the impacts of high-frequency trading on the financial
71
I By Haval Rawf Hamza Supervisor Dr. Jayaram Muthuswamy Thesis Submitted in Partial Fulfillment of the Requirements for the Degree of Master of Business Administration Kent State University March 2015 THE IMPACTS OF HIGH-FREQUENCY TRADING ON THE FINANCIAL MARKETS’ STABILITY
-
Upload
khangminh22 -
Category
Documents
-
view
1 -
download
0
Transcript of the impacts of high-frequency trading on the financial
I
By
Haval Rawf Hamza
Supervisor
Dr. Jayaram Muthuswamy
Thesis Submitted in Partial Fulfillment of the Requirements for the Degree of
Master of Business Administration
Kent State University
March 2015
THE IMPACTS OF HIGH-FREQUENCY TRADING ON THE FINANCIAL
MARKETS’ STABILITY

II
Thesis written by
Haval Rawf Hamza
B.S., Technical College of Sulaimani, Sulaimani, Iraq
MBA, Kent State University, Kent, Ohio, USA
Approved by
___________________________________, Chair, Master Thesis Committee
___________________________________, Members, Master Thesis Committee
___________________________________
___________________________________
___________________________________
Accepted by
___________________________________, Chair, Department of Business Administration
___________________________________, Dean, College of Business
III
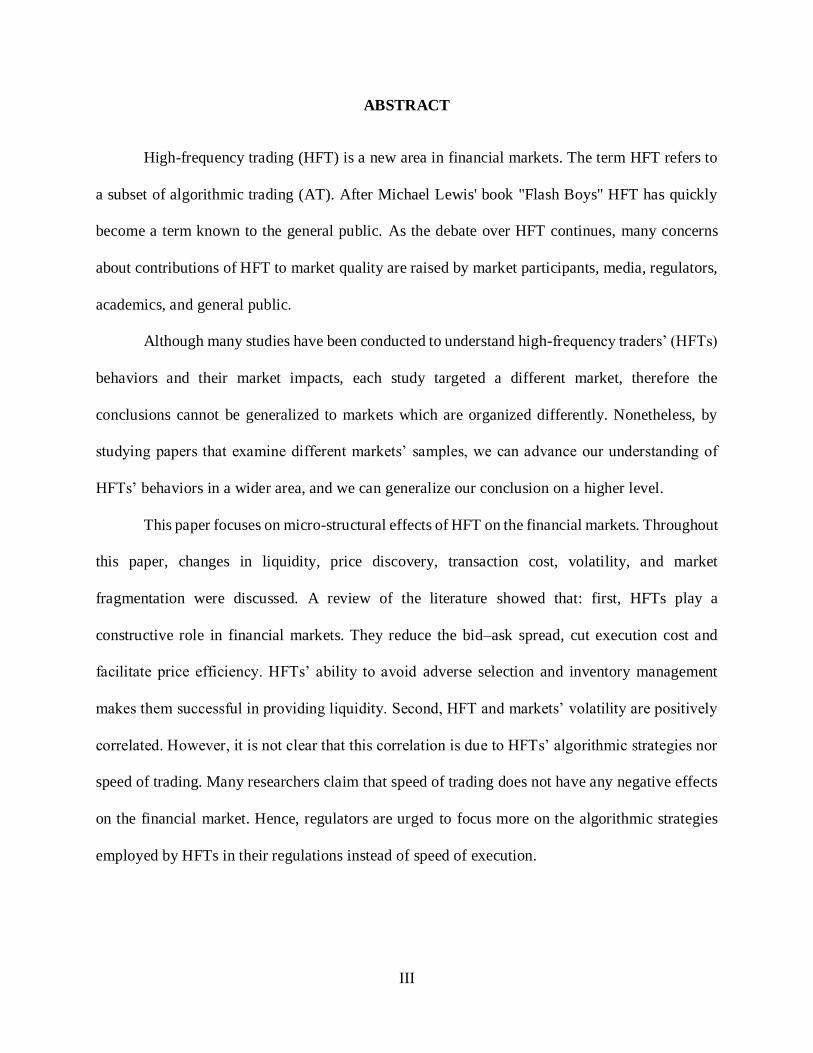
ABSTRACT
High-frequency trading (HFT) is a new area in financial markets. The term HFT refers to
a subset of algorithmic trading (AT). After Michael Lewis' book "Flash Boys" HFT has quickly
become a term known to the general public. As the debate over HFT continues, many concerns
about contributions of HFT to market quality are raised by market participants, media, regulators,
academics, and general public.
Although many studies have been conducted to understand high-frequency traders’ (HFTs)
behaviors and their market impacts, each study targeted a different market, therefore the
conclusions cannot be generalized to markets which are organized differently. Nonetheless, by
studying papers that examine different markets’ samples, we can advance our understanding of
HFTs’ behaviors in a wider area, and we can generalize our conclusion on a higher level.
This paper focuses on micro-structural effects of HFT on the financial markets. Throughout
this paper, changes in liquidity, price discovery, transaction cost, volatility, and market
fragmentation were discussed. A review of the literature showed that: first, HFTs play a
constructive role in financial markets. They reduce the bid–ask spread, cut execution cost and
facilitate price efficiency. HFTs’ ability to avoid adverse selection and inventory management
makes them successful in providing liquidity. Second, HFT and markets’ volatility are positively
correlated. However, it is not clear that this correlation is due to HFTs’ algorithmic strategies nor
speed of trading. Many researchers claim that speed of trading does not have any negative effects
on the financial market. Hence, regulators are urged to focus more on the algorithmic strategies
employed by HFTs in their regulations instead of speed of execution.

IV
TABLE Of CONTENTS
ABSTRACT ........................................................................................................................................ III
DEDICATION ....................................................................................................................................VI
ACKNOWLEDGMENTS................................................................................................................ VII
CHAPTER 1 ......................................................................................................................................... 1
Introduction ........................................................................................................................................... 1
1.1. High-frequency Trading Definition...................................................................................... 3
1.1.1. SEC Detention................................................................................................................ 4
1.1.2. Netherlands Authority for the Financial Markets (AFM) Definition ......................... 4
1.2. High-frequency Trading Transaction Volume..................................................................... 5
1.3. High-frequency Trading Profit ............................................................................................. 7
1.4. Problem Statement ................................................................................................................ 9
1.5. Research Questions ............................................................................................................... 9
CHAPTER 2 ....................................................................................................................................... 11
Literature Review ............................................................................................................................... 11
2.1. Theoretical Paper ................................................................................................................. 11
2.2. NASDAQ Datasets .............................................................................................................. 14
2.3. Chi-X and Euronext Dataset ............................................................................................... 16
2.4. Financial Services Authority (FSA) Dataset ..................................................................... 16
2.5. E-mini Dataset ..................................................................................................................... 17
2.6. NASDAQ-OMX Stockholm Exchange Dataset ................................................................ 17
2.7. Computerized Trade Reconstruction (CTR) Dataset Provided by the CME ................... 18
2.8. CRSP and the Thomson Reuters Institutional Holdings Databases ................................. 19
CHAPTER 3 ....................................................................................................................................... 20
Discussion of Papers........................................................................................................................... 20
V
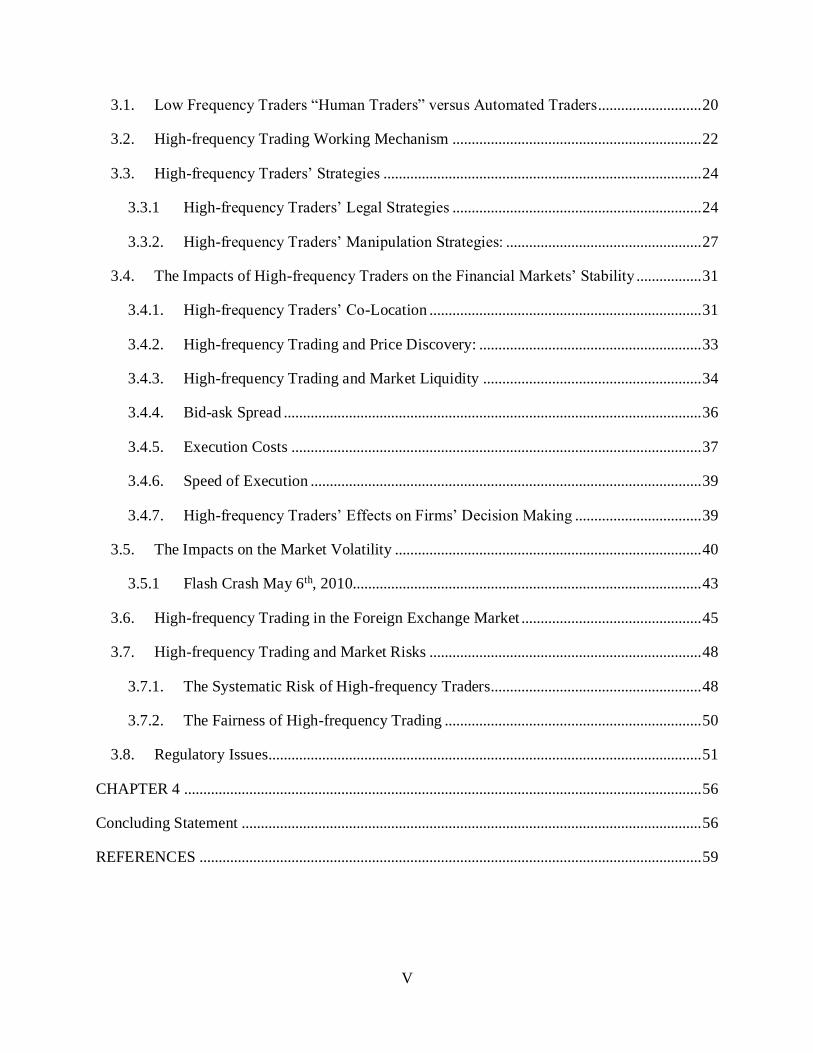
3.1. Low Frequency Traders “Human Traders” versus Automated Traders........................... 20
3.2. High-frequency Trading Working Mechanism ................................................................. 22
3.3. High-frequency Traders’ Strategies ................................................................................... 24
3.3.1 High-frequency Traders’ Legal Strategies ................................................................. 24
3.3.2. High-frequency Traders’ Manipulation Strategies: ................................................... 27
3.4. The Impacts of High-frequency Traders on the Financial Markets’ Stability ................. 31
3.4.1. High-frequency Traders’ Co-Location ....................................................................... 31
3.4.2. High-frequency Trading and Price Discovery: .......................................................... 33
3.4.3. High-frequency Trading and Market Liquidity ......................................................... 34
3.4.4. Bid-ask Spread ............................................................................................................. 36
3.4.5. Execution Costs ........................................................................................................... 37
3.4.6. Speed of Execution ...................................................................................................... 39
3.4.7. High-frequency Traders’ Effects on Firms’ Decision Making ................................. 39
3.5. The Impacts on the Market Volatility ................................................................................ 40
3.5.1 Flash Crash May 6th, 2010........................................................................................... 43
3.6. High-frequency Trading in the Foreign Exchange Market ............................................... 45
3.7. High-frequency Trading and Market Risks ....................................................................... 48
3.7.1. The Systematic Risk of High-frequency Traders....................................................... 48
3.7.2. The Fairness of High-frequency Trading ................................................................... 50
3.8. Regulatory Issues................................................................................................................. 51
CHAPTER 4 ....................................................................................................................................... 56
Concluding Statement ........................................................................................................................ 56
REFERENCES ................................................................................................................................... 59

VI
DEDICATION
I dedicate this thesis…
To my loving family, especially to my parents for all their sacrifices to provide a
better life and education for me.
To my sisters and brothers for their patience and understanding
To all members of the Higher Committee for Education Development in Iraq for
supporting me from the beginning of program until the end.
To my undergraduate professors Dr. Othman Abdul Qader Hama Amin and Dr.
Kawa Mohammed Faraje Qaradaghi who motivated me to reach my dreams.
To all my friends

VII
ACKNOWLEDGMENTS
Writing this thesis was challenging since it was the first thesis offered by the Masters in
Business Administration (MBA) department at Kent State University. In the meantime, it was
great experience. Writing this thesis was only possible with help of so many people during my life
at Kent State University. I wish to thank all of them for their support.
I would like to express my deep gratitude for my superior, Dr. Jayaram Muthuswamy, who
directed me through my thesis process. I thank him for his valuable advice and suggestions during
this thesis, and the time that he generously dedicated to helping me. I would also like to thank Ms.
Louise Ditchey and Ms. Felecia Urbanek and other academic staff in the MBA department for
trusting me and for making this thesis possible.
Finally, I would like to thank my family for their love and support. You are definitely my
greatest blessing in my life. Also, I would like to thank all my friends who encouraged and
supported me throughout my stud

1
CHAPTER 1
Introduction
Technology has a big influence on financial markets. Rapidly developing technologies
have changed the way financial markets work. In the last decade, many financial markets started
replacing human intermediaries with automated trading systems. Unlike traditional markets, where
all trades were conducted between humans and took a long time to ensure that trades were
completed and recorded properly, HFTs and other automated traders can trade thousands of times
in a minute and just by making a fraction of a cent in each trade, they can aggregate a huge amount
of profit. Also, HFTs can take advantage from any trading opportunities that may open up for only
a millisecond. For example, if the price of certain stock trading in New York and Chicago markets
differs even for a millisecond, HFTs can take advantage of that window of opportunity. Ostensibly,
speed and access to information are the main advantages of high-frequency and other automated
traders.
HFT volume, as a percentage of the total market volume and its effects on the financial
markets, highlights the importance of studying HFT in more detail not only for policy makers but
also for academics. In 2014, the SEC’s Concept Release on Equity Market Structure recognized
that “HFT is one of the most significant market structure developed in recent years.” The SEC’s
Concept Release also found that HFT volume exceeded 50% of total volume of US-listed equities
and concluded that “by any measure, HFT is a dominant component of the current market structure
and likely to affect nearly all aspects of its performance.” (p. 4) The Flash Crash event, when on
2
May 6th, 2010 the Dow Jones Industrial Average mysteriously dropped 10% and recovered quickly
in a few minutes was another reason to increase the importance of studying HFT. For example, on
June 16th 2014, SEC Director of enforcement, Andrew Ceresney, declared the SEC’s recent
enforcement strategies in regard to dark pools and HFT. He said “since algorithmic trading is now
the obvious norm in the market, the SEC has ongoing investigations related to HFT.” SEC’s clear
focus is on the use of confidential information that algorithmic traders have from their customers
for other purposes and the role of brokers and dealers in the market structure. This shows that
markets have become more complex and advanced; hence, there is need for more studies and
investigations about the role that algorithmic and HFTs play in the financial markets. (Ceresney,
2014)
In order to study HFT, we have to distinguish between agency algorithms and proprietary
algorithms regarding what is typically referred to as HFT. According to Hagströmer & Nordén
(2013), agency algorithm firms provide execution services for clients, typically using their
infrastructure and market knowledge to minimize the price impacts of trading. In contrast, HFTs
apply their strategies to their own holdings. HFT can be subdivided into two other groups, market-
making and opportunistic traders. In defining HFT market-makers, I used a definition that is used
by Jovanovic & Menkveld (2010) and Hagströmer & Nordén (2013). HFT market-makers trade
large volumes but keep inventories close to zero, and they are on the passive side in the majority
of their trades. (Jovanovic & Menkveld, 2010) (Hagströmer & Nordén, 2013) On the other hand,
HFT opportunistic traders conduct strategies such as arbitrage and directional, and they are on the
aggressive side in the majority of their trades.

3
1.1. High-frequency Trading Definition
HFT is a term for a subset of algorithmic strategies and the use of powerful computers in
trading financial securities. It has grown rapidly over the past decade and is still evolving.
Algorithmic trading can be divided into two main models:
1. Algorithmic execution: A human trader decides to trade by using an electronic trading
program in executing trades. Algorithmic execution is used by traders for several reasons. For
example, a trader may use smart-order routing to choose where to trade, especially for larger
orders. It may also be used to achieve the best price through a time- or volume-weighted
methods. “Bank traders may use this type of approach to trade via an aggregator; real money
investors may use a time-weighted approach to drip-feed a large order to the market.” (Debelle,
2011)
2. Algorithmic trade decision-making: HFT belongs to this part of algorithmic trading. A trader
builds a model to initiate a trade automatically based on certain key input parameters, such as
order book imbalance, momentum, correlations (within or across markets), mean reversion,
and systematic response to economic data or news. Hedge funds and banks’ automated risk
management tools may use this model to offset risk automatically. (Debelle, 2011)
HFT lacks clear definition and researchers use different approaches to distinguish HFT from
other automated trading. As a result, some algorithmic and other computer assisted trading that
should not be classified as HFT may be considered as HFT, or some HFT may be excluded from
the data set. The main detentions for HFT are:
4
1.1.1. SEC Detention
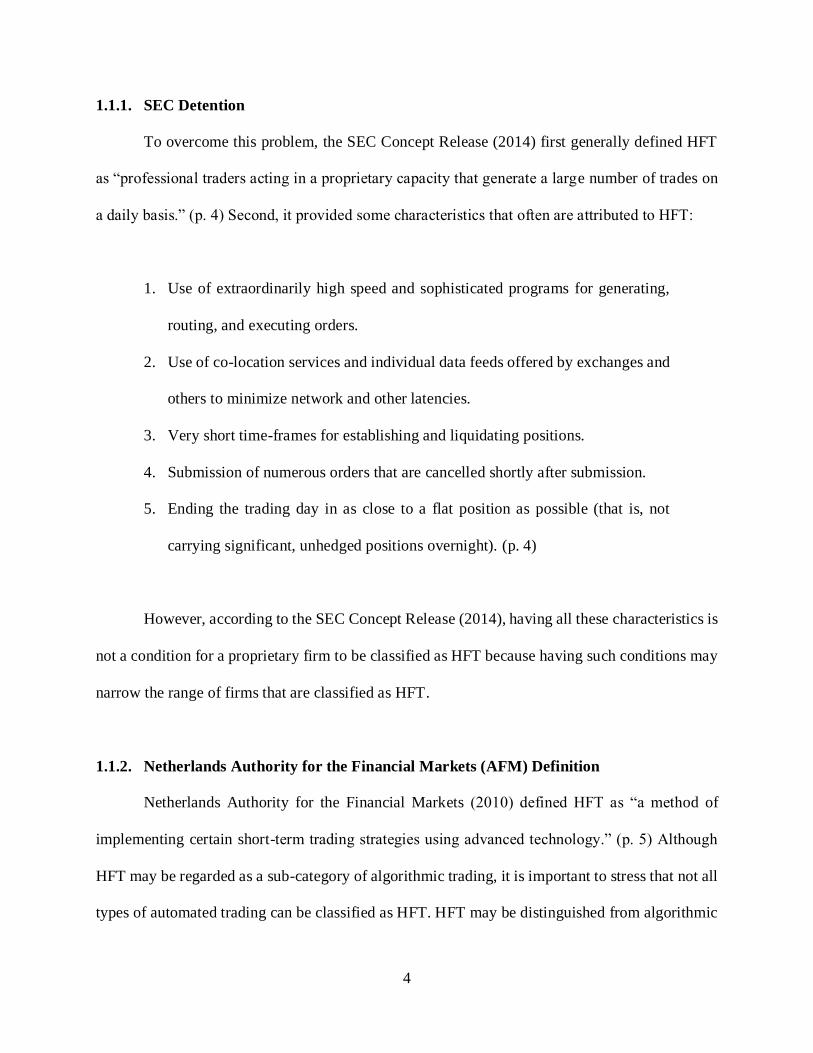
To overcome this problem, the SEC Concept Release (2014) first generally defined HFT
as “professional traders acting in a proprietary capacity that generate a large number of trades on
a daily basis.” (p. 4) Second, it provided some characteristics that often are attributed to HFT:
1. Use of extraordinarily high speed and sophisticated programs for generating,
routing, and executing orders.
2. Use of co-location services and individual data feeds offered by exchanges and
others to minimize network and other latencies.
3. Very short time-frames for establishing and liquidating positions.
4. Submission of numerous orders that are cancelled shortly after submission.
5. Ending the trading day in as close to a flat position as possible (that is, not
carrying significant, unhedged positions overnight). (p. 4)
However, according to the SEC Concept Release (2014), having all these characteristics is
not a condition for a proprietary firm to be classified as HFT because having such conditions may
narrow the range of firms that are classified as HFT.
1.1.2. Netherlands Authority for the Financial Markets (AFM) Definition
Netherlands Authority for the Financial Markets (2010) defined HFT as “a method of
implementing certain short-term trading strategies using advanced technology.” (p. 5) Although
HFT may be regarded as a sub-category of algorithmic trading, it is important to stress that not all
types of automated trading can be classified as HFT. HFT may be distinguished from algorithmic
5
trading possessed by institutional investors, brokers, and hedge funds in term of trading frequency,
holding period and strategy. Unlike HFT, this form of automated trading is by definition
directional and therefore not market-neutral. This is because, in order to build or reduce an asset
portfolio, a position is chosen (long or short) based on a view regarding the current or future
development of the market. These positions are therefore usually not fully or partially hedged. The
holding period is usually much longer than a few seconds or minutes and, indeed, positions are
usually held overnight. The order-to-transaction ratio in generic algorithmic trading is also
different from that of HFT because this trading does not involve market-making or arbitrage
strategies with a very short time horizon. Therefore, they have less reason to very quickly update
orders. (Netherlands Authority for the Financial Markets, 2010)
1.2. High-frequency Trading Transaction Volume
HFT volume as a percentage of total market and other characteristic of HFT vary a great
deal since HFT lacks a generally accepted definition. Netherlands Authority for the Financial
Markets (2010) reported that even with an established definition, trading platforms would not yet
be able to distinguish HFT from other forms of algorithmic trading. “To be able to make this
distinction, they would have to establish the specific market shares of the various trading
strategies” (p. 11) Hagströmer & Nordén (2013) estimated the HFT volume in their data set,
comprised of 30 Swedish large-cap stocks traded on the NASDAQ-OMX Stockholm exchange, as
71.5% of the trading volume in August 2011 and 62.8% in February 2012. Furthermore, they
claimed that, during both months, 80% of the HFT limit-order submissions originated from
the market-making strategies.
6
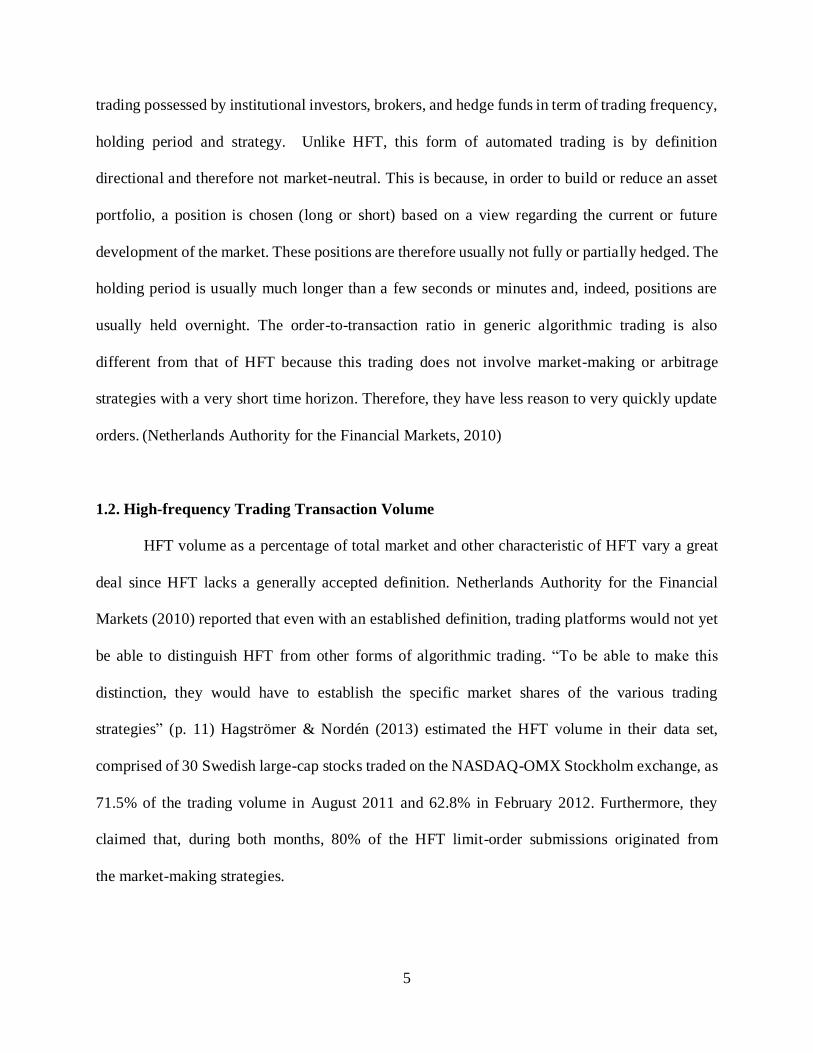
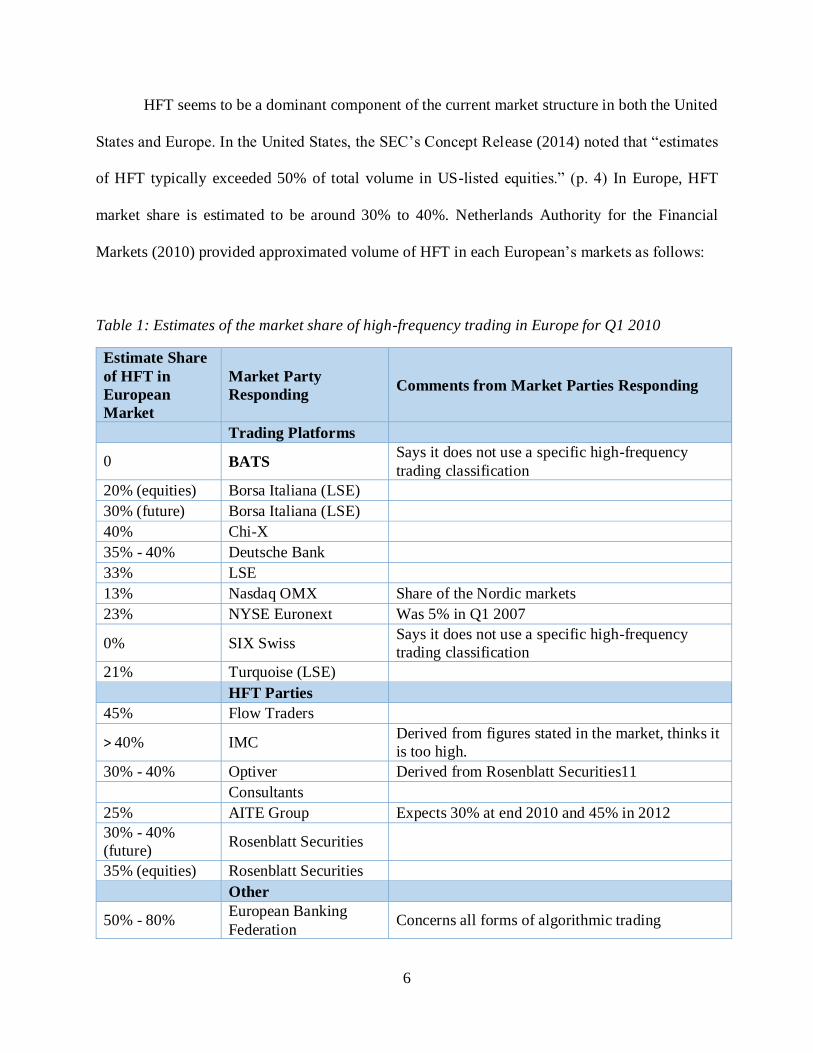
HFT seems to be a dominant component of the current market structure in both the United
States and Europe. In the United States, the SEC’s Concept Release (2014) noted that “estimates
of HFT typically exceeded 50% of total volume in US-listed equities.” (p. 4) In Europe, HFT
market share is estimated to be around 30% to 40%. Netherlands Authority for the Financial
Markets (2010) provided approximated volume of HFT in each European’s markets as follows:
Table 1: Estimates of the market share of high-frequency trading in Europe for Q1 2010
Estimate Share
of HFT in
European
Market
Market Party
Responding Comments from Market Parties Responding
Trading Platforms
0 BATS Says it does not use a specific high-frequency
trading classification
20% (equities) Borsa Italiana (LSE)
30% (future) Borsa Italiana (LSE)
40% Chi-X
35% - 40% Deutsche Bank
33% LSE
13% Nasdaq OMX Share of the Nordic markets
23% NYSE Euronext Was 5% in Q1 2007
0% SIX Swiss Says it does not use a specific high-frequency
trading classification
21% Turquoise (LSE)
HFT Parties
45% Flow Traders
> 40% IMC Derived from figures stated in the market, thinks it
is too high.
30% - 40% Optiver Derived from Rosenblatt Securities11
Consultants
25% AITE Group Expects 30% at end 2010 and 45% in 2012
30% - 40%
(future) Rosenblatt Securities
35% (equities) Rosenblatt Securities
Other
50% - 80% European Banking
Federation Concerns all forms of algorithmic trading
7
1.3. High-frequency Trading Profit
HFTs’ profitability depends on which sides HFTs choose. Some researches such as Sahalia
& Saglam (2013) and Jovanovic & Menkveld (2010) focus on the HFT market-makers (passive)
who use speed to improve market quality by providing liquidity, contributing to price discovery,
and improving market efficiency. Other researchers, such as Foucault & Hombert (2013) and
Biais, Foucault, & Moinas (2014) view HFT more as liquidity-demanding traders (aggressive)
who overinvest in technology to react faster to news and use speed to trade an instant before others.
As a result, they may increase trading cost and adverse selection. HFT firms which specialize in
liquidity-taking (aggressive) substantially generate more money than passive HFTs who specialize
in providing liquidity. According to Baron, Brogaard, & Kirilenko (2014), aggressive HFTs lose
money on shorter time scales but gain money by predicting price movements on longer ones.
Inconstant, passive HFTs make money at short horizons and lose money over longer intervals.
Moreover, accumulating disproportional revenue to the top performing HFTs suggests that speed
is an important determinant of revenue generation, and the competitive trading structure of HFT
firms can lead to a winner-takes-all environment, whereby a trader who is first able to identify and
respond to a profitable opportunity will capture all the gains. In their analysis, Baron, Brogaard, &
Kirilenko (2014) show that profits are concentrated among a small number of incumbents who
realize high and persistent returns. They also expected that aggregate profits and the concentration
of profits would not decrease over time. In fact, HFTs’ daily returns increased in their sample after
taking into account market volatility and non-HFT volume.
Menkveld (2013) examined profitability of a particular high-frequency trader who acts as
a market maker on Chi-X and Euronext. He examined the sources of profitability by decomposing
trade revenue into a bid–ask spread earned or paid (according to the type of trade) and a positioning
8
revenue, based on mid-quote changes in the life of the nonzero position. Then, he subtracted
variable costs of exchange and clearing fees, but he did not take fixed costs, such as development
of the algorithm, acquisition of hardware, and clearing house/exchange membership fees, into his
calculation. He stated that the amount of capital HFTs need to make available for the operation is
roughly four times as high as the average margin required (€9:462 million vs. €2:641 million). He
believes that this amount is surprisingly low and it indicates that the HFTs are particularly skillful
in keeping their position in check. (Menkveld, 2013)
He also found that HFTs employ a cross-market strategy. His sample firm’s trade
participation rate is 8.1% in the incumbent market and 64.4% in a small, high-growth entrant
market. He claimed that four out of five of HFTs’ trades are passive: 78.1% in Euronext and 78.0%
in Chi-X. He claimed HFTs earn profit on the bid–ask spread and the gross spread earned on these
passive trades is €2:09 in Euronext and €2:38 in Chi-X. However, HFTs cannot net their positions
across these clearing houses which leads to loss on their inventory and increase capital
requirements by a factor of 100. Finally, he found that HFTs can only profit from spreads in
positions that are less than five seconds and steadily lose on positions held longer than a minute.
(Menkveld, 2013)
Carrion (2013) considered liquidity-demanding trades and liquidity-supplying trades
separately and estimated that the sample HFTs in the NASDAQ earn money ($3292.61per stock-
day) when supplying liquidity and lose money ($691.54) when demanding liquidity. However, the
supplying and demanding profits do not add up to the total; the net earning in his dataset was
$2623.84 per stock-day. This imbalance occurred because he analyzed liquidity-demanding and
supplying trades separately. In this case, the liquidity-supplying trades’ effect will be offset by the
effect of liquidity-demanding trades.
9
Baron, Brogaard, & Kirilenko (2011) found that that HFT are highly profitable. “HFTs
collectively earned over $23 million in trading profits in the E-mini S&P 500 futures contract
during the month of August 2010.” Finally, unlike the traditional trading environment, where past
traders’ performance does not predict their performance in the future, in the case of HFT, the level
of performance in the past predicts the level of performance in the future. Skilled and experienced
employees, technological advantages, or a combination thereof may be a reason for that. (Baron,
Brogaard, & Kirilenko, 2011)
1.4. Problem Statement
The high profitability of high-frequency trades raises the question of how HFT is actually
used and how it affects financial market stability. However, studies in this area have arrived at
different conclusions due to variations in the size of data sets and from HFT firms’ desire to keep
their trading confidential. Some economists believe that HFT does not add any real economic
value, whereas other economists claim that HFT is beneficial to financial markets because it
increases market liquidity and tight spreads. Meanwhile, regulators share concerns about how
HFT affects traditional investors and using HFT strategies in vulnerable market conditions.
The purpose of this research is to show how HFT affects market stability and volatility
through investigating HFT volume and profit, measuring trade execution costs, and evaluating
stock volatility.
1.5. Research Questions
When I started to search the literatures concerning computerized and HFT, I noticed that most
papers in this area focus on one aspect of HFT in a certain financial market. Therefore, I decided
10
to compile a portfolio of papers instead of conducting typical research which tends to focus on
analyzing a set of financial data for a specific period and providing an unbiased opinion. Also,
since HFT has recently attracted public attention, I put together some articles written by financial
market experts to show public perception of HFT. “Public perception should be of vital concern
to financial academics and practitioners because a populist outcry can lead government and
regulators to “do something” rather than take thoughtful and reasoned measures.” (Muthuswamy,
n.d., para. 12) The main question of this research is to explore how HFT affects market stability.
Through this research, I will describe the various aspects, both positive and negative, of HFT. I
also make a number of suggestions to improve the current situation.
11
CHAPTER 2
Literature Review
Many papers have been written about algorithmic trading and HFT, most of them coming
from the United States, United Kingdom, and Europe. Also, thousands of articles have been
published in the financial and economic magazines and newspapers about the impacts of HFT on
the financial market. This section covers the most relevant papers and articles related to the impacts
of HFT on the financial market. My goal was to provide the reader an overview of the main issues
and key findings related to HFT. The chapter presents a detailed literature review of a
comprehensive framework of HFT, including liquidity providing, price discovery, transaction cost,
volatility and fairness of HFT. The papers are categorized based on a database that has been used
to identify HFTs’ activity.
2.1. Theoretical Paper
Treleaven, Galas, & Vidhi (2011), unlike other researchers who attempt to show how HFTs
effect market quality, tried to focus on the process and components of algorithmic trading systems
including HFT. According to them, an algorithmic trading system contains several components,
some of which may be automated by a computer, and others that may be manually executed.
Algorithmic trading strategies refers to the precise nature of the entire spectrum of activities
employed by a software system. In general, this approach employs two main strategies:
Momentum and Mean Reversion. The authors divide the working process of algorithmic trading
systems into five stages: (a) Data access/cleaning, (b) Pre-trade analysis, (c) Trading signal
generation, (d) Trade execution, and (e) Post-trade analysis.
12
Angel & McCabe (2010) examined the fairness of using HFT. The authors state that although
HFTs are often implementing traditional strategies, they can use manipulative strategies as well.
They do not agree with critics who believe that HFTs may impose additional risk on the market
and cause excessive volatility. The authors also support HFT co-location strategies by saying that
the speed of computing and location in exchange data centers are available to anyone who is
willing to pay for it. The authors also claimed that this fraction of millisecond that HFTs gain in
co-location only matters in the competition with each other. The dimension of efficient prices is
another area of their debate. It would be unfair if the activities of HFTs imposed substantial losses
on other investors or otherwise disrupted the market in a manner disproportionate to the benefits
they provide. Angel & McCabe (2010) conclude that most HFT strategies do not impose harm on
others.
Easley, Marcos, & Maureen (2011) investigated the Flash Crash event of May 6 th, 2010 and
flow toxicity during the flash crash by using the Volume of Probability of Informed Traders (VPIN
metric)1. They state that in the computerized market increasing order flow toxicity faces HFT
1 Volume of Probability of Informed Traders (VPIN) is the seminal of work of Professors Maureen O'Hara and David
Easley. First, in 1996, Maureen O'Hara and David Easley proposed a mathematical model to as Probability of Informed
Trading (PIN). The value of a certain security “S0” will be change once new information has been incorporated into
the price. The value of the security will be lower if the new information is bad “SB” or it will be higher if the new
information is good “SG”. There is a probability that the new information will arrive within the time-frame of the
analysis. The value of the security then can be expected at time “t” Following a Poisson distribution, informed traders
arrive at a rate μ, and uninformed traders at a rate ε. Then, in order to avoid losses from informed traders, market
makers reach breakeven at a bid level. There are for parameters that can be estimated to calculate PIN; probability
that new information will arrive within the time-frame of the analysis, probability that the news will be bad, rate of
13
market-makers significant losses. In the highly toxic market, HFTs decrease their risks by reducing
or liquidating their positions. In conclusion, the authors provide their point of view to prevent such
crisis. They believe that market will be stabilized by recognizing and managing the risks of trading
in this new market structure instead of restricting HFTs’ activities, a position contrary to others in
the field. They believe that “VPIN metric” may serve as an objective measurement of flow toxicity
for market-makers and a risk management tool to hedge the risk of being adversely selected.
Brook, Sharp, Ushaw, Blewitt, & Morgan (2013) also studied volatility in HFT environments.
In their study, they propose a new approach to manage volatility. The technique provided by them
is called Contention Management. The authors assert that lower volatility can be achieved by
varying client-trading frequencies while exploiting the semantic properties inherent in algorithmic
trading. They believe that their approach can be adapted to changes in trading patterns,
technological resources and trading volumes during runtime.
Hong (2013) investigated the relationship between HFT and the volatility of price. The author
identifies the statistical impact of HFT schemes applied to price momentum trading strategy2.
Hong primarily focuses on differentiating between algorithmic trading strategy and frequent
trading. Hong (2013) implies that high-frequency of trading does not cause any problem in the
financial markets. He states that increasing volatility might be due to the behavioral difference of
informed traders, and rate of uninformed traders. VPIN adopted to HFT environment by using a volume clock which
synchronizes the data sampling with the market activity,
Source: http://www.quantresearch.info/VPIN.pdf
2 A typical momentum trading strategy for stocks aims at capturing trends in stock prices. According to momentum
strategy, stock large increases in the price will continue rising and should be bought and vice versa for declining
values.
14
the traders rather than more frequent trading. Hong posits that his results are consistent with many
traders’ claims, and suggests that regulators should focus more on the behavioral aspect of the
HFTs rather than on how frequent they trade.
2.2. NASDAQ Datasets
Brogaard, Hendershott, & Riordan (2013) used the NASDAQ dataset to investigate the role of
HFT in price discovery and price efficiency. The data used in the study are from 2008 - 2009 for
120 stocks traded on NASDAQ. Of the 120 stocks, 60 are listed on the New York Stock Exchange
and 60 from NASDAQ. The stocks are also split into three groups based on market capitalization.
To understand the impact of HFT on the overall market prices, the authors use national best-bid,
best-offer prices that represent the best available price for a security across all markets. They
estimate a model of price formation by following Hendershott & Menkveld’s (2011) approach and
using a state-space model to decompose price movements into permanent and temporary
components and to relate changes in both to HFT. They conclude that HFT has a beneficial role in
the price discovery process in terms of information being impounded into prices and smaller
pricing errors, but they do not provide any evidence about whether HFT contributes directly to
market instability in prices or not.
(Brogaard J. A., 2010), in addition to NASDAQ dataset during 2008 and 2009, used CRSP and
TAQ for firms outside of the NASDAQ dataset. He also used CBOE Index data to incorporate the
CBOE S&P 500 Volatility Index (VIX) in certain instances. The paper is divided into two main
sections: In section one, the author analyzes HFT strategies in detail. He divides the decisions that
HFTs make at any given time into three categories: do they buy, do they sell, or do they do nothing?
15
His approach is similar to Hausman, Lo, &MacKinlay’s (1992) approach. In section two, he
analyzes the impact of HFT on the overall market, including liquidity, price discovery, and
volatility. Finally, he examines if HFTs engage in systematic front-running or not.
Carrion (June 2013) tried to analyze HFT performance, trading costs, and effects on market
efficiency. He classifies his dataset as HFTs and non-HFTs. Then based on HFTs’ activities, he
subdivides HFTs into HFT participants on either side of a trade as (HF All), HFTs on the liquidity
demanding side, and HFTs on the liquidity supplying side. The method that he uses in his analysis
is called Volume-Weighted Average Price (VWAP), which measures trading performance by
comparing the average price obtained on a set of trades. He shows that HFTs’ daily trades end
with considerable apparent positions. He states that in his dataset, it is not clear to what extent
these apparent positions are offset by trades and to what extent they are actually overnight. He
concludes that HFTs have strong market performance with very low trading cost. However,
spreads are wider on trades where HFTs provide liquidity and tighter on trades where HFTs take
liquidity. He claims that HFTs impose higher adverse selection costs on slower traders, but they
are less likely to face adverse selection. Finally, he claims that HFTs make prices more efficient,
because stocks’ price incorporates new information from order flow and market index returns more
quickly when HFTs are active.
Ki (2011) used a NASDAQ dataset to investigate the relationship between Capital Assets
Pricing Model (CAPM) and HFT. In this study, he chooses the 26 stocks with the highest trading
volume in last 20 years. In calculating market risk premium, Ki (2011) uses the spread between
the BAA rating and AAA rating bond yields and S&P 500 as proxy for the market. Since human
16
capital comprises a large portion of the total capital, it considered as one of the factors in the model.
He concludes that in the computer-based trading, CAPM cannot generate accurate returns. He
claims that in calculating returns, conditional CAPM and APT model provide more accurate
results.
2.3. Chi-X and Euronext Dataset
Menkveld (2013) considered the trading strategy of a large HFTs that started trading in Chi-X
and Euronext. The analysis is based on its trading in 200 days beginning from September 4 th, 2007
to June 17th, 2008. In his analysis, he uses the SEC definition to categorize firms as HFT. The main
objective of this study is to understand the sources of HFTs’ profit. He analyzes revenue and
required capital separately, and then combines both to arrive at a standard profitability
measurement. In analyzing the expenditure side, fixed costs such as development of the algorithm,
acquisition of hardware, and membership fees are not taken into consideration. He found that
unlike in the US markets, HFTs cannot net their position in Chi-X and Euronext, leading to an
increase in capital requirements by 100%.
2.4. Financial Services Authority (FSA) Dataset
Brogaard, et al. (2013) used FSA dataset on November 2007 to August 2011. The data only
include firms that were either directly regulated in the European Economic Area (EEA) or traded
through a broker. Since the authors believe that HFTs mainly concentrate in the most liquid stocks,
they limited their analysis only to the 250 stocks with the largest market capitalization. The main
goal of this paper was to determine whether HFT increases the execution costs of institutional
17
investors or not. They use an empirical method called two-stage3 least squares to examine the
impact of HFT on institutional investors’ execution costs. They identify a link between latency
changes made by the London Stock Exchange and HFTs’ activities. However, they do not find any
measurable association between these latency changes and execution costs. They conclude that
since intraday prices are volatile, identifying small changes in costs is difficult.
2.5. E-mini Dataset
Baron, Brogaard, & Kirilenko (2011) used the E-mini dataset to analyze risk and return in the
HFT environment. The data include E-mini S&P 500 stock index futures contract trades from
August 2010 to the end of August 2012. In their study, they categorize trades based on inventory
and trading volume. HFTs are identified as those firms with extremely high volume, low intraday
inventory and low overnight inventory. Then HFTs are classified as passive and aggressive traders
based on liquidity impact. The study’s results confirm HFTs’ strong performance by showing that
HFTs earn Sharpe ratios several times higher than those for other asset classes or trader types. The
study also shows that HFTs can keep risk very low through tight inventory control and rapid
turnover of contracts. Baron, Brogaard, & Kirilenko (2011) calculate direct costs of trading such
as trading fees, but capital costs such as cost of co-location, computer systems, and risk
management systems are not adequately calculated.
2.6. NASDAQ-OMX Stockholm Exchange Dataset
Hagströmer & Nordén (2013) studied the influence of market-making HFTs on short-term
volatility by analyzing 30 Swedish large-cap stocks traded on the NASDAQ-OMX Stockholm
3 This method estimates the influence of one variable based on another one.
18
exchange from February 8th, 2010 to March 31st, 2012. To overcome the computational problem
of the dataset, the analyses are conducted only on two different months, a month with high
volatility (August, 2011) and a reasonably calm month (February, 2012). The metric used in this
study is day-end inventory and the frequent submissions and cancellations of limit orders. Since
market-makers typically earn the spread whereas opportunistic traders tend to pay the spread, the
study predicts that that a tick size increase would increase the share of trading activity due to
market-making HFTs, but opportunistic HFTs’ activities would decrease share of trading activity.
In conclusion, the authors suggest using tick size in regulation, because an increased minimum
tick size makes strategies based on liquidity supply (such as market-making) more attractive; hence
it will allow for limiting quoting traffic without threatening the advantages of HFTs activities.
2.7. Computerized Trade Reconstruction (CTR) Dataset Provided by the CME
Kirilenko, Kyle, Samadi, & Tuzun (2010) investigated the role of HFTs on the Flash Crash of
May 6th, 2010. They divide the data into six categories: (a) HFTs, (b) Intermediaries, (c)
Fundamental Buyers, (d) Fundamental Sellers, (e) Opportunistic Traders, and (f) Noise Traders.
They identify major changes in the Fundamental Buyers’ and Sellers’ behaviors. They also note
that although HFTs stayed in the market during the Flash Crash, they exacerbated the crisis by
aggressively taking liquidity from the market when prices were about to change to keep their
inventory near the target. HFTs who behaved as Fundamental Buyers started to sell contracts and
compete for liquidity with Fundamental Sellers during the Flash Crash. In addition, the HFT firms
start buying and selling contracts from one another many times, and generated “hot potatoes.”4
4 Example to explain Hot Potato: If the price of a certain security is in equilibrium and it incorporates all
information available in the market for this security so that the expected future price of this security is predictable.
19
2.8. CRSP and the Thomson Reuters Institutional Holdings Databases
Zhang (2010) uses CRSP and the Thomson Reuters Institutional Holdings databases during
1985 to 2009 to study HFT price discovery and market volatility. He divides his variable into three
groups: (a) institutional investors, (b) individual investors, and (c) HFTs. He defines HFTs only as
all short-term trading activities by hedge funds and other institutional traders. Unlike other studies
(such as Easley, Marcos, & Maureen, (2011); Brook, Sharp, Ushaw, Blewitt, & Morgan, (2013);
and Hong, (2013)), which do not draw any direct link between HFT and price volatility, Zhang
(2010) concludes that HFT is positively correlated with stock price volatility after controlling for
firm fundamental volatility and other exogenous determinants of volatility. Also, he states that the
positive correlation is stronger among the top 3,000 stocks in market capitalization and among
stocks with high institutional holdings, and it is stronger during the period of high market
uncertainty. Finally, he concludes that markets’ reaction for fundamental news increases in the
high presence of HFTs. Mathematically, he claims that a one standard deviation increase in HFT
increases stock volatility by 5.6% on average and increases price reaction to earnings news by 8%
after taking measurement error into account.
Now, if suddenly some bad information arrives about this security, and if people expect future decline in the price of
the security, they try to get rid of it. However, since the amount of supply increases in the market, the only way for
the market to go back to an equilibrium point is by dropping the price to the point that people think it compensates
them for the risk they take by holding the security. In the event of Flash Crash May 6, when fundamental investors
pulled out of the market, HFT firms started selling and buying securities to each other, which led to the hot potato
effect.

20
CHAPTER 3
Discussion of Papers
3.1. Low Frequency Traders “Human Traders” versus Automated Traders
Before discussing the effects of HFT on the financial markets and comparing the pros and cons
of low-frequency traders (LFTs) and automated traders, it is important to determine which one
may be more practical to today’s complex financial markets.
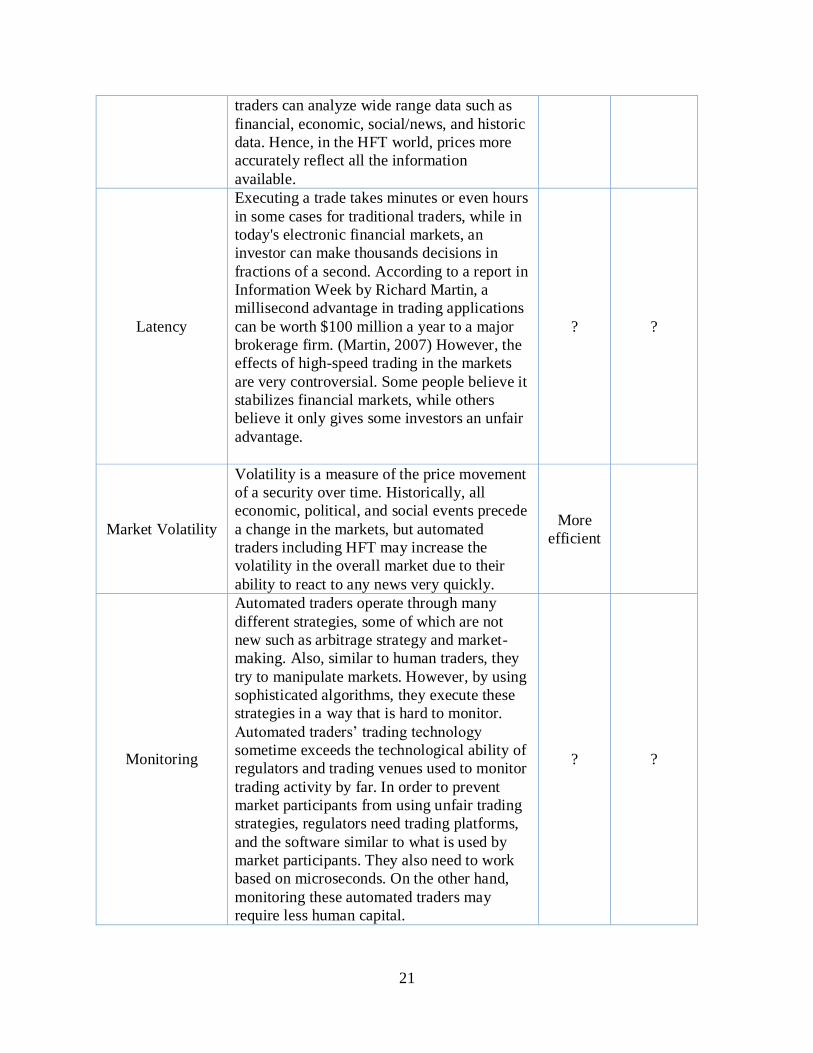
Term Description LFT Automated
Traders
Decision Making
Expecting the directional change of the
financial markets is one of the important
responsibility of traders. Automated traders
make a decision only based on the settings
that have been programmed into the platform.
Unlike human traders that can easily evaluate
different situation, differentiate unreasonable
moves in the market and can decide to pull
out the trades at any time, automated traders
can’t differentiate between genuine
information that financial markets rely on
from false information. A fake tweet about an
explosion at the White House that sent shock
waves through the stock market and caused
the S&P 500 to decline 0.9% is a good
example. I explain this more in detail in the
next chapter.
More
efficient
Objectivity
If there is not any programming issue,
automated traders can perform trades more
appropriately than human traders. Humans
sometimes become emotionally involved with
his or her investment, which sometimes leads
to wrong decisions.
More
efficient
Data Processing
Automated traders can process more data
compared to a human traders. By using highly
sophisticated computer programs, automated
More
efficient
21
traders can analyze wide range data such as
financial, economic, social/news, and historic
data. Hence, in the HFT world, prices more
accurately reflect all the information
available.
Latency
Executing a trade takes minutes or even hours
in some cases for traditional traders, while in
today's electronic financial markets, an
investor can make thousands decisions in
fractions of a second. According to a report in
Information Week by Richard Martin, a
millisecond advantage in trading applications
can be worth $100 million a year to a major
brokerage firm. (Martin, 2007) However, the
effects of high-speed trading in the markets
are very controversial. Some people believe it
stabilizes financial markets, while others
believe it only gives some investors an unfair
advantage.
? ?
Market Volatility
Volatility is a measure of the price movement
of a security over time. Historically, all
economic, political, and social events precede
a change in the markets, but automated
traders including HFT may increase the
volatility in the overall market due to their
ability to react to any news very quickly.
More
efficient
Monitoring
Automated traders operate through many
different strategies, some of which are not
new such as arbitrage strategy and market-
making. Also, similar to human traders, they
try to manipulate markets. However, by using
sophisticated algorithms, they execute these
strategies in a way that is hard to monitor.
Automated traders’ trading technology
sometime exceeds the technological ability of
regulators and trading venues used to monitor
trading activity by far. In order to prevent
market participants from using unfair trading
strategies, regulators need trading platforms,
and the software similar to what is used by
market participants. They also need to work
based on microseconds. On the other hand,
monitoring these automated traders may
require less human capital.
? ?
22
3.2. High-frequency Trading Working Mechanism
HFTs use many strategies to lower latency. In fulfilling orders, most HFTs’ servers are
designed based on two key criteria. First is fulfilling orders by price. The high buy orders or low
sale orders are fulfilled first. Second is fulfilling order by time, wherein a “first in first out” strategy
is used to fulfill orders with the same limit price. (Zook & Grote, 2014) According to Treleaven,
Galas, & Vidhi (2011), algorithmic trading’s working mechanism including HFT can be divided
into five stages as follows:
1. Data access/cleaning: The wide range and frequently updating data available for HFTs
guarantees their success in the markets. HFTs’ range of data includes financial, economic,
social/news, and historic data. (Treleaven, Galas, & Vidhi , 2011) Natural language
programming (NLP) reinforces HFTs to read millions of webpages at once, and trade on the
basis of new fundamental information. (Hara, 2014) One example illustrating HFTs’ ability to
collect and react to new arriving information was a false tweet about explosions in the White
House and injuring Barack Obama, posted by a group of hackers calling themselves the “Syrian
Electronic Army” on the official Associated Press news agency on April 23 rd, 2013. The false
tweet showed how fast HFTs and other algorithmic traders react to a real time information. As
a result of this post, the Dow Jones plunged more than 140 points and bond yields fell. Traders
quickly started selling S&P futures and buying Treasury 10-year futures. Although within just
six minutes, the Dow recovered its losses, Reuters estimated that the temporary loss of market
cap in the S&P 500 alone totaled $136.5 billion. (Domm, 2013)
2. Pre-trade analysis: Algorithmic and HFTs’ firms analyze property assets to identify trading
opportunities by using market data or financial news. The main components of this stage are
the Alpha, Risk and Transaction Cost models. (Treleaven, Galas, & Vidhi , 2011)
23
3. Trading signal generation: By taking the results of pre-trade analysis, HFTs decide which
portfolio should be traded. (Treleaven, Galas, & Vidhi , 2011) In accumulating portfolios, HFT
systems are thinking in a volume clock while traditional markets are based on trading time.
Hara (2014) compared the standardized return distributions of the e-mini S&P 500 futures
contract calculated every minute and calculated for every 1/50 of the daily volume. He found
that the actual time-weighted distribution is skinnier and has fatter tails than the normal
distribution. It is undesirable in financial markets because probability of occurring extreme
losses is higher than what would be expected with the normal distribution. On the other hand,
the volume clock distribution behaves more like the normal distribution, which matters because
it is easier to predict something that has normal distribution.
4. Trade execution: In this stage, several decisions are performed to control transaction costs
and trading duration. “Execution model which is used in this stage contains three parts; trading
venues, execution strategies, and order type.” (Treleaven, Galas, & Vidhi , 2011)
5. Post-trade analysis: HFTs analyze the result of their trading activities such as amount of
spread. In general, algorithmic traders use two common approaches. First is Momentum
strategy, in which the algorithm assumes that large increases in the price of a security will be
followed by additional gains and vice versa for declining values. Second is Mean Reversion,
meaning prices and returns eventually move back toward the average. (Treleaven, Galas, &
Vidhi , 2011)

24
3.3. High-frequency Traders’ Strategies
Proprietary firms may engage in a variety of strategies, some of which may benefit market
quality and some of which may be harmful. (U.S. Securities and Exchange, 2014) Most of the HFT
strategies are not new, but by using fast computers and special programs, HFTs can execute these
strategies better than other traders. Speed and low-latency are the priorities for HFTs. They invest
heavily in co-location and advanced computing technology to create an edge in strategic
interactions. They attempt to minimize their trading costs, profit from short-term changes in price,
and liquidate their position. We divided HFT strategies into legal and manipulation strategies as
follows:
3.3.1 High-frequency Traders’ Legal Strategies
1. Passive market-making: Passive market making primarily involves the submission of non-
marketable resting orders that essentially provide liquidity to the marketplace against a fee.
The profits for these strategies depend on earning a spread between bids and offers, and
liquidity rebates paid by most markets for resting liquidity. Passive market makers’ prices may
need to be updated frequently to find prices that are consistent with changing market conditions
because these passive orders generally are not executed immediately and must rest on an order
book. As a result, a passive market making strategy may generate an enormous number of
order cancellations or modifications as orders are updated. The two main concerns of passive
market makers are inventory risk and adverse selection. (U.S. Securities and Exchange, 2014)
2. Arbitrage strategy: An arbitrage strategy generally seeks to capture pricing disparities
between related products or markets, such as between an exchange traded product (ETP) and
its underlying basket of stocks or between different markets and venues. Arbitrage strategies
25
also do not depend on directional price moves, but rather on price convergence. (U.S.
Securities and Exchange, 2014)
a. Statistical arbitrage: Statistical arbitrage involves identifying opportunities for arbitrage
based on statistical links. The assumptions usually are derived from large historical datasets.
“Some market parties see this as directional trading rather than arbitrage.” (Netherlands
Authority for the Financial Markets, 2010, p. 15 ) Statistical arbitrage is often seen as an
advanced form of the strategy “pairs trading”. HFTs are calculating variance–covariance
matrices of both securities. When the price of one of two highly correlated securities goes up,
it is highly probable that the price of the second security will go up as well. HFTs instantly
compute a probability that the price of a certain stock goes up or down basis of predicted
correlations. Then, it will trade in a preferable side. (Hara, 2014)
b. Geographic arbitrage: It is profiting from price differentials between exchanges or markets
for the same securities. Geographic arbitrage is an important component of HFT strategies.
Two factors determine the success of the stagey; the physical distance between markets and
the type of medium used. For example, if information is transmitted between London and New
York stock exchange by satellite or microwave, it takes approximately 8 microseconds less if
transmitted by fiber optic cables. (Zook & Grote, 2014) This small difference may not be
important to human traders, but it makes a big difference in HFT environments. Also, the dark
pool becomes the main place for HFTs to conduct their arbitrage strategies. The primary goal
of dark pools was to allow the execution of large orders by a pension or mutual fund without
moving the market price. However, today dark pools are used to trade all size of trades, which
leads to trading similar securities at slightly different prices between markets. Hence, it
26
provides HFTs the opportunity to operate statistical and geographic arbitrage. (Zook & Grote,
2014)
3. Structural strategies: Structural strategies attempt to exploit structural vulnerabilities in the
market or in certain market participants. For example, traders with access to the lowest latency
market data and trading tools may be able to profit by trading with market participants on a
trading venue that is offering executions at stale prices. (U.S. Securities and Exchange, 2014)
The most important factor for success in structural strategies is being faster than the rest of the
market. This category consists of many types of strategies.
a. Analyzing the way other market participants’ algorithms for order execution work. As soon as
the party has discovered how these algorithms work, this knowledge can be used to perform
arbitrage. (Netherlands Authority for the Financial Markets, 2010)
b. Multiple co-location and central proximity hosting: Latency-sensitive market parties including
HFTs are often co-located in several places to exploit arbitrage and market-making strategies
that they execute between various platforms. “A trading platform offers market participants
who are members of the platform the opportunity to rent server racks in the same building, in
which the matching engine is located.” (Netherlands Authority for the Financial Markets,
2010, p. 18)
4. Directional strategies: Directional strategies generally involve establishing a long or short
position in anticipation of a price move up or down. There are two main types of directional
strategies: (U.S. Securities and Exchange, 2014)
a. Momentum ignition: It refers to a strategy of initiating and canceling a number of orders.
HFTs attempt to prompt other participants to trade quickly and cause a rapid price movement.
In momentum ignition, HFTs induce short time volatility to profit from later price reversals.
27
(Tse, Lin, & Vincent, 2012) Zook & Grote (2014) referred to momentum ignition as an illegal
strategy. Also, U.S. Securities and Exchange (2014) stated that it may pose particular problems
for long-term investors and may present serious problems in today’s market structure.
b. Order anticipation strategy: It seeks to ascertain the existence of large buyers or sellers in
the marketplace and then trade ahead of those buyers or sellers in anticipation that their large
orders will move market prices (up for large buyers and down for large sellers). (U.S. Securities
and Exchange, 2014)
3.3.2. High-frequency Traders’ Manipulation Strategies:
1. Liquidity Detection: Quick access to the market enables HFTs to successfully implement a
"liquidity detection" strategy that seeks solely to ascertain whether there is a large buyer or
seller in the market (such as an institutional investor); HFTs may be able to profit from trading
ahead of the large order. (Muthuswamy, Palmer, Richie, & Webb, 2011)
2. Dark Pools of Liquidity: Alternative trading systems (ATS) are venues for matching the buy
and sell. The SEC reported that that there were 87 registered ATS through December 1st, 2014.
(U.S. Securities and Exchange Commission, n.d.) Most ATS operate on dark pools by
providing a venue for traders to privately display orders and latent demand in an effort to avoid
market impact. Though many dark pools were developed as a means for crossing large trades,
they have evolved into markets for smaller trades that are sliced orders of larger "parent" trades.
Additionally, some dark pools consist of trades that broker-dealers are trying to cross internally
rather than trade publicly. HFTs may seek opportunities in dark pools by "fishing" using a
small number of shares as "bait" and taking the resulting transactions as indicators of liquidity
and potential profits. (Muthuswamy, Palmer, Richie, & Webb, 2011)
28
3. Flash Orders: International Securities Exchange (2009) defined flash orders as:
Procedures defined by a trading venue (e.g., exchange or ECN) to expose
marketable orders that have been submitted to that venue when the national best
bid/offer (NBBO) is at an away market. The marketable order is exposed for a
predefined period of time and may execute on the original market if responders to
the order exposure match or improve the NBBO. If the NBBO is not matched or
improved, the order is then routed to the better away market or cancelled back to
the order-entry firm (depending on the customer’s original instructions). (p. 2)
High speed technology allows HFTs to view orders from other market participants before
others in the marketplace. Although Flash Orders provide some market benefit, for example, for
some investors, flash orders are a mechanism by which they can identify latent liquidity without
revealing their intentions via a public order, they may give HFTs unfair advantage. The concern
with flash orders is that those with the fastest computers gain an informational advantage over
long-term investors. (Muthuswamy, Palmer, Richie, & Webb, 2011) In August 2009, SEC
Chairman Mary Schapiro said she had asked the agency's staff to develop a proposal to "eliminate
the inequity that results from flash orders." (Patterson, Scannell, & Rogow, 2009)
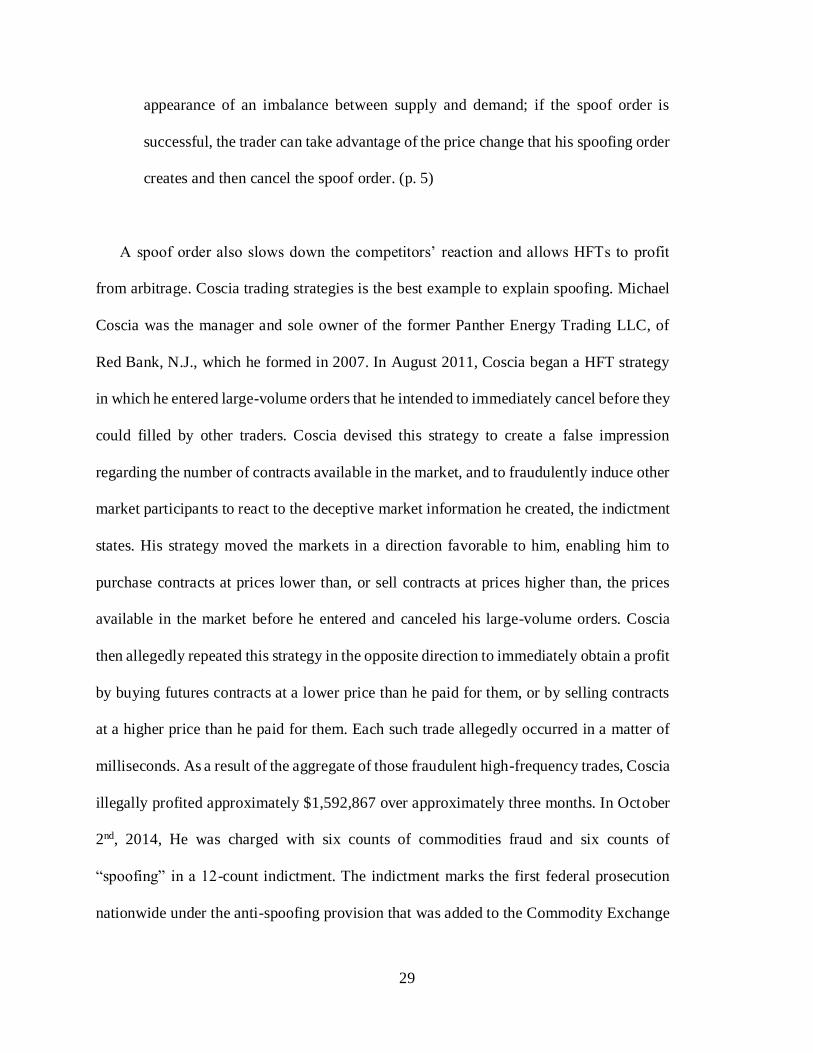
4. Spoofing: (Muthuswamy, Palmer, Richie, & Webb (2011) defined spoofing as:
Spoofing is essentially a microstructure-based strategic trading technique. A spoof
order is a visible order that is submitted to the limit order book by a trader who has
no intention of filling the order. The objective of a spoof order is to create the
29
appearance of an imbalance between supply and demand; if the spoof order is
successful, the trader can take advantage of the price change that his spoofing order
creates and then cancel the spoof order. (p. 5)
A spoof order also slows down the competitors’ reaction and allows HFTs to profit
from arbitrage. Coscia trading strategies is the best example to explain spoofing. Michael
Coscia was the manager and sole owner of the former Panther Energy Trading LLC, of
Red Bank, N.J., which he formed in 2007. In August 2011, Coscia began a HFT strategy
in which he entered large-volume orders that he intended to immediately cancel before they
could filled by other traders. Coscia devised this strategy to create a false impression
regarding the number of contracts available in the market, and to fraudulently induce other
market participants to react to the deceptive market information he created, the indictment
states. His strategy moved the markets in a direction favorable to him, enabling him to
purchase contracts at prices lower than, or sell contracts at prices higher than, the prices
available in the market before he entered and canceled his large-volume orders. Coscia
then allegedly repeated this strategy in the opposite direction to immediately obtain a profit
by buying futures contracts at a lower price than he paid for them, or by selling contracts
at a higher price than he paid for them. Each such trade allegedly occurred in a matter of
milliseconds. As a result of the aggregate of those fraudulent high-frequency trades, Coscia
illegally profited approximately $1,592,867 over approximately three months. In October
2nd, 2014, He was charged with six counts of commodities fraud and six counts of
“spoofing” in a 12-count indictment. The indictment marks the first federal prosecution
nationwide under the anti-spoofing provision that was added to the Commodity Exchange
30
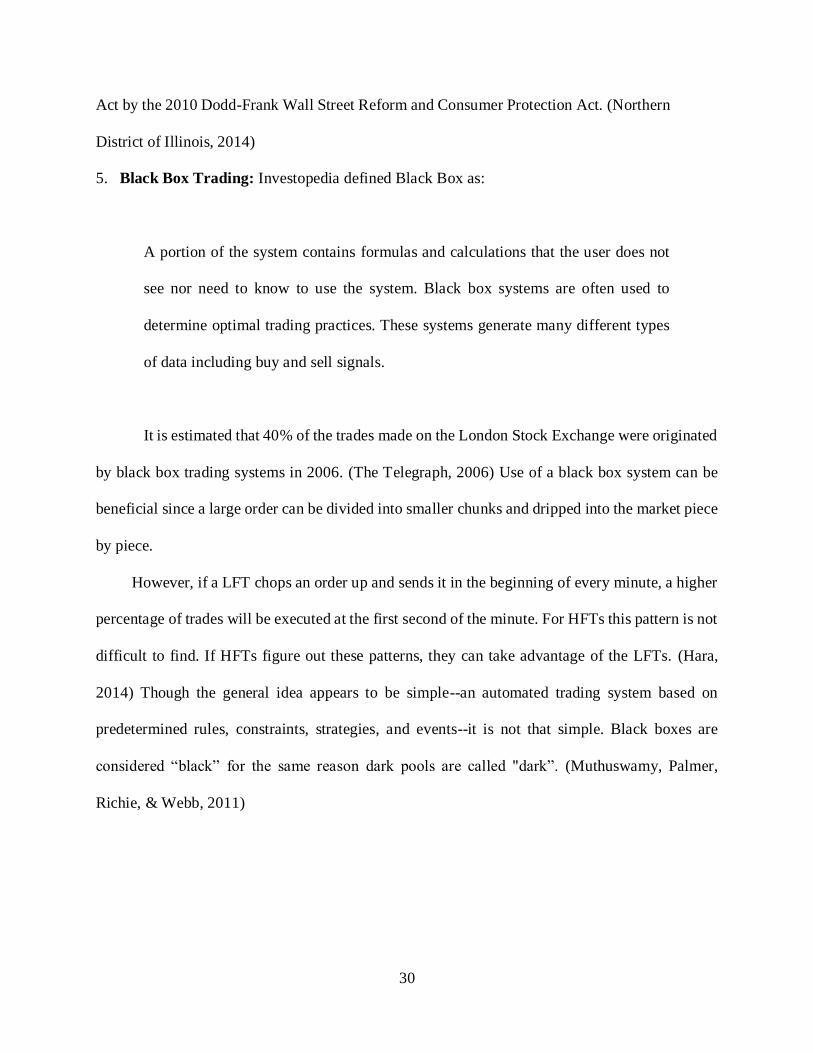
Act by the 2010 Dodd-Frank Wall Street Reform and Consumer Protection Act. (Northern
District of Illinois, 2014)
5. Black Box Trading: Investopedia defined Black Box as:
A portion of the system contains formulas and calculations that the user does not
see nor need to know to use the system. Black box systems are often used to
determine optimal trading practices. These systems generate many different types
of data including buy and sell signals.
It is estimated that 40% of the trades made on the London Stock Exchange were originated
by black box trading systems in 2006. (The Telegraph, 2006) Use of a black box system can be
beneficial since a large order can be divided into smaller chunks and dripped into the market piece
by piece.
However, if a LFT chops an order up and sends it in the beginning of every minute, a higher
percentage of trades will be executed at the first second of the minute. For HFTs this pattern is not
difficult to find. If HFTs figure out these patterns, they can take advantage of the LFTs. (Hara,
2014) Though the general idea appears to be simple--an automated trading system based on
predetermined rules, constraints, strategies, and events--it is not that simple. Black boxes are
considered “black” for the same reason dark pools are called "dark”. (Muthuswamy, Palmer,
Richie, & Webb, 2011)
31
3.4. The Impacts of High-frequency Traders on the Financial Markets’ Stability
3.4.1. High-frequency Traders’ Co-Location
HFTs face significant computer infrastructure demands as they cope with the incredibly
high message traffic where milliseconds can make the difference between success and failure.
Thus, the location of market participants becomes important as latency is reduced when the HFTs’
servers are physically located more closely to market operators. (Muthuswamy, Palmer, Richie, &
Webb, 2011) Therefore, most HFTs are co-locating in several places in order to efficiently execute
client orders under their best execution obligation, exploit market weaknesses, and conduct
arbitrage strategy. For example, co-location is an important determinant to success HFTs in
conduct geographical arbitrage.
Traders argue that reducing latency by means of co-location should be regarded as an unfair
trading practice. “According to them, co-location gives the market participants an unfair
technological advantage. Indeed, because of their minimum distance from the platform’s matching
engine, they have an advantage in terms of information over participants who are further removed
from the matching engine.” (Netherlands Authority for the Financial Markets, 2010, P. 21)
According to an interview with the Deutsche Börse, which was used as an example of HFTs
manipulation strategy by Zook & Grote (2014), even in the trading platforms, HFTs try to position
their server directly below the exit nozzle of the air conditioning system because this provides a
somewhat cooler operating temperature, which allows HFTs’ server to react faster to market
information than their not-so-cool peers.
The desire to co-locate servers at exchanges to reduce latency and to gain a few
milliseconds’ advantage in trade recognition and execution has its counterpart in the past. In the
19th century, the inventions of the telegraph allowed some traders to receive price quotations before

32
others because not all market participants received the information at the same time. (Webb, 2003)
However, in HFT environment location within a trading facility is key concern. According to Zook
& Grote (2014) the important of position in electronic market has shifted spot of actual trading
from city centers to the sidelines of financial regions. For example, “the matching engines of the
NYSE and NASDAQ located in Mahwah and Carteret, New Jersey respectively 55 and 35
kilometers from Wall Street while the co-location facility for the Chicago Mercantile Exchange is
66 kilometers from city center in Aurora, Illinois.” (Zook & Grote, 2014, p. 9) A similar pattern
also exists in the European market.
There are several ways for market participants to acquire access to trading platforms. For
instance, according to Netherlands Authority for the Financial Markets (2010), there are two main
ways to access trading platforms in the European marketplace:
1. Membership of a platform: it is the most direct and fastest way but it involves high cost.
2. Sponsored access (SA): It is an alternative form of direct access. Sponsored access consists of
an adapted form of direct market access (DMA). DMA enables clients of an intermediary that
is a member of a trading platform to obtain direct access to the trading platform, without
themselves having to become members. This provides a gain in terms of speed. DMA and SA
may be attractive to market participants which are latency-sensitive, but due to cost or other
reasons such as maintaining anonymity, flexibility, and/or limiting compliance obligations do
not need to become a member of a platform. (Netherlands Authority for the Financial Markets,
2010)
33
Risks Associated to Sponsored access (SA) and Direct Market Access (DMA)
Erroneous transactions: Erroneous transactions are results of human error (fat fingers) or an
incorrectly programmed trading algorithm (rogue algorithms). Ordinarily, traders will also
have set up systems to detect this kind of error before it is sent to the trading platform. Since
these systems offer no guarantee that erroneous transactions will be prevented, it is essential
that additional monitoring occur. (Netherlands Authority for the Financial Markets, 2010)
Market abuse: Accessing trading via DMA or SA makes it difficult to get a complete picture
of the behavior of players in the market. In many European countries, market participants that
connect to a platform via a DMA or SA contract with an intermediary are able to trade under
the name of the intermediary. The Netherlands Authority for the Financial Markets (2010) is
in favor of the introduction of a “client ID”. “This would enable supervisors to monitor the
market more effectively; the use of DMA and SA would be less attractive to parties with
malicious intentions and the specific risks of market abuse related to DMA and SA would be
reduced.” (Netherlands Authority for the Financial Markets, 2010)
3.4.2. High-frequency Trading and Price Discovery:
In pre-electronic securities trading, the search process was particularly costly, and a
centralized market could capitalize on a large network externality that, in effect, created a high
entry barrier for new market entrants. In the electronic age, search cost is very insignificant as
arrival market prices are easily checked by a computer. (Pagano, 1989)
The cost a market-maker experiences is comprised of essentially three components: order-
handling cost such as the fee an exchange charges to process an order, the cost of being adversely
selected on a bid or ask quote, and the premium risk-averse market makers require for price risk
34
of non-zero positions. (Madhavan, 2000) Market-makers prefer to operate in a system where these
costs are low. Brogaard, Hendershott, & Riordan (2013) found that HFTs facilitate price efficiency
on normal and on the highest volatility days by trading in the direction of permanent price changes
and in the opposite direction of transitory pricing errors. Also, they found HFTs’ marketable
orders’ informational advantage is sufficient to overcome the bid-ask spread and trading fees to
generate positive trading revenues. For non-marketable limit orders the costs associated with
adverse selection are less than the bid-ask spread and liquidity rebates.
They also find that HFT is correlated with public information, such as macro news
announcements, market-wide price movements, and limit order book imbalances. They believe
HFTs predict price changes occurring a few seconds in the future. However, they believe if this
information would become public without HFTs, the potential welfare gains may be small or
negative if HFTs impose significant adverse selection on longer-term investors. If HFTs’ liquidity
supply at the time of arriving new information is greater than HFTs’ liquidity demand, overall
HFTs are not imposing net adverse selection on others around macroeconomic news. (Brogaard,
Hendershott, & Riordan, 2013) Brogaard J. A. (2010) reached the same conclusion that although
HFTs rely on a less diverse set of strategies than non- HFTs, they add substantially to the price
discovery process. Brogaard, Hendershott, & Riordan (2013) and Brogaard J. A. (2010) claimed
that HFTs have a beneficial role in the price discovery process in terms of information being
impounded into prices and smaller pricing errors.
3.4.3. High-frequency Trading and Market Liquidity
Most researchers agree that HFT market makers benefit the market by providing liquidity.
However, HFTs’ liquidity providing strategy may be temporary since in the absence of affirmative

35
obligations, HFTs could cause disruptions by exiting the market at a stress time. HFTs also engage
in arbitrage strategies, which have the beneficial effect of making prices more efficient.
There are several indicators to measure markets’ liquidity:
The bid-ask spread: It is often used as an indicator of liquidity. The narrower the spread, the
greater the liquidity of a stock.
Market depth: It is another indicator of liquidity. “The deeper the market, the larger an order
must be to cause a change in the price, and the greater the liquidity of the stock.” (Netherlands
Authority for the Financial Markets, 2010, p. 29)
Markets’ information can be used very differently. For example, liquidity demanders attempt
to use the information contained in order flow and in price changes to capture market inefficiencies
while liquidity suppliers use computer algorithms to process the same information in an effort to
avoid being "picked off." Meanwhile, institutional investors use AT to minimize transaction costs
and reduce the market impact associated with large trades by employing algorithms that slice large
orders into smaller orders. (Muthuswamy, Palmer, Richie, & Webb, 2011) Like many other
financiers, Carrion (2013) agree that HFT increases market liquidity, but He believes that the
liquidity they provide is unreliable because it is outweighed by disruptive practices they employ
such as spoofing, predatory trading, and overloading market infrastructure with excessive
messages. Also, since aggressive HFTs earn substantially higher returns than passive HFTs-- the
average aggressive HFTs earn an annualized alpha of 90.67%, while the average passive firm earns
23.22%-- passive HFTs have a strong profit motivation to change their strategies. (Baron,
Brogaard, & Kirilenko, 2014)
Inventory cost also has a great effect on the liquidity. HFTs generally seek a flat position at the
end of the day. Naik & Yadav (2003) computed the ordinary inventory positions of London equity
36
dealer firms across all stocks using an LSE dataset. They examined whether the trading and pricing
decisions of these dealer firms in individual stocks are more closely related to their ordinary
inventory of that stock or to other measures of their equivalent inventory. They found strong
evidence that the decision-making of dealers is governed by their ordinary inventories. They also
concluded that market-maker inventory adjustment takes place relatively slowly. (Naik & Yadav,
2003) Since HFTs can manage inventory more aggressively, they may have greater effects on
liquidity. This is consistent with the many other researchers’ predictions of HFTs’ ability to
provide liquidity.
3.4.4. Bid-ask Spread
Bid-ask spread is a difference between buying and selling price of a particular security.
Different securities have different spreads based on number of willing buyers or sellers for this
particular security. There are several other factors that determine the difference between the bid
and ask prices. The volume of a security traded on a daily basis is the first factor. The securities
that have larger trading volume have a narrower spread than the securities that are traded
infrequently. Another important factor is volatility. In volatile period the spread is much larger
because market participants require a higher return for an extra amount of risk that they are willing
to take. Another factor that affects bid-ask spread is a stock’s price. Most of low price securities
have a wider spread as they have limited trades because most of them are new or small in size.
(Sargeant, n.d.) Finally, the risk facing investors, such as inventory risk and asymmetric
information risk arising from informed traders, is another determiner of bid-ask spread. Since most
researchers agree that HFTs provide liquidity and have better inventory management, one can
assume that they can reduce bid-ask spread, which aligns with claims of HFT advocators. In the
37
time when HFT was increasing, the bid–ask spread dropped by 50% in the Chi-X market.
(Menkveld, 2013)
HFTs are able to rapidly adjust the bid and ask prices they offer base on market
circumstances due to their high speed. “This means they are able to remain closer to a certain
reference price with their prices, without increasing their trading risk.” (Netherlands Authority for
the Financial Markets, 2010, p. 28) As a result, they can provide a narrower bid-ask spread and
lower trading costs for market participants. However, some researchers believe that spread is small
because most HFT strategies are intermarket arbitrage. They believe that HFTs basically move
liquidity from a market where it is abundant to a market where it is less abundant. (Hara, 2014)
3.4.5. Execution Costs
Execution Costs consist of direct cost (bid-ask spreads, commissions, and clearing and
settlement costs) and indirect cost such as human capital and infrastructure. (Brogaard, et al., 2013)
“Obtaining accurate measures of trade execution costs and assessing the reasons for their
systematic variation is important to individual investors, portfolio managers, those evaluating
brokerage firms or financial market performance, and corporate managers considering where to
list their shares.” (Bessembinder, 2003, p. 2) Supporters of HFT argue that HFT lowers transaction
costs for market participants. Carrion (2013) stated that HFTs execute their trades at better prices
than non-HFTs and have some ability to avoid adverse selection costs on larger trades when
supplying liquidity. Nonetheless, he believes that proving that HFTs reduce transaction cost
requires more study because it is possible that causality runs in the opposite direction. HFTs may
position their trading behavior on expected trading costs. (Carrion, 2013)
38
The Netherlands Authority for the Financial Markets (2010) argued that it is in the interest
of the platforms to attract HFTs because in addition to providing liquidity, HFTs will ensure that
costs of market access do not become unreasonable, and they are charging competitive transaction
costs. This is consistent with Carrion’s (2013) final conclusion that even if HFTs do not participate
in a given trade, their presence in the market could still affect the cost of that trade through
competition or adverse selection.
On the other hand, opponents of HFT claim that execution costs, a component of
transaction costs, could be increasing because of HFTs. They increase execution costs by reacting
faster to public information, which picks off orders from slower market participants. Another
possible reason is trading in front of institutional investors through the detection of autocorrelation
in order flow caused by institutional investors entering large trades. (Baron, Brogaard, &
Kirilenko, 2011) (Brogaard, et al., 2013)
In conclusion, HFT is more likely to reduce execution cost. Advances in technology lower
barriers to entry and increases compaction, which may trigger price wars that end with further
reductions in clearing fees. New market entrants may offer lower commissions than those that
currently exist. Moreover, new market players with lower operating costs can provide the same
level of services at a lower price. (Brogaard, et al., 2013) However, new regulations may be
necessary to foster competition for volume on a global scale. Also, regulation must limit increasing
technology requirements which involve big up-front, fixed costs and generate higher barriers to
entry.
39
3.4.6. Speed of Execution
Given the fact that speed is an important factor of profitability, HFTs have strong incentives
to compete over non- HFT peers in an industry dominated by a small number of incumbents
earning high and persistent returns. (Baron, Brogaard, & Kirilenko, 2014) Advocates of HFTs
argue that HFTs increases the speed of filling orders. As a result, there is less time for adverse
price changes between placing and executing the order. Between the time of placing an order and
executing the transaction, valuable information may come to light which was not considered in the
order. Hence, an adverse selection problem may arise. In the case of adverse selection, the late
investor may gain a price advantage by waiting for new information, but a high speed execution
reduces the chance of incurring the adverse selection problem. (Netherlands Authority for the
Financial Markets, 2010) (Hagströmer & Nordén, 2013). Unsurprisingly in the last few years, the
latency gap between HFTs and non-HFTs decreases, which reflects an improvement in technology
over time. (Hagströmer & Nordén, 2013).
3.4.7. High-frequency Traders’ Effects on Firms’ Decision Making
Beside its macro structural effects, HFTs may affect firms’ decisions and their subsequent
valuation. Thomas Hanson in his PhD dissertation (2014) explored HFTs’ effects on three
corporate finance variables: the quality of corporate governance, the value of the firm, and the
value of cash held on the balance sheet. He stated that “the effect of HFT is detrimental to firms.
Corporate governance becomes less democratic, firm value declines, and the market gives a lower
value to cash on the balance sheet.” (p. 1)
40
3.5. The Impacts on the Market Volatility
Volatility is of the most controversial aspect of the market quality in relation to HFTs’
activities.
It refers to the amount of uncertainty or risk about the size of changes in a security's
value. A higher volatility means that a security's value can potentially be spread out
over a larger range of values. Volatility can either be measured by using the
standard deviation or variance between returns from that same security or market
index. (Investopedia, n.d.)
Many researchers have noted that aggregate stock market volatility changes over time, and
there have been many attempts to relate changes in stock market volatility to changes in expected
returns to stocks. Some researchers believe that volatility is exaggerated by an increase in HFT.
(Schwert, 1988) Unlike some benefits of HFT such as providing liquidity and narrowing spread,
which seem to be clear and generally agreed, there is a controversy over its cost risen in price
volatility. (Hong, 2013) Proponents of HFT claim that although the spread becomes wider in
volatile situations, HFTs continue to set prices even in volatile periods. However, due to their
technological development HFTs can withdraw from the market at times when it becomes too
difficult for them to estimate the correct price of a share in the absence of any market making
obligations. Furthermore, the increasing dependence on algorithms in general may increase
volatility and systematic risk. (Netherlands Authority for the Financial Markets, 2010)
Zhang (2010) found that although market-making activity reduces stock volatility since it
provides liquidity to the market and generates revenues only from the bid–ask spread as well as
41
incentive rebates provided by electronic communication networks (ECNs), HFT in general is
positively correlated with stock price volatility after controlling for firm fundamental volatility
and other exogenous determinants of volatility. He stated that the correlation is even stronger
among the top 3,000 stocks in market capitalization and among stocks with high institutional
holdings. During high market uncertainty, this positive correlation is stronger. Zhang (2010)
provides three reasons for why HFTs increase market volatility:
1. High trading volume generated by HFTs is not necessarily a reliable indicator of market
liquidity, especially in times of significant volatility. The automated execution of large orders
by fundamental investors could trigger excessive price movement such as the Flash Crash on
May 6th, 2010.
2. “HFT is often based on short-term statistical correlations among stock returns. A large number
of unidirectional trades can create price momentum and attract other momentum traders to the
stock, a practice that amplifies price swings and thus increases price volatility.” (Zhang, 2010,
p. 10)
3. HFTs may use manipulation strategies such as front-run large orders by institutional investors.
HFTs push the stock price up if institutional investors have large buy or vice versa. Hence,
they add stock price volatility.
Hong (2013) believes that HFT and volatility is related to all sorts of issues including market
stability, short-term and long-term expectations, herding behavior and even systemic risk. In
general, HFT consists of two components, predetermined algorithmic trading strategy and frequent
trading. He believes that studying both components together creates the controversial arguments
about HFT effects on the market volatility. “Careful reading of existing literatures reveals that
most of the existing works focus on the empirical evidences and have less emphasis on the
42
possibility that the increase or the decrease in the volatility might be due to statistical properties.”
(Hong, 2013, p. 4) The focus on empirical evidence would be one of the reasons why it is hard to
distinguish the impact of one from that of the other. In his theoretical research Hong (2013)
investigated the relationship between more frequent trading and price volatility at asset and
portfolio levels with a stochastic price process. He suggested that in regulating HFTs activities,
the more frequent trading aspect of the HFTs should be separated from algorithmic code that
determines the trading behavior. The result of this paper suggests that while fast and more frequent
trading has clear benefits of lowering the cost of trading, increasing the information of quotes,
providing liquidity and eliminating arbitrage, there is no theoretical evidence that it increases the
price volatility. (Hong, 2013)
In general, most of HFT strategies are designed to work under high liquidity and low volatility.
Therefore, HFT participants are more likely to stabilize markets and reduce risk when volatility is
low. However, HFTs have also designed trading models that work under more volatile conditions.
(Debelle, 2011) Since HFTs have access to markets more quickly, they can submit or cancel their
orders faster than long-term investors are able to do which may result in less favorable trading
conditions for these investors. “This quicker access could, for example, enable HFTs to
successfully implement "momentum" strategies designed to prompt sharp price movements and
then profit from the resulting short-term volatility.” (Muthuswamy, Palmer, Richie, & Webb,
2011, p. 3)
Using an event study based on changes in minimum tick size, Hagströmer & Nordén (2013)
focused on the effects of HFTs’ activities on short-term volatility. They identified an event day
based on the change in the minimum tick size. Since the time that it takes for each trader to react
to change in the tick size is different, they identify the last day before and the first day after the
43
event day on which transaction prices remain in the same tick size category for the whole day, and
if such day is not found within ten days before and after an event day, the event is rejected. Also,
they calculate intraday realized stock return volatility using midpoint quote changes in 1-, 5-, 10-,
and 15-minute intervals. The authors concluded that market-making HFTs’ activities are good for
the overall market quality and reduce short-term volatility. They also stated that while most
economists agree that HFTs affect market volatility, the opposite also may be true. HFTs’ firms
focus on the most liquid stocks in each market with high efficiency and low volatility; hence
volatility may reduce HFTs’ activities. For example, opportunistic HFTs supply significantly less
liquidity for stocks with low market capitalization, low trading volume, and high volatility.
(Hagströmer & Nordén, 2013)
3.5.1 Flash Crash May 6th, 2010
On May 6th, 2010 between 2:30 and 2:47 pm, the prices of many US-based equity products
experienced an extraordinarily rapid decline and recovery. The Dow Jones Industrial Average
(DJIA), S&P 500, and NASDAQ 100 all reached their daily minima. By 2:30, the Dow Jones
Industrial Average (DJIA) was down about 2.5%. Furthermore, E-Mini S&P 500 futures contracts
and the S&P 500 SPDR Exchange Traded dropped from the early-morning level of nearly $6
billion dollars to $2.65 billion (representing a 55% decline). On that day, many other equity
securities and exchange traded funds (ETFs) suffered similar price declines. Over 20,000 trades
executed at prices 60% or more away from their values before the crash. (The Staffs of the CFTC
and SEC, 2010)
The Staffs of the CFTC and SEC (2010) report on the market events of May 6 th, 2010 noted
that HFTs and intermediaries built up temporary long positions, specifically HFTs, which
44
accumulated a net long position of about 3,300 contracts. Then suddenly, HFTs stopped providing
liquidity and instead began to take liquidity. They started competing with the large Fundamental
Seller for the liquidity.
The imbalance between buy and sell sides as a result of using nonpublic information by
some traders is measured by VPIN (volume synchronized probability of informed trading). VPIN
is a way to measure this imbalance, and it provides a degree of the market’s “toxicity”. “VPIN is
estimated using a volume clock, and it works by capturing the imbalance between buy-initiated
volume and sell-initiated volume over volume increments.” (Hara, 2014, p. 5)
Hara (2014) stated that on May 6th 2010 at 11:56 am, the realized value of the VPIN was
in the 10% tail of its distribution (meaning that 90% of the time, VPINs are below this level). It
means that the market was very toxic. The VPIN kept going up; by 1:08 pm (an hour and a half
before the market crashes), it was at the 1% tail of the distribution. “Therefore, the market plunged.
This buildup of toxicity was captured by the VPIN, suggesting it is a potent tool for monitoring
markets going forward.” (Hara, 2014, p. 6)
Hong (2013) argued that even HFTs’ contribution to the Flash Crash May 6 th, 2010 was
due to the algorithmic or automated feature, not the high frequency feature of HFTs. The selling
pressure due to the lack of liquidity demand was the reason for the crash. The hot-potato volume
effects were due to the herding effect created by algorithms that acted in the same style
simultaneously. This is not due to more frequent trading. The lack of liquidity was induced because
the trading algorithms were coded in similar style, which created the herding behavior. This has
not much to do with fast trading.
There are several other reasons behind May 6th flash crash. Currency movement,
particularly changes in the U.S. dollar/Japanese yen, sale of 75,000 E-Mini contracts by Waddell
45
& Reed, and a large purchase of put options by the hedge fund Universa Investments were the
primary cause of the crash. Nonetheless, the predatory practice called quote stuffing by algorithmic
trading forced competitors to slow down their operations in order to catch up with the
overwhelming amount of data. In their analysis of the flash crash, Easley, Marcos, & Maureen
(2011) applied Hara‘s (2014) model to measure order toxicity (VPIN). They claim that HFTs were
not the actual cause of the crash, but were responsible for liquidity crises since some electronic
market makers withdrew liquidity in the market. They provide evidence that during the crash order
flow was becoming increasingly toxic for market makers. Hence, HFTs leave the market, setting
the stage for irregular illiquidity. After the May 6th, 2010 Flash Crash, estimating toxicity becomes
the important indicator for market-makers. If they expect losses from trading with better-informed
counterparts, and if they believe that this toxicity is too high, they will liquidate their positions and
leave the market.
In their study, Easley, Marcos, & Maureen (2011) confirmed Hara’s (2014) results. They
stated that (a) the VPIN metric for E-mini S&P 500 futures was abnormally high at least one week
before the crash, and (b) the market toxicity got worse several hours before the crash, as at 11:55
a.m. on May 6th the realized value of the VPIN metric was in the 10% tail of the distribution. The
realized value of the VPIN metric was increased, and it reached 5% tail of the distribution at 1:08
p.m. This indicates the importance of strong market monitoring because if market makers consider
these alerts the crash might be prevented, or at least it might be less severe.
3.6. High-frequency Trading in the Foreign Exchange Market
Today’s foreign exchange market structures are very different from twenty years ago. New
electronic trading platforms and trading strategies like HFT reduce trading costs and increase
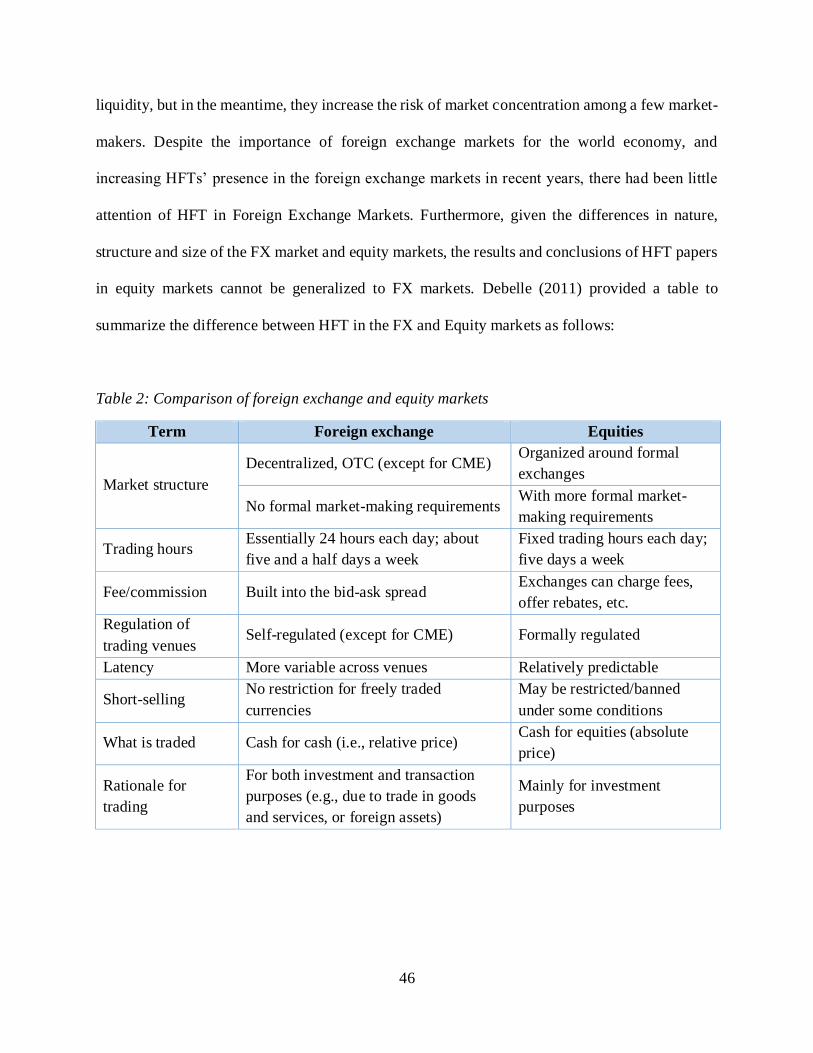
46
liquidity, but in the meantime, they increase the risk of market concentration among a few market-
makers. Despite the importance of foreign exchange markets for the world economy, and
increasing HFTs’ presence in the foreign exchange markets in recent years, there had been little
attention of HFT in Foreign Exchange Markets. Furthermore, given the differences in nature,
structure and size of the FX market and equity markets, the results and conclusions of HFT papers
in equity markets cannot be generalized to FX markets. Debelle (2011) provided a table to
summarize the difference between HFT in the FX and Equity markets as follows:
Table 2: Comparison of foreign exchange and equity markets
Term Foreign exchange Equities
Market structure
Decentralized, OTC (except for CME) Organized around formal
exchanges
No formal market-making requirements With more formal market-
making requirements
Trading hours Essentially 24 hours each day; about
five and a half days a week
Fixed trading hours each day;
five days a week
Fee/commission Built into the bid-ask spread Exchanges can charge fees,
offer rebates, etc.
Regulation of
trading venues Self-regulated (except for CME) Formally regulated
Latency More variable across venues Relatively predictable
Short-selling No restriction for freely traded
currencies
May be restricted/banned
under some conditions
What is traded Cash for cash (i.e., relative price) Cash for equities (absolute
price)
Rationale for
trading
For both investment and transaction
purposes (e.g., due to trade in goods
and services, or foreign assets)
Mainly for investment
purposes
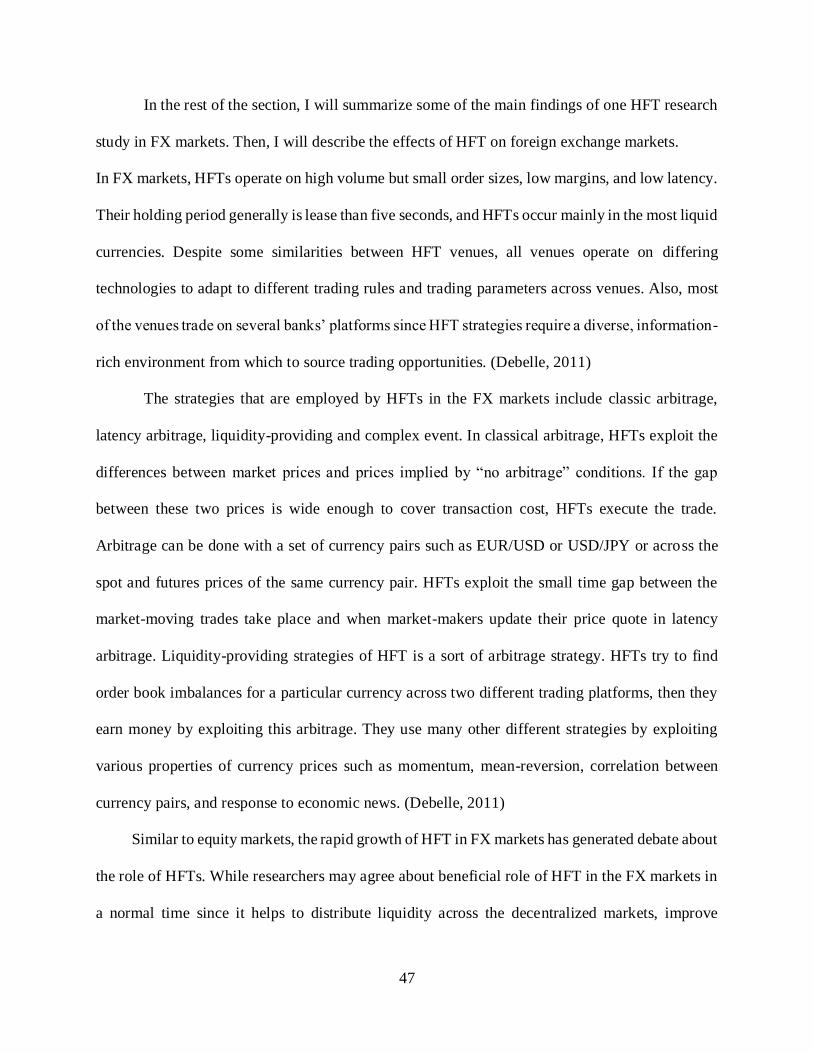
47
In the rest of the section, I will summarize some of the main findings of one HFT research
study in FX markets. Then, I will describe the effects of HFT on foreign exchange markets.
In FX markets, HFTs operate on high volume but small order sizes, low margins, and low latency.
Their holding period generally is lease than five seconds, and HFTs occur mainly in the most liquid
currencies. Despite some similarities between HFT venues, all venues operate on differing
technologies to adapt to different trading rules and trading parameters across venues. Also, most
of the venues trade on several banks’ platforms since HFT strategies require a diverse, information-
rich environment from which to source trading opportunities. (Debelle, 2011)
The strategies that are employed by HFTs in the FX markets include classic arbitrage,
latency arbitrage, liquidity-providing and complex event. In classical arbitrage, HFTs exploit the
differences between market prices and prices implied by “no arbitrage” conditions. If the gap
between these two prices is wide enough to cover transaction cost, HFTs execute the trade.
Arbitrage can be done with a set of currency pairs such as EUR/USD or USD/JPY or across the
spot and futures prices of the same currency pair. HFTs exploit the small time gap between the
market-moving trades take place and when market-makers update their price quote in latency
arbitrage. Liquidity-providing strategies of HFT is a sort of arbitrage strategy. HFTs try to find
order book imbalances for a particular currency across two different trading platforms, then they
earn money by exploiting this arbitrage. They use many other different strategies by exploiting
various properties of currency prices such as momentum, mean-reversion, correlation between
currency pairs, and response to economic news. (Debelle, 2011)
Similar to equity markets, the rapid growth of HFT in FX markets has generated debate about
the role of HFTs. While researchers may agree about beneficial role of HFT in the FX markets in
a normal time since it helps to distribute liquidity across the decentralized markets, improve
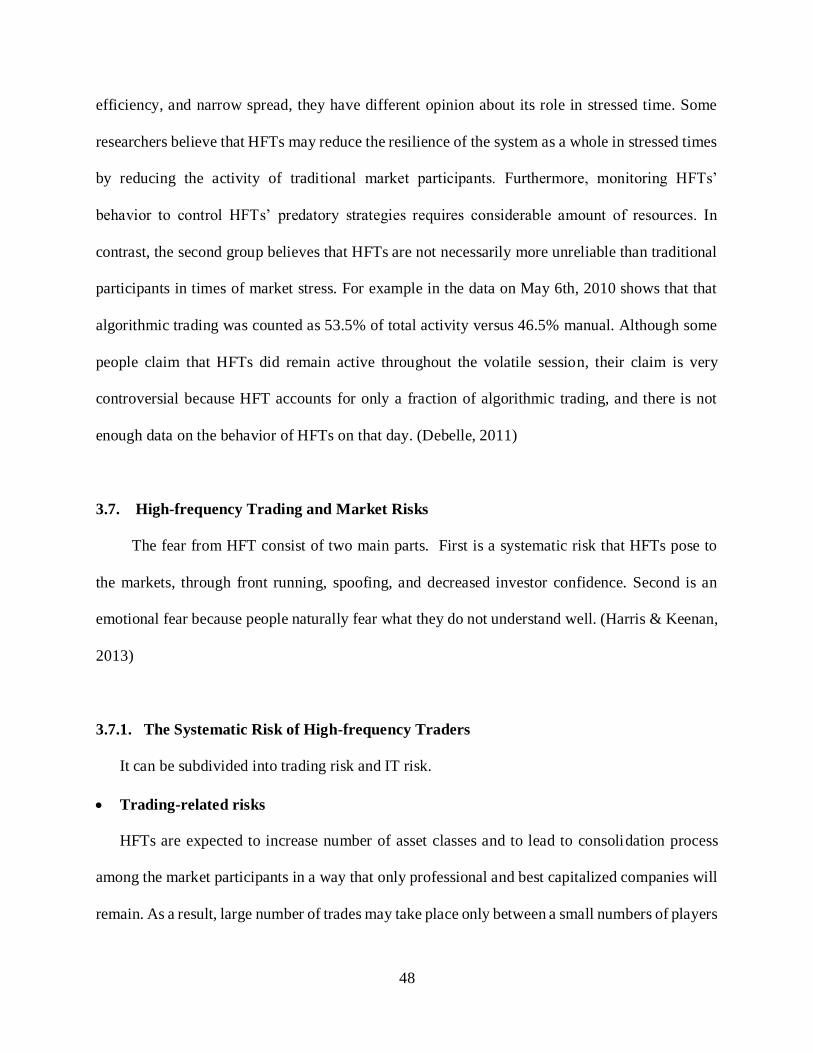
48
efficiency, and narrow spread, they have different opinion about its role in stressed time. Some
researchers believe that HFTs may reduce the resilience of the system as a whole in stressed times
by reducing the activity of traditional market participants. Furthermore, monitoring HFTs’
behavior to control HFTs’ predatory strategies requires considerable amount of resources. In
contrast, the second group believes that HFTs are not necessarily more unreliable than traditional
participants in times of market stress. For example in the data on May 6th, 2010 shows that that
algorithmic trading was counted as 53.5% of total activity versus 46.5% manual. Although some
people claim that HFTs did remain active throughout the volatile session, their claim is very
controversial because HFT accounts for only a fraction of algorithmic trading, and there is not
enough data on the behavior of HFTs on that day. (Debelle, 2011)
3.7. High-frequency Trading and Market Risks
The fear from HFT consist of two main parts. First is a systematic risk that HFTs pose to
the markets, through front running, spoofing, and decreased investor confidence. Second is an
emotional fear because people naturally fear what they do not understand well. (Harris & Keenan,
2013)
3.7.1. The Systematic Risk of High-frequency Traders
It can be subdivided into trading risk and IT risk.
Trading-related risks
HFTs are expected to increase number of asset classes and to lead to consolidation process
among the market participants in a way that only professional and best capitalized companies will
remain. As a result, large number of trades may take place only between a small numbers of players
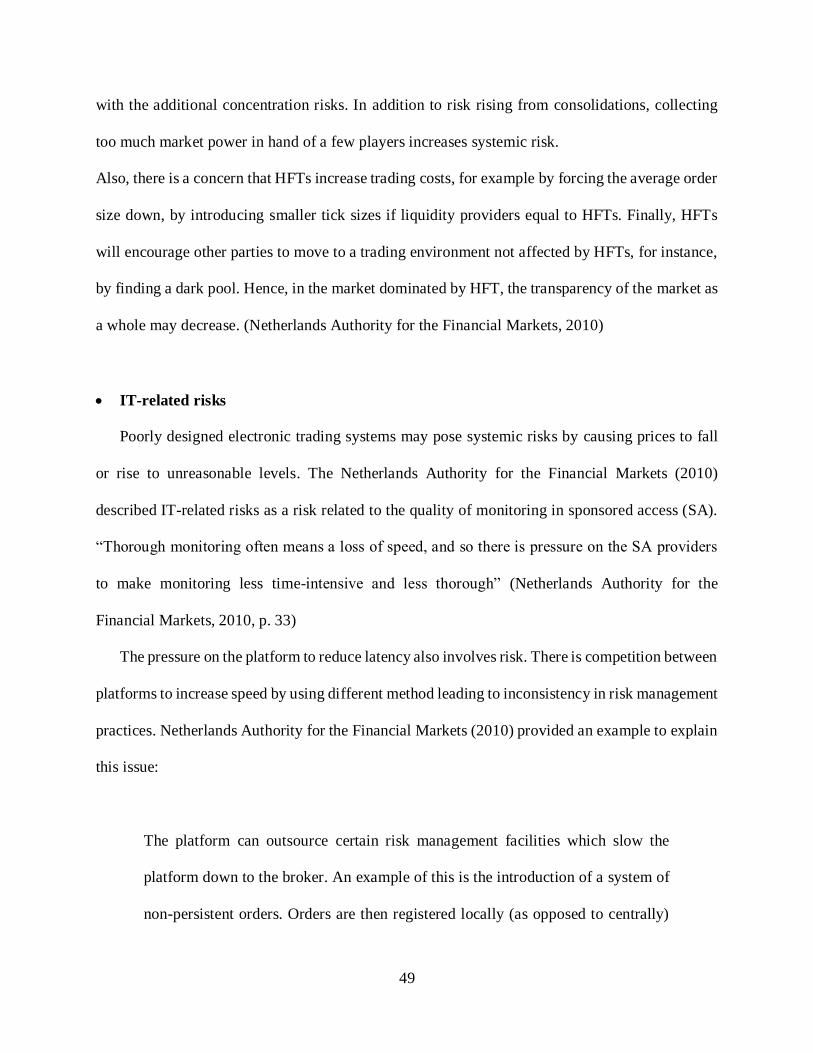
49
with the additional concentration risks. In addition to risk rising from consolidations, collecting
too much market power in hand of a few players increases systemic risk.
Also, there is a concern that HFTs increase trading costs, for example by forcing the average order
size down, by introducing smaller tick sizes if liquidity providers equal to HFTs. Finally, HFTs
will encourage other parties to move to a trading environment not affected by HFTs, for instance,
by finding a dark pool. Hence, in the market dominated by HFT, the transparency of the market as
a whole may decrease. (Netherlands Authority for the Financial Markets, 2010)
IT-related risks
Poorly designed electronic trading systems may pose systemic risks by causing prices to fall
or rise to unreasonable levels. The Netherlands Authority for the Financial Markets (2010)
described IT-related risks as a risk related to the quality of monitoring in sponsored access (SA).
“Thorough monitoring often means a loss of speed, and so there is pressure on the SA providers
to make monitoring less time-intensive and less thorough” (Netherlands Authority for the
Financial Markets, 2010, p. 33)
The pressure on the platform to reduce latency also involves risk. There is competition between
platforms to increase speed by using different method leading to inconsistency in risk management
practices. Netherlands Authority for the Financial Markets (2010) provided an example to explain
this issue:
The platform can outsource certain risk management facilities which slow the
platform down to the broker. An example of this is the introduction of a system of
non-persistent orders. Orders are then registered locally (as opposed to centrally)
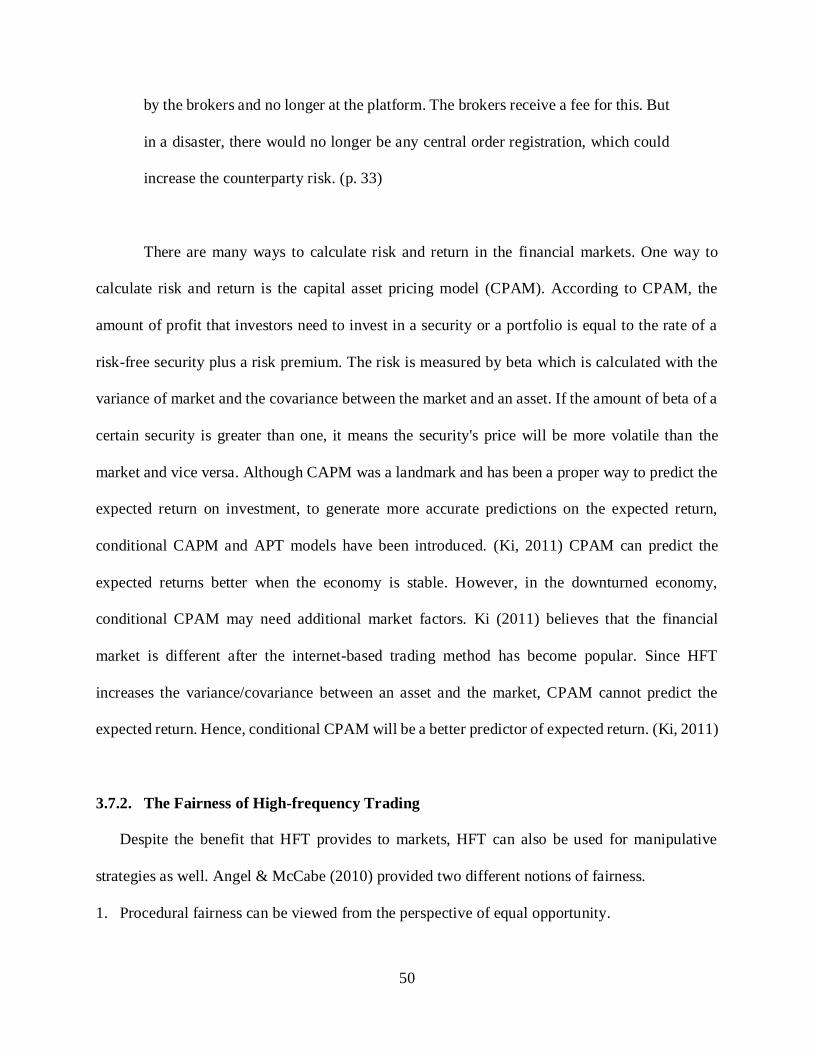
50
by the brokers and no longer at the platform. The brokers receive a fee for this. But
in a disaster, there would no longer be any central order registration, which could
increase the counterparty risk. (p. 33)
There are many ways to calculate risk and return in the financial markets. One way to
calculate risk and return is the capital asset pricing model (CPAM). According to CPAM, the
amount of profit that investors need to invest in a security or a portfolio is equal to the rate of a
risk-free security plus a risk premium. The risk is measured by beta which is calculated with the
variance of market and the covariance between the market and an asset. If the amount of beta of a
certain security is greater than one, it means the security's price will be more volatile than the
market and vice versa. Although CAPM was a landmark and has been a proper way to predict the
expected return on investment, to generate more accurate predictions on the expected return,
conditional CAPM and APT models have been introduced. (Ki, 2011) CPAM can predict the
expected returns better when the economy is stable. However, in the downturned economy,
conditional CPAM may need additional market factors. Ki (2011) believes that the financial
market is different after the internet-based trading method has become popular. Since HFT
increases the variance/covariance between an asset and the market, CPAM cannot predict the
expected return. Hence, conditional CPAM will be a better predictor of expected return. (Ki, 2011)
3.7.2. The Fairness of High-frequency Trading
Despite the benefit that HFT provides to markets, HFT can also be used for manipulative
strategies as well. Angel & McCabe (2010) provided two different notions of fairness.
1. Procedural fairness can be viewed from the perspective of equal opportunity.
51
2. Distributive fairness is concerned with equality of outcome.
If fair in the market is defined as a periodical gathering of numerous buyers and sellers so that
the competition arrives at “fair” prices, there does not appear to be any inequality in the bargaining
power of the HFTs relative to other traders. (Angel & McCabe , 2010)
However, there are several other concerns about the fairness of HFT. Increasing market
volatility is one of them. Co-location as previously discussed is another concern with respect to
HFT. Some people view co-location as a violation of the equal information dimension. Zook &
Grote (2014) mentioned that “Exchanges remain a zero-sum activities: high-frequency traders
profit from the change in prices simply because they are milliseconds faster than other market
participants and are not necessary for achieving equilibrium.”(p. 12) Defenders of HFTs point out
that this speed of computing and location in exchange data centers are available to anyone who is
willing to pay for it. Also, they claim that this small fraction of a millisecond’s difference gives
them advantage only in competing with other HFTs. Finally, in Zook & Grote’s (2014) opinion,
HFTs’ firms hire mathematicians, physicists, information scientists and capital market specialists
to compete to compress time-space microscopically, but produce little to nothing of social value.
All in all, although the social value of HFT is very controversial, both Angel & McCabe (2010)
and Zook & Grote (2014) agreed that HFT is a net benefit for exchanges, and HFT practices cannot
be categorically denounced as unfair because many HFTs’ strategies are beneficial to other market
participants.
3.8. Regulatory Issues
Increasing limit order submissions, order cancellations, and price volatility are a few reasons
to urge regulators to consider regulating algorithmic trading. Regulators’ concerns regarding HFT
52
should be consistent with HFTs’ behavior. “As long as people are using legitimate strategies, they
should be treated exactly like other market participants” (Netherlands Authority for the Financial
Markets, 2010, p. 53) Nonetheless, since HFTs increased the dependence of the financial markets
on technology, it is essential to regulators to make sure that the orders issued by HFTs and other
systems that generate, process and execute orders automatically do not damage the integrity of the
market. (Netherlands Authority for the Financial Markets, 2010) Therefore, new risk management
and operational systems that are appropriate for automated markets may be necessary. However,
regulators should be very careful because poorly conceived policies could easily hurt the markets.
(Harris & Keenan, 2013) Also, since there are various types of HFTs that pursue different trading
strategies, every change in legal environment should be based on thorough understanding of the
various players and their behavior, and policymakers should consider these differences.
Informative prices are the most important part of market efficiency. If the market is divided
into informed traders who have special information and uninformed traders, the market maker
knows he will lose if he trades with the informed trader but will usually win if he trades with an
uninformed trader. In this case, bid-ask spreads may not reflect the risk that the market maker faces
in trading. (Hara, 2014)
Regulators must make sure that prices reflect all available and relevant information and
should not be manipulated easily. “This requires markets to perform the process of price discovery
well. Consequently, regulators should pursue policies that promote price discovery and deter price
distortions or manipulation.” (Muthuswamy, Palmer, Richie, & Webb, 2011, p. 7) Regulators
should monitor markets’ transparency and they should not allow market participants to exploit any
legitimate informational advantage that they have. Also, “regulators need to ensure that such
53
asymmetries do not arise from the exploitation of inside information, an uneven playing field, or
defects in market microstructure.” (Muthuswamy, Palmer, Richie, & Webb, 2011, p. 7)
The question that regulators should ask is whether all market participants have the same
opportunities, whether technological developments in the financial market provide benefit to
investors, and whether HFTs and other algorithmic traders increase market transparency or not.
Then regulators should implement special policies to prevent HFTs’ harmful strategies which
make trades more expensive to a buy-side.
One way to protect large, algorithmic buy-side traders is to reduce the information about
trade sizes that markets distribute. Markets should report only approximate trade sizes instead of
actual size or report only aggregated volumes at intervals of 5-10 minutes. (Harris & Keenan,
2013) “Dark pools [also] minimize the price impact of large trades thus contributing to the liquidity
of the market.” (Muthuswamy, Palmer, Richie, & Webb, 2011, p. 8) These changes with the use
of dark pools will reduce the ability of traders to identify future orders.
Another way that has been used to regulate HFTs’ order cancelation is the “Financial
Transaction Tax (FTT)” in the European market, which leads to a big argument among investors
and academics. The European Commission has outlined plans to put tax on all transactions of
equities, bonds, derivatives (both exchange-traded and OTC) at 0.01% of value calculated on the
basis of the notional underlying value. The plan was approved by all 27 EU Member States and
took effect on January 1st, 2014. The FTT would be imposed when at least one party to the
transaction is a financial institution, and at least one party of the transaction is established within
the EU. FTT is an effective tool to reduce short-term exchange rate volatility, and a means to
prevent speculative attacks on currencies. (Alternative Investment Management Association
(AIMA), 2012)
54
Proponents of the FTT view it as a source of market instability and systemic risk. They
claim that that the FTT will enhance financial stability by reducing the market-destabilizing effects
of speculative short-term trading, through the imposition of a severe penalty on investments with
short-term horizons. However, some economists believe that the plan would deteriorate market
liquidity and widen spreads. They believe that even though HFTs may be socially useless, they
provide meaningful liquidity to market participants such as pension funds, and are lowering
transaction costs. (Alternative Investment Management Association (AIMA), 2012) Hara (2014)
believes FTT will make European markets less attractive to HFTs and potentially less attractive to
all traders because liquidity may be reduced. Requiring all exchanges to delay the processing of
every order for a certain period such as 10 milliseconds will be most effective because it is likely
to substantially reduce expenditures by HFTs without any negative effect on the quality of the
markets. It will also guarantee that HFT remains a highly competitive business because
technological investment becomes affordable for a larger group of trader firms. A call market, in
which each transaction takes place at predetermined intervals and where all the bid-ask spreads
are transacted at once, is another way to make sure that compaction for higher speed does not force
some market participants to leave. For example, the price can be updated every 1 to 10
milliseconds.
Harris & Keenan (2013) also contradict the argument that restrictions on HFTs do not harm
the markets as investment decisions are not made over one-second intervals. The authors argue
that submitting and canceling orders quickly is crucial for HFTs to provide liquidity. Finally, HFT
in foreign exchange markets is regulated by using three different tools including HFTs’ own risk
controls and prime brokers’ monitoring to regulate HFTs. The main concern here is whether the
prime brokers are technologically able to keep up with their HFT clients or have the financial
55
incentives to do so. The rules of trading platforms are another factor to guarantee a fair trading
environment. (Debelle, 2011)
In conclusion, regulators should implement special policies to prevent HFTs’ manipulation
strategies. They should impose all electronic traders to have a killer switch to shut down the system
in the case of an IT-related problem or market extreme such as the Flash Crash of May 6th, 2010.
Meanwhile, they should be very careful about the consequences of their policies. The future impact
of HFTs on the market depends on whether there will be more formal regulation. It depends also
on the reaction of other market participants for a new market environment. Since LFTs in both
equity and foreign exchange markets face similar challenges in the present of HFTs, they should
protect themselves from continuing competition for speed and getting more technological
development as well. They should instead adapt to new markets’ environments and change their
behavior. (Harris & Keenan, 2013) Since LFTs cannot defeat HFTs and cannot become them, they
need to learn new ways to look at the data, and be aware of the new risks that arise in automated
markets. Also, having smarter brokers which can operate in a similar direction of quantitative
brokers is important to portfolio managers and traders because they can search for liquidity and
avoiding a footprint. The goal of LFTs should be staying invisible to the HFTs. (Hara, 2014)
56
CHAPTER 4
Concluding Statement
Based on a thorough review of the literatures, this paper examines the effects of HFT on the
financial markets’ stability. HFTs engage in variety of strategies, most of which are not new, but
by using fast computer and special programs, HFTs can execute these strategies better than other
traders. Other market participants employ a variety of tactics to minimize potential effects of
HFTs. Dark Pool is one of the private exchanges that have been developed as a means for crossing
large trades. However, the benefits of HFT such as increasing liquidity, narrowing spread, and
lowering execution cost resulting from more efficient markets may outweigh the possible costs of
having HFTs involved in the financial markets. This paper has three key findings.
First of all, most of the HFTs’ legal strategies play a constructive role in markets. Most of
HFTs are co-located in several places in order to efficiently execute client orders under their best
execution obligation, exploit market weaknesses, and conduct arbitrage strategy. While some
traders argue that reducing latency by means of co-location should be regarded as an unfair trading
practice, many academics and traders believe the desire to co-locate is legal because all market
participants can acquire access to trading platforms as long as they are willing to pay the price.
Technological development of HFTs makes the searching process cost very insignificant as arrival
market prices are easily checked by computer. Also, in addition to markets’ information and macro
news announcements, HFTs collect information from other public sources. Hence, they facilitate
price efficiency as more information being impounded into prices. Although HFTs can predict the
future price a few milliseconds before other traders, the welfare of all markets' participants is at
stake as long as HFTs do not impose significant adverse selection on longer-term investors.

57
Moreover, HFTs reduce the bid–ask spread. Menkveld (2013) pointed out that increasing HFT
firms in the Chi-X market led to a 50% drop in the bid–ask spread. Reducing execution cost is
another advantage of HFT. HFTs execute their trades at better prices than non- HFTs and have
some ability to avoid adverse selection. Finally, HFTs’ enormous speed in filling orders, managing
execution cost, and aggressive inventory management make HFTs successful in providing
liquidity.
Second, one of the biggest concerns about HFT is that HFTs may not help to stabilize prices
during volatile periods. Although most HFT strategies are designed to work under low and high
volatility periods, HFTs can withdraw from the market at times when it becomes too difficult for
them to estimate the correct price of a share in the absence of affirmative obligations. HFT in
general is positively correlated with stock price volatility after controlling for firm fundamental
volatility and other exogenous determinants of volatility. He stated that the correlation is even
stronger among the top 3,000 stocks in market capitalization and among stocks with high
institutional holdings. (Zhang, 2010) The Flash Crash of May 6th, 2010 is one example of how
HFTs may distract markets. They exacerbate the decline by rapidly liquidating their positions and
starting to trade with each other. However, other researchers believe that predetermined
algorithmic trading strategies should be separated from frequent trading. They claim that the
positive correlation between HFTs and market volatility is due to their algorithmic strategies not
how fast they are trading.
Finally, since HFT is a dominant component of the current market structure in both United
States and Europe, regulators should make sure that their activities do not damage the integrity of
the market. Nonetheless, since HFTs are important market participants and provide many benefits
to financial markets, regulators’ concern should include only the manipulative side of HFTs and

58
different HFT players should be regulated differently. LFTs on the other hand must adopt new
trading strategies, be aware of the new risks arising in the HFT world and avoid being detected by
predatory algorithms.
59
REFERENCES
Alternative Investment Management Association (AIMA). (2012). AIMA Note: Financial
Transaction Tax. Alternative Investment Management Association (AIMA).
Angel, J. J., & McCabe , D. (2010). Fairness in Financial Markets: The Case of High Frequency
Trading. Washington DC: McDonough School of Business.
Baron, M., Brogaard, J., & Kirilenko, A. (2011). The Trading Profits of High Frequency
Traders. Retrieved from
http://faculty.chicagobooth.edu/john.cochrane/teaching/35150_advanced_investments/Ba
ron_Brogaard_Kirilenko.pdf
Baron, M., Brogaard, J., & Kirilenko, A. (2014). Risk and Return in High Frequency Trading.
Social Science Research Network. Retrieved from http://ssrn.com/abstract=2433118
Bessembinder, H. (2003). Issues in Assessing Trade Execution Costs. Journal of Financial
Markets.
Biais, B., Foucault, T., & Moinas, S. (2014). Equilibrium Fast Trading. San Diego. Retrieved
from http://neeo.univ-tlse1.fr/3384/4/Equilibrium_fast_trading_March_2014.pdf
Brogaard, J. A. (2010). High Frequency Trading and Its Impact on Market Quality. Chicago:
Northwestern University_ Kellogg School of Management. Retrieved from
http://ssrn.com/abstract=1641387
Brogaard, J., Hendershott, T., & Riordan, R. (2013). High Frequency Trading and Price
Discovery. Frankfurt: European Central Bank (ECB).
Brogaard, J., Hendershott, T., Hunt, S., Latza, T., Pedace, L., & Ysusi, C. (2013). High-
Frequency Trading and the Execution Costs of Institutional Investors. London: Financial
Services Authority.
60
Brook, M., Sharp, C., Ushaw, G., Blewitt, W., & Morgan, G. (2013). Volatility Management of
High Frequency Trading Environments. Institute of Electrical and Electronics Engineers
(IEEE).
Carrion, A. (2013). Very Fast Money: High-Frequency Trading on the NASDAQ. Journal of
Financial Markets 16(4).
Ceresney, A. (2014, 6 17). SEC's Recent Enforcement Strategy in Regards to Dark Pools, High
Frequency Trading and Other New Developments. (F. Guerrera, Interviewer) Wall Street
Journal. Retrieved from 2. http://live.wsj.com/video/cfo-network-does-policy-match-
enforcement-at-sec/A89C2AC0-5D2E-49D5-B86B-3D9E5C0B1F74.html#!D8ADD528-
F774-4D52-AA5F-C16BCD0BA6C1
Debelle, G. (2011). High Frequency Trading in the Foreign Exchange Market. Basel: Bank for
International Settlements.
Domm, P. (2013, April 23). False Rumor of Explosion at White House Causes Stocks to Briefly
Plunge; AP Confirms Its Twitter Feed Was Hacked. Retrieved from CNBC:
http://www.cnbc.com/id/100646197#
Easley, D., Marcos, L. M., & Maureen, H. O. (2011). The Microstructure of the “Flash Crash”:
Flow Toxicity, Liquidity Crashes, and the Probability of Informed Trading. The Journal
of Portfolio Management 37(2). Retrieved from www.iijournals.com
Foucault , T., & Hombert, J. (2013). News Trading and Speed. HEC Paris Research Paper.
Retrieved from http://blog.iese.edu/financeseminars/files/2013/04/Foucault.pdf
Hagströmer, B., & Nordén, L. (2013). The Diversity of High-frequency Traders. Stockholm:
Journal of Financial Markets 16(4). Retrieved from www.elsevier.com/locate/finmar
61
Hanson, T. A. (2014). Real Effects of High Frequency Trading. Kent, Ohio: Kent State
University.
Hara, M. O. (2014). High Frequency Trading and Its Impact on Markets. Chicago: Financial
Analysts Journal.
Harris, L., & Keenan, F. V. (2013). What to Do about High Frequency Trading. Los Angeles:
Financial Analysts Journal. Retrieved from www.cfapubs.org
Hong, K. J. (2013). Does More Frequent Trading Increase the Volatility? Theoretical Evidence
at Asset and Portfolio Level. Sydney: University Technology of Sydney.
International Securities Exchange. (2009). Flash Orders in the U.S. Options Markets.
International Securities Exchange. Retrieved from
https://www.ise.com/assets/files/ISE_Position_Paper_on_Flash_Website.pdf
Investopedia. (n.d.). Definition of Black Box Model. Retrieved from Investopedia:
http://www.investopedia.com/terms/b/blackbox.asp
Investopedia. (n.d.). Volatility. Retrieved from Investopedia:
http://www.investopedia.com/terms/v/volatility.asp
Jovanovic, B., & Menkveld, A. J. (2010). Middlemen in Limit-Order Markets. Western Finance
Association (WFA). Retrieved from http://www.atl-
res.com/macro/papers/seminar_jovanovic_090210.pdf
Ki, Y. (2011). The CAPM and the High Frequency Trading: Will the CAPM Hold Good Under
the Impact of High-Frequency Trading? University of Kansas.
Kirilenko, A., Kyle, A. S., Samadi, M., & Tuzun, T. (2010). The Flash Crash: The Impact of
High Frequency Trading on an Electronic Market. Social Science Research Network.
Retrieved from http://ssrn.com/abstract=1686004

62
Madhavan, A. (2000). Market Microstructure: A survey. Journal of Financial Markets 3 (3).
Martin, R. (2007, April 21). Financial Firms Use Physical Proximity to Overcome the Technical
Barriers of Data Latency. (The Wall Street Journal ) Retrieved from
http://www.informationweek.com/wall-streets-quest-to-process-data-at-the-speed-of-
light/d/d-id/1054287?
Menkveld, A. J. (2013). High Frequency Trading and the New Market Makers. Journal of
Financial Markets 16(4). Retrieved from www.sciencedirect.com
Muthuswamy, J. (n.d.). High Frequency Trading and Market Efficiency. Retrieved from Asia
Etrading: http://asiaetrading.com/high-frequency-trading-and-market-efficiency/
Muthuswamy, J., Palmer, J., Richie, N., & Webb, R. (2011). High-Frequency Trading:
Implications for Markets, Regulators, and Efficiency. The Journal of Trading 6(1).
Naik, N. Y., & Yadav, P. K. (2003). Do Dealer Firms Manage Inventory on a Stock-by-Stock or
a Portfolio Basis? Journal of Financial Economics 69(2).
Netherlands Authority for the Financial Markets. (2010). High Frequency Trading: The
Application of Advanced Trading Technology in the European Marketplace. Amsterdam:
Netherlands Authority for the Financial Markets.
Northern District of Illinois. (2014, October 02). High-Frequency Trader Indicted for
Manipulating Commodities Futures Markets in First Federal Prosecution for Spoofing .
Retrieved from Federal Bureau of Investigation: http://www.fbi.gov/chicago/press-
releases/2014/high-frequency-trader-indicted-for-manipulating-commodities-futures-
markets-in-first-federal-prosecution-for-spoofing
Pagano, M. (1989). Trading Volume and Asset Liquidity. Quarterly Journal of Economics 104.
Retrieved from http://qje.oxfordjournals.org/content/104/2/255.short
63
Patterson, S., Scannell, K., & Rogow, G. (2009, Augustus 5). Ban on Flash Orders Is
Considered by SEC. Retrieved from The Wall Street Journal :
http://www.wsj.com/articles/SB124940289965505053
Sahalia, A. Y., & Saglam, M. (2013). High Frequency Traders: Taking Advantage of Speed.
New York University . Retrieved from http://www-
wcs.stern.nyu.edu/cons/groups/content/documents/webasset/con_044931.pdf
Sargeant, N. (n.d.). Investopedia. Retrieved from What are the determinants of a stock's bid-ask
spread?: http://www.investopedia.com/ask/answers/06/bidaskspread.asp
Schwert, W. (1988). Why Does Stock Market Volatility Change Over Time? Cambridge:
National Bureau of Economic Research. Retrieved from
http://core.kmi.open.ac.uk/download/pdf/6819513.pdf
The Staffs of the CFTC and SEC. (2010). Findings Regarding the Market Events of May 6, 2010.
The U.S. Securities and Exchange Commission. Retrieved from
http://www.sec.gov/news/studies/2010/marketevents-report.pdf
The Telegraph. (2006, August 27). Black Box Traders Are on The March. Retrieved from The
Telegraph: http://www.telegraph.co.uk/finance/2946240/Black-box-traders-are-on-the-
march.html
Treleaven, P., Galas, M., & Vidhi , L. (2011). Algorithmic Trading Review. Association for
Computing Machinery (ACM).
Tse, J., Lin, X., & Vincent, D. (2012). High Frequency Trading: The Good, The Bad, and The
Regulation. Credit Suisse AES Analysis. Retrieved from https://edge.credit-
suisse.com/edge/Public/Bulletin/Servefile.aspx?FileID=23284&m=1815212669
64
U.S. Securities and Exchange. (2014). Equity Market Structure Literature Review Part II: High
Frequency Trading. U.S. Securities and Exchange Commission.
U.S. Securities and Exchange Commission. (n.d.). Alternative Trading Systems with Form ATS
on File with the SEC as of December 1, 2014. Retrieved from U.S. Securities and
Exchange Commission Web site: http://www.sec.gov/foia/ats/atslist1214.pdf
Webb, R. I. (2003). Transitory Real-Time Property Rights and Exchange Intellectual Property.
Futures Markets 23(9).
Zhang, F. X. (2010). High-Frequency Trading, Stock Volatility, and Price Discovery. Yale
University.
Zook, M. A., & Grote, M. H. (2014). The Microgeographies of Global Finance: High Frequency
Trading and the Construction of Information Inequality. Social Science Research
Network. Retrieved from http://ssrn.com/abstract=2401030