The Impact of the Perceived Value of Records on the Use of ...
304
The Impact of the Perceived Value of Records on the Use of Electronic Recordkeeping Systems by Matthew James Lewellen A thesis submitted to the Victoria University of Wellington in fulfilment of the requirements for the degree of Doctor of Philosophy Victoria University of Wellington 2015
-
Upload
khangminh22 -
Category
Documents
-
view
0 -
download
0
Transcript of The Impact of the Perceived Value of Records on the Use of ...
The Impact of thePerceived Value of Recordson the Use of ElectronicRecordkeeping Systems
by
Matthew James Lewellen
A thesissubmitted to the Victoria University of Wellingtonin fulfilment of the requirements for the degree of
Doctor of Philosophy
Victoria University of Wellington
2015

Abstract
Today’s electronic documents and digital records are rapidly supersedingtraditional paper records and similarly need to be managed and stored forthe future. This need is driving new theoretical recordkeeping models, in-ternational electronic recordkeeping standards, many instances of nationalrecordkeeping legislation, and the rapid development of electronic recordkeep-ing systems for use in organizations. Given the legislative imperative, theexponential growth of electronic records, and the importance to the individual,organization, and society of trustworthy electronic recordkeeping, the questionarises: why are electronic recordkeeping systems experiencing different ratesof acceptance and utilization by end users? This research seeks to addressthat question through identifying the factors that influence a user’s intentionto use an electronic recordkeeping system.
Although a significant body of research has been dedicated to studyingsystem use in various situations, no research in the information systemsdiscipline has yet focused specifically on electronic recordkeeping and itsunique set of use-influencing factors.
This research creates a new conceptual research model by selecting con-structs to represent the technology acceptance literature and adding additionalconstructs to represent organizational context and knowledge interpretation.It also introduces a new construct: the perceived value of records.
A survey instrument was developed and administered to a sample of publicservants from the New Zealand government in order to evaluate the researchmodel quantitatively and determine the relative importance of the factors.
By identifying the factors that impact the use of electronic recordkeepingsystems, this research will inform future strategies to improve the captureand retention of our digital heritage. As Archives New Zealand states: “Donothing, lose everything. If no action is taken, public sector digital informationwill be lost.”

ii
Acknowledgments
I wish to express my sincere thanks and appreciation to the following peopleand organizations who have supported me in this project:
• My primary supervisor, Val Hooper, for her rigorous attention to detail,continuous encouragement, insightful suggestions and guidance, and thetime taken to read this tome across numerous time zones.
• My co-supervisor, Gillian Oliver, for her insight, guidance, enthusiasm,kind words, encouragement, and contagious love of recordkeeping.
• The New Zealand public sector people and organizations who supportedme with their time, access, and willingness to contribute to this research.
• My friend Thoron Hollard, who helped me sort out my en dashes andsemicolons, because he really cares about that sort of thing.
• To my wife, Ruth, who willingly agreed to take up many of my familyresponsibilities to allow me to carve out research time, encouragedme to work hard and stay on schedule even when I didn’t want to,and provided the rock-solid foundation on which this project was built(. . . even though she still refuses to read the final output).
• And to my boys, Keiran and Brayden, for their love of learning andconstant willingness to provide distraction.
iii

iv
Contents
1 Introduction 11.1 Chapter Overview . . . . . . . . . . . . . . . . . . . . . . . . . 11.2 Motivation for the Research . . . . . . . . . . . . . . . . . . . 11.3 Research Gap . . . . . . . . . . . . . . . . . . . . . . . . . . . 31.4 Research Questions and Objectives . . . . . . . . . . . . . . . 41.5 Research Methodology . . . . . . . . . . . . . . . . . . . . . . 51.6 Value and Importance of the Research . . . . . . . . . . . . . 5
1.6.1 Academic Value of the Research . . . . . . . . . . . . . 61.6.2 Practitioner Value of the Research . . . . . . . . . . . 6
1.7 Thesis Outline . . . . . . . . . . . . . . . . . . . . . . . . . . . 71.8 Chapter Summary . . . . . . . . . . . . . . . . . . . . . . . . 8
2 Literature Review 92.1 Chapter Overview . . . . . . . . . . . . . . . . . . . . . . . . . 92.2 Records and Recordkeeping . . . . . . . . . . . . . . . . . . . 10
2.2.1 Key Characteristics of Records . . . . . . . . . . . . . 112.2.2 A Short History of Records and Recordkeeping . . . . . 142.2.3 A Short History of Electronic Recordkeeping . . . . . . 16
2.3 Recordkeeping Models and Theories . . . . . . . . . . . . . . . 192.3.1 Structuration Theory . . . . . . . . . . . . . . . . . . . 192.3.2 The Records Continuum Model . . . . . . . . . . . . . 21
2.4 Electronic Document and Records Management . . . . . . . . 252.4.1 Reorganizing Recordkeeping . . . . . . . . . . . . . . . 252.4.2 EDRMS Defined . . . . . . . . . . . . . . . . . . . . . 272.4.3 The Future of EDRMS . . . . . . . . . . . . . . . . . . 28
2.5 EDRMS-Use Constructs . . . . . . . . . . . . . . . . . . . . . 302.5.1 System Use: the Dependent Variable . . . . . . . . . . 302.5.2 Determinants of System Use . . . . . . . . . . . . . . . 35
2.6 Chapter Summary . . . . . . . . . . . . . . . . . . . . . . . . 55
v
vi CONTENTS
3 Conceptual Research Model 57
3.1 Chapter Overview . . . . . . . . . . . . . . . . . . . . . . . . . 57
3.2 Technology Acceptance Factors . . . . . . . . . . . . . . . . . 58
3.2.1 Effort Expectancy . . . . . . . . . . . . . . . . . . . . . 59
3.2.2 Performance Expectancy . . . . . . . . . . . . . . . . . 59
3.3 Organizational Context Factors . . . . . . . . . . . . . . . . . 60
3.3.1 Social Influence . . . . . . . . . . . . . . . . . . . . . . 60
3.3.2 Perceived Power Security . . . . . . . . . . . . . . . . . 61
3.4 Knowledge Interpretation . . . . . . . . . . . . . . . . . . . . 62
3.5 Chapter Summary . . . . . . . . . . . . . . . . . . . . . . . . 64
4 Research Design and Methodology 67
4.1 Chapter Overview . . . . . . . . . . . . . . . . . . . . . . . . . 67
4.2 Research Paradigm . . . . . . . . . . . . . . . . . . . . . . . . 68
4.3 Sample Population . . . . . . . . . . . . . . . . . . . . . . . . 70
4.4 Research Methodology . . . . . . . . . . . . . . . . . . . . . . 71
4.4.1 Phase I: Qualitative Methods . . . . . . . . . . . . . . 73
4.4.2 Phase II: Quantitative Methods . . . . . . . . . . . . . 76
4.5 Chapter Summary . . . . . . . . . . . . . . . . . . . . . . . . 80
5 Phase I: Qualitative Methods 81
5.1 Chapter Overview . . . . . . . . . . . . . . . . . . . . . . . . . 81
5.2 Stage 1: Interviews . . . . . . . . . . . . . . . . . . . . . . . . 82
5.2.1 Interview Instrument Creation . . . . . . . . . . . . . . 82
5.2.2 Data Collection Methods . . . . . . . . . . . . . . . . . 83
5.2.3 Thematic Analysis Methods . . . . . . . . . . . . . . . 84
5.2.4 Measurement Item Creation Analysis and Results . . . 86
5.3 Stage 2: Proofreading . . . . . . . . . . . . . . . . . . . . . . . 107
5.3.1 Proofreading Methods . . . . . . . . . . . . . . . . . . 107
5.3.2 Proofreading Analysis and Results . . . . . . . . . . . 108
5.4 Stage 3: Card Sorting . . . . . . . . . . . . . . . . . . . . . . 112
5.4.1 Card Sorting Introduction Procedure . . . . . . . . . . 113
5.4.2 Closed Card Sorting Methods . . . . . . . . . . . . . . 115
5.4.3 Open Card Sorting Methods . . . . . . . . . . . . . . . 116
5.4.4 Card Sorting Analysis and Results . . . . . . . . . . . 117
5.5 Chapter Summary . . . . . . . . . . . . . . . . . . . . . . . . 126
CONTENTS vii
6 Phase II: Quantitative Methods 1296.1 Chapter Overview . . . . . . . . . . . . . . . . . . . . . . . . . 1296.2 Stage 4: Survey Design . . . . . . . . . . . . . . . . . . . . . . 130
6.2.1 Online Survey Platform . . . . . . . . . . . . . . . . . 1306.2.2 Analysis-Informed Data Capture . . . . . . . . . . . . 1316.2.3 Creation of Survey Instrument . . . . . . . . . . . . . . 1326.2.4 Survey Documentation Templates . . . . . . . . . . . . 133
6.3 Stage 5: Survey Pretest . . . . . . . . . . . . . . . . . . . . . . 1336.4 Stage 6: Survey . . . . . . . . . . . . . . . . . . . . . . . . . . 1356.5 Chapter Summary . . . . . . . . . . . . . . . . . . . . . . . . 135
7 Phase II: Data Analysis 1377.1 Chapter Overview . . . . . . . . . . . . . . . . . . . . . . . . . 1377.2 Descriptive Statistics . . . . . . . . . . . . . . . . . . . . . . . 138
7.2.1 Response Rate . . . . . . . . . . . . . . . . . . . . . . 1387.2.2 Sample Demographics . . . . . . . . . . . . . . . . . . 1397.2.3 EDRMS Experience Profile . . . . . . . . . . . . . . . 141
7.3 Factor Analysis . . . . . . . . . . . . . . . . . . . . . . . . . . 1437.3.1 Circle of Correlations . . . . . . . . . . . . . . . . . . . 1447.3.2 Factor Analysis by Construct . . . . . . . . . . . . . . 145
7.4 Partial Least Squares Path Modeling (PLS-PM) . . . . . . . . 1627.4.1 Selection of PLS-PM . . . . . . . . . . . . . . . . . . . 1627.4.2 PLS-PM Described . . . . . . . . . . . . . . . . . . . . 1647.4.3 PLS-PM Outer (Measurement) Model Analysis . . . . 1657.4.4 PLS-PM Inner (Structural) Model Analysis . . . . . . 1727.4.5 PLS-PM Model Significance Tests . . . . . . . . . . . . 1757.4.6 PLS-PM Bootstrapping and Model Validation . . . . . 179
7.5 Analysis of Hypothesized Effects . . . . . . . . . . . . . . . . . 1817.6 Additional Comments by Respondents . . . . . . . . . . . . . 1847.7 Chapter Summary . . . . . . . . . . . . . . . . . . . . . . . . 188
8 Discussion 1918.1 Chapter Overview . . . . . . . . . . . . . . . . . . . . . . . . . 1918.2 The Measures of the Constructs . . . . . . . . . . . . . . . . . 192
8.2.1 Technology Acceptance . . . . . . . . . . . . . . . . . . 1928.2.2 Organizational Context . . . . . . . . . . . . . . . . . . 1958.2.3 Knowledge Interpretation . . . . . . . . . . . . . . . . 199
8.3 The Research Model . . . . . . . . . . . . . . . . . . . . . . . 2028.3.1 Hypothesized Path Effects . . . . . . . . . . . . . . . . 203
viii CONTENTS
8.3.2 The Explanatory Power of the Model . . . . . . . . . . 2128.4 Chapter Summary . . . . . . . . . . . . . . . . . . . . . . . . 212
9 Conclusions 2159.1 Chapter Overview . . . . . . . . . . . . . . . . . . . . . . . . . 2159.2 Overview of the Research . . . . . . . . . . . . . . . . . . . . . 216
9.2.1 Research Gap . . . . . . . . . . . . . . . . . . . . . . . 2169.2.2 Research Objectives and Conceptual Model . . . . . . 2169.2.3 Research Design . . . . . . . . . . . . . . . . . . . . . . 2189.2.4 Research Findings and Model Evaluation . . . . . . . . 220
9.3 Contributions of the Research . . . . . . . . . . . . . . . . . . 2219.3.1 Academic Value of the Research . . . . . . . . . . . . . 2219.3.2 Practitioner Value of the Research . . . . . . . . . . . 2239.3.3 Implications of the Research . . . . . . . . . . . . . . . 223
9.4 Limitations of the Research . . . . . . . . . . . . . . . . . . . 2249.4.1 Limitations of the Conceptual Model . . . . . . . . . . 2249.4.2 Limitations of the Research Design . . . . . . . . . . . 2259.4.3 Limitations of the Research Instrument . . . . . . . . . 226
9.5 Directions for Future Research . . . . . . . . . . . . . . . . . . 2279.5.1 Improved Measures of Social Influence . . . . . . . . . 2279.5.2 Social Influence in Mandatory Use Situations . . . . . 2289.5.3 Aligment with the Records Continuum Model . . . . . 2299.5.4 Development of a Multilevel Theoretical Model . . . . 2299.5.5 Benchmarking the Prevalence of the Four Knowledge
Management Discourses . . . . . . . . . . . . . . . . . 2309.6 Chapter Summary . . . . . . . . . . . . . . . . . . . . . . . . 230
A Interview Instrument 231
B Proofreading of Stage 1 Items 235
C Final Survey Instrument 239
D Survey Communications Templates 249
E Final Survey Data 257
F Bootstrap Validation 265
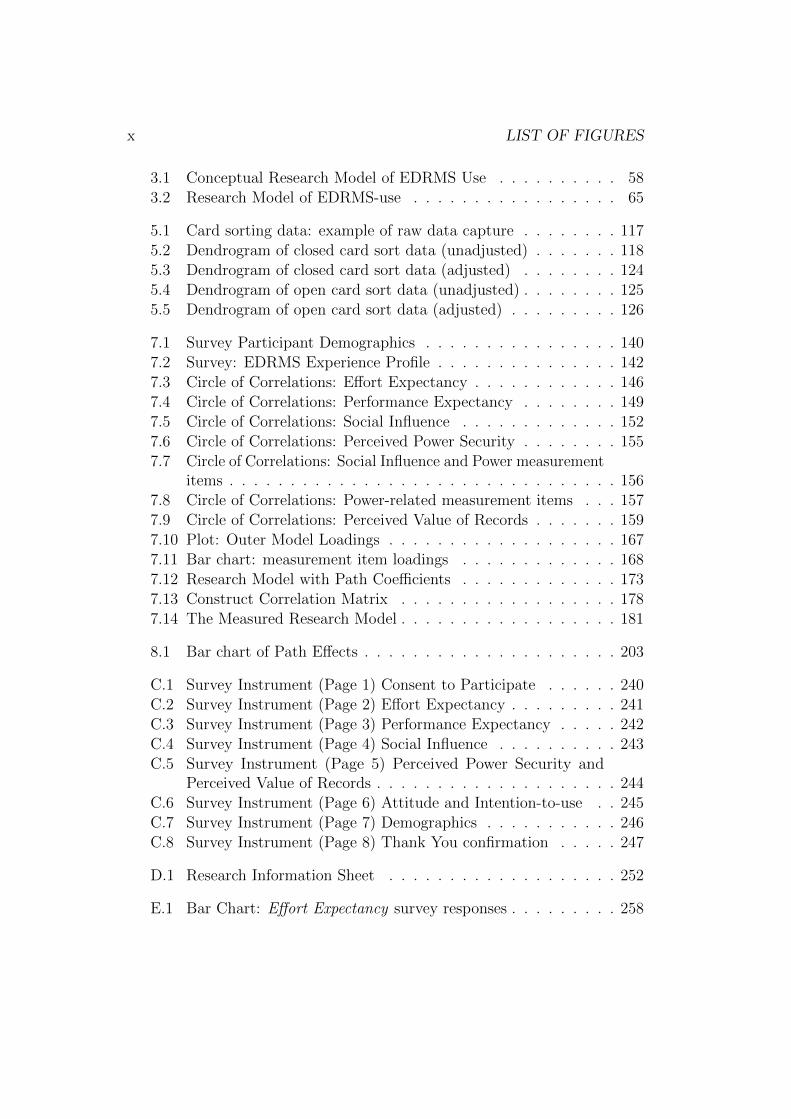
List of Figures
2.1 Conceptual model of recordkeeping metadata (Final ReportCRKM Project, 2007) . . . . . . . . . . . . . . . . . . . . . . . 18
2.2 Dimensions of the duality of structure (Giddens, 1984) . . . . 202.3 The Records Continuum Model (Upward, 2005) . . . . . . . . 242.4 Example of a recordkeeping metadata relationship (McKem-
mish, Acland, Ward, & Reed, 1999) . . . . . . . . . . . . . . . 262.5 ‘IS use’ from variance and process perspectives (Fidock &
Carroll, 2009) . . . . . . . . . . . . . . . . . . . . . . . . . . . 312.6 DeLone and McLean IS Success Model (DeLone & McLean,
1992) . . . . . . . . . . . . . . . . . . . . . . . . . . . . . . . . 322.7 Seddon’s respecification of the DeLone & McLean IS Success
Model (Seddon, 1997) . . . . . . . . . . . . . . . . . . . . . . 332.8 Past conceptualizations of the system-usage construct (Burton-
Jones & Straub, 2006) . . . . . . . . . . . . . . . . . . . . . . 342.9 TAM: Technology Acceptance Model (Davis, 1986) . . . . . . 362.10 TAM2: extension of the Technology Acceptance Model (Venkatesh
& Davis, 2000) . . . . . . . . . . . . . . . . . . . . . . . . . . 392.11 UTAUT: Unified Theory of Acceptance and Use of Technology
(Venkatesh, Morris, Davis, & Davis, 2003) . . . . . . . . . . . 412.12 TAM3: Technology Acceptance Model 3 (Venkatesh & Bala,
2008) . . . . . . . . . . . . . . . . . . . . . . . . . . . . . . . . 432.13 TRA: Theory of Reasoned Action (Davis, Bagozzi, & Warshaw,
1989) . . . . . . . . . . . . . . . . . . . . . . . . . . . . . . . . 462.14 Addition of the subjective norm to the Technology Acceptance
Model (Schepers & Wetzels, 2007) . . . . . . . . . . . . . . . . 472.15 Addition of perceived power security and the subjective norm
to TAM (Ong, Lai, Wang, & Wang, 2005) . . . . . . . . . . . 492.16 Four discourses of knowledge management research (Schultze
& Stabell, 2004) . . . . . . . . . . . . . . . . . . . . . . . . . . 52
ix
x LIST OF FIGURES
3.1 Conceptual Research Model of EDRMS Use . . . . . . . . . . 583.2 Research Model of EDRMS-use . . . . . . . . . . . . . . . . . 65
5.1 Card sorting data: example of raw data capture . . . . . . . . 1175.2 Dendrogram of closed card sort data (unadjusted) . . . . . . . 1185.3 Dendrogram of closed card sort data (adjusted) . . . . . . . . 1245.4 Dendrogram of open card sort data (unadjusted) . . . . . . . . 1255.5 Dendrogram of open card sort data (adjusted) . . . . . . . . . 126
7.1 Survey Participant Demographics . . . . . . . . . . . . . . . . 1407.2 Survey: EDRMS Experience Profile . . . . . . . . . . . . . . . 1427.3 Circle of Correlations: Effort Expectancy . . . . . . . . . . . . 1467.4 Circle of Correlations: Performance Expectancy . . . . . . . . 1497.5 Circle of Correlations: Social Influence . . . . . . . . . . . . . 1527.6 Circle of Correlations: Perceived Power Security . . . . . . . . 1557.7 Circle of Correlations: Social Influence and Power measurement
items . . . . . . . . . . . . . . . . . . . . . . . . . . . . . . . . 1567.8 Circle of Correlations: Power-related measurement items . . . 1577.9 Circle of Correlations: Perceived Value of Records . . . . . . . 1597.10 Plot: Outer Model Loadings . . . . . . . . . . . . . . . . . . . 1677.11 Bar chart: measurement item loadings . . . . . . . . . . . . . 1687.12 Research Model with Path Coefficients . . . . . . . . . . . . . 1737.13 Construct Correlation Matrix . . . . . . . . . . . . . . . . . . 1787.14 The Measured Research Model . . . . . . . . . . . . . . . . . . 181
8.1 Bar chart of Path Effects . . . . . . . . . . . . . . . . . . . . . 203
C.1 Survey Instrument (Page 1) Consent to Participate . . . . . . 240C.2 Survey Instrument (Page 2) Effort Expectancy . . . . . . . . . 241C.3 Survey Instrument (Page 3) Performance Expectancy . . . . . 242C.4 Survey Instrument (Page 4) Social Influence . . . . . . . . . . 243C.5 Survey Instrument (Page 5) Perceived Power Security and
Perceived Value of Records . . . . . . . . . . . . . . . . . . . . 244C.6 Survey Instrument (Page 6) Attitude and Intention-to-use . . 245C.7 Survey Instrument (Page 7) Demographics . . . . . . . . . . . 246C.8 Survey Instrument (Page 8) Thank You confirmation . . . . . 247
D.1 Research Information Sheet . . . . . . . . . . . . . . . . . . . 252
E.1 Bar Chart: Effort Expectancy survey responses . . . . . . . . . 258

LIST OF FIGURES xi
E.2 Bar Chart: Performance Expectancy survey responses . . . . . 259E.3 Bar Chart: Social Influence survey responses . . . . . . . . . . 260E.4 Bar Chart: Perceived Power Security survey responses . . . . 261E.5 Bar Chart: Perceived Value of Records survey responses . . . . 262E.6 Bar Chart: Intention to Use survey responses . . . . . . . . . 263

xii LIST OF FIGURES
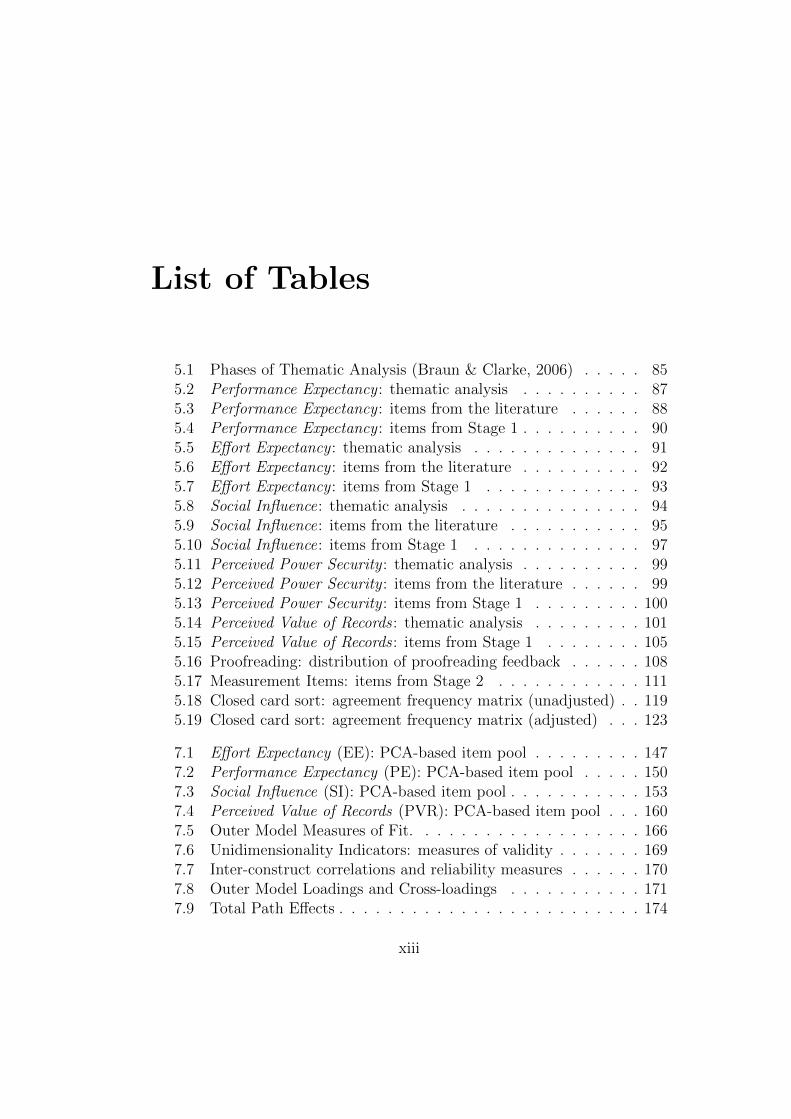
List of Tables
5.1 Phases of Thematic Analysis (Braun & Clarke, 2006) . . . . . 855.2 Performance Expectancy : thematic analysis . . . . . . . . . . 875.3 Performance Expectancy : items from the literature . . . . . . 885.4 Performance Expectancy : items from Stage 1 . . . . . . . . . . 905.5 Effort Expectancy : thematic analysis . . . . . . . . . . . . . . 915.6 Effort Expectancy : items from the literature . . . . . . . . . . 925.7 Effort Expectancy : items from Stage 1 . . . . . . . . . . . . . 935.8 Social Influence: thematic analysis . . . . . . . . . . . . . . . 945.9 Social Influence: items from the literature . . . . . . . . . . . 955.10 Social Influence: items from Stage 1 . . . . . . . . . . . . . . 975.11 Perceived Power Security : thematic analysis . . . . . . . . . . 995.12 Perceived Power Security : items from the literature . . . . . . 995.13 Perceived Power Security : items from Stage 1 . . . . . . . . . 1005.14 Perceived Value of Records : thematic analysis . . . . . . . . . 1015.15 Perceived Value of Records : items from Stage 1 . . . . . . . . 1055.16 Proofreading: distribution of proofreading feedback . . . . . . 1085.17 Measurement Items: items from Stage 2 . . . . . . . . . . . . 1115.18 Closed card sort: agreement frequency matrix (unadjusted) . . 1195.19 Closed card sort: agreement frequency matrix (adjusted) . . . 123
7.1 Effort Expectancy (EE): PCA-based item pool . . . . . . . . . 1477.2 Performance Expectancy (PE): PCA-based item pool . . . . . 1507.3 Social Influence (SI): PCA-based item pool . . . . . . . . . . . 1537.4 Perceived Value of Records (PVR): PCA-based item pool . . . 1607.5 Outer Model Measures of Fit. . . . . . . . . . . . . . . . . . . 1667.6 Unidimensionality Indicators: measures of validity . . . . . . . 1697.7 Inter-construct correlations and reliability measures . . . . . . 1707.8 Outer Model Loadings and Cross-loadings . . . . . . . . . . . 1717.9 Total Path Effects . . . . . . . . . . . . . . . . . . . . . . . . . 174
xiii
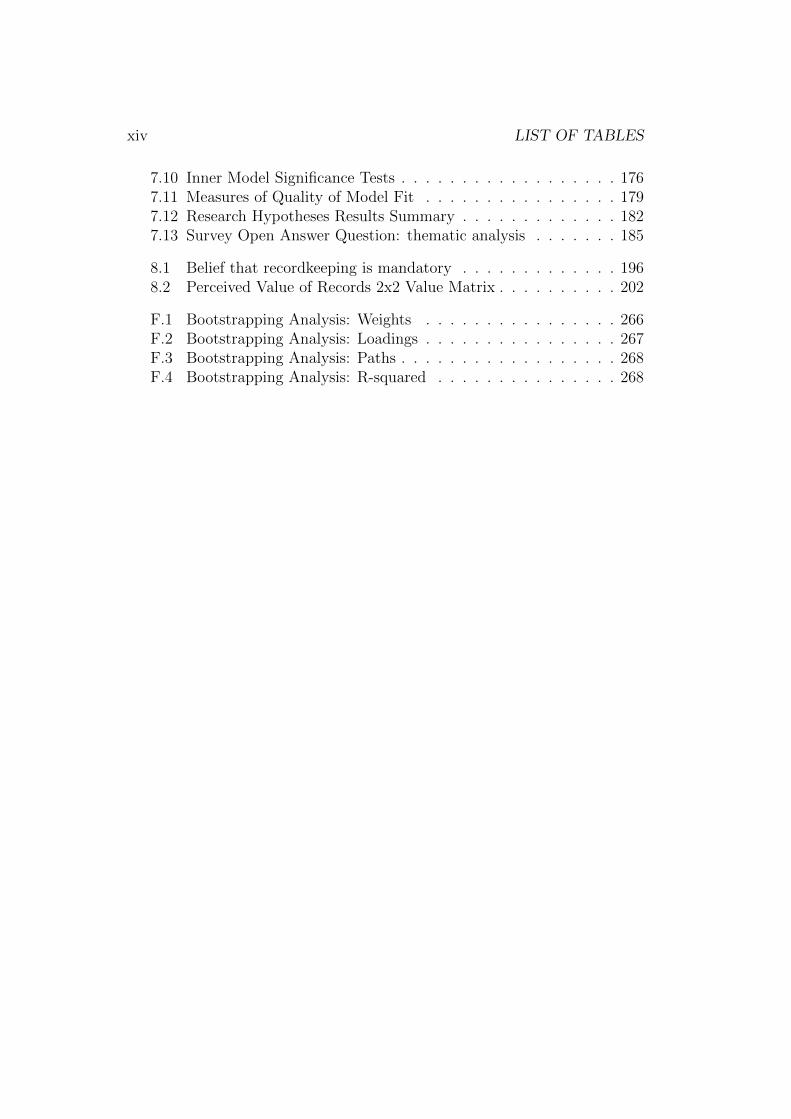
xiv LIST OF TABLES
7.10 Inner Model Significance Tests . . . . . . . . . . . . . . . . . . 1767.11 Measures of Quality of Model Fit . . . . . . . . . . . . . . . . 1797.12 Research Hypotheses Results Summary . . . . . . . . . . . . . 1827.13 Survey Open Answer Question: thematic analysis . . . . . . . 185
8.1 Belief that recordkeeping is mandatory . . . . . . . . . . . . . 1968.2 Perceived Value of Records 2x2 Value Matrix . . . . . . . . . . 202
F.1 Bootstrapping Analysis: Weights . . . . . . . . . . . . . . . . 266F.2 Bootstrapping Analysis: Loadings . . . . . . . . . . . . . . . . 267F.3 Bootstrapping Analysis: Paths . . . . . . . . . . . . . . . . . . 268F.4 Bootstrapping Analysis: R-squared . . . . . . . . . . . . . . . 268
Chapter 1
Introduction
Contents1.1 Chapter Overview . . . . . . . . . . . . . . . . . . 1
1.2 Motivation for the Research . . . . . . . . . . . . 1
1.3 Research Gap . . . . . . . . . . . . . . . . . . . . . 3
1.4 Research Questions and Objectives . . . . . . . . 4
1.5 Research Methodology . . . . . . . . . . . . . . . 5
1.6 Value and Importance of the Research . . . . . 5
1.7 Thesis Outline . . . . . . . . . . . . . . . . . . . . 7
1.8 Chapter Summary . . . . . . . . . . . . . . . . . . 8
1.1 Chapter Overview
This chapter provides an introduction to the thesis and explains the motivationfor the research undertaken. The central research question and objectives areset out, and the methodological approach is summarized. The chapter endswith an outline of subsequent chapters.
1.2 Motivation for the Research
Records and archives have been at the foundation of human civilization sinceancient times. The word archive (Greek: archeion) describes the ‘keystone’of an arch. Metaphorically, the ancient Greeks considered the archive as the
1
2 CHAPTER 1. INTRODUCTION
keystone in the arch of government – the crucial piece that keeps the archfrom crumbling; thereby underlining the importance of records and archivesto society. They recognized the importance of reliable recorded evidence tothe functioning of government and created a special location to store thatevidence (Upward, 2005).
In modern times, the ability of an organization to collect, store, anduse knowledge (in the form of records) has important consequences for itsperformance (Olivera, 2000). However, records must be trustworthy for anorganization to rely on them to meet its legal and business requirements(NARA, 2005; Cullen, Hirtle, Levy, Lynch, & Rothenberg, 2000). To meetthose requirements, a specialist discipline – records management – developedover time to support the collection, classification, storage, and retrieval ofrecords. This discipline also addresses methods to manage the key character-istics of records: reliability, authenticity, integrity, and usability (ISO 15489.1,2002). Traditionally, this discipline has focused on physical (paper) records.
At the beginning of the twenty-first century, governments in many countriesbegan to implement electronic document and records management systems –EDRMS (Nguyen, Swatman, & Fraunholz, 2009; Agourram & Robson, 2006;Johnston & Bowen, 2005; Sprehe, 2005). This is often done in an attempt tomanage the exponential increase in both electronic records (Duranti, 2010)and the “unstructured information captured in paper and electronic formats,such as emails, word processed and spreadsheet contents” (Joseph, 2008)produced by end users. EDRMS are also implemented in response to legislativeimperatives such as the New Zealand Public Records Act (2005) or the USSarbanes-Oxley Act of 2002 (Nguyen & Swatman, 2007). Recordkeepinglegislation has raised the profile of organizational recordkeeping standardsand their importance at the regulatory level.
EDRMS are being used to improve and control electronic recordkeepingwithin organizations (Svard, 2013; Wilkins, Swatman, & Holt, 2009a; Joseph,2008). An important implication is that these systems transfer the responsi-bility of recordkeeping from the records and information management (RIM)professionals to the end users, those prolific creators of the electronic records(Joseph, Debowski, & Goldschmidt, 2012). Consequently, end users nowhave responsibility for both identifying documents worthy of retention andapplying descriptive metadata to those records. The selection of descriptivemetadata (including the correct application of suitable records classifications)drives the application of retention schedules and ultimately impacts futurecontextual search and retrieval (Joseph, Debowski, & Goldschmidt, 2013;Sprehe & McClure, 2005).
1.3. RESEARCH GAP 3
In spite of the active interest by senior management in investing in large-scale implementations of EDRMS, multiple published case studies observedthat rates of acceptance and use of these systems by end users were oftendisappointing (S. Jones, 2012; Nguyen et al., 2009; Maguire, 2005; Smyth,2005; D. Williams, 2005). Low rates of use could lead to an unproductivecycle where users who chose not to store records in the system are not likelyto use the system to retrieve records since it is unlikely that the records theywere seeking would have been stored in the system initially.1
Nonetheless, there are also examples of successful EDRMS implementationswith high utilization and tangible benefits (Wilkins, Swatman, & Holt, 2009b,2007; Nguyen, Swatman, & Fraunholz, 2008a; D. Williams, 2005).
By identifying the factors that impact the acceptance and use of electronicrecordkeeping systems, this research will inform future strategies to improvethe capture and retention of our digital heritage. An electronic documentcan only be a trustworthy record if it is managed systematically (the primarypurpose of the EDRMS). As Archives New Zealand states: “Do nothing, loseeverything. If no action is taken, public sector digital information will be lost”(Archives New Zealand, 2009, p. 8).
1.3 Research Gap
Electronic recordkeeping systems that rely on end user participation are auseful class of system for studying a user’s intention to use a system. Eventhough the use of such systems can be mandated by senior management oreven by legislation, the actual use of the systems requires action and judgmentby end users: action, in appropriately identifying records; and judgment, instoring such records in logical contextual categories and classifications. Assuch, the electronic recordkeeping environment provides a significant marginfor users to participate or not according to their perception of the importanceof their documents and the information they contain.
1This low utilization reflects the capture of comparatively simple office-style documents.More complex records – particularly those forming in Web 2.0 technologies – are experiencingtheir own set of recordkeeping challenges (Lips & Rapson, 2009, 2010). From a recordsperspective, the impact of low utilization also means that documents are not being properlymanaged, and can be lost through destruction or deterioration, or else made irretrievablethrough lack of an indexing mechanism (Wilson, 1995). Loss of these records also has animpact on society. In the short term, the loss of accountability – a cornerstone of our legalsystem and civilization, and in the long term, ultimately a loss of history (Johnston &Bowen, 2005).
4 CHAPTER 1. INTRODUCTION
The reasons that explain and support utilization rates of generic Informa-tion Systems (IS) have been widely studied and have been organized into avariety of well-tested and validated technology acceptance models. Leadingexamples of such measurement models include Davis’s (1989) TechnologyAcceptance Model (TAM); Goodhue & Thompson’s (1995) Task-TechnologyFit (TTF) model; Dishaw and Strong’s (1999) combined TAM/TTF model;Venkatesh and Davis’s (2000) extended TAM2 model; Venkatesh, Morris,Davis, & Davis’s (2003) Unified Theory of Acceptance and Use of Technology(UTAUT) model; and Venkatesh and Bala’s (2008) Technology AcceptanceModel 3 (TAM3).
Acknowledging the known limitations of these models (Benbasat & Barki,2007), they have nonetheless been successfully applied to a wide variety oftraditional IS tools and systems, albeit with few examples having been appliedto any information management-class systems. Some limited efforts havebeen made to apply these models to classes of systems that are similar tothat of this research, including Organizational Memory Systems (Li, Bao-wei, & Ye-zhuang, 2007, 2004) and Knowledge Management Systems (Liet al., 2007), which primarily focus on capturing ‘lessons learned’ to improvefuture performance. However, no studies have been found to date thatapply technology acceptance-class models directly to electronic recordkeepingsystems with their unique set of contexts and use cases. Furthermore, themodels, when applied in these related studies, have shown variable anddiffering results in explaining system utilization rates.
1.4 Research Questions and Objectives
The main research question considered is:
• What factors influence a user’s intention to use an electronic record-keeping system?
Converted into the research objectives, the aim of the research is:
• To identify the factors that influence a user’s intention to use an elec-tronic recordkeeping system.
• To determine the relative importance of the factors that influence auser’s intention to use an electronic recordkeeping system.
1.5. RESEARCH METHODOLOGY 5
1.5 Research Methodology
As the factors that influence a user’s intention to use an electronic record-keeping system are not known, the research began with a literature review.This review revealed the importance of records and recordkeeping in society,introduced the underlying theories and models that support modern record-keeping practices and standards, and introduced prior research that focusedon similar aspects of technology acceptance, albeit not within a recordkeepingcontext.
Taking a post-positivist stance and a reductionist approach (Creswell,2008), a conceptual research model was then created based on the findingsfrom the literature review. Most of the constructs required by the modelwere already available and validated; however, there was one aspect that wasincomplete. This required the development of a new construct to completethe model: the perceived value of records. The research then turned tothe construct measurement items to determine if they (and the constructsthemselves) were sufficient to be used within a recordkeeping context.
A mixed-method approach was adopted consisting first of a qualitativephase to explore and seek out suitable contextually-appropriate measurementitems that adequately reflect the conceptual model’s constructs. To thisend, data were collected via personal interviews and a pool of measurementitems was developed based on an analysis of the interview transcripts. Addi-tional data-gathering activities were used to further assign and validate themeasurement-item-to-construct relationships, with the knowledge that thesemeasurement items would eventually be used to construct the quantitativesurvey instrument.
In the quantitative phase, the survey instrument (consisting primarilyof the construct measurement items) was developed to gather data for themeasurement and validation of the research model. The data were collectedvia an online survey of a large New Zealand public sector organization.
1.6 Value and Importance of the Research
This research provided the first empirical measurement of the set of uniqueacceptance and use factors associated with electronic recordkeeping systems.The main benefits of the research to academics and practioners are introducedbelow.
6 CHAPTER 1. INTRODUCTION
1.6.1 Academic Value of the Research
The primary academic contribution of this research is the combination ofexisting IS technology acceptance theory with recordkeeping and its set ofunderlying theories.
Information systems that are designed to support recordkeeping require-ments are quite complicated, and they require the input of extensive record-keeping metadata and an understanding of what records are and how recordsshould be stored and organized. Since electronic recordkeeping systems expectend users to take on this responsibility, these systems end up inhabiting aunique position in the list of enterprise information systems in that the use ofthese systems is often ancillary to the end user’s main roles, responsibilities,and performance measures.
To address this gap, this research develops a new construct: the perceivedvalue of records. This new construct is defined, provided with a set ofmeasurement items, and empirically measured and validated.
Furthermore, this research provides additional nomological validity checksof existing research constructs and their measurement items in the context ofelectronic recordkeeping systems and in the context of the culture of the NewZealand public sector.
1.6.2 Practitioner Value of the Research
Unfortunately, the level of acceptance and use of EDRMS has been mixed.With an increasing reliance on electronic records, the impact of low utilizationof an organization’s electronic recordkeeping system means that electronicdocuments are not being properly managed, can be lost through destructionor deterioration, or else they can be made irretrievable through a lack of asuitable indexing mechanism.
By identifying the factors that impact the use of electronic recordkeepingsystems, this research helps identify and prioritize the factors that constitutethe greatest barriers to use. Knowledge of these factors will help softwaredevelopers to improve their system’s user interface, provide trainers withcritical insight from which they could develop training materials that targetthe most important knowledge gaps, and provide managers with the means todevelop policies and change management strategies that will reduce barriersand ultimately increase the acceptance and use of these critical systems.
1.7. THESIS OUTLINE 7
1.7 Thesis Outline
The remainder of the thesis is structured in eight additional chapters asfollows:
• Chapter 2: Literature Review
The literature review covers the importance of records and recordkeepingto society and introduces the primary models and theories supportingmodern recordkeeping approaches and standards. The focus then movesto electronic recordkeeping systems, and finally to the introduction ofconstructs that are expected to influence the use of these systems.
• Chapter 3: Conceptual Research Model
In this chapter, the constructs introduced in the literature review areorganized into a conceptual research model. The model consists offactors (constructs) that were selected to represent three conceptualareas: technology acceptance, organization context, and knowledgeinterpretation.
• Chapter 4: Research Design and Methodology
The research design and methodological approach is presented in thischapter. This includes consideration of the research paradigm and thedefinition of a suitable population from which to sample. The finalresearch design, a mixed-methods approach consisting of a qualitativephase followed by a quantitative phase, is presented.
• Chapter 5: Phase I: Qualitative Methods
The qualitative data-gathering activities are discussed in detail in thischapter. These include three stages consisting of semi-structured in-terviews, proofreading of the measurement items, and the card sortingactivities used to link the measurement items to the research model’sconstructs. Each stage consists of the methods, analysis, and findings,as each stage forms the foundation for the next stage.
• Chapter 6: Phase II: Quantitative Methods
This chapter focuses on the quantitative methods phase. This phaseincludes the design and development of the survey instrument, thesurvey pretest activities, and the final survey data-gathering activitiesand measurement approach.
8 CHAPTER 1. INTRODUCTION
• Chapter 7: Phase II: Data Analysis
The data analysis chapter focuses on the data gathered during the finalsurvey stage. This analysis includes descriptive statistics followed byfactor analysis, which seeks to identify the most appropriate measure-ment items for inclusion in the final structural equation model. Thestatistical measurement of the model is covered, followed by the measureof the hypothesized path effects. The findings are further supportedby a qualitative analysis of the open comments provided by the surveyrespondents.
• Chapter 8: Discussion
The discussion chapter brings all of the findings together. It starts byconsidering the measures of the constructs as they were evaluated in thequalitative and quantitative phases of the research. Next, the researchmodel is discussed, including the implications of the empirical findingsto the research hypotheses.
• Chapter 9: Conclusions
Finally, the conclusion chapter provides a summary of what the researchhas achieved in terms of answering the research questions, achievingthe research objectives, and its contributions. The limitations of theresearch are discussed and several directions for possible future researchare suggested.
1.8 Chapter Summary
In this chapter, the motivation for the research is introduced and the researchgap is identified. The research question is then introduced, namely: Whatfactors influence a user’s intention to use an electronic recordkeeping system?This question lays the foundation for the two research objectives which seek toidentify those factors, and once identified, determine the relative importanceof the those factors.
The general research methodology is then described, as is the value of theresearch to both the academic and practitioner fields. The chapter concludeswith a summary outline of the contents of the remaining thesis chapters.
Chapter 2
Literature Review
Contents2.1 Chapter Overview . . . . . . . . . . . . . . . . . . 9
2.2 Records and Recordkeeping . . . . . . . . . . . . 10
2.3 Recordkeeping Models and Theories . . . . . . . 19
2.4 Electronic Document and Records Management 25
2.5 EDRMS-Use Constructs . . . . . . . . . . . . . . 30
2.6 Chapter Summary . . . . . . . . . . . . . . . . . . 55
2.1 Chapter Overview
The literature review examines the foundation of electronic recordkeepingsystems by first exploring the concept of a record and then providing anaccount of the evolving historical approaches to recordkeeping. StructurationTheory is introduced as the primary theoretical mechanism for considering asociety’s recordkeeping requirements, while the Records Continuum Model isintroduced as the foundation for modern recordkeeping and archival science.The resultant electronic recordkeeping technology, the primary subject of thisresearch, is introduced with a focus on its suitability to meet society’s currentand future recordkeeping requirements.
An account and consolidation of the most relevant Information Systems(IS) literature is then provided with consideration first given to the dependentvariable: system use. The determinants of system use are then explored byfocusing on factors associated with generic models for the acceptance and use
9
10 CHAPTER 2. LITERATURE REVIEW
of technology; on factors associated with the organizational context of thesystem, and finally on factors relating to the interpretation of the value ofrecorded knowledge by the system’s users.
2.2 Records and Recordkeeping
Without reliable recorded evidence, we are, in fact, doomed topersonal ignorance, cruel manipulation and exploitation, andultimately societal chaos. (Cook, 1997, p. 23)
A record is defined in ISO 15489.1: Records Management1 as “informa-tion created, received, and maintained as evidence and information by anorganization or person, in pursuance of legal obligations or in the transactionof business” (ISO 15489.1, 2002, p. 3). Records management is defined as the“field of management responsible for the efficient and systematic control ofthe creation, receipt, maintenance, use and disposition of records, includingprocesses for capturing and maintaining evidence of and information aboutbusiness activities and transactions in the form of records”(ISO 15489.1, 2002,p. 3). Records are maintained as evidence for the purpose of accountability(Oliver, Evans, Reed, & Upward, 2009; ISO 15489.1, 2002; Cullen et al., 2000).They must be trustworthy in order to stand as evidence.
Many modern office workers spend their days creating documents. Adocument is defined as any “recorded information or object which can betreated as a unit” (ISO 15489.1, 2002, p. 3). With such a general definition,a document can appear in a wide range of forms (e.g., reports, letters, emails,memos, SMS text messages, scraps of paper, etc.). However, these informationunits are not records, or at least not until they have been placed undersystematic control that can guarantee certain key characteristics required foruse as evidence. As such, records and the process of records management arerelated and reliant on each other, for a record must be managed systematicallyin order to maintain the evidentiary chain.
Records management practices have developed over time to focus onmanaging and protecting a record’s key evidentiary characteristics that con-tribute to the trustworthiness of that record. These characteristics are brieflydiscussed below.
1ISO 15489: Records Management is frequently referenced in this section. It is theinternational standard for records management and, by its nature, an influential andauthoritative source.

2.2. RECORDS AND RECORDKEEPING 11
2.2.1 Key Characteristics of Records
Trustworthy records are essential for an organization to meet its legislativeand internal business needs. From a records management perspective, thefollowing characteristics are used to describe trustworthy records: authenticity,reliability, integrity, and usability (Sprehe, 2008; NARA, 2005; ISO 15489.1,2002; Cullen et al., 2000; Upward, 1996).
Authenticity (and Provenance)
An authentic record is one that can be proven to be what it purports tobe, to have been created or sent by the person purported to have createdor sent it, and to have been created or sent at the purported time (ISO15489.1, 2002, p. 7). To prove authenticity, records require policies andprocedures that control and record the creation, transmission, receipt, andmaintenance of records (NARA, 2005). These systematic controls ensure thatrecords creators are authorized and identified and that records are protectedagainst unauthorized addition, deletion, and alteration; in other words, adocumented history of the record. This history of a record or object is calledits provenance.
The term provenance is used extensively in the study of fine art, where adocumented history helps an object to ‘attain an authority’. It is a methodof placing the object in a particular context and determining its importancerelative to other objects (Moreau et al., 2008).
In the case of historic manuscripts, the need to determine provenanceled to the creation of a body of knowledge within archival science knownas diplomatics. Diplomatics is dedicated to examining clues that supportprovenance claims. One of the original definitions of diplomatics (circa 17th
century) was “the establishment of certain and accurate terms and rules bywhich authentic instruments can be distinguished from spurious, and certainand genuine ones from uncertain and suspect ones” (MacNeil, 2004, p. 202).
In modern times, the scientific, financial, and art communities find knowl-edge of provenance (for example, the ownership and/or access history) ofobjects to be of great importance as this history provides vital elements fordetermining the object’s relative trust level (Hasan, Sion, & Winslett, 2007).In the case of records, provenance has even been called the fundamental prin-ciple of archival science (Hasan et al., 2007) for its importance in contributingto a record’s authenticity.
12 CHAPTER 2. LITERATURE REVIEW
The record of an object’s provenance must itself also be a trusted record.Examples of domains that require secure provenance include law (whereownership history must be maintained if it is to be used as reliable evidence);authorship (where provenance records or evidence can be used to resolvetiming disputes associated with research or patent applications); scientific data(tracking data and data transformation through large collaborative projects);digital forensics (any changes to data or documents would be known); andregulatory compliance ranging from trusted medical records to governmentand financial institution recordkeeping compliance legislation (Hasan et al.,2007).
Reliability
A reliable record is defined as one whose contents can:
be trusted as a full and accurate representation of the transactions,activities or facts to which they attest and can be depended uponin the course of subsequent transactions or activities. Recordsshould be created at the time of the transaction or incident towhich they relate, or soon afterwards, by individuals who havedirect knowledge of the facts or by instruments routinely usedwithin the business to conduct the transaction. (ISO 15489.1,2002, p. 7)
From that definition, it can be noted that the context of the record’screation is important in determining its reliability. Automated, real-timecapture of objective transaction information would have the highest reliability,whereas timely first-hand accounts by individuals would have slightly lessreliability, as the content is necessarily filtered through personal subjectiveinterpretation (Collopy, 1996). Again, a record’s provenance or lineage canbe used as evidence in support of a record’s reliability (Simmhan, Plale, &Gannon, 2005), with records created at the time of the event considered tobe the most reliable.
Integrity
The integrity of a record refers to its being complete and unaltered. The ISOstandard on Records Management states:
2.2. RECORDS AND RECORDKEEPING 13
It is necessary that a record be protected against unauthorizedalteration. Records management policies and procedures shouldspecify what additions or annotations may be made to a recordafter it is created, under what circumstances additions or anno-tations may be authorized, and who is authorized to make them.Any authorized annotation, addition or deletion to a record shouldbe explicitly indicated and traceable. (ISO 15489.1, 2002, p. 7)
ISO 15489.1 emphasizes the need for systematic management policies andprocedures to guard against alteration and fraud. This again illustrates theneed to capture a complete and auditable record of a record’s provenanceas an important indicator of that record’s integrity. The risk of fraud in theprovenance record (in addition to fraud in the record itself), has led to thedevelopment of secure provenance, especially in electronic records (Hussein,Karim, & Selamat, 2007). Furthermore, the systems themselves must haveintegrity. The perceived need for system integrity is also helping to build thecase for the transparency commonly associated with open source softwaresolutions (Ince, Hatton, & Graham-Cumming, 2012).
Another aspect of integrity is the contextual and structural integrity ofthe content of records. This includes the physical and logical format and therelationships between content elements. Failure to maintain the structuralintegrity of records may impair a record’s reliability and authenticity (NARA,2005); but more importantly, it will impact the record’s usability.
Usability
A usable record is one that can be found and understood in its original context.The ISO standard on Records Management further states:
A usable record is one that can be located, retrieved, presentedand interpreted. It should be capable of subsequent presentationas directly connected to the business activity or transaction thatproduced it. The contextual linkages of records should carry theinformation needed for an understanding of the transactions thatcreated and used them. It should be possible to identify a recordwithin the context of broader business activities and functions.The links between records that document a sequence of activitiesshould be maintained. (ISO 15489.1, 2002, p. 7)
14 CHAPTER 2. LITERATURE REVIEW
There are thus two aspects of a record’s usability: the usability of therecord itself and the functionality of the system that is managing the record.To keep an individual record usable, it must be preserved over time. Ingeneral, the primary goal of preservation is “to allow future users to retrieve,access, decipher, view, interpret, understand, and experience documents,data, and records in meaningful and valid (that is, authentic) ways” (Cullenet al., 2000, p. 54). One of the challenges for preservation is that recordsmust be altered to preserve them, and this impacts on the record’s integrityand authenticity (Cullen et al., 2000). Clearly, a balance must be sought tomaintain authenticity and usability.
The second aspect of usability relates to the functionality of the systemin which the record is being managed. The definition requires that a usablerecord be able to be “located, retrieved, presented and interpreted.” In orderto do that, sufficient information must be captured about the record and thecontext of its creation and use. This information should be sufficient to locatethe record, while the contextual linkages should provide an understanding ofthe transactions that created and used them (NARA, 2005).
2.2.2 A Short History of Records and Recordkeeping
The history of records and records management in western civilization ispresented in this section.2 The three models of records management coveredbelow have been refined over time to meet the evidence requirements of theday, and now form the foundation for much of our current legal system andeconomy.
The Archive
Western civilization’s approach to recordkeeping can be traced back thousandsof years to ancient Greece. The ancient Greeks considered trustworthy recordsto be the key to a trustworthy government. In fact, the word ‘archive’ (Greek:archeion) describes the ‘keystone’ of an arch, thereby illustrating the role thatrecords play in preserving the delicate ‘arch of government’. To safeguard thesecritically important records, the ancient Greeks created a secure repositorylocation in which they could store their historical recorded evidence.
The Romans expanded the scope of their archivum by providing a publicoffice in which citizens could record their transactions, thereby providing a
2Much of the historical context featured in this section is sourced from Upward’s seminalwork found in Archives: Recordkeeping in Society (Upward, 2005).
2.2. RECORDS AND RECORDKEEPING 15
location and legitimizing mechanism to create and guard the authenticity andreliability of their records. The archive became the safe house as well as theformal witness of action. Much of the success of Rome and its wealth fromtrade can be attributed to the confidence that merchants had in the ‘truth’of the records lodged in the archivum (Duranti, 1996; Upward, 2005).
This tradition has continued, with most modern nation states continuingto support national archives, an institution (and location) to guard theauthenticity and reliability of their national records and history (Duranti,1996).
Archival Diplomatics
The period following the fall of the Roman empire coincided with the lossof the Roman archivum as witness and guardian of the community’s officialrecords; however, the need for authenticity and reliability of documents(especially representing transactions or treaties) continued as a necessary partof a functioning marketplace or government. Lacking an archivum as thelocation/witness to provide legitimacy to documents, a mark of authenticityand reliability was instead embedded into the document itself. The professionsof the notary and the jurist came into being. This meant that an officialstate-appointed person provided that mark of legitimacy on the document(according to the rules of diplomatics) as a method of determining authenticityand the provenance of these official documents in order to guard against fraud(MacNeil, 2004).
In other words, the methods of managing the key characteristics of a record(authenticity, reliability, integrity, and usability) effectively split into twocamps. On the one hand, there was the archive, a secure storage location andofficial witness of transactions. On the other hand, there was the autonomousrecord (e.g., diplomas, certificates, etc.) signaling its trustworthiness throughembedded markers of authenticity and reliability, supported by a range ofofficials trained to make and read those embedded markers.
Bureaucratic Recordkeeping
The third wave of change came about during the rise of nation states, globalcolonization, and ‘big business’, resulting in the development of the bureau-cratic recordkeeping approach (Upward, 2005). Organizations were beginningto rival governments in complexity and required standardized records to rungeographically dispersed operations. They duly created powerful systematic
16 CHAPTER 2. LITERATURE REVIEW
control systems called registries. These registries (which were often locatedin regional offices, in contrast to the archive’s single, central location) effec-tively managed metadata (i.e., data about data) for two primary purposes:describing the records themselves, and describing the relationships betweenrecords. Registrars (the keeper of the registries) were now the guardians ofauthenticity, reliability and integrity for the new systems.
The bureaucratic recordkeeping systems supported the current operationsof organizations, and their records often had a relatively short period ofvalue. Modern techniques and theory developed during this time focused onmanaging a record’s life-cycle, and these helped to guide records managerson rules of creation, use, storage, and eventual disposal of records (Upward,2005).
Today, western civilization relies on all three methods to maintain reliablerecorded evidence.3 Nation states actively maintain national archives thatstore and maintain records of events and activities. Official documents arestill issued with embedded markers of authenticity or an official witnessingby a notary or justice of the peace, and organizations and governmentsare still operating official recording departments to maintain registries oftransactions and operational activities. Nonetheless, the point at which eachkey characteristic is sufficient to raise the status of a document to that of arecord is contingent on the interpretation of that characteristic and on theneeds as defined by the legislative and regulatory setting of the society inwhich the record resides.
2.2.3 A Short History of Electronic Recordkeeping
During the 1970s, along with the introduction of computing and computerizedinformation systems, the recordkeeping and archival community found itselfat a crossroads. Information was increasingly being stored electronically, andthese electronic records didn’t fit well in their paper-based, records-life-cycle-modeled world. One side argued that archival work was scholarly and thatthe methods supporting historical research should be shifted from a record’scontent to its context as a way of dealing with the volume and format of thesenew electronic records (Cook, 1997, p. 19). The other side proposed thatarchivists should “abandon their traditional history-based orientation, and
3Although all three methods are in use in modern western civilization, the EDRMSshows the legacy of the Roman archivum – a central repository to guard the authenticityand reliability of its records.
2.2. RECORDS AND RECORDKEEPING 17
transform themselves into records or information managers, into computerscientists, into technical experts in the new media” (Cook, 1997, p. 19).
In addition, separating the digital information streams and declaring whichone is the record and which one is not is more difficult than it would appear.For example, a digital office document may be considered self-contained,whereas a database query is only transitory. Speaking of David Bearman’scontribution to the recordkeeping literature, Cook noted that electronic files,such as computer dumps or backups, are not evidence of business transactions,but rather “views or frozen snapshots of information, and views that are bydefinition incomplete, not linked to creator context or activity, and thereforewithout assurance of reliability and authenticity. They are not records” (Cook,1997, p. 23).
At what point does an electronic file become worthy of being calleda record? What are the attributes of an electronic record and how canthose attributes be applied in the electronic medium where physical form ismeaningless?
Before an electronic recordkeeping system could be introduced into prac-tice, the definitions and attributes of an electronic record had to be determined.Starting in the 1990s, there have been several efforts to develop these defini-tions and to set standards for electronic records and electronic recordkeeping,including: the Pittsburgh Project (Pittsburgh Project, 1993); the ongoingInterPARES project (Gilliland, Rouche, Lindberg, & Evans, 2005; Duranti& Blanchette, 2004; MacNeil, 2002; InterPARES Project, 2011); and theClever Recordkeeping Metadata Project (Evans, Reed, & McKemmish, 2008;Final Report CRKM Project, 2007; Evans, McKemmish, & Bhoday, 2006;CRKM Project, 2011). The outcome of these projects was the creation andstandardization of recordkeeping metadata.
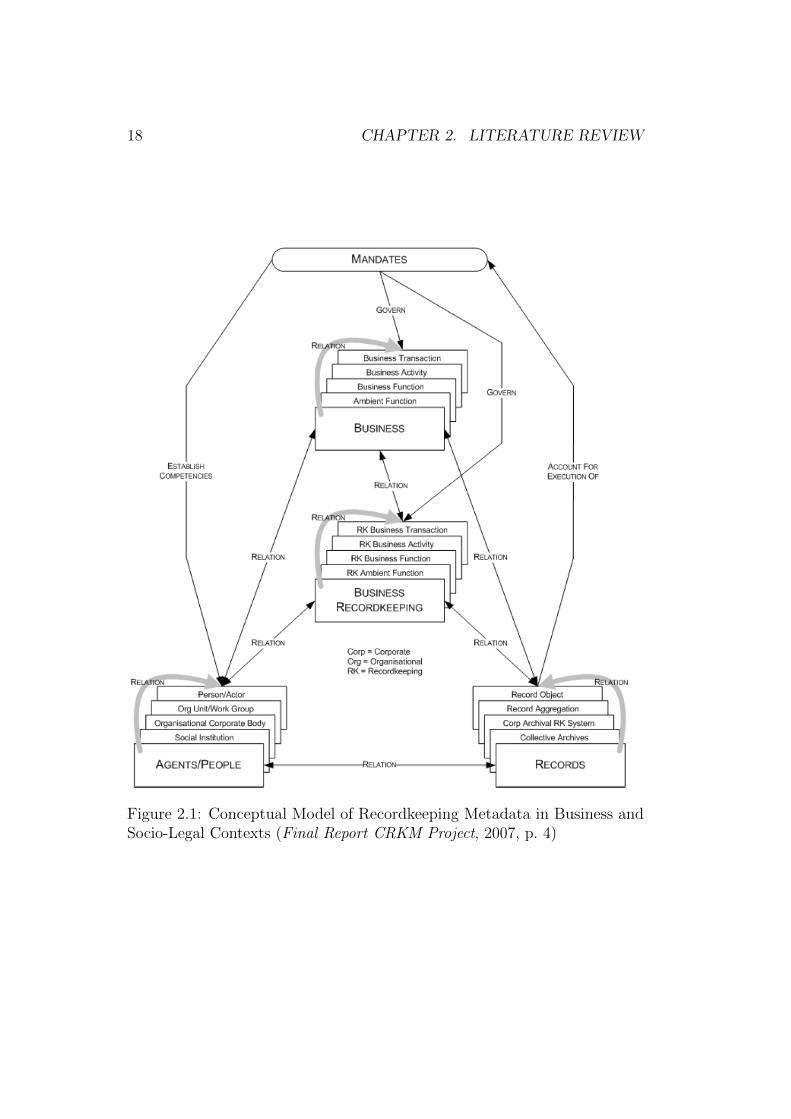
Recordkeeping metadata is defined as including “all standardised informa-tion that identifies, authenticates, describes, manages and makes accessible,through time and space, documents created in the context of social andbusiness activity” (McKemmish, Acland, Ward, & Reed, 1999, p. 7). Ad-ditional work in refining models of recordkeeping metadata (McKemmishet al., 1999; Evans & Lindberg, 2004; Final Report CRKM Project, 2007)has resulted in a refined conceptualization of recordkeeping metadata thatbecame an international standard, ISO 23081.1 (2006) – Managing metadatafor records. An example of an electronic recordkeeping metadata model foruse in a business and socio-legal context is provided in Figure 2.1.
In the next section, the discussion will focus on the theoretical underpin-nings of how records and society relate to, and support, each other.
18 CHAPTER 2. LITERATURE REVIEW
Figure 2.1: Conceptual Model of Recordkeeping Metadata in Business andSocio-Legal Contexts (Final Report CRKM Project, 2007, p. 4)
2.3. RECORDKEEPING MODELS AND THEORIES 19
2.3 Recordkeeping Models and Theories
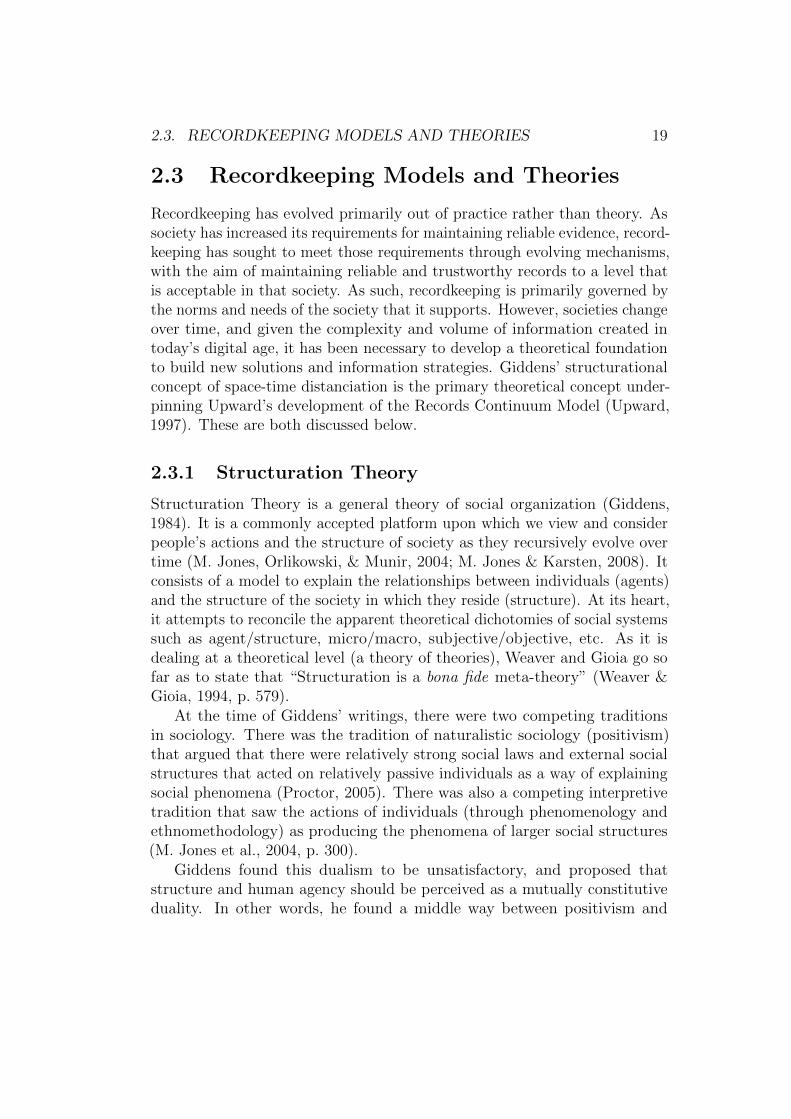
Recordkeeping has evolved primarily out of practice rather than theory. Associety has increased its requirements for maintaining reliable evidence, record-keeping has sought to meet those requirements through evolving mechanisms,with the aim of maintaining reliable and trustworthy records to a level thatis acceptable in that society. As such, recordkeeping is primarily governed bythe norms and needs of the society that it supports. However, societies changeover time, and given the complexity and volume of information created intoday’s digital age, it has been necessary to develop a theoretical foundationto build new solutions and information strategies. Giddens’ structurationalconcept of space-time distanciation is the primary theoretical concept under-pinning Upward’s development of the Records Continuum Model (Upward,1997). These are both discussed below.
2.3.1 Structuration Theory
Structuration Theory is a general theory of social organization (Giddens,1984). It is a commonly accepted platform upon which we view and considerpeople’s actions and the structure of society as they recursively evolve overtime (M. Jones, Orlikowski, & Munir, 2004; M. Jones & Karsten, 2008). Itconsists of a model to explain the relationships between individuals (agents)and the structure of the society in which they reside (structure). At its heart,it attempts to reconcile the apparent theoretical dichotomies of social systemssuch as agent/structure, micro/macro, subjective/objective, etc. As it isdealing at a theoretical level (a theory of theories), Weaver and Gioia go sofar as to state that “Structuration is a bona fide meta-theory” (Weaver &Gioia, 1994, p. 579).
At the time of Giddens’ writings, there were two competing traditionsin sociology. There was the tradition of naturalistic sociology (positivism)that argued that there were relatively strong social laws and external socialstructures that acted on relatively passive individuals as a way of explainingsocial phenomena (Proctor, 2005). There was also a competing interpretivetradition that saw the actions of individuals (through phenomenology andethnomethodology) as producing the phenomena of larger social structures(M. Jones et al., 2004, p. 300).
Giddens found this dualism to be unsatisfactory, and proposed thatstructure and human agency should be perceived as a mutually constitutiveduality. In other words, he found a middle way between positivism and
20 CHAPTER 2. LITERATURE REVIEW
interpretivism where societal structure is the outcome of human agency andpractices, but it is also the medium in which those practices take place andis thus influencing both the shape and form of those practices. In this light,societal structure is both affecting individuals and being affected by thoseindividuals simultaneously. Giddens’ use of the term structuration invokesthe condition of societal structures as being in a constant state of creationthrough the flow of everyday social practices (M. Jones & Karsten, 2008,p. 131).
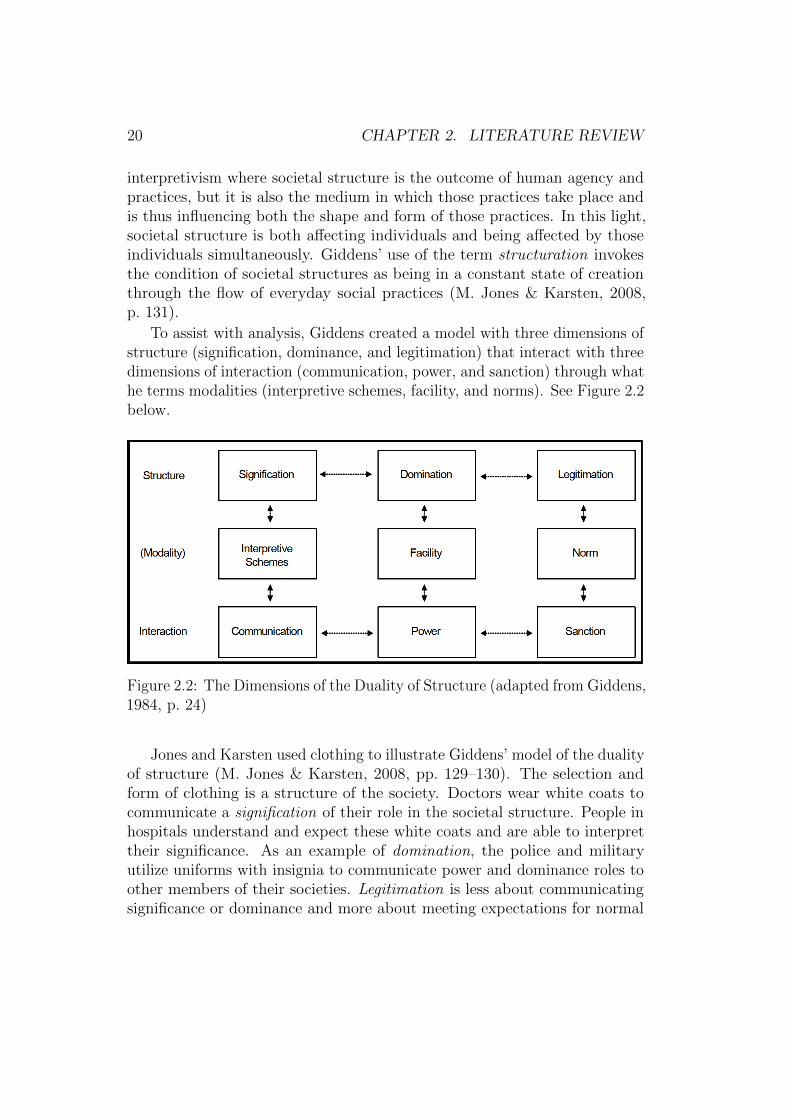
To assist with analysis, Giddens created a model with three dimensions ofstructure (signification, dominance, and legitimation) that interact with threedimensions of interaction (communication, power, and sanction) through whathe terms modalities (interpretive schemes, facility, and norms). See Figure 2.2below.
Figure 2.2: The Dimensions of the Duality of Structure (adapted from Giddens,1984, p. 24)
Jones and Karsten used clothing to illustrate Giddens’ model of the dualityof structure (M. Jones & Karsten, 2008, pp. 129–130). The selection andform of clothing is a structure of the society. Doctors wear white coats tocommunicate a signification of their role in the societal structure. People inhospitals understand and expect these white coats and are able to interprettheir significance. As an example of domination, the police and militaryutilize uniforms with insignia to communicate power and dominance roles toother members of their societies. Legitimation is less about communicatingsignificance or dominance and more about meeting expectations for normal
2.3. RECORDKEEPING MODELS AND THEORIES 21
and acceptable behavior; for example, in the degree of formality of dressallowed in an office situation (e.g., casual Fridays).
The concept of space-time distanciation is a recurring theme in Giddens’work, and refers to the intersecting points of space and time as being necessarycoordinates to determine the structure of society at that place and thattime. Giddens sees structuration as involving three ‘intersecting planes oftemporality’: duree (the timeframe of day-to-day life), dasein (the humanlifespan), and the longue duree (the timeframe of social institutions), thusillustrating that his theory is able to link the individual to that of the longer-lived social institution (M. Jones & Karsten, 2008, p. 133).
However, Giddens’ structuration theory is often considered too broad tobe used by itself. Poole & DeSanctis note that:
[S]tructuration theory has been the theoretical lens of choicefor most scholars during the past decade. It provides a majortheoretical pillar, though it specifies no detailed theorems or formalhypotheses; and it offers little methodological guidance. [. . . ][S]tructuration is more a guiding philosophy of social scientificinquiry than a theory per se. It offers a grand formulation – away of viewing the world – that is so general and encompassingthat it cannot be falsified. (Poole & DeSanctis, 2004, p. 207)
Nevertheless, Giddens’ theoretical approach to explaining the constitutionof society does provide a logical foundation for understanding how societiesform and change their norms over time. This movement at the societal levelalso informs the changing level of acceptability that defines a record over time– an important attribute in defining recordkeeping requirements. Upward(1997) explored this implication to recordkeeping while developing his RecordsContinuum model.
2.3.2 The Records Continuum Model
For the greater part of the 20th century (up through the 1980s), the dominantmodel controlling the records management-archives relationship consisted ofthe life-cycle model (J. Atherton, 1985; Gilliland et al., 2005; Johnston &Bowen, 2005).
The life-cycle model is based on the premise that the life of a record canbe divided into eight separate stages in two phases, starting with a recordsmanagement phase consisting of the
22 CHAPTER 2. LITERATURE REVIEW
1. creation or receipt of information in the form of records,
2. classification of the records or their information in some logical system,
3. maintenance and use of the records, and
4. their final disposition through destruction or transfer to an archive.
This is then followed by an archival phase consisting of the
5. selection/acquisition of the records by an archive,
6. description of the records in inventories, indexing, etc.,
7. preservation of the records or, perhaps, the information in the records,and
8. reference and use of the information by researchers and scholars (J.Atherton, 1985).
The two phases were most often managed by completely separate organiza-tions, with the records management phase being managed by the organizationbased on its needs, followed by a handover of the records to an archivalorganization supporting a different set of users and stakeholders governed bydifferent policies and procedures. Inevitably, the archivist had little or noinput into how records were initially captured, and the records manager oftenneglected to identify permanently valuable records for the future.
In 1985, Atherton stated that the “split between the records managementand archival phases of the life-cycle is no longer acceptable” and recommendedmerging the recordkeeping and archival phases into a single continuum tohelp maintain contextual continuity throughout the managed life of a record(J. Atherton, 1985, p. 47). At the same time, archives were under a growing‘threat’ by the spread of electronic documents and the Internet. In 1996,Upward noted that “[i]f the archival profession is to avoid a fracture alongthe lines of paper and electronic media, it has to be able to develop waysof expressing its ideas in models of relevance to all ages of recordkeeping”(Upward, 1996, p. 269).
To help practitioners move to a more unified approach to the records-archival relationship, Upward introduced a new model based on Giddens’notion of time-space distanciation (Giddens, 1984). Upward’s model intro-duced a space-time model for records. In short, a record can be and be
2.3. RECORDKEEPING MODELS AND THEORIES 23
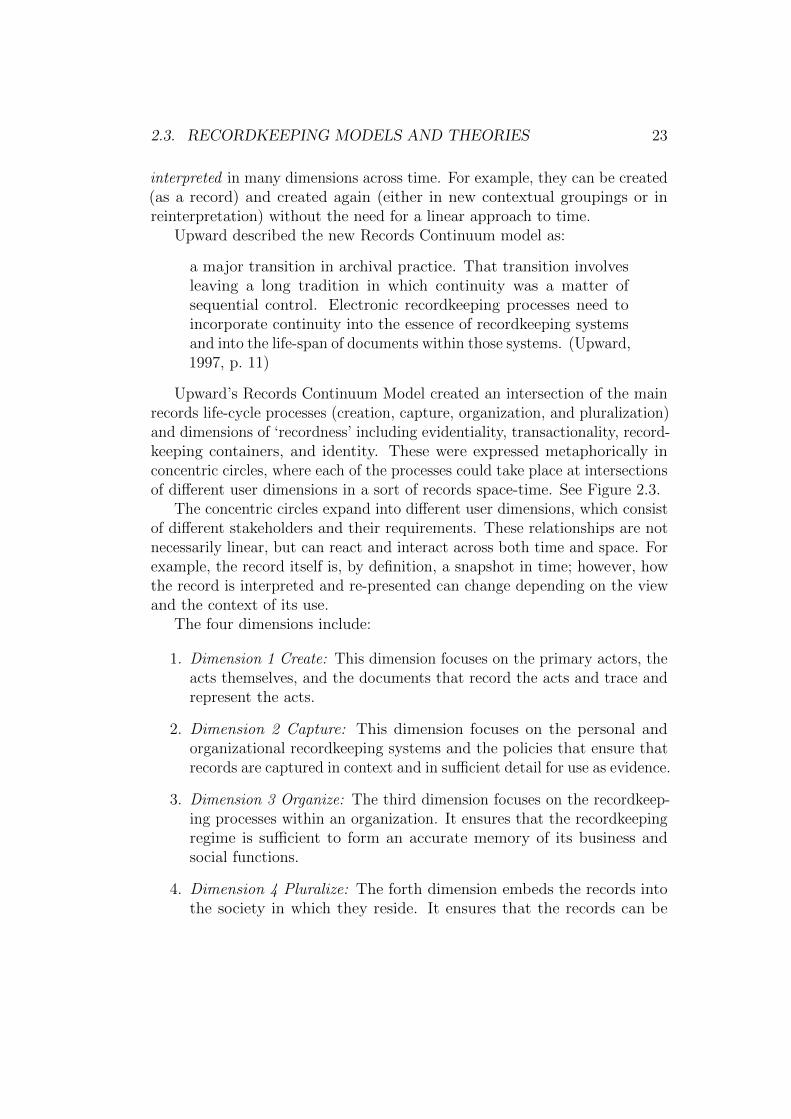
interpreted in many dimensions across time. For example, they can be created(as a record) and created again (either in new contextual groupings or inreinterpretation) without the need for a linear approach to time.
Upward described the new Records Continuum model as:
a major transition in archival practice. That transition involvesleaving a long tradition in which continuity was a matter ofsequential control. Electronic recordkeeping processes need toincorporate continuity into the essence of recordkeeping systemsand into the life-span of documents within those systems. (Upward,1997, p. 11)
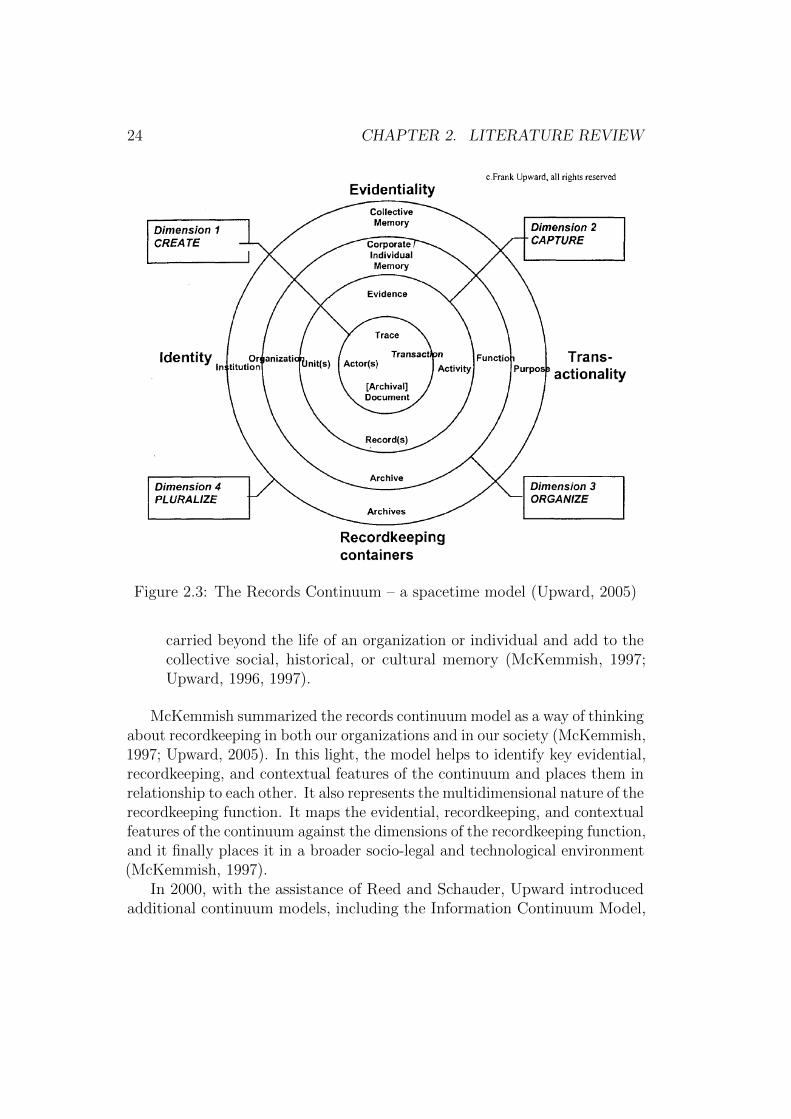
Upward’s Records Continuum Model created an intersection of the mainrecords life-cycle processes (creation, capture, organization, and pluralization)and dimensions of ‘recordness’ including evidentiality, transactionality, record-keeping containers, and identity. These were expressed metaphorically inconcentric circles, where each of the processes could take place at intersectionsof different user dimensions in a sort of records space-time. See Figure 2.3.
The concentric circles expand into different user dimensions, which consistof different stakeholders and their requirements. These relationships are notnecessarily linear, but can react and interact across both time and space. Forexample, the record itself is, by definition, a snapshot in time; however, howthe record is interpreted and re-presented can change depending on the viewand the context of its use.
The four dimensions include:
1. Dimension 1 Create: This dimension focuses on the primary actors, theacts themselves, and the documents that record the acts and trace andrepresent the acts.
2. Dimension 2 Capture: This dimension focuses on the personal andorganizational recordkeeping systems and the policies that ensure thatrecords are captured in context and in sufficient detail for use as evidence.
3. Dimension 3 Organize: The third dimension focuses on the recordkeep-ing processes within an organization. It ensures that the recordkeepingregime is sufficient to form an accurate memory of its business andsocial functions.
4. Dimension 4 Pluralize: The forth dimension embeds the records intothe society in which they reside. It ensures that the records can be
24 CHAPTER 2. LITERATURE REVIEW
Figure 2.3: The Records Continuum – a spacetime model (Upward, 2005)
carried beyond the life of an organization or individual and add to thecollective social, historical, or cultural memory (McKemmish, 1997;Upward, 1996, 1997).
McKemmish summarized the records continuum model as a way of thinkingabout recordkeeping in both our organizations and in our society (McKemmish,1997; Upward, 2005). In this light, the model helps to identify key evidential,recordkeeping, and contextual features of the continuum and places them inrelationship to each other. It also represents the multidimensional nature of therecordkeeping function. It maps the evidential, recordkeeping, and contextualfeatures of the continuum against the dimensions of the recordkeeping function,and it finally places it in a broader socio-legal and technological environment(McKemmish, 1997).
In 2000, with the assistance of Reed and Schauder, Upward introducedadditional continuum models, including the Information Continuum Model,
2.4. ELECTRONIC DOCUMENT AND RECORDS MANAGEMENT 25
the Information Systems Continuum Model, and the Publishing ContinuumModel (Upward, 2000). All of the models use the same dimensions butwith different processes, and represent the “intra-disciplinary informationmanagement and systems nature of records management, as it does for eachof the specialisations depicted” (Upward, 2000, p. 133).
The continuum approach to records as they exist in both space and timeis critical to the mental move required to address the functional requirementsand need for virtual archives to manage the future’s electronic records (Cook,1994). Nevertheless, both structuration theory and the related records con-tinuum model are an abstraction of reality – and they still require a tangiblemethod of application to recordkeeping in general and electronic recordkeepingspecifically.
2.4 EDRMS: Electronic Document and Records
Management Systems
By the turn of the millennium, the current recordkeeping theory, in the form ofUpward’s Records Continuum Model (Upward, 1996, 1997, 2000), had caughtthe attention of much of the recordkeeping profession and had formed the basisof the international standard ISO 15489: Records Management. Furthermore,work had begun on defining the model of electronic recordkeeping metadata(later published as ISO 23081: Managing metadata for records – see exampleon p. 18) that would be required to make electronic recordkeeping technicallypossible. The focus now turned to developing a system to create and manageelectronic records.
2.4.1 Reorganizing Recordkeeping
In 2001, the State Records Authority of New South Wales (Australia) createda strategy called DIRKS: Designing and Implementing Recordkeeping Systems(National Archives of Australia, 2001). This strategy was designed to assistorganizations in setting up a compliant enterprise-wide recordkeeping system.
More recently, standard-setting authorities have built upon this founda-tion and either developed or adopted improved standards. Examples includethe International Council on Archives (ICA)’s “Digital Recordkeeping Stan-dard” (2010), as well as checklist-style functional requirements on electronicrecordkeeping like those developed under the Australasian Digital Record-
26 CHAPTER 2. LITERATURE REVIEW
keeping Initiative and adopted by the ICA, such as “Principles and FunctionalRequirements for Records in Electronic Office Environments” (2008).
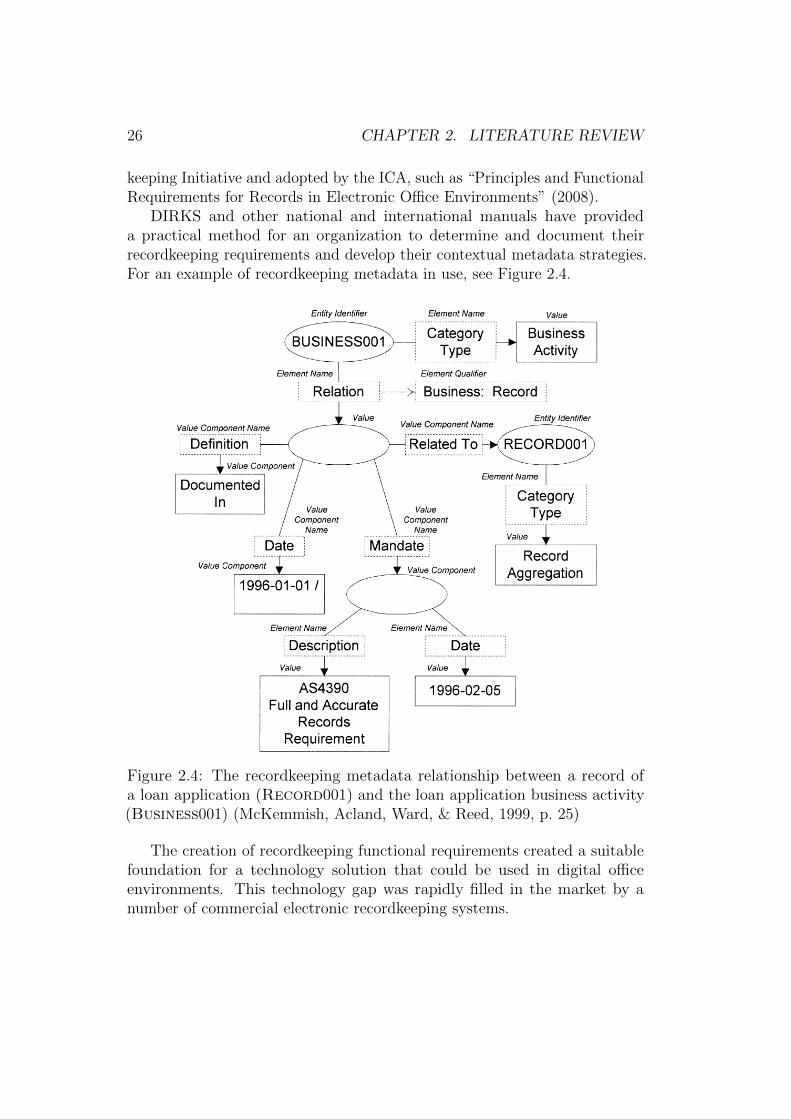
DIRKS and other national and international manuals have provideda practical method for an organization to determine and document theirrecordkeeping requirements and develop their contextual metadata strategies.For an example of recordkeeping metadata in use, see Figure 2.4.
Figure 2.4: The recordkeeping metadata relationship between a record ofa loan application (Record001) and the loan application business activity(Business001) (McKemmish, Acland, Ward, & Reed, 1999, p. 25)
The creation of recordkeeping functional requirements created a suitablefoundation for a technology solution that could be used in digital officeenvironments. This technology gap was rapidly filled in the market by anumber of commercial electronic recordkeeping systems.
2.4. ELECTRONIC DOCUMENT AND RECORDS MANAGEMENT 27
2.4.2 EDRMS Defined
When focusing on possible enterprise-wide solutions, Bearman made a strongdifferentiation between information systems and recordkeeping systems (Cook,1997, p. 23). The former cover the storage and retrieval of both information(as in data fragments in a database) and documents, while the latter focuson the more formal requirements of records management, which includeprotecting the key characteristics of records such as authenticity and integrity(see Section 2.2.1).
In the traditional life-cycle model, documents were generally only em-bedded in a formal recordkeeping system (archive) after they had satisfiedtheir initial purpose within the organization (often years after). However,the records continuum model introduced a ‘spacetime shift’ in the perceptionof records (Upward, 2000, p. 126). The result of this shift in thinking wasultimately to push the ideal requirement for formal recordkeeping as close tothe moment of creation as possible.
It logically follows that any electronic systems that were designed to man-age records should also be intimately involved with their creation. In an effortto reconcile Bearman’s differentiation between information systems and record-keeping systems in terms of the management of documents, Benfell (2002)stated that a single, combined Electronic Document and Records Manage-ment Systems (EDRMS) would generally be the most effective enterprise-widesolution. Several EDRMS solutions soon entered the marketplace to focus onthe management of ‘office’-type documents.
The State Records of South Australia (SRSA), for example, defines anEDRMS as:
An automated system used to manage the creation, use, manage-ment and disposal of physical and electronically created documentsand records for the purpose of supporting the creating, revision andmanagement of digital documents, improving an organisation’swork-flow and providing evidence of business activities. (SRSA ascited by Nguyen, Swatman, & Fraunholz, 2008b, p. 524)
Efforts to create standards for electronic recordkeeping systems softwaresoon followed, with some early examples including the the European Commis-sion’s MoReq: Model Requirements for Electronic Records (Cain, 2002) andthe United States Department of Defense’s Electronic Records ManagementSoftware Applications Design Criteria Standard (DoD 5015.02-STD, 2007).
28 CHAPTER 2. LITERATURE REVIEW
The electronic recordkeeping software standards continue to develop. Withthe release of MoReq2010 (Lappin, 2011a; MoReq2010, 2011), which includesa new modular requirements structure, standard XML schema, and a ven-dor certification process, the commercial offerings in the electronic recordsmanagement software space could expand significantly (Cunningham, 2011).In spite of some process concerns (Fresko, 2010), it is likely that electronicrecordkeeping standards and resultant technology solutions will continue tochange rapidly to meet the evolving needs of the organizations and societiesthat they support.
2.4.3 The Future of EDRMS
The development of national and international recordkeeping standards andthe push to develop electronic recordkeeping systems arrived during the col-lapse of the dot-com bubble and after a number of high profile accountingscandals including the collapse of WorldCom (Ackman, 2002) and Enron(Holtzman, Venuti, & Fonfeder, 2003). A 2007 review of recordkeeping legisla-tion in force for Australia, the USA, the UK, and the EU reveals that “recordsmanagement has gradually moved from a position on the very periphery oforganizational attention towards a far more central legal requirement forboth public and private sector organizations” (Nguyen & Swatman, 2007).Given the legislative imperative, the operational benefits, and the rapidadoption by large organizations, the EDRMS quickly joined other whole-of-enterprise systems, which include Enterprise Resource Planning (ERP),Customer Relationship Management (CRM), and Supply Chain Management(SCM) (Nguyen et al., 2008b). EDRMS as a class is now the predominantsolution available to organizations to centrally manage their electronic records.
Harries (2009) successfully predicted that the EDRMS would be a foun-dational technology that would support what he terms a true “businesstransformation”. Harries argued that EDRMS are the key enabler for twomain reasons: 1) “e-records are one aspect of the modernization process,because the electronic management of electronic information is a necessaryenabler for sustainable business change”, and 2) “that better managementis essential to meet information policy and compliance requirements in thismodernised environment” (Harries, 2009, p. 16). He concluded that orga-nizational management and public policy is undergoing a radical shift, andargues that larger, networked recordkeeping systems are required in order tomove the perception of electronic records management from “a ‘back-office’
2.4. ELECTRONIC DOCUMENT AND RECORDS MANAGEMENT 29
end-of-process activity to one that is central to the delivery of outcomes”(Harries, 2009, p. 24).
With the introduction of Microsoft Sharepoint, which focuses more oncollaboration than recordkeeping (Lappin, 2011b), and the continued frag-mentation of electronic document repositories, many began to think thatEDRMS might be a passing fad. Lappin (2011a) thought that declaring thedeath of EDRMS was premature: “EDRMS has lost momentum but most ofthose organisations that have succeeded in implementing them corporate-widehave felt a benefit and will continue to maintain and develop their systems.”It is likely that as the information systems ecology continues to evolve, theEDRMS will continue to evolve with them, taking the lead role in some casesand working in tandem or even behind the scenes with others.
Nonetheless, EDRMS are not without their limitations. In terms ofrecordkeeping models, the EDRMS is based on the records repository model(Lappin, 2010). The current electronic file standards do not (yet) includesufficient and trustworthy information to make individual files into recordsin their own right; so it remains the act of lodging the electronic file intoan EDRMS that provides it with its legitimacy. Furthermore, the processof lodging the document remains a manual one (Joseph et al., 2012; Bailey,2009).
Another limitation of EDRMS applications is that they typically onlymanage the ‘office’-type documents, and often exclude records representedin other enterprise business systems and Web 2.0 platforms (Lips, Rapson,& Hooper, 2008; Lips & Rapson, 2009, 2010), which arguably create thebulk of ‘records’ in most organizations. Reed (2008) advocated a significantscope enhancement to the EDRMS concept that would expand its domainto include automated collection of evidence of transactions taking place inother systems across the enterprise via the use of a common service-orientedarchitecture.4
This concept of comprehensive or ubiquitous recordkeeping has broaderimplications for the structure of future organizations and for the disciplineof records management. A current direction of research seeks to explore thebroader impact (and opportunity) of weaving records management principlesthroughout an organization under the banner of recordkeeping informatics(Oliver et al., 2009, 2010; Upward, Reed, Oliver, & Evans, 2013). In addition,there were also efforts to embed recordkeeping principles directly into the
4This functional requirement is supported by the MoReq2010 standard (Lappin, 2011a;MoReq2010, 2011), with technical standards modules being released from late 2012.
30 CHAPTER 2. LITERATURE REVIEW
‘office’-type file formats (Mishina, Yoshihama, & Kudo, 2007), which couldintroduce a new ‘diplomatics’ aspect to the measure of reliability in electronicrecords stored outside of an EDRMS repository. Furthermore, advances incloud computing seek to redefine the concept of the ‘records repository’ whilepotentially increasing the portability (and potential of ubiquity) of records toanywhere on the Internet (Duranti, 2012; Lappin, 2010).
2.5 Constructs Associated with the Use of
EDRMS Technology
The previous sections explored the literature with a focus on records, record-keeping, and the purpose and importance of an EDRMS in modern orga-nizations. Returning to the research question, the focus will now turn tothe acceptance and use of EDRMS in the organizational context. The de-pendent variable, system use, is considered in Section 2.5.1, followed by anexploration of relevant factors that could potentially influence EDRMS-usein Section 2.5.2.
2.5.1 System Use: the Dependent Variable
Information systems are generally implemented in organizations with theexpectation that they will be used by staff to the benefit of the organization. Itis not surprising that the system use construct appears widely in the literatureand has been under continual investigation since the 1970s (Barkin Gary &Stephen, 1977, as referenced by Burton-Jones & Straub, 2006). IS researchhas since dedicated much study and effort to understanding and measuringmany aspects of the acceptance and use of technology (DeLone & McLean,1992; Venkatesh et al., 2003), using both variance and/or process researchmodels (Fidock & Carroll, 2009). See Figure 2.5.
Both approaches provide a partial understanding of the system understudy. Variance research largely utilizes quantitative, survey-based methods,where measures are carefully developed to ensure their statistical validity andreliability. In variance research, researchers seek to identify which independentvariables best predict the variation in occurrence or the magnitude of thedependent variable under study (Burton-Jones & Straub, 2006). However,given the reliance on survey-based methods, variance models are also limitedin scope to being ‘snapshots’ in time, where the selection of the time-slice isdependent upon the requirements of the research at hand.
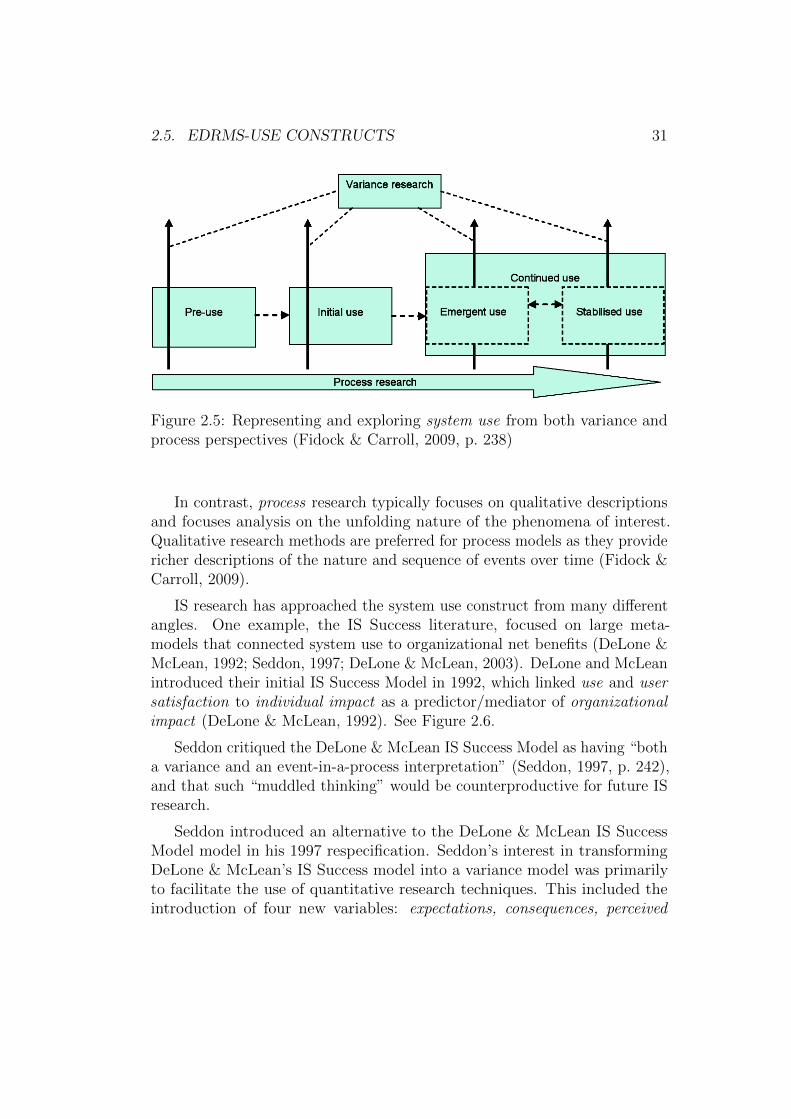
2.5. EDRMS-USE CONSTRUCTS 31
Figure 2.5: Representing and exploring system use from both variance andprocess perspectives (Fidock & Carroll, 2009, p. 238)
In contrast, process research typically focuses on qualitative descriptionsand focuses analysis on the unfolding nature of the phenomena of interest.Qualitative research methods are preferred for process models as they providericher descriptions of the nature and sequence of events over time (Fidock &Carroll, 2009).
IS research has approached the system use construct from many differentangles. One example, the IS Success literature, focused on large meta-models that connected system use to organizational net benefits (DeLone &McLean, 1992; Seddon, 1997; DeLone & McLean, 2003). DeLone and McLeanintroduced their initial IS Success Model in 1992, which linked use and usersatisfaction to individual impact as a predictor/mediator of organizationalimpact (DeLone & McLean, 1992). See Figure 2.6.
Seddon critiqued the DeLone & McLean IS Success Model as having “botha variance and an event-in-a-process interpretation” (Seddon, 1997, p. 242),and that such “muddled thinking” would be counterproductive for future ISresearch.
Seddon introduced an alternative to the DeLone & McLean IS SuccessModel model in his 1997 respecification. Seddon’s interest in transformingDeLone & McLean’s IS Success model into a variance model was primarilyto facilitate the use of quantitative research techniques. This included theintroduction of four new variables: expectations, consequences, perceived
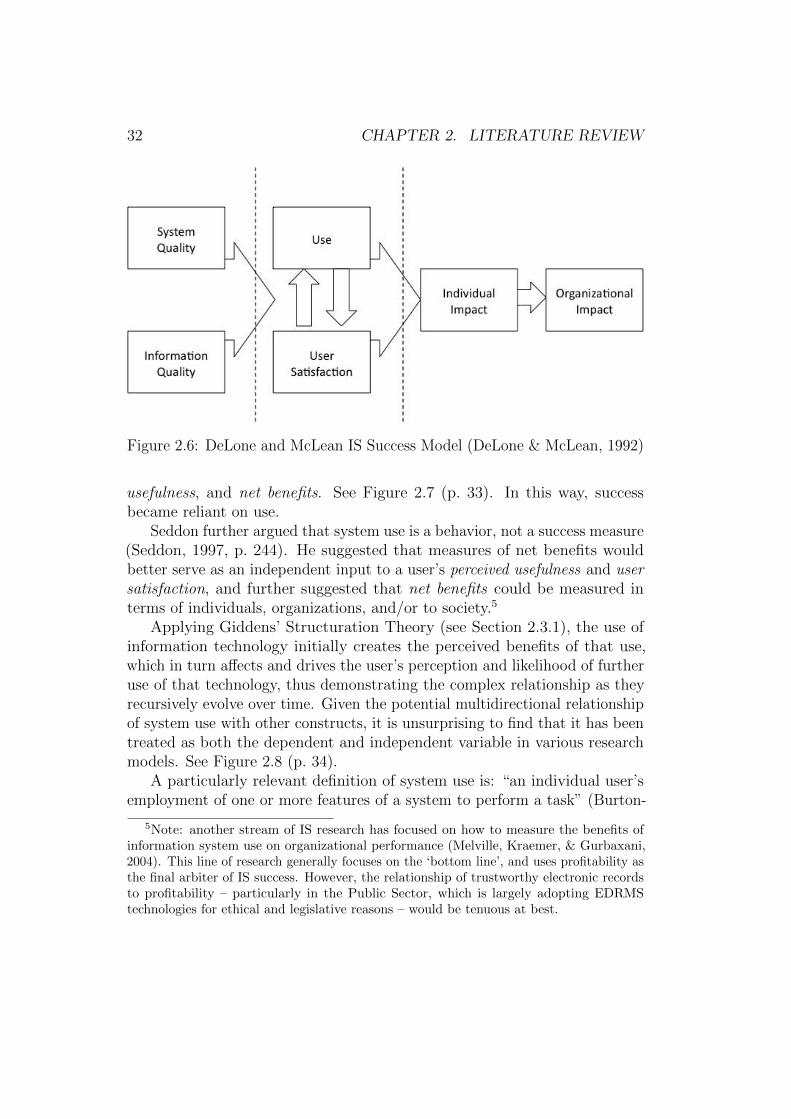
32 CHAPTER 2. LITERATURE REVIEW
Figure 2.6: DeLone and McLean IS Success Model (DeLone & McLean, 1992)
usefulness, and net benefits. See Figure 2.7 (p. 33). In this way, successbecame reliant on use.
Seddon further argued that system use is a behavior, not a success measure(Seddon, 1997, p. 244). He suggested that measures of net benefits wouldbetter serve as an independent input to a user’s perceived usefulness and usersatisfaction, and further suggested that net benefits could be measured interms of individuals, organizations, and/or to society.5
Applying Giddens’ Structuration Theory (see Section 2.3.1), the use ofinformation technology initially creates the perceived benefits of that use,which in turn affects and drives the user’s perception and likelihood of furtheruse of that technology, thus demonstrating the complex relationship as theyrecursively evolve over time. Given the potential multidirectional relationshipof system use with other constructs, it is unsurprising to find that it has beentreated as both the dependent and independent variable in various researchmodels. See Figure 2.8 (p. 34).
A particularly relevant definition of system use is: “an individual user’semployment of one or more features of a system to perform a task” (Burton-
5Note: another stream of IS research has focused on how to measure the benefits ofinformation system use on organizational performance (Melville, Kraemer, & Gurbaxani,2004). This line of research generally focuses on the ‘bottom line’, and uses profitability asthe final arbiter of IS success. However, the relationship of trustworthy electronic recordsto profitability – particularly in the Public Sector, which is largely adopting EDRMStechnologies for ethical and legislative reasons – would be tenuous at best.
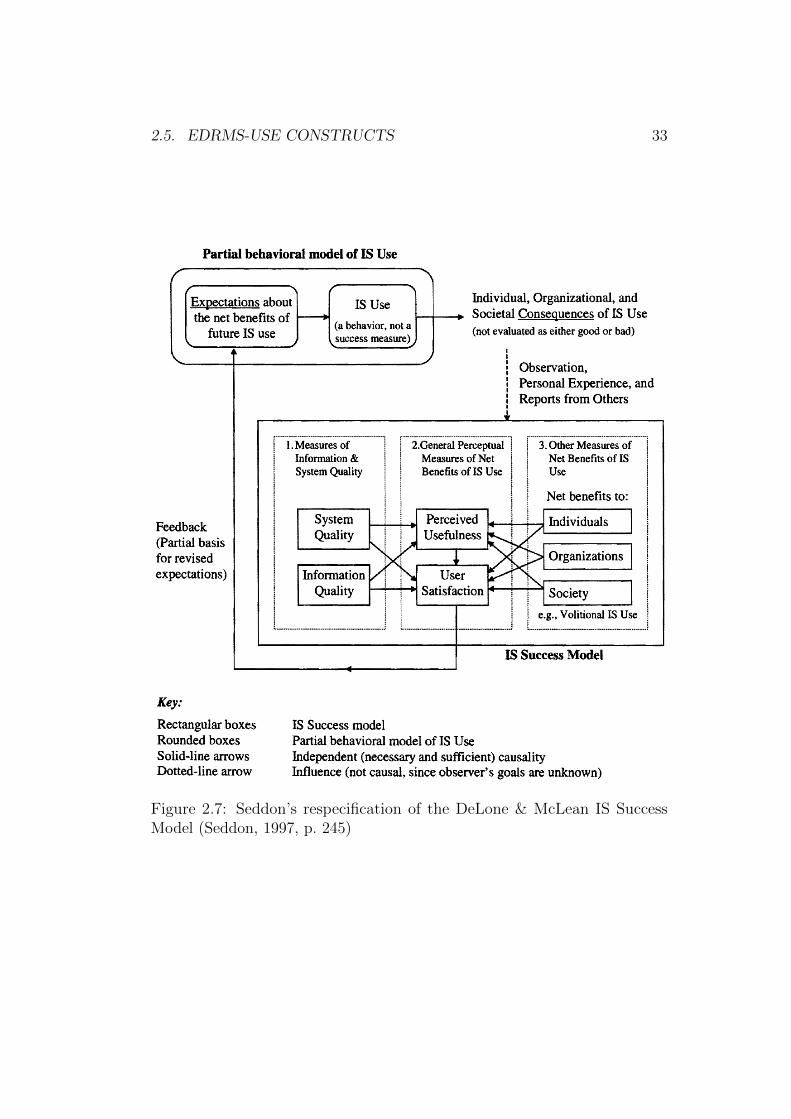
2.5. EDRMS-USE CONSTRUCTS 33
Figure 2.7: Seddon’s respecification of the DeLone & McLean IS SuccessModel (Seddon, 1997, p. 245)
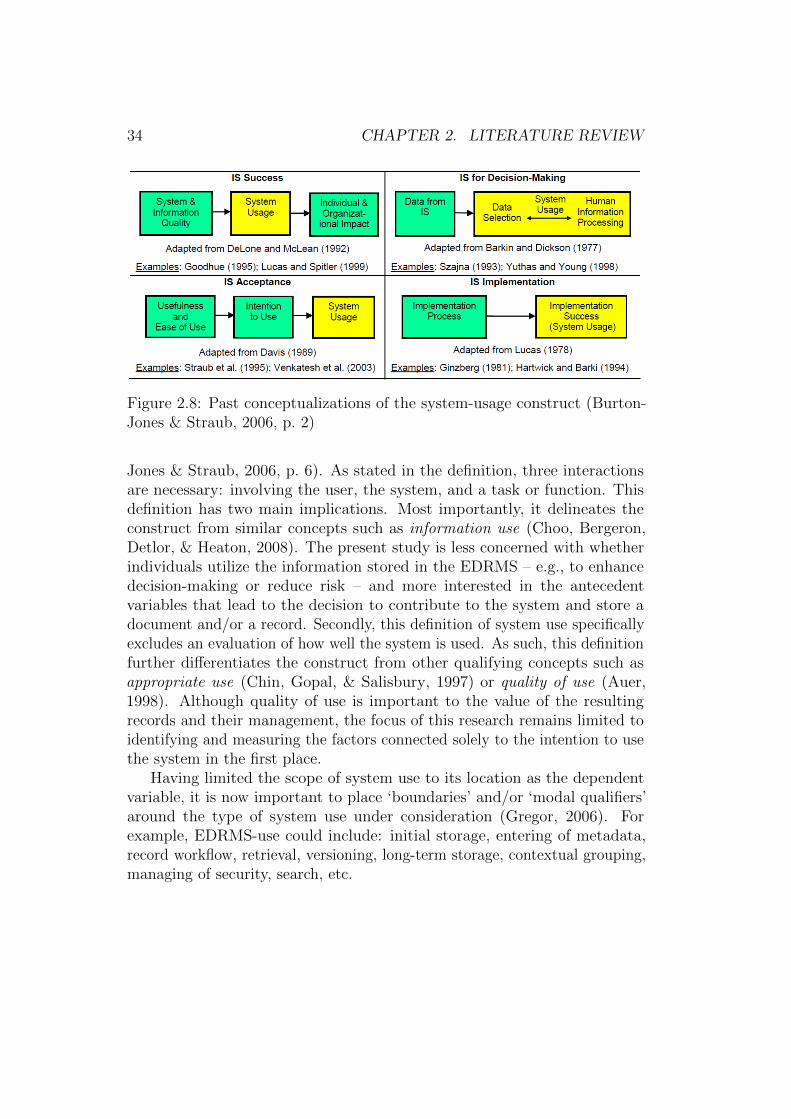
34 CHAPTER 2. LITERATURE REVIEW
Figure 2.8: Past conceptualizations of the system-usage construct (Burton-Jones & Straub, 2006, p. 2)
Jones & Straub, 2006, p. 6). As stated in the definition, three interactionsare necessary: involving the user, the system, and a task or function. Thisdefinition has two main implications. Most importantly, it delineates theconstruct from similar concepts such as information use (Choo, Bergeron,Detlor, & Heaton, 2008). The present study is less concerned with whetherindividuals utilize the information stored in the EDRMS – e.g., to enhancedecision-making or reduce risk – and more interested in the antecedentvariables that lead to the decision to contribute to the system and store adocument and/or a record. Secondly, this definition of system use specificallyexcludes an evaluation of how well the system is used. As such, this definitionfurther differentiates the construct from other qualifying concepts such asappropriate use (Chin, Gopal, & Salisbury, 1997) or quality of use (Auer,1998). Although quality of use is important to the value of the resultingrecords and their management, the focus of this research remains limited toidentifying and measuring the factors connected solely to the intention to usethe system in the first place.
Having limited the scope of system use to its location as the dependentvariable, it is now important to place ‘boundaries’ and/or ‘modal qualifiers’around the type of system use under consideration (Gregor, 2006). Forexample, EDRMS-use could include: initial storage, entering of metadata,record workflow, retrieval, versioning, long-term storage, contextual grouping,managing of security, search, etc.
2.5. EDRMS-USE CONSTRUCTS 35
Ashton and Reed (2011) simplified the EDRMS-use options by consideringwhen and how the users interact with records:
There are two major intersections of users and recordkeeping. Thefirst is putting records into the system, and the second is searchand retrieval to find and use existing records. These do not haveto work on the same paradigm. Different mechanisms can beconstructed to support both (Ashton & Reed, 2011, p. 7).
To help focus the research, and to avoid excessive attention on individualrecordkeeping processes or functions, system use will focus primarily on theact of contribution; however, measurement of the construct will use publishedmeasurement items where possible and appropriate and will include additionalaspects of use that are specific to electronic recordkeeping systems.
Unfortunately, actual usage data is extremely difficult to obtain from largeorganizations. Nonetheless, a number of earlier studies have demonstratedthat actual usage behavior and behavioral intention are highly correlated(Fishbein & Ajzen, 1975; Davis, Bagozzi, & Warshaw, 1989; Dishaw & Strong,1999; Turner, Kitchenham, Brereton, Charters, & Budgen, 2010). In asystematic review of 79 relevant empirical studies, Turner et al. (2010) foundthat behavioral intention to use was likely correlated with actual use, andthis finding supports the relationship initially posited by Fishbein and Ajzen(1975). The implication is that a user’s intention to use can be measured andused as a suitable and reliable proxy for their actual system use behavior.
In many of the above system use models, an intention to act also impliesunconstrained freedom to choose. However, in practice, constraints such aslimited ability, time, environmental or organizational factors, and unconscioushabits will limit this freedom (Wilkins et al., 2009b, p. 55).
2.5.2 Determinants of System Use
Next to be considered are factors that may affect system use (or ratherintention to use). The literature provides a number of conceptual areas(including models and constructs) that warrant attention.
Primarily, an EDRMS is an enterprise-class technology system. Therefore,an individual’s willingness to use that technology must be considered onpar with any other technology system (see Technology Acceptance below).Secondly, electronic recordkeeping technologies are necessarily used in anorganizational context, so social conditions specific to the organization and

36 CHAPTER 2. LITERATURE REVIEW
their combined impact on the user are next considered (see OrganizationalContext on p. 45). Finally, the interpretation required to value electronicrecords and the process of recordkeeping are considered (see KnowledgeInterpretation on p. 50).
Technology Acceptance
Technology acceptance is an area of IS theory that attempts to model howusers come to accept and use a technology. Figure 2.9 reproduces Davis’original Technology Acceptance Model (TAM) (Davis, 1986). TAM is one ofthe most influential theories in technology systems adoption and use behaviorresearch (Venkatesh & Davis, 2000; Venkatesh et al., 2003; Wilkins et al.,2009b) and was adapted from Ajzen and Fishbein (1980)’s Theory of ReasonedAction (TRA) (Venkatesh & Davis, 2000).
Figure 2.9: The Technology Acceptance Model (TAM) (Davis, 1986, p. 24)
The Technology Acceptance Model is based on the observation that anactual behavior (e.g., system use or ‘tool use’) is highly correlated with theintention to perform the behavior (Turner et al., 2010; Dishaw & Strong,1999; Bagozzi, 1982). Furthermore, the intention to perform the behavior isdetermined by the user’s perception of the technology’s usefulness and itsease of use. These two constructs form the basis for one’s attitude toward use,which loads onto one’s intention to use and, ultimately, use. As a model, TAMconsistently explains a large proportion of the variance in use-intentions andultimately use-behavior across all time frames, with the explained varianceregularly approaching 40 percent (Venkatesh & Davis, 2000, p. 186).
2.5. EDRMS-USE CONSTRUCTS 37
However, the model is not without its detractors. For example, whencommenting on the application of TAM to practical situations as part ofan open-ended survey, Dennis commented: “imagine talking to a managerand saying that to be adopted, technology must be useful and easy to use.I imagine the reaction would be ‘Duh!’ The more important questions arewhat makes technology useful and easy to use” (Y. Lee, Kozar, & Larsen,2003, p. 766).
Nonetheless, this research submits that the ability to identify usefulnessand/or ease of use as issues in getting a particular technology acceptedwill help practitioners to begin to narrow the search for the source of theunderlying acceptance problem(s).
In the 1990s, TAM enjoyed a significant amount of attention in the ISresearch community as other researchers sought to replicate (and validate)Davis’s original study and provide additional empirical evidence relatingperceived usefulness, perceived ease of use, and system use. This includedreplication of the original study with improved analysis tools such as test-retestscenarios (Hendrickson, Massey, & Cronan, 1993) and structural equationmodeling (SEM) (Adams, Nelson, & Todd, 1992),6 as well as studies thatfocused on providing the theoretical underpinning of the relative importanceof TAM constructs; that is, perceived usefulness and perceived ease of use(Karahanna & Straub, 1999).
The results of TAM under SEM scrutiny supported the model’s strengths,but also detected some possible weaknesses in several measurement itemswhen used in different contexts. The established TAM measurement itemswere then studied with more rigor, using newer, sensitive statistical methods.Segars and Grover (1993, p. 525) found that indeed the measurement items didload differently on the two primary TAM constructs under different contexts.They concluded:
Such findings in no way diminish the value of Davis’ (1989) originalscales or the value of identifying measures that explain technologyacceptance. Instead, they challenge the IS community to furtherexplore the nature and specific influences of factors that may alterthe “user perception-usage” equation.
In an effort to further explore the “user perception-usage” equation,Venkatesh and Davis created TAM2 – see Figure 2.10 (p. 39) – which was anextension to the TAM model with a focus on additional determinants and
6For more information on Structural Equation Modeling, see Section 7.4 on p. 162.
38 CHAPTER 2. LITERATURE REVIEW
modifiers to perceived usefulness (Venkatesh & Davis, 2000). In 2003, thiswas followed by a massive reformulation of the technology acceptance modelinto the Unified Theory of Acceptance and Use of Technology (UTAUT)(Venkatesh et al., 2003). UTAUT is reproduced in Figure 2.11 (p. 41).
In 2007, the Journal of the Association for Information Systems (JAIS)featured a special issue focusing on the theoretical implications of TAM(including versions such as UTAUT). Benbasat and Barki (2007) acknowledgedthat perceived usefulness and perceived ease of use are influential constructs“almost to the point of certainty”; however, they declared that the “key problemwith TAM could be described as a focus on a middle range theory that providesa potentially useful bridge to antecedents and consequences of adoption, butthe bridge seems to have become an end in itself” (Benbasat & Barki, 2007,p. 216). Straub and Burton-Jones (2007) agreed that the focus on TAMconstructs has limited research into other aspects of technology acceptanceand use, but they took exception to the assertion that TAM was ‘unassailable’by pointing out the unresolved risk of common method bias7 among themajority of empirical TAM studies. Goodhue (2007) further commented thatTAM studies are generally quite static, while business processes and theirsupport systems are naturally undergoing change. This raises the questionof “how to design (and redesign) tasks at the same time as designing (andredesigning) information system” (Goodhue, 2007, p. 221), thus highlightinganother potential weakness in TAM in that its approach “does not encourageus to think about these larger contexts.”
In 2008, Venkatesh returned to TAM (partially in response to the JAISspecial issue) with the addition of a new direction of extension into thedeterminants of perceived ease of use resulting in TAM3 (Venkatesh & Bala,2008). TAM3 is reproduced in Figure 2.12 (p. 43).
In the next two sections, the Technology Acceptance Model’s two primarydeterminants of system use constructs, perceived usefulness and perceived easeof use are covered in more detail, including examples of how they have beenapproached via the various models and analysis techniques referenced above.
Perceived usefulness In the original Technology Acceptance Model (TAM),Davis tested the construct perceived usefulness in two studies and found that
7Common method bias – or common method variance (CMV) – is “variance thatis attributable to the measurement method rather than to the constructs the measuresrepresent” (Podsakoff, MacKenzie, Lee, & Podsakoff, 2003, p. 879). Steps taken to mitigatethe risk of CMV in this research are addressed in Section 4.4.2 on p. 79.
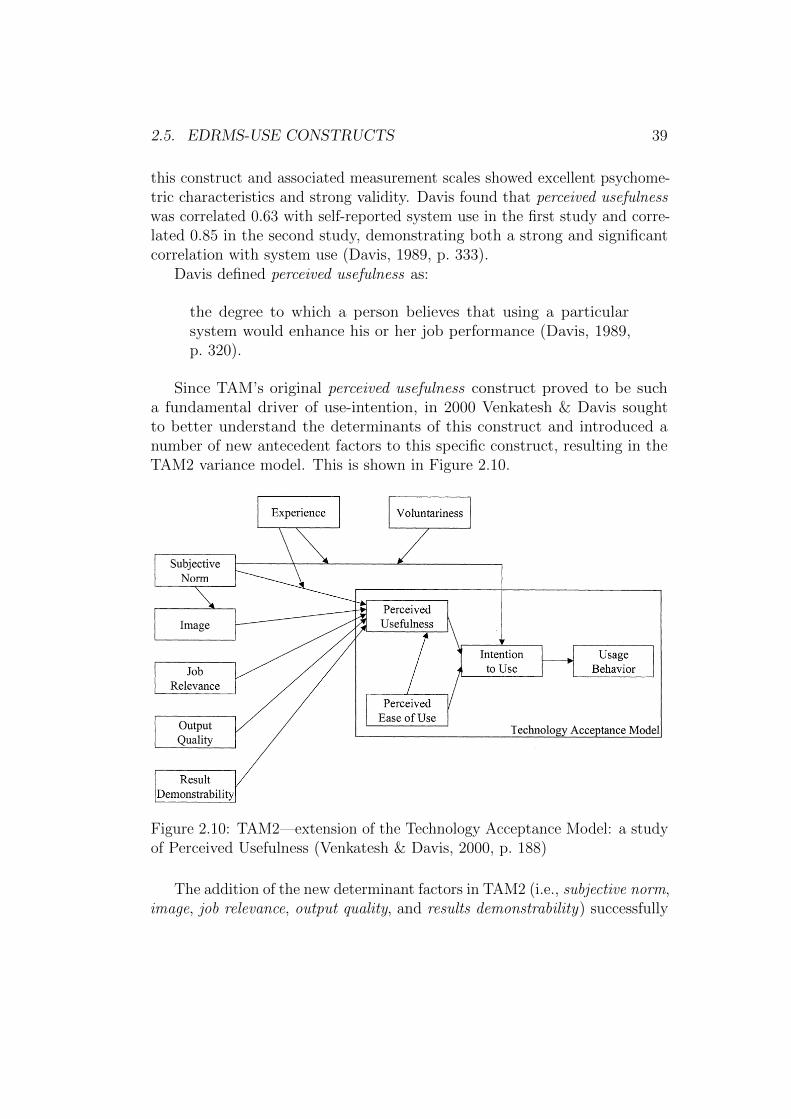
2.5. EDRMS-USE CONSTRUCTS 39
this construct and associated measurement scales showed excellent psychome-tric characteristics and strong validity. Davis found that perceived usefulnesswas correlated 0.63 with self-reported system use in the first study and corre-lated 0.85 in the second study, demonstrating both a strong and significantcorrelation with system use (Davis, 1989, p. 333).
Davis defined perceived usefulness as:
the degree to which a person believes that using a particularsystem would enhance his or her job performance (Davis, 1989,p. 320).
Since TAM’s original perceived usefulness construct proved to be sucha fundamental driver of use-intention, in 2000 Venkatesh & Davis soughtto better understand the determinants of this construct and introduced anumber of new antecedent factors to this specific construct, resulting in theTAM2 variance model. This is shown in Figure 2.10.
Figure 2.10: TAM2—extension of the Technology Acceptance Model: a studyof Perceived Usefulness (Venkatesh & Davis, 2000, p. 188)
The addition of the new determinant factors in TAM2 (i.e., subjective norm,image, job relevance, output quality, and results demonstrability) successfully
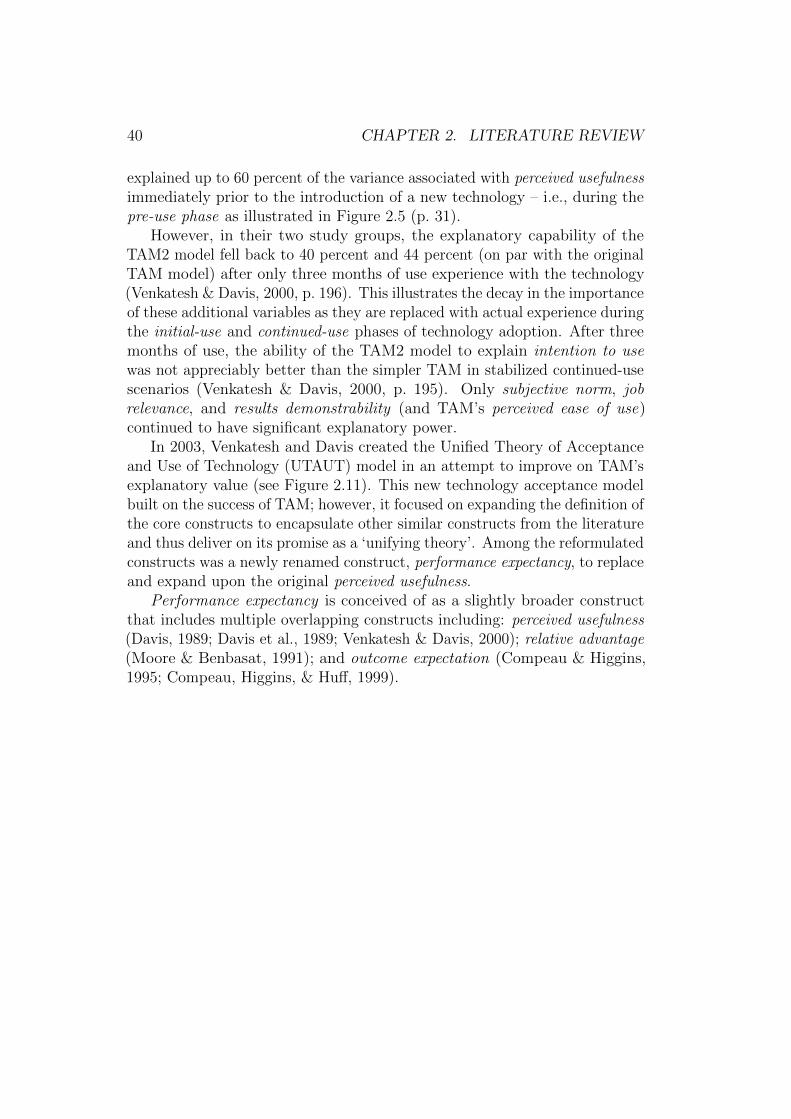
40 CHAPTER 2. LITERATURE REVIEW
explained up to 60 percent of the variance associated with perceived usefulnessimmediately prior to the introduction of a new technology – i.e., during thepre-use phase as illustrated in Figure 2.5 (p. 31).
However, in their two study groups, the explanatory capability of theTAM2 model fell back to 40 percent and 44 percent (on par with the originalTAM model) after only three months of use experience with the technology(Venkatesh & Davis, 2000, p. 196). This illustrates the decay in the importanceof these additional variables as they are replaced with actual experience duringthe initial-use and continued-use phases of technology adoption. After threemonths of use, the ability of the TAM2 model to explain intention to usewas not appreciably better than the simpler TAM in stabilized continued-usescenarios (Venkatesh & Davis, 2000, p. 195). Only subjective norm, jobrelevance, and results demonstrability (and TAM’s perceived ease of use)continued to have significant explanatory power.
In 2003, Venkatesh and Davis created the Unified Theory of Acceptanceand Use of Technology (UTAUT) model in an attempt to improve on TAM’sexplanatory value (see Figure 2.11). This new technology acceptance modelbuilt on the success of TAM; however, it focused on expanding the definition ofthe core constructs to encapsulate other similar constructs from the literatureand thus deliver on its promise as a ‘unifying theory’. Among the reformulatedconstructs was a newly renamed construct, performance expectancy, to replaceand expand upon the original perceived usefulness.
Performance expectancy is conceived of as a slightly broader constructthat includes multiple overlapping constructs including: perceived usefulness(Davis, 1989; Davis et al., 1989; Venkatesh & Davis, 2000); relative advantage(Moore & Benbasat, 1991); and outcome expectation (Compeau & Higgins,1995; Compeau, Higgins, & Huff, 1999).
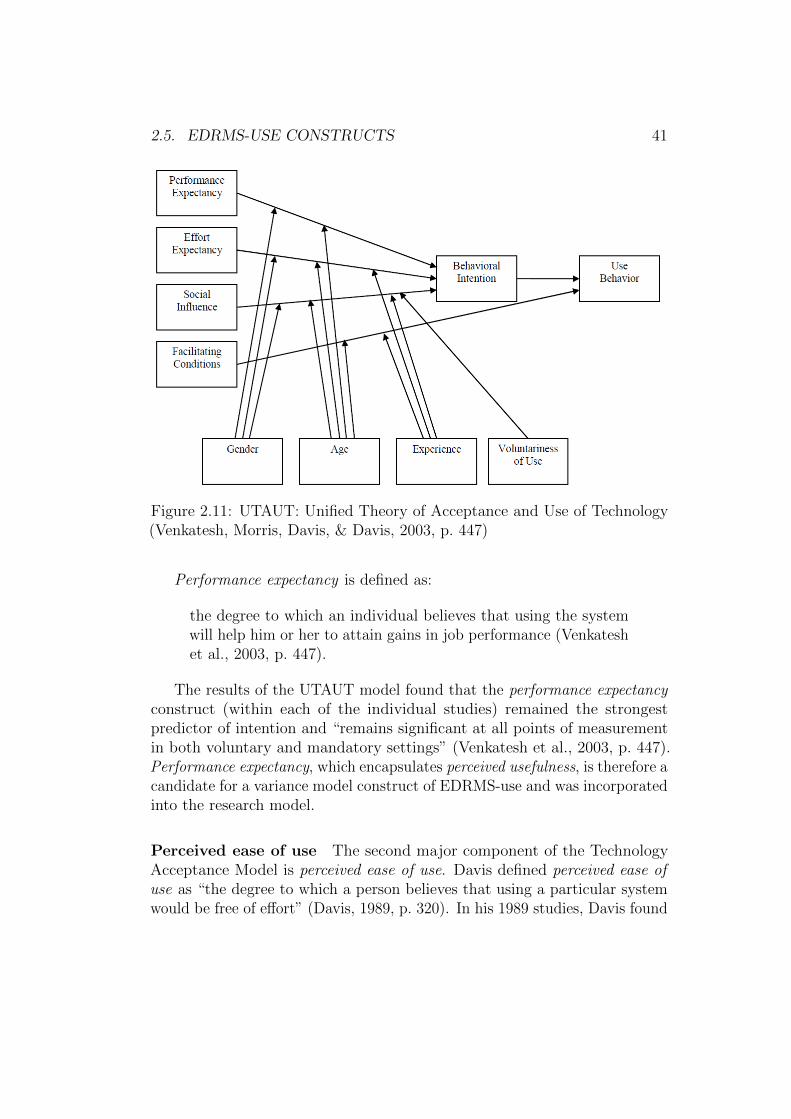
2.5. EDRMS-USE CONSTRUCTS 41
Figure 2.11: UTAUT: Unified Theory of Acceptance and Use of Technology(Venkatesh, Morris, Davis, & Davis, 2003, p. 447)
Performance expectancy is defined as:
the degree to which an individual believes that using the systemwill help him or her to attain gains in job performance (Venkateshet al., 2003, p. 447).
The results of the UTAUT model found that the performance expectancyconstruct (within each of the individual studies) remained the strongestpredictor of intention and “remains significant at all points of measurementin both voluntary and mandatory settings” (Venkatesh et al., 2003, p. 447).Performance expectancy, which encapsulates perceived usefulness, is therefore acandidate for a variance model construct of EDRMS-use and was incorporatedinto the research model.
Perceived ease of use The second major component of the TechnologyAcceptance Model is perceived ease of use. Davis defined perceived ease ofuse as “the degree to which a person believes that using a particular systemwould be free of effort” (Davis, 1989, p. 320). In his 1989 studies, Davis found
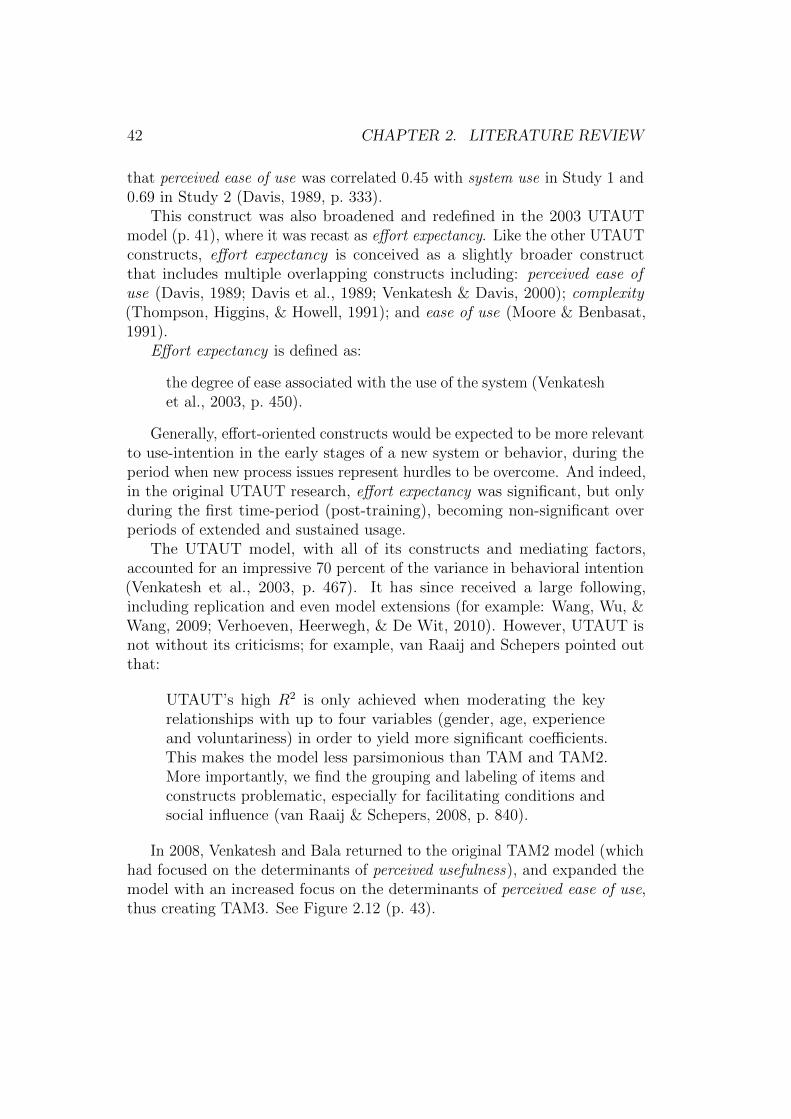
42 CHAPTER 2. LITERATURE REVIEW
that perceived ease of use was correlated 0.45 with system use in Study 1 and0.69 in Study 2 (Davis, 1989, p. 333).
This construct was also broadened and redefined in the 2003 UTAUTmodel (p. 41), where it was recast as effort expectancy. Like the other UTAUTconstructs, effort expectancy is conceived as a slightly broader constructthat includes multiple overlapping constructs including: perceived ease ofuse (Davis, 1989; Davis et al., 1989; Venkatesh & Davis, 2000); complexity(Thompson, Higgins, & Howell, 1991); and ease of use (Moore & Benbasat,1991).
Effort expectancy is defined as:
the degree of ease associated with the use of the system (Venkateshet al., 2003, p. 450).
Generally, effort-oriented constructs would be expected to be more relevantto use-intention in the early stages of a new system or behavior, during theperiod when new process issues represent hurdles to be overcome. And indeed,in the original UTAUT research, effort expectancy was significant, but onlyduring the first time-period (post-training), becoming non-significant overperiods of extended and sustained usage.
The UTAUT model, with all of its constructs and mediating factors,accounted for an impressive 70 percent of the variance in behavioral intention(Venkatesh et al., 2003, p. 467). It has since received a large following,including replication and even model extensions (for example: Wang, Wu, &Wang, 2009; Verhoeven, Heerwegh, & De Wit, 2010). However, UTAUT isnot without its criticisms; for example, van Raaij and Schepers pointed outthat:
UTAUT’s high R2 is only achieved when moderating the keyrelationships with up to four variables (gender, age, experienceand voluntariness) in order to yield more significant coefficients.This makes the model less parsimonious than TAM and TAM2.More importantly, we find the grouping and labeling of items andconstructs problematic, especially for facilitating conditions andsocial influence (van Raaij & Schepers, 2008, p. 840).
In 2008, Venkatesh and Bala returned to the original TAM2 model (whichhad focused on the determinants of perceived usefulness), and expanded themodel with an increased focus on the determinants of perceived ease of use,thus creating TAM3. See Figure 2.12 (p. 43).
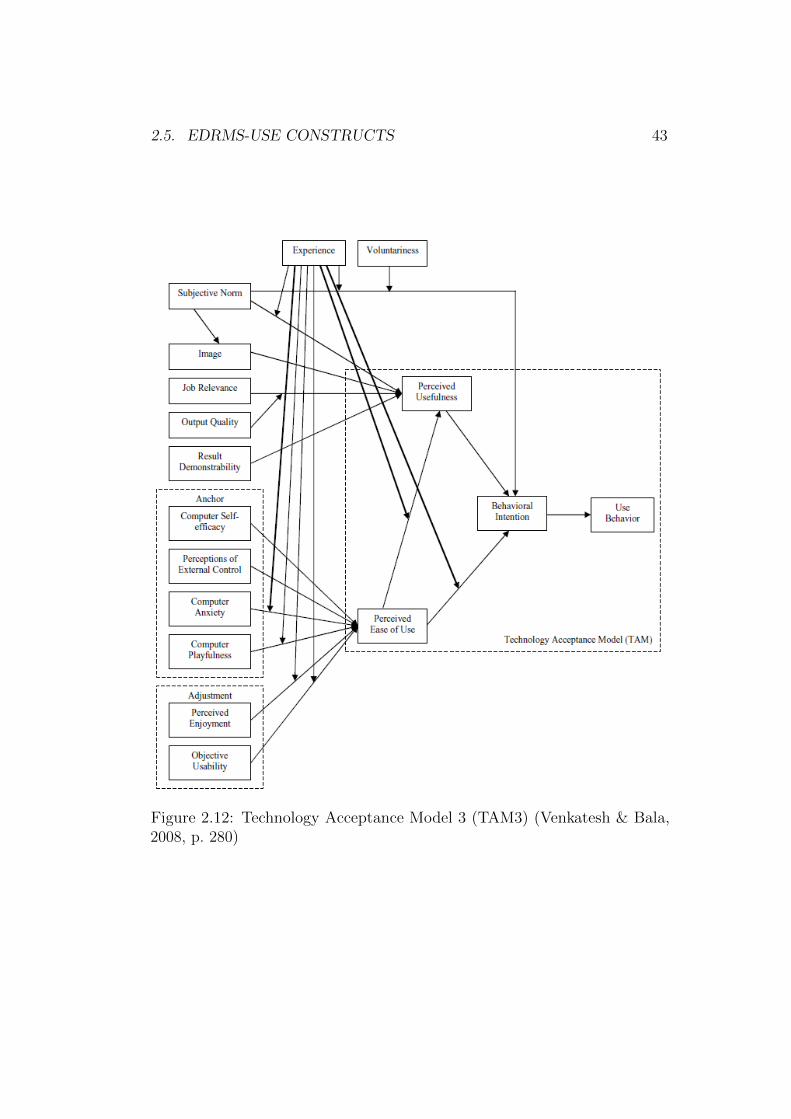
2.5. EDRMS-USE CONSTRUCTS 43
Figure 2.12: Technology Acceptance Model 3 (TAM3) (Venkatesh & Bala,2008, p. 280)
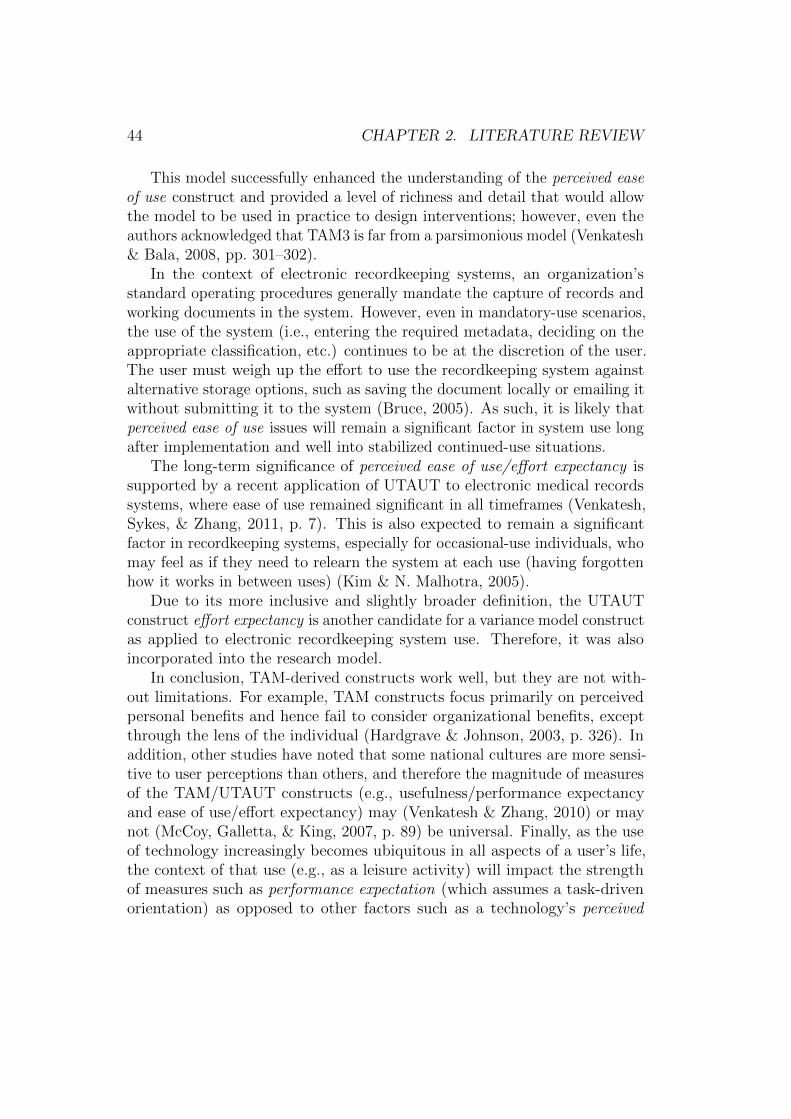
44 CHAPTER 2. LITERATURE REVIEW
This model successfully enhanced the understanding of the perceived easeof use construct and provided a level of richness and detail that would allowthe model to be used in practice to design interventions; however, even theauthors acknowledged that TAM3 is far from a parsimonious model (Venkatesh& Bala, 2008, pp. 301–302).
In the context of electronic recordkeeping systems, an organization’sstandard operating procedures generally mandate the capture of records andworking documents in the system. However, even in mandatory-use scenarios,the use of the system (i.e., entering the required metadata, deciding on theappropriate classification, etc.) continues to be at the discretion of the user.The user must weigh up the effort to use the recordkeeping system againstalternative storage options, such as saving the document locally or emailing itwithout submitting it to the system (Bruce, 2005). As such, it is likely thatperceived ease of use issues will remain a significant factor in system use longafter implementation and well into stabilized continued-use situations.
The long-term significance of perceived ease of use/effort expectancy issupported by a recent application of UTAUT to electronic medical recordssystems, where ease of use remained significant in all timeframes (Venkatesh,Sykes, & Zhang, 2011, p. 7). This is also expected to remain a significantfactor in recordkeeping systems, especially for occasional-use individuals, whomay feel as if they need to relearn the system at each use (having forgottenhow it works in between uses) (Kim & N. Malhotra, 2005).
Due to its more inclusive and slightly broader definition, the UTAUTconstruct effort expectancy is another candidate for a variance model constructas applied to electronic recordkeeping system use. Therefore, it was alsoincorporated into the research model.
In conclusion, TAM-derived constructs work well, but they are not with-out limitations. For example, TAM constructs focus primarily on perceivedpersonal benefits and hence fail to consider organizational benefits, exceptthrough the lens of the individual (Hardgrave & Johnson, 2003, p. 326). Inaddition, other studies have noted that some national cultures are more sensi-tive to user perceptions than others, and therefore the magnitude of measuresof the TAM/UTAUT constructs (e.g., usefulness/performance expectancyand ease of use/effort expectancy) may (Venkatesh & Zhang, 2010) or maynot (McCoy, Galletta, & King, 2007, p. 89) be universal. Finally, as the useof technology increasingly becomes ubiquitous in all aspects of a user’s life,the context of that use (e.g., as a leisure activity) will impact the strengthof measures such as performance expectation (which assumes a task-drivenorientation) as opposed to other factors such as a technology’s perceived
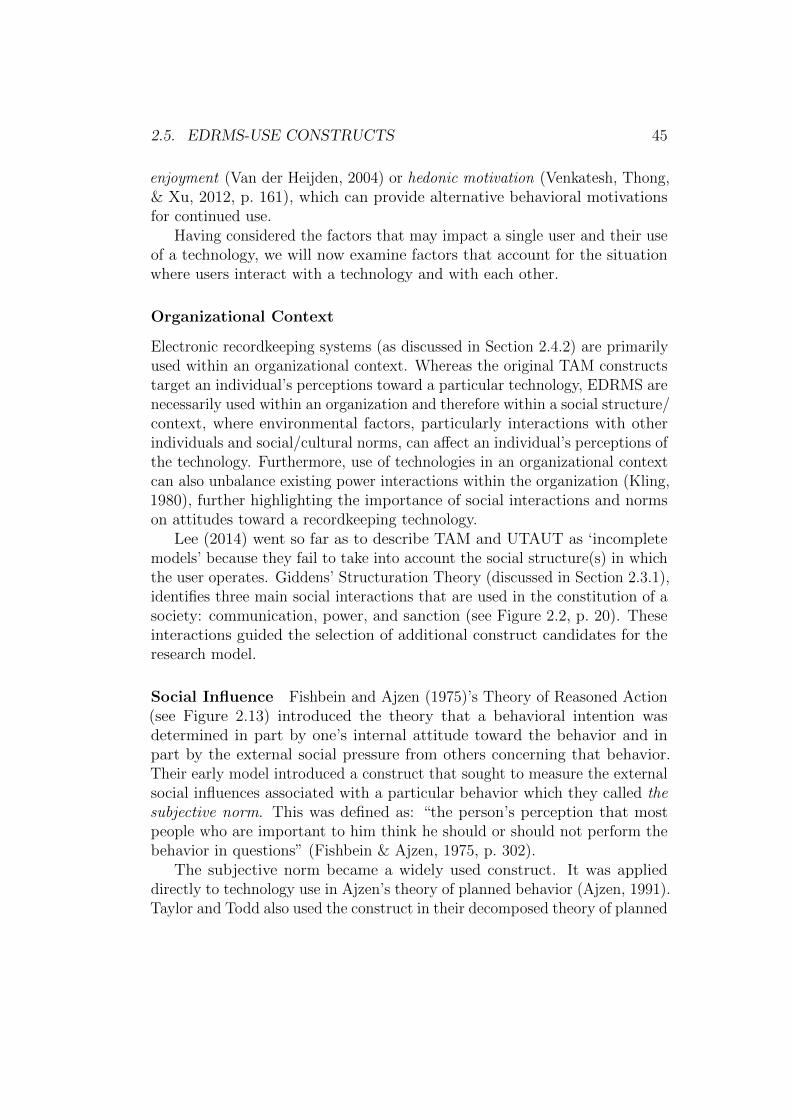
2.5. EDRMS-USE CONSTRUCTS 45
enjoyment (Van der Heijden, 2004) or hedonic motivation (Venkatesh, Thong,& Xu, 2012, p. 161), which can provide alternative behavioral motivationsfor continued use.
Having considered the factors that may impact a single user and their useof a technology, we will now examine factors that account for the situationwhere users interact with a technology and with each other.
Organizational Context
Electronic recordkeeping systems (as discussed in Section 2.4.2) are primarilyused within an organizational context. Whereas the original TAM constructstarget an individual’s perceptions toward a particular technology, EDRMS arenecessarily used within an organization and therefore within a social structure/context, where environmental factors, particularly interactions with otherindividuals and social/cultural norms, can affect an individual’s perceptions ofthe technology. Furthermore, use of technologies in an organizational contextcan also unbalance existing power interactions within the organization (Kling,1980), further highlighting the importance of social interactions and normson attitudes toward a recordkeeping technology.
Lee (2014) went so far as to describe TAM and UTAUT as ‘incompletemodels’ because they fail to take into account the social structure(s) in whichthe user operates. Giddens’ Structuration Theory (discussed in Section 2.3.1),identifies three main social interactions that are used in the constitution of asociety: communication, power, and sanction (see Figure 2.2, p. 20). Theseinteractions guided the selection of additional construct candidates for theresearch model.
Social Influence Fishbein and Ajzen (1975)’s Theory of Reasoned Action(see Figure 2.13) introduced the theory that a behavioral intention wasdetermined in part by one’s internal attitude toward the behavior and inpart by the external social pressure from others concerning that behavior.Their early model introduced a construct that sought to measure the externalsocial influences associated with a particular behavior which they called thesubjective norm. This was defined as: “the person’s perception that mostpeople who are important to him think he should or should not perform thebehavior in questions” (Fishbein & Ajzen, 1975, p. 302).
The subjective norm became a widely used construct. It was applieddirectly to technology use in Ajzen’s theory of planned behavior (Ajzen, 1991).Taylor and Todd also used the construct in their decomposed theory of planned
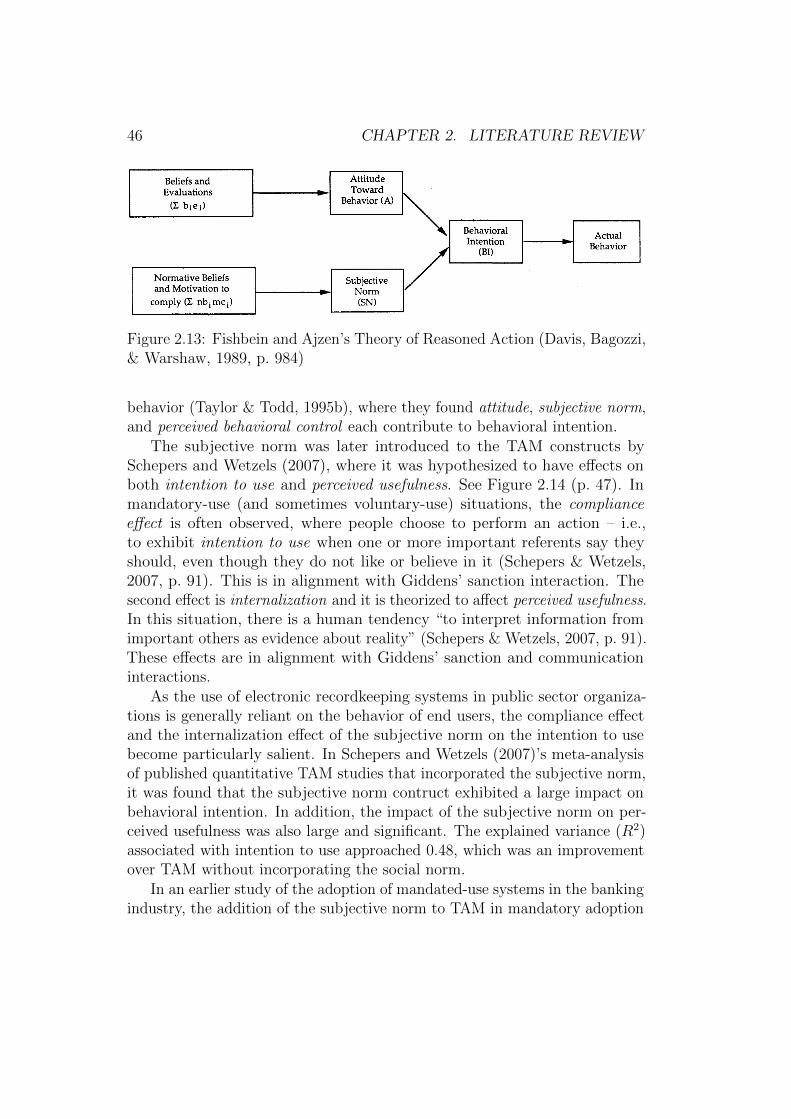
46 CHAPTER 2. LITERATURE REVIEW
Figure 2.13: Fishbein and Ajzen’s Theory of Reasoned Action (Davis, Bagozzi,& Warshaw, 1989, p. 984)
behavior (Taylor & Todd, 1995b), where they found attitude, subjective norm,and perceived behavioral control each contribute to behavioral intention.
The subjective norm was later introduced to the TAM constructs bySchepers and Wetzels (2007), where it was hypothesized to have effects onboth intention to use and perceived usefulness. See Figure 2.14 (p. 47). Inmandatory-use (and sometimes voluntary-use) situations, the complianceeffect is often observed, where people choose to perform an action – i.e.,to exhibit intention to use when one or more important referents say theyshould, even though they do not like or believe in it (Schepers & Wetzels,2007, p. 91). This is in alignment with Giddens’ sanction interaction. Thesecond effect is internalization and it is theorized to affect perceived usefulness.In this situation, there is a human tendency “to interpret information fromimportant others as evidence about reality” (Schepers & Wetzels, 2007, p. 91).These effects are in alignment with Giddens’ sanction and communicationinteractions.
As the use of electronic recordkeeping systems in public sector organiza-tions is generally reliant on the behavior of end users, the compliance effectand the internalization effect of the subjective norm on the intention to usebecome particularly salient. In Schepers and Wetzels (2007)’s meta-analysisof published quantitative TAM studies that incorporated the subjective norm,it was found that the subjective norm contruct exhibited a large impact onbehavioral intention. In addition, the impact of the subjective norm on per-ceived usefulness was also large and significant. The explained variance (R2)associated with intention to use approached 0.48, which was an improvementover TAM without incorporating the social norm.
In an earlier study of the adoption of mandated-use systems in the bankingindustry, the addition of the subjective norm to TAM in mandatory adoption
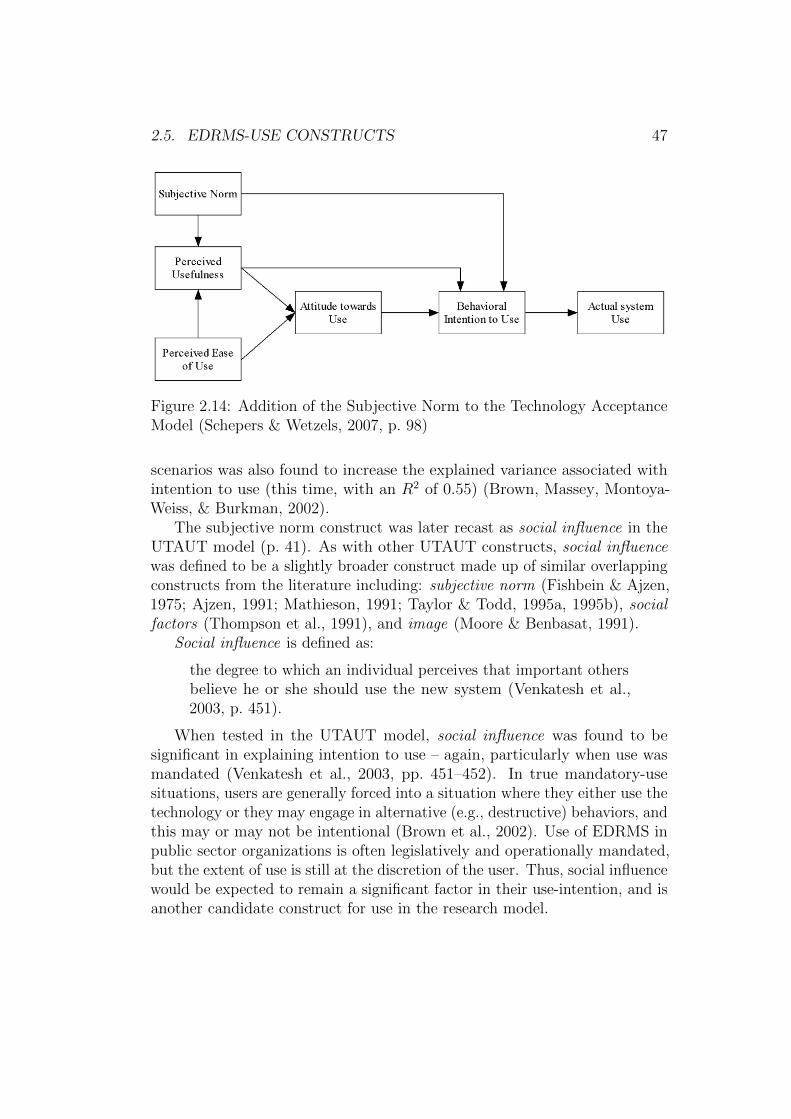
2.5. EDRMS-USE CONSTRUCTS 47
Figure 2.14: Addition of the Subjective Norm to the Technology AcceptanceModel (Schepers & Wetzels, 2007, p. 98)
scenarios was also found to increase the explained variance associated withintention to use (this time, with an R2 of 0.55) (Brown, Massey, Montoya-Weiss, & Burkman, 2002).
The subjective norm construct was later recast as social influence in theUTAUT model (p. 41). As with other UTAUT constructs, social influencewas defined to be a slightly broader construct made up of similar overlappingconstructs from the literature including: subjective norm (Fishbein & Ajzen,1975; Ajzen, 1991; Mathieson, 1991; Taylor & Todd, 1995a, 1995b), socialfactors (Thompson et al., 1991), and image (Moore & Benbasat, 1991).
Social influence is defined as:
the degree to which an individual perceives that important othersbelieve he or she should use the new system (Venkatesh et al.,2003, p. 451).
When tested in the UTAUT model, social influence was found to besignificant in explaining intention to use – again, particularly when use wasmandated (Venkatesh et al., 2003, pp. 451–452). In true mandatory-usesituations, users are generally forced into a situation where they either use thetechnology or they may engage in alternative (e.g., destructive) behaviors, andthis may or may not be intentional (Brown et al., 2002). Use of EDRMS inpublic sector organizations is often legislatively and operationally mandated,but the extent of use is still at the discretion of the user. Thus, social influencewould be expected to remain a significant factor in their use-intention, and isanother candidate construct for use in the research model.
48 CHAPTER 2. LITERATURE REVIEW
Social influence would be expected to vary depending on local culturalnorms. In a comparison of Western versus non-Western studies, the subjectivenorm had a slightly larger effect on intention-to-use in Western studies(Schepers & Wetzels, 2007, p. 100); and in a US versus China study, UTAUT(which included social influence) was found to ‘work differently’ in China,where there are generally stronger collective pressures to conform (Venkatesh& Zhang, 2010).
In considering Giddens’ Structuration Theory, it is argued that socialinfluence incorporates two of the three main societal interactions. Thecompliance effect satisfied Giddens’ sanction interaction, while internalizationsatisfied the communication interaction. This leaves the final interaction:power.
Perceived Power Security Knowledge management systems (KMS), whichare similar to electronic document management systems, have the capabilityof incorporating Giddens’ structure of domination via the interaction of power(refer to Figure 2.2, p. 20). In this context, two kinds of power over resourcesare manifested: authoritative – power extending over people; and allocative –power extending over objects or materials (Orlikowski, 1992, p. 405).
EDRMS technologies (particularly when newly implemented) have thepotential to disrupt both. First, by increasing the transparency of individuals’contributions to the EDRMS and making them accessible to the organization,managers and peers can access and potentially judge the work of individuals.Second, by centralizing recordkeeping into an EDRMS, individuals withallocative power over legacy systems and/or control over individual documentsmay perceive a loss of power to those who administer and manage the EDRMsystem. Furthermore, these feelings may become entrenched and be exhibitedlong into the continued-use phase (p. 31).
The ability of information technology systems to centralize and changepower ownership within organizations has been studied for some time (Kling,1980). In terms of power shifts (i.e., loss of security) associated with theintroduction of new technology systems, the more negative the expectationsof employees, the more negative are their reactions, including apprehension,anxiety, stress, and fear (Martinko, Henry, & Zmud, 1996). The intensityof these emotions can affect one’s intention to use a technology, as wellas impacting the technology’s perceived ease of use (Hackbarth, Grover, &Yi, 2003). This continuum of emotion has been captured in the construct:perceived power security.
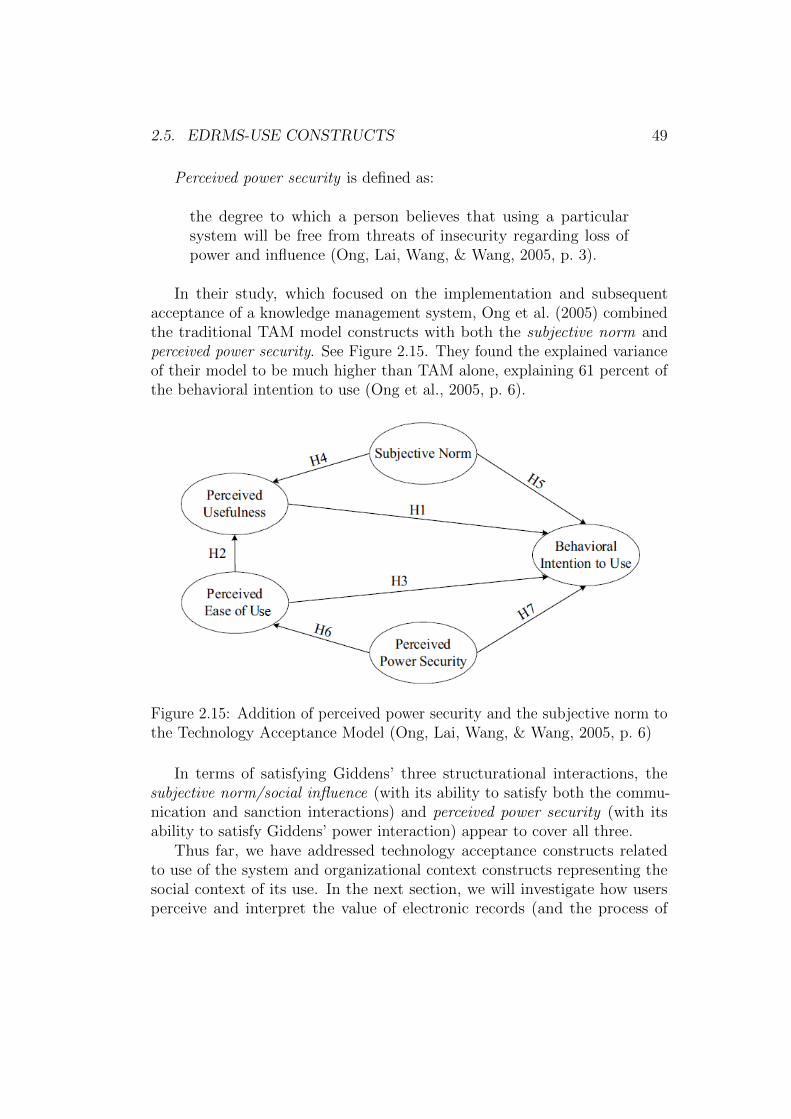
2.5. EDRMS-USE CONSTRUCTS 49
Perceived power security is defined as:
the degree to which a person believes that using a particularsystem will be free from threats of insecurity regarding loss ofpower and influence (Ong, Lai, Wang, & Wang, 2005, p. 3).
In their study, which focused on the implementation and subsequentacceptance of a knowledge management system, Ong et al. (2005) combinedthe traditional TAM model constructs with both the subjective norm andperceived power security. See Figure 2.15. They found the explained varianceof their model to be much higher than TAM alone, explaining 61 percent ofthe behavioral intention to use (Ong et al., 2005, p. 6).
Figure 2.15: Addition of perceived power security and the subjective norm tothe Technology Acceptance Model (Ong, Lai, Wang, & Wang, 2005, p. 6)
In terms of satisfying Giddens’ three structurational interactions, thesubjective norm/social influence (with its ability to satisfy both the commu-nication and sanction interactions) and perceived power security (with itsability to satisfy Giddens’ power interaction) appear to cover all three.
Thus far, we have addressed technology acceptance constructs relatedto use of the system and organizational context constructs representing thesocial context of its use. In the next section, we will investigate how usersperceive and interpret the value of electronic records (and the process of

50 CHAPTER 2. LITERATURE REVIEW
recordkeeping) and how the importance assigned to these records (and theinformation they contain) may impact on the users’ willingness to use thesystem.
Knowledge Interpretation
EDRMS require end users to add contextual metadata when entering theirdocuments into the system or when declaring those documents as records.As discussed in Section 2.2, the creation and tracking of these document-specific contextual metadata are fundamentally what differentiates documentsfrom records; however, this prerequisite necessarily requires additional un-derstanding and effort on the part of end users. Therefore, the contributionof documents into an EDRMS requires both a user’s willing participationand their interpretation as to what is record-worthy. Although there is con-tinuing research into how to remove the need for voluntary participation inthe capture of contextual recordkeeping metadata (Bailey, 2007, 2009), theneed for user participation is likely to remain, as will the challenges involvedin obtaining and maintaining the participation of end users (Kettunen &Henttonen, 2010).
J. Klein, Connell, and Jasimuddin (2007), while reviewing the organiza-tional memory literature,8 noted that the literature predominantly paints apicture of organizational memory as a repository that is essential for orga-nizational effectiveness. However, the authors also note that depending onthe user’s frame of reference, retention of detailed documents and recordsis not necessarily an unqualified good (J. Klein et al., 2007). For example,organizations with a strong knowledge of previous events and solutions may,to their detriment, be less likely to try new and creative solutions. Thus, usersmay view the value of records differently, depending on how an organizationuses and interprets that repository of information, experience, and knowledge.In other words, the value that an end user places on their organization’srecords repository is expected to influence their willingness to participate inrecordkeeping activities.
The quantification of the term value becomes more complicated when oneacknowledges that it can have different meanings for different people. Exam-ples of different types of value include: utility, social significance, emotional,and spiritual (Boztepe, 2007), with measurement scales including continuums
8Organizational Memory refers to several structures and mechanisms that store andreflect previous events and decisions within an organization (including the structuresconsisting of records and documents). See Walsh and Ungson (1991).
2.5. EDRMS-USE CONSTRUCTS 51
such as extrinsic/intrinsic value, active/reactive value, and self-oriented/other-oriented measures of value (Holbrook, 1999). In order to measure the valueof records, it is important to locate and define potential sources of value inthe mind of the user, particularly as it applies to information and knowledge.
To help explore these core value assumptions, J. Klein et al. (2007) lookedto a four-paradigm framework adapted for knowledge management by Schultzeand Stabell (2004), which was in turn based on a framework developed byBurrell and Morgan in 1979.
Burrell and Morgan had created a two-dimensional framework to exploresociological paradigms in organizations. Their ontological dimension (subjec-tivity to objectivity) was combined with a social order dimension (sociologiesof regulation to radical change), and thereby created a 2x2 grid of sociologi-cal paradigms that the authors labeled functionalist, interpretivist, radicalstructuralist, and radical humanist paradigms (Burrell & Morgan, 1979).
In 1996, Deetz recast Burrell and Morgan’s framework’s social orderdimension to instead contrast consensus and dissensus within the organization(Deetz, 1996). Consensus reflects a social order based on trust and the commongood, where science and/or knowledge is seen as neutral and a ‘hegemonicorder’ is seen as the natural state. In contrast, dissensus reflects a social orderbased on suspicion and conflict of interest, where science, knowledge, and the‘current order’ is seen as heavily politicized (Schultze & Stabell, 2004).
Deetz also argued that the ontological dimension (subjectivity to objec-tivity) in the original framework was ‘untenable and meaningless’ and hasmore political than descriptive value (Schultze & Stabell, 2004). In searchingfor a suitable replacement continuum, Schultz and Stabell changed Burrelland Morgan’s original ontological dimension to an epistemological dimensionborrowed from Giddens’ Structuration Theory, adopting dualism and dualityas the two main world views encompassing information and knowledge.
Schultze and Stabell refer to their final framework (see Figure 2.16) asdiscourses of organizational knowledge (rather than paradigms) “in orderto highlight that each of them is plagued by internal debates, that theedges between the worldviews are not well demarcated, and that debatesin one world view influence debates in the others” (Schultze & Stabell,2004, p. 555). Schultze and Stabell’s knowledge discourses include the neo-functionalist discourse, constructivist discourse, critical discourse, and thedialogic discourse. These are explained in more detail below.
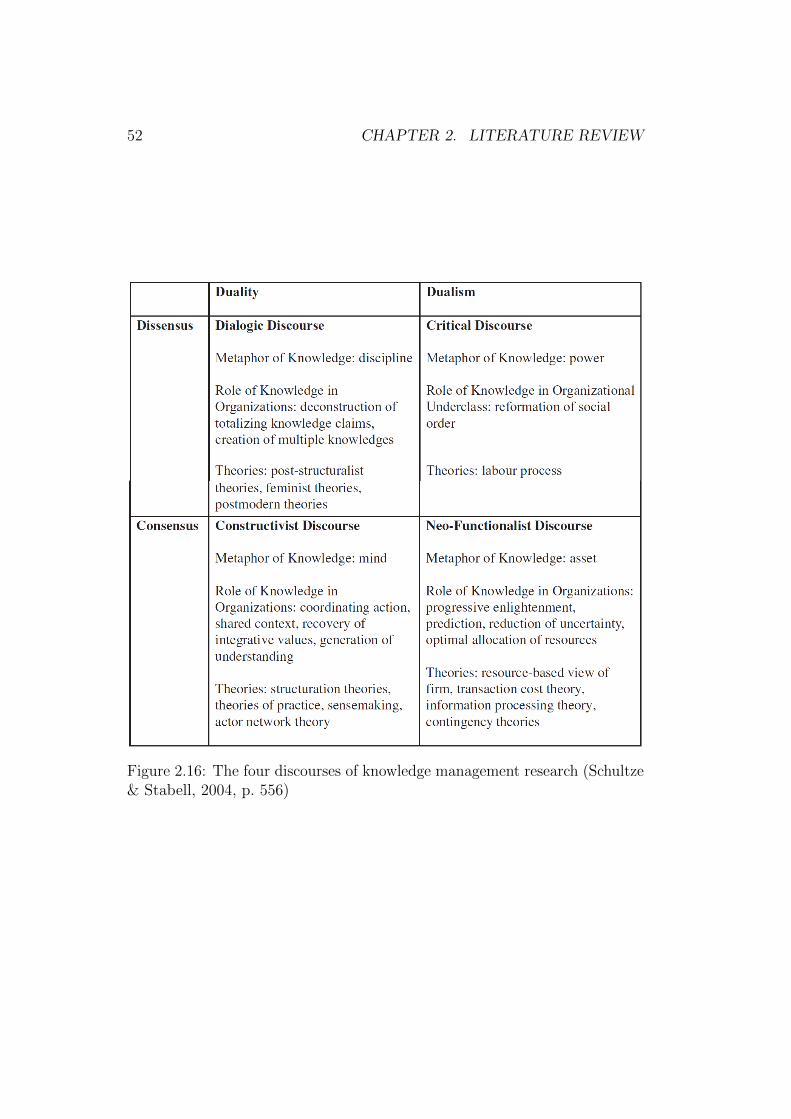
52 CHAPTER 2. LITERATURE REVIEW
Figure 2.16: The four discourses of knowledge management research (Schultze& Stabell, 2004, p. 556)
2.5. EDRMS-USE CONSTRUCTS 53
Neo-functionalist (Dualism/Consensus) In this discourse, “knowledge isviewed as an asset and the role of knowledge is to progress individuals, or-ganizations and society to the ideal state of enlightenment (or competitiveadvantage)” (Schultze & Stabell, 2004, p. 557). In the field of organizationalmemory and recordkeeping research and practice, the neo-functionalist dis-course is arguably the ‘default’ discourse (J. Klein et al., 2007). However,it is one that is not universally shared by all end users, and it is necessarilythe end users who have replaced the traditional ‘records clerks’ in takingresponsibility for contributions to electronic recordkeeping repositories.
Constructivist (Duality/Consensus) The constructivist discourse is con-cerned with “integrating knowledge and coordinating collective action inorganizations, which are conceptualized as systems of distributed knowledge”(Schultze & Stabell, 2004, p. 558). Adherents of this discourse believe thatknowledge cannot be separated from its application. As such, J. Klein et al.(2007) suggest an emerging picture of a Markovian organization. Markovtheory is a mathematical theory that “concerns events that are conditionalupon those that [immediately] precede them and affect those that come after”(Schwarz, 2002). For individuals with this view of knowledge, the informationneeds required to solve a current problem are sought in the present, not fromthe past. Furthermore, any knowledge not required by the organization issimply abandoned and lost to the organization. In other words, knowledge“is integrated with the activities that the organization [currently] undertakes”(J. Klein et al., 2007). In organizations with users who predominantly adhereto the constructivist discourse, efforts to create and maintain physical reposi-tories for organizational memory (e.g., EDRMS) would be seen as having littlevalue or impact on organizational effectiveness. In their view, organizationalmemory is limited to “knowledge in use: working knowledge” (J. Klein et al.,2007).
The neo-functionalist and constructivist discourses are arguably the mostcommon views found in healthy and successful organizations (due to theirfocus on the consensus social order dimension). The final two discourses areless common, and primarily occur in organizations with social orders that arecategorized as dissensus. These include:
Critical (Dualism/Dissensus) The critical discourse can be categorized asan almost anti-organizational discourse in that it often: “aligns itself withthe interest of the workers against management. It regards knowledge as
54 CHAPTER 2. LITERATURE REVIEW
an entity separate from the individual knower and knowledgeable action[. . . with the risk that knowledge can be] extracted from one social groupingand appropriated by another, thus becoming a means of exercising power andcontrol” (Schultze & Stabell, 2004, p. 559). Adherents view knowledge ashaving value and capable of being stored (and as such, are similar to neo-functionalists). However, J. Klein et al. (2007) go further and suggest that thisdiscourse sees ‘objectified knowledge’ as a source of power in an organizationwith dissensus, and point out that the possessor of that knowledge caneither use it to preserve the organization or destroy it through, for example,knowingly maintaining outdated or dysfunctional practices (J. Klein et al.,2007).
Dialogic (Duality/Dissensus) The final discourse type views knowledgewithin the concept of duality in an organization typifying dissensus. Adherentsof the dialogic discourse adopt “a Foucauldian perspective [that] contendsthat knowledge and power are inextricably intertwined giving rise to theconcept of power-knowledge” (Schultze & Stabell, 2004, p. 560). In this view,those with power-knowledge are likely to use it to further their own interests,which is a common goal in highly political environments.
The main difference in the above ontological perspectives could be arguedto be the perceived value-duration of a particular knowledge artifact. Thesetime-slices of a record’s perceived value-duration can again be consideredin light of Giddens’ structuration theory (Section 2.3.1) and his ‘planes oftemporality’: duree (the timeframe of day-to-day life), dasein (the humanlifespan), and the longue duree (the timeframe of social institutions).
Those adhering to a neo-functionalist or critical knowledge discourse seeall records as potential long-term ‘assets’ that are worthy of keeping andmanaging for use in the future (with the value-duration of the knowledgeartifact extending to the dasein and longue duree temporal planes). However,an individual’s willingness to share that knowledge or participate in an orga-nizational recordkeeping activity is strongly influenced by the power politicsof the organization – i.e., whether the organizational culture is primarilycategorized as consensus or dissensus. It can thus be argued that even ifan individual believes that a particular knowledge artifact has value andwould ‘normally’ be willing to participate, this willingness to participate iscontingent on the organizational political context.
In contrast, those adhering to the constructivist or dialogic knowledgediscourse perceive the same knowledge artifacts as supporting the current
2.6. CHAPTER SUMMARY 55
‘working knowledge’ only. Even in the most supportive of consensus-drivenorganizations, these individuals would still see little or no value in makingefforts to formally retain documents and/or records beyond their currentapplication. In dissensus organizations, these individuals may even perceivecentralized efforts to systematize and store this ‘low value’ knowledge as aform of conspiracy and a developing threat against the workers – furthersteeling their intention not to participate.
2.6 Chapter Summary
In this chapter, the literature was explored to set the context and seek outsuitable conceptual areas to address the research question: What factorsinfluence a user’s intention to use an electronic recordkeeping system?
Primarily, an EDRMS is an enterprise-class technology system. Therefore,an individual’s willingness to use that technology (i.e., technology acceptance)must be considered on par with any other technology system. Davis et al.(1989)’s Technology Acceptance Model (TAM) has two primary constructsthat have proven over time to be a consistent predictor of system use. Theuser’s perceived usefulness and perceived ease of use were found to explain asignificant portion of behavioral intentions, and those intentions were foundto drive system use. Venkatesh et al. (2003)’s subsequent UTAUT modelredefined the constructs as performance expectancy and effort expectancy,thereby completely capturing the original TAM constructs and attempting toencompass and align similar ones from the literature. The slightly broaderUTAUT constructs will be favored over the TAM constructs when used inthe conceptual research model.
The second consideration is that electronic recordkeeping systems areimplemented across an organization for shared use by its employees, and soan individual’s perceptions of a system’s usefulness is likely influenced by thesocial context in which it is being used (i.e., organizational context). Schultzeand Stabell (2004)’s categorization of four knowledge management discourseshighlights the importance of the political climate and culture, particularlyon the power-politics continuum of consensus versus dissensus organizations.Giddens (Section 2.3.1) named three main interactions between individuals inthe act of structuring their society: communication, power, and sanction. Interms of the potential impact of the organizational context on an individual’sbeliefs regarding an EDRMS, the subjective norm (recast by UTAUT associal influence) has been selected for its ability to represent interactions with
56 CHAPTER 2. LITERATURE REVIEW
fellow employees, covering both of Giddens’ communication and sanctioninteractions. Perceived power security was selected to address Giddens’ finalinteraction: power.
An approach to the final consideration of how individual’s value electronicrecords and recordkeeping (i.e., knowledge interpretation) is suggested as aresult of the second half of Schultze and Stabell (2004)’s knowledge manage-ment discourses. In addition to the power-politics continuum of consensusand dissensus, Schultze and Stabell also included a knowledge interpretationdimension, with some users believing that stored knowledge can be an ‘asset’that has a lasting value that can be applied in future situations, whereasother users believe that knowledge can only have value while in use, as work-ing knowledge. Accordingly, it would appear that only one of Schultze andStabell’s four knowledge management discourses is conducive to the willinguse of EDRMS: that of the neo-functionalists, who both believe knowledgecan and should be stored and who also exist in an organizational context thatencourages and supports that belief.
With these three categories of the determinants of EDRMS-use derivedfrom the literature, the focus now moves to combining these constructs anddeveloping the conceptual research model.
Chapter 3
Conceptual Research Model
Contents3.1 Chapter Overview . . . . . . . . . . . . . . . . . . 57
3.2 Technology Acceptance Factors . . . . . . . . . . 58
3.3 Organizational Context Factors . . . . . . . . . . 60
3.4 Knowledge Interpretation . . . . . . . . . . . . . 62
3.5 Chapter Summary . . . . . . . . . . . . . . . . . . 64
3.1 Chapter Overview
In this chapter, a conceptual research model that includes the hypothesizedrelationships between its constructs is created to address the research objec-tives; namely, to identify the factors that influence a user’s intention to usean electronic recordkeeping system; and, once identified, to determine theirrelative importance and influence.
A review of the literature identified three primary sources of factors thatmay be considered to influence EDRMS use. These sources are groupedinto technology acceptance factors, organizational context factors (includingconstructs that measure a user’s localized socio-political climate), and knowl-edge interpretation factors, including a new construct: the perceived value ofrecords.
Based on the literature, a conceptual research model was developed to morefully explore and relate the factors associated with the use of electronic record-keeping systems. See Figure 3.1. Each of the conceptual research model’s
57
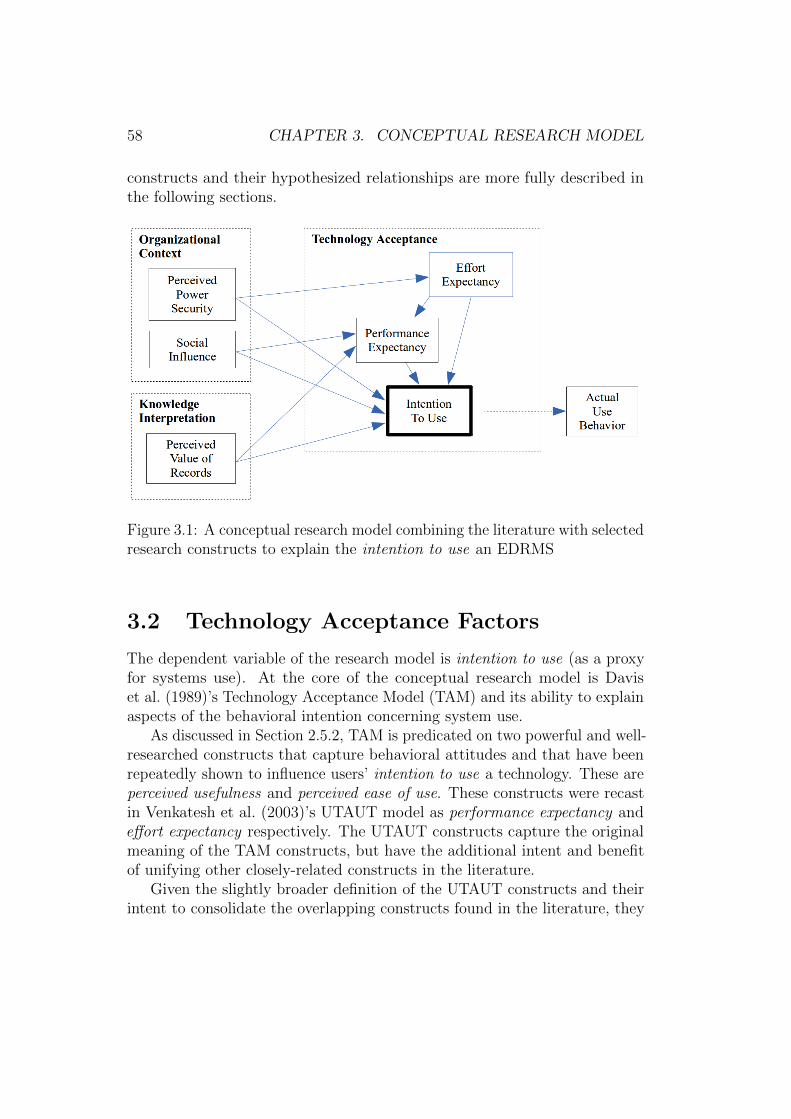
58 CHAPTER 3. CONCEPTUAL RESEARCH MODEL
constructs and their hypothesized relationships are more fully described inthe following sections.
Figure 3.1: A conceptual research model combining the literature with selectedresearch constructs to explain the intention to use an EDRMS
3.2 Technology Acceptance Factors
The dependent variable of the research model is intention to use (as a proxyfor systems use). At the core of the conceptual research model is Daviset al. (1989)’s Technology Acceptance Model (TAM) and its ability to explainaspects of the behavioral intention concerning system use.
As discussed in Section 2.5.2, TAM is predicated on two powerful and well-researched constructs that capture behavioral attitudes and that have beenrepeatedly shown to influence users’ intention to use a technology. These areperceived usefulness and perceived ease of use. These constructs were recastin Venkatesh et al. (2003)’s UTAUT model as performance expectancy andeffort expectancy respectively. The UTAUT constructs capture the originalmeaning of the TAM constructs, but have the additional intent and benefitof unifying other closely-related constructs in the literature.
Given the slightly broader definition of the UTAUT constructs and theirintent to consolidate the overlapping constructs found in the literature, they
3.2. TECHNOLOGY ACCEPTANCE FACTORS 59
were selected over the original TAM constructs for this research. However,the UTAUT constructs, due to their similarity to TAM definitions and intent,will be considered interchangeable with their source TAM constructs whenconsidering the application of validated theoretical relationships from theliterature. These two technology acceptance constructs have been included inthe conceptual research model in order to represent the generic technologyacceptance factors associated with the use of an information technology. Thesetwo constructs and their associated research propositions will be consideredin more detail below.
3.2.1 Effort Expectancy
It is expected that an easy to use system will present lower barriers to use: thelower the effort, the more likely a user will be to consider using the system tocomplete a task. In accordance with the published and validated relationshipsin the technology acceptance literature, effort expectancy (Venkatesh et al.,2003, p. 450) – see Section 2.5.2 – is expected to positively impact both a user’sintention to use a technology and the performance expectancy (Venkateshet al., 2003, p. 447) of that technology. The associated research propositionsare as follows:
• Research Proposition 1 (P1): effort expectancy (perceived ease ofuse) will have a positive impact on a user’s intention to use an electronicrecordkeeping system.
• Research Proposition 2 (P2): effort expectancy (perceived ease ofuse) will have a positive impact on a user’s performance expectancy(perceived usefulness) of an electronic recordkeeping system.
3.2.2 Performance Expectancy
The second technology acceptance construct, performance expectancy (per-ceived usefulness) (Venkatesh et al., 2003, p. 447), has been found to be posi-tively and strongly associated with intention to use in every study consultedthat attempted to validate technology acceptance constructs in organizationalcontexts (see Section 2.5.2). It is expected that this trend will continueamongst EDRMS users, with those users who perceive the system to be usefulcontinuing to have a strong intention to continue to use it. The associatedresearch proposition is as follows:

60 CHAPTER 3. CONCEPTUAL RESEARCH MODEL
• Research Proposition 3 (P3): performance expectancy (perceivedusefulness) will have a positive impact on a user’s intention to use anelectronic recordkeeping system.
As illustrated in the conceptual research model (Figure 3.1), given that anelectronic recordkeeping system necessarily operates within an organization,a user’s willingness to participate in storing records in an electronic record-keeping system is also anticipated to be influenced by external social factorsassociated with the user’s immediate environment (their organizational con-text). Therefore, constructs capturing the organizational context of EDRMSuse are also expected to influence the intention to use.
3.3 Organizational Context Factors
Users of EDRMS are necessarily associated with an organization and are thusunder the influence of social pressures and norms that form that organizationalcontext. These social influences represent a continuum of behaviors. Based onthe literature, the conceptual research model has adopted two representativeconstructs: social influence (based on the subjective norm) and perceivedpower security, which attempt to reflect the primary sources of social influencesexpected to impact a user’s decision to use an EDRMS.
3.3.1 Social Influence
As discussed in Section 2.5.2, social influence (Venkatesh et al., 2003, p. 451)is a well-studied construct that has proven its worth through standardized andvalidated measurements. As with the technology acceptance constructs, socialinfluence is the UTAUT construct that is defined in an attempt to combineclosely-related constructs from the literature, and it is based fundamentallyon the subjective norm. As with the previous constructs, this research willfavor the broader intent and definition of the UTAUT construct; however,social influence and the subjective norm will be used interchangeably whenapplying findings from the literature concerning the proposed relationships ofthis construct with others in the model.
Within an organization, employees are likely to be influenced in decidingwhether to use an EDRMS both by what their managers may think (e.g., theimpact of performance reviews) and what their peers think (e.g., the desireto conform to the social norm), as well as the need to work flexibly in teams
3.3. ORGANIZATIONAL CONTEXT FACTORS 61
with other employees who may require or demand access to their records.Furthermore, earlier research has provided evidence that social influence(subjective norm) has a significant effect on intention to use, either directly orindirectly, through its effects on performance expectancy (perceived usefulness)(Karahanna, Straub, & Chervany, 1999; Venkatesh & Davis, 2000).
The associated research propositions are as follows:
• Research Proposition 4 (P4): social influence (subjective norm) willhave a positive impact on a user’s performance expectancy (perceivedusefulness) of an electronic recordkeeping system.
• Research Proposition 5 (P5): social influence (subjective norm)will have a positive impact on a user’s intention to use an electronicrecordkeeping system.
3.3.2 Perceived Power Security
As discussed in Section 2.5.2, perceived power security is a second, less-researched social construct that is defined as “the degree to which a personbelieves that using a particular system will be free from threats of insecurityregarding loss of power and influence” (Ong et al., 2005, p. 3).
EDRMS technologies have the potential to disrupt both authoritative(extending over people) and allocative (extending over objects or materials)types of power resources (Orlikowski, 1992, p. 405). By increasing thetransparency of individuals’ contributions to the EDRMS, individuals mayfeel more open to being judged with an associated loss of security. Also, bycentralizing recordkeeping into an EDRMS, individuals with allocative powerover legacy systems and/or individual documents may perceive a loss of powerto those who administer and manage the EDRMS. As such, users who chooseto use the system are expected to experience a shift in power associated withcontrol over their records, and they are likely to resist due to concerns abouttheir power relationships. The more secure a user feels in terms of their powerrelationships, the more that person is likely to intend to use the system:
• Research Proposition 6 (P6): perceived power security will have apositive impact on a user’s intention to use an electronic recordkeepingsystem.
In addition, the literature indicated that the more insecure or negativeemployees’ expectations are, the more negative are their affective reactions
62 CHAPTER 3. CONCEPTUAL RESEARCH MODEL
including apprehension, anxiety, stress, and fear. Hackbarth et al. (2003) haveshown that there is a negative relationship between computer anxiety andusers’ perception of ease of use. This leads to the next research proposition.
• Research Proposition 7 (P7): perceived power security will have apositive impact on a user’s effort expectancy (perceived ease of use) ofan electronic recordkeeping system.
The selection of social influence and perceived power security also repre-sent the possible ‘interactions’ proposed in Giddens’ Structuration Theory(p. 20) – communication, power, and sanction. This provides a theoreticallygrounded basis for the selection of the organizational context constructs, theirproposed interrelationships, and ultimately the selection of their underlyingmeasurement items.
3.4 Knowledge Interpretation
As discussed in Section 2.5.2, the final determinant of system use focuses ona user’s perceptions surrounding the importance and usefulness of the record-keeping process itself. It focuses on the user’s needs and their interpretationof the value of recorded documents: knowledge interpretation.
The location of the individual on that value continuum is expected toimpact their willingness to use an EDRMS to store documents and recordsfor use in the future. For the records manager and archivist, the purposeof and need for records is clear: the activity of recordkeeping has value andis a necessary part of a functioning society (Pederson, 2003). However, thisview of the value of stored knowledge and records is not necessarily shared byeveryone. Nonetheless, due in part to the volume of documents being createdin modern society, current EDRMS designs require end users (rather thanrecords managers or records clerks) to make the actual effort to nominate,classify, and store documents and records into the system (Joseph et al.,2012). However, not all end users share the same interpretation of the valueof records, and many end users may believe that formal storage of thosedocuments and records is simply not worth the effort, instead relying onpersonal collections based on their personal anticipated information needs(Bruce, 2005).
Schultze and Stabell (2004) defined four knowledge discourses (Figure 2.16on p. 52) to illustrate different world views and differing interpretationsconcerning the value of recorded knowledge. Furthermore, each discourse is
3.4. KNOWLEDGE INTERPRETATION 63
tuned to work within an organizational context, the same context as sharedby current implementations of EDRMS. However, of those four world views,only one of them – that of the neo-functionalists – appears to value thecapture of records and the process of recordkeeping in a consensus-orientedorganizational context.
The literature suggests that the main difference in the ontological per-spectives of these knowledge discourses is the perceived value-duration ofa particular knowledge artifact. Those adhering to a neo-functionalist orcritical knowledge discourse see all records as potential long-term ‘assets’ thatare worthy of keeping and managing for use in the future. In contrast, thoseadhering to a constructivist or dialogic knowledge discourse perceive the sameknowledge artifacts as merely supporting the current ‘working knowledge’ (i.e,having only short-term value). These latter individuals would see little or novalue in investing in the effort to formally classify and manage documentsand/or records beyond their current application.
Lacking a suitably validated construct from the literature, this studyfurther developed the perceived value of records. This was initially defined1
as a user’s belief that a document2 has value beyond the current applicationand is worthy of storing for the future. Note that this is more targeted thanexisting qualitatively described constructs including the value accorded toinformation (Oliver, 2008) or the value of information (Svard, 2014).
It is expected that individuals who have a higher perceived value of recordswill believe that an EDRMS is a useful tool to capture and manage thosedocuments and records into the future. The associated research propositionis:
• Research Proposition 8 (P8): perceived value of records will have apositive impact on a user’s performance expectancy (perceived usefulness)of an electronic recordkeeping system.
Furthermore, it is expected that individuals with a higher perceived valueof records will also see the entire exercise of electronic records managementas an activity worthy of their time and effort, consequently increasing theirintention to use the system. The final associated research proposition is:
1For the final refined definition of Perceived Value of Records, see Section 8.2.3, p. 201.2Refer to Section 2.2 and the broader definition of document : any “recorded information
or object which can be treated as a unit” (ISO 15489.1, 2002, p. 3).
64 CHAPTER 3. CONCEPTUAL RESEARCH MODEL
• Research Proposition 9 (P9): perceived value of records will have apositive impact on a user’s intention to use an electronic recordkeepingsystem.
The resulting research model (see Figure 3.2) illustrates the proposedrelationships between the selected constructs. Furthermore, it provides anillustration of the relationship of the construct measurement items (In) to theconstructs. It is expected that these constructs will work together to increaseor decrease a user’s intention to use an EDRMS.
For example, it can be envisioned that even if an individual believesthat a particular document has value and would ‘normally’ be willing toparticipate in recordkeeping (i.e., has a high perceived value of records), this‘willingness’ (intention to use) may be contingent on (or be correlated with)the organizational political context, with lower intention to use observed indissensus organizational contexts.
Likewise, individuals with a low perceived value of records may perceiveefforts to systematize and store this ‘low value’ knowledge as a form ofconspiracy and/or a developing threat against the workers, thus furthersteeling their intention to not participate.
3.5 Chapter Summary
This chapter has presented a conceptual research model derived from theliterature. The core of the model is based on the technology acceptanceliterature, where the constructs effort expectancy and performance expectancyand their proposed interactions are presented. Next, electronic recordkeep-ing technology is necessarily used in an organizational context, with thisconceptual area being represented by two additional constructs, social influ-ence and perceived power security, and their proposed interactions. Finally,the interpretation required to value electronic records and the process ofrecordkeeping was addressed via individuals’ knowledge interpretation, whichincluded the introduction of a new construct: the perceived value of records.The constructs and their associated research propositions were integrated intoa single research model.
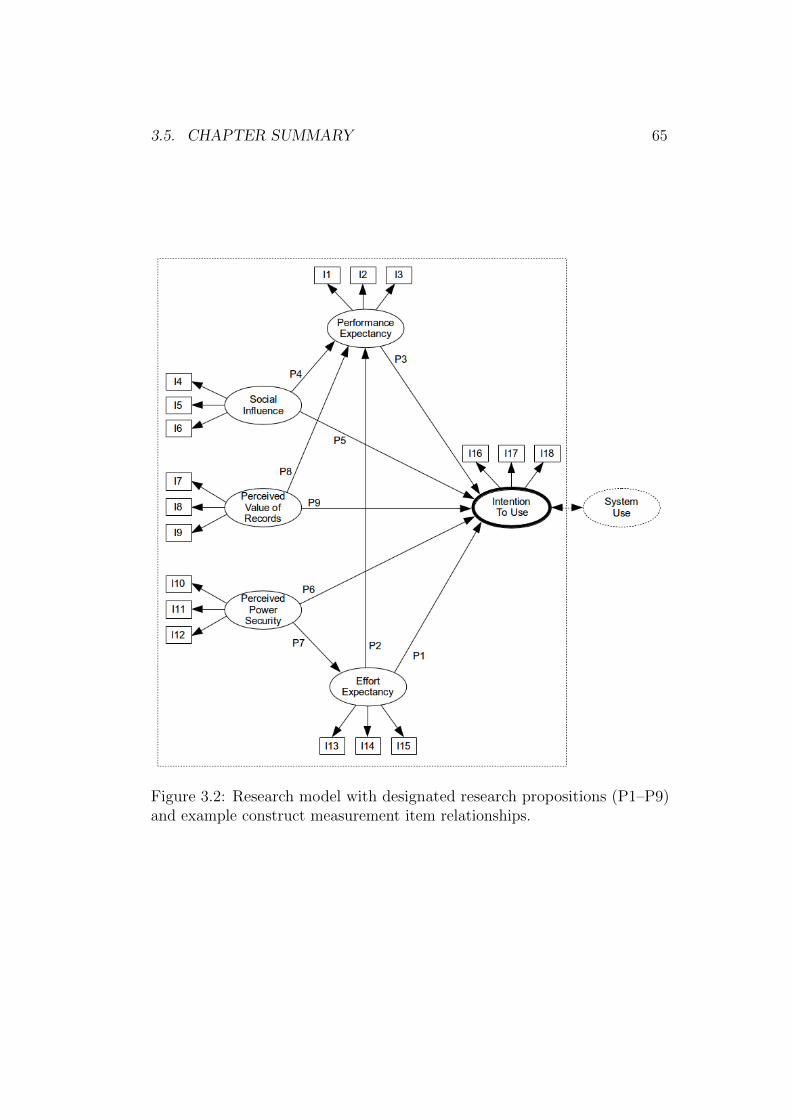
3.5. CHAPTER SUMMARY 65
Figure 3.2: Research model with designated research propositions (P1–P9)and example construct measurement item relationships.

66 CHAPTER 3. CONCEPTUAL RESEARCH MODEL
Chapter 4
Research Design andMethodology
Contents4.1 Chapter Overview . . . . . . . . . . . . . . . . . . 67
4.2 Research Paradigm . . . . . . . . . . . . . . . . . 68
4.3 Sample Population . . . . . . . . . . . . . . . . . . 70
4.4 Research Methodology . . . . . . . . . . . . . . . 71
4.5 Chapter Summary . . . . . . . . . . . . . . . . . . 80
4.1 Chapter Overview
This chapter explains the design and methodological approach used for theempirical phase of the research. Once the conceptual research model wasestablished and the research propositions developed from a foundation oftheory and prior research (see Chapter 3), it was necessary to plan the researchitself. This plan would ultimately provide the mechanism for answering theinitial research question and addressing each of the research objectives. Thefirst section outlines the philosophical stance used to approach the researchand identifies the paradigm that influenced the subsequent approach foreach research phase. Next, the sample population is considered, as theapproach required to access this group influenced the final selection of researchmethodology. Finally, the research methodology is discussed with a focus on
67
68 CHAPTER 4. RESEARCH DESIGN AND METHODOLOGY
two distinct phases of the research, the first being exploratory and mainlyqualitative, the second being confirmatory and quantitative – a means oftesting and validating the research model.
4.2 Research Paradigm
Prior to embarking on a new piece of research, the researcher is expectedto consider any underlying assumptions concerning how and what they willlearn during their inquiry. Creswell (2008) summarized the sources of theseassumptions and knowledge claims as follows:
Philosophically, researchers make claims about what is knowledge(ontology), how we know it (epistemology), what values go into it(axiology), how we write about it (rhetoric), and the process forstudying it (methodology) (Creswell, 2008, p. 6).
Bhaskar (1975) framed three broad ontological positions of knowledgein the philosophy of science, and advocated transcendental realism as, inhis opinion, it more closely approximates reality.1 Transcendental realismwas similarly selected as the base ontology for this research as it regardsthe objects of knowledge as “the structures and mechanisms that generatephenomena” and regards those objects/structures as real (in the Humiansense); however, it acknowledges that knowledge of those objects is necessarilyproduced in “the social activity of science”(Bhaskar, 1975, pp. 24–25), therebyadding an interpretive element to this ontological foundation.
This balance between positivist and interpretivist perspectives is foundthroughout recordkeeping research and theory. As discussed in Section 2.3,recordkeeping theory has been heavily influenced by Giddens’ StucturationTheory (Giddens, 1984; Upward, 1997). Like Bhaskar, Giddens developedStructuration Theory as a way of overcoming what he saw as deficiencies in thetwo dominant epistemological and methodological approaches used in socialanalysis in the late 1970s and early 1980s (M. Jones & Karsten, 2008, p. 130);in other words, he found both positivist/naturalist as well as interpretivesociologies to have significant weaknesses when applied to sociological issues.
1This is in contrast to classical empiricism, as put forward by Hume, which assertsthat the ultimate objects of knowledge are ‘atomistic events’ and that these, if known,would perfectly constitute given facts and ultimately reality; and transcendental idealism,as formulated by Kant, which asserts that all objects of knowledge are merely idealizedmodels, and knowledge is a “structure rather than a surface”(Bhaskar, 1975, p. 25).

4.2. RESEARCH PARADIGM 69
Thus, Structuration Theory sought to “avoid such asymmetrical and dualistictreatment of action and structure by conceptualizing the two as a mutuallyconstitutive duality” (M. Jones & Karsten, 2008, p. 131).
However, Giddens did not offer a methodological recommendation forthose who choose the structurational theoretical perspective. In fact, headmitted: “I do not try to wield a methodological scalpel. . . there is [nothing]in the logic or the substance of structuration theory which would somehowprohibit the use of some specific research technique, such as survey methods,questionnaires or whatever” (Giddens, 1984 as quoted in M. Jones & Karsten,2008, p. 131). However, those who choose to use quantitative tools mustguard against the temptation to claim a complete understanding based ontheir quantitative results.
That said, the theoretical perspective (paradigm) claimed for this researchis post-positivism (Creswell, 2008, p. 7). The relationships of the constructsderived from the literature review – as set forth in the conceptual researchmodel – imply determination, reductionism, empirical observation and mea-surement, and theory verification (i.e., a positivist/naturalist heritage). Themethodology best able to test the relationship between variables is the survey,as it can collect data that is able to test theory and causal relations, and doesso from “theoretically grounded expectations about how and why the variablesought to be related” (Pinsonneault & Kraemer, 1993, p. 9). Nonetheless, asGiddens highlighted, the ‘variables’ themselves are based on a foundation ofinterpretive constructivism.
Methodologically, this research thus required a mixed-methods approach(Creswell, 2008). Part of the research activity included the investigationand development of measurement items and the exploration of the researchmodel’s new construct (perceived value of records), which had yet to befully defined and validated quantitatively. This initial phase of the researchnecessarily included the use of qualitative methods in order to explore andgain an understanding of how people view, understand, and relate to theessence of the model constructs, and how they communicate that meaning.This exploratory work was required in order collect and validate suitablemeasurement items for use in the quantitative survey and its subsequentstatistical analysis.
70 CHAPTER 4. RESEARCH DESIGN AND METHODOLOGY
4.3 Sample Population
The sample was drawn from a population consisting of employees from a NewZealand public sector organization that has implemented an EDRMS.2 Theunit of analysis is the individual EDRMS user.
New Zealand has taken a strong stance on electronic recordkeeping. TheNew Zealand Government was an early adopter of ISO 15489 and placedthe international standard materially into force after passing the PublicRecords Act (2005). The Public Records Act sets a mandatory framework forrecordkeeping in public offices and local authorities3 – i.e., the public sector.
A 2010 Government Recordkeeping Survey of Public Offices (which wasthe last survey of its type) found that New Zealand Government offices useda variety of recordkeeping systems, with the majority of public offices (93%)continuing to use paper systems for one or more record series. In terms ofelectronic records, only 44% used compliant electronic recordkeeping systems.Furthermore, 28% of public offices reported that they were undertaking aproject to implement a system to manage electronic records (Dudding &Mayo, 2010b). In addition, the 2010 Government Recordkeeping Survey ofLocal Authorities found similar trends with 59% of local authorities reportinguse of electronic recordkeeping systems, and 33% undertaking a project toimplement a system to manage electronic records (Dudding & Mayo, 2010a).
In addition, Archives New Zealand was actively developing a GovernmentDigital Archive, with an associated Digital Continuity Action Plan, whichclaimed “to be a world first initiative to prevent important public records beinglost and ensuring that today’s information is available tomorrow” (ArchivesNew Zealand, 2011). This national system of electronic records requiresthe compliant use of electronic recordkeeping metadata in order to maintainthe context (and authenticity and reliability) of the electronic records forthe planned transition from the organization’s EDRMS to the new nationalrepository.
Of particular interest to this study are ongoing efforts to capture electronicdocuments and records that are personally authored by employees (e.g.,documents associated with projects or policy creation or research). Depending
2It should be pointed out that the observed EDRMS has been implemented primarilyto head office business units, many of whom have used a version of the EDRMS since 2006.However, the organization is also still implementing the EDRMS, as other business unitshave not yet been transitioned on to the system.
3The Public Records Act 2005 does not cover privately owned companies, politicalparties, or charitable trusts.
4.4. RESEARCH METHODOLOGY 71
on the organization, project or policy documents are often generated for aparticular event or purpose, and then left to the author to manage (or not)beyond that usage event. EDRMS will provide these knowledge workers(often for the first time) with a system that is capable of capturing allof their working papers and communications, and by placing them undera management strategy, transform these documents into records of thoseactivities and events.
This type of record is also likely to be low-volume and of an ad hoc nature,which makes it more challenging to fully capture its context. The targetedindividuals are most likely to experience higher personal ownership of theirdocuments and thus exhibit variable EDRMS-use intention depending ontheir interpretation of the value of the documents and the organizationalcontext in which these documents are generated.
It is therefore this subpopulation – the sample frame consisting of thecreators of low-volume, high-value documents that have historically beenpoorly managed – that was the primary target of this study. The samplewas identified with the assistance of EDRMS administrators from within thepublic sector organizations – forming a judgmental sample in terms of thefinal business units approached.
The target population consisted of knowledge workers and managers4 whogenerate reports and/or documentation, such as policy/strategy development,project management, business analysis, etc. These individuals were expectedto have a personal ownership of their documents, which was expected to impacttheir willingness to participate in organizational recordkeeping activities.
4.4 Research Methodology
As discussed in Section 4.2, this research firmly resides in a post-positivistparadigm as it seeks to identify and measure the factors that impact the useof an EDRMS, and it does so through the use of a survey. This approachimplies determination, reductionism, empirical observation and measurement,
4The target population of users can be contrasted with the records and informationmanagement (RIM) professionals who manage more rigid and structured records serieswithin the same organizations, such as HR personnel files or case files that have historicallybeen well managed in both paper and electronic series. The professional records clerksare less likely to have emotional connections with the records under management asthese structured records were likely generated by someone else and/or created as partof an established business process, have a high volume, and are part of a daily routine.Professional recordkeepers were excluded from the study.
72 CHAPTER 4. RESEARCH DESIGN AND METHODOLOGY
and theory verification (i.e., a positivist/naturalist heritage). Nonetheless,Giddens highlighted that the variables themselves (in this case, the constructsand survey measurement items) are based on a foundation of interpretiveconstructivism. As such, this research required the use of a mixed-methodsapproach.
Mixed-methods as it pertains to a research methodology is described asfollows:
Mixed-method inquiry intentionally combines different methods –that is, methods meant to gather different kinds of information.[. . . ] The underlying premise of mixed-method inquiry is thateach paradigm offers a meaningful and legitimate way of knowingand understanding. The underlying rationale for mixed-methodinquiry is to understand more fully, to generate deeper and broaderinsights, to develop important knowledge claims that respect awider range of interests and perspectives. (Greene & Caracelli,1997, p. 7)
When seeking support for the use of mixed-methods, Greene, Caracelli,and Graham (1989) identified five purposes for mixed-method evaluations:triangulation, complementarity, development, initiation, and expansion. Ofthese five purposes, development is the primary reason for mixing methods inthe context of this research project. Greene et al. (1989) state the purpose andrationale for using development as a justification for adopting mixed-methodsas follows:
Purpose: Development seeks to use the results from one methodto help develop or inform the other method, where developmentis broadly construed to include sampling and implementation, aswell as measurement decisions (Greene et al., 1989, p. 259).
Rationale: [Development seeks to] increase the validity of con-structs and inquiry results by capitalizing on inherent methodstrengths (Greene et al., 1989, p. 259).
The research design thus consisted of two phases that align with theresearch objectives as outlined in Section 1.4, and that generally follow themethodological processes for construct creation and validation put forwardby Moore and Benbasat (1991) and Lewis, Templeton, & Byrd (2005). Thetwo research phases are as follows:
4.4. RESEARCH METHODOLOGY 73
1. Phase I: Qualitative Phase consisted of qualitative methods usedto develop a pool of potential measurement items as they pertain to theconceptual research model and its constructs.
This phase was used to address aspects of the first research objective: Toidentify the factors that influence a user’s intention to use an electronicrecordkeeping system.
2. Phase II: Quantitative Phase consisted of quantitative methods tovalidate the links between the measurement items and their constructs,and – via the use of a survey – test the research model.
This phase was used to address aspects of the second research objective:To determine the relative importance of the factors that influence auser’s intention to use an electronic recordkeeping system.
The qualitative and quantitative phases of the research design are discussedin more detail below.
4.4.1 Phase I: Qualitative Methods
Once the conceptual research model’s constructs were identified (see Figure 3.2on p. 65), the next step of the research design was to validate that theproposed constructs worked within the context of electronic recordkeepingand to identify a pool of suitable measurement items.
The four specific objectives of the qualitative research phase were to:
1. validate the proposed constructs and measurement items derived fromthe literature in the context of electronic recordkeeping;
2. validate the new construct, perceived value of records ;
3. identify additional factors that may impact a user’s intention to use anelectronic recordkeeping system and that are not specifically covered bythe constructs of the research model; and
4. validate the relationships of the respective measurement items to theirparent constructs.
The research design of the qualitative phase consisted of three stages:Stage 1: in-depth personal interviews to develop an initial pool of measurementitems; Stage 2: proofreading with attention to the comprehension of themeasurement items; and Stage 3: card sorting to validate the relationshipsbetween the constructs and their measurement items.
74 CHAPTER 4. RESEARCH DESIGN AND METHODOLOGY
Stage 1: Interviews
As recommended by Suhr (2006), the conceptual research model in Chapter 3was developed by first reviewing the relevant theory and research literatureto support the model’s specification. All but one of the research model’sconstructs have been sourced from the literature and come with pre-validatedmeasurement items. The exception is a newly proposed construct: perceivedvalue of records. Stage 1 explored the meaning and definition of this newconstruct, generally following the established construct-building procedures asput forward by Churchill (1979) and Lewis et al. (2005), as well as exploringthe suitability of the rest of the constructs in the context of electronicrecordkeeping.
The technique selected to develop and explore the constructs was theinterview (Byrne, 2001b). A semi-structured set of interview questions wasadministered to a dozen individuals who were selected from the targetedsample population. A convenience/judgmental sample (Boudreau, Gefen, &Straub, 2001; Pinsonneault & Kraemer, 1993) was deemed to be suitable forthe purposes of this exploration as the targeted constructs were relativelyconstrained. The interviews were digitally recorded and a written transcriptof each of the interviews was created to support the subsequent coding andthematic analysis (Byrne, 2001a; Woods, Priest, & Roberts, 2002).
The resulting themes were then converted into a pool of measurementitem statements. At this point, the measurement items were independentof their research model constructs, as one of the goals of this stage of theresearch was to provide support for the constructs by first independentlycreating the foundational pool of measurement items.5
Stage 2: Proofreading
This stage sought to increase the quality of the pool of measurement items.Moore and Benbasat (1991) discussed the need for ‘valid item statements’ tobe developed by the authors. To improve the item statements, ten volunteerswere recruited to provide assistance and input. These volunteers were givena limited background concerning the research project, and were simply toldthat the system referred to is an electronic recordkeeping system. They were
5It was possible that some emergent measurement items would not be explained by themodel’s constructs, potentially suggesting the need for additional constructs to fully capturethe determinants of EDRMS-use. Subsequent to the analysis, no additional constructswere found to be required.

4.4. RESEARCH METHODOLOGY 75
then asked to review the pool of measurement items and to comment on eachitem’s clarity and comprehensibility.
Individual feedback on the measurement items was obtained and con-sidered in context with other feedback in an effort to maximize the clarityand shared understanding of the essence of each measurement item. Prob-lematic measurement items were reworked to incorporate the feedback. Thefinal wordings were checked for tense and clarity, and only then were themeasurement items tentatively associated with a parent construct.
Stage 3: Card Sorting
Stage 3 focused on scale development (Moore & Benbasat, 1991; Jackson& Paunonen, 1985) and construct validation (Hinkle, 2008; Peter, 1981).Construct or content validity is defined as “the degree to which the score orscale being used represents the concept about which generalizations are to bemade” (Bohrnstedt, 1970, p. 91 as referenced in Davis, 1989, p. 323).
The technique selected to develop and explore construct validity is cardsorting (Spencer & Warfel, 2004). The goal of this stage is to verify thatthe pool of measurement items (from Stage 1 and Stage 2) individually loadonto one (and only one) of the constructs from the research model. To dothis, individual measurement items were written on separate cards, and thesecards were then sorted into groups by different participants.
There are two main variations of card sorting that were used to measuredifferent aspects of construct validity. Closed card sorting (Spencer & Warfel,2004) is where categories are provided to the participants, and they are thenasked to sort each measurement item against the available categories. Opencard sorting (Faiks & Hyland, 2000) is where participants are asked to createtheir own groupings. These two techniques measure two different aspects ofvalidity (Rugg & McGeorge, 2005; Boudreau et al., 2001), with the formermeasuring convergent validity – the likelihood that different judges agree thatan item reflects the same construct; and the latter measuring discriminantvalidity – the likelihood that an item unambiguously reflects a single construct(and only that construct).
The goal of this qualitative stage was to maximize the shared understand-ing of the relationship between a measurement item and its construct, whileacknowledging that the interpretation of the author may not be the same asthat of participants. Based on the participant feedback, some measurementitems were adjusted to more clearly reflect a particular construct, or theywere allocated to a different construct, or – in the case of vague measure-
76 CHAPTER 4. RESEARCH DESIGN AND METHODOLOGY
ment items that appeared to link to multiple constructs – some measurementitems were removed from the pool. This also provided the opportunity todetermine if the set of constructs in the research model were both necessaryand sufficient to explain the set of measurement items that emerged from theStage 1: interviews.
The outcome of the Stage 3: card sorting was a pool of measurementitems with a strong qualitative link to a parent construct. At this pointin the research, the research design switched to a primarily quantitativemethodological phase.
4.4.2 Phase II: Quantitative Methods
Phase II of the research design focused on quantitative methods – specificallyon the development and delivery of a survey instrument that was capable ofgathering sufficient data to quantitatively validate the relationship betweenthe measurement items and the constructs, and ultimately determine therelative importance of the factors in the research model.
Building on Stages 1–3 of the qualitative phase, the research design ofthe quantitative phase consisted of three additional stages: Stage 4: SurveyDesign covered the design of the survey instrument and its implementationwithin a suitable online survey technology; Stage 5: Survey Pretest includedrunning a pretest of the online survey and using the feedback to further refinethe survey instrument; and Stage 6: Survey consisted of using the instrumentto gather data to validate the underlying research model.
Stage 4: Survey Design
The survey design stage consisted of transforming the final measurementitem pools into a survey instrument. Although this is not specifically adata-gathering stage (although different designs were trialled and discussed),the effort and consideration required to create the survey instrument isconsiderable, and therefore it warrants its own stage in the research design.
The objectives of Stage 4 included:
1. the selection of an appropriate online survey delivery technology andtraining in its use;
2. consideration of the data analysis approach and the implications of howand in what detail the data is required to be captured;
4.4. RESEARCH METHODOLOGY 77
3. the creation of the survey instrument including: design, item grouping,section flow, branding, etc.; and
4. the creation of associated documentation and communications, includ-ing: participant information sheets, participation waivers, introductoryemails, graduated automated reminder emails, ‘thank you’ emails, etc.
The outcome of this stage was a draft ‘survey instrument package’ thatincluded all materials required to initiate the final data-gathering activity.However, awareness of the data analysis approach was also required in orderto inform how the data would be captured by the survey instrument.
The selected analysis approach is one which focuses on confirmatory factoranalysis (CFA) as opposed to exploratory factor analysis (EFA) (Suhr, 2006).A class of structural equation modeling was selected as the analysis methodbecause it provides “inferential data analysis and hypothesis testing wherethe pattern of inter-relationships among the study constructs are specifieda priori and grounded in established theory” (Hoe, 2008, p. 76). Specifically,Partial Least Squares Path Modeling (PLS-PM) was selected, because
Unlike the classical covariance-based approach, PLS-PM does notaim at reproducing the sample covariance matrix. PLS-PM isconsidered as a soft modeling approach where no strong assump-tions (with respect to the distributions, the sample size and themeasurement scale) are required. (Vinzi, Trinchera, & Amato,2010, p. 48)
The PLS-PM analysis method is discussed in greater detail in Section 7.4.However, its identification at this point helped to determine the level of detailand the format required for the survey data collection.
A five-point Likert scale was selected and used for the design of the surveyinstrument, as it has been found to be sufficient in capturing a measureof reliability (Hinkin, 1998). In addition, design decisions, such as makingquestions mandatory and ordering them in terms of difficulty, were takenduring the design stage (and during the analysis and interpretation stages)in order to avoid common pitfalls associated with statistical data analysis(Helberg, 1995).
The next stage sought to increase the quality of the survey instrumentand refine the orchestration of the survey activities through a pretest of theentire survey instrument package.
78 CHAPTER 4. RESEARCH DESIGN AND METHODOLOGY
Stage 5: Survey Pretest
The pretest stage focused on two aspects of the online survey: the testing ofthe survey instrument itself; and the familiarization with and testing of thesurvey distribution platform and mode of transmission and data collection.
Although a pretest is generally recommended, Dillman (2007) warns thatthe survey pretest is often done “haphazardly, if at all.” He further emphasizesthat a properly conceived pretest phase is a chance to:
• evaluate the distribution procedures and see whether any problemsarise;
• discover production mistakes by having a few people fill out the survey;
• learn whether people clearly understand all of the questions; and
• provide an opportunity for feedback to improve the survey.
In the case of this online survey, it was also where the technology meetsthe measurement items, and it provided the researcher with an opportunityto pretest the survey instrument as well as the platform on which it would beadministered.
The research design for the survey pretest consisted of administering thesurvey to 10 participants selected as a convenience sample. These individualswere debriefed subsequent to the survey in an attempt to discover any produc-tion mistakes or distribution errors, and they were also given the opportunityto provide additional feedback to improve the survey. The outcome of thisstage was the final draft of the survey instrument.
Stage 6: Survey
The main data-gathering stage in the research design was the final survey.The survey was distributed to a sample selected from the target population(see Section 4.3) and it utilized a communication plan based on the modifiedTailored Design Method (Dillman, 2009), the intention of this method beingto minimize non-response bias (Sivo, Saunders, Chang, & Jiang, 2006).
Sample Size: The required sample size was estimated based on the numberof constructs required to provide sufficient explanatory power for the researchmodel. For structural equation modeling in general, this is set forth as a‘formula’, with a range of 5–20 participants required per parameter estimated
4.4. RESEARCH METHODOLOGY 79
(Suhr, 2006). The actual number of participants per parameter required isaffected by the normality of the data and the estimation method used; however,for PLS-PM, 10 participants per construct is the generally agreed number(Schreiber, Nora, Stage, Barlow, & King, 2006). Furthermore, a ‘criticalsample size’ or rule-of-thumb sample of 200 is also mentioned elsewhere in theliterature (Garver & Mentzer, 1999; Hoe, 2008; Hox & Bechger, 1998). Giventhat there are 6 constructs in the conceptual research model, a multiplierof 10–20 (resulting in 60–120 participants) would provide the lower requiredsample size estimate. For added security and statistical sensitivity, an effortwas made to increase the sample size to ≈ 200 participants. In the end, 193usable responses were obtained (see Section 7.2, p. 138).
Common Method Variance (CMV): Also known as common methodbias, CMV is “variance that is attributable to the measurement method ratherthan to the constructs the measures represent” (Podsakoff et al., 2003, p. 879).Data gathered from surveys and questionnaires can sometimes be at risk ofCMV. This bias can arise from many sources, including the use of a commonrater, the manner in which items are presented to participants, the contextin which the items are presented, and other external contextual influencesthat may be independent of the survey instrument (e.g., time, location andmedia) yet still affect how people respond (S.-J. Chang, van Witteloostuijn,& Eden, 2010).
In an attempt to control for CMV risk, Chang et al. (2010, p. 181)recommend a number of ex ante and ex post remedies – “use multiple remedies,not just one remedy, in order to assuage the various concerns about CMV.”Several of their recommended “remedies” were considered and incorporatedinto the research design.
• Collect data from multiple sources. This research incorporated data frommultiple public sector organizations and used multiple data collectiontechniques including interviews, card-sorting, and surveys (see ResearchStages above) in an effort to minimize source and method bias.
• Design the data collection instruments with care. The survey mea-surement items were sourced from the literature and cross-referencedwith the thematic analysis from the interviews and cardsorted prior toincorporation into the survey instrument in an effort to minimize bias.Subsequent to data collection, the measurement items also underwentstatistical validity checking.
80 CHAPTER 4. RESEARCH DESIGN AND METHODOLOGY
In addition, other recommended CMV-reducing techniques were usedwhen collecting the survey data including: 1) assuring anonymity andconfidentiality, 2) neutral phrasing of measurement items, and 3) positiveand negative measurement items, and 4) care to make the measure-ment items clear and unambiguous. These steps removed many of thepotential biases from the comprehension stage of the response process.
• Complicated regression models reduce the likelihood of CMV. Responsebias is more likely to emerge in simple survey models, so “complicatedspecifications of regression models reduce the likelihood of CMV” (S.-J.Chang et al., 2010, p. 179). The analysis of the survey data required theuse of partial least squares path modeling paired with statistical validitychecks, thereby removing an additional source of potential CMV risk.
These methods, combined with an emphasis on keeping the responserate as high as possible to avoid non-response bias (Sivo et al., 2006;Dillon, Madden, & Firtle, 1990), were put in place to manage CMVrisk.
4.5 Chapter Summary
This chapter has explained the approach to the research design and method-ology used in the empirical phase of the research. The first section outlinedthe philosophical stance behind the research, and illustrated the need fordifferent methods to approach each of the research phases. Next, the samplepopulation was described in more detail, as the approach required to accessthis group would dictate aspects of the final research design. Finally, theresearch methodology was discussed with a focus on the two distinct phasesof the research, the first being qualitative and exploratory, and the secondbeing quantitative and confirmatory – a means of testing and validating theresearch model.
In the next two chapters, the results of Phase I: Qualitative Methods(Stages 1–3) and Phase II: Quantitative Methods (Stages 4–6) are discussedin more detail.
Chapter 5
Phase I: Qualitative Methods
Contents5.1 Chapter Overview . . . . . . . . . . . . . . . . . . 81
5.2 Stage 1: Interviews . . . . . . . . . . . . . . . . . 82
5.3 Stage 2: Proofreading . . . . . . . . . . . . . . . . 107
5.4 Stage 3: Card Sorting . . . . . . . . . . . . . . . . 112
5.5 Chapter Summary . . . . . . . . . . . . . . . . . . 126
5.1 Chapter Overview
As noted in Chapter 4: Research Design & Methodology, this chapter willcover Phase I of the empirical research in more depth. Phase I relied onqualitative methods to develop a pool of potential measurement items andrelated them to the conceptual research model and its constructs. The purposeof Phase I was to address the first research objective: to identify the factorsthat influence a user’s intention to use an electronic recordkeeping system.
The research covered in this chapter was conducted in three stages of datagathering and analysis, where each stage built on the results of the previousstage. The stages were as follows:
1. Stage 1: Interviews – interviews were conducted and then converted,through thematic analysis, into a pool of measurement items.
81
82 CHAPTER 5. PHASE I: QUALITATIVE METHODS
2. Stage 2: Proofreading – external input was sought to create clearmeasurement items that maximized the shared understanding of eachstatement.
3. Stage 3: Card sorting – relationships were created between measurementitems and their parent construct.
In the next three sections, each of the above stages are discussed in detail,including the methods used to capture the data, the results that were obtained,and the analysis and implications that were considered before moving on tothe next stage. The Phase I research activities covered in this chapter set thestage for the Phase II quantitative methods that are covered in Chapter 6.
5.2 Stage 1: Interviews
The first stage of the qualitative research phase began with interviews. Thespecific objectives of this stage were to:
1. validate the existing set of construct measurement items derived fromthe literature in the context of electronic recordkeeping and furtherexploring potential determinants of each construct;
2. explore the new construct: perceived value of records ; and
3. search for additional items or factors that may impact a user’s intentionto use an electronic recordkeeping system and that are not specificallycovered by the constructs of the research model.
5.2.1 Interview Instrument Creation
In consideration of Stage 1’s research objectives (stated above), a questionnairewas created that presented the questions without disguising the purpose ofthe interview (Smith & Albaum, 2012). However, in order to explore theanswers and follow-up on interesting comments that might provide evidenceof unanticipated research factors, the structured questionnaire was only usedas a guide, incorporating unstructured and probing, open-ended questions asdeemed appropriate and necessary by the interviewer.
The resulting interview instrument (see Appendix A) is roughly dividedinto four sections. The first section starts with simple questions concerningthe individual, their role in the organization, and their experience with the
5.2. STAGE 1: INTERVIEWS 83
recordkeeping system technology. The second section explores the variousconstructs suggested by the literature review as they appear in the conceptualresearch model. The third section then focuses on the new construct –perceived value of records – approaching the issue from several directions.The final section explores the participant’s intention to continue to use thetechnology in the future and provides the opportunity to add additional ideasor anecdotes as they see fit.
5.2.2 Data Collection Methods
The dyadic nature of interviews is one in which bias and error are likely to bepresent, which may be a result of interviewer and interviewee background char-acteristics, psychological attributes, and behavior (Smith & Albaum, 2010).In order for the interview instrument to successfully capture a useful amountof high-value information, a wider range of factors than ‘good questions’ mustbe taken into account. Some of these include: context, content, structure,disclosure, feedback, and levels of cooperation and/or conflict (Stewart &Cash, 2008).
In addition, Smith and Albaum (2012, p. 41) emphasize that dyadicinteractions can be affected by other intervening factors that can be controlledby the interviewer:
The interviewer can likewise control the style of interviewing andthereby affect the quality of information obtained. For example,styles can range from socio-emotional (maintaining a warm, sym-pathetic, and understanding relationship with the respondent)to formal (where the person-oriented actions of the interviewerare held to a socially acceptable minimum). The researcher mustthen assess the desirability of one style over the other in a givensituation.
With the above firmly in mind, twelve (12) interview participants weresought from the New Zealand public sector who also met the criteria of thetarget population (see Section 4.3). The sample consisted of a judgmentsample1 of four individuals selected from each of three different organizations,representing a variety of roles and management levels. All were willing to
1The interview participants were recommended by the organizations’ records managersbased on a verbal description of the targeted sample population. They were generally ‘goodusers’ of their systems and had been involved with attempts to recruit others to use thesystem.

84 CHAPTER 5. PHASE I: QUALITATIVE METHODS
discuss the use of their electronic recordkeeping system within the context oftheir organization.
In order to promote trust and cooperation, the interviews were held inquiet meeting rooms or private offices that were familiar to the interviewee. Apositive socio-emotional approach dominated the tone of the interviews, withfriendly non-verbal queues and feedback used liberally to encourage disclosure.Furthermore, the structure of the interview instrument was designed so thatthe more difficult questions were posed in the second half of the interview inorder to maximize the quality of the interview responses (Byrne, 2001b).
Each interview was approximately one hour in duration, was digitallyrecorded, and was transcribed by the interviewer immediately after theinterview, within a timeframe ranging from ‘that afternoon’ to 1–3 days afterthe interview. Copies of the interview transcripts were made available toparticipants on request. The data contained in the transcripts were used as thebasis for the next step – the development of the initial pool of measurementitems.
5.2.3 Thematic Analysis Methods
The next step in the interview stage focused on the analysis of the interviewtranscripts in an attempt to derive some meaning and/or patterns that couldcontribute to the development of a pool of measurement items. Thematicanalysis was selected as the most suitable technique (Byrne, 2001a; Priest,Roberts, & Woods, 2002; Woods et al., 2002). Thematic analysis is a methodfor identifying, analyzing, and reporting patterns (or themes) within data(Braun & Clarke, 2006); or in other words, “a form of pattern recognitionwithin the data, where emerging themes become the categories for analysis”(Fereday & Muir-Cochrane, 2008).
Braun and Clarke (2006, p. 78) argue that qualitative methods fall intobasically two camps. In the first camp are found methods that are “tiedto, or stemming from, a particular theoretical or epistemological position.[. . . ] Second, there are methods that are essentially independent of theoryand epistemology, and can be applied across a range of theoretical andepistemological approaches.” They conclude that thematic analysis is “firmlyin the second camp.” The different steps or phases of thematic analysis asdescribed by Braun and Clarke (2006, p. 87) and are reproduced in detail inTable 5.1.
After consideration of the pros and cons of using software to ease theprocess of thematic coding for qualitative research (A. Atherton & Elsmore,
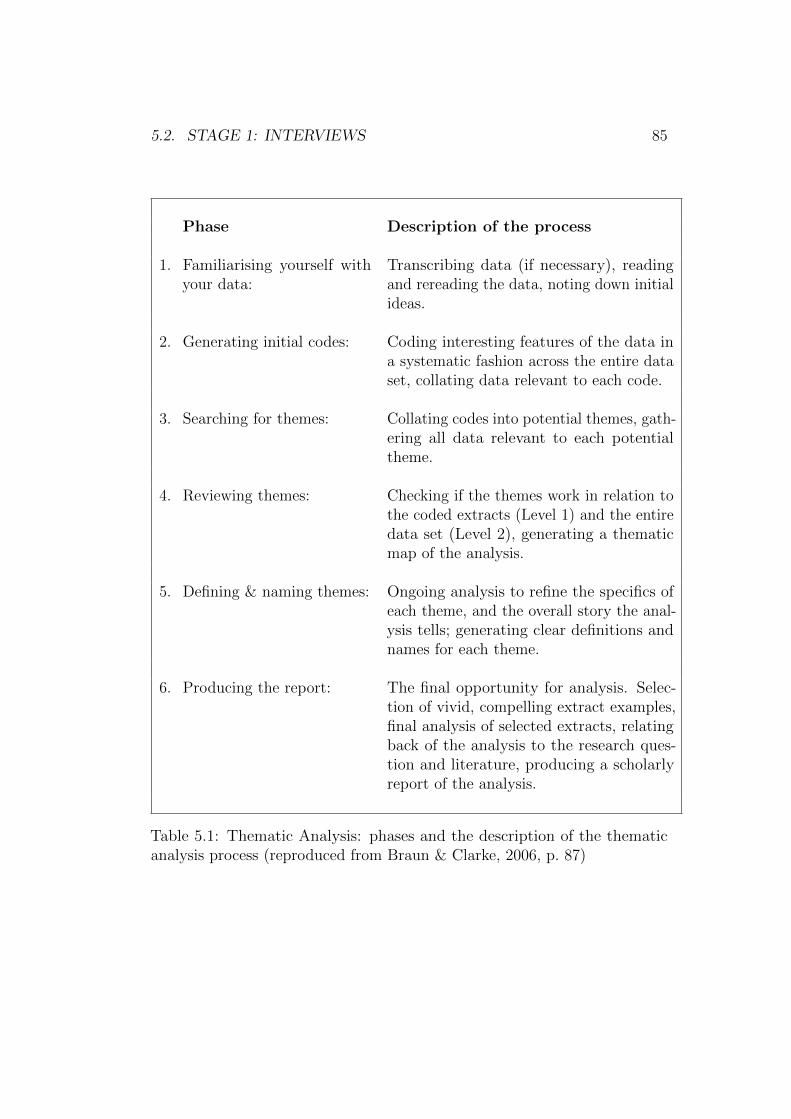
5.2. STAGE 1: INTERVIEWS 85
Phase Description of the process
1. Familiarising yourself withyour data:
Transcribing data (if necessary), readingand rereading the data, noting down initialideas.
2. Generating initial codes: Coding interesting features of the data ina systematic fashion across the entire dataset, collating data relevant to each code.
3. Searching for themes: Collating codes into potential themes, gath-ering all data relevant to each potentialtheme.
4. Reviewing themes: Checking if the themes work in relation tothe coded extracts (Level 1) and the entiredata set (Level 2), generating a thematicmap of the analysis.
5. Defining & naming themes: Ongoing analysis to refine the specifics ofeach theme, and the overall story the anal-ysis tells; generating clear definitions andnames for each theme.
6. Producing the report: The final opportunity for analysis. Selec-tion of vivid, compelling extract examples,final analysis of selected extracts, relatingback of the analysis to the research ques-tion and literature, producing a scholarlyreport of the analysis.
Table 5.1: Thematic Analysis: phases and the description of the thematicanalysis process (reproduced from Braun & Clarke, 2006, p. 87)
86 CHAPTER 5. PHASE I: QUALITATIVE METHODS
2007), it was decided that the pragmatic goals of this research – namely,the creation of a pool of measurement items – outweighed the difficultiesof ‘contextual reassembly’ that might warrant the use of manual qualitativeanalysis methods.2 To this end, QSR International’s NVivo 10 qualitativedata analysis software greatly assisted in the completion of the subsequentthematic analysis.
Using NVivo, every phrase and paragraph of the interview transcripts wasseparately considered and coded. Each theme (or ‘node’ in NVivo) was formedbased on the interpretation of the general intent of an interview statement andwas both labeled and defined at creation. Several iterations were necessaryto code interview phrases logically and consistently. To assist with codingconsistency, a thematic analysis ‘dictionary’ was created for personal use. Thisdictionary grew to contain over sixty codes, their working definitions, and 1–3illustrative quotations per defined code. The number of codes was eventuallyreduced/combined to form forty (40) themes that effectively emerged fromthe interview stage.
Two main measures were used to determine the relative importance ofa particular theme: the number of participants who mentioned the theme,and the total number of times it came up in the interviews. For example,the importance of ‘effective search’ in an EDRMS was a theme mentionedby all 12 participants and referred to 51 times. In contrast, the influence oforganizational policy on use was only mentioned by 3 participants and ononly 4 occasions, while the need for a more flexible EDRMS interface wasonly mentioned once.
5.2.4 Item Creation Analysis and Results
As recommended in Table 5.1, the emergent codes were first developed andapplied as a single pool across the entire data set. However, these were latergrouped into themes and then further grouped according to the constructsin alignment with the research model (Figure 3.2). Given the challenge ofreporting this iterative and interconnected analysis process in a linear fashion,the following sections will detail the development of individual measurement
2It could be argued that contextual reassembly is more targeted at the ‘first camp’ ofanalysis techniques, where methods such as Grounded Theory require the reassembly ofthemes to create new theory (Corbin & Strauss, 2008).
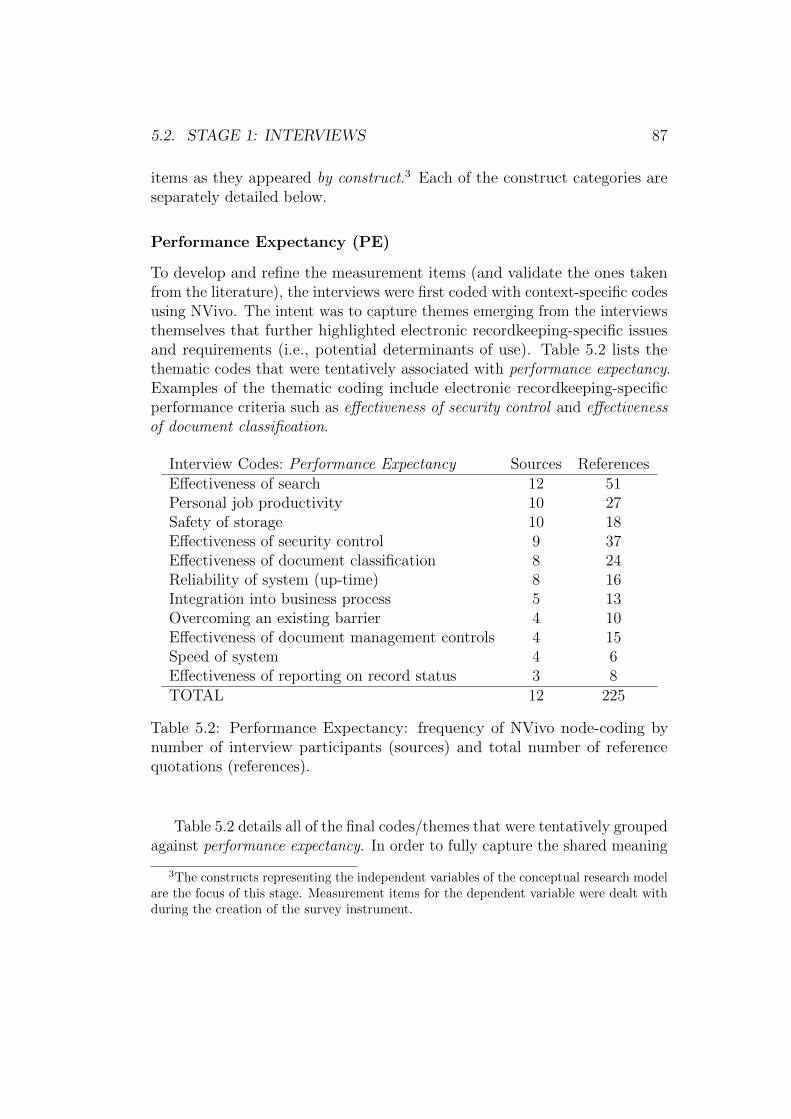
5.2. STAGE 1: INTERVIEWS 87
items as they appeared by construct.3 Each of the construct categories areseparately detailed below.
Performance Expectancy (PE)
To develop and refine the measurement items (and validate the ones takenfrom the literature), the interviews were first coded with context-specific codesusing NVivo. The intent was to capture themes emerging from the interviewsthemselves that further highlighted electronic recordkeeping-specific issuesand requirements (i.e., potential determinants of use). Table 5.2 lists thethematic codes that were tentatively associated with performance expectancy.Examples of the thematic coding include electronic recordkeeping-specificperformance criteria such as effectiveness of security control and effectivenessof document classification.
Interview Codes: Performance Expectancy Sources ReferencesEffectiveness of search 12 51Personal job productivity 10 27Safety of storage 10 18Effectiveness of security control 9 37Effectiveness of document classification 8 24Reliability of system (up-time) 8 16Integration into business process 5 13Overcoming an existing barrier 4 10Effectiveness of document management controls 4 15Speed of system 4 6Effectiveness of reporting on record status 3 8TOTAL 12 225
Table 5.2: Performance Expectancy: frequency of NVivo node-coding bynumber of interview participants (sources) and total number of referencequotations (references).
Table 5.2 details all of the final codes/themes that were tentatively groupedagainst performance expectancy. In order to fully capture the shared meaning
3The constructs representing the independent variables of the conceptual research modelare the focus of this stage. Measurement items for the dependent variable were dealt withduring the creation of the survey instrument.
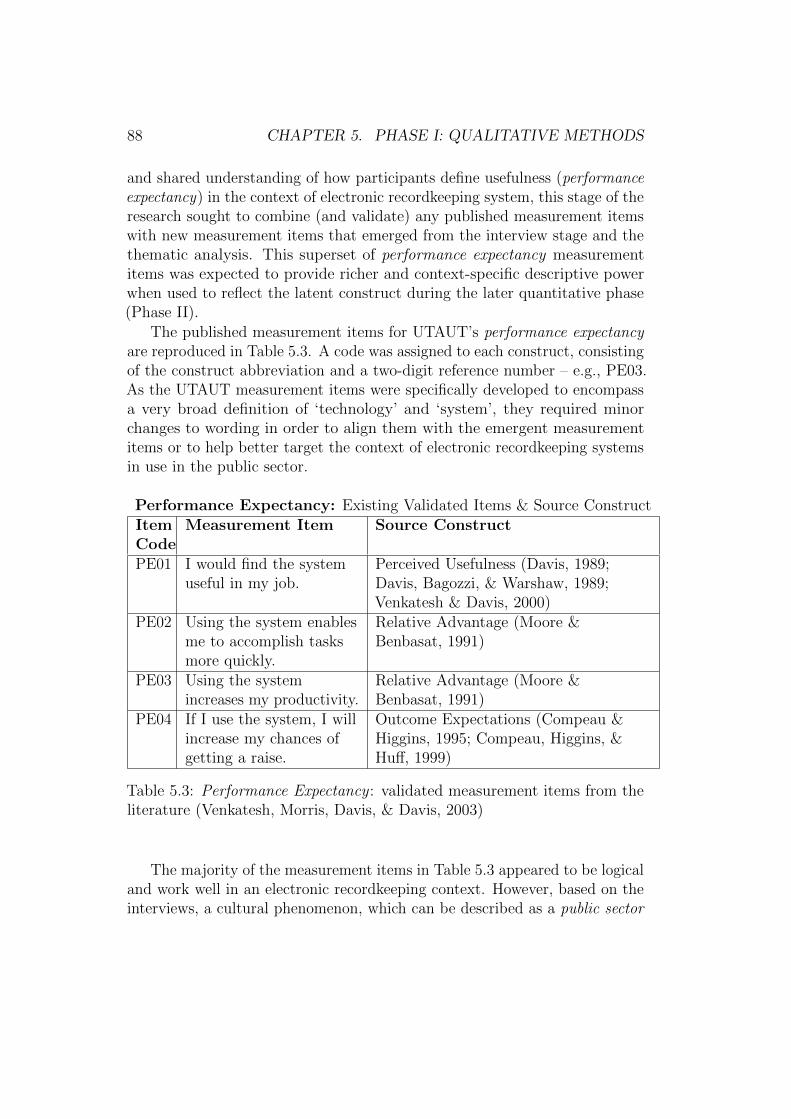
88 CHAPTER 5. PHASE I: QUALITATIVE METHODS
and shared understanding of how participants define usefulness (performanceexpectancy) in the context of electronic recordkeeping system, this stage of theresearch sought to combine (and validate) any published measurement itemswith new measurement items that emerged from the interview stage and thethematic analysis. This superset of performance expectancy measurementitems was expected to provide richer and context-specific descriptive powerwhen used to reflect the latent construct during the later quantitative phase(Phase II).
The published measurement items for UTAUT’s performance expectancyare reproduced in Table 5.3. A code was assigned to each construct, consistingof the construct abbreviation and a two-digit reference number – e.g., PE03.As the UTAUT measurement items were specifically developed to encompassa very broad definition of ‘technology’ and ‘system’, they required minorchanges to wording in order to align them with the emergent measurementitems or to help better target the context of electronic recordkeeping systemsin use in the public sector.
Performance Expectancy: Existing Validated Items & Source ConstructItemCode
Measurement Item Source Construct
PE01 I would find the systemuseful in my job.
Perceived Usefulness (Davis, 1989;Davis, Bagozzi, & Warshaw, 1989;Venkatesh & Davis, 2000)
PE02 Using the system enablesme to accomplish tasksmore quickly.
Relative Advantage (Moore &Benbasat, 1991)
PE03 Using the systemincreases my productivity.
Relative Advantage (Moore &Benbasat, 1991)
PE04 If I use the system, I willincrease my chances ofgetting a raise.
Outcome Expectations (Compeau &Higgins, 1995; Compeau, Higgins, &Huff, 1999)
Table 5.3: Performance Expectancy : validated measurement items from theliterature (Venkatesh, Morris, Davis, & Davis, 2003)
The majority of the measurement items in Table 5.3 appeared to be logicaland work well in an electronic recordkeeping context. However, based on theinterviews, a cultural phenomenon, which can be described as a public sector
5.2. STAGE 1: INTERVIEWS 89
ethos, was evident in the responses. In this context, public sector ethos isdefined as the extent to which an individual shares an altruistic philosophythat allows them to separate responsibility from ownership.
This was most in evidence when discussing situations where personal effortwould have been expected to lead to personal gain – a key driver in performanceexpectancy. In these cases, several participants had no expectation of receivingpersonal recognition. Two examples of public sector ethos from the interviewtranscripts are as follows:
It’s not my work! It’s not my document! I’m responsible for doinga good job and creating it, so I’m accountable for creating a goodproduct, but the product isn’t. . . I don’t own it! I can’t say: ‘Iwrote the policy. This is my policy.’ Or, ‘This is my piece ofresearch.’ It is the public’s. It is the Government’s. It is theMinister’s. It’s my boss’s.
Another participant stated:
I am personally accountable for the quality of the document andthe quality of what I produce. But, I can’t claim it as. . . mine – ifsomething goes really well, for example.
Given the lack of apparent connection between effort and reward (specifi-cally ‘pay’), the measurement item PE04: “If I use the system, I will increasemy chances of getting a raise” was less reflective of the desires or expectationsof public sector employees than other potential outcome expectations such as‘recognition.’ As such, Item PE4 was updated to: “If I use the system, I willincrease my chances of getting recognition in the workplace.”
The remaining themes – those not already covered by published measure-ment items – were then converted into draft measurement item statementsand added to the measurement item pool. The final superset of potentialmeasurement items combined the existing (adjusted) UTAUT measurementitems with the new draft measurement items that emerged from the thematicanalysis. The superset of measurement items relating to the performanceexpectancy construct category are listed in Table 5.4.
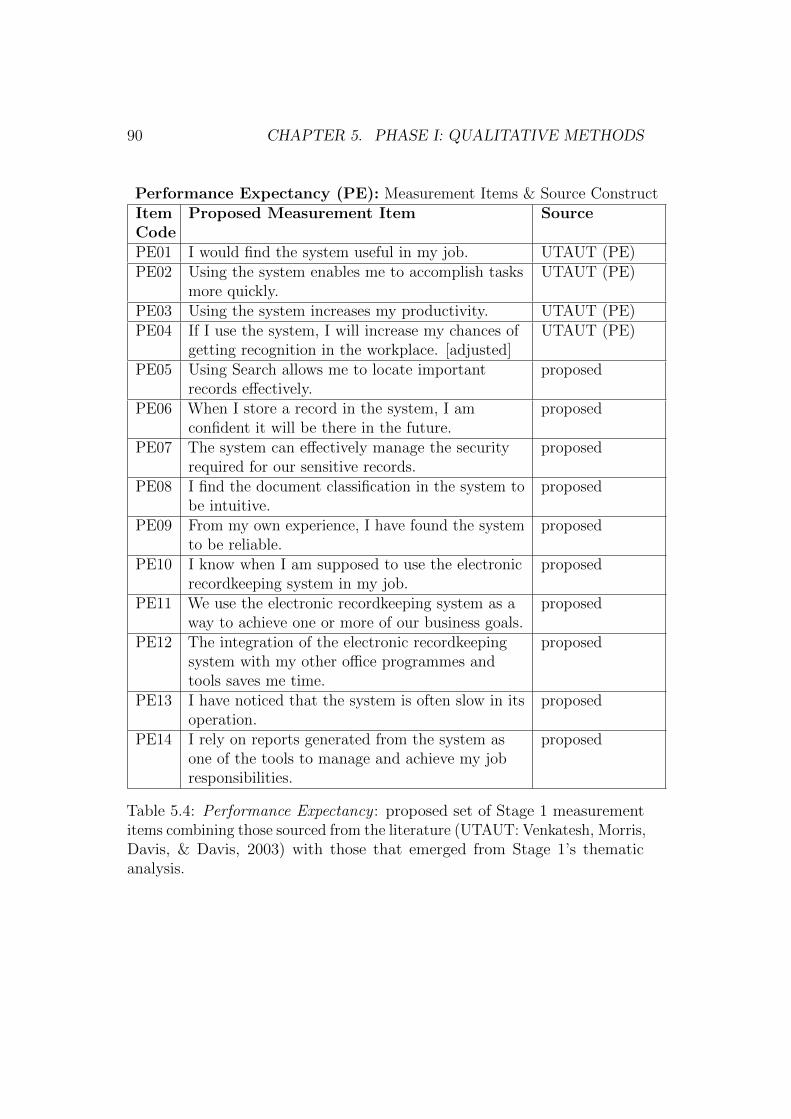
90 CHAPTER 5. PHASE I: QUALITATIVE METHODS
Performance Expectancy (PE): Measurement Items & Source ConstructItemCode
Proposed Measurement Item Source
PE01 I would find the system useful in my job. UTAUT (PE)PE02 Using the system enables me to accomplish tasks
more quickly.UTAUT (PE)
PE03 Using the system increases my productivity. UTAUT (PE)PE04 If I use the system, I will increase my chances of
getting recognition in the workplace. [adjusted]UTAUT (PE)
PE05 Using Search allows me to locate importantrecords effectively.
proposed
PE06 When I store a record in the system, I amconfident it will be there in the future.
proposed
PE07 The system can effectively manage the securityrequired for our sensitive records.
proposed
PE08 I find the document classification in the system tobe intuitive.
proposed
PE09 From my own experience, I have found the systemto be reliable.
proposed
PE10 I know when I am supposed to use the electronicrecordkeeping system in my job.
proposed
PE11 We use the electronic recordkeeping system as away to achieve one or more of our business goals.
proposed
PE12 The integration of the electronic recordkeepingsystem with my other office programmes andtools saves me time.
proposed
PE13 I have noticed that the system is often slow in itsoperation.
proposed
PE14 I rely on reports generated from the system asone of the tools to manage and achieve my jobresponsibilities.
proposed
Table 5.4: Performance Expectancy : proposed set of Stage 1 measurementitems combining those sourced from the literature (UTAUT: Venkatesh, Morris,Davis, & Davis, 2003) with those that emerged from Stage 1’s thematicanalysis.
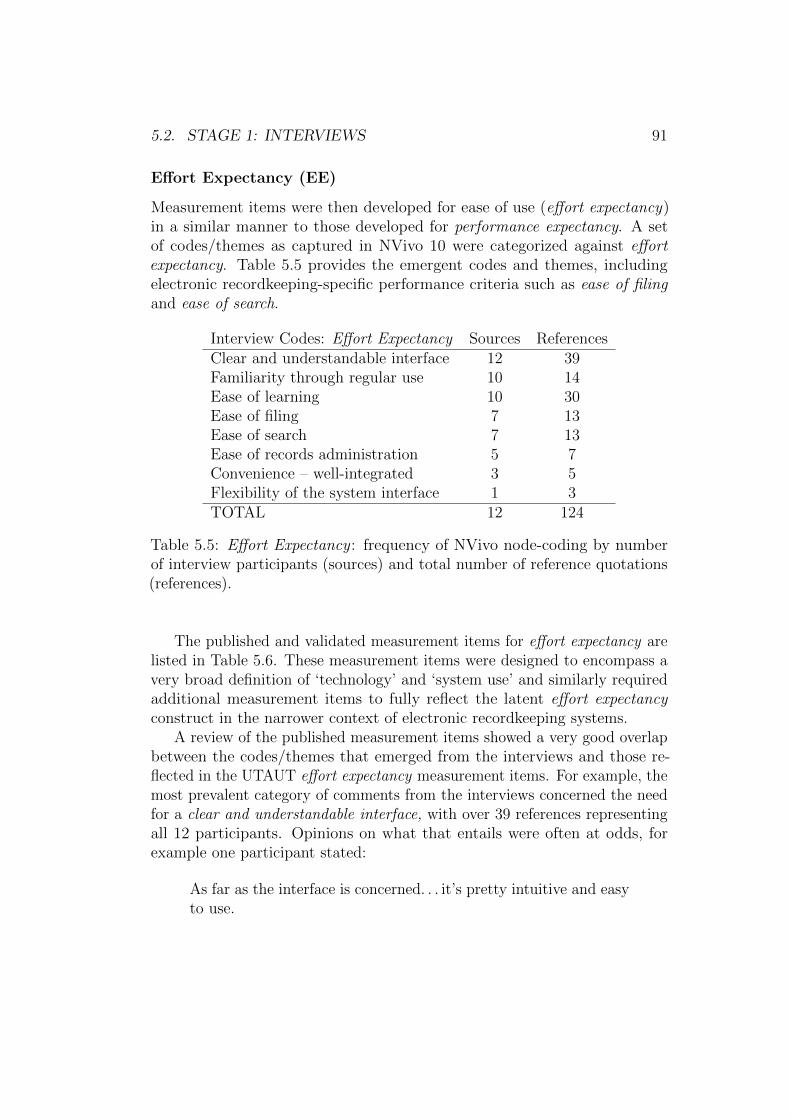
5.2. STAGE 1: INTERVIEWS 91
Effort Expectancy (EE)
Measurement items were then developed for ease of use (effort expectancy)in a similar manner to those developed for performance expectancy. A setof codes/themes as captured in NVivo 10 were categorized against effortexpectancy. Table 5.5 provides the emergent codes and themes, includingelectronic recordkeeping-specific performance criteria such as ease of filingand ease of search.
Interview Codes: Effort Expectancy Sources ReferencesClear and understandable interface 12 39Familiarity through regular use 10 14Ease of learning 10 30Ease of filing 7 13Ease of search 7 13Ease of records administration 5 7Convenience – well-integrated 3 5Flexibility of the system interface 1 3TOTAL 12 124
Table 5.5: Effort Expectancy : frequency of NVivo node-coding by numberof interview participants (sources) and total number of reference quotations(references).
The published and validated measurement items for effort expectancy arelisted in Table 5.6. These measurement items were designed to encompass avery broad definition of ‘technology’ and ‘system use’ and similarly requiredadditional measurement items to fully reflect the latent effort expectancyconstruct in the narrower context of electronic recordkeeping systems.
A review of the published measurement items showed a very good overlapbetween the codes/themes that emerged from the interviews and those re-flected in the UTAUT effort expectancy measurement items. For example, themost prevalent category of comments from the interviews concerned the needfor a clear and understandable interface, with over 39 references representingall 12 participants. Opinions on what that entails were often at odds, forexample one participant stated:
As far as the interface is concerned. . . it’s pretty intuitive and easyto use.
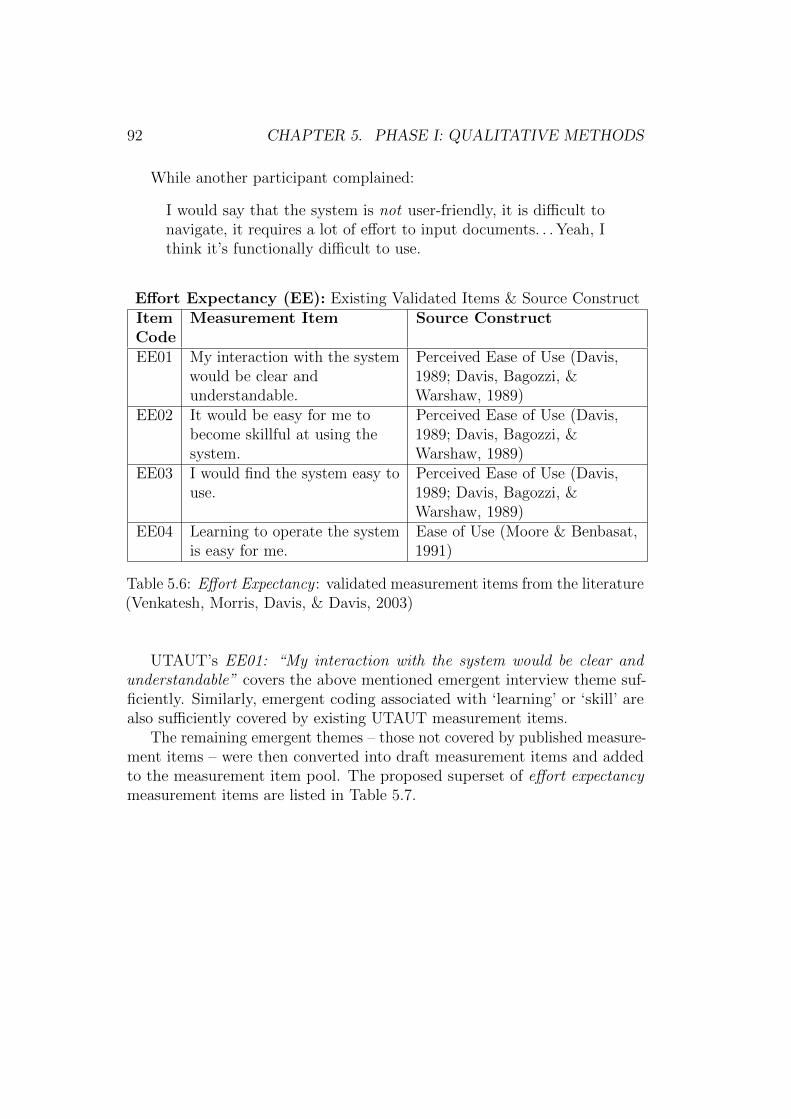
92 CHAPTER 5. PHASE I: QUALITATIVE METHODS
While another participant complained:
I would say that the system is not user-friendly, it is difficult tonavigate, it requires a lot of effort to input documents. . . Yeah, Ithink it’s functionally difficult to use.
Effort Expectancy (EE): Existing Validated Items & Source ConstructItemCode
Measurement Item Source Construct
EE01 My interaction with the systemwould be clear andunderstandable.
Perceived Ease of Use (Davis,1989; Davis, Bagozzi, &Warshaw, 1989)
EE02 It would be easy for me tobecome skillful at using thesystem.
Perceived Ease of Use (Davis,1989; Davis, Bagozzi, &Warshaw, 1989)
EE03 I would find the system easy touse.
Perceived Ease of Use (Davis,1989; Davis, Bagozzi, &Warshaw, 1989)
EE04 Learning to operate the systemis easy for me.
Ease of Use (Moore & Benbasat,1991)
Table 5.6: Effort Expectancy : validated measurement items from the literature(Venkatesh, Morris, Davis, & Davis, 2003)
UTAUT’s EE01: “My interaction with the system would be clear andunderstandable” covers the above mentioned emergent interview theme suf-ficiently. Similarly, emergent coding associated with ‘learning’ or ‘skill’ arealso sufficiently covered by existing UTAUT measurement items.
The remaining emergent themes – those not covered by published measure-ment items – were then converted into draft measurement items and addedto the measurement item pool. The proposed superset of effort expectancymeasurement items are listed in Table 5.7.
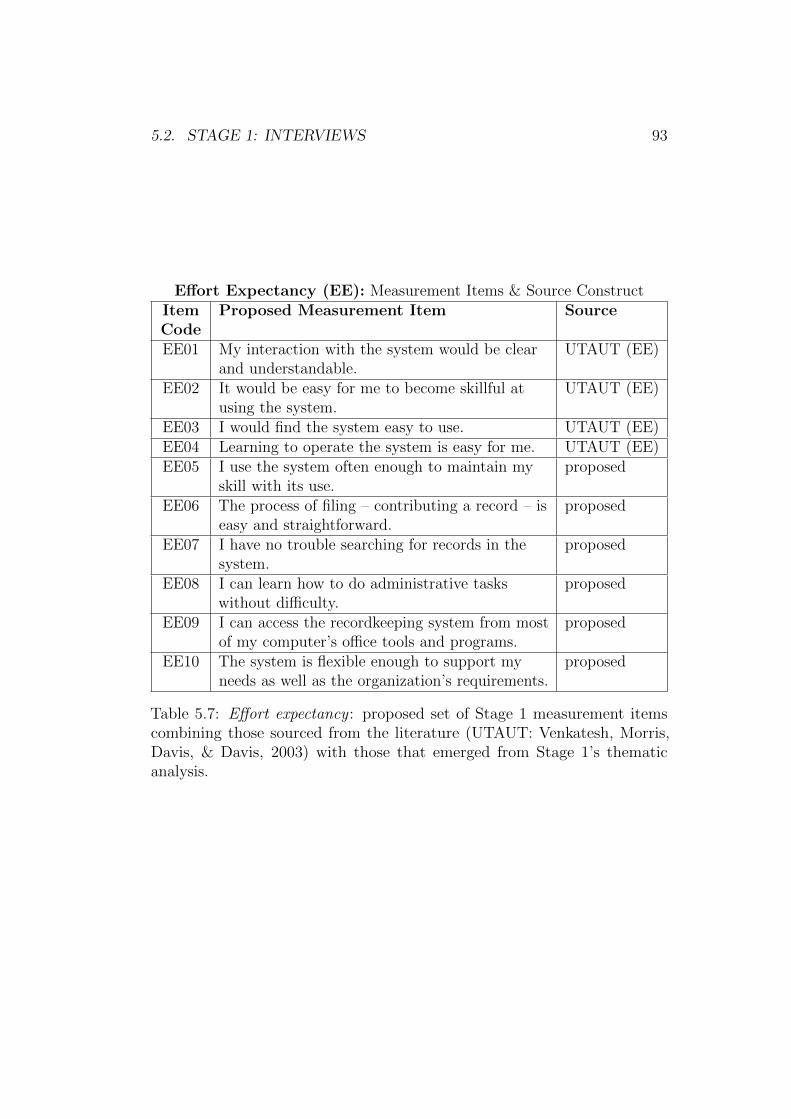
5.2. STAGE 1: INTERVIEWS 93
Effort Expectancy (EE): Measurement Items & Source ConstructItemCode
Proposed Measurement Item Source
EE01 My interaction with the system would be clearand understandable.
UTAUT (EE)
EE02 It would be easy for me to become skillful atusing the system.
UTAUT (EE)
EE03 I would find the system easy to use. UTAUT (EE)EE04 Learning to operate the system is easy for me. UTAUT (EE)EE05 I use the system often enough to maintain my
skill with its use.proposed
EE06 The process of filing – contributing a record – iseasy and straightforward.
proposed
EE07 I have no trouble searching for records in thesystem.
proposed
EE08 I can learn how to do administrative taskswithout difficulty.
proposed
EE09 I can access the recordkeeping system from mostof my computer’s office tools and programs.
proposed
EE10 The system is flexible enough to support myneeds as well as the organization’s requirements.
proposed
Table 5.7: Effort expectancy : proposed set of Stage 1 measurement itemscombining those sourced from the literature (UTAUT: Venkatesh, Morris,Davis, & Davis, 2003) with those that emerged from Stage 1’s thematicanalysis.
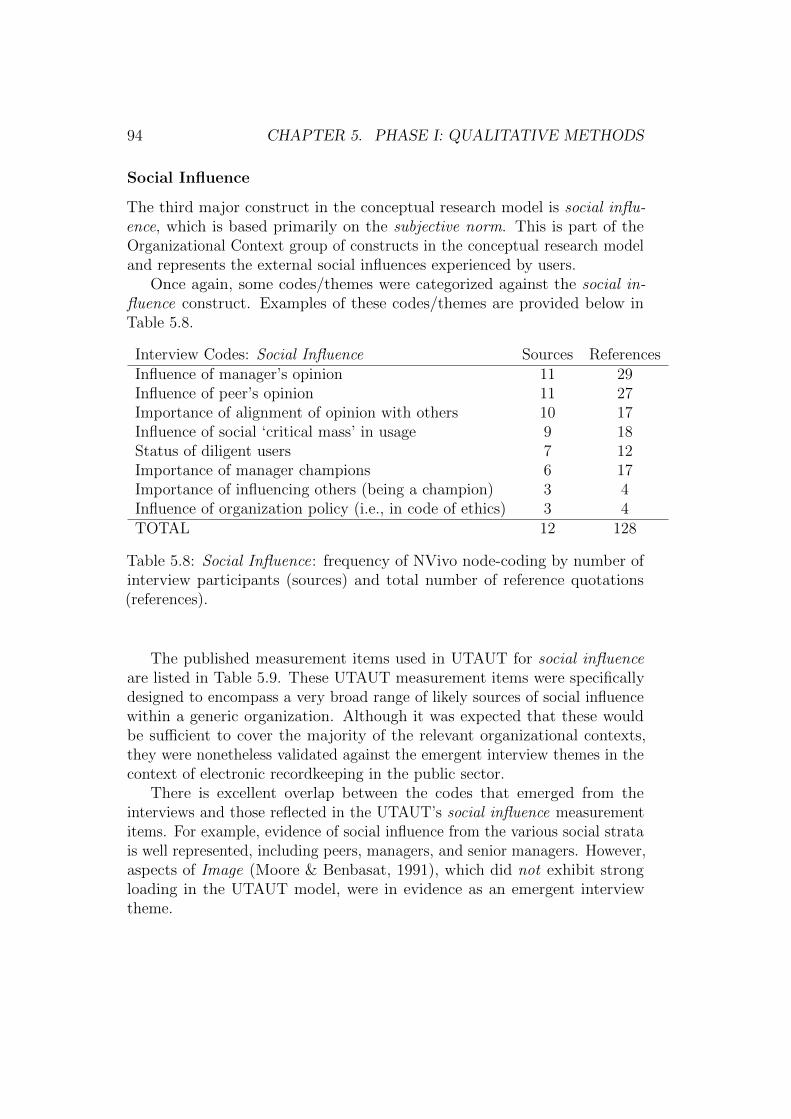
94 CHAPTER 5. PHASE I: QUALITATIVE METHODS
Social Influence
The third major construct in the conceptual research model is social influ-ence, which is based primarily on the subjective norm. This is part of theOrganizational Context group of constructs in the conceptual research modeland represents the external social influences experienced by users.
Once again, some codes/themes were categorized against the social in-fluence construct. Examples of these codes/themes are provided below inTable 5.8.
Interview Codes: Social Influence Sources ReferencesInfluence of manager’s opinion 11 29Influence of peer’s opinion 11 27Importance of alignment of opinion with others 10 17Influence of social ‘critical mass’ in usage 9 18Status of diligent users 7 12Importance of manager champions 6 17Importance of influencing others (being a champion) 3 4Influence of organization policy (i.e., in code of ethics) 3 4TOTAL 12 128
Table 5.8: Social Influence: frequency of NVivo node-coding by number ofinterview participants (sources) and total number of reference quotations(references).
The published measurement items used in UTAUT for social influenceare listed in Table 5.9. These UTAUT measurement items were specificallydesigned to encompass a very broad range of likely sources of social influencewithin a generic organization. Although it was expected that these wouldbe sufficient to cover the majority of the relevant organizational contexts,they were nonetheless validated against the emergent interview themes in thecontext of electronic recordkeeping in the public sector.
There is excellent overlap between the codes that emerged from theinterviews and those reflected in the UTAUT’s social influence measurementitems. For example, evidence of social influence from the various social stratais well represented, including peers, managers, and senior managers. However,aspects of Image (Moore & Benbasat, 1991), which did not exhibit strongloading in the UTAUT model, were in evidence as an emergent interviewtheme.
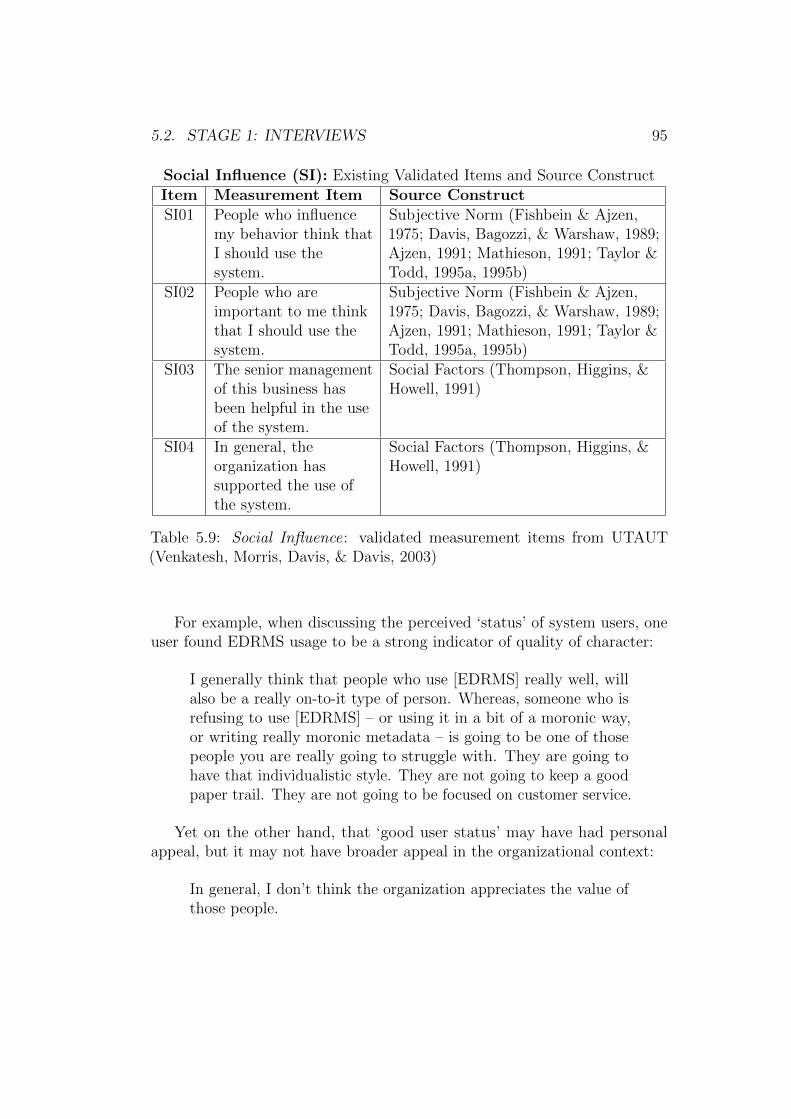
5.2. STAGE 1: INTERVIEWS 95
Social Influence (SI): Existing Validated Items and Source ConstructItem Measurement Item Source ConstructSI01 People who influence
my behavior think thatI should use thesystem.
Subjective Norm (Fishbein & Ajzen,1975; Davis, Bagozzi, & Warshaw, 1989;Ajzen, 1991; Mathieson, 1991; Taylor &Todd, 1995a, 1995b)
SI02 People who areimportant to me thinkthat I should use thesystem.
Subjective Norm (Fishbein & Ajzen,1975; Davis, Bagozzi, & Warshaw, 1989;Ajzen, 1991; Mathieson, 1991; Taylor &Todd, 1995a, 1995b)
SI03 The senior managementof this business hasbeen helpful in the useof the system.
Social Factors (Thompson, Higgins, &Howell, 1991)
SI04 In general, theorganization hassupported the use ofthe system.
Social Factors (Thompson, Higgins, &Howell, 1991)
Table 5.9: Social Influence: validated measurement items from UTAUT(Venkatesh, Morris, Davis, & Davis, 2003)
For example, when discussing the perceived ‘status’ of system users, oneuser found EDRMS usage to be a strong indicator of quality of character:
I generally think that people who use [EDRMS] really well, willalso be a really on-to-it type of person. Whereas, someone who isrefusing to use [EDRMS] – or using it in a bit of a moronic way,or writing really moronic metadata – is going to be one of thosepeople you are really going to struggle with. They are going tohave that individualistic style. They are not going to keep a goodpaper trail. They are not going to be focused on customer service.
Yet on the other hand, that ‘good user status’ may have had personalappeal, but it may not have broader appeal in the organizational context:
In general, I don’t think the organization appreciates the value ofthose people.
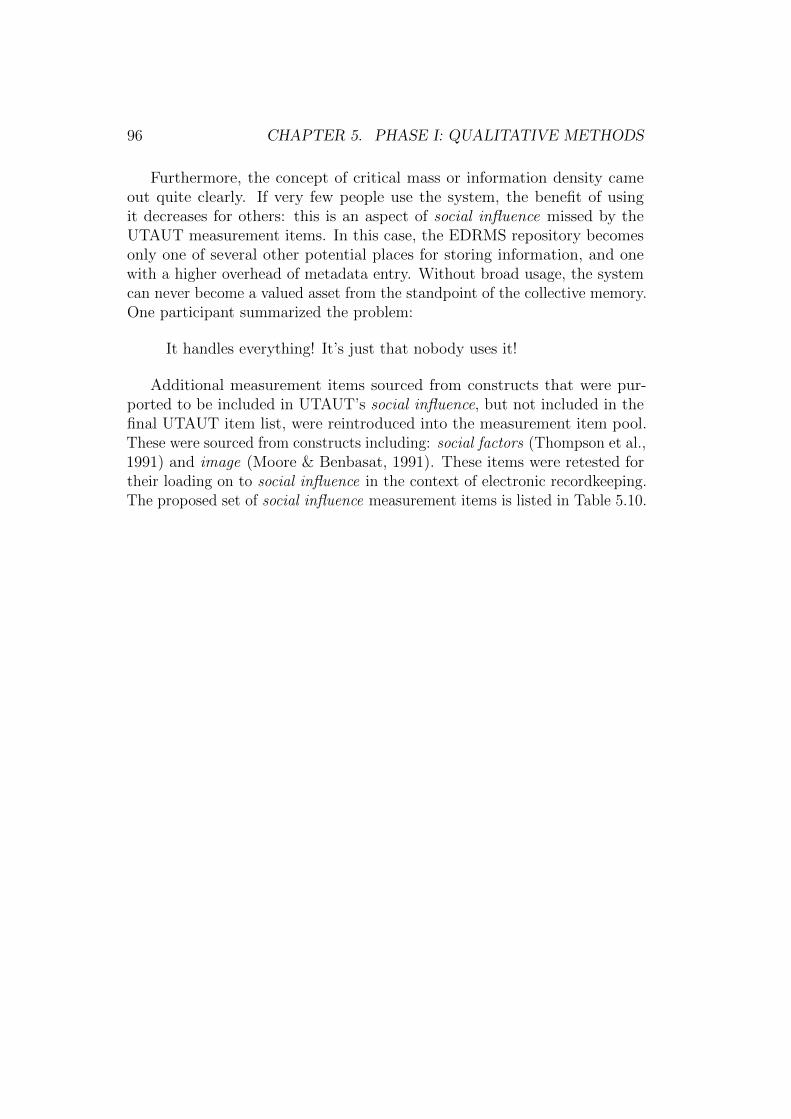
96 CHAPTER 5. PHASE I: QUALITATIVE METHODS
Furthermore, the concept of critical mass or information density cameout quite clearly. If very few people use the system, the benefit of usingit decreases for others: this is an aspect of social influence missed by theUTAUT measurement items. In this case, the EDRMS repository becomesonly one of several other potential places for storing information, and onewith a higher overhead of metadata entry. Without broad usage, the systemcan never become a valued asset from the standpoint of the collective memory.One participant summarized the problem:
It handles everything! It’s just that nobody uses it!
Additional measurement items sourced from constructs that were pur-ported to be included in UTAUT’s social influence, but not included in thefinal UTAUT item list, were reintroduced into the measurement item pool.These were sourced from constructs including: social factors (Thompson et al.,1991) and image (Moore & Benbasat, 1991). These items were retested fortheir loading on to social influence in the context of electronic recordkeeping.The proposed set of social influence measurement items is listed in Table 5.10.
5.2. STAGE 1: INTERVIEWS 97
Social Influence (SI): Measurement Items & Source ConstructItemCode
Proposed Measurement Item Source
SI01 People who influence my behavior thinkthat I should use the system.
UTAUT (SI)
SI02 People who are important to me thinkthat I should use the system.
UTAUT (SI)
SI03 The senior management of this businesshas been helpful in the use of thesystem.
UTAUT (SI)
SI04 In general, the organization hassupported the use of the system.
UTAUT (SI)
SI05 I use the system because of theproportion of my co-workers who usethe system.
Social Factors(Thompson, Higgins, &Howell, 1991)
SI06 People in my organization who use thesystem have more prestige than thosewho do not.
Image (Moore &Benbasat, 1991)
SI06a People in my organization who use thesystem are more reliable than those whodo not.
Proposed change toSI06
SI07 People in my organization who use thesystem have a high profile.
Image (Moore &Benbasat, 1991)
Table 5.10: Social Influence: proposed set of Stage 1 measurement itemscombining those sourced from UTAUT (Venkatesh, Morris, Davis, & Davis,2003) with others sourced from the literature that support themes fromStage 1’s thematic analysis.
98 CHAPTER 5. PHASE I: QUALITATIVE METHODS
Perceived Power Security
The fourth construct – perceived power security – represents the second aspect(i.e., the internal social aspect) of the Organizational Context component ofthe conceptual research model.
In the literature, the perceived power security construct initially appearedto be quite important in explaining some perceived barriers to using anelectronic recordkeeping system. However, among the interview participants,the importance of ‘power security’ in electronic recordkeeping systems didnot emerge as an important consideration. Even when emphasizing thepotential risks associated with transparency, judgment, and power-loss duringinterviews, the majority of the interview participants appeared unconvincedas to the importance of perceived power security in explaining system use.For example, one participant explained:
I guess there is always that risk, but as long as I am happy withthe standard that I produce, then I don’t think that it’s an issuefor me. Everyone will interpret things as they interpret them, butas long as I am personally happy with my performance, then I’mcomfortable with that. I understand, however, that some wouldfret terribly about it, and they would find it terribly, terriblydifficult, and they would choose to avoid using the system.
As the above illustrates, many people see system use as just part of thejob, with many seeing it instead as a beneficial source of evidence that wouldincrease their sense of security:
If you want job security in terms of decisions that are made, youwill make sure that you have a record, even if you have your ownlittle personal hard copy sitting near you.
However, power and its use did come out as potentially important atsome levels in the organization, particularly as applied to the perceivedrecordkeeping motivations thought to be the case at senior managementlevels:
Yes, I think they don’t want to go on the record. Knowledge ispower, and if you’re not around the table, they don’t want youto know what they’re up to. They are probably scared of makingrecords that people could go back and look at.
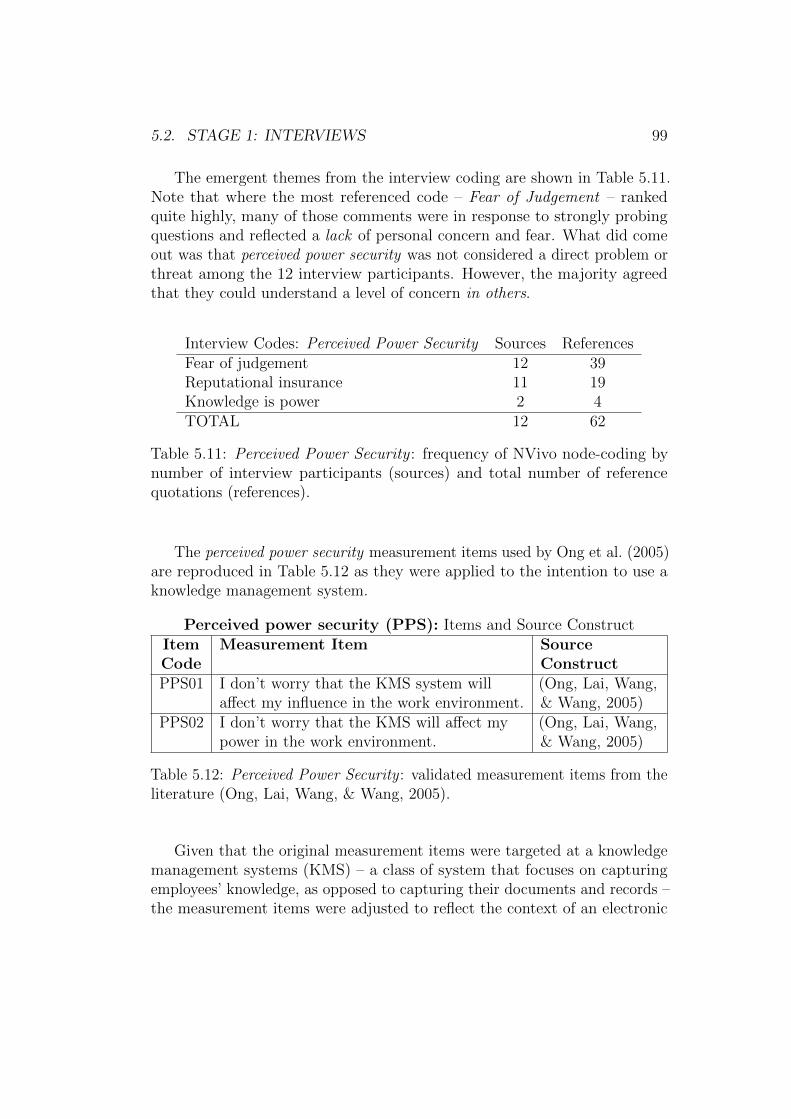
5.2. STAGE 1: INTERVIEWS 99
The emergent themes from the interview coding are shown in Table 5.11.Note that where the most referenced code – Fear of Judgement – rankedquite highly, many of those comments were in response to strongly probingquestions and reflected a lack of personal concern and fear. What did comeout was that perceived power security was not considered a direct problem orthreat among the 12 interview participants. However, the majority agreedthat they could understand a level of concern in others.
Interview Codes: Perceived Power Security Sources ReferencesFear of judgement 12 39Reputational insurance 11 19Knowledge is power 2 4TOTAL 12 62
Table 5.11: Perceived Power Security : frequency of NVivo node-coding bynumber of interview participants (sources) and total number of referencequotations (references).
The perceived power security measurement items used by Ong et al. (2005)are reproduced in Table 5.12 as they were applied to the intention to use aknowledge management system.
Perceived power security (PPS): Items and Source ConstructItemCode
Measurement Item SourceConstruct
PPS01 I don’t worry that the KMS system willaffect my influence in the work environment.
(Ong, Lai, Wang,& Wang, 2005)
PPS02 I don’t worry that the KMS will affect mypower in the work environment.
(Ong, Lai, Wang,& Wang, 2005)
Table 5.12: Perceived Power Security : validated measurement items from theliterature (Ong, Lai, Wang, & Wang, 2005).
Given that the original measurement items were targeted at a knowledgemanagement systems (KMS) – a class of system that focuses on capturingemployees’ knowledge, as opposed to capturing their documents and records –the measurement items were adjusted to reflect the context of an electronic
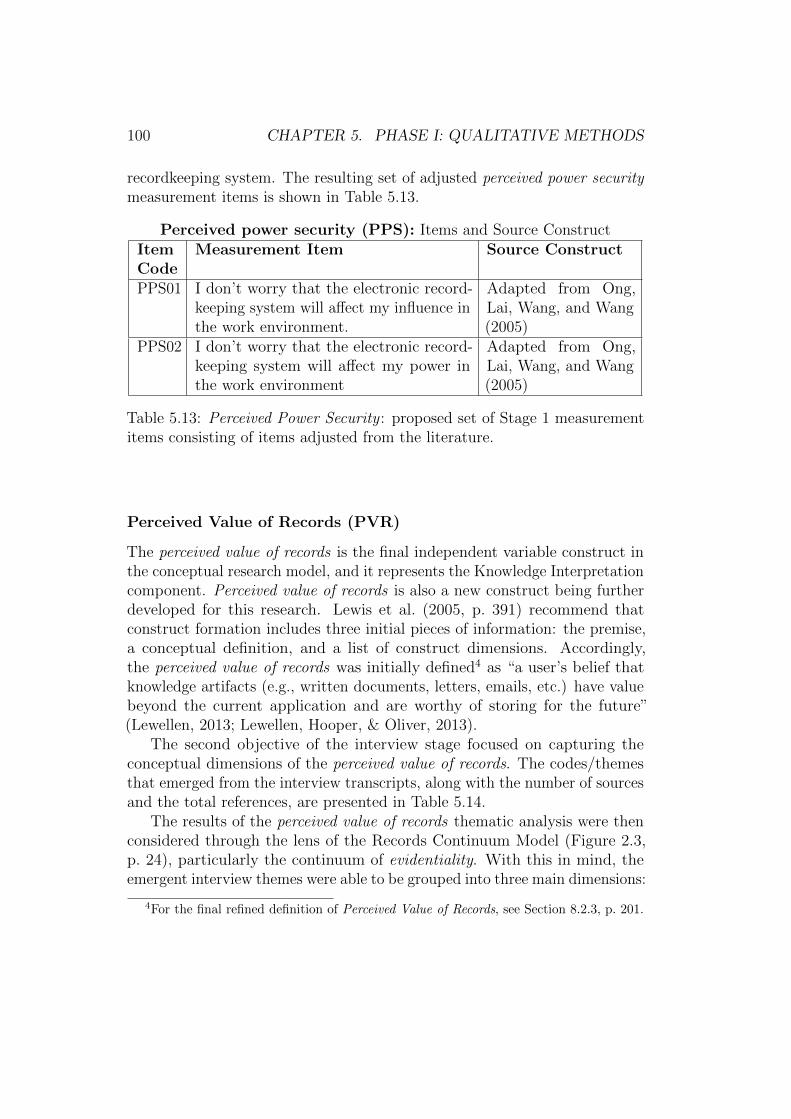
100 CHAPTER 5. PHASE I: QUALITATIVE METHODS
recordkeeping system. The resulting set of adjusted perceived power securitymeasurement items is shown in Table 5.13.
Perceived power security (PPS): Items and Source ConstructItemCode
Measurement Item Source Construct
PPS01 I don’t worry that the electronic record-keeping system will affect my influence inthe work environment.
Adapted from Ong,Lai, Wang, and Wang(2005)
PPS02 I don’t worry that the electronic record-keeping system will affect my power inthe work environment
Adapted from Ong,Lai, Wang, and Wang(2005)
Table 5.13: Perceived Power Security : proposed set of Stage 1 measurementitems consisting of items adjusted from the literature.
Perceived Value of Records (PVR)
The perceived value of records is the final independent variable construct inthe conceptual research model, and it represents the Knowledge Interpretationcomponent. Perceived value of records is also a new construct being furtherdeveloped for this research. Lewis et al. (2005, p. 391) recommend thatconstruct formation includes three initial pieces of information: the premise,a conceptual definition, and a list of construct dimensions. Accordingly,the perceived value of records was initially defined4 as “a user’s belief thatknowledge artifacts (e.g., written documents, letters, emails, etc.) have valuebeyond the current application and are worthy of storing for the future”(Lewellen, 2013; Lewellen, Hooper, & Oliver, 2013).
The second objective of the interview stage focused on capturing theconceptual dimensions of the perceived value of records. The codes/themesthat emerged from the interview transcripts, along with the number of sourcesand the total references, are presented in Table 5.14.
The results of the perceived value of records thematic analysis were thenconsidered through the lens of the Records Continuum Model (Figure 2.3,p. 24), particularly the continuum of evidentiality. With this in mind, theemergent interview themes were able to be grouped into three main dimensions:
4For the final refined definition of Perceived Value of Records, see Section 8.2.3, p. 201.
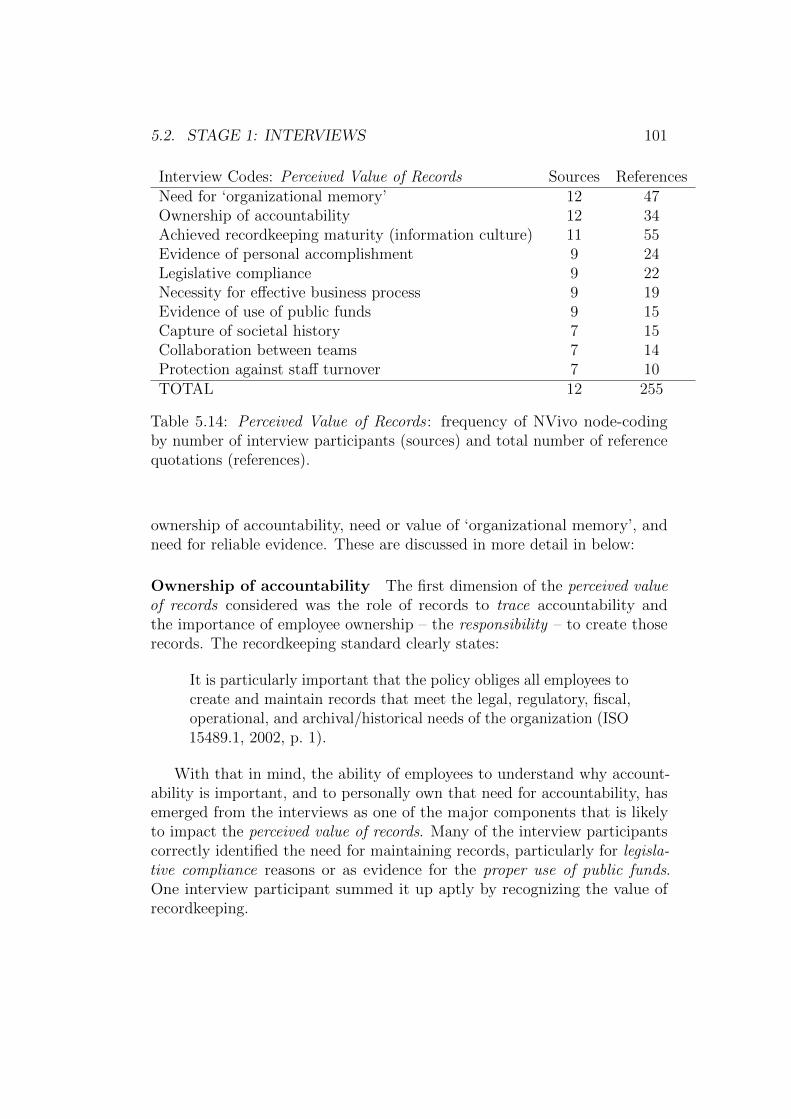
5.2. STAGE 1: INTERVIEWS 101
Interview Codes: Perceived Value of Records Sources ReferencesNeed for ‘organizational memory’ 12 47Ownership of accountability 12 34Achieved recordkeeping maturity (information culture) 11 55Evidence of personal accomplishment 9 24Legislative compliance 9 22Necessity for effective business process 9 19Evidence of use of public funds 9 15Capture of societal history 7 15Collaboration between teams 7 14Protection against staff turnover 7 10TOTAL 12 255
Table 5.14: Perceived Value of Records: frequency of NVivo node-codingby number of interview participants (sources) and total number of referencequotations (references).
ownership of accountability, need or value of ‘organizational memory’, andneed for reliable evidence. These are discussed in more detail in below:
Ownership of accountability The first dimension of the perceived valueof records considered was the role of records to trace accountability andthe importance of employee ownership – the responsibility – to create thoserecords. The recordkeeping standard clearly states:
It is particularly important that the policy obliges all employees tocreate and maintain records that meet the legal, regulatory, fiscal,operational, and archival/historical needs of the organization (ISO15489.1, 2002, p. 1).
With that in mind, the ability of employees to understand why account-ability is important, and to personally own that need for accountability, hasemerged from the interviews as one of the major components that is likelyto impact the perceived value of records. Many of the interview participantscorrectly identified the need for maintaining records, particularly for legisla-tive compliance reasons or as evidence for the proper use of public funds.One interview participant summed it up aptly by recognizing the value ofrecordkeeping.
102 CHAPTER 5. PHASE I: QUALITATIVE METHODS
As part of an open and transparent society, where the citizens de-serve the right to know what the government is doing. . . . Recordsassume an importance for that reason; that if need be, citizenscan trace back why decisions were made.
That said, it came through very clearly that many employees do not yetown the need to participate in creating that ‘transparent society’ throughgood personal recordkeeping. Many comments reflected this interpretation,including:
I just think that the organization has bigger fish to fry.
There is no management champion of it [EDRMS] by any means.
The last thing he wants to know about is actually filing anything.
This apparent lack of ownership at a personal level of the need to maintainorganizational accountability is expected to impact the perceived value ofrecords and ultimately the intention to use an electronic recordkeeping system.
Value of organizational memory “An organization’s ability to collect,store and use knowledge it has generated through experience can have im-portant consequences for its performance” (Olivera, 2000, p. 811). Thisstatement, if true, simultaneously provides a mechanism and outcome, as wellas a basic business driver for creating, maintaining, and accessing a form oforganizational memory.
Stein (1995) defined Organizational Memory as “the means by whichknowledge from the past is brought to bear on present activities, thus resultingin higher or lower levels of organizational effectiveness.” Walsh and Ungson(1991) also emphasized that the repositories of that organizational memoryneed not be limited to its records, and that organizational memory exists in‘bins’ including individuals, culture, transformations, structures, and ecology.As discussed, organizational memory can exist in many guises, with recordsbeing one of the most visible, obvious, and tangible forms.
Organizational Memory is specifically mentioned in the Records Contin-uum Model as being part of the continuum of evidentiality. As such, thesecond dimension of perceived value of records can be attributed to the rolethat records have to play in the maintenance and transfer of informationthrough time.
5.2. STAGE 1: INTERVIEWS 103
Interview participants identified a number of different non-accountabilityroles that records play in the organization, including continuity – the helpfulrole of records during periods of high staff turnover; reuse of information – theability to reuse information and thus provide efficiency gains to organizationalprocesses; collaboration – between individuals, teams, and business unitsthrough a shared and trusted repository; business process – the role of recordsin the operation of business processes over time; and even societal history –the role of records in clarifying the changes in society over time.
Interview participants had a range of views on the value of organizationalmemory. Comments were sometimes quite extreme:
I think part of it is the valuable resource. I dip into the recordsto find: ‘What did we say last time? What kind of proformaapproach to attacking an issue?’ – and that’s really useful!
In contrast, another participated commented:
I’m not so sure [that records are valuable] – probably not so much.In the area of IT, things are moving so fast that sometimes adecision that’s 18-months old is almost irrelevant.
Thus, a user’s individual contextual need to access the organizationalmemory – their need for a trustworthy repository and the value to them ofwhat it contains – is also expected to impact their perceived value of records.
Need for trustworthy evidence The last dimension that emerged frominterview participants concerning the perceived value of records is a morepersonal requirement for trustworthy evidence. This is another use of records(and more specifically, recordkeeping metadata), and could be consideredseparate from the broader accountability requirement or the need for theinformation contained in records in terms of ‘organizational memory’. This isthe ability to retain trustworthy records that are important primarily to theindividual. Nine of the interview participants made at least 24 mentions ofthe importance of maintaining evidence of their personal accomplishments,with the primary motivation being the use of that evidence as leverage forpromotion or for the demonstration of the ongoing delivery of value to theorganization.
The need for trustworthy evidence of employees’ accomplishments ishighlighted in a recent case where fewer employees were going to be retainedafter an organizational restructuring:
104 CHAPTER 5. PHASE I: QUALITATIVE METHODS
I think, possibly, the issue coming to a head now, for them, is:they don’t have a record of their work very easily. And they arerealizing that that could be a real problem coming up. So, I thinkthat the value of records could hit home for a few people realsoon. So, while I haven’t got everything filed in the system, thekey points are in there. So I’m reasonably comfortable, whereasmost other people [. . . ] are [saying], ‘What are we going to relyon in terms of a record of our work?’
Another interview participant cheerfully concluded:
You know, I can sum it all up. It’s all ass-covering. And ass-covering is a good thing!
The primary themes of perceived value of records that emerged from theinterviews can thus be linked back to the information that is required atvarious points time as illustrated in the Records Continuum Model (Figure 2.3,p. 24). The Records Continuum includes the use of a record as evidence,as corporate/individual memory, and finally as a collective memory for thepurposes of accountability. However, this requires ownership of that collectiveresponsibility by individuals. With that in mind, the proposed PVR measure-ment items, representing the construct dimensions or ‘facets’ of the construct(Bollen & Lennox, 1991), have been brought together in Table 5.15.
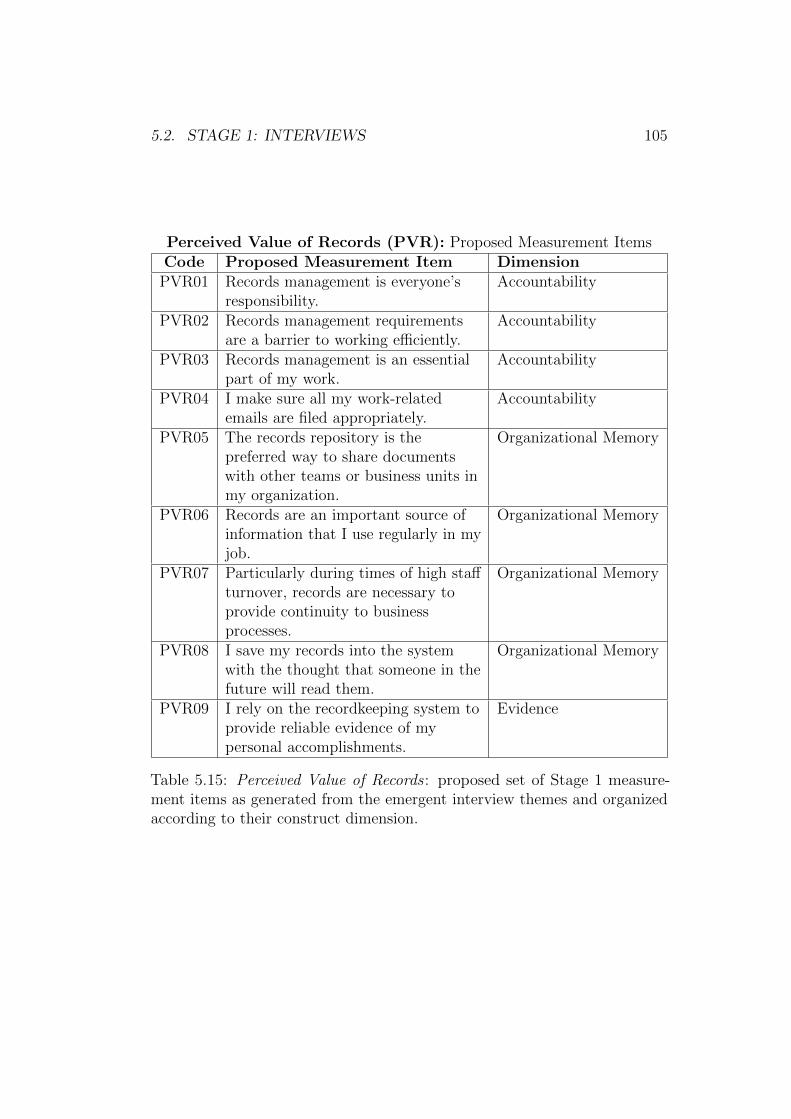
5.2. STAGE 1: INTERVIEWS 105
Perceived Value of Records (PVR): Proposed Measurement ItemsCode Proposed Measurement Item DimensionPVR01 Records management is everyone’s
responsibility.Accountability
PVR02 Records management requirementsare a barrier to working efficiently.
Accountability
PVR03 Records management is an essentialpart of my work.
Accountability
PVR04 I make sure all my work-relatedemails are filed appropriately.
Accountability
PVR05 The records repository is thepreferred way to share documentswith other teams or business units inmy organization.
Organizational Memory
PVR06 Records are an important source ofinformation that I use regularly in myjob.
Organizational Memory
PVR07 Particularly during times of high staffturnover, records are necessary toprovide continuity to businessprocesses.
Organizational Memory
PVR08 I save my records into the systemwith the thought that someone in thefuture will read them.
Organizational Memory
PVR09 I rely on the recordkeeping system toprovide reliable evidence of mypersonal accomplishments.
Evidence
Table 5.15: Perceived Value of Records: proposed set of Stage 1 measure-ment items as generated from the emergent interview themes and organizedaccording to their construct dimension.
106 CHAPTER 5. PHASE I: QUALITATIVE METHODS
Stage 1 Summary and Conclusion
The interview stage used thematic analysis to create a set of emergent themesassociated with each of the constructs of interest.
The resulting themes were then considered in light of the measurementitems published in the literature. Where an existing measurement itemreflected the essence of the emergent theme, it was added to the pool ofmeasurement items. Where the emergent themes uncovered additional dimen-sions of the constructs, they were transformed into new measurement items.In this way, the measurement items from the literature were validated foruse in the context of electronic recordkeeping systems, while the interviewsprovided additional measurement items to increase the depth and breadth ofmeasurement in the context of electronic recordkeeping.
Next, the new construct – perceived value of records – was explored usingthree construct dimensions borrowed from the Records Continuum Model.The emergent themes – having been found to align nicely with the proposedconstruct dimensions – were also converted into measurement items and addedto the pool.
Finally, the process of conducting the thematic analysis independentlyof a predetermined structure supported the search for any additional itemsor factors. These additional factors, if detected, could potentially impact auser’s intention to file documents in an electronic recordkeeping system ina way that is not specifically covered by the constructs of the conceptualresearch model. None was found ; however, the convergent and discriminantvalidity of the final measurement items would be further tested in Stage 3.
The next stage of the research used new participants to assist in proof-reading the pool of measurement items and helped to improve their wording,clarity, and quality.

5.3. STAGE 2: PROOFREADING 107
5.3 Stage 2: Proofreading
Stage 2 of the qualitative research phase focused on improving and aligningthe measurement items and beginning the process of construct validation(Peter, 1981). Construct or content validity is defined as “the degree to whichthe score or scale being used [e.g., measurement items] represents the conceptabout which generalizations are to be made” (Bohrnstedt, 1970, p. 91, asreferenced in Davis, 1989, p. 323). This stage focused on each individualmeasurement item in order to determine if the statement itself was both clearand easy to understand and therefore was able to measure the concept itattempted to represent.
The objectives of this stage were to:
1. identify measurement items from Stage 1 that were vague, unclear, ordifficult to understand, and address those issues;
2. align all of the measurement item statements in terms of tense, grammar,and style; and
3. combine the required changes into an improved Stage 2 measurementitem pool for use in later research stages.
The data collection, analysis methods, and results of Stage 2 are describedin more detail below.
5.3.1 Proofreading Methods
Prior to developing the survey instrument (in Phase II), the measurementitems must first go through an iterative refining process (Lewis et al., 2005;Moore & Benbasat, 1991). Stage 1 in the process collected all of the measure-ment items from the literature along with those proposed by the researcherin order to create an initial pool of measurement items. See Section 5.2.4.
The next stage in this process (Stage 2) elicited the input from tenproofreading participants. These volunteers were given limited backgroundconcerning the research project and simply were told that the ‘system’ referredto was an electronic recordkeeping system. They were then asked to review43 measurement items (presented on paper) from the Stage 1 measurementitem pool. If the item was clear and understandable, and therefore requiredno change, the participants were asked to place a tick in front (to indicate
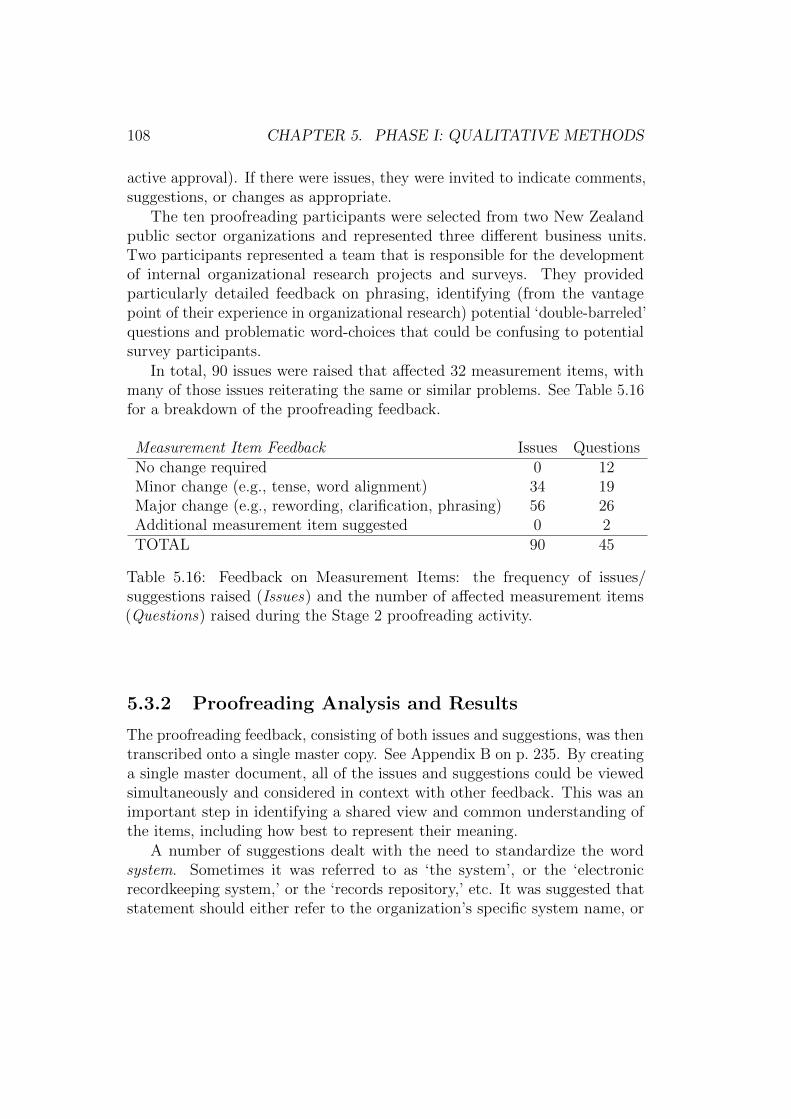
108 CHAPTER 5. PHASE I: QUALITATIVE METHODS
active approval). If there were issues, they were invited to indicate comments,suggestions, or changes as appropriate.
The ten proofreading participants were selected from two New Zealandpublic sector organizations and represented three different business units.Two participants represented a team that is responsible for the developmentof internal organizational research projects and surveys. They providedparticularly detailed feedback on phrasing, identifying (from the vantagepoint of their experience in organizational research) potential ‘double-barreled’questions and problematic word-choices that could be confusing to potentialsurvey participants.
In total, 90 issues were raised that affected 32 measurement items, withmany of those issues reiterating the same or similar problems. See Table 5.16for a breakdown of the proofreading feedback.
Measurement Item Feedback Issues QuestionsNo change required 0 12Minor change (e.g., tense, word alignment) 34 19Major change (e.g., rewording, clarification, phrasing) 56 26Additional measurement item suggested 0 2TOTAL 90 45
Table 5.16: Feedback on Measurement Items: the frequency of issues/suggestions raised (Issues) and the number of affected measurement items(Questions) raised during the Stage 2 proofreading activity.
5.3.2 Proofreading Analysis and Results
The proofreading feedback, consisting of both issues and suggestions, was thentranscribed onto a single master copy. See Appendix B on p. 235. By creatinga single master document, all of the issues and suggestions could be viewedsimultaneously and considered in context with other feedback. This was animportant step in identifying a shared view and common understanding ofthe items, including how best to represent their meaning.
A number of suggestions dealt with the need to standardize the wordsystem. Sometimes it was referred to as ‘the system’, or the ‘electronicrecordkeeping system,’ or the ‘records repository,’ etc. It was suggested thatstatement should either refer to the organization’s specific system name, or
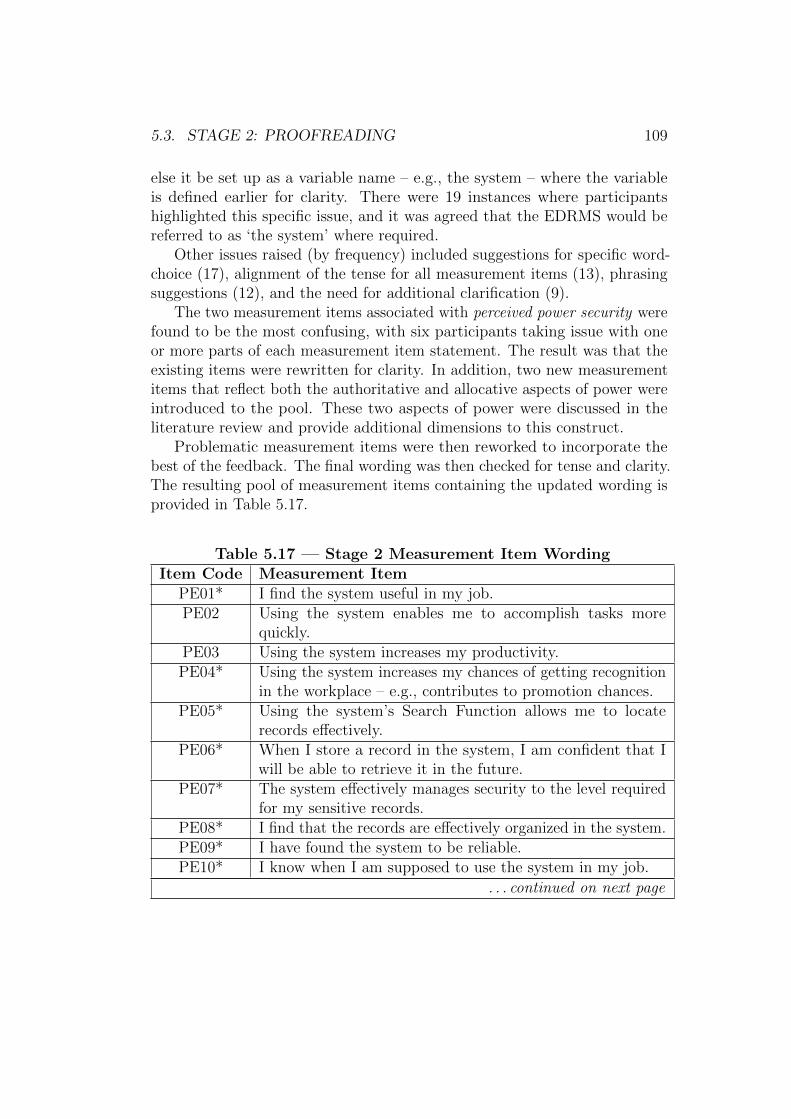
5.3. STAGE 2: PROOFREADING 109
else it be set up as a variable name – e.g., the system – where the variableis defined earlier for clarity. There were 19 instances where participantshighlighted this specific issue, and it was agreed that the EDRMS would bereferred to as ‘the system’ where required.
Other issues raised (by frequency) included suggestions for specific word-choice (17), alignment of the tense for all measurement items (13), phrasingsuggestions (12), and the need for additional clarification (9).
The two measurement items associated with perceived power security werefound to be the most confusing, with six participants taking issue with oneor more parts of each measurement item statement. The result was that theexisting items were rewritten for clarity. In addition, two new measurementitems that reflect both the authoritative and allocative aspects of power wereintroduced to the pool. These two aspects of power were discussed in theliterature review and provide additional dimensions to this construct.
Problematic measurement items were then reworked to incorporate thebest of the feedback. The final wording was then checked for tense and clarity.The resulting pool of measurement items containing the updated wording isprovided in Table 5.17.
Table 5.17 — Stage 2 Measurement Item WordingItem Code Measurement Item
PE01* I find the system useful in my job.PE02 Using the system enables me to accomplish tasks more
quickly.PE03 Using the system increases my productivity.PE04* Using the system increases my chances of getting recognition
in the workplace – e.g., contributes to promotion chances.PE05* Using the system’s Search Function allows me to locate
records effectively.PE06* When I store a record in the system, I am confident that I
will be able to retrieve it in the future.PE07* The system effectively manages security to the level required
for my sensitive records.PE08* I find that the records are effectively organized in the system.PE09* I have found the system to be reliable.PE10* I know when I am supposed to use the system in my job.
. . . continued on next page
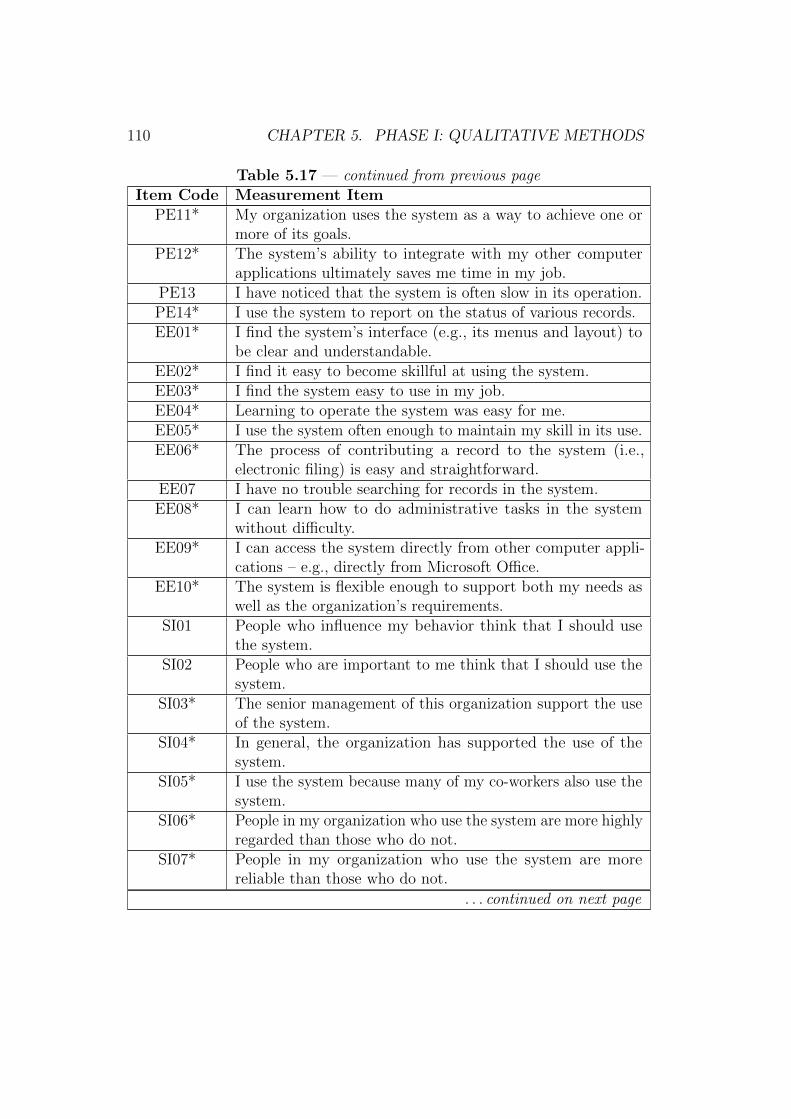
110 CHAPTER 5. PHASE I: QUALITATIVE METHODS
Table 5.17 — continued from previous pageItem Code Measurement Item
PE11* My organization uses the system as a way to achieve one ormore of its goals.
PE12* The system’s ability to integrate with my other computerapplications ultimately saves me time in my job.
PE13 I have noticed that the system is often slow in its operation.PE14* I use the system to report on the status of various records.EE01* I find the system’s interface (e.g., its menus and layout) to
be clear and understandable.EE02* I find it easy to become skillful at using the system.EE03* I find the system easy to use in my job.EE04* Learning to operate the system was easy for me.EE05* I use the system often enough to maintain my skill in its use.EE06* The process of contributing a record to the system (i.e.,
electronic filing) is easy and straightforward.EE07 I have no trouble searching for records in the system.EE08* I can learn how to do administrative tasks in the system
without difficulty.EE09* I can access the system directly from other computer appli-
cations – e.g., directly from Microsoft Office.EE10* The system is flexible enough to support both my needs as
well as the organization’s requirements.SI01 People who influence my behavior think that I should use
the system.SI02 People who are important to me think that I should use the
system.SI03* The senior management of this organization support the use
of the system.SI04* In general, the organization has supported the use of the
system.SI05* I use the system because many of my co-workers also use the
system.SI06* People in my organization who use the system are more highly
regarded than those who do not.SI07* People in my organization who use the system are more
reliable than those who do not.
. . . continued on next page

5.3. STAGE 2: PROOFREADING 111
Table 5.17 — continued from previous pageItem Code Measurement Item
SI08* People in my organization who regularly use the systemacquire a higher profile.
PPS01* Placing my documents in the system – where other peoplemay view them – may positively affect my reputation.
PPS02* I worry that by recording my knowledge in the system, I willbe less valuable to the organization as a source of knowledge.
PPS03* By placing my records in the system, I feel that I have morecontrol over them.
PPS04* I am concerned that by putting my documents into the system,there is a potential for people to judge my work.
PVR01 Records management is everyone’s responsibility.PVR02 Records management requirements are a barrier to working
efficiently.PVR03 Records management is an essential part of my work.PVR04 I make sure all my work-related emails are filed appropriately.PVR05* The system is the preferred way to share documents with
other teams or business units in my organization.PVR06* I regularly refer to records to obtain information needed in
my job.PVR07* Particularly during times of high staff-turnover, records are
necessary to provide continuity to my organization’s businessprocesses.
PVR08 I save my records into the system with the thought thatsomeone in the future will read them.
PVR09 I rely on the system to provide reliable evidence of my personalaccomplishments.
Table 5.17: Measurement Items after Stage 2 proofreading. Those markedwith an asterisk (*) were improved as a result of the Stage 2 proofreadingfeedback.
112 CHAPTER 5. PHASE I: QUALITATIVE METHODS
5.4 Stage 3: Card Sorting
The final stage of the qualitative phase (Stage 3) explored the measurement-item-to-construct relationship and used some quantitative techniques to verifythat this relationship contained a shared interpretation, understanding, andmeaning amongst a sample of participants. To this point, the relationshipbetween a measurement item and its parent construct had merely beenproposed by the researcher. This stage sought to lend reliability and validityto that assigned relationship by incorporating the views of others.
The objectives of this stage were to:
1. test the convergent validity of the measurement-item-to-construct rela-tionship and thereby verify that the proposed relationship is similarlyinterpreted and shared by other participants;
2. test the discriminant validity of the measurement-item-to-constructrelationship and thereby verify that the provided number of constructsare both sufficient and necessary to explain the number of measurementitems that emerged from Stages 1 and 2; and
3. recategorize and adjust those measurement items and/or constructs asrequired to maximize the convergent and discriminant validity measures,should any of the proposed measurement item relationships change as aresult of the analysis.
The technique selected to explore the relationship between the constructand its measurement items was card sorting (Moore & Benbasat, 1991; Hinkle,2008). The goal of this stage was to verify that the pool of measurementitems loaded appropriately onto one (and only one) of the constructs in theresearch model. Two methods of card sorting – closed card sorting and opencard sorting – were employed to measure these two different aspects of validity(Boudreau et al., 2001; Rugg & McGeorge, 2005). Items demonstrating lowerreliability were candidates for elimination, as these items would likely havelow explanatory power in the final research model (Hinkin, 1998; Moore &Benbasat, 1991).
A sample of 24 participants (12 for each variation) were recruited toparticipate in card sorting in order to obtain a recommended sample size tomeasure validity (J. R. Wood & L. E. Wood, 2008). The participants weredrawn from a single New Zealand public sector organization, but representa number of different levels within the organizational hierarchy, including a
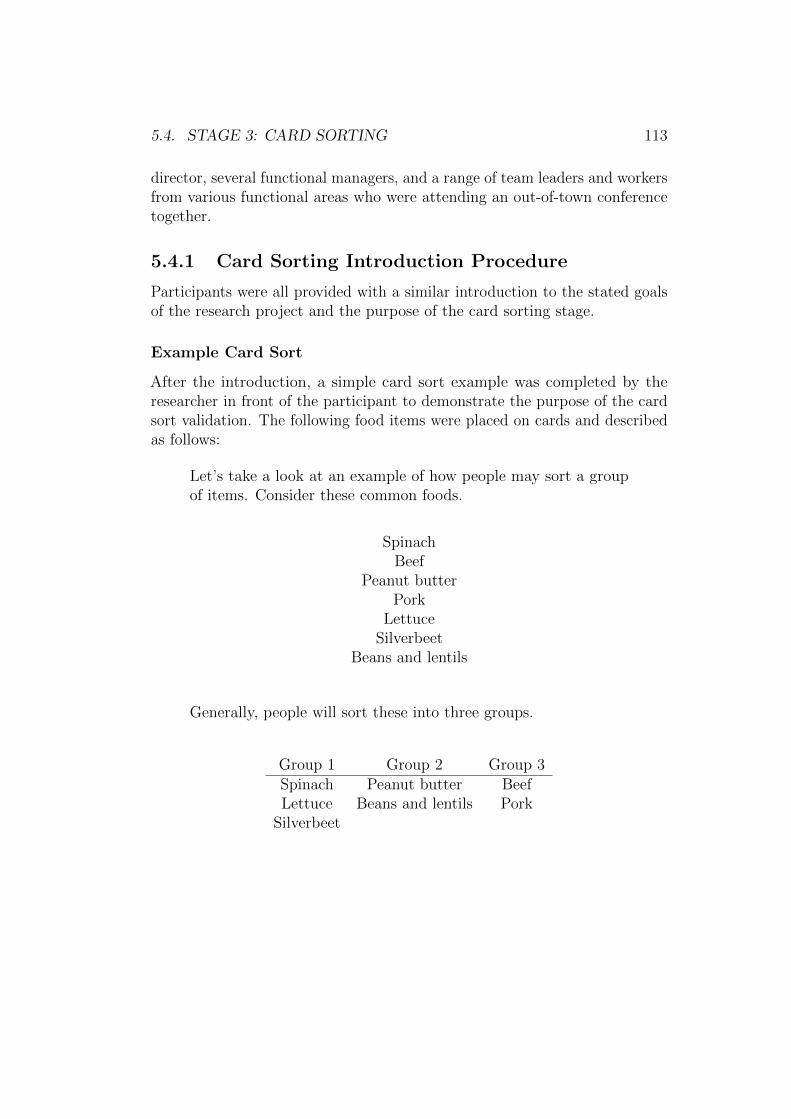
5.4. STAGE 3: CARD SORTING 113
director, several functional managers, and a range of team leaders and workersfrom various functional areas who were attending an out-of-town conferencetogether.
5.4.1 Card Sorting Introduction Procedure
Participants were all provided with a similar introduction to the stated goalsof the research project and the purpose of the card sorting stage.
Example Card Sort
After the introduction, a simple card sort example was completed by theresearcher in front of the participant to demonstrate the purpose of the cardsort validation. The following food items were placed on cards and describedas follows:
Let’s take a look at an example of how people may sort a groupof items. Consider these common foods.
SpinachBeef
Peanut butterPork
LettuceSilverbeet
Beans and lentils
Generally, people will sort these into three groups.
Group 1 Group 2 Group 3Spinach Peanut butter BeefLettuce Beans and lentils PorkSilverbeet
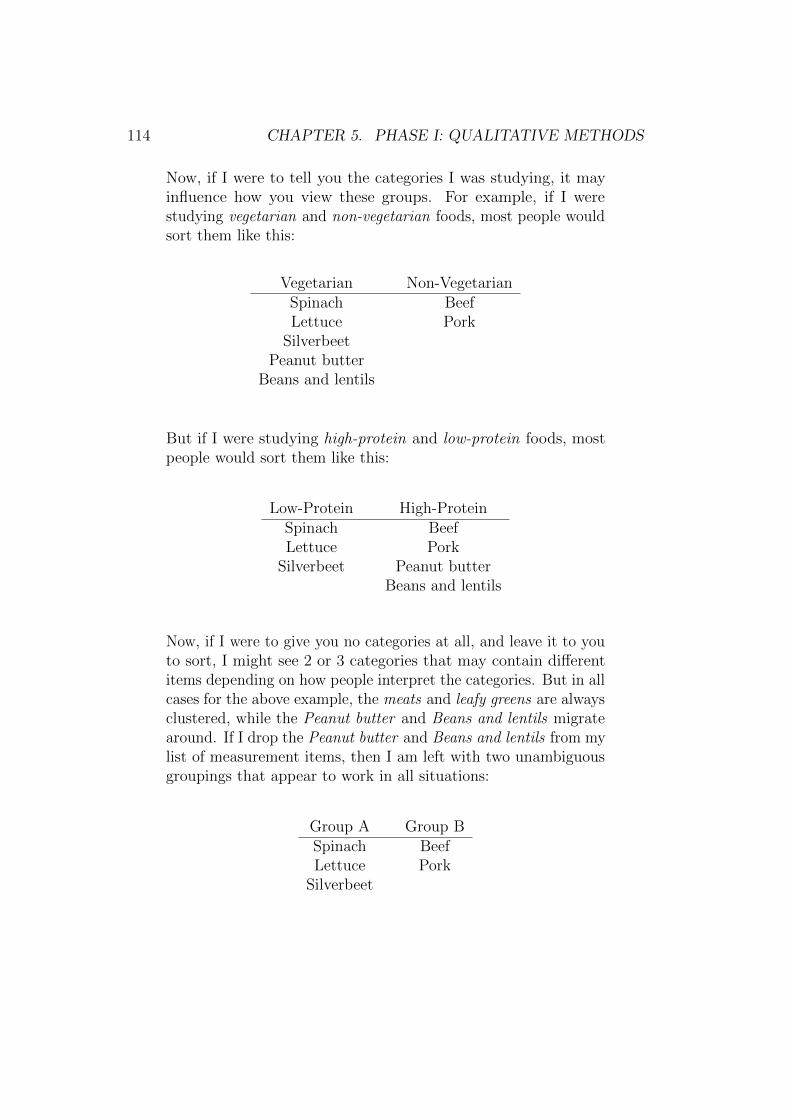
114 CHAPTER 5. PHASE I: QUALITATIVE METHODS
Now, if I were to tell you the categories I was studying, it mayinfluence how you view these groups. For example, if I werestudying vegetarian and non-vegetarian foods, most people wouldsort them like this:
Vegetarian Non-VegetarianSpinach BeefLettuce PorkSilverbeet
Peanut butterBeans and lentils
But if I were studying high-protein and low-protein foods, mostpeople would sort them like this:
Low-Protein High-ProteinSpinach BeefLettuce PorkSilverbeet Peanut butter
Beans and lentils
Now, if I were to give you no categories at all, and leave it to youto sort, I might see 2 or 3 categories that may contain differentitems depending on how people interpret the categories. But in allcases for the above example, the meats and leafy greens are alwaysclustered, while the Peanut butter and Beans and lentils migratearound. If I drop the Peanut butter and Beans and lentils from mylist of measurement items, then I am left with two unambiguousgroupings that appear to work in all situations:
Group A Group BSpinach BeefLettuce PorkSilverbeet
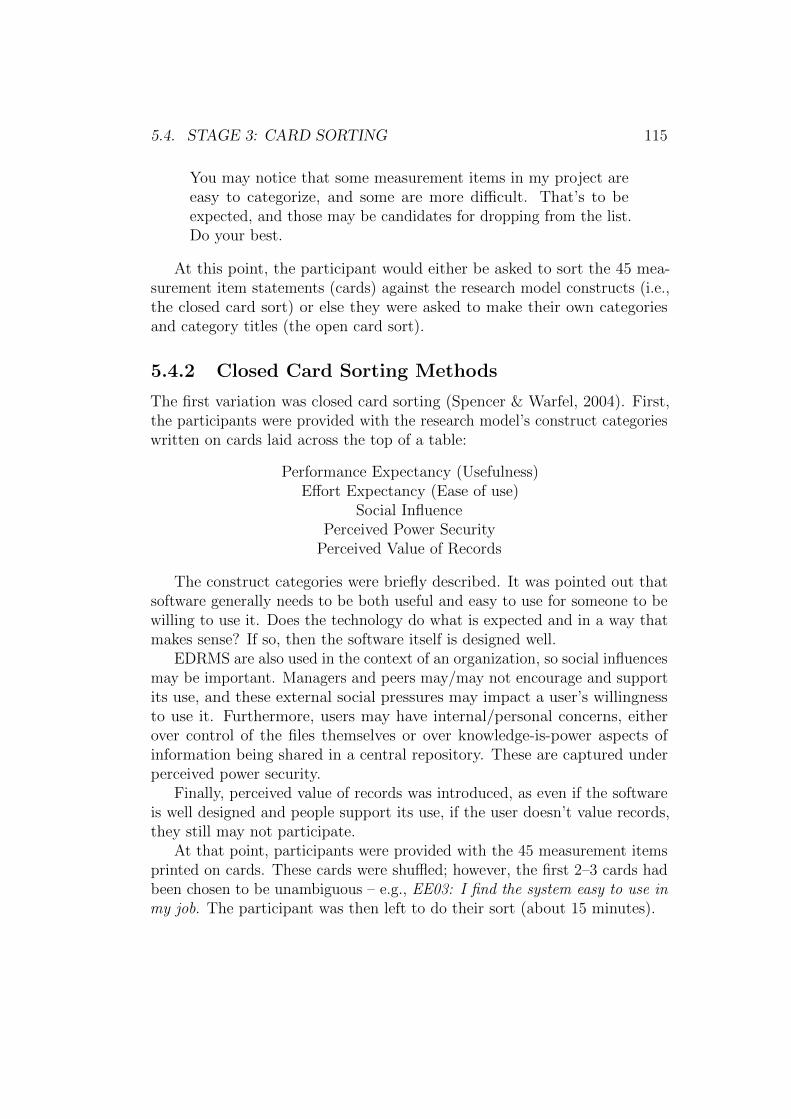
5.4. STAGE 3: CARD SORTING 115
You may notice that some measurement items in my project areeasy to categorize, and some are more difficult. That’s to beexpected, and those may be candidates for dropping from the list.Do your best.
At this point, the participant would either be asked to sort the 45 mea-surement item statements (cards) against the research model constructs (i.e.,the closed card sort) or else they were asked to make their own categoriesand category titles (the open card sort).
5.4.2 Closed Card Sorting Methods
The first variation was closed card sorting (Spencer & Warfel, 2004). First,the participants were provided with the research model’s construct categorieswritten on cards laid across the top of a table:
Performance Expectancy (Usefulness)Effort Expectancy (Ease of use)
Social InfluencePerceived Power SecurityPerceived Value of Records
The construct categories were briefly described. It was pointed out thatsoftware generally needs to be both useful and easy to use for someone to bewilling to use it. Does the technology do what is expected and in a way thatmakes sense? If so, then the software itself is designed well.
EDRMS are also used in the context of an organization, so social influencesmay be important. Managers and peers may/may not encourage and supportits use, and these external social pressures may impact a user’s willingnessto use it. Furthermore, users may have internal/personal concerns, eitherover control of the files themselves or over knowledge-is-power aspects ofinformation being shared in a central repository. These are captured underperceived power security.
Finally, perceived value of records was introduced, as even if the softwareis well designed and people support its use, if the user doesn’t value records,they still may not participate.
At that point, participants were provided with the 45 measurement itemsprinted on cards. These cards were shuffled; however, the first 2–3 cards hadbeen chosen to be unambiguous – e.g., EE03: I find the system easy to use inmy job. The participant was then left to do their sort (about 15 minutes).
116 CHAPTER 5. PHASE I: QUALITATIVE METHODS
When the sort was completed, the participant was asked to recheck theirsorting. They were also asked if any cards were particularly difficult to place.The item codes – e.g., PE04, PVR07, etc. – were noted on the reverse side ofthe cards to facilitate data capture, and the resulting data were recorded in anotebook.
5.4.3 Open Card Sorting Methods
The second variation was open card sorting (Faiks & Hyland, 2000). In thisvariation, participants were asked to sort and develop their own categories fromthe available item pool. This was a test of discriminant validity (measuringthat a factor unambiguously loads onto a single construct).5
The open card sort participants were shown the same introduction examplesort and were similarly introduced to the goals of the research project; however,the research model (and construct categories) were deliberately withheld.
The open card sort was much more challenging for participants, whogenerally had to approach the sorting iteratively, and the time-to-sort wasapproximately double that of the closed card sort. As such, the participantsselected for the open card sort were generally individuals who were known tohave a longer attention span and a greater willingness to participate.
The participants were told that between 5–7 categories were expected,and that the measurement items would not necessarily be evenly distributedbetween the categories. The range of 5–7 categories was specified to provideleeway for participants to use their own logical grouping, while limiting thenumber of categories to a reasonable number. Even so, one participantapologetically created 8 categories. The participants were also warned thatpositive and negative statements could be in the same category – e.g., ‘negativestatements’ was not an expected category. They were then provided with astack of empty cards and a pencil, so that they could create working titlesfor their categories as they sorted.
When the sort was completed, the participants were asked to rechecktheir work. They were also asked if any cards were particularly difficult toplace, and then the resulting data were recorded in the research notebook.All participants were thanked for their time and participation.
5Some of the established and validated construct measurement items from the literaturehad been altered or added to, taking into account the new situation-specific informationfrom the interview stage. This additional validation provided an opportunity to checkthe nomological validity for some of the more established constructs and their associatedmeasurement instruments (Boudreau et al., 2001, p. 12).
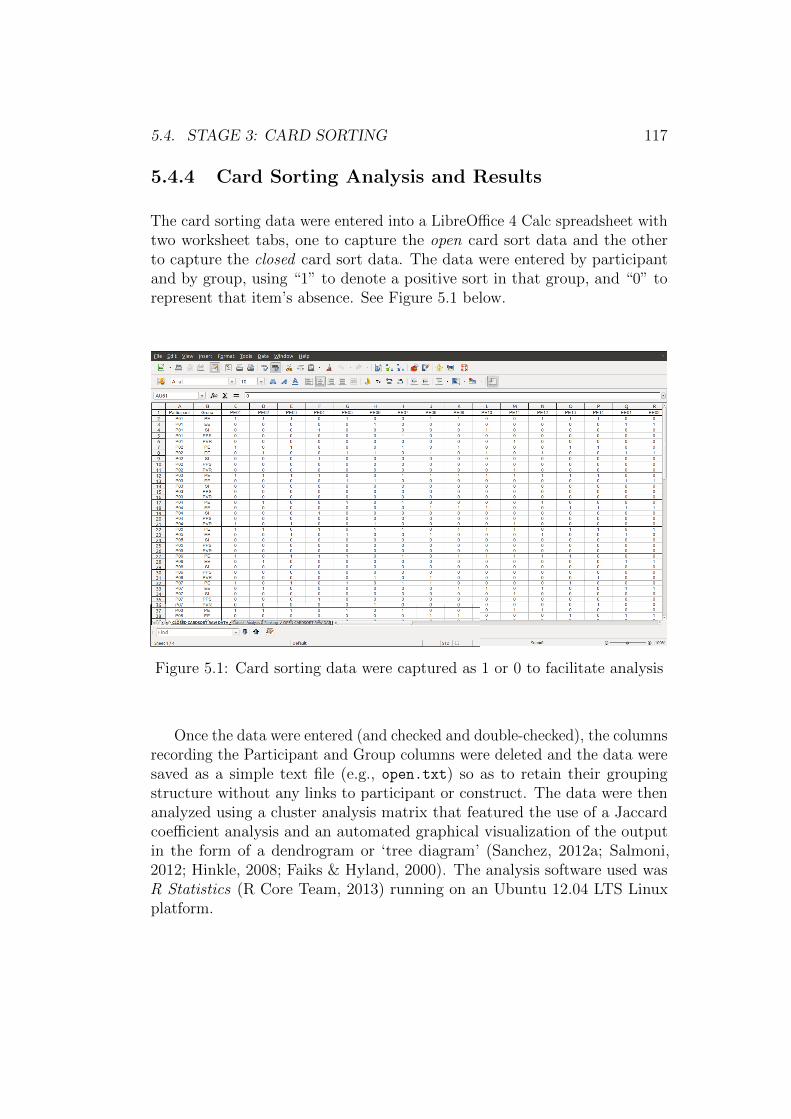
5.4. STAGE 3: CARD SORTING 117
5.4.4 Card Sorting Analysis and Results
The card sorting data were entered into a LibreOffice 4 Calc spreadsheet withtwo worksheet tabs, one to capture the open card sort data and the otherto capture the closed card sort data. The data were entered by participantand by group, using “1” to denote a positive sort in that group, and “0” torepresent that item’s absence. See Figure 5.1 below.
Figure 5.1: Card sorting data were captured as 1 or 0 to facilitate analysis
Once the data were entered (and checked and double-checked), the columnsrecording the Participant and Group columns were deleted and the data weresaved as a simple text file (e.g., open.txt) so as to retain their groupingstructure without any links to participant or construct. The data were thenanalyzed using a cluster analysis matrix that featured the use of a Jaccardcoefficient analysis and an automated graphical visualization of the outputin the form of a dendrogram or ‘tree diagram’ (Sanchez, 2012a; Salmoni,2012; Hinkle, 2008; Faiks & Hyland, 2000). The analysis software used wasR Statistics (R Core Team, 2013) running on an Ubuntu 12.04 LTS Linuxplatform.
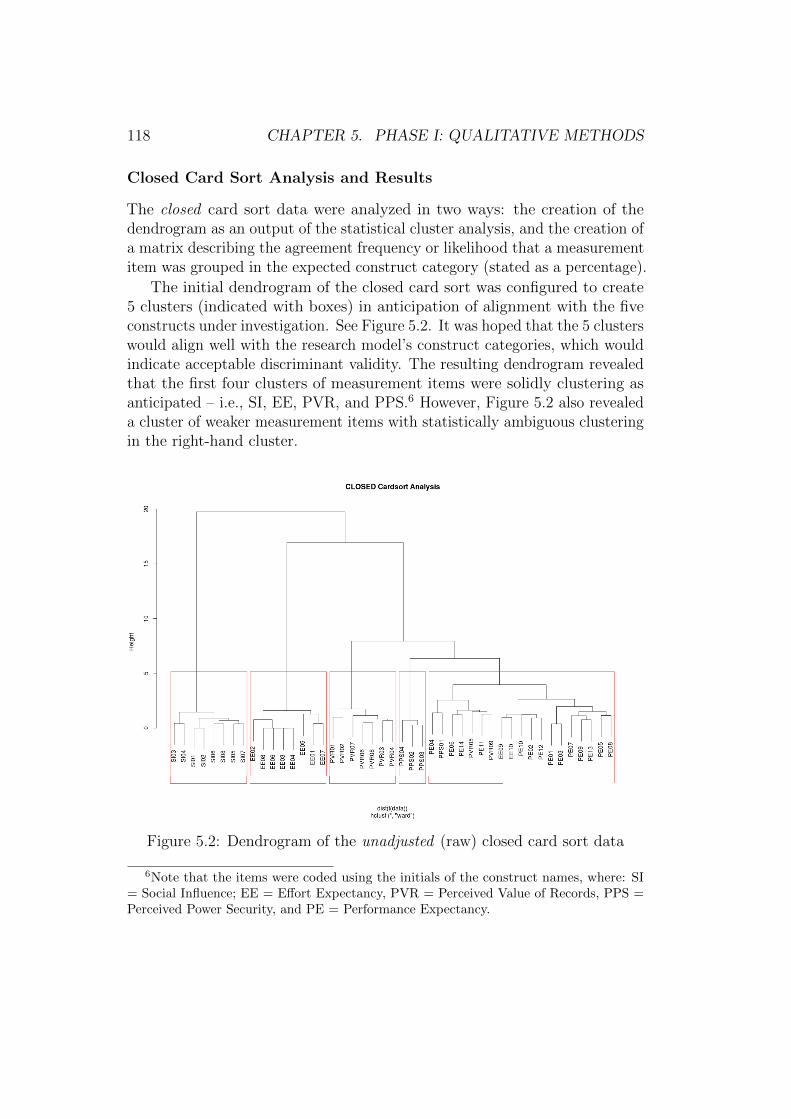
118 CHAPTER 5. PHASE I: QUALITATIVE METHODS
Closed Card Sort Analysis and Results
The closed card sort data were analyzed in two ways: the creation of thedendrogram as an output of the statistical cluster analysis, and the creation ofa matrix describing the agreement frequency or likelihood that a measurementitem was grouped in the expected construct category (stated as a percentage).
The initial dendrogram of the closed card sort was configured to create5 clusters (indicated with boxes) in anticipation of alignment with the fiveconstructs under investigation. See Figure 5.2. It was hoped that the 5 clusterswould align well with the research model’s construct categories, which wouldindicate acceptable discriminant validity. The resulting dendrogram revealedthat the first four clusters of measurement items were solidly clustering asanticipated – i.e., SI, EE, PVR, and PPS.6 However, Figure 5.2 also revealeda cluster of weaker measurement items with statistically ambiguous clusteringin the right-hand cluster.
Figure 5.2: Dendrogram of the unadjusted (raw) closed card sort data
6Note that the items were coded using the initials of the construct names, where: SI= Social Influence; EE = Effort Expectancy, PVR = Perceived Value of Records, PPS =Perceived Power Security, and PE = Performance Expectancy.
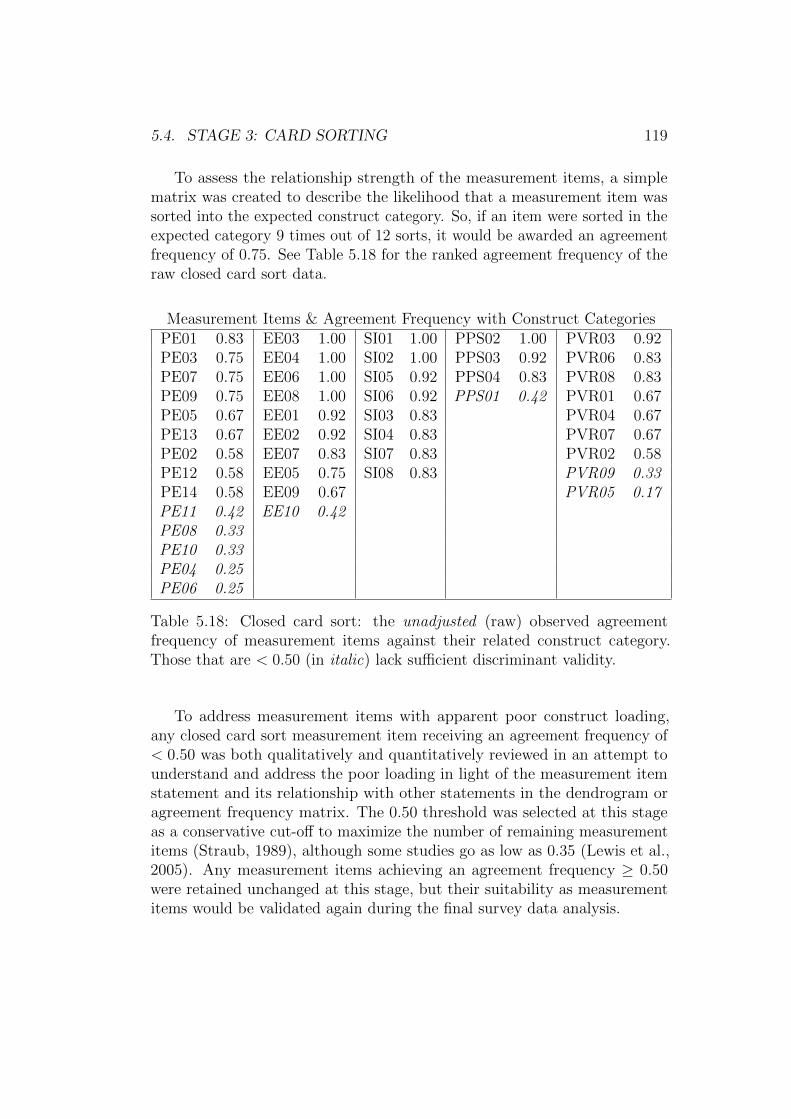
5.4. STAGE 3: CARD SORTING 119
To assess the relationship strength of the measurement items, a simplematrix was created to describe the likelihood that a measurement item wassorted into the expected construct category. So, if an item were sorted in theexpected category 9 times out of 12 sorts, it would be awarded an agreementfrequency of 0.75. See Table 5.18 for the ranked agreement frequency of theraw closed card sort data.
Measurement Items & Agreement Frequency with Construct CategoriesPE01 0.83 EE03 1.00 SI01 1.00 PPS02 1.00 PVR03 0.92PE03 0.75 EE04 1.00 SI02 1.00 PPS03 0.92 PVR06 0.83PE07 0.75 EE06 1.00 SI05 0.92 PPS04 0.83 PVR08 0.83PE09 0.75 EE08 1.00 SI06 0.92 PPS01 0.42 PVR01 0.67PE05 0.67 EE01 0.92 SI03 0.83 PVR04 0.67PE13 0.67 EE02 0.92 SI04 0.83 PVR07 0.67PE02 0.58 EE07 0.83 SI07 0.83 PVR02 0.58PE12 0.58 EE05 0.75 SI08 0.83 PVR09 0.33PE14 0.58 EE09 0.67 PVR05 0.17PE11 0.42 EE10 0.42PE08 0.33PE10 0.33PE04 0.25PE06 0.25
Table 5.18: Closed card sort: the unadjusted (raw) observed agreementfrequency of measurement items against their related construct category.Those that are < 0.50 (in italic) lack sufficient discriminant validity.
To address measurement items with apparent poor construct loading,any closed card sort measurement item receiving an agreement frequency of< 0.50 was both qualitatively and quantitatively reviewed in an attempt tounderstand and address the poor loading in light of the measurement itemstatement and its relationship with other statements in the dendrogram oragreement frequency matrix. The 0.50 threshold was selected at this stageas a conservative cut-off to maximize the number of remaining measurementitems (Straub, 1989), although some studies go as low as 0.35 (Lewis et al.,2005). Any measurement items achieving an agreement frequency ≥ 0.50were retained unchanged at this stage, but their suitability as measurementitems would be validated again during the final survey data analysis.
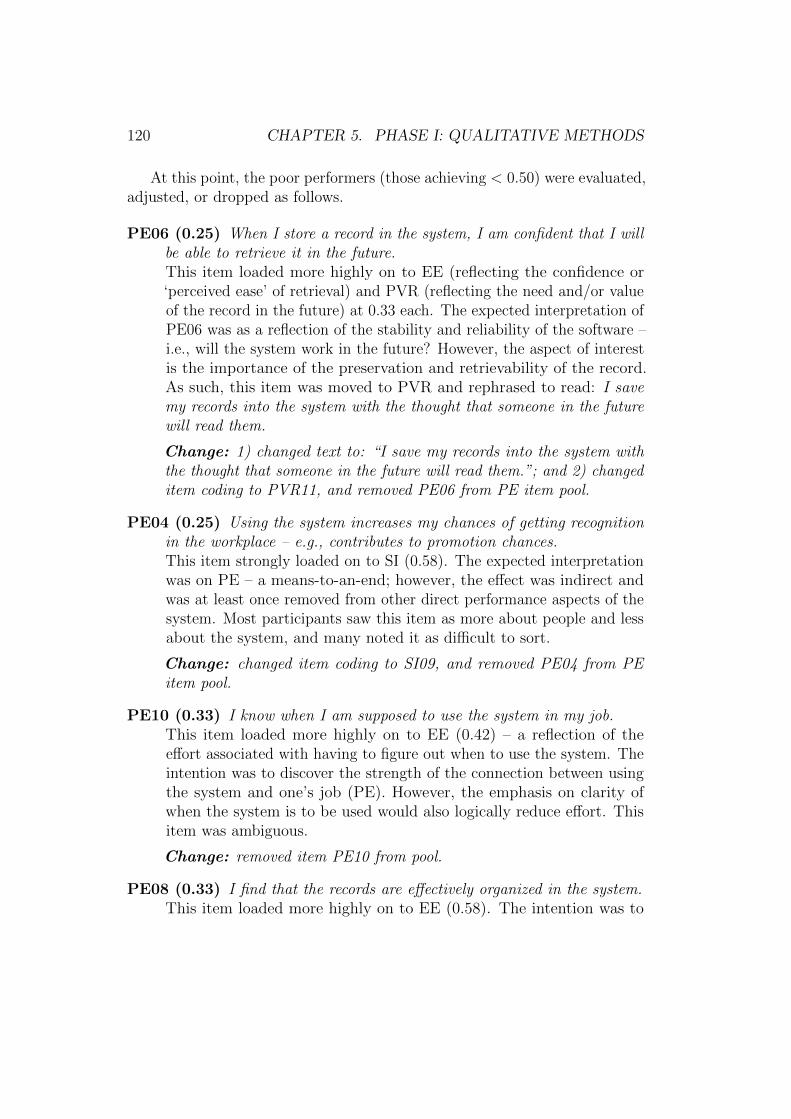
120 CHAPTER 5. PHASE I: QUALITATIVE METHODS
At this point, the poor performers (those achieving < 0.50) were evaluated,adjusted, or dropped as follows.
PE06 (0.25) When I store a record in the system, I am confident that I willbe able to retrieve it in the future.This item loaded more highly on to EE (reflecting the confidence or‘perceived ease’ of retrieval) and PVR (reflecting the need and/or valueof the record in the future) at 0.33 each. The expected interpretation ofPE06 was as a reflection of the stability and reliability of the software –i.e., will the system work in the future? However, the aspect of interestis the importance of the preservation and retrievability of the record.As such, this item was moved to PVR and rephrased to read: I savemy records into the system with the thought that someone in the futurewill read them.
Change: 1) changed text to: “I save my records into the system withthe thought that someone in the future will read them.”; and 2) changeditem coding to PVR11, and removed PE06 from PE item pool.
PE04 (0.25) Using the system increases my chances of getting recognitionin the workplace – e.g., contributes to promotion chances.This item strongly loaded on to SI (0.58). The expected interpretationwas on PE – a means-to-an-end; however, the effect was indirect andwas at least once removed from other direct performance aspects of thesystem. Most participants saw this item as more about people and lessabout the system, and many noted it as difficult to sort.
Change: changed item coding to SI09, and removed PE04 from PEitem pool.
PE10 (0.33) I know when I am supposed to use the system in my job.This item loaded more highly on to EE (0.42) – a reflection of theeffort associated with having to figure out when to use the system. Theintention was to discover the strength of the connection between usingthe system and one’s job (PE). However, the emphasis on clarity ofwhen the system is to be used would also logically reduce effort. Thisitem was ambiguous.
Change: removed item PE10 from pool.
PE08 (0.33) I find that the records are effectively organized in the system.This item loaded more highly on to EE (0.58). The intention was to
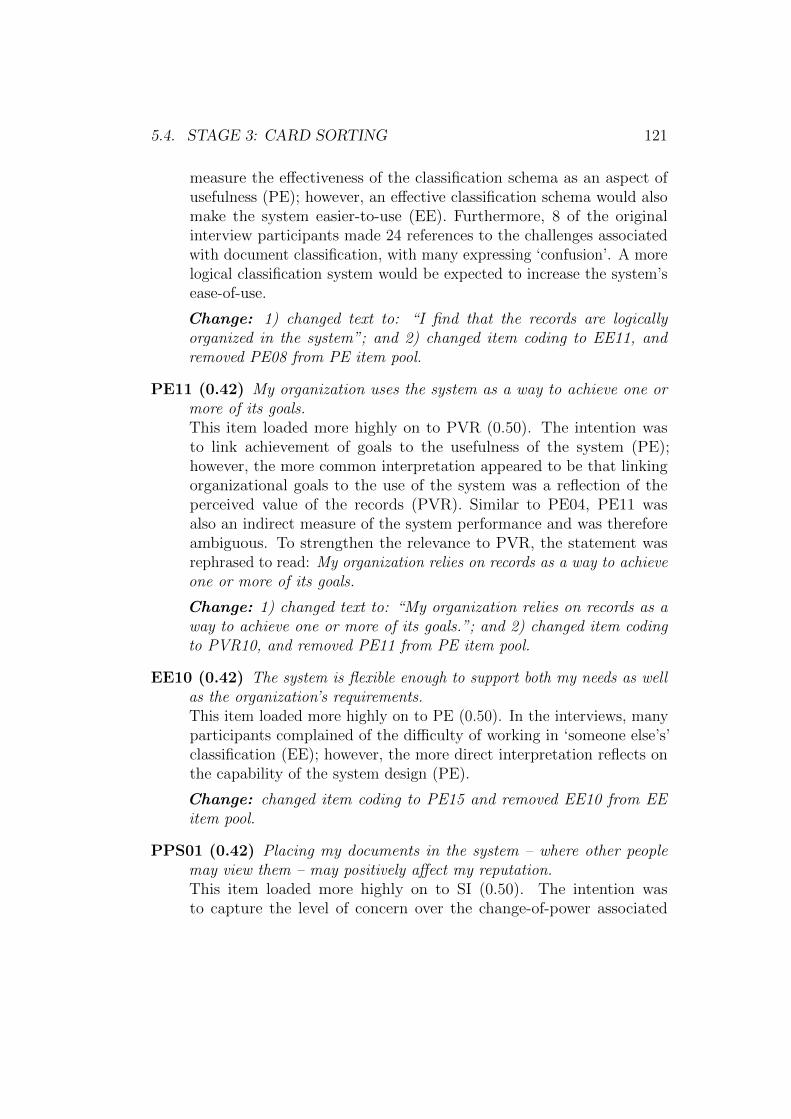
5.4. STAGE 3: CARD SORTING 121
measure the effectiveness of the classification schema as an aspect ofusefulness (PE); however, an effective classification schema would alsomake the system easier-to-use (EE). Furthermore, 8 of the originalinterview participants made 24 references to the challenges associatedwith document classification, with many expressing ‘confusion’. A morelogical classification system would be expected to increase the system’sease-of-use.
Change: 1) changed text to: “I find that the records are logicallyorganized in the system”; and 2) changed item coding to EE11, andremoved PE08 from PE item pool.
PE11 (0.42) My organization uses the system as a way to achieve one ormore of its goals.This item loaded more highly on to PVR (0.50). The intention wasto link achievement of goals to the usefulness of the system (PE);however, the more common interpretation appeared to be that linkingorganizational goals to the use of the system was a reflection of theperceived value of the records (PVR). Similar to PE04, PE11 wasalso an indirect measure of the system performance and was thereforeambiguous. To strengthen the relevance to PVR, the statement wasrephrased to read: My organization relies on records as a way to achieveone or more of its goals.
Change: 1) changed text to: “My organization relies on records as away to achieve one or more of its goals.”; and 2) changed item codingto PVR10, and removed PE11 from PE item pool.
EE10 (0.42) The system is flexible enough to support both my needs as wellas the organization’s requirements.This item loaded more highly on to PE (0.50). In the interviews, manyparticipants complained of the difficulty of working in ‘someone else’s’classification (EE); however, the more direct interpretation reflects onthe capability of the system design (PE).
Change: changed item coding to PE15 and removed EE10 from EEitem pool.
PPS01 (0.42) Placing my documents in the system – where other peoplemay view them – may positively affect my reputation.This item loaded more highly on to SI (0.50). The intention wasto capture the level of concern over the change-of-power associated
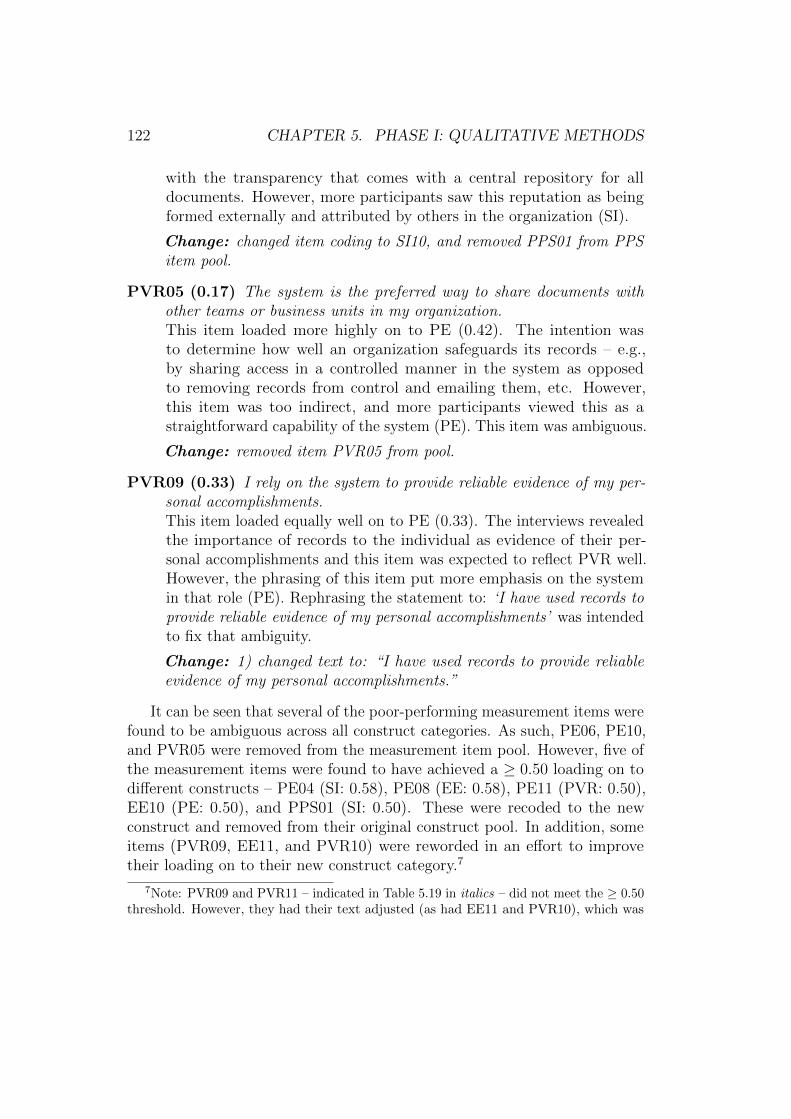
122 CHAPTER 5. PHASE I: QUALITATIVE METHODS
with the transparency that comes with a central repository for alldocuments. However, more participants saw this reputation as beingformed externally and attributed by others in the organization (SI).
Change: changed item coding to SI10, and removed PPS01 from PPSitem pool.
PVR05 (0.17) The system is the preferred way to share documents withother teams or business units in my organization.This item loaded more highly on to PE (0.42). The intention wasto determine how well an organization safeguards its records – e.g.,by sharing access in a controlled manner in the system as opposedto removing records from control and emailing them, etc. However,this item was too indirect, and more participants viewed this as astraightforward capability of the system (PE). This item was ambiguous.
Change: removed item PVR05 from pool.
PVR09 (0.33) I rely on the system to provide reliable evidence of my per-sonal accomplishments.This item loaded equally well on to PE (0.33). The interviews revealedthe importance of records to the individual as evidence of their per-sonal accomplishments and this item was expected to reflect PVR well.However, the phrasing of this item put more emphasis on the systemin that role (PE). Rephrasing the statement to: ‘I have used records toprovide reliable evidence of my personal accomplishments’ was intendedto fix that ambiguity.
Change: 1) changed text to: “I have used records to provide reliableevidence of my personal accomplishments.”
It can be seen that several of the poor-performing measurement items werefound to be ambiguous across all construct categories. As such, PE06, PE10,and PVR05 were removed from the measurement item pool. However, five ofthe measurement items were found to have achieved a ≥ 0.50 loading on todifferent constructs – PE04 (SI: 0.58), PE08 (EE: 0.58), PE11 (PVR: 0.50),EE10 (PE: 0.50), and PPS01 (SI: 0.50). These were recoded to the newconstruct and removed from their original construct pool. In addition, someitems (PVR09, EE11, and PVR10) were reworded in an effort to improvetheir loading on to their new construct category.7
7Note: PVR09 and PVR11 – indicated in Table 5.19 in italics – did not meet the ≥ 0.50threshold. However, they had their text adjusted (as had EE11 and PVR10), which was
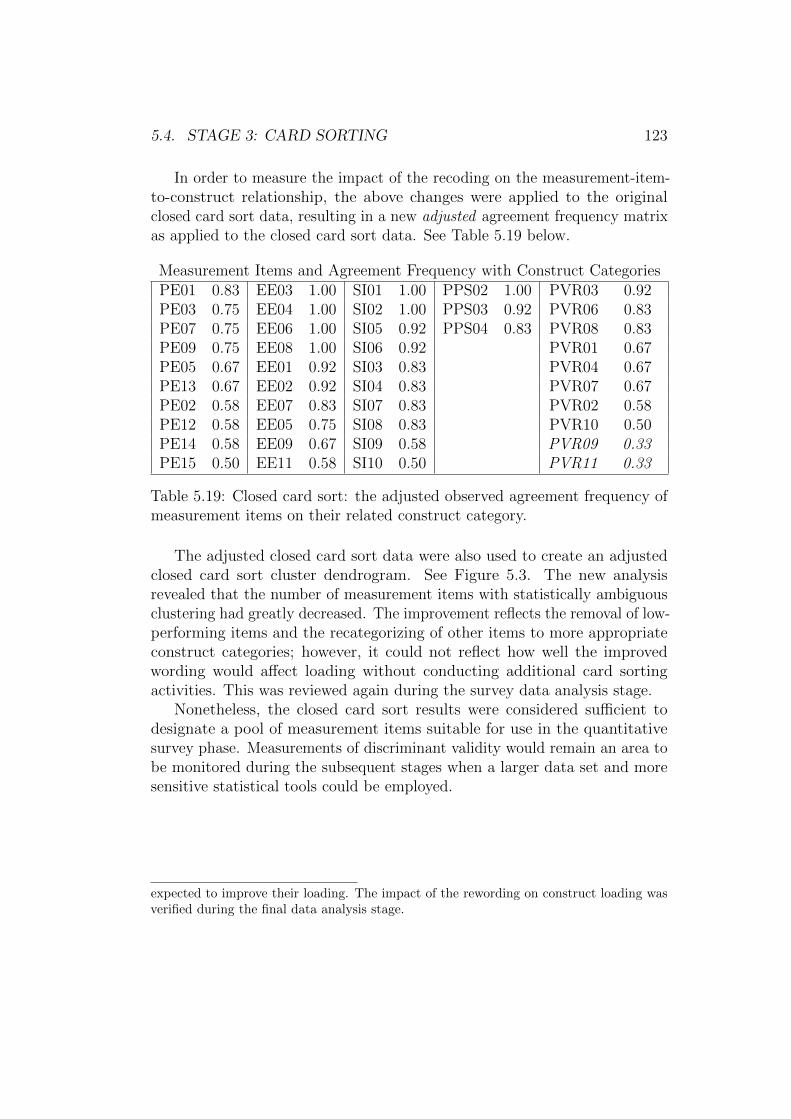
5.4. STAGE 3: CARD SORTING 123
In order to measure the impact of the recoding on the measurement-item-to-construct relationship, the above changes were applied to the originalclosed card sort data, resulting in a new adjusted agreement frequency matrixas applied to the closed card sort data. See Table 5.19 below.
Measurement Items and Agreement Frequency with Construct CategoriesPE01 0.83 EE03 1.00 SI01 1.00 PPS02 1.00 PVR03 0.92PE03 0.75 EE04 1.00 SI02 1.00 PPS03 0.92 PVR06 0.83PE07 0.75 EE06 1.00 SI05 0.92 PPS04 0.83 PVR08 0.83PE09 0.75 EE08 1.00 SI06 0.92 PVR01 0.67PE05 0.67 EE01 0.92 SI03 0.83 PVR04 0.67PE13 0.67 EE02 0.92 SI04 0.83 PVR07 0.67PE02 0.58 EE07 0.83 SI07 0.83 PVR02 0.58PE12 0.58 EE05 0.75 SI08 0.83 PVR10 0.50PE14 0.58 EE09 0.67 SI09 0.58 PVR09 0.33PE15 0.50 EE11 0.58 SI10 0.50 PVR11 0.33
Table 5.19: Closed card sort: the adjusted observed agreement frequency ofmeasurement items on their related construct category.
The adjusted closed card sort data were also used to create an adjustedclosed card sort cluster dendrogram. See Figure 5.3. The new analysisrevealed that the number of measurement items with statistically ambiguousclustering had greatly decreased. The improvement reflects the removal of low-performing items and the recategorizing of other items to more appropriateconstruct categories; however, it could not reflect how well the improvedwording would affect loading without conducting additional card sortingactivities. This was reviewed again during the survey data analysis stage.
Nonetheless, the closed card sort results were considered sufficient todesignate a pool of measurement items suitable for use in the quantitativesurvey phase. Measurements of discriminant validity would remain an area tobe monitored during the subsequent stages when a larger data set and moresensitive statistical tools could be employed.
expected to improve their loading. The impact of the rewording on construct loading wasverified during the final data analysis stage.
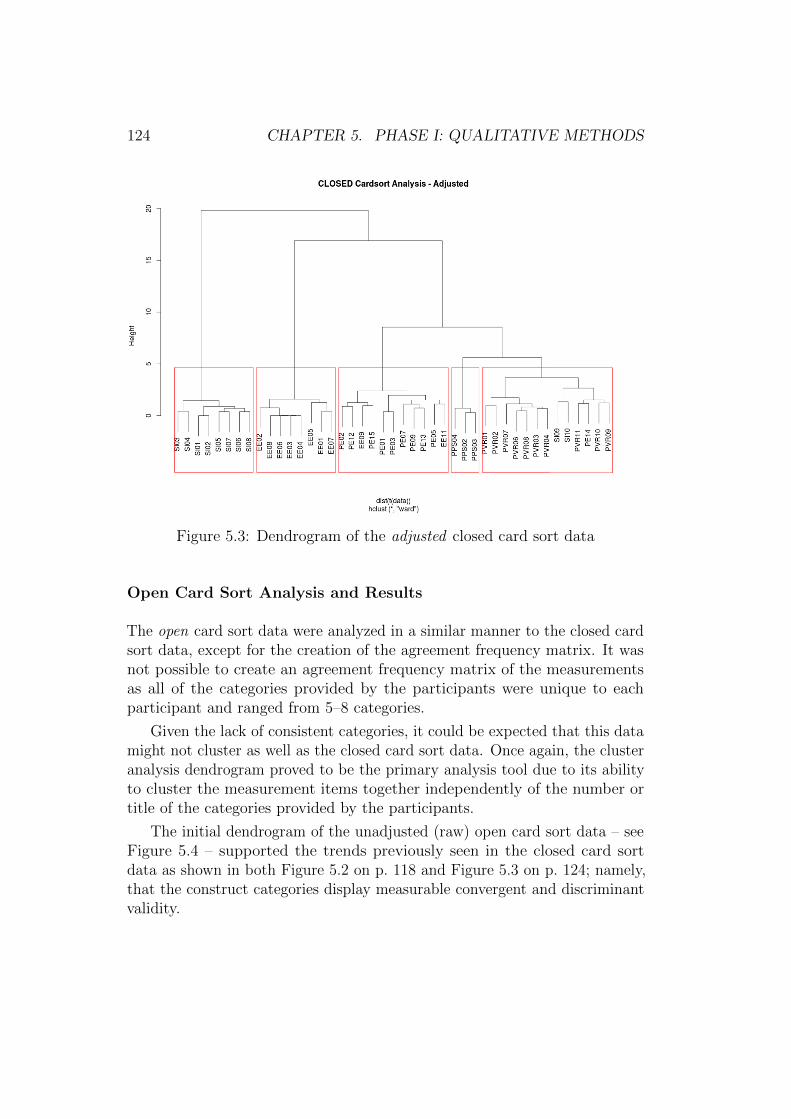
124 CHAPTER 5. PHASE I: QUALITATIVE METHODS
Figure 5.3: Dendrogram of the adjusted closed card sort data
Open Card Sort Analysis and Results
The open card sort data were analyzed in a similar manner to the closed cardsort data, except for the creation of the agreement frequency matrix. It wasnot possible to create an agreement frequency matrix of the measurementsas all of the categories provided by the participants were unique to eachparticipant and ranged from 5–8 categories.
Given the lack of consistent categories, it could be expected that this datamight not cluster as well as the closed card sort data. Once again, the clusteranalysis dendrogram proved to be the primary analysis tool due to its abilityto cluster the measurement items together independently of the number ortitle of the categories provided by the participants.
The initial dendrogram of the unadjusted (raw) open card sort data – seeFigure 5.4 – supported the trends previously seen in the closed card sortdata as shown in both Figure 5.2 on p. 118 and Figure 5.3 on p. 124; namely,that the construct categories display measurable convergent and discriminantvalidity.
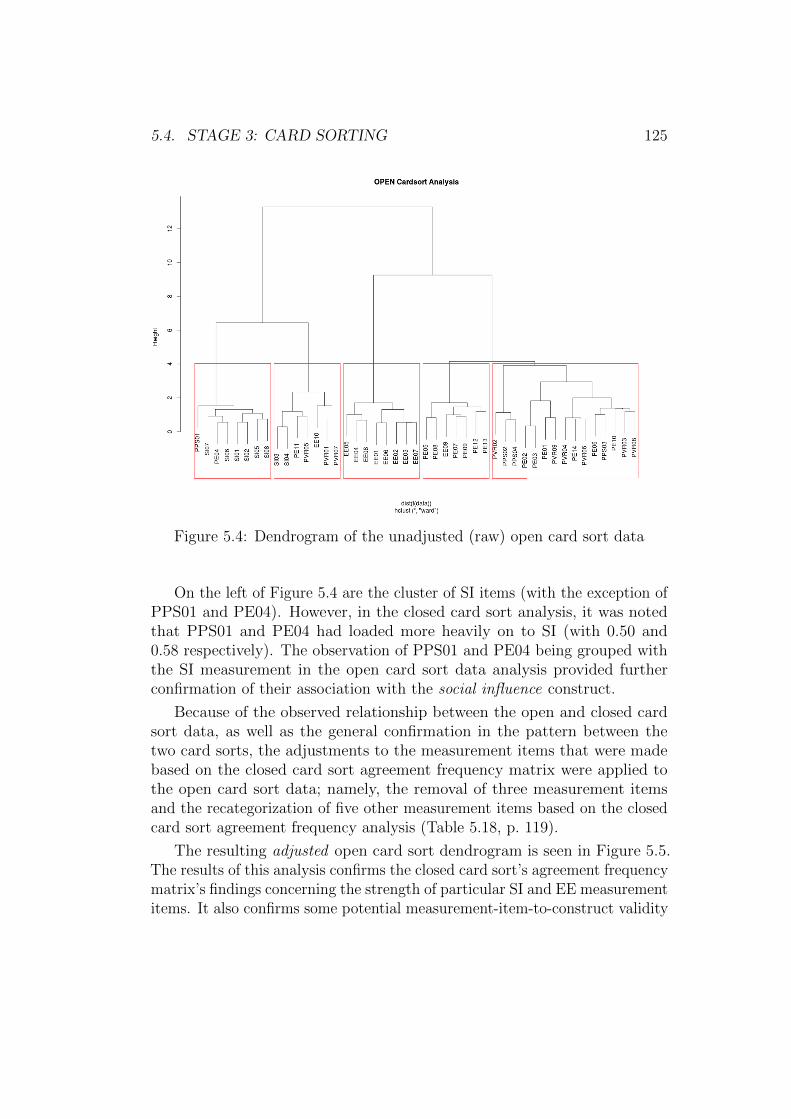
5.4. STAGE 3: CARD SORTING 125
Figure 5.4: Dendrogram of the unadjusted (raw) open card sort data
On the left of Figure 5.4 are the cluster of SI items (with the exception ofPPS01 and PE04). However, in the closed card sort analysis, it was notedthat PPS01 and PE04 had loaded more heavily on to SI (with 0.50 and0.58 respectively). The observation of PPS01 and PE04 being grouped withthe SI measurement in the open card sort data analysis provided furtherconfirmation of their association with the social influence construct.
Because of the observed relationship between the open and closed cardsort data, as well as the general confirmation in the pattern between thetwo card sorts, the adjustments to the measurement items that were madebased on the closed card sort agreement frequency matrix were applied tothe open card sort data; namely, the removal of three measurement itemsand the recategorization of five other measurement items based on the closedcard sort agreement frequency analysis (Table 5.18, p. 119).
The resulting adjusted open card sort dendrogram is seen in Figure 5.5.The results of this analysis confirms the closed card sort’s agreement frequencymatrix’s findings concerning the strength of particular SI and EE measurementitems. It also confirms some potential measurement-item-to-construct validity
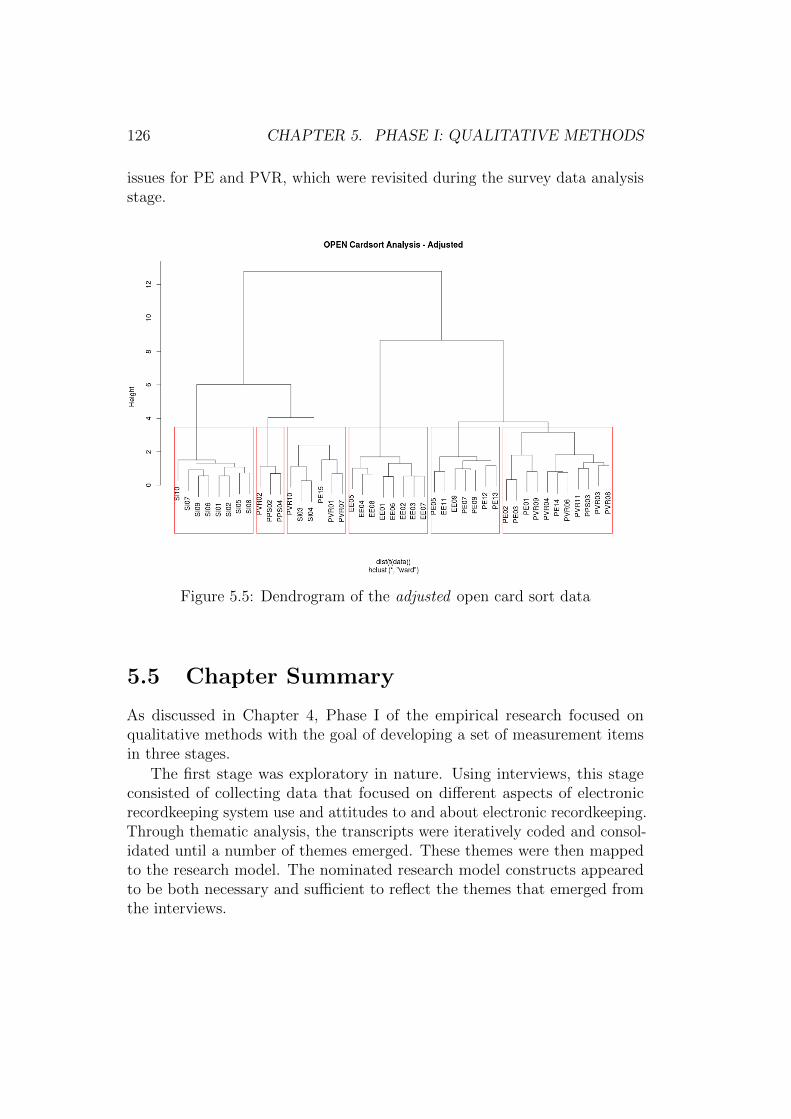
126 CHAPTER 5. PHASE I: QUALITATIVE METHODS
issues for PE and PVR, which were revisited during the survey data analysisstage.
Figure 5.5: Dendrogram of the adjusted open card sort data
5.5 Chapter Summary
As discussed in Chapter 4, Phase I of the empirical research focused onqualitative methods with the goal of developing a set of measurement itemsin three stages.
The first stage was exploratory in nature. Using interviews, this stageconsisted of collecting data that focused on different aspects of electronicrecordkeeping system use and attitudes to and about electronic recordkeeping.Through thematic analysis, the transcripts were iteratively coded and consol-idated until a number of themes emerged. These themes were then mappedto the research model. The nominated research model constructs appearedto be both necessary and sufficient to reflect the themes that emerged fromthe interviews.
5.5. CHAPTER SUMMARY 127
Efforts were then made to convert the themes to measurement items.Measurement items from the literature were first mapped to the emergentthemes, as there was a strong preference to use validated measurement itemswhere possible. Where a theme did not have a corresponding validatedmeasurement item, one was created. Individual measurement items were thententatively mapped to reflect their construct by the researcher.
The second stage took the additional step of proofreading the initial poolof measurement items using another ten participants. The value of this stepwas considerable, with over 90 issues raised (and addressed) in total. Therefined set of measurement items formed the basis for stage 3’s verification ofthe measurement item to construct relationship.
The third stage tested the proposed measurement item to construct re-lationship through the use of open and closed card sorting. The analysisdemonstrated that the assumptions of the researcher were not necessarilyshared by the participants. The card sort data highlighted several measure-ment items that either mapped poorly or mapped more strongly to differentconstructs. These were considered on a case-by-case basis. The measurementitems were then remapped and the analysis was performed again, demonstrat-ing an increase in construct validity.
Equipped with a set of qualitatively developed and validated measurementitems, the focus now turns to the development of the survey instrument inthe next chapter: Phase II Quantitative Methods.

128 CHAPTER 5. PHASE I: QUALITATIVE METHODS
Chapter 6
Phase II: Quantitative Methods
Contents6.1 Chapter Overview . . . . . . . . . . . . . . . . . . 129
6.2 Stage 4: Survey Design . . . . . . . . . . . . . . . 130
6.3 Stage 5: Survey Pretest . . . . . . . . . . . . . . 133
6.4 Stage 6: Survey . . . . . . . . . . . . . . . . . . . 135
6.5 Chapter Summary . . . . . . . . . . . . . . . . . . 135
6.1 Chapter Overview
As noted in Chapter 4: Research Design and Methodology, Phase II ofthe research employed a quantitative methodology. Specifically, this phaseused quantitative methods to validate the links between the measurementitems and their constructs, and by capitalizing on those linkages, sought toquantitatively test the research model.
Building on Stages 1–3 of the qualitative phase, the research design of thequantitative phase consisted of three additional stages (Stages 4–6):
1. Stage 4: Survey Design: the design of the survey instrument and itsimplementation within a suitable online survey technology;
2. Stage 5: Survey Pretest : conducting a pretest of the online survey andusing the feedback to further refine the survey instrument; and
129
130 CHAPTER 6. PHASE II: QUANTITATIVE METHODS
3. Stage 6: Survey : this was the main data-gathering exercise, whichconsisted of using the survey instrument to gather sufficient data tovalidate the underlying research model.
In the next three sections, the methods used in each is discussed in detail.Stages 4–5 were necessarily completed prior to Stage 6, and thus their methodsincluded some analysis and implications that were considered before movingon to the final survey. The analysis of the Stage 6 data will be furtherdiscussed in Chapter 7: Phase II Data Analysis.
6.2 Stage 4: Survey Design
The survey design stage consisted of transforming the final measurement itempools that emerged from Stage 3 into an initial (draft) survey instrument.The objectives for this stage included:
1. the selection of an appropriate online survey technology;
2. consideration of the data analysis approach and the implications forhow and in what detail the data needed to be captured;
3. the creation of the survey instrument, including design, item grouping,section flow, branding, etc.; and
4. the creation of associated documentation and communications templates,including participant information sheets, consent forms, introductoryemails, graduated automated reminder messages, and thank you emails.
The outcome of this stage was a draft survey instrument package thatincluded all materials required to initiate the final data-gathering activity.The survey design decisions are briefly discussed below:
6.2.1 Online Survey Platform
The targeted sample population (as discussed in Section 4.3) consisted ofknowledge workers who had ready access to electronic recordkeeping systemsas part of their work. An online survey tool was selected as the best way toreach this ‘connected’ audience.
The advantages of online survey tools are numerous and well-documented.They are time efficient, cost effective, customizable, capable of providing
6.2. STAGE 4: SURVEY DESIGN 131
automated or immediate follow-up, unrestricted in geographic coverage, andable to minimize/eliminate processing and coding errors (T.-Z. Chang, 2013).An additional benefit is that they allow for direct access to public sectoremployees who are literally behind locked doors.
However, online surveys are not without their disadvantages. T.-Z. Chang(2013) points out that online surveys are constrained by Internet accessibilityand the state of the participant’s computer (e.g., featuring an up-to-datebrowser). Some populations are inaccessible to online surveys due to thesetechnological constraints. Furthermore, online surveys can be overused orautomated by commercial providers, leading to selection bias, truthfulnessconcerns (if anonymous), and even privacy concerns (T.-Z. Chang, 2013).In this research, the target population was known to be accessible onlineand was known to be operating compliant technology. Selection bias andprivacy concerns were mitigated through the sampling procedures, informationsheets, and privacy waivers. Furthermore, each invitation was customized toinclude the participant’s name, which was expected to address the truthfulnessconcern associated with anonymity.
To this end, Qualtrics (http://qualtrics.com) was adopted as the surveytechnology platform for use in the implementation of the pretest and finalsurvey stages. The next section addresses the survey design and data capturedecisions.
6.2.2 Analysis-Informed Data Capture
As discussed in Section 4.4.2 (p. 76), the selected analysis approach was a formof structural equation modeling (Partial Least Squares Path Modeling – PLS-PM – see Section 7.4 on p. 162). Structural equation modeling is particularlysuited for use in “inferential data analysis and hypothesis testing where thepattern of inter-relationships among the study constructs are specified a prioriand grounded in established theory” (Hoe, 2008, p. 76). PLS-PM is a goodfit to analyze models such as this confirmatory research model.
Knowing that the data would be analyzed using the PLS-PM technique,the survey design had to reflect that technique’s requirements and capturedata in a format suitable for subsequent analysis. In the case of PLS-PM,the data needed to be captured in the form of a multi-point Likert scale.A five-point Likert scale had been found to be sufficient as a measure ofreliability (Hinkin, 1998) and was therefore used in the design of the surveyinstrument.
132 CHAPTER 6. PHASE II: QUANTITATIVE METHODS
Qualtrics provided standardized preset scale labels as an option during thesurvey design. These labels (e.g., common Likert scales such as Strongly Dis-agree to Strongly Agree) were accepted and incorporated into the final design.The final survey is reproduced in Appendix C on p. 239. Having selected thesurvey tool and data capture method, the next decision point concerned theorganization of the survey and the presentation of the measurement items.
6.2.3 Creation of Survey Instrument
There was a final pool of 56 measurement items plus additional demographicquestions. Given the need to organize these items onto short survey screens/pages, the next question concerned how best to present them. To that end,three separate survey instruments were created using different methods oforganization.
• Randomized: this survey consisted of ≈ 15 measurement items perquestion block (which formed a page of the survey). The order ofthe questions generally followed the standard practice of starting witheasier questions, which then lead on to the more thoughtful or difficultquestions; however, in terms of their affiliation with specific modelconstructs, they were otherwise mixed together.
• Grouped by Conceptual Area: this survey consisted of three mainblocks that corresponded to: the recordkeeping system, the impacts ofthe organizational context, and the personal opinions toward record-keeping. The measurement items were roughly divided into the threeblocks, but were otherwise presented in a random order within eachblock.
• Grouped by Construct: this version consisted of blocks that corre-sponded directly to the research model’s constructs, where each blockconsisted of that construct’s pool of measurement items (≈ 10 perblock).
The three surveys were then considered from the viewpoint of potentialparticipants. The survey based on the conceptual area was the first to bediscarded. Although many of the measurement items fitted logically intothose three groupings, several did not place well. In addition, each blockconsisted of as many as 20 measurement items, and this was likely to make

6.3. STAGE 5: SURVEY PRETEST 133
the survey feel long and daunting to participants (which could negativelyimpact participation rates).
The randomized survey was the next to be discarded. Although thereis much to be said for randomizing the measurement items, there was arisk that how a participant may interpret an item could be impacted by itscontextual position next to other items. A truly randomized survey (andQualtrics provides a randomization feature so that each participant couldreceive the items in a different random order) could also cause problems incomprehension and interpretation.
Thus, the survey design that grouped the measurement items by constructwas selected as the preferred survey design. This design provided an opportu-nity to describe each construct to the participant and then introduce thatconstruct’s measurement item pool for consideration. By considering eachpool individually, the participant would be able to focus on the constructdimensions portrayed by each of the measurement items in relation to eachother, and this was expected to assist in how participants would interpreteach measurement item, leading to improved data and model measurements.
6.2.4 Survey Documentation Templates
The next task was to assemble and design the associated documentation andcommunication templates. This included introductory emails, informationsheets, consent forms, encouraging reminder email templates, and thank youtemplates. The final versions of these documents are shown in Appendix Cand Appendix D starting on p. 239.
Having selected a survey design and drafted the survey communicationtemplates, the survey was ready for pretesting.
6.3 Stage 5: Survey Pretest
The Survey Pretest is the phase where all of the parts come together foradvanced testing; in other words, a ‘dress rehearsal’ for the final survey.Although a pretest is generally recommended, Dillman (2007) warns that theSurvey Pretest is often done “haphazardly, if at all.” He further emphasizesthat a properly conceived pretest phase is a chance to:
• evaluate the distribution procedures and see whether any problemscome up;
134 CHAPTER 6. PHASE II: QUANTITATIVE METHODS
• discover production mistakes by having a few people fill out the survey;
• learn whether people clearly understand all of the questions; and
• provide an opportunity for feedback to improve the survey.
In the case of an online survey, it is where the technology meets the mea-surement items; and a pretest can provide the researcher with an opportunityto fine-tune the survey instrument as well as the platform on which it will beadministered.
Malhotra and Grover (1998) emphasized that “careful pretesting of in-struments [. . . ] can serve as a reality check indicating to the researcher howwell conceptualizations of the problem match the actual experience of thepractitioner.” Foddy (1998) also argued that “standard advice” to surveyresearchers has been to “field test questionnaires and interview schedules onsmall subsamples of respondents that have been drawn from the populationsof interest so that problematic questions can be identified.”
Hunt, Sparkman Jr., and Wilcox (1982) provided an early frameworkfor identifying the role of the pretest in improving the survey instrumentitself. They separated the pretest items into three categories: items aboutthe questionnaire itself; items about specific questions; and items about dataanalysis (Hunt et al., 1982). Adapting this framework, the pretest of thissurvey instrument focused on two primary aspects of the online survey: thetesting of the survey instrument itself and the testing of the survey instrumentdelivery, including distribution platform, mode of transmission, and ease ofdata file collection and processing.
The draft survey instrument was sent to a convenience sample of a dozenparticipants drawn from the New Zealand public sector and Victoria Universityof Wellington. Each of the participants was asked to complete the survey andprovide feedback on the survey instrument and its individual measurementitems.
The participant feedback was positive and didn’t result in any changes towording. All templates worked and the data was successfully extracted andrun through a trial PLS-PM analysis.
6.4. STAGE 6: SURVEY 135
6.4 Stage 6: Survey
In November 2013, the introductory email template was sent to a panel of254 employees of a large New Zealand public sector organization.
Appendix D (p. 249) shows the final Qualtrics communication templatesand the orchestration of the timings of their release to participants. Wherepossible, the number of recipients for each communication template is indi-cated. The communication template they received was determined by theirindividual survey completion status at the time of each mail-out. In total,the survey was open for 13 business days.
The progress of the survey was monitored closely using the Qualtricsonline monitoring tools. In addition, a personal email and telephone numberwas provided to all recipients to provide an easy channel for contacting theresearcher should they have any questions, issues or comments.
A detailed descriptive summary of the collected survey data is provided inAppendix E (p. 257). The subsequent analysis of the collected data is coveredin-depth in Chapter 7 – Phase II: Data Analysis.
6.5 Chapter Summary
As discussed in Chapter 4, Phase II of the research focused on quantitativemethods and the goal of developing the measurement items into a surveyinstrument and collecting sufficient data to empirically measure the researchmodel. Phase II included the next three stages (Stages 4–6) of the researchmethodology.
The first quantitative stage (Stage 4: Survey Design) covered the stepstaken to design a survey instrument and select a suitable platform to orches-trate its delivery. After selecting the online survey platform, the type andformat of the data needed to meet the analysis requirements was determined,resulting in the selection of a standard 5-point Likert scale. With thesedesign decisions in place, the organization of the survey instrument was nextconsidered. Three surveys were eventually created, and after examination oftheir potential advantages and disadvantages, one was selected for use as thefinal survey. In addition, a variety of communication templates were draftedin accordance with the modified Tailored Design Method (Dillman, 2009).
In the next stage (Stage 5: Survey Pretest), two aspects of the draftsurvey instrument were tested. The first aspect was the survey instrumentitself, where a dozen participants were asked to fill out the survey and provide

136 CHAPTER 6. PHASE II: QUANTITATIVE METHODS
feedback. The second aspect tested the automated follow-up email function-ality of the Qualtrics survey platform. This included several scenarios thatvalidated the mail-merge capability as well as the tracking of the completionstatus. For example, the completion status determined the set of peoplewho would receive reminder emails as opposed to thank you emails. Thefinal pretest consisted of extracting the dozen pretest records and runningthem through a trial PLS-PM analysis in order to validate that the data wascollected in sufficient detail and in the correct format to facilitate analysis.
The final stage covered in this chapter was Stage 6: Survey. Havingdeveloped confidence in the survey instrument and the delivery platform,the survey was sent to 254 employees of a large New Zealand public sectororganization.
In the next chapter (Chapter 7 – Phase II: Data Analysis), the analysis ofthe survey data is discussed.
Chapter 7
Phase II: Data Analysis
Contents7.1 Chapter Overview . . . . . . . . . . . . . . . . . . 137
7.2 Descriptive Statistics . . . . . . . . . . . . . . . . 138
7.3 Factor Analysis . . . . . . . . . . . . . . . . . . . . 143
7.4 Partial Least Squares Path Modeling (PLS-PM) 162
7.5 Analysis of Hypothesized Effects . . . . . . . . . 181
7.6 Additional Comments by Respondents . . . . . 184
7.7 Chapter Summary . . . . . . . . . . . . . . . . . . 188
7.1 Chapter Overview
In this chapter, the analysis of the survey data is discussed. The chapter startswith a summary of the response rate and descriptive statistics associatedwith the sample. This is followed by a closer look at the relationship betweenthe measurement items and their parent constructs, using a factor analysistechnique in an effort to further refine and improve the measurement itempools. With the final measurement item pools selected, the preferred analysistechnique, Partial Least Squares Path Modeling (PLS-PM), is introduced andits various merits discussed.
A description of the PLS-PM results for the survey data follows, withthe focus first on the outer (measurement) model, and then on the inner
137
138 CHAPTER 7. PHASE II: DATA ANALYSIS
(structural) model, with the estimated parameters, significance levels, andmodel validation analysis covered.
These results are then related back to the original research hypotheses inorder to determine how well the research model approximates the observedbehavior of the target population. Lastly, the qualitative data collected froman open-ended question are analyzed.
7.2 Descriptive Statistics
As discussed in Section 4.4.2 on estimated sample size (p. 78), the samplerequired for a statistically significant analysis was conservatively estimated tobe between 60–120 participants. By using PLS-PM as the primary methodfor analysis (see Section 7.4 on p. 162), it is likely that significant resultscould be obtained at the lower end of that estimate. However, non-response(and its associated bias) always remains a significant risk. As such, a generoussample size was set at ≈ 200 participants and an effort was made to minimizenon-response as much as possible.
7.2.1 Response Rate
The survey consisted of 254 invitations that were emailed out to a large NewZealand public sector organization consisting of a cross section of businessunits and responsibilities.1 The personal assistant to one of the generalmanagers volunteered to compile a list of suitable employees, which wasimported as a panel within Qualtrics. Each record included the first name,last name, email address, title, and phone number, which assisted greatly inpersonalizing the mass emailed invitations.
Of the 254 invitations, 208 surveys were opened and viewed, resulting inan 81.89% opening rate. Of the 208 opened surveys, there were 193 usablerecords, consisting of:
1Although the sample was limited to one organization, it captured a cross-section offunctions and activities that was expected to provide a similar representative variabilityto that of the public sector study population. It has been observed that “the relativeimportance of business unit effects far outweighs those of corporate or industry effects”(Misangyi, Elms, Greckhamer, & Lepine, 2006, p. 587), and it is argued that the differencesin attitudes between functional business units is likely greater than the aggregate differencesbetween public sector organizations.
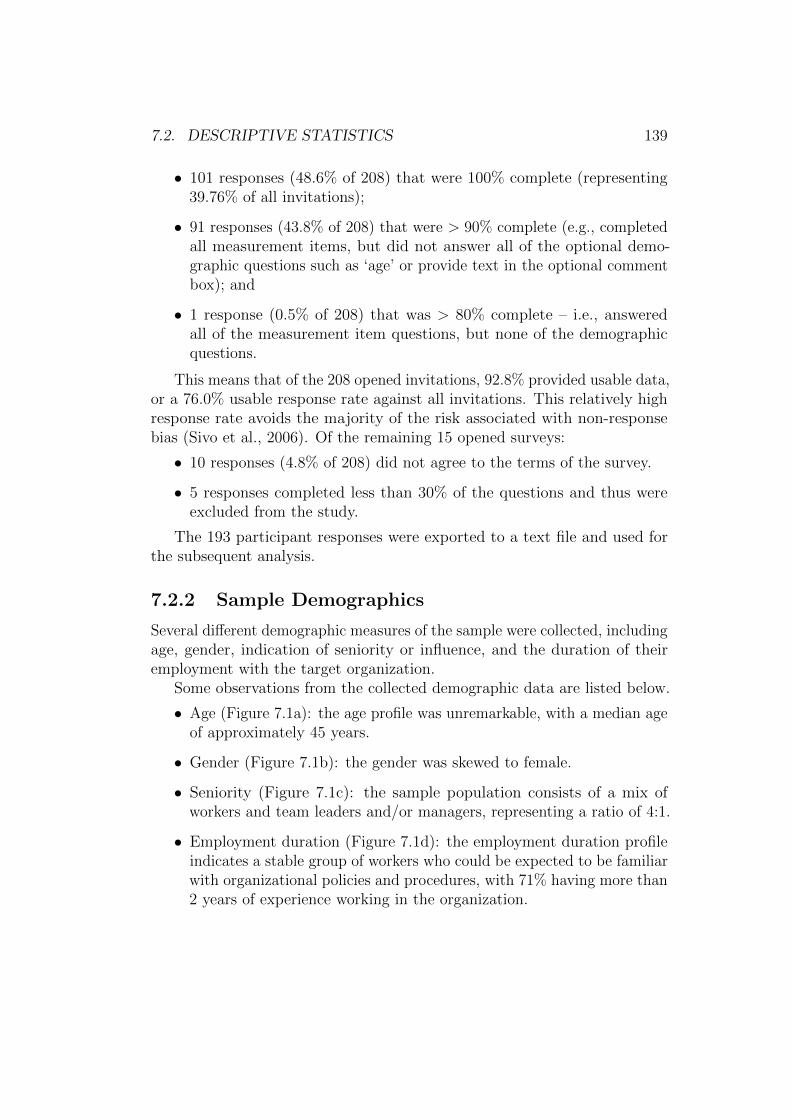
7.2. DESCRIPTIVE STATISTICS 139
• 101 responses (48.6% of 208) that were 100% complete (representing39.76% of all invitations);
• 91 responses (43.8% of 208) that were > 90% complete (e.g., completedall measurement items, but did not answer all of the optional demo-graphic questions such as ‘age’ or provide text in the optional commentbox); and
• 1 response (0.5% of 208) that was > 80% complete – i.e., answeredall of the measurement item questions, but none of the demographicquestions.
This means that of the 208 opened invitations, 92.8% provided usable data,or a 76.0% usable response rate against all invitations. This relatively highresponse rate avoids the majority of the risk associated with non-responsebias (Sivo et al., 2006). Of the remaining 15 opened surveys:
• 10 responses (4.8% of 208) did not agree to the terms of the survey.
• 5 responses completed less than 30% of the questions and thus wereexcluded from the study.
The 193 participant responses were exported to a text file and used forthe subsequent analysis.
7.2.2 Sample Demographics
Several different demographic measures of the sample were collected, includingage, gender, indication of seniority or influence, and the duration of theiremployment with the target organization.
Some observations from the collected demographic data are listed below.
• Age (Figure 7.1a): the age profile was unremarkable, with a median ageof approximately 45 years.
• Gender (Figure 7.1b): the gender was skewed to female.
• Seniority (Figure 7.1c): the sample population consists of a mix ofworkers and team leaders and/or managers, representing a ratio of 4:1.
• Employment duration (Figure 7.1d): the employment duration profileindicates a stable group of workers who could be expected to be familiarwith organizational policies and procedures, with 71% having more than2 years of experience working in the organization.
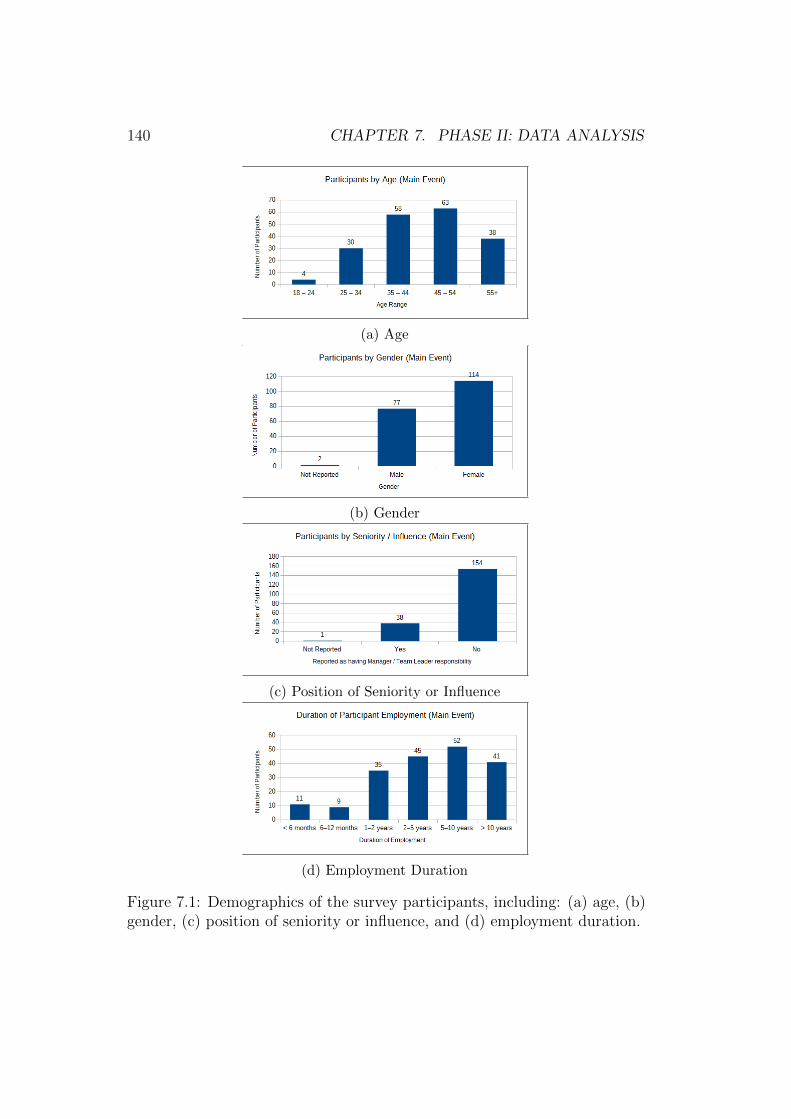
140 CHAPTER 7. PHASE II: DATA ANALYSIS
(a) Age
(b) Gender
(c) Position of Seniority or Influence
(d) Employment Duration
Figure 7.1: Demographics of the survey participants, including: (a) age, (b)gender, (c) position of seniority or influence, and (d) employment duration.
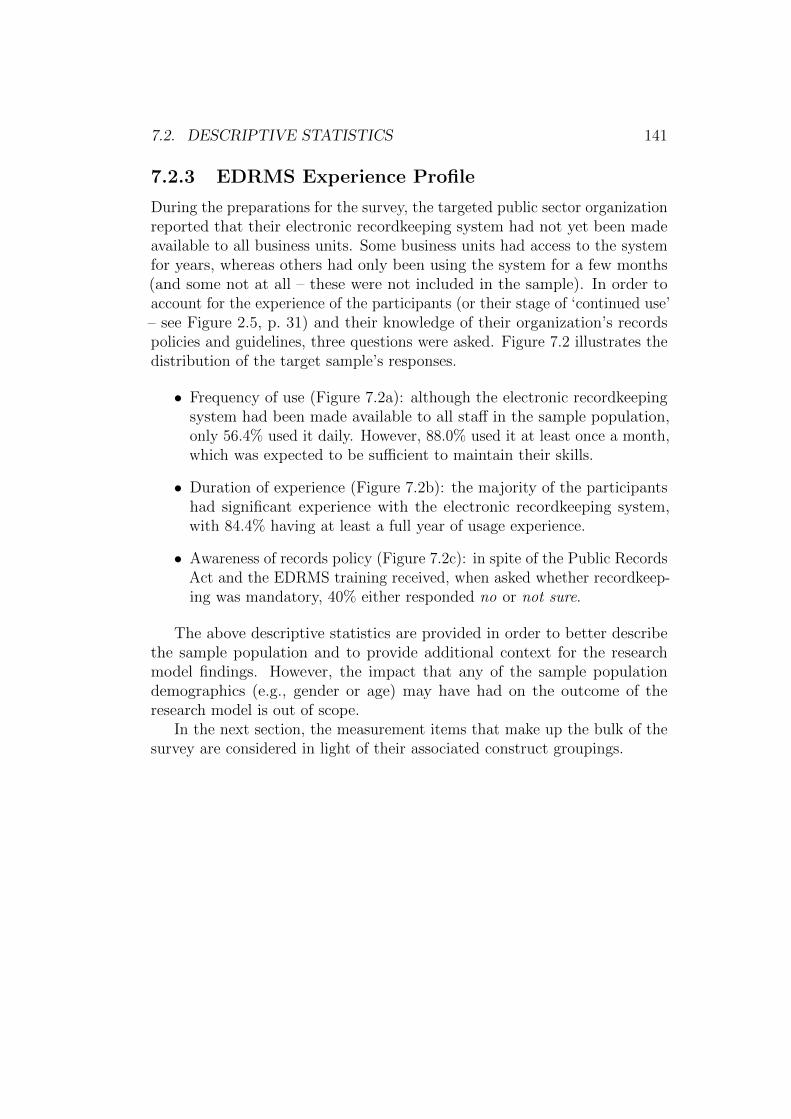
7.2. DESCRIPTIVE STATISTICS 141
7.2.3 EDRMS Experience Profile
During the preparations for the survey, the targeted public sector organizationreported that their electronic recordkeeping system had not yet been madeavailable to all business units. Some business units had access to the systemfor years, whereas others had only been using the system for a few months(and some not at all – these were not included in the sample). In order toaccount for the experience of the participants (or their stage of ‘continued use’– see Figure 2.5, p. 31) and their knowledge of their organization’s recordspolicies and guidelines, three questions were asked. Figure 7.2 illustrates thedistribution of the target sample’s responses.
• Frequency of use (Figure 7.2a): although the electronic recordkeepingsystem had been made available to all staff in the sample population,only 56.4% used it daily. However, 88.0% used it at least once a month,which was expected to be sufficient to maintain their skills.
• Duration of experience (Figure 7.2b): the majority of the participantshad significant experience with the electronic recordkeeping system,with 84.4% having at least a full year of usage experience.
• Awareness of records policy (Figure 7.2c): in spite of the Public RecordsAct and the EDRMS training received, when asked whether recordkeep-ing was mandatory, 40% either responded no or not sure.
The above descriptive statistics are provided in order to better describethe sample population and to provide additional context for the researchmodel findings. However, the impact that any of the sample populationdemographics (e.g., gender or age) may have had on the outcome of theresearch model is out of scope.
In the next section, the measurement items that make up the bulk of thesurvey are considered in light of their associated construct groupings.
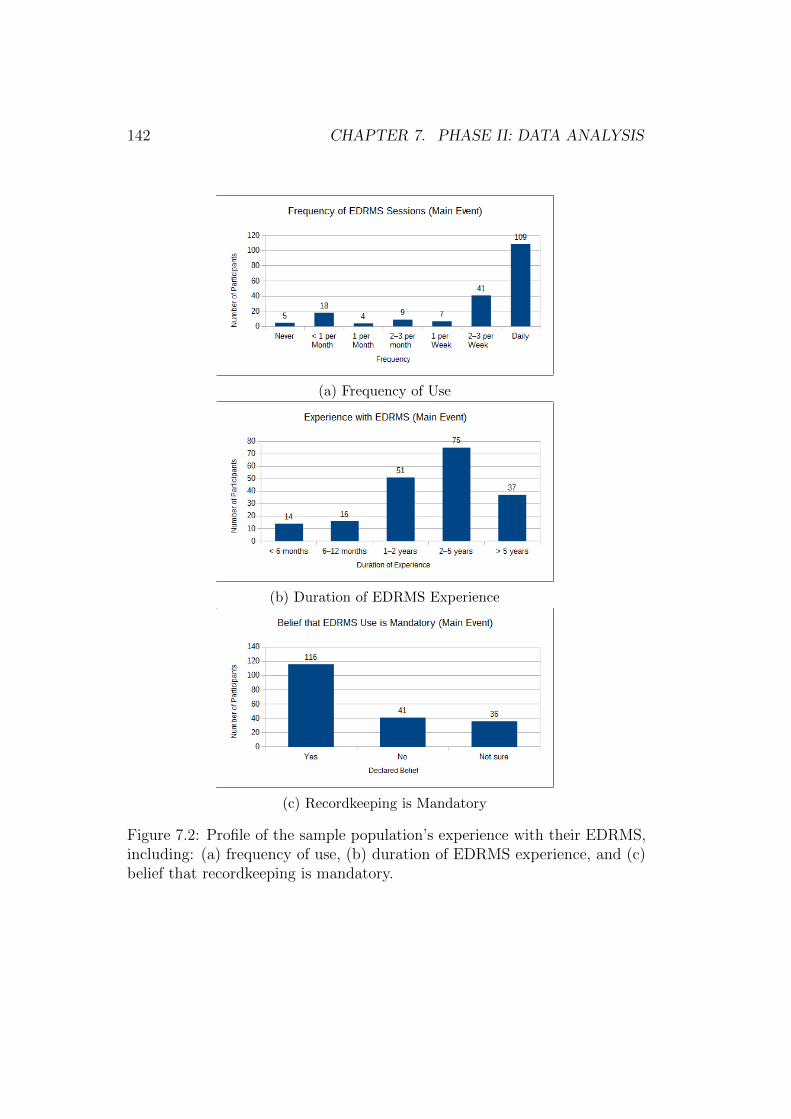
142 CHAPTER 7. PHASE II: DATA ANALYSIS
(a) Frequency of Use
(b) Duration of EDRMS Experience
(c) Recordkeeping is Mandatory
Figure 7.2: Profile of the sample population’s experience with their EDRMS,including: (a) frequency of use, (b) duration of EDRMS experience, and (c)belief that recordkeeping is mandatory.
7.3. FACTOR ANALYSIS 143
7.3 Factor Analysis
The initial selection process was based on Principal Component Analysis(PCA). This statistical method was used to measure how well each of themeasurement item pools co-correlated with each other.
The goals of PCA are to (a) extract the most important infor-mation from the data table, (b) compress the size of the dataset by keeping only this important information, (c) simplify thedescription of the data set, and (d) analyze the structure of theobservations and the variables. (Abdi & L. Williams, 2010, p. 3)
To achieve these goals, PCA computes a new set of variables (principalcomponents) that represent a linear combination of the original variables.The first principal component is the one that explains the largest source ofinertia, where inertia is a term used to represent the total variance of thedata. The second principal component is computed “under the constraintof being orthogonal to the first component and to have the [next] largestpossible inertia” (Abdi & L. Williams, 2010, p. 4).
If one were to imagine a positive correlation scatter plot (with the pointsforming a diagonal distribution from the lower left to the upper right of thegraph), the first principal component would describe the primary regressionline moving in the same direction (in parallel) with the correlation distributionand would thus describe the majority of the observed variance (inertia). Thesecond principal component would describe the width of the distributionand is measured as being perpendicular (orthogonal) to the first principalcomponent. The first two principal component variables thus capture themajority of the inertia associated with a regular positive correlation scatterplot. These variables are called, depending on their context, either “principalcomponents, factors, eigenvectors, singular vectors, or loadings” (Abdi, 2003,p. 1).
If the correlation scatter plot were irregularly shaped, additional principalcomponents could be similarly computed (and may be required to explainthe additional inertia/variance). Principal component calculations result infactor scores that can be “interpreted geometrically as the projections ofthe observations onto the principal components” (Abdi & L. Williams, 2010,p. 4).
The circle of correlations is a common visualization to help with theinterpretation of the first two principal components. A high correlation on the
144 CHAPTER 7. PHASE II: DATA ANALYSIS
first and second principal components indicates that the measurement itemsare also sufficiently correlated to perform well in the final PLS-PM analysis,which uses a similar statistical method for calculating its outer model.
PCA (via the circle of correlations) was applied to each of the modelconstructs in turn in order to verify aspects of construct validity and select afinal pool of measurement items for use in the structural equation model.
7.3.1 Circle of Correlations
The circle of correlations consists of a plot of correlations between the originalvariables and a pair of principal components (usually the first two). For anexample, see Figure 7.3 (p. 146). Abdi and Williams (2010, p. 11) provided amethod to interpret the circle of correlations as follows:
Recall that the sum of the squared loadings for a variable isequal to one. Remember, also, that a circle is defined as theset of points with the property that the sum of their squaredcoordinates is equal to a constant. As a consequence, when thedata are perfectly represented by only two components, the sumof the squared loadings is equal to one, and therefore, in this case,the loadings will be positioned on a circle which is called the circleof correlations. When more than two components are needed torepresent the data perfectly, the variables will be positioned insidethe circle of correlations. The closer a variable is to the circle ofcorrelations, the better we can reconstruct this variable from thefirst two components (and the more important it is to interpretthese components); the closer to the center of the plot a variableis, the less important it is for the first two components.
When plotting multiple measurement items on to the same circle, a tightcluster demonstrates that the measurement items reflect similar aspects ofthe same latent construct. As such, highly clustered measurement items areregarded as being better predictors of the latent construct (Sanchez, 2013b).Measurement items that did not cluster well were reviewed for possiblealternative interpretations, and some were dropped from the measurementitem pools.
In the next section, the analysis of each construct and how its measurementitem pool performed is described, with an emphasis on how the analysis resultswere interpreted and actioned to create the final pool of measurement itemstaken forward for further structural analysis.
7.3. FACTOR ANALYSIS 145
7.3.2 Factor Analysis by Construct
The PCA-based circle of correlations, in combination with the qualitativecard sorting data collected in Phase I and discussed in Chapter 5, Section 5.4(p. 112), was used to identify the measurement items that were highly corre-lated and thus provided a tight unidimensional reflection of their construct.Measurement items that did not cluster well were reviewed for the possibilityof different semantic interpretations and other potential sources of error. Manymeasurement items were subsequently removed from the final measurementmodel. Each of the constructs (and their related measurement item pools)are discussed below.
Effort Expectancy (Ease of Use) Factor Analysis
The first construct under consideration was effort expectancy (ease of use).Effort expectancy measurement items grouped well during the card sortingexercises (see Table 5.19 on p. 123) with several items sorting perfectly amongall participants. In this stage, the larger dataset collected during the surveysupported the use of the more robust PCA-based circle of correlations asa method to confirm the earlier card sorting analysis. The resulting effortexpectancy (EE) circle of correlations is shown in Figure 7.3.
Figure 7.3 shows that the EE measurement items were generally clusteredand shared a similar directional alignment. In addition, the majority of theitems were well explained by the first two principal components (as illustratedby the proximity to the edge of the circle). Note that EE09 is closer to thecenter of the circle than the other items, and this indicates that at least oneadditional principal component may be required to fully explain the shape ofits distribution. This could also mean that survey participants interpret theEE09 measurement item as having additional meanings or dimensions thatare beyond the context intended – i.e., an unintended source of error.
The primary cluster of EE measurement items in Figure 7.3 is designatedwith the manual addition of a small red circle. All of the measurement itemswithin that circle were considered to be well correlated and were expected toreflect the construct in the final measurement item with low error. Table 7.1provides the full text of the EE measurement items and divides the primarycluster of measurement items from the outliers (those that did not cluster aswell) to assist with the interpretation.
The initial observation was that the measurement items in the primaryEE cluster coincided with the highest scoring measurement items from the
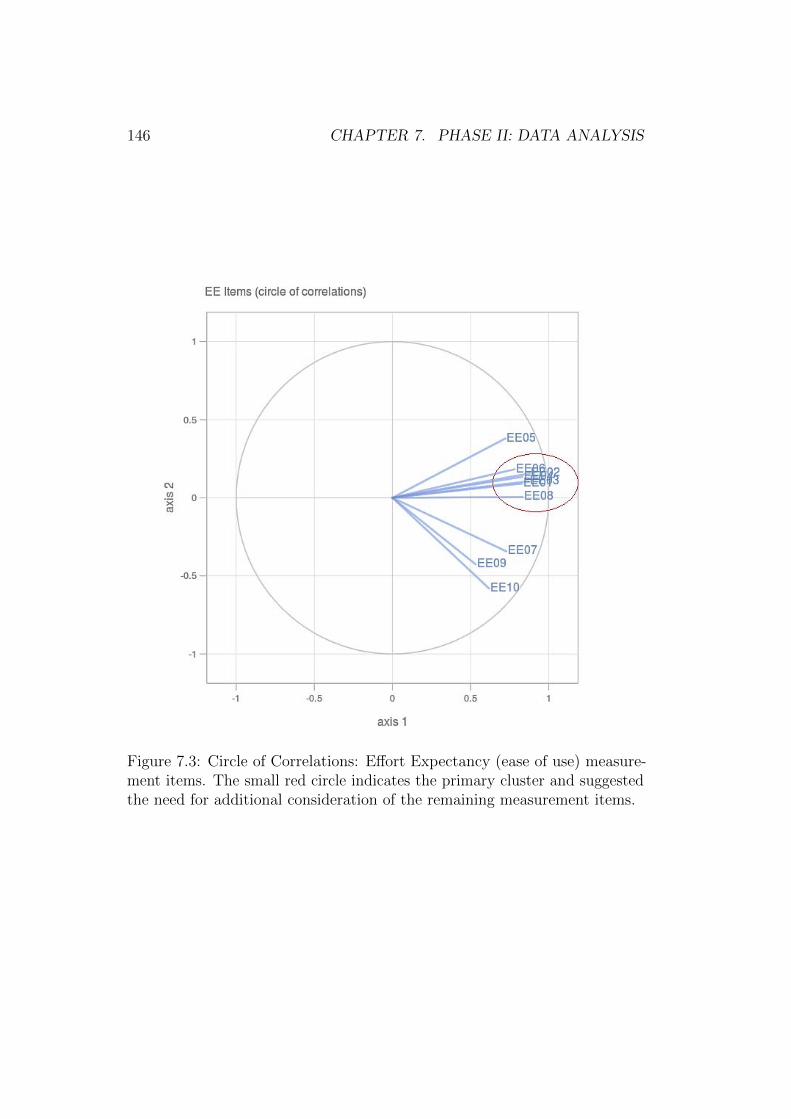
146 CHAPTER 7. PHASE II: DATA ANALYSIS
Figure 7.3: Circle of Correlations: Effort Expectancy (ease of use) measure-ment items. The small red circle indicates the primary cluster and suggestedthe need for additional consideration of the remaining measurement items.
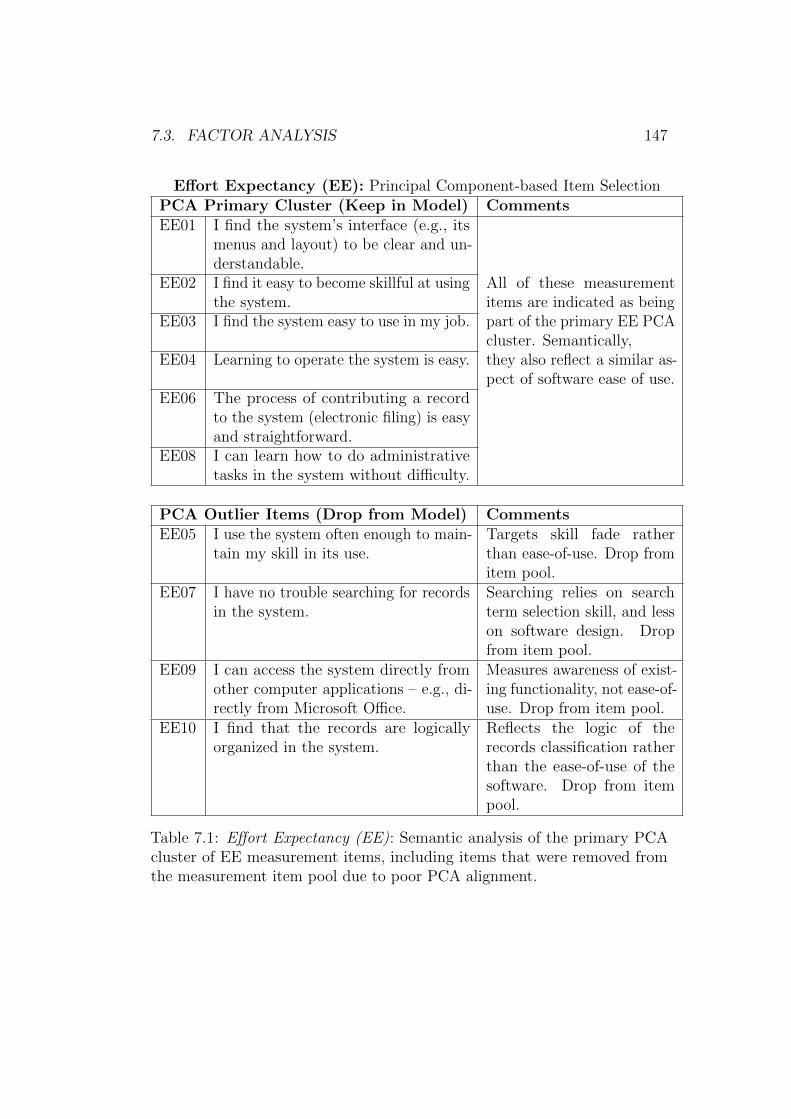
7.3. FACTOR ANALYSIS 147
Effort Expectancy (EE): Principal Component-based Item SelectionPCA Primary Cluster (Keep in Model) CommentsEE01 I find the system’s interface (e.g., its
menus and layout) to be clear and un-derstandable.
EE02 I find it easy to become skillful at usingthe system.
All of these measurementitems are indicated as being
EE03 I find the system easy to use in my job. part of the primary EE PCAcluster. Semantically,
EE04 Learning to operate the system is easy. they also reflect a similar as-pect of software ease of use.
EE06 The process of contributing a recordto the system (electronic filing) is easyand straightforward.
EE08 I can learn how to do administrativetasks in the system without difficulty.
PCA Outlier Items (Drop from Model) CommentsEE05 I use the system often enough to main-
tain my skill in its use.Targets skill fade ratherthan ease-of-use. Drop fromitem pool.
EE07 I have no trouble searching for recordsin the system.
Searching relies on searchterm selection skill, and lesson software design. Dropfrom item pool.
EE09 I can access the system directly fromother computer applications – e.g., di-rectly from Microsoft Office.
Measures awareness of exist-ing functionality, not ease-of-use. Drop from item pool.
EE10 I find that the records are logicallyorganized in the system.
Reflects the logic of therecords classification ratherthan the ease-of-use of thesoftware. Drop from itempool.
Table 7.1: Effort Expectancy (EE): Semantic analysis of the primary PCAcluster of EE measurement items, including items that were removed fromthe measurement item pool due to poor PCA alignment.
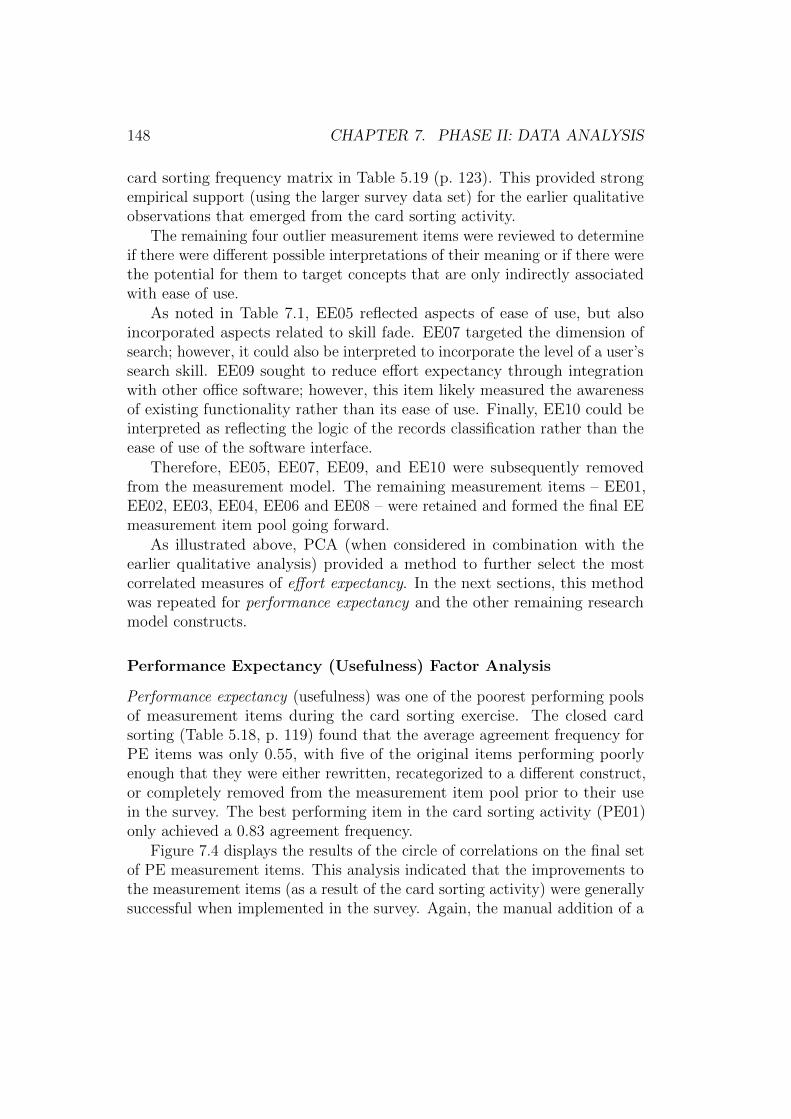
148 CHAPTER 7. PHASE II: DATA ANALYSIS
card sorting frequency matrix in Table 5.19 (p. 123). This provided strongempirical support (using the larger survey data set) for the earlier qualitativeobservations that emerged from the card sorting activity.
The remaining four outlier measurement items were reviewed to determineif there were different possible interpretations of their meaning or if there werethe potential for them to target concepts that are only indirectly associatedwith ease of use.
As noted in Table 7.1, EE05 reflected aspects of ease of use, but alsoincorporated aspects related to skill fade. EE07 targeted the dimension ofsearch; however, it could also be interpreted to incorporate the level of a user’ssearch skill. EE09 sought to reduce effort expectancy through integrationwith other office software; however, this item likely measured the awarenessof existing functionality rather than its ease of use. Finally, EE10 could beinterpreted as reflecting the logic of the records classification rather than theease of use of the software interface.
Therefore, EE05, EE07, EE09, and EE10 were subsequently removedfrom the measurement model. The remaining measurement items – EE01,EE02, EE03, EE04, EE06 and EE08 – were retained and formed the final EEmeasurement item pool going forward.
As illustrated above, PCA (when considered in combination with theearlier qualitative analysis) provided a method to further select the mostcorrelated measures of effort expectancy. In the next sections, this methodwas repeated for performance expectancy and the other remaining researchmodel constructs.
Performance Expectancy (Usefulness) Factor Analysis
Performance expectancy (usefulness) was one of the poorest performing poolsof measurement items during the card sorting exercise. The closed cardsorting (Table 5.18, p. 119) found that the average agreement frequency forPE items was only 0.55, with five of the original items performing poorlyenough that they were either rewritten, recategorized to a different construct,or completely removed from the measurement item pool prior to their usein the survey. The best performing item in the card sorting activity (PE01)only achieved a 0.83 agreement frequency.
Figure 7.4 displays the results of the circle of correlations on the final setof PE measurement items. This analysis indicated that the improvements tothe measurement items (as a result of the card sorting activity) were generallysuccessful when implemented in the survey. Again, the manual addition of a
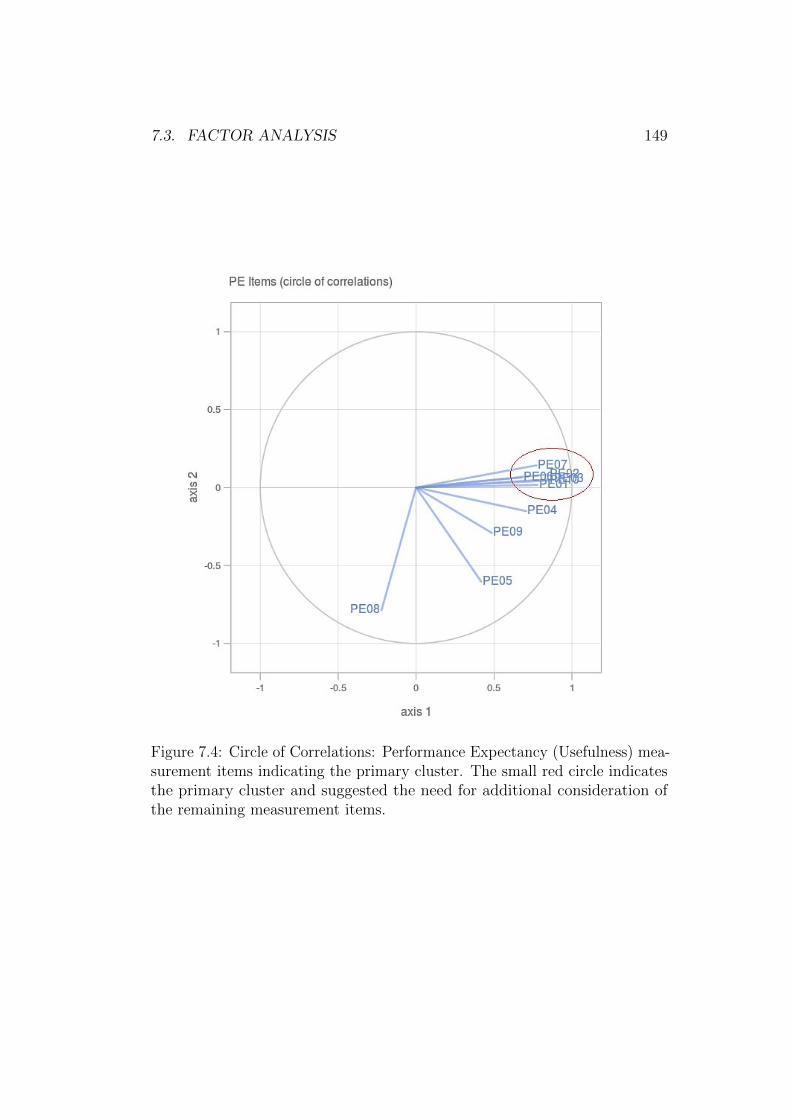
7.3. FACTOR ANALYSIS 149
Figure 7.4: Circle of Correlations: Performance Expectancy (Usefulness) mea-surement items indicating the primary cluster. The small red circle indicatesthe primary cluster and suggested the need for additional consideration ofthe remaining measurement items.
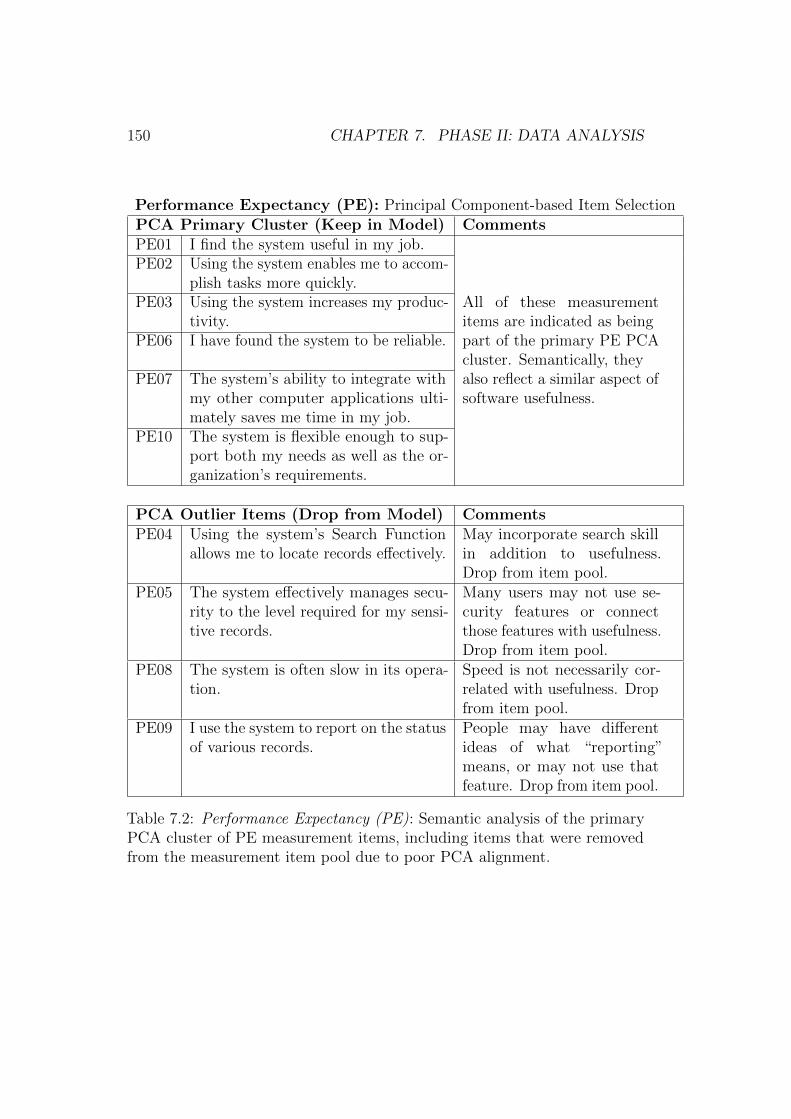
150 CHAPTER 7. PHASE II: DATA ANALYSIS
Performance Expectancy (PE): Principal Component-based Item SelectionPCA Primary Cluster (Keep in Model) CommentsPE01 I find the system useful in my job.PE02 Using the system enables me to accom-
plish tasks more quickly.PE03 Using the system increases my produc-
tivity.All of these measurementitems are indicated as being
PE06 I have found the system to be reliable. part of the primary PE PCAcluster. Semantically, they
PE07 The system’s ability to integrate withmy other computer applications ulti-mately saves me time in my job.
also reflect a similar aspect ofsoftware usefulness.
PE10 The system is flexible enough to sup-port both my needs as well as the or-ganization’s requirements.
PCA Outlier Items (Drop from Model) CommentsPE04 Using the system’s Search Function
allows me to locate records effectively.May incorporate search skillin addition to usefulness.Drop from item pool.
PE05 The system effectively manages secu-rity to the level required for my sensi-tive records.
Many users may not use se-curity features or connectthose features with usefulness.Drop from item pool.
PE08 The system is often slow in its opera-tion.
Speed is not necessarily cor-related with usefulness. Dropfrom item pool.
PE09 I use the system to report on the statusof various records.
People may have differentideas of what “reporting”means, or may not use thatfeature. Drop from item pool.
Table 7.2: Performance Expectancy (PE): Semantic analysis of the primaryPCA cluster of PE measurement items, including items that were removedfrom the measurement item pool due to poor PCA alignment.
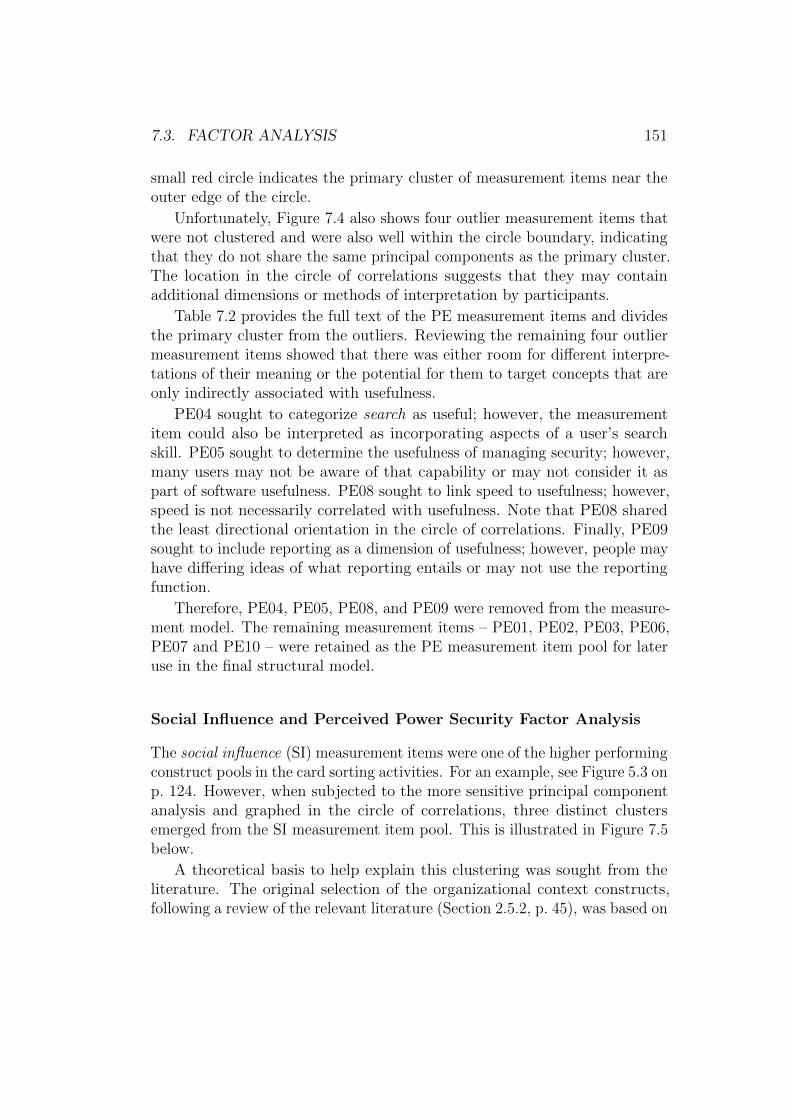
7.3. FACTOR ANALYSIS 151
small red circle indicates the primary cluster of measurement items near theouter edge of the circle.
Unfortunately, Figure 7.4 also shows four outlier measurement items thatwere not clustered and were also well within the circle boundary, indicatingthat they do not share the same principal components as the primary cluster.The location in the circle of correlations suggests that they may containadditional dimensions or methods of interpretation by participants.
Table 7.2 provides the full text of the PE measurement items and dividesthe primary cluster from the outliers. Reviewing the remaining four outliermeasurement items showed that there was either room for different interpre-tations of their meaning or the potential for them to target concepts that areonly indirectly associated with usefulness.
PE04 sought to categorize search as useful; however, the measurementitem could also be interpreted as incorporating aspects of a user’s searchskill. PE05 sought to determine the usefulness of managing security; however,many users may not be aware of that capability or may not consider it aspart of software usefulness. PE08 sought to link speed to usefulness; however,speed is not necessarily correlated with usefulness. Note that PE08 sharedthe least directional orientation in the circle of correlations. Finally, PE09sought to include reporting as a dimension of usefulness; however, people mayhave differing ideas of what reporting entails or may not use the reportingfunction.
Therefore, PE04, PE05, PE08, and PE09 were removed from the measure-ment model. The remaining measurement items – PE01, PE02, PE03, PE06,PE07 and PE10 – were retained as the PE measurement item pool for lateruse in the final structural model.
Social Influence and Perceived Power Security Factor Analysis
The social influence (SI) measurement items were one of the higher performingconstruct pools in the card sorting activities. For an example, see Figure 5.3 onp. 124. However, when subjected to the more sensitive principal componentanalysis and graphed in the circle of correlations, three distinct clustersemerged from the SI measurement item pool. This is illustrated in Figure 7.5below.
A theoretical basis to help explain this clustering was sought from theliterature. The original selection of the organizational context constructs,following a review of the relevant literature (Section 2.5.2, p. 45), was based on
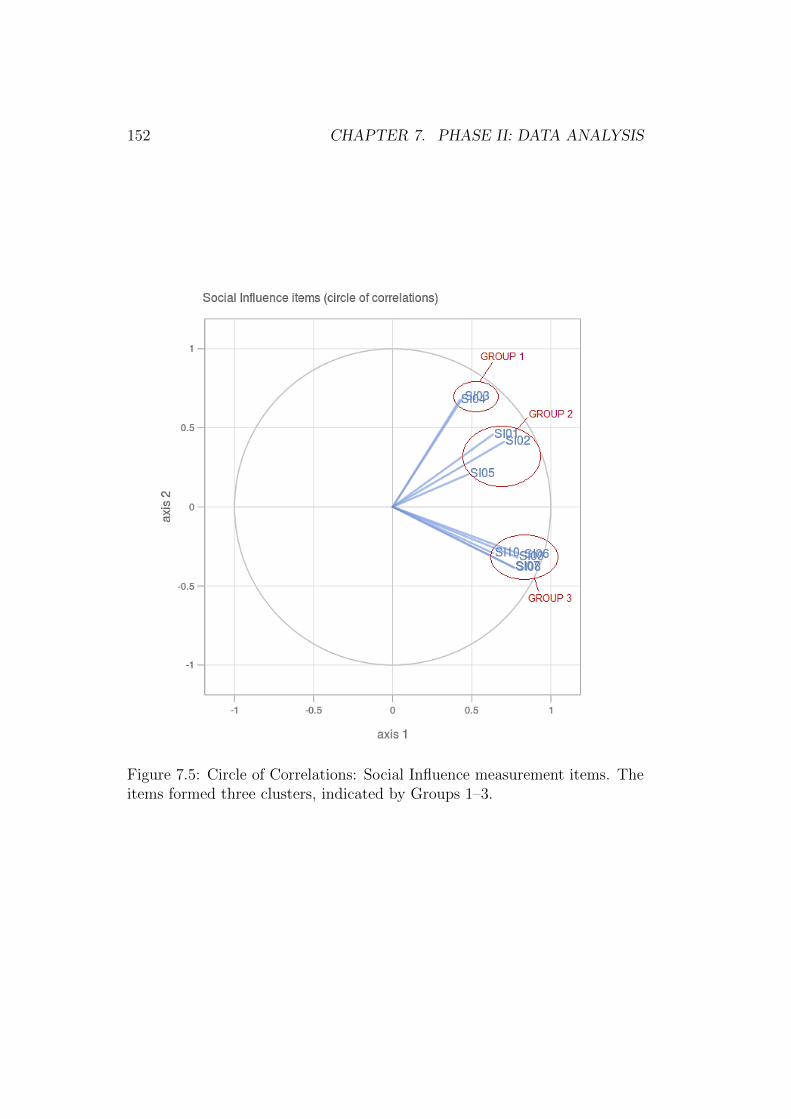
152 CHAPTER 7. PHASE II: DATA ANALYSIS
Figure 7.5: Circle of Correlations: Social Influence measurement items. Theitems formed three clusters, indicated by Groups 1–3.
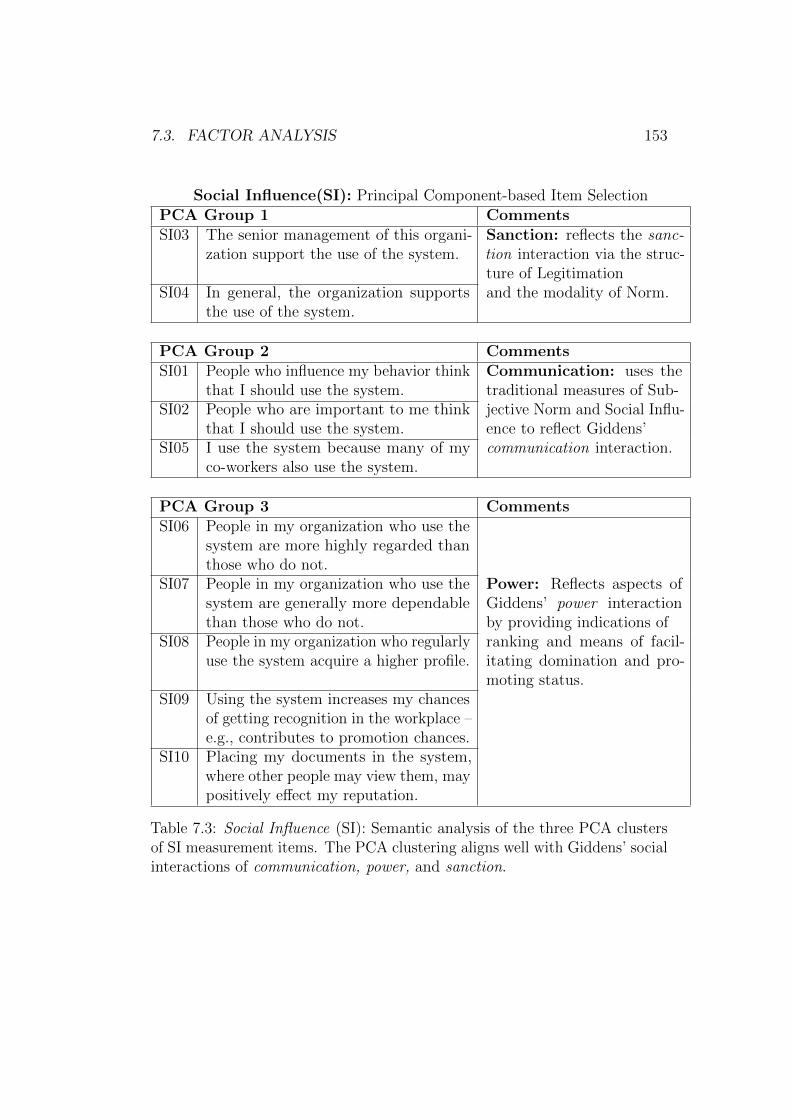
7.3. FACTOR ANALYSIS 153
Social Influence(SI): Principal Component-based Item SelectionPCA Group 1 CommentsSI03 The senior management of this organi-
zation support the use of the system.Sanction: reflects the sanc-tion interaction via the struc-ture of Legitimation
SI04 In general, the organization supportsthe use of the system.
and the modality of Norm.
PCA Group 2 CommentsSI01 People who influence my behavior think
that I should use the system.Communication: uses thetraditional measures of Sub-
SI02 People who are important to me thinkthat I should use the system.
jective Norm and Social Influ-ence to reflect Giddens’
SI05 I use the system because many of myco-workers also use the system.
communication interaction.
PCA Group 3 CommentsSI06 People in my organization who use the
system are more highly regarded thanthose who do not.
SI07 People in my organization who use thesystem are generally more dependablethan those who do not.
Power: Reflects aspects ofGiddens’ power interactionby providing indications of
SI08 People in my organization who regularlyuse the system acquire a higher profile.
ranking and means of facil-itating domination and pro-moting status.
SI09 Using the system increases my chancesof getting recognition in the workplace –e.g., contributes to promotion chances.
SI10 Placing my documents in the system,where other people may view them, maypositively effect my reputation.
Table 7.3: Social Influence (SI): Semantic analysis of the three PCA clustersof SI measurement items. The PCA clustering aligns well with Giddens’ socialinteractions of communication, power, and sanction.
154 CHAPTER 7. PHASE II: DATA ANALYSIS
Giddens’ Structuration Theory and his social interactions of communication,power, and sanction. (See Figure 2.2 on p. 20.)
Table 7.3 groups the SI measurement items by their PCA cluster and alignsthem with Giddens’ social interactions. The interpretation of this clusteranalysis indicates that the social influence measurement items incorporatemore than a single dimension of the construct, and that social influencecan be further considered in terms of its structurational components. Thisinterpretation is explored in Chapter 8 Discussion, p. 195.
The initial selection of social influence as a construct was made because itpartially reflected Giddens’ interactions of communication and to some extentsanction, with power being reflected separately by perceived power security(PPS). However, by adding in additional measurement items from componentconstructs that were claimed by social influence, the appearance of threeclusters (including one that could be interpreted as covering power) raiseda question. Were the measurement items contained in Figure 7.5 Group 3(power) sufficiently aligned with PPS to consider merging the two power itempools into one?
Perceived Power Security Factor Analysis When applying PCA tothe PPS data, the resulting circle of correlations for the PPS measurementitems revealed relatively weak clustering. See Figure 7.6.
The PPS measurement items had been problematic throughout the firststages of the research. They were among the most targeted for comprehensionproblems during proofreading; and subsequently, they did not sort well in thecard sorting activity. The survey data (see p. 261) provided what appearedto be conflicting responses – i.e., participants reported that use of the systemsimultaneously increased and decreased their power and influence over others.Finally, the PCA analysis confirmed only a weak relationship between themeasurement items. Nonetheless, were these still power measurement itemsin spite of their imperfections?
With the SI measurement item pool providing a potential alternative powergrouping (i.e., the Figure 7.5 Group 3 power cluster), additional analysis wasconducted to determine the extent of the overlap of PPS and SI measurementitems in terms of their principal component alignment.
To this end, the PPS and SI measurement items were combined intoa single pool for analysis. Figure 7.7 revealed that the PPS measurementitems appeared to cluster well in the context of the other SI measurementitems that had been associated with power, thus seeming to create a larger
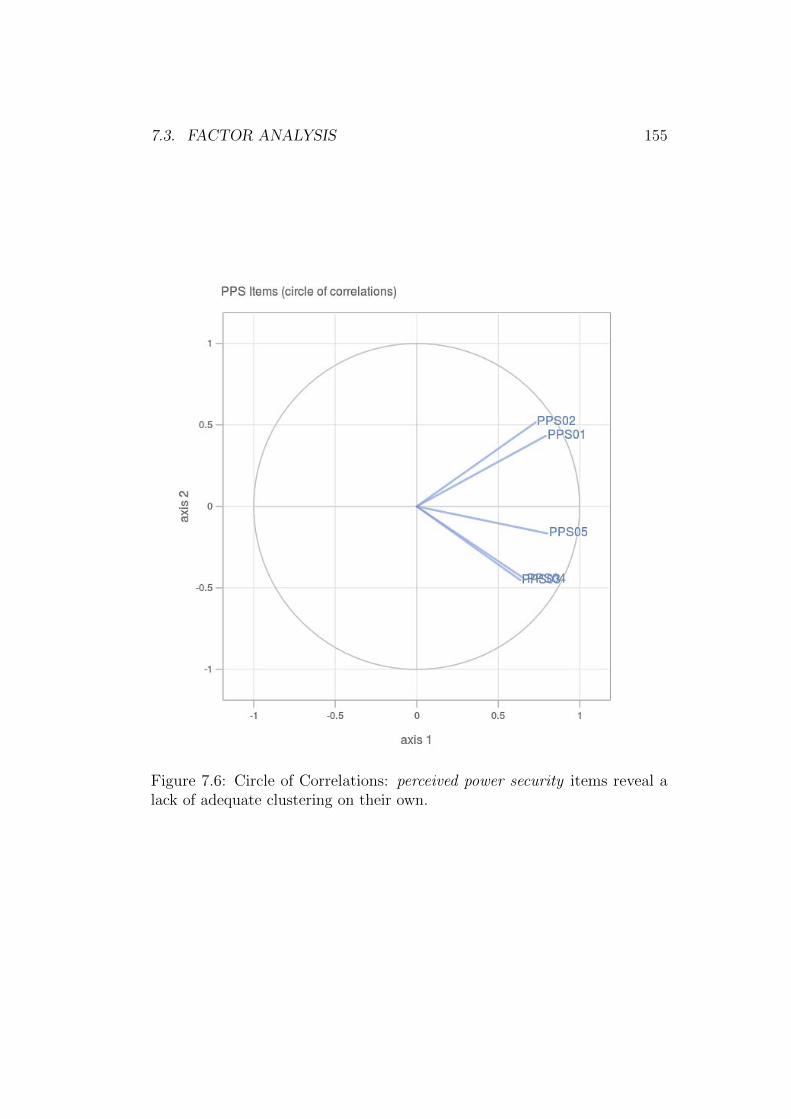
7.3. FACTOR ANALYSIS 155
Figure 7.6: Circle of Correlations: perceived power security items reveal alack of adequate clustering on their own.
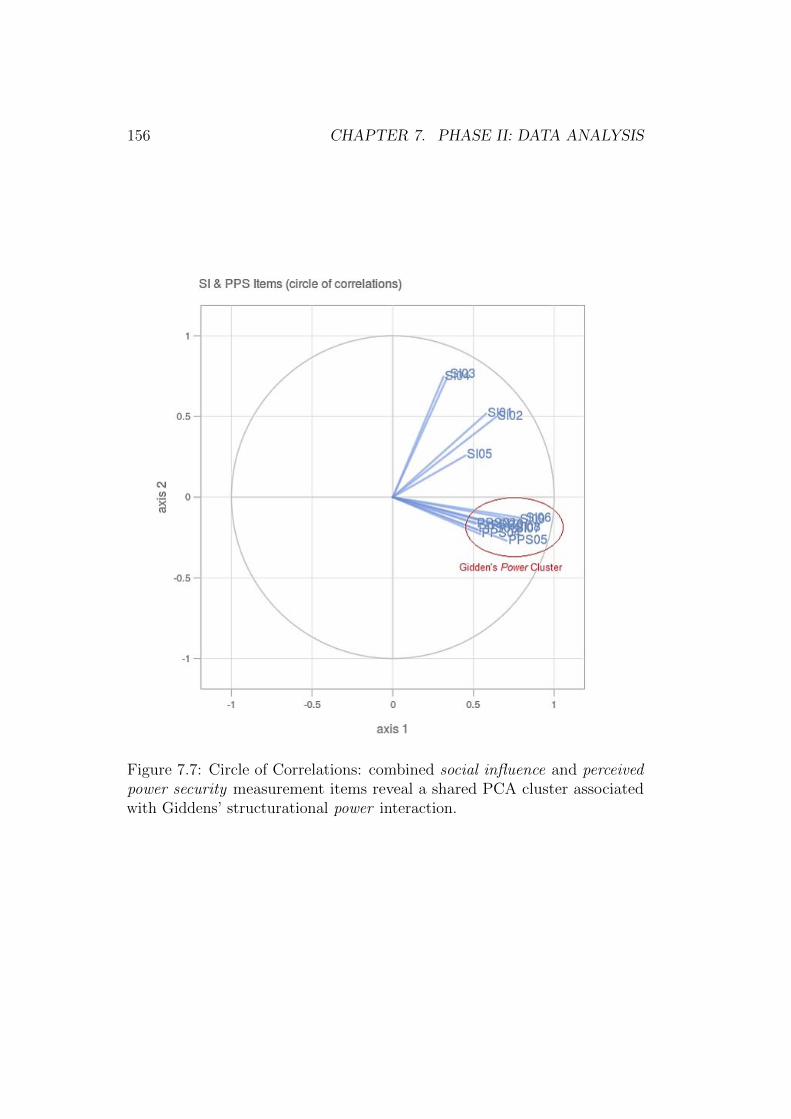
156 CHAPTER 7. PHASE II: DATA ANALYSIS
Figure 7.7: Circle of Correlations: combined social influence and perceivedpower security measurement items reveal a shared PCA cluster associatedwith Giddens’ structurational power interaction.

7.3. FACTOR ANALYSIS 157
cluster of potential power measurement items that share a similar PCAalignment. Nonetheless, it was already known from Figure 7.6 that the PPSitems themselves did not cluster well as a group. The next step was to focussolely on the larger set of power items in an effort to select the tightest clusterfor further analysis.
Figure 7.8: Circle of Correlations: combined power -related measurementitems sourced from SI and PPS reveal that the SI-based power items formthe primary cluster.
Figure 7.8 shows the circle of correlations that include only the set ofSI and PPS power measurement items. The power-related SI items are stilltightly clustered; however, the PPS items are once again spread outside of the
158 CHAPTER 7. PHASE II: DATA ANALYSIS
ideal clustering, forming two additional groups. These groups were consideredseparately to determine if the items provided additional support to the powerconstruct.
PPS01: Use of the system decreases my power over others ; and PPS02: Byrecording my knowledge in the system, I will be less valuable to the organizationas a source of knowledge were clustered and semantically dealt with an internalsense of personal value associated with use. Unlike the SI measurement itemsthat dealt with a direct cause and effect, these PPS measurement itemsmeasure power indirectly by requiring an intermediary concept: the powervalue of knowledge. To reduce error associated with potential differences ininterpretation of the power value of knowledge (a different construct from theperceived value of records), PPS01 and PPS02 were removed from the powermeasurement item pool.
PPS03, PPS04, and PPS05 were clustered, but were not logically related.They included measurement items that dealt with allocative control overone’s records; risk of judgment and exposure; and increasing influence overothers. Their principal component clustering may be due to other factorsoutside of the Giddens’ social power interaction. PPS03, PPS04 and PPS05were also removed from the power measurement item pool.
The PPS construct (having been stripped of all of its original measurementitems) was provided with a new set of measurement items taken from thesocial influence measurement item pool (coinciding with Figure 7.5 Group 3).To signify this change in measurement item pool, the construct label wasupdated to Power (POW). This replacement construct retained the originalPPS definition and theoretical foundation, but replaced the measurementitems with a new set that exhibited better PCA alignment.
Perceived Value of Records (PVR) Factor Analysis
The perceived value of records was the final construct to be analyzed usingPCA. Once again, the measurement item data from the survey were analyzed,resulting in a new PVR circle of correlations. See Figure 7.9.
Figure 7.9 shows two distinct clusters that emerged from the PVR mea-surement item pool. As with the social influence clusters, the literaturewas consulted in an effort to provide a theoretical foundation to explainthe differences between the clusters. During the initial development of themeasurement items, emergent themes were considered through the lens ofUpward’s Records Continuum Model (see the Records Continuum Model inFigure 2.3 on p. 24), particularly the continuum of evidentiality. With the
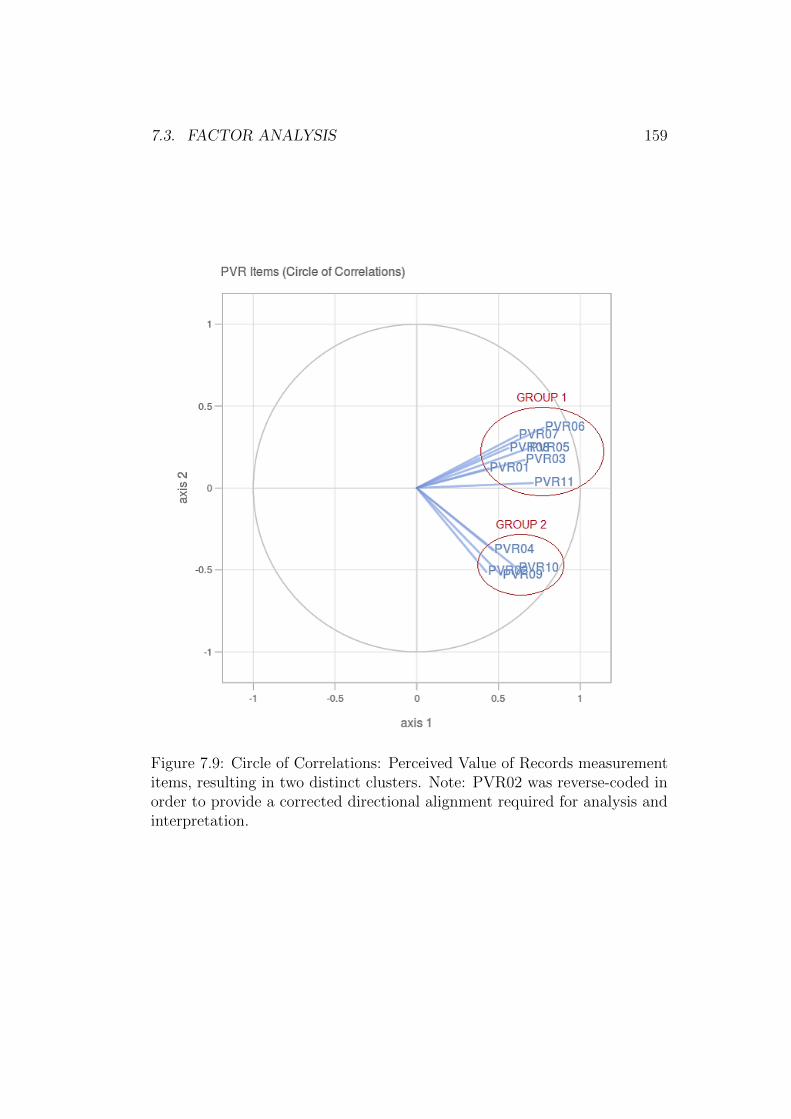
7.3. FACTOR ANALYSIS 159
Figure 7.9: Circle of Correlations: Perceived Value of Records measurementitems, resulting in two distinct clusters. Note: PVR02 was reverse-coded inorder to provide a corrected directional alignment required for analysis andinterpretation.
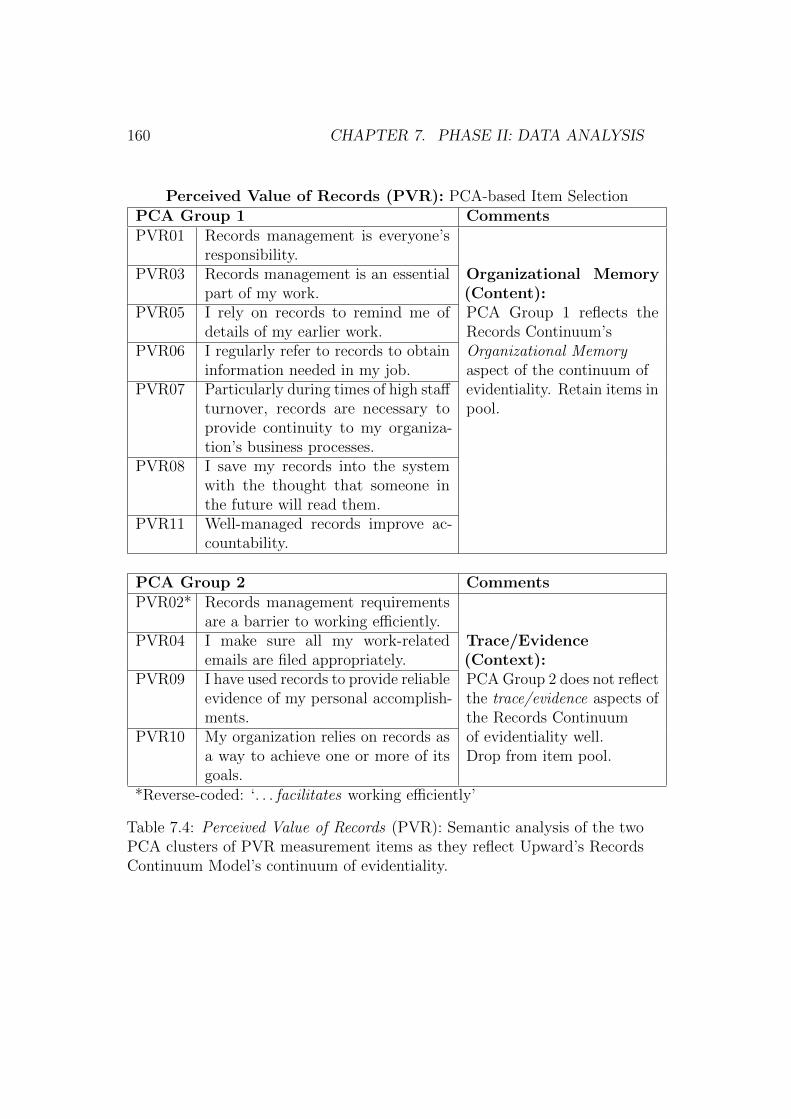
160 CHAPTER 7. PHASE II: DATA ANALYSIS
Perceived Value of Records (PVR): PCA-based Item SelectionPCA Group 1 CommentsPVR01 Records management is everyone’s
responsibility.PVR03 Records management is an essential
part of my work.Organizational Memory(Content):
PVR05 I rely on records to remind me ofdetails of my earlier work.
PCA Group 1 reflects theRecords Continuum’s
PVR06 I regularly refer to records to obtaininformation needed in my job.
Organizational Memoryaspect of the continuum of
PVR07 Particularly during times of high staffturnover, records are necessary toprovide continuity to my organiza-tion’s business processes.
evidentiality. Retain items inpool.
PVR08 I save my records into the systemwith the thought that someone inthe future will read them.
PVR11 Well-managed records improve ac-countability.
PCA Group 2 CommentsPVR02* Records management requirements
are a barrier to working efficiently.PVR04 I make sure all my work-related
emails are filed appropriately.Trace/Evidence(Context):
PVR09 I have used records to provide reliableevidence of my personal accomplish-ments.
PCA Group 2 does not reflectthe trace/evidence aspects ofthe Records Continuum
PVR10 My organization relies on records asa way to achieve one or more of itsgoals.
of evidentiality well.Drop from item pool.
*Reverse-coded: ‘. . . facilitates working efficiently’
Table 7.4: Perceived Value of Records (PVR): Semantic analysis of the twoPCA clusters of PVR measurement items as they reflect Upward’s RecordsContinuum Model’s continuum of evidentiality.
7.3. FACTOR ANALYSIS 161
literature in mind, the emergent interview themes were originally groupedinto three main dimensions: ownership of accountability (trace), need or valueof organizational memory, and need for reliable evidence.
In considering the two emergent clusters from the principal componentanalysis, the measurement items were again considered through the lens of theRecords Continuum Model. The full text of the measurement items makingup the two groups are documented in Table 7.4. Group 1 reflected the needand importance of records as a method to capture their information for use inthe future. The importance of the content of the records is in alignment withthe dimension of organizational memory within the continuum of evidentiality.
Group 2, however, did not reflect the semantic aspects of the dimensionsof trace and/or evidence as strongly, nor did it reflect the value of the contentof the records. Instead, Group 2 appeared to consist of a mixed bag of itemsranging from the willingness to save individual emails to the perception ofrecords management requirements as a barrier to working efficiently. OnlyPVR09 clearly connected a measurement item to the dimension of evidence,and unfortunately a single measurement item was insufficient to introducea new dimensional construct into the model. This is an area to potentiallyinvestigate in future research.
Consequently, PVR02, PVR04, PVR09 and PVR10 were removed fromthe PVR measurement item pool, and the perceived value of records constructwas instead focused on the remaining Records Continuum dimension oforganizational memory as the sole dimension of interest for this research.
In this section, PCA was applied to the measurement item pools associatedwith each of the main constructs. The results were analyzed using the circleof correlations as a method of identifying measurement items with principalcomponent factors that were aligned and clustered. Based on this analysis,those measurement items both closely clustered with each other and thatwere also semantically related to the targeted construct were retained. Thoseoutside of the primary cluster were reconsidered in light of these two selectioncriteria and, in some cases, were dropped from the measurement model.
In the next section, Partial Least Squares Path Modeling (PLS-PM)is introduced, and those measurement items remaining in the constructpools were combined to form the measurement model, which supported theevaluation of the research question.
162 CHAPTER 7. PHASE II: DATA ANALYSIS
7.4 Partial Least Squares Path Modeling
Partial Least Squares Path Modeling (PLS-PM) “is a statistical approachfor modeling complex multivariable relationships among observed and latentvariables” (Vinzi et al., 2010, p. 2). It falls within the general category ofstructural equation modeling (SEM) techniques.
When applied correctly, “SEM-based procedures have substantial advan-tages over first-generation techniques such as principal component analysis,discriminant analysis, or multiple regression because of the greater flexibilitythat a researcher has for the interplay between theory and data” (Chin, 1998a,p. vii). Haenlein and Kaplan (2004, p. 284) go so far as to state that theabove mentioned first-generation techniques are “only applicable when thereis neither a systematic nor a random error component – a rare situation inreality.”
SEM-based procedures allow researchers to construct latent variables andstatistically test a priori theoretical models against empirical data; in otherwords, it is an excellent tool for confirmatory analysis (Chin, 1998a). SEMprovides particular value due to its “increased rigor” surrounding constructvalidity, where it provide substantial improvements to testing many sub-dimensions of construct validity, including “unidimensionality, convergentvalidity, discriminant validity, and predictive validity” (Garver & Mentzer,1999, p. 33). In addition, these measures greatly assisted in providing supportand validation for the perceived value of records.
7.4.1 Selection of PLS-PM
SEM generally falls into two camps: Covariance Structure Analysis (CSA)and Partial Least Squares Path Modeling (PLS-PM). PLS-PM was selectedas the more appropriate analysis method for this research primarily due tothe advantages and characteristics listed below.2
• Philosophy of soft modeling : Soft modeling refers to “the ability of PLSto exhibit greater flexibility in handling various modeling problems in
2On his website dedicated to PLS modeling, Sanchez (2013a) compares and contrastsCSA to PLS-PM across 23 different dimensions, ranging from the “fitting algorithm”through to the method for estimating model correctness. PLS-PM clearly fits the contextof this research better than CSA. Furthermore, many of the limitations of PLS-PM, suchas its inability to handle recursive models, were of little concern given the straightforwardreflective structure of the research model.
7.4. PARTIAL LEAST SQUARES PATH MODELING (PLS-PM) 163
situations where it is difficult or impossible to meet the hard assumptionsof more traditional multivariate statistics” (Vinzi et al., 2010, p. 2). Thisis particularly true in relation to statistical “distributional assumptions”that are quite stringent for covariance-based approaches.
• Sample size: PLS-PM can provide significant results on substantiallysmaller sample sizes (Vinzi et al., 2010). Sanchez (2013a) suggests thatPLS-PM will perform well with as few as 30–100 cases, whereas thesample sizes required for CSA are often larger and can require from200–800 cases to return similar results.
• Predictive capability : PLS-PM seeks “optimal linear predictive relation-ships rather than for causal mechanisms, thus privileging a prediction-relevance oriented discovery process to the statistical testing of causalhypotheses” (Vinzi et al., 2010, p. 2). In other words, it is more data-driven and provides more emphasis on its measurement items than onthe structural model, thereby improving its predictive capability.
In addition, Chin (1998b, p. 299) suggested a straightforward set of criteriafor choosing between PLS and CSA modeling approaches:
Three essential distinctions to be brought forth between the PLSand covariance-based approaches are (a) whether the underlyingconstructs are modeled as indeterminate or determinate, (b) theextent to which one is confident in one’s theoretical model andauxiliary theory linking measures to constructs, and (c) whetherone is parameter oriented or prediction oriented. If, in eachinstance, one’s answer is the latter, then the PLS approach islikely more suitable.
In considering Chin’s SEM-method selection criteria, PLS-PM was found tobe more suitable. Mirroring his above selection structure: (a) the constructs,which were reflected by the selection of measurement items, were beingmodeled in an effort to obtain determinate values within the latent variablesthat could then be used for predictive purposes; (b) the level of confidence inthe theoretical model was moderated by the inclusion of a new, and untested,construct (perceived value of records); and (c) the model was prediction-oriented, in that one of the objectives of the research was to develop andvalidate a model in order “to determine the relative importance of the factorsthat influence a user’s intention to use an electronic recordkeeping system”
164 CHAPTER 7. PHASE II: DATA ANALYSIS
with the intention being to use those factors to predict use. PLS-PM wasthus confirmed as the preferred analysis technique for this research.
7.4.2 PLS-PM Described
A PLS-PM model can be considered as two separate models. The first modelis the outer (measurement) model and it consists of the pools of measurementitems. The measurement items are also called manifest variables since theyare made manifest through direct measurement using the survey instrument.The measurement model attempts to form the latent variables (or constructs)by reflecting aspects of the measurement items using a technique based onprincipal component analysis. The latent variables (constructs) cannot bemeasured directly: they are an abstract representation. The estimate ofthis latent variable is simply a linear combination of their manifest variables.More precisely, the latent variables are estimated as a weighted sum of theirindicators (Sanchez, 2013b, p. 39).
The second model (also called the structural or inner model) consists of therelationships between the estimated latent variables (the model’s constructs).The relationships to be tested are based on the hypothesized paths betweenthe constructs. These expected paths (research propositions) were sourcedfrom the literature and are the basis for the research model. The researchpropositions were covered in detail in Chapter 3.
Sanchez (2013b) describes the general logic behind the PLS-PM algorithm.The algorithm has three major stages. Stage 1 estimates the weights necessaryto compute the latent variables scores. Stage 2 estimates the path coefficients(the measure of the inner model), and stage 3 computes the loadings (themeasure of the outer model).
In order to estimate the weights for the latent variables (stage 1), PLS-PMperforms an iterative estimation approach. Successive iterations refine theweight estimates between the internal and external approximations of thelatent variables until they reach convergence. Once the stage 1 weights haveconverged, the stage 2 and stage 3 calculations complete the PLS-PM model.
There are many in-depth sources that go into great detail concerning themathematical basis and implementation of the PLS-PM algorithm (Sanchez,2013b; Tenenhaus, Vinzi, Chatelin, & Lauro, 2005; Chin, 1998b), and mostnotably Vinzi et al. (2010)’s Handbook of Partial Least Squares.
With the PLS-PM algorithm having been validated and incorporated intoseveral different reliable and popular statistical software tools, the focus ofthe remainder of the analysis was on the interpretation and application of
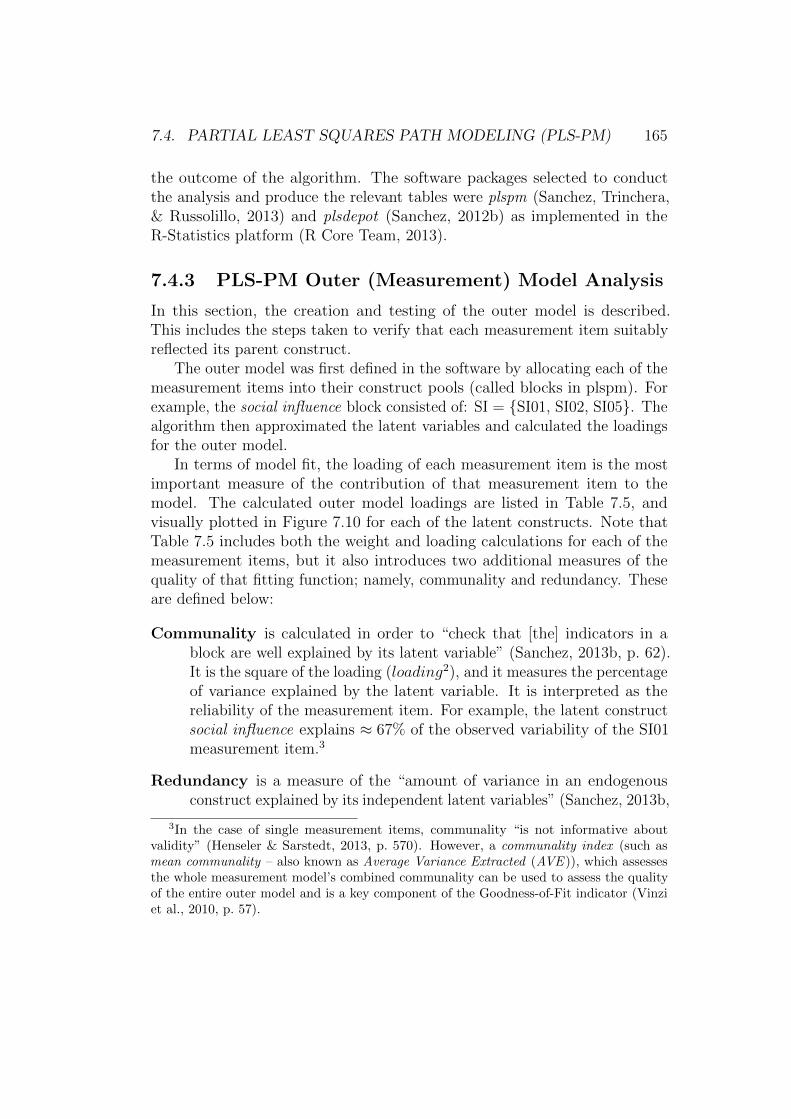
7.4. PARTIAL LEAST SQUARES PATH MODELING (PLS-PM) 165
the outcome of the algorithm. The software packages selected to conductthe analysis and produce the relevant tables were plspm (Sanchez, Trinchera,& Russolillo, 2013) and plsdepot (Sanchez, 2012b) as implemented in theR-Statistics platform (R Core Team, 2013).
7.4.3 PLS-PM Outer (Measurement) Model Analysis
In this section, the creation and testing of the outer model is described.This includes the steps taken to verify that each measurement item suitablyreflected its parent construct.
The outer model was first defined in the software by allocating each of themeasurement items into their construct pools (called blocks in plspm). Forexample, the social influence block consisted of: SI = {SI01, SI02, SI05}. Thealgorithm then approximated the latent variables and calculated the loadingsfor the outer model.
In terms of model fit, the loading of each measurement item is the mostimportant measure of the contribution of that measurement item to themodel. The calculated outer model loadings are listed in Table 7.5, andvisually plotted in Figure 7.10 for each of the latent constructs. Note thatTable 7.5 includes both the weight and loading calculations for each of themeasurement items, but it also introduces two additional measures of thequality of that fitting function; namely, communality and redundancy. Theseare defined below:
Communality is calculated in order to “check that [the] indicators in ablock are well explained by its latent variable” (Sanchez, 2013b, p. 62).It is the square of the loading (loading2), and it measures the percentageof variance explained by the latent variable. It is interpreted as thereliability of the measurement item. For example, the latent constructsocial influence explains ≈ 67% of the observed variability of the SI01measurement item.3
Redundancy is a measure of the “amount of variance in an endogenousconstruct explained by its independent latent variables” (Sanchez, 2013b,
3In the case of single measurement items, communality “is not informative aboutvalidity” (Henseler & Sarstedt, 2013, p. 570). However, a communality index (such asmean communality – also known as Average Variance Extracted (AVE )), which assessesthe whole measurement model’s combined communality can be used to assess the qualityof the entire outer model and is a key component of the Goodness-of-Fit indicator (Vinziet al., 2010, p. 57).
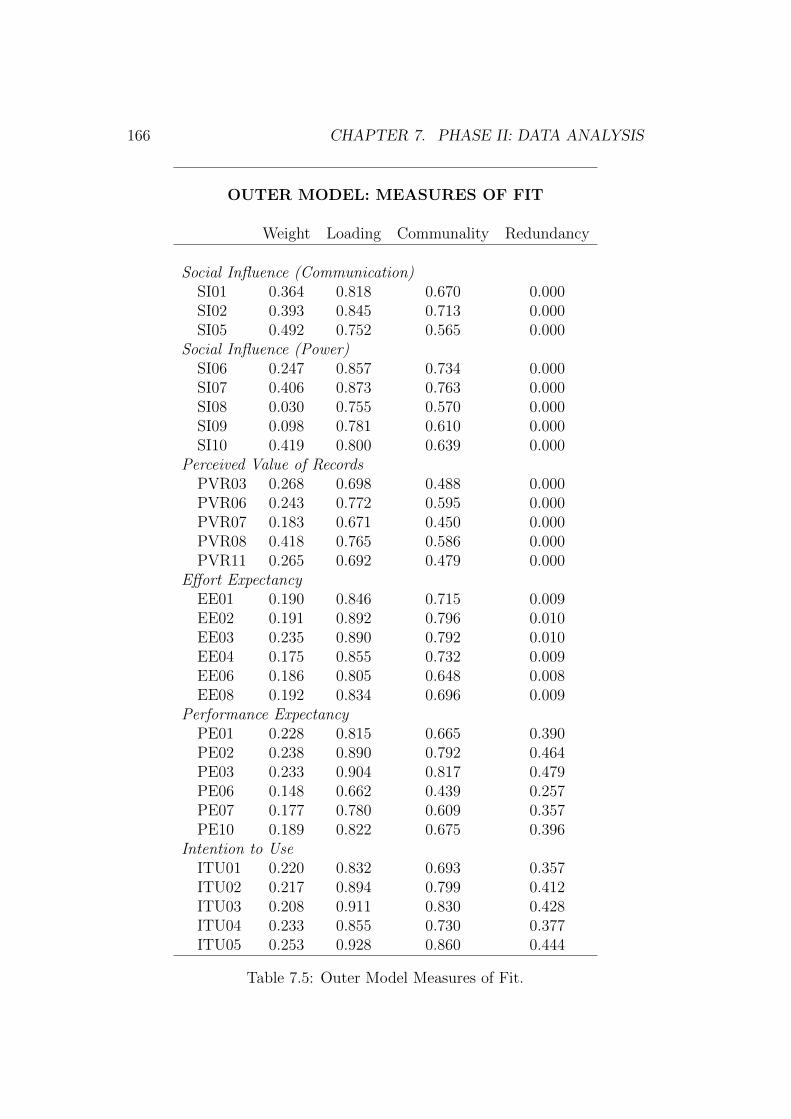
166 CHAPTER 7. PHASE II: DATA ANALYSIS
OUTER MODEL: MEASURES OF FIT
Weight Loading Communality Redundancy
Social Influence (Communication)SI01 0.364 0.818 0.670 0.000SI02 0.393 0.845 0.713 0.000SI05 0.492 0.752 0.565 0.000
Social Influence (Power)SI06 0.247 0.857 0.734 0.000SI07 0.406 0.873 0.763 0.000SI08 0.030 0.755 0.570 0.000SI09 0.098 0.781 0.610 0.000SI10 0.419 0.800 0.639 0.000
Perceived Value of RecordsPVR03 0.268 0.698 0.488 0.000PVR06 0.243 0.772 0.595 0.000PVR07 0.183 0.671 0.450 0.000PVR08 0.418 0.765 0.586 0.000PVR11 0.265 0.692 0.479 0.000
Effort ExpectancyEE01 0.190 0.846 0.715 0.009EE02 0.191 0.892 0.796 0.010EE03 0.235 0.890 0.792 0.010EE04 0.175 0.855 0.732 0.009EE06 0.186 0.805 0.648 0.008EE08 0.192 0.834 0.696 0.009
Performance ExpectancyPE01 0.228 0.815 0.665 0.390PE02 0.238 0.890 0.792 0.464PE03 0.233 0.904 0.817 0.479PE06 0.148 0.662 0.439 0.257PE07 0.177 0.780 0.609 0.357PE10 0.189 0.822 0.675 0.396
Intention to UseITU01 0.220 0.832 0.693 0.357ITU02 0.217 0.894 0.799 0.412ITU03 0.208 0.911 0.830 0.428ITU04 0.233 0.855 0.730 0.377ITU05 0.253 0.928 0.860 0.444
Table 7.5: Outer Model Measures of Fit.
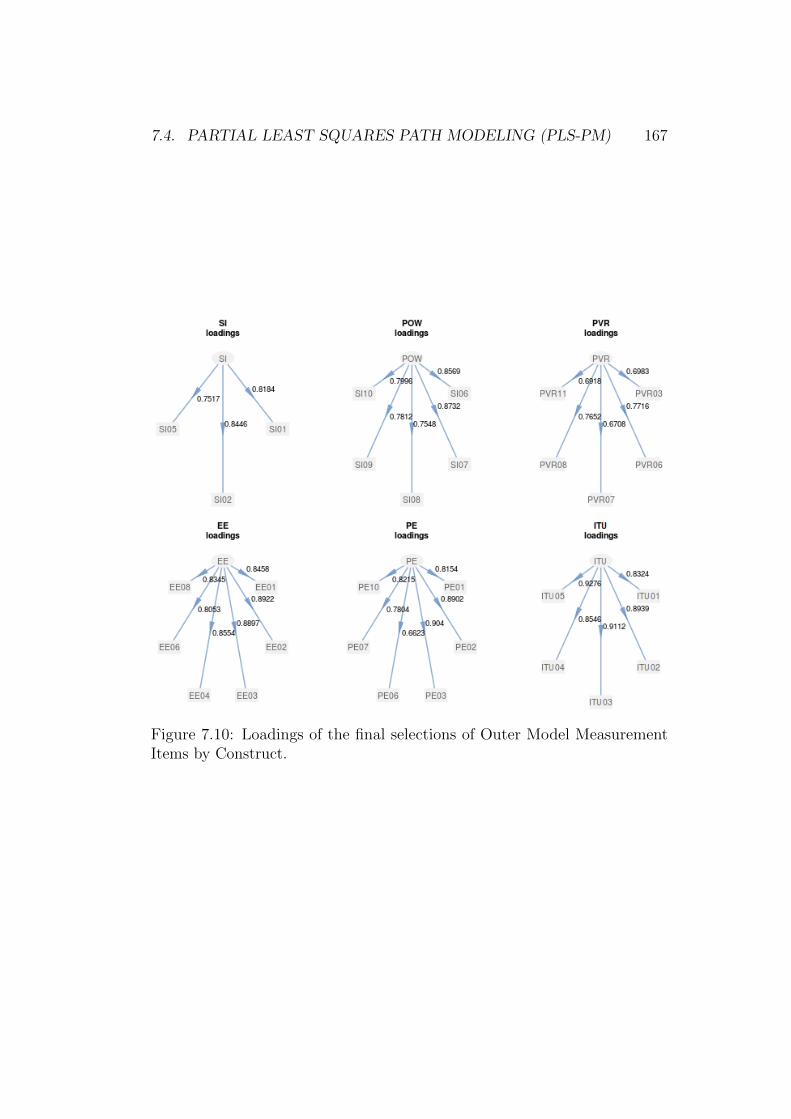
7.4. PARTIAL LEAST SQUARES PATH MODELING (PLS-PM) 167
Figure 7.10: Loadings of the final selections of Outer Model MeasurementItems by Construct.
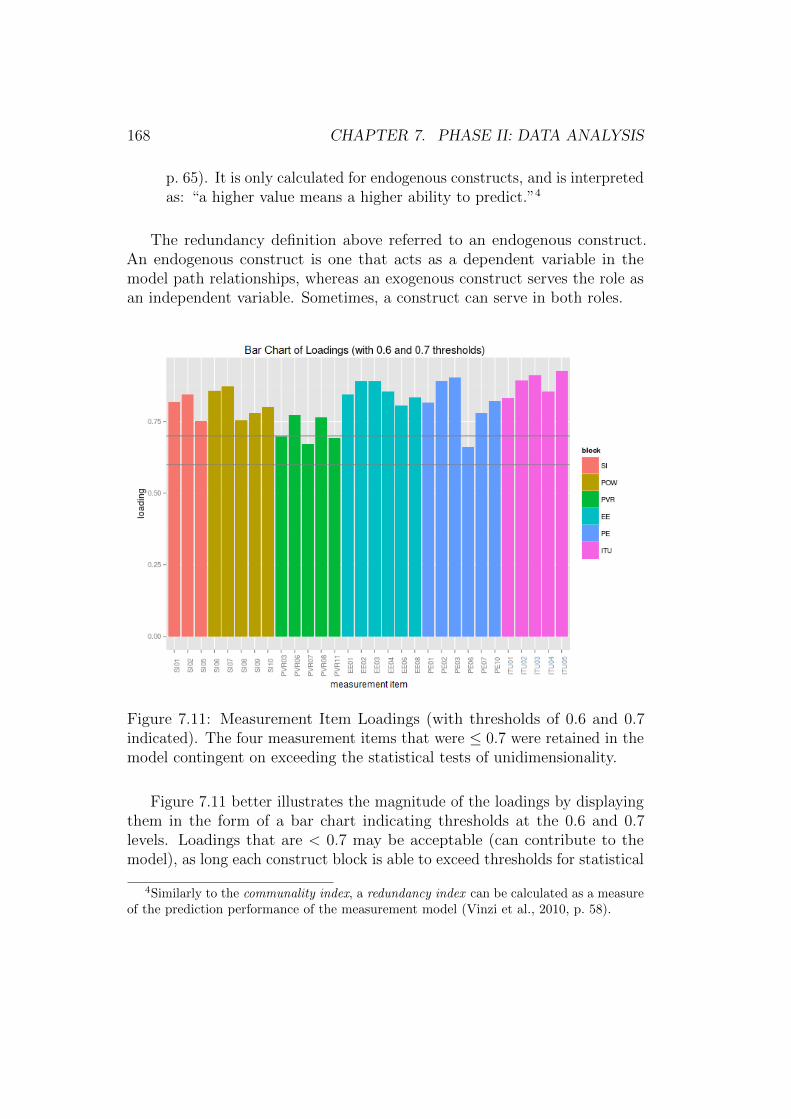
168 CHAPTER 7. PHASE II: DATA ANALYSIS
p. 65). It is only calculated for endogenous constructs, and is interpretedas: “a higher value means a higher ability to predict.”4
The redundancy definition above referred to an endogenous construct.An endogenous construct is one that acts as a dependent variable in themodel path relationships, whereas an exogenous construct serves the role asan independent variable. Sometimes, a construct can serve in both roles.
Figure 7.11: Measurement Item Loadings (with thresholds of 0.6 and 0.7indicated). The four measurement items that were ≤ 0.7 were retained in themodel contingent on exceeding the statistical tests of unidimensionality.
Figure 7.11 better illustrates the magnitude of the loadings by displayingthem in the form of a bar chart indicating thresholds at the 0.6 and 0.7levels. Loadings that are < 0.7 may be acceptable (can contribute to themodel), as long each construct block is able to exceed thresholds for statistical
4Similarly to the communality index, a redundancy index can be calculated as a measureof the prediction performance of the measurement model (Vinzi et al., 2010, p. 58).
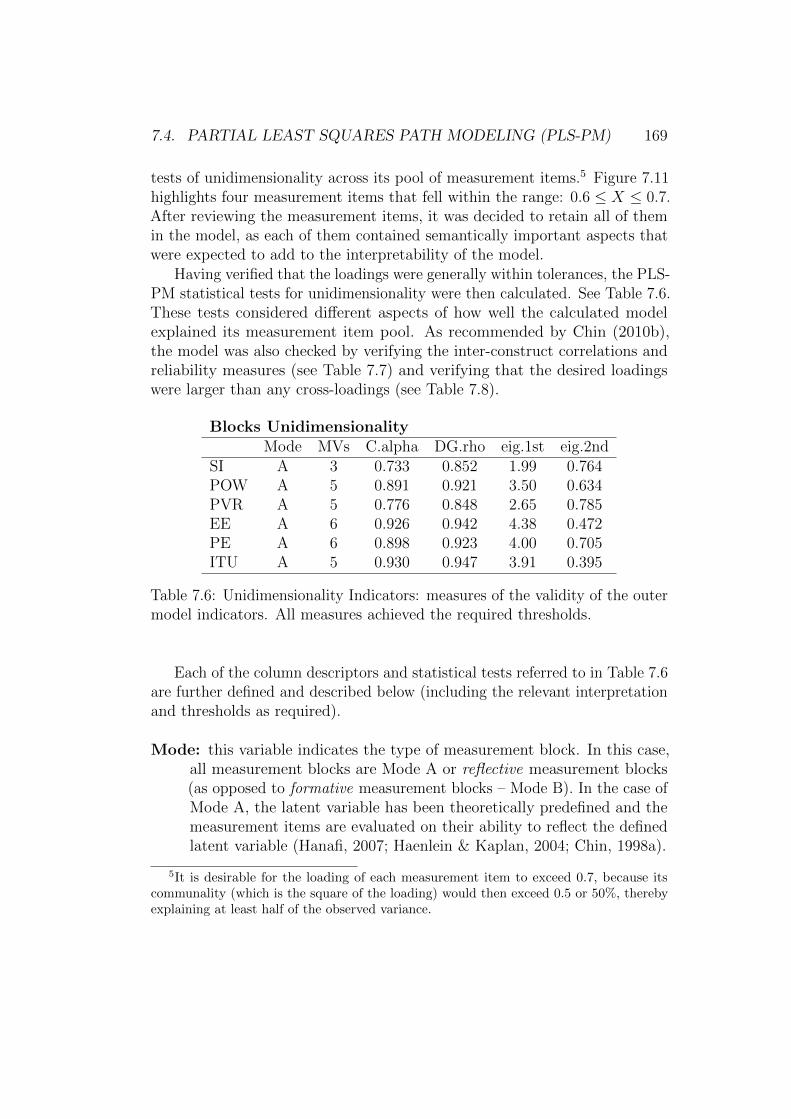
7.4. PARTIAL LEAST SQUARES PATH MODELING (PLS-PM) 169
tests of unidimensionality across its pool of measurement items.5 Figure 7.11highlights four measurement items that fell within the range: 0.6 ≤ X ≤ 0.7.After reviewing the measurement items, it was decided to retain all of themin the model, as each of them contained semantically important aspects thatwere expected to add to the interpretability of the model.
Having verified that the loadings were generally within tolerances, the PLS-PM statistical tests for unidimensionality were then calculated. See Table 7.6.These tests considered different aspects of how well the calculated modelexplained its measurement item pool. As recommended by Chin (2010b),the model was also checked by verifying the inter-construct correlations andreliability measures (see Table 7.7) and verifying that the desired loadingswere larger than any cross-loadings (see Table 7.8).
Blocks UnidimensionalityMode MVs C.alpha DG.rho eig.1st eig.2nd
SI A 3 0.733 0.852 1.99 0.764POW A 5 0.891 0.921 3.50 0.634PVR A 5 0.776 0.848 2.65 0.785EE A 6 0.926 0.942 4.38 0.472PE A 6 0.898 0.923 4.00 0.705ITU A 5 0.930 0.947 3.91 0.395
Table 7.6: Unidimensionality Indicators: measures of the validity of the outermodel indicators. All measures achieved the required thresholds.
Each of the column descriptors and statistical tests referred to in Table 7.6are further defined and described below (including the relevant interpretationand thresholds as required).
Mode: this variable indicates the type of measurement block. In this case,all measurement blocks are Mode A or reflective measurement blocks(as opposed to formative measurement blocks – Mode B). In the case ofMode A, the latent variable has been theoretically predefined and themeasurement items are evaluated on their ability to reflect the definedlatent variable (Hanafi, 2007; Haenlein & Kaplan, 2004; Chin, 1998a).
5It is desirable for the loading of each measurement item to exceed 0.7, because itscommunality (which is the square of the loading) would then exceed 0.5 or 50%, therebyexplaining at least half of the observed variance.
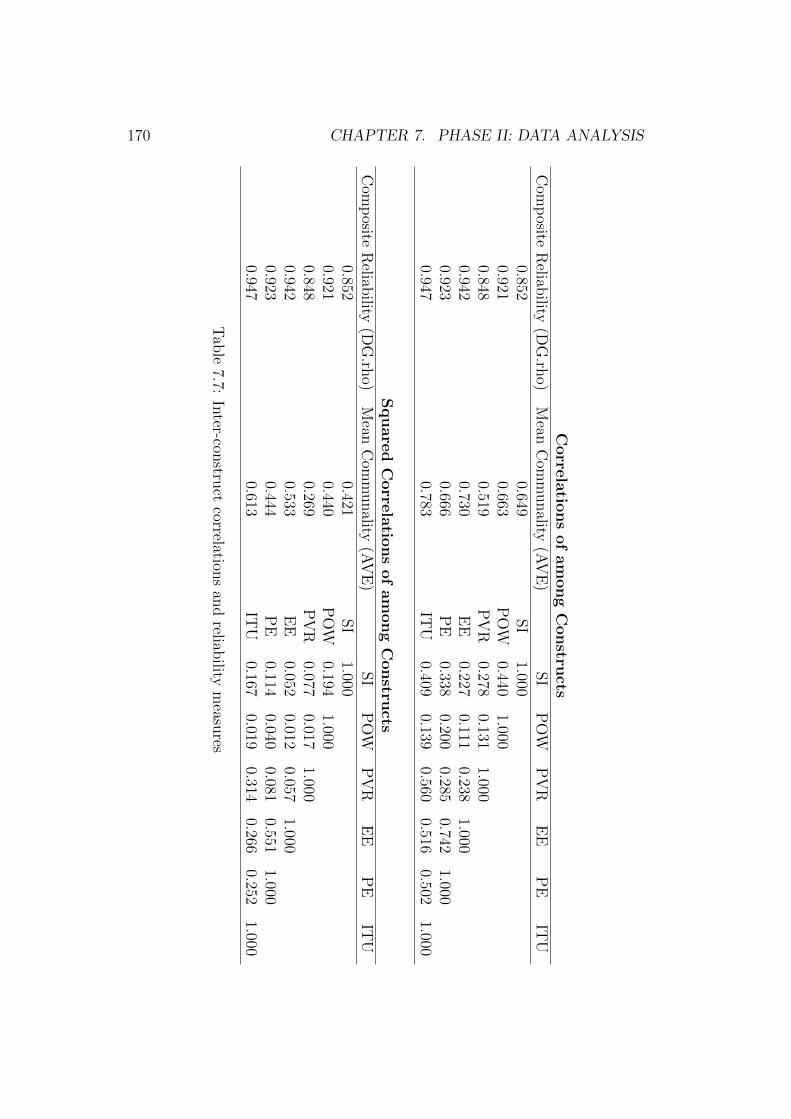
170 CHAPTER 7. PHASE II: DATA ANALYSIS
Corre
latio
nsofamongConstru
ctsCom
posite
Reliab
ility(D
G.rh
o)Mean
Com
munality
(AVE)
SI
POW
PVR
EE
PE
ITU
0.8520.649
SI
1.0000.921
0.663POW
0.4401.000
0.8480.519
PVR
0.2780.131
1.0000.942
0.730EE
0.2270.111
0.2381.000
0.9230.666
PE
0.3380.200
0.2850.742
1.0000.947
0.783IT
U0.409
0.1390.560
0.5160.502
1.000
SquaredCorre
latio
nsofamongConstru
ctsCom
posite
Reliab
ility(D
G.rh
o)Mean
Com
munality
(AVE)
SI
POW
PVR
EE
PE
ITU
0.8520.421
SI
1.0000.921
0.440POW
0.1941.000
0.8480.269
PVR
0.0770.017
1.0000.942
0.533EE
0.0520.012
0.0571.000
0.9230.444
PE
0.1140.040
0.0810.551
1.0000.947
0.613IT
U0.167
0.0190.314
0.2660.252
1.000
Tab
le7.7:
Inter-con
struct
correlationsan
dreliab
ilitymeasu
res
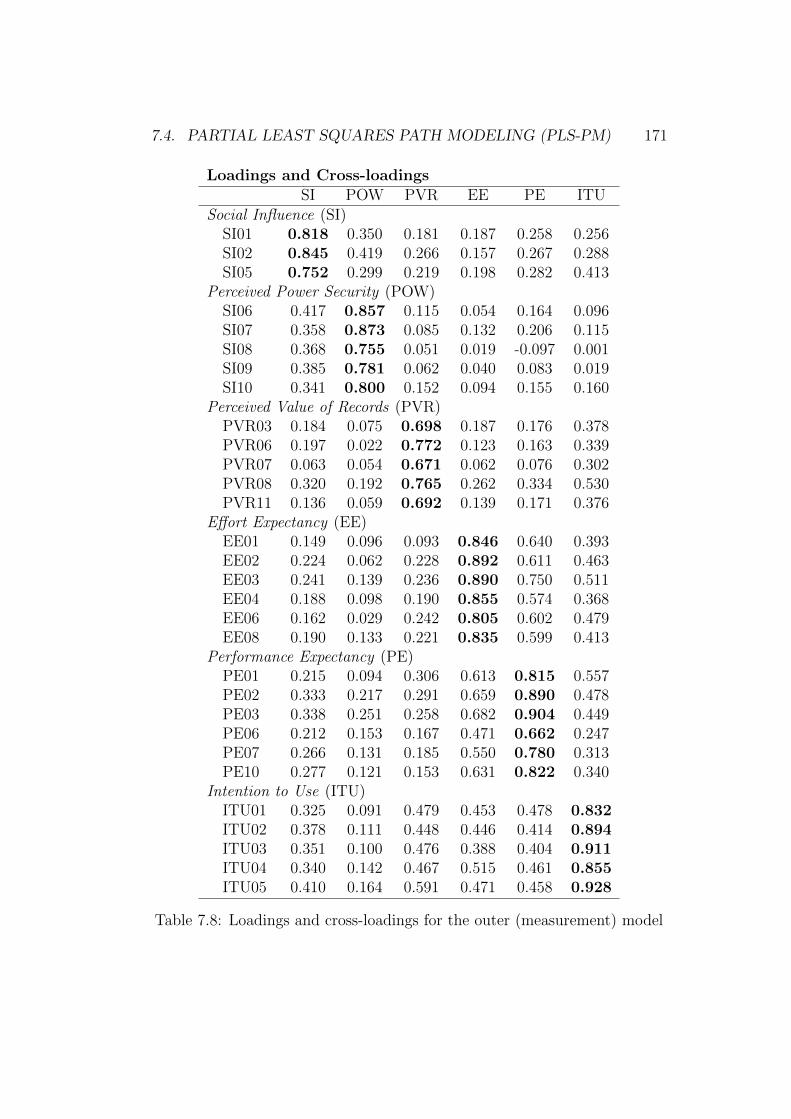
7.4. PARTIAL LEAST SQUARES PATH MODELING (PLS-PM) 171
Loadings and Cross-loadingsSI POW PVR EE PE ITU
Social Influence (SI)SI01 0.818 0.350 0.181 0.187 0.258 0.256SI02 0.845 0.419 0.266 0.157 0.267 0.288SI05 0.752 0.299 0.219 0.198 0.282 0.413
Perceived Power Security (POW)SI06 0.417 0.857 0.115 0.054 0.164 0.096SI07 0.358 0.873 0.085 0.132 0.206 0.115SI08 0.368 0.755 0.051 0.019 -0.097 0.001SI09 0.385 0.781 0.062 0.040 0.083 0.019SI10 0.341 0.800 0.152 0.094 0.155 0.160
Perceived Value of Records (PVR)PVR03 0.184 0.075 0.698 0.187 0.176 0.378PVR06 0.197 0.022 0.772 0.123 0.163 0.339PVR07 0.063 0.054 0.671 0.062 0.076 0.302PVR08 0.320 0.192 0.765 0.262 0.334 0.530PVR11 0.136 0.059 0.692 0.139 0.171 0.376
Effort Expectancy (EE)EE01 0.149 0.096 0.093 0.846 0.640 0.393EE02 0.224 0.062 0.228 0.892 0.611 0.463EE03 0.241 0.139 0.236 0.890 0.750 0.511EE04 0.188 0.098 0.190 0.855 0.574 0.368EE06 0.162 0.029 0.242 0.805 0.602 0.479EE08 0.190 0.133 0.221 0.835 0.599 0.413
Performance Expectancy (PE)PE01 0.215 0.094 0.306 0.613 0.815 0.557PE02 0.333 0.217 0.291 0.659 0.890 0.478PE03 0.338 0.251 0.258 0.682 0.904 0.449PE06 0.212 0.153 0.167 0.471 0.662 0.247PE07 0.266 0.131 0.185 0.550 0.780 0.313PE10 0.277 0.121 0.153 0.631 0.822 0.340
Intention to Use (ITU)ITU01 0.325 0.091 0.479 0.453 0.478 0.832ITU02 0.378 0.111 0.448 0.446 0.414 0.894ITU03 0.351 0.100 0.476 0.388 0.404 0.911ITU04 0.340 0.142 0.467 0.515 0.461 0.855ITU05 0.410 0.164 0.591 0.471 0.458 0.928
Table 7.8: Loadings and cross-loadings for the outer (measurement) model
172 CHAPTER 7. PHASE II: DATA ANALYSIS
MV (Manifest Variables): the number of manifest variables6 or measure-ment items that are included in the block associated with each latentvariable or construct.
C.alpha (Cronbach’s Alpha): [goal: > 0.7] is a classic coefficient to mea-sure internal consistency. “A block is considered homogenous [unidimen-sional] if this index is larger than 0.7 for confirmatory studies” (Vinziet al., 2010, p. 50).
DG.rho (Dillon-Goldstein’s rho): [goal: > 0.7] (also called compositereliability) it is another measure of block homogeneity. In the contextof PLS-PM, Dillon-Goldstein’s rho is considered a better indicator thanCronbach’s Alpha because it bases its estimates on the PLS-PM loadingsdirectly instead of relying on the measurement item correlation matrixof the data. “A block is considered homogenous [unidimensional] if thisindex is larger than 0.7” (Vinzi et al., 2010, p. 50).
eig.1st (1st Eigenvalue): [goal: > 1.0] is also known as the 1st principalcomponent. A high value (significantly greater than one) indicates thatthe majority of the correlation matrix of measurement items is based onthe importance of the first eigenvalue, and is therefore unidimensional(Vinzi et al., 2010, p. 50).
eig.2nd (2nd Eigenvalue): [goal: < 1.0] is also known as the 2nd principalcomponent. This is a double-check of the power of the 1st Eigenvalue.A very low value (less than 1) [Kaiser’s Rule], which indicates that theremainder of the correlation matrix is unimportant and is thereforeunidimensional (Vinzi et al., 2010, p. 50).
With regard to the tests of unidimensionality, all measures presented inTable 7.6 were well within the established thresholds. Therefore, the outermodel was considered good and was able to provide the foundation for testingthe inner model.
7.4.4 PLS-PM Inner (Structural) Model Analysis
The inner model is also known as the structural model and correspondswith the theoretical research model. It consists of the proposed relationships
6Measurement items are sometimes called manifest variables (MV) to differentiate themfrom a construct or latent variable (LV). In the plspm output, MV and LV are often usedas labels.
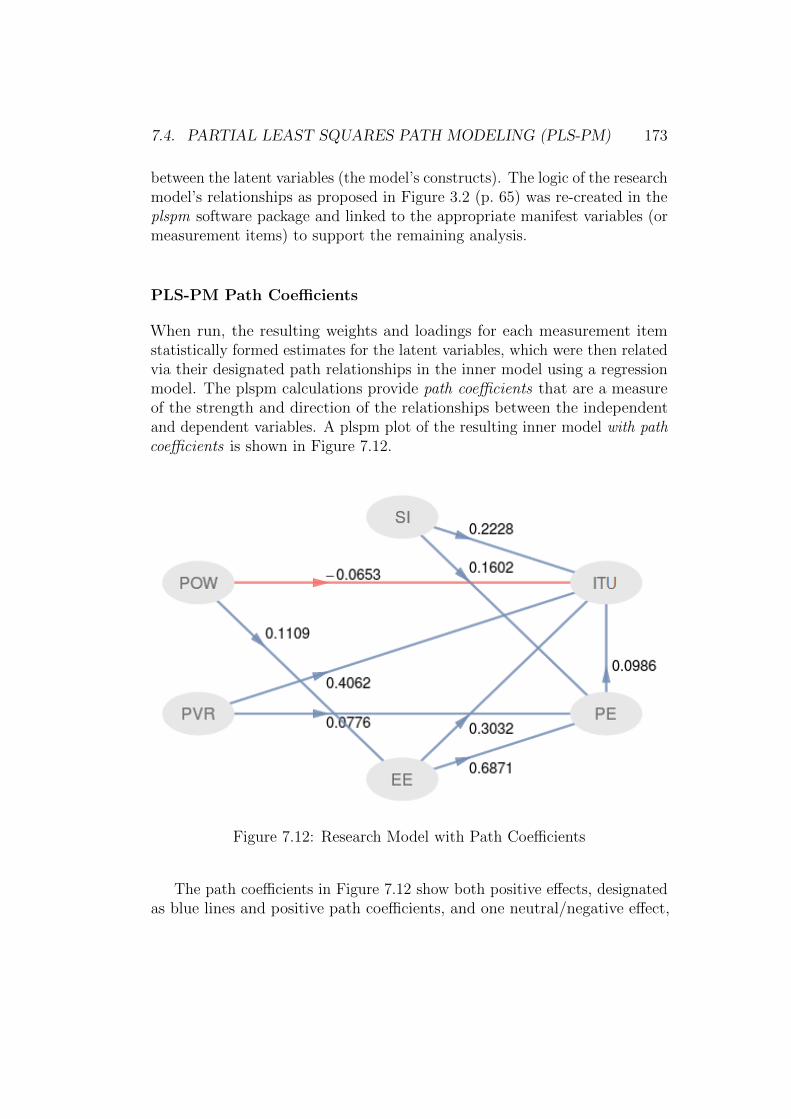
7.4. PARTIAL LEAST SQUARES PATH MODELING (PLS-PM) 173
between the latent variables (the model’s constructs). The logic of the researchmodel’s relationships as proposed in Figure 3.2 (p. 65) was re-created in theplspm software package and linked to the appropriate manifest variables (ormeasurement items) to support the remaining analysis.
PLS-PM Path Coefficients
When run, the resulting weights and loadings for each measurement itemstatistically formed estimates for the latent variables, which were then relatedvia their designated path relationships in the inner model using a regressionmodel. The plspm calculations provide path coefficients that are a measureof the strength and direction of the relationships between the independentand dependent variables. A plspm plot of the resulting inner model with pathcoefficients is shown in Figure 7.12.
Figure 7.12: Research Model with Path Coefficients
The path coefficients in Figure 7.12 show both positive effects, designatedas blue lines and positive path coefficients, and one neutral/negative effect,
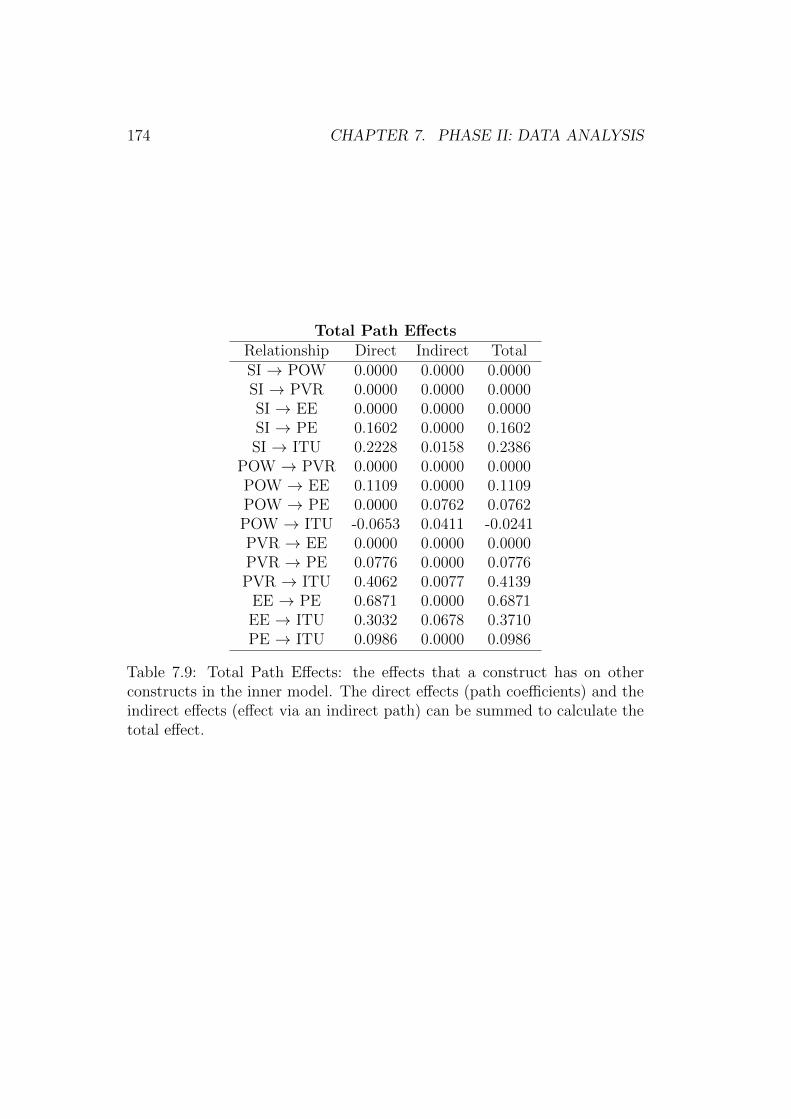
174 CHAPTER 7. PHASE II: DATA ANALYSIS
Total Path EffectsRelationship Direct Indirect TotalSI → POW 0.0000 0.0000 0.0000SI → PVR 0.0000 0.0000 0.0000SI → EE 0.0000 0.0000 0.0000SI → PE 0.1602 0.0000 0.1602SI → ITU 0.2228 0.0158 0.2386
POW → PVR 0.0000 0.0000 0.0000POW → EE 0.1109 0.0000 0.1109POW → PE 0.0000 0.0762 0.0762POW → ITU -0.0653 0.0411 -0.0241PVR → EE 0.0000 0.0000 0.0000PVR → PE 0.0776 0.0000 0.0776PVR → ITU 0.4062 0.0077 0.4139EE → PE 0.6871 0.0000 0.6871EE → ITU 0.3032 0.0678 0.3710PE → ITU 0.0986 0.0000 0.0986
Table 7.9: Total Path Effects: the effects that a construct has on otherconstructs in the inner model. The direct effects (path coefficients) and theindirect effects (effect via an indirect path) can be summed to calculate thetotal effect.
7.4. PARTIAL LEAST SQUARES PATH MODELING (PLS-PM) 175
designated as a red line and in this case a negative path coefficient.7 In thiscase, the perceived value of records is seen to explain 40.6% of the observedvariance associated with its relationship with the intention to use.
An independent analysis of the total path effects of the research model isshown in Table 7.9 (p. 174). These path effects are also shown graphically inFigure 8.1 on p. 203.
7.4.5 PLS-PM Model Significance Tests
Since the inner model as illustrated in Figure 7.12 can be interpreted as aregression model, standard path significance tests can be used to determinethe confidence intervals (or significance levels) for each of the path coefficients.These are presented in Table 7.10.
Table 7.10 consists of four columns that provide measures of the significanceof the path coefficients. The columns are:
Estimate: the PLS-PM estimate of the path coefficient. For example, theestimate of PV R → ITU shows PVR explains 40.62% of the observedvariance of ITU.
Std. Error (Standard Error): the statistical standard deviation of thepath coefficient estimate mean.
t value: a single-tailed t-test showing the standardized t score.
Probability p (> |t|): the probability calculated from the t value at the 95%significance level. This probability is interpreted using the standardasterisk system with the key located at the bottom of the Table.
Table 7.10 also illustrates that the apparent negative path coefficientassociated with POW → ITU (as indicated by the red arrow in Figure 7.12)is also not statistically significant. In fact, both effects of power were foundto be insignificant, including: POW → ITU and POW → EE.
Somewhat of a surprise was the finding that performance expectancy ’seffect (PE → ITU) was not significant, as performance expectancy ’s impact
7Note that the path coefficients (which represent both the strength and direction of therelationship) require interpretation. For example, the statement “the more power I losedue to electronic recordkeeping within my organization, the more I will use the system”does not make sense. Rather, the low impact value of POW → ITU should be interpretedas “The impact of power on intention to use is negligible.”
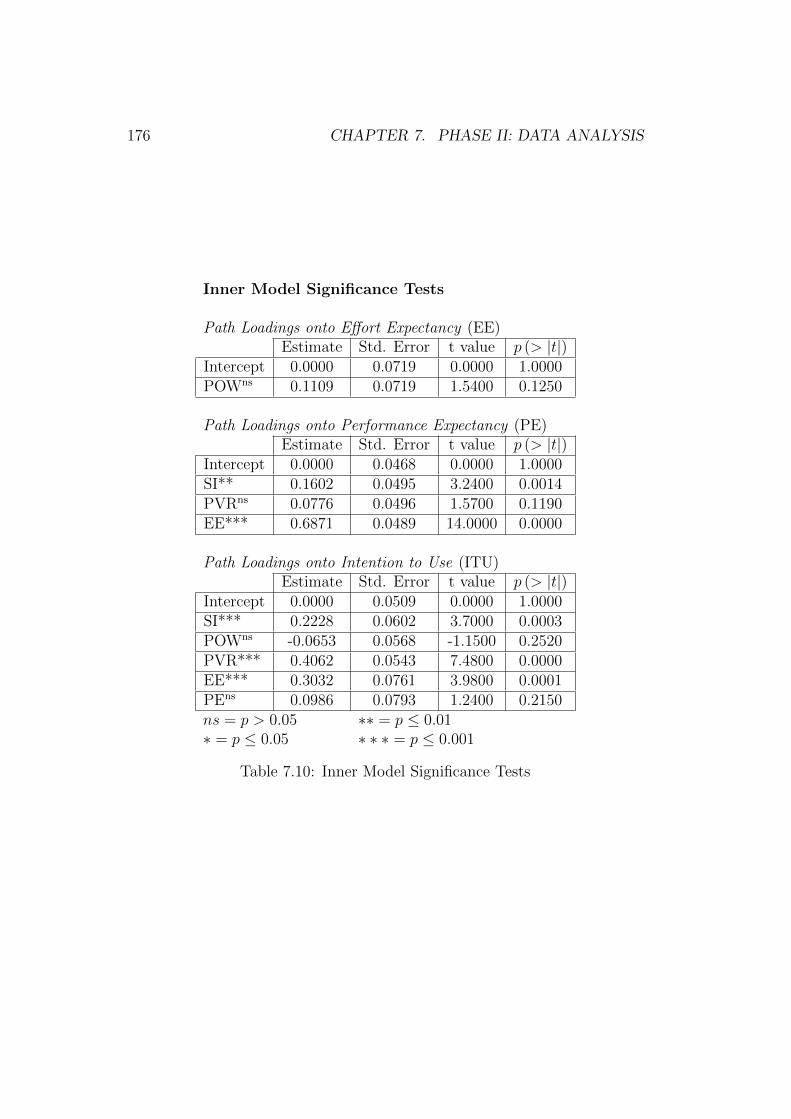
176 CHAPTER 7. PHASE II: DATA ANALYSIS
Inner Model Significance Tests
Path Loadings onto Effort Expectancy (EE)Estimate Std. Error t value p (> |t|)
Intercept 0.0000 0.0719 0.0000 1.0000POWns 0.1109 0.0719 1.5400 0.1250
Path Loadings onto Performance Expectancy (PE)Estimate Std. Error t value p (> |t|)
Intercept 0.0000 0.0468 0.0000 1.0000SI** 0.1602 0.0495 3.2400 0.0014PVRns 0.0776 0.0496 1.5700 0.1190EE*** 0.6871 0.0489 14.0000 0.0000
Path Loadings onto Intention to Use (ITU)Estimate Std. Error t value p (> |t|)
Intercept 0.0000 0.0509 0.0000 1.0000SI*** 0.2228 0.0602 3.7000 0.0003POWns -0.0653 0.0568 -1.1500 0.2520PVR*** 0.4062 0.0543 7.4800 0.0000EE*** 0.3032 0.0761 3.9800 0.0001PEns 0.0986 0.0793 1.2400 0.2150ns = p > 0.05 ∗∗ = p ≤ 0.01∗ = p ≤ 0.05 ∗ ∗ ∗ = p ≤ 0.001
Table 7.10: Inner Model Significance Tests
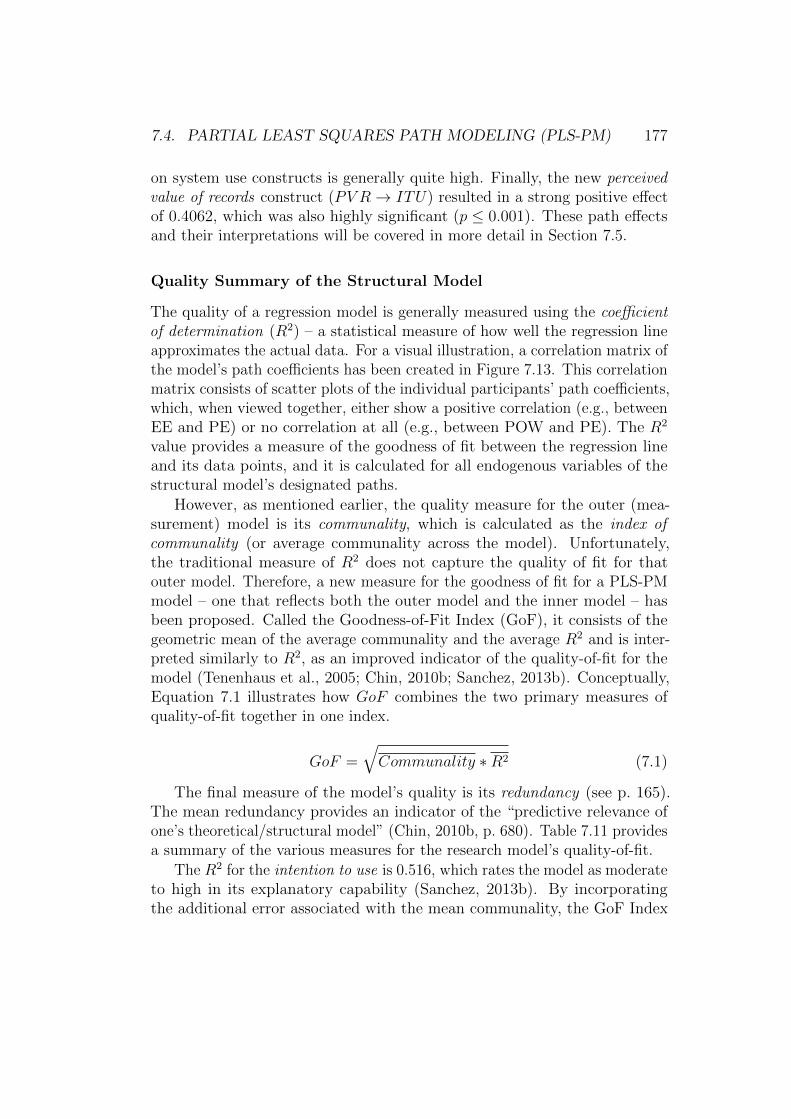
7.4. PARTIAL LEAST SQUARES PATH MODELING (PLS-PM) 177
on system use constructs is generally quite high. Finally, the new perceivedvalue of records construct (PV R → ITU) resulted in a strong positive effectof 0.4062, which was also highly significant (p ≤ 0.001). These path effectsand their interpretations will be covered in more detail in Section 7.5.
Quality Summary of the Structural Model
The quality of a regression model is generally measured using the coefficientof determination (R2) – a statistical measure of how well the regression lineapproximates the actual data. For a visual illustration, a correlation matrix ofthe model’s path coefficients has been created in Figure 7.13. This correlationmatrix consists of scatter plots of the individual participants’ path coefficients,which, when viewed together, either show a positive correlation (e.g., betweenEE and PE) or no correlation at all (e.g., between POW and PE). The R2
value provides a measure of the goodness of fit between the regression lineand its data points, and it is calculated for all endogenous variables of thestructural model’s designated paths.
However, as mentioned earlier, the quality measure for the outer (mea-surement) model is its communality, which is calculated as the index ofcommunality (or average communality across the model). Unfortunately,the traditional measure of R2 does not capture the quality of fit for thatouter model. Therefore, a new measure for the goodness of fit for a PLS-PMmodel – one that reflects both the outer model and the inner model – hasbeen proposed. Called the Goodness-of-Fit Index (GoF), it consists of thegeometric mean of the average communality and the average R2 and is inter-preted similarly to R2, as an improved indicator of the quality-of-fit for themodel (Tenenhaus et al., 2005; Chin, 2010b; Sanchez, 2013b). Conceptually,Equation 7.1 illustrates how GoF combines the two primary measures ofquality-of-fit together in one index.
GoF =
√Communality ∗R2 (7.1)
The final measure of the model’s quality is its redundancy (see p. 165).The mean redundancy provides an indicator of the “predictive relevance ofone’s theoretical/structural model” (Chin, 2010b, p. 680). Table 7.11 providesa summary of the various measures for the research model’s quality-of-fit.
The R2 for the intention to use is 0.516, which rates the model as moderateto high in its explanatory capability (Sanchez, 2013b). By incorporatingthe additional error associated with the mean communality, the GoF Index
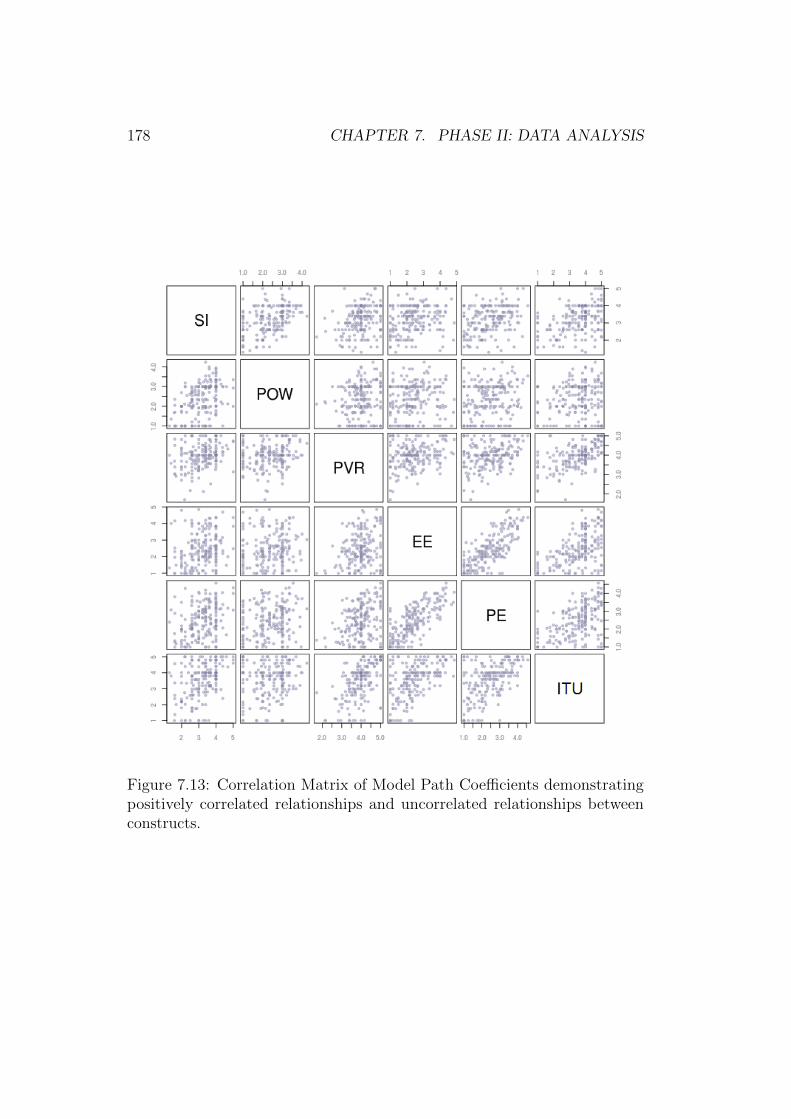
178 CHAPTER 7. PHASE II: DATA ANALYSIS
Figure 7.13: Correlation Matrix of Model Path Coefficients demonstratingpositively correlated relationships and uncorrelated relationships betweenconstructs.
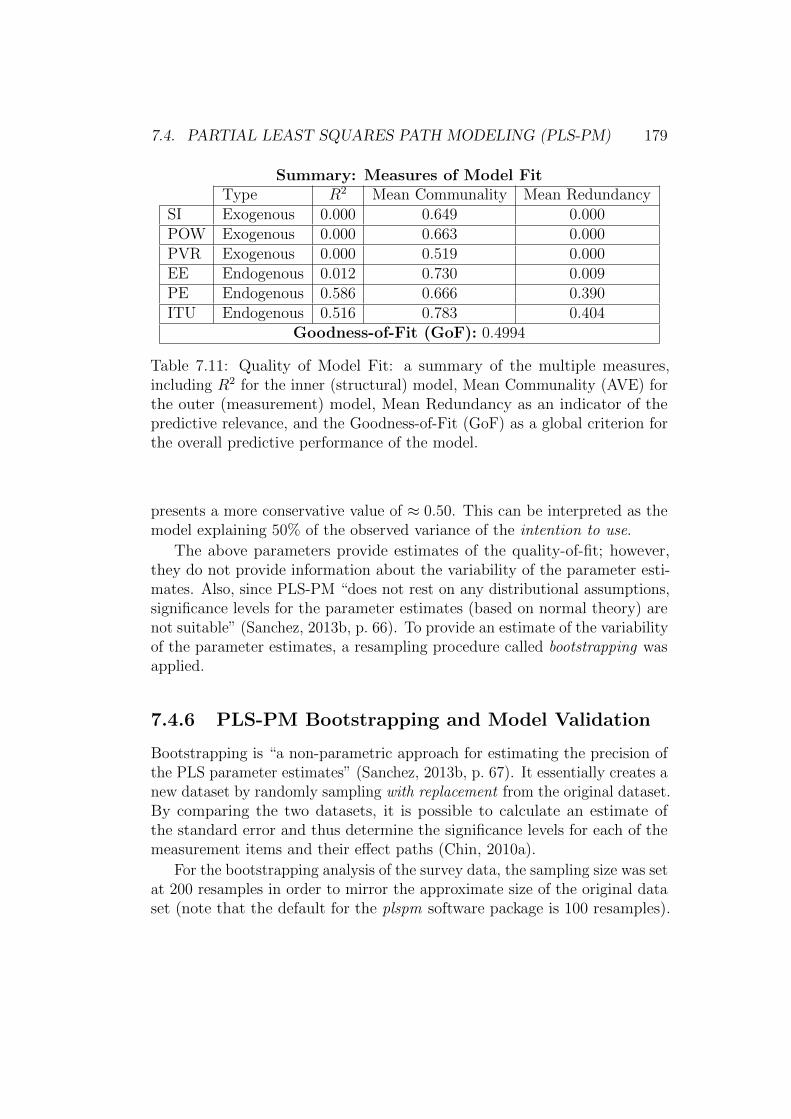
7.4. PARTIAL LEAST SQUARES PATH MODELING (PLS-PM) 179
Summary: Measures of Model FitType R2 Mean Communality Mean Redundancy
SI Exogenous 0.000 0.649 0.000POW Exogenous 0.000 0.663 0.000PVR Exogenous 0.000 0.519 0.000EE Endogenous 0.012 0.730 0.009PE Endogenous 0.586 0.666 0.390ITU Endogenous 0.516 0.783 0.404
Goodness-of-Fit (GoF): 0.4994
Table 7.11: Quality of Model Fit: a summary of the multiple measures,including R2 for the inner (structural) model, Mean Communality (AVE) forthe outer (measurement) model, Mean Redundancy as an indicator of thepredictive relevance, and the Goodness-of-Fit (GoF) as a global criterion forthe overall predictive performance of the model.
presents a more conservative value of ≈ 0.50. This can be interpreted as themodel explaining 50% of the observed variance of the intention to use.
The above parameters provide estimates of the quality-of-fit; however,they do not provide information about the variability of the parameter esti-mates. Also, since PLS-PM “does not rest on any distributional assumptions,significance levels for the parameter estimates (based on normal theory) arenot suitable” (Sanchez, 2013b, p. 66). To provide an estimate of the variabilityof the parameter estimates, a resampling procedure called bootstrapping wasapplied.
7.4.6 PLS-PM Bootstrapping and Model Validation
Bootstrapping is “a non-parametric approach for estimating the precision ofthe PLS parameter estimates” (Sanchez, 2013b, p. 67). It essentially creates anew dataset by randomly sampling with replacement from the original dataset.By comparing the two datasets, it is possible to calculate an estimate ofthe standard error and thus determine the significance levels for each of themeasurement items and their effect paths (Chin, 2010a).
For the bootstrapping analysis of the survey data, the sampling size was setat 200 resamples in order to mirror the approximate size of the original dataset (note that the default for the plspm software package is 100 resamples).
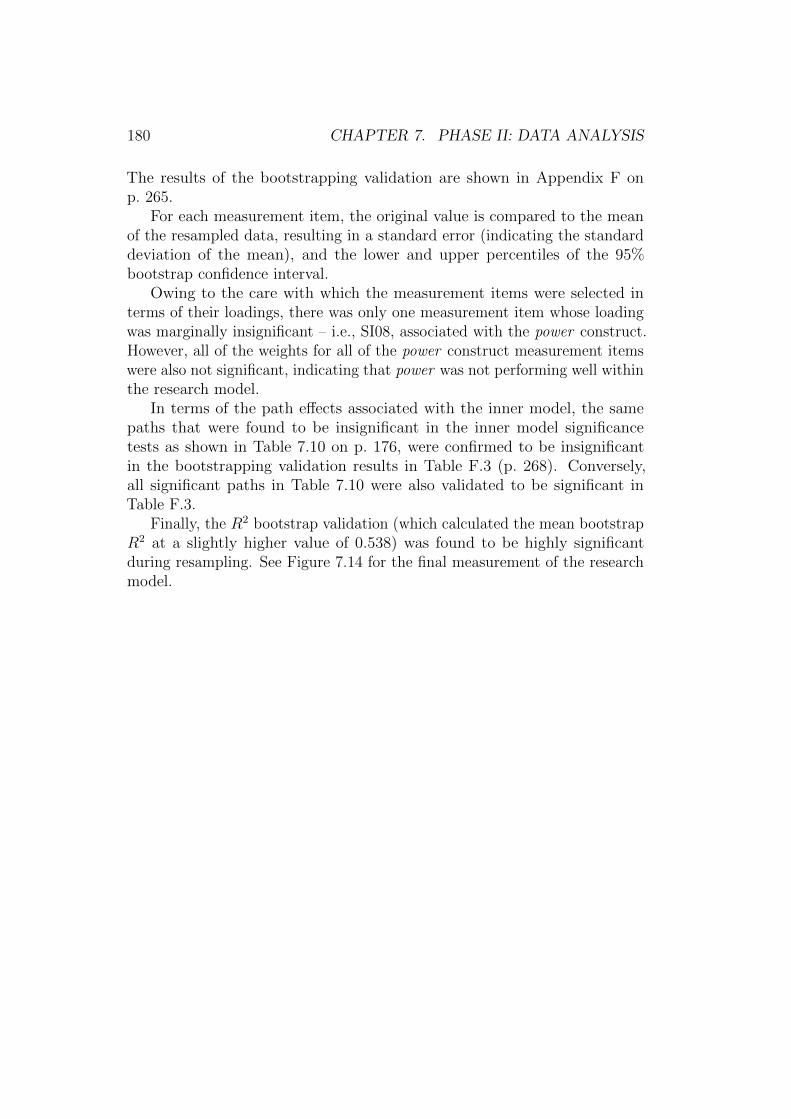
180 CHAPTER 7. PHASE II: DATA ANALYSIS
The results of the bootstrapping validation are shown in Appendix F onp. 265.
For each measurement item, the original value is compared to the meanof the resampled data, resulting in a standard error (indicating the standarddeviation of the mean), and the lower and upper percentiles of the 95%bootstrap confidence interval.
Owing to the care with which the measurement items were selected interms of their loadings, there was only one measurement item whose loadingwas marginally insignificant – i.e., SI08, associated with the power construct.However, all of the weights for all of the power construct measurement itemswere also not significant, indicating that power was not performing well withinthe research model.
In terms of the path effects associated with the inner model, the samepaths that were found to be insignificant in the inner model significancetests as shown in Table 7.10 on p. 176, were confirmed to be insignificantin the bootstrapping validation results in Table F.3 (p. 268). Conversely,all significant paths in Table 7.10 were also validated to be significant inTable F.3.
Finally, the R2 bootstrap validation (which calculated the mean bootstrapR2 at a slightly higher value of 0.538) was found to be highly significantduring resampling. See Figure 7.14 for the final measurement of the researchmodel.
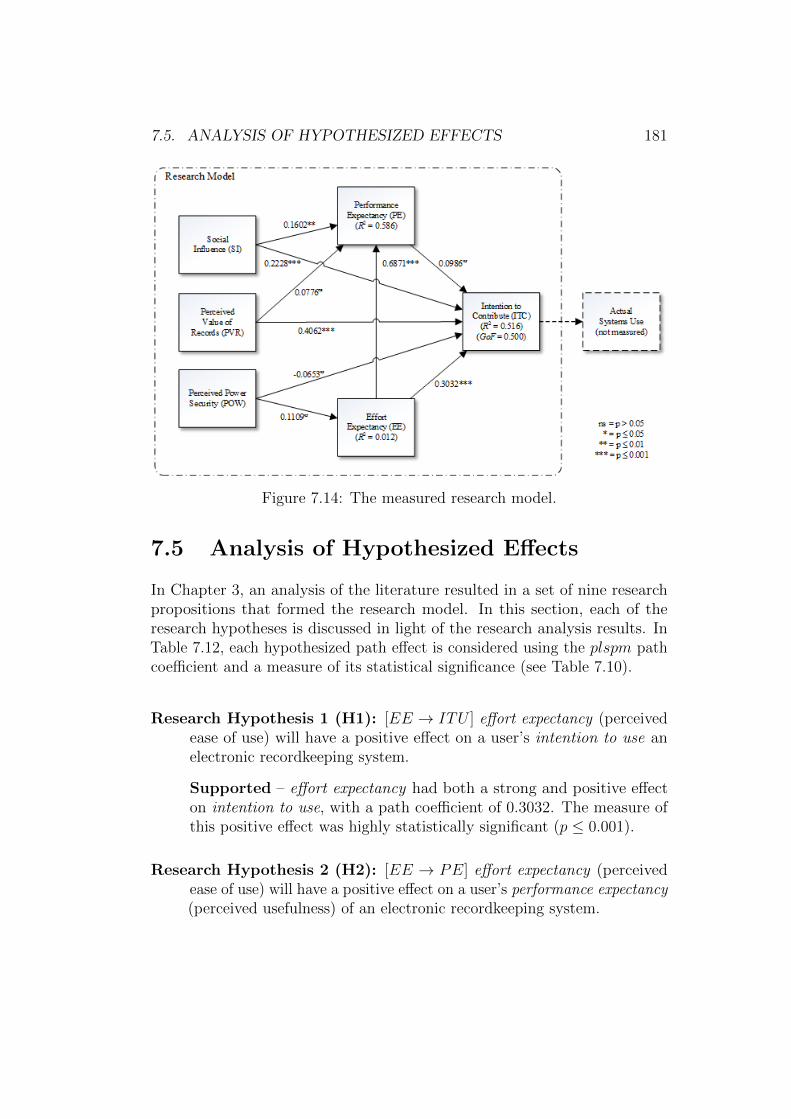
7.5. ANALYSIS OF HYPOTHESIZED EFFECTS 181
Figure 7.14: The measured research model.
7.5 Analysis of Hypothesized Effects
In Chapter 3, an analysis of the literature resulted in a set of nine researchpropositions that formed the research model. In this section, each of theresearch hypotheses is discussed in light of the research analysis results. InTable 7.12, each hypothesized path effect is considered using the plspm pathcoefficient and a measure of its statistical significance (see Table 7.10).
Research Hypothesis 1 (H1): [EE → ITU ] effort expectancy (perceivedease of use) will have a positive effect on a user’s intention to use anelectronic recordkeeping system.
Supported – effort expectancy had both a strong and positive effecton intention to use, with a path coefficient of 0.3032. The measure ofthis positive effect was highly statistically significant (p ≤ 0.001).
Research Hypothesis 2 (H2): [EE → PE] effort expectancy (perceivedease of use) will have a positive effect on a user’s performance expectancy(perceived usefulness) of an electronic recordkeeping system.
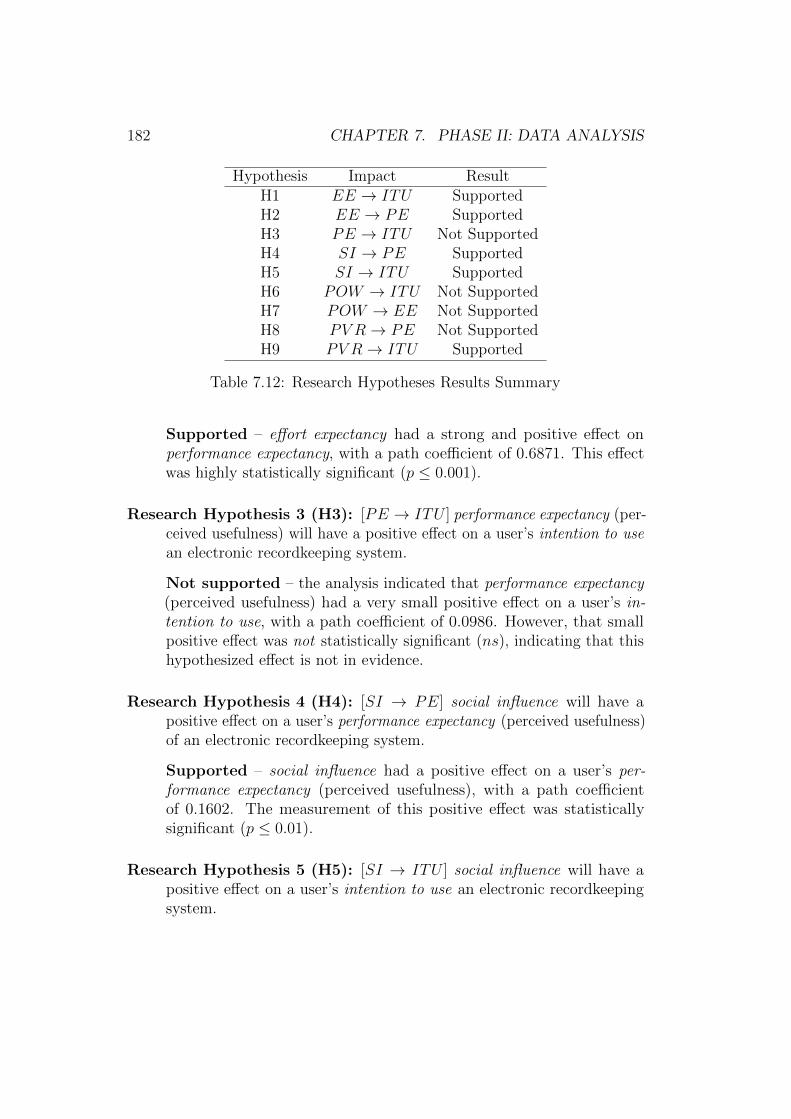
182 CHAPTER 7. PHASE II: DATA ANALYSIS
Hypothesis Impact ResultH1 EE → ITU SupportedH2 EE → PE SupportedH3 PE → ITU Not SupportedH4 SI → PE SupportedH5 SI → ITU SupportedH6 POW → ITU Not SupportedH7 POW → EE Not SupportedH8 PV R → PE Not SupportedH9 PV R → ITU Supported
Table 7.12: Research Hypotheses Results Summary
Supported – effort expectancy had a strong and positive effect onperformance expectancy, with a path coefficient of 0.6871. This effectwas highly statistically significant (p ≤ 0.001).
Research Hypothesis 3 (H3): [PE → ITU ] performance expectancy (per-ceived usefulness) will have a positive effect on a user’s intention to usean electronic recordkeeping system.
Not supported – the analysis indicated that performance expectancy(perceived usefulness) had a very small positive effect on a user’s in-tention to use, with a path coefficient of 0.0986. However, that smallpositive effect was not statistically significant (ns), indicating that thishypothesized effect is not in evidence.
Research Hypothesis 4 (H4): [SI → PE] social influence will have apositive effect on a user’s performance expectancy (perceived usefulness)of an electronic recordkeeping system.
Supported – social influence had a positive effect on a user’s per-formance expectancy (perceived usefulness), with a path coefficientof 0.1602. The measurement of this positive effect was statisticallysignificant (p ≤ 0.01).
Research Hypothesis 5 (H5): [SI → ITU ] social influence will have apositive effect on a user’s intention to use an electronic recordkeepingsystem.
7.5. ANALYSIS OF HYPOTHESIZED EFFECTS 183
Supported – social influence had a strong positive effect on a user’sintention to use, with a path coefficient of 0.2228. The measurement ofthis positive effect was highly statistically significant (p ≤ 0.001).
Research Hypothesis 6 (H6): [POW → ITU ] perceived power securitywill have a positive effect on a user’s intention to use an electronicrecordkeeping system.
Not supported – The analysis found that perceived power securitydid not have a positive effect on a user’s intention to use. Instead, itfound a small neutral to negative effect, with a path coefficient of -0.0653. Furthermore, the measurement of this effect was not statisticallysignificant (ns), indicating that this hypothesized effect was not inevidence.
Research Hypothesis 7 (H7): [POW → EE] perceived power securitywill have a positive effect on a user’s effort expectancy (perceived easeof use) of an electronic recordkeeping system.
Not supported – the analysis found evidence that perceived powersecurity had a positive effect on a user’s effort expectancy (perceivedease of use), with a path coefficient of 0.1109. But the variance of themeasurements indicate that this positive effect was not statisticallysignificant (ns). The combination of H6 and H7 draws into questionthe actual effect of power as a factor in the research model.
Research Hypothesis 8 (H8): [PV R → PE] perceived value of recordswill have a positive effect on a user’s performance expectancy (perceivedusefulness) of an electronic recordkeeping system.
Not supported – the analysis found that perceived value of recordsexhibited a very small positive effect on a user’s performance expectancy(perceived usefulness), with a path coefficient of 0.0776. However, thevariance of the measurements indicate that this measured positive effectwas not statistically significant (ns).
Research Hypothesis 9 (H9): [PV R → ITU ] perceived value of recordswill have a positive effect on a user’s intention to use an electronicrecordkeeping system.
Supported – perceived value of records had a very strong positive effecton a user’s intention to use, with a large and positive path coefficientof 0.4062. The effect was highly statistically significant (p ≤ 0.001).
184 CHAPTER 7. PHASE II: DATA ANALYSIS
As mentioned at the beginning of this section, the hypothesized effectsbetween the constructs contributed to forming the paths of the researchmodel. The results of the survey were then used to confirm those proposedeffects. In general, the proposed effects were confirmed, with a few notedexceptions. The implications of these results are considered more fully inChapter 8: Discussion.
In the next section, an analysis of the additional comments is discussed.This analysis provided a broader context and further support for the mainconstructs included in the research model.
7.6 Additional Comments by Respondents
In addition to providing empirical data to measure the research model, thesurvey also included one final (optional) question: Please share any other com-ments you may have concerning your organization’s electronic recordkeepingsystem.
The response rate for this question was high. In total, 53.4% of the 193active participants provided 103 comments. Many of the comments consistedof full essays, with one reaching 366 words in length. The resulting transcriptprovided observations, complaints, and suggestions.
Given the volume of the comments, an NVivo-based thematic analysistechnique (introduced in Section 5.2.3, p. 84) was applied to the survey’sadditional comments transcript. Table 7.13 outlines the emergent themes andtheir relative frequencies as they were recorded by the participants.8
8Note that more than one thematic reference may be associated with a single respondent.In general, there is a 1:1 ratio of thematic reference to respondent; however, in the case oflonger essay-like responses, there may be 2–3 references per respondent. In no situationwere there > 3 references per respondent for a single theme.
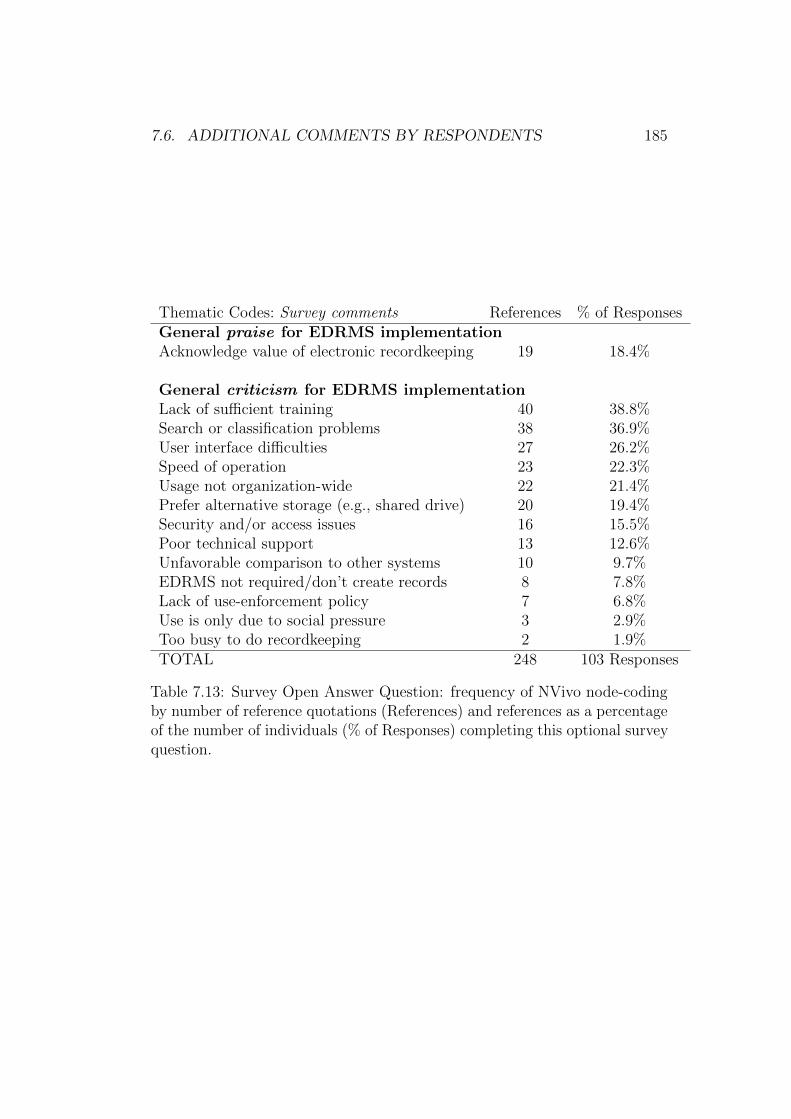
7.6. ADDITIONAL COMMENTS BY RESPONDENTS 185
Thematic Codes: Survey comments References % of ResponsesGeneral praise for EDRMS implementationAcknowledge value of electronic recordkeeping 19 18.4%
General criticism for EDRMS implementationLack of sufficient training 40 38.8%Search or classification problems 38 36.9%User interface difficulties 27 26.2%Speed of operation 23 22.3%Usage not organization-wide 22 21.4%Prefer alternative storage (e.g., shared drive) 20 19.4%Security and/or access issues 16 15.5%Poor technical support 13 12.6%Unfavorable comparison to other systems 10 9.7%EDRMS not required/don’t create records 8 7.8%Lack of use-enforcement policy 7 6.8%Use is only due to social pressure 3 2.9%Too busy to do recordkeeping 2 1.9%TOTAL 248 103 Responses
Table 7.13: Survey Open Answer Question: frequency of NVivo node-codingby number of reference quotations (References) and references as a percentageof the number of individuals (% of Responses) completing this optional surveyquestion.
186 CHAPTER 7. PHASE II: DATA ANALYSIS
Nineteen respondents (18.4%) included some positive comments concerningtheir EDRMS; however, those comments were often in the form of: ”Electronicrecordkeeping is great; but . . . ”9 For example:
Electronic recordkeeping is necessary and can be a blessing, if thesystem is user-friendly and all staff have access to it. [Participantthen proceeds to list aspects that are not user-friendly.]
Good to have documents all in one place, but takes a long timeto save them.
I like the system and find it fairly easy to use. However, I knowthat some of my colleagues don’t use it as they don’t know how,or when they do, they have problems.
One of the most insightful comments reflected aspects of the perceivedvalue of records construct as well as characteristics of trustworthy records.The following comment reflected the need for trustworthy organizationalmemory and highlighted the challenges of educating/motivating end usersto input records in a manner that will enhance the value of this repository,rather than detract from its usefulness.
EDRMS is a tool well worthy of investment. The problem we haveis around the quality control of documents (particularly versionsand updates), naming conventions and the basic foundations of anyprocess or system that make it easy to find the right informationat the right time. There needs to be a tremendous amount ofthought and education into how we want to make it successfulfor all to use without doubt that the information found is eitherinaccurate or out of date.
In addition, a large percentage of responses (38.8%) highlighted a lackof sufficient training as a primary driver of usage problems. This is in spiteof compulsory business unit training upon introduction, weekly EDRMStraining sessions available for new users or those who require additional help,nominated local super-users, and online manuals illustrating the step-by-stepbasics. Nonetheless, three comments provided some insight into the need forbuy-in and the importance of personal ownership/responsibility in learningto use the system:
9There were no comments that consisted solely of praise for their EDRMS. All commentsincluded some caveats or criticisms.
7.6. ADDITIONAL COMMENTS BY RESPONDENTS 187
[N]ow that I have taken ownership of using [the system] as partof my everyday use, I find it a great tool.
I do not use it as I also do not see the point in it. As far as Iam aware, it records documents and work, and the departmentalready has a storage system for storing work and documents [i.e.,a shared network-drive] so I use that instead [of the EDRMS]. Ijust don’t see its point.
I strongly support the idea of an EDRMS, but sadly the organi-zation has not really bought into [the system] and it is still onlyused in a few areas [. . . ]. This, combined with a lack of seniorchampions, has done little to promote the use of [the system].
The next most frequent criticisms focused on the difficulty of search and/orclassification problems (36.9%) and user-interface difficulties (26.2%). Thesewere generally linked by the respondents to insufficient training and/or thepoor quality of the recordkeeping metadata that is required to provide auseful foundation of content for Search function. For example, the name“draft.doc” would not be a suitably descriptive title for a record (nonetheless,it is very common), and while it might be expected that perhaps its locationin context may help shed some light on the purpose of that draft document,another participant lamented that “many users have a single personal folder,crammed full of different records, and completely defeating the purpose ofthe system.”
Finally, many participants (21.4% of comment responses) pointed out thatalthough the EDRMS has been designated as the official records repository,it has not been made available to the entire organization.
It’s only been partially rolled out across the organization. It wasrolled out to our team over two years ago, and we have no optionbut to use it. However, none of the other teams we work with useit, which makes version control a nightmare when you’re trying towork on a document with people from other teams. In this typeof situation, trying to keep one master record in [the system] isan exercise in futility and eats up enormous amounts of time.
In general, the comments by the survey respondents provided additionalsupport for the proposed research model. The subsequent thematic analysisfurther highlighted aspects of technology acceptance, the importance of
188 CHAPTER 7. PHASE II: DATA ANALYSIS
organizational context, and differences in knowledge interpretation/perceivedvalue of records. Furthermore, no additional factors were suggested that werenot already covered by the existing research model. The complex combinationof lack of buy-in and the poor understanding of the purpose of records, lowquality recordkeeping metadata input by end users, and mixed social influencemessages resulted in low-use of the technology. One interview participantconcisely summarized the current situation:
As an information analyst, having good recordkeeping is a key tomy performance. However, the use of [the system] in my area isappalling. I’ve done what what I could to improve things – I’vetrained, I’ve shamed, I’ve improved the structure, I’ve cleaned uprecords. But there’s a disconnect. People have to use [the system],but nobody uses [the system]. There’s just an unwillingness bymost people to use it, and there’s no lever to make people use it.
In summary, the optional comments by the participants at the end of thesurvey provided additional support for the current research model. Moreimportantly, they provided a glimpse of the organizational context in whichthe electronic recordkeeping system is expected to be used. Furthermore,given the types of complaints, concerns, and grumbles, the comments alsosupport the findings of the model in that perceived value of records (andprimarily the regard for organizational memory) is a key driver for use.
7.7 Chapter Summary
In this chapter, the steps associated with the analysis of the survey data werediscussed in detail. The response rate for the survey was quite high, with 76%of survey invitations resulting in a usable record – a total of 193 participantrecords – which was well in excess of the 60–120 samples estimated to berequired for the analysis to be statistically valid. Demographic measures ofthe sample population were also described.
To further refine the measurement item pools, each construct pool was an-alyzed separately to determine its ability to reflect its parent construct. UsingPrincipal Component Analysis (PCA) and a common graphical visualizationcalled the Circle of Correlations, measurement items that were found to clus-ter were considered to be more uniform (unidimensional) in their capabilityto reflect their parent construct and were thus retained for use in the finalmodel. Outliers (those items that did not cluster well) were considered in
7.7. CHAPTER SUMMARY 189
light of their performance in the card sorting activity and via the possibilityof comprehension and interpretations differences between participants. Manyof those measurement items were then excluded from the final model.
Partial Least Squares Path Modeling (PLS-PM) was then introducedas the preferred analysis technique for the survey dataset, with a shortdiscussion of its relative merits. The PLS-PM analysis started with the outer(measurement) model, building on and validating the factor analysis resultsfrom the previous section. Once the outer model was deemed ready, it wasstatistically checked to make sure that its measures of unidimensionality werewithin optimal tolerances. This proved to be the case.
The focus then moved to the inner (structural) model, where the theo-retical research model finally emerged for measurement. The PLS-PM pathcoefficients were calculated, showing significant promise for the new constructperceived value of records (which is discussed in more detail in Chapter 8).
Having effectively measured the structural model, the statistical signifi-cance of those measurements was determined by turning to standard regressionmodel significance tests for the inner model, followed by the non-parametricbootstrapping validation technique to evaluate the overall precision of the PLSparameter estimates. The bootstrap findings validated the initial estimatescompletely.
Armed with a validated model, the research hypotheses were reviewed withan aim to determine how well the research model supported the hypothesizedpath relationships.
Finally, the survey’s additional comments were analyzed, providing furthercontextual background for the interpretation of the research model while alsoadding support to the selected constructs and measurement items making upthis model.
In the next chapter, Chapter 8: Discussion, the implications of the findingsare considered and discussed.

190 CHAPTER 7. PHASE II: DATA ANALYSIS
Chapter 8
Discussion
Contents8.1 Chapter Overview . . . . . . . . . . . . . . . . . . 191
8.2 The Measures of the Constructs . . . . . . . . . 192
8.3 The Research Model . . . . . . . . . . . . . . . . 202
8.4 Chapter Summary . . . . . . . . . . . . . . . . . . 212
8.1 Chapter Overview
This chapter discusses the research findings reported in Chapter 7. First,the outer measurement model is examined, focusing on the measures of theconstructs and the implications of the PCA-based clustering. The discussionthen moves on to the interplay of the constructs by exploring the inner model(the research model) and considering the implications of how the empiricalresults affect the interpretation of the hypothesized effect paths.
191
192 CHAPTER 8. DISCUSSION
8.2 The Measures of the Constructs
The constructs were originally chosen to represent three conceptual aspectsof the research model: technology acceptance, organizational context, andknowledge interpretation. The empirical results from Chapter 7 are discussedbelow, particularly as they apply to the measurement validity for each of theconstructs.
8.2.1 Technology Acceptance
The two technology acceptance constructs used in this research were effortexpectancy (perceived ease of use) and performance expectancy (perceivedusefulness).
The original Technology Acceptance Model (Figure 2.9, p. 36) hypothesizedthat the cognitive responses (consisting of the above constructs) requiredmoderation via attitude before having an effect on the behavioral response.However, subsequent models (e.g., TAM 2: Figure 2.10, p. 39 and TAM3:Figure 2.12, p. 43) dispensed with the attitude construct and instead linkedthe models’ effect paths directly to the behavioral intention construct (whichis, in this study, intention to use (ITU)).1
The measurement item pools were intentionally enlarged to include themeasurement items used in the broader technology acceptance literatureclaimed by the UTAUT constructs as well as additional measurement itemsthat emerged from the Stage 1 interviews. As discussed in Chapter 7, the circleof correlations greatly assisted in refining the final set of measurement items torepresent a unidimensional (in the principal component space) measurement ofeach construct. In general, the technology acceptance literature’s measurementitems were found to be satisfactory and were mainly retained as measures fortheir respective constructs in the final research model analysis.
Effort expectancy (perceived ease of use)
On the surface, effort expectancy (EE) is one of the least complex of theconstructs in the research model. It simply seeks to determine if a technologyis easy to use. However, that apparent lack of complexity is itself a challenge
1The survey instrument captured measures for attitude in the unlikely event that theresearch model failed to provide significant path effects directly to intention to use. However,as confirmed in the later technology acceptance models (e.g., TAM2 and TAM3), attitudewas not required to moderate those path effects in the model.
8.2. THE MEASURES OF THE CONSTRUCTS 193
for measurement. Many of the measurement items found in the literaturecould almost be considered tautological in their approach, with one commonmeasurement item for perceived ease of use being: “I would find the systemeasy to use” (Davis, 1989; Davis et al., 1989).
To address this situation, the pool of EE measurement items was enlargedto include other contextual dimensions in which the effort of use could bemeasured in an electronic recordkeeping context. Examples include the easeof learning, the ease of filing, the ease of search, and the ease of recordsadministration (see Table 5.5, p. 91, for the EE thematic codes that emergedfrom Stage 1).
Each of the emergent thematic codes contained within them a rich story ofadditional contextual complexity. For example, several of the Stage 1 interviewparticipants expressed criticism of the content and quality of training availablein their organizations. Some individuals subsequently explored the systeminterface and claimed to have successfully taught themselves, while otherswaited to receive training and then complained that it was inadequate. Thosethat didn’t put effort into learning the system also reported that othermeasures of effort such as ease of filing or ease of search were also “difficult.”
Nonetheless, the interviews indicated that additional training may not bethe sole answer, as there were similar complaints from individuals who hadattended training, but may not have actively engaged during that training.This issue is only raised here to indicate that all constructs and/or modelsare designed to simplify reality to a manageable and measurable level (Bailer-Jones, 2003). In the case of this research, the measurement items were selectedto best approximate the defined construct and were deemed appropriate whenthey were both logical and clustered in the circle of correlations.
The principal component clustering analysis resulted in a final (smaller)pool of measurement items (Table 7.1, p. 147). It should be noted that theexclusion of any measurement items from the final model was due primarilyto their inability to cluster precisely enough with other such items. Hav-ing leftover measurement items does not suggest that there are additionalconstructs that need to be added to the research model to somehow explainthese items. Nothing from the card sorting activities (particularly the opencard-sorting) or the circle of correlations analyses suggested that there wereany additional technology acceptance constructs lurking in the data. Instead,the excluded measurement items were simply not clear enough for the surveyparticipants to uniformly interpret them in a similar manner. Retaining themwould only have added error to the final analysis.
194 CHAPTER 8. DISCUSSION
Performance expectancy (perceived usefulness)
Performance expectancy (or perceived usefulness) has typically been thestrongest of the technology acceptance constructs (Venkatesh & Davis, 2000;Venkatesh & Bala, 2008). In their research, Venkatesh and Davis (2000)found that “the performance expectancy construct within each individualmodel. . . is the strongest predictor of intention and remains significant at allpoints of measurement” (Venkatesh & Davis, 2000, p. 447).
Once again, the pool of measurement items for performance expectancywas intentionally enlarged to include additional dimensions in which theperformance/usefulness could be measured in an electronic recordkeepingcontext, while remaining true to the construct definition. See Table 5.2 (p. 87),for the thematic analysis from which these additional PE measurement itemswere sourced.
The circle of correlations was then applied to the survey data in an effort toidentify the measurement items that clustered well. Performance expectancy ’sfinal measurement items are listed in Table 7.2 (p. 150). In general, thepublished construct measurement items were retained. The majority of theadditional measurement items added on account of the thematic analysis wereeventually excluded due to a lack of precision in reflecting only this construct.Those that were retained were unidimensional and tightly clustered in thecircle of correlations.
However, usefulness is a very broad concept and the adopted constructdefinition is quite narrow. Does the technology acceptance literature’s def-inition of performance expectancy/perceived usefulness continue to work indifferent cultural and/or use contexts? In the UTAUT model, performanceexpectancy was defined as
the degree to which an individual believes that using the systemwill help him or her to attain gains in job performance (Venkateshet al., 2003, p. 447).
This definition focuses on personal gain and aligns usefulness with acompetitive performance edge. Many of the published measurement itemsdirectly linked usefulness to increased job performance or even increased pay.This performance lens may work well in a competitive American corporateenvironment, where each employee will quickly adopt the technology that willprovide them with a personal competitive advantage. This definition appearsto celebrate individualism and, to some extent, self-promotion.
8.2. THE MEASURES OF THE CONSTRUCTS 195
In contrast, the culture of the New Zealand public sector and its publicsector ethos (see p. 89) creates a very different environment in which usefulnesscan be defined. Many of the interviewees claimed no expectation of receivingpersonal recognition for their work, much less personal gain. Their altruisticpublic servant philosophy appears to seek motivation from sources other thangains in performance.
A dictionary entry for useful (Dictionary.com, 2014) is:
1. being of use or service; serving some purpose; advantageous,helpful, or of good effect: a useful member of society.
2. of practical use, as for doing work; producing material results;supplying common needs: the useful arts; useful work.
Perhaps there are other dimensions of perceived usefulness (and thereforeother measurement items) that could replace Venkatesh and Davis’ perfor-mance lens set. These new definitions and measures could reflect cultures thatview usefulness through different lenses, and could thus provide a contextualdefinition of what usefulness means. Such a definition could be tailored to aculture and its use context.
Usefulness could be – helping out co-workers – streamlining policy devel-opment – improving the organization’s ability to meet legislative requirements– making information discoverable to improve decision-making. All of theseare other-centric and yet can reflect the goals of many public servants andstill be covered by the definition of being useful.
In the case of electronic recordkeeping systems, the traditional performanceexpectancy measures that focused on attaining gains in job performance did notreflect the usefulness of a system that is mainly used for storage, reference, andcompliance purposes. Far from being the “strongest predictor of intention”,in the context of EDRMS, the effect of PE was found to be statisticallyinsignificant.
8.2.2 Organizational Context
The bulk of recordkeeping theory finds its origins in Giddens’ StructurationTheory (Section 2.3.1) and builds upon this theory to explain how records andtheir requirements reflect and adapt to the changing needs of society. Becausethe adoption of electronic recordkeeping systems also occurs within the contextof a society, the organizational context constructs were selected to reflectthe three proposed structurational interactions that form a society, namely
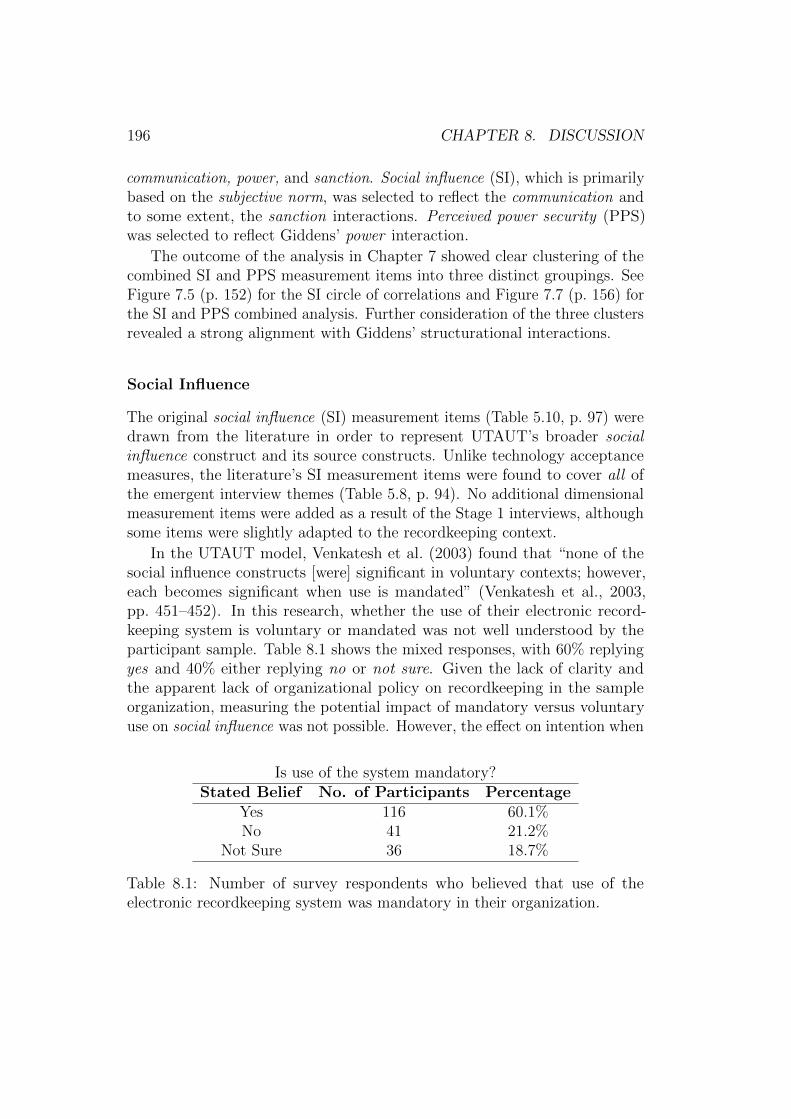
196 CHAPTER 8. DISCUSSION
communication, power, and sanction. Social influence (SI), which is primarilybased on the subjective norm, was selected to reflect the communication andto some extent, the sanction interactions. Perceived power security (PPS)was selected to reflect Giddens’ power interaction.
The outcome of the analysis in Chapter 7 showed clear clustering of thecombined SI and PPS measurement items into three distinct groupings. SeeFigure 7.5 (p. 152) for the SI circle of correlations and Figure 7.7 (p. 156) forthe SI and PPS combined analysis. Further consideration of the three clustersrevealed a strong alignment with Giddens’ structurational interactions.
Social Influence
The original social influence (SI) measurement items (Table 5.10, p. 97) weredrawn from the literature in order to represent UTAUT’s broader socialinfluence construct and its source constructs. Unlike technology acceptancemeasures, the literature’s SI measurement items were found to cover all ofthe emergent interview themes (Table 5.8, p. 94). No additional dimensionalmeasurement items were added as a result of the Stage 1 interviews, althoughsome items were slightly adapted to the recordkeeping context.
In the UTAUT model, Venkatesh et al. (2003) found that “none of thesocial influence constructs [were] significant in voluntary contexts; however,each becomes significant when use is mandated” (Venkatesh et al., 2003,pp. 451–452). In this research, whether the use of their electronic record-keeping system is voluntary or mandated was not well understood by theparticipant sample. Table 8.1 shows the mixed responses, with 60% replyingyes and 40% either replying no or not sure. Given the lack of clarity andthe apparent lack of organizational policy on recordkeeping in the sampleorganization, measuring the potential impact of mandatory versus voluntaryuse on social influence was not possible. However, the effect on intention when
Is use of the system mandatory?Stated Belief No. of Participants Percentage
Yes 116 60.1%No 41 21.2%
Not Sure 36 18.7%
Table 8.1: Number of survey respondents who believed that use of theelectronic recordkeeping system was mandatory in their organization.
8.2. THE MEASURES OF THE CONSTRUCTS 197
recordkeeping is clearly understood to be mandated would be a candidate forfuture research.
While discussing their statistically insignificant findings, Venkatesh et al.(2003, p. 452) acknowledged that “social influence in technology decisions iscomplex” and then suggested that social influence has an impact via threemechanisms. The proposed mechanisms (compliance, internalization, andidentification) are based on Warshaw’s (1980) work, and predate Giddens’(1984) Structuration Theory.
In this research, there were three distinct groups or clusters of SI itemsdetected. These groups were interpreted as aligning with the three structura-tional interactions (communication, power, and sanction). To further test thestructurational interpretation (versus Warshaw’s interpretation), the perceivedpower security items were added to the circle of correlations analysis. Thisadditional analysis revealed a clustering with the Giddens’ power interactiongroup. In other words, the power measurement items shared a similar princi-pal component orientation to the social influence power grouping (Figure 7.7,p. 156).
There are two implications of this interpretation. First, the social influenceconstruct is multidimensional.2 In other words, if each of the three SI clustershad been treated as separate constructs in the measurement model, they wouldhave resulted in different path coefficients and significance levels. Second,this multidimensionality can be interpreted well via the structures of societyput forward by Giddens’ Structuration Theory, where social influence couldbe redefined in terms of the structurational interactions:
social influence = {communication, power, sanction}
In an effort to retain a unidimensional construct, only the measurementitems that aligned with Giddens’ communication interaction were retainedto represent the SI construct. This pool of measurement items includes themeasurement items used in UTAUT to represent SI and were a similar poolto those used to represent the original subjective norm.
The final measures of SI (now defined in structurational terms as SIcomms
to reflect their measure of the communication interaction) were purged of any
2Although the UTAUT model claims that social influence unites multiple overlappingconstructs, combining the measurement item pools resulted in three PCA clusters. Thisanalysis suggests that social influence, as claimed in UTAUT, is not unidimensional.However, the final UTAUT measurement items selected to represent SI correspond onlywith the communication interaction cluster. Thus, SIcomms has been confirmed by thisanalysis to be unidimensional.
198 CHAPTER 8. DISCUSSION
measures relating to sanction. As sanction was not included in the originalmodel (and no effort was made to refine a pool of sanction measurementitems prior to the survey), the inclusion of Giddens’ sanction interaction wasnecessarily out of scope. However, research into defining and measuring theeffect of sanction behaviors on technology acceptance would be a candidatefor future exploration.
Perceived Power Security
Perceived power security (PPS) was selected from the literature as the con-struct that was most likely to represent Giddens’ final social interaction: power.As discussed in Section 5.2.4 (p. 98), many of the interview participants didnot believe that power (either represented as allocative or authoritative) waslikely to affect the intention to use an electronic recordkeeping system. Inaddition, the measurement items taken from the literature had proved tobe problematic. The original wording of the measurement items had beenconfusing to participants in the proofreading stage, and subsequent effortsto create meaningful measurement items had shown mixed results in thecard-sorting stage (Figure 5.5, p. 126).
Nonetheless, these measurement items were partially successful. Whenthey were added to the social influence items in the circle of correlationsanalysis (see discussion above and Figure 7.7, p. 156), their shared orientationwith other power-associated measurement items provided confirmation of theirPCA power alignment and appeared to hold much promise for the researchmodel.
However, the observed PCA clustering was primarily due to the scale ofdifferences between the power grouping and the other SI groups. A morerestricted circle of correlations analysis focused solely on the combined poolof power measurement items (Figure 7.8, p. 157) revealed that the PPSconstructs were not clustering as well as the SIpower constructs. In orderto retain a unidimensional measure of power, all of the PPS measurementitems were eventually dropped from the model. To represent the change inmeasurement items, the PPS label was changed to POW (to represent thepower interaction, but separate it from the PPS measurement items). Thenew POW construct retained the same construct definition as PPS, but usesdifferent measurement items. Nonetheless, the logic and predicted path effectsof POW on the inner research model remained unchanged.
The role of structuration theory in defining organizational context hasthe potential to provide a powerful lens for empirically viewing the cultural

8.2. THE MEASURES OF THE CONSTRUCTS 199
aspects of technology acceptance. Additional investigation into developingand defining measurement constructs based on the structurational interactionswould be another candidate for future research. However, incorporation ofGiddens’ structures and modalities (see Figure 2.2, p. 20) into this futureresearch could provide even more insight into organizational context. In astudy of information culture, Zheng (2005) argued that the development ofa mature information culture is the key to increased use of technology andused Giddens’ modalities as a basis for proposing a mechanism for actioningthat change. Additional research into information culture and its relationshipwith recordkeeping is ongoing (Oliver & Foscarini, 2014).
8.2.3 Knowledge Interpretation
The final conceptual aspect of the research model focused on the knowledgeinterpretation aspect of electronic records and process of recordkeeping. As asuitable validated construct was not found in the literature, a new constructwas developed out of Schultze and Stabell (2004)’s knowledge managementdiscourses (Section 2.5.2, p. 35). These were used to provide a foundationfor discussing the value of records and the perceived value of the informationthey contain.
Schultze and Stabell (2004)’s discourses suggested how knowledge (or inthis case, recorded evidence) can be viewed from the perspective of a socialorder continuum (consensus to dissensus) and an epistemological continuum(dualism to duality). The epistemological continuum aligned with Giddens’approach to Structuration Theory (and his attempt to reconcile the two), andthereby linked the discourses to the common structuration-based theoreticalplatform used throughout this research. The discourses lens also providedthe basis for the Stage 1 interview questions and the development of the newconstruct, the perceived value of records.
Perceived Value of Records
The subsequent analysis of the interviews provided a set of thematic codes(Figure 5.14, p. 101). When they were considered in light of Upward’sRecords Continuum Model (Section 2.3.2, p. 21), the codes appeared to groupwell according to Upward’s continuum of evidentiality. The continuum ofevidentiality consists of four dimensions: trace, evidence, corporate/individualmemory, and collective memory. Semantically, the emergent measurement
200 CHAPTER 8. DISCUSSION
items appeared be grouped into three groups (where memory uses werecombined into a single category):
• The ownership of accountability corresponds to the trace dimension ofthe records continuum. It represents the role that records play to traceaccountability and the responsibility that users take in maintaining thisaspect of recordkeeping.
• The need for trustworthy evidence reflects the evidence dimension ofthe records continuum. It also represents the importance of evidence,such as the importance of keeping a record of one’s personal work asevidence of job quality.
• The value of organizational memory corresponds to the two memorydimensions of the records continuum. It represents the organization’sability to “collect, store and use knowledge” (Olivera, 2000, p. 811)and reflects the value of the content of those records and whether therecorded knowledge would have value in the future.
However, when these measurement items were analyzed using PCA, thecircle of correlations only provided two clusters rather than three (Figure7.9 and Table 7.4). Group 1 aligned well with the organizational memorydimension and reflected the need and importance of records as a vehicle forcapturing information for use in the future. Unfortunately, Group 2 was notas logically consistent, and did not reflect the record continuum’s trace orevidence dimensions well, nor did it semantically reflect the accountabilityor trustworthy evidence groupings as suggested above. Consequently, themeasurement items in Group 2 were dropped from the measurement model.
Nonetheless, the two groups that emerged from the PCA circle of cor-relations did suggest that the perceived value of records may consist of twodimensions. As mentioned above, Group 1 appeared to reflect the value ac-corded to the content of the records. As noted earlier, a document is definedas “recorded information. . . which can be treated as a unit” (ISO 15489.1,2002, p. 3). Documents can be (and are) a vehicle for storing organizationalmemory, and many public sector organizations rely on shared-drives or otherad hoc locations to store these documents for use in the future. They valuethe content of those documents.
Group 2 provided a hint of what the second dimension may be. Documentscannot be records unless they are under systematic control. As defined inISO 15489: Records Management, a record is “information created, received,
8.2. THE MEASURES OF THE CONSTRUCTS 201
and maintained as evidence and information by an organization or person, inpursuance of legal obligations or in the transaction of business” (ISO 15489.1,2002, p. 3), while records management is defined as the “field of managementresponsible for the efficient and systematic control of the creation, receipt,maintenance, use and disposition of records, including processes for capturingand maintaining evidence of and information about business activities andtransactions in the form of records”(ISO 15489.1, 2002, p. 3).
Therefore, it is likely that the second dimension reflects the evidentialimportance and contextual tracking of a document; in other words, the valueof its context. Information about its context is held in its recordkeepingmetadata and in the systems that support electronic recordkeeping. In termsof the trace and evidence dimensions of the records continuum, it is therecordkeeping metadata that can answer such questions as: what is the statusof this draft policy? (with the metadata allowing users to trace their record inthe system), or: did this policy decision predate that action? (which relies onthe metadata to provide trustworthy evidence of timing). Even questions suchas, Who last edited this record? is information stored in the metadata ratherthan in the document itself. This research, then, suggests two dimensionsthat are expected to contribute to the perceived value of records :
perceived value of records = value{content, context}
The perceived value of records was initially defined on p. 63 as a user’sbelief that a document has value beyond the current application and is worthyof storing for the future. This definition can now be updated as follows:
Perceived Value of Records: the perceived importance that auser places on a document’s information content combined withthe importance accorded to its evidential context through time.(Lewellen, Hooper, & Oliver, 2014a)
Identifying the content and context dimensions of a record provides anapproach to explaining the current state of electronic recordkeeping systemsadoption within public sector organizations, as well as explaining the resistanceto moving away from legacy shared-drive systems in favor of an EDRMS.
Table 8.2 illustrates a hypothetical matrix consisting of the perceived valueof content (organizational memory) [low–high] and the perceived value ofinformation about a document’s context (recordkeeping metadata) [low–high].
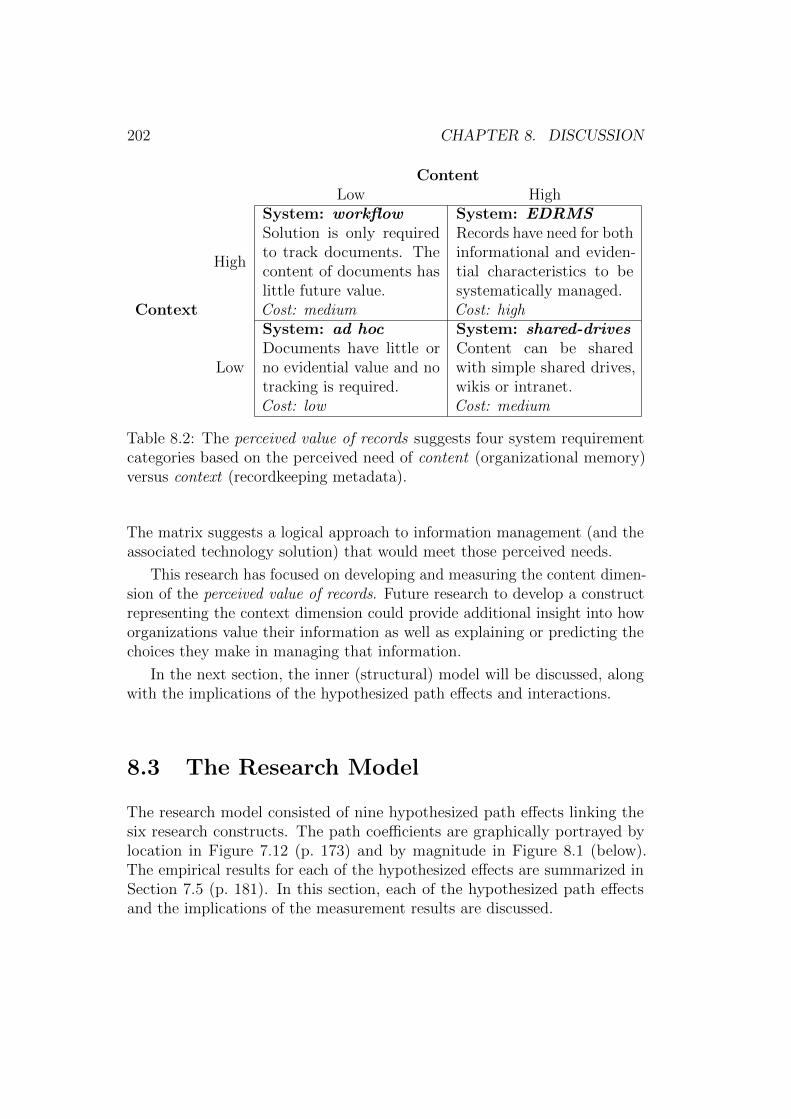
202 CHAPTER 8. DISCUSSION
ContentLow High
Context
High
System: workflowSolution is only requiredto track documents. Thecontent of documents haslittle future value.Cost: medium
System: EDRMSRecords have need for bothinformational and eviden-tial characteristics to besystematically managed.Cost: high
Low
System: ad hocDocuments have little orno evidential value and notracking is required.Cost: low
System: shared-drivesContent can be sharedwith simple shared drives,wikis or intranet.Cost: medium
Table 8.2: The perceived value of records suggests four system requirementcategories based on the perceived need of content (organizational memory)versus context (recordkeeping metadata).
The matrix suggests a logical approach to information management (and theassociated technology solution) that would meet those perceived needs.
This research has focused on developing and measuring the content dimen-sion of the perceived value of records. Future research to develop a constructrepresenting the context dimension could provide additional insight into howorganizations value their information as well as explaining or predicting thechoices they make in managing that information.
In the next section, the inner (structural) model will be discussed, alongwith the implications of the hypothesized path effects and interactions.
8.3 The Research Model
The research model consisted of nine hypothesized path effects linking thesix research constructs. The path coefficients are graphically portrayed bylocation in Figure 7.12 (p. 173) and by magnitude in Figure 8.1 (below).The empirical results for each of the hypothesized effects are summarized inSection 7.5 (p. 181). In this section, each of the hypothesized path effectsand the implications of the measurement results are discussed.
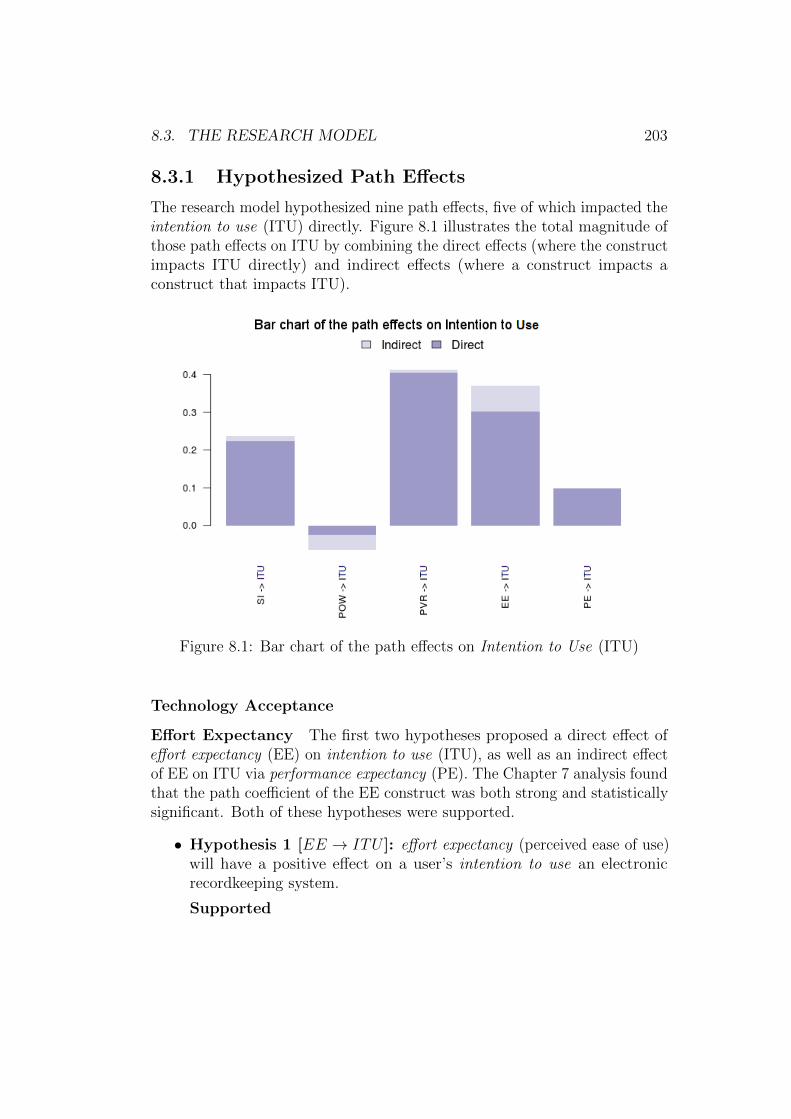
8.3. THE RESEARCH MODEL 203
8.3.1 Hypothesized Path Effects
The research model hypothesized nine path effects, five of which impacted theintention to use (ITU) directly. Figure 8.1 illustrates the total magnitude ofthose path effects on ITU by combining the direct effects (where the constructimpacts ITU directly) and indirect effects (where a construct impacts aconstruct that impacts ITU).
Figure 8.1: Bar chart of the path effects on Intention to Use (ITU)
Technology Acceptance
Effort Expectancy The first two hypotheses proposed a direct effect ofeffort expectancy (EE) on intention to use (ITU), as well as an indirect effectof EE on ITU via performance expectancy (PE). The Chapter 7 analysis foundthat the path coefficient of the EE construct was both strong and statisticallysignificant. Both of these hypotheses were supported.
• Hypothesis 1 [EE → ITU ]: effort expectancy (perceived ease of use)will have a positive effect on a user’s intention to use an electronicrecordkeeping system.
Supported
204 CHAPTER 8. DISCUSSION
• Hypothesis 2 [EE → PE]: effort expectancy (perceived ease of use)will have a positive effect on a user’s performance expectancy (perceivedusefulness) of an electronic recordkeeping system.
Supported
As seen in Figure 8.1, the EE → ITU total effect was measured at0.37 (consisting of a direct effect of 0.30 and an indirect effect via PE of anadditional 0.07). Effort expectancy represents the second most importantconstruct in the research model.
Given the importance of EE in explaining ITU in the research model, itwas interesting to see that the raw effort expectancy results (see Figure E.1,p. 258) showed that the majority of the survey participants did not find thetechnology easy to use. This apparent contradiction was later resolved whenthe relationship between the variables was viewed as a correlation matrix (seethe interaction between EE and ITU in Figure 7.13, p. 178). This matrixindicated that some people who find it difficult to use will use it anyway,whereas all people who find it easy to use will use it. There is a definitepositive correlation between the EE and ITU constructs. In other words, theintention to use the system increases as people find it easier to use.
The strength of effort expectancy ’s effect in the model would suggest thatany strategy that reduces the effort required of end users would dramaticallyincrease use. For example, many of the recorded complaints were targeted atthe effort associated with the need to enter metadata (as compared to usinga shared-drive with no metadata requirements). The overhead associatedwith manually entering metadata is a known barrier to the use of electronicrecordkeeping systems (Joseph et al., 2012; Kettunen & Henttonen, 2010;Polfreman & Rajbhandari, 2008). Therefore, any efforts that can reduce orautomate the metadata entry requirements are likely to have the greatestimpact.
Another approach would be to increase the awareness and importanceof context information to end users as discussed on p. 202. If end usersunderstand and value the contextual information that electronic recordkeepingcan provide, then the need for that contextual information may exceed theannoyance barrier associated with having to enter that metadata. However,a two-pronged approach, consisting of increasing the demand for and use ofcontextual information while simultaneously reducing/automating much ofthe metadata entry requirements, would be expected to provide the greatestimpact on the intention to use associated with effort expectancy.
8.3. THE RESEARCH MODEL 205
Performance Expectancy As discussed earlier, performance expectancy(or perceived usefulness) has generally been the strongest of the two maintechnology acceptance constructs. In their work on TAM2, Venkatesh andDavis (2000) emphasized this construct’s importance: “Across the manyempirical tests of TAM, perceived usefulness has consistently been a strongdeterminant of usage intentions, with standardized regression coefficientstypically around 0.6” (Venkatesh & Davis, 2000, p. 187). In the later UTAUTmodel, the “performance expectancy construct within each individual model[was found to be] the strongest predictor of intention and remains significantat all points of measurement” (Venkatesh & Davis, 2000, p. 447).
Nonetheless, in the context of electronic recordkeeping systems, thisresearch appears to reflect an exception to the rule. The impact of PE → ITUwas measured as having a small positive path coefficient of 0.098 (as comparedwith Venkatesh & Davis’ impressive 0.6). In addition, it was statisticallyinsignificant, meaning that it may have no effect at all insofar as technologysolutions used in a recordkeeping context are concerned.
• Hypothesis 3 [PE → ITU ]: performance expectancy (perceived use-fulness) will have a positive effect on a user’s intention to use anelectronic recordkeeping system.
Not Supported
As mentioned in Section 8.2.1, p. 194, the effect strength of PE wasexpected to be less for recordkeeping technologies in the context of thepublic service. This has to do with the performance lens associated withthe published PE measurement items. The performance emphasis misses thecontextual mark in two ways.
First, electronic recordkeeping systems are not focused directly on jobperformance improvements. It is true that the competent use of an EDRMScan have a positive effect on job outcomes by providing consistent and reliablestorage and improved search and access to historical records that may improvedecision-making; however, the primary use of electronic recordkeeping is forstorage, reference and compliance purposes. The link back to improved jobperformance is weak.
Second, as mentioned on p. 89 and in Section 8.2.1, p. 195, many of theinterviewees displayed a public sector ethos and claimed no expectation ofreceiving personal recognition for their work, much less personal gain. Theiraltruistic public servant philosophy appears to seek motivation from sourcesother than from personal gain.
206 CHAPTER 8. DISCUSSION
In cases where a new technology may give a user a competitive edge,this construct is expected to continue to weigh heavily (and significantly)in their decision to use that technology. However, in the case of electronicrecordkeeping, the use of the system is less likely to be perceived to helpthe individual user in this manner. In contrast, use will help others andprovide accountability and transparency at the organizational level, but theperformance edge provided by good recordkeeping to the individual user isexpected to be perceived as small.
In this case, the technology acceptance constructs behave in a differentmanner to the cases presented in the literature. Based on the technologyacceptance constructs, users appear to be willing to use this technology onlyif the system is easy to use. Furthermore, they see very little usefulness inthe system in terms of their job performance, and what they do see does notsignificantly affect their intention to use the system.
As proposed in the research model, other factors must be considered toexplain the intention to use an EDRMS.
Organizational Context
The organizational context constructs include social influence and perceivedpower security. Social influence (SI) represents the structurational interactionof communication (SIcomms), whereas perceived power security (POW) rep-resents the structurational interaction of power (and consists of the SIpower
measurement items).
Social Influence As seen in Figure 8.1, the SI → ITU total effect wasmeasured at 0.24 (consisting of a direct effect of 0.22 and an indirect effectvia PE of an additional 0.016). Social influence represents the third mostimportant construct in the research model.
• Research Hypothesis 4 [SI → PE]: social influence will have apositive effect on a user’s performance expectancy (perceived usefulness)of an electronic recordkeeping system.
Supported3
3The effect of SI → PE was statistically significant; however, the effect of PE → ITUwas not. As such, the inclusion of the indirect effect for SI provides an indication of thepath coefficient strength, but not the statistical validity.
8.3. THE RESEARCH MODEL 207
• Research Hypothesis 5 [SI → ITU ]: social influence will have apositive effect on a user’s intention-to-use an electronic recordkeepingsystem.
Supported
As discussed in Section 8.2.2, p. 196, Venkatesh et al. (2003) observed thatSI was only significant in mandatory use situations. In the sample organization,it was not clear among the survey participants whether use of the recordkeepingsystem was mandatory or not. Nonetheless, the effect of SI → ITU wasboth strong and highly significant. Lacking clear organizational recordkeepingguidelines in the sample organization, it would appear that the ‘opinions ofimportant others’ provided the required use guidance in the absence of clearwritten policies. This suggests there may be other aspects of operational policythat are left to grow organically, and that staff may rely on their peers andmanagers to communicate acceptable norms and behaviors. If this is the case,then the relevance of structuration theory in explaining technology acceptanceincreases as the societal norms concerning usage behaviors recursively evolvein the absence of a static policy.
A clear policy mandating the use of an EDRMS (supported by a culturethat respects and adheres to clear policies) would be expected to reducethe importance of social influence in the research model. In other words,users would know what they were expected to do and would rely less on theopinions of others. However, this outcome is the opposite of what was foundby Venkatesh et al. (2003), who said “none of the social influence constructsare significant in voluntary contexts; however, each becomes significant whenuse is mandated” (Venkatesh et al., 2003, pp. 451–452).
This apparent conflict can be explained by analyzing the channel by whichan organization’s policy expectations are transmitted. If a written mandatoryuse policy is communicated to users via managers and peers, then socialinfluence will be seen as being a significant factor in use. However, if thewritten mandatory use policy is known via a non-social channel (e.g., as partof the code of conduct or via one’s job description and performance evaluationcriteria), then a social communication channel as a mode of transmissionwould be expected to be less important. In the case of clear written policiestransmitted via a non-social channel, it is likely that Giddens’ communicationinteraction would decrease in importance in the research model, while Giddens’sanction interaction would increase as managers and peers increasingly applynegative social pressure against non-users.
208 CHAPTER 8. DISCUSSION
Future research is required to determine the relevance of communicationand sanction social interactions within mandatory use situations, takinginto account cultural context and mode of transmission of these policies.It is expected that a campaign to present clear policies and expectationswould effectively reduce the need for social communication interactions, whileincreasing the role of sanction interactions as a means to boost compliance.
Perceived Power Security The remaining organizational context con-struct in the research model is perceived power security (POW). Its hypothe-sized path effects are listed below.
• Research Hypothesis 6 [POW → ITU ]: perceived power securitywill have a positive effect on a user’s intention-to-use an electronicrecordkeeping system.
Not Supported
• Research Hypothesis 7 [POW → EE]: perceived power securitywill have a positive effect on a user’s effort expectancy (perceived easeof use) of an electronic recordkeeping system.
Not Supported
The impact of POW → ITU appeared to be small and negative; however,it was also statistically insignificant. So, the logical interpretation is that ithad no impact at all in the model.
This observation is further supported by comments that emerged in thestage 1 interviews (p. 98). When pressed in the interviews, the participantsacknowledged that someone could conceivably feel a loss of power associatedwith storing records in a common system; however, the majority of participantsremained unconvinced as to the importance of power, power-security, or power-loss in explaining system use.
The measurement model supports this sentiment. Nonetheless, thereremains the potential for records to be transformed into a source of power.As discussed earlier, two kinds of power can be manifested: authoritative –extending over people, and allocative – extending over objects or materials(Orlikowski, 1992, p. 405).
As use of electronic recordkeeping becomes more mature (and the aware-ness of the value of context and access controls increases), it is possible thatindividuals will begin to use access rights or contextual storage as means ofexpressing power over others. Most EDRMS prevent unapproved destruction
8.3. THE RESEARCH MODEL 209
of records; however, access rights are generally assigned to a record type orclassification, and the selection of that classification (along with granularaccess controls) is left to the individual.
Record storage and access thus have the potential to be used maliciously.For example, placing a record in a different context could make that recordappear to be something that it is not, and opening access to that record toobroadly could damage someone’s reputation. Alternatively, reducing access toor hiding records could similarly affect decisions and reflect power agendas.
In addition, should records grow in importance and become a form ofmeasurement (for example, linking pay to records of one’s work), it is possiblethat individuals could enter metadata in such a way that the measures wouldload positively onto themselves or perhaps load negatively onto others. Inthis way, power could become a significant factor in the research model.
However, the evidence suggests that recordkeeping systems have not (yet)been used for these sorts of power struggles. Nonetheless, future researcherscould consider revisiting this construct, especially in organizations that displayaspects of dissensus in their organizational culture.
Knowledge Interpretation
The final conceptual aspect of the research model references how individualsinterpret the value of knowledge. As discussed in Section 8.2.3, the newconstruct perceived value of records (PVR) captures the value associated withorganizational memory (content), but excludes measures of contextual value.
Perceived Value of Records As seen in Figure 8.1 (p. 203), the totaleffect of PV R → ITU was measured with a path coefficient of 0.41 (consistingof a direct effect of 0.406 and a small indirect effect via PE of an additional0.007).4 Perceived value of records represents the most important constructin the research model.
The related research hypotheses are included below.
• Research Hypothesis 8 [PV R → PE]: perceived value of recordswill have a positive effect on a user’s performance expectancy (perceivedusefulness) of an electronic recordkeeping system.
Not Supported
4The effect of PV R → PE was not statistically significant, nor was the effect ofPE → ITU . Thus, the inclusion of the indirect effect for PVR provides an indication ofthe path coefficient strength, but not the statistical validity.
210 CHAPTER 8. DISCUSSION
• Research Hypothesis 9 [PV R → ITU ]: perceived value of recordswill have a positive effect on a user’s intention-to-use an electronicrecordkeeping system.
Supported
Research Hypothesis 8 proposes that individuals with a high perceivedvalue of records will be more likely to believe that an EDRMS is a usefultool that will further increase their job performance. As discussed earlier,performance expectancy was found to have an insignificant role to play inthe context of electronic recordkeeping. The reduced importance of PEwas attributed to the performance lens of the PE construct’s definition ofusefulness.
In other words, the research finding suggests that survey participantssaw little or no impact of using a recordkeeping technology on their jobperformance. With this perception in mind, further attempts to create alogical connection between perceived value of records and job performancewould no longer appear likely or logical. The results are in alignment withthis interpretation. The indirect path coefficient was extremely small (nearzero) and was also statistically insignificant.
However, Research Hypothesis 9, which posited a direct effect of perceivedvalue of records on the intention to use a recordkeeping system, was stronglysupported with a high level of statistical significance. It is perhaps unsurprisingthat individuals who generally value records are likely to use an electronicrecordkeeping system. However, the strength of the direct PV R → ITU effecthas an important implication in identifying the epistemological perspectiveof the survey participants, and may provide some insight into the culturalnorms of the research population.
As noted earlier, Schultze and Stabell (2004)’s four discourses for knowl-edge management research (see Figure 2.16 on p. 52) illustrate different worldviews concerning the value of knowledge in differing social contexts. Theliterature suggests that the main difference in the epistemological perspectivesis the perceived value-duration of a particular knowledge artifact. Thoseadhering to a neo-functionalist or critical knowledge discourse see all recordsas potential long-term assets that are worthy of keeping and managing foruse in the future. In contrast, those adhering to a constructivist or dialogicknowledge discourse perceive the same knowledge artifacts as merely support-ing the current working knowledge and conclude that these same knowledgeartifacts have only short-term value. These latter individuals would see little
8.3. THE RESEARCH MODEL 211
or no reason to invest in the effort to formally classify and manage recordsbeyond their current application.
The strength of the PV R → ITU effect provides strong evidence for theprevalence of dualism as the epistemological world view for the majority ofthe survey participants. These individuals regard documents and recordsas assets that have value beyond today’s working knowledge. Accordingto this view, records have the potential to have value in the future and innew and different contexts. This view is also in alignment with Upward’sRecords Continuum Model (Section 2.3.2, p. 21), which is built on the tacitassumption of dualism and records-as-assets that require management.
The prevelance of dualism is further supported by the Stage 1 interviews,where several participants spoke of taking pride in being part of the organiza-tional record, and one participant went so far as to require that his staff notuse common acronyms so that distant future readers of their reports wouldhave greater clarity as to their contextual meaning.
In addition, the insignificant impact of power in the research modelprovides insight into the social order dimensions of Schultze and Stabell(2004)’s knowledge management discourses. The surveyed organization haddisplayed anecdotal evidence of dissensus, with participants referring totension between business units as well as between senior management andworkers. However, the perceived context of the use of electronic recordkeepingfor the majority of users appears to be at a more local level. The lack ofpower politics combined with a high reliance on social influence for guidanceon social norms and expectations (pertaining to the use of their EDRMS)provides evidence of a consensus-based social order, at least at the local level.
The presence of a consensus social order in a population that has adopteddualism as their epistemological frame of reference neatly places the majorityof the sample into the knowledge discourse of the neo-functionalists. Asdiscussed earlier, the neo-functionalists are the most likely group to adoptelectronic recordkeeping. Their metaphor of knowledge is an asset, and therole of knowledge in the organization is “progressive enlightenment, prediction,reduction of uncertainty, and optimal allocation of resources” (Schultze &Stabell, 2004, p. 556).
The neo-functionalist world view is the foundation on which a positiveinformation culture can be built. Its presence bodes well for the future ofelectronic recordkeeping as a distributed responsibility. Although this researchhas detected the presence of neo-functionalist thinking, it has not quantifiedthe distribution of people among the four discourses. Future research intoidentifying and measuring the distribution of people among the knowledge
212 CHAPTER 8. DISCUSSION
discourses could provide additional insight where electronic recordkeepingsystems adoption has not gone as planned.
8.3.2 The Explanatory Power of the Model
The most important constructs in the research model (in rank order) werethe perceived value of records, effort expectancy, and social influence. Themodel confirms that the acceptance and use of an electronic recordkeepingsystem requires that its users have a high perceived value of records. In thiscase, the users with the most positive attitude toward recordkeeping have anepistemological bias in favor of knowledge as a dualism and generally functionwithin a social order based on consensus. The importance of the social orderis illustrated by the strong effect of social influence in the model.
The research model also provides insight into the reported challenges thathave been experienced concerning the acceptance and uptake of electronicrecordkeeping systems. In the case of EDRMS, the research model revealedthat the performance expectancy/perceived usefulness construct fails to pullits weight in affecting system use. It is likely that change managementstrategies appealing to the usefulness of this class of system will miss themark with users. This leaves effort expectancy as the sole remaining technologyacceptance construct, and due to the nature of recordkeeping metadata, theimplementation of these systems can be quite complex.
Overall, the research model demonstrated moderate to high explanatorycapability, with the combined research constructs explaining more than halfof the observed variance associated with the intention to use the electronicrecordkeeping system (R2 = 0.52, GoF = 0.50).
8.4 Chapter Summary
This chapter discussed the findings of the research and provided an interpreta-tion of their significance. First, the outer (measurement) model was explored.The conceptual research model was used as a framework to introduce andconsider each construct in context. The findings from the various stagesof the research were drawn together to provide insight into each constructand a means to interpret each of its dimensions and its role in the researchmodel. In several cases, the research findings identified additional theoreticaldimensions that may produce new avenues for future research.
8.4. CHAPTER SUMMARY 213
Next, the hypothesized interactions of the constructs were discussed, withan emphasis on the levels of support provided to each of the nine researchhypotheses that formed the inner (research) model. Again, the findings fromthe various stages of the research were drawn together to provide insight andinterpretation for each instance whether a hypothesis was supported or notsupported.
The research model produced moderate to high explanatory capability.However, the pattern of non-support associated with one of the technologyacceptance constructs shed additional light on the importance of organizationalcontext and knowledge interpretation in the acceptance and use of electronicrecordkeeping systems.

214 CHAPTER 8. DISCUSSION
Chapter 9
Conclusions
Contents9.1 Chapter Overview . . . . . . . . . . . . . . . . . . 215
9.2 Overview of the Research . . . . . . . . . . . . . 216
9.3 Contributions of the Research . . . . . . . . . . . 221
9.4 Limitations of the Research . . . . . . . . . . . . 224
9.5 Directions for Future Research . . . . . . . . . . 227
9.6 Chapter Summary . . . . . . . . . . . . . . . . . . 230
9.1 Chapter Overview
In this final chapter, the research is summarized and brought to a close. Firstly,the research process, as it was conducted, is presented. Next, the contributionsof the research are identified and discussed, including the theoretical benefitsto academics and the pragmatic implications for practitioners and managers.The limitations of the research are then examined. These limitations pertainto the conceptual model, the research design, and the research instrument.Finally, directions for future research are outlined.
215
216 CHAPTER 9. CONCLUSIONS
9.2 Overview of the Research
This section will briefly summarize the research, the conceptual model, theresearch design, and the findings.
9.2.1 Research Gap
The discipline of recordkeeping has long been maintained by professionalrecords managers. However, with the introduction of electronic recordkeepingsystems, the responsibility for recordkeeping has moved from the recordsprofessional to the creators of the record – the end users (Joseph et al., 2012).
Many large-scale implementations of organization-wide electronic docu-ment and records management systems (EDRMS) have met with limitedsuccess and acceptance. However, as a class, the EDRMS had not yet beeninvestigated empirically using the validated technology acceptance models.In addition, the EDRMS as a foundational organizational technology plays aunique role in that its primary focus is generally ancillary to the jobs andresponsibilities of its primary users.
Given that these end users are now responsible for the creation of themajority of an organization’s records (and many choose not to participate),the research question that sought to further the understanding in this areawas:
• What factors influence a user’s intention to use an electronic record-keeping system?
9.2.2 Research Objectives and Conceptual Model
Converted into the research objectives, the aim of the research was:
• To identify the factors that influence a user’s intention to use an elec-tronic recordkeeping system.
• To determine the relative importance of the factors that influence auser’s intention to use an electronic recordkeeping system.
The literature review sought to more fully understand the role of recordsand recordkeeping in society. Records and recordkeeping were defined andconsidered in light of the key characteristics of records, namely: authenticity,reliability, integrity, and usability (ISO 15489.1, 2002, p. 7). A short history
9.2. OVERVIEW OF THE RESEARCH 217
of how these key characteristics have been used to create and manage recordshelped to place the EDRMS’ current design and manifestation in context.
One of the primary functions of records is to act as evidence to demonstratethat a business function or transaction has occurred. As such, recordkeepingprimarily relies on social theories such as Giddens’ (1984) StructurationTheory to understand how society conceives of that evidential threshold, andhow that threshold can change over time and space, as explained by Upward’s(1997) Records Continuum model. These theories influenced the developmentof national and international standards which, when combined with work onrecordkeeping metadata models, strongly influenced the development of theEDRMS in its current form.
In developing the conceptual research model, the technology acceptanceliterature was used as the model’s core with system use being the dependentvariable. As the EDRMS could be seen as having multiple potential uses (e.g.,search, retrieval, security, workflow, etc.), the research focused on the pointof contribution. All other uses require that records first be entered into thesystem.
The conceptual model was extended to include the organizational context.Records and the information they contain are necessarily created withinthe context of an organization. The organization is a microcosm of society.The social interactions that form that society, as put forward in Giddens’Structuration Theory, were expected to effect how people viewed the recordsand recordkeeping system within that society.
In addition, the literature also suggested that individuals view informationdifferently, giving rise to the third part of the conceptual research model:knowledge interpretation. The knowledge management literature suggestedseveral approaches. Schultze and Stabell (2004) provided the four discourses ofknowledge management research combining a social order dimension (consen-sus to dissensus) that reflects the hegemonic order within the organizationalcontext with an epistemological dimension that mirrors that used by Struc-turation Theory (dualism versus duality). The resulting matrix suggestedthat only one of the four discourses was conducive to successful informationmanagement and recordkeeping. In other words, how one views recordedinformation could impact one’s willingness to use an EDRMS.
Six constructs were then selected from the literature to represent thethree conceptual areas – performance expectancy, effort expectancy, socialinfluence, perceived power security, and perceived value of records – whichwere all expected to drive the intention to use an EDRMS. The perceived
218 CHAPTER 9. CONCLUSIONS
value of records was developed for this research and is a new construct beingintroduced into the literature.
The conceptual research model is shown in Figure 3.1 on p. 58. Thehypothesized path effects between the selected constructs were developed anddiscussed in Chapter 3 resulting in nine hypotheses.
9.2.3 Research Design
Having identified likely constructs from the literature and having formed aconceptual research model, the next step focused on the research design. Thedesign consists of two main phases.
Phase I consisted of a qualitative methodological phase to develop a poolof potential measurement items relating to the conceptual research model andits constructs. This phase also addressed the first research objective, namely:To identify the factors that influence a user’s intention to use an electronicrecordkeeping system.
Phase II consisted of a quantitative methodological phase to validatethe links between the measurement items and their constructs, and therebytest the research model. This phase addressed the second research objective,namely: To determine the relative importance of the factors that influence auser’s intention to use an electronic recordkeeping system.
The final research design consisted of six stages. Each stage collected dataand resulted in analysis that informed the next stage. Phase I (qualitativemethods) comprised:
• Stage 1: Interviews – The interview stage consisted of a semi-structuredinterview (see Appendix A on p. 231) with 12 participants selected fromthe targeted research population. The interviews sought to gather datathat could be used to validate the existing set of construct measurementitems derived from the literature, explore potential measures for the newconstruct (perceived value of records), and search for additional itemsor factors that may impact a user’s intention to use an EDRMS thatwere not specifically covered by the research model. See Section 5.2.4(p. 86) to trace the development of the measurement items.
• Stage 2: Proofreading – The proofreading stage sought ten volunteersto check the proposed measurement item statements and verify thateach statement was written clearly and unambiguously. Problematicmeasurement items were reworked to incorporate the best of the feedback
9.2. OVERVIEW OF THE RESEARCH 219
and the final wordings were checked for tense and clarity. Only then werethe measurement items tentatively associated with a parent constructfrom the research model. See Table 5.16 (p. 108) for a summary of theresults and Appendix B (p. 235) for the annotated measurement items.
• Stage 3: Card Sorting – The card sorting stage focused on validatingthe proposed relationship between a measurement item and its parentconstruct. Card sorting (Moore & Benbasat, 1991; Hinkle, 2008) wasused to test both the convergent validity and discriminant validity ofthe measurement-item-to-construct relationship in order to inform thedevelopment of the final survey instrument and reduce the risk of poorlyperforming measurement items in the Phase II quantitative analysis.
Twenty-four participants were recruited from the research population toparticipate in the card sorting activity, with twelve focusing on closedcard sorting (Spencer & Warfel, 2004) and the remaining twelve focusingon open card sorting (Faiks & Hyland, 2000).
The participants’ qualitative sorting judgments were quantitativelyanalysed, resulting in a series of agreement frequency matrices – seeTable 5.18 (p. 119) and Table 5.19 (p. 123) – and dendrograms – see Fig-ure 5.2 (p. 118), Figure 5.3 (p. 124), Figure 5.4 (p. 125), and Figure 5.5(p. 126).
The findings linked the measurement items to their parent constructsand supported the development of the survey instrument as part of thenext stage.
Having developed a set of measurement items, the research then focusedon a quantitative methodological approach. Phase II comprised:
• Stage 4: Survey Design – This stage focused on the selection of thesurvey delivery technology, the selection of the analysis approach (whichdictated the form of the data to be collected), the creation of the surveyinstrument, and the development of the associated documentation andcommunication templates. See Appendix C (p. 239) for the final surveyinstrument and Appendix D (p. 249) for the associated documents andcommunication templates.
• Stage 5: Survey Pretest – This stage focused on bringing everythingtogether for a “dress rehearsal” of the final survey. This stage sought toevaluate the distribution procedures, discover any production mistakes,
220 CHAPTER 9. CONCLUSIONS
learn whether people clearly understood all of the survey statementsand questions, and provide an opportunity for feedback.
The pretest survey was sent to a sample of a dozen participants. Thefeedback was positive, and although some errors were noted and cor-rected, the feedback did not result in any major changes to the surveyinstrument.
• Stage 6: Survey – The final stage consisted of the survey data collectionactivity. The survey was sent to a panel of 254 employees of a largeNew Zealand public sector organization and resulted in 193 usablerecords. See Figure 7.1 (p. 140) for an analysis of the demographicsof the participants and Figure 7.2 (p. 142) for a breakdown of theirexperience with EDRMS technologies. The raw survey data is presentedin Appendix E (p. 257).
The research findings and model evaluation focused on the analysis of thequantitative data collected by the survey instrument.
9.2.4 Research Findings and Model Evaluation
The survey data were first examined using Principal Component Analysis(PCA) in order to determine how well each pool of measurement itemsreflected their target construct. The measurement items must be statisticallyunidimensional (i.e., they must share the same measurement dimensions) inorder to adequately reflect their latent construct.
In order to select the best measures of each construct for use in the finalstructural equation model, each construct’s pool of measurement items werecompared in the PCA space. The Circle of Correlations was adopted as acommon and practical method to visualize the data. See Section 7.3.2 startingon p. 145. Measurement items that did not cluster well were reviewed for thepossibility of different semantic interpretations and other potential sources oferror. Several measurement items were subsequently removed from the finalmeasurement model.
The remaining measurement items formed the basis for the final analysisusing Partial Least Squares Path Modeling (PLS-PM) (Vinzi et al., 2010;Chin, 1998b; Sanchez, 2013b; Tenenhaus et al., 2005). PLS-PM can beconsidered as two separate models. The outer (measurement model) consistsof the relationship between the measurement items and their constructs. Theinner (structural) model consists of the relationship between the constructs
9.3. CONTRIBUTIONS OF THE RESEARCH 221
and thus represents the conceptual research model. The validity of the latterrelies on effective measures of the former.
Having already been through the initial filter using PCA and the circleof correlations, the reduced set of measurement items comprising the outermodel loaded well. The measures of fit (see Table 7.5 on p. 166 and Figure 7.11on p. 168) were well above the required thresholds. In addition, all statisticalmeasures of unidimensionality (see Table 7.6 on p. 169) were also well abovethe required levels. The outer model provided a strong statistical foundationfor measuring the inner model and addressing the research question.
The next step was to evaluate the inner (structural) model. The PLS-PMalgorithm calculated path coefficients for each of the hypothesized paths thatmake up the research model. These path coefficients provide an indication ofthe size of the effect that one construct has on another. These path effectswere graphically plotted in Figure 7.12 on p. 173.
Once these were calculated, the statistical significance of the path coeffi-cients was evaluated. See Table 7.10 (p. 176) for the inner model significancetests and Table 7.11 (p. 179) for the quality of the model fit. The bootstrap-ping results are presented in Appendix F on p. 265 and the final measuredmodel is portrayed in Figure 7.14 on p. 181.
The survey data and measurements supported five of the nine hypothesizedpath effects. These are summarized on p. 182 and discussed in Section 8.3.1starting on p. 203. The three most important constructs influencing use thatemerged from this research were, in order of significance, the perceived valueof records, effort expectancy, and social influence (see Figure 8.1 on p. 203).
9.3 Contributions of the Research
This research has made several contributions to the existing body of knowl-edge. These are divided into contributions which provide academic value andcontributions which provide practitioner value.
9.3.1 Academic Value of the Research
The primary academic contribution of this research is the combination ofexisting IS technology acceptance theory with recordkeeping and its setof underlying theories. Information systems that are designed to supportrecordkeeping requirements are quite complicated, and they require the inputof extensive recordkeeping metadata and an understanding of what records
222 CHAPTER 9. CONCLUSIONS
are and how records should be stored and organized. Furthermore, thesesystems expect end users to take on this responsibility.
This research sought to determine which factors influence a user’s intentionto use an electronic recordkeeping system. It tested the existing technologyacceptance theory on a recordkeeping class of enterprise information systemand found it wanting. Performance expectancy – the most important of thetechnology acceptance constructs – measured as insignificant in explainingthe use of an electronic recordkeeping system.
Lee (2014) described TAM and UTAUT as being ‘incomplete models’because they fail to take into account the social structure(s) in which theuser operates. This research sought to test and expand on the traditionaldeterminants of system use by including constructs representing the users’organizational context (which captures Lee’s referenced social dimension) andknowledge interpretation (which focuses on the perceived value of recordsstored in the system), thereby combining aspects of structuration theory andthe Records Continuum Model with technology acceptance theory.
The results suggest that TAM’s perceived usefulness and/or UTAUT’sperformance expectancy may be too narrowly defined and culturally specificto work in all situations. The use of a performance lens for usefulness focuseson the competitive advantage afforded by the use of the technology as theprimary driver of technology acceptance, and thus excludes other social drivers(including altruism) that occur when the primary beneficiaries of use arenot solely the individual, but include the social structure(s) in which thatindividual operates.
This research also introduced a new construct, the perceived value ofrecords, and provided a corresponding set of validated measurement items.This construct proved to have a high and significant path coefficient withinthe measurement model, and outperformed all other constructs.
During the search for new measurement items to reflect the perceivedvalue of records, this research took the opportunity to recheck the nomologicalvalidity of the more established constructs and their associated measurementitems. During this process, many of the traditional measurement items werefurther validated; however, this research also detected that the social influenceconstruct was multidimensional. Structuration Theory was used to explainthe three observed dimensions; furthermore, this multidimensionality couldalso explain why social influence has often been found to be insignificant inprevious studies. This opens up opportunities for future research to explorethis finding (see Directions for Future Research, Section 9.5, p. 227).
9.3. CONTRIBUTIONS OF THE RESEARCH 223
9.3.2 Practitioner Value of the Research
As reliance on physical (paper) files reduces, an organization’s documents andrecords are increasingly being stored only in an electronic (digital) format.Unfortunately, the success of organizational electronic recordkeeping systemsin managing these records, as measured by acceptance and use, has beenmixed.
The impact of low utilization of an organization’s electronic recordkeepingsystem means that documents are not being properly managed, can be lostthrough destruction or deterioration, or else can be made irretrievable throughlack of an indexing mechanism (Wilson, 1995). Loss of these records alsohas an impact on society. In the short term, this could lead to a loss ofaccountability, a cornerstone of our legal system and civilization; and in thelong term, ultimately a loss of history (Johnston & Bowen, 2005).
By identifying the factors that impact the use of electronic recordkeepingsystems, this research will help software vendors (e.g., systems developers)by informing future strategies and prioritizing development work that targetconstructs likely to affect a user’s intention to use the system. This researchsuggests that ease of use would have the greatest impact, whereas seeking tocreate gains in job performance would have little or no effect on use.
This research will also assist organizations (e.g., records managers andimplementation project teams) by improving understanding of the motivationsbehind contribution behaviors. This knowledge will help practitioners todevelop implementation and change management strategies that focus onaddressing concerns likely to provide social barriers to use, as well as focusingon aspects of training, such as the importance of contextual metadata and anemphasis on the value of records, that will increase the perceived benefit ofusing systems.
9.3.3 Implications of the Research
In addition to the benefits for both researchers and practitioners, a numberof observations can be made about the implications of this research.
Firstly, although it is expected that the measured path effects (and thusthe interpretation of the model) will vary based on the local organizationalcontext, this research has highlighted that the technology acceptance modelhas not worked as expected in a recordkeeping context. With the performanceexpectancy/perceived usefulness measurement effect being low and insignifi-cant, this research has shown that the context of systems use is important.
224 CHAPTER 9. CONCLUSIONS
Recordkeeping systems in public sector organizations have a unique set offactors influencing use.
The large effect size of the new construct, perceived value of records, alsohas implications for the governance of organizations. This research has shownthat those individuals placing a high value on records are more likely to beinterested in managing those records in the provided EDRMS. Furthermore,Ashton and Reed (2011) argued that aligning the captured records with anorganization’s business processes is an excellent way to provide evidenceof those business processes. Increased reliance on records, when combinedwith improved alignment of the records classification with business processes,could provide a way to automate the majority of the metadata capture (i.e,reduce effort), increase the transparency and accountability of the businessprocesses, and provide trustworthy and strategically captured data with whichto evaluate business performance. In other words, the EDRMS could be thenext source for efficiency and effectiveness measures.
Finally, records bring both transparency and accountability, and dependingon the organizational culture, these attributes can either be perceived as anasset (i.e, in a consensus organization) or as a liability (i.e., in a dissensusorganization). Management should be aware of organizational culture whenworking on strategies to improve their recordkeeping policies and strategies(see Directions for Future Research, Section 9.5, p. 227).
9.4 Limitations of the Research
There were also certain limitations of this research that need to be recognized.They fall into three areas: limitations associated with the conceptual model,the research design, and the research instrument. These are discussed below.
9.4.1 Limitations of the Conceptual Model
The conceptual model was developed to represent three conceptual areas,including technology acceptance, organizational context, and knowledge in-terpretation. However, not all of the constructs selected to represent thesethree conceptual areas measured well.
Specifically, the constructs associated with organizational context pre-sented measurement challenges. As suggested in the Directions for FutureResearch (Section 9.5, p. 227), the constructs representing the organiza-
9.4. LIMITATIONS OF THE RESEARCH 225
tional context conceptual area may be improved by focusing on the threestructurational interactions of communication, power, and sanction.
9.4.2 Limitations of the Research Design
The primary limitations associated with the research design may be linked toconstraints associated with the sample/sample frame and the selected level ofanalysis.
One source of concern may be the decision to sample a New Zealand publicsector organization to represent the target population for the Stage 6: Surveydata collection activity. To address this concern, it should be noted that themajority of the constructs and their measurement items have been sourcedfrom studies from North America and that these have since been validatedin additional studies internationally. By including those measurement itemsand retesting their nomological validity in this research (as assessed bothin the qualitative phase’s thematic analysis and in the quantitative phase’smeasures of statistical validity), we have assessed that those measures worksimilarly within a New Zealand context.
In addition, the literature in support of the challenges associated withEDRMS adoption comes from numerous locations around the globe, thusdemonstrating that EDRMS acceptance challenges are not limited to NewZealand. Furthermore, the EDRMS system software used in the organizationunder study was a commercial off-the-shelf system developed overseas andimported into New Zealand. The challenges experienced in New Zealand arelikely to be similar to those experienced by any organization using the samesoftware.
Finally, New Zealand strives to stay current with global governance prac-tices and recordkeeping policies, as evidenced by its regular adoption of, andcontribution to, international standards. It is a global player. Given thequantitative measures of nomological validity and qualitative observations ofthe use of international standards, one can conclude that measurements madewithin New Zealand are highly likely to have applicability internationallyand will likely reflect the realities associated with the adoption challenges ofelectronic recordkeeping systems wherever they may occur.
A second potential limitation of the research design was that it focused ona single organization and/or lacked group level variable(s) capable of reflectingand measuring possible differences between groups within an organizationsuch as cross-level or multilevel conceptualizations of the research model’sconstructs (K. J. Klein & Kozlowski, 2000). As such, the research design did
226 CHAPTER 9. CONCLUSIONS
not explore the organizational context constructs at the team or organizationlevel nor did it explore the differences in the perceived value of records betweengroups within an organization. To do so would have required additional com-plexity such as selecting theoretically appropriate methods to conceptualizeand measure multilevel constructs, justifying the levels of aggregation, andutilizing a different approach to analyzing the resulting multilevel models. Asthe conceptual research model was constructed on a foundation of validatedconstructs that were limited to single-level models, this research design alsoexcluded analysis of potential aggregations.1 Nonetheless, future researchcould further explore the impacts of group behaviors on the use of electronicrecordkeeping systems. See Section 9.5.4 on p. 229.
9.4.3 Limitations of the Research Instrument
It was not possible to know the strengths and weaknesses (and the statisticalunidimensionality) of the measurement items without first measuring them.As such, many of the measurement items included in the research instrumentwere found not to cluster well during the PCA’s circle of correlations. Severalof the research instrument’s items were subsequently discarded from the finalPLS-PM outer measurement model.
By including more measurement items than were required to statisticallyreflect the constructs, this research instrument was necessarily a compromise:one which sought to measure the model and validate the measurement itemsat the same time (using the same data).
It is likely that several replications would be required to further refineand validate a final set of improved measurement items that could form amore succinct and parsimonious research instrument. Such an instrumentwould also likely include additional constructs or aggregation variables suchas those suggested in the next section.
1Care must be taken to collect and analyze data at the same level as required to satisfythe research question. Attempting to deduce unit level interactions based on data collectedat the aggregate level can be hindered by the ecological fallacy (Steel & Holt, 1996).Similarly, attempting to infer group behaviors based on data collected at the unit level canbe impacted by the atomistic fallacy (Diez, 2002).
9.5. DIRECTIONS FOR FUTURE RESEARCH 227
9.5 Directions for Future Research
There are many aspects of organizational recordkeeping systems that havenot been explored. The primary direction of future research suggested bythe findings and analysis consists of aligning various aspects of commonlyused information systems constructs with Giddens’ Structuration Theory. Byaligning constructs and measurement items with this broad meta-theory, itwill be possible to build new theory and linkages using a consistent foundation.This shared foundation could place information systems research within acontextual social framework that incorporates a robust view of the interactionsand structures of society. Four major directions are suggested below.
9.5.1 Improved Measures of Social Influence
Social Influence was the third most important construct in the measurementmodel. As shared and networked information systems continue to expandand grow in importance, it is likely that social interactions concerning theuse of these systems will similarly grow in importance.
As detected in Figure 7.5 (p. 152), the measures of the constructs that areclaimed to be represented by social influence displayed additional clusteringwithin the circle of correlations. The three clusters were imperfectly inter-preted as aligning with Giddens’ three social interactions of communication,power and sanction (Lewellen, Hooper, & Oliver, 2014b).
The research model focused solely on social influence (representing thecommunication interaction) and on power. In this context, the sanction-based measurement items were not suggested from the literature, nor didthey emerge from the interviews. Nonetheless, approaching social influ-ence using Giddens’ three structurational interactions may provide improvedtheoretically-grounded measurement constructs that take into account theneed for different types of social interactions to explain aspects of technologyacceptance. A new set of social influence constructs would be ideal for use infuture models, particularly those that require unidimensional measures andthat take advantage of the additional sensitivity provided by modern SEMtechniques. Potential research objectives include:
• Creation and definition of a new set of social influence constructs basedon Giddens’ three structurational interactions of communications, power,and sanction.

228 CHAPTER 9. CONCLUSIONS
• Development of a set of validated and unidimensional measurementitems sufficient to measure these constructs and thereby integrate theminto future structural models.
• Research that validates the appropriateness of the use of structurationalinteraction constructs in place of traditional social influence measures.For example, research that quantifies the latent social influence variable(in the principal component space) as measured in previous studiesand determines the mathematical appropriateness of replacing thelegacy construct(s) with the proposed structurational measures of socialinfluence.
• Research into cross-level and multilevel conceptualizations of the pro-posed structurational measures of social influence in order to providea richer understanding of the impact of team norms on individualbehaviors and vice versa.
• Research into benchmarking the relative effect size of the differentinteractions (communication, power, and sanction behaviors) as theypertain to different technology acceptance and other IS use situations,particularly in organizations that exhibit different cultural attributes(e.g., on the consensus to dissensus continuum).
Furthermore, incorporating Giddens’ structures and modalities into thisfuture research agenda could provide additional insight into organizationalcontext.
9.5.2 Social Influence in Mandatory Use Situations
The importance of social influence and its effect on technology acceptance isalso likely to be influenced by the strength of policy associated with mandateduse. In situations where the policy unambiguously requires use of a system,the reliance of social influence channels and the opinions of peers concerningthe system are more likely to be ignored. However, when the policy concerninguse is either ambiguous or not well publicized, it would follow that userswould rely more heavily on cues from their peers and managers.
This avenue of future research could aim at determining the relative im-portance of communication and sanction social interactions within mandatoryuse situations taking into account cultural context and mode of transmissionof these policies. For example, it is expected that a campaign to present clear
9.5. DIRECTIONS FOR FUTURE RESEARCH 229
organizational policies and expectations would effectively reduce the needand reliance on communication interactions, while increasing the potentialrole and importance of sanction interactions as a means to boost compliancewith the stated policies.
9.5.3 Aligment with the Records Continuum Model
Another avenue of future research could focus on the development of constructsthat better represent the evidentiality dimension of the records continuum.On p. 201, the revised definition of the perceived value of records included botha content dimension and a context dimension. Only the content dimensionwas measured in this research; however, as illustrated in Table 8.2 (p. 202),the addition of measures on the perceived value of recordkeeping contextcould provide additional insight into how users (and organizations) value theirinformation as well as explaining or predicting the technological choices theymake in managing that information.
For example, if future EDRMS implementations continue to rely on endusers to contribute documents to the system, it may be necessary to promoteawareness of the purpose of contextual metadata so that they can willinglyparticipate as good eCitizens within a culture that values records.
9.5.4 Development of a Multilevel Theoretical Model
This research consisted of a single-level research design; however, future re-search could seek to develop a multilevel conceptualization of the researchmodel that may be capable of providing a richer understanding of the deter-minants of EDRMS use.
For example, a cross-level moderator model analysis may be capableof showing that variables at different levels of analysis (e.g., a group-levelvariable and an individual-level variable) could interact to predict a measurableoutcome at the lower unit level of analysis (K. J. Klein & Kozlowski, 2000,p. 219). A future multilevel study may demonstrate that the proposedstructurational social influence constructs are both multilevel and homologouswithin an organizational context. In other words, the explanatory capabilityof the conceptual research model may be supported across different levelsof the organizational system, thereby providing additional validation of theconstructs and the functional relations linking the constructs. A similarapproach could be used to further explore the proposed content and context
230 CHAPTER 9. CONCLUSIONS
aspects of the perceived value of records across functional groups within anorganization and/or groups between organizations.
9.5.5 Benchmarking the Prevalence of the KnowledgeManagement Discourses
This research also cited Schultze and Stabell (2004)’s four discourses ofknowledge management research (see Figure 2.16 on p. 52). Furthermore,it has detected the prevalence of their neo-functionalist discourse, whichidentifies knowledge as an asset, worthy of sharing and storing for the future.
This research has not attempted to quantify or benchmark the distributionof people among the four proposed discourses. To address this gap, futureresearch into identifying the contextual distribution of people among theknowledge discourses could provide additional insight into situations whereelectronic recordkeeping systems adoption has not gone as planned. Thisapplies particularly if the distribution varies between different cultures and/orcontexts.
9.6 Chapter Summary
This concluding chapter begins with a brief overview and summary of theresearch process; first discussing the research gap, the research objectives,and the development of the conceptual research model. The focus then movesto summarizing the research design and the subsequent findings and modelevaluation.
The chapter then focused on the contributions of the research, highlightingboth the academic value and the value and implications to practitioners whomay be struggling to improve the acceptance and use of their EDRMSinvestment.
The limitations of the research were then discussed. These were categorizedinto the limitations of the conceptual model, the limitations of the researchdesign, and the limitations of the research instrument. Finally, severaldirections for future research were both identified and discussed.
In seeking to discover the factors that influence a user’s intention to usean electronic recordkeeping system, this research not only uncovered andmeasured those factors, but also provided several paths for future researchinto the social use of technology. This chapter is finished, but the researchcontinues. . .
Appendix A
Interview Instrument
The following semi-structured interview instrument was used during Stage 1:Interviews of the qualitative research phase from April–June 2012.
The indicative questions cover the general areas suggested by the concep-tual research model as well as provide open-ended questions to seek out otherpotential factors. The first group of questions places the individual within theorganization and determines their approximate level of EDRMS experience.Important questions are in bold.
[Demographics]—to be used for reporting the interview sample
• What is your current role/position?
• What was your previous occupation?
• observable age, gender
[Initial Situation]
• Would you consider yourself a ‘regular’ users of the EDRMS? Describewhat kinds of things do you store in the EDRMS (general categories).
• Do you generally use the EDRMS for filing things you receive,or for things you create?
• Do you feel you should be storing more? Less?
The second section will explore the applicability of existing measurements.The intention is not to verify old instruments, but rather explore aspects ofthem that would be applicable to my model.
[Social Influence/Subjective Norm]
• Thinking of your co-workers (peers), have they expressed any opinionsabout the EDRMS?
231
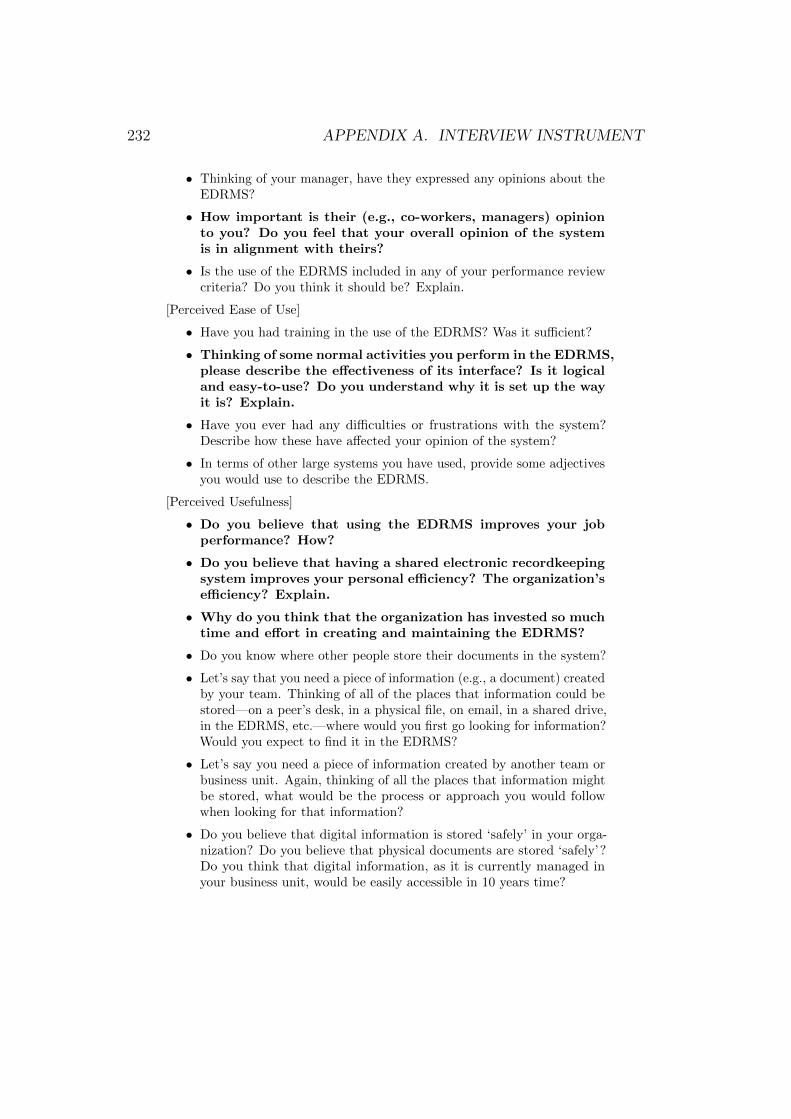
232 APPENDIX A. INTERVIEW INSTRUMENT
• Thinking of your manager, have they expressed any opinions about theEDRMS?
• How important is their (e.g., co-workers, managers) opinionto you? Do you feel that your overall opinion of the systemis in alignment with theirs?
• Is the use of the EDRMS included in any of your performance reviewcriteria? Do you think it should be? Explain.
[Perceived Ease of Use]
• Have you had training in the use of the EDRMS? Was it sufficient?
• Thinking of some normal activities you perform in the EDRMS,please describe the effectiveness of its interface? Is it logicaland easy-to-use? Do you understand why it is set up the wayit is? Explain.
• Have you ever had any difficulties or frustrations with the system?Describe how these have affected your opinion of the system?
• In terms of other large systems you have used, provide some adjectivesyou would use to describe the EDRMS.
[Perceived Usefulness]
• Do you believe that using the EDRMS improves your jobperformance? How?
• Do you believe that having a shared electronic recordkeepingsystem improves your personal efficiency? The organization’sefficiency? Explain.
• Why do you think that the organization has invested so muchtime and effort in creating and maintaining the EDRMS?
• Do you know where other people store their documents in the system?
• Let’s say that you need a piece of information (e.g., a document) createdby your team. Thinking of all of the places that information could bestored—on a peer’s desk, in a physical file, on email, in a shared drive,in the EDRMS, etc.—where would you first go looking for information?Would you expect to find it in the EDRMS?
• Let’s say you need a piece of information created by another team orbusiness unit. Again, thinking of all the places that information mightbe stored, what would be the process or approach you would followwhen looking for that information?
• Do you believe that digital information is stored ‘safely’ in your orga-nization? Do you believe that physical documents are stored ‘safely’?Do you think that digital information, as it is currently managed inyour business unit, would be easily accessible in 10 years time?
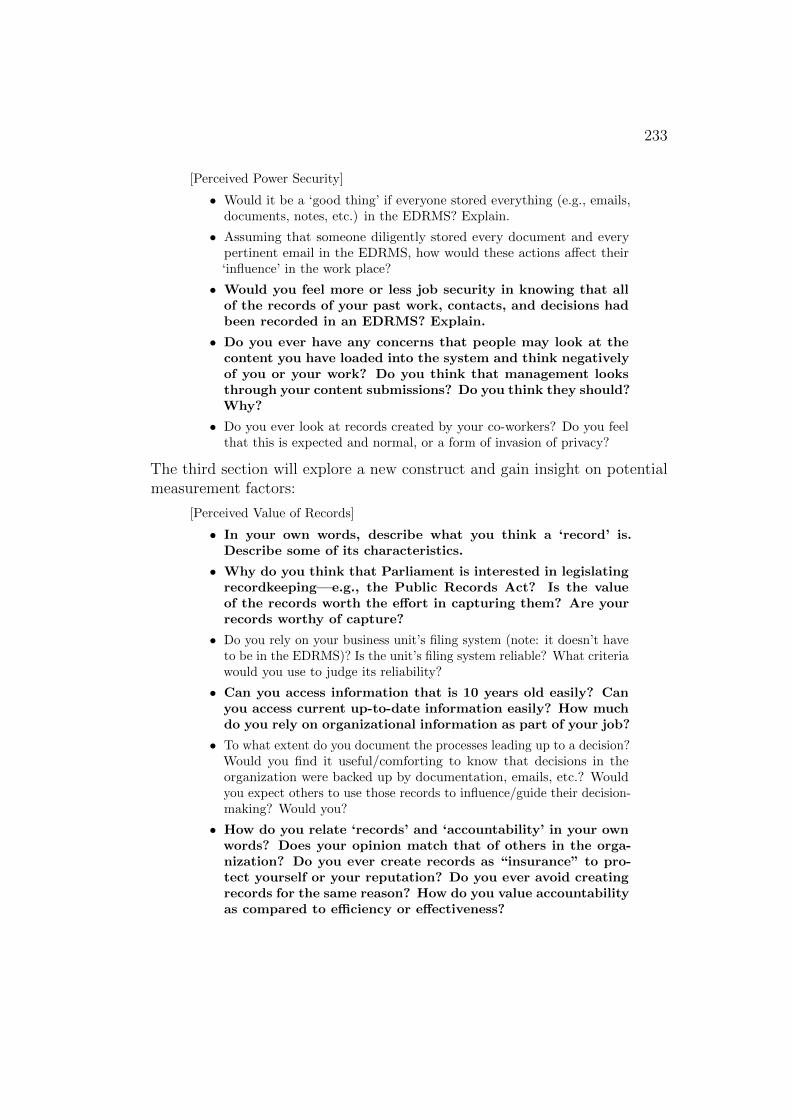
233
[Perceived Power Security]
• Would it be a ‘good thing’ if everyone stored everything (e.g., emails,documents, notes, etc.) in the EDRMS? Explain.
• Assuming that someone diligently stored every document and everypertinent email in the EDRMS, how would these actions affect their‘influence’ in the work place?
• Would you feel more or less job security in knowing that allof the records of your past work, contacts, and decisions hadbeen recorded in an EDRMS? Explain.
• Do you ever have any concerns that people may look at thecontent you have loaded into the system and think negativelyof you or your work? Do you think that management looksthrough your content submissions? Do you think they should?Why?
• Do you ever look at records created by your co-workers? Do you feelthat this is expected and normal, or a form of invasion of privacy?
The third section will explore a new construct and gain insight on potentialmeasurement factors:
[Perceived Value of Records]
• In your own words, describe what you think a ‘record’ is.Describe some of its characteristics.
• Why do you think that Parliament is interested in legislatingrecordkeeping—e.g., the Public Records Act? Is the valueof the records worth the effort in capturing them? Are yourrecords worthy of capture?
• Do you rely on your business unit’s filing system (note: it doesn’t haveto be in the EDRMS)? Is the unit’s filing system reliable? What criteriawould you use to judge its reliability?
• Can you access information that is 10 years old easily? Canyou access current up-to-date information easily? How muchdo you rely on organizational information as part of your job?
• To what extent do you document the processes leading up to a decision?Would you find it useful/comforting to know that decisions in theorganization were backed up by documentation, emails, etc.? Wouldyou expect others to use those records to influence/guide their decision-making? Would you?
• How do you relate ‘records’ and ‘accountability’ in your ownwords? Does your opinion match that of others in the orga-nization? Do you ever create records as “insurance” to pro-tect yourself or your reputation? Do you ever avoid creatingrecords for the same reason? How do you value accountabilityas compared to efficiency or effectiveness?

234 APPENDIX A. INTERVIEW INSTRUMENT
• How do you feel (emotionally) when you permanently lodgeinformation attributed to you into a recordkeeping system?Explain.
• Do you ‘trust’ the factual nature of your organization’s phys-ical records? Would you trust them more (or less) if theywere all held in an EDRMS?
• Do you have any other thoughts concerning the general ‘value’of records?
The final section will draw everything together and explore their intention tocontribute information to electronic recordkeeping systems:
[Intention to Use]
• Will you continue to use the EDRMS in the future?
• As more people use the system, do you expect that you willbe storing more of your content in the EDRMS (e.g., emails,notes, documents, etc.)?
• Do you contribute information immediately upon creation? Or do youlet it pile up and then do some recordkeeping when you have time?How does your contribution style compare to your peers?
• What categories of information do you generally NOT contribute intoan EDRMS. Why?
[Conclusion]
• Please list some good or helpful things that an EDRMS would provideto you personally.
• Are there any other points you’d like to raise that haven’t already beencovered?
Thank the participant!!
Appendix B
Proofreading of Stage 1 Items
In Section 5.2.4 (p. 86), the initial pool of Stage 1 measurement items wasformed as a combination of items taken from (or adapted from) the literatureand measurement items that were created by the author to represent emergentthemes from the interview stage.
As many of the measurement items were new and untested, and thosetaken from the literature were of different tone and tense, it was importantthat the wording of the measurement items be aligned and tested for meaning,comprehension, and grammar. To this end, Stage 2: Proofreading recruitedparticipants to do just that. See Section 5.3 (p. 107).
A 3-page printed feedback instrument containing the Stage 1 measurementitem statements was provided to each of the proofreading participants, andtheir combined feedback was transcribed by the author onto a single form inorder to better understand the statements that are problematic and to seekpatterns in the feedback. This combined master form records feedback foreach statement and tally marks for instances of identical or similar feedback.In addition, those who thought the statement was fine were tracked usingtally marks in the left margin.
The scanned combined (master) feedback instrument is reproduced overthe next three pages.
235
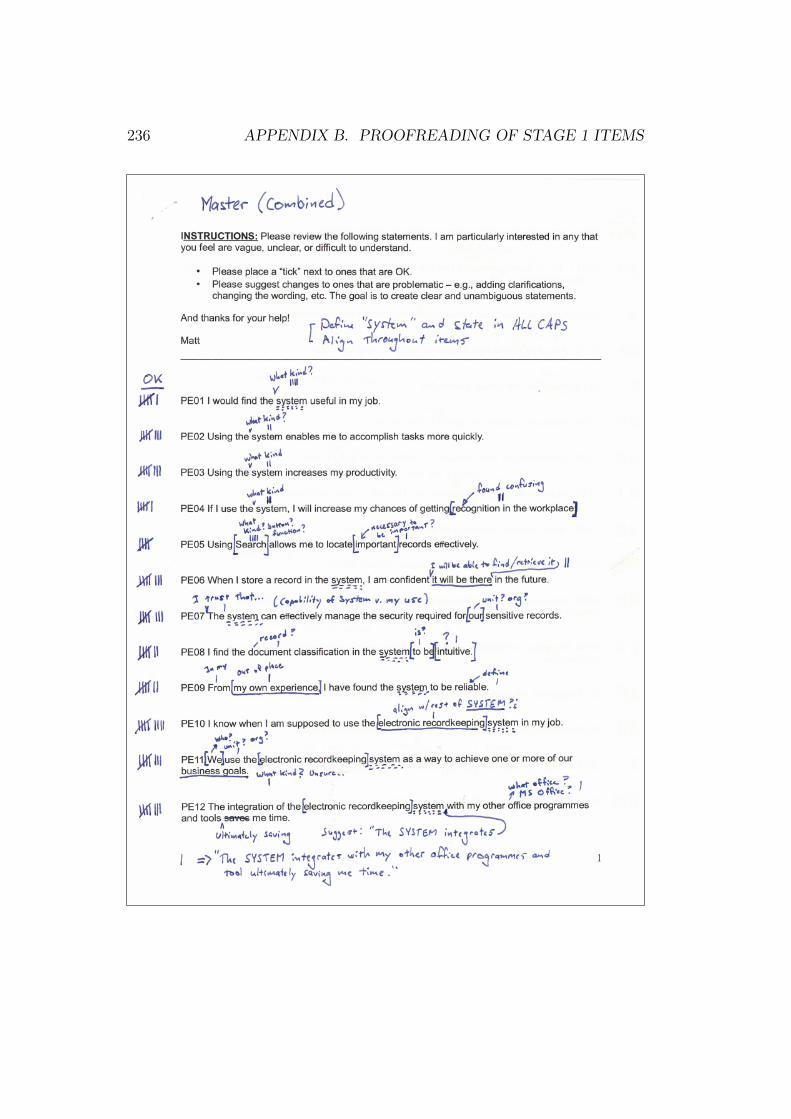
236 APPENDIX B. PROOFREADING OF STAGE 1 ITEMS
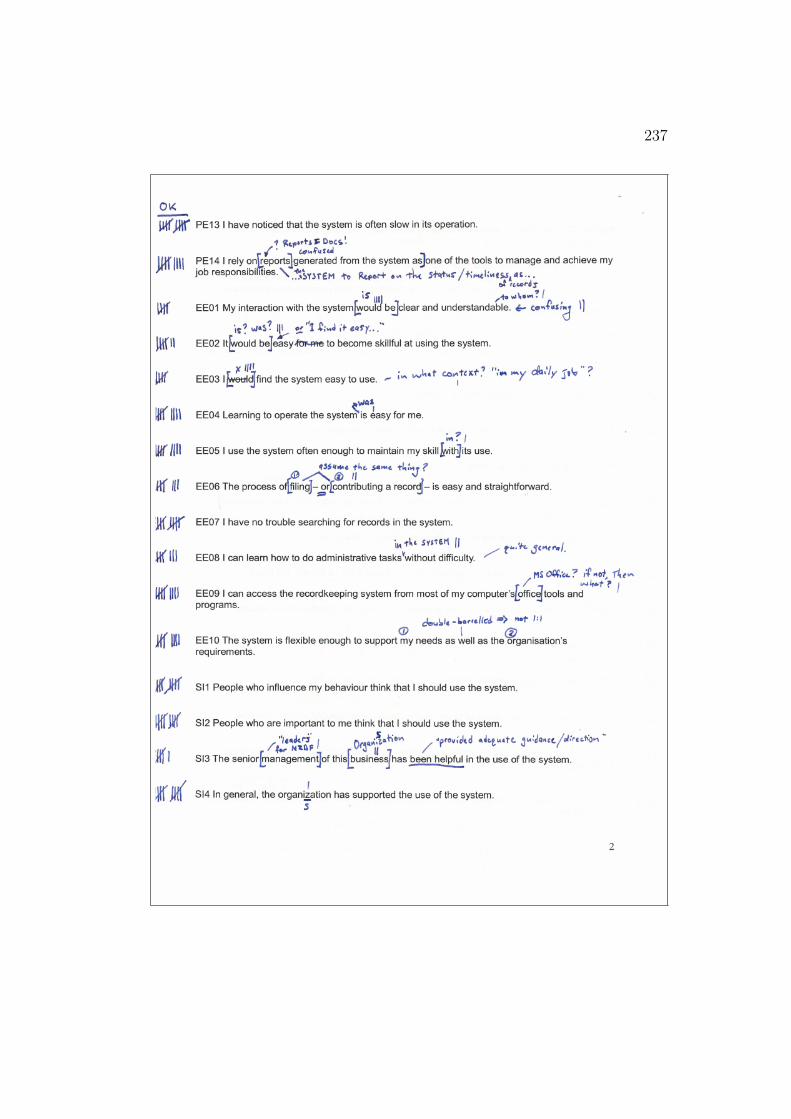
237
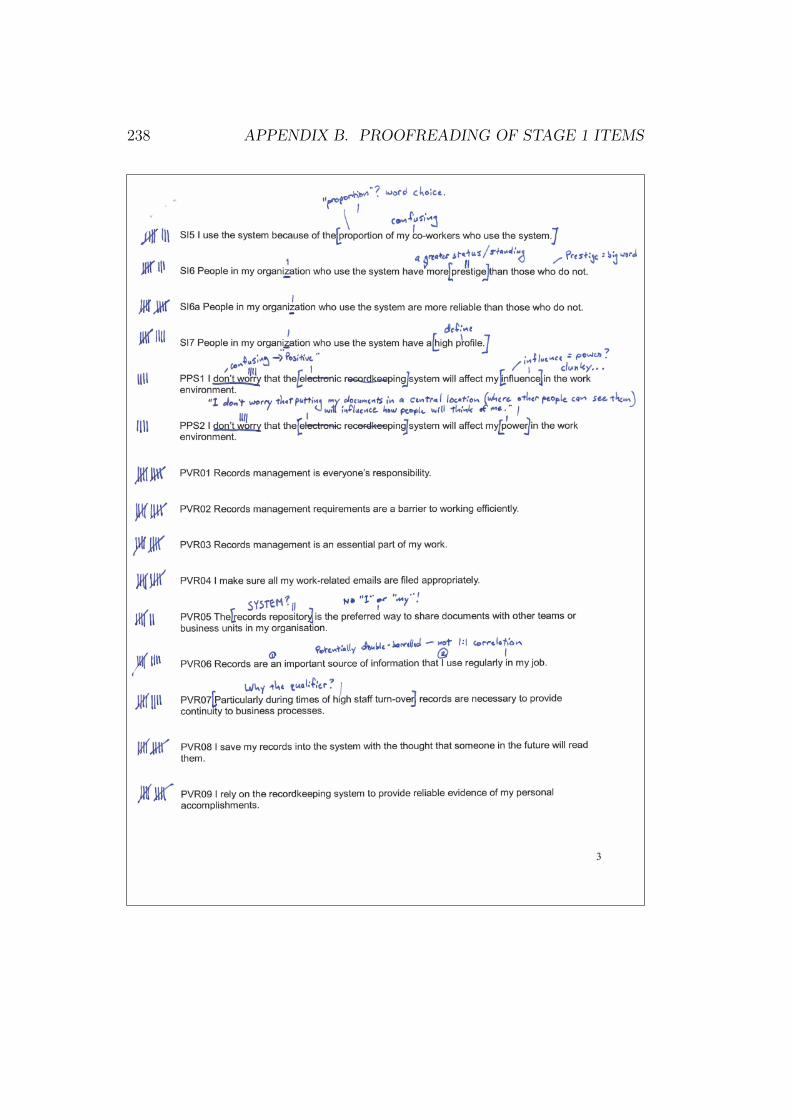
238 APPENDIX B. PROOFREADING OF STAGE 1 ITEMS
Appendix C
Final Survey Instrument
The Survey Instrument was created using Qualtrics (http://qualtrics.com/).The Qualtrics Research Suite is a popular on-line product that is designedspecifically for market research, including the development of on-line surveys.Qualtrics was licensed to the researcher under the Victoria University ofWellington’s site license.
The final survey instrument consisted of 7 pages (or ‘screens’) of questions,followed by an automated page that thanks the participant and confirms thecapture of their answers.
Screenshots of the complete survey instrument as they were seen byparticipants are provided on the next several pages.
239
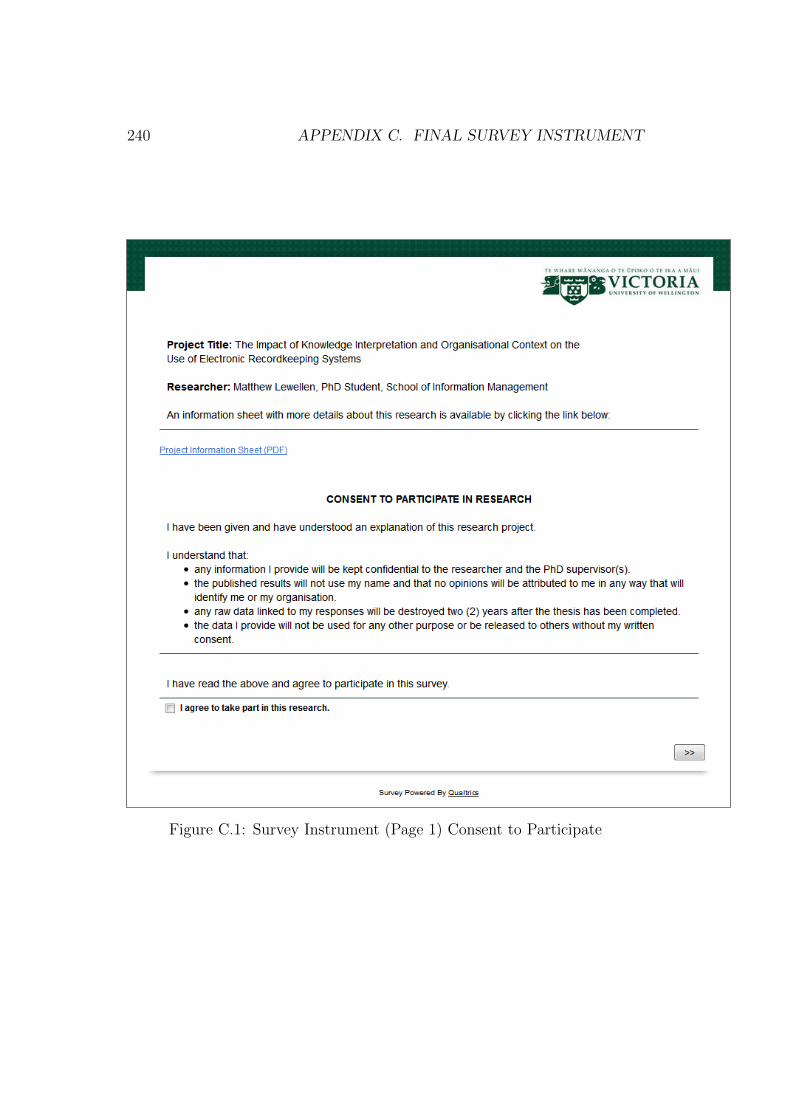
240 APPENDIX C. FINAL SURVEY INSTRUMENT
Figure C.1: Survey Instrument (Page 1) Consent to Participate

241
Figure C.2: Survey Instrument (Page 2) Effort Expectancy construct
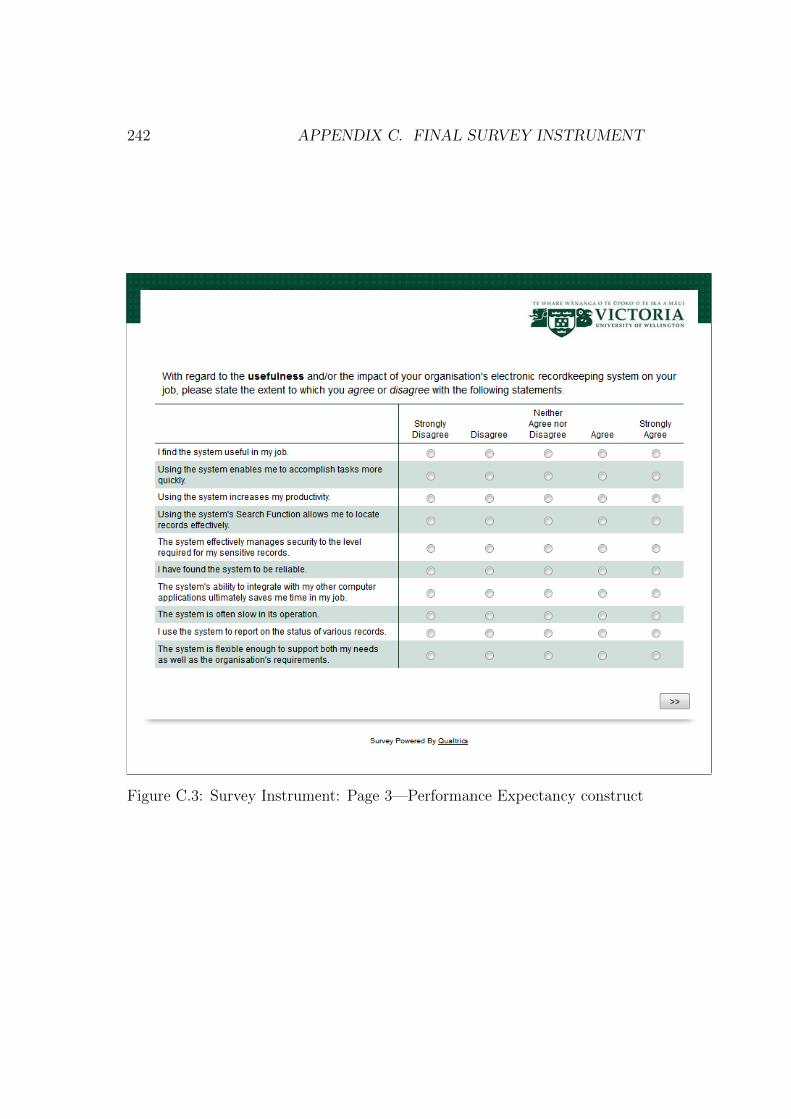
242 APPENDIX C. FINAL SURVEY INSTRUMENT
Figure C.3: Survey Instrument: Page 3—Performance Expectancy construct
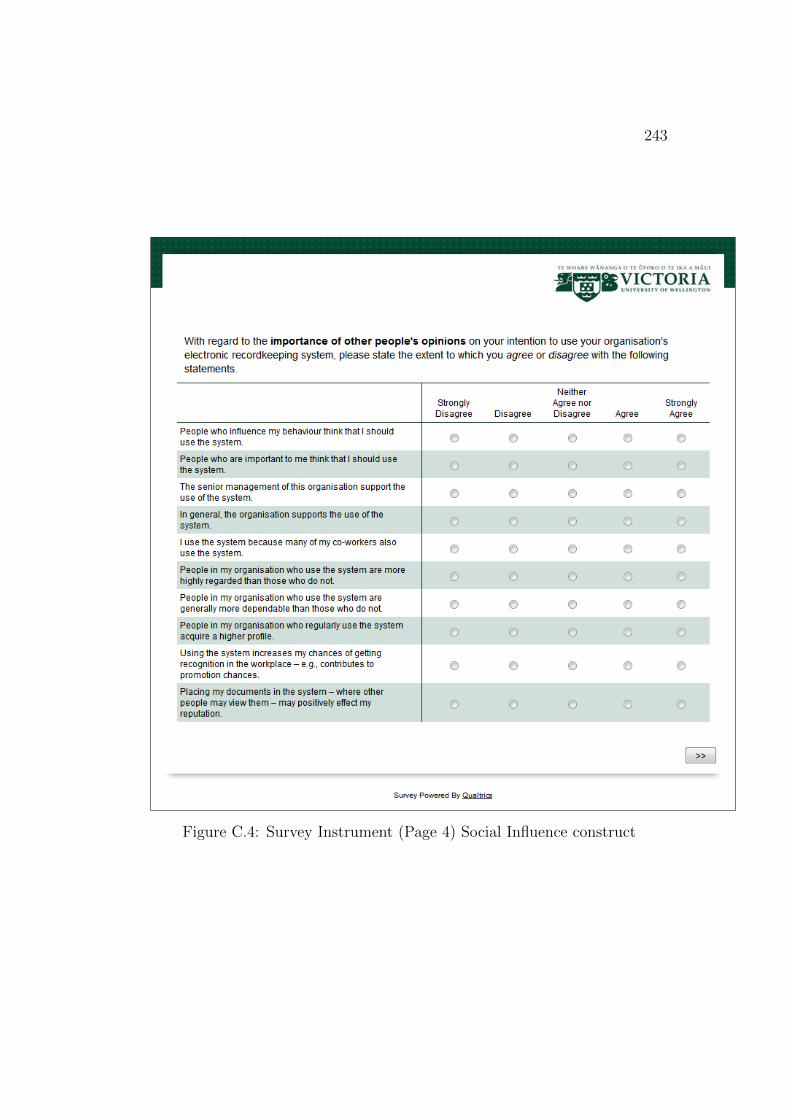
243
Figure C.4: Survey Instrument (Page 4) Social Influence construct
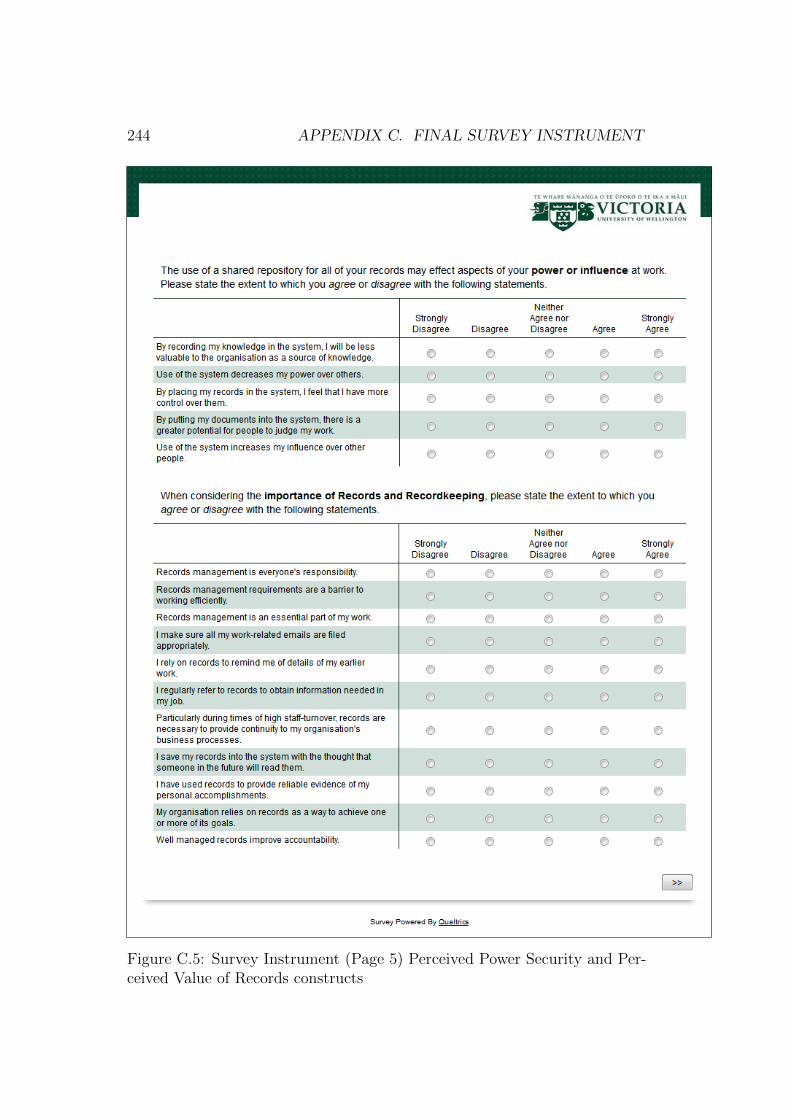
244 APPENDIX C. FINAL SURVEY INSTRUMENT
Figure C.5: Survey Instrument (Page 5) Perceived Power Security and Per-ceived Value of Records constructs
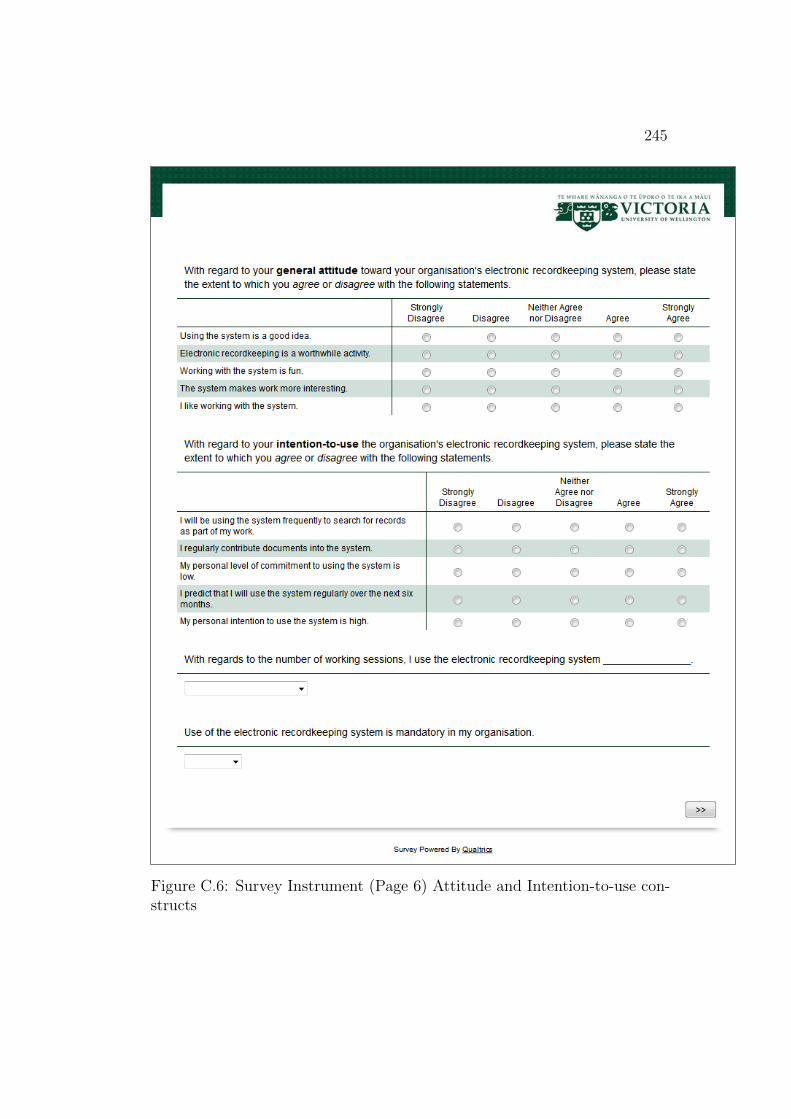
245
Figure C.6: Survey Instrument (Page 6) Attitude and Intention-to-use con-structs
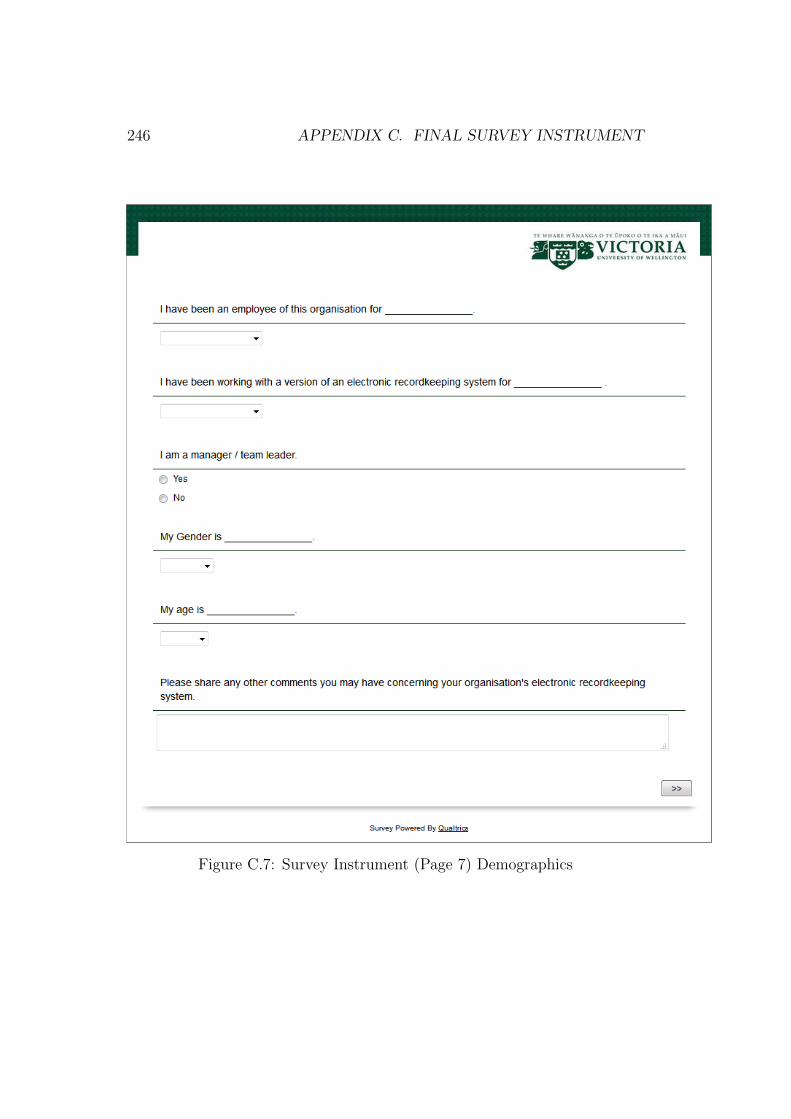
246 APPENDIX C. FINAL SURVEY INSTRUMENT
Figure C.7: Survey Instrument (Page 7) Demographics
247
Figure C.8: Survey Instrument (Page 8) Thank you and confirmation ofcompletion
Demographic Scales
The scales for many of the demographic questions were available as drop-downboxes within the survey instrument. Many of these were common frequencyor time divisions and were available as a ‘default’ Qualtrics scale selection.The selected ‘selection scales’ are provided below for the sake of completion:
Demographic Questions Selection ScaleWith regard to the number of working sessions, NeverI use the electronic recordkeeping system: Less than once a month
Once a month2–3 Times a monthOnce a week2–3 Times a weekDaily
Use of the electronic recordkeeping system is Yesmandatory in my organization No
Not sure
248 APPENDIX C. FINAL SURVEY INSTRUMENT
Demographic Questions—continued Selection ScaleI have been an employee of this organization Less than 6 monthsfor: 6 to 12 months
1 to 2 years2 to 5 years5 to 10 yearsMore than 10 years
I have been working with a version of an Less than 6 monthselectronic recordkeeping system for: 6 to 12 months
1 to 2 years2 to 5 yearsMore than 5 years
My Gender is: malefemale
My age is: 18–2425–3435–4445–5455+
*** End Section ***
Appendix D
Survey CommunicationsTemplates
In an effort to minimize non-response (and thereby minimize non-responsebias), Sivo et al. (2006) recommend two strategies: 1) selecting the smallestrandom sample from the target population that will provide sufficient powerand accurately determining the effect size, and 2) “using Dillman’s empiricallysupported Tailored Design Method (TDM) to minimize non-response” (Sivoet al., 2006, p. 355).
The Tailored Design Method was initially put forward in 1978 and, givenits continued success, it continues to be the primary distribution method forreducing survey non-response (Dillman, 2009; Sivo et al., 2006). The methodis grounded in social exchange theory, and includes a number of necessaryelements, including: 1) a user-friendly questionnaire, 2) a multi-contactstrategy, and 3) personalized correspondence.1
Dillman stressed the importance of tone and voice, and recommendedthat each contact in the multi-contact strategy use a different tone of voiceand/or method of delivery. In an effort to reduce the perceived barriersto participation, he also recommends including the questionnaire with eachcontact (Dillman, 2009).
With this in mind, a series of email templates were built in Qualtrics,based roughly on the recommended paragraph order and structure (Dillman,2007). A link to the Research Information Sheet and a link to the onlinesurvey was included with every communication (except for the ‘thank you’
1Originally designed for mailed (paper) questionnaires, the original elements alsoincluded a return envelope with real first class stamps and a token prepaid financialincentive (Sivo et al., 2006)
249
250 APPENDIX D. SURVEY COMMUNICATIONS TEMPLATES
notes), and each email was personalized in an effort to build trust with theparticipants. In addition, the emails were scheduled to go out at 11:00am, atime of day when people might be ready for a change of activity.
The contact strategy included five contacts:
1. Introductory email
2. Reminder email #1
3. Reminder email #2
4. Reminder email #3
5. Thank you email
The email templates were created in Qualtrics (http://qualtrics.com/),which can automatically track who has responded and who has not respondedin order to optimally target the correct people with each mailing. In addition,the emails could be scheduled ahead to be sent at specific times, supportinga “fire and forget” approach to the contact strategy. The email templatesfor each stage – as well as details about their timings – are included below.Note that the email templates have been adjusted to hide the identity of theorganization.
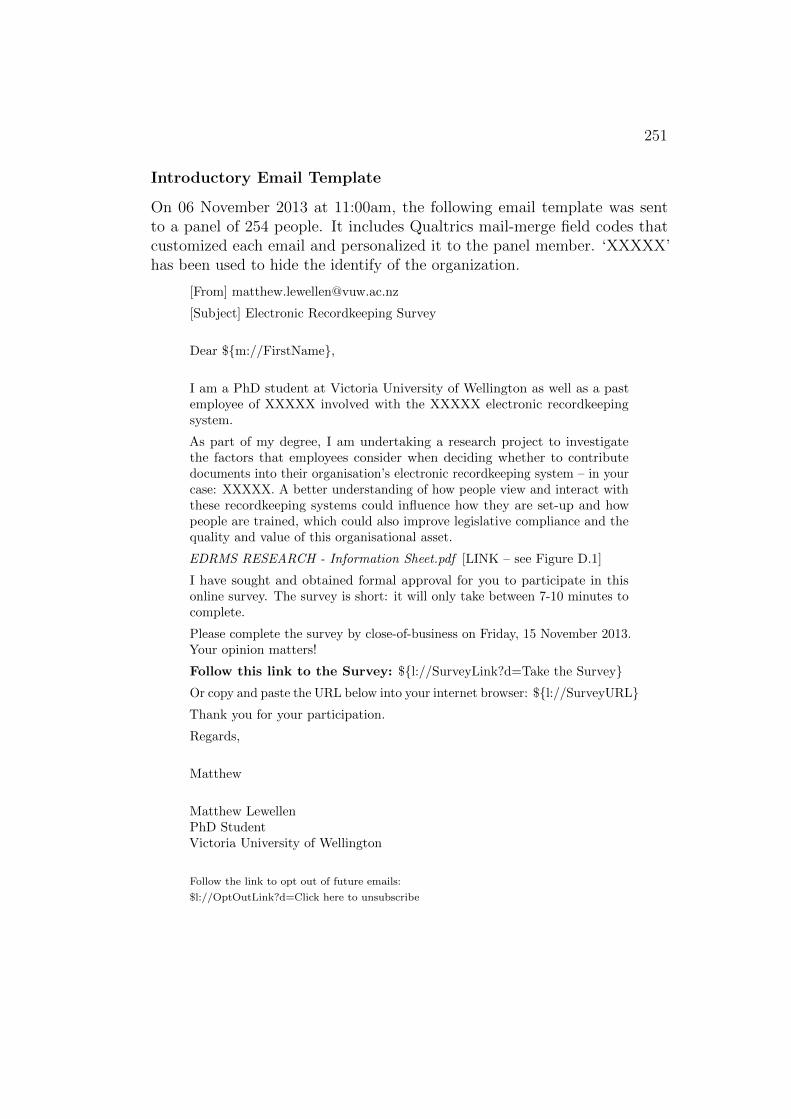
251
Introductory Email Template
On 06 November 2013 at 11:00am, the following email template was sentto a panel of 254 people. It includes Qualtrics mail-merge field codes thatcustomized each email and personalized it to the panel member. ‘XXXXX’has been used to hide the identify of the organization.
[From] [email protected]
[Subject] Electronic Recordkeeping Survey
Dear ${m://FirstName},
I am a PhD student at Victoria University of Wellington as well as a pastemployee of XXXXX involved with the XXXXX electronic recordkeepingsystem.
As part of my degree, I am undertaking a research project to investigatethe factors that employees consider when deciding whether to contributedocuments into their organisation’s electronic recordkeeping system – in yourcase: XXXXX. A better understanding of how people view and interact withthese recordkeeping systems could influence how they are set-up and howpeople are trained, which could also improve legislative compliance and thequality and value of this organisational asset.
EDRMS RESEARCH - Information Sheet.pdf [LINK – see Figure D.1]
I have sought and obtained formal approval for you to participate in thisonline survey. The survey is short: it will only take between 7-10 minutes tocomplete.
Please complete the survey by close-of-business on Friday, 15 November 2013.Your opinion matters!
Follow this link to the Survey: ${l://SurveyLink?d=Take the Survey}Or copy and paste the URL below into your internet browser: ${l://SurveyURL}Thank you for your participation.
Regards,
Matthew
Matthew LewellenPhD StudentVictoria University of Wellington
Follow the link to opt out of future emails:
$l://OptOutLink?d=Click here to unsubscribe
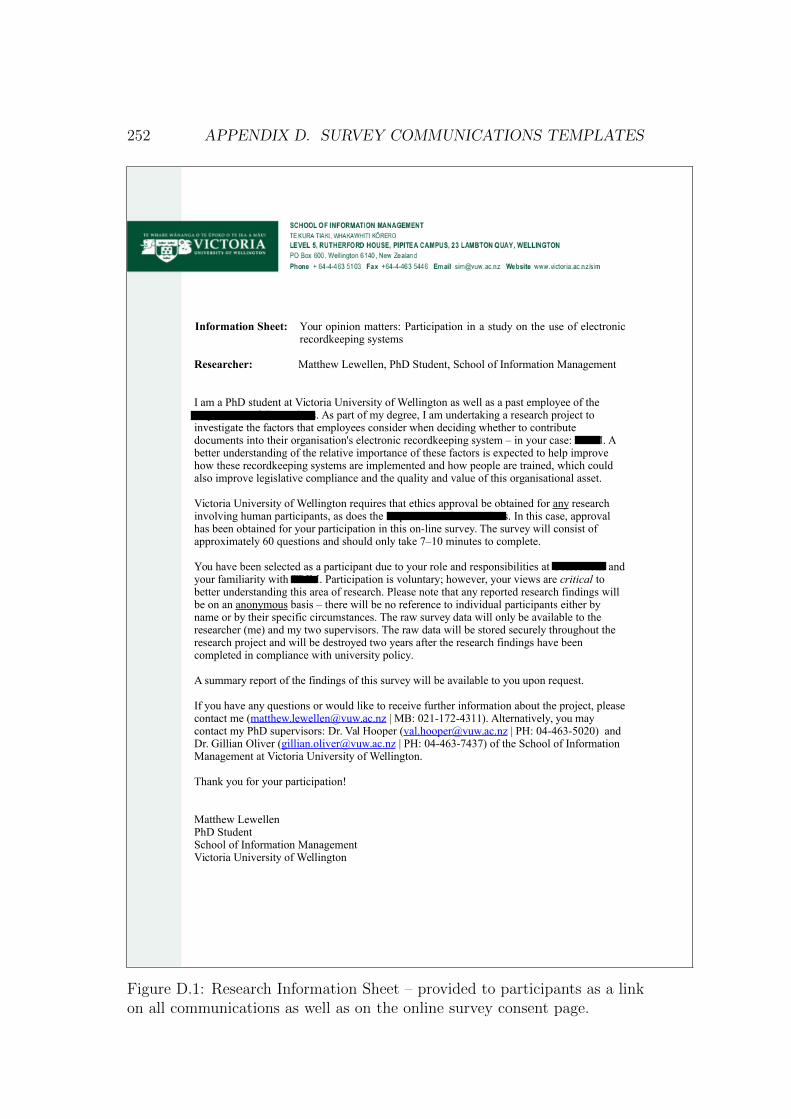
252 APPENDIX D. SURVEY COMMUNICATIONS TEMPLATES
Information Sheet: Your opinion matters: Participation in a study on the use of electronicrecordkeeping systems
Researcher: Matthew Lewellen, PhD Student, School of Information Management
I am a PhD student at Victoria University of Wellington as well as a past employee of the Department of Corrections. As part of my degree, I am undertaking a research project to investigate the factors that employees consider when deciding whether to contribute documents into their organisation's electronic recordkeeping system – in your case: TRIM. A better understanding of the relative importance of these factors is expected to help improve how these recordkeeping systems are implemented and how people are trained, which could also improve legislative compliance and the quality and value of this organisational asset.
Victoria University of Wellington requires that ethics approval be obtained for any research involving human participants, as does the Department of Corrections. In this case, approval has been obtained for your participation in this on-line survey. The survey will consist of approximately 60 questions and should only take 7–10 minutes to complete.
You have been selected as a participant due to your role and responsibilities at Corrections andyour familiarity with TRIM. Participation is voluntary; however, your views are critical to better understanding this area of research. Please note that any reported research findings will be on an anonymous basis – there will be no reference to individual participants either by name or by their specific circumstances. The raw survey data will only be available to the researcher (me) and my two supervisors. The raw data will be stored securely throughout the research project and will be destroyed two years after the research findings have been completed in compliance with university policy.
A summary report of the findings of this survey will be available to you upon request.
If you have any questions or would like to receive further information about the project, pleasecontact me ([email protected] | MB: 021-172-4311). Alternatively, you may contact my PhD supervisors: Dr. Val Hooper ([email protected] | PH: 04-463-5020) and Dr. Gillian Oliver ([email protected] | PH: 04-463-7437) of the School of Information Management at Victoria University of Wellington.
Thank you for your participation!
Matthew LewellenPhD StudentSchool of Information ManagementVictoria University of Wellington
Figure D.1: Research Information Sheet – provided to participants as a linkon all communications as well as on the online survey consent page.

253
Reminder Email Template #1
On 12 November 2013 at 11:00am, an email template was sent to a panel of 131people. This was the first reminder email as per the schedule recommendedby the modified Tailored Design Method (Dillman, 2009).
[From] [email protected]
[Subject] Electronic Recordkeeping Survey (reminder)
Dear ${m://FirstName},
This is a gentle reminder that the Electronic Recordkeeping Survey is stillopen this week, and I have yet to hear from you. The survey is short: it willonly take between 7-10 minutes to complete.
Several people have asked whether the survey is only targeted at people whouse XXXXX regularly. Since the purpose of the study is to look at the factorsthat contribute to use, I am as interested in hearing from ‘infrequent users’as I am in hearing from ‘regular users.’ All opinions matter!
Follow this link to the Survey: ${l://SurveyLink?d=Take the Survey}Or copy and paste the URL below into your internet browser:${l://SurveyURL}
Also, if you started the survey, but did not yet complete it, the attached linkwill take you back to where you left off.
In case you missed last Wednesday’s original survey invite, I have also re-attached the information sheet that provides more information about thisresearch project:
EDRMS RESEARCH - Information Sheet.pdf [LINK – see Figure D.1]
Please complete the survey by close-of-business on Friday, 15 November 2013.
Thank you for your participation.
Regards,
Matthew
Matthew LewellenPhD StudentVictoria University of Wellington
Follow the link to opt out of future emails:
$l://OptOutLink?d=Click here to unsubscribe
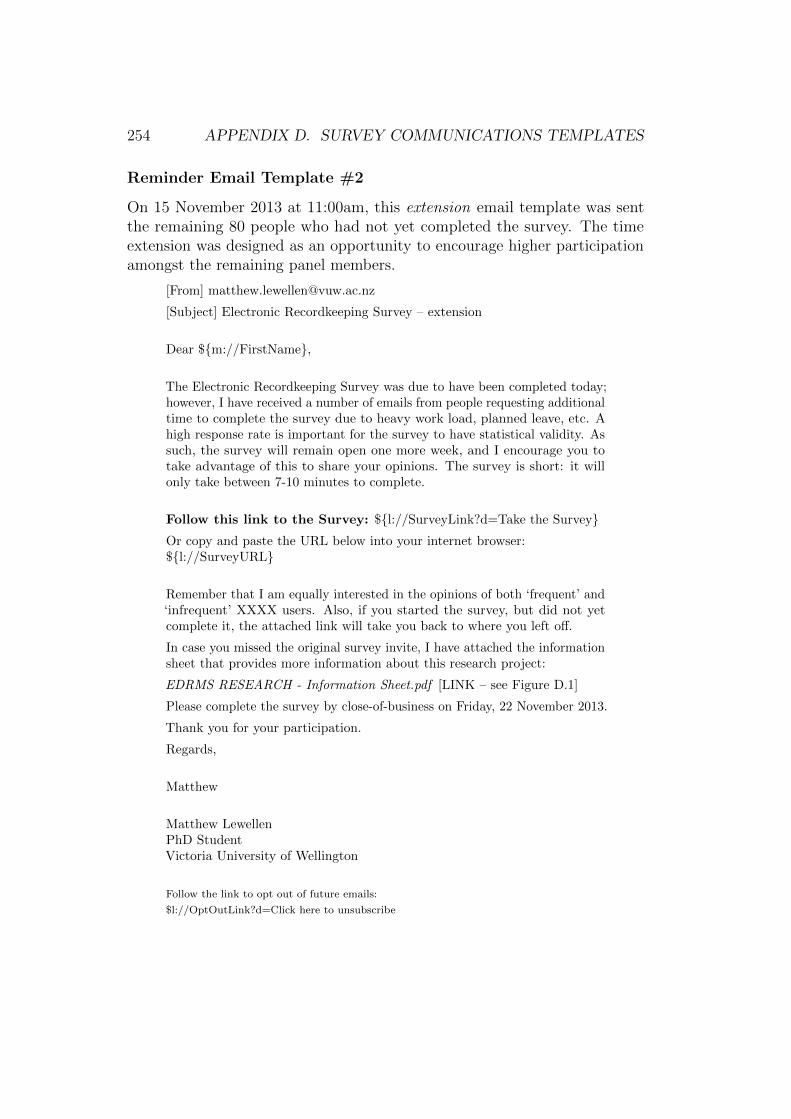
254 APPENDIX D. SURVEY COMMUNICATIONS TEMPLATES
Reminder Email Template #2
On 15 November 2013 at 11:00am, this extension email template was sentthe remaining 80 people who had not yet completed the survey. The timeextension was designed as an opportunity to encourage higher participationamongst the remaining panel members.
[From] [email protected]
[Subject] Electronic Recordkeeping Survey – extension
Dear ${m://FirstName},
The Electronic Recordkeeping Survey was due to have been completed today;however, I have received a number of emails from people requesting additionaltime to complete the survey due to heavy work load, planned leave, etc. Ahigh response rate is important for the survey to have statistical validity. Assuch, the survey will remain open one more week, and I encourage you totake advantage of this to share your opinions. The survey is short: it willonly take between 7-10 minutes to complete.
Follow this link to the Survey: ${l://SurveyLink?d=Take the Survey}Or copy and paste the URL below into your internet browser:${l://SurveyURL}
Remember that I am equally interested in the opinions of both ‘frequent’ and‘infrequent’ XXXX users. Also, if you started the survey, but did not yetcomplete it, the attached link will take you back to where you left off.
In case you missed the original survey invite, I have attached the informationsheet that provides more information about this research project:
EDRMS RESEARCH - Information Sheet.pdf [LINK – see Figure D.1]
Please complete the survey by close-of-business on Friday, 22 November 2013.
Thank you for your participation.
Regards,
Matthew
Matthew LewellenPhD StudentVictoria University of Wellington
Follow the link to opt out of future emails:
$l://OptOutLink?d=Click here to unsubscribe
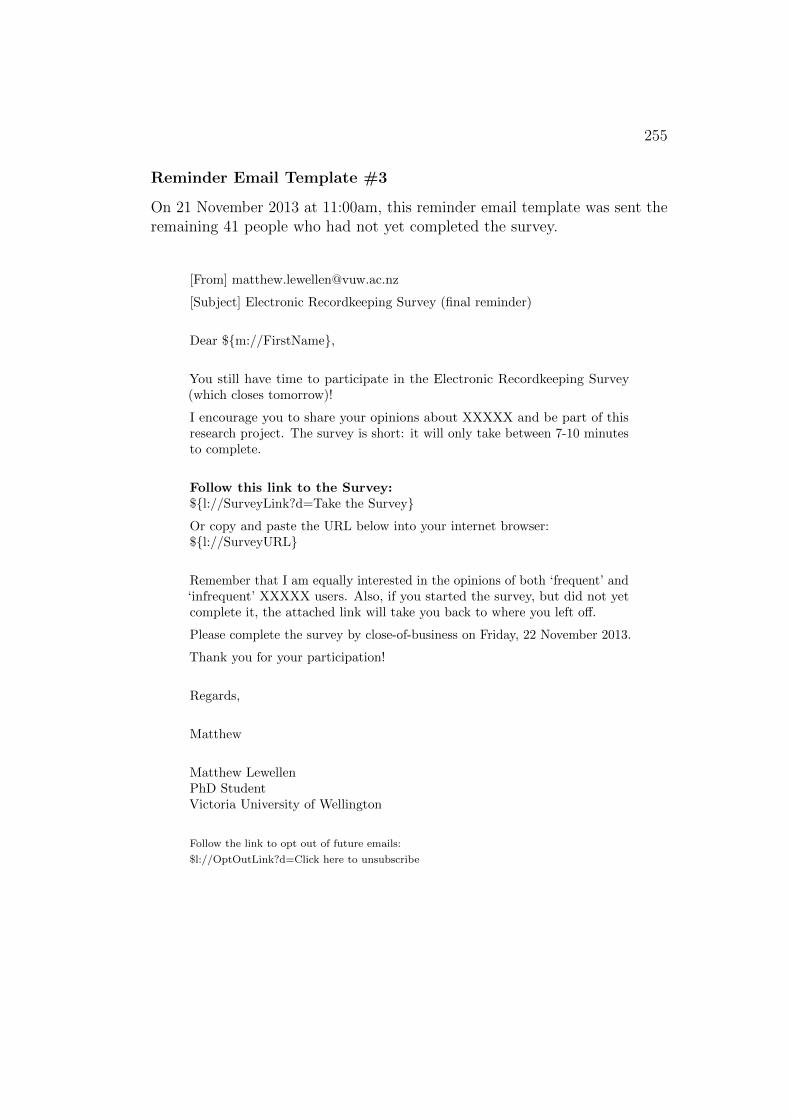
255
Reminder Email Template #3
On 21 November 2013 at 11:00am, this reminder email template was sent theremaining 41 people who had not yet completed the survey.
[From] [email protected]
[Subject] Electronic Recordkeeping Survey (final reminder)
Dear ${m://FirstName},
You still have time to participate in the Electronic Recordkeeping Survey(which closes tomorrow)!
I encourage you to share your opinions about XXXXX and be part of thisresearch project. The survey is short: it will only take between 7-10 minutesto complete.
Follow this link to the Survey:${l://SurveyLink?d=Take the Survey}Or copy and paste the URL below into your internet browser:${l://SurveyURL}
Remember that I am equally interested in the opinions of both ‘frequent’ and‘infrequent’ XXXXX users. Also, if you started the survey, but did not yetcomplete it, the attached link will take you back to where you left off.
Please complete the survey by close-of-business on Friday, 22 November 2013.
Thank you for your participation!
Regards,
Matthew
Matthew LewellenPhD StudentVictoria University of Wellington
Follow the link to opt out of future emails:
$l://OptOutLink?d=Click here to unsubscribe
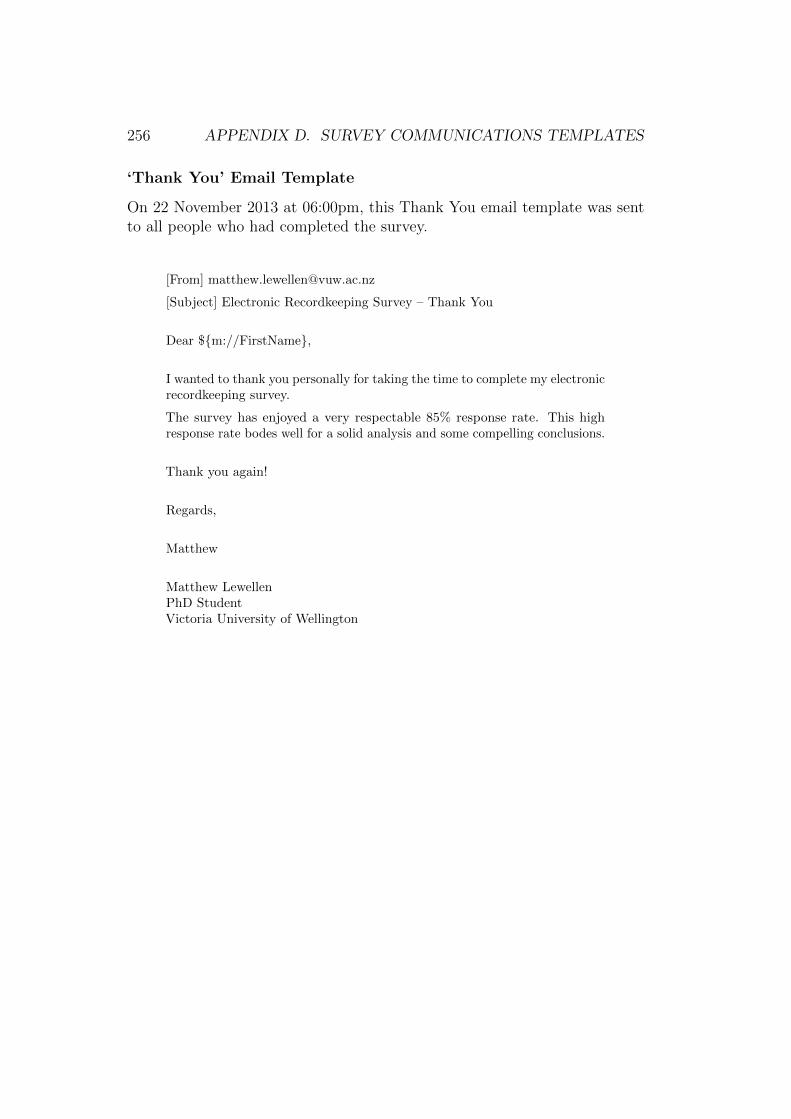
256 APPENDIX D. SURVEY COMMUNICATIONS TEMPLATES
‘Thank You’ Email Template
On 22 November 2013 at 06:00pm, this Thank You email template was sentto all people who had completed the survey.
[From] [email protected]
[Subject] Electronic Recordkeeping Survey – Thank You
Dear ${m://FirstName},
I wanted to thank you personally for taking the time to complete my electronicrecordkeeping survey.
The survey has enjoyed a very respectable 85% response rate. This highresponse rate bodes well for a solid analysis and some compelling conclusions.
Thank you again!
Regards,
Matthew
Matthew LewellenPhD StudentVictoria University of Wellington
Appendix E
Final Survey Data
The survey responses were recorded in Qualtrics using a 1–5 (Disagree–Agree)Likert Scale. The survey design (see Appendix C) aligned the measurementitem questions by construct, resulting in multiple question groups. The groupsof interest included:
• Effort Expectancy (Ease of use) – see Table E.1 (p. 258)
• Performance Expectancy (Usefulness) – see Table E.2 (p. 259)
• Social Influence – see Table E.3 (p. 260)
• Perceived Power Security – see Table E.4 (p. 261)
• Perceived Value of Records – see Table E.5 (p. 262)
• Intention to Use – see Table E.6 (p. 263)
A summary of the responses to each measurement item (in the form of barcharts using the original Likert Scale responses by construct) are provided onthe following pages.
257
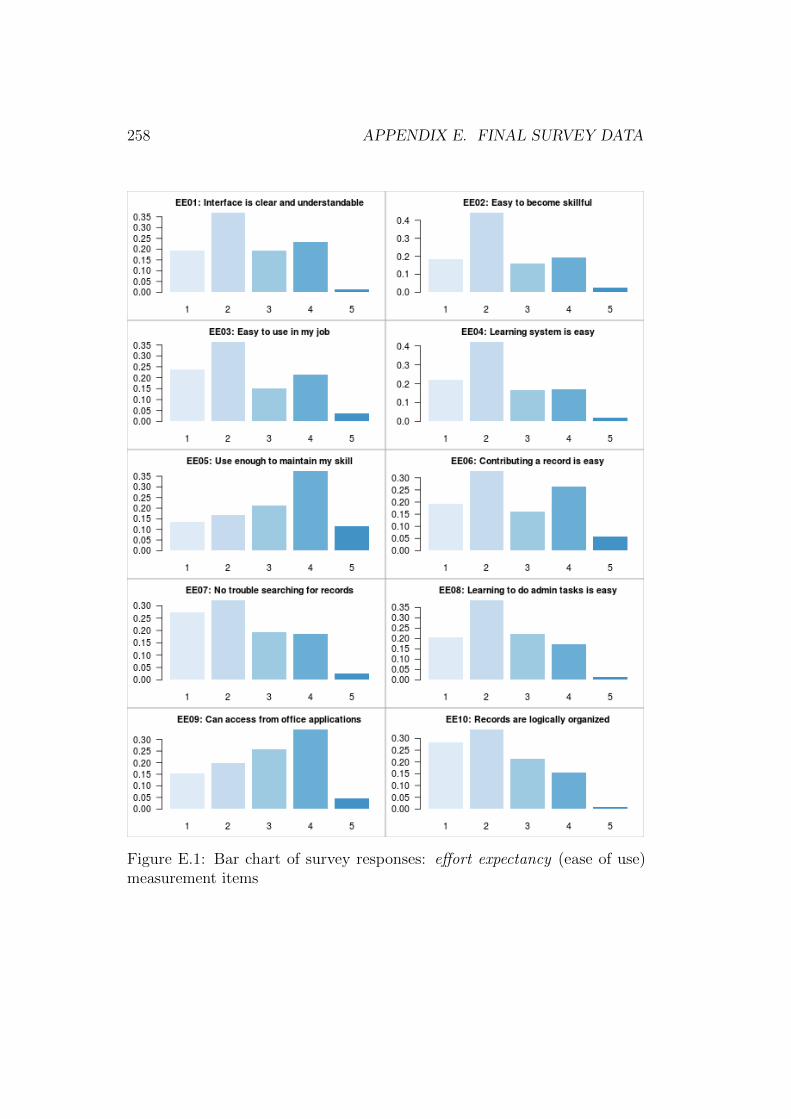
258 APPENDIX E. FINAL SURVEY DATA
Figure E.1: Bar chart of survey responses: effort expectancy (ease of use)measurement items
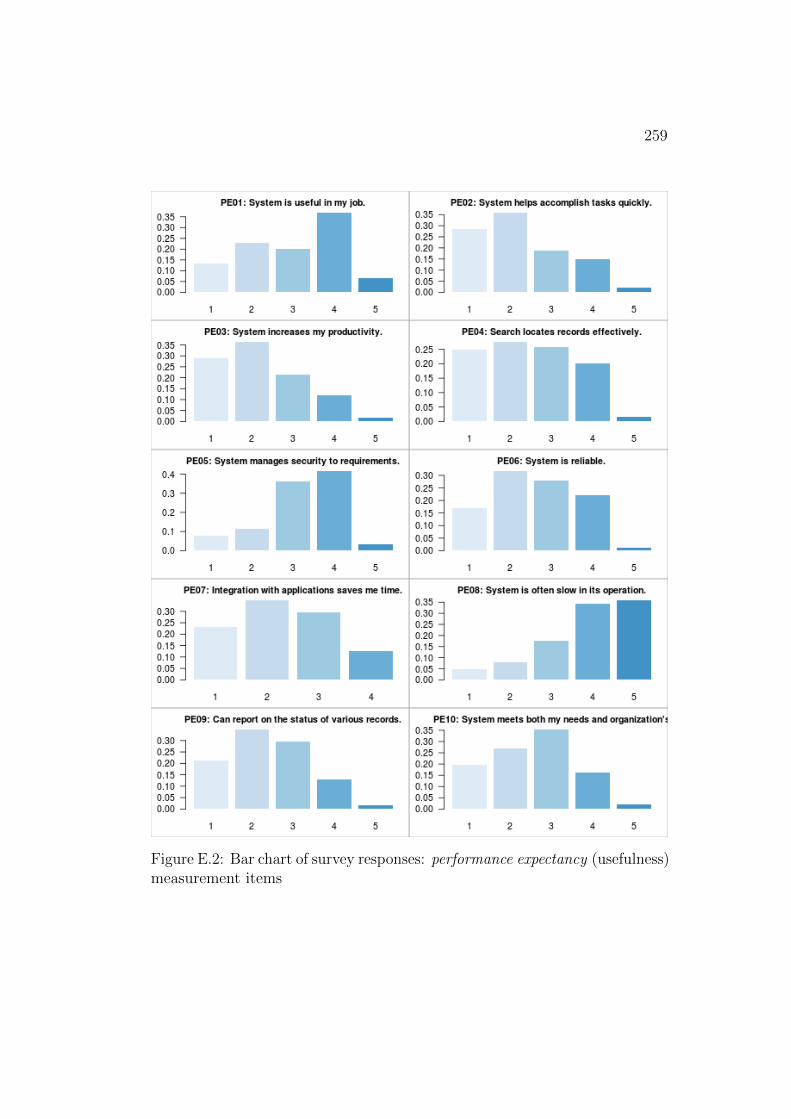
259
Figure E.2: Bar chart of survey responses: performance expectancy (usefulness)measurement items
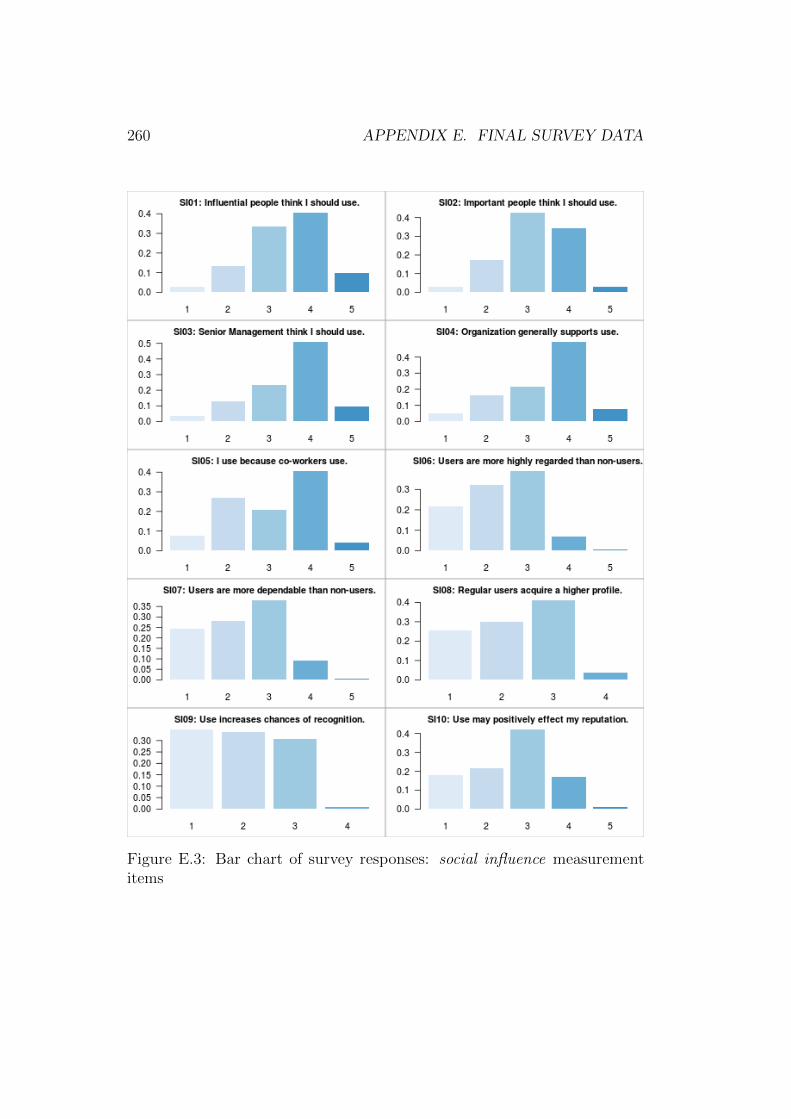
260 APPENDIX E. FINAL SURVEY DATA
Figure E.3: Bar chart of survey responses: social influence measurementitems
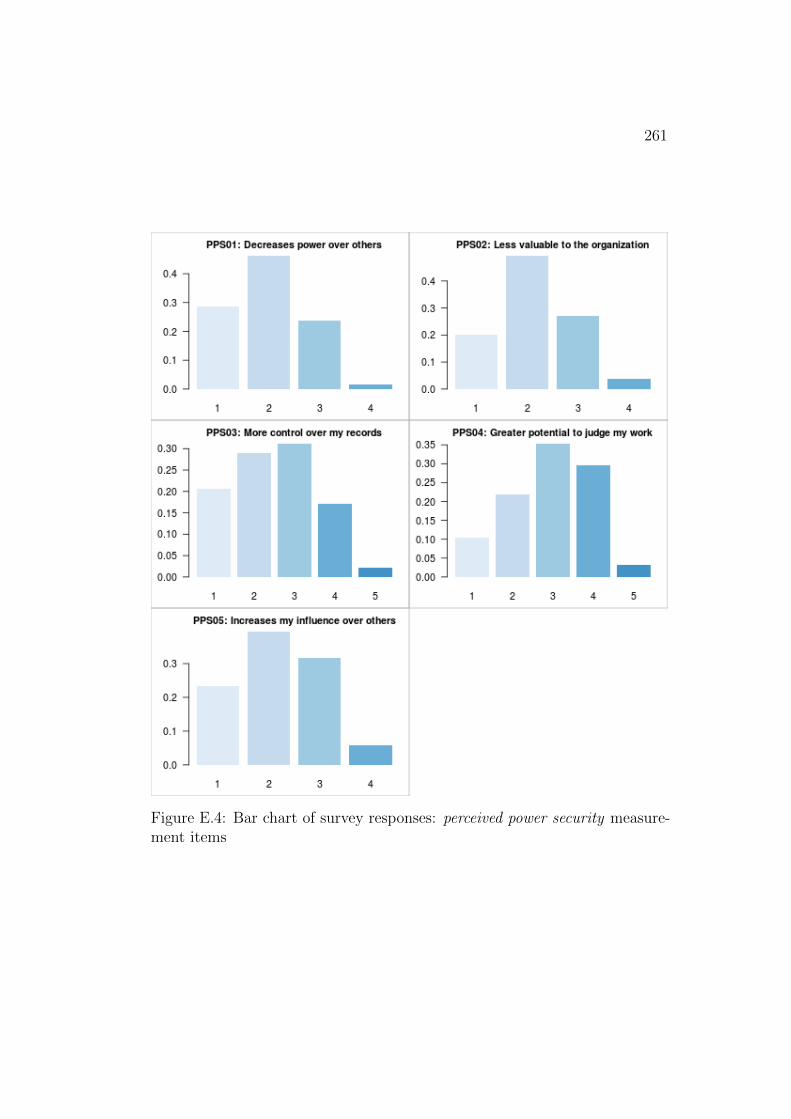
261
Figure E.4: Bar chart of survey responses: perceived power security measure-ment items
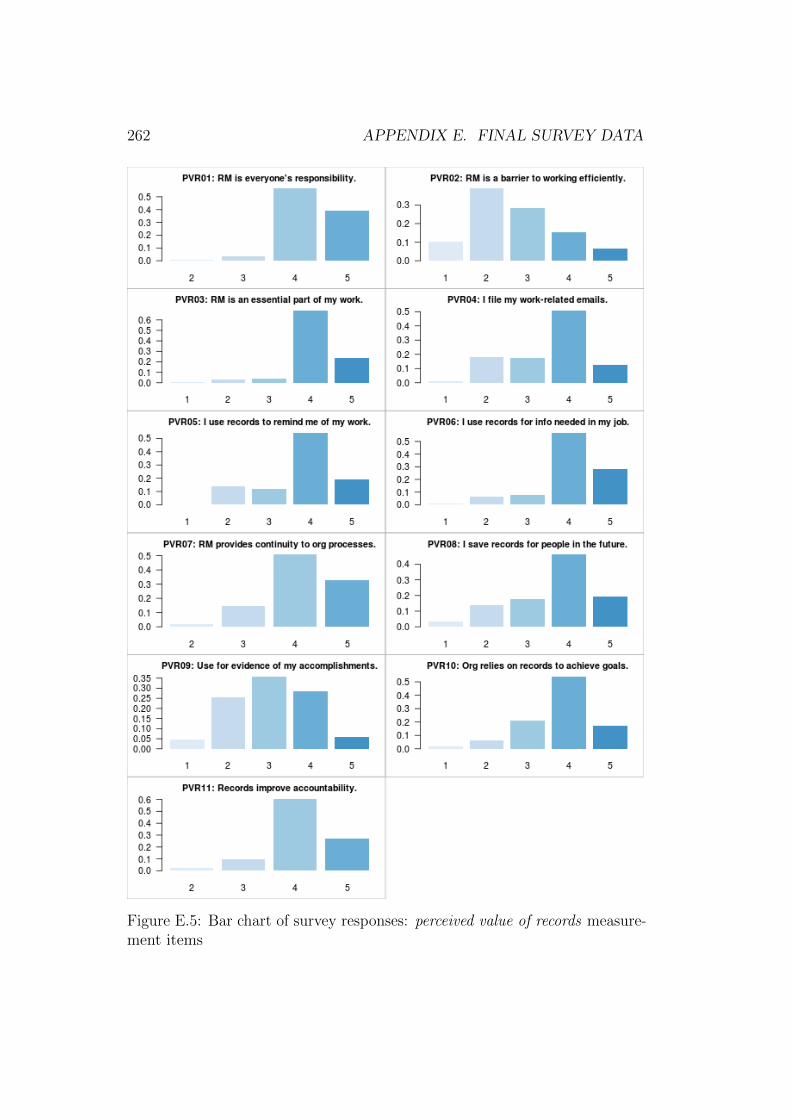
262 APPENDIX E. FINAL SURVEY DATA
Figure E.5: Bar chart of survey responses: perceived value of records measure-ment items
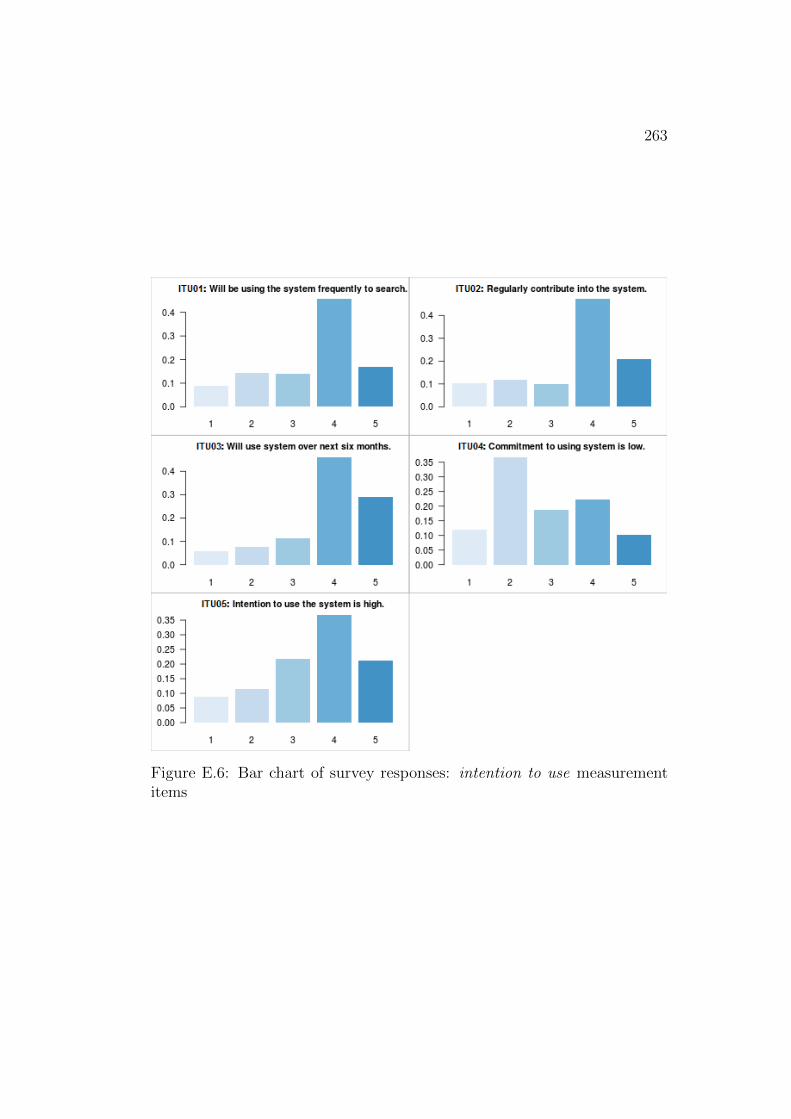
263
Figure E.6: Bar chart of survey responses: intention to use measurementitems

264 APPENDIX E. FINAL SURVEY DATA
Appendix F
Bootstrap Validation
The bootstrap validation consisted of a run using a resample rate of 200. Thetables on the following pages provide the bootstrap results and significancelevels for the following aspects of the model:
• Outer Model Validation
– Measurement Item Weights
– Measurement Item Loadings
• Inner Model Validation
– Paths (as specified in the model)
– Coefficients of Determination (R2)
Each table presents the original value that emerged from the initialPLS-PM analysis, and then compares that value to the Mean Bootstrappedvalue (Mean.Boot) from the bootstrapping sample. The standard error(Std.Error) is then presented to provide an indication of the standard de-viation of the mean. Finally, the lower percentiles (perc.025) and upperpercentiles (perc.975) of the 95% bootstrap confidence intervals are providedto indicate the significance.
265
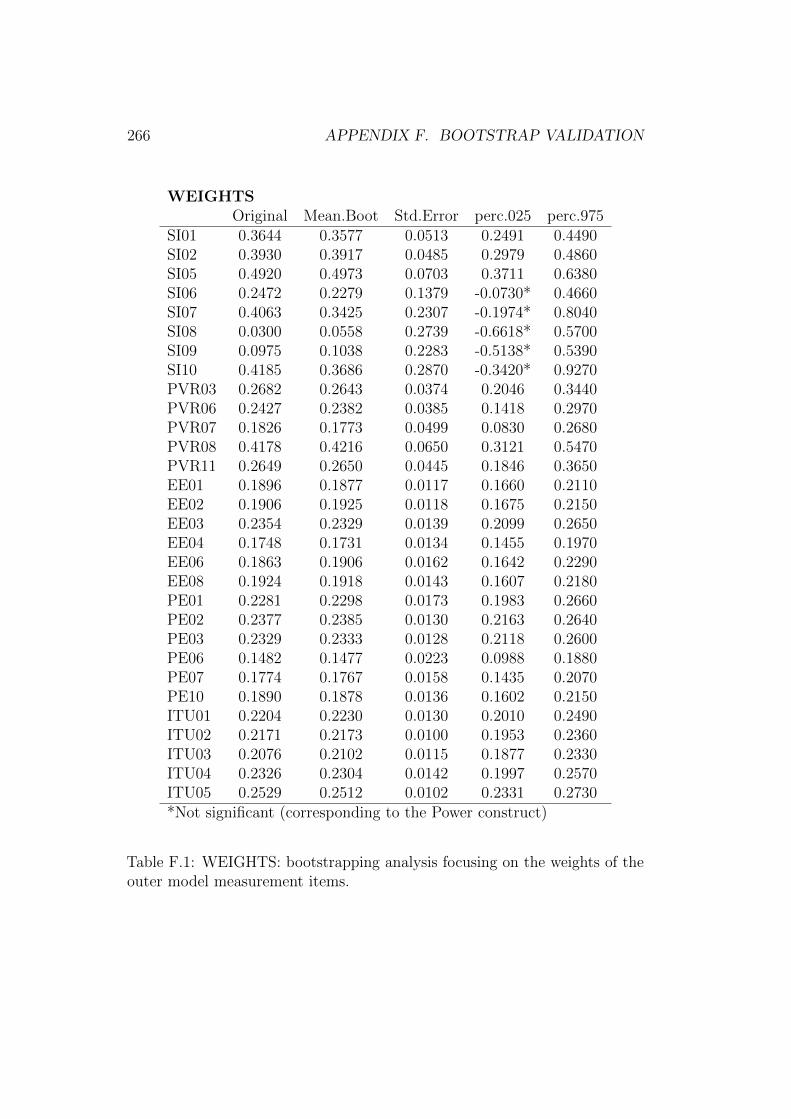
266 APPENDIX F. BOOTSTRAP VALIDATION
WEIGHTSOriginal Mean.Boot Std.Error perc.025 perc.975
SI01 0.3644 0.3577 0.0513 0.2491 0.4490SI02 0.3930 0.3917 0.0485 0.2979 0.4860SI05 0.4920 0.4973 0.0703 0.3711 0.6380SI06 0.2472 0.2279 0.1379 -0.0730* 0.4660SI07 0.4063 0.3425 0.2307 -0.1974* 0.8040SI08 0.0300 0.0558 0.2739 -0.6618* 0.5700SI09 0.0975 0.1038 0.2283 -0.5138* 0.5390SI10 0.4185 0.3686 0.2870 -0.3420* 0.9270PVR03 0.2682 0.2643 0.0374 0.2046 0.3440PVR06 0.2427 0.2382 0.0385 0.1418 0.2970PVR07 0.1826 0.1773 0.0499 0.0830 0.2680PVR08 0.4178 0.4216 0.0650 0.3121 0.5470PVR11 0.2649 0.2650 0.0445 0.1846 0.3650EE01 0.1896 0.1877 0.0117 0.1660 0.2110EE02 0.1906 0.1925 0.0118 0.1675 0.2150EE03 0.2354 0.2329 0.0139 0.2099 0.2650EE04 0.1748 0.1731 0.0134 0.1455 0.1970EE06 0.1863 0.1906 0.0162 0.1642 0.2290EE08 0.1924 0.1918 0.0143 0.1607 0.2180PE01 0.2281 0.2298 0.0173 0.1983 0.2660PE02 0.2377 0.2385 0.0130 0.2163 0.2640PE03 0.2329 0.2333 0.0128 0.2118 0.2600PE06 0.1482 0.1477 0.0223 0.0988 0.1880PE07 0.1774 0.1767 0.0158 0.1435 0.2070PE10 0.1890 0.1878 0.0136 0.1602 0.2150ITU01 0.2204 0.2230 0.0130 0.2010 0.2490ITU02 0.2171 0.2173 0.0100 0.1953 0.2360ITU03 0.2076 0.2102 0.0115 0.1877 0.2330ITU04 0.2326 0.2304 0.0142 0.1997 0.2570ITU05 0.2529 0.2512 0.0102 0.2331 0.2730*Not significant (corresponding to the Power construct)
Table F.1: WEIGHTS: bootstrapping analysis focusing on the weights of theouter model measurement items.

267
LOADINGSOriginal Mean.Boot Std.Error perc.025 perc.975
SI01 0.8180 0.8100 0.0462 0.7075 0.8880SI02 0.8450 0.8390 0.0419 0.7446 0.9080SI05 0.7520 0.7570 0.0470 0.6696 0.8410SI06 0.8570 0.7900 0.1748 0.2167 0.9200SI07 0.8730 0.7920 0.1907 0.1689 0.9450SI08 0.7550 0.7100 0.2119 0.0241* 0.9160SI09 0.7810 0.7290 0.1943 0.1376 0.9070SI10 0.8000 0.7110 0.2354 0.0261 0.9360PVR03 0.6980 0.6900 0.0507 0.5849 0.7780PVR06 0.7720 0.7640 0.0525 0.6411 0.8460PVR07 0.6710 0.6680 0.0682 0.4861 0.7720PVR08 0.7650 0.7720 0.0363 0.7016 0.8380PVR11 0.6920 0.6960 0.0592 0.5745 0.7940EE01 0.8460 0.8450 0.0218 0.8017 0.8860EE02 0.8920 0.8930 0.0185 0.8523 0.9250EE03 0.8900 0.8880 0.0175 0.8501 0.9170EE04 0.8550 0.8550 0.0230 0.8067 0.8960EE06 0.8050 0.8070 0.0281 0.7462 0.8570EE08 0.8340 0.8360 0.0262 0.7849 0.8810PE01 0.8150 0.8140 0.0228 0.7657 0.8540PE02 0.8900 0.8910 0.0190 0.8511 0.9210PE03 0.9040 0.9030 0.0107 0.8832 0.9230PE06 0.6620 0.6590 0.0625 0.5213 0.7570PE07 0.7800 0.7760 0.0389 0.6900 0.8360PE10 0.8220 0.8170 0.0280 0.7577 0.8630ITU01 0.8320 0.8310 0.0318 0.7671 0.8900ITU02 0.8940 0.8920 0.0172 0.8620 0.9270ITU03 0.9110 0.9110 0.0149 0.8808 0.9400ITU04 0.8550 0.8510 0.0312 0.7818 0.8970ITU05 0.9280 0.9270 0.0108 0.9038 0.9460*Not significant at the 95% confidence level.
Table F.2: LOADINGS: bootstrapping analysis focusing on the loadings ofthe outer model measurement items.

268 APPENDIX F. BOOTSTRAP VALIDATION
PATHS (specified in the model)Original Mean.Boot Std.Error perc.025 perc.975
SI → PE 0.1602 0.1592 0.0456 0.0674 0.2448SI → ITU 0.2228 0.2221 0.0642 0.0902 0.3329
POW → EE 0.1109 0.1100 0.1131 -0.2271* 0.2499POW → ITU -0.0653 0.0574 0.0642 -0.1907* 0.0635PV R → PE 0.0776 0.0885 0.0500 -0.0116* 0.1807PV R → ITU 0.4062 0.4093 0.0627 0.2930 0.5168EE → PE 0.6871 0.6830 0.0409 0.5986 0.7529EE → ITU 0.3032 0.3184 0.0766 0.1812 0.4804PE → ITU 0.0986 0.0787 0.0914 -0.1066* 0.2599
*Not significant
Table F.3: PATHS: bootstrapping analysis focusing on the inner model pathcoefficients.
RSQ (R-Squared)Original Mean.Boot Std.Error perc.025 perc.975
EE 0.012 0.025 0.019 0.000* 0.073PE 0.586 0.591 0.040 0.510 0.662ITU 0.516 0.538 0.053 0.435 0.637*Not significant
Table F.4: R-Squared: bootstrapping analysis focusing on the coefficient ofdetermination (R2) for the inner model’s endogenous variables.
Bibliography
Abdi, H. (2003). Multivariate analysis. Encyclopedia for research methods forthe social sciences. Thousand Oaks: Sage, 699–702. Retrieved February15, 2014, from http://www.utd.edu/∼Herve/Abdi-MultivariateAnalysis-pretty.pdf
Abdi, H. & Williams, L. (2010). Principal component analysis. Wiley Inter-disciplinary Reviews: Computational Statistics, 2 (4), 433–459.
Ackman, D. (2002, June 26). The WorldCom we hardly knew [Forbes.com].Retrieved April 24, 2011, from http://www.forbes.com/2002/06/26/0626topnews.html
Adams, D. A., Nelson, R. R., & Todd, P. A. (1992, June). Perceived usefulness,ease of use, and usage of information technology: a replication. MISQuarterly, 16 (2), 227–247.
Agourram, H. & Robson, B. (2006). Defining information systems success inCanada. Information Management & Computer Security, 14 (4), 300.doi:10.1108/09685220610690781
Ajzen, I. (1991). The theory of planned behavior. Organizational Behaviorand Human Decision Processes, 50 (2), 179–211.
Archives New Zealand. (2009). Digital continuity action plan: managing infor-mation for public sector efficiency. Archives New Zealand. Wellington,N.Z.
Archives New Zealand. (2011). Government Digital Archive Programme[Archives New Zealand: Advice on Records & Archiving]. RetrievedJuly 2, 2011, from http://archives.govt.nz/advice/government-digital-archive-programme
Ashton, C. & Reed, B. (2011, December 12). Reinventing records classification.Information & Records Management Annual (iRMA).
Atherton, A. & Elsmore, P. (2007). Structuring qualitative enquiry in man-agement and organization research: a dialogue on the merits of using
269
270 BIBLIOGRAPHY
software for qualitative data analysis. Qualitative Research in Organiza-tions and Management: An International Journal, 2 (1), 62–77.
Atherton, J. (1985). From life cycle to continuum: some thoughts on therecords management-archives relationship. Archivaria, 21, 43–51.
Auer, T. (1998, September). Quality of IS use. European Journal of Informa-tion Systems, 7 (3), 192–201. doi:10.1038/sj.ejis.3000305
Bagozzi, R. P. (1982). A field investigation of causal relations among cognitions,affect, intentions, and behavior. Journal of Marketing Research, 19 (4),562–583. doi:10.2307/3151727
Bailer-Jones, D. M. (2003, March). When scientific models represent. Inter-national Studies in the Philosophy of Science, 17 (1), 59.
Bailey, S. (2007). Taking the road less travelled by: the future of the archiveand records management profession in the digital age. Journal of theSociety of Archivists, 28 (2), 117–124.
Bailey, S. (2009). Forget electronic records management, it’s automatedrecords management that we desperately need. Records ManagementJournal, 19 (2), 91–97.
Barki, H. & Hartwick, J. (1994). Measuring user participation, user involve-ment, and user attitude. MIS Quarterly, 59–82.
Barkin Gary, W. & Stephen, R. (1977). An investigation of information systemutilization. Information & Management, 1 (1), 35–45.
Barkin, S. & Dickson, G. (1977). An investigation of information systemutilization. Information & Management, 1 (1), 35–45.
Benbasat, I. & Barki, H. (2007). Quo vadis TAM? Journal of the Associationfor Information Systems, 8 (4), 7.
Benfell, P. (2002). An integrated approach to managing electronic records.Records Management Journal, 12 (3), 94–97.
Bhaskar, R. (1975). A realist theory of science. Leeds, England: Leeds BooksLimited.
Bohrnstedt, G. W. (1970). Reliability and validity assessment in attitudemeasurement. In G. Summers (Ed.), Attitude measurement (pp. 80–99).Chicago: Rand McNally.
Bollen, K. & Lennox, R. (1991, September). Conventional wisdom on measure-ment: a structural equation perspective. Psychological Bulletin, 110 (2),305–314. doi:http://dx.doi .org.helicon.vuw.ac.nz/10.1037/0033-2909.110.2.305
Boudreau, M. C., Gefen, D., & Straub, D. W. (2001). Validation in informationsystems research: a state-of-the-art assessment. MIS Quarterly, 1–16.
BIBLIOGRAPHY 271
Boztepe, S. (2007). User value: competing theories and models. InternationalJournal of Design, 1 (2), 55–63.
Braun, V. & Clarke, V. (2006). Using thematic analysis in psychology. Quali-tative Research in Psychology, 3 (2), 77–101.
Brown, S. A., Massey, A. P., Montoya-Weiss, M. M., & Burkman, J. R. (2002).Do I really have to? User acceptance of mandated technology. EuropeanJournal of Information Systems, 11 (4), 283–295.
Bruce, H. (2005, April). Personal anticipated information need. InformationResearch, 10 (3).
Burrell, G. & Morgan, G. (1979). Sociological paradigms and organisationalanalysis. London: Heinemann.
Burton-Jones, A. & Straub, D. W. (2006). Reconceptualizing system usage:an approach and empirical test. Information Systems Research, 17 (3),228.
Byrne, M. (2001a). Data analysis strategies for qualitative research. AORN,74 (6), 904–905.
Byrne, M. (2001b). Interviewing as a data collection method. AORN, 74 (2),233–235.
Cain, P. (2002). Model requirements for the management of electronic records(MoReq): a critical evaluation. Records Management Journal, 12 (1),14–18.
Chang, S.-J., van Witteloostuijn, A., & Eden, L. (2010, February). From theeditors: common method variance in international business research.Journal of International Business Studies, 41 (2), 178–184. doi:10.1057/jibs.2009.88
Chang, T.-Z. (2013, June). Strategies for improving data reliability for onlinesurveys: a case study. International Journal of Electronic CommerceStudies, 121–130. doi:10.7903/ijecs.1121
Chin, W. W. (1998a). Commentary: issues and opinion on structural equationmodeling. MIS Quarterly, vii–xvi.
Chin, W. W. (1998b). The partial least squares approach for structuralequation modeling. In Modern methods for business research (pp. 295–336). Methodology for business and management. Mahwah, NJ, US:Lawrence Erlbaum Associates Publishers.
Chin, W. W. (2010a). Bootstrap cross-validation indices for PLS path modelassessment. In Handbook of partial least squares (pp. 83–97). SpringerHandbooks of Computational Statistics. Springer: Handbooks of Com-putational Statistics.
272 BIBLIOGRAPHY
Chin, W. W. (2010b). How to write up and report PLS analyses. In Hand-book of partial least squares (pp. 655–690). Springer: Handbooks ofComputational Statistics.
Chin, W. W., Gopal, A., & Salisbury, W. D. (1997). Advancing the the-ory of adaptive structuration: the development of a scale to measurefaithfulness of appropriation. Information Systems Research, 8, 342–367.
Choo, C. W., Bergeron, P., Detlor, B., & Heaton, L. (2008). Informationculture and information use: an exploratory study of three organizations.Journal of the American Society for Information Science and Technology,59 (5), 792–804. doi:10.1002/asi.20797
Churchill Jr, G. A. (1979). A paradigm for developing better measures ofmarketing constructs. Journal of Marketing Research, 16, 64–73. doi:10.2307/3150876
Clever recordkeeping metadata project - final report. (2007, August). MonashUniversity. Melbourne, Australia.
Collopy, F. (1996). Biases in retrospective self-reports of time use: an empiricalstudy of computer users. Management Science, 42 (5), 758–767.
Compeau, D. R. & Higgins, C. A. (1995). Computer self-efficacy: developmentof a measure and initial test. MIS Quarterly, 19 (2), 189–211. doi:10.2307/249688
Compeau, D. R., Higgins, C. A., & Huff, S. (1999, June 1). Social cognitivetheory and individual reactions to computing technology: a longitudinalstudy. MIS Quarterly, 23 (2), 145–158. doi:10.2307/249749
Cook, T. (1994). Electronic records, paper minds: the revolution in informationmanagement and archives in the post-custodial and post-modernist era.Archives and Manuscripts, 22 (2), 300–328.
Cook, T. (1997). The impact of David Bearman on modern archival thinking:an essay of personal reflection and critique. Archives and MuseumInformatics, 11 (1), 15–37.
Corbin, J. & Strauss, A. (2008). Basics of qualitative research: techniques andprocedures for developing grounded theory. London, UK: Sage Publica-tions, Inc.
Creswell, J. W. (2008). Research design: qualitative, quantitative, and mixedmethods approaches (3rd ed.). Los Angeles, CA: Sage Publications, Inc.
CRKM Project. (2011, April 3). (CRKM) clever recordkeeping metadataproject. Retrieved from http://www.infotech.monash.edu.au/research/groups/rcrg/crkm/
Cullen, C. T., Hirtle, P. B., Levy, D., Lynch, C. A., & Rothenberg, J. (2000,May). Authenticity in a digital environment. Washington, D.C.: Council
BIBLIOGRAPHY 273
on Library and Information Resources. Retrieved from http://www.clir.org
Cunningham, A. (2011). Good digital records don’t just “happen”: embeddingdigital recordkeeping as an organic component of business processesand systems. Archivaria, 71, 21–34.
Davis, F. D. (1986). A technology acceptance model for empirically testingnew end-user information systems: theory and results (PhD Thesis,Massachusetts Institute of Technology, Sloan School of Management,Massachusetts). Retrieved from http://hdl.handle.net/1721.1/15192
Davis, F. D. (1989). Perceived usefulness, perceived ease of use, and useracceptance of information technology. MIS Quarterly, 13 (3), 319–340.
Davis, F. D., Bagozzi, R. P., & Warshaw, P. R. (1989). User acceptance of com-puter technology: a comparison of two theoretical models. ManagementScience, 35 (8), 982–1003.
Deetz, S. (1996). Describing differences in approaches to organization science:rethinking Burrell and Morgan and their legacy. Organization Science,7 (2), 191–207.
DeLone, W. H. & McLean, E. R. (1992, March). Information systems success:the quest for the dependent variable. Information Systems Research,3 (1), 60–95. doi:10.1287/isre.3.1.60
DeLone, W. H. & McLean, E. R. (2003). The DeLone and McLean model ofinformation systems success: a ten-year update. Journal of ManagementInformation Systems, 19 (4), 9–30.
Dictionary.com. (2014). Dictionary.com Unabridged [Random House, Inc.].Retrieved March 26, 2014, from http://dictionary.reference.com/browse/useful
Diez, R. (2002). A glossary for multilevel analysis. Journal of Epidemiologyand Community Health, 56 (8), 588.
Digital Recordkeeping Standard. (2010, August). Retrieved from http://archives.govt.nz/advice/continuum-resource-kit/continuum-publications-html/s5-digital-recordkeeping-standard
Dillman, D. A. (2007). Mail and internet surveys: the tailored design method—2007 update with new internet, visual, and mixed-mode guide (2nd ed.).Hoboken, New Jersey: John Wiley & Sons.
Dillman, D. A. (2009). Internet, mail, and mixed-mode surveys: the tailoreddesign method (3rd ed.). Hoboken, New Jersey: Wiley & Sons.
Dillon, W. R., Madden, T. J., & Firtle, N. H. (1990). Marketing research in amarketing environment (3rd ed.). Burr Ridge, IL: Irwin Homewood.
274 BIBLIOGRAPHY
Dishaw, M. T. & Strong, D. M. (1999, July). Extending the technologyacceptance model with task-technology fit constructs. Information &Management, 36 (1), 9–21. doi:10.1016/S0378-7206(98)00101-3
DoD 5015.02-STD. (2007, April 25). DoD Standard – Electronic Records Man-agement Software Applications Design Criteria Standard. Departmentof Defense (USA).
Dudding, A. & Mayo, K. (2010a, July 23). Government recordkeeping surveyreport 2010 — local authorities (No. NZ200187). Archives New Zealand.Wellington, New Zealand.
Dudding, A. & Mayo, K. (2010b, July 23). Government recordkeeping surveyreport 2010 — public offices (No. NZ200187). Archives New Zealand.Wellington, New Zealand.
Duranti, L. (1996, November). Archives as a place. Archives and Manuscripts,24 (2), 242–255.
Duranti, L. (2010). Concepts and principles for the management of elec-tronic records, or records management theory is archival diplomatics(republished - 1999). Records Management Journal, 20 (1), 78–95.
Duranti, L. (2012). Records in the cloud: towards InterPARES-trust. Fon-dazione Rinascimento Digitale. The University of British Columbia,Canada. Retrieved July 6, 2014, from http://93.63.166.138:8080/dspace/handle/2012/97
Duranti, L. & Blanchette, J. (2004). The authenticity of electronic records:the InterPARES approach. In Proceedings of IS&T 2004 archivingconference (pp. 215–220).
Evans, J. & Lindberg, L. (2004). Describing and analyzing the recordkeepingcapabilities of metadata sets. In Proceedings of the 2004 internationalconference on dublin core and metadata applications: metadata acrosslanguages and cultures (p. 9).
Evans, J., McKemmish, S., & Bhoday, K. (2006, March). Create once, usemany times: the clever use of recordkeeping metadata for multiplearchival purposes. Archival Science, 5 (1), 17–42. doi:10.1007/s10502-005-4625-x
Evans, J., Reed, B., & McKemmish, S. (2008). Interoperable data: sustainableframeworks for creating and managing recordkeeping metadata. RecordsManagement Journal, 18 (2), 115–129.
Faiks, A. & Hyland, N. (2000). Gaining user insight: a case study illustratingthe card sort technique. College & research libraries, 61 (4), 349–357.Retrieved February 18, 2013, from http://crl.acrl.org/content/61/4/349.short
BIBLIOGRAPHY 275
Fereday, J. & Muir-Cochrane, E. (2008). Demonstrating rigor using thematicanalysis: a hybrid approach of inductive and deductive coding and themedevelopment. International Journal of Qualitative Methods, 5 (1), 80–92.
Fidock, J. & Carroll, J. (2009, December 2). Combining variance and processresearch approaches to understand system use. In Combining varianceand process research approaches (pp. 235–245). 20th Australasian Con-ference on Information Systems. Melbourne, Australia.
Fishbein, M. & Ajzen, I. (1975). Belief, attitude, intention, and behavior: anintroduction to theory and research. Reading, MA: Addison-Wesley Pub.Co.
Foddy, W. (1998, August 1). An empirical evaluation of in-depth probes usedto pretest survey questions. Sociological Methods & Research, 27 (1),103–133. doi:10.1177/0049124198027001003
Fresko, M. (2010, September). MoReq2010 - a new world standard for com-pliance & best practice information management for all sectors. Infor-mation and Records Management Society Bulletin, (157), 18–20.
Garver, M. & Mentzer, J. (1999). Logistics research methods: employingstructural equation modeling to test for construct validity. Journal ofBusiness Logistics, 20, 33–58.
Giddens, A. (1984). The constitution of society. Berkeley: University of Cali-fornia Press.
Gilliland, A., Rouche, N., Lindberg, L., & Evans, J. (2005). Towards a 21stcentury metadata infrastructure supporting the creation, preservationand use of trustworthy records: developing the InterPARES 2 metadataschema registry. Archival Science, 5 (1), 43–78. doi:10.1007/s10502-005-9000-4
Ginzberg, M. J. (1981, June). Key recurrent issues in the MIS implementationprocess. MIS Quarterly, 5 (2), 47–59. doi:10.2307/249223
Goodhue, D. L. (2007, April). Comment on Benbasat and Barki’s ”Quo VadisTAM” article. Journal of the Association for Information Systems, 8 (4),220–222.
Goodhue, D. L. & Thompson, R. L. (1995, June). Task-technology fit andindividual performance. MIS Quarterly, 19 (2), 213–236. doi:10.2307/249689
Greene, J. C. & Caracelli, V. J. (1997). Defining and describing the paradigm is-sue in mixed-method evaluation. New Directions for Evaluation, 1997 (74),5–17.
276 BIBLIOGRAPHY
Greene, J. C., Caracelli, V. J., & Graham, W. F. (1989). Toward a conceptualframework for mixed-method evaluation designs. Educational Evaluationand Policy Analysis, 11 (3), 255–274.
Gregor, S. (2006, September). The nature of theory in information systems.MIS Quarterly, 30 (3), 611–642.
Hackbarth, G., Grover, V., & Yi, M. Y. (2003). Computer playfulness andanxiety: positive and negative mediators of the system experience effecton perceived ease of use. Information & management, 40 (3), 221–232.
Haenlein, M. & Kaplan, A. M. (2004). A beginner’s guide to partial leastsquares analysis. Understanding Statistics, 3 (4), 283–297.
Hanafi, M. (2007, July 1). PLS path modelling: computation of latent variableswith the estimation mode b. Computational Statistics, 22 (2), 275–292.doi:10.1007/s00180-007-0042-3
Hardgrave, B. C. & Johnson, R. A. (2003). Toward an information systemsdevelopment acceptance model: the case of object-oriented systemsdevelopment. IEEE Transactions on Engineering Management, 50 (3),322–336.
Harries, S. (2009). Managing records, making knowledge and good governance.Records Management Journal, 19 (1), 16–25.
Hasan, R., Sion, R., & Winslett, M. (2007). Introducing secure provenance:problems and challenges. In Proceedings of the 2007 ACM workshop onstorage security and survivability (p. 18).
Helberg, C. (1995). Pitfalls of data analysis (or how to avoid lies and damnedlies). (Vol. 5, p. 2005). Third international applied statistics in industry.Dallas, TX.
Hendrickson, A. R., Massey, P. D., & Cronan, T. P. (1993, June). On thetest-retest reliability of perceived usefulness and perceived ease of usescales. MIS Quarterly, 17 (2), 227–230.
Henseler, J. & Sarstedt, M. (2013, April 1). Goodness-of-fit indices for partialleast squares path modeling. Computational Statistics, 28 (2), 565–580.doi:10.1007/s00180-012-0317-1
Hinkin, T. (1998). A brief tutorial on the development of measures for use insurvey questionnaires. Organizational Research Methods, 1, 104.
Hinkle, V. (2008, October). Card-sorting: what you need to know about ana-lyzing and interpreting card sorting results. Software Usability ResearchLaboratory, Wichita State University. Usability News, 10 (2). RetrievedFebruary 19, 2013, from http://tinyurl.com/logczk5
Hoe, S. (2008). Issues and procedures in adopting structural equation modelingtechnique. Journal of applied quantitative methods, 3 (1), 76–83.
BIBLIOGRAPHY 277
Holbrook, M. (Ed.). (1999). Consumer value: a framework for analysis andresearch. London: Routledge.
Holtzman, M., Venuti, E., & Fonfeder, R. (2003, April 3). Enron and theraptors [The CPA journal]. Retrieved April 25, 2011, from http://www.nysscpa.org/cpajournal/2003/0403/features/f042403.htm
Hox, J. & Bechger, T. (1998). An introduction to structural equation modeling.Family Science Review, 11, 354–373.
Hunt, S. D., Sparkman Jr., R. D., & Wilcox, J. B. (1982, May). The pretest insurvey research: issues and preliminary findings. Journal of MarketingResearch (JMR), 19 (2), 269–273.
Hussein, R., Karim, N. S. A., & Selamat, M. H. (2007). The impact oftechnological factors on information systems success in the electronic-government context. Business Process Management Journal, 13 (5),613.
Ince, D. C., Hatton, L., & Graham-Cumming, J. (2012, February 22). Thecase for open computer programs. Nature, 482 (7386), 485–488. doi:10.1038/nature10836
InterPARES Project. (2011). InterPARES project. Retrieved April 3, 2011,from http://www.interpares.org/
ISO 15489.1. (2002). ISO Standard: Records Management – Part 1: General.Standards Australia.
ISO 23081-1. (2006). ISO 23081-1 Information and Documentation—RecordsManagement Processes—Metadata for Records—Part 1: Principles.(2006). International Organization for Standardization.
Jackson, D. N. & Paunonen, S. V. (1985). Construct validity and the pre-dictability of behavior. Journal of Personality and Social Psychology,49, 554–570.
Johnston, G. P. & Bowen, D. V. (2005, December 1). The benefits of electronicrecords management systems: a general review of published and someunpublished cases. Records Management Journal, 15 (3), 131–140. doi:10.1108/09565690510632319
Jones, M. & Karsten, H. (2008, March). Giddens’s structuration theory andinformation systems research. MIS Quarterly, 32 (1), 127–157.
Jones, M., Orlikowski, W. J., & Munir, K. (2004). Structuration theory andinformation systems: a critical reappraisal. In J. Mingers & L. Willcocks(Eds.), Social theory and philosophy for information systems (pp. 297–328). Chichester, UK: John Wiley & Sons Ltd.
278 BIBLIOGRAPHY
Jones, S. (2012, August). eGovernment document management system: acase analysis of risk and reward. International Journal of InformationManagement, 32 (4), 396–400. doi:10.1016/j.ijinfomgt.2012.04.002
Joseph, P. (2008). EDRMS 101: the basics. iRMA: Information and RecordsManagement Annual, 9–26.
Joseph, P., Debowski, S., & Goldschmidt, P. (2012, March 23). Paradigmshifts in recordkeeping responsibilities: implications for ISO 15489’simplementation. Records Management Journal, 22 (1), 57–75. doi:10.1108/09565691211222108
Joseph, P., Debowski, S., & Goldschmidt, P. (2013). Search behaviour inelectronic document and records management systems: an exploratoryinvestigation and model. Information Research – an International Elec-tronic Journal, 18 (1).
Karahanna, E. & Straub, D. W. (1999, April 5). The psychological originsof perceived usefulness and ease-of-use. Information & Management,35 (4), 237–250. doi:10.1016/S0378-7206(98)00096-2
Karahanna, E., Straub, D. W., & Chervany, N. L. (1999, June). Informationtechnology adoption across time: a cross-sectional comparison of pre-adoption and post-adoption beliefs. MIS Quarterly, 23 (2), 183–213.
Kettunen, K. & Henttonen, P. (2010). Missing in action? content of recordsmanagement metadata in real life. Library & Information Science Re-search, 32 (1), 43–52.
Kim, S. S. & Malhotra, N. (2005, May). A longitudinal model of continuedIS use: an integrative view of four mechanisms underlying postadoptionphenomena. Management Science, 51 (5), 741–755.
Klein, J., Connell, C., & Jasimuddin, S. (2007, May). Who needs memory? Thecase for the Markovian organisation. Knowledge Management Research& Practice, 5 (2), 110–116. doi:10.1057/palgrave.kmrp.8500130
Klein, K. J. & Kozlowski, S. W. (2000). From micro to meso: critical stepsin conceptualizing and conducting multilevel research. OrganizationalResearch Methods, 3 (3), 211–236.
Kling, R. (1980). Social analyses of computing: theoretical perspectives inrecent empirical research. ACM Computing Surveys (CSUR), 12 (1),61–110.
Lappin, J. (2010). What will be the next records management orthodoxy?Records Management Journal, 20 (3), 252–264.
Lappin, J. (2011a, May 6). How MoReq 2010 differs from previous electronicrecords management (ERM) system specifications [Thinking records].Retrieved October 5, 2011, from http://thinkingrecords.co.uk/2011/
BIBLIOGRAPHY 279
05/06/how-moreq- 2010- differs - from- previous- electronic - records-management-erm-system-specifications/
Lappin, J. (2011b, October 19). Is SharePoint a records management system? -podcast [Thinking records]. Retrieved 2014, from http://thinkingrecords.co .uk/2011/10/19/is - sharepoint- a- records-management- system-podcast/
Lee, A. (2014, June 26). Keynote address. 18th Pacific Asia Conference onInformation Systems (PACIS 2014), Chengdu, Sichuan, China.
Lee, Y., Kozar, K. A., & Larsen, K. R. T. (2003, September). The technologyacceptance model: past, present, and future. Communications of theAssociation for Information Systems, 12, 752–780.
Lewellen, M. (2013, July 26). Factors influencing employees’ intention to con-tribute to an electronic recordkeeping system. New Zealand InformationSystems Doctoral Consortium (NZISDC 2013). Auckland, New Zealand.
Lewellen, M., Hooper, V., & Oliver, G. (2013, December 4). Factors influ-encing employees’ intention to use an electronic recordkeeping system:development of a valid survey instrument. 24th Australasian Conferenceon Information Systems (ACIS 2013). Melbourne, Australia.
Lewellen, M., Hooper, V., & Oliver, G. (2014a, December). The impactof knowledge interpretation and organizational context on the useof electronic recordkeeping systems. 25th Australasian Conference onInformation Systems (ACIS 2014). Auckland University of Technology,Auckland, New Zealand: ACIS.
Lewellen, M., Hooper, V., & Oliver, G. (2014b, June 24). Unpacking thesubjective norm: applying structuration theory to traditional measuresof social influence. (p. 11). 18th Pacific Asia Conference on InformationSystems (PACIS 2014). Chengdu, China.
Lewis, B. R., Templeton, G. F., & Byrd, T. A. (2005, December). A method-ology for construct development in MIS research. European Journal ofInformation Systems, 14 (4), 388–400. doi:http://dx.doi.org.helicon.vuw.ac.nz/10.1057/palgrave.ejis.3000552
Li, Z., Bao-wei, L., & Ye-zhuang, T. (2007, August). Empirical study onorganizational memory constructive factors. (pp. 1487–1492). 2007 in-ternational conference on management science & engineering. Harbin,P.R. China: ICMSE. doi:10.1109/ICMSE.2007.4422053
Li, Z., YeZhuang, T., & ZhongYing, Q. (2004). An empirical study on theimpact of organizational memory on organizational performance inmanufacturing companies. In The 37th annual Hawaii international
280 BIBLIOGRAPHY
conference on system sciences (p. 10). Koloa, Kauai, Hawaii: IEEEComputer Society.
Lips, M. & Rapson, A. (2009, November). Emerging records management in21st century New Zealand Government—Part 2. Victoria University ofWellington. Wellington, New Zealand.
Lips, M. & Rapson, A. (2010). Exploring public recordkeeping behaviorsin wiki-supported public consultation activities in the New Zealandpublic sector. In 2010 43rd Hawaii international conference on systemsciences (pp. 1–10). HICSS. Koloa, Kauai, Hawaii: IEEE ComputerSociety. doi:10.1109/HICSS.2010.453
Lips, M., Rapson, A., & Hooper, T. (2008, October 23). E-mail managementknowledge and recordkeeping behaviours of New Zealand public servants.In 4th international conference on e-government (p. 273). Melbourne,Australia.
Lucas Jr, H. C. (1978, June). Empirical evidence for a descriptive model ofimplementation. MIS Quarterly, 2 (2), 27–42. doi:10.2307/248939
Lucas Jr, H. C. & Spitler, V. K. (1999). Technology use and performance: afield study of broker workstations. Decision Sciences, 30 (2), 291–311.
MacNeil, H. (2002). Providing grounds for trust II: the findings of the au-thenticity task force of InterPARES. Archivaria, 24–58.
MacNeil, H. (2004). Contemporary archival diplomatics as a method of inquiry:lessons learned from two research projects. Archival Science, 4 (3), 199–232.
Maguire, R. (2005). Lessons learned from implementing an electronic recordsmanagement system. Records Management Journal, 15 (3), 150–157.doi:10.1108/09565690510632337
Malhotra, M. & Grover, V. (1998, July). An assessment of survey research inPOM: from constructs to theory. Journal of Operations Management,16 (4), 407–425. doi:10.1016/S0272-6963(98)00021-7
Martinko, M. J., Henry, J. W., & Zmud, R. W. (1996). An attributionalexplanation of individual resistance to the introduction of informationtechnologies in the workplace. Behaviour & Information Technology,15 (5), 313–330.
Mathieson, K. (1991). Predicting user intentions: comparing the technologyacceptance model with the theory of planned behavior. Informationsystems research, 2 (3), 173–191. doi:10.1287/isre.2.3.173
McCoy, S., Galletta, D. F., & King, W. R. (2007). Applying TAM acrosscultures: the need for caution. European Journal of Information Systems,16 (1), 81–90.
BIBLIOGRAPHY 281
McKemmish, S. (1997). Yesterday, today and tomorrow: a continuum ofresponsibility. In Preserving yesterday, managing today and challengingtomorrow: proceedings 14th national convention RMAA, 1997 (p. 19).
McKemmish, S., Acland, G., Ward, N., & Reed, B. (1999). Describing recordsin context in the continuum: the australian recordkeeping metadataschema. Archivaria, 48, 3–43.
Melville, N., Kraemer, K., & Gurbaxani, V. (2004). Information technologyand organizational performance: an integrative model of IT businessvalue. MIS Quarterly, 28 (2), 283–322.
Misangyi, V. F., Elms, H., Greckhamer, T., & Lepine, J. A. (2006, June).A new perspective on a fundamental debate: a multilevel approach toindustry, corporate, and business unit effects. Strategic ManagementJournal, 27 (6), 571–590.
Mishina, T., Yoshihama, S., & Kudo, M. (2007). Fine-grained sticky prove-nance architecture for office documents. In Proceedings of the security2nd international conference on advances in information and computersecurity (pp. 336–351).
Moore, G. C. & Benbasat, I. (1991). Development of an instrument to mea-sure the perceptions of adopting an information technology innovation.Information Systems Research, 2 (3), 192–222.
Moreau, L., Groth, P., Miles, S., Vazquez-Salceda, J., Ibbotson, J., Jiang, S.,. . . Tan, V. (2008). The provenance of electronic data. Communicationsof the ACM, 51 (4), 52–58.
MoReq2010. (2011, June 6). MoReq2010 – Modular Requirements for RecordsSystems. DLM Forum Foundation.
NARA. (2005). US National Archives and Records Administration Guidanceon Managing Web Records: What Are the Characteristics of TrustworthyRecords? Retrieved December 21, 2013, from http://www.archives.gov/records-mgmt/policy/managing-web-records.html
National Archives of Australia. (2001). DIRKS: designing and implementingrecordkeeping systems manual. Retrieved April 24, 2011, from http://www.naa.gov.au/records-management/publications/dirks-manual.aspx
Nguyen, L. T. & Swatman, P. (2007). EDMS, ERMS, ECMS or EDRMS:fighting through the acronyms towards a strategy for effective corporaterecords management. (pp. 790–800). 18th Australasian Conference onInformation Systems. Toowoomba, Australia,
282 BIBLIOGRAPHY
Nguyen, L. T., Swatman, P., & Fraunholz, B. (2008a). Australian public sectoradoption of EDRMS: a preliminary survey. Australasia conference oninformation systems. Christchurch, New Zealand.
Nguyen, L. T., Swatman, P., & Fraunholz, B. (2008b, June). Standing on theshoulders of giants: are ERP success factors relevant for EDRMS im-plementation? In eCollaboration: overcoming boundaries through multi-channel interaction (pp. 523–536). The 21st Bled eConference. Bled,Slovenia.
Nguyen, L. T., Swatman, P., & Fraunholz, B. (2009, December). EDRMSimplementations in the Australian public sector. In 20th AustralasianConference on Information Systems (915(14)). EDRMS in the AustralianPublic Sector. Melbourne, Australia.
Oliver, G. (2008). Information culture: exploration of differing values andattitudes to information in organisations. Journal of Documentation,64 (3), 363.
Oliver, G., Evans, J., Reed, B., & Upward, F. (2009). Achieving the rightbalance: recordkeeping informatics, Part 1. InfoRMAA Quarterly: Offi-cial Bulletin of the Records Management Association of Australia, The,25 (4), 18–21.
Oliver, G., Evans, J., Reed, B., & Upward, F. (2010). Achieving the rightbalance: recordkeeping informatics, Part 2. InfoRMAA Quarterly: Offi-cial Bulletin of the Records Management Association of Australia, The,26 (1), 42–44, 52.
Oliver, G. & Foscarini, F. (2014). Records management and informationculture: tackling the people problem. London: Facet Publishing.
Olivera, F. (2000). Memory systems in organizations: an empirical investiga-tion of mechanisms for knowledge collection, storage and access. Journalof Management Studies, 37 (6), 811–832.
Ong, C. S., Lai, J. Y., Wang, Y. M., & Wang, S. W. (2005). An understandingof power issues influencing employees’ acceptance of KMS: an empiricalstudy of Taiwan semiconductor manufacturing companies. The 38thHawaii International Conference on System Sciences. Koloa, Kauai,Hawaii.
Orlikowski, W. J. (1992). The duality of technology: rethinking the conceptof technology in organizations. Organization Science, 3 (3), 398–427.
Pederson, A. (2003). Understanding ourselves and others: Australian archivistsand temperament. Archival Science, 3 (3), 223–274. doi:10.1007/s10502-004-4039-1

BIBLIOGRAPHY 283
Peter, J. P. (1981). Construct validity: a review of basic issues and marketingpractices. Journal of Marketing Research, 18 (2), 133–145.
Pinsonneault, A. & Kraemer, K. L. (1993). Survey research methodology inmanagement information systems: an assessment. Journal of Manage-ment Information Systems, 10 (2), 105.
Pittsburgh Project. (1993). Pittsburgh project. Retrieved September 2, 2010,from http://www.sis.pitt.edu/∼bcallery/pgh/MainPage.htm
Podsakoff, P. M., MacKenzie, S. B., Lee, J.-Y., & Podsakoff, N. P. (2003).Common method biases in behavioral research: a critical review of theliterature and recommended remedies. Journal of applied psychology,88 (5), 879.
Polfreman, M. & Rajbhandari, S. (2008). MetaTools-Investigating metadatageneration tools-final report.
Poole, M. S. & DeSanctis, G. (2004). Structuration theory in informationsystems research: methods and controversies. In M. Whitman & A.Woszczynski (Eds.), The Handbook of Information Systems Research(pp. 206–249). Idea Group Publishing.
Priest, H., Roberts, P., & Woods, L. (2002). An overview of three differentapproaches to the interpretation of qualitative data. part 1: theoreticalissues. Nurse Researcher, 10 (1), 30.
Principles and Functional Requirements for Records in Electronic Office En-vironments. (2008). Principles and functional requirements for recordsin electronic office environments – module 2: guidelines and functionalrequirements for electronic records management systems. (2008). Inter-national Council on Archives.
Proctor, R. W. (2005). Methodology is more than research design and tech-nology. Behavior Research Methods, 37 (2), 197–201.
Public Records Act (NZ). (2005, April 20). Public records act 2005 of newzealand. (2005, April 20). Retrieved from http://www.legislation.govt.nz/act/public/2005/0040/latest/DLM345529.html
R Core Team. (2013). R: a language and environment for statistical computing.Vienna, Austria: R Foundation for Statistical Computing. Retrievedfrom http://www.R-project.org
Reed, B. (2008). Service-oriented architectures and recordkeeping. RecordsManagement Journal, 18 (1), 7. doi:10.1108/09565690810858488
Rugg, G. & McGeorge, P. (2005). The sorting techniques: a tutorial paper oncard sorts, picture sorts and item sorts. Expert Systems, 22 (3), 94–107.doi:10.1111/j.1468-0394.2005.00300.x
284 BIBLIOGRAPHY
Salmoni, A. (2012, April 10). Open card sort analysis 101 [UX booth]. Re-trieved February 19, 2013, from http://www.uxbooth.com/articles/open-card-sort-analysis-101/
Sanchez, G. (2012a, October 3). 7+ ways to plot dendrograms in R [GastonSanchez]. Retrieved from http://gastonsanchez.com/blog/how-to/2012/10/03/Dendrograms.html
Sanchez, G. (2012b). Plsdepot: partial least squares (pls) data analysis methods.R package version 0.1.17. Retrieved from http://CRAN.R-project.org/package=plsdepot
Sanchez, G. (2013a). Overall comparison: PLS -vs- CSA [PLS modeling].Retrieved 2014, from http://www.plsmodeling.com/extra/pls-csa
Sanchez, G. (2013b). PLS path modeling with r. eBook. Retrieved from http://www.gastonsanchez.com/PLS Path Modeling with R.pdf
Sanchez, G., Trinchera, L., & Russolillo, G. (2013). Plspm: tools for partialleast squares path modeling (PLS-PM) (Version R package version0.4.1). Retrieved from http://CRAN.R-project.org/package=plspm
Schepers, J. & Wetzels, M. (2007). A meta-analysis of the technology ac-ceptance model: investigating subjective norm and moderation effects.Information & Management, 44 (1), 90–103.
Schreiber, J., Nora, A., Stage, F., Barlow, E., & King, J. (2006). Reportingstructural equation modeling and confirmatory factor analysis results:a review. The Journal of Educational Research, 99 (6), 323–338.
Schultze, U. & Stabell, C. (2004, June). Knowing what you don’t know? Dis-courses and contradictions in knowledge management research. Journalof Management Studies, 41 (4), 549–573. doi:10.1111/j.1467-6486.2004.00444.x
Schwarz, A. (2002, June). Managing with Markov. Harvard Magazine, 34–36.Seddon, P. B. (1997). A respecification and extension of the DeLone and
McLean model of IS success. Information Systems Research, 8 (3), 240–253. doi:10.1287/isre.8.3.240
Segars, A. H. & Grover, V. (1993, December). Re-examining perceived easeof use and usefulness: a confirmatory factor analysis. MIS Quarterly,17 (4), 517–525.
Simmhan, Y. L., Plale, B., & Gannon, D. (2005). A survey of data provenancein e-science. ACM SIGMOD Record, 34 (3), 36.
Sivo, S. A., Saunders, C., Chang, Q., & Jiang, J. J. (2006). How low should yougo? low response rates and the validity of inference in IS questionnaireresearch. Journal of the Association for Information Systems, 7 (6),351–414.
BIBLIOGRAPHY 285
Smith, S. M. & Albaum, G. S. (2010). An introduction to marketing research.Qualtrics Labs Inc. Retrieved April 24, 2013, from http://www.qualtrics.com/university/researchsuite/ebooks
Smith, S. M. & Albaum, G. S. (2012). Basic marketing research: volume 1.Qualtrics Labs Inc. Retrieved April 24, 2013, from http://www.qualtrics.com/university/researchsuite/ebooks
Smyth, Z. A. (2005). Implementing EDRM: has it provided the benefitsexpected? Records Management Journal, 15 (3), 141.
Spencer, D. & Warfel, T. (2004, April 7). Card sorting: a definitive guide.Retrieved 2013, from http://boxesandarrows.com/card- sorting- a-definitive-guide/
Sprehe, J. T. (2005). The positive benefits of electronic records management inthe context of enterprise content management. Government InformationQuarterly, 22 (2), 297–303. doi:10.1016/j.giq.2005.02.003
Sprehe, J. T. (2008, June). Exploring the information management side ofRIM. Information Management Journal, 42 (3), 62–67.
Sprehe, J. T. & McClure, C. R. (2005, July). Lifting the burden. InformationManagement Journal, 39 (4), 47. doi:Article
Steel, D. G. & Holt, D. (1996, April 1). Analysing and adjusting aggregationeffects: the ecological fallacy revisited. International Statistical Review /Revue Internationale de Statistique, 64 (1), 39–60. doi:10.2307/1403423
Stein, E. W. (1995). Organizational memory: review of concepts and rec-ommendations for management. International Journal of InformationManagement, 15 (1), 17–32.
Stewart, C. J. & Cash, W. B. (2008). Interviewing: principles and practices.Boston: McGraw-Hill Higher Education.
Straub Jr., D. W. & Burton-Jones, A. (2007, April). Veni, vidi, vici: breakingthe TAM logjam. Journal of the Association for Information Systems,8 (4), 224–229.
Straub, D. W. (1989). Validating instruments in MIS research. MIS quarterly,147–169. Retrieved April 26, 2013, from http://www.jstor.org/stable/10.2307/248922
Straub, D. W., Limayem, M., & Karahanna-Evaristo, E. (1995). Measuringsystem usage: implications for IS theory testing. Management Science,1328–1342.
Suhr, D. (2006). Exploratory or confirmatory factor analysis. Cary: SASInstitute. SUGI, 1–17.
286 BIBLIOGRAPHY
Svard, P. (2013). Enterprise content management and the records continuummodel as strategies for long-term preservation of digital information.Records Management Journal, 23 (3), 159–176.
Svard, P. (2014). The impact of information culture on information/recordsmanagement: a case study of a municipality in Belgium. Records Man-agement Journal, 24 (1), 5–21.
Szajna, B. & Scamell, R. W. (1993, December). The effects of informationsystem user expectations on their performance and perceptions. MISQuarterly, 17 (4), 493–516.
Taylor, S. & Todd, P. (1995a, December). Assessing IT usage: the role ofprior experience. MIS Quarterly, 19 (4), 561–570. doi:10.2307/249633
Taylor, S. & Todd, P. (1995b). Understanding information technology usage: atest of competing models. Information Systems Research, 6 (2), 144–176.
Tenenhaus, M., Vinzi, V. E., Chatelin, Y.-M., & Lauro, C. (2005). PLS pathmodeling. Computational Statistics & Data Analysis, 48 (1), 159–205.doi:10.1016/j.csda.2004.03.005
Thompson, R. L., Higgins, C. A., & Howell, J. M. (1991, March). Personalcomputing: toward a conceptual model of utilization. MIS Quarterly,15 (1), 125–143.
Turner, M., Kitchenham, B., Brereton, P., Charters, S., & Budgen, D. (2010).Does the technology acceptance model predict actual use? A systematicliterature review. Information and Software Technology, 52 (5), 463–479.
Upward, F. (1996, November). Structuring the records continuum part one:post-custodial principles and properties. Archives and Manuscripts,24 (2), 268–285.
Upward, F. (1997, May). Structuring the records continuum part two: struc-turation theory and recordkeeping. Archives and Manuscripts, 25 (1),10–35.
Upward, F. (2000). Modelling the continuum as paradigm shift in recordkeep-ing and archiving processes and beyond: a personal reflection. RecordsManagement Journal, 10 (3), 115–139.
Upward, F. (2005). The records continuum. In S. McKemmish, M. Piggott, B.Reed, & F. Upward (Eds.), Archives: recordkeeping in society (pp. 197–222). New South Wales: Centre for Information Studies, CSU.
Upward, F., Reed, B., Oliver, G., & Evans, J. (2013, March 22). Recordkeep-ing informatics: re-figuring a discipline in crisis with a single mindedapproach. Records Management Journal, 23 (1), 37–50. doi:10.1108/09565691311325013
BIBLIOGRAPHY 287
Van der Heijden, H. (2004). User acceptance of hedonic information systems.MIS Quarterly, 28 (4), 695–704.
van Raaij, E. M. & Schepers, J. (2008, April). The acceptance and use of avirtual learning environment in China. Computers & Education, 50 (3),838–852. doi:10.1016/j.compedu.2006.09.001
Venkatesh, V. & Bala, H. (2008). Technology acceptance model 3 and aresearch agenda on interventions. Decision Sciences, 39 (2), 273–315.doi:10.1111/j.1540-5915.2008.00192.x
Venkatesh, V. & Davis, F. D. (2000, February). A theoretical extensionof the technology acceptance model: four longitudinal field studies.Management Science, 46 (2), 186–204.
Venkatesh, V., Morris, M. G., Davis, G. B., & Davis, F. D. (2003, September).User acceptance of information technology: toward a unified view. MISQuarterly, 27 (3), 425–478.
Venkatesh, V., Sykes, T., & Zhang, X. (2011). ’Just what the doctor ordered’: arevised UTAUT for EMR system adoption and use by doctors. (pp. 1–10).2011 44th Hawaii international conference on system sciences (HICSS).Koloa, Kauai, Hawaii. doi:10.1109/HICSS.2011.1
Venkatesh, V., Thong, J., & Xu, X. (2012). Consumer acceptance and use ofinformation technology: extending the unified theory of acceptance anduse of technology. MIS Quarterly, 36 (1), 157–178.
Venkatesh, V. & Zhang, X. (2010). Unified theory of acceptance and use oftechnology: U.S. vs. China. Journal of Global Information TechnologyManagement, 13 (1), 5–27.
Verhoeven, J. C., Heerwegh, D., & De Wit, K. (2010, August). Informationand communication technologies in the life of university freshmen: ananalysis of change. Computers & Education, 55 (1), 53–66. doi:10.1016/j.compedu.2009.12.002
Vinzi, V. E., Trinchera, L., & Amato, S. (2010). PLS path modeling: fromfoundations to recent developments and open issues for model assessmentand improvement. In Handbook of partial least squares (pp. 47–82).Springer: Handbooks of Computational Statistics.
Walsh, J. P. & Ungson, G. R. (1991). Organizational memory. Academy ofManagement Review, 16 (1), 57–91.
Wang, Y.-S., Wu, M.-C., &Wang, H.-Y. (2009). Investigating the determinantsand age and gender differences in the acceptance of mobile learning.British Journal of Educational Technology, 40 (1), 92–118. doi:10.1111/j.1467-8535.2007.00809.x
288 BIBLIOGRAPHY
Warshaw, P. R. (1980). A new model for predicting behavioral intentions: analternative to Fishbein. Journal of Marketing Research, 17 (2).
Weaver, G. R. & Gioia, D. A. (1994). Paradigms lost: incommensurability vsstructurationist inquiry. Organization Studies, 15 (4), 565.
Wilkins, L., Holt, D., Swatman, P., & Chan, E. (2007, June). Implementinginformation management strategically: an Australian EDRMS casestudy. In Merging and emerging technologies, processes and institutions.20th Bled eMergence. Bled, Slovenia.
Wilkins, L., Swatman, P., & Holt, D. (2009a, February 20). Achieved andtangible benefits: lessons learned from a landmark EDRMS imple-mentation. Records Management Journal, 19 (1), 37–53. doi:10.1108/09565690910937236
Wilkins, L., Swatman, P., & Holt, D. (2009b, June 19). Adding value toenterprise-wide system integration: a new theoretical framework forassessing technology adoption outcomes. In Proceedings of the IADISinternational conference e-commerce 2009 (pp. 53–60). IADIS multi-conference on computer science and information systems 2009. Algarve,Portugal: IADIS Press.
Williams, D. (2005). EDRM implementation at the national weights andmeasures laboratory. Records Management Journal, 15 (3), 158.
Wilson, J. (1995). A framework for identifying the business benefits of elec-tronic document management. Records Management Journal, 5 (2), 93–99. doi:10.1108/eb027081
Wood, J. R. & Wood, L. E. (2008). Card sorting: current practices andbeyond. Journal of Usability Studies, 4 (1), 1–6. Retrieved February18, 2013, from http://usabilityprofessionals.org/upa publications/jus/2008november/JUS Wood Nov2008.pdf
Woods, L., Priest, H., & Roberts, P. (2002). An overview of three differentapproaches to the interpretation of qualitative data. Part 2: Practicalillustrations. Nurse Researcher, 10 (1), 43.
Yuthas, K. & Young, S. T. (1998). Material matters: assessing the effectivenessof materials management IS. Information & Management, 33 (3), 115–124.
Zheng, Y. (2005). Information culture and development: chinese experienceof e-health. In HICSS 2005 – Proceedings of the 38th Annual HawaiiInternational Conference on System Sciences (153a–153a). IEEE.