The Impact of the Combination between Task Designs and Think-Aloud Approaches on Website Evaluation
18
IBIMA Publishing Journal of Software and Systems Development http://www.ibimapublishing.com/journals/JSSD/jssd.html Vol. 2013 (2013), Article ID 172572, 18 pages DOI: 10.5171/2013. 172572 ______________ Cite this Article as: Roobaea AlRoobaea, Ali H. Al-Badi and Pam J. Mayhew (2013), " The Impact of the Combination between Task Designs and Think-Aloud Approaches on Website Evaluation” Journal of Software and Systems Development, Vol. 2013 (2013), Article ID 172572, DOI: 10.5171/2013. 172572. Research Article The Impact of the Combination between Task Designs and Think-Aloud Approaches on Website Evaluation Roobaea AlRoobaea 1 , Ali H. Al-Badi 2 and Pam J. Mayhew 1 1 College of Computers and Information Systems, Taif University, Saudi Arabia and School of Computing Sciences, University of East Anglia, Norwich, UK 2 Department of Information Systems,Sultan Qaboos University, Oman Correspondence should be addressed to: Roobaea AlRoobaea; [email protected] Received date: 15 April 2013; Accepted date: 12 August 2013; Published date: 19 September 2013 Academic Editor: Jia Rong Copyright © 2013. Roobaea AlRoobaea, Ali H. Al-Badi and Pam J. Mayhew. Distributed under Creative Commons CC-BY 3.0 Abstract The growth of the Internet and related technologies has enabled the development of a new breed of dynamic website and applications that are growing rapidly in use, which have had a significant impact on many businesses. Usability testing is a method widely used for measuring the usability of a system from the perspective of real users. The main aim of this paper is to explore the efficiency of three types of usability testing method by discovering usability problems through a combination of three proposed task designs and three types of ‘think-aloud’ approach, and to compare the results of these methods with those of the traditional usability testing method that has been published separately. This is a missing area in usability testing. The quantitative and qualitative data are collected and analysed in order to assess the efficiency of the three combinations in terms of the usability problems encountered and their severity, and the success rate and user satisfaction of the websites being tested, through the feedback received. The research findings show clearly that the task scenarios and how they are designed and combined with different types of ‘think-aloud’ approaches can influence the usability testing results by discovering different types of usability problems, and can affect the results of usability measures, such as success rate, errors number and time spent. Keywords: Specific task, Guess task, Free task, Concurrent, Retrospective, Constructive Interaction approaches
-
Upload
independent -
Category
Documents
-
view
2 -
download
0
Transcript of The Impact of the Combination between Task Designs and Think-Aloud Approaches on Website Evaluation

IBIMA Publishing Journal of Software and Systems Development http://www.ibimapublishing.com/journals/JSSD/jssd.html Vol. 2013 (2013), Article ID 172572, 18 pages
DOI: 10.5171/2013. 172572
______________
Cite this Article as: Roobaea AlRoobaea, Ali H. Al-Badi and Pam J. Mayhew (2013), " The Impact of the
Combination between Task Designs and Think-Aloud Approaches on Website Evaluation” Journal of
Software and Systems Development, Vol. 2013 (2013), Article ID 172572, DOI: 10.5171/2013. 172572.
Research Article
The Impact of the Combination
between Task Designs
and Think-Aloud Approaches on
Website Evaluation
Roobaea AlRoobaea1, Ali H. Al-Badi
2 and Pam J. Mayhew
1
1College of Computers and Information Systems, Taif University, Saudi Arabia and
School of Computing Sciences, University of East Anglia, Norwich, UK
2Department of Information Systems,Sultan Qaboos University, Oman
Correspondence should be addressed to: Roobaea AlRoobaea; [email protected]
Received date: 15 April 2013; Accepted date: 12 August 2013; Published date: 19 September 2013
Academic Editor: Jia Rong
Copyright © 2013. Roobaea AlRoobaea, Ali H. Al-Badi and Pam J. Mayhew. Distributed under
Creative Commons CC-BY 3.0
Abstract
The growth of the Internet and related technologies has enabled the development of a new
breed of dynamic website and applications that are growing rapidly in use, which have had
a significant impact on many businesses. Usability testing is a method widely used for
measuring the usability of a system from the perspective of real users.
The main aim of this paper is to explore the efficiency of three types of usability testing
method by discovering usability problems through a combination of three proposed task
designs and three types of ‘think-aloud’ approach, and to compare the results of these
methods with those of the traditional usability testing method that has been published
separately. This is a missing area in usability testing. The quantitative and qualitative data
are collected and analysed in order to assess the efficiency of the three combinations in
terms of the usability problems encountered and their severity, and the success rate and
user satisfaction of the websites being tested, through the feedback received. The research
findings show clearly that the task scenarios and how they are designed and combined with
different types of ‘think-aloud’ approaches can influence the usability testing results by
discovering different types of usability problems, and can affect the results of usability
measures, such as success rate, errors number and time spent.
Keywords: Specific task, Guess task, Free task, Concurrent, Retrospective, Constructive
Interaction approaches

Journal of Software & Systems Development 2 __________________________________________________________________________
______________
Roobaea AlRoobaea, Ali H. Al-Badi and Pam J. Mayhew (2013), Journal of Software and Systems
Development, DOI: 10.5171/2013. 172572.
Introduction
The growth of the Internet and new
technologies has created new dynamic
websites that are growing rapidly in use and
are having a significant impact on many
businesses. These dynamic websites
increasingly being developed in the midst of
the Internet revolution and ever-improving
information technologies. For example, e-
learning websites are now essential for all
universities that have a physical workplace.
They have websites, and particularly those
for e-learning, that have become an integral
part of their businesses. The Internet
revolution has even led to a large number of
universities functioning solely online,
without the need of a physical workplace. To
keep pace with this development; some
companies and organizations such as Intel®
Education and the BBC seek to build free
online learning websites that are oriented to
world-class education at all educational
levels. This development in lifelong learning
has made the learners’ intention to continue
using e-learning an increasingly critical
issue. Consequently, quality is considered
crucial to education in general, and to e-
learning in particular. Web design is a key
factor in determining the success of e-
learning websites, and the users should take
priority in the designers’ eyes because
usability problems in educational websites
can have serious ramifications over and
above failing to meet the users’ needs.
Usability is one of the most significant
aspects affecting the user experience. The
techniques for measuring the quality of
users’ experience have been classified under
the heading of ‘ergonomics’ and ‘ease-of-use’,
but more recently under the heading of
‘usability’ [Oztekin & Uysal, 2010]. ISO
defines usability as “the extent to which the
product can be used by specified users to
achieve specified goals with effectiveness,
efficiency, and satisfaction in a specified
context of use” [ISO 9241-11, 1998]. During
the past decade a variety of Usability
Evaluation Methods (UEMs) have been
developed, and a number of research studies
have compared the effectiveness of different
UEMs [Jeffries et al., 1991; Alrobai et al.,
2012; AlRoobaea et al., 2013; AlRoobaea et
al., 2013; AlRoobaea et al., 2013; AlRoobaea
et al., 2013; Ali et al., 2013; Ahmed et al.,
2013]. UEMs can be categorized as analytic
or empirical; analytic UEMs include
techniques such as Heuristic Evaluation
(HE), whereas empirical UEMs include a
wide range of methods and procedures that
are often referred to simply as ‘usability (or
user) testing’ [Nielsen & Molich, 1990; Lewis
& Polson, 1992].
Briefly, usability testing is labour-intensive,
as it requires real users of the product to be
examined whilst performing a set of tasks.
These users need to be observed carefully by
evaluators in order to record the usability
problems encountered by them. Overall, the
most important aim of usability testing is the
compilation of a list of the usability problems
encountered, which will then indicate the
necessary changes to make in order to
improve the product [Lawand & Hvannberg,
2002].
The recent literature has raised a number of
questions and issues in the usability testing
field that deserve further research from
various viewpoints. For example, many
researchers such as Fang and Holsapple
(2011), and AlShamari and Mayhew (2010)
have investigated the impact of task types on
user testing results. However, the impact of
task formulation and combining it with
different ‘think-aloud’ approaches is a
missing area in usability testing. This paper
aims to investigate the efficacy of using three
different combinations of task formulation
and ‘think-aloud’ approaches in usability
testing. Three out of nine combinations were
chosen and tested, which were ‘specific task
with constructive interaction think-aloud’,
‘guess task with concurrent think-aloud’, and
finally, ‘free task with retrospective think-
aloud’. These were measured against the
number of problems found, the users’
performance and the overall user experience,
as well as other usability measures. This
paper is organized thus: Section 2 presents a
brief literature review relating to this study;
Section 3 describes the methodology and
techniques adopted; Section 4 contains the
data analysis; Section 5 presents a discussion
and highlights interesting findings; and
Journal of Software & Systems Development 3
__________________________________________________________________________
______________
Roobaea AlRoobaea, Ali H. Al-Badi and Pam J. Mayhew (2013), Journal of Software and Systems
Development, DOI: 10.5171/2013. 172572.
Section 6 presents the conclusion and
suggestions for future work.
Literature Review
The concept of user experience has become
central to interaction design; it defines how a
product behaves and is used in the real
world [Rubin & Chisnell, 2008]. Garrett
(2010) describes user experience as what
happens to the users when they interact with
the system in question. Experience varies
from person to person and from product to
product because of something calling
‘usability’. Usability is a one of the core
concepts to have emerged from the human-
computer interaction (HCI) field. The
literature reveals that usability is not a single
‘one-dimensional’ property of a user
interface; there are many usability attributes
that should be taken into account and
measured during experimental sessions. For
example, whether or not it is easy to learn
and to remember, efficient and subjectively
pleasing to use, and whether or not there are
errors. There are a variety of methods for
measuring the usability of a system or
product, and they can be divided into three
categories: usability testing (below),
usability inspection (e.g. Heuristic
Evaluation), and inquiry methods (e.g.
interviewing users). As mentioned before,
the first is empirical and the other two are
analytical.
Usability testing (or user testing) is the
method addressed in this paper. This is
considered to be the most important
evaluation method for ensuring system
quality, and particularly for websites,
although it is claimed to be costly [Oztekin &
Uysal, 2010]. It requires participants to
perform a set of tasks, usually under
laboratory conditions. These tasks are
performed without including any
information or clues as to how to complete
the tasks or scenarios, and with no help
provided to the user during the test session.
The performance of these tasks are
monitored through ‘observation’ and then
assessed by the evaluator/researcher in
order to record the usability problems
encountered by the users. All the observed
data, such as error numbers, time spent,
success rate and user satisfaction, are
recorded for analysis [Nielsen, 1994].
Dumas and Redish (1991) point out that a
fruitful usability testing session requires
careful planning and attention to detail.
Thus, there is a general procedure for
conducting user testing: 1) Planning a
usability test; 2) Selecting a representative
sample and recruiting participants; 3)
Preparing the test materials and actual test
environment; 4) Conducting the usability
test; 5) Debriefing the participants; 6)
Analysing the data of the usability test; and
7) Reporting the results and making
recommendations to improve the design and
effectiveness of the system or product. The
aim of applying usability testing is to procure
a list of usability problems, which are
defined as flaws in the design of a system
that make the attainment of a particular goal
(through the use of the system) ineffective
and/or inefficient, and thus lower the users’
level of satisfaction in using it [Lewis &
Polson, 1992]. These problems can be
classified into different groups, in which a
numeric scale from 0 to 4 is often used to
measure the severity of each problem. 0
means “not a usability problem at all”, 1
means “cosmetic problem that should be
fixed if enough time is available”, 2 means
“minor problem with low priority”, 3 means
“major problem with high priority”, and 4
means “catastrophic problem that is
imperative to fix”. Usability testing involves
the collection of measurable data that can be
compared with those of other websites; in
particular, data on time spent, task success
rate, error numbers, satisfaction rate and
other metrics [Tan et al., 2009].
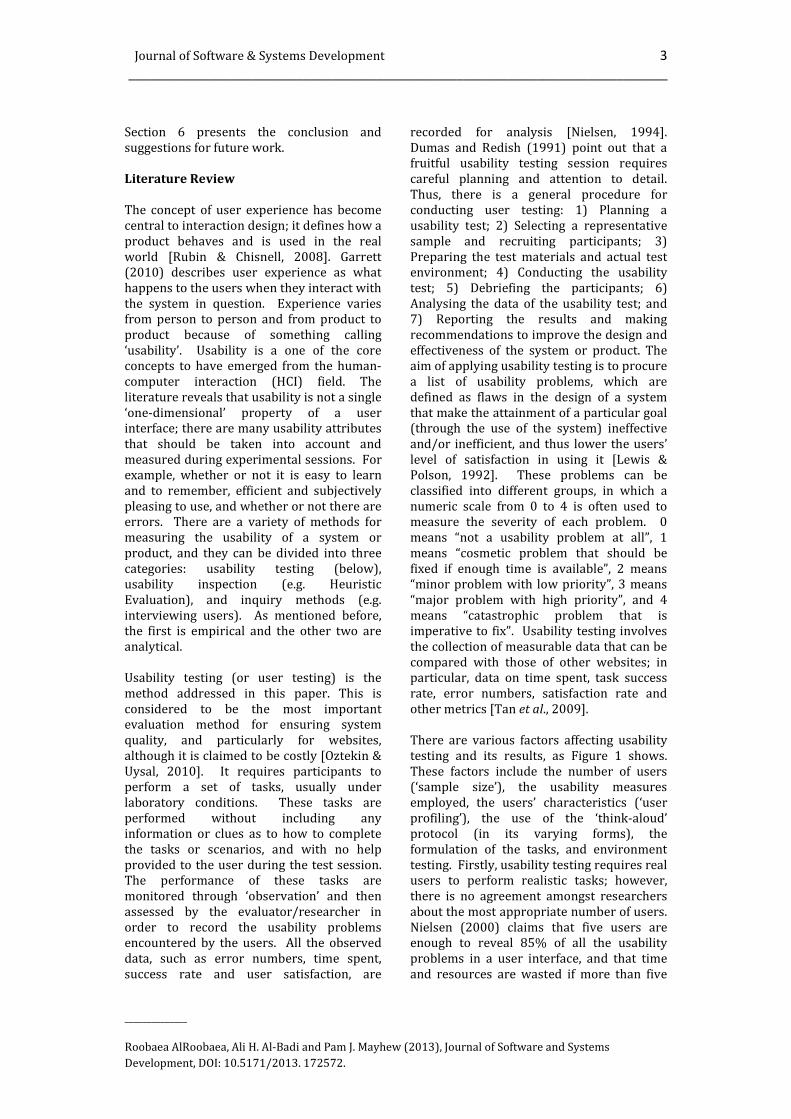
There are various factors affecting usability
testing and its results, as Figure 1 shows.
These factors include the number of users
(‘sample size’), the usability measures
employed, the users’ characteristics (‘user
profiling’), the use of the ‘think-aloud’
protocol (in its varying forms), the
formulation of the tasks, and environment
testing. Firstly, usability testing requires real
users to perform realistic tasks; however,
there is no agreement amongst researchers
about the most appropriate number of users.
Nielsen (2000) claims that five users are
enough to reveal 85% of all the usability
problems in a user interface, and that time
and resources are wasted if more than five

Journal of Software & Systems Development 4 __________________________________________________________________________
______________
Roobaea AlRoobaea, Ali H. Al-Badi and Pam J. Mayhew (2013), Journal of Software and Systems
Development, DOI: 10.5171/2013. 172572.
are involved. Rubin and Chisnell (2008)
confirm that the first of the three to five
users can detect the majority of the usability
problems, and that each additional user is
unlikely to uncover new ones. Several
researchers have suggested that 5 to 12
users are sufficient for the purposes of
website usability testing; however, others
have suggested that 20 users, for the
purpose of benchmarking, are needed for an
experiment [Nielsen, 2006; Rubin & Chisnell,
2008]. Lindgarrd and Chattatichart (2007)
confirm, in the findings of their paper which
discusses user numbers and tasks, that “the
result casts doubt on the role of the number
of users in a usability test but confirms the
important role of task coverage”.
The second factor is ‘usability measures’.
This is the most important factor because
any failure in measuring the level of usability
means failure in the whole evaluation. There
are three main ISO standards for measuring
usability, and these are efficiency,
effectiveness and user satisfaction.
Efficiency can be calculated through
measuring input rate, task completion time
and other factors. Effectiveness can be
worked out through measuring binary task
completion, accuracy and the number of
errors. Satisfaction can be measured by
asking about the user’s feelings towards the
system or through conducting standardized
questionnaires with the users after the test
[Sauro & Kindlund, 2005; Hornbaek, 2006].
However, there are other usability measures
such as success rate, which is defined by
Nielsen (2001) as the percentage of tasks
that users complete correctly and
successfully. He divides task completion into
three categories, which are ‘completed
successfully without error’, ‘completed
partially with some errors but with recovery
from those errors’, and ‘failure to complete’
[Nielsen, 2001]. Overall, usability measures
can produce different types of result, but
which system to measure, what to measure
and how to measure it are critical questions
in determining the most appropriate
usability measures.
The third factor is ‘user characteristics’; it is
important to consider the user profile from
all angles. Users differ in age, nationality,
background, gender and, crucially,
computing skills. Each one of these factors
may play a significant role in usability
testing. Molich et al., (2004) states,
“usability testing effectiveness is dependent
on the tasks given, the methodology used
and the users’ characteristics”.
Figure 1: Factors that impact on the results of usability testing

Journal of Software & Systems Development 5
__________________________________________________________________________
______________
Roobaea AlRoobaea, Ali H. Al-Badi and Pam J. Mayhew (2013), Journal of Software and Systems
Development, DOI: 10.5171/2013. 172572.
Regarding the fourth factor, there are
various techniques that supplement usability
testing, the ‘think-aloud’ protocol being the
most widely used. It is employed during the
test when the users are asked to think out
loud whilst performing their tasks and their
thoughts, feelings, and opinions are
recorded. This technique can effectively help
evaluators to capture how users interact
with an interface and what is happening on
the screen [Rubin & Chisnell, 2008]. It has
been claimed that one-third of ‘severe’
usability problems can be discovered
through this technique [Ebling & John, 2000].
However, the environmental setting of the
usability test can sometimes influence the
effectiveness of the ‘think-aloud’ protocol,
and it does not always help when the users
are not in their natural surroundings; this
means that users may not feel as relaxed and
may feel unable to talk or express their
thoughts and ideas freely in a restricted and
unfamiliar laboratory environment [Haak &
Jong, 2004]. Furthermore, Rubin and
Chisnell (2008) suggested that if the tasks
are designed to assess the efficiency of a
system (i.e. measuring time spent on tasks)
then ‘think-aloud’ protocol should be
avoided as it may negatively impact on the
performance of the users. The ‘think-aloud’
protocol has been generally used in
achieving three goals; firstly, to find evidence
for models and theories of cognitive
processes; secondly, to discover and
understand general patterns of behaviour in
the interaction with documents or
applications in order to create a scientific
basis for designing; and thirdly, to test
specific new documents or applications in
order to troubleshoot and revise them
[Krahmer & Ummelen, 2004].
There are three types of ‘think-aloud’
protocol, which are ‘concurrent’,
‘retrospective’ and ‘constructive interaction’.
The concurrent ‘think-aloud’ type is the most
common; this involves participants
verbalising their thoughts whilst performing
tasks in order to evaluate a product.
‘Retrospective think-aloud’ is less frequently
used; in this method participants perform
their tasks silently, and comment on their
work afterwards by means of recording of
their performance. Constructive interaction
is more commonly known as ‘co-discovery
learning’, where two participants work
together in performing their tasks,
verbalising their thoughts through
interaction (with each other?) [Van den Haak
et al., 2004]. On the one hand it has been
argued that ‘think-aloud’ protocol should be
avoided in certain circumstances, as
mentioned above, but on the other hand,
Tullis and Albert (2008) assess the degree to
which it can actually influence users’
performance, concluding that this technique
can in fact enhance performance because it
helps users to focus more on the tasks.
However, some researchers when employing
the concurrent type have concerns about
reactivity, i.e. the possibility that the act of
speaking concurrently may influence user
performance through distracting their
attention and concentration; the effort of
fully verbalizing the steps taken in the task
may change the ways that users attend to the
task components. For this reason the
retrospective ‘think-aloud’ type has been
proposed in order to avoid the problems of
‘concurrent think-aloud; it is assumed to be
the most fruitful in terms of problems
reported per participant [Van den Haak et al.,
2004]. Furthermore, ‘co-discovery learning’
(constructive interaction) has been claimed
to be the most suitable method for
evaluating collaborative systems and also to
be the most appropriate method for usability
testing with children [Nielsen, 1994].
The fifth factor in usability testing is the
design of the tasks. Many researchers are
aware that task design is an important factor
in the design of adequate Web usability tests.
The tasks designed for Web usability testing
should focus on the main functions of the
system. The tasks should cover the following
aspects: 1) Product page; 2) Category page;
3) Display of records; 4) Searching features;
5) Interactivity and participation features;
and 6) Sorting and refining features. The
tasks can be selected from four different
perspectives. These are: 1) Tasks that are
expected to detect usability problems; 2)
Tasks that are based on the developer’s
experience; 3) Tasks that are designed for
specific criteria; and 4) Tasks that are
normally performed on the system.
Researchers also recommend that the tasks
should be short and clear, in the users’
language, and based on the system’s goals.

Journal of Software & Systems Development 6 __________________________________________________________________________
______________
Roobaea AlRoobaea, Ali H. Al-Badi and Pam J. Mayhew (2013), Journal of Software and Systems
Development, DOI: 10.5171/2013. 172572.
Alshamari and Mayhew (2008) found that
task design can play a vital role in the
usability testing results, where it can be
shown that changing the design of the task
can produce differences in the results. They
propose and examine three different types of
task formulations, which are structured
tasks, uncertain tasks and problem-solving
tasks. They find that structured tasks are
able to identify superficial and minor
usability problems whereas the problem-
solving tasks are able to identify usability
disasters and major problems. Furthermore,
Fang and Holsapple (2011), having designed
two sets of tasks, which were ‘simple tasks’
and ‘complex tasks’, find that simple tasks
impact differently on the website navigation
structure, user performance, and perceptions
of usability than complex tasks.
The sixth factor is the test environment.
Generally, user testing takes place in a
controlled laboratory. Tullis et al., (2002)
discover several cases where the product
works fine in the laboratory but not in the
real world. They find that the conditions
under which the product’s use is tested are
different to the conditions for actual use. Dix
et al., (2004) list four aspects when seeking
to understand why a laboratory experiment
sometimes fails: 1) The users’ motivation can
be greatly diminished or even destroyed by
the atmosphere of a controlled laboratory; 2)
A laboratory does not take into account the
social context (of supporting and motivating
the users if they need it); 3) A laboratory
setting does not consider the time context
where, in reality, users may leave their work
and resume it later; and 4) A laboratory does
not take into account the user’s work context
(users may feel disinclined to invest time and
effort in something that they see as someone
else’s job). However, conducting
experiments in a laboratory can increase
their validity, can facilitate system
comparisons, and can offer a controlled area
where all interactions with the system can be
closely recorded and monitored [Lazar et al.,
2010; Nielsen, 2009].
In conclusion, further research should be
carried out to investigate the impact of task
formulation on usability testing, as
recommended by Fang and Holsapple (2011)
and Alshamari and Mayhew (2008).
Furthermore, there is no research that
investigates the impact on the results of user
testing of a combination of different types of
task formulation and different types of think-
aloud technique. Many researchers use
traditional user testing which consist of
simple tasks and observation [Dale et al.,
2012; Manzari and Trinidad, 2013]. This
research will also compare the proposed
combined methods here with the results of
the traditional user testing in the paper
written by AlRoobaea et al., (2013) on the
same websites. This will help us discover
which method can provide a better
performance in the identification of usability
problems. Consequently, this research will
consider all these gaps and it will present
useful information in the HCI field.
Research Methodology
The experimental approach was selected to
achieve the research objectives outlined
above. The educational domain was chosen,
and three educational websites were
selected for different reasons; firstly, they
are all completely free educational websites;
secondly, they are interactive and are
supported by three well-known companies
with a wide range of users; and thirdly, they
meet the research objectives and
requirements through having various
functions, processes and features. These
websites are BBC KS3bitesize, Skoool, and
Academic Earth. Three experiments were
employed on each. Each experiment
employed one design of task and one type of
‘think-aloud’ protocol. This section presents
an explanation of the test procedures in
these experiments, including the quantitative
and qualitative data. Testing procedures
The user testing was conducting by giving a
quick introduction to the task designs; think-
aloud approaches and the purpose of the
study to each user. The next step was to
explain the testing environment and how to
use the equipment, followed by a quick
demonstration of how to ‘think aloud for
each test’ while performing the given tasks.
Prior to the tests the users had to read and
sign the consent letter and fill in a user sheet
that included his/her demographic data,

Journal of Software & Systems Development 7
__________________________________________________________________________
______________
Roobaea AlRoobaea, Ali H. Al-Badi and Pam J. Mayhew (2013), Journal of Software and Systems
Development, DOI: 10.5171/2013. 172572.
such as computer skills, nationality and
gender. All the above steps took
approximately ten minutes for each test
session. The timing of each test started when
the user was given the task scenario sheet
and asked to read and then perform the task.
Once they had finished the session they were
asked to rate their satisfaction levels. This
was followed by a brief discussion.
The Proposed Tasks
The literature suggests that further work on
task design is needed [Lindgaard &
Chattratichart, 2007; Alshamari & Mayhew,
2008]. This is because giving users only one
task design may not achieve the testing
goals; however, offering users different
designs of task may reveal more usability
problems. Three designs were proposed for
the tasks to be employed in this study. These
three types were:
1. Specific Task: this design of task will
guide the users to finding specific
information relating to a number of
specific questions. This task involves
constructive interaction ‘think-aloud’
type (co-discovery learning), where two
users work together in performing their
tasks. This is designed to reveal
potential usability problems. For
example, the following task is to
measure the usability of a website’s
registration process.
• Work with your friend and go to the
website and register.
• Work with your friend and fill in the
fields, following the instructions
given.
2. Guess Task: in this task design the
users should guess aloud, saying what
information they expect to find behind
the functions targeted in the test. This
design of task relies on the fact that
users are usually uncertain as to
whether they will find the information
that they are looking for whilst surfing a
website. The task involves the
concurrent ‘think-aloud’ type, which is
the most commonly used. The following
is an example of this task, which is to
measure the usability of a website’s
post-a-question facility.
• Guess how you can post your
question.
3. Free Task: in this task users are
allowed to explore the target website
freely, based on their own interests.
This task involves the retrospective
‘think-aloud’ type, which means that
users perform their tasks silently, and
afterwards comment on their work by
means of a recording of their
performance. The following is an
example of this task; it is to measure the
usability of a website game.
• Go to the website and enjoy your
favourite game in the English
section.
Each of these tasks consists of four sub-tasks
which represent the key functional aspects of
the selected website; i.e. they represent the
main features of the website. Although they
have been formed differently, the task goals
are the same.
Building the Questionnaire
After the users finish their tasks they will be
asked to rate their level of satisfaction with
the website and task formalization on a scale
of 1 to 7, where 1 indicates ‘highly
unsatisfactory’ and 7 indicates ‘highly
satisfactory’. This scale has been suggested
to measure the levels of satisfaction felt by
users truthfully following a test [Nielsen &
Loranger, 2006]. Also, they will be asked to
write down their comments and thoughts in
a feedback questionnaire, explaining any
reactions that they observed during the test.
User Characteristics
Selecting and recruiting participants must be
done carefully; the selection must reflect real
users of the targeted websites because
engaging inappropriate users will lead to
incorrect results, thereby invalidating the
experiments. Appropriate users will give
confident results; the selection of these users
will also encourage them to take part in the
experiment [Dumas & Redish, 1999]. In this
experiment the majority of users of the
targeted websites were students. They were
divided into three groups consisting of 20

Journal of Software & Systems Development 8 __________________________________________________________________________
______________
Roobaea AlRoobaea, Ali H. Al-Badi and Pam J. Mayhew (2013), Journal of Software and Systems
Development, DOI: 10.5171/2013. 172572.
students in each; each group was mixed in
terms of sex, age, education and computer
skills. These conditions should deliver
reliable and accurate results; they may also
play a significant role in the accuracy of the
usability testing results. Of the 60 students,
40 were pre-university, and 20 were a mix of
undergraduates and postgraduates. The
users performing the specific tasks were
called SC-Group, the users performing the
guess tasks were called GC-Group, and the
users performing the free tasks were called
FR-Group.
The Number of Users Participating in the
Experiment
As mentioned in the literature review, 20
users are required for testing each design of
task and ‘think-aloud’ type. This means that
60 students are needed for each website,
and, therefore, 180 users were required to
conduct this experiment [Nielsen &
Loranger, 2006]. They were all introduced
to the concept of the ‘think-aloud’ protocol
and its three types, and how to perform the
different task types.
Test Environment
The test environment was controlled; it was
conducted in a quiet, child-friendly room.
Also, we attempted to find out what our
users regularly used, i.e. a familiar type of
machine, browser and Internet connection
speed, and set it up for them before the test.
Table 1: The actual environment for the
usability testing experiment
Test environment A small, quiet,
child-friendly room
Type of machine Laptop (Intel, with
high speed and
Windows Vista)
Browser Internet Explorer 6
Internet
connection
Reliable and fast
Additional
requirements
A mouse for those
unfamiliar with a
laptop
The Observer
As mentioned above, usability testing
requires an observer, and the researcher
adopted this role in all the sessions, noting
all the comments made by the users. He
used a stopwatch to record the time spent by
each user on each task, and an observation
sheet to write down the behaviour of each
user and the number of problems
encountered.
Severity Rating Assessment
A severity assessment sheet was prepared in
order to rank each usability problem on a
scale of 0 to 4 in accordance with the
literature review, and after listing all the
usability problems they had encountered an
evaluation was conducted for each user.
This severity scale was used by Nielsen for
prioritizing usability problems, as the
severity sheets can then be used to compare
the problems discovered by each group
[Nielsen, 1994].
Piloting the test
There are two objectives in conducting a
pilot study. The first one is to assess all the
materials, including tasks, questionnaires
and procedures, checking the language (to
avoid any ambiguities) and ensuring that all
the tasks have the same goal (although with
different formulation). This objective was
achieved by engaging independent expert
evaluators. The second one is to assess the
time needed for each test. This objective was
achieved by engaging three users, each one
performing one type of task. The users’
behaviour was monitored and all the
usability measures were assessed; the post-
test questionnaires were then given to them
by the observer (researcher) as they would
be in the real testing. All these steps resulted
in useful corrections and adjustments to the
real test.
Usability Measures Recorded
In the experiment three usability attributes
were considered, which were efficiency,
effectiveness and satisfaction. These
attributes were measured as time spent, task
success and user satisfaction, respectively.

Journal of Software & Systems Development 9
__________________________________________________________________________
______________
Roobaea AlRoobaea, Ali H. Al-Badi and Pam J. Mayhew (2013), Journal of Software and Systems
Development, DOI: 10.5171/2013. 172572.
• Time spent: the time spent on each task
in seconds was recorded in order to
measure the efficiency of the website.
• Task success rate: this was used to
measure the effectiveness of the
website. This was calculated using the
following equation:
The success rate = (Number of tasks
completed successfully) + (Number
of tasks completed partly
successfully (*0.5)) / the total
number of tasks [Nielsen,
2001]
• User satisfaction: each user had to rate
their satisfaction with the website after
finishing the testing session, as
indicated in Section 3.2.
Additional data were also collected:
• Number of errors: this refers to the
number of errors made by a user when
attempting to accomplish a task, such as
visiting a wrong page.
• Usability problems encountered and
their severity rate: this is the most
important result as it can help the
owner, developer and designer to
improve their website. Once the
problems were found they were
assessed in terms of severity, as
indicated in the literature review.
• Users’ comments and feedback: this was
collected at the end of each session; the
users were asked to comment and to
provide feedback with regard to their
perceived usability of the website.
• Efficiency: one measure of Efficiency of
Usability Evaluation Methods (UEMs) is
“the ratio between the number of
usability problems detected and the
total time spent on the inspection
process” [Fernandez et al., 2011].
Others can be deduced by dividing the
average severity rating by the average
time taken, as shown below [Tan et al.,
2009]:
Efficiency =
[Tan et al., 2009]
• Thoroughness: this is perhaps the most
attractive measure. It is defined as
being an indication of the proportion of
real problems found using a Usability
Evaluation Method (UEM) to the total
number of known real problems
existing in the target design z. It can be
calculated by following formula:
Thoroughnes=
[Sears, 1997]
• Validity: this is the extent to which a
usability evaluation method accurately
identifies usability problems. It can be
calculated by following formula:
Validity =
[Sears, 1997]
• Effectiveness: this is defined as the
ability of a usability evaluation method
to identify usability problems related to
the user interface of a specific system
[Khajouei et al., 2011]. It can be
calculated by the following formula:
Effectiveness =
[Sears, 1997]
Data Analysis
The previous sections describe and explore
the objectives of the study, the methods
used, the preparation of the experiment and,
finally other usability testing measures. This
section is a critical part of the experiment. It
starts by exploring the users’ demographic
data, which includes nationality, gender and
Web experience. It then examines the
quantitative and qualitative data. Finally, the
impact of the tasks and the ‘think-aloud’
types are assessed vis-à-vis on the three
websites. Table 2 shows the mean values of
the users’ Web experience for all three
groups. Approximately 4 years was the
Number of real usability problems found
Total number of real usability problems
Number of real usability problems found
Number of issues identified as a usability problem
Thoroughness X Validity
Average severity rating
Average time spent

Journal of Software & Systems Development 10 __________________________________________________________________________
______________
Roobaea AlRoobaea, Ali H. Al-Badi and Pam J. Mayhew (2013), Journal of Software and Systems
Development, DOI: 10.5171/2013. 172572.
average for user experience across the three
groups.
Table 2: Means for distribution of user
Web experience
Group Mean
(years)
N (number of
users)
BBC
KS3bitesize
3.7 60
Skoool 4.1 60
Academic
Earth
4.4 60
Total 4.1 180
Quantitative Analysis
Quantitative data is an important part of
usability data analysis. It provides a number
of useful results, derived from various
aspects that include success rate, error
number, user satisfaction and time spent.
The following sections explore and discuss
the quantitative data collected in these
experiments and reveal how each group
performed with regard to usability
measures.
� Success rate
Table 3 shows the success rate for each
group when using the three websites. The
BBC KS3bitesize groups had the lowest
overall success rate. For this website, FR-
Group had the highest success rate of the
three groups, which was expected because
they performed tasks they were interested in
and paid more attention to their tasks
because they did not have to speak while
doing them. They scored a 58% success rate,
which means that 58% of the tasks, on
average, were completed successfully by the
users. Although SC-Group discovered fewer
usability problems than GC-group, they
scored better than them. SC-Group members
were observed performing tasks very
successfully in the first stage, when they
were asked to explore the website and
familiarise themselves with it. They were
more focused on accomplishing this task as
they were expecting to encounter problems
later. The actual tasks were limited to
finding an answer and so they knew what
they were looking for. Also, the constructive
‘think-aloud’ procedure helped them to
clarify their tasks. This is perhaps the main
difference between SC-Group and GC-group.
The Skoool groups ranked second in terms of
success rate. They scored 62%, which means
that 62% of the tasks, on average, were
completed successfully by the users. FR-
Group again had the highest success rate,
followed by SC-Group and GC-group
respectively. It can be seen clearly that GC-
Group were able to score more partially
successful tasks than successful ones, as they
attempted different ways and visited
different pages to accomplish each task.
Also, the concurrent ‘think-aloud’ procedure
may have played a role in producing more
failed tasks. This may be because this
procedure distracted their attention,
lowered their level of concentration and
ultimately influenced their task performance.
The Academic Earth groups had the highest
success rate of the three website groups.
These groups scoured 63%, which means
that 63% of the tasks, on average, were
completed successfully by the users. SC-
Group had the highest number of failed tasks
of the three groups. This may be because
they had doubts and were uncertain of their
ability to guess and accomplish a task
successfully. Overall, the FR-Group success
rate was somewhat higher than those of SC-
Group and GC-Group.
Despite these observations none of the three
websites scored below 50%, which is
claimed by Nielsen to be the average for
most websites, arguing that users generally
fail to perform a task successfully the first
time [Nielsen, 2001]. In terms of the group
types, GC-Group achieved below 50% in BBC
KS3bitesize, and came close to this score
with the other websites. This implies that
the website’s success rate can be described
as acceptable and is in line with this study.

Journal of Software & Systems Development 11
__________________________________________________________________________
______________
Roobaea AlRoobaea, Ali H. Al-Badi and Pam J. Mayhew (2013), Journal of Software and Systems
Development, DOI: 10.5171/2013. 172572.
Table 3: Success rate for the three groups across the three websites by three methods
Type of
website
Group
Type
Task completion Mean success
rate for each
website Successful
tasks
Partially
successful
tasks
Failed
tasks
Number
of tasks
Success
rate
BBC
KS3bitesize
SC-
Group 31 20 29 80 51%
52%
GC-
Group 27 19 34 80 46%
FR-
Group 37 18 25 80 58%
Skoool
SC-
Group 40 23 17 80 64%
62%
GC-
Group 33 24 23 80 56%
FR-
group 48 23 9 80 66%
Academic
Earth
SC-
Group 38 21 30 80 61%
63%
GC-
Group 34 26 20 80 59%
FR-
Group 41 27 12 80 68%
Average of the most websites [Nielsen 2001] < 50%
� The number of errors made
Table 4 shows that the BBC KS3bitesize
groups made more errors than the other
website groups. FR-Group made fewer errors
than the other groups, where an average of
1.5 errors were made by each user while
he/she performed this type of task using
‘think-aloud’ protocol on the BBC
KS3bitesize website, and 1.3 and 1.2 errors
respectively on the Skoool and Academic
Earth websites. GC-Group made the most
errors. This was probably because this group
did not have any guidelines or specific
objective when performing the tasks. Also,
the concurrent ‘think-aloud’ procedure may
have had a negative impact, thus
contributing to the number of errors made.
Difficulties were also encountered because
some of the navigation on the Skoool and
Academic Earth websites took the users
away from the website; also, there were too
many windows and help links, and much of
the documentation was not very visible. SC-
Group came second with 1.7 errors per user,
on average, in performing the specific task
and the constructive ‘think-aloud’ procedure
on the BBC KS3bitesize website; the average
number of errors was 1.5 on both the Skoool
and the Academic Earth websites. Thus, it
can be seen that different types of task
produce different results with regard to the
number of errors made by users.

Journal of Software & Systems Development 12 __________________________________________________________________________
______________
Roobaea AlRoobaea, Ali H. Al-Badi and Pam J. Mayhew (2013), Journal of Software and Systems
Development, DOI: 10.5171/2013. 172572.
Table 4: Error numbers for the three website groups by the three methods
� Number of usability problems
discovered
Table 5 shows the number of problems
discovered by each group. It shows that GC-
Group, in performing guessing tasks with the
concurrent procedure, discovered 81% of
the total usability problems discovered by all
groups on the BBC KS3bitesize website, and
85% and 67% on the Skoool and Academic
Earth websites respectively. SC-Group
performed specific tasks using Co-Discovery
Learning, uncovered only 56% of the total
number of discovered usability problems on
the BBC KS3bitesize website, and 39% and
50% on the Skoool and Academic Earth
websites respectively. The FR-Group found
31% of the total number of usability
problems discovered by all groups on the
BBC KS3bitesize website, and 31% and 25%
on the Skoool and Academic Earth websites
respectively. GC-Group performed better
than SC-Group in discovering catastrophic,
major, minor and cosmetic problems.
However, FR-Group was better at
discovering minor and cosmetic problems.
The majority of the major problems
discovered by GC-Group were mostly to do
with navigation and structure. This may be
because the users were not provided with
guidelines telling them what they should do
and where they should go; also, they had to
speak out loud. On the other hand, SC-Group
performed their tasks knowing what they
were looking for, i.e. answering a question.
Table 5: Number of usability problems discovered by the three groups using three
different methods
Problem
type
BBC KS3bitesize Skoool Academic Earth
SC-
Group
GC-
Group
FR-
Group
SC-
Group
GC-
Group
FR-
Group
SC-
Group
GC-
Group
FR-
Group
No. of
problems 9 13 5 5 11 4 6 8 3
% of
discovered
problems
56% 81% 31% 39% 85% 31% 50% 67% 25%
Catastrophic 0 0 0 1 1 0 0 0 0
Major 1 2 1 1 3 0 2 3 1
Minor 3 4 2 1 1 1 0 1 1
Cosmetic 5 7 2 2 6 3 4 4 1
Website
Errors
BBC KS3bitesize Skoool Academic Earth
SC-
Grou
p
GC-
Group
FR-
Group
SC-
Group
GC-
Group
FR-
Group
SC-
Group
GC-
Group
FR-
Group
No. of errors
made
139 154 118 119 133 105 108 115 95
Average
error
number per
user for each
task
1.7 1.8 1.5 1.5 1.6 1.3 1.4 1.4 1.2
Average
error
number per
user overall
tasks
6.9 7.7 5.9 5.9 6.7 5.3 5.4 5.8 4.7

Journal of Software & Systems Development 13
__________________________________________________________________________
______________
Roobaea AlRoobaea, Ali H. Al-Badi and Pam J. Mayhew (2013), Journal of Software and Systems
Development, DOI: 10.5171/2013. 172572.
� Time spent
Table 6 shows the time spent by each user in
performing their tasks, and whether or not
they succeeded in carrying them out. GC-
Group spent the longest time, longer than SC-
Group and FR-Group, the timings being 310,
275 and 244 minutes respectively on the
BBC KS3bitesize website. On the Skoool
website, GC-Group spent the longest time -
340 minutes; SC-Group and FR-Group spent
293 and 237 minutes respectively. On the
Academic Earth website, again GC-Group
spent the longest time, longer than SC-Group
and FR-Group, the timings being 298, 267
and 239 minutes respectively. Again, this is
probably due to the type of task and ‘think-
aloud’ procedure performed by the users.
For example, GC-Group found themselves in
problematic circumstances and having to
speaking out loud whilst performing their
tasks, which may have affected their
concentration and attention. Also, they were
trying to understand the situation they were
in, and so had to spend time thinking about
how to perform each task. FR-Group was
free of such hindrances and so were more
interested in, and concentrated on,
accomplishing their tasks. SC-Group felt
confident about how to accomplish their
tasks and the constructive interaction
procedure was helpful for this group; this is
demonstrated in the success rate table
(Table 3). The average time spent by each
user in all website groups was longer than 3
minutes. Dumas and Redish (1999) asserted
that the time spent by users on a website is
less important than other factors such as
success rate.
Table 6: Time spent by the three groups using the three methods
Usability
measure
BBC KS3bitesize Total
time
Skoool Total
time
Academic Earth Total
time
SC-
Group
GC-
Group
FR-
Group
SC-
Group
GC-
Group
FR-
Group
SC-
Group
GC-
Group
FR-
Group
Total time
spent by all
users (in
minutes)
275 310 244 276 293 340 237 290 267 298 239 268
Average
time per
user per
task (in
minutes)
3.4 3.9 3.1 3.5 3.7 4.3 3 3.7 3.3 3.7 3 3.3
Average
time per
user over
four tasks 13.8 15.5 12.2 13.8 14.7 17 11.9 14.5 13.4 14.9 12 13.4
� User Satisfaction
Table 7 shows that the Academic Earth
group were noticeably less satisfied than the
BBC KS3bitesize and the Skoool groups. The
FR-Group produced the highest scores,
followed by SC-Group and GC-Group in
overall evaluations. This indicates that there
were certain factors influencing the users
which impacted on their satisfaction score
for the tested websites, as evidenced by the
critical user comments relating to the design
features of each website. These factors
related to the various activities and
Journal of Software & Systems Development 14 __________________________________________________________________________
______________
Roobaea AlRoobaea, Ali H. Al-Badi and Pam J. Mayhew (2013), Journal of Software and Systems
Development, DOI: 10.5171/2013. 172572.
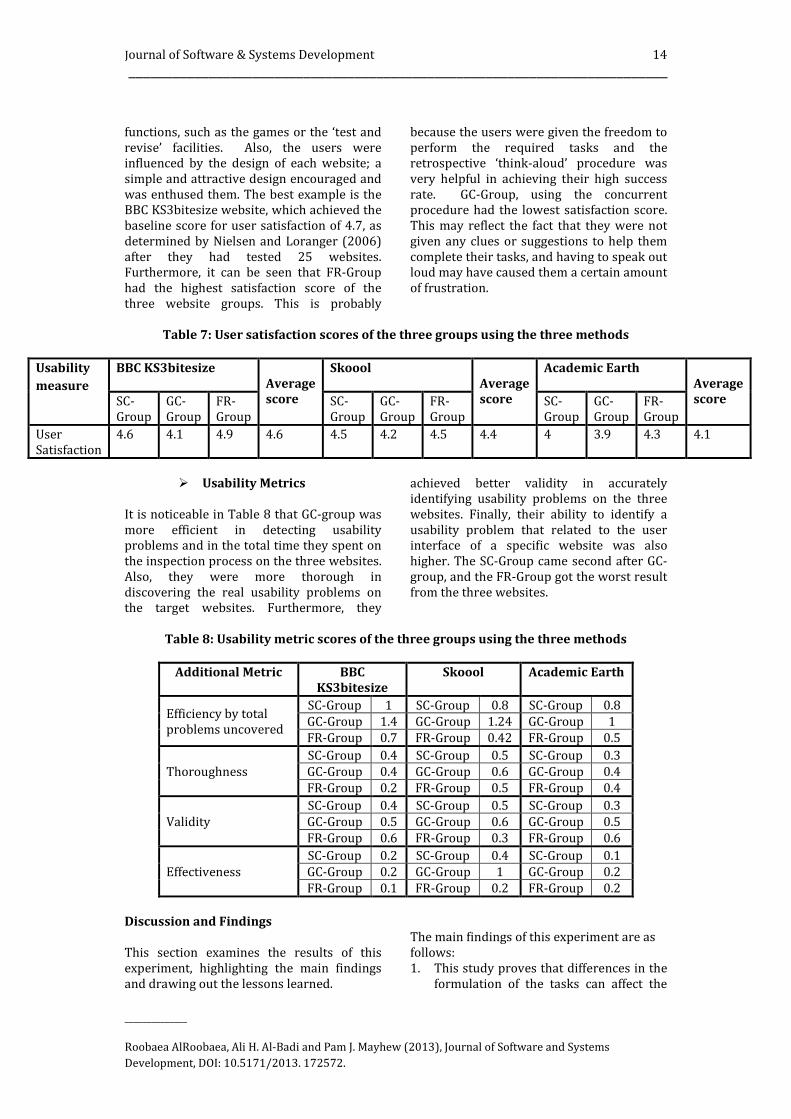
functions, such as the games or the ‘test and
revise’ facilities. Also, the users were
influenced by the design of each website; a
simple and attractive design encouraged and
was enthused them. The best example is the
BBC KS3bitesize website, which achieved the
baseline score for user satisfaction of 4.7, as
determined by Nielsen and Loranger (2006)
after they had tested 25 websites.
Furthermore, it can be seen that FR-Group
had the highest satisfaction score of the
three website groups. This is probably
because the users were given the freedom to
perform the required tasks and the
retrospective ‘think-aloud’ procedure was
very helpful in achieving their high success
rate. GC-Group, using the concurrent
procedure had the lowest satisfaction score.
This may reflect the fact that they were not
given any clues or suggestions to help them
complete their tasks, and having to speak out
loud may have caused them a certain amount
of frustration.
Table 7: User satisfaction scores of the three groups using the three methods
Usability
measure
BBC KS3bitesize
Average
score
Skoool
Average
score
Academic Earth
Average
score SC-
Group
GC-
Group
FR-
Group
SC-
Group
GC-
Group
FR-
Group
SC-
Group
GC-
Group
FR-
Group
User
Satisfaction
4.6 4.1 4.9 4.6 4.5 4.2 4.5 4.4 4 3.9 4.3 4.1
� Usability Metrics
It is noticeable in Table 8 that GC-group was
more efficient in detecting usability
problems and in the total time they spent on
the inspection process on the three websites.
Also, they were more thorough in
discovering the real usability problems on
the target websites. Furthermore, they
achieved better validity in accurately
identifying usability problems on the three
websites. Finally, their ability to identify a
usability problem that related to the user
interface of a specific website was also
higher. The SC-Group came second after GC-
group, and the FR-Group got the worst result
from the three websites.
Table 8: Usability metric scores of the three groups using the three methods
Additional Metric BBC
KS3bitesize
Skoool Academic Earth
Efficiency by total
problems uncovered
SC-Group 1 SC-Group 0.8 SC-Group 0.8
GC-Group 1.4 GC-Group 1.24 GC-Group 1
FR-Group 0.7 FR-Group 0.42 FR-Group 0.5
Thoroughness
SC-Group 0.4 SC-Group 0.5 SC-Group 0.3
GC-Group 0.4 GC-Group 0.6 GC-Group 0.4
FR-Group 0.2 FR-Group 0.5 FR-Group 0.4
Validity
SC-Group 0.4 SC-Group 0.5 SC-Group 0.3
GC-Group 0.5 GC-Group 0.6 GC-Group 0.5
FR-Group 0.6 FR-Group 0.3 FR-Group 0.6
Effectiveness
SC-Group 0.2 SC-Group 0.4 SC-Group 0.1
GC-Group 0.2 GC-Group 1 GC-Group 0.2
FR-Group 0.1 FR-Group 0.2 FR-Group 0.2
Discussion and Findings
This section examines the results of this
experiment, highlighting the main findings
and drawing out the lessons learned.
The main findings of this experiment are as
follows:
1. This study proves that differences in the
formulation of the tasks can affect the

Journal of Software & Systems Development 15
__________________________________________________________________________
______________
Roobaea AlRoobaea, Ali H. Al-Badi and Pam J. Mayhew (2013), Journal of Software and Systems
Development, DOI: 10.5171/2013. 172572.
user experience and, therefore, the
product evaluation of the end users. This
means that the owners of websites or
researchers should be careful to choose
a task formulation that serves their goals
by understanding the users’
requirements. For example, the task
formulation can indeed influence the
results by revealing the different types of
problems.
2. This study also proves that the ‘think-
aloud’ protocol can affect the way users
think and behave during the session. For
example, GS-Group, who performed the
guess tasks with the concurrent ‘think-
aloud’ type of protocol, discovered more
catastrophic, major, minor and cosmetic
problems than the other two groups.
However, SC-Group, who performed
specific tasks with Co-Discovery
Learning, discovered mostly major,
minor and cosmetic problems. FR-Group,
who performed free tasks with the
retrospective ‘think-aloud’ procedure,
revealed only minor and cosmetic
problems. Thus, exploring the behaviour
of users as they are engaged with a
website and employing a variety of tasks
can positively help in the development of
a website.
3. From the observation of GS-Group, the
concurrent ‘think-aloud’ type of
evaluation appears to be the main
reason for tasks not being completed
because it leads to the dispersal of
concentration of the users. This was
manifested very obviously by the
success of FR-Group when they
performed their tasks silently.
Consequently, this ‘think-aloud’ type
should be avoided if the aim of the
evaluation is to find all the usability
problems in the selected product.
4. The task and type of ‘think-aloud’
protocol affected different
measurements of usability, such as
success rate and time spent. FR-Group
achieved the highest success rate, made
the fewest errors, had the highest level
of user satisfaction and spent the least
time. GC-Group, who used the
concurrent ’think-aloud’ procedure, left
a number of tasks unfinished; they spent
more time, made more errors and had
lower levels of user satisfaction.
5. There is a relationship between user
satisfaction and task type or ‘think-
aloud’ type; it is likely that if users make
more errors while performing tasks,
their satisfaction level will fall.
6. There is a strong positive correlation
between the time spent and problems
discovered (using Pearson Correlation),
its significance being (p-value = 0.02),
which means that when users spent
more time they were able to discover
more problems. Furthermore, there is
also a strong positive correlation
between the time spent and the number
of errors made (using Pearson
Correlation), the p- value being 0.03.
7. In comparing the results of the testing
methods described here with those of
the traditional testing methods in
AlRoobaea et al., (2013), the traditional
user testing was better at discovering
usability problems than the three
combination methods. For example, the
traditional testing of the BBC
KS3bitesize website identified 16
problems, whereas SC Group, GC Group,
and FR Group identified 9, 13, and 5
respectively. On Skoool website the
traditional testing identified 13
problems, whereas SC Group, GC Group,
and FR Group identified 5, 11, and 4
respectively. Finally, the traditional
testing of Academic Earth website
identified 12 problems, whereas SC
Group, GC Group, and FR Group
identified 6, 8, and 3 respectively. This
leads to a recommendation that using
traditional user testing without
employing ‘think-aloud’ approaches, and
using simple tasks, is a good formula for
the discovery of any usability problems
that may be present.
8. This study found (from the feedback
questionnaire) that teenagers like
websites that provide interactive
features such as online tests, message
boards for providing feedback, asking
questions and playing games. All these
features are present on the BBC
KS3bitesize website and this could well
be why this website achieved a high
satisfaction rate. The low satisfaction
rate achieved by the Academic Earth
website might be related to the huge
amount of information on each page,

Journal of Software & Systems Development 16 __________________________________________________________________________
______________
Roobaea AlRoobaea, Ali H. Al-Badi and Pam J. Mayhew (2013), Journal of Software and Systems
Development, DOI: 10.5171/2013. 172572.
which confused the users during testing
and impacted on their level of
satisfaction, as teenagers do not like to
read a great deal on a website or to have
to look hard for links.
Conclusion
This paper investigated the impact on the
results of usability testing in using three
combinations of three tasks and three ‘think-
aloud’ approaches. These combinations are a
specific task with ‘constructive interaction
think-aloud’, ‘guess task with concurrent
think-aloud’ and, finally, ‘free task with
retrospective think-aloud’. It has been shown
that having different combinations of task
design and ‘think-aloud’ approach can affect
usability testing results by discovering
different usability problems. This was
demonstrated through the results of the
assessment of the sites’ usability obtained
from the experiment in terms of the
problems found. However, the study proves
that there is no need to design complex task
scenarios to discover more usability
problems or to employ ‘think-aloud’
approaches. Designing suitable tasks based
on the website features and understanding
the users’ experiences is quite sufficient to
obtain good results. Further investigation on
how different combinations of task design
and think-aloud approaches can affect
usability testing results is needed to confirm
the findings of this research. In this regard,
we propose to examine the impact of
employing different combinations of ‘think-
aloud’ approaches and task designs; for
example, employ the ‘specific task’ with the
‘retrospective think-aloud’ type or the ‘guess
task’ with the ‘constructive interaction think-
aloud’ type, and also to employ these same
combinations on different websites.
Acknowledgements
We thank the expert evaluators at the School
of Education and Lifelong Learning and the
School of Computing Sciences at the
University of East Anglia (UEA), and the MSc
and PhD students at both these schools, and
also at the Saudi Norwich School (UK) and
Thaghr School in Saudi Arabia. Thanks also
go to the expert evaluators in Aviva company
in the UK for their participation in this
comparative study and in the mini-usability
testing experiments.
References
Al-Badi, A., Michelle, O. Okam, Al Roobaea, R.,
and Mayhew, P. (2013), "Improving Usability
of Social Networking Systems: A Case Study
of LinkedIn," Journal of Internet Social
Networking & Virtual Communities, Vol.
2013 (2013), Article ID 889433, DOI:
10.5171/2013.889433.
Alghamdi,A., Al-Badi, A., Al Roobaea, R., and
Mayhew, P. (2013). A Comparative Study of
Synchronous and Asynchronous Remote
Usability Testing Methods. International
Review of Basic and Applied Sciences. Vol. 1
Issue.3.
Alrobai, A., AlRoobaea, R., Al-Badi, A., and
Mayhew, P. (2012). Investigating the
usability of e-catalogue systems: modified
heuristics vs. user testing, Journal of
Technology Research.
AlRoobaea, R., Al-Badi, A., and Mayhew P.
(2013). A Framework for Generating
Domain-Specific Heuristics for Evaluating
Online Educational Websites. International
Journal of Information Technology &
Computer Science, Volume 8, page 75 - 84.
AlRoobaea, R., Al-Badi, A., and Mayhew P.
(2013). A Framework for Generating
Domain-Specific Heuristics for Evaluating
Online Educational Websites- Further
Validation. International Journal of
Information Technology & Computer
Science, volume 8, page 97 - 105.
AlRoobaea, R., Al-Badi, A., and Mayhew, P.
(2013). Generating a Domain Specific
Inspection Evaluation Method through an
Adaptive Framework: A Comparative Study
on Educational Websites. International
Journal of Human Computer Interaction
(IJHCI), 4(2), 88.
AlRoobaea, R., Al-Badi, A., and Mayhew, P.
(2013). Generating a Domain Specific
Inspection Evaluation Method through an
Adaptive Framework. International Journal
of Advanced Computer Science and
Applications, Vol.4 No.6.

Journal of Software & Systems Development 17
__________________________________________________________________________
______________
Roobaea AlRoobaea, Ali H. Al-Badi and Pam J. Mayhew (2013), Journal of Software and Systems
Development, DOI: 10.5171/2013. 172572.
Alshamari, M. and Mayhew, P. (2008). Task
design: Its impact on usability testing. In
Internet and Web Applications and Services,
2008, ICIW’08. Third International
Conference on, pages 583-589. IEEE.
AlShamari, M., and Mayhew, P. (2010). Task
Formulation in Usability Testing (Doctoral
dissertation, University of East Anglia).
Dale, O., Drivenes, T., Tollefsen, M., and
Reinertsen, A. (2012). User Testing of Social
Media–Methodological Considerations. In
Computers Helping People with Special Needs
(pp. 573-580). Springer Berlin Heidelberg.
Dix, A. (2004). Human-computer interaction.
Prentice Hall.
Dumas, J. and Redish, J. (1999). A practical
guide to usability testing, Lives of Great
Explorers Series, Intellect Books, Portland.
Ebling, M. and John, B. (2000). On the
contributions of different empirical data in
usability testing. In Proceedings of the 3rd
Conference on Designing Interactive
Systems: processes, practices, methods and
techniques, pages 289-296. ACM.
Fang, X., and Holsapple, C. (2011). Impacts of
navigation structure, task complexity, and
users’ domain knowledge on Web site
usability—an empirical study. Information
Systems Frontiers, 13(4), 453-469.
Feng, J., Lazar, J., Kumin, L. and Ozok, A.
(2010). Computer usage by children with
Down’s syndrome: Challenges and future
research. ACM Transactions on Accessible
Computing (TACCESS), 2(3): 13.
Fernandez, A., Insfran, E. and Abrahão, S.,
(2011), Usability evaluation methods for the
web: A systematic mapping study,
Information and Software Technology.
Garrett, J. (2010). The elements of user
experience: user-centered design for the Web
and beyond. New Riders Pub.
Hornbaek, K. (2006). Current practice in
measuring usability: Challenges to usability
studies and research. International journal of
human-computer studies, 64(2): 79-102.
ISO ISO. 9241-11: 1998 ergonomic
requirements for office work with visual
display terminals (vdts) - Part 11: guidance
on usability. Geneve, CH: ISO, 1998.
Jeffries, R., Miller, J.R., Wharton, C. and
Uyeda, K.M. (1991). User interface evaluation
in the real world: A comparison of four
techniques. Proceedings of ACMCHI’91, pp.
119-124. New York: ACM Press.
Khajouei, R., Hasman, A. and Jaspers, M.,
(2011), Determination of the effectiveness of
two methods for usability evaluation using a
CPOE medication ordering system,
International Journal of Medical Informatics,
vol. 80 (5), pp. 341-350.
Krahmer, E. and Ummelen, N. (2004).
Thinking about thinking aloud: A comparison
of two verbal protocols for usability testing.
Professional Communication, IEEE
Transactions on, 47(2): 105-117.
Law, L. and Hvannberg, E. (2002),
complementarily and convergence of
heuristic evaluation and usability test: a case
study of universal brokerage platform. In
Proceedings of the Second Nordic
Conference on Human-Computer Interaction,
pages 71-80, ACM.
Lewis, C. and Polson, P. (1992). Cognitive
walkthroughs: A method for theory-based
evaluation of user interfaces. Paper presented
at the Tutorial at the CHI’92 Conference on
Human Factors in Computing Systems,
Monterey, CA.
Liljegren, E., (2006), Usability in a medical
technology context assessment of methods
for usability evaluation of medical
equipment, International Journal of Industrial
Ergonomics, vol. 36 (4), pp. 345-352.
Lindgaard, G. and Chattratichart, J. (2007).
Usability testing: what have we overlooked?
In Proceedings of the SIGCHI Conference on
Human Factors in Computing Systems, pages
1415-1424. ACM.
Manzari, L., and Trinidad-Christensen, J.
(2013). User-centered design of a web site
for library and information science students:

Journal of Software & Systems Development 18 __________________________________________________________________________
______________
Roobaea AlRoobaea, Ali H. Al-Badi and Pam J. Mayhew (2013), Journal of Software and Systems
Development, DOI: 10.5171/2013. 172572.
Heuristic evaluation and usability testing.
Information technology and libraries, 25(3),
163-169.
Molich, R., Ede, M., Kaasgaard, K. and
Karyukin, B. (2004). Comparative usability
evaluation. Behaviour & Information
Technology, 23(1):65-74.
Nielsen, J. & Molich, R. (1990). Heuristic
evaluation of user interfaces. Proceedings of
the ACM CHI’90 Conference on Human Factors
in Computing Systems, 249–256. New York:
ACM.
Nielsen, J. (1994). Usability engineering.
Morgan Kaufmann.
Nielsen, J. (2000). Why you only need to test
with 5 users. Test 9 (September 23).
Nielsen, J. (2001). Success rate: The simplest
usability metric, available at:
[http://www.useit.com/alertbox/20010218.
html], accessed on 11/6/2012
Nielsen, J. (2006). Quantitative studies: How
many users to test. Alertbox, June, 26:2006.
Nielsen, J. (2009). Authentic behavior in user
testing.
Nielsen, J. and Loranger, H. (2006),
Prioritizing web usability, New Riders Press,
Thousand Oaks, CA, USA.
Oztekin, A., Konga, Z., and Uysal, O. (2010).
UseLearn: A novel checklist and usability
evaluation method for eLearning systems by
criticality metric analysis. International
Journal of Industrial Ergonomics, 40(4): 455-
469, 2010.
Rubin, J. and Chisnell, D. (2008). Handbook of
Usability Testing: How to Plan, Design and
Conduct Effective Tests. Wiley India Pvt. Ltd.
Sauro, J. and Kindlund, E. (2005). A method
to standardize usability metrics into a single
score. In Proceedings of the SIGCHI
Conference on Human Factors in Computing
Systems, pages 401-409. ACM.
Sears, A., (1997), Heuristic walkthroughs:
Finding the problems without the noise,
International Journal of Human-Computer
Interaction, vol. 9 (3), pp. 213-234.
Tan, W., Liu, D. and Bishu, R. (2009). Web
evaluation: Heuristic evaluation vs. user
testing. International Journal of Industrial
Ergonomics, 39(4): 621-627.
Tullis, T. and Albert, W. (2008). Measuring
the User Experience: Collecting, Analyzing,
and Presenting. Morgan Kaufmann,
Burlington.
Tullis, T., Fleischman, S., McNulty, M.,
Cianchette, C. and Bergel, M. (2002). An
empirical comparison of lab and remote
usability testing of web sites. In Usability
Professionals Association Conference. UPA.
Van den Haak, M., de Jong, M. and Schellens,
P. (2004). Employing think-aloud protocols
and constructive interaction to test the
usability of online library catalogues: a
methodological comparison. Interacting with
computers, 16(6): 1153-1170.