The impact of overstory density on sapling height growth in the Missouri Ozarks: implications for...
11
ARTICLE The impact of overstory density on sapling height growth in the Missouri Ozarks: implications for interspecific differentiation during canopy recruitment Lance A. Vickers, David R. Larsen, Benjamin O. Knapp, John M. Kabrick, and Daniel C. Dey Abstract: Successful canopy recruitment is one of the most important components of sustainable forestry practices. For many desirable species in oak-dominated forests, insufficient sapling growth is a common limitation to successful recruitment. The objectives of this study were to (i) examine the impact of overstory density on sapling growth in the Missouri Ozarks, (ii) investigate the potential for overstory retention to promote compositional shifts via interspecific differences in sapling height growth, and (iii) com- pare the use of mean and near-maximum growth rates to quantify the impact of overstory density on sapling growth and height differentiation among species. We found that the periodic annual height increment of saplings decreased with increasing overstory density for all species groups in this study (red oaks (Quercus spp.), white oaks (Quercus spp.), hickories (Carya spp.), sassafras (Sassafras spp.), blackgum (Nyssa spp.), dogwood (Cornus spp.), red maple (Acer spp.), ashes (Fraxinus spp.), and elms (Ulmus spp.)). There was evidence of interspecific differentiation in growth rates during the sapling stage, and the observed differences were more pronounced at low overstory densities. Increasing overstory densities either reduced or eliminated the differences in growth among species. Although red oaks displayed the greatest maximum growth rates of all species under low overstory densities (<5 m 2 ·ha −1 ), the growth advantage of red oaks was reduced with increasing overstory density. This may provide opportunities to shift species composition toward white oaks using partial harvesting regimes in the Missouri Ozarks. However, white oaks had little to no advantage in height growth over many competing species when overstory density exceeded about 10 m 2 ·ha −1 . This implies that the probability of recruit- ment under overstory densities greater than about 10 m 2 ·ha −1 is likely to decline for all oaks in the Missouri Ozarks. We found that using the 90th quantile of height growth rates to evaluate the impact of overstory density on sapling growth had two potential advantages over using the mean growth rate: (i) it provided better models of the limiting effects of overstory density on sapling height growth, and (ii) the focus was on the growth rates of stems that were most likely to recruit into the canopy. Key words: silviculture, regeneration, recruitment, differentiation, quantile. Résumé : Le succès du recrutement dans le couvert dominant est une des plus importantes composantes des pratiques de foresterie durable. Dans le cas de plusieurs espèces désirées des forêts dominées par le chêne, la croissance insuffisante des gaules est le facteur qui limite couramment la réussite du recrutement. Les objectifs de cette étude consistaient a `(i) examiner l'impact de la densité du couvert dominant sur la croissance des gaules dans les monts Ozarks du Missouri, (ii) évaluer le potentiel de mesures de rétention du couvert dominant pour favoriser des changements de composition induits par des différences interspécifiques de croissance en hauteur des gaules et (iii) comparer l’utilisation des taux de croissance moyen et près du maximum pour quantifier l’impact de la densité du couvert dominant sur la croissance des gaules et sur les différences de croissance entre les espèces. Nous avons trouvé que l’accroissement annuel périodique en hauteur des gaules diminuait avec l’augmentation de la densité du couvert dominant pour tous les groupes d’espèces dans cette étude (chênes rouge et blanc, caryers, sassafras, nyssa, cornouiller, érable rouge, frênes et ormes). Il y avait des signes de différences interspécifiques du taux de croissance des gaules et les différences observées étaient plus prononcées lorsque la densité du couvert dominant était faible. L’augmentation de la densité du couvert dominant réduisait ou éliminait les différences de croissance entre les espèces. Bien que le chêne rouge ait montré le taux maximal de croissance le plus élevé parmi toutes les espèces lorsque la densité du couvert dominant était faible (<5 m 2 ·ha −1 ), cet avantage diminuait avec l’augmentation de la densité du couvert dominant. Ceci peut offrir des possibilités de changer la composition des espèces en faveur du chêne blanc a ` l’aide de coupes partielles dans les monts Ozarks du Missouri. Toutefois, l’avantage de croissance en hauteur du chêne blanc était faible ou nul par rapport a ` plusieurs espèces concurrentes lorsque la densité du couvert dominant dépassait environ 10 m 2 ·ha −1 . Ceci implique que la probabilité de recrutement de tous les chênes des monts Ozarks du Missouri va probablement diminuer sous des couverts dominants de densité supérieure a ` 10 m 2 ·ha −1 . Nous avons trouvé que l’utilisation du 90 e quantile du taux de croissance en hauteur pour évaluer l’impact de la densité du couvert dominant sur la croissance des gaules avait deux avantages potentiels par rapport a ` l’utilisation du taux de croissance moyen: (i) meilleurs modèles des effets limitatifs de la densité du couvert dominant sur la croissance en hauteur des gaules, et (ii) emphase placée sur le taux de croissance des tiges les plus susceptibles d’atteindre le couvert dominant. [Traduit par la Rédaction] Mots-clés : sylviculture, régénération, recrutement, différentiation, quantile. Received 13 May 2014. Accepted 12 July 2014. L.A. Vickers, D.R. Larsen, and B.O. Knapp. School of Natural Resources, University of Missouri, 203 ABNR Building, Columbia, MO 65211-7280, USA. J.M. Kabrick and D.C. Dey. USDA Forest Service, Northern Research Station, 202 ABNR Building, Columbia, MO 65211-7260, USA. Corresponding author: Lance A. Vickers (e-mail: [email protected]). 1320 Can. J. For. Res. 44: 1320–1330 (2014) dx.doi.org/10.1139/cjfr-2014-0237 Published at www.nrcresearchpress.com/cjfr on 16 July 2014. Can. J. For. Res. Downloaded from www.nrcresearchpress.com by University of Missouri Columbia on 10/03/14 For personal use only.
Transcript of The impact of overstory density on sapling height growth in the Missouri Ozarks: implications for...

ARTICLE
The impact of overstory density on sapling height growth inthe Missouri Ozarks: implications for interspecificdifferentiation during canopy recruitmentLance A. Vickers, David R. Larsen, Benjamin O. Knapp, John M. Kabrick, and Daniel C. Dey
Abstract: Successful canopy recruitment is one of the most important components of sustainable forestry practices. For manydesirable species in oak-dominated forests, insufficient sapling growth is a common limitation to successful recruitment. Theobjectives of this study were to (i) examine the impact of overstory density on sapling growth in the Missouri Ozarks, (ii) investigate thepotential for overstory retention to promote compositional shifts via interspecific differences in sapling height growth, and (iii) com-pare the use of mean and near-maximum growth rates to quantify the impact of overstory density on sapling growth and heightdifferentiation among species. We found that the periodic annual height increment of saplings decreased with increasing overstorydensity for all species groups in this study (red oaks (Quercus spp.), white oaks (Quercus spp.), hickories (Carya spp.), sassafras (Sassafrasspp.), blackgum (Nyssa spp.), dogwood (Cornus spp.), red maple (Acer spp.), ashes (Fraxinus spp.), and elms (Ulmus spp.)). There wasevidence of interspecific differentiation in growth rates during the sapling stage, and the observed differences were more pronouncedat low overstory densities. Increasing overstory densities either reduced or eliminated the differences in growth among species.Although red oaks displayed the greatest maximum growth rates of all species under low overstory densities (<5 m2·ha−1), the growthadvantage of red oaks was reduced with increasing overstory density. This may provide opportunities to shift species compositiontoward white oaks using partial harvesting regimes in the Missouri Ozarks. However, white oaks had little to no advantage in heightgrowth over many competing species when overstory density exceeded about 10 m2·ha−1. This implies that the probability of recruit-ment under overstory densities greater than about 10 m2·ha−1 is likely to decline for all oaks in the Missouri Ozarks. We found thatusing the 90th quantile of height growth rates to evaluate the impact of overstory density on sapling growth had two potentialadvantages over using the mean growth rate: (i) it provided better models of the limiting effects of overstory density on sapling heightgrowth, and (ii) the focus was on the growth rates of stems that were most likely to recruit into the canopy.
Key words: silviculture, regeneration, recruitment, differentiation, quantile.
Résumé : Le succès du recrutement dans le couvert dominant est une des plus importantes composantes des pratiques de foresteriedurable. Dans le cas de plusieurs espèces désirées des forêts dominées par le chêne, la croissance insuffisante des gaules est le facteurqui limite couramment la réussite du recrutement. Les objectifs de cette étude consistaient a (i) examiner l'impact de la densité ducouvert dominant sur la croissance des gaules dans les monts Ozarks du Missouri, (ii) évaluer le potentiel de mesures de rétention ducouvert dominant pour favoriser des changements de composition induits par des différences interspécifiques de croissance enhauteur des gaules et (iii) comparer l’utilisation des taux de croissance moyen et près du maximum pour quantifier l’impact de ladensité du couvert dominant sur la croissance des gaules et sur les différences de croissance entre les espèces. Nous avons trouvé quel’accroissement annuel périodique en hauteur des gaules diminuait avec l’augmentation de la densité du couvert dominant pour tousles groupes d’espèces dans cette étude (chênes rouge et blanc, caryers, sassafras, nyssa, cornouiller, érable rouge, frênes et ormes). Ily avait des signes de différences interspécifiques du taux de croissance des gaules et les différences observées étaient plus prononcéeslorsque la densité du couvert dominant était faible. L’augmentation de la densité du couvert dominant réduisait ou éliminait lesdifférences de croissance entre les espèces. Bien que le chêne rouge ait montré le taux maximal de croissance le plus élevé parmi toutesles espèces lorsque la densité du couvert dominant était faible (<5 m2·ha−1), cet avantage diminuait avec l’augmentation de la densitédu couvert dominant. Ceci peut offrir des possibilités de changer la composition des espèces en faveur du chêne blanc a l’aide decoupes partielles dans les monts Ozarks du Missouri. Toutefois, l’avantage de croissance en hauteur du chêne blanc était faible ou nulpar rapport a plusieurs espèces concurrentes lorsque la densité du couvert dominant dépassait environ 10 m2·ha−1. Ceci implique quela probabilité de recrutement de tous les chênes des monts Ozarks du Missouri va probablement diminuer sous des couvertsdominants de densité supérieure a 10 m2·ha−1. Nous avons trouvé que l’utilisation du 90e quantile du taux de croissance en hauteurpour évaluer l’impact de la densité du couvert dominant sur la croissance des gaules avait deux avantages potentiels par rapport al’utilisation du taux de croissance moyen: (i) meilleurs modèles des effets limitatifs de la densité du couvert dominant sur la croissanceen hauteur des gaules, et (ii) emphase placée sur le taux de croissance des tiges les plus susceptibles d’atteindre le couvert dominant.[Traduit par la Rédaction]
Mots-clés : sylviculture, régénération, recrutement, différentiation, quantile.
Received 13 May 2014. Accepted 12 July 2014.
L.A. Vickers, D.R. Larsen, and B.O. Knapp. School of Natural Resources, University of Missouri, 203 ABNR Building, Columbia, MO 65211-7280, USA.J.M. Kabrick and D.C. Dey. USDA Forest Service, Northern Research Station, 202 ABNR Building, Columbia, MO 65211-7260, USA.Corresponding author: Lance A. Vickers (e-mail: [email protected]).
1320
Can. J. For. Res. 44: 1320–1330 (2014) dx.doi.org/10.1139/cjfr-2014-0237 Published at www.nrcresearchpress.com/cjfr on 16 July 2014.
Can
. J. F
or. R
es. D
ownl
oade
d fr
om w
ww
.nrc
rese
arch
pres
s.co
m b
y U
nive
rsity
of
Mis
sour
i Col
umbi
a on
10/
03/1
4Fo
r pe
rson
al u
se o
nly.

IntroductionRegeneration and canopy recruitment are two vital ecosystem
processes necessary for sustainable forestry (Dey 2014). Unfortu-nately, difficulties and failures to regenerate either economicallyor ecologically important species are common in many forestecosystems. Although these regeneration failures can result frominadequacies in seed production or poor seedling establishment,insufficient sapling recruitment into the canopy is also a majorcause (Clark et al. 1999; Coates 2002; Peet and Christensen 1987).
Saplings compete with the overstory for space and resourcesboth above and below the ground (Horn 1985). The density, struc-ture, and composition of the overstory has an influence on thequantity and quality of light reaching the forest floor (Canhamet al. 1994; Larsen and Kershaw 1996) and also on the availability ofwater and nutrients (Coomes and Grubb 2000). In turn, resourceavailability affects the abundance, survival, and growth of saplings(e.g., Kneeshaw et al. 2006; Kobe et al. 1995; Pacala et al. 1994).Consequently, the density of the regeneration layer is often re-duced as resource competition intensifies among saplings, but thecohort may be eliminated altogether depending on the magni-tude of release provided by canopy disturbance (Oliver and Larson1996).
Successful canopy recruitment is largely disturbance driven,and there have been several efforts to organize disturbanceresponse patterns into a framework that offers insight into thesuitability of a species to certain environmental conditions (e.g.,MacArthur and Wilson 1967; Noble and Slatyer 1980; Grime 2006).Yet, despite numerous investigations into the impacts of resourcelimitation on canopy recruitment, consensus is lacking on therelative importance of the underlying physiological mechanismsinvolved (Coomes and Grubb 2000; Valladares and Niinemets2008). Stem analyses suggest that successful recruits typically donot experience suppression during their ascent into the canopy(Landis and Peart 2005). Faster growing saplings generally have alower risk of mortality (Kobe et al. 1995) and are more likely tocapture available growing space (Loftis 1990a; Dey et al. 1996).Individuals that successfully differentiate from their peers in stat-ure often benefit from the advantages of asymmetric competition(Schwinning and Weiner 1998; Weiner 1990).
However, rate of growth, per se, may not be an entirely suffi-cient predictor of successful recruitment unless it provides a last-ing advantage in relative stature among co-occurring species withdifferences in life histories (Clatterbuck and Hodges 1988). More-over, growth is only beneficial to the extent that resource avail-ability and (or) efficiency exceed respiration costs (Givnish 1988;Messier et al. 1999). For many species, trade-offs between rapidgrowth with abundant resources and survival with scarce resourcessuggest that efficiency and persistence should be favored as delaysin recruitment extend exposure to suppression (Tilman 1982;Walters and Reich 2000). Thus, shade-intolerant species are likelyto exhibit growth reduction, carbon imbalance, frequent dieback,and increased mortality when recruitment is delayed due to in-sufficient release (Kobe et al. 1995; Poorter et al. 2005).
Increasingly, regeneration methods that leave a partial overstoryare being favored throughout the United States. Concurrently, therehas been increasing concern that widespread recruitment problemsare leading to compositional shifts and reductions in oak impor-tance across much of the eastern United States (e.g., Fei and Steiner2007; Nowacki and Abrams 2008; Oliver et al. 2005). Because oakspecies (Quercus spp.) have historically been an important, andoften dominant, component of these forests, this concern hasprompted extensive research into the regeneration niche of manyoak species (Johnson et al. 2009).
At one time, clear-cutting followed by intermediate thinningswas advocated as the optimal method for maintaining oak-dominated forests in the Central Hardwood Forest Region (Roachand Gingrich 1968). However, clear-cutting has led to oak recruit-
ment failures at highly productive sites where intense and sus-tained competition from shade-intolerant species excludes oaksaplings (Beck and Hooper 1986). Consequently, variations of shel-terwood methods were developed to increase the relative perfor-mance of oak saplings by reducing the abundance and (or) growthof competitors (e.g., Loftis 1990b; Brose et al. 1999). However, par-tial harvesting of oak-dominated forests has allowed for the pro-liferation of shade-tolerant species in some cases (e.g., Schuler2004). This suggests that successful oak recruitment is a complexprocess that is dependent, in part, on stand structure and compo-sition in addition to local site conditions.
Tree recruitment dynamics in the Missouri Ozarks may be ratherunique compared with much of the eastern United States. Thesoils, climate, and flora throughout much of the Missouri Ozarksfavor an oak–hickory (Carya spp.) forest type by limiting the com-position, stature, and (or) longevity of potential competitors(Johnson et al. 2009). While there are few long-lived, shade-intolerant species, and most shade-tolerant species are not capa-ble of persisting through stand development to ascend into thecanopy of mature forests (Dey et al. 1996). This phenomenon isbelieved to be due, in part, to the relatively xeric conditions thatprovide opportunities for oaks to persist where less drought-tolerant species cannot (Larsen and Johnson 1998). Consequently,several silvicultural systems may be appropriate to sustain theoak–hickory forests in the Missouri Ozarks, including single-treeselection (Loewenstein et al. 2000). However, partial harvestinglikely delays recruitment and may promote a successional shiftfrom mixed oaks to predominantly white oaks in the MissouriOzarks (Kabrick et al. 2008b).
To date, results from longitudinal studies suggest that the ef-fects of varying levels of residual overstory density on recruitmentdynamics in oak-dominated forests are not yet fully understood(Kabrick et al. 2008b; Atwood et al. 2011; Schweitzer and Dey 2011).Moreover, there is some uncertainty regarding how the effects ofoverstory density on recruitment should be quantified (Oliveret al. 2005). Overstory density is highly influential on sapling pop-ulations, but growth can be constrained by several limiting fac-tors (Canham et al. 1996; Niinemets and Valladares 2006). Becauseof this complexity, when growth is plotted as a function of a singlelimiting factor, the resulting graph is often a scatter of points withincreasing or decreasing variance (heteroscedasticity) with a con-spicuous upper boundary (Cade et al. 1999; Kaiser et al. 1994).Although the means of such distributions are informative, analternative approach is to use the maxima, which may provide amore ecologically meaningful description of the effect of a singlelimiting factor in the presence of many factors (Cade et al. 1999).In addition, individuals that are most likely to be lasting par-ticipants in the recruitment process often exhibit above-averagegrowth (Landis and Peart 2005; Oliver et al. 2005). This providesopportunities for differentiation in stature, domination of neigh-bors, and continued ascent towards the canopy (Oliver and Larson1996; Schwinning and Weiner 1998; Weiner 1990). Thus, the max-ima of growth–resource relationships are likely to better repre-sent the growth displayed by successful canopy recruits.
Applying knowledge of physiological and ecological principlesto simultaneously meet regeneration and multiple-use objectivesis a hallmark of scientific forest management, but changes incommunity composition, structure, and function should be inten-tional and well reasoned. The ability to quantify and understandthe competitive dynamics that result in the successful recruit-ment and dominance of desired species is essential to preventunintended shifts in forest composition and ecosystem function.Therefore, the objectives of this study are as follows: (i) to examinethe effect of overstory density on sapling growth in the MissouriOzarks, (ii) to investigate the potential for overstory retention topromote shifts in composition via interspecific differences in sap-ling height growth, and (iii) to compare the use of mean andnear-maximum growth rates to quantify the impact of overstory
Vickers et al. 1321
Published by NRC Research Press
Can
. J. F
or. R
es. D
ownl
oade
d fr
om w
ww
.nrc
rese
arch
pres
s.co
m b
y U
nive
rsity
of
Mis
sour
i Col
umbi
a on
10/
03/1
4Fo
r pe
rson
al u
se o
nly.

density on sapling growth and height differentiation amongspecies.
Materials and methodsThe data used in this study were collected from the Missouri
Ozark Forest Ecosystem Project (MOFEP), which encompassesmore than 3700 ha within the Current River watershed in theCarter, Reynolds, and Shannon counties of southeastern Missouri.The study region is an unglaciated, deeply dissected plateau pri-marily comprised of Ordovician and Cambrian dolomites andsandstones (Kabrick et al. 2000). Average annual precipitation is115 cm and average annual temperature is 13.5 °C (Kabrick et al.2008b). Slope aspect and slope position are important character-istics used for site classification in the region (Nigh et al. 2000).The sites used in this study were on exposed (aspect 135–315°) andprotected (aspect 315–135°) backslopes with an average site index(Quercus velutina Lam., base age 50) of 21.0 ± 1.3 m and 22.0 ± 1.1 m,respectively (McQuilkin 1974). Overstory species composition forthe two site classes was heavily dominated (>70% basal area) byoak species (primarily Q. velutina, Q. alba L., Q. coccinea Münchh.,and Q. stellata Wangenh.), and compositional differences betweenthe two site classes were subtle (Kabrick et al. 2004). Protectedbackslopes usually have a slightly higher Q. alba component thanexposed backslopes, whereas Q. stellata and Pinus echinata Mill. aremore common on exposed backslopes (Kabrick et al. 2004). Shifleyand Brookshire (2000) provide a detailed documentation of theabundance and diversity of species found on MOFEP.
MOFEP is a long-term, landscape-scale experiment initiated in1989 by the Missouri Department of Conservation (MDC) to eval-uate the effects of forest management on ecosystem composition,structure, and function within the Missouri Ozark Highlands(Brookshire and Shifley 1997). The forest management systemsunder evaluation at MOFEP include even-aged, uneven-aged, andno-harvest management regimes. The even-aged management re-gime included clearcutting with reserves (�5 m2·ha−1) for standsto be regenerated and intermediate thinning elsewhere, as pre-scribed by Roach and Gingrich (1968). In the clear-cut stands, alllive trees either >3 m in total height or >4 cm in diameter at breastheight (dbh, 1.37 m) were felled, with the exception of trees leftas reserves (Missouri Department of Conservation 1986). Theuneven-aged management regime consisted of single-tree selec-tion on a 15-year harvest cycle with group openings that rangedfrom one to two tree heights (0.03–0.15 ha) interspersed through-out and summed to 5% of the harvested land area, as prescribed byLaw and Lorimer (1989). Areas designated for a no-harvest man-agement regime were maintained as experimental controls. In1996, stands were harvested and MDC Forest Land ManagementGuidelines (1986) were followed. For additional information onMOFEP, including study rationale, experimental design, site con-ditions, inventory methods, and early findings, see Brookshireand Shifley (1997), Shifley and Brookshire (2000), and Shifley andKabrick (2002).
Woody overstory vegetation on MOFEP was sampled via 648circular 0.2 ha permanent plots that were randomly locatedthroughout the study area with the constraint that each standmust have at least one plot located therein. On these 0.2 ha plots,the dbh and the species of trees with a dbh ≥11 cm were recorded.The dbh and the species of woody understory vegetation with adbh of 4–11 cm was sampled on four 0.02 ha subplots nestedwithin each 0.2 ha plot. A stratified random sample of eighty-eight0.02 ha understory subplots (17 clearcut, 23 thinned, 16 harvestedwith single-tree selection, 8 in group openings, and 24 in standsthat were not harvested), equally allocated to exposed and pro-tected backslopes, received measurements additional to those de-scribed above. Due to the random determination of plot locations,the proportion of a subplot occupied by a group opening or single-tree gap varied. At the 88 subplots, the species, dbh, and total
height were recorded for all stems ≥1 m in 1999 (3 years aftertreatment) and again in 2004 (8 years after treatment). Other vari-ables, including the apparent origin of stems (seed or sprout),were recorded but these largely categorical data were not included inthe analyses that follow.
Given the number of species included in this dataset, somespecies were grouped for analyses at the genera or subgeneralevel. All species, genera, or subgenera that had ≥100 trees in thedataset were included in our analyses. The nine species groupsused in this study were as follows: red oaks (Quercus rubra L.,Q. velutina Lam., Q. coccinea Münchh., Q. marilandica Münchh.),white oaks (Q. alba L., Q. stellata Wangenh., Q. muehlenbergiiEngelm.), hickories (Carya tomentosa (Lam. ex Poir.) Nutt., C. glabra(Mill.) Sweet, C. ovata (Mill.) K. Koch., C. texana Buckley, C. cordiformis(Wangenh.) K. Koch.), sassafras (Sassafras albidum (Nutt.) Nees),blackgum (Nyssa sylvatica Marshall), dogwood (Cornus florida L.), redmaple (Acer rubrum L.), ashes (Fraxinus americana L., F. pennsylvanicaMarsh.), and elms (Ulmus alata Michx., U. rubra Muhl., U. americana L.).Within the red oaks group, Q. velutina (75%) and Q. coccinea (23%)were the most common species. Quercus alba (86%) and Q. stellata(12%) were the most common species in the white oaks group.Carya texana (45%), C. tomentosa (34%), and C. glabra (20%) were themajor components of the hickories group. Fraxinus americana (94%)was the most common species in the ashes group, and U. alata(58%) and U. rubra (34%) were the most common elm species.
The response variable analyzed in this study was periodic an-nual height increment (PAIHT) of saplings (trees >1 m tall, ≤5 cmdbh). PAIHT was calculated as the mean annual height incrementbetween the 1999 and 2004 measurements. Only stems that werealive at both measurement intervals and had a PAIHT ≥ 0 wereincluded in our analyses. The random location of the study plotsand the variability in post-treatment overstory densities offered agradient to estimate the effects of overstory density on saplingPAIHT (Table 1; Fig. 1). PAIHT was calculated from the trees withinthe 0.02 ha understory subplots, whereas overstory density (basalarea per hectare of stems ≥11.5 cm dbh) was calculated from the0.2 ha overstory plot that each understory subplot was nestedwithin. Although overstory basal area is an imperfect descriptorof stand density, it is widely used in silvicultural prescriptionsbecause it is simple to measure. Overstory basal area is stronglycorrelated with canopy openness in the Missouri Ozarks (Blizzardet al. 2013) and has proven to be a useful indicator of the compet-itive pressure exerted by overstory trees in other locales (Bigingand Dobbertin 1995; Lorimer 1983).
Plots of PAIHT vs overstory basal area suggested that there wasan exponential decline in growth with increasing overstory basalarea (Fig. 1). Eight variants of a negative exponential function wereused as candidate models to describe this relationship (Table 2).Model I was a basic negative exponential model with only anintercept (a) and decay parameter (b) used to estimate the reduc-tion in sapling growth (PAIHT) as a function of increasing over-story basal area (x1). It was expected that site differences betweenexposed and protected backslopes would impact sapling growth,thus models II, III, and IV incorporated site effects in differentways. Model II posits that site differences have the greatest influ-ence on sapling growth in the absence of overstory competitionand includes a parameter (s1) and indicator variable (x2) for siteclass (0 for exposed backslopes, 1 for protected backslopes) withthe intercept parameter of the basic model. Model III posits thatsite differences have the greatest influence on the rate that sap-ling growth declines with increasing overstory competition andincludes a parameter (s2) and indicator variable (x2) for site classwith the decay parameter of the basic model. Model IV posits thatsite differences influence growth through both of the mecha-nisms described in models II and III and, therefore, includes siteparameters and indicator variables with both the intercept anddecay parameters of the basic model.
1322 Can. J. For. Res. Vol. 44, 2014
Published by NRC Research Press
Can
. J. F
or. R
es. D
ownl
oade
d fr
om w
ww
.nrc
rese
arch
pres
s.co
m b
y U
nive
rsity
of
Mis
sour
i Col
umbi
a on
10/
03/1
4Fo
r pe
rson
al u
se o
nly.
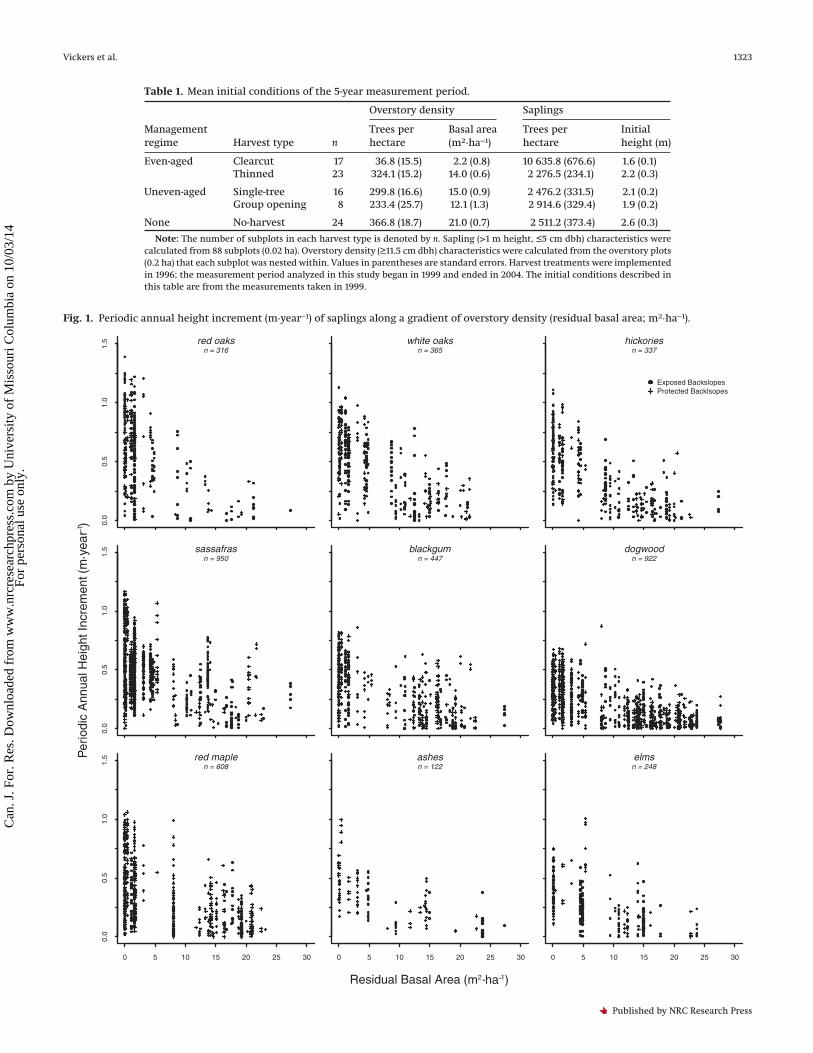
Table 1. Mean initial conditions of the 5-year measurement period.
Overstory density Saplings
Managementregime Harvest type n
Trees perhectare
Basal area(m2·ha−1)
Trees perhectare
Initialheight (m)
Even-aged Clearcut 17 36.8 (15.5) 2.2 (0.8) 10 635.8 (676.6) 1.6 (0.1)Thinned 23 324.1 (15.2) 14.0 (0.6) 2 276.5 (234.1) 2.2 (0.3)
Uneven-aged Single-tree 16 299.8 (16.6) 15.0 (0.9) 2 476.2 (331.5) 2.1 (0.2)Group opening 8 233.4 (25.7) 12.1 (1.3) 2 914.6 (329.4) 1.9 (0.2)
None No-harvest 24 366.8 (18.7) 21.0 (0.7) 2 511.2 (373.4) 2.6 (0.3)
Note: The number of subplots in each harvest type is denoted by n. Sapling (>1 m height, ≤5 cm dbh) characteristics werecalculated from 88 subplots (0.02 ha). Overstory density (≥11.5 cm dbh) characteristics were calculated from the overstory plots(0.2 ha) that each subplot was nested within. Values in parentheses are standard errors. Harvest treatments were implementedin 1996; the measurement period analyzed in this study began in 1999 and ended in 2004. The initial conditions described inthis table are from the measurements taken in 1999.
Fig. 1. Periodic annual height increment (m·year−1) of saplings along a gradient of overstory density (residual basal area; m2·ha−1).
0.0
0.5
1.0
1.5 red oaks
n = 316white oaks
n = 365hickories
n = 337
Exposed BackslopesProtected Backlsopes
0.0
0.5
1.0
1.5 sassafras
n = 950blackgum
n = 447dogwood
n = 922
0 5 10 15 20 25 30
0.0
0.5
1.0
1.5 red maple
n = 608
0 5 10 15 20 25 30
ashesn = 122
0 5 10 15 20 25 30
elmsn = 248
Residual Basal Area
Per
iodi
c A
nnua
l Hei
ght I
ncre
men
t (m
yea
r 1•
-
(m2 ha 1)-•
)
Vickers et al. 1323
Published by NRC Research Press
Can
. J. F
or. R
es. D
ownl
oade
d fr
om w
ww
.nrc
rese
arch
pres
s.co
m b
y U
nive
rsity
of
Mis
sour
i Col
umbi
a on
10/
03/1
4Fo
r pe
rson
al u
se o
nly.

There was evidence of a nonlinear relationship between theinitial sapling height and the PAIHT in this dataset. Although thereis clear biological precedent for such a relationship (Weiner andThomas 2001), differences in sapling establishment dates betweenclear-cut subplots and partial- or no-harvest subplots also likelycontributed to perceived “size” effects on PAIHT. At the beginningof the study period, the maximum initial height of saplings in theclear-cut subplots, which were 3 years after harvest at the start ofthe study period, was about 4.5 m. Saplings in the partial- andno-harvest subplots may have established several years earlierthan the study period and, therefore, had a broader range of ini-tial heights. Models of periodic growth (absolute or relative) thatdo not appropriately account for initial size may be subject to bias(MacFarlane and Kobe 2006). Thus, the effect of initial height wasparameterized by adding an initial height covariate (x3) and expo-nent (�) parameter (Pacala et al. 1994; MacFarlane and Kobe 2006)to all models described above, resulting in models i, ii, iii, and ivlisted in Table 2.
Parameter estimates for mean PAIHT were obtained via the gen-eralized nonlinear least squares (GNLS) function within the NLMEpackage (Pinheiro et al. 2011) in R version 2.13.0 (R Core Team2013). GNLS extend nonlinear regression by allowing for corre-lated errors and (or) nonconstant variance (Pinheiro and Bates2000). In this dataset, variance was clearly nonconstant and wasmodeled as a power function of the conditional mean. The datawere structured as repeated measurements (trees) in space (sub-plot), making it likely that trees on the same subplot had corre-lated errors. Thus, a compound symmetric covariance structurewas incorporated to account for within-subplot error correlation.
Nonlinear quantile regression (Koenker 2005) was used tomodel the near maxima of the growth–resource distributions inthis study (Cade and Noon 2003). Quantile regression allows forthe estimation of conditional quantiles (e.g., 25th, 50th, 75th, etc.)instead of the conditional mean of a response variable as a func-tion of covariates (Koenker 2005). The maximum quantile that canbe precisely estimated varies with sample size and data distribu-tion; thus, estimates of the absolute maxima (e.g., 99th quantile)may not be reliable without very large samples due to potentialfor bias from measurement error and other sources (Cade et al.1999). To avoid limitations due to sample size, the 90th quantilewas chosen to represent the near-maxima of the growth–resourcedistributions (PAIHT-Q90). Parameter estimates for the quantile re-
gression analyses were obtained via the nonlinear quantile regres-sion function within the QUANTREG package (Koenker 2012) in Rversion 2.13.0 (R Core Team 2013).
The candidate models were compared using Akaike’s informa-tion criterion corrected for small sample sizes (AICc) (Burnhamand Anderson 1998). For a species group, the model with the low-est AICc value was selected as the “best” model among all thoseconsidered (Burnham and Anderson 1998). Goodness-of-fit for thebest models was calculated using the square of Pearson’s correla-tion coefficient (r2) of predicted values against observed values.Paired bootstrapping (2000 iterations, percentile method) wasused to construct pointwise 95% confidence bands (Harrell 2001)for the best models of both mean and near-maximum PAIHT. Theseconfidence bands were used for visual statistical inference amonggroups. Nonoverlapping confidence bands indicate statistical dif-ferences among groups at a significance level of � ≤ 0.05, althoughstatistical differences may also exist where confidence bands over-lap slightly.
ResultsThe best models (according to the lowest AICc value) explained
between 28% and 55% of the variation in mean PAIHT (r2, Table 3).Initial sapling height was a significant predictor of mean PAIHT forall species groups. There was considerable uncertainty in param-eter estimates for some species, particularly for the parametersassociated with site productivity. The best models of mean PAIHT
for all species groups included one or more parameter(s) to accountfor differences between the exposed and protected backslopes.Sassafras, blackgum, red maple, and elms were best representedby model iv, which included a site modifier for both the interceptand decay parameters. Red oaks, white oaks, hickories, and dog-wood were best represented by model ii, which included a sitemodifier for only the intercept parameter. Ashes were best repre-sented by model iii which included a site modifier for the decayparameter only.
The parameter estimate for initial sapling height (�) varied amongspecies (Table 3). For all species, � was positive but <1, which indi-cated that larger stems had an advantage over smaller stems(Fig. 2), but the magnitude per unit size diminished with increas-ing size (MacFarlane and Kobe 2006). The growth advantage ex-hibited by larger saplings was greatest at low overstory densitiesand diminished considerably with increasing overstory density(Fig. 2).
The mean PAIHT of saplings decreased with increasing overstorydensity for all species groups (Fig. 3). As overstory density in-creased, decreases in mean PAIHT were similar among most spe-cies except for sassafras and red maple on exposed backslopes,which declined less in growth rate than the other species. Fewchanges in rank occurred among species as mean PAIHT convergedwith increasing overstory density. The range of separation inmean PAIHT among all species groups was about 50 cm·year−1 withno residual overstory and was reduced to about 25 cm·year−1 at thehighest densities in this study (30 m2·ha−1). There was evidence ofdifferentiation among species groups in mean PAIHT at the lowestlevels of overstory density and on exposed backslopes, particu-larly for those that occupied different strata in mature forests inthe Missouri Ozarks. Oaks exhibited an advantage over many spe-cies at low overstory densities, but the advantage decreased withan increasing overstory density.
In general, mean PAIHT was somewhat greater on protectedbackslopes than on exposed backslopes for most species groups(Fig. 2). However, the increases in mean PAIHT related to slopeaspect were only statistically significant for sassafras (s1, Table 3).Red maple and elms exhibited considerable but nominal increases inmean PAIHT at low overstory densities as site quality increased. Incontrast, blackgum and dogwood were much less competitive on
Table 2. Candidate models for estimating PAIHT ofsaplings as a function of residual overstory densityand other covariates.
Model df Form
I 3 PAIHT = aex1/b
i 4 PAIHT = �aex1/b�x3�
II 4 PAIHT = �a � s1x2�ex1/b
ii 5 PAIHT = ��a � s1x2�ex1/b�x3
�
III 4 PAIHT = aex1/�b�s2x2�
iii 5 PAIHT = �aex1/�b�s2x2��x3�
IV 5 PAIHT = �a � s1x2�ex1/�b�s2x2�
iv 6 PAIHT = ��a � s1x2�ex1/�b�s2x2��x3
�
Note: The parameters estimated from the data are asfollows: x1, overstory basal area (m2·ha−1); x2, site class (0 ifexposed backslopes, 1 if protected backslopes); x3, initialsapling height (m); a, intercept; b, decay; s1, site class mod-ifier to intercept; s2, site class modifier to decay; �, initialsapling height modifier. Parameter estimates for the meanwere fit using GNLS with the variance modeled as a powerfunction of the conditional mean and a compound symmet-ric error correlation structure. These additional parametersare not included in the reported degrees of freedom (df).Parameter estimates for the near maxima were fit usingnonlinear quantile regression, which does not account forvariance heterogeneity or error correlation.
1324 Can. J. For. Res. Vol. 44, 2014
Published by NRC Research Press
Can
. J. F
or. R
es. D
ownl
oade
d fr
om w
ww
.nrc
rese
arch
pres
s.co
m b
y U
nive
rsity
of
Mis
sour
i Col
umbi
a on
10/
03/1
4Fo
r pe
rson
al u
se o
nly.

protected backslopes, particularly at low overstory densities. Ac-cording to the site parameter estimates, mean PAIHT for blackgumand dogwood was lower (nominally for blackgum) on protectedthan exposed backslopes, but the rank changes across site classeswas driven more by greater mean PAIHT for sassafras, red maple,and elm than by lower mean PAIHT for blackgum and dogwood (s1,Table 3). Ashes and blackgum exhibited nominally lower reduc-tions in mean PAIHT as the overstory density increased on protectedbackslopes than on exposed backslopes (s2, Table 3). Hickories exhib-ited modest but nominal increases in mean PAIHT at low overstorydensities on protected backslopes. Both red oaks and white oaksexhibited only slight nominal increases in mean PAIHT at lowoverstory densities on protected backslopes.
The best models of near-maximum growth rates using PAIHT-Q90were more parsimonious than the models of mean PAIHT (Table 4).Except for sassafras, the best model of PAIHT-Q90 was model I,which included only the intercept and scale parameters. The bestmodel for sassafras (model II) included a site modifier for theintercept. The interval estimates for the decay parameter (b, Table 4)largely overlapped across species groups and provided littleevidence of species segregating into distinct tolerance classes re-lated to growth decline at the sapling stage. The PAIHT-Q90 of mostspecies was reduced by half [ln(2)·b] between 10 m2·ha−1 and15 m2·ha−1. Sassafras exhibited the greatest tolerance in growth tooverstory density, reducing in growth by half at about 28 m2·ha−1.
Quantile regression analyses of PAIHT-Q90 provided evidence ofgreater interspecific differentiation in sapling growth than wassuggested by mean PAIHT. Among species groups in this study,PAIHT-Q90 suggested a four-tiered growth hierarchy at low over-story densities. Red oaks were the fastest growing species andexhibited significantly greater growth than all other species in theabsence of an overstory (Fig. 4). The difference in PAIHT-Q90 be-tween red oaks and the second tier, which included white oaks,hickories, red maple, and sassafras (protected aspects), was ap-proximately 15 cm·year−1. Red oaks were able to maintain a statis-tical advantage over the second tier only when overstory densitieswere <�5 m2·ha−1. At low overstory densities, PAIHT-Q90 for redoaks was approximately 40 cm·year−1 greater than blackgum,ashes, elms, and sassafras (exposed aspects), which comprised thethird tier of growth. Red oaks were statistically indistinguishablefrom the third tier once overstory density reached about 10 m2·ha−1.The difference in PAIHT-Q90 between red oak and dogwood (fourthtier) was greatest in the absence of an overstory (≈50 cm·year−1),but the difference decreased as overstory density increased andwas only statistically significant below about 18 m2·ha−1.
PAIHT-Q90 was significantly greater (≈15 cm·year−1) for the sec-ond tier than for the third tier without a residual overstory, butthe two tiers were largely indistinguishable once overstory den-sity exceeded about 5 m2·ha−1. PAIHT-Q90 was significantly lowerfor dogwood than for all other species when overstory density was
Table 3. Parameter estimates for best models of mean PAIHT of saplings as a function of overstory density and other covariates.
Species N/n Model a b s1 s2 � Power Rho RSE r2
Akaikeweights
Red oaks 320/35 ii 0.443 (0.03) −13.591 (1.70) 0.043 (0.03) — 0.636 (0.08) 0.492 0.039 0.343 0.39 0.60White oaks 365/48 ii 0.547 (0.05) −10.552 (1.12) 0.041 (0.05) — 0.301 (0.07) 0.141 0.217 0.227 0.46 0.59Hickories 343/61 ii 0.497 (0.08) −12.198 (1.74) 0.096 (0.09) — 0.169 (0.08) 0.612 0.514 0.459 0.48 0.33Sassafras 968/58 iv 0.446 (0.06) −21.762 (6.33) 0.176 (0.08) 6.922 (7.14) 0.109 (0.04) 0.032 0.608 0.199 0.26 0.57Blackgum 455/62 iv 0.422 (0.05) −12.612 (1.81) −0.062 (0.06) −6.964 (3.83) 0.392 (0.08) 0.369 0.213 0.274 0.42 0.93Dogwood 455/81 ii 0.347 (0.03) −12.418 (0.85) −0.054 (0.02) — 0.339 (0.06) 0.588 0.162 0.325 0.41 0.54Red maple 646/44 iv 0.289 (0.06) −29.076 (13.15) 0.133 (0.07) 15.921 (13.24) 0.409 (0.06) 0.742 0.205 0.472 0.38 0.99Ashes 122/20 iii 0.414 (0.05) −13.493 (3.11) — −2.060 (4.43) 0.397 (0.13) 0.346 0.387 0.223 0.55 0.65Elms 249/24 iv 0.351 (0.09) −16.767 (6.61) 0.158 (0.12) 5.496 (7.25) 0.169 (0.08) 0.461 0.411 0.297 0.34 0.74
Note: N/n is the total number of trees in the understory subplots and total number of overstory plots in which a species was measured, respectively. The model listedis the best model for a species, according to the AICc value found from the candidate models described in Table 2. The model parameters estimated from the data areas follows: a, intercept; b, decay; s1, site class modifier to intercept; s2, site class modifier to decay; �, initial sapling height modifier. Parameter estimates were fit usingGNLS with the variance modeled as a power function of the conditional mean (power) and a compound symmetric error correlation structure at the overstory plot level(rho). RSE is the residual standard error of the model. Goodness-of-fit was assessed using the square of Pearson's correlation coefficient (r2) of predicted values againstobserved values. The Akaike weights indicate the proportional weight of evidence for the best model relative to the other candidate models in Table 2. Values inparentheses are standard errors. Bold text indicates parameters included in a model that were not statistically significant (� = 0.05).
Fig. 2. Impact of initial height on sapling mean periodic annual height increment (m·year−1) for red and white oaks along a gradient ofoverstory density (residual basal area; m2·ha−1). Graphs are shown for exposed backslopes (left two graphs) and protected backslopes (righttwo graphs).
0.0
0.5
1.0
0.25
0.75
1.25
0 5 10 15 20 25 30
red oaksExposed Backslopes (136 − 315o)
0 5 10 15 20 25 30
white oaksExposed Backslopes (136 − 315o)
0 5 10 15 20 25 30
red oaksProtected Backslopes(316 − 135o)
0 5 10 15 20 25 30
Initial Height
1m2m3m4m
white oaksProtected Backslopes(316 − 135o)
Residual Basal Area
Mea
n P
erio
dic
Ann
ual H
eigh
t Inc
rem
ent
(m2 ha 1-•
(m y
ear 1
•- )
)
Vickers et al. 1325
Published by NRC Research Press
Can
. J. F
or. R
es. D
ownl
oade
d fr
om w
ww
.nrc
rese
arch
pres
s.co
m b
y U
nive
rsity
of
Mis
sour
i Col
umbi
a on
10/
03/1
4Fo
r pe
rson
al u
se o
nly.

less than about 5 m2·ha−1. Beyond that threshold, dogwood andelms were statistically indistinguishable, and at overstory densi-ties greater than about 20 m2·ha−1, dogwood was only significantlydifferent from sassafras, blackgum, and white oak.
DiscussionThe influence of overstory density on recruitment is a critical
component of community dynamics (Oliver and Larson 1996). Wefound that the method of statistical analysis was an importantfactor in quantifying and interpreting these dynamics. By placinggreater emphasis on saplings with the best intraspecific growthrates, quantile regression analyses of PAIHT-Q90 provided evidenceof greater interspecific differentiation in sapling growth than wassuggested by mean PAIHT. Moreover, AICc scores ranked the basic
negative exponential models for PAIHT-Q90 better than the morecomplex models using quantile regression. In contrast, AICc
scores ranked the more complex models better for the mean,supporting the notion that the maxima of growth–resource dis-tributions provide more ecologically meaningful estimates of theeffect of a single limiting factor in the presence of multiple limit-ing factors (Cade et al. 1999; Cade and Guo 2000). Growth differ-entiation is often difficult to quantify with traditional statisticalprocedures (e.g., Oliver et al. 2005); our results support the use ofquantile regression to quantify a more meaningful response bytargeting the population of above-average performers that aremost successful.
The species analyzed in this study span a range of reportedshade tolerance (Baker 1949; Burns and Honkala 1990; Niinemets
Fig. 3. Mean regression curves and confidence bands for sapling periodic annual height increment (m·year−1) along a gradient of overstorydensity (residual basal area; m2·ha−1) for both exposed and protected backslopes. Figure adjusted to represent an initial sapling height of 2 m,which was approximately average across the study. Regression curves are depicted for hickories, sassafras, red maple, and ashes. Confidencebands are depicted for red oaks, white oaks, blackgum, elms, and dogwood. Nonoverlapping confidence bands indicate differences amonggroups at a significance level � ≤ 0.05. Statistically significant differences among groups may also exist in areas where their confidence bandsslightly overlap.
00.
51
0.75
0.25
0 5 10 15 20 25 30
Exposed Backslopes (136 − 315o)
00.
51
0.75
0.25
0 5 10 15 20 25 30
Red OaksWhite OaksHickoriesSassafrasBlackgumDogwoodRed MapleAshesElms
|
Protected Backslopes (316 − 135o)
Residual Basal Area
Per
iodi
c A
nnua
l Hei
ght I
ncre
men
t
(m2 ha 1)-•
(m y
ear -
•)1
Table 4. Parameter estimates for best models of PAIHT-Q90 of saplings.
a b s1
Species Model Mean (SE) CI Mean (SE) CI Mean (SE) CIAkaikeweights
Red oaks I 1.066 (0.04) 1.00, 1.16 −14.371 (2.02) −18.13, −11.29 — 0.29White oaks I 0.907 (0.03) 0.85, 0.96 −22.282 (2.82) −27.67, −16.75 — 0.34Hickories I 0.878 (0.03) 0.84, 0.91 −15.315 (1.70) −18.93, −13.23 — 0.41Sassafras II 0.658 (0.01) 0.63, 0.69 −40.927 (5.77) −54.3, −30.45 0.271 (0.02) 0.21, 0.31 0.38Blackgum I 0.707 (0.02) 0.68, 0.74 −26.117 (2.92) −35.59, −21.82 — 0.36Dogwood I 0.567 (0.01) 0.54, 0.58 −18.488 (1.05) −21.12, −16.44 — 0.39Red maple I 0.859 (0.02) 0.82, 0.89 −18.195 (1.32) −20.49, −15.23 — 0.31Ashes I 0.646 (0.08) 0.60, 0.91 −20.826 (6.01) −39.53, −13.08 — 0.39Elms I 0.657 (0.02) 0.60, 0.72 −20.227 (3.91) −28.34, −14.85 — 0.41
Note: The model listed is the best model for a species selected by the AICc value found from the candidate models described in Table 2. Themodel parameters estimated from the data are as follows: a, intercept; b, decay; s1, site class modifier to intercept. Parameter estimates werefit using nonlinear quantile regression of 0.9 conditional quantile of the response distribution. The Akaike weights indicate the proportionalweight of evidence for the best model relative to the other candidate models in Table 2. SE estimates are from the nonlinear quantileregression. CI values are bootstrapped confidence intervals for parameter estimates (� = 0.05). All parameters were statistically significant.
1326 Can. J. For. Res. Vol. 44, 2014
Published by NRC Research Press
Can
. J. F
or. R
es. D
ownl
oade
d fr
om w
ww
.nrc
rese
arch
pres
s.co
m b
y U
nive
rsity
of
Mis
sour
i Col
umbi
a on
10/
03/1
4Fo
r pe
rson
al u
se o
nly.

and Valladares 2006). The growth of all species declined as theoverstory density increased, and the rate of decline differedamong some species (parameter b, Table 4). Thus, there was someevidence of rank changes among species in the magnitude ofgrowth along the gradient of overstory density analyzed in thisstudy (Fig. 4). We found that the overstory density affected thegrowth of sassafras the least. In fact, the overstory density atwhich growth was reduced by half for sassafras was almost doublethat of all other species (Table 4). Moreover, the magnitude ofgrowth for sassafras became greater than most other species asoverstory density increased, especially on protected backslopes(Fig. 4). Although sassafras is generally considered intolerant ofshade, Bazzaz et al. (1972) reported that sassafras was able to pho-tosynthesize efficiently at low light intensities. However, reliablerecruitment of sassafras via small openings in the canopy of ma-ture forests in the Missouri Ozarks has not been reported.
Interpreting the observed differences among species in themagnitude of growth, albeit statistically significant, as ecologi-cally meaningful may be premature. We do not yet know if thereare threshold rates of growth for a species to successfully recruitinto the canopy or how such thresholds might vary with ontogenyor other factors such as site, overstory composition and structure,and disturbance regime (Poorter et al. 2005; Wright et al. 2000).Nonetheless, canopy recruitment is a process rather than anevent; thus, the cumulative effects of even minor sustained advan-tages could prove influential.
Previous studies in the Missouri Ozarks have suggested thatinterspecific differences in reproduction abundance are related tosite quality and residual overstory density (Green 2008; Kabricket al. 2008b; Larsen et al. 1997). Our results showed that speciesalso exhibited differentiated growth rates during the sapling stageand that differences were most pronounced at relatively low over-story densities (<10 m2·ha−1). Residual overstory densities >5 m2·ha−1
eliminated the growth advantage of red oaks over white oaks. Inthe Missouri Ozarks, susceptibility to episodic red oak declineevents may be a catalyst for foresters to favor white oaks over redoaks (Shifley et al. 2006; Kabrick et al. 2008a). Our results suggestthat there is potential for partial harvesting methods to reachsuch an objective. However, the growth advantage exhibited bywhite oaks over competing species also decreased with increasingoverstory density. White oaks had little to no advantage in heightgrowth over many competing species when the overstory densityexceeded about 10 m2·ha−1. Moreover, the sprouting probabilitiesand subsequent growth rates of oaks have also been reported todecrease with increasing overstory density (Dey et al. 2008; Atwoodet al. 2009). This implies that the probability of recruitment underoverstory densities greater than about 10 m2·ha−1 is likely to de-cline for all oaks in the Missouri Ozarks, which is consistent withthe residual overstory densities recommended to sustain oak re-cruitment by Larsen et al. (1997, 1999). Oliver et al. (2005) reportedsimilar recruitment dynamics with increasing overstory densityin the bottomland forests of the southern United States, but the
Fig. 4. Quantile regression curves and confidence bands for the 90th quantile of sapling periodic annual height increment (m·year−1) along agradient of overstory density (residual basal area; m2·ha−1). Regression curves are depicted for hickories, sassafras, red maple, and ashes.Confidence bands are depicted for red oaks, white oaks, blackgum, elms, and dogwood. Nonoverlapping confidence bands indicatedifferences among groups at a significance level � ≤ 0.05. Statistically significant differences among groups may also exist in areas wheretheir confidence bands slightly overlap.
0.0
0.5
1.0
1.25
0.75
0.25
0 5 10 15 20 25 30
Red OaksWhite OaksHickoriesSassafras (exposed)Sassafras (protected)BlackgumDogwoodRed MapleAshesElms
|
Residual Basal Area
Per
iodi
c A
nnua
l Hei
ght I
ncre
men
t
(m2 ha 1)-•
(m y
ear 1 -
•)
Vickers et al. 1327
Published by NRC Research Press
Can
. J. F
or. R
es. D
ownl
oade
d fr
om w
ww
.nrc
rese
arch
pres
s.co
m b
y U
nive
rsity
of
Mis
sour
i Col
umbi
a on
10/
03/1
4Fo
r pe
rson
al u
se o
nly.

threshold densities recommended for oak recruitment werelower.
Many of the species analyzed in this study rarely (ashes, black-gum, elms, red maple, sassafras) or never (dogwood) attain over-story stature in the mature forests of the Missouri Ozarks (Burnsand Honkala 1990; Johnson et al. 2009). However, these speciesgroups are often among the most abundant members of the seed-ling and sapling layer during stand development (Dey 1991; Johnsonet al. 2009; Schlesinger et al. 1993). Because of this, these commonassociates in oak–hickory forests play an influential, albeit tem-porally constrained, role in the canopy recruitment process bylimiting spatial opportunities for recruitment and delaying or,perhaps, eliminating the release of neighboring oaks and hicko-ries from the sapling strata by exhibiting increasingly comparablegrowth under increasing overstory density. The temporal impor-tance of this limiting influence is likely more constrained in theMissouri Ozarks than in the more mesic parts of the easternUnited States, where many of the competing species that we ana-lyzed and several others have greater potential to reach the over-story and are a more lasting source of competition (Atwood et al.2011; Loftis 1990b; Nowacki and Abrams 2008; Oliver et al. 2005;Schuler 2004). As increasing overstory density progressively re-duces both sapling abundance and differences in growth rates,repeated disturbance, stochasticity, and differentiation along othergradients may become more important determinants of recruit-ment success (Beckage and Clark 2003; Grubb 1977). In general,oaks and hickories are thought to predominately utilize persis-tence strategies for regeneration and recruitment and exhibit var-ious degrees of tolerance to both drought and fire (Arthur et al.2012; Brose et al. 2013; Burns and Honkala 1990). The ability topersist in temporarily unfavorable conditions via dieback, vegeta-tive reproduction, and seedling storage increases longevity (Bondand Midgley 2003; Warner and Chesson 1985). It is likely thatdifferential mortality plays an important role in recruitment dy-namics (Coates 2002; Pacala et al. 1996; Wright et al. 1998). Giventhe relatively xeric conditions of the Missouri Ozarks, differencesin mortality rates among species may provide additional opportu-nities for differentiation during the sapling stage; however, this isan area in need of quantitative research.
Undoubtedly, other factors, in addition to overstory density,affect sapling growth as evidenced by the spread of response inFig. 1. One likely source of the variation in growth that we ob-served was an inability of the overstory metric used in this studyto capture the spatial heterogeneity of resource availability. Vary-ing spatial arrangement while maintaining the same stand-levelbasal area can substantially alter competitive neighborhoods andinfluence regeneration and other ecosystem processes (Boydenet al. 2012; Palik et al. 2003). The models of mean PAIHT suggestthat another source of the observed variation in growth was sitequality. Despite many nonsignificant site parameters (Table 3),models of mean PAIHT that included site differences were rankedbetter by AICc for all species groups. It is possible that the nonsig-nificance of site parameters was due to inherent variation, modelmisspecification, and (or) the coarse-scaled site delineation usedin these analyses. Another possible explanation is the limitedobservation period of this study, although greenhouse studieshave found site effects on tree seedling growth after a single grow-ing season (Latham 1992).
The influence of site was greatest for the four species that werebest described by model iv. We observed a relatively large increasein growth on protected backslopes compared with exposed back-slopes for sassafras, red maple, and elms in this study. This isconsistent with several other studies that reported an increasedimportance of these species on more productive sites (e.g., Kabricket al. 2008b; Schlesinger et al. 1993). However, the increase in meanPAIHT from exposed to protected backslopes was accompanied bynominal increases in the rate that growth declined with increas-ing overstory density (s2, Table 3). This suggests that growth and
(or) tolerance trade-offs may exist for these species (Kaelke et al.2001; Niinemets and Valladares 2006; Walters and Reich 2000) butis inconclusive because overstory composition, structural ar-rangement, and other potentially confounding differences amongplots were not accounted for.
Increases in mean PAIHT from exposed to protected backslopeswere expected and observed (sometimes nominally) for most spe-cies but not all (s1, Table 3). Blackgum showed evidence of havingreduced growth at better sites with low overstory densities buthad a nominal reduction in the rate that growth declined withincreasing overstory density. This is consistent with Abrams’ (2007)suggestion that blackgum should be most successful in xeric up-land forests. There, the disadvantages of relatively slow inherentgrowth rates may be somewhat mitigated by considerable stresstolerance and a reduction in the number and competitive capacityof associated species (Abrams 2007). Our results suggest that thespecies that were best described by model ii (oaks, hickories, anddogwood) were also influenced by differences in site class; how-ever, the relationship between site class and overstory density onmean PAIHT was not as dynamic as the species described by modeliv. Mean PAIHT of oaks and hickories at low overstory densities wasnominally greater on protected backslopes than on exposed back-slopes. However, we observed a significant reduction in mean PAIHT
on protected backslopes compared with exposed backslopes for dog-wood. Given the reported shade tolerance and drought intoler-ance of this understory species (Horn 1985; McLemore 1990), thisresult was not expected.
It has long been known that a seedling bank of large advancereproduction is often vital to successful canopy recruitment ofoaks due to the inherently slow growth of seedlings that lackwell-developed root systems (Johnson et al. 2009). Due to frequentdieback and resprouting of upland oaks, root-collar diameter is abetter predictor of root biomass than height (Knapp et al. 2006).Nonetheless, we found that initially taller oak saplings exhibiteda growth advantage in mean PAIHT over shorter saplings (Fig. 2).The magnitude of the initial height effect on mean PAIHT wasmuch more pronounced for red oaks (� = 0.64, Table 3) than forwhite oaks (� = 0.30, Table 3), which is consistent with previousestimates of the relative impact of size on reproduction growthamong oak species (Dey 1991). In fact, an initial height effect onmean PAIHT was significant for all species in this study (�, Table 3).However, the effect of size on competitive capacity under a denseoverstory was limited due to the intrinsically low growth for allsaplings in that setting (Fig. 2).
Our results provide insight into how overstory density manip-ulation alters the composition and structure of the regenerationlayer in Missouri Ozark forests. This information could be valu-able to foresters considering regeneration techniques that utilizepartial cutting and multiple entries. Although we have not yetestablished longitudinal growth thresholds for successful canopyrecruitment across a range of overstory density, the models ofmean PAIHT presented herein should provide inferences into thetiming required to attain recommended size thresholds for ad-vance reproduction prior to a planned harvest (e.g., Brose et al.2008; Sander et al. 1984). This potentially extends the applicationof existing regeneration simulators (e.g., Dey et al. 1996) by pro-viding insight into how preparatory partial harvesting might alterthe structure of the regeneration layer prior to a clear-cut harvest.Of course, this potential is constrained by the species and sizesreported in this study and the inherent assumptions of existingregeneration simulators.
ConclusionPAIHT of saplings decreased within increasing overstory density
for all species groups (objective i). Secondly, species differentia-tion in growth rates occurred during the sapling stage, but differ-ences were most pronounced at lower overstory densities. We
1328 Can. J. For. Res. Vol. 44, 2014
Published by NRC Research Press
Can
. J. F
or. R
es. D
ownl
oade
d fr
om w
ww
.nrc
rese
arch
pres
s.co
m b
y U
nive
rsity
of
Mis
sour
i Col
umbi
a on
10/
03/1
4Fo
r pe
rson
al u
se o
nly.

identified thresholds in overstory densities that are related topossible shifts in species composition on certain sites in the Mis-souri Ozarks (objective ii). This information should be valuable toforesters and improve the likelihood of achieving regenerationobjectives. Finally, we suggest that the near-maxima of growth–resource distributions have two potential advantages over themean: (1) better models of the limiting effects of overstory densityon sapling height growth were provided, and (2) the focus was onthe growth rates of stems that were most likely to recruit into thecanopy (objective iii). Additional research into the role of recruit-ment fluctuation is certainly warranted. Longitudinal monitoringof individuals in addition to populations on established studieslike MOFEP will be essential to better understand the biology andecology of forest dynamics and provide science-based manage-ment guidelines.
AcknowledgementsWe gratefully acknowledge the Missouri Department of Con-
servation for providing data from the Missouri Ozark Forest Eco-system Project. We thank Jason Green, Randy Jensen, and thenumerous technicians that assisted with data collection. Fundingfor this study was provided by the USDA Forest Service NorthernResearch Station, the Missouri Department of Conservation, andthe University of Missouri. We thank the Associate Editor and twoanonymous reviewers for their helpful comments.
ReferencesAbrams, M.D. 2007. Tales from the blackgum, a consummate subordinate tree.
Bioscience, 57(4): 347–359. doi:10.1641/B570409.Arthur, M.A., Alexander, H.D., Dey, D.C., Schweitzer, C.J., and Loftis, D.L. 2012.
Refining the oak-fire hypothesis for management of oak-dominated forestsof the eastern United States. J. For. 110: 257–266.
Atwood, C.J., Fox, T.R., and Loftis, D.L. 2009. Effects of alternative silviculture onstump sprouting in the southern Appalachians. For. Ecol. Manage. 257: 1305–1313. doi:10.1016/j.foreco.2008.11.028.
Atwood, C.J., Fox, T.R., and Loftis, D.L. 2011. Effects of various silvicultural sys-tems on regeneration in mixed hardwood stands of the southern Appala-chians. J. Sust. For. 30: 419–440. doi:10.1080/10549811.2011.541020.
Baker, F.S. 1949. A revised tolerance table. J. For. 47: 179–181.Bazzaz, F.A., Paape, V., and Boggess, W.R. 1972. Photosynthetic and respiratory
rates of Sassafras albidum. For. Sci. 18: 218–222.Beck, D.E., and Hooper, R.M. 1986. Development of a southern Appalachian
hardwood stand after clearcutting. South. J. Appl. For. 10: 168–172.Beckage, B., and Clark, J.S. 2003. Seedling survival and growth of three forest
tree species: the role of spatial heterogeneity. Ecology, 84(7): 1849–1861. doi:10.1890/0012-9658(2003)084[1849:SSAGOT]2.0.CO;2.
Biging, G.S., and Dobbertin, M. 1995. Evaluation of competition indices in indi-vidual tree growth models. For. Sci. 41(2): 360–377.
Blizzard, E.M., Kabrick, J.M., Dey, D.C., Larsen, D.R., Pallardy, S.G., and Gwaze, D.P.2013. Light, canopy closure, and overstory retention in upland Ozark forests.In Proceedings of the 15th Biennial Southern Silvicultural Research Confer-ence. Edited by J.M. Guldin. USDA Forest Service, Southern Research Station,Asheville, North Carolina, Gen. Tech. Rep. SRS-GTR-175. pp. 73–79.
Bond, W.J., and Midgley, J.J. 2003. The evolutionary ecology of sprouting inwoody plants. Int. J. Plant. Sci. 164(S3): S103–S114. doi:10.1086/374191.
Boyden, S., Montgomery, R., Reich, P.B., and Palik, B. 2012. Seeing the forest forthe heterogeneous trees: stand-scale resource distributions emerge fromtree-scale structure. Ecol. Appl. 22(5): 1578–1588. doi:10.1890/11-1469.1. PMID:22908715.
Brookshire, B.L., and Shifley, S.R. (Editors). 1997. Proceedings of the MissouriOzark Forest Ecosystem Project Symposium: An Experimental Approach toLandscape Research. 3–5 June 1997. USDA Forest Service, North Central For-est Experiment Station, St. Paul, Minnesota, Gen. Tech. Rep. NC-193.
Brose, P.H., Van Lear, D.H., and Keyser, P.D. 1999. A shelterwood-burn techniquefor regenerating productive upland oak sites in the Piedmont region. South.J. Appl. For. 23: 158–163.
Brose, P.H., Gottschalk, K.W., Horsley, S.B., Knopp, P.D., Kochenderfer, J.N.,McGuinness, B.J., Miller, G.W., Ristau, T.E., Stoleson, S.H., and Stout, S.L.2008. Prescribing regeneration treatments for mixed-oak forests in the Mid-Atlantic Region. USDA Forest Service, Northern Research Station, NewtownSquare, Pennsylvania, Gen. Tech. Rep. NRS-33.
Brose, P.H., Dey, D.C., Phillips, R.J., and Waldrop, T.A. 2013. A meta-analysis ofthe fire-oak hypothesis: does prescribed burning promote oak reproductionin eastern North America? For. Sci. 59(3): 322–334. doi:10.5849/forsci.12-039.
Burnham, K.P., and Anderson, D.R. 1998. Model selection and inference. A prac-tical information-theoretic approach. Springer.
Burns, R.M., and Honkala, B.H. (Editors). 1990. Silvics of North America. Vol. 2.Hardwoods. USDA Forest Service Agriculture Handbook 654, Washington,D.C.
Cade, B.S., and Guo, Q. 2000. Estimating effects of constraints on plant perfor-mance with regression quantiles. Oikos, 91: 245–254. doi:10.1034/j.1600-0706.2000.910205.x.
Cade, B.S., and Noon, B.R. 2003. A gentle introduction to quantile regression forecologists. Front. Ecol. Environ. 1(8): 412–420. doi:10.1890/1540-9295(2003)001[0412:AGITQR]2.0.CO;2.
Cade, B.S., Terrell, J.W., and Schroeder, R.L. 1999. Estimating effects of limitingfactors with regression quantiles. Ecology, 80(1): 311–323. doi:10.1890/0012-9658(1999)080[0311:EEOLFW]2.0.CO;2.
Canham, C.D., Finzi, A.C., Pacala, S.W., and Burbank, D.H. 1994. Causes andconsequences of resource heterogeneity in forests: interspecific variation inlight transmission by canopy trees. Can. J. For. Res. 24(2): 337–349. doi:10.1139/x94-046.
Canham, C.D., Berkowitz, A.R., Kelly, V.R., Lovett, G.M., Ollinger, S.V., andSchnurr, J. 1996. Biomass allocation and multiple resource limitation in treeseedlings. Can. J. For. Res. 26(9): 1521–1530. doi:10.1139/x26-171.
Clark, J.S., Beckage, B., Camill, P., Cleveland, B., HilleRisLambers, J., Lichter, J.,McLachlan, J., Mohan, J., and Wyckoff, P. 1999. Interpreting recruitmentlimitation in forests. Am. J. Bot. 86(1): 1–16. doi:10.2307/2656950. PMID:21680341.
Clatterbuck, W.K., and Hodges, J.D. 1988. Development of cherrybark oak andsweet gum in mixed, even-aged bottomland stands in central Mississippi,U.S.A. Can. J. For. Res. 18(1): 12–18. doi:10.1139/x88-003.
Coates, K.D. 2002. Tree recruitment in gaps of various size, clearcuts and undis-turbed mixed forest of interior British Columbia, Canada. For. Ecol. Manage.155: 387–398. doi:10.1016/S0378-1127(01)00574-6.
Coomes, D.A., and Grubb, P.J. 2000. Impacts of root competition in forests andwoodlands: a theoretical framework and review of experiments. Ecol. Monogr.70(2): 171–207. doi:10.1890/0012-9615(2000)070[0171:IORCIF]2.0.CO;2.
Dey, D.C. 1991. A comprehensive Ozark regenerator. Ph.D. dissertation, Univer-sity of Missouri, Columbia, Missouri.
Dey, D.C. 2014. Sustaining oak forests in eastern North America: regenerationand recruitment, the pillars of sustainability. For. Sci. [In press]. doi:10.5849/forsci.13-114.
Dey, D.C., Johnson, P.S., and Garrett, H.E. 1996. Modeling the regeneration of oakstands in the Missouri Ozark Highlands. Can. J. For. Res. 26(4): 573–583.doi:10.1139/x26-066.
Dey, D.C., Jensen, R.G., and Wallendorf, M.J. 2008. Single-tree harvesting reducessurvival and growth of oak stump sprouts in the Missouri Ozark Highlands.In Proceedings of the 16th Central Hardwood Forest Conference. Edited byD.F. Jacobs and C.H. Michler. USDA Forest Service, Northern Research Sta-tion, Newtown Square, Pennsylvania, Gen. Tech. Rep. NRS-P-24. pp. 26–37.
Fei, S., and Steiner, K.C. 2007. Evidence for increasing red maple abundance inthe eastern United States. For. Sci. 53(4): 473–477.
Givnish, T.J. 1988. Adaptation to sun and shade: a whole plant perspective. Aust.J. Plant. Physiol. 15: 63–92. doi:10.1071/PP9880063.
Green, J.L. 2008. Overstory density and its effect on oak regeneration abundanceand oak understory height growth in the Missouri Ozark Highlands. M.Sc.thesis, University of Missouri, Columbia, Missouri.
Grime, J.P. 2006. Plant strategies, vegetation processes, and ecosystem proper-ties. John Wiley & Sons.
Grubb, P.J. 1977. The maintenance of species-richness in plant communities: theimportance of the regeneration niche. Biol. Rev. 52: 107–145. doi:10.1111/j.1469-185X.1977.tb01347.x.
Harrell, F.E. 2001. Regression modeling strategies with applications to linearmodels, logistic regression, and survival analysis. Springer.
Horn, J.C. 1985. Responses of understory tree seedlings to trenching. Am. Midl.Nat. 114(2): 252–258. doi:10.2307/2425600.
Johnson, P.S., Shifley, S.R., and Rogers, R. 2009. The ecology and silviculture ofoaks. CABI Publishing, CAB International, Wallingford, UK.
Kabrick, J.M., Meinert, D., Nigh, T., and Gorlinsky, B.J. 2000. Physical environ-ment of the Missouri Ozark forest ecosystem project sites. In Missouri OzarkForest Ecosystem Project: site history, soils, landforms, woody and herba-ceous vegetation, down wood, and inventory methods for the landscapeexperiment. Edited by S.R. Shifley and B.L. Brookshire. USDA Forest Service,North Central Forest Experiment Station, St. Paul, Minnesota, Gen. Tech.Rep. NC-208. pp. 41–70.
Kabrick, J.M., Shifley, S.R., Jensen, R.G., Larsen, D.R., and Grabner, J.K. 2004. Oakforest composition, site quality, and dynamics in relation to site factors inthe southeastern Missouri Ozarks. In Upland oak ecology symposium: his-tory, current conditions, and sustainability. Edited by M.A. Spetich. USDAForest Service, Southern Research Station, Asheville, North Carolina, Gen.Tech. Rep. SRS-73. pp. 94–101.
Kabrick, J.M., Dey, D.C., Jensen, R.G., and Wallendorf, M. 2008a. The role ofenvironmental factors in oak decline and mortality in the Ozark Highlands.For. Ecol. Manage. 255: 1409–1417. doi:10.1016/j.foreco.2007.10.054.
Kabrick, J.M., Zenner, E.K., Dey, D.C., Gwaze, D., and Jensen, R.G. 2008b. Usingecological land types to examine landscape-scale oak regeneration dynamics.For. Ecol. Manage. 255: 3051–3062. doi:10.1016/j.foreco.2007.09.068.
Kaelke, C.M., Kruger, E.L., and Reich, P.B. 2001. Trade-offs in seedling survival,
Vickers et al. 1329
Published by NRC Research Press
Can
. J. F
or. R
es. D
ownl
oade
d fr
om w
ww
.nrc
rese
arch
pres
s.co
m b
y U
nive
rsity
of
Mis
sour
i Col
umbi
a on
10/
03/1
4Fo
r pe
rson
al u
se o
nly.

growth, and physiology among hardwood species of contrasting successionalstatus along a light-availability gradient. Can. J. For. Res. 31(9): 1602–1616.doi:10.1139/x01-090.
Kaiser, M.S., Speckman, P.L., and Jones, J.R. 1994. Statistical models for limitingnutrient relations in inland waters. J. Am. Stat. Assoc. 89: 410–423. doi:10.1080/01621459.1994.10476763.
Knapp, B.O., Wang, G.G., Van Lear, D.H., and Walker, J.L. 2006. Predicting rootbiomass of burned and unburned white oak advance reproduction fromdiameter and height. South. J. Appl. For. 30(1): 40–45.
Kneeshaw, D.D., Kobe, R.K., Coates, K.D., and Messier, C. 2006. Sapling sizeinfluences shade tolerance ranking among southern boreal tree species.J. Ecol. 94: 471–480. doi:10.1111/j.1365-2745.2005.01070.x.
Kobe, R.K., Pacala, S.W., Silander, J.A., and Canham, C.D. 1995. Juvenile treesurvivorship as a component of shade tolerance. Ecol. Appl. 5: 517–532. doi:10.2307/1942040.
Koenker, R. 2005. Quantile regression. Cambridge University Press.Koenker, R. 2012. Quantreg: quantile regression. R package version 4.91. http://
CRAN.R-project.org/package=quantreg.Landis, R.M., and Peart, D.R. 2005. Early performance predicts canopy attain-
ment across life histories in subalpine forest trees. Ecology, 86(1): 63–72.doi:10.1890/03-0848.
Larsen, D.R., and Johnson, P.S. 1998. Linking the ecology of natural oak regen-eration to silviculture. For. Ecol. Manage. 106: 1–7. doi:10.1016/S0378-1127(97)00233-8.
Larsen, D.R., and Kershaw, J.A. 1996. Influence of canopy structure assumptionson predictions form Beer’s law. A comparison of deterministic and stochasticsimulations. Agr. For. Meteorol. 81: 61–77.
Larsen, D.R., Metzger, M.A., and Johnson, P.S. 1997. Oak regeneration and over-story density in the Missouri Ozarks. Can. J. For. Res. 27(6): 869–875. doi:10.1139/x97-010.
Larsen, D.R., Loewenstein, E.F., and Johnson, P.S. 1999. Sustaining recruitmentof oak reproduction in uneven-aged stands in the Ozark Highlands. USDAForest Service, North Central Forest Experiment Station, St. Paul, Minnesota,Gen. Tech. Rep. NC-203.
Latham, R.E. 1992. Co-occurring tree species change rank in seedling perfor-mance with resources varied experimentally. Ecology, 73: 2129–2144. doi:10.2307/1941461.
Law, J.R., and Lorimer, C.G. 1989. Managing uneven-aged stands. Edited byF.B. Clark and J.G. Hutchinson. USDA Forest Service, North Central ForestExperiment Station, St. Paul, Minnesota, Central Hardwood Note 6.08.
Loewenstein, E.F., Johnson, P.S., and Garrett, H.E. 2000. Age and diameter struc-ture of a managed uneven-aged oak forest. Can. J. For. Res. 30(7): 1060–1070.doi:10.1139/x00-036.
Loftis, D.L. 1990a. Predicting post-harvest performance of advance red oak re-production in the southern Appalachians. For. Sci. 36(4): 908–916.
Loftis, D.L. 1990b. A shelterwood method for regenerating red oak in the south-ern Appalachians. For. Sci. 36(4): 917–929.
Lorimer, C.G. 1983. Tests of age-independent competition indices for individualtrees in natural hardwood stands. For. Ecol. Manage. 6: 343–360. doi:10.1016/0378-1127(83)90042-7.
MacArthur, R.H., and Wilson, E.O. 1967. The theory of island biogeography.Princeton University Press.
MacFarlane, D.W., and Kobe, R.K. 2006. Selecting models for capturing tree-sizeeffects on growth–resource relationships. Can. J. For. Res. 36(7): 1695–1704.doi:10.1139/x06-054.
McLemore, B.F. 1990. Cornus florida L. flowering dogwood. In Silvics of NorthAmerica. Vol. 2. Hardwoods. Edited by R.M. Burns and B.H. Honkala. USDAForest Service Agriculture Handbook 654, Washington, D.C.
McQuilkin, R.A. 1974. Site index prediction tables for black, scarlet, and whiteoaks in southeastern Missouri. USDA Forest Service, North Central ForestExperimental Station, St. Paul, Minnisota, Res. Pap. NC-108.
Messier, C., Doucet, R., Ruel, J.-C., Claveau, Y., Kelly, C., and Lechowicz, M.J. 1999.Functional ecology of advance regeneration in relation to light in borealforests. Can. J. For. Res. 29(6): 812–823. doi:10.1139/x99-070.
Missouri Department of Conservation. 1986. Forest land management guide-lines. Missouri Department of Conservation, Jefferson City, Missouri.
Nigh, T., Buck, C., Grabner, J., Kabrick, J., and Meinert, D. 2000. Ecologicalclassification system for the Current River Hills subsection. Missouri Depart-ment of Conservation Publication, Jefferson City, Missouri.
Niinemets, U., and Valladares, F. 2006. Tolerance to shade, drought, and water-logging of temperate northern hemisphere trees and shrubs. Ecol. Monogr.76(4): 521–547. doi:10.1890/0012-9615(2006)076[0521:TTSDAW]2.0.CO;2.
Noble, I.R., and Slatyer, R.O. 1980. The use of vital attributes to predict succes-sional changes in plant communities subject to recurrent disturbances. Veg-etatio, 43: 5–21. doi:10.1007/BF00121013.
Nowacki, G.J., and Abrams, M.D. 2008. The demise of fire and “mesophication”of forests in the eastern United States. Bioscience, 58(2): 123–138. doi:10.1641/B580207.
Oliver, C.D., and Larson, B.C. 1996. Forest stand dynamics. John Wiley & Sons,New York.
Oliver, C.D., Burkhardt, E.C., and Skojac, D.A. 2005. The increasing scarcity ofred oaks in Mississippi River floodplain forests: influence of the residualoverstory. For. Ecol. Manage. 210: 393–414. doi:10.1016/j.foreco.2005.02.036.
Pacala, S.W., Canham, C.D., Silander, J.A., and Kobe, R.K. 1994. Sapling growth asa function of resources in a north temperate forest. Can. J. For. Res. 24(11):2172–2183. doi:10.1139/x94-280.
Pacala, S.W., Canham, C.D., Saponara, J., Silander, J.A., Kobe, R.K., andRibbens, E. 1996. Forest models defined by field measurements: estimation,error analysis, and dynamics. Ecol. Monogr. 66: 1–43. doi:10.2307/2963479.
Palik, B., Mitchell, R.J., Pecot, S., Battaglia, M., and Pu, M. 2003. Spatial distribu-tion of overstory retention influences resources and growth of longleaf pineseedlings. Ecol. Appl. 13: 674–686. doi:10.1890/1051-0761(2003)013[0674:SDOORI]2.0.CO;2.
Peet, R.K., and Christensen, N.L. 1987. Competition and tree death. Bioscience,37(8): 586–595. doi:10.2307/1310669.
Pinheiro, J.C., and Bates, D.M. 2000. Mixed-effects models in S and S-PLUS.Springer-Verlag New York, Inc.
Pinheiro, J.C., Bates, D.M., Debroy, S., Sarkar, D., and the R Core Team. 2011.NLME: linear and nonlinear mixed effects models. R package version 3.1-100.
Poorter, L., Bongers, F., Sterck, F.J., and Woll, H. 2005. Beyond the regenerationphase: differentiation of height–light trajectories among tropical tree spe-cies. J. Ecol. 93: 256–267. doi:10.1111/j.1365-2745.2004.00956.x.
R Core Team. 2013. R: a language environment for statistical computing. RFoundation for Statistical Computing, Vienna, Austria. http://R-project.org/.
Roach, B.A., and Gingrich, S.F. 1968. Even-aged silviculture for upland centralhardwoods. USDA Forest Service Agriculture Handbook 355.
Sander, I.L., Johnson, P.S., and Rogers, R. 1984. Evaluating oak advance repro-duction in the Missouri Ozarks. USDA Forest Service, North Central ForestExperimental Station, St. Paul, Minnisota, Res. Pap. NC-251.
Schlesinger, R.C., Sander, I.L., and Davidson, K.R. 1993. Oak regeneration poten-tial increased by shelterwood treatments. North. J. Appl. For. 10(4): 149–153.
Schuler, T.M. 2004. Fifty years of partial harvesting in a mixed mesophyticforest: composition and productivity. Can. J. For. Res. 34(5): 985–997. doi:10.1139/x03-262.
Schweitzer, C.J., and Dey, D.C. 2011. Forest structure, composition, and treediversity response to a gradient of regeneration harvests in the mid-Cumberland Plateau escarpment region, USA. For. Ecol. Manage. 262: 1729–1741. doi:10.1016/j.foreco.2011.07.020.
Schwinning, S., and Weiner, J. 1998. Mechanisms determining the degree of sizeasymmetry in competition among plants. Oecologia, 113: 447–455. doi:10.1007/s004420050397.
Shifley, S.R., and Brookshire, B.L. (Editors). 2000. Missouri Ozark Forest Ecosys-tem Project: site history, soils, landforms, woody and herbaceous vegetation,down wood, and inventory methods for the Landscape Experiment. USDAForest Service, North Central Forest Experiment Station, St. Paul, Minnesota,Gen. Tech. Rep. NC-208.
Shifley, S.R., and Kabrick, J.M. (Editors). 2002. Proceedings of the Second MissouriOzark Forest Ecosystem Project Symposium. 17–18 October 2000. USDA For-est Service, North Central Forest Experiment Station, St. Paul, Minnesota,Gen. Tech. Rep. NC-227.
Shifley, S.R., Fan, Z., Kabrick, J.M., and Jensen, R.G. 2006. Oak mortality riskfactors and mortality estimation. For. Ecol. Manage. 229: 16–26. doi:10.1016/j.foreco.2006.03.033.
Tilman, D. 1982. Resource competition and community structure. PrincetonUniversity Press.
Valladares, F., and Niinemets, U. 2008. Shade tolerance, a key plant feature ofcomplex nature and consequences. Annu. Rev. Ecol. Evol. Syst. 39: 237–257.doi:10.1146/annurev.ecolsys.39.110707.173506.
Walters, M.B., and Reich, P.B. 2000. Trade-offs in low-light CO2 exchange: acomponent of variation in shade tolerance among cold temperate tree seed-lings. Funct. Ecol. 14: 155–165. doi:10.1046/j.1365-2435.2000.00415.x.
Warner, R.R., and Chesson, P.L. 1985. Coexistence mediated by recruitmentfluctuations: a field guide to the storage effect. Am. Nat. 125(6): 769–787.doi:10.1086/284379.
Weiner, J. 1990. Asymmetric competition in plant populations. Trends Ecol.Evol. 5: 360–364. doi:10.1016/0169-5347(90)90095-U. PMID:21232393.
Weiner, J., and Thomas, S.C. 2001. The nature of tree growth and the “age-relateddecline in forest productivity”. Oikos, 94: 374–376. doi:10.1034/j.1600-0706.2001.940219.x.
Wright, E.F., Coates, K.D., Canham, C.D., and Bartemucci, P. 1998. Species vari-ability in growth response to light across climatic regions in northwesternBritish Columbia. Can. J. For. Res. 28(6): 871–886. 10.1139/x98-055.
Wright, E.F., Canham, C.D., and Coates, K.D. 2000. Effects of suppression andrelease on sapling growth for 11 tree species of northern, interior BritishColumbia. Can. J. For. Res. 30(10): 1571–1580. doi:10.1139/x00-089.
1330 Can. J. For. Res. Vol. 44, 2014
Published by NRC Research Press
Can
. J. F
or. R
es. D
ownl
oade
d fr
om w
ww
.nrc
rese
arch
pres
s.co
m b
y U
nive
rsity
of
Mis
sour
i Col
umbi
a on
10/
03/1
4Fo
r pe
rson
al u
se o
nly.