the impact of governance characteristics and non-audit fees ...
299
THE IMPACT OF GOVERNANCE CHARACTERISTICS AND NON-AUDIT FEES ON AUDIT PRICING: EVIDENCE FROM UK LISTED COMPANIES by Roziani Ali The University of Sheffield Management School Thesis submitted in partial fulfilment of the requirements for the degree of Doctor of Philosophy at The University of Sheffield August 2014
-
Upload
khangminh22 -
Category
Documents
-
view
1 -
download
0
Transcript of the impact of governance characteristics and non-audit fees ...

THE IMPACT OF GOVERNANCE CHARACTERISTICS
AND NON-AUDIT FEES ON AUDIT PRICING: EVIDENCE
FROM UK LISTED COMPANIES
by
Roziani Ali
The University of Sheffield Management School
Thesis submitted in partial fulfilment of the requirements for the degree of Doctor of Philosophy
at
The University of Sheffield
August 2014
i
ABSTRACT
Due to concerns regarding auditor independence and the importance of good
corporate governance for business, especially in the wake of corporate scandals
and collapses, the relationship between auditor and corporate governance has
become more important. Therefore, this study examines the impact of
governance characteristics and non-audit fees on audit quality proxied by the
audit fees in the UK before and after the recent economic crisis. It utilises the
data from a sample of 384 FTSE All Share listed companies in 2007 and 2010.
This study provides evidence that before the economic crisis audit committee
diligence, audit committee commitment, management share ownership and non-
executive share ownership had a significant impact on audit fees. In the post-
economic crisis, none of the audit committee characteristics exhibits a
significant relationship with audit fees, while non-executive director
shareholding and management shareholding remain significant. The increasing
levels of compliance with Codes of Corporate Governance and listing
requirements, especially since the economic crisis, may be the reason why
governance characteristics have lost their explanatory power. The finding also
indicates a positive relationship between audit and non-audit services pre and
post economic crisis. Detailed analysis shows that non-audit services supplied
pursuant to legislation, taxation and other non-audit services have a significant
positive relationship with audit fees. Therefore, it provides evidence to reject the
notion of a total prohibition of non-audit services, as the provision of non-audit
services does not seem to affect auditor independence.
Being comprehensive in its scope and methods employed to measure these
characteristics, this study offers a major contribution to the understanding of the
association between various governance characteristics and financial reporting
quality in two economic environments; before and after economic crisis.
Another major contribution is that this study is the first to utilise published data
in investigating the impact of individual components of non-audit services on
audit pricing as this published information only became available in 2006.

ii
ACKNOWLEDGEMENT
In completing my PhD, I’m indebted to a few people who have been so
wonderful in giving me guidance, support and encouragement. My first debt of
gratitude must go to my supervisor, Professor Noel O’Sullivan. His direction,
encouragement and especially his kindness have made my PhD journey, which
is supposed to be a very lonely and painful process, a very wonderful and
enriching experience. Although at times I was scared by his ambitious targets
and strict requirements, I ended up appreciating him more as I realised that
everything demanded by him is essential in producing a good quality PhD thesis.
Millions of thanks are especially dedicated to my husband cum best friend,
Alizan Ismail. His love, moral support, understanding and consideration are
always there and have given me the secure foundation to stand tall and strong in
the face of all the difficulties and hardship in this PhD journey. To my kids, Nur
Aisyah, Ahmad, Asri and Ariff, thank you for being such wonderful, adorable
and understanding children. Their supportive attitude and understanding have
been almost impossible to believe. Without their support and understanding,
completing a PhD with four kids would have been an impossible mission to
accomplish.
This thesis is especially dedicated to my Late Mum who left us before this
dream was realised. She was the one who encouraged me strongly to do this
PhD, despite the hardship that it could bring. Despite her poor health, she used to
give me moral support daily over the telephone, even though we were thousands
of miles apart. I really miss her soothing and encouraging voice. Although she
was not there anymore, her advice and encouragement kept me going to finish
this tough and yet meaningful journey.
Last but not least, I would like to express my appreciation and gratitude to my
beloved friends, especially Lorian and Ahmad who have made this PhD journey
a very wonderful and happy experience. We have experienced ups and downs
together. We celebrated happy moments together and they offered me sincere
consolation when I faced difficult times. Words can’t really describe how
grateful I am for their support and I hope sincerely that this friendship will last
forever.

iii
Table of Contents
ABSTRACT ...................................................................................................... i
ACKNOWLEDGEMENT .................................................................................... ii
CHAPTER 1: INTRODUCTION ................................................................. 1
1.1 Audit Pricing and Corporate Governance .................................................... 1
1.2 Motivation for the Study ........................................................................... 3
1.3 Research Objectives .................................................................................. 9
1.4 Contribution of the Study ........................................................................... 9
1.5 Structure of Study ................................................................................... 12
CHAPTER 2: Corporate Governance and Auditing in the UK .................. 13
2.1 Introduction ................................................................................................ 13
2.2 Corporate Governance ................................................................................. 13
2.2.1 Corporate Governance and Auditing in the UK ............................................. 14
2.2.2 Development of Corporate Governance and Auditing in the UK .................. 18
2.2.3 The Impact of Governance and Non-Audit Development on Audit Pricing .. 33
2.3 Chapter Summary ........................................................................................ 38
CHAPTER 3: LITERATURE REVIEW .................................................... 41
3.1 Introduction ................................................................................................ 41
3.2 Audit Pricing Literature ................................................................................ 41
3.3 Corporate Governance and Audit Pricing Literature ...................................... 50
3.3.1 Board Characteristics and Audit Fees ............................................................ 52
3.3.2 Audit Committee Characteristics and Audit Fees .......................................... 62
3.3.3 Ownership Structure and Audit Fees ............................................................. 67
3.4 Non-Audit Fees Literature ........................................................................... 87
3.4.1 Non-Audit Fees and Auditor Independence .................................................. 87
3.4.2 Non-Audit Fees and Audit Fees ...................................................................... 89
Chapter 4: Theoretical Background and Hypotheses Development ............. 110
4.1 Introduction ...............................................................................................110
4.2 Theoretical underpinning of the study .........................................................110
4.3 Development of Hypotheses: Board Characteristics and Audit Fees ..............113
4.4 Development of Hypotheses: Audit Committee Characteristics and Audit Fees
........................................................................................................................120
4.5 Development of Hypotheses: Ownership Structure and Audit Fees ..............129
4.6 Development of Hypotheses: Non-Audit Fees and Audit Fees ......................134
4.7 Development of Hypotheses: the Effect of Economic Crisis ..........................136
4.7.1 Governance Characteristics and Audit Fees ................................................ 136
4.7.2 Non-Audit Fees and Audit Fees Relationship ............................................... 139
4.8 Control Variables ........................................................................................140
4.9 Chapter Summary .......................................................................................157
iv
Chapter 5: Research Methodology ............................................................. 159
5.1 Introduction ...............................................................................................159
5.2 Research Methodology ...............................................................................159
5.3 Data Collection ...........................................................................................162
5.3 Sample Selection ........................................................................................165
5.4 Research Design and Measurement Procedures ...........................................167
5.4.1 Measurement for Independent Variables ................................................... 167
5.4.2 Audit Committee Characteristics ................................................................. 171
5.4.3 Ownership Structure .................................................................................... 174
5.4.4 Control Variables .......................................................................................... 175
5.4.5 Non-Audit Fee .............................................................................................. 176
5.5 Empirical Research Models and Tests ..........................................................178
5.5.1 Audit fees and Governance Model .............................................................. 178
5.5.2 Audit Fees and Non-Audit Fees .................................................................... 179
5.6 Statistical Techniques Used to Conduct Univariate and Bivariate Analysis ....179
5.7 Chapter Summary .......................................................................................181
CHAPTER 6: DATA ANALYSIS ..................................................................... 184
6.1 Introduction ...............................................................................................184
6.2 Descriptive Statistics ..................................................................................187
6.3 Correlation Matrix ......................................................................................195
6.4 Multivariate Regression Analysis .................................................................205
6.4.1 Governance Characteristics and Ownership Structure on Audit Fees ......... 206
6.5 Chapter Summary .......................................................................................229
CHAPTER 7: CONCLUSIONS ........................................................................ 235
7.1 Introduction ...............................................................................................235
7.2 Summary of the Empirical Findings ..............................................................236
7.3 Theoretical and Policy Implications .............................................................241
7.4 Limitations of the Study and Avenues for Future Research ...........................242
REFERENCES ........................................................................................... 245
APPENDICES .......................................................................................... 276

v
List of Tables
Table 2.1 Development of Corporate Governance in UK..........................29
Table 3.1 Summary of Empirical Studies Examining the Influence
of Corporate Governance Characteristics on Audit Fees............77
Table 3.2 Summary of Empirical Studies Examining the Influence
of Non-Audit Fees on Audit Fees since the 1990s.....................95
Table 5.1 Data Collection and Sources of Information.............................164
Table 5.2 Sample Firms.............................................................................166
Table 5.3 Firms by ICB Industry sector....................................................166
Table 5.3 Definitions of Variables.............................................................180
Table 6.1 Descriptive statistics for dependent and independent variables185
Table 6.2 Pearson Correlation Matrix........................................................196
Table 6.3 OLS Regressions Explaining the Determinants of Audit
Fees For FTSE All Shares for the Years 2007 and 2010.........217
Table 6.4 OLS Regressions Explaining the Determinants of Audit
Fees (Details Of Non-Audit) for FTSE All Shares For the
Years 2007 and 2010.................................................................218
Table 6.5 OLS Regressions Explaining the Determinants of Audit
Fees For FTSE All Shares for the Year 2007
(Pre Economic Crisis) and 2010 (Post Economic Crisis)..........223
Table 6.6 OLS Regressions Explaining the Determinants of Audit
Fees For FTSE All Shares for the Years 2007 And 2010
(Robustness Test).......................................................................228
Table 6.7 Summary of Results...................................................................232

1
CHAPTER 1: INTRODUCTION
1.1 Audit Pricing and Corporate Governance
In the wake of numerous corporate scandals and collapses (e.g. Enron,
WorldCom and Lehman Brothers in the US and Northern Rock and the Royal
Bank of Scotland in the UK), interest in the quality of corporate governance has
increased dramatically. As part of this concern the attention of corporate
stakeholders has increasingly focused on the quality of financial disclosures, a
key component of which is the statutory audit and, consequently, audit pricing.
A survey involving 40 Fortune 500 companies indicated that in 2004, the audit
fees charged by the big four accounting firms had increased significantly and
that much of this increase in fees was attributed to the additional work mandated
by the Sarbanes-Oxley Act (Taub, 2005). Another study by Griffin and Lont
(2007) also documents a significant positive relationship between residual audit
fees following the introduction of the SOX and proxies for incremental audit risk
and audit effort. In New Zealand, new regulation, effective from 1st July 2012,
requires individual audit partners to be licensed and audit firms to be registered.
According to Hay (2012), this requirement will increase average audit fees as
bad auditors who are not qualified will drop out of the system and audit quality
will rise as part of the same process. As a result of such regulation auditing firms
are increasingly under pressure to deliver a high standard of auditing, while also
doing so in the most efficient and effective way.
Companies, on the other hand, could minimise the cost of auditing by enhancing
their internal control systems. Traditional arguments have suggested that an
effective and reliable internal control system could go some way to reducing the
amount of testing and investigation needed by auditors and therefore could
reduce the costs of auditing (Collier and Gregory, 1996). However, higher
standards of internal governance could also mean a higher degree of
commitment towards the welfare of shareholders and this could lead to the
purchase of higher quality audit services since a higher quality audit means a
higher level of verification of accounting records and assurance of transparency
2
(O’Sullivan, 2000). The possibility that higher standards of internal governance
may actually have either a positive or negative impact on audit fees raises an
important empirical question deserving of research attention. In other words,
how do companies’ governance characteristics influence the pricing of audit
contracts?
There are a number of components of internal governance that could constitute
good internal control in a company. The composition of the board of directors
has long been viewed as a key organ of governance in shareholder-owned
companies. More specifically, governance regulators consistently assert that
appropriately led and independent boards are a pre-requisite for good
governance (Cadbury, 1992; Combined Code, 1999; 2003; 2006; 2008; UK
Corporate Governance Code, 2010). More recently, regulators have focused on
the existence and specific characteristics of audit committees in seeking to
enhance the quality of the external audit process. In particular, current
governance regulation, both in the UK and in the US, stresses the importance of
independent, effective and diligent audit committees for enhancing the quality
and transparency of corporate financial disclosure (e.g. The Combined Code
(2006), Smith Guidance (2003), Turnbull Guidance (2005) in the UK and
Sarbanes Oxley Act (2002) in the US) In addition to board and audit committee
characteristics, the nature of a company’s ownership structure may influence the
extent of the audit undertaken and, consequently, the fee charged. In particular,
companies whose managers possess significant ownership stakes may not have
so much need for extensive audits while companies with significant external
blockholder ownership may also require a less extensive audit since large
blockholders are more likely to be able to more directly monitor managerial
behaviour (Chan et al., 1993; O’Sullivan, 2000; O’Sullivan and Diacon, 2002;
Mitra et al., 2007). The statutory audit is a monitoring mechanism available to
shareholders in addition to the internal governance mechanisms mentioned
above. An understanding of the relationship between internal governance
characteristics and the statutory audit is valuable since these two mechanisms
can complement each other in achieving better corporate governance. The
objective of this thesis is to achieve such an understanding.

3
1.2 Motivation for the Study
Following the increase in concern regarding corporate governance and the
contribution of external auditors to ensuring the transparency of financial
statements, understanding the relationship between relevant governance
characteristics and audit quality, typically proxied by audit fees, is becoming
more relevant. However, there are not many studies done in the UK
investigating the relationship between governance characteristics and audit
pricing. Most of the previous UK studies use data from the 1990s, especially
around the release of the Cadbury Report in 1992. For example, O’Sullivan
(1999) investigates the impact of board and audit committee characteristics on
audit pricing, using data from 146 large UK listed companies at the end of the
1995 financial year. This study, therefore, utilises data from the post-Cadbury
period. The Cadbury report outlined a number of recommendations around the
separation of the role of chief executive and chairman in an organisation, greater
use of non-executive directors, clearer selection processes for non-executive
directors, greater transparency of financial reporting, and the need for improved
internal controls. O’Sullivan (1999) found no evidence that board and audit
committee characteristics influence auditors’ pricing decisions. The author
suggests that any fee reductions expected due to improved board monitoring
may be counterbalanced by the increase in audit effort and assurances desired by
non-executive directors. In a subsequent study, O’Sullivan (2000) investigates
the impact of board and ownership structure on audit fees in the pre-Cadbury
period, utilising data from 402 quoted companies in 1992. In contrast to the
result of his post-Cadbury study, it is found that the proportion of non-executive
directors has a significant positive impact on audit fees while audit fees are
negatively related to the proportion of equity owned by executive directors.
However, the results of another pre-Cadbury study of the impact of board
composition variables on audit pricing, by Peel and Clatworthy (2001), shows
that a range of board composition variables were insignificantly related to audit
fees.
In response to the controversial failure of Enron in 2002 in the US, UK
regulators established the Smith Committee in 2003. There have been significant
changes to UK corporate governance following the recommendations of the

4
Smith Report (2003), especially with regard to recommendations concerning
audit committee effectiveness. The recommendations include: all audit
committee members should be independent directors, at least one of whom
should have recent and relevant financial experience; the audit committee should
have primary responsibility for all aspects of the company’s relationship with the
external auditors; the committee should make an annual report to shareholders,
to include an explanation as to how the auditor’s objectivity and independence is
maintained in cases where the auditor is also employed to provide non-audit
services to the company. In addition, the report (Smith Report, 2003) also
recommended that audit committees should have at least three members (two in
the case of smaller companies); members should not serve for more than two
three-year terms; and there should be a minimum of three meetings per year.
Subsequent revisions of the Combined Code in 2006 and 2008 as well as the UK
Corporate Governance Code in 2010 and 2012 have basically carried forward
the existing recommendations for audit committees as recommended by the
Smith Report (2003).
Two other recent studies have investigated the relationship between corporate
governance and audit fees in the UK. The first study, by Zaman et al. (2011),
examines the influence of audit committee effectiveness, a proxy for governance
quality, on audit and non-audit fees, using a new composite measure comprising
audit committee independence, expertise, diligence and size. However, the study
only involves a sample of companies listed on the FTSE 350. Utilising Data
from 135 companies (540 company year observations) between the years 2001-
2004, they found enough evidence to conclude that audit committee
effectiveness (ACE) has a significant and positive impact on audit fees after
controlling for board characteristics. As the Smith Report was only published in
2003, Zaman et al. (2011) do not really capture the effect of governance change
following the recommendations of the Smith Report (2003), especially with
regard to audit committee characteristics. In another UK study, Adelopo et al.
(2012) examine the impact of ownership structure on audit pricing using the
number of Multiple Large Shareholders (MLS) for 209 listed companies on
FTSE 350 in 2005 and 2006. Although Adelopo et al. (2012) use a bigger
sample size than Zaman et al. (2011) and focus on a period after the introduction

5
of the Smith (2003) induced reforms, the study focuses only on the impact of
ownership structure particularly Multiple Large Shareholders and audit
committee activity on auditor remuneration. Adelopo et al. (2012) found that the
majority of listed firms in the UK have multiple large shareholders and their
one-way ANOVA result showed that there are statistically significant
differences in the audit fees, firm size and audit committee activities of the firms
under study when they are categorised into “widely held”, “concentrated” and
“highly concentrated” firms.
Many studies in the US have studied the relationship between governance
characteristics and audit pricing. For example, Carcello et al. (2002) based their
study of audit pricing and board characteristics on data from 1992-1993; Abbott
et al. (2003) focused on the impact of audit committee characteristics and non-
audit fees on audit pricing using data from 2001; Lee and Mande (2005) focused
on audit committees using 2000 data; Mitra et al. (2007) focused on ownership
and audit pricing using 2000 data; Vafeas and Waegelein (2007) focused on
audit fees using 2001-2003 data; Ittonen et al. (2008) focused on audit
committees and used 2006 data; Abbott et al. (2009) focused on audit
committees and non-audit fees using 2001 data while Krishnan and Visvanathan
(2009) focused on audit committees using 2000-2002 data.
Although there are similarities between the US and UK markets, there are also
important differences, especially with regard to the regulatory framework in
respect of auditing and governance. Past studies (e.g. Beekes and Brown, 2006;
Collett and Hrasky, 2005; Conyon, 2000; and Doidge et al., 2007) highlighted
that there are indeed differences between the US, Australia and the UK
environment in terms of corporate governance. The key difference between UK
and US corporate governance practice is their focus on corporate governance.
This is highlighted by Ethiopis Tafara, Director at the Office of International
Affairs of the U.S. Securities and Exchange Commission, in his speech delivered
at the Institute of Chartered Accountants in England and Wales, London, United
Kingdom, on January 9, 2007.

6
“The US corporate governance system is commonly held out as the
exemplar of the ‘regulator-led’ approach to corporate governance, in
which the SEC and the exchanges are responsible for implementing and
enforcing good corporate governance standards. By contrast, in the UK
shareholders are given the autonomy and the authority to decide what
corporate governance measures are necessary and appropriate to protect
their interests.”
This means that as compared to US corporate governance, which is more
legislative in nature, UK corporate governance is based on self-regulation. UK
listed companies are encouraged to comply with the recommendations of the
Combined Code, but are also at liberty not to do so provided appropriate
explanation is provided in the annual report (Gafran and O’Sullivan, 2013). Due
to this fact, there will be more variations in governance practice in the UK as
listed companies have more freedom to choose any governance practice as long
as in their opinion it will be beneficial to the company and the shareholders. This
is supported by Zaman et al. (2011) who suggest that there is greater variation in
board composition in the UK than in the US, while Peasnell et al. (2005) point
out that audit committees are not mandatory in the UK. Collier and Zaman
(2005) also document significant differences in national requirements and
recommendations relating to audit committees for the two countries. This
variation in the UK allows the researcher to capture more meaningfully the
relationship between governance characteristics, especially the board of
directors, audit committee and ownership structure, with the external governance
mechanism, namely the auditor, than in studies on the US, where there is strict
regulation. This is supported by Aguilera et al. (2006), who suggest that results
from US studies may not be totally applicable to a different setting such as the
UK.
Recent corporate scandals and failures have also increased concern about the
independence of auditors providing non-audit services to their audit clients. As a
result, the issues of independence in appearance and independence in fact are
subject to increased discussion and investigation (e.g. Srinidhi and Gul, 2007;
Lim and Tan, 2008; Krishnan et al., 2005; Francis and Ke, 2006). The provision

7
of non-audit services may tarnish the independence of the auditor in terms of
giving judgments on whether the financial statements are a true and fair view
and in disclosing any risk or possible going concern issues. In addressing these
independence issues many parties have suggested total prohibition of provision
of non-audit services by auditors to their audit clients. As a result of this
concern, the Auditing Practices Board (APB) has issued consultation on this
matter, surveying the opinions of many parties. In response to this, the
accounting profession has formed a working group to investigate and discuss
this matter and has come up with many suggestions to improve the independence
of the auditor, including improvements in the way non-audit fees are disclosed in
financial statements. The shareholders of FTSE 100 companies in the UK, for
example, are reported to oppose a total ban on non-audit services and believe
that total prohibition will in fact have a negative impact on company
performance (Christodoulou, 2010).
At European level, the European Commission launched its Green Paper on audit
policy (European Commission, 2010) and raised the question whether the role of
auditors can be enhanced to mitigate any future financial risk. Following this
discussion, on 30 November 2011 the European Commission presented its
proposals regarding the statutory audit of public-interest entities (European
Commission, 2011). A maximum term of audit engagement of six years, which
can be extended to nine if joint audits are performed, and a prohibition against
providing non-audit services to audit clients are key elements of the proposals.
Quick (2012) concludes that the provision of non-audit services might affect
independence in appearance negatively; however, a total ban would not be
necessary. In addition, he suggests that limiting the proportion of fees an audit
firm can receive from a single client as well as a cap on non-audit fees seem to
be desirable. So, the relationship between audit fees and non-audit fees to find
out whether the provision of non-audit fees actually has a negative relationship
with audit fees is a really interesting area for investigation. It is also suggested
by the working group (Working Group on Provision of Non-audit Services by
Audit Firms to Listed Audit Clients, 2010) that the way non-audit fees are
presented in financial statements invites unnecessary criticism as some
compulsory audits are treated as non-audit services (ICAS, 2010). The new

8
disclosure requirements introduced by the Companies (Disclosure of Auditor
Remuneration and Liability Agreements) Regulations 2005, later superseded by
the Companies (Disclosure of Auditor Remuneration and Liability Agreements)
Regulations 2008, require companies to disclose details of audit fees paid to the
auditor. With this detailed disclosure, further investigation to find individual
relationships between audit fees and specific components of non-audit fees will
be possible.
Furthermore, since this study commenced, the world economy has undergone an
unprecedented economic crisis (Rose and Spiegel, 2009). A recent report (Bank
of England, 2009) indicates that the economic crisis started in 2008 in UK and a
slow recovery started in 2009. It is reported that UK real GDP fell by 5.5%
between 2008 quarter 1 and 2009 quarter 2 (Bank of England, 2009). From early
2010 world economic recovery stabilised, the situation on the global financial
markets calmed down and crisis measures started to be withdrawn (Berg, 2012).
A recent study (D.H. Erkens et al., 2012) shows that corporate governance had
an effect on financial firms during the economic crisis. The result of the study
shows that firms with more independent boards and greater institutional
ownership experienced worse stock returns during the crisis period. Based on
agency theory, management will increase earnings management in order to
convey a better picture of the company during a crisis period so that they get
better rewards. Therefore, the audit risk during this period would increase, hence
affecting the audit scope and the audit fees charged by the auditor. On the other
hand, with the economic crisis highlighting the weaknesses of corporate
governance, the regulator requires the company to increase the effectiveness of
their internal governance characteristics for survival of the business. These new
requirements will strengthen internal control of the business and therefore
reduce audit risk and consequently reduce the audit fees charged by the auditors
to their audit clients. It was therefore decided that the scope of the study should
be extended to capture data post-crisis, that is, to the year 2010, so as to
investigate whether the financial crisis has had an impact on the nature and
extent of the internal governance-audit fee relationship.

9
1.3 Research Objectives
To address the gap that exists in prior literature on audit pricing and governance
characteristics, the aim of this study is to investigate the impact of companies’
internal governance characteristics and auditor independence on audit quality,
proxied by the audit fees paid by listed companies in the United Kingdom. At
the end of the research, the following research objectives should have been
achieved:
1) Analyse the impact of an effective board of directors on audit fees.
2) Analyse the impact of an effective audit committee on audit fees.
3) Analyse the impact of ownership structure on audit fees.
4) Establish the relationship between non-audit fees and audit fees.
5) Analyse the impact of economic crisis on the relationship between
governance characteristics and audit fees.
6) Analyse the impact of economic crisis on the relationship between non-
audit and audit fees.
These research objectives will be expressed as hypotheses which will be tested
with secondary data collected and analysed appropriately in chapter 6.
1.4 Contribution of the Study
This study extends and contributes to prior literature in a number of ways. First,
this study incorporates more corporate governance characteristics as compared
to previous studies. Therefore it contributes to the body of knowledge by
providing a detailed examination of the association between a comprehensive
range of corporate governance characteristics and audit fees. This study includes
details of board characteristics, audit committee characteristics and ownership
structure. To investigate the relationship between audit fees and board
characteristics, variables are used to measure board size, board independence
(measured by CEO duality, percentage of non-executive directors and
percentage of independent non-executive directors) and board activity (measured
by number of board meetings). For Audit committee characteristics, this study
includes audit committee size, audit committee activity (measured by number of
audit committee meetings), audit committee commitment (measured by

10
weighted average attendance of audit committee members), audit committee
independence (measured by percentage of independent non-executive directors
on audit committee), audit committee expertise (measured by percentage of audit
committee with financial expertise, percentage of audit committee with
accounting expertise and percentage of audit committee with supervisory
expertise) and also a composite variable measuring audit committee
effectiveness, calculated using earlier variables. For ownership structure, the
percentage of block ownership, number of blockholders, percentage of executive
share ownership and percentage of non-executive share ownership are used to
measure ownership. Most of the prior studies in the UK (e.g. O’Sullivan, 1999;
O’Sullivan, 2000; Peel and Clatworthy, 2001) used data from the 1990s to
investigate the relationship between corporate governance characteristics and
audit fees. Even though these studies took governance characteristics into
account, in particular board characteristics, none of them included details on
audit committee characteristics. Later, Zaman et al. (2011) and Adelopo et al.
(2012) investigated the relationship between governance characteristics and
audit fees. However, neither of these studies included details of both board and
audit committee characteristics. Zaman et al. (2011) focused solely on the
relationship between audit committee effectiveness and audit fees, using a new
composite comprising audit committee independence, expertise, diligence and
size, while Adelopo et al. (2012) focused more on the ownership structure,
especially Multiple Large Shareholders (MLS) and audit fees.
The second contribution of the study is the inclusion of smaller companies,
which were ignored in previous studies. The final sample of this study is made
up of 384 companies listed on FTSE all shares, including FTSE small capital.
Therefore, this research uses a bigger sample than previous studies, hence
increasing the generalisability of the results. Zaman et al. (2011), for example,
only utilised data on 135 companies from the FTSE 350, while Adelopo et al.
(2012) used data from 209 companies, also from the FTSE 350.
Third, this study investigates the relationship between audit fees and the
individual components of non-audit fees, which was previously not possible
using published data. There are new requirements (The Companies (Disclosure
11
of Auditor Remuneration and Liability Agreements) Regulations 2005) for
companies to disclose details of the audit and non-audit fees paid to the auditor.
Because of these new requirements, information is available on the amount of
non-audit fees purchased from the incumbent auditor in specified categories. As
a result, the study investigates which components of non-audit fees contribute,
positively or negatively, to the relationship between audit fees and non-audit
fees. This could shed some light on whether the provision of non-audit fees
really affects the independence of the auditor. The independence of the auditor
normally relates to the provision of management advice to their audit client and
not the provision of essential accounting services that enable listed companies to
comply with legal and regulatory requirements. Beattie et al. (1996) concluded
that the profession is inviting unnecessary criticism by bundling essential
compliances services with a limited amount of consultancy work into a single
disclosure figure and it would be advantageous to show a split figure. As these
regulations came into force immediately: for financial years beginning on or
after 1st October 2005, the use of 2007 data will provide reliable information
with which to investigate the relationship between audit fees and specific types
of non-audit services.
Fourth, unlike almost all prior studies, this study includes financial institutions.
It will therefore offer additional insights on a company sector which has been
under severe governance scrutiny following the collapse of many banking and
financial institutions during the recent financial crisis in the UK. It will also
allow me to obtain further insights on the impact of the increased regulation of
companies on the governance-audit pricing relationship. Finance companies
(excluding investment companies) represent 18.7% of the sample firms.
The fifth contribution of this study is that in addition to 2007 data, 2010 data
representing the post-financial crisis period is included. This allows an
interesting investigation of the impact of the financial crisis on the relationship
between internal governance characteristics and audit fees. A comparative
analysis between 2007 (pre-economic crisis) and 2010 (post-economic crisis)
should reveal whether the relationship between corporate governance and audit
quality is stronger in the post than pre-economic crisis period or vice versa. This

12
also could increase understanding on corporate governance and how it is applied
in different economic environments.
Finally, this study explores in detail the relationship between corporate
governance characteristics and audit fees as well as the relationship between
non-audit fees and audit fees. Therefore, this study also contributes to
understanding issues of auditor independence and corporate governance
effectiveness in the UK, especially following current discussions among the
public policy and regulatory bodies surrounding these two issues.
1.5 Structure of Study
This chapter has discussed the motivation and background of the study as well as
identifying how the study will contribute to existing academic knowledge in the
area. Chapter two discusses the regulation of corporate governance and auditing
in the UK, including the development of corporate governance regulation in the
UK since the Cadbury report. Chapter three provides a comprehensive review of
prior research in the field of audit pricing and corporate governance. At the end
of the discussion, a table is presented to summarise the key studies since 1990.
This is followed by discussion in Chapter four of the theoretical underpinning of
the study and hypotheses development. There is also discussion on control
variables used in the study which are normally included in other audit pricing
studies. Chapter five outlines the research methodology adopted in this study
and develops a number of testable hypotheses. First, the research methods are
described and justified. This includes explanation of the rationale and
importance of the selected sample and details of how it differs from samples
used in previous UK studies. Chapter six presents and discusses the empirical
results. It starts with descriptive statistics and correlation analysis for the
variables concerned and then presents the multivariate results, with a discussion
of the findings in the context of the hypotheses outlined in chapter three.
Chapter seven presents a summary of this research study and draws conclusions
and implications. This chapter also highlights the study's potential limitations
and provides recommendations both for practitioners and policy-makers as well
as suggesting avenues for future research.
13
CHAPTER 2: Corporate Governance and Auditing in the UK
2.1 Introduction
The objective of this chapter is to give background on UK Corporate
Governance and auditing. The chapter first provides a definition of corporate
governance, followed by background on corporate governance and auditing in
the UK. The UK corporate governance approach which is more a principle-
based or “comply or explain” approach and the advantages of the approach are
also discussed. Then, the development of corporate governance and auditing in
the UK is highlighted, from the setting up of the Cadbury Committee in 1992 to
the latest developments. Finally, the research gap due to these developments is
identified.
2.2 Corporate Governance
Discussion of Corporate Governance has become more frequent due to the
increase in high profile corporate failures involving the alleged misbehaviour of
management in carrying out their agency duties in managing the business.
Despite the widespread use of the term, corporate governance has no generally
accepted definition (Rezaee, 2009). The reason for this is that the term is widely
used across many disciplines, such as management, law, behavioural sciences
and humanities (Adelopo and Jallow, 2010). Both the private and public sector
are concerned about the quality of corporate governance. However, regulators
tend to narrow down the definition, especially in an economic context, by
referring to corporate governance as an entire system of controls, financial and
otherwise, which ensure that a firm is directed in the right way and towards the
right direction (Cadbury, 1992). Despite the diverse definitions and meanings
attributed to the term, the importance of corporate governance is an undeniable
fact.
Narrowing the focus of governance down to shareholder-owned corporations, it
is generally accepted that two types of governance mechanisms are available in
seeking to ensure that managers pursue shareholders’ objectives in their
administration of companies – internal governance and external governance.
First, external control mechanisms include the regulatory framework, which has
14
produced many important corporate governance reports, such as the Cadbury
Report (1992), the Hampel Report (1998), the Higgs Report (2003), the Smith
Report (2003) and the Walker Report (2010). The second external governance
mechanism is the market for corporate control – in other words, poorly
performing companies face increased likelihood of being taken over by another
company. The third external control mechanism is the existence of the
managerial labour market, which focuses on such issues as retention, removal
and also management image related to poor performance. Another important
external governance mechanism available to the shareholders is the external
audit. In addition, a number of internal governance mechanisms also seek to
strengthen the quality of corporate governance. These include ownership
structure, the board of directors, audit committees and companies’ internal audit
function. This study will focus more on the relationship between internal
governance and monitoring mechanisms as the combination of strong internal
mechanisms with effective monitoring mechanisms constitutes strong overall
governance.
2.2.1 Corporate Governance and Auditing in the UK
Good corporate governance is very important as high quality corporate
governance helps to underpin long-term company performance. The Financial
Reporting Council (FRC) claims that the UK has some of the highest standards
of corporate governance in the world, which makes the UK market attractive to
new investment (FRC 2010). The UK Approach to Corporate Governance
(2010) points out that the key aspect of corporate governance in the UK is that a
single board is collectively responsible for the sustainable success of the
company, which means that checks and balances are needed. These checks and
balances include the separation of Chairman and Chief Executive positions,
balance of executive and independent non-executive directors, strong
independent audit and remuneration committees, and finally, an annual
evaluation by the board of its performance. It is very important to ensure that
systems of appointment and remuneration are transparent. Besides that, there
should be effective rights for shareholders, who should be encouraged to engage
with the companies in which they invest. In addition, the external auditor will act
as a complementary safeguard for the company. The auditor will act as a public

15
watchdog to ensure that the financial statements prepared by management are
free of material misstatement and errors. The financial statements prepared by
the management will be audited by the external auditor to assess whether
relevant accounting methods and procedures have been followed and whether
the company account is a true and fair view.
In contrast to the rule-based corporate governance practice in the US, the UK
approach to corporate governance is more principle based, which could help the
UK remain competitive in the global market. This fact was highlighted by the Rt
Hon Nick Anstee, Lord Mayor of the City of London, in 2010, in his foreward to
the UK Approach to Corporate Governance report (2010). The Mayor wrote:
“The UK’s system of business regulation, which is principles rather than rules
based, also reduces the cost to global businesses of introducing procedures to
comply with detailed regulations, many of which unnecessarily constrain
business practice and innovation. Of course, there continues to be public and
political pressure for better regulation of the City and this must be accepted and
acted upon. However, better regulation should be part of the framework for
economic growth, directed at the next crisis rather than the last. Excessive
regulation could damage the spirit of innovation that the UK economy needs.”
Corporate governance in the UK is guided by the UK Corporate Governance
Code, which was first issued in 1992. The series of Codes, published almost
every two years, has been instrumental in spreading best practice among listed
companies in the UK. The Combined Codes set out good practice covering
issues such as board composition and effectiveness, the role of board
committees, risk management, remuneration and relations with the shareholders.
Corporate governance in the UK is based on the “comply or explain” principle
and this is different from the rule-based corporate governance practices in the
US. Practically all listed companies are required under the UK Listing Rules
either to comply with the provisions of the Code or explain to investors in their
next annual report why they have not done so. The shareholders also could play
a role in monitoring the company’s direction. If shareholders are not satisfied
with the non-compliance and the explanation given by the company, they can
use their powers, including the power to appoint and remove directors, to hold

16
the company to account. To complement the Combined Codes and enhance the
effectiveness of corporate governance in UK, the Stewardship Code was
introduced in 2010. Investors are encouraged to sign up to the Stewardship
Code, which sets standards for their monitoring of and engaging with the
companies in which they invest.
There are a number of advantages to this “comply or explain” approach. First, its
inherent flexibility means that it is possible to set more demanding standards
than can be done through hard rules. Experience has shown that the vast
majority of companies set such standards as part of good corporate governance
in maintaining the company’s survival (FRC, 2010). This is proved by a report
by Governance Metrics International in September 2009 that the UK ranked
second in a table showing average governance performance by companies in
different countries (FRC 2010).
Second, it is proportionate and capable of dealing with a wide variety of
circumstances. This means that there is a relative lack of prescription as to how a
company’s board organises itself and exercises its responsibilities; however,
companies are provided with some guidance to manage their corporate
governance. The UK Corporate Governance Codes identifies good governance
practices but companies can choose to adopt a different approach if that is more
appropriate to their circumstances. This flexibility encourages the spirit of
innovation which is needed by the UK economy to grow and compete in the
global market.
Third, any non-compliance with recommendations in the Codes will be reported
in the annual report. This shows that the key relationship is between the
company and its shareholders, not between the company and the securities
regulator or stock exchange. In other words, the decision on whether a
company's governance is adequate is taken by those in whose interest the board
is meant to act (FRC 2010). This is because the shareholders have voting rights
and rights to information, set out in company law and the Listing Rules, which
enable them to hold the board to account. In addition, boards and shareholders
are encouraged to engage in dialogue on corporate governance matters to ensure
high quality corporate governance will be in place that could benefit everyone.

17
The Financial Reporting Council highlighted certain reasons why this approach
is chosen by the UK. First, a regulatory framework that aims to improve
standards of corporate governance is more likely to succeed if it recognises that
governance should support, not constrain, entrepreneurial leadership of the
company, while ensuring risk is properly managed. Thus a degree of flexibility
in the way companies adopt and adapt governance practices is required. This is
because effective corporate governance should be implemented in a way that fits
the culture and organisation of the individual company. This can vary
enormously from company to company, depending on factors such as size,
ownership structure and the complexity of its activities. In addition, it is
important that boards see good governance as a means to improve their
performance, not just as a compliance exercise. This could motivate a healthy
culture towards success and survival of the business.
Finally, the FRC highlighted that an assessment of whether the company’s
governance practices are effective in underpinning the sustainable success of the
company should be made by the intended beneficiaries - i.e. the shareholders.
This is important as well-informed and engaged investors are able to take a
pragmatic approach about how to apply best practice in a way that is in the best
long-term interests of the company. To ensure that the investors have the
information they need to make that assessment, companies are required to
disclose in their annual report any non-compliance with best practice together
with the reasons for non-compliance.
To ensure the relevance of the codes, they are revised and updated every two
years. Any changes are subject to extensive consultation and dialogue with the
market (FRC 2013). The most recent editions of the Codes were published in
September 2012. In addition to the UK Corporate Governance Code, the FRC
also publishes a series of guidance notes intended to assist companies in
addressing specific aspects of governance and accountability. They cover board
effectiveness, risk management and internal control, the role of audit
committees, and assessing and reporting on whether the business is a going
concern.
18
2.2.2 Development of Corporate Governance and Auditing in the UK
Initial corporate governance developments in the UK began in the early 1990s in
the wake of corporate scandals such as Polly Peck, BCCI and Maxwell.
Financial reporting irregularities led to the establishment of the Committee on
the Financial Aspects of Corporate Governance, led by Sir Adrian Cadbury and
subsequently the publication of the Cadbury Report in 1992. Following this, a
number of other governance reports and codes have been produced. This chapter
will discuss the development of corporate governance in the UK from early
1990s to the most recent development. It is important to understand and be
aware of these developments as when pricing their service auditor normally take
into consideration the corporate governance quality of a company to avoid or
reduce audit risk. The compliance to the relevant corporate governance codes by
companies would reflect good quality corporate governance practice.
The Cadbury Committee Report (1992)
The committee was set up as a result of increasing concerns and dissatisfaction
among public towards corporate misbehaviour. Public confidence in governance
of the corporations is declining as a result of the top management dominance and
lack of transparency in the accounting and auditing practices.
The recommendations of the committee covered various aspects of the
corporation including the structure and composition of the main board, structure
and operations of key board standing and ad hoc committees, the role of non-
executive directors and the reporting and control mechanisms in corporate
entities in the UK. Basically the report covers subjects covering the board
structure, non-executive directors, executive directors and reporting and
controls.
On the topic of structure and composition of the board, the committee
recommended that the board should meet regularly, retain full and effective
control over the company and monitor the executive management. There should
be a balance of power and responsibilities at the top of the company with no
individual having unfettered powers of decision-making. The roles of the
19
chairman and chief executive of the organisation should be vested in different
individuals, but with clearly defined roles and responsibilities for each office.
This is to prevent boardroom tussles and power play by achieving a balance of
power and compensating controls within the board itself. The board should have
a set of matters reserved for its attention.
On the issue of non-executive directors, the committee recommended that they
should bring an independent judgment to bear on issues of strategy, performance
and resources. They should form the majority of the membership of the board
and be independent of the management. They should be appointed for a
specified term without automatic reappointment. On executive directors, the
committee recommended that directors’ service contracts should not exceed
three years without shareholders’ approval and executive director’ pay should be
subject to the recommendations of a remuneration committee made up wholly or
mainly of non-executive directors. There should be full and clear disclosure of
directors’ total emoluments and those of the chairman and highest-paid UK
director, including pension contributions and stock options. Separate figures
should be given for salary and performance-related elements and the basis on
which performance is measured should be explained. On reporting and control, it
recommended that the board should establish an Audit Committee of at least
three non-executive directors with written terms of reference that deal clearly
with its authority and duties.
The Greenbury Committee (1995)
The report was issued following public concern and the outcry over excessive
directors’ remuneration, and huge payments for poor performance and ridiculous
severance payment packages popularly referred to variously as “golden
handshakes”, “golden parachutes”, “golden handcuffs” etc. Equally, executive
share options especially in certain privatised utility companies were becoming
excessive and questionable. The committee also produced a Code of Best
Practice which deals with the following issues:
1. The establishment, membership and status of remuneration
committees
20
2. The determination of remuneration policy for executive directors and
other senior executives
3. The disclosure and approval of the details of remuneration policy and
4. The length of service contracts and the determination of
compensation when these are terminated.
The code of best practice is to be implemented by listed companies but the
‘comply or explain’ non-compliance mechanism is also applied. With regards to
the establishment of a remuneration committee, Greenbury suggested that all
public companies should have a standing remuneration committee comprising of
wholly non-executive directors with a minimum of three members with clearly
defined terms of reference. For all aspect of remuneration, full disclosures that
form part of the information in the financial statements of public companies are
recommended. This disclosure should include all elements of total level of
remuneration, disaggregating total remuneration into all its component parts.
Therefore the annual bonus scheme and long-term incentive schemes including
executive share options are all to be disclosed for every director in the company.
Further, the measures of performance which are to be used in the determination
of the reward packages and the relationship between these rewards and the long
term objectives of the firm are all to be disclosed.
The Hampel Report 1998
The Hampel committee was established in November 1995 by Sir Sydney
Lipworth, the chairman of the Financial Reporting Council. Hampel Report was
published in 1998 and it endorses most of the recommendations of the Cadbury
and Greenbury Reports. The area of concern includes board structure, the
separation of the roles of the chairman from the chief executive, board balance
and the role of the non-executive directors on the board. The role of institutional
investors in governance, the relationship with shareholders and the role of
auditors in Corporate Governance also highlighted in the report. The committee
believes that stakeholders’ interests should be protected but not at the expense
and survival of the business (BBC News, 1998).
21
The Turnbull Report (1999)
The Turnbull Committee was set up by the Institute of Chartered Accountants in
England and Wales to provide guidelines on the implementation of the internal
control requirements of the Combined Code 1998. The Turnbull Report (1999)
focused on three main provisions of the Combined Code concerning a sound
system of internal control to safeguard shareholders’ investments and company
assets, and the need for the directors to conduct a review of the effectiveness of
the group’s system of internal control annually and to report to shareholders that
they have done so. The report asserted the responsibility of the directors in
respect of internal control and risk management. It emphasised that directors
need to ascertain that appropriate internal control procedures are in place and
that they are working. The nature and kind of risks facing the organisation do
change and directors need to be aware of these and review the procedures in
place to be certain of their adequacy and relevance in view of the nature of new
risks confronting the organisation.
The Higgs Committee Report (2003)
The Higgs Committee reported on the role and effectiveness of non-executive
directors. This is in response to corporate turbulence especially the the collapse
of big companies in the USA, Enron and WorldCom. The report supports most
of the earlier recommendations contained in the Combined Code and made
additional recommendations such as requesting listed companies to disclose in
their annual reports the number of meetings of the board and its committees as
well as the attendance record of the individual directors. It endorsed the
recommendation that the position of the chief executive and chairman of the
board should be separated, non-executive directors should meet as a group at
least once a year without executive directors being present and annual reports
should indicate that such a meeting had been held.

22
The Smith Committee Report (2003) and Guidance on Audit Committees
(2010) and (2012)
Smith Committee Reports (2003) was released around the time Higgs Report is
made available, in January 2003. The committee reported on five main areas of
the Audit Committee which cover it’s purpose, membership, relationship with
the board, roles and responsibilities and communications with shareholders. The
committee emphasised the important role of the Audit Committee in the bigger
picture of Corporate Governance as the audit committee which is independent of
the management could protect shareholders’ interests better.The following
recommendations to be included in the next Combined Code are proposed;
a. All audit committee members should be independent directors
b. At least one of whom should have recent and relevant financial
experience
c. The audit committee should have primary responsibility for all aspects of
the company’s relationship with the external auditors
d. The committee should make an annual report to shareholders, to include
an explanation as to how the auditor’s objectivity and independence is
maintained in cases where the auditor is also employed to provide non-
audit services to the company.
e. Audit committees should have at least three members (two in the case of
smaller companies)
f. Audit committee members should not serve for more than two three-year
terms, and
g. There should be a minimum of three meetings per year. (2003).
Subsequent revisions of the Combined Code in 2006 and 2008 as well as the UK
Corporate Governance Code in 2010 and 2012 have basically carried forward
the existing recommendations for audit committees as recommended by the
Smith Report (2003). The latest revision of the report is known as Guidance on
Audit Committees (2012). This guidance incorporates additional wording
intended to help the implemention of the recommendations of the Sharman
Inquiry on going concern.

23
The Combined Code (2003), (2006) and (2008) and UK Corporate
Governance Code 2010 and (2012)
Since its first edition in 1998, the Combined Code has been updated on a regular
basis in line with developments in the corporate environment and changes in the
global Corporate Governance guidelines that are deemed necessary in the
context of the UK. The “Comply or Explain” approach is still applied. The new
editions of the Combined Codes normally come with some amendments to the
previous ones. For example, the Combined Codes 2003 replaces the Combined
Code issued by the Hampel Committee on Corporate Governance in June 1998.
It derives from a review of the role and effectiveness of non-executive directors
by Derek Higgs (Higgs, 2003) and a review of audit committees by a group led
by Sir Robert Smith (Smith, 2003). The new Code calls for the following
changes:
a. A separation of the roles of the Chairman and Chief Executive. The
Chairman should satisfy the criteria for independence on appointment,
but should not, thereafter, be considered independent when assessing the
balance of board membership;
b. A Board of at least half independent NEDs. The Code defines
independence as recommended by the Higgs Report;
c. Candidates for Board selection to be drawn from a wider pool;
d. The Board, its committees and directors to be subject to an annual
performance review;
e. At least one member of the audit committee to have recent and relevant
financial experience; and
f. In contrast to the Higgs Report, the revised Code permits the Chairman
to chair the nominations committee, except where the committee is
considering the appointment of the chairman’s successor.
Two major changes is introduced in the Combined Code (2008) as compared to
Combined Code (2006). Firstly, it removes the restriction on an individual
chairing more than one FTSE 100 company. Secondly, for listed companies
outside the FTSE 350, it allows the company chairman to sit on the Audit
Committee where he or she was considered independent on appointment

24
(Combined Code, 2008). The UK Corporate Governance Code (formerly the
Combined Code) was updated in June 2010 following an extensive review
carried out by the FRC in parallel with Sir David Walker’s review of corporate
governance in the financial sector. Among the changes as compared to the
Combined Codes 2008 are:
a. To encourage boards to be well balanced and avoid “group think”, there
are new principles on the composition and selection of the board,
including the need to appoint members on merit, against objective
criteria, and with due regard for the benefits of diversity, including
gender diversity.
b. To promote proper debate in the boardroom, there are new principles on
the leadership of the chairman, the responsibility of the nonexecutive
directors to provide constructive challenge, and the time commitment
expected of all directors.
c. To help enhance the board’s performance and awareness of its strengths
and weaknesses, the chairman should hold regular development reviews
with each director and board evaluation reviews in FTSE 350 companies
should be externally facilitated at least every three years.
d. To increase accountability to shareholders, all directors of FTSE 350
companies should be re-elected annually and chairmen are encouraged to
report personally on how the principles relating to the leadership and
effectiveness of the board have been applied.
e. To improve risk management, the company‘s business model should be
explained and the board should be responsible for determining the nature
and extent of the significant risks it is willing to take.
f. Performance-related pay should be aligned to the long-term interests of
the company and its risk policies and systems.
It is also reported that Implementation of the UK Corporate Governance Code
by listed companies has generally been good. FRC reports high rates of
compliance with most provisions of the Code by companies of all sizes. There
has been an encouraging response to the changes made to the Code in 2010
where eighty percent of FTSE 350 companies put all their directors up for re-
election, while more companies are bringing in external advisers to assist with

25
evaluation of the board’s effectiveness. In addition, many company chairmen
and committee chairs make a personal statement in the annual report. It is also
reported that it was clear from a series of meetings with directors and others held
earlier in the following year that boards are now paying considerable attention to
understanding and overseeing the main risks facing the business, as required by
the Code.
The revised Code (2012) issued in September 2012 followed a consultation
exercise seeking views on whether to amend the UK Corporate Governance
Code and the associated Guidance on Audit committees. The main changes to
the UK Corporate Governance Code included that boards should confirm that
the annual report and accounts taken as a whole are fair, balanced and
understandable, that audit committees should report more fully on their
activities, and that FTSE 350 companies should put the external audit contract
out to tender at least every ten years. In addition, companies are also required to
report on their boardroom diversity policies. As with all existing provisions of
the Code, these additions are subject to the “comply or explain” approach.
The companies (Disclosure of Auditor Remuneration and Liability
Agreements) Regulations 2005
Following the corporate scandals of earlier in the decade, including Enron and
WorldCom, the regulation of auditors in the UK was reviewed and one aspect
of that review was the provision of non-audit services by a company auditor.
The Companies (Disclosure of Auditor Remuneration) Regulations 2005 were
made on 25 st
August 2005 after consultation with a range of stakeholders. They
were laid before parliament on 31 st
August 2005 and came into force on 1st
October 2005. Section 4 of the regulations clearly state that the notes to the
account of a company shall disclose the amount of any remuneration receivable
for auditing of the accounts and the supply of other services.
In addition, schedule 2 of the act details out the services to be disclosed in the
company annual report:
a. The auditing of accounts of associates of the company pursuant to
26
b. legislation (including that of countries and territories outside Great
Britain).
a. Other services supplied pursuant to such legislation.
b. Other services relating to taxation.
c. Services relating to information technology.
d. Internal audit services.
e. Valuation and actuarial services.
f. Services relating to litigation.
g. Services relating to recruitment and remuneration.
h. Services relating to corporate finance transactions entered into or proposed
to be entered into by or on behalf of the company or any of its associates.
i. All other services.
On 6th of April 2008, the Companies (Disclosure of Auditor Remuneration and
Liability Agreements) Regulations 2008 were coming into force. These
regulations require companies to disclose in their annual accounts the amounts
payable for the services they and their associates have purchased from their
auditors and their associates. They also require companies to disclose whether
they have entered into a liability limitation agreement with their auditors, and if
so, to provide certain information about that agreement. They replace the
existing Companies (Disclosure of Auditor Remuneration) Regulations 2005 (SI
2005/2417).
On 1 October 2011 new regulations (Companies (Disclosure of Auditor
Remuneration) Regulations 2005 ) for how companies report the fees they have
paid their auditor came into force. To help businesses of all sizes disclose the
right sums, ICAEW has published detailed guidance. The companies are legally
required to disclose the amount of fees they pay auditors, with large companies
and groups also being required to provide detailed break-downs of the amount of
money spent on audit and non-audit services. This fact is made clear by Dr Nigel
Sleigh-Johnson, Head of ICAEW’s Financial Reporting Faculty, who said:
“All UK companies are legally required to disclose the amount of money
they have paid their auditor in their annual reports, with large companies

27
also being required to provide a detailed breakdown of the amount paid
by the type of service bought.
“The new legislation changes the way non-audit services are classified..
As it is not always straightforward to work out which audit firm services
fall into which categories from the legal text, ICAEW’s Financial
Reporting Faculty has issued a technical release that provides detailed
guidance to help UK companies determine how to break down and
present the information in accordance with the new legal requirements.”
Detailed explanation on the purpose of the regulation which is to require the
companies to disclose services (both audit and non-audit services) provided by
their auditor, and the fees paid for those services, in notes to the company’s
annual published accounts is provided in the explanatory memorandum of the
act. The new Schedule is intended to work in parallel with the Ethical Standards
for Auditors produced by the Auditing Practices Board. The standards require
auditors to undertake an analysis of threats to their independence (including
from the provision of non-audit services) and to put in place any necessary
safeguards in order to reduce those threats to an acceptable level.
UK Stewardship Code (2010) and Revised in 2012
The UK Stewardship Code was published in July 2010 with the aim to enhance
the quality of engagement between institutional investors and companies to help
improve long-term returns to shareholders and the efficient exercise of
governance responsibilities. The Code set out good practice on engagement with
investee companies to which the FRC believes institutional investors should
aspire and operates on a 'comply or explain' basis. The FSA requires UK
authorised asset managers to report on whether or not they apply the Code and to
disclose on their websites how they have applied the Code. Since December
2010 all UK-authorised Asset Managers are required under the FSA's Conduct
of Business Rules (FSA, 2010) to produce a statement of commitment to the
Stewardship Code or explain why it is not appropriate to their business model.
The FRC sees the UK Stewardship Code as complementary to the UK Corporate
Governance Code for listed companies.
28
The new Stewardship Code, published in September 2012, has been more
extensively revised than the UK Corporate Governance Code, although the
seven principles of the Code are unchanged. The main changes to the
Stewardship Code include: clarification of the respective responsibilities of asset
managers and asset owners for stewardship, and for stewardship activities that
they have chosen to outsource; and clearer reporting requirements, including on
the policy on stock lending.
Asset managers are also encouraged to have the processes that support their
stewardship activities independently verified, to provide greater assurance to
their clients. The Institute of Chartered Accountants in England and Wales
published in November 2012 a revised edition of the Stewardship Supplement to
its guidance on assurance reporting (AAF 01/06) to enable assurance to be
carried out against the revised Code. Table 1.1 on page 29 summarises the
development of corporate governance since the early 1990s.
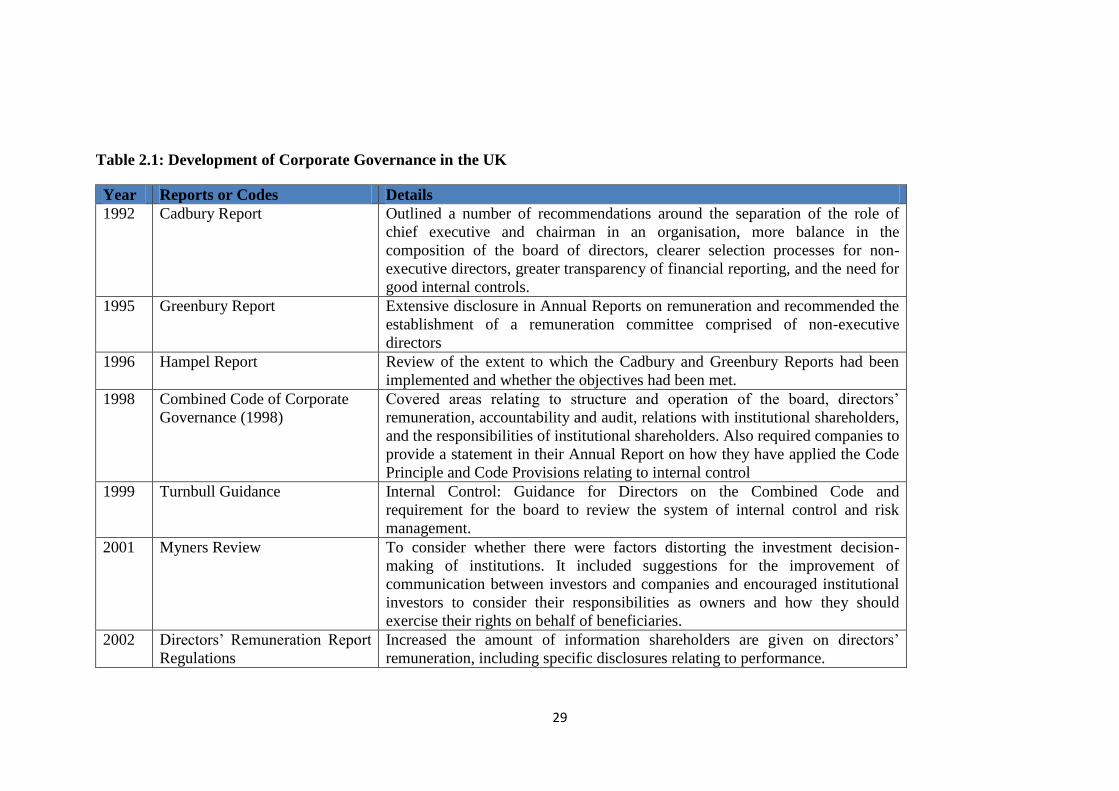
29
Table 2.1: Development of Corporate Governance in the UK
Year Reports or Codes Details
1992 Cadbury Report Outlined a number of recommendations around the separation of the role of
chief executive and chairman in an organisation, more balance in the
composition of the board of directors, clearer selection processes for non-
executive directors, greater transparency of financial reporting, and the need for
good internal controls.
1995 Greenbury Report Extensive disclosure in Annual Reports on remuneration and recommended the
establishment of a remuneration committee comprised of non-executive
directors
1996 Hampel Report Review of the extent to which the Cadbury and Greenbury Reports had been
implemented and whether the objectives had been met.
1998 Combined Code of Corporate
Governance (1998)
Covered areas relating to structure and operation of the board, directors’
remuneration, accountability and audit, relations with institutional shareholders,
and the responsibilities of institutional shareholders. Also required companies to
provide a statement in their Annual Report on how they have applied the Code
Principle and Code Provisions relating to internal control
1999 Turnbull Guidance Internal Control: Guidance for Directors on the Combined Code and
requirement for the board to review the system of internal control and risk
management.
2001 Myners Review To consider whether there were factors distorting the investment decision-
making of institutions. It included suggestions for the improvement of
communication between investors and companies and encouraged institutional
investors to consider their responsibilities as owners and how they should
exercise their rights on behalf of beneficiaries.
2002 Directors’ Remuneration Report
Regulations
Increased the amount of information shareholders are given on directors’
remuneration, including specific disclosures relating to performance.
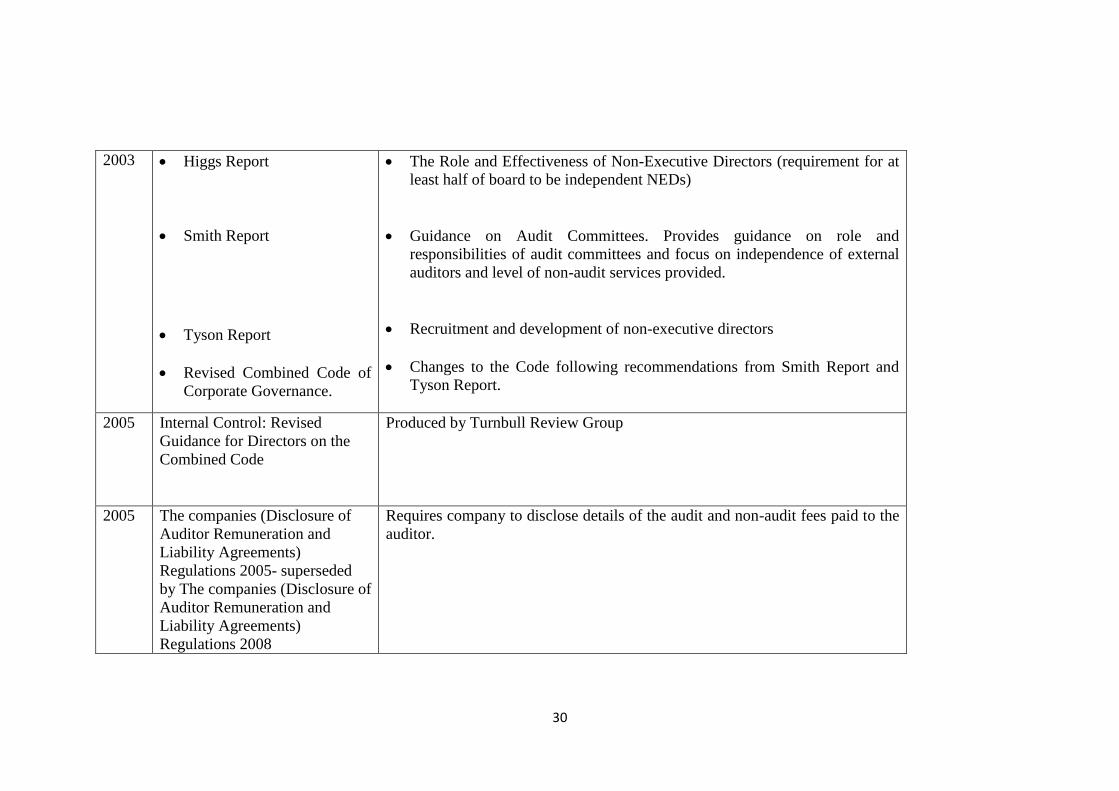
30
2003 Higgs Report
Smith Report
Tyson Report
Revised Combined Code of
Corporate Governance.
The Role and Effectiveness of Non-Executive Directors (requirement for at
least half of board to be independent NEDs)
Guidance on Audit Committees. Provides guidance on role and
responsibilities of audit committees and focus on independence of external
auditors and level of non-audit services provided.
Recruitment and development of non-executive directors
Changes to the Code following recommendations from Smith Report and
Tyson Report.
2005 Internal Control: Revised
Guidance for Directors on the
Combined Code
Produced by Turnbull Review Group
2005
The companies (Disclosure of
Auditor Remuneration and
Liability Agreements)
Regulations 2005- superseded
by The companies (Disclosure of
Auditor Remuneration and
Liability Agreements)
Regulations 2008
Requires company to disclose details of the audit and non-audit fees paid to the
auditor.

31
2006 Revised Combined Code of
Corporate Governance
Changes to the remuneration committee, nomination committee and
institutional shareholders’ right to withhold their votes.
2008 Revised Combined Code of
Corporate Governance
Changes include removal of the restriction in provision on an individual
chairing more than one FTSE 100 company and to allow the company chairman
of a smaller company (not FTSE 350) to be a member of, but not chair, the
audit committee provided that he or she was considered independent on
appointment.
2009 Financial Reporting Council’s
guidance entitled ‘Going
concern and liquidity risk:
Guidance for directors of UK
companies 2009
Guidance on going concern for directors of UK companies to assist them with
their assessment of going concern and in evaluating the nature and extent of
disclosures.
2009 Walker Review Number of recommendations incorporated into the renamed 2010 UK corporate
Governance Code
2010 Revised Combined Code of
Corporate Governance now
called the UK Corporate
Governance Code 2010
Proposed new additions to those main principles include:
The chairman will be responsible for leadership of the board and for
ensuring its effectiveness.
A ‘fit for purpose’ obligation on the composition of boards to enable them to
discharge duties and responsibilities effectively.
An obligation on non-executive directors to constructively challenge and
help develop proposals on strategy.
Requirement for Directors to allocate sufficient time to perform their
responsibilities effectively.
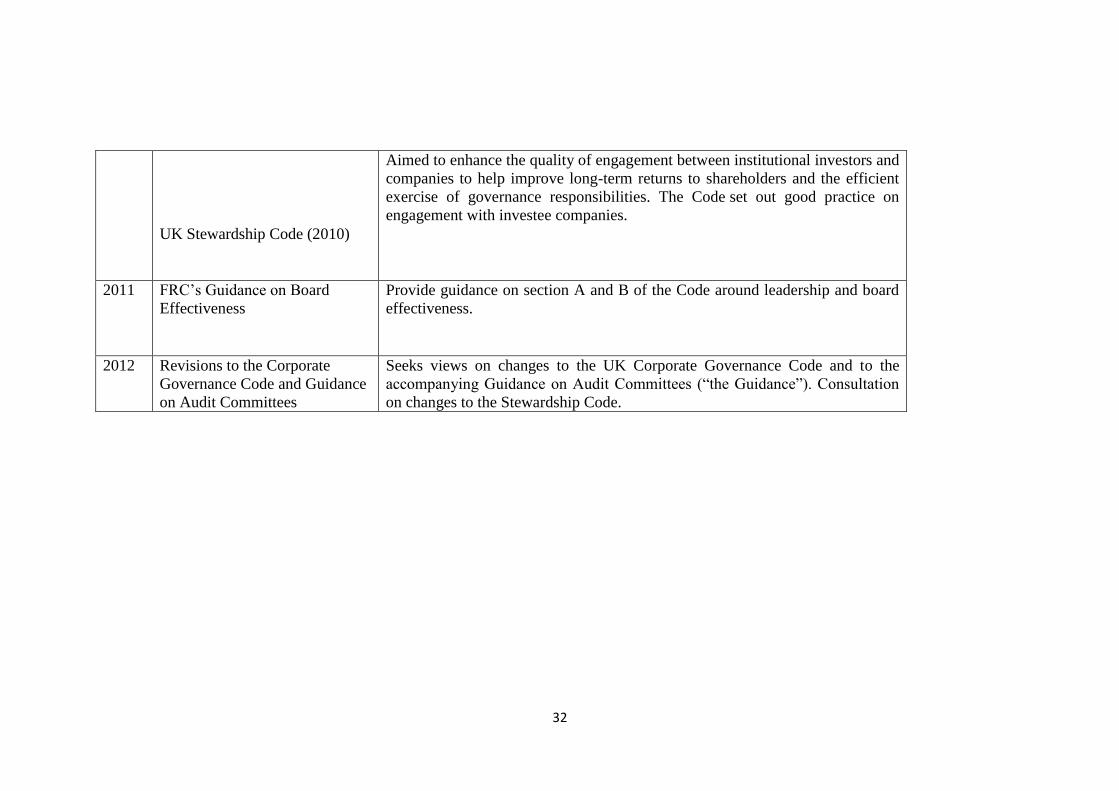
32
UK Stewardship Code (2010)
Aimed to enhance the quality of engagement between institutional investors and
companies to help improve long-term returns to shareholders and the efficient
exercise of governance responsibilities. The Code set out good practice on
engagement with investee companies.
2011 FRC’s Guidance on Board
Effectiveness
Provide guidance on section A and B of the Code around leadership and board
effectiveness.
2012 Revisions to the Corporate
Governance Code and Guidance
on Audit Committees
Seeks views on changes to the UK Corporate Governance Code and to the
accompanying Guidance on Audit Committees (“the Guidance”). Consultation
on changes to the Stewardship Code.

33
2.2.3 The Impact of Governance and Non-Audit Development on Audit Pricing
The Cadbury Report (1992) was issued in response to UK governance failures such
as Polly Peck, BCCI and Maxwell. The Cadbury Report outlined a number of
recommendations around the separation of the role of chief executive and chairman
in an organisation, more balance in the composition of the board of directors, clearer
selection processes for non-executive directors, greater transparency of financial
reporting, and the need for good internal controls. The Cadbury Report inspired
researchers to study the relationship between audit pricing and corporate
governance in more detail. Prior to the Cadbury period, most of the audit pricing
studies investigated the relationship between audit fees and the presence of the
board or audit committee. Using 1989-1991 data from 315 FTSE companies in the
UK, Collier and Gregory (1996) investigated the relationship between audit fees
and the presence of audit committee. They found that the relationship between size-
related audit fees and the presence of an audit committee is positive and significant.
Utilising data from the pre-Cadbury period, O’Sullivan (2000) investigated the
impact of board characteristics on audit fees using data from 402 quoted companies
in 1992. The finding was that the proportion of non-executive directors has a
significant positive impact on audit fees. The author suggests that non-executive
directors encourage more intensive audits as a complement to their own monitoring
role. The same author was also interested in the relationship between board
characteristics and audit fees, post-Cadbury period. O’Sullivan (1999) investigated
the impact of board and audit committee characteristics on audit pricing, using data
on 146 large UK listed companies at the end of the 1995 financial year. However, as
compared to the study using pre-Cadbury data, this study found no evidence that
board characteristics influence auditors’ pricing decisions. The author claims that
the absence of a relationship between internal governance characteristics and audit
fees in the study may be due to a number of reasons. First, improved governance
characteristics are expected to have a dual impact on audit fees: while greater use of
non-executives and audit committees is expected to indicate stronger internal
controls and a reduced demand for audit testing, the increased independence of the

34
audit function from the control of senior executives may allow auditors to undertake
more extensive audits and consequently charge higher fees. Second, as audit users’
expectations of non-executives’ monitoring responsibilities increase, non-executive
directors are expected to transfer some of this responsibility to auditors by requiring
auditors to undertake more thorough audits. Since the recommendations of Cadbury
(1992) have been widely adopted by UK listed companies, the variation between
companies in respect of governance characteristics is likely to be small, therefore
weakening the power of their empirical tests. O’Sullivan and Diacon (2002)
compared the pricing of audits in 117 UK mutual and proprietary insurance
companies (including audit committees and non-audit fees) in 1992. The study
found that the existence of an audit committee has a positive impact on audit fees
paid by companies but audit fees are not sensitive to the composition of the audit
committee.
In 2003, two reports, namely the Higgs Report (2003) and the Smith Report (2003),
as well as a Revision of the UK Combined Code for Corporate Governance (2003),
were issued, mainly in response to US corporate failures such as Enron, WorldCom
and Tyco and associated concerns over auditor independence. The infamous Enron
scandal in 2002 prompted a global shift to re-regulation in the form of the Sarbanes-
Oxley Act (SOX) (2002), which introduced major changes to the US audit, financial
reporting and corporate governance regimes. As discussed earlier in regard to
development of corporate governance in UK, unlike the US approach of regulation
through the Sarbanes-Oxley Act in response to corporate failure, the UK Combined
Code for Corporate Governance (2003) sticks with the “Comply or Explain”
principle. This is to encourage the innovation needed for economic growth and give
the shareholders, as the real owners of the company, more power than the regulator
to monitor the company. Additional requirements were introduced, such as at least
half of the board should be independent non executive directors (NEDs) and annual
board and director evaluation. To address the issue of auditor independence, the
Smith Report (2003) provides guidance on the role and responsibilities of audit
committees in dealing with external auditors. The guidance focuses on the external

35
auditors’ independence and the level of non-audit services provided by them, in
other words requiring much closer engagement between the audit committee of a
company and its auditors, thus creating a much more significant role for the audit
committee in the audit process.
The developments in this area inspired Zaman et al. (2011) to examine the influence
of audit committee effectiveness, a proxy for governance quality on audit fees and
non-audit fees, using a new composite measure comprising audit committee
independence, expertise, diligence and size. This study involved 135 companies
listed on FTSE 350 on the London Stock Exchange in 2001-2004. They found
enough evidence to conclude that audit committee effectiveness (ACE) has
significant positive impact on audit fees after controlling for board characteristics
only for larger clients. Their results indicate that effective audit committees
undertake more monitoring, which results in wider audit scope and higher audit
fees. Contrary to their expectations, the association between ACE and NASF was
found to be positive and significant, especially for larger clients. This suggests that
larger clients are more likely to purchase non-audit services (NAS) even in the
presence of an effective audit committee, probably due to the complexity of their
activities.
On the other hand, post-Enron prohibitions on the provision of certain types of NAS
led to large reductions in the amount of NAS provided by incumbent auditors
(Beattie, 2012). Beattie et al. (2009) reported that a study by Deloitte (2009)
documented a significant reduction in the percentage of NAS provision to audit fees
provided by auditor to their audit client from 300% in 2001 to 75% in 2008. The
study concluded that both regulatory changes and voluntary choices made by
companies seeking to avoid criticism are the reasons for the significant reduction.
The reason for substantial reduction in NAS is provided by Beattie and Fearnley
(2009). Using questionaire responses from 446 qualifying UK companies, Beattie
and Fearnley (2009) identified four main drivers of the changes to the non-audit
regime on the decisions of UK listed company finance directors, audit committee
chairs and audit partners, in 2007. First, enhanced role of the audit committee in
36
developing a policy for NAS purchase, as introduced by the Combined Code (2003)
and the Smith Report (2003), has made audit committees more conscious of the
importance of auditor independence and therefore reluctant to buy services from
their auditor. Second, less visible driver is the risk to the directors of a challenge
from activist investors and from adverse publicity where the level of NAS appears
too high or the services disclosed appear inappropriate. Third, the requirement for
auditors to comply with ES 5 has restricted their ability to provide many services,
regardless of client need. Fouth, the UK’s audit inspection regime has created an
environment where breaches of ethical standards or inaccurate reporting of the
breakdown of NAS are likely to be discovered, providing a further deterrent to NAS
provision by the auditors. Beattie and Fearnley (2009) concluded that the additional
restrictions have had an adversely impact on the efficiency and effectiveness of the
financial reporting and auditing process, as auditors have less knowledge and
understanding of the business.
Following concern over auditor independence, on 30 November 2011 the European
Commission presented its proposals regarding the statutory audit of public-interest
entities (European Commission, 2011). The proposal focuses on audit tenure as well
as prohibition of providing non-audit services to audit clients. At UK level, the FRC
has taken this issue seriously. One of the key changes in the UK Corporate
governance Code (2012) is that FTSE 350 companies should put the external audit
contract out to tender at least every ten years. However, this new requirement leads
to many problems. It is reported (FRC 2013) that audit firms are facing fee
pressures in the current economic environment, as evidenced by substantial
reductions in audit fees as a consequence of audit tenders, particularly in respect of
large listed entities. Responding to these pressures, audit firms are seeking
efficiencies by reducing overall audit hours (FRC 2013). It is reported in the FRC’s
audit quality inspection report (FRC 2013) that reductions in audit hours may be
achieved through the application of higher materiality levels, which reduces the size
of the sample tested, and by reducing the extent of testing in areas of low audit risk.
Audit firms have also been found to use samples that do not cover the entire period

37
or the total population, increasing the level of judgmental sampling, and in the
context of group audits there have been instances where materiality applicable to
business components has been increased, thus the number of business components
subjected to full audit procedures has been reduced. The FRC has consequently
raised concerns regarding the position of audit committees. They stress the fact that
audit committees also have an important role to play in this area. It is suggested that
where fee reductions have been offered, audit committees should scrutinise the
proposed scope of the audit, including the determination of materiality, the attention
to be given to each business component and to the significant audit risks identified.
It is also suggested that if there are significant changes in these areas following fee
reduction, audit committees should carefully consider whether the overall level of
work to be performed is likely to be sufficient to identify material misstatements
and also to ensure that audit quality is not compromised.
It is observed that over the past decades, corporate governance and auditing have
developed well especially since controversial collapse of Enron in 2002. These
involve changes to the supply of audit and non-audit services, with restrictions on
the non-audit services that can be offered by auditors. At the same time, corporate
governance developments have increased the scope and the role of the board of
directors and, more importantly, audit committees in dealing with auditors.
Following the development of corporate governance, the literature in audit pricing is
also developed. The earlier UK studies (e.g. O’Sullivan, 1999; O’Sullivan, 2000)
have examined the relationship of governance characteristics and audit fees in the
pre or post Cadbury period. Literature review shows that there is still a little number
of studies investigating the relationship between corporate governance
characteristics and audit fees after Smith Report (2003). The quite similar study is
done by Zaman et al. (2011) who investigate the relationship between audit
committee effectiveness and audit fees before or around the time of the Smith
Report (2003) using data of 135 FTSE 350 listed companies in 2001 to 2004.
Another study (Adelopo et al., 2012) utilised data of 209 FTSE 350 companies for
year end 2005/2006 but only focus on the relationship between the number of

38
multiple large shareholders and audit committee activity on audit fees. Given this
background, this study aims to fill the gap in the literature. As compared to Zaman
et al. (2011), this study contributes to the literature as more comprehensive
measurements and scope of governance characteristics; including board
characteristics, audit committee characteristics and ownership are used. In addition,
this study utilises bigger sample companies from FTSE All Shares listed companies
(384 companies) in 2007 and 2010 (768 observations). The use of more
contemporary data could capture the impact of the recommendations by Smith
Report (2003) and Higgs Report (2003) better as compared to Zaman et al. (2011).
Another gap identified is that there is no study investigating the relationship
between audit fees and detail component of non-audit services using published data.
This is because, prior to 2005, this information is not publicly available. Therefore,
this study makes another major contribution by using published data of detail
components of non-audit services which are available since the enactment of the
Companies Act (Disclosure of Auditor Remuneration and Liability Agreements)
Regulations in 2005.
2.3 Chapter Summary
The chapter begins with a brief introduction to corporate governance in the UK. The
importance of high quality corporate governance for long-term company
performance is highlighted and the UK approach to corporate governance is
explained. Basically, unlike the rule-based corporate governance practised in the
US, corporate governance in the UK is more principle based and the approach is
“comply or explain”. Corporate governance in the UK is guided by the UK
Corporate Governance Codes, which were first issued in 1992 and have been
revised and updated almost every two years since. The second part of the chapter
discusses the principles of corporate governance practice in the UK and the “comply
or explain” approach. The advantages of the approach are discussed and the reasons
for the adoption of this approach are explained.
The chapter continues by outlining the development of corporate governance in the
UK. The fact that corporate governance development in the UK, starting with the

39
establishment of the Cadbury Committee in 1992, was initiated due to corporate
scandals such as Polly Peck, BCCI and Maxwell is highlighted. Details are provided
of the reports produced from 1992 to 2012, including, first, the Cadbury Committee
Report (1992), followed by The Greenbury Committee report (1995) and later, the
Hampel Committee report (1998) and the Turnbull Report (1999). In 2003, The
Higgs Committee Report was published in the wake of other infamous scandals and
corporate collapses involving Enron and WorldCom in the US. In the same year, the
Smith Committee Report was published in the UK. The report emphasised the
important role of the Audit Committee in the bigger picture of Corporate
Governance. The latest revision of the report is known as Guidance on Audit
Committees (2012). The Combined Codes, first published in 1998, are then
discussed. It is highlighted that the Codes have been updated on a regular basis in
line with developments in the corporate environment locally and globally. The
regulation of auditors in the UK was also reviewed in light of the same corporate
scandals that happened in the early years of the decade. The Companies (Disclosure
of Auditor Remuneration and Liability agreements) Regulation 2005 came into
force on 1st October 2005, focusing on the provision of non-audit services by a
company auditor. This regulation requires detailed disclosure of non-audit services
provided by the auditor to their audit client. The revision of the act was published in
6th
of April 2008 with additional requirements for companies to disclose in the
annual accounts the amounts payable for the services they and their associates have
purchased from their auditors and their associates and whether the company have
entered into a liability agreement with their auditors and if so to provide certain
information about the agreement. Another revision came into force on 1st October
2011 and, to help companies to disclose the right sums, ICAEW published detailed
guidance. The replacement schedule is intended to enable clearer disclosure of fees
for audit and non-audit services and to work in parallel with the ethical Standards
for Auditors produced by the Auditing Practice Board (APB). The standards require
auditors to undertake an analysis of threats to their independence and to put in place
any necessary safeguards in order to reduce these to an acceptable level. To enhance
the quality of engagement between institutional investors and companies and to help

40
improve long-term returns to shareholders and the efficient exercise of governance
responsibilities, the UK Stewardship Code was published in July 2010. FRC sees
the UK Stewardship Code as complementary to the UK Corporate Governance
Code for listed companies. The latest revision to the codes was published in
September 2012.
The next part of the chapter discusses how developments in corporate governance in
the UK have affected auditing and audit pricing. Before the Cadbury Report (1992)
most of the audit pricing literature investigated the relationship between audit
pricing and existence of an audit committee or the board of directors (eg: Collier
and Gregory, 1996). After the release of the Cadbury Report in 1992, which
highlighted the importance of non-executive directors on the board of directors and
also the audit committee, researchers start investigating the relationship between
governance characteristics and audit fees (eg: O’Sullivan, 1999 and Zaman et al.,
2011). The development in corporate governance in the UK has increased the role
of the board and also audit committees in ensuring the success and long term
survival of the business. At the same time, rules have been tightened regarding non-
audit services that can be offered by auditors to their audit clients, to ensure the
auditor’s independence. With the changes in both the supply of audit services
(auditor side) and demand for audit services (company side), a new study is greatly
needed in order to consider both of these factors and assess whether the relationship
identified by earlier studies that used data post Cadbury Report (1992) (eg:
O’Sullivan, 1999) and later data from around the time of the Smith Report (2003)
(eg: Zaman et al., 2011) still stands.

41
CHAPTER 3: LITERATURE REVIEW
3.1 Introduction
The objective of the chapter is to review prior literature on audit pricing, corporate
governance and also non-audit service. The discussion starts with a review of
general audit pricing studies since the seminal paper of Simunic (1980). This
discussion is followed by a review of corporate governance and audit pricing
literature. The second part of the chapter provides a discussion on non-audit fees
and audit pricing. The discussion starts with the general non-audit fees literature.
Independence issues related to the provision of non-audit service are also
highlighted. The chapter then provides a review on prior non-audit fees and audit
fees studies. At the end of the chapter, the gap in audit pricing literature is
identified.
3.2 Audit Pricing Literature
As the issue of corporate failure continues to attract attention and controversy, the
role of auditors has come under increased scrutiny, especially due to their apparent
inability to foresee and warn about impending failures, and the study of audit fees,
specifically their determinants, becomes more relevant and current. According to
Hay et al. (2006), there are two main reasons why researchers study the
determinants of audit fees: (i) to evaluate the competitiveness of audit markets, and,
(ii) to examine issues of contracting and independence related to the audit process,
for example, low-balling, and the impact of non-audit services on audit pricing.
Regardless of the purpose of the study, Hay et al. (2006) found that a common
methodology has been developed in the course of the publication of over 100
journal articles examining the determinants of audit fees. Both auditors and their
client companies can benefit from improved knowledge in this area. As for clients,
better knowledge could assist them in negotiating audit fees and controlling the
internal aspects that influence the amount of the audit fee (Meshari, 2008). On the
other hand, it could also help the auditors to price their audit services appropriately
42
(Gist, 1992). Low et al. (1990, p. 292) further underline the value of audit fee
studies:
“The strength of the audit fees model is in its objectivity and its relevance to
the audit function. Fees are, and should be, a direct measure of the audit effort
expended in response to the risks involved in audit engagements. This basis of
fees determination is decidedly fair to both auditors and their clients because it
provides an objective benchmark for fees negotiation and is directly related to
the services rendered”
The primary work in studying the determinants of audit and non-audit fees was
conducted by Simunic (1980). Using 397 responses from a survey of publicly held
corporations in the US conducted in 1977, he developed and tested a model to
explain the relationship between audit fees and many different variables. The
dependent variable of his study is measured by the amount of current year’s
external auditor fees. The factors initially identified as determining audit fees
include:
a. Size (measured by total assets);
b. Complexity (measured by no. of consolidated subsidiaries; no. of two-digit
SIC industries in which auditee operates; and foreign assets divided by total
assets at year end).
c. Industry;
d. Audit risk (measured by net income divided by total assets; dummy variable
for loss incurred during the year; and instance of the company receiving a
subject to or qualified audit opinion during the year);
e. Audit tenure (no. of years);
f. Auditor type or identity (big eight or not)
The hypotheses of his study were tested by obtaining least-squares’ estimates of the
coefficients of the variables in the following linear regression function:

43
FEE / ASSETS e =b0 + b1SUBS+ b2DIVERS+ b3 FORGN + b4RECV +b5INV +
b6PROFIT + b7LOSS + b8SUBJ + b9TIME + b10AUDITOR + u
Where:
FEE / ASSETS = the ratio of current year’s external audit fee/total assets
SUBS =number of consolidated subsidiaries
DIVERS=number of two-digit SIC industries in which auditee operates, less one
FORGN=foreign assets + total assets at year-end
RECV=accounts, loans and notes receivable + total assets at year-end
INV=inventories + total assets at year-end
PROFIT = net income + total assets
LOSS =dummy variable (1,0) where (1) if auditee incurred loss in any three
fiscal years
SUBJ=dummy variable (1,0) where (1) if auditee received a “subject to”
qualified opinion
TIME =number of years auditee has used current auditor
AUDITOR=dummy variable (1,0) where (1) if auditor is a Big Eight audit firm
The study found that the audit fee is a function of auditee size, complexity, risk and
the relative elasticity of demand for both audit and non-audit services.The model he
developed has been and continues to be used widely and has been significantly
expanded, with the addition of new variables by many researchers over the past 30
years. His model is widely used not only in Anglo-Saxon countries but also in other
parts of the world. Studies of the determinants of audit fees have been conducted,

44
for example, in India (Simon et al., 1986), Singapore (Low et al., 1990), Hong Kong
(Simon et al., 1992), Malaysia (Simon et al., 1992), South Africa (Simon, 1995),
Bangladesh (Karim and Moizer, 1996), The Netherlands (Langendijk, 1997),
Norway (Firth, 1997), Japan (Taylor, 1997), Pakistan (Simon and Taylor, 1997),
South Korea (Taylor et al., 1999), Finland (Nieme, 2002), Nigeria (Taylor and
Simon, 2003), Indonesia (Basioudis and Fifi, 2004), Italy (Cameran, 2005), Kuwait
(Meshari, 2008) and China (Wang et al., 2009).
In their meta-analysis of many existing audit fee studies up to the year 2001, Hay et
al. (2006) summarised the determinants of audit fees into three main attributes: (i)
client attributes, (ii) auditor attributes, and (iii) other attributes. The most traditional
determinants of audit fees that relate to client companies are client size, complexity
and audit risk. As well as audit client characteristics, auditor attributes could be
associated with higher or lower audit fees. Common audit pricing models normally
seek to recognise “auditor effect” by including variables representing the quality of
the auditor (normally measured by whether the audit firm is categorised as Big or
non-Big), length of audit tenure and also the location of the audit firm. Other factors
which may affect audit pricing are engagement related matters. These include
factors such as report lag, ‘busy season reporting’ and, very importantly, the joint
provision of audit and non-audit services by the same accounting firm. Discussion
on these general determinants is provided in the hypotheses development chapter as
this study uses these determinants as control variables to assess the impact of
governance characteristics and non-audit fees on audit fees.
As the audit pricing literature developed over the years, new variables were added
to the model initially introduced by Simunic (1980). Ten years after Simunic
(1980), Turpen et al. (1990) examined whether auditing firms differentially price the
audits of new clients, using data from 146 public companies between 1982-1984 in
the USA. The study found that audit fees for new clients are significantly lower than
those for continuing engagements when controlling for the influence of other audit
fee determinants. The additional tests indicate that this differential persists into the
second year following a change of auditor.

45
In the UK, Chan et al. (1993) investigated the applicability of the existing audit fee
models in the UK context. The study added three new variables to the study, namely
the Herfindahl diversification index, ownership control and audit location. Using
data from 985 quoted companies in 1989 in the UK, they found that the results were
consistent with previous research, particularly in relation to the effect on audit fee of
auditee size and number of subsidiaries. In addition, a Big Eight premium was also
observed for both large and small size auditees. However, not all the new variables
introduced were significant in explaining audit fees. In the same year, Chan et al.
(1993) further investigated the determinants of audit fees in the UK, using more
variables. The study involved 280 quoted companies in 1987. The principal
explanatory variables were found to be auditee size, return on shareholders’ equity,
the number of subsidiaries, the lag between the year end and the date of the audit
report, size of the auditor, ameasure of auditee diversification, the ownership
structure of the auditee, and whether the auditor was based in London, with the last
three being new variables introduced in this study. Pong and Whittington (1994)
used data on 577 UK listed companies between the year 1981 and the year 1988 to
examine the theoretical rationale for empirical models of audit fees extant in the
literature in the context of UK companies. It was found that auditee size is an
important audit fee determinant. In addition, complexity, as measured by number of
subsidiaries also had a positive and statistically significant effect on audit fees.
However, profit had an effect which was sensitive to model specification. Small
loss-making auditee firms received a discount on their audit fee but larger loss-
making firms were charged a premium by their auditors. They also found that big 8
audit firms were, on average, more expensive than non-big 8 firms.
Brinn et al. (1994) tested whether earlier findings on audit fees can be generalised to
the unquoted sector. Utilising data from 154 UK companies (independent and
subsidiary unquoted) in electrical/electronic for the year 1988 the study found that
the most significant factors affecting the audit fees of unquoted companies are
auditee size and complexity. Chaney et al. (2004) investigated audit pricing among
private firms in the UK using 1994-1998 data from 15,484 private firms with annual

46
turnover greater than 750,000. It was found that private firms do not pay such a
large Big 5 premium on average and client firms choosing Big 5 auditors generally
would have faced higher fees had they chosen non-Big 5 auditors, given the firm-
specific characteristics. Auditees in their setting do not, on average, view Big 5
auditors as superior in terms of the perceived quality of the services provided to a
degree significant enough to warrant a fee premium. Cullinan (1997) on the other
hand examined the generalisability of the audit fee model by applying the model in
the pension plan audit context. The study used 1991 data from 1110 US pension
funds and found no differences in fee structures between Big Six and non-Big Six
firms. This result indicates that auditor change does not affect pension plan audit
fees. Hackenbrack et al. (2000) studied audit pricing in a municipal market.
Utilising year 1995 data from 675 municipal audits in eight south-eastern states of
the US the study found that Municipalities covered by the statute paid higher audit
fees, engaged larger audit firms and firms with larger municipal audit client bases.
They were also more likely to be recognised for excellence in financial reporting
than municipalities not covered by statute. Results support the claim that audit
selection criteria emphasising technical competence over low audit fee should result
in selection of an auditor that will produce relatively high audit quality.
Some studies relate audit pricing with Agency theory. Nikkinen and Sahlstrom
(2004) examined whether agency theory provides a general framework for audit
pricing. Their study involved seven countries: Denmark, Hong Kong, Malaysia,
Singapore, South Africa, Sweden and the UK, and used1992-2000 data from the
largest firms in these countries. A negative relationship was found between audit
fees and manager ownership and a positive relationship between audit fees and free
cash flow in several countries. Therefore it was concluded that Agency theory can
be used, at least to some extent, to explain audit fees internationally. Moreover,
agency theory explains audit fees similarly across countries, while control variables
have different impact on audit fees. Using data from 16,771 company-year
observations from the year 2000-2006 in the US, excluding financial and insurance
companies, Griffin et al. (2010) provided further evidence on whether audit fees

47
vary in relation to agency problems that can arise in companies with excess free
cash flow. It was found that agency problems of companies with high free cash flow
and low growth opportunities induce auditors of companies in the United States to
raise audit fees to compensate for the additional effort. High FCF companies with
high growth prospects have higher audit fees and debt level moderates the increase
in fees, while dividend pay-out and share repurchase do not have any effect on
increases in fees.
Following the implementation of the Sarbanes-Oxley Act (2002), researchers started
to relate audit pricing to SOX. Griffin and Lont (2007) analysed residual increases
in audit fees following SOX. The study used data from 25,851 firm-year
observations over five years (2000-2005) which were audited by Big 4 or Big 5
audit firms in the US. The study found a significant relationship between residual
audit fees and incremental audit risk, audit effort and auditor changes, and these
factors are noticeably more influential in the period following SOX that includes the
implementation of section 404 on internal control. Hoitash et al. (2008) extended
prior research on audit risk adjustment by examining the association of audit pricing
with internal control problems disclosed under sections 404 and 302 of the
Sarbanes-Oxley Act. This study utilised data from 962 US companies from
November 2004-October 2005. It was found that Audit fees are positively
associated with internal control problems disclosed in the first year of
implementation of section 404. In the case of broadly-based accelerated filers, audit
pricing for companies with internal control problems varies by problem severity. In
addition, companies disclosing internal control problems under section 302 continue
to pay higher fees the following year, even if no problems are disclosed under
section 405. Bedard et al. (2008) examined the association of audit fees with
disclosures regarding internal control effectiveness under section 302 of the
Sarbanes Oxley Act 2002. The study utilised year 2003 to 2004 data from 4952
firm-year observations in US. It was found that companies disclosing problems
under section 302 pay higher audit fees. Fees are adjusted for risk associated with
problem severity, but relative risk adjustment did not change between 2003 and

48
2004. They also found a significant fee increase for “clean” companies in 2004,
although there was no change in regulation for non-accelerated filers in that year. It
also emerged that in 2004, Big 4 audit fees were higher for both continuing and new
clients and only companies switching away from Big 4 firms experienced a
reduction in their audit fees. Ettredge et al. (2007) studied the relationship between
higher audit fees and auditor dismissals in the period immediately subsequent to the
implementation of SOX. Their study involved 428 companies which announced
auditor dismissals from Jan 2004 through to December 2004. It was found that
clients paying higher fees were more likely to dismiss their auditors and dismissals
were associated with small companies, companies with going concern reports and
companies that later reported material weaknesses in their internal control.
Dismissing clients, in particular those hiring new non-Big 4 auditors experienced
smaller fee increases than non-switching clients in the following year.
The introduction of a new auditing standard could affect the audit pricing decision
and some studies have investigated such effects. Doogar et al. (2010) studied the
impact of Auditing standard no 5 (AS5) on audit fees as compared to AS2, the old
standard. For this purpose, data for the years 2005-2008 were utilised from 3,023
public companies that were Big Four accelerated filer auditees, whose financial and
audit fee data were available in the compustat and AuditAnalytics databases. It was
found that AS5 audit fees are aligned with auditee fraud risk, but not AS2 audit fees.
Relative to AS2 bench mark level, AS5 audit fees are on average lower for all
auditees and are lower for lower-fraud-risk auditees but greater for higher-fraud-risk
auditees. On the other hand, the adoption of new financial reporting standards could
also affect audit pricing. Kim et al. (2012) examined the impact of International
Financial Reporting Standards (IFRS) adoption on audit fees. They concluded that
generally mandatory IFRS adoption has led to increases in audit fees. They found
however that IFRS-related audit fee premiums increase with the increase in audit
complexity brought about by IFRS adoption, and decrease with improvements in
financial reporting quality arising from IFRS adoption.
49
Having two auditors auditing the same company might have an impact on the
pricing of audit services. Motivated by this, Thinggard and Kiertzner (2008)
examined the audit fees paid by listed companies in Copanhagen, where listed
companies are required to have two external auditors. Their study used 2002 data on
126 companies in Denmark. The results indicate that having two significant,
independent auditors in a competitive environment is likely to reduce total audit
fees, albeit only for larger companies, where the payoff from competition might be
worthwhile. So, it might be of interest to other countries to consider two auditors as
a solution to the auditor independence issue.
Recently more lines of inquiry have been added to the audit pricing literature. For
example, an interesting study was carried out by Hay and Knechel (2010) in which
they investigated the effect of advertising and solicitation on audit fees as prior
research suggests that the auditing crisis could be caused by deregulation, which
allows firms to advertise their services and solicit new clients and encourages firms
to be more commercial. For this study, data from all public listed companies in New
Zealand from 1980 to 2001 were utilised. It was found that advertising is associated
with increases in fees while solicitation corresponds to decreasing audit fees. This
finding indicates an increase in competition among accounting firms.
As the economic crisis has become a hot global issue, audit pricing researchers have
started relating the economic crisis to audit pricing. Following the severe economic
crisis that affected the US, Ettredge et al. (2011) investigated audit fee pressure
during the period from 2007 to 2009 to assess the impact of fee pressure on audit
effort. The sample consisted of 1897 firms in 2006 and 1926 firms in 2008. The
study found that 49.6% of clients successfully exerted fee pressure on their auditors.
They also found that fee pressure is positively associated with reporting losses,
increases in size and complexity and disclosures of material weaknesses in internal
control over financial reporting. They concluded that clients that successfully exert
fee pressure are more likely to have accounting misstatements and have higher

50
levels of discretionary accruals in 2008 and these results are driven by smaller
auditors.
Another audit pricing issue emerged in an Australian study in terms of audit fee
benefits arising from the execution of deed of cross guarantee (DXG), which
relieves wholly owned subsidiaries from financial reporting, auditing and other
requirements. Using data from 1317 listed companies in Australia for the financial
year 2007, the study found positive and persistent statistical significance of the
DXG in audit fee determination and established that DXG groups consistently pay
higher audit fees than non-DXG groups, irrespective of firm size or audit
complexity.
As a conclusion, there has been sound general development of audit pricing studies
since Simunic’s (1980) seminal paper. Appendix 1 summarises audit-pricing studies
since the 1990s. One of the variables identified by previous studies and that has an
impact on audit pricing is corporate governance. Hay et al. (2006) and Hay et al.
(2012) concluded that more audit pricing and governance studies are needed. The
other important variable that appears in most of the previous studies is non-audit
fees. As the objective of this research is to assess the impact of corporate
governance (including ownership structure) and non-audit fees on audit fees,
detailed discussion on the relationship between these two characteristics and audit
pricing will be provided later in this chapter.
3.3 Corporate Governance and Audit Pricing Literature
Prior studies (e.g. Shleifer and Vishny, 1997; Dennis and Mc Connel, 2003) has
noted that good corporate governance is beneficial to the company. To be effective
corporate governance should possess certain characteristics. As internal corporate
governance is expected to be interrelated with the monitoring role of the external
auditor in monitoring management behavior and safeguarding the shareholders, the
characteristics of corporate governance can also be associated with audit pricing.

51
Hayes et al. (2005) describes four theories that may explain the demand of audit
services. The first theory is Policeman theory where an auditor is needed for fraud
detection and prevention. Second theory is Lending Credibility theory where
audited financial statements are used by management to enhance the stakeholders’
faith in management’s stewardship. The third theory, Theory of Inspired Confidence
explains that audit services is the direct consequence of the participation of outside
stakeholders in the company.The last theory, Agency theory point out that a
reputable auditor is appointed not only in the interest of the third parties, but also in
the interest of management.
Discussion of corporate governance in the context of audit pricing normally
involves two different perspectives, the supply and demand sides of audit services.
Looking at the demand side of the audit service, good governance could be reflected
in a higher demand for good quality audits, which could give rise to higher audit
fees. This is highlighted by Hay and Knechel (2004) as they argued that the demand
effect may lead to increased audit fees as independent directors may demand more
auditing in order to fulfil their responsibilities, protect their reputations and
discharge their responsibilities of due diligence. Looking at the supply of the audit
service by the auditor, improved corporate governance could reflect a good control
environment within a company hence requires a reduced audit, which could then be
translated into lower audit fees (Collier and Gregory, 1996). Prior studies suggest
that the firm’s internal control mechanism has a significant impact on control risk
and audit scope as audit fee determinants (e.g. Wallace, 1986). Hence, a weak
internal control mechanism results in higher control risk and to reduce audit risk to
an acceptable level more substantive audit work will be needed and this results in
higher audit fees (Desender et al., 2009). In seeking to review existing evidence, the
discussion of prior literature on corporate governance and audit pricing is divided
into three main governance issues: board characteristics, audit committee
characteristics and ownership structure.

52
3.3.1 Board Characteristics and Audit Fees
Board Composition and Independence
The relationship between board characteristics and audit fees has begun to attract
interest from audit fee researchers (e.g. O’Sullivan, 1999; Peel and Clathworthy,
2001). In the early 2000s, few studies had looked at the issue (e.g. O’Sullivan, 1999;
O’Sullivan, 2000; Peel and Clatworthy, 2001; Carcello et al., 2002 and Tsui et al.,
2001). More recently, there has been slightly more research interest (e.g. Bliss et
al., 2007; Boo and Sharma, 2008; Leventis and Dimitropoulos, 2010). The board
characteristic most frequently studied is the composition or independence of board
members as successive governance reforms since the 1990s have emphasised the
monitoring potential of non-executive board members (e.g. Cadbury, 1992; Hampel,
1998 and Higgs, 2003, Combined Codes, 2000, 2003, 2006, 2008; UK Corporate
Governance Code, 2010).
The role of independent outside directors becomes crucial in monitoring the
management as Agency theory suggests that boards dominated by inside directors
may intentionally provide self-serving accounts of managerial actions to enhance
their status with the firm’s chief executive officer (Fama 1980; Eisenhardt, 1989).
Since outside directors are independent of management they are expected to allow
an effective and impartial governance system to operate within the corporation
(Abdul Rahman, 2006).
Cadbury (1992), Hampel (1998), and Higgs (2003) and various editions of the
Combined Code and the current UK Corporate Governance Code (2012) have all
emphasised the importance of non-executive representation on the board of
directors as a means of ensuring greater independence and impartiality in board
decision-making. Carcello et al. (2002) describe three factors which may motivate
independent directors to prevent and detect any opportunistic reporting behaviour
by management. First, the directors may seek to protect their reputations as experts
in monitoring, because the market for directors punishes those associated with
corporate failure or poor performance. Second, from a legal liability perspective,

53
directors who fail to exercise reasonable care in discharging their monitoring
responsibilities are liable to be subject to severe sanctions. Third, shareholders often
suffer significant losses in the wake of financial reporting problems, so directors
seeking to protect shareholder wealth may seek a higher quality audit service. Past
studies found evidence of an inverse relationship between the percentage of outside
directors and fraudulent financial reporting (Beasley, 1996; Dechow et al., 1996).
O’Sullivan (1999) examined the impact of board/audit committee characteristics on
audit fees paid by large UK companies in the post-Cadbury period. Using
comprehensive analysis of financial statements for the year 1995 of a sample of 146
largest non-financial companies quoted on the London International Stock
Exchange the study found that board composition variables had no significant
impact on the audit fees paid. The study (O’Sullivan, 1999, p 261-262) provides
detailed reasons for the insignificant relationship found in the study.
“First, even though increased non-executive representation and audit
committee membership is perceived to result in better governance on behalf
of shareholders, such reforms may have a dual impact on audit pricing.
While internal governance reforms are expected to signal better internal
controls and consequently lower audit fees, the introduction of increased
independence is also expected to encourage auditors to increase effort and
ultimately fees. Non-executives serving on boards and audit committees may
encourage increased testing by auditors so as to minimise the likelihood of
future financial problems for the firm and avoid subsequent criticism being
directed at them. Of course, the net impact of both these pressures may result
in individual mechanisms of governance having a negligible impact on the
audit fee. Second, even though we have taken care to conduct our analysis at
least three years after the Cadbury (1992) recommendations, it is unclear
how long auditors may require firms to have appropriate internal governance
mechanisms in place prior to offering an audit fee reduction. A useful
extension of our study may be to monitor the relationship between audit fees
and internal governance characteristics over a longer period of time.

54
Especially useful might be a study of the impact of internal governance
changes on the audit fee. Third, since we have undertaken our analysis post-
Cadbury, we are unable to investigate the impact of internal governance
changes on the audit fee. For example, we do not know whether companies
possessing few nonexecutive directors and CEO/chairman duality paid
higher audit fees prior to the Cadbury recommendations. Our results may
indicate that the widespread adoption of the minimum governance
characteristics recommended by Cadbury (1992) serves to eliminate fee
reductions that had previously been received by ‘better’ governed
companies. Of course the widespread compliance with the Cadbury (1992)
recommendations is expected to reduce the variation in board composition
and leadership and consequently reduce the power of the empirical tests. An
interesting extension of our study may be to undertake an examination of the
relationship between board composition and audit pricing utilizing pre-
Cadbury data.”
As a result, shortly afterwards, O’Sullivan conducted another study (O’Sullivan,
2000), to investigate the impact of board composition and ownership on audit fees
prior to the adoption of the recommendations of the Cadbury report (1992). This
time data from a sample of 402 quoted companies in UK was utilised. Contrary to
the result post Cadbury (1992), this study found that the proportion of non-executive
directors had a significant positive impact on audit fees. This result suggests that
non-executive directors encourage more intensive audits as a complement to their
own monitoring role. According to O’Sullivan and Diacon (2002), increasing the
non-executive representation on the board of directors has the capacity for
improving the quality of the audit process in the following three respects:
a. External auditors are able to discuss matters arising from the audit process
with non-executive representative board members, free from managerial
influence. This is especially important if auditors seek to question certain
aspects of the preparation of the financial statements by management or
55
require further (more costly) testing in order to reach an opinion on the
quality of financial statements.
b. In negotiations with the external auditor, non-executives are expected to
place greater emphasis on the extent and quality of the audit rather than on
the cost, compared to executive directors.
c. Non-executives are expected to favour more extensive auditing in order to
complement their own monitoring responsibilities since they share with
auditors the objective of identifying and rectifying reporting errors made by
managers, deliberately or otherwise.
Peel and Clatworthy also extended post-Cadbury study by investigating the
relationship between internal governance structure and audit fees. As an internal
governance mechanism, non-executive directors could contribute to higher quality
auditing in many ways. Contrary to the findings of O’Sullivan (2000), Peel and
Clatworthy (2001) found an insignificant relationship between board composition
(measured by percentage of non-executive directors to total directors) and audit
fees. The study utilised data on 132 listed UK firms for 1992. They concluded that
there is no systematic evidence that auditors (both pre and post-Cadbury) recognise
board governance characteristics in pricing their audit. A possible explanation for
this difference could be the different sample size used by the two studies; while
O’Sullivan based his conclusions on 406 quoted companies, Peel and Clatworthy
based theirs on a much smaller sample of 132 companies.
Tsui et al. (2001) examined the relationship between a firm’s internal monitoring
mechanism and its impact on audit fees in Hong Kong. Using data from 650 non-
financial companies in Hong Kong between the years 1994 and 1996, they found
that the independence of corporate boards (measured by chief executive officer and
chairman being separate individuals) is an important factor in auditors’ assessment
of control risk and the determination of audit fees.
Leventis and Dimitropoulos (2010) investigated the relationship between audit
pricing, quality of earnings and board independence in Greece, utilising data from
56
248 firm year observations (from 97 companies listed on Athens Stock Exchange)
for a five year period (2000-2004). The study found a positive association between
board independence and audit pricing (meaning strong governance is related to
increased need for quality assurance services). The study also documented a
positive association between audit pricing and earnings management for small size
companies. The study assumed this to be an indicator of a potential red flag.
Desender et al. (2009) investigated whether the relationship between board
characteristics and the demand for external audit was different for firms with
dispersed ownership compared to firms with controlled ownership. Using data on
247 French and Spanish listed companies in 2007 the study found that ownership
structure has a significant influence on the relationship between the demand for
external audit and board characteristics. For widely held-firms, they found that
board independence and CEO duality are significantly related to audit fees;
however, the relationship between board characteristics and audit fees was found to
be insignificant in closely-held firms.
A recent UK study by Zaman et al. (2011) incorporated board composition variables
into the audit pricing model. The study recognised that the composition of the
board/audit committee is an important factor that may affect audit quality. It was
found that proportion of independent non-executive directors has a significant
relationship with audit fees when the composite measure of audit committee
effectiveness is substituted with the independent variables relating to audit
committee effectiveness.
Board Leadership
Another corporate governance issue that has received increasing attention is board
leadership. Most studies use CEO duality to reflect board leadership. CEO duality
means that the CEO is also chairman of the board of directors: a situation that is
common in the US. Coles et al. (2001) found 80% cases of role duality among their
sample of US firms. However, CEO duality is not as common in the UK as the US

57
and has become even less popular recently. Conyon (1994) reported 23% CEO
duality in the UK in 1993, whilst O’Sullivan (1999) reported 15% for the year 1995
and Zaman et al. (2011) reported a significant reduction by 2004, with only 3% of
their 135 sample firms having the same person occupying these two important
positions. The continuous reduction in the CEO duality case is a result of the
recommendation of the codes of corporate governance (e.g. UK Corporate
Governance Code, 2010). Section A.2.1 of the code highlighted that the roles of
chairman and chief executive should not be fulfilled by the same individual and the
division of responsibilities between the chairman and chief executive should be
clearly established, set out in writing and agreed by the board.
Stewardship theory argues that CEO duality may enhance board effectiveness.
Solomon (1993) contended that the firm managers’ influence in setting board
agendas and the flow of information are stronger when the firm adopts CEO duality.
Another study agreed that CEO duality helps in decision-making as it permits a
sharper focus on company objectives and also promotes more rapid implementation
of operational decisions (Stewart, 1991). In the same vein, Dahya et al. (1996)
stated that CEO duality helps the CEO to understand the strategic vision of the firm
better due to minimal board interference. Further suppor is given by Rechner and
Dalton (1991), who claimed that CEO duality may lead to improvement of the
firm’s performance as a result of clear unfettered leadership of the board.
However, CEO duality removes the ‘checks and balances’, hence resulting in a
decrease in vigilance regarding the operation of the firm (Abdul Rahman, 2006).
CEO duality can be wrongly used for personal gain due to greed and corruption at
the expense of other stakeholders in the firm. The case of Enron is a real-life
example of this situation, where Kenneth Lay was both the CEO and Chairman until
2001. Therefore, separation of these two positions provides the essential ‘checks
and balances’ needed to improve accountability ad transparency of the board. It is
also argued that CEO duality upsets the balance of power among the top
management team. In other words, CEO duality restricts the board’s effectiveness in
controlling managerial initiatives and in decision-making since duality is assumed

58
to increase information asymmetry between the CEO and the board (Boyd et al.,
2005, Desender et al., 2009). Fosberg and Nelson (1999) state that firms with
separated, clear-cut leadership perform significantly better in the areas of strategy
formulation and implementation. This is supported by Farber (2005), who found
that fraud firms have a higher percentage of duality, which makes it difficult for
insecure directors to be honest when evaluating firm performance, thereby leading
to long term organisational drift (Carver, 2006).
Bliss (2011) examined whether CEO duality affects the association between board
independence and demand for higher quality audits proxied by audit fee. Using data
from 950 Australian public listed companies in 2003 the study found that the
positive association between board independence and audit fee proxied for audit
quality is only present in firms without CEO duality. He suggested that CEO duality
constrains board independence. The finding is supported by a study in Europe
(Desender et al., 2009). Partitioning their sample size into widely-held firms and
closely-held firms, Desender et al. (2009), who utilised data on 247 French and
Spanish listed companies in 2007, found that CEO duality is a significant
determinant of audit fee only in widely-held firms. In the presence of a dominant
CEO, non-executive directors are expected to have reduced influence in seeking an
intensive audit (Desender et al., 2009) and as a result companies with CEO duality
are more likely to have lower demand for external audit services (O’Sullivan, 2000),
hence audit fees will be lower. On the other hand, most of the earlier UK studies, for
example, O’Sullivan (1999), Peel and Clatworthy (2001) and O’Sullivan (2000),
failed to find any significant relationship between CEO-duality and audit fees.
Contrary to the other UK studies Zaman et al. (2011) documented a significant
positive relationship between CEO duality and audit fees when using CEO duality
as one of their control variables to assess the relationship between audit committee
effectiveness and audit fees.

59
Board Size
The effect of board size on the monitoring ability of the board of directors has also
been discussed. Some researchers have argued that larger boards have greater
capability to monitor the actions of top management as it is difficult for CEOs to
dominate larger boards (Zahra and Pearce, 1989). Supporting this view, Singh and
Harianto (1989) argued that larger boards can make it difficult for the CEO to
obtain consensus for taking actions that will harm shareholders’ interests. However,
there are disadvantages associated with larger boards. Prior studies have identified
that larger board size is associated with decreased board ability to control
management, difficult communication among directors, poorer decision making and
poorer processing of information (Vafeas, 1999). In addition, larger boards increase
the time taken to make decisions and bureaucratic problems create more hindrance
(Xie et al., 2003). In addition, Jensen (1993) argued that large boards are less
effective in their oversight duties relative to smaller board and are susceptible to
CEO domination over board matters. Jensen (1993, p. 865) states that: ‘as groups
increase in size they become less effective because the coordination and process
problems overwhelm the advantages from having more people to draw on’.
In contrast, it is suggested that smaller boards may be more effective as they might
be more able to make timely strategic decisions (Goodstein et al., 1994). In addition,
Fieger and Brown (2000), for example, found that smaller board size and outside
representation is conducive to an active board with high level of involvement in
strategic formulation. Other studies found that smaller board size, particularly
amongst large US industrial corporations, is associated with better firm performance
(Yermack, 1996).
In conclusion, regarding optimum board size, the board should not be so big that its
ability to control management is reduced and communication among directors is
difficult, leading to poorer decision making and poorer processing of information,
and should not be so small that it can be easily dominated by the CEO.
60
Many changes have occurred in terms of board composition in UK listed companies
post the Cadbury Report. Dahya et al. (2002), in a study involving a sample of 460
UK publicly quoted companies, documented the increase in non-executive directors
on UK boards, indicating that the percentage rose from 35.3% pre Cadbury to 46%
post Cadbury Report. Faccio and Lasfer (1999) reported that the median board size
of UK companies is 7, while Renneboog and Trojanwoski (2005) reported a median
board size of 9.
The association of board size and audit fees has been investigated in the US (Boo
and Sharma, 2008; Chan et al., 2012). Boo and Sharma (2008) examined the
relationship between internal governance characteristics, external audit monitoring
proxied by audit fees and regulatory oversight, using 2001 data from 469 large
listed companies comprising 252 finance companies and 217 companies from non-
regulated industries. Their studies were motivated by the call by DeFond and
Francis (2005) to develop theoretical explanations regarding how and why the board
and audit committee influence the financial reporting and audit processes. Cohen et
al. (2004) and DeFond and Francis (2005) examined how industry regulation
influences corporate governance practices. The coefficient value of variables
measuring board/audit committee size is insignificant in their model 2; however,
after introducing an interaction term for board size and regulated companies, the
coefficient of the interaction term SIZE–REG (board/audit committee size by
regulatory oversight) is negative and significant (p < 0.01). This result is also
consistent with their expectation from their Hypothesis 3, which posits that
regulatory oversight diminishes the association between size of board/audit
committee and audit fees. As a whole the study concluded that the association
between audit fees and board/audit committee independence and size is weaker for
regulated companies.
In an attempt to examine whether independent audit committee members’ board
tenure affects audit fees, Chan et al. (2012) included both board size and audit
committee size among their controlling variables. Utilising data from1524 firm-year
observations of US firms for the years 2005 and 2006 the study found that board
61
independence and board size are positively associated with audit fees. These
findings suggest that high-quality boards demand more audit effort from external
auditors.
Board Activity or Board Dilligence
The UK Corporate Governance Code (2012, Section A.1.1) highlights the
importance of board meetings. It is clearly stated that the board should meet
sufficiently regularly to discharge its duties effectively. There should be a formal
schedule of matters specifically reserved for its decision. This is important as
meeting frequency could reflect board effectiveness as boards that meet frequently
are likely to be better informed and more diligent in performing their duties
(Goodwin-Stewart and Kent, 2006). This fact is supported by earlier researchers,
such as Conger et al. (1998) and Lipton and Lorsch (1992). In the same vein, Evans
and Weir (1995) concluded that a board of directors that has frequent meetings has
more time to identify and discuss problems and this is expected to lead to superior
performance of the company. Another study correlated board meeting frequency
with annual report timeliness (Tauringana et al., 2008) in Kenya. The study found a
significant negative relationship between frequency of board meetings and
timeliness of the annual report, indicating that companies which hold meetings
frequently publish their annual reports earlier, thereby enhancing the company’s
performance and providing evidence of an effective corporate governance
mechanism. Despite the fact that number of board meetings is important in
measuring board effectiveness, not many audit fee researchers have included this
variable in their audit pricing model.
Among the researchers who have considered board activity or diligence in an audit
pricing study are Carcello et al. (2002). Carcello et al. (2002) used number of board
meetings held to measure the diligence of the board, since the behaviour of
individual board members surrounding such meetings, which includes preparation
before meetings, attentiveness and participation during meetings, and post-meeting
follow-up, is not observable by the public. Based on an analysis of 258 companies

62
from Fortune 1000 in the US in the year 1992 to 1993, Carcello et al. (2002)
confirmed that high frequency of board meetings could indicate a higher level of
control in the company, leading to higher audit fees.
In UK, Zaman et al. (2011) used number of board meetings to control for board
effectiveness in their audit pricing model. Utilising panel data (2001-2004) of a
sample from 135 FTSE-350 the study found a significant positive relationship
between audit fees and number of board meetings per year.
3.3.2 Audit Committee Characteristics and Audit Fees
Unlike board characteristics, which have received comparatively little attention
from audit pricing researchers, audit committee characteristics is a well researched
area.In the 1990s, researchers started investigating the relationship between the
existence of an audit committee and audit fees. Collier and Gregory (1996)
investigated this relationship to establish whether audit committees are effective in
ensuring audit quality by protecting the auditors from fee cuts which might affect
audit quality. For this purpose, data from 315 FTSE UK companies from the year
1989 to 1991 was utilised. The study found evidence that the relationship between
size-related audit fees and presence of an audit committee is positive and
significant. O’Sullivan and Diacon (2002) compared the pricing of audits in mutual
and proprietary insurance companies. Utilising data from 117 UK insurance
companies in 1992 they found that the existence of an audit committee has a
positive impact on audit fees paid by companies. Redmayne et al. (2011) examined
the association between the existence of an audit committee and audit fees in New
Zealand public sector entities for the period 1998–2000, when audit committee
formation was voluntary. The study found enough evidence to associate audit
committees with lower audit fees and interaction with audit risk in public-benefit
entities but found a positive association between audit committees and audit fees
(but no significant interaction terms) in profit-oriented public sector entities.
O’Sullivan (1999) extended the research area to include audit committee
characteristics in his audit pricing model. The study includes two variables for audit

63
committee characteristics: audit committee size and audit committee independence,
measured respectively by number of members on the audit committee and a binary
variable to represent the existence of executive directors on audit committee. The
study, however, failed to find any evidence of a relationship between audit
committee characteristics and audit fees. In the US, Boo and Sharma (2008)
examined the relationship between audit committee independence and audit
committee size for regulated and non-regulated companies. The study found the
association between audit fees and audit committee independence and size to be
weaker for regulated companies.
Besides studying the impact of board characteristics, Carcello et al. (2002) also
investigated the relationship between audit committee independence, diligence and
expertise and audit fees. The researchers simply replaced their measures of board
independence, diligence and expertise with comparable audit committee measures.
The study found enough evidence to conclude that audit fee has a positive
relationship with audit committee independence and audit committee expertise
diligence but not with number of audit committee meetings. The study also
combined both types of variables in one audit pricing model and found that all
board variables remained significant, while none of the audit committee variables
were significantly related to audit fees. They concluded that audit committee
variables provide no incremental explanatory power when board variables are
included in the model.
Abbott et al. (2003) examined the association between audit committee
characteristics and audit fees, using US data for 2001. Their study included three
audit committee variables: audit committee independence, audit committee
expertise and audit committee meeting frequency. They found that audit fees are
higher when firms have an independent audit committee. A similar result was found
for firms with at least one accounting or financial expert on the audit committee as
opposed to firms without accounting or financial experts on the audit committee.
Their result indicated that directors’ independence and their competence can both
increase audit scope. This is because audit committee members with accounting
64
experience are more likely to understand the importance of external auditing and
make judgments consistent with those that an auditor would make. This argument is
supported by Knapp (1987), who suggests that auditors are more likely to discuss
accounting issues with knowledgeable audit committees. Therefore, audit
committees’ accounting or financial expertise can induce audit effort. In addition,
audit committee expertise could enhance and maintain the relationship with the
auditor. Lee at al. (2004) found that the financial expertise of audit committee
members is inversely related to auditor resignation. Krishnan and Visvanathan
(2009) also examined the relationship between audit fees and audit committee
financial expertise. The study partitions the financial expertise into accounting
financial expertise and non-accounting financial expertise. The study utilised data of
801 firm-year observations (2000-2002) of S&P 500 US companies other than
financial institutions and companies not audited by Big 4 audit firms. The study
found that audit fee is negatively related to accounting financial expertise but not to
non-accounting financial expertise.
Some audit pricing studies have used a composite measure of audit committee
effectiveness. Lee and Mande (2005), for example, examined the relationship
between audit committee characteristics and audit fees using a composite measure
of audit committee effectiveness (to be considered effective an audit committee
must be fully independent and meet at least four times a year). The composite proxy
captures the interaction between independence and diligence and potentially could
provide greater explanatory power than the individual component attributes. The
study also included audit committee expertise (financial expertise) in the audit
pricing model. Using a sample of US firms listed on New York Stock Exchange in
2000, the study found that audit fees are positively related to audit committee
independence and diligence.
Vafeas and Waegelein (2007) investigated the effect of board and audit committee
characteristics on audit fees. Using data on US Fortune 500 companies for 2001–
2003 the study documented positive associations between audit fees and board
independence, size and activity and also audit committee independence, expertise
65
and size. Likewise, Goodwin-Stewart and Kent (2006) examined the association
between board and audit committee characteristics and audit fees, based on
Australian data in 2000. They found that audit fees are positively related to board
independence and audit committee diligence. Rainsbury et al. (2009) examined the
association between the qualities of audit committees and external audit fees in an
environment where the formation of audit committees was unregulated. Utilising
data on 87 companies listed on the New Zealand Stock Exchange in 2001 the study
found that the quality of the audit committee (audit committee independence and
expertise) has little impact on the level of fees paid to external auditors. The result
suggests that the benefits of “Best practice” audit committees may be less than
anticipated by regulators and policy makers.
Motivated by gender differences in human behaviour, and recent findings in
corporate finance literature, Ittonen et al. (2008) examined the association between
female audit committee representation and audit fees among S&P firms listed on the
major US Stock Exchange. Using 2006 data on these companies the study found
that firms with female audit committee representation have significantly lower audit
fees.Their study is considered novel in the sense that it was the first study to
introduce gender diversity into corporate governance and audit pricing studies. A
few years after this study, the regulators started to recogniseg the importance of
board diversity, including gender diversity, to effectiveness of boards and audit
committees (see UK Corporate Governance Code, 2012).
Prior to SOX, the audit committee’s responsibility regarding the audit and the
preparation of the financial statements was to act in an advisory role to management
and to the external auditor. Following the enactment of SOX(2002), the structure of
the audit committee changed and its role and responsibility for oversight of the
external auditor were expanded. Hoitash and Hoitash (2009) extended previous
research by examining the association between audit committee characteristics and
auditor related decisions following the mandated changes in the committee’s
composition and responsibilities. The study examined the association between audit
committee characteristics and auditors’ compensation and dismissals following the
66
enactment of SOX. Using data from a 2004 sample of 2393 companies with a total
of 8306 audit committee members, the study found that audit committee size and
diligence are associated with higher audit fees. The study also documented a
positive association between level of assurance and proportion of experts on the
audit committee. Inconsistent with previous studies, this study found that experts
with supervisory expertise demand higher quality audits. They conjectured that the
lack of actual experience among those with supervisory expertise might cause them
to purchase additional audit services. Alternatively, familiarity of accounting
financial experts with the audit negotiation process enables them to negotiate a high
level of assurance at a lower cost. However, when examining engagements that
follow dismissals, their evidence is consistent with the prior literature finding that
experts with accounting experience seek to hire high quality auditors while those
with supervisory experience are more willing to appoint lower quality auditors.
Eagel et al. (2010) examined the relation between audit committee compensation
and the demand for monitoring of the financial reporting process in the US. Data
from 3295 firm-year observations covering the period between 2000-2004,
excluding utilities and financial institutions, were utilised for this study. The study
documented a positive correlation between total compensation and cash retainers
paid to audit committees and audit fees and also the impact of the Sarbanes-Oxley
Act, suggesting a positive link between audit committee compensation and the audit
committee’s demand for financial reporting process monitoring.
Masli et al.’s (2010) examination of the potential benefits of Internal Control
Monitoring Technology was an innovative contribution to audit pricing literature.
Using i-Data from 139 firm year observations of firms announcing SOX-related
ICM technology initiatives over a four-year period (2003-2006) in the US, the study
found implementation of internal control monitoring technology to be associated
with lower likelihood of material weaknesses, smaller increases in audit fees and
smaller increases in audit delays during the post-SOX time period.
67
Gul and Goodwin (2010) examined whether a firm’s short-term debt maturity
structure is associated with auditor assessment of audit risk and consequently audit
fees. Data were derived from 9,632 firm year observations from 2003 to 2006,
excluding financial companies. The study found that short-term debt is negatively
related to audit fees for firms rated by Standard & Poor’s. This is consistent with the
finding of more monitoring and better governance mechanisms in firms with higher
short-term debt. Additionally the study found that credit rating quality is negatively
related to audit fees, consistent with credit rating quality reflecting a firm’s liquidity
risk, governance mechanisms, and monitoring from rating agencies. The study also
documented that the negative relationship between short-term debt and audit fees is
stronger for firms with low-quality credit ratings.
Chan et al. (2012) examined whether long board tenure among independent audit
committee members affects audit fees. He examined 1524 year observations of US
firms for the year 2005 to 2006. The study argues that there are two possible
relationships between board tenure and audit fees. On the one hand, long board
tenure audit committee members (defined as members with board tenure of 10 or
more years) have greater incentive to protect their reputational capital by purchasing
increased audit effort, which positively affects audit fees. On the other hand, audit
pricing reflects audit committee quality. Long board tenure audit committee
members may have less need for increased audit effort because they can effectively
oversee the financial reporting process themselves, which negatively affects audit
fees. The study documented a negative association between proportion of long
board tenure of directors on the independent audit committee and audit fees.The
result of the study is consistent with the notion that long board tenure among audit
committee members results in lower audit efforts.
3.3.3 Ownership Structure and Audit Fees
Prior studies argued that there are two types of ownership and control structure:
‘outsider’ and ‘insider’ systems (Frank and Mayer, 1995; Short et al., 1998). The
classic ‘outsider’ systems are commonly found in the UK and US. The main
68
characteristic of this ‘outsider’ system is dispersed ownership of corporate equity
amongst a large number of outside investors whereby the firms are controlled by the
managers but owned by outside shareholders (corporate or individual shareholders).
As the capital market works based on supply and demand, the shareholders control
or discipline the action of the managers by selling their share ownership, causing the
share price to go down. In this way, hostile takeovers might take place and most
often there will be a change of management. The ‘insider’ system, on the other
hand, is owned and controlled by identifiable and cohesive groups of ‘insiders’ who
have longer-term stable relationships with the company. Included in this system is
insider ownership whereby some of the company’s shares are owned by members of
the board, the CEO or top management.
Publicly traded firms in most countries are generally controlled by single and large
shareholders (La Porta et al., 1999). The controlling shareholder should have
sufficient financial incentive to reduce his/her willingness to expropriate the wealth
of outside investors and this relates to the amount of cash flow rights owned. The
greater the concentration of cash flow rights (ownership) in the hand of largest
blockholder, the greater his/her incentive to properly run the business (Abdul
Rahman, 2006). However, concentrated ownership could cause a conflict of interest
between majority and minority shareholders where expropriation of minority wealth
by the controlling shareholders could happen.
Previous empirical studies have documented mixed results on the relationship
between ownership structure and firm performance. Using data on 114 NYSE or
AMEX-listed Corporations in which the majority shareholder owned at least 50.5%
of the common stock, Holderness and Sheedan (1988) found that shareholding of
large investors has positive relationship with firm performance. In the same vein,
McConnell and Servales (1990) also documented a significant positive correlation
between fraction of shares owned by large investors and firm performance in their
sample of 1000 firms. The result implies that large shareholders may influence the
company’s policies and may put pressure on companies to perform well. In
addition, they also might develop close relationships with directors of the

69
companies to make the directors more accountable on the performance of the
company. Similarly, examining 1301 publicly traded corporations in eight East
Asian countries, Claessens et al. (2002) found a significant positive relationship
between ownership concentration and corporate performance, especially in
countries with weaker governance. Therefore the study concluded that ownership
structure plays an important role in structuring corporate governance mechanisms in
those countries.
In contrast, studying 511 large US corporations, Demsetz and Lehn (1985) failed to
find a significant correlation between ownership concentration and firm
performance. The study deduced that concentrated ownership is endogenously
determined by a set of firm-level characteristics in the contracting environment.
Ownership structure is expected to affect agency costs or risk of organisation or its
auditor. Some forms of ownership structure are considered to increase the auditor’s
potential exposure to liability and thus increase audit fees. The three measurements
most commonly used in early studies investigating the relationship between
ownership structure and audit fees are dummy variables distinguishing between
public versus private companies, stock versus mutual companies and the existence
of a major external shareholder. The variable with the strongest impact on audit
fees is that which distinguishes between public versus private companies (Hay et al.,
2006). In their study, Hay et al. (2006) found that out of 12 studies using this
measurement, 8 showed a significant positive relationship with audit fees. On the
other hand, the existence of a major shareholder for a public company may indicate
lower agency costs or stronger control (Desender et al., 2009; Villalonga and Amit,
2006; Hay et al., 2006), with conflicting effects on audit fees.
In the US, Mitra et al. (2007) examined the empirical relationship between
ownership characteristics and audit fees. They performed their analysis based on the
stockholder monitoring argument and proposed that large and sophisticated
shareholders actively monitor and influence management’s accounting policy
choice and its strategy for producing financial statement information. They argued
that managers’ incentive to produce the type of accounting information and the
70
quality of such information depends on the level of their ownership interests in a
firm. The study considers the effect of both supply and demand factors as there is
possibly a conflicting relationship between ownership characteristics and audit fees.
Based on the supply perspective the study argues that large and sophisticated
shareholders normally actively monitor management and constrain its accounting
flexibility to produce distorted financial statement information for self-serving
interests. Therefore the adverse effect of agency problems and inherent risk of
material misstatements in financial reporting diminish. For such a client, the
auditor’s assessed audit risk becomes lower, leading to lower engagement efforts
and/or ex-ante risk premiums and therefore audit fees. In addition, high ownership
interests (i.e., greater alignment of manager-shareholder interests in a firm) induce
managers to produce more value-relevant information rather than to
opportunistically manage accounting numbers for self-serving interests. This has the
effect of diminishing the inherent risk of material misstatements and therefore the
overall audit risk and audit fees. On the other hand, the relationship between
ownership structure and audit fees is likely to hold from the demand perspective as
well. On one hand, large, sophisticated shareholders as a part of their monitoring
may require firm managers to purchase high-quality audits as a safeguard against
fraudulent financial reporting. On the other hand, managers may purchase a high-
quality audit service to increase the perceived credibility of reported financial
information in an effort to attract investments from large and sophisticated
shareholders. Furthermore, when their ownership interests are high, managers may
be inclined to purchase high-quality and extensive audit coverage to create a
positive perception about the reported financial numbers in order to derive various
economic benefits. Based on these arguments the study concluded that audit fees are
jointly determined by both the demand-related and supply-related factors. To find
the answer to the question of which factor dominates the relationship between
ownership structure and audit fees, they examined whether stock ownership by
sophisticated and substantial shareholders and managerial personnel has a
relationship with audit fees. For this purpose, four ownership constructs were used;
a. Diffused institutional stock ownership (i.e., aggregate percentage ownership

71
by institutions who individually own less than 5% of the outstanding common
stock),
b. Institutional blockholder stock ownership (i.e., aggregate percentage
ownership by institutions who individually own 5% or more of the
outstanding common stock),
c. Non-institutional blockholder stock ownership (i.e., aggregate percentage
ownership by non-institutional shareholders who individually own 5% or
more of the outstanding common stock), and
d. Percentage of stock ownership by managerial personnel.
Using a sample of 358 New York Stock Exchange (NYSE)-listed, non-regulated
industrial firms that were audited by Big Five audit firms and had a fiscal year end
on December 31, 2000, the study found that diffused institutional stock ownership is
significantly and positively related to audit fees as a result of institutional investors’
demand for the purchase of high-quality audit service as a safeguard against
fraudulent financial reporting or firms’ endeavour to purchase high-quality audits to
attract institutional investment in common stock. Consistent with the notion that
large and substantial shareholder monitoring reduces the inherent risk of material
misstatements and audit risk, they found that institutional blockholder stock
ownership is negatively related to audit fees. In addition, Mitra et al. (2007)
documented that managerial stock ownership is negatively related to audit fees. The
study suggests that managers with high ownership interests are less likely to engage
in opportunistic reporting activities, reducing the inherent risk of misstatements in
the financial reporting process. As a result, the auditor perceives a low level of audit
risk, leading to a lower price premium and/or audit engagement efforts and therefore
lower audit fees. The study did not find any evidence that non-institutional
blockholder stock ownership affects audit fees. The main results of the study hold
even when the effects of board-related and audit committee variables are factored
into the analysis.
In Europe, Desender et al. (2009) investigated how the ownership structure and the
board of directors affect the demand for external audit. This study is interesting
72
because despite the existence of integration of financial markets, corporate
financing and governance practices in Continental European countries like France
or Spain are very different from practices in the US or UK. The study listed a few
differences between Continental Europe and the Anglo-American system. First, the
role of market forces in monitoring managers’ behaviour is weaker in France and
Spain than in Anglo-American countries. Second, the contribution of financial
markets in corporate financing is lower where external monitoring mechanisms such
as takeovers, the market for managers and nonexecutive directors, remain marginal
in the corporate governance process. Third, the French and Spanish environments
are rather characterised by entrepreneurship culture and high managerial power:
most public companies exhibit concentrated ownership and are controlled by large
shareholders who directly monitor managers’ actions and the accounting production
process as they generally dominate the board of directors. The study claimed that
using French and Spanish firms allowed them to investigate the demand for audit by
the board of directors in the context of a non-Anglo-Saxon institutional environment
where firms are much more concentrated. In addition, focusing on companies from
countries with a low litigation risk setting allowed them to investigate the
importance of the director’s legal liability on the demand for audit. Referring to
other prior literature like Zahra and Pearce (1989) and Hillman and Dalziel (2003),
which described the two main functions of the Board of Directors as monitoring and
providing resources (e.g. legitimacy, advice and counsel, links to other
organisations, etc.), the study argued that:
a. The ownership structure directly influences the priorities set by the board
of directors,
b. The demand for audit by the board of directors depends on the board’s
primary focus.
The study explained that the monitoring role of the board is most important in
dispersed ownership companies as there is a great need to use the board of directors
to monitor the managers. In contrast, when ownership is concentrated, large
shareholders, who are already motivated to monitor management, have a lot of
influence beyond the board, more access to valuable information and have
73
alternative corporate governance mechanisms to discipline the managers if
necessary. Therefore, those boards with a strong focus on monitoring are more
likely to favour a higher demand of audit compared to boards with a focus on
providing resources to management. Based on 2007 data from 247 French and
Spanish listed companies the study found that the ownership structure has a
significant influence on the relationship between the demand for audit and board
characteristics. Similar to the findings for Anglo-American companies the study
found that board independence and CEO duality (i.e. the CEO also serves as
Chairman of the Board) are significantly related to audit fees for firms with
dispersed ownership. However, for closely held firms, the study did not find any
significant relationship between board characteristics and the demand for external
audit. The result of the study implies that a firm’s ownership structure has an
important influence on the behaviour of the board of directors.
In the UK, the relationship between ownership structures and audit quality was
investigated by O’Sullivan (2000) using data prior to the adoption of the Cadbury
Report (1992). His study was motivated by Chan et al. (1993), who suggest that
shareholders in companies with widely dispersed ownership are expected to place
particular reliance on auditing as a means of monitoring managerial behaviour. The
study argues that as ownership becomes more dispersed, direct monitoring by
shareholders becomes more costly and greater reliance on the audit as a mechanism
of governance is expected. In a more concentrated ownership, block shareholders
possess a greater incentive to actively monitor managerial behaviour due to the size
of their equity holdings and the likely cost to them of any non-value-maximising
behaviour by managers. Such shareholders are expected to view the audit process as
an important mechanism through which they can monitor managerial behaviour.
Based on these arguments, the study expected higher audit fees both in companies
with widely dispersed ownership (due to the appropriateness of auditor monitoring
compared to other monitoring mechanisms and the bonding motivation of
managers), and also in companies with large external blockholders (due to such
blockholders having the financial incentives to ensure maximum monitoring is
undertaken).

74
O’Sullivan (2000) also examined the impact of management share ownership on
audit fees. The study refers to the argument of Jensen and Meckling (1976) that
agency conflicts between managers and shareholders may be reconciled when
managers possess an ownership interest in their companies. Managerial ownership
serves to realign the interests of shareholders and managers, therefore reducing the
need for intensive auditing. Furthermore, a significant portion of equity
shareholding could reduce incentive for the management to issue misleading
information to shareholders, so auditors are less likely to need to undertake
additional testing. This suggests that the extent of auditing and ultimately the audit
fee will be negatively related to the degree of managerial ownership, but at higher
ownership levels, auditing is expected to be more intensive, reflecting the increased
likelihood of managerial entrenchment. Based on data of 402 quoted UK companies
in 1992, the study found enough evidence to argue that audit fees are negatively
related to the proportion of equity owned by executive directors. However, the study
failed to document any evidence that large blockholder ownership (partitioned into
% ownership by institutional investors and % ownership by non-institutional
investors) has significant impact on audit fees.
While previous studies in the UK (e.g. O’Sullivan, 2000) used proportion of total
equity owned by institutional investors and proportion of total equity own by non-
institutional investors to measure block ownership, Adelopo et al. (2012) examined
the impact of ownership structure on audit pricing using number of Multiple Large
Shareholders (MLS-the number of large shareholders holding at least 3 percent of
the total voting shares in a company). The study used the number of MLS to define
ownership concentration in a firm and to categorise firms in their sample. It is
indicated in Adelopo et al. (2012) that they use MLS to respond to the open call in
Edmans and Manso (2009) to use MLS since the number of MLS matters in
corporate monitoring as it is a relevant determinant of market efficiency or strength
of corporate governance. The study is also an extension of Mitra et al.’s (2007)
direct examination of the relationship between ownership structure as a part of
corporate governance and the level of audit fees. The study partitioned the sample
into three categories with equal ranges, i.e. firms where MLS ≤4 (diffused firms),

75
5≤MLS≤8 (concentrated firms) 9≤MLS≤12 (highly concentrated firms). The study
found significant differences between audit fees, company size and committee
meetings for each of these three groups using one-way analysis of variance
(ANOVA). The study also investigated the relationship between the number of
MLS, Audit committee activity and audit fees in a multiple regression model that
controlled for additional variables including firm-specific and governance variables.
Hypothetically, they expect that when a firm has more MLS (concentrated firms),
monitoring by active shareholders and monitoring by block-holders will increase,
and this will most likely impact positively on internal control and mitigate
misreporting. This is because the improvements in internal control should reduce
audit risk, hence reducing audit fees. Their findings are consistent with this
conjecture. Specifically, the study found that the number of MLS is significantly
and negatively related to audit fees. This suggests that the higher the number of
MLS, the higher the ownership concentration and the lower the audit fees paid to
the external auditors. Table 3.1 summarises prior audit pricing and corporate
governance studies since the 1990s.
In conclusion, literature review on corporate governance and audit pricing in the UK
shows that most studies have been done using 1990s data, around the Cadbury
period. Since then, corporate governance in the UK has gone through rapid
development especially with regards to board and audit committee effectiveness.
Higgs Report (2003), Smith Report (2003) and consequently Combine Code (2003),
have brought many changes to the corporate governance especially with regard to
audit committee effectiveness. Therefore, this study aims to fulfil this gap. In the
interim, the study contributes to the literature by examining the relationship between
governance and audit pricing using more comprehensive characteristics including
board characteristics, audit committee characteristics and ownership structure. In
addition, the more comprehensive measurements of the characteristics are
employed. There are two studies that use data in 2000s (Zaman et al., 2011;
Adelopo et al., 2012). However, Adelopo et al. (2012) only focus on the impact of
Multiple Large Shareholders and audit committee activity on audit fees. The quite
similar study is done by Zaman et al. (2011). They have investigated the

76
relationship between governance characteristics and audit fees using a more recent
data (2001-2004 UK-data). However, this study is different from Zaman et al.
(2011) in a few ways. Firstly, this study consist more comprehensive governance
characteristics including board characteristics, audit committee characteristics and
ownership structure while Zaman et al. (2011) focus more on audit committee
effectiveness and audit pricing. Secondly, Zaman et al. (2011) covers the period
before and around Smith Report (2003), therefore the study cannot actually capture
the effect of recommendation of Smith Report (2003). On the other hand, this study
use data in 2007 and 2010 which capture the impact of the recommendation (Smith
Report, 2003) on audit pricing. Thirdly, Zaman et al. (2011) use a very small sample
size (135 FTSE 350 companies) to arrive at their conclusion while this study utilises
data of 384 FTSE All Shares listed companies.Therefore, the conclusion from this
study also covers the smaller companies listed on FTSE Small Capital which are
ignored in earlier studies. Fourth, this study contributes to the literature since
Financial Institutions which are ignored in Zaman et al. (2011) and the previous.
The collapse of the UK Banking Institutions justifies the inclusion of this industry in
the study. In addition, this study also investigates the impact of economic condition
on the relationship between governance characteristics and audit fees by having a
comparison between pre- and post-economic crisis on the relationship between
governance characteristics and audit fees.

77
Table 3.1: Summary of Empirical Studies Examining the Influence of Corporate Governance Characteristics on Audit Fees
Author(s)
(Publication)
Objective(s) of study Details of study(Country) Main Findings
Collier and Gregory (1996)
(EAR)
Seek to establish whether audit committees are effective in ensuring
audit quality by protecting the auditors
from fee cuts which might affect audit quality
1989-1991 data from 315 FTSE companies
(UK)
The relationship between size-related audit fees and the presence of an audit committee is positive and significant.
Insignificant negative relationship between risk-and complexity-related audit fees and the presence of an audit committee.
O’Sullivan (1999)
(EAR)
Examines the impact of board and audit committee characteristics on the audit
fee paid by large UK companies in the
post –Cadbury (1992) period.
146 large UK listed companies at the end of the 1995 financial year
(UK)
Results suggest that audit fees remain predominantly influenced by the size, complexity and risk of the audit client.
Companies operating in regulated industries pay lower audit fees.
No evidence that board and audit committee characteristics
influence auditors’ pricing decisions
Any fee reductions expected due to improved board monitoring may
be counterbalanced by the increase in audit effort and assurances desired by non-executive directors
O’Sullivan (2000)
(BAR)
Examines the impact of board composition and ownership structure on
audit quality in the UK prior to the
adoption of Cadbury (1992)
1992 data from 402 quoted companies
(UK)
The proportion of non-executive directors has a significant positive impact on audit fees
Audit fees are negatively related to the proportion of equity owned by executive directors
No evidence that ownership by large blockholders or CEO/chairman duality has a significant impact on audit fees.
Peel and Clatworthy (2001)
(CGIR)
To present the results of a pre-Cadbury study of the impact of board
composition variables on audit pricing
1992 data from 132 listed firms, which were the first companies required to
disclose consultancy fees under a
change to UK disclosure requirements (UK)
It was found that, consistent with a post-Cadbury study of UK quoted firms (O'Sullivan, 1999), a range of board composition
variables were insignificantly related to audit fees
Higher consultancy fees were found to be associated with higher audit fees.
While prior research has shown that the aggregated level of institutional and managerial ownership is negatively associated with
audit fees, the study finds only directors' ownership has a significant impact.

78
Author(s) (Publication) Objective(s) of study Details of study(Country) Main Findings
Felix et al. (2001)
(JAR)
This study investigates the effect of
internal audit contribution on the external audit fee.
Based on publicly available data and
survey responses from internal and external auditors affiliated with 70 Non-
financial service Fortune 1000
companies, undertaken in 1997
(USA)
Internal audit contribution is a significant determinant of the
external audit fee.
Examination of the factors influencing internal audit contribution
suggests that internal audit contribution is influenced by internal audit quality.
As inherent risk increases, the effect of internal audit availability on contribution diminishes, while the effect of coordination on
contribution increases.
Overall, the findings suggest that internal audit contribution can result in reduced external audit fees, and that client firms can
potentially affect internal audit contribution by investing in internal
audit quality, managing availability, and facilitating coordination between the internal and external auditors.
Tsui et al. (2001)
(JAAF)
The study examines the relationship between a firm's internal monitoring
mechanism and its impact on the audit
fee.
650 non-financial companies in Hong Kong between 1994-1996
(Hong Kong)
Independence of corporate boards (chief executive officer and chairman being separate individuals) is an important factor in
auditors' assessment of control risk and the determination of audit fees.
The negative association between audit fees and independent
corporate boards is stronger (weaker) for firms with low (high)
growth opportunities.
Carcello, et al. (2002)
(CAR)
Examines the relationship between three
board characteristics (independence,
diligence and expertise) and Big 6 audit fees
Data from 258 companies from Fortune
1000 companies in 1992-93
(USA)
Significant positive relationship between audit fees and board
independence, diligence and expertise.
O’Sullivan, and Diacon (2002)
(IJA)
Compare the pricing of audits in mutual and proprietary insurance companies
(including audit committees and non-
audit fees)
1992 data from 117 UK insurance companies
(UK)
Mutual insurers pay significantly lower audit fees compared to their proprietary counterparts
Existence of an audit committee has a positive impact on audit fees paid by companies.
Audit fees are not sensitive to the composition of audit committees.
There is weak evidence of the relationship between provision of
non-audit service and audit fees. No evidence linking audit fees and nature of non-audit service. Company size and complexity are the
most important determinants of audit pricing in insurance
companies, with significant price reductions earned by insurers specializing in either general or life insurance business.
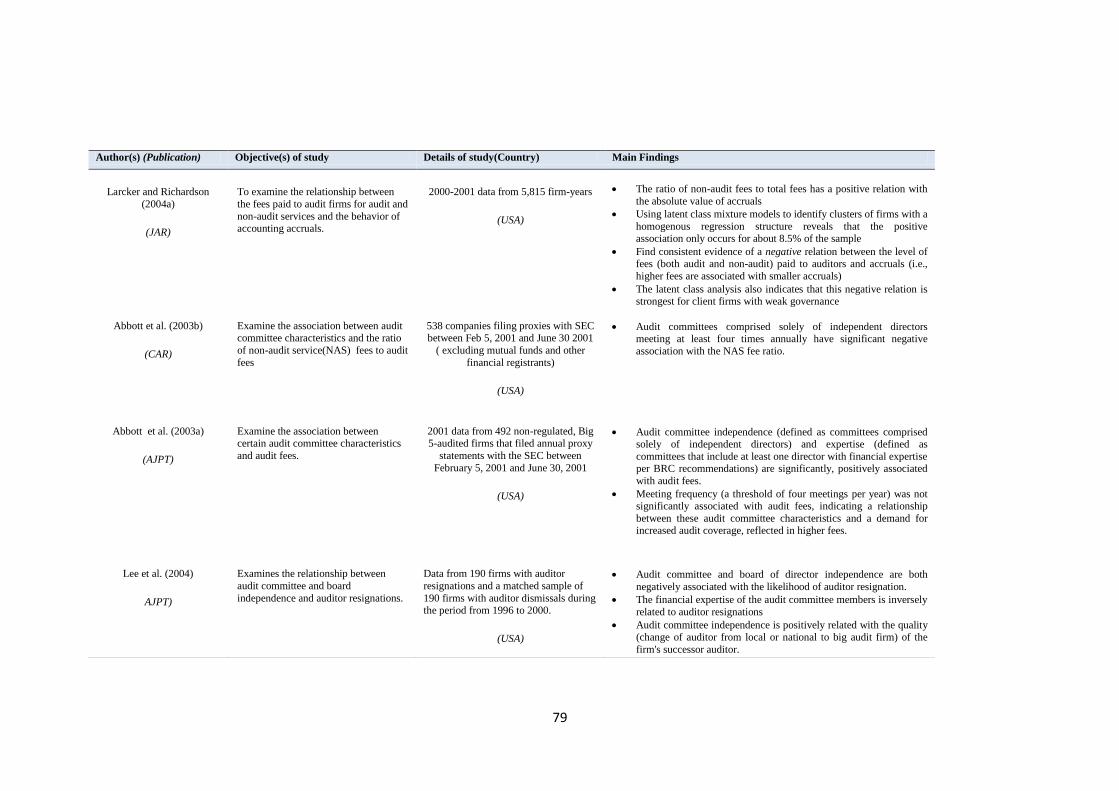
79
Author(s) (Publication) Objective(s) of study Details of study(Country) Main Findings
Larcker and Richardson
(2004a)
(JAR)
To examine the relationship between
the fees paid to audit firms for audit and
non-audit services and the behavior of accounting accruals.
2000-2001 data from 5,815 firm-years
(USA)
The ratio of non-audit fees to total fees has a positive relation with
the absolute value of accruals
Using latent class mixture models to identify clusters of firms with a
homogenous regression structure reveals that the positive association only occurs for about 8.5% of the sample
Find consistent evidence of a negative relation between the level of fees (both audit and non-audit) paid to auditors and accruals (i.e.,
higher fees are associated with smaller accruals)
The latent class analysis also indicates that this negative relation is strongest for client firms with weak governance
Abbott et al. (2003b)
(CAR)
Examine the association between audit committee characteristics and the ratio
of non-audit service(NAS) fees to audit
fees
538 companies filing proxies with SEC between Feb 5, 2001 and June 30 2001
( excluding mutual funds and other
financial registrants)
(USA)
Audit committees comprised solely of independent directors meeting at least four times annually have significant negative
association with the NAS fee ratio.
Abbott et al. (2003a)
(AJPT)
Examine the association between certain audit committee characteristics
and audit fees.
2001 data from 492 non-regulated, Big 5-audited firms that filed annual proxy
statements with the SEC between
February 5, 2001 and June 30, 2001
(USA)
Audit committee independence (defined as committees comprised solely of independent directors) and expertise (defined as
committees that include at least one director with financial expertise per BRC recommendations) are significantly, positively associated
with audit fees.
Meeting frequency (a threshold of four meetings per year) was not significantly associated with audit fees, indicating a relationship
between these audit committee characteristics and a demand for increased audit coverage, reflected in higher fees.
Lee et al. (2004)
AJPT)
Examines the relationship between
audit committee and board
independence and auditor resignations.
Data from 190 firms with auditor
resignations and a matched sample of
190 firms with auditor dismissals during the period from 1996 to 2000.
(USA)
Audit committee and board of director independence are both
negatively associated with the likelihood of auditor resignation.
The financial expertise of the audit committee members is inversely
related to auditor resignations
Audit committee independence is positively related with the quality (change of auditor from local or national to big audit firm) of the
firm's successor auditor.

80
Author(s) (Publication) Objective(s) of study Details of study(Country) Main Findings
Lee and Mande (2005)
(QJBE)
Examines the association between the
fees paid to the external auditor and
effective audit committees
2000 data from 792 firms from the
Investor Responsibility Research
Center’s (IRRC) database
(US)
Effectiveness of audit committee, measured by composite of audit
committee independence and diligence, is positively associated with
audit fees.
Initial results also suggest that effective audit committees seek to
increase audit quality by reducing the non-audit services provided
by the external auditor.
Once the non-audit fee is modelled endogenously the results show that there is no statistically significant association between the non-
audit fees and audit committee effectiveness.
Goodwin-Steward and Kent
(2006)
(A&F)
Examines the association between audit
fees, an effective audit committee and
internal audit in an Australian setting.
2000 data from 401 Australian public
listed companies – combining survey
and public data.
(Australia)
Significant positive associations between the level of audit fees and
the existence of an audit committee, the use of internal audit and
audit committee meeting frequency.
Significant three-way interaction between audit committee
independence, expertise and meeting frequency.
Additional analysis indicates that expertise is positively associated
with audit fees only when meeting frequency and independence are low-consistent with audit committee members with accounting
expertise demanding a higher level of assurance in these
circumstances.
Knechel and Willekens
(2006) (JBFA)
Examines the role of risks and controls
in the determination of audit fees
2001 data from 50 Belgian companies
that were listed on Euronext Brussels on December 31, 2001
(Belgium)
Audit fees are higher when a company has an audit committee,
discloses a relatively high level of financial risk management, and has a larger proportion of independent Board Members.
Audit fees are lower when a company discloses a relatively high level of compliance risk management.
Mitra et al.. (2007) (RQFA)
Examines the empirical relationship
between ownership characteristics and
audit fees
2000 data from 358 New York Stock
Exchange-listed firms audited by the
Big Five auditors
(USA)
Significantly positive relationship between diffused institutional
stock ownership (i.e., having less than 5% individual shareholding) and audit fees
a significantly negative relationship between institutional block-
holder ownership (i.e. having 5% or more individual shareholding ) and audit fees.
Managerial stock ownership is negatively associated with audit fees.
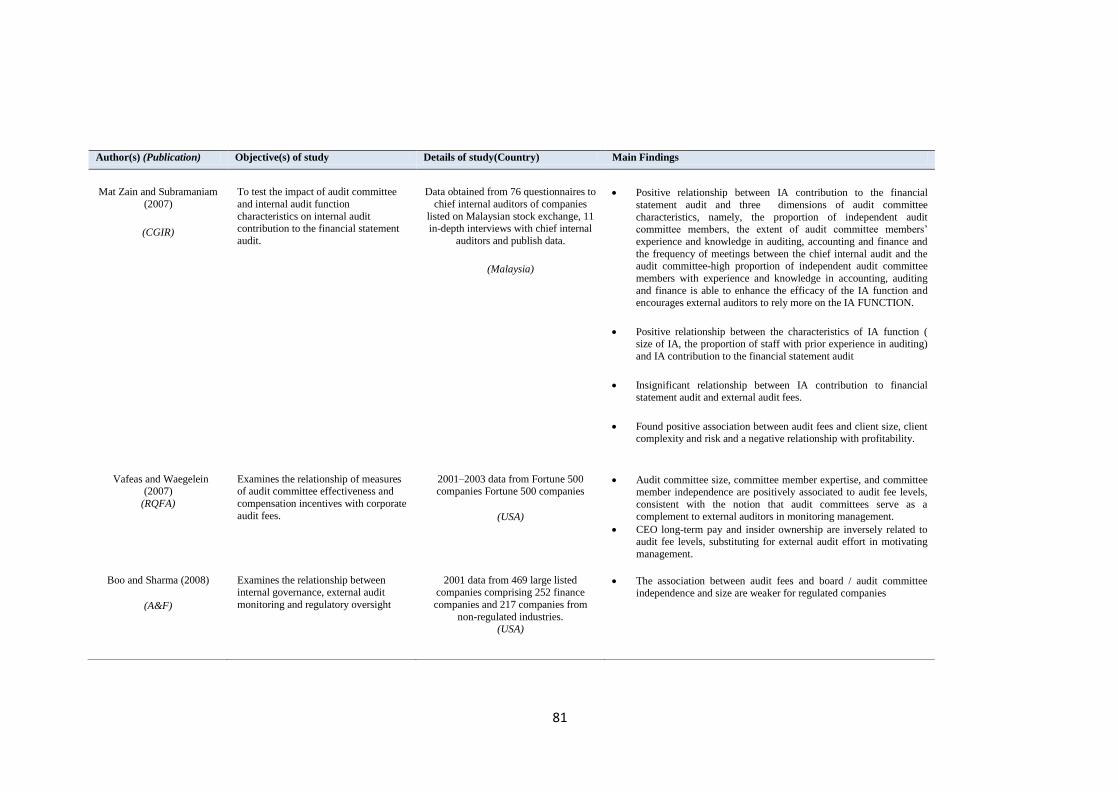
81
Author(s) (Publication) Objective(s) of study Details of study(Country) Main Findings
Mat Zain and Subramaniam
(2007)
(CGIR)
To test the impact of audit committee
and internal audit function
characteristics on internal audit contribution to the financial statement
audit.
Data obtained from 76 questionnaires to
chief internal auditors of companies
listed on Malaysian stock exchange, 11 in-depth interviews with chief internal
auditors and publish data.
(Malaysia)
Positive relationship between IA contribution to the financial
statement audit and three dimensions of audit committee
characteristics, namely, the proportion of independent audit committee members, the extent of audit committee members’
experience and knowledge in auditing, accounting and finance and
the frequency of meetings between the chief internal audit and the audit committee-high proportion of independent audit committee
members with experience and knowledge in accounting, auditing
and finance is able to enhance the efficacy of the IA function and encourages external auditors to rely more on the IA FUNCTION.
Positive relationship between the characteristics of IA function ( size of IA, the proportion of staff with prior experience in auditing)
and IA contribution to the financial statement audit
Insignificant relationship between IA contribution to financial statement audit and external audit fees.
Found positive association between audit fees and client size, client complexity and risk and a negative relationship with profitability.
Vafeas and Waegelein (2007)
(RQFA)
Examines the relationship of measures of audit committee effectiveness and
compensation incentives with corporate
audit fees.
2001–2003 data from Fortune 500 companies Fortune 500 companies
(USA)
Audit committee size, committee member expertise, and committee member independence are positively associated to audit fee levels,
consistent with the notion that audit committees serve as a complement to external auditors in monitoring management.
CEO long-term pay and insider ownership are inversely related to audit fee levels, substituting for external audit effort in motivating
management.
Boo and Sharma (2008)
(A&F)
Examines the relationship between
internal governance, external audit
monitoring and regulatory oversight
2001 data from 469 large listed
companies comprising 252 finance
companies and 217 companies from
non-regulated industries. (USA)
The association between audit fees and board / audit committee
independence and size are weaker for regulated companies
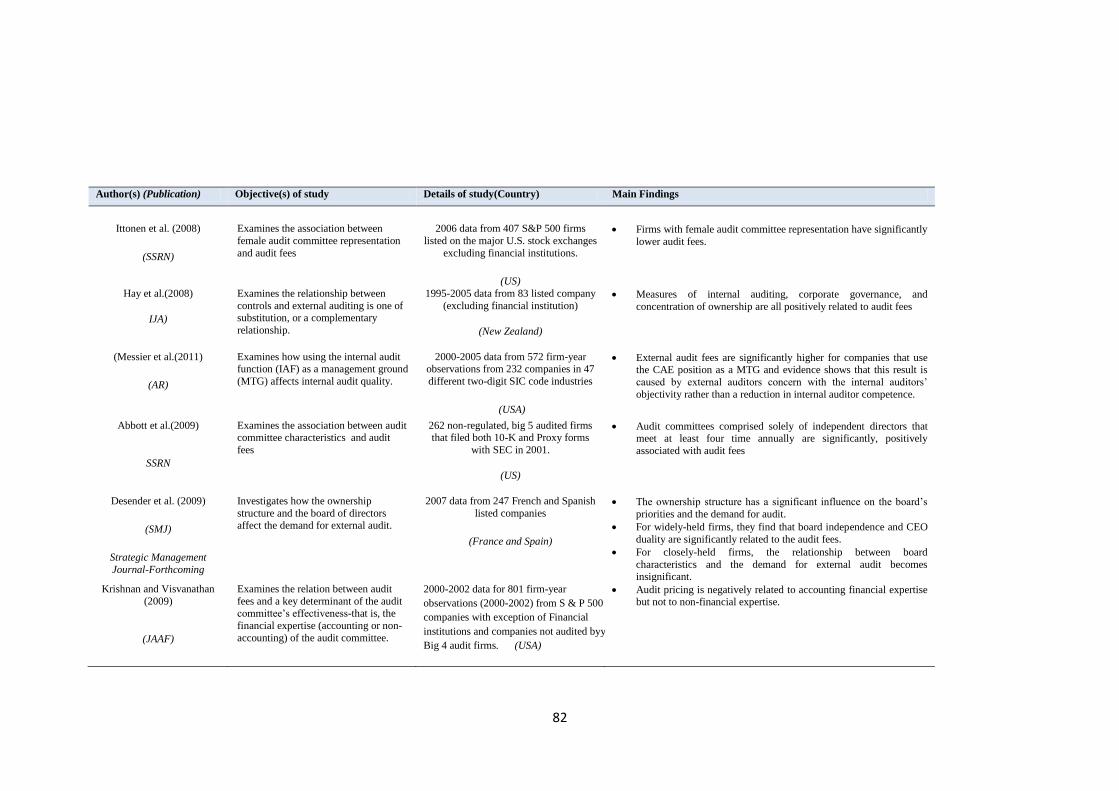
82
Author(s) (Publication) Objective(s) of study Details of study(Country) Main Findings
Ittonen et al. (2008)
(SSRN)
Examines the association between
female audit committee representation
and audit fees
2006 data from 407 S&P 500 firms
listed on the major U.S. stock exchanges
excluding financial institutions.
(US)
Firms with female audit committee representation have significantly
lower audit fees.
Hay et al.(2008)
IJA)
Examines the relationship between
controls and external auditing is one of substitution, or a complementary
relationship.
1995-2005 data from 83 listed company
(excluding financial institution)
(New Zealand)
Measures of internal auditing, corporate governance, and
concentration of ownership are all positively related to audit fees
(Messier et al.(2011)
(AR)
Examines how using the internal audit function (IAF) as a management ground
(MTG) affects internal audit quality.
2000-2005 data from 572 firm-year observations from 232 companies in 47
different two-digit SIC code industries
(USA)
External audit fees are significantly higher for companies that use the CAE position as a MTG and evidence shows that this result is
caused by external auditors concern with the internal auditors’
objectivity rather than a reduction in internal auditor competence.
Abbott et al.(2009)
SSRN
Examines the association between audit committee characteristics and audit
fees
262 non-regulated, big 5 audited firms that filed both 10-K and Proxy forms
with SEC in 2001.
(US)
Audit committees comprised solely of independent directors that meet at least four time annually are significantly, positively
associated with audit fees
Desender et al. (2009)
(SMJ)
Strategic Management
Journal-Forthcoming
Investigates how the ownership
structure and the board of directors affect the demand for external audit.
2007 data from 247 French and Spanish
listed companies
(France and Spain)
The ownership structure has a significant influence on the board’s
priorities and the demand for audit.
For widely-held firms, they find that board independence and CEO
duality are significantly related to the audit fees.
For closely-held firms, the relationship between board
characteristics and the demand for external audit becomes insignificant.
Krishnan and Visvanathan
(2009)
(JAAF)
Examines the relation between audit
fees and a key determinant of the audit committee’s effectiveness-that is, the
financial expertise (accounting or non-
accounting) of the audit committee.
2000-2002 data for 801 firm-year
observations (2000-2002) from S & P 500
companies with exception of Financial
institutions and companies not audited byy
Big 4 audit firms. (USA)
Audit pricing is negatively related to accounting financial expertise but not to non-financial expertise.
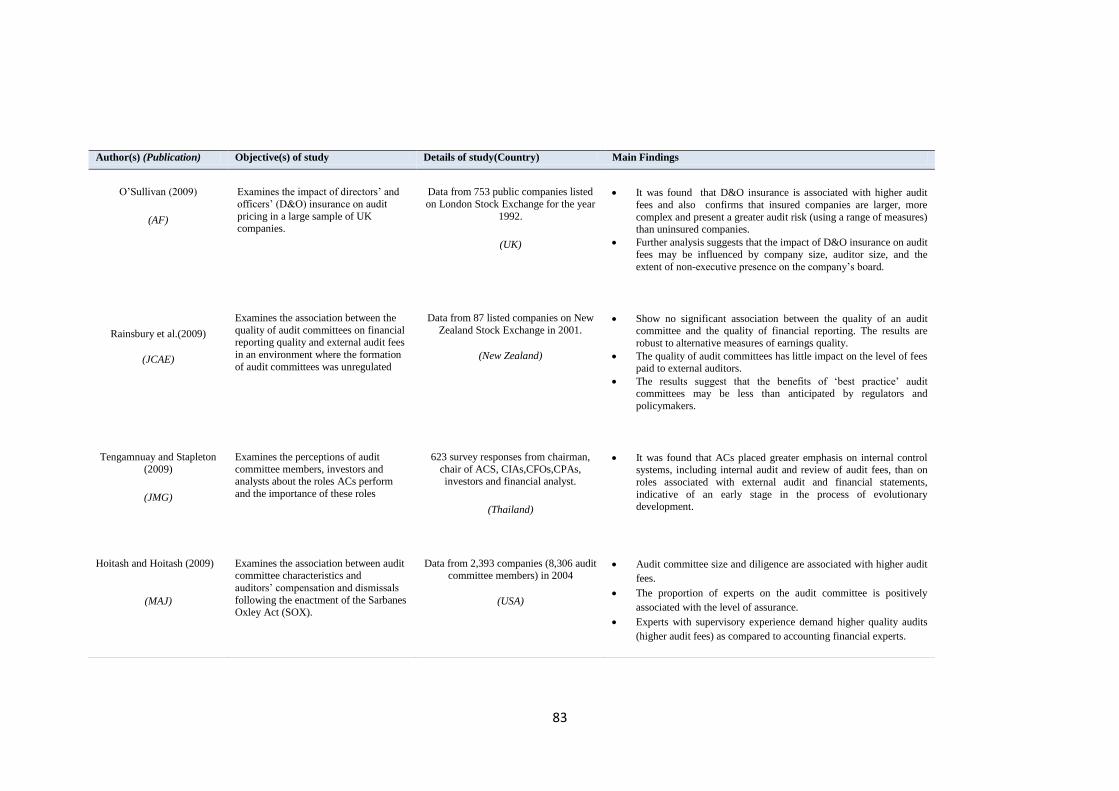
83
Author(s) (Publication) Objective(s) of study Details of study(Country) Main Findings
O’Sullivan (2009)
(AF)
Examines the impact of directors’ and
officers’ (D&O) insurance on audit
pricing in a large sample of UK companies.
Data from 753 public companies listed
on London Stock Exchange for the year
1992.
(UK)
It was found that D&O insurance is associated with higher audit
fees and also confirms that insured companies are larger, more
complex and present a greater audit risk (using a range of measures) than uninsured companies.
Further analysis suggests that the impact of D&O insurance on audit
fees may be influenced by company size, auditor size, and the
extent of non-executive presence on the company’s board.
Rainsbury et al.(2009)
(JCAE)
Examines the association between the
quality of audit committees on financial reporting quality and external audit fees
in an environment where the formation
of audit committees was unregulated
Data from 87 listed companies on New
Zealand Stock Exchange in 2001.
(New Zealand)
Show no significant association between the quality of an audit committee and the quality of financial reporting. The results are
robust to alternative measures of earnings quality.
The quality of audit committees has little impact on the level of fees paid to external auditors.
The results suggest that the benefits of ‘best practice’ audit committees may be less than anticipated by regulators and
policymakers.
Tengamnuay and Stapleton
(2009)
(JMG)
Examines the perceptions of audit
committee members, investors and analysts about the roles ACs perform
and the importance of these roles
623 survey responses from chairman,
chair of ACS, CIAs,CFOs,CPAs, investors and financial analyst.
(Thailand)
It was found that ACs placed greater emphasis on internal control systems, including internal audit and review of audit fees, than on
roles associated with external audit and financial statements,
indicative of an early stage in the process of evolutionary development.
Hoitash and Hoitash (2009)
(MAJ)
Examines the association between audit committee characteristics and
auditors’ compensation and dismissals
following the enactment of the Sarbanes Oxley Act (SOX).
Data from 2,393 companies (8,306 audit committee members) in 2004
(USA)
Audit committee size and diligence are associated with higher audit
fees.
The proportion of experts on the audit committee is positively
associated with the level of assurance.
Experts with supervisory experience demand higher quality audits
(higher audit fees) as compared to accounting financial experts.

84
Author(s) (Publication) Objective(s) of study Details of study(Country) Main Findings
Engel et al. (2010)
(JAE)
Examine the relation between audit
committee compensation and the demand for monitoring of the financial
reporting process.
Data from 3295 firm-year observations
covering the period between 2000-2004 excluding utilities and financial
institutions.
(USA)
Found positive correlation between total compensation and cash retainers paid to audit committees and audit fees and also the impact
of the Sarbanes-Oxley Act, suggesting a positive link between audit
committee compensation and the audit committee’s demand for financial reporting process monitoring.
Ho and Hutchinson (2010)
(JIAAT)
Examine the linkages between various internal audit characteristics and
activities of Hong Kong firms and
external audit fees.
53 public listed companies on Hong Kong stock Exchange that responded to
the survey in 2004.
(Hong Kong)
Lower audit fees associate with: Larger internal audit departments, Internal auditors who spend more time on examining financial
statement and external audit related matters, Internal auditors who
spend more time on system development and maintenance, Internal auditors who spend more time on reviewing operating efficiency and
effectiveness including internal control, Internal auditors who spend
more time on fraud investigations and special projects, Internal auditors who give external auditor more access to internal auditor’s
working papers.
Leventis and Dimitropoulos
(2010)
(AA)
Investigates the relation between audit
pricing, quality of earnings and board
independence.
Data from 248 firm year
observation(from 97 companies listed
on Athens Stock Exchange) for five
years(2000-2004)
(Greece)
The results show a positive association between:
Board independence and audit pricing (means strong governance is related to increased needs for quality assurance
services )
Audit pricing and earnings management for a small size companies( might indicate potential red flag)
Masli et al.(2010)
(AR)
Examining the potential benefits of
Internal Control Monitoring
Technology.
Data from 139 firm year observations of
firms announcing SOX-related ICM
technology initiatives over a four-year period (2003-2006) (USA)
Implementation of internal control monitoring technology is
associated with lower likelihood of material weaknesses, smaller increase in audit fees and smaller increases in audit delays during
the post-SOX time period.

85
Author(s) (Publication) Objective(s) of study Details of study(Country) Main Findings
Gul and Goodwin (2010)
(AR)
Examine whether a firm’s short-term
debt maturity structure is associated
with auditor assessment of audit risk
and consequently audit fees
Data from 9,632 firm years
observations from 2003 to 2006
excluding financial companies
(USA)
Find that short-term debt is negatively related to audit fees for firms
rated by Standard & Poor’s- consistent with more monitoring and
better governance mechanisms in firms with higher short-term debt
Credit ratings quality is negatively related to audit fees, consistent
with ratings quality reflecting a firm’s liquidity risk, governance
mechanisms, and monitoring from rating agencies
Find that the negative relationship between short-term debt and
audit fees is stronger for firms with low-quality credit ratings
Zaman et al. (2011)
(JBFA)
Examine the influence of audit
committee effectiveness a proxy for
governance quality on audit fees and non-audit fees using a new composite
measure comprising audit committee
independence, expertise, diligence and size.
Data from 135 companies (540 company
year observations) of UK FTSE-350 in
2001-2004
(UK)
Provide evidence that audit committee effectiveness (ACE) has
significant positive impact on audit fees after controlling for board
characteristics.
Frequency of board meeting, LnTA(size), number of subsidiary
company and BIG4 have significant positive association with audit fees.
Major blockholder has negative relationship with audit fees.
ACE has positive association with Non-audit service fee(NASF)
NASF is negatively associated with audit committee financial expertise and audit committee independence and positively
associated with audit committee size.
Board meeting, CEO-duality, board independence, company size and BIG4 has positive association with NASF.
Bliss (2011)
(A&F)
Examines whether CEO duality affects
the association between board
independence and demand for higher
quality audits, proxied by audit fee
950 Australian publicly listed
companies in 2003
(Australia)
There is a positive association between board independence and
audit fees
Positive association is only present in firms without CEO duality,
thus suggesting that CEO duality constrains board independence
Board size (the number of directors on the board) is positively
associated with audit fees.
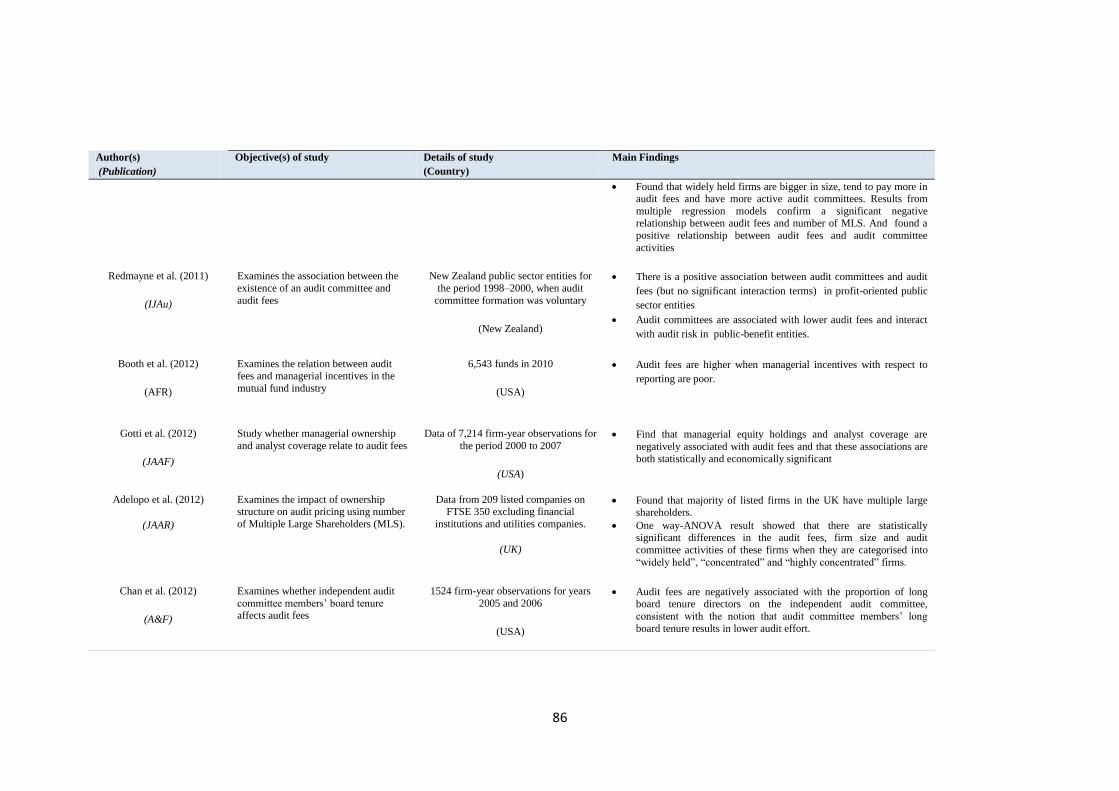
86
Author(s)
(Publication)
Objective(s) of study Details of study
(Country)
Main Findings
Found that widely held firms are bigger in size, tend to pay more in audit fees and have more active audit committees. Results from
multiple regression models confirm a significant negative relationship between audit fees and number of MLS. And found a
positive relationship between audit fees and audit committee
activities
Redmayne et al. (2011)
(IJAu)
Examines the association between the
existence of an audit committee and
audit fees
New Zealand public sector entities for
the period 1998–2000, when audit
committee formation was voluntary
(New Zealand)
There is a positive association between audit committees and audit
fees (but no significant interaction terms) in profit-oriented public
sector entities
Audit committees are associated with lower audit fees and interact
with audit risk in public-benefit entities.
Booth et al. (2012)
(AFR)
Examines the relation between audit fees and managerial incentives in the
mutual fund industry
6,543 funds in 2010
(USA)
Audit fees are higher when managerial incentives with respect to
reporting are poor.
Gotti et al. (2012)
(JAAF)
Study whether managerial ownership
and analyst coverage relate to audit fees
Data of 7,214 firm-year observations for
the period 2000 to 2007
(USA)
Find that managerial equity holdings and analyst coverage are
negatively associated with audit fees and that these associations are
both statistically and economically significant
Adelopo et al. (2012)
(JAAR)
Examines the impact of ownership structure on audit pricing using number
of Multiple Large Shareholders (MLS).
Data from 209 listed companies on FTSE 350 excluding financial
institutions and utilities companies.
(UK)
Found that majority of listed firms in the UK have multiple large shareholders.
One way-ANOVA result showed that there are statistically significant differences in the audit fees, firm size and audit
committee activities of these firms when they are categorised into
“widely held”, “concentrated” and “highly concentrated” firms.
Chan et al. (2012)
(A&F)
Examines whether independent audit
committee members’ board tenure affects audit fees
1524 firm-year observations for years
2005 and 2006
(USA)
Audit fees are negatively associated with the proportion of long board tenure directors on the independent audit committee,
consistent with the notion that audit committee members’ long
board tenure results in lower audit effort.

87
3.4 Non-Audit Fees Literature
3.4.1 Non-Audit Fees and Auditor Independence
With Enron and other corporate scandals leading to a perceived failure of
corporate governance, the issue of auditors simultaneously providing non-audit
services became the focus of much discussion. This is due to the fact that the
responsible auditor (Arthur Andersen), who audited companies involved in the
three biggest US bankruptcies (Enron, WorldCom and Global Crossing),
obtained more revenue from these companies from the provision of non-audit
services (NAS) than from audit services. The over-reliance of audit firms on
earnings from non-audit services is frequently cited as the reason why their
independence as public “watch dogs” may be impaired and, as a result, it is
claimed that drastic changes are needed to restore the confidence of the public.
Such claims could be due to the fact that many accounting firms appeared to
focus more on revenue generation and firm growth, especially in the 1980s, and
sales of non-audit services became a major strategy for achieving firm growth
(Vinatoru and Calota, 2009).
Responding to the controversial scandals mentioned above, and in an attempt to
restore public confidence in an accounting profession which has been badly
damaged in the eyes of the public, the accounting professions in many countries
have produced guidelines on the code of ethics for auditors (Che Ahmad et al.,
2006). This could, in one way or another, ensure the independence of auditors
and hence protect the interests of investors. In the USA, the introduction of the
Sarbanes-Oxley Act (2002) was designed to safeguard the interests of
shareholders and they have brought about some fundamental changes for
auditing firms and their clients regarding the joint provision of audit and non-
audit services (Davis and Hollie, 2004). Audit firms are now prohibited from
providing certain non-audit services to their clients. The prohibited services
include: information technology work, internal audit work and expert services.
Prior to this, SEC rules only required listed companies to disclose the amount
paid to the incumbent auditors for non-audit services (SEC, 2000).
Before the Andersen scandal, many studies had attempted to investigate the
issue of non-audit fees; however, the public only became aware of the

88
importance of such research from a public policy perspective after that case. In
the early 1990s it was revealed that many companies paid more to their auditor
for non-audit services than for the audit service (Ezzamel et al., 1996) and
disclosure of the breakdown of non-audit services was very limited. A study in
2005 by Bigus and Zimmerman (2008) also found that among German
companies non-audit services accounted for 42% of total fees, earning them
nearly as much revenue as audit services. In Switzerland, the mean of non-audit
fees to total fees amounted to 37.4% for listed firms (Stefani, 2006 as cited in
Bigus and Zimmerman, 2008) and for listed firms in the UK, at 67.5% in 2002,
the figure was significantly higher (Beattie et al., 2003). These findings could
explain the growing public concern regarding auditor independence.
Following the requirement for disclosure of non-audit fees by the SEC, Frankel
et al. (2002) carried out a US-based study of 3074 proxy statements on the
SEC’s EdGAR database, with filing dates between February 5, 2001 and June
15, 2001. It was found that non-audit fees are positively associated with the
magnitude of discretionary accruals and negatively associated with share value
on the date of fee disclosure. This could mean that shareholders are suspicious
that the existence of non-audit fees might affect auditor independence. The
results of Frankel et al. (2002) have stimulated great interest among other
researchers regarding the association between non-audit and auditor
independence. Hay et al. (2006) and Antle et al. (2006), however, failed to find
any evidence that non-audit fees affect auditor independence. In contrast to the
above findings, Wines (1994) reported results consistent with apparent
independence impairment. Using a small matched sample of 29 financially
distressed U.K. firms, Basioudis et al. (2006) also found that the magnitude both
of audit fees and non-audit fees is significantly associated with the issuance of a
going-concern modified (GCM) audit opinion. Contrary to findings of previous
studies in the USA that documented no evidence of any impact of non-audit fees
on auditor independence, Srinidhi and Gul (2007) found significant evidence to
link the two variables based on their study using 2000 to 2001 data on
financially distressed firms in the USA.
89
3.4.2 Non-Audit Fees and Audit Fees
The non-audit services most commonly offered by audit firms as listed by Firth
(1997) include tax consultancy, system consultancy, management advice,
international business advice, human resource management and financial and
investment consultancies. The relationship between audit fees and non-audit fees
has attracted much interest among researchers since the 1980s (e.g., Simunic
1984; Hillison and Kennelley, 1988; Firth 1997, Butterworth and Houghton,
1995). Investigation of the reasons for the dramatic increase in non-audit fees is
a really important research area and has become more important even than the
audit fee itself. Simunic (1984) analysed the client's decision to purchase MAS
and audit services when their production functions are interdependent and tested
for the existence and pricing effects of such knowledge spillovers. The data for
the study were taken from the 397 observations of publicly held U.S. companies,
collected as a stratified random sample by Simunic (1980), which (1) used a Big
Eight auditor; (2) responded to the question which asked for the dollar amount of
MAS fees paid to the auditor during the fiscal year 1976 and 1977; and (3)
reported assets of less than $3 billion. The final sample of the study included 263
companies. The study found that the audit fees of clients who also purchase MAS
from their auditors are significantly higher than audit fees of clients who do not
do so. This result is consistent with the existence of efficiencies from joint
production; however, the study also argues that while efficiencies from joint
production may exist, this does not imply that joint performance of MAS and
auditing is necessarily desirable. This is because efficiencies can be partially
appropriated as rents to the CPA firm supplier, and hence can themselves create
a threat to audit independence.
McMeeking et al. (2006) stated that the big firm premium might be explained in
terms of interdependence between the fees charged by auditors for audit and
non-audit services. Some researchers argue that a negative relationship could
exist between audit fees and non-audit fees due to “knowledge spillover”
(Simunic, 1984; Antle et al., 1997; Whisenant et al., 2003). “Knowledge
Spillover” is a synergy or external economy “arising from providing audit and
NAS as joint products” (Abdel-Khalik, 1990). Obtaining the NAS from the
incumbent auditor is cost efficient where it could reduce client search and
90
transaction costs. Abdel-Khalik (1990, p. 296) argues that any efficiencies
flowing from knowledge spillover should result in lower costs if a single auditor
supplies both services than if the two services are sourced from two different
audit firms. In addition, an auditor offering both types of service develops a
greater understanding of the client company and hence the amount of audit
testing and investigation could be reduced, leading to lower audit fees. However,
similar to Palmrose (1986b), Abdel-Khalik (1990) finds audit fees do not differ
significantly between clients purchasing audit services alone and those
purchasing both audit and non-audit services. Firth (1997a) finds that audit and
non-audit fees are positively related and contends that there is no apparent
reason why this is so. More recent research which examined knowledge
spillover using a simultaneous system of audit fee equations has also provided
inconsistent results. While Whisenant et al. (2003) and Hay et al. (2006)
reported no knowledge spillover, Antle et al. (2006) found evidence of
knowledge spillover between audit and non-audit services. In an experimental
setting, Joe and Vandervelde (2007) investigated whether knowledge gained
from working on a non-audit task can be transferred to enhance the performance
of the audit task. It was found that higher risk assessments were made by
auditors who performed both services than were made by auditors who
performed only audit services and had no access to the non-audit service
working papers. The benefit from the “knowledge spillover” effect may be
passed on by the auditor to their client in the form of reduced audit fees charges.
On the other hand, in a competitive environment where client companies have
more opportunity to change auditor and take advantage of the “low balling”
associated with a newly appointed auditor, the auditor may try to avoid dismissal
by reducing the audit fees and will recover the loss by increasing the NAS fees
(Hillison & Kenneley, 1988). The situation whereby the auditor charges lower
audit fees to gain more lucrative consultancy work from their client is called a
“Loss leader” (Che Ahmad, 2006).
Despite the above theories (knowledge spillover and loss leader theory), many
studies have found that non-audit fees are positively related to audit fees. Out of
19 studies from 1980–2003, 16 found a positive relationship, 1 showed an
insignificant and 2 a significant negative relationship, and the overall meta-

91
analysis confirmed the positive relationship between audit fees and non-audit
fees (Hay et al., 2006). A number of explanations have been offered for this
apparently counter-intuitive result. First, it was argued by Simunic (1984) and
Firth (2002) that the joint supply of audit and NAS will reduce the price per unit
of the audit service, which leads to an increased demand for additional services
by client companies, assuming that the demand for audit services is price-elastic.
This course of action will increase the total audit cost. Second, the positive
relationship might be due to client specific event(s) which generate demand for
consultancy services and subsequently necessitate additional auditing (Ezzamel
et al., 2002; Firth, 2002). Specific events in a company such as mergers and
acquisitions, share issues, implementation of new accounting and information
systems, appointment of a new Chief Executive Officer (CEO) and corporate
restructuring all require additional audit effort and consultancy services (Firth,
2002). Third, those client companies requiring more NAS normally are
problematic in general. Undertaking NAS provides the auditor with some insider
knowledge of the riskiness of such companies and the auditor might charge
higher fees to cover for the subsequent higher litigation risk. Fourth, monopoly
power in service efficiency for non-audit services allows auditors to charge fee
premiums (Hay et al., 2006). Accounting firms also sometimes promote
themselves as “one stop” service providers (McMeeking et al. 2006). Regardless
of the underlying explanation, a recent meta-analysis covering audit fee
literature up to 2007 (Hay, 2012) confirms that audit fees and non-audit fees
have a significant positive association and concludes that non-audit fees do not
affect auditor independence.
Whisenant et al. (2003) investigated whether the characteristics of clients,
auditors and the auditor-client relationship simultaneously determine audit and
non-audit fees. It was the first study incorporating simultaneous equation models
into the pricing of audit services. The results of the study show that audit and
non-audit services are endogenous. The findings also suggest that either no
knowledge spillover occurs or equal knowledge spillover exists between audit
and non-audit services. This study motivated McMeeking et al. (2006) to model
both audit and non-audit fees in a simultaneous equation framework. The study
found that the big firm premium disappears as compared to results using a single

92
equation model. It is suggested that the big firm premium might be associated
with the provision of NAS to UK audit clients when the proper allowance is
made for endogeneity. On the other hand, Wu (2006) presented a model in
which markets for both audit services and non-audit services were oligopolistic.
The empirical implication of the testing is that because of competition-crossover
effects between the auditing and consulting service market, finding empirical
evidence for a knowledge-spillover benefit is likely to be difficult. In the same
manner, a study by Stein (2006) also found that knowledge spillover benefits
may be difficult to assess because of the intermediating effect of competition
cross over. Both studies recommended the inclusion of the control variable
“market concentration” in audit fee regression to increase the power of empirical
testing.
In an earlier study in the US, Palmrose (1988) used questionnaire survey
responses to study individual non-audit services as companies were not at that
time required to disclose individual services. Palmrose (1988) broke up the non-
audit fees into Management advisory service (MAS)-Accounting service, MAS-
Non-accounting service and Tax service. From the analysis, Palmrose (1988)
found tax services to be the most frequently purchased category when only one
type of service was acquired. In the UK, Beattie et al. (1996) studied non-audit
fees in detail by gathering data from the survey responses of finance directors of
300 listed companies and 307 audit partners of listed companies in 1995. The
study categorises non-audit fees into accounting advice, account preparation
assistance, corporate tax, corporate finance, due diligence, and IT. It was found
that corporate tax is the non-audit service most frequently purchased from the
incumbent auditor, while corporate finance is the service most commonly
purchased from elsewhere. Beattie et al. (1996) disclose that most of the non-
audit services provided by the auditors are not management consultancy work,
but instead, essential accounting services that enable listed companies to comply
with legal and regulatory requirements. They later concluded that the profession
is inviting unnecessary criticism by bundling essential compliances services
together with limited consultancy work into one disclosure figure and that it
would be advantageous to show the split figures. The other study, by Ezzamel et
al. (2002), categorised non-audit fees into tax services, finance services,
93
management consultancy, accounting, and other services. Using 193 survey
responses gathered in 1995 from non-financial quoted companies, they also
presented evidence that whilst management consultancy is not the most sought
after service from a firm’s incumbent auditor, it is the most common service
purchased from non-incumbent auditors.
Analysing fee income for the years 1990 and 1999 (Beattie and Fearnley, 2002)
identified three main types of non-audit fees: Accounting and Audit, Tax
services and Consulting services, with consulting fees for 4% of the sample
companies reported as exceeding audit fees for the year 1990. Levitt (2000)
further asserted that among the then Big 5 consulting services represented 50%
of their revenues, up from just 12% in 1977 (reported in DeFond et al., 2002: 6).
Utilising information disclosed in proxy statements for the years 2000 and 2001
for 562 firm year observations, Lai and Krishnan (2009) studied the linkage
between market value of equity and the particular non-audit service of designing
and developing a financial information system (FIS). They focused on this type
of service as this service was singled out for disclosure and subsequently banned
by the Securities and Exchange Commission (SEC, 2000). It was found that the
market value of equity is greater for firms that purchase FIS-related services
from their incumbent auditors relative to firms that do not. They concluded that
despite the negative perception associated with non-audit services, investors
regard FIS-related services as value-adding activities. Table 3.2 summarises the
empirical studies examining the relationship between audit fees and non-audit
fees since the 1990s.
In conclusion, the literature review on audit fees and non-audit service
relationship shows that the impact of non-audit fees on audit fees is
inconclusive. Some researchers argue that a negative relationship could exist
between audit fees and non-audit fees due to “knowledge spillover” (Simunic,
1984; Antle et al., 1997; Whisenant et al., 2003) and Lost Leader theory (Che
Ahmad, 2006). On the other hand, some researchers are supporting the positive
relationship between audit fees and non-audit services (e.g. Ezzamel et al., 2002;
Firth, 2002). Since Enron’s case, some development involving changes to the
supply of audit and non-audit services have taken place.This is among the others

94
involving restrictions on the non-audit services that can be offered by the
auditor. In addition, regulators are now debating on the issues of the total
prohibition of non-audit services among auditor to their audit clients. Most of
previous studies are done in the US (e.g Firth, 2002) while the recent UK studies
(e.g Zaman et al.,2011) are concluded using the year 2001 to 2004 data of a
rather small sample size (135 FTSE 350 companies). Therefore, this study aims
to fulfil the gap existing in the literature by investigating this relationship
between audit fees and non-audit fees using a bigger sample size (384 FTSE All
Shares) and more contemporary data (2007 and 2010 data) after the restriction
on non-audit services is imposed among listed companies in the UK. The use of
a more contemporary data (i.e. 2007 and 2010 data) could capture the effect of
recommendation of Smith Report (2003) regarding the non-audit services
received from company auditors and current debate on total prohibition of non-
audit services on the relationship between audit fees and non-audit
fees.Therefore, the findings of this study could provide support for or against the
total probihition of non-audit services.
Literature review also reveals an attempt to investigate the relationship between
the detail component of non-audit fees and audit pricing exist since 1980s. The
previous US studies (e.g. Palmrose, 1988) and the UK studies ( e.g. Beattie et
al., 1996) have utilised questionnaire survey response to study the relationship
between details non-audit services and audit fees. Questionnaires survey
response is used due to unavailability of published data with regard to detail
components of non-audit services before year 2005. Since year 2005, the UK
listed companies are required to disclose detail non-audit services purchased
from their auditors [The Companies Regulation (Disclosure of Auditor
Remuneration and Liability agreements), 2005]. Therefore, this study aims to
fulfil the gap. Furthermore, this study contributes to the literature by
investigating the relationship between detail non-audit services and audit fees
using year 2007 and 2010 published data of 384 FTSE All Shares listed
companies in the UK.

95
Table 3.2: A Summary of Empirical Studies Examining the Influence of Non-Audit Fees on Audit Fees since the 1990s1
1
Even though the table focuses on the analysis of literature starting from 1990, Simunic (1984) and Palmrose (1986) are included as these are the studies most commonly quoted by much of the audit pricing literature.
Author(s)
(Publication)
Objective(s) of study Details of study
(Country)
Main findings
Simunic (1984)
(JAR)
Analyses a client’s decision to purchase
MAS and audit services when their
production functions are interdependent
as well as testing for the existence and pricing effects of knowledge spill-over.
Data from 263 publicly-held companies in
1977.
(USA)
Audit fees of clients who purchase MAS from their
auditors are significantly higher than audit fees of
clients who do not do so.
While efficiencies from joint production may exist, this does not imply that joint performance of MAS and
auditing is necessarily desirable.
Palmrose (1986b)
(JAR)
Investigates the effect of non-audit
services on the pricing of audit services.
1980-1981 data from 298 public and
closely-held companies with big 8 firms as the incumbent auditor.
(USA)
Provides evidence of a positive relationship between fees for audit services and fees for three categories of
non-audit services (accounting-related MAS, non-
accounting MAS and tax).
Abdel-Khalik (1990)
(CAR)
Provides a method to evaluate directly
the cost (benefits) of knowledge spill-over arising from purchasing MAS from
the incumbent auditor
84 survey responses from different audit
regions in five states (excluding financial companies but includes private firms),
study undertaken in early 1987.
(USA)
Purchasing MAS from the incumbent auditor does not have an impact on audit fees.
Davis et al. (1993)
(AR)
Investigates whether the provision of non-audit services results in knowledge
spillover and audit production efficiencies that could produce
economic rents for the auditor.
98 clients of one large public accounting firm.
(USA)
Finds a weak, positive relationship between tax services and audit effort measures and between accounting-
related consulting services and audit hours weighted by billing rate ratios.
Provides no empirical evidence that provision of non-audit services will affect auditor objectivity.
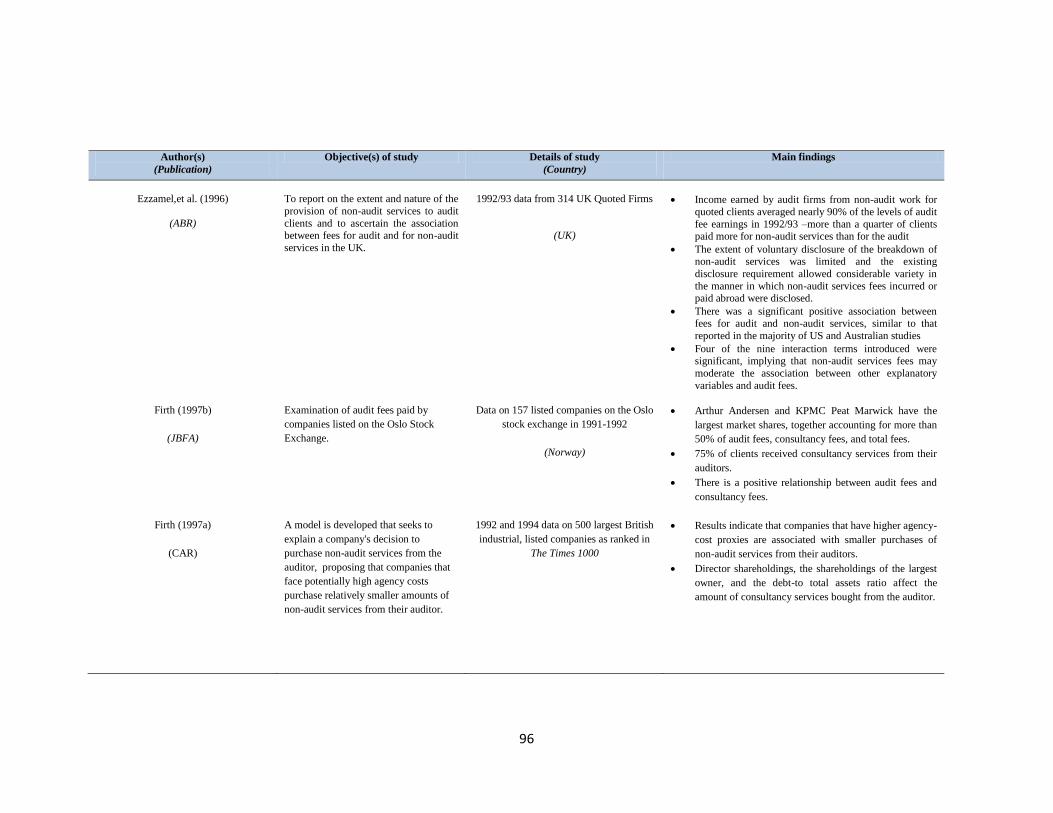
96
Author(s)
(Publication)
Objective(s) of study Details of study
(Country)
Main findings
Ezzamel,et al. (1996)
(ABR)
To report on the extent and nature of the
provision of non-audit services to audit
clients and to ascertain the association between fees for audit and for non-audit
services in the UK.
1992/93 data from 314 UK Quoted Firms
(UK)
Income earned by audit firms from non-audit work for
quoted clients averaged nearly 90% of the levels of audit
fee earnings in 1992/93 –more than a quarter of clients paid more for non-audit services than for the audit
The extent of voluntary disclosure of the breakdown of non-audit services was limited and the existing
disclosure requirement allowed considerable variety in
the manner in which non-audit services fees incurred or paid abroad were disclosed.
There was a significant positive association between fees for audit and non-audit services, similar to that
reported in the majority of US and Australian studies
Four of the nine interaction terms introduced were significant, implying that non-audit services fees may
moderate the association between other explanatory
variables and audit fees.
Firth (1997b)
(JBFA)
Examination of audit fees paid by
companies listed on the Oslo Stock
Exchange.
Data on 157 listed companies on the Oslo
stock exchange in 1991-1992
(Norway)
Arthur Andersen and KPMC Peat Marwick have the
largest market shares, together accounting for more than
50% of audit fees, consultancy fees, and total fees.
75% of clients received consultancy services from their
auditors.
There is a positive relationship between audit fees and
consultancy fees.
Firth (1997a)
(CAR)
A model is developed that seeks to
explain a company's decision to
purchase non-audit services from the
auditor, proposing that companies that
face potentially high agency costs
purchase relatively smaller amounts of
non-audit services from their auditor.
1992 and 1994 data on 500 largest British
industrial, listed companies as ranked in
The Times 1000
Results indicate that companies that have higher agency-
cost proxies are associated with smaller purchases of
non-audit services from their auditors.
Director shareholdings, the shareholdings of the largest
owner, and the debt-to total assets ratio affect the
amount of consultancy services bought from the auditor.

97
Author(s)
(Publication)
Objective(s) of study Details of study
(Country)
Main findings
Lennox (1999)
(EAR)
Investigates the effect of non-audit services on audit quality
Data from 537 listed companies in 1988-1994
(UK)
Following the announcement of the requirement to
disclose non-audit fees, approximately 1/3
of UK quoted companies disclosed before the
requirement became effective.
Auditor size, directors’ shareholdings and non-audit
fees were not significantly correlated
with early disclosure.
Indicates a positive weakly significant relationship
between disclosed non-audit fees and audit
qualifications- suggests that when non-audit fees are
disclosed, the provision of non-audit services does not
reduce audit quality.
Clatworthy et al. (2002)
(JBFA)
Investigate the market for audit services
for UK National Health Service (NHS)
trusts.
459 NHS Trust for the year ended 31st
March 1997 (UK)
A negative association between audit and non-audit fees
in the UK National Health Service sector consistent with
knowledge spillover.
Firth (2002)
(JBFA)
To examine the provision of non-audit
services (also termed here as
consultancy services) to audit clients
using data from UK
1,112 observations of company listed on International Stock Exchange in 1996
Positive association between audit and non-audit fees
observed in the UK is primarily driven by company
specific events (e.g. mergers and acquisitions,
restructuring, new finance, change in management) that
result in the demand for more consultancy and audit
services.
O’Sullivan, and Diacon (2002)
(IJA)
Compare the pricing of audits in mutual
and proprietary insurance companies
(including audit committees and non-audit fees)
1992 data from 117 UK insurance
companies
(UK)
There is weak evidence of the relationship between
provision of non-audit service and audit fees. No
evidence between audit fees and nature of non-audit service. Company size and complexity are the most
important determinants of audit pricing in insurance
companies, with significant price reductions earned by insurers specializing in either general or life insurance
business.
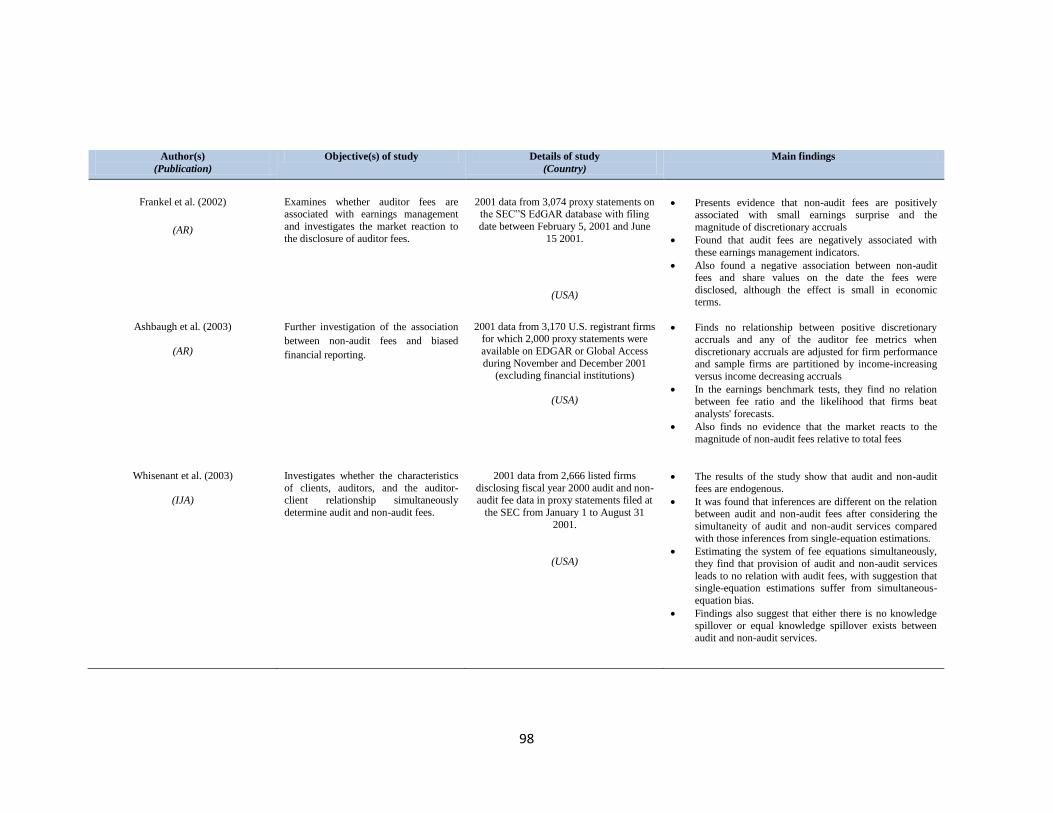
98
Author(s)
(Publication)
Objective(s) of study Details of study
(Country)
Main findings
Frankel et al. (2002)
(AR)
Examines whether auditor fees are associated with earnings management
and investigates the market reaction to
the disclosure of auditor fees.
2001 data from 3,074 proxy statements on the SEC”S EdGAR database with filing
date between February 5, 2001 and June
15 2001.
(USA)
Presents evidence that non-audit fees are positively associated with small earnings surprise and the
magnitude of discretionary accruals
Found that audit fees are negatively associated with
these earnings management indicators.
Also found a negative association between non-audit fees and share values on the date the fees were
disclosed, although the effect is small in economic terms.
Ashbaugh et al. (2003)
(AR)
Further investigation of the association
between non-audit fees and biased
financial reporting.
2001 data from 3,170 U.S. registrant firms for which 2,000 proxy statements were
available on EDGAR or Global Access
during November and December 2001 (excluding financial institutions)
(USA)
Finds no relationship between positive discretionary accruals and any of the auditor fee metrics when
discretionary accruals are adjusted for firm performance and sample firms are partitioned by income-increasing
versus income decreasing accruals
In the earnings benchmark tests, they find no relation between fee ratio and the likelihood that firms beat
analysts' forecasts.
Also finds no evidence that the market reacts to the
magnitude of non-audit fees relative to total fees
Whisenant et al. (2003)
(IJA)
Investigates whether the characteristics
of clients, auditors, and the auditor-client relationship simultaneously
determine audit and non-audit fees.
2001 data from 2,666 listed firms
disclosing fiscal year 2000 audit and non-audit fee data in proxy statements filed at
the SEC from January 1 to August 31
2001.
(USA)
The results of the study show that audit and non-audit fees are endogenous.
It was found that inferences are different on the relation between audit and non-audit fees after considering the
simultaneity of audit and non-audit services compared
with those inferences from single-equation estimations.
Estimating the system of fee equations simultaneously,
they find that provision of audit and non-audit services
leads to no relation with audit fees, with suggestion that single-equation estimations suffer from simultaneous-
equation bias.
Findings also suggest that either there is no knowledge
spillover or equal knowledge spillover exists between
audit and non-audit services.

99
Author(s)
(Publication)
Objective(s) of study Details of study
(Country)
Main findings
Abbott et al. (2003b)
(CAR)
Examine the association between audit committee characteristics and the ratio
of non-audit service(NAS) fees to audit
fees
538 companies filing proxies with SEC between Feb 5, 2001 and June 30 2001
( excluding mutual funds and other
financial registrants)
(USA)
Audit committee comprised solely of independent
directors meeting at least four times annually has
significant negative association with the NAS fee ratio.
Larcker and Richardson (2004)
(JAR)
To examine the relationship between the fees paid to audit firms for audit and
non-audit services and the behaviour of
accounting accruals.
2000-2001 data from 5,815 firm-years
(USA)
The ratio of non-audit fees to total fees has a positive relation with the absolute value of accruals
Using latent class mixture models to identify clusters of firms with a homogenous regression structure reveals
that the positive association only occurs for about 8.5%
of the sample
Find consistent evidence of a negative relation between
the level of fees (both audit and non-audit) paid to auditors and accruals (i.e. higher fees are associated with
smaller accruals)
The latent class analysis also indicates that this negative
relation is strongest for client firms with weak
governance
Felix et al. (2005)
(CAR)
Investigates how external auditor
provision of significant non-audit services and client pressure to use the
work of internal auditor influence
external auditors’ use of internal auditors’ work.
Audit engagements for 1996
were obtained from the same data set used in Felix et al (2001) and gathered through
matched surveys completed by internal
and external auditors for 74 Fortune 1000 firms
(USA)
It was found that when significant non-audit services are
not provided to a client, internal audit quality and the level of internal-external auditor coordination positively
affect auditors’ internal audit reliance decisions
However, when the auditor provides significant non-audit services to the client, internal audit quality and the
extent of internal-external auditor coordination do not significantly affect auditors’ reliance decisions
When significant non-audit services are provided, client pressure significantly increases extent of internal audit
reliance.
External auditors appear to be more affected by client
pressure and less concerned about internal audit quality
and coordination when making internal audit reliance
decisions for clients for whom significant non-audit services are also provided.

100
Author(s)
(Publication)
Objective(s) of study Details of study
(Country)
Main findings
Lee and Mande (2005)
(QJBE)
Examine the association between the
fees paid to the external auditor and
effective audit committees
2000 data from 792 firms from the
Investor Responsibility Research Center’s
(IRRC) database
(US)
Initial results also suggest that effective audit committees seek to increase audit quality by reducing
the non-audit services provided by the external auditor.
Once the non-audit fee is modelled endogenously the results show that there is no statistically significant
association between the non-audit fees and audit
committee effectiveness. Jeong et al. (2005)
(IJOA)
Investigate the relationship among audit
fees, mandatory auditor assignment and
the joint provision of Non-audit and auditor services.
Data from 2025 firm year observations of
companies listed on Korean Stock
Exchange for the period between 1999 and 2002.
(Korea)
Assigned auditors charge significantly higher audit fees
than freely selected auditors.
Joint provision of audit fees and non-audit fees does
intensify the relationship between auditor assignment and audit fees.
Suggest that mandatory auditor assignment may improve auditor independence.
Antle et al. (2006)
(RQFA)
Addresses the endogeneity issue by
modelling the confluence of audit fees,
fees for non-audit services and abnormal
accruals in a system of simultaneous
equations.
Data from 2,294 Firm year observations
from 25 industries for fiscal year 1994-2000 and 1,570 USA firms’ year
observations for fiscal year 1994.
(US)
Finds evidence consistent with knowledge spillover (or
economies of scope) from auditing to non-audit services and from non-audit services to auditing.
Do not find support for the assertion that fees for non-
audit services increase abnormal accruals.
Found that non-audit fees decrease abnormal accruals, which is attributed to the productive effects of non-audit
services.
Hay et al. (2006)
(JBFA)
Examines evidence in New Zealand as to whether auditors providing more non-
audit services are less independent.
1999-2001 data from top companies in New Zealand (177 for 1999, 224 in 2000
and 243 in 2001).
(New Zealand)
Found positive relationship between audit fees and non-audit fees.
No significant relationship between audit qualification or modification and non-audit fees.
There is no significant relationship between auditor change and non-audit fees.

101
Author(s)
(Publication)
Objective(s) of study Details of study
(Country)
Main findings
Wu (2006)
(CAR)
Presents a model in which both markets
for audit services and non-audit services
are oligopolistic.
Data from two oligopolistic markets: the
audit market ( CPA firms or auditors) and
the consulting market (consulting firms or consultants)
(USA)
The empirical implication of the result is that because of
competition-crossover effects between the auditing and consulting service markets, finding empirical evidence
for knowledge spillover benefit is likely to be difficult.
Control variables for “audit market concentration” concerned with competition-crossover effects and
“auditor expertise” concerned with knowledge spillover
benefits should be included in audit fee regressions to increase the power of empirical tests.
With regard to policy implications, the analyses help explain the impact of the Sarbanes-Oxley Act on
“market segmentation” and hence the profitability of
accounting firms.
Stein (2006)
(CAR)
To explain the theory/empirical
evidence gap on the knowledge spill-over.
2001 data from
3,053 firm year observations of publicly traded companies
(USA)
The results suggest that knowledge spillover benefits may be difficult to find because of the intermediating
effect of competition crossover.
Control variable for audit “market concentration” concerned with knowledge spillover benefit should be
included in audit fee regressions to increase the power
of empirical testing.
Che Ahmad et al. (2006)
( AAMJAF)
To examine the effect of non-audit services on audit fees, to investigate the
relationship between non-audit fees and
the issuance of qualified audit opinion and to analyse the proportion of non-
audit fees to total fees paid by a client to
its auditor.
2002 data of 819 public listed companies.
(Malaysia)
Found significant positive relationship between audit fees and non-audit fees and significant relationship
between non-audit fees and qualified audit opinions.
Finally, the descriptive analysis presents a worrying development regarding the high ratio of non-audit fees
to total fee.
Srinidhi and Gul (2007)
(CAR)
This study examines linkages between
the audit and non-audit fees and accrual quality.
2000-2001 data from a database compiled
by Standard & Poors from proxy
statements
(USA)
Results show that accrual quality has a significant
negative association with the magnitude of non-audit
fees but a significant positive association with audit fees.
This latter result is consistent with the proposition that higher audit fee reflects higher audit effort and better
judgments about the propriety of accruals, but is not
consistent with the proposition that audit fee is associated with economic bonding.
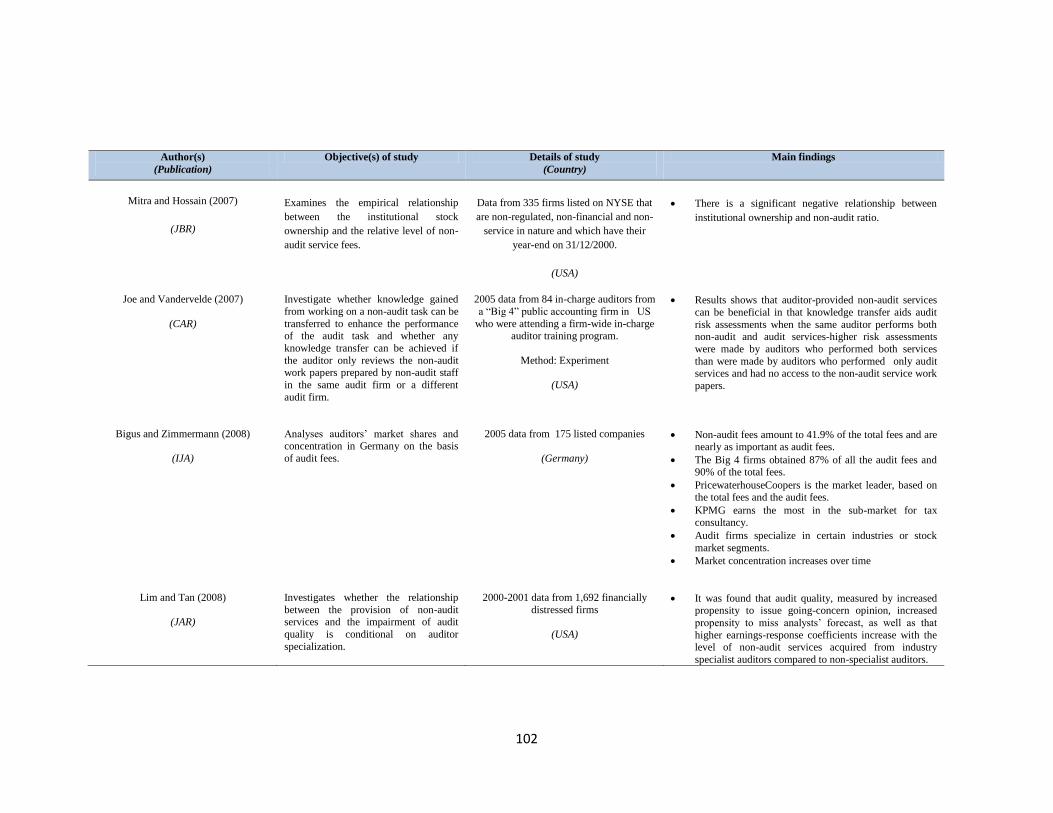
102
Author(s)
(Publication)
Objective(s) of study Details of study
(Country)
Main findings
Mitra and Hossain (2007)
(JBR)
Examines the empirical relationship
between the institutional stock
ownership and the relative level of non-
audit service fees.
Data from 335 firms listed on NYSE that
are non-regulated, non-financial and non-
service in nature and which have their
year-end on 31/12/2000.
(USA)
There is a significant negative relationship between
institutional ownership and non-audit ratio.
Joe and Vandervelde (2007)
(CAR)
Investigate whether knowledge gained
from working on a non-audit task can be
transferred to enhance the performance of the audit task and whether any
knowledge transfer can be achieved if
the auditor only reviews the non-audit work papers prepared by non-audit staff
in the same audit firm or a different
audit firm.
2005 data from 84 in-charge auditors from
a “Big 4” public accounting firm in US
who were attending a firm-wide in-charge auditor training program.
Method: Experiment
(USA)
Results shows that auditor-provided non-audit services
can be beneficial in that knowledge transfer aids audit
risk assessments when the same auditor performs both non-audit and audit services-higher risk assessments
were made by auditors who performed both services
than were made by auditors who performed only audit services and had no access to the non-audit service work
papers.
Bigus and Zimmermann (2008)
(IJA)
Analyses auditors’ market shares and
concentration in Germany on the basis
of audit fees.
2005 data from 175 listed companies
(Germany)
Non-audit fees amount to 41.9% of the total fees and are
nearly as important as audit fees.
The Big 4 firms obtained 87% of all the audit fees and 90% of the total fees.
PricewaterhouseCoopers is the market leader, based on the total fees and the audit fees.
KPMG earns the most in the sub-market for tax consultancy.
Audit firms specialize in certain industries or stock
market segments.
Market concentration increases over time
Lim and Tan (2008)
(JAR)
Investigates whether the relationship
between the provision of non-audit services and the impairment of audit
quality is conditional on auditor
specialization.
2000-2001 data from 1,692 financially
distressed firms
(USA)
It was found that audit quality, measured by increased propensity to issue going-concern opinion, increased
propensity to miss analysts’ forecast, as well as that
higher earnings-response coefficients increase with the level of non-audit services acquired from industry
specialist auditors compared to non-specialist auditors.

103
Author(s)
(Publication)
Objective(s) of study Details of study
(Country)
Main findings
Lee et al. (2009)
(IJA)
To examine whether audit report lags
decrease as auditor tenure increases and
to study whether the provision of non-audit services by external auditor
reduces report lags
2000-2005 data from
18,473 firms-years representing 15
industries
(USA)
Both audit tenure and non-audit services are negatively
significantly associated with ARLs.
Indicates that the longer the audit tenure, the more efficient auditors are in auditing their clients and the
more non-audit services they supply, meaning more learning, thus reducing audit delays.
Quick and Warming-Rasmussen (2009)
(IJA)
Investigate the influence of NAS on the perceived auditor independence.
2006 data from 98 survey responses from “Borsen-Team” an academic investment
club at Darmstadt University of
Technology
(Germany)
Shareholders generally perceive a negative effect on auditor’s independence if NAS are provided, especially
if NAS is provided by separate department of audit firm
Griffin et al. (2009)
( A&F)
Examines the association between
overseas and New Zealand governance
regulatory reforms and New Zealand companies’ audit and non-audit fees
Data from 653 company-year observations
for the period 2002-2007.
(New Zealand)
Found that audit fees increased in New Zealand over
2002–2006 and such increases associate reliably with the transition to and adoption of NZ IFRS and not with
earlier overseas governance reforms.
Also document a decrease in non-audit fees over the same period, but find no IFRS effect for non-audit fees.
Lu and Sapra (2009)
(AR)
Develop a theoretical framework to
investigate the determinants and
consequences of auditor Conservatism
in a capital market and implications of
Section 201 of SOX for auditor
conservatism and investment efficiency.
A theoretical paper: Model the interactions
between corporate decisions and investors’
decisions and assess how auditing
mediates these interactions.
By adjusting the mix of audit and non-audit fees,
companies with high business risk induce auditor
conservatism, while companies with low business risk
induce auditor aggressiveness.
The nature of investment inefficiency(over or under)
depends on its auditor attestation (conservative or
aggressive)
Mandatory restriction of non-audit services imposed by
section 201 increases audit conservatism, decreases a
conservative auditor’s audit quality and increases an
aggressive auditor’s audit quality, increases
overinvestment and decreases under-investments and
increases the audit fees.

104
Author(s)
(Publication)
Objective(s) of study Details of study
(Country)
Main findings
Ghosh et al. (2009)
(JAPP)
Examine the relationship between audit
and non-audit fees and capital market
perceptions of auditor independence
2001 - 2006 data of 21,797 firm-year
Observations (client of Big 5 auditor).
(USA)
Found that earnings response coefficients (ERCs) are
negatively associated with client importance, but there is
no evidence of an association between ERCs and non-audit fee ratio- investors perceive client importance, and
not non-audit fee ratio, as compromising auditors’
independence.
Further, when they decomposed client importance into
two components: audit fees and non-audit fees, from a given client as percentages of the total revenues of the
audit firm, they found that only the audit fee component
is significantly negatively related to ERCs- investors are concerned about perceived auditor independence when
client importance increases because of audit fees, but
not because of non-audit fees.
Lai and Krishnan (2009)
(A&F)
Study the association of non-audit
services with firm value.
Data from 562 firm-year observations for
sample 1 firms (mixture of companies buying/not buying the service) and 408 for
sample 2 firms that buy FIS-related
services from the incumbent auditors in
year 2000 or 2001.
(USA)
Found that the market value of equity is greater for firms that purchase FIS-related services from their
incumbent auditors relative to firms that do not.
The levels of FIS fees are found positively related to firm value after controlling for total other fees, or total
other non-audit fees.
Implication: Despite the negative perception associated
with non-audit services, investors regard FIS-related
services as value-adding activities.
Duh et al. (2009)
(RQFA)
Examines whether non-audit service
provision impairs auditor independence and whether the degree of auditor
independence in Taiwan changed in the
wake of the 2004 Procomp scandal
Data from 37 companies listed on the TSE
and the GreTai securities market for 2003 and 2004.
(Taiwan)
The results indicate that the non-audit fees ratio was significantly and negatively associated with audit
adjustment in 2003 (prior to the Procomp event) but not
in 2004 (after the event).
The coefficient of manipulation for 2004 was
significantly smaller than that for 2003. Using non-audit fees (rather than non-audit fees ratio) as an independent
variable yields similar results.
These findings have implications for the amendment of the CPA Law currently under deliberation in that
proscribing non-audit service may not be the only route
to strengthening auditor independence.

105
Author(s)
(Publication)
Objective(s) of study Details of study
(Country)
Main findings
Abidin et al. (2010)
(BAR)
Study the audit market structure, fees
and choices in a period of structural
change (1998-2003) in UK
Data from UK companies listed on Main
and AIM market of London stock
exchange (9,006 observations) for the
period 1998-2003.
(UK)
There has been significant upward pressure on audit fees
since 2001 for smaller auditees and audit fee income for
Big 4/5 did not change significantly, while the number
of auditees fell significantly.
Andersen’s demise reduced the level of inequality
among top tier firms, with PWC retaining its position as
the dominant firm. Former Andersen clients experienced
an initial audit fee rise broadly in line with inflation.
There are significantly lower Non-audit fees among the
companies.
Craswell et al. (2010)
(Conference Paper)
To estimate a supply and demand
system for the audit of Australian listed
companies by combining publicly
available data and proprietary data on
audit hours (using simultaneous
equation).
Data from 136 Australian listed
companies.
(Australia)
The results from the study suggest that the higher audit
fees obtained by suppliers of non-audit services result
from two influences: a shift to the right in the demand
curve and an upward shift in the supply-price function.
The benefits of any knowledge spillovers are offset by
higher prices representing economic rents.
Zaman et al. (2011)
(JBFA)
Examines the influence of audit committee effectiveness (ACE) as a
proxy for governance quality on audit
fees and non-audit fees using a new composite measure comprising audit
committee independence, expertise,
diligence and size.
Data from 135 companies (540 company year observations) of UK FTSE-350 in
2001-2004
(UK)
ACE has positive association with Non-audit service fee (NASF)
NASF is negatively associated with audit committee financial expertise and audit committee independence
and positively associated with audit committee size.
Board meeting, CEO-duality, board independence,
company size and Big 4 has positive association with
NASF.
Knechel et al. (2012)
(JBFA)
Examines whether auditor-provided
non-audit services generate
knowledge spillover, using a sample of
audits from New Zealand
2004-2005 data of 230 Firm year
observations of New Zealand listed companies.
A negative association between non-audit fees and audit
lag, thus suggesting the presence of knowledge
spillover. However, the knowledge spillover effect is
limited to the city office providing both the audit and
non-audit services

106
Author(s)
(Publication)
Objective(s) of study Details of study
(Country)
Main findings
Chan et al (2012)
(AF)
Examines whether independent audit
committee members’ board tenure
affects audit fees
1524 firm-year observations for the years
2005 and 2006.
(USA)
Find that audit fees are negatively associated
with the proportion of long board tenure directors on the
independent audit committee, consistent with the notion that audit committee members’ long board tenure
results in lower audit effort.
107
3.5 Chapter Summary
The objective of this chapter was to review prior literature on audit pricing. The
chapter begins with a discussion of the importance of audit pricing research as
identified by previous researchers such as Al-Harsani (2008), Gist (1992), Low
et al. (1990) and Hay et al. (2006). It can be summarised that the reason people
study audit fees is to evaluate the competitiveness of the audit market and
examine issues of contracting and independence related to the audit process. In
addition, knowledge in audit pricing could help clients in negotiating audit fees
and controlling the internal aspects to reduce their audit costs. On the other
hand, auditors could become more proficient in determining the appropriate
audit fee.
The discussion continues with a general review of audit pricing literature. In
1980, Simunic’s seminal paper introduced a model for audit fee determinants.
This model identified size, complexity, industry, audit risk, audit tenure and
auditor type as the key audit fee determinants. The model was used by many
later studies, with new variables added. Over the past 30 years, many other
determinants have been identified and added to the original Simunic model.
These determinants can be classified as client attributes, auditor attributes and
other attributes. Other determinants added recently by audit pricing researchers
include the Herfindahl index, ownership control, auditor location, SOX, the
effect of having two auditors, the effect of introduction of new standards, and
economic crisis.
The second part of the chapter discusses literature relating to governance
characteristics, including ownership structure, on audit fees. In terms of board
characteristics, literature relating to board independence, size and diligence is
discussed. This is followed by a review of literature regarding audit committee
characteristics, which includes audit committee effectiveness, size,
independence, expertise, diligence and commitment. This is followed by a
review of audit-pricing literature relating to ownership concentration, non-
executive share ownership and executive share ownership. The literature review
reveals the gap in audit pricing literature as prior studies only investigates the

108
relationship between governance characteristics in limited scope (only focus on
the board, audit committee or ownership structure structure). This part ends with
a summary of audit pricing and governance literature since the 1990s.
The third part of the chapter discusses the non-audit fees literature. First there is
discussion of the independence of the auditor, which seems to be affected by the
amount of non-audit services provided to the audit client. Prior to the Enron-
Andersen scandal, many studies investigated issues relating to non-audit fees.
However, the importance of such research was only realised after that scandal.
Studies post Enron found a continuous and worrying trend of high non-audit to
audit fee ratios. However, many studies failed to show conclusive evidence of
the relationship between lower audit quality and non-audit fees (e.g. Flankel et
al., 2002). Studies have also investigated instances of financial distress, seeking
to identify the relationship between auditor independence and going concern
and/or other modified audit opinions received by companies. However, most of
the studies found no significant relationship between non-audit fees and going
concern or modified audit opinions, which suggests that auditor independence is
not affected by the magnitude of non-audit services provided to their clients.
The discussion then turns to the relationship between non-audit fees and audit
fees, which has attracted much attention since the 1980s. The findings of prior
literature have been mixed, showing that the relationship between non-audit fees
and audit fees is inconsistent. Theoretically the relationship between non-audit
fees and audit fees should be negative due to “knowledge spill-over” effects.
Any saving made by the auditor as a result of carrying out less testing and
investigation will be passed on to the client, which will lead to lower audit fees.
Another reason for the negative relationship highlighted by prior studies is the
“loss leader”, whereby the auditor reduces audit fees to gain more lucrative
consultancy work from their client.
Despite the knowledge spill-over and loss leader theory, many studies have
found a positive relationship between non-audit fees and audit fees. The first
reason highlighted by prior studies for this positive relationship is the increase in
demand from the client for more audit service as the price per unit of the audit
109
services is reduced as a result of joint provision of audit and non-audit services.
Client specific events that require special consultancy services and at the same
time necessitate additional auditing are identified as the second reason for the
positive relationship between non-audit fees and audit fees. Third, as client
companies that require additional non-audit services are normally problematic
companies, joint provision provides the auditor with insider knowledge on client
riskiness, thus higher audit fees are charged to cover the higher subsequent
associated litigation cost. The fourth reason for the positive relationship is that
monopoly power is reflected in efficient provision of non-audit services, which
allows the auditor to charge a fee premium for the audit service. The last part
review studies that investigate the relationship between audit fees and details
non-audit fees. The gap is identified where a study using published data that is
more reliable is needed as prior studies only rely on suyvey response.

110
Chapter 4: Theoretical Background and Hypotheses
Development
4.1 Introduction
This chapter focuses on the theoretical background and the development of the
hypotheses of the study. The chapter starts with a discussion on the use of
agency theory as a basis for understanding the role of corporate governance and
its assumptions, which underpin the present research. The chapter continues with
the development of five hypotheses on the relationship between board
characteristics and audit fees. This is followed by development of another eight
hypotheses on the relationship between audit fees and audit committee
characteristics and then by discussion leading to the development of three
hypotheses on the relationship between audit fees and ownership structures. The
chapter continues with the development of hypotheses on the relationship
between non-audit fees and audit fees and also the effect of economic crisis on
the earlier relationship. In addition to examination of the relationship between
audit fees – along with governance characteristics, ownership structure – and
non-audit fees, which are the main focus of this study, the relationship between
other audit fee determinants used as control variables in this study is discussed.
4.2 Theoretical underpinning of the study
This study is heavily dependent on Agency Theory. This theory is rooted in the
work of Berle and Means (1932) on the separation of firm ownership from
management. Later, Jensen and Meckling (1976) identified the agency
relationship between principal (the owner, shareholder) and agent (the
management), whereby the principal engages the agent to perform services on
their behalf. According to Jensen and Meckling (1976), the management is
obliged to maximise the shareholder’s wealth for long-term survival of the
business. Therefore, some decision-making authority is given to the top
management to ensure smooth business operation. As a reward for their best
efforts in running the business, the management will be given good
remuneration package and incentives. This theory assumes a model of man
(manager) that is self-serving, individualistic and opportunistic in nature, who

111
prefers to maximise his own utility functions at the expense of the owners. As a
result, the theory is built on the assumption that there is almost always a
divergence of objectives between the goals of the management and those of the
shareholders.
Past studies (e.g Abdul Rahman, 2006; Arnold and De Lange (2004) have
highlighted possible problems that can occur in agency relationships. Abdul
Rahman (2006) identified two problems, namely adverse selection (where the
principal cannot determine if the agent is performing the work for which he is
paid) and moral hazard (where the principal is unsure as to whether the agent has
performed their work to their best ability, due to self-seeking motives). Arnold
and De Lange (2004), on the other hand, associate the agency problem with
different attitudes towards risk. Therefore, managers may not act in the best
interest of the shareholders but prefer actions which could maximise their
compensation, security, status and reputation. Timing of the main business
objective (profitability) is another issue. The management normally prefer profit
maximisation, which is short term in nature, to demonstrate success while the
shareholders prefer shareholder wealth maximisation (which could maximise the
share price, profitability and dividend payouts), which could maintain the
success of the company in the long run (Arnold and De Lange, 2004).
Watts and Zimmerman (1978) assume that individuals act to maximise their own
utility and consequently some managers’ decisions might reduce the welfare of
the principal as they are motivated by self-interest. Abdul Rahman (2006)
explained that the agency problem is aggravated by information asymmetry
which occurs when management have the competitive advantage of the
information within the business over the owners. Consequently, management are
tempted to place less emphasis on maximising shareholders’ wealth but focus
more on expanding the asset base, increasing turnover at the expense of long
term profitability and paying themselves higher salaries.
There are costs associated with the agency problem which arise from the conflict
between the principal (shareholders) and the agent (the management), such as
costs associated with monitoring management, creating and implementing an
effective incentive system and value destroyed by sub-optimal actions on the
112
part of the management (Abdul Rahman, 2006). Jensen and Meckling (1976)
categorise agency cost into monitoring costs, bonding costs and residual costs.
Monitoring costs are defined as the costs paid by shareholders to measure,
monitor and control the activities and behaviour of the management. Included in
these costs are the cost of appointing the board of directors to monitor
management’s activities and the cost paid to external auditors to verify the
accuracy of the financial statements prepared by the management. Bonding
costs, on the other hand, relate to the debt contract between the principal (the
lenders) and agents (the borrowers). It is the cost of establishing and complying
with the mechanisms of guaranteeing that the agent’s remuneration is based on
the principal’s expectations on how much the agent’s behaviour is likely to
oppose the principal’s interests. The costs incurred in these bonding activities
include those relating to the time and effort involved in producing quarterly
reports. Residual loss occurs because the costs of monitoring and bonding make
it impossible to identify or stop all self-interested behaviour by managers. It is
also argued that residual loss arises because the cost to overcome agency
problem would be more than the benefits derived from doing so (Abdul Rahman,
2006). Failure of the board of directors to exercise due care in their oversight
role over the management could cause agency cost. The best example of such an
occurrence is the Enron case. The failure of the company happened because
Enron’s board of directors did not properly monitor the company’s incentive
compensation plans, thereby allowing top executives to “hype” the company’s
shares so that employees would add them to their retirement plans (Abdul
Rahman, 2006).
As a conclusion, the main focus of the theory in the agency relationship is the
selection of an appropriate governance mechanism between principal and agents
to efficiently align the principal’s and agents’ interests, and hence minimise
agency costs. Therefore, a number of mechanisms have been devised to reduce
conflicts of interest and their impact on organizations (Abdul Rahman, 2006).
First, incorporating into the contract between the contracting parties as many
clauses as possible to simulate possible scenarios and attempt to provide for
them in the contract could reduce the conflict between these parties. Another
method of control includes linking management compensation to performance.

113
Reducing the free cash flow available within the organisation through debt
financing could also solve the problem as it reduces the possibility of
consumption of perquisites. Finally, increasing management’s stake in the equity
of the company could be another solution. It is suggested by Jensen and
Meckling (1976) that increasing management’s share ownership should align
their interests more closely with those of other shareholders.
This study focuses on the relationship between the internal mechanism
(including board of directors, audit committees and ownership structure) and the
external mechanism that is the auditor. Agency theory provides a theoretical
foundation to the study as it could explain the behaviour of the management and
the mechanism in place towards goal unity between the management and the
shareholders. The theory influences the formulation of the study hypotheses,
research methodology and statistical techniques used in this study. Popular
agency cost variables relevant to the study are examined. Relationships between
variables are explained first in the context of Agency Theory and then other
theories.
4.3 Development of Hypotheses: Board Characteristics and Audit Fees
The relationship between board characteristics and audit fees has begun to attract
interest from audit fee researchers. By the early 2000s, only a few studies had
looked at the issue (e.g. O’Sullivan, 1999; O’Sullivan, 2000; Peel and
Clatworthy, 2001; Carcello et al., 2002 and Tsui et al., 2001). More recently,
there has been slightly more research interest (e.g. Bliss et al., 2007; Boo and
Sharma, 2008; Zaman et al., 2011 and Adelopo and Jallow, 2012). The board
characteristic most frequently studied is the independence of board members as
successive governance reforms since the 1990s have emphasised the monitoring
potential of non-executive board members (e.g. Cadbury, 1992; Hampel, 1998
and Higgs, 2003, Combined Codes, 2000, 2003, 2006, 2008; UK Corporate
Governance Code, 2010, 2012). The existence of effective board could reduce
agency cost as an effective board stands as a good monitoring mechanism to
protect shareholders’ interests against misbehaviour of the management.
114
Board Independence and Audit Fee
Cadbury (1992), Hampel (1998), and Higgs (2003), various editions of the
Combined Code and the current UK Corporate Governance Code (2012) have all
emphasised the importance of non-executive representation on the board of
directors as a means of ensuring greater independence and impartiality in board
decision-making. Carcello et al. (2002) describe three factors which may
motivate independent directors to prevent and detect any opportunistic reporting
behaviour by management. First, the directors may seek to protect their
reputations as experts in monitoring, because the market for directors punishes
those associated with corporate failure or poor performance. Second, from a
legal liability perspective, directors who fail to exercise reasonable care in
discharging their monitoring responsibilities are liable to be subject to severe
sanctions. Third, shareholders often suffer significant losses in the wake of
financial reporting problems, so directors seeking to protect shareholder wealth
may seek a higher quality audit service. Past studies found evidence of an
inverse relationship between the percentage of outside directors and fraudulent
financial reporting (Beasley, 1996; Dechow et al., 1996).
As an internal governance mechanism, non-executive directors could contribute
to higher quality auditing in many ways. According to O’Sullivan and Diacon
(2002), increasing the non-executive representation on the board of directors has
the capacity for improving the quality of the audit process in the following three
respects:
a. External auditors are able to discuss matters arising from the audit
process with non-executive representative board members, free from
managerial influence. This is especially important if auditors seek to
question certain aspects of the preparation of the financial statements by
management or require further (more costly) testing in order to reach an
opinion on the quality of financial statements.
b. In negotiations with the external auditor, non-executives are expected to
place greater emphasis on the extent and quality of the audit rather than
on the cost, compared to executive directors.
115
c. Non-executives are expected to favour more extensive auditing in order
to complement their own monitoring responsibilities since they share
with auditors the objective of identifying and rectifying reporting errors
made by managers, deliberately or otherwise.
O’Sullivan and Diacon (2002) suggested that because of the factors listed above,
higher levels of non-executive representation are expected to result in higher
audit fees. The hypothesis is supported by studies in the UK, US and Hong
Kong, Greece and Malaysia which find that the proportion of non-executive
directors has a significant and positive impact on audit fees (O’Sullivan, 2000;
Carcello et al., 2000; Tsui et al., 2001; Leventis and Dimitropoulos, 2010; Bliss
et al., 2007; Bliss, 2011). However, O’Sullivan (1999) and Peel and Clatworthy
(2001) in their studies covering large UK companies in the post-Cadbury period
did not find any evidence that board characteristics influence auditors’ pricing
decisions. This could be due to the fact that improved board monitoring may be
counterbalanced by an increase in audit effort and the assurances demanded by
non-executive directors.
In recognition of the non-executive directors’ potential for improving monitoring
and also in ensuring high quality auditing and greater transparency of financial
reporting, the Revised Combined Code on Corporate Governance July 2003
requires the board to have a balance of executive and non-executive directors
(and in particular independent non-executive directors) such that no individual
or small group of individuals can dominate the board’s decision making. As per
earlier studies and theoretical expectation that it is expected that the presence of
a larger number of non-executive directors, especially independent non-
executive directors, on the board will lead to the purchase of a higher quality
audit and that is expected to lead to higher audit fees. Hence, the first two
hypotheses of the study are:
H1a: There will be a positive relationship between the proportion of non-
executives serving on a company’s board and the audit fee.

116
H1b: There will be a positive relationship between the proportion of
independent non-executives serving on a company’s board and the audit
fee.
CEO Duality
Another issue related to board independence is CEO duality – whereby the same
individual holds the positions of CEO and chairman. CEO dominated boards are
likely to exist when the CEO and chairman of the board are the same person. It
is argued that CEO duality upsets the balance of power among the top
management team and therefore increases the agency cost as CEO duality
restricts the board’s effectiveness in controlling managerial initiatives and in
decision-making since duality is assumed to increase information asymmetry
between the CEO and the board (Boyd et al., 2005, Desender et al., 2009).
Fosberg and Nelson (1999) state that firms with separated, clear-cut leadership
perform significantly better in the areas of strategy formulation and
implementation. This is supported by Farber (2005), who found that fraud firms
have a higher percentage of duality, which makes it difficult for insecure
directors to be honest when evaluating firm performance, thereby leading to long
term organisational drift (Carver, 2006). Bliss (2011) found that the positive
association between board independence and audit fee proxied for audit quality
is only present in firms without CEO duality. He suggests that CEO duality
constrains board independence. In the presence of a dominant CEO, non-
executive directors are expected to have reduced influence in seeking an
intensive audit (Desender et al., 2009) and as a result companies with CEO
duality are more likely to have lower demand for external audit services
(O’Sullivan, 2000), hence audit fees will be lower. A study by Tsui et al. (2001)
found that the negative association between audit fees and independent corporate
boards is stronger (weaker) for firms with low (high) growth opportunities. The
results have two implications; first, from a policy perspective, they demonstrate
that firms with CEO domination are associated with higher risk and higher audit
fees. Second, the findings provide evidence consistent with the contracting
theory that growth firms are associated with higher uncertainty, which in turn
makes monitoring of managerial activities more difficult. An independent
117
corporate board is likely to reduce this uncertainty and mitigate potential
opportunistic behaviour associated with high-growth opportunities. Independent
board members who are concerned about incurring legal liability which could
harm their reputations will support the external auditors in accomplishing their
assurance duties. Lee et al. (2004) examined the relationship between board
independence and auditor resignations and found that board independence is
negatively associated with the likelihood of auditor resignation.
On the other hand, companies with CEO duality may be perceived by the auditor
as having weaker internal governance, which might be expected to result in
higher audit fees. This is supported by a study by Bliss et al. (2007), who found
that the presence of CEO duality on boards is associated with higher audit fees.
Desender et al. (2009) found that in widely-held firms, board independence and
CEO duality are significantly related to audit fees, whereas in closely-held firms
the relationship is insignificant. They argued that controlling shareholders
encourage the board to focus on the provision of resources rather than
monitoring, while boards in widely-held firms have a stronger focus on
monitoring.
As a conclusion, the existence of CEO duality impairs the effectiveness of
internal control, hence increasing the agency cost. Therefore it is expected that
CEO duality will reduce board independence therefore will support the purchase
of lower quality audit. Hence, the next hypothesis of the study is:
H1c: There will be a negative relationship between the existence of CEO duality
and the audit fee.
Board Size and Audit Fee
Board size can be a determinant of the effectiveness of the board of directors in
terms of the performance of its monitoring and oversight functions. More
experienced and larger boards, comprising directors with a range of
backgrounds, knowledge and expertise, have the potential for greater
effectiveness and usefulness to the organisation as compared to smaller boards
(Vafeas 1999; Beasley 1996; Yermack 1996 and Jensen 1993).
118
On the other hand, bigger boards could also be associated with more bottlenecks
and sluggishness in decision making and, consequently, be more susceptible to
management whims (Adellappo and Jallow, 2008). Jensen (1993, p. 865) stated
that:‘as groups increase in size they become less effective because the
coordination and process problems overwhelm the advantages from having more
people to draw on’. Another disadvantage associated with larger boards relates
to less effective monitoring due to potential free riding, communication
breakdowns and inefficiencies (Dechow et al., 1996; Bushman et al., 2004).
Yermack (1996) provided empirical evidence consistent with these views to
demonstrate that companies with smaller boards have higher market value.
Correspondingly, Beasley (1996) found that the likelihood of fraud increases
with board size. Prior studies in the US (Boo and Sharma, 2008) and in the UK
(Adelopo and Jallow, 2008) found an insignificant relationship between audit
fees and board size. However, Chan et al. (2012), in a study based on 2005 and
2006 data in the US, found that board size has a significant positive relationship
with audit fees.
Therefore it is expected that bigger board size could increase agency cost due to
monitoring over the management becoming less effective. Drawing on the past
literature, and consistent with the risk-based perspective, the current study
expects larger boards to have a heightened risk of material misstatements;
consequently, they will require a more extensive audit. It is therefore expected
that board size, as defined by the number of directors on the board, will have a
positive relationship with audit fees. Hence, the next hypothesis of the study is:
H2: There will be a positive relationship between the board size and the audit
fee.
Board Diligence and Audit Fees
The other characteristics studied by Carcello et al. (2002) in relation to boards
were the diligence of the directors and the expertise of board members. The
diligence of the board is measured by the number of board meetings held, since
the behaviour of individual board members surrounding such meetings, which

119
includes preparation before meetings, attentiveness and participation during
meetings, and post-meeting follow-up, is not observable by the public.
Schedule C - that is the Disclosure of corporate governance arrangements in the
Combined Code (2010), amongst other things, recommends the disclosure of the
number of meetings held by the board and individual attendance by directors
(A.1.2). Meeting frequency could reflect board effectiveness as boards that meet
frequently are likely to be better informed and more diligent in performing their
duties (Goodwin-Stewart and Kent, 2006). This is supported by earlier
researchers, such as Lipton and Lorsch (1992) and Conger et al. (1998), who
found that boards of directors that meet frequently are more likely to discharge
their duties well. In addition, a board of directors that has frequent meetings has
more time to identify and discuss problems, and this is expected to lead to
superior performance of the company (Evans and Weir, 1995). Tauringana et al.
(2008) found a significant negative relationship between frequency of board
meetings and timeliness of annual reports for companies listed on the Nairobi
Stock Exchange (NSE) in Kenya. This indicates that companies which hold
meetings frequently publish their annual reports earlier, thereby enhancing the
company’s performance and providing evidence of an effective corporate
governance mechanism. Hence, it is expected that such companies will adopt a
more responsible attitude towards the shareholders, thereby reducing the agency
cost, which could consequently lead to the purchase of relatively higher quality
audit services, resulting in higher audit fees. Carcello et al. (2002) confirm that
high frequency of board meetings could indicate a higher level of control in the
company, leading to higher audit fees. Zaman et al. (2011) used number of board
meetings to control for board effectiveness and found a significant positive
relationship between audit fees and number of board meetings per year. The
above discussion leads to the third hypothesis.
H3: There will be a positive relationship between the number of board meetings
and the audit fee.

120
4.4 Development of Hypotheses: Audit Committee Characteristics and Audit
Fees
Audit Committee Effectiveness and Audit Fees
An Audit committee represents a governance mechanism that needs to function
effectively in order to limit potential agency conflict arising from the separation
of corporate ownership and control (Abbott and Parker, 2000; Jensen and
Meckling, 1976). Following the increased regulatory interest, especially
following the failure of big corporations, many studies have been undertaken to
examine the contribution of audit committees to auditing. Such studies include
that of Lee et al., (2004), who argue that audit committees may affect the quality
of auditing in several respects. First, the audit committee may demand that the
firm appoints a more knowledgeable auditor with a better reputation (see e.g.
Abbot and Parker, 2000; Chen et al., 2005). Second, the audit committee may
improve audit quality by demanding a greater amount of audit effort from the
incumbent auditor (e.g. Goodwin-Stewart and Kent 2006; Abbot et al., 2003;
Carcello et al., 2002). Audit committees may also increase the independence of
external auditors by providing support for auditors in potential disputes with the
firm’s management (see e.g. Knapp 1987; Carcello and Neal, 2000; DeZoort and
Salterio, 2001; DeZoort et al., 2003). Finally, audit committees may enhance the
integrity of audit reports by mitigating the potential threat of auditor dismissal
based on managerial motives (see e.g. Carcello and Neal, 2000; Lee et al., 2004).
The relationship between effective audit committees and the external auditor has
been studied by many researchers (e.g Zaman et al, 2011). Many studies have
been carried out to examine the relationship between audit committees and audit
fees, although earlier studies focused only on the existence of audit committees
and audit fees (Collier and Gregory, 1996; Goddard and Masters, 2000; Coulton
et al., 2001). To be more effective and efficient, audit committees should have
certain characteristics; hence, researchers later started to examine the association
between audit fees and audit committee characteristics and activities such as the
independence and expertise of committee members and frequency of meetings
(Carcello et al., 2002; Abbort et al., 2003; Sharma, 2003). Other characteristics
used to measure effectiveness of the audit committee are committee size.

121
Recently, the relationship between audit committee characteristics and audit fees
has been investigated further by, for example, Lee and Mande (2005), Goodwin-
Steward and Kent (2006), Vafeas and Waegelein (2007) and Hoitash and
Hoitash (2009).
Prior research (Goodwind-Stewart and Kent, 2006) explained that the
relationship between audit committees and audit fees is complex and affected by
both the demand for audit services by the client and the supply of audit services
by the external auditor. From the demand side, the presence of an audit
committee may have a positive association with audit fees by ensuring that audit
hours are not reduced to a level that compromises the quality of the audit. This
could reduce the risk of litigation and the loss of reputation in the event of
fraudulent financial reporting. From the supply side, the audit committee’s
involvement in strengthening the internal controls of the company may lead the
external auditor to reduce the assessed level of control risk. As a result of the
auditor’s reliance on internal controls, less testing will be carried out and this
could lower the audit fee (Collier and Gregory, 1996). However, an increase in
audit hours resulting from the need for audit partners to liaise regularly with
audit committees, attend audit committee meetings and prepare reports for the
committee could increase the audit fees. Furthermore, Goodwin-Stewart and
Munro (2003) find that audit partners and managers believe that the presence of
an audit committee has little impact on the level of audit testing but that audit
fees are greater as a result of the increase in partner and manager time.
A further reason for a positive relationship between audit fees and audit
committees is that an effective audit committee should reduce the threat of
auditor dismissal and therefore could strengthen the auditor’s bargaining
position during fee negotiation (Abbot et al., 2003). Other recent studies have
also found a positive association between audit committee characteristics and
audit fees (Lee and Mande, 2005; Goodwin-Steward and Kent, 2006; Vafeas and
Waegelein, 2007; Zaman et al, 2011). As one of the governance mechanisms to
reduce agency cost, it is expected that an effective audit committee will request a
higher quality audit to safeguard the shareholders from any financial
irregularities and fraud. As a result, there will be an increase in audit effort
122
which will lead to higher audit fees. Similar Zaman et al. (2011) this study uses a
composite measure for audit committee effectiveness on the following 4
variables: the size of the committee (at least 3 members), the independence of
the committee members (contains only non-executive directors), number of
committee meetings (a minimum of 3 meetings per year) and the existence of
expertise on the committee (at least one finance expert on the committee). The
6th hypothesis is as follows:
H4: There will be a positive relationship between audit committee
effectiveness and the audit fee.
Audit Committee Independence and Audit Fees
Agency theory suggests that the independence of the non-executive directors is
crucial to the effective performance of the audit committee’s monitoring
function. Many previous studies, such as Beasley (1996), Hudaib and Cooke
(2005) and Peasnell et al. (2005), have correlated the independence of directors
with audit quality as independent directors are normally more interested in
reducing the likelihood of fraud and earnings management. As a result, audit
committees comprising only independent non-executive directors are able to
exercise power over management and could demand greater audit scope to
ensure audit quality (Zaman et al., 2011). In the US, Abbott et al. (2009) and
Vafeas and Waegelein (2007) found that audit committee independence is
positively associated with audit fee levels, consistent with the notion that audit
committees serve as a complement to external auditors in monitoring
management. Utilising data for 2001-2004 from FTSE 350 companies in the
UK, Zaman et al. (2011) later also confirmed that audit committee independence
has a positive association with audit fees. In the UK, successive Codes of Best
Practice have clearly stated that audit committees should consist only of
independent non-executive directors. Results from Zaman et al. (2011) reveal
that 99% of their sample firms in 2004 had only independent directors on the
audit committee, showing that some companies were still not following the
requirements of the Combined Code of Corporate Governance (2003).
Motivated by this finding, and despite the existing requirement for 100%
independent director composition of audit committees, this study includes

123
measures for audit committee independence. It is therefore expected that audit
committee independence will have a positive impact on audit pricing. This
discussion leads to the following hypothesis:
H5: There will be a positive relationship between audit committee
independence and the audit fee.
Audit Committee Size
It appears that an audit committee’s size is a significant factor in ensuring its
effectiveness. As indicated by the BRC (1999), “Because of the audit
committee’s responsibilities and the complex nature of the accounting and
financial matters reviewed, the committee merits significant director resources”.
This is because a small audit committee will have an insufficient number of
directors available to serve on the committee, thus its monitoring capacity is
reduced (Vafeas, 2005). Alzoubi and Selamat (2012) suggest that a small audit
committee is not capable of fulfilling its duties efficiently as the given
assignments are always increasing. Due to the important contribution that can
be made by this committee, it is expected that many companies will have more
members than required on their audit committee. The larger the number of
members on the committee, the more effective it can be since each of the
members could contribute to the objectives and efficiency of the committee in
performing its roles, especially its monitoring role.
The benefit of additional members, however, must be weighed against the
incremental cost of poorer communication and decision making associated with
larger groups. In general, it is recommended that the size of the committee
should be limited to five (Levitt, 1998) or six members (National Association of
Corporate Directors (NACD), 1999). Previous studies have suggested that the
ideal audit committee size is either three or four members (Abbott et al., 2004;
Vafeas, 2005; Xie et al., 2003). The Codes of Best Practice in Corporate
Governance (2006) suggest an audit committee needs at least three members in
order to provide the necessary strength and diversity of expertise and views to
ensure appropriate monitoring. While the evidence is limited, it suggests that
size does matter. For example, Archambeault and DeZoort (2001) find a
124
significantly negative relationship between committee size and suspicious
auditor switches. On the other hand, Abbott et al. (2004) find no significant
association between audit committee size and earnings misstatements. However,
other studies, for example, Kalbers and Fogarty (1993), suggest that a large audit
committee is more likely to enhance the status and power of the audit committee
within the organisation and demand higher quality audits. In addition, Pincus et
al. (1989) suggest that as they have more resources, larger audit committees are
more likely to discover potential problems and therefore to fulfil their
monitoring role more effectively. Consequently, large audit committees are
expected to improve the quality of internal control as a result of enhanced status
and increased resources and hence to be more effective in fulfilling their
monitoring role (Zaman et al., 2011).
Vafeas and Waegelein (2007), using 2001-2003 data from 500 Fortune 500
companies, found that audit committee size is positively associated with audit
fees. However, Boo and Sharma (2008) found that the association between audit
fees and audit committee size is weaker for regulated companies. In the UK,
Zaman et al. (2011) found that audit committee size is positively associated with
audit fees. Based on demand perspective of the audit fees, it is expected that
audit committees with larger numbers of members will require higher quality
audits, resulting in higher audit fees. This discussion leads to the next
hypothesis:
H6: There will be a positive relationship between audit committee size and
audit fee.
Audit Committee Expertise and Audit Fees
Having a financial expert director on the audit committee could improve its
effectiveness, especially in relation to financial matters. It is expected that
financially knowledgeable members will be able to perform their oversight roles
more effectively, especially in relation to detecting material misstatements
(Raghunandan et al, 2001; Davidson et al., 2004; Defond et al., 2005). SEC
(2002) firstly defined expertise by emphasising knowledge of accounting gained
through extensive experience in the field. However, as a result of criticism of

125
this narrow definition, SEC (2003) broadened the definition of expertise beyond
accounting experience to also include experience in finance, financial statement
analysis or evaluation and supervision of accounting and financial executives or
personnel. The UK’s Corporate Governance Code specifies that at least one
member of the audit committee should have recent and relevant financial
experience. The code is not specific about what constitutes “relevant
experience”, but the Smith Report pointed out that it is desirable that the
committee member whom the board considers to have recent and relevant
financial experience should have a professional qualification from one of the
professional accountancy bodies.
Raghunandan et al. (2001) demonstrated that audit committees comprised solely
of independent directors and having at least one member with an accounting or
finance background are more likely to have longer meetings with the chief
internal auditor, are more likely to meet privately with the chief internal auditor,
more likely to review the internal auditing programme and results, and review
management’s interaction with internal auditing. In the same respect, DeZoort
and Salterio (2001) document that independent audit committee members having
relatively high audit knowledge are more likely to support the auditor in auditor-
management disputes over accounting policy. This is supported by Carcello et
al. (2006), who found a significant relationship between having a financial
expert on the audit committee and a lower level of earnings management and
this association is most pronounced when the designated financial expert has
prior work experience in accounting, for example, s(he) is a CPA, former CFO,
corporate treasurer or controller. Another study in the US (Vafeas and
Waegelein, 2007) found that audit committee expertise is positively associated
with audit fee levels. In addition, Krishnan and Visvanathan (2009) report that
as the percentage of financial experts on the audit committee increases, the
likelihood of disclosing internal control weaknesses decreases. As one of the
duties of the audit committee is to review financial reports prepared by
management, having financially literate and qualified audit committee members
on the board should lead to a more effective review. Hoitash and Hoitash (2009)
suggest that audit committees with more expertise are more likely to understand

126
complex accounting issues and demand higher assurance levels from the
auditors that the financial statements do not contain material misstatements.
Most of the prior research studying expertise is based on measurements of
expertise outlined by the recommendations of the BRC (Blue Ribbon
Committee, 1999) and SEC (2003). Previous studies have examined the
importance of expertise by means of various measurements. Carcello et al.
(2002) measured audit committee expertise using the number of other
directorships held by audit committee members, while Abbott et al. (2003a) used
the presence of at least one audit committee member with accounting or
financial management qualifications. However, recent studies, including those of
Hoitash et al. (2009), Carcello et al.(2008), Hoitash and Hoitash (2009), have
shown that classifying financial expertise in a more granular way can reveal
important insights on this matter. Hoitash and Hoitash (2009) highlighted the
importance of separating the two types of expert as recent evidence emphasises
the importance of distinguishing between diverse types of expertise due to
inconsistent evidence with regard to the contribution of experts without
accounting qualifications. Bedard et al. (2007), for example, found that both
accounting and supervisory financial experts are associated with better internal
control quality in their area of expertise. Similarly, DeFond et al. (2005)
observed a positive market reaction to the appointment of directors with
accounting expertise but not to those with other types of expertise. This is
further supported by Carcello et al. (2008), who found that designated financial
experts with accounting experience contribute to higher reporting quality but
that supervisory financial experts do not. In the same vein, Dhaliwal et al. (2006)
find that only accounting experts contribute to higher accrual quality, while
Krishnan and Visvanathan (2009) find that conservative accounting reporting is
positively associated only with accounting expertise. Therefore, this study
separates financial experts into supervisory financial experts and accounting
financial experts. A supervisory expert is an individual who has qualification as
a result of knowledge obtained through supervising accounting tasks (e.g. CEO).
On the other hand, an accounting financial expert is one who has an accounting
qualification gained through experience (e.g. CPA, CFO). Krishnan and
Visvanathan (2009) found financial expertise to be negatively related to audit

127
fees when the definition of expertise is restricted to accounting expertise. They
argue that accounting experts lower the overall audit risk and, therefore, auditors
value accounting experts for their potential to strengthen the effectiveness of
audit committees. In support of this finding, Hoitash and Hoitash (2009) report
that experts with supervisory experience demand a higher level of assurance in
comparison to accounting experts as they do not have the necessary experience
to understand complex accounting issues. Hence, in order to reduce the risk to
shareholders, they authorise additional audit work. On the other hand, experts
with accounting qualifications might be better negotiators and therefore able to
purchase the same level of assurance at a lower cost.
Financial experts might also seek to purchase additional services in order to
protect themselves (Hoitash and Hoitash, 2009). Better audit committees with
better financial knowledge and experience will demand higher audit quality in
order to avoid personal monetary and reputational loss (Abbott and Parker
(2000). Evidence from the US suggests that financial expertise is positively
associated with audit fees (e.g. Carcello et al., 2002; Abbott et al., 2003a).
Consequently, it is expected that having a larger number of directors with
financial knowledge and experience (financial expert) on the audit committee
may increase the committee’s demand for higher quality audits and this will lead
to higher audit fees being charged by the auditor. So, the next hypothesis of the
study is:
H7 : There will be a positive relationship between the number of financial expert
members of the audit committee and the audit fee.
Audit Committee Diligence and Commitment and Audit Fees
Audit committee diligence will be tested using the number of audit committee
meetings held per year as disclosed in the Annual Reports. An audit committee
that is eager to carry out its functions of control must maintain a constant level
of activity, so the Codes of Best Practice suggest three meetings a year (Cadbury
Report, 1992; Smith Report, 2003). McMullen and Raghunandan (1996) found
that audit committees of firms that are facing SEC enforcement actions or
restating their quarterly reports are less likely to have frequent meetings. The

128
committees of only 23 percent of these problematic companies met more than
twice a year compared to 40 percent for the other firms. Abbott et al. (2004) find
similar results in a more recent sample. Audit committees meeting more
frequently are expected to require higher quality audits, leading to higher audit
fees.
Recent studies in the US examining corporate governance in an audit context
have found that the number of meetings of the audit committee and the board
(Abbott et al., 2003, Abbott et al., 2004) and the financial expertise of its
members (Carcello and Neal, 2003) do indeed proxy for effective monitoring.
Abbott et al. (2003), for example, found that the numbers of audit committee and
board meetings, as well as the financial expertise of the audit committee, are
positively associated with audit fees. Using data for the year 2000 from 401
Australian public listed companies by way of combining survey and public data,
Goodwind-Steward and Kent (2006) also examined the association between
audit fees, effective audit committee and internal audit. The studies revealed a
significant positive association between the level of audit fees and audit
committee meeting frequency. However, the study also found a significant three-
way interaction between audit committee independence, expertise and meeting
frequency. Additional analysis by the study indicates that expertise is positively
associated with audit fees only when meeting frequency and independence are
low, implying that audit committees with accounting expertise demand a higher
level of audit assurance in these circumstances. Contrary to other researchers,
Adelopo and Jallow (2008) found a significant negative relationship between
audit committee meetings and audit fees in the UK. The study utilised data from
87 of the top 100 UK listed companies for the year 2006.
On the other hand, audit committee meetings not attended by members will
serve no purpose at all. It is expected that committed audit committee members
will form a highly effective audit committee which will demand more quality
assurance for financial reports presented by the management, hence leading to
higher audit fees being paid. The commitment of members is measured from
their individual attendance at meetings of the audit committee in any given year.
The above discussion leads to the next two hypotheses:

129
H8 a: There will be a positive relationship between the number of audit
committee meetings and the audit fee
H8 b: There will be a positive relationship between the percentage of attendance
at meetings by members of the audit committee and the audit fee.
4.5 Development of Hypotheses: Ownership Structure and Audit Fees
Previous studies such as Jensen and Meckling (1976), Keasey and Short (1999)
and Mitra et al. (2007) have suggested that the ownership structure in an
organisation matters as it could affect corporate monitoring and control.
Essentially, as ownership becomes more dispersed, direct monitoring by
shareholders becomes more costly and greater reliance on the audit as a
mechanism of governance is expected. Jensen and Meckling (1976) argued that
dispersed owners are more likely to anticipate opportunities for managers to
pursue their own interests at the owners’ expense. There are two sides to the
argument. From the managers’ perspective, aware of the shareholders’
perceptions of their credibility and transparency, they are expected to push for a
more comprehensive audit so as to signal their interest in the shareholders’
welfare (O’Sullivan and Diacon, 2002). From the shareholders’ perspective,
Chan et al. (1993) suggested that in widely dispersed ownership companies they
are more likely to rely on auditors as a means of managerial monitoring and this
indirectly leads to higher quality audits and higher audit fees.
On the other hand, the major shareholders in companies with more concentrated
ownership are more likely to be actively involved in monitoring managerial
behaviour, thus reducing the dependence on the auditor; hence audit fees are
lower. The results of past studies are mixed regarding the impact of large
blockholder on audit fees. In the US, Mitra et al. (2007) used the percentage
holdings of institutional investors as a measure of ownership structure and found
a negative relationship between large percentage shareholding and audit fees.
However, using the same measurement for his UK sample companies,
O’Sullivan (2000) did not arrive at the same result. However, another UK study,
Adelopo et al. (2012) found a significant negative relationship between the
number of multiple large shareholders (MLS) and audit fees. Using more
130
contemporary data this study expects that the ownership of large blockholders
will have a negative impact on audit fees as the existence of large blockholders
reduces agency cost, therefore reducing the need for an extensive audit. In line
with this thinking, the next Hypothesis is:
H9a: There will be a negative relationship between the ownership of large
blockholders and the audit fee.
Another type of ownership that could have an impact on audit fees is board
shareholding, particularly management shareholding. Chow (1982) suggests that
when managers own smaller equity stakes in their firms, they have increased
incentives to falsify financial disclosures as such information will be used by
shareholders in setting managers’ remuneration. Jensen and Meckling (1976)
suggest a solution to this by arguing that the conflict between shareholders and
management could be reconciled when managers possess an ownership interest
in their companies. As a monitoring mechanism, the external auditor acts as a
mediator to resolve the conflicts expected by agency theory to arise between
managers and owners of the business (Fan and Wong, 2005). If there is no
separation between management and the owner, no conflict would arise as
agency costs are eliminated. Consequently, unless required by law, no auditor
would be needed to observe or check the financial statement prepared as no
earnings management, fraud or other manipulation by management would occur.
However, whilst finding such an organisation nowadays is virtually impossible,
finding an organisation with a substantial proportion of management
shareholding is not. As their interest in the company increases due to a sense of
belonging, it is expected that the management in companies with high
management ownership will work hard to improve the company’s performance:
since higher performance means higher returns. In addition, there will be less
involvement in earnings management since there will be less tendency or
initiative to issue misleading information to the users of financial statements,
especially the shareholders. This train of events leads to greater company
success and higher quality of financial reporting and increases trust among
auditors regarding transparency.
131
However, the relationship between management ownership and firm
performance is not straightforward and has attracted much attention, especially
among corporate finance researchers. Early researchers such as Demsetz and
Lehn (1985) suggested a linear relationship between these two variables, while
later analyses considered a non-linear relationship (for example, Kole, 1995).
The issue of alignment and entrenchment plays an important role in shaping up
any relationship found. Short and Keasey (1999) found that at low levels the
shareholding by managers helps align the interests of managers and shareholders
to the extent that there is less divergence of resources from value maximisation.
However, at increasing levels of equity ownership, the manager’s consumption
of perquisites such as an attractive salary may outweigh the loss they suffer from
a reduction in the value of the firm. At a higher stage, managerial ownership
could lead to entrenchment as management have sufficient control to follow
their objectives without fear of disciplinary action from the other shareholders.
The study by Short and Keasey (1999) confirmed that UK management becomes
entrenched at higher levels of ownership as compared to its US counterparts.
Using information for taken-over companies between 1985 and 1996, Cosh et al.
(2006) found evidence that overall board ownership has a strong positive impact
on long run share returns and a weak positive impact on operating performance.
When board ownership is split into CEO, executive and non-executive, only the
relation between takeover performance and CEO ownership is significantly
positive. This could be explained by the argument that substantial share
ownership in a firm by board members can also result in a shift in conflicts of
interest from management-shareholders to management-minority shareholders
(Akhtaruddin and Haron, 2010). This is because, in line with entrenchment
theory, having higher management shareholdings means less risk of
retrenchment among managers and, consequently, outside shareholders’ ability
to monitor management is greatly reduced, which causes opportunistic
behaviour to increase (Akhtaruddin and Haron, 2010). This claim is supported
by the finding of Mak and Li (2001) that executive share ownership is negatively
related to board monitoring of management activities. Based on a sample of 124
public listed companies in Malaysia, Akhtaruddin and Haron (2010) later found
a negative relationship between board ownership and corporate voluntary
disclosure. However, the relationship is weaker for firms with higher proportions

132
of Independent non-executive directors on Audit committee. These results
support the notion that non-executive directors increase independence and could
possibly explain why Cosh et al. (2006) found no relationship between company
performance and executive share ownership, as non-executive directors
moderate the effect of executive shareholdings.
The impact on audit fees of having a higher proportion of managerial share
ownership should be viewed from two different perspectives. Looking at the
demand for audit services, the degree of management ownership is expected to
be negatively related with audit fees due to the demand for high quality audits
decreasing. This is supported by previous studies which found that at high levels
of ownership managers become entrenched (Sudarsanam et al., 1996) and prefer
to satisfy their own objectives at the expense of other shareholders’ interests;
thus they require a reduced audit. However, looking at the supply of audit
services, there are two possible scenarios. If the management share ownership is
seen by the auditor as affecting the independence of the board (leading to lower
disclosure and lower board monitoring), the auditor might charge a premium to
compensate for the higher associated audit risk. On the other hand, if the
assumption is that share ownership by the management could improve corporate
governance, this will reduce the need for a high quality audit, hence audit fees
will be lower. Studying the relationship between ownership structure and audit
pricing by utilising data from a sample of 402 quoted companies in the UK prior
to the adoption of the recommendations of the Committee on the Financial
Aspects of Corporate Governance (Cadbury, 1992), O’Sullivan (2000) found
that audit fees are negatively related to the proportion of equity owned by
executive directors and non-executive directors. Overall, O’Sullivan (2000)
suggested that non-executive directors encourage more intensive audits as a
complement to their own monitoring role, while a reduction in agency costs is
expected through significant managerial ownership resulting in a reduced need
for intensive auditing. The significant negative association between audit fees
and management ownership found in O’Sullivan (2000) is supported by two US
studies conducted in 2007. First, utilising data from 358 New York Stock
Exchange listed firms which were audited by Big Five auditors in the year 2000,
Mitra et al. (2007) found that managerial ownership is negatively associated
133
with audit fees. Utilising more recent data (2001- 2003) of Fortune 500
companies, Vafeas and Waegelein (2007) documented an inverse relationship
between audit fee levels and insider ownership. This suggests that insider
ownership acts as a substitute for external audit effort in monitoring
management. More recently, Gotti et al. (2012) found that management equity
holdings and analyst coverage are negatively related with audit fees. Based on
the above findings, it is expected that the percentage of equity owned by
executive directors will reduce the audit work, leading to lower audit fees. This
leads to the following Hypothesis:
H9b: There will be a negative relationship between the percentage of ownership
held by executives and the audit fee.
It is also interesting to investigate the relationship between Non-executive share
ownership and audit fees. The existence of non-executive directors on boards
could improve board independence, especially regarding monitoring the
behaviour of management. Resource dependence theory supports having more
independent directors on boards because of the expertise, prestige and contacts
they bring (Kesner and Johnson, 1990). Despite the obvious benefit of having a
majority of non-executive directors on the board as suggested by agency theory,
some studies have acknowledged certain drawbacks. The shortcomings
identified by researchers include the stifling of strategic action, excessive
monitoring and lack of the business knowledge needed to be effective
(Goodstein et al., 1994, Baysinger and Butler, 1985, Patton and Baker, 1987).
Demb and Neubauer (1992) question whether non-executive directors are
actually independent, which is especially relevant if these directors are former
employees of the firm or have a personal relationship with the management. If
opportunistic behaviour among executive directors can be reduced or eradicated
by giving them share ownership, as was suggested by Jenson and Meckling
(1976), the same can also be done in the case of non-executive directors as a
way of motivating them to enhance the company’s performance.
As compared to management ownership, very few studies appear to have
explored the effect of non-executive share ownership on business performance
(Swan and Honeine, 2010). Swan and Honeine (2010) concluded that listing

134
requirements of many countries, for example, the Australian Security Exchange
(ASX), do not encourage non-executive share ownership as they believe it will
affect non-executive independence. By contrast, New York Stock Exchange
(NYSE) listing rules do not treat stock ownership as a barrier to independence.
Utilising a unique panel dataset, they observed a sizeable positive relationship
between non-executive director ownership and firm performance. More
specifically they found that firms with a non-executive director with substantial
shareholding perform 29.7% better than otherwise. Consequently it is expected
that higher non-executive share ownership will lead to less audit work and hence
lower audit fees. O’Sullivan (2000) found that ownership by non-executive
directors exerts a significant negative impact on audit fees. Both the regression
results and the correlations suggested that non-executive ownership and
executive ownership affect audit fees in a similar way. This indicates that
nonexecutives possessing significant equity interests may also have business or
family links with the company and consequently behave in a similar way to their
executive colleagues. Based on the result of past studies it is expected that non-
executive share ownership will lead to less audit work and hence lower audit
fees. This expectation leads to the following Hypothesis:
H9c: There will be a negative relationship between the percentage of ownership
held by non-executives and the audit fee
4.6 Development of Hypotheses: Non-Audit Fees and Audit Fees
According to agency theory, external auditor is one of the mechanisms that
could reduce agency cost. It is expected that the provision of non-audit service to
audit client may affect auditor independence. Therefore, a negative relationship
is expected between audit fees and non-audit fees. Studies which find a negative
relationship argue that audit fees should decrease as a result of external
economic synergy arising from the provision of audit and non-audit services
and known as “knowledge spillover” (Simunic, 1984; Antle et al., 1997;
Whisenant et al., 2003). In addition, in a competitive environment where clients
have freedom of choice, the dismissal of auditors is common, and auditors may
regard reducing audit fees and recovering the loss by charging higher Non-audit
fees to the client as an alternative way to operate (Loss Leader Theory).

135
Despite the theoretical logic of a negative relationship between audit fees and
non-audit fees arising from the joint provision of audit and non-audit services,
many researchers have reported a positive relationship between the two. The
meta-analysis undertaken by Hay et al. (2006) demonstrates that the majority of
studies undertaken between 1977 and 2003 found a positive relationship
between non-audit fees and audit fees. The explanation for such a positive
relationship is that the joint provision of non-audit and audit services reduces the
price per unit of audit services and triggers the purchase of more audit service.
The alternative explanation is that client specific events such as mergers and
acquisitions, share issues, and implementation of new accounting and
information services generate demand for consultancy services and at the same
time these result in additional auditing. Furthermore, providing non-audit
services could expose to the auditor the real financial position of the client and
enable the auditor to price the relevant risk identified and accordingly charge
higher audit fees for problematic clients. Monopoly power, as reflected in
efficiency of non-audit service provision, also allows the auditor to charge an
audit fee premium (Hay et al., 2006), especially with accounting firms
increasingly promoting themselves as “one stop” service providers (McMeeking,
2006).
The inconsistent results of past studies on the relationship between non-audit
fees and audit fees as well as several changes that have taken place recently with
regards to the disclosure of non-audit fees, and the continuing concern among
many parties regarding the provision of non-audit fees by the auditor motivated
the current author to conduct a further investigation on this relationship using
more current data drawn from a bigger sample and including financial
institutions, which have mostly been ignored by previous studies. Previous
studies like Ezzamel et al.(2002) and Firth (2002) found positive relationship
between non-audit fees and audit fees, therefore this study also expects the same
relationship between audit fees and non-audit fees. This discussion leads to my
next Hypothesis:
H10: There will be a positive relationship between total Non-audit fees
provided by the auditor and the audit fee

136
4.7 Development of Hypotheses: the Effect of Economic Crisis
4.7.1 Governance Characteristics and Audit Fees
Many parties have blamed corporate governance as one of the reasons for the
recent economic crisis. Financial Times columnist John Plender writes “the
credit bubble was not just a simple market failure, but a failure of business
leadership, corporate governance and risk management, exacerbated by flawed
incentive structures within banks” (Plender, 2008) .
In the same vein, a report has pointed out that the 2008/2009 financial crisis can
to an extent be attributed to failures and weaknesses in corporate governance as
there was a failure in protection from excessive risk taking and irresponsible
behaviour (ACCA, 2009). The report later highlighted a few governance-related
reasons for the economic crisis. The first reason is dysfunctional boards that did
not fully understand the risks and impact associated with the strategies and
activities they approved. In addition, the boards did not provide adequate
monitoring of implementation, accounting, reporting and audit. The reason for
this is identified as lack of appropriately qualified non-executive directors with
the broad range of skills and knowledge required to fully understand the
complex financial and non-financial matters involved. Irresponsible ownership
also exacerbated the financial crisis as powerful shareholders did not play an
active enough role in improving governance. Remuneration systems that
encouraged short-term thinking and unsustainable risk taking at the expense of
longer term sustainability were another factor that contributed to the failure of
governance and hence to the economic crisis. It is suggested that the corporate
governance model needs changing and corporate governance practices should be
enhanced to restore confidence to markets. However, Barker (2008,p.9)
disagrees with this opinion and comments:
“The credit-crunch and the resulting crisis amongst leading financial
institutions are increasingly presented as a crisis of corporate
governance. However, although current problems are indicative of
shortcomings in the global financial architecture, they should not be
interpreted as reflecting dysfunction in the broader UK corporate
governance model. Consequently, it is essential that UK policy makers
focus their response to the crisis on the underlying source of the problem:

137
the financial regulatory framework (both in the UK and globally). They
should resist populist calls for more general corporate governance
reform”.
He also highlighted that the challenge for the future is to ensure that the UK
model of corporate governance remains an asset rather than a liability for the UK
business community.
UK corporate governance is guided by the Codes of Corporate Governance.
Since its establishment in 1992, the Code has been used widely and gained some
reputation. Indeed, it seems that there is almost a belief that complying with the
Code in itself constitutes good governance. However, the Code is only a
guidance in general terms to principles, structure and processes. It cannot
guarantee effective board behaviour and the boards have a lot of room within
the framework of the Code to decide for themselves how they should act.
However, running a corporate board successfully is extremely challenging and
demanding as it requires high quality efforts due to time and knowledge
constraints and the need to maintain mutual respect and openness between a cast
of strong, able and busy directors dealing with each other across the different
demands of executive and non-executive roles.
The financial crisis triggered a widespread reappraisal of governance systems
globally. In the UK the governance of banks and other financial institutions has
been reviewed (Walker Review, 2010) simultaneously with the revision of the
Code of Corporate Governance. Two principal conclusions were drawn by the
FRC from its review. First, that much more attention needed to be paid to
following the spirit of the Code as well as its letter. Secondly, that the impact of
shareholders in monitoring the Code could and should be enhanced by better
interaction between the boards of listed companies and their shareholders. The
Stewardship Code was then published in 2010 and revised in 2012 to provide
guidance on this interaction and with the aim to promote the long term success
of companies in such a way that the ultimate providers of capital also prosper.
Effective stewardship benefits companies, investors and the economy as a whole
(FRC, 2012). Following the Walker Review (2009) the UK Corporate
Governance Code was reviewed in 2010 and 2012. Many improvements were

138
made regarding boards of directors, especially in relation to their characteristics
and effectiveness. In addition, Guidance on Audit Committees was published in
September 2012 to assist company boards in making suitable arrangements for
their audit committees, and to assist directors serving on audit committees in
carrying out their role.
It can be concluded that regular revision and updating of the UK Corporate
Governance Code and Guidance on Audit Committees will allow identification
and enhancement of the principles that underlie effective boards and audit
committees, especially following the economic crisis. These revisions enhance
the quality of boards and audit committees as an internal monitoring mechanism,
therefore reducing agency costs. To complement this, the UK Stewardship Code
sets out the principles of effective stewardship by investors so that they can play
an active role towards success of the company. This is important because, as was
pointed out earlier, irresponsible ownership contributed to the financial crisis as
powerful shareholders did not play an active enough role in improving
governance. It is expected that the changes to the Codes will improve the
characteristics and effectiveness of the internal governance mechanism (board
and audit committee) and also the involvement of the investor in company
operation.
However, as discussed earlier, the Codes only provide guidance on best practice
but the implementation will be in the hands of the board and also the
shareholders. An online survey (Mckinsey, 2013) involving 1597 corporate
directors worldwide reveals that boards have taken to heart the new and higher
demands placed on them. However, some directors say that they feel ill
equipped to live up to these expectations because of inadequate expertise about
the business and the lack of time they can commit to their board duties. This
finding shows that the boards are under great pressure because many parties
have put huge responsibility on them to monitor the company properly. On the
other hand, the auditor, as another monitoring mechanism, is also under great
scrutiny and pressure, especially when most company failures (e.g. Enron,
WorldCom) have been blamed on auditors for failing to detect material
misstatement and errors before the companies went bankrupt. It is expected that

139
the auditor will conduct sufficient investigation and evaluation of the quality of
corporate governance of the company before determination of the extent of audit
procedure needed. This therefore will strengthen the relationship between audit
fees and governance characteristics. As a result, it is expected that the
relationship between audit fees and governance characteristics will be stronger
after the economic crisis (2010) than before the economic crisis.
H11a: The relationship between governance characteristics and audit fees is
stronger after the economic crisis.
4.7.2 Non-Audit Fees and Audit Fees Relationship
An independence auditor could monitor the behaviour of the management and
reduce agency cost. However, it is argued that the provision of non-audit
services may affect auditor independence. The literature review chapter and the
development of hypotheses for non-audit and audit fees have highlighted
changes that have been introduced on disclosure of non-audit services, total
prohibition of provision of non-audit services by the company auditor to their
audit client, and compulsory auditor rotation, especially after the economic
crisis. These changes have placed auditors under great pressure to maintain their
reputation and also their independence. This is supported by stronger governance
as a result of regular revision of UK Corporate Governance Code and Guidance
on Audit Committees especially following the economic crisis. Guidance on
Audit Committee (2008) for example contain detailed guidance for audit
committees regarding the approval of non-audit services, to ensure that the
independence of external auditor is not impaired. Therefore, it is expected that
auditor independence will be stronger after the economic crisis as a result of
these changes. Consequently, this study expects that the relationship between
non-audit and audit fees after the economic crisis will be stronger than the
relationship found before the economic crisis. This expectation leads to the next
hypothesis:
H11b: The relationship between non-audit fees and audit fees is stronger after
the economic crisis.

140
4.8 Control Variables
Consistent with previous audit pricing studies, this study includes other audit
fees determinants in the model to control for client related attributes such as
client size, complexity and also audit risk. Besides these, auditor related
attributes such as auditor size and location could also affect the audit fees they
charge to their audit client. Other attributes considered include report lag and the
seasons when the audit work is undertaken. Following is discussion of the
control variables.
Client Size
The most significant and consistent explanatory variable in determining audit
fees is the size of the company being audited. It is expected that the bigger the
company, the more audit effort is needed to audit the financial statements, in the
form of testing and analysis of data and information (Simunic, 1980; Firth, 1985;
Chan et al., 1993; Pong and Whittington, 1994; Simon, 1995; Firth, 1997;
Adams et al., 1997). Hence, the larger the company, the higher the audit fee
charged by the auditor. Prior studies have commonly used either total assets or
revenue as measurements of fee size. Of 111 research studies on the
determinants of audit fees, published up to 2003, 87 used total assets while 25
used revenues (Hay et al., 2006). Total assets is considered suitable for audit
firms that adopt an audit approach which is essentially balance sheet based,
while turnover may be a better explanatory variable for auditors employing a
transactions based approach to the audit (Chan et al., 1993). In this respect,
many studies (e.g. Low et al., 1990; Firth, 1997; Carson et al., 2004; Lawrence
et al., 2011) have found that the size of the client company as measured by their
total assets is the major factor in determining the audit fee. On the other hand,
other studies, which prefer to use the natural logarithm of annual net sales as a
measure of company size, also report a significant positively association
between client size and audit fees (e.g. Chan et al., 1993; Collier & Gregory,
1996; Owusu-Ansah et al., 2010). Total revenue may be superior to total assets
in the sense that it is not so susceptible to accounting policy choices, financial
structure and capital intensity of a company as is the case for the total assets
measurement (see Chan et al., 1993:766). Furthermore, in subsequent regression

141
models, a sales-based model may exhibit relatively lower heteroscedasticity than
an asset-based model (see Collier and Gregory, 1996:190).
However, Chan et al. (1993) stressed that both measurements of client size have
their drawbacks. For example, differences in total assets may be influenced by
the age profile of assets and choice of accounting policy, especially with regard
to fixed asset revaluations, treatment of goodwill and other types of assets. In
addition, using assets to represent size may be problematic due to its relationship
and subsequent interaction with complexity variables, especially those which
incorporate total assets directly into the calculation (e.g. inventory to total assets
ratio and debtors to total assets ratio). As for the use of revenue, differences in
the definition of revenue amongst different industries may affect subsequent
comparisons.
Economies of scale in the auditor’s production function and the likelihood that
larger companies will have more sophisticated internal control procedures
suggest that the relationship between auditee size and audit fees is unlikely to be
linear (Chan et al., 1993). This is supported by the findings of Carsons et al.
(2004). Using 1995-1999 data from 795 audit engagements in Australia, the
study presented evidence that audit fees are not linearly related to client size as
is typically assumed in audit fee models. In the US environment, O’Keefe
(1994) also found clear evidence that, ceteris paribus, audit effort is a concave
function of client size. In addition, the study also found that the documented
concave relationship between audit fees and size is caused partially by the
employment of a relatively large proportion of low-level (and therefore
relatively inexpensive) professional labour as clients increase in size. As a
conclusion, despite the strong argument that a bigger company is likely to have
stronger internal control mechanisms that will reduce the audit fee charged by
the auditor, the majority of past studies (from 1980-2003), as reflected in the
meta-analysis in Hay et al. (2006), have reported a significant positive
relationship between client size and audit fees. In his latest paper, Hay (2012)
confirms that client size was the audit fee determinant most consistently used by
researchers between 1980 and 2007.

142
Client Complexity
A second issue commonly addressed in audit pricing studies is the complexity of
the client company (e.g.: Low et al., 1990; Gist, 1992; Chan et al., 1993; Brinn
et al,1994; Pong and Whittington, 1994; Gist, 1994; Collier and Gregory, 1996;
O’Sullivan, 1999; Menon and Williams, 2001; O’Sullivan and Diacon, 2002;
Basioudis and Fifi, 2004; O’Keefe, 2004; Cameran, 2005; Mc Meeking, 2006;
Mat Zain, 2007; O’Sullivan, 2009). The level of audit effort may be expected to
increase due to the increased complexity of the audit task directly influencing
audit fees. The complexity of audit clients is normally associated with the nature
of their business, its location, the quality of internal controls, and the presence of
unusual transactions. Measurements commonly used to represent complexity
include the number of subsidiaries, the number of foreign subsidiaries, the
proportion of foreign assets, the number of standard industrial classification
(SIC) codes that apply to the business, the number of business segments, the
number of audit locations, and a subjective rating of complexity provided by the
audit team.
The number of subsidiaries is the measurement most commonly used in prior
work (Hay et al., 2006). As discussed in Chan et al. (1993), there are certain
reasons why a group of companies with many subsidiaries has to pay higher
audit fees as compared to a single company of comparable size. First, more
testing and audit effort is required to audit accounts across all subsidiaries,
which involves a variety of statutory and disclosure requirements. In addition, if
not all the subsidiary companies are audited by the same auditor, there may be
some inquiry costs involved in obtaining information and this could increase
audit cost. Besides, a group auditor should always pay particular attention to
intra-group transactions, taxation implications of pricing policy and the
existence of related party transactions, etc. Another point to stress is the
importance of protecting the interests of minority shareholders in the case of the
subsidiary company not being a wholly owned subsidiary. Finally, if the
subsidiary companies operate in a variety of different fields, this could also
complicate the auditing process since more substantial learning and expertise
costs will be incurred by the auditor. Maher et al. (1992), Brinn et al. (1994),

143
Chan et al. (1993), Pong and Whittington (1994), Gist (1994a), O’Sullivan
(1999), O’Sullivan (2000), O’Sullivan and Diacon (2002) and Basioudis and
Fifi (2004) all found that the number of subsidiaries has a significant positive
impact on audit fees in their sample of companies. This is supported by Hay
(2012), who found a strongly significant positive association between number of
subsidiaries and audit fees in his meta-analysis of audit fee literature published
between 1980 and 2007.
In the UK, O’Sullivan (1999) emphasised the importance of segregating
subsidiaries into foreign and local subsidiaries and his results show that foreign
subsidiaries have a greater impact on audit fees as compared to local
subsidiaries. O’Sullivan (2000) later further specified foreign subsidiaries as US
subsidiary or other non-UK subsidiaries. The study found a significant positive
relationship between all categories of subsidiary with audit fees. Consequently,
some studies have found the proportion of foreign subsidiaries to total
subsidiaries to be another important explanatory variable in explaining the
complexity of client companies, leading to the auditor charging higher audit fees
(Hay et al., 2006). The reason for this is that the existence of foreign subsidiaries
is expected to increase the monitoring and control costs as different offices of
the auditor firm, in different countries, take part in auditing the client (Chan et
al., 1993).
The industry in which the client operates also determines the audit fees charged
by an auditor as a common assertion made by auditors and researchers is that
some industries are more difficult to audit than others (Simunic 1980; Turpen
1990; Pearson and Trompeter 1994). Financial institutions and utilities, which
have relatively large assets, are generally easier to audit than manufacturing
companies, for instance, which have extensive inventory, receivables or
knowledge based assets (Hay et al., 2006). Another explanation could derive
from the differing nature of regulation in different industries. Focusing on the
insurance industry, O’Sullivan and Diacon (2002) find that insurers specializing
either in life or general insurance pay significantly lower fees than their
composite counterparts, suggesting that the audit of specialist insurers is less
complex and consequently consumes less audit effort. In their study, Low et al.

144
(1990) concluded that there are significant improvements in the explanatory
power of the audit fee model when industries are segmented into specific
industrial models. The study found that complexity variables were only
significant in the hotel industry. The two industries that have most frequently
been singled out in audit fee research are financial institutions (eight studies) and
utilities (15 studies) (Hay et al., 2006). Studies have typically found a reduced
audit fee for companies operating in regulated industries (e.g. Ezzamel et al.,
1996; O’Sullivan, 1999; O’Sullivan, 2000). Ezzamel et al. (1996) offer two
possible explanations for this finding on lower audit fees among regulated firms.
First, some of the regulated companies in their sub-sample were previously
publicly owned and may have been subject to a different level and ethos of
accountability, control and audit.Therefore, less risk is associated with them
hence resulting in a lower audit fee. Second, the majority of regulated
enterprises operate with a limited product range and usually on a national rather
than an international basis so less effort is needed to audit the company as
compared to a multinational manufacturer of a similar product.
As well as firm characteristics, the content and nature of financial statement
items can add to the complexity of the audit. Thinggaard and Kiertzner (2008)
argue that the nature of transactions, the accounting criteria for recognition and
measurement, and the degree of judgment necessary regarding the potential
importance of the outcome of future events may affect client complexity. In
addition, the ratio of the sum of inventories and receivables to total assets is
commonly used by researchers as a proxy for financial statement items that
require more attention from the auditor. Early researchers such as Firth (1985)
used this ratio to control for the complexity of audit clients. Using total
inventories, debtors and internally generated intangible assets over assets as a
proxy for financial statement items for which it is often difficult to obtain
sufficient and appropriate audit evidence regarding possible material
misstatement (labelled as complexity of substance), Thinggaard and Kiertzner
(2008) found a significant positive relationship between complexity and audit
fees. However, the study only found a significant effect for technical complexity
(represented by the square root of the sum of subsidiaries and associated
companies) among their small companies sample. The result implies that the

145
accounting technicality of consolidation has some weight in small companies
but, in large companies, traditional considerations of inherent risk in relation to
financial statement items are more important for the auditors, in line with audit
theory of materiality and risk. In the Malaysian environment, Che Ahmad et al.
(2006) also found that client complexity (proxied by total inventory and
receivables to total assets) is positively and significantly related to audit fees. On
the other hand, O’Sullivan (2000) used expenditure on research and
development as one of his proxies for complexity. The study found that
companies’ expenditure on research and development has a positive impact on
audit fees. The result is consistent with the argument that knowledge-based
industries are likely to require more intensive auditing due to the larger
proportion of intangible assets involved.
Other factors that can affect client complexity include the number of audit
locations and the ratio of foreign to total assets. Gist (1992) used the number of
audit locations visited by the auditor and the ratio of foreign to total assets to
proxy for client complexity. Based on survey data from 95 public companies
between 1983 and 1985 in the USA, the study found that the complexity of audit
clients is significant in explaining variability of external audit fees. In the same
year, Maher et al. (1992) also studied the effect of client complexity on audit
fees, during a period of greater competition in USA as a result of deregulation of
prohibition on client encroachment, client solicitation and advertising
prohibition. He used additional measurements of client complexity which
consisted of: two digit SIC codes, the number of subsidiaries, the ratio of foreign
assets to total assets, the ratio of receivables to total assets and the ratio of
inventory to total assets. He found a significant positive relationship between all
these variables as proxies for client complexity and audit fees. Despite different
definitions and the number of variables used to measure client complexity across
prior literature, all the studies document empirical results indicating that the
degree of client complexity significantly influences the audit fees charged by
auditors. These findings support the argument that complex and diversified
companies are charged higher audit fees as more audit labour, knowledge, and
effort are needed to satisfactorily complete an audit assignment.
146
Audit Risk
During an audit of a client company the auditor is exposed to risk. Risk occurs
when financial statements have been fraudulently prepared and include
falsification of financial records, intentional omissions of transactions,
misapplication of accounting principles and intentional omission of disclosures
of financial information. As described in Zhao et al. (2006), there is a difference
between audit failure and audit risk. Audit failure means that the auditor
provides an incorrect audit opinion for unfaithful financial statements due to
non-conformation to audit standards. Audit risk is the risk that the auditor may
unknowingly fail to express the appropriate opinion on financial statements that
are materially misstated. The main difference between audit failure and audit
risk is whether or not the auditor conforms to audit standards. As mentioned in
Wong (2009), results of a survey done by the Institute of Chartered Accountants
in Australia in 2003 show that there has been a dramatic increase in the cost of
insurance premiums purchased by audit firms to cover them against possible
claims arising if they issue the wrong opinion. As these insurance costs are a
significant expense for auditors, one way of compensating for this extra cost is
by increasing audit fees to their audit client according to the degree of riskiness
of the firm.
There are two forms of risk which are relevant to the auditor, business risk and
audit risk. Business risk is defined as risk related to the business, which relates
to the probability that an auditor will suffer financial or reputational loss in his
professional practice as a result of lawsuits, sanctions imposed by external
regulators, diminution of the auditor’s professional reputation, possible loss of
clients, time and costs incurred in defending the auditor’s position and the non-
realisation of audit fees (Jubb et al., 1996). Audit risk is defined as the risk that
financial statements may be materially misstated after the audit is completed and
an unqualified opinion issued (Arens and Loebbecke, 1994). The major
components of business risk for audit firms arise from client specific audit risk.
The higher the audit risk of the client company, the higher the business risk for
the audit firm.

147
The relationship between audit fees and audit risk is described by Cameran
(2005) as being much more complex than that between the other two attributes.
Since higher audit risk means higher business risk for the audit firm, the auditor
will try to provide for possible losses by charging extra fees to their client.
Consequently, the higher the audit risk, the more testing needs to be carried out
by the auditor and the higher the fees charged to compensate for the additional
work and the greater the risk of audit failure (Brinn et al., 1994). Bell et al.
(2001) found that high business risk increases the number of audit hours, but not
the fee per hour. This implies that audit firms perceive firm-level differences in
business risk and obtain compensation through billing additional hours, not by
increasing the hourly charge. When considering inherent risk, profitability and
leverage are among the common examples of audit risk. Generally, inherent risk
is measured based on accounting information and also based on market risk
measures. Using accounting information, the riskiness of a business is
determined by the value of inventory to total assets ratio, receivables over total
assets, inventory and receivable over total assets and current ratios. Simunic
(1980) was the first to recognise inventory and receivables as “risky” balance
sheet items that generally represent a material portion of the balance sheet figure
and could lead to an increase in the level of audit effort and at the higher risk of
a material misstatement of the items being missed by the auditor. However, it
was argued by Jubb et al. (1996) that the use of these measures of risk is
redundant with the proxy for complexity. This is because in the case of a more
complex auditee, its operations are more dispersed and it may be harder for the
auditee’s central management to maintain adequate control over their inventories
and receivables. Greater complexity leads to higher risk. Market risk, on the
other hand, takes into account the systematic risk (i.e. market beta). Most of the
earlier literature, such as studies by DeFond et al. (2000), Menon and Williams
(2001), Nieme (2002) and Simunic and Stein (1996), used accounting
information to determine risk. As compared to accounting based risk measures,
market based measures are not widely used, despite possessing desirable
properties such as being forward looking and not being affected by differences
in accounting practices. In addition, the capital asset pricing model (CAPM)
developed by Sharpe (1964), Lintner (1965) and Mossin (1966) suggests that the
correct measure for the systematic risk of a firm is the beta. Motivated by this
148
proposition, Nikkinen and Sahlstrom (2003) investigated whether auditors across
different environments actually access the systematic market risk in their audit
pricing decisions. The results of the study reveal that the market based risk
measure explains audit fees in addition to risk measures based on accounting
information. However, the model differs among countries, which could be due to
differences in cultural factors. Also, in using the market beta to measure risk,
O’Sullivan (2000) found that the beta has a positive impact on audit fees. The
result suggests that auditors charge a higher fee for auditing companies with
greater stock market volatility as volatility can lead to a financial distress
condition and subsequent investigation of the auditor’s work. As a conclusion,
the higher the inherent risk the higher the audit fees charged and, according to
Hay (2006), 71% of audit fees studies from 1980-2003 reported a significant
positive relationship between audit fees and various measures of inherent risk.
The profitability of a company can also be reflected in the riskiness of an audit.
Client profitability reflects the extent to which an auditor may be exposed to loss
in the event of a client not being financially viable and eventually failing
(Simunic, 1980). The weaker the performance of the firm, the higher the risk for
the auditor and the higher the audit fee expected to be charged (Van Caneghem,
2010). Loss by a client has become an increasingly important driver of audit fees
in recent years (Hay et al, 2006), in addition to measures of profitability. It is
expected that the audit fees will have a negative relationship with return on
assets (ROA) and have a positive relationship with the presence of a loss.
However, contrary to the above expectations, Nieme (2002) found that loss-
making Finnish firms pay lower fees than their better performing counterparts.
Nieme (2002) suggested this was due to the fact that the poor financial condition
of a company might increase fee pressure and prevent the auditor from raising
the audit fees.
Measures of leverage and liquidity may also be used to assess the risk of client
failure, which potentially exposes the auditor to a loss (Simunic, 1980).
Normally, leverage is used to measure long-term solvency and the liquidity
ratios (current ratio and acid-test ratio) measure short term liquidity. It is
expected that audit fees will have a positive relationship with leverage and a

149
negative relationship with the current and acid test ratios. However, Chaney et
al. (2004) found a negative relationship between leverage and audit fees for a
sample of privately held UK firms. It is argued that such a relationship is due to
the stricter monitoring by lenders, which leads to lower audit fees for those
companies with higher leverage levels. This is supported by Ang et al. (2000),
who argue that as leverage increases, the risk of default also increases and this
leads to more incentives for lenders to monitor the firm to avoid losses. Half of
the studies included in the meta-analysis by Hay et al. (2006) showed a highly
significant relationship between audit fees and leverage. Furthermore, based on
a classification of studies by country, it is suggested that leverage is a more
important determinant of audit fees in the United States and in the United
Kingdom than in other countries.
It is suggested by Houston et al. (2005) that business risk is composed of at least
three factors (acceptable audit risk, residual litigation risk and non-litigation
risk) and that auditors are compensated to act as auditors, provide insurance for
investor losses and bear risks associated with factors that extend beyond the
conducting of the audit. Bedard et al. (2008) examined the association between
audit fees and disclosure regarding effectiveness of internal control under
section 302 of the Sarbanes Oxley Act 2002. Despite the fact that auditors are
not required to evaluate internal controls under section 302, they found that
companies disclosing problems under this section pay higher audit fees and
continue paying higher audit fees in the following year. This is supported in a
study by Hoitash et al. (2008), who found that audit fees were positively
associated with internal control problems disclosed in the first year of
implementation of section 404 of the Sarbanes Oxley Act 2002. These two
studies provide detailed insights into audit risk adjustment during the initial
period of SOX implementation. In an investigation of whether the association
between financial reporting risk and audit fees changed during a period marked
by momentous and historic events for auditors in the wake of the Enron scandal,
Charles et al. (2010) found that the positive relationship between financial
reporting risk and audit fees strengthened significantly in 2002 and 2003,
consistent with a shift in the way auditors priced risk, in response to the events
surrounding the Sarbanes-Oxley Act of 2002. Companies experiencing
150
restatements are normally assessed by the auditor as having higher audit risk
than those with no financial problems. Using data from 228 US companies that
had financial restatements for 2003, Feldman (2009) investigated this matter and
also investigated whether subsequent remedial actions moderate the increase in
audit price resulting from the higher audit risk. The study found evidence that
audit fees are higher for restatement firms, compared with a matched-pair
control group of non-restatement firms. Recently, Doogar et al. (2010) studied
the transition effect to the new Auditing Standard (from Auditing Standard No 2
(AS2) to Auditing Standard No 5 (AS5)) in the US, using data from the years
2005 to 2008. It was found that AS5 audit fees are aligned with auditee fraud
risk but AS2 audit fees are not; hence, AS5 audit fees are greater for those
clients with higher fraud risk.
Initial Public Offerings (IPOs) can also lead to higher audit risk. There is a
possibility of opportunistic earning management by issuers in an attempt to
increase the offering price. It was found by Venkataraman et al. (2008) that
auditors earn higher fees for IPO engagements than post-IPO engagements. The
wedge between control rights and cash flow rights arising from the presence of a
dual-class share structure also could increase audit risk. Dual class shares exist
in firms having two or more classes of shares, with disproportionate voting
rights. It was found by Khalil et al. (2008) that audit fees and the wedge between
cash flow rights and control rights have a significant positive relationship. This
is due to the wider scope of such audits, since auditors perceive a higher level of
business risk in this kind of organisation.
Another factor that could play a crucial role in determining the auditor’s legal
liability is the legal environment. This prompted Choi et al. (2009b) to conduct a
study of the effect of cross listing on audit fees based on the three following
predictions. First, auditors charge higher fees for firms that are cross-listed in
stronger legal regimes than for non-listed firms. Second, when firms are cross-
listed in countries whose legal regimes are no stronger than those of their home
countries, the cross-listing premium exists if and only if cross-listing leads to a
significant increase in audit complexity. The third prediction is that for the firms
cross-listed in stronger legal regimes, the cross listing audit fees premium

151
increases (decreases) as the difference in the strength of the legal regimes
between the cross-listed foreign country and the home country becomes larger
(smaller). The subsequent empirical analysis supported the first and third
predictions only. The conclusion from this study is that cross-listing audit
premiums are associated with increased legal liability. Using data from 21,559
firms across 15 countries between 1996 and 2002, Choi et al. (2008) found that
the strictness of a country’s legal liability regime is an important fee-increasing
factor after controlling for the client firm-specific fee determinants and other
factors, such as macroeconomic variables. The other findings include the
existence of a Big 4 audit fee premium at a particular legal liability as the Big 4
charge higher audit fees as compared to non-Big 4 firms; however, the Big 4
premium decreases as the country’s legal liability regime becomes stronger.
They also found that the effect of legal regime on audit pricing and Big 4
premiums is more salient for small and medium-sized firms than for large firms.
Finally, Choi et al. (2008) also found that the marginal effects of most firm-
specific fee determinants on audit fees differ systematically between countries
with stronger legal regimes and countries with weaker legal regimes, suggesting
that the strictness of legal liability regimes is an important factor in explaining
variations in audit fee structure across countries with different legal
environments.
These findings are supported by Chan et al. (2008), who found that the increase
in audit fees among large foreign accelerated filers is negatively associated with
the strength of the legal environment in their home countries, implying that
auditors charge higher audit fees to compensate for the higher audit risk
associated with weaker legal environments. Laux and Newman (2010)
developed a theoretical model to shed some light on the implications of the legal
liability environment for the auditor’s decision to accept or reject risky clients
and the level of audit quality and audit fees in a setting in which the auditor
expends considerable resources on evaluating the prospective client prior to
making the acceptance decision. The main finding is that the relationship
between the strictness of the legal regime and the probability of client rejection
is U-shaped (rejection is higher for both weak and strong liability regimes as
compared to those with moderate liability regimes). It was also found that both
152
audit quality and audit fees increase as the auditor’s expected litigation loss from
audit failures increases.
Krishnan et al. (2009) studied the possibility that a company’s earnings forecast
policy is associated with audit fees. It is argued that auditors view clients that
make earnings forecasts as being associated with greater risk of earnings
management and litigation. Consistent with this argument, the study found that
companies issuing a greater number of earnings forecasts in a particular year,
making more precise forecasts and management earnings forecasts which are
more optimistically biased, pay higher audit fees.
Auditor Size
It is widely hypothesized that large audit firms demand higher fees (Cameran,
2005) and this could be due to the level of audit quality (DeAngelo, 1981), risk
factors due to higher exposure to litigation risk if the client company should fail
since bigger audit firms are perceived to be more wealthy (Mishari, 2008) and to
possess stronger brands, or due to their market power (Basioudis and Fifi, 2004).
However, contrary to the above assumptions, in a study among private firms, it
was found that auditees, on average, do not view Big 5 auditors as sufficiently
superior in terms of the perceived quality of the services provided to warrant a
fee premium (Chaney et al., 2004).
Results from several studies in many countries support the positive association
between audit fees and big audit firms (Taffler and Ramalinggam, 1982, Francis,
1984, Francis and Stokes, 1986, Chan et al., 1993, Anderson and Zéghal, 1994,
Pong and Whittington, 1994, Wang et al., 2009). However, some studies in
USA, Canada and UK have found no significant difference between fees paid to
big audit firms and non-big firms (Simunic, 1980; Brinn et al., 1994). Even
though the above studies show mixed results, combined results from 25 years of
audit fee studies show a strong association between Big 8/6/5/4 firms and audit
fees, with 58% of studies finding a significant positive relationship (Hay et al.,
2006). In his latest meta-analysis study, Hay (2012) found strong evidence that
big audit firms are associated with higher audit fees. While the majority of
previous studies have found a strong significant positive relationship between
153
audit fees and Big audit firms, some authors believe that the relationship
between the two variables should actually be negative (Cameran, 2005). The
rationale behind this is that a negative relationship between audit fees and
auditor size can be explained by the expected presence of greater economies of
scale in the costs of the larger auditors (Palmrose, 1986).
Some authors have investigated this positive result further and found that the
relationship differs between small and large auditee markets (e.g. Carson et al.,
2004). Studies from the early to mid-1980s (Simunic, 1980; Simon, 1986;
Francis and Stokes, 1986; Palmrose, 1986) found that auditor size is not
significant for very large companies with assets of over $600 million. For
relatively small companies with mean assets less than $100 million, auditor size
has a positive relationship with audit fees (Francis, 1984; Francis and Stokes,
1986; Palmrose, 1986; Francis and Simon, 1987; Lee, 1996; McMeeking et al.,
2006). One possible explanation for this result is that economies of scale offset
the price premium for Big auditors in the large client segment (Francis and
Stokes, 1986) and the positive relationship among smaller clients reflects the
effect of product differentiation of the auditor rather than the abuse of monopoly
power (McMeeking et al, 2006). However, recent studies from the 1990s and
2000s have found evidence that a Big 6 audit fee premium does exist among
listed companies and larger audit clients (Johnson et al., 1995; Gul, 1999;
Ireland and Lennox, 2002).
Some published literature has studied the effect of big audit firm premium in
different audit market segments. Nieme (2004) examined the effect of auditor
size among small Finnish audit firms. The results suggest that both size and
technical capability have a positive impact on auditor remuneration. Earlier
studies in Australia (e.g. Francis and Stokes, 1986), based on the large company
segment, observed no significant differences between large and small audit
firms, while in the small company segment, Big 8 firms charged significantly
higher audit fees than non-Big 8 firms. This result is similar to the findings of
Brinn et al. (1994), who studied big audit firm premiums in the UK. In the US,
Palmrose (1986) and Francis and Simon (1987) have also reported the existence
of a Big 8 audit firm premium with respect to smaller companies. Lee (1996)

154
found that in Hong Kong Big 6 firms charge higher audit fees in the small
auditee market than in the big auditee market. Gul (1999) found that audit fees
for Big 6 firms are higher than for non-Big 6 firms, among both larger and
smaller auditees in the Hong Kong audit market. In the 2000s, Sullivan (2002)
found that following the mergers in the UK of Big 8 to Big 6, there was evidence
of reduced marginal costs for auditing large clients as measured by patterns of
client switches following the mergers and no evidence that mergers were
anticompetitive. Reynolds and Francis (2001), however, found no evidence that
Big 5 auditors report more favourably for larger clients. Ireland and Lennox
(2002) found evidence of a premium being charged by large audit firms in the
United Kingdom, after modelling the selection of a large auditor by larger
clients. In a different environment, Basioudis and Fifi (2004) found a significant
relationship between size of business and audit fees for companies listed on the
Jakarta Stock Exchange in 2000.
Using data on UK listed firms collected over a longer period (1985-2002),
McMeeking et al. (2006) found that, based on partitioning of the sample by
client size, big firm returns are more significant in the small client sector due to
product differentiation. In investigating whether the Enron-Andersen affair in
the US had affected audit fees, Chi (2006) found evidence of higher fees for Big
4 industry specialists relative to non-specialist auditors but the result only
applies when the client is a small company. Abidin et al. (2010) studied audit
market structure, fees and choices in a period of structural change (1998-2003)
in the UK and found that there has been significant upward pressure on audit
fees since 2001 for smaller audit clients. In Greece, Owusu-Ansah et al. (2010)
studied the determinants of corporate audit fees following the liberalization of
the statutory audit market in the country. They found that size of the auditee and
particular hours spent on the audit engagement have a positive and significant
influence on the audit fees charged by the auditor. Lawrence et al. (2011)
examined whether differences in proxies for audit quality between Big 4 and
non-Big 4 could be a reflection of their respective clients’ characteristics. The
study found that the effects of Big 4 auditors are insignificantly different from
those of non-Big 4 auditors with respect to the three audit-quality proxies, thus
suggesting that differences in these proxies between Big 4 and non-Big 4

155
auditors largely reflect client characteristics, especially client size. A number of
studies have divided the audit market into second tier and local or regional firms.
In the US, Francis and Simon (1987) found a significant Big 8 audit premium in
both second tier national firms and local or regional firms. Similar results are
also observed in the UK market by Basiodis (2002).
Some studies have attempted to relate individual large accounting firms to the
existence of an audit fee premium (Balachandran and Simon, 1993; Anderson
and Zéghal, 1994; Simon, 1995; Firth, 1997; Langendijk, 1997; Simon and
Taylor, 2002). Firth (1997) reported that in general no Big 6 audit firm premium
applied in Norway as only Arthur Andersen accrued a premium. According to
Langendijk (1997), the Big 6 audit fee premium in the Netherlands is related to
KPMG. Simon and Taylor (2002) later reported a big audit firm fee premium in
Ireland, whilst further analysis revealed that the premium applied only to Price
Waterhouse and Coopers and Lybrand. Investigating the relationship between
audit fees and large audit firms in Italy, Cameran (2005) found that Italian
auditees pay more in order to engage a big audit firm. Further testing shows that
there are intra-Big audit fee differences and that the audit fee premium applies to
only one large international firm (KPMG) rather than to all large audit firms as a
group. In addition to auditor size, the size of a local branch office within an audit
firm could determine the audit quality and audit fees. In this respect, Choi et al.
(2010) found that office size has a significantly positive relationship with both
audit quality and audit fees, even after controlling for national-level audit firm
size and office-level industry expertise.
Auditor Location
Location of the auditor may have a significant impact on audit fees. The first
issue relating to location is geographical proximity. There are two possible
effects of auditor locality on audit fees. The first is that since geographic
proximity and familiarity facilitate information flow (Malloy, 2005; Francis et
al., 1999), the lowered information asymmetry between auditors and clients may
reduce audit risk and audit cost. These cost savings would allow local auditors to
charge lower audit fees. On the other hand, the information advantage and the
more effective communication channels that local auditors enjoy compared to

156
non-local auditors may lead to more effective monitoring, and thus, higher-
quality audits by local auditors. Higher audit quality could lead to the auditor
charging higher audit fees (Choi et al., 2008). Utilising data from 10,587 firms
between 2002 and 2005 in the USA, Choi et al. (2008) investigated whether and
how the locality of auditors or the geographical proximity between auditors and
clients affects audit quality and audit pricing. It was found that clients of local
auditors report significantly fewer abnormal accruals than clients of non-local
auditors and the audit fees paid to local auditors are lower than those paid to
non-local auditors. This suggests that the cost savings associated with local
audits are sufficiently large to outweigh potential fee premiums for high quality
local audits.
The other issue relating to location is the address of the audit firm itself. The
measurement commonly used to measure auditor location in metropolitan
centres, for example, London (UK), Amsterdam (Netherlands) or Oslo (Norway)
(Hay et al, 2006), is a dummy variable for auditor location. In the UK, Chan et
al. (1993), Ezzamel et al (1996), O’Sullivan (2000) and Chaney et al. (2004)
found a significant positive relationship between audit fees and whether the
auditor was based in London. Hay (2012) found that audit pricing studies that
have used this measurement, especially those conducted in the UK, show a very
consistent positive relationship with audit fee; therefore, he considers this
variable highly applicable to studies conducted in other countries, such as the US
and Australia.
Report Lag
Report lag is the elapsed time between the audit client’s financial year-end date
and when the audit report is signed off. It is sometimes interpreted as an
indication of the efficiency of an audit. A shorter time taken to audit could imply
greater efficiency of the auditor. On the other hand, the longer time taken is
likely to be because of the need for more audit testing and investigation. It is
predicted that audit fees will have a positive relationship with report lag (Hay et
al., 2006). In the UK, Chan et al. (1993), Ezzamel et al. (1996) and O’Sullivan
(2000) found a significant positive relationship between audit fees and the lag
between the year end and the date of the audit report. However, O’Sullivan

157
(1999) found no significant evidence that report lag has an effect on audit fees.
To extend the understanding about the determinants of audit report lag, Knechel
and Payne (2001) examined previously uninvestigated audit firm factors that
potentially influence audit report lag. Their results indicate that incremental
audit effort, the presence of contentious tax issues, and the use of less
experienced audit staff are positively correlated with audit report lag. However,
audit report lag is decreased by the potential synergistic relationship between
non-audit services and audit services.
Busy Season
It is predicted that auditing during the auditing busy season (normally at the
beginning of the calendar year) could lead to higher audit fees. However,
O’Sullivan (1999) and O’Sullivan (2000) found no evidence that auditing during
the busy season has a significant impact on audit fees. This is supported by Hay
et al. (2006), who found that of 32 studies between 1980 and 2003 that examined
the relationship between audit fees and busy season, only 5 reported a significant
positive relationship, 2 negative and the rest reported insignificant results.
Although the evidence to support that busy season audits are more costly is quite
mixed, Hay (2012) concluded that the variable is significantly and positively
associated with audit fees and such a measure should be included in further
studies.
4.9 Chapter Summary
The first part of this chapter provided a rich discussion on various internal
governance characteristics and their importance. Also discussed was the
relationship between governance characteristics and audit pricing previously
investigated by prior studies. However, the limited availability of contemporary
studies relating corporate governance with audit pricing was also pointed out.
The discussion then turned to the development of 17 hypotheses for assessing
the relationship between governance characteristics and audit fees.
The second part of the chapter discussed the developments that have taken place
in relation to non-audit fees, particularly since the recent increase in concern
among various parties regarding independence of the auditor in dealing with

158
pressure imposed by management, especially in those companies having
financial difficulties. These concerns have resulted in additional restrictions on
the provision of non-audit services by auditors to their audit clients and also the
publication of new accounting regulations and guidelines on procedures and
disclosure for non-audit services. The new requirements to disclose details of
non-audit services in financial statements provided a valuable opportunity for
this study to investigate further the relationship between non-audit fees and audit
fees and to assess the impact on audit pricing of each service individually rather
than having to bundle them together as was previously the case due to data
limitations. Five hypotheses were developed to test the relationship between
non-audit fees and audit fees. The study does not test all the non-audit services
individually as services such as audit of pension fund, SOX related services,
other services related to pension fund, and IT and actuarial related services are
too small in value and as percentages of total non-audit services to be considered
important.
159
Chapter 5: Research Methodology
5.1 Introduction
The objective of this chapter is to provide details of the research strategy, data
collection and the research design used. First, the research methods used in the
study are discussed in detail and justified. Second, the data used in the study and
the method of collection are provided, summarised in a table and explained in
the text. This is followed by details of the samples used, including sample size
and details of firms by Industry Classification Benchmark (ICB) industrial
sector. The means used to measure the dependent variable (LOGAUDIT) and
various audit fee determinants covering board characteristics, audit committee
characteristics and ownership structure are shown. The discussion of the
research design comprises an explanation of the control variables, including
measurement procedure and the expected relationship for each independent and
control variable. Where possible, variables and their respective measurements
are supported by past literature. Finally, the regression models, which are
basically an extension of Simunic’s (1980) audit pricing model, are presented.
5.2 Research Methodology
Past studies have identified two main research strategies, namely quantitative
and qualitative methods (Saunders et al, 2007; Bryman and Bell, 2003).
However, some authors (e.g. Craswell, 2003; Tashakkori and Teddlie, 2003)
have referred to a third approach, the mixed method, which is a combination of
the quantitative and qualitative approaches. Research strategy refers to the
method of data collection and analysis adopted in the study.
Quantitative research strategy favours a positivist epistemological orientation
(Bryman and Bell, 2003; Hennink et al., 2011). In short the quantitative research
approach involves quantifying a research problem, measuring and counting
issues and then to generalising the findings to a broader population (Hennink et
al., 2011). It employs scientific methods of identifying the research question and
sampling technique, with a strong theoretical framework. Questions developed
under this strategy are expressed in terms of hypotheses and estimation models
in the form of derived equations with which to test the hypotheses. The

160
hypotheses normally are tested using mathematical equations, statistical analyses
and econometric measurements. This method is also known as a “deductive”
approach to research. The data are normally collected using semi-structured
questionnaires or publicly available primary and secondary data. The outcomes
of a quantitative research normally lead to the identification of statistical trends,
patterns, averages, frequencies or correlations (Hennink et al., 2011).
One advantage of using quantitative research strategy is that it allows the
establishment of causal relationships between variables and provides important
insights into the interrelationships that could exist between very many variables
of interest and enhances the understating of their links (Bryman and Bell, 2003;
Vanderstoep and Johnston, 2009). As this method involves strict definition of
terms and measurement of variables of interest it allows the researcher to
measure what he sets out to measure and not another phenomenon. In addition,
the approach allows generalisation and replication of results and may improve
study validity and originality since mathematical and statistical tools used in this
method enhance the ability to make inferences and forecasts.
However, there are a few drawbacks of using this method. Adelopo (2010)
explore the limitation of this research method. First, the method has the
difficulty in finding suitable variables to capture the concepts of the study. This
is because the use of proxy variables for unobservable concepts is not equivalent
to measuring the actual variable itself. Wrong model specification such as the
exclusion of important variables, inclusion of irrelevant variables and
measurement errors either for the dependent or independent variables is another
common problem. Therefore, he concludes that the idea of using a proxy may
limit the impact of the established relationship and may cast doubt on the
validity of the result from such a study. This is because elements of subjectivity
are involved in determining the proxy or surrogate variables. These leave room
for wide variations in the choice of variables and their measurements and may
account for numerous inconsistencies in a number of quantitative studies.
Finally, the measurement validity and the choice of estimation techniques,
model specification issues and statistical tests conducted may be inappropriate.

161
Second, this research strategy have been criticized by interpretivists on the
grounds that it assumes that social sciences, whose primary focus is humans and
their social involvements, can be subjected to the same or similar methods of
analysis as the pure sciences.
On the other hand, qualitative research is guided by concepts from the
interpretive paradigm (Hennink et al., 2011). Therefore, an inductive research
approach where research questions lead to the formulation of theory and the
discovery of a pattern of behavior is preferred. Also, the values and perceptions
of the researcher are inevitably linked to the research itself. Qualitative research
is described by Hennink et al. (2011) as an approach that allows an examination
of people’s experiences in detail, by the use of a specific set of research methods
such as in-dept interview, focus group discussion, observations, content analysis,
visual methods, and life histories or biographies. In short, it uses the strategy that
captures the social dynamics of business, its internal constituents, environments
and stakeholders. This research strategy involves the use of data collection and
analysis methods that are considered to be most suitable for investigating a
social actor in a social setting. In other words, human dynamics are recognised
in every stage of the research process (Adelopo, 2010).
The key benefit of this method is the ability to explore and undertake an in depth
investigation of a social actor or phenomenon, therefore providing the
opportunity to make meaning of both spoken and unspoken responses, which
enables firsthand experience and interaction with the subject of the investigation.
For example, technique such as interviews and focus groups allow the
participant of the research to give a very detailed and specific answer
(Vanderstoep and Johnston, 2009). It is perhaps the closest representation of
reality. The inductive research approach also can be the pivot to the emergence
of a grounded theory, providing a more original insight is there.
However, this approach has generalisability and replicatability problems
considering no two individuals are the same in terms of feeling, emotional make
up and other individual uniqueness. In addition, the sample sizes are normally
small and non-random, and therefore the findings may not be generalised to the
larger population (Vanderstoep and Johnston, 2009). Another problem is the

162
possibility of bias arising from the researcher’s own values, culture and
perceptions. Inductive research method involves direct contact with people of
various ages and circumstances so the issues of consent, vulnerability and
participation might be another problem to be addressed.
The nature of the study itself is a very important determinant in choosing the
most suitable research method (Saunders et al, 2007). For studying certain issues
quantitative strategy is more appropriate; for example, in the case of collecting
data from senior management on corporate strategy or governance processes,
which is considered sensitive information. Such data could have been reliably
collected by previous research or could be publicly available through
government departments or agencies or through private providers and there is no
point in reinventing the wheel so long as the data is reliable and free from error
and bias. Constraints such as time and finance could also determine the research
method. Therefore, readily available secondary or published data are preferred
by most researchers due to considerations of time and cost effectiveness.
Based on these facts, this study uses a positivist epistemological stance with a
deductive approach, using only a quantitative research strategy. These
philosophical and strategic research choices are based on the nature of the
investigation as well as the fact that quantitative method is more cost effective
and less time consuming as compared to qualitatitive research strategy.
Therefore, the data collected for this study derives from published (the
companies’ annual reports) and secondary data (datastream).
5.3 Data Collection
Most of the data used in this study were obtained from the companies’ annual
reports for the years 2007 and 2010. The year 2007 is chosen to represent pre
economic crisis period because, a recent report (Bank of England, 2009)
indicates that the economic crisis started in 2008 in UK with UK real GDP fell
by 5.5% between 2008 quarter 1 and 2009 quarter 2 (Bank of England, 2009).
From early 2010 world economic recovery stabilised, the situation on the global
financial markets calmed down and crisis measures started to be withdrawn
(Berg, 2012). Therefore, the year 2010 is used to represent post crisis period.
The required annual reports were downloaded from the individual company’s
163
website and the filings section of Thomson One Banker. Most of the data were
hand collected from companies’ annual reports. The data were divided into three
categories: audit data, governance data and financial data. In order to obtain the
necessary information, various sections of the annual reports were utilised. Audit
fee and non-audit fee data were collected from the notes to the accounts listing
details of the remuneration paid to the company’s auditor. Almost all companies
involved in the study disclosed this information in the notes to the accounts for
operating expenses or operating profit. To comply with the requirements of The
Companies Regulations 2005, most of the companies disclosed details of audit
and non-audit fees paid to their auditor. This enabled the relationship between
audit fees and the individual components of non-audit fees to be studied. The
details of other audit data, such as the name of the auditor, audit report date, type
of opinion received and location of the auditor, were obtained from the
independent auditors’ report section of the annual report.
Governance data were collected from annual reports, in particular, the corporate
governance section. Board of directors’ profiles, remuneration reports,
governance statements, directors’ reports and audit committee reports were
analysed in order to obtain relevant governance information. The number of
directors on the board and also the number of non-executive directors was
calculated using the names disclosed in the board of directors’ profile, excluding
those who retired before the year end and also those appointed after the year end.
The names of the directors in the directors’ remuneration statement were then
crosschecked with those in the governance section of the annual report, which
normally states the number of directors and also any change of directors during
the year. Further analysis of the governance statements was done to determine
which non-executive directors were in fact independent of management. Most of
the companies stated clearly which directors were considered independent based
on the code of corporate governance. Information on CEO duality was another
item of data collected from the board of directors’ profile. CEO duality exists
when the chairman of the board and Chief Executive Officer position is held by
the same person. The number of audit committee members and the expertise
possessed by each member was collected from the audit committee report.

164
In order to collect information on board meetings and audit committee meetings,
the corporate governance report and sometimes the report of the audit committee
were checked. Most companies provided tables giving details of the attendance
of each member at board meetings and also committee meetings such as audit
committee meetings, nomination meetings and remuneration meetings. In the
absence of such a table, detailed reading of the corporate governance report
enabled the necessary information to be collected. Ownership information is also
related to corporate governance. Thus, the remuneration report was utilised to
determine the number of executive and non-executive directors holding ordinary
shares in the company. Most companies provided a table showing the share
ownership of the board. Care was taken not to include in the ownership of the
board the board members who had retired during the year In relation to
ownership, blockholder information was obtained from the directors’ report
under the significant share ownership section as the companies are obliged to
disclose the shareholders holding 3% or more of their shares.
Financial data for the study were obtained from Datastream. In cases where
figures were missing from the Datastream database, the companies’ financial
statements were checked to obtain the missing data. Table 5.1 below summarises
how the data were collected and the sources of the information.
Table 5.1 Data Collection and Sources of Information
Type of data Source
Audit fee data
Audit fees and Non-audit fees
Other audit data
Report Lag, Auditor Location
and Auditor size.
Notes to the financial statements under
operating expenses or operating profit
headings.
Annual report - Independent auditors’
report (Group)
Governance data
Board data
Audit committee data
Other data
Directors’ ownership
Blockholders’ ownership
Subsidiaries
Board of directors’ profile, corporate
governance statement, remuneration
report.
Audit committee report, corporate
governance statement
Annual report
Annual report
Annual report

165
Industry classification FTSE websites
Financial data Datastream and annual reports.
5.3 Sample Selection
The population of the study consists of all companies listed on the FTSE All
Share (UK) as at 31st December 2007, information which is available on the
FTSE website. Table 5.2 shows details of the sample companies. The initial
number of companies was 672, including investment companies. However,
investment companies were subsequently excluded as they are typically holding
companies, producing no goods and services but rather holding investments (or
shares) in other companies. This reduced the sample to 568 companies. Due to
outliers and other data restrictions, mainly relating to problems in obtaining
copies of some companies’ annual reports, the number of companies was
reduced to 492. The companies which were no longer listed in the London Stock
Exchange and also those that had moved to an AIM listing in 2010 were then
taken out, leaving the final sample of 384 companies. Total observations for the
two years is 768.
Unlike most prior audit pricing studies, this study includes financial institutions.
In the UK, all the prior audit pricing studies into the relationship between
governance characteristics and audit fees (e.g. O’Sullivan 2000; Peel and
Clatworthy, 2001; Adelopo and Jallow, 2008; Adelopo et al., 2009) have
excluded financial companies, while O’Sullivan and Diacon (2002) included
Insurance companies only. The rationale behind the inclusion of financial
companies in this study is that the recent economic crisis and the collapse of
banks and financial institutions have increased interest and concern regarding
the governance of financial institutions so it was felt important to include these
companies in the sample, especially as they have not been investigated
previously. Reasons commonly cited for the exclusion of this industry from
audit pricing literature are that the financial reporting format of Banks and
Financial Institutions is different from those of other types of companies and that
they operate in a regulated industry.
Table 5.3 shows the sample firms categorised by Industry Classification
Benchmark (ICB) industry sector. The sample firms are distributed among ten
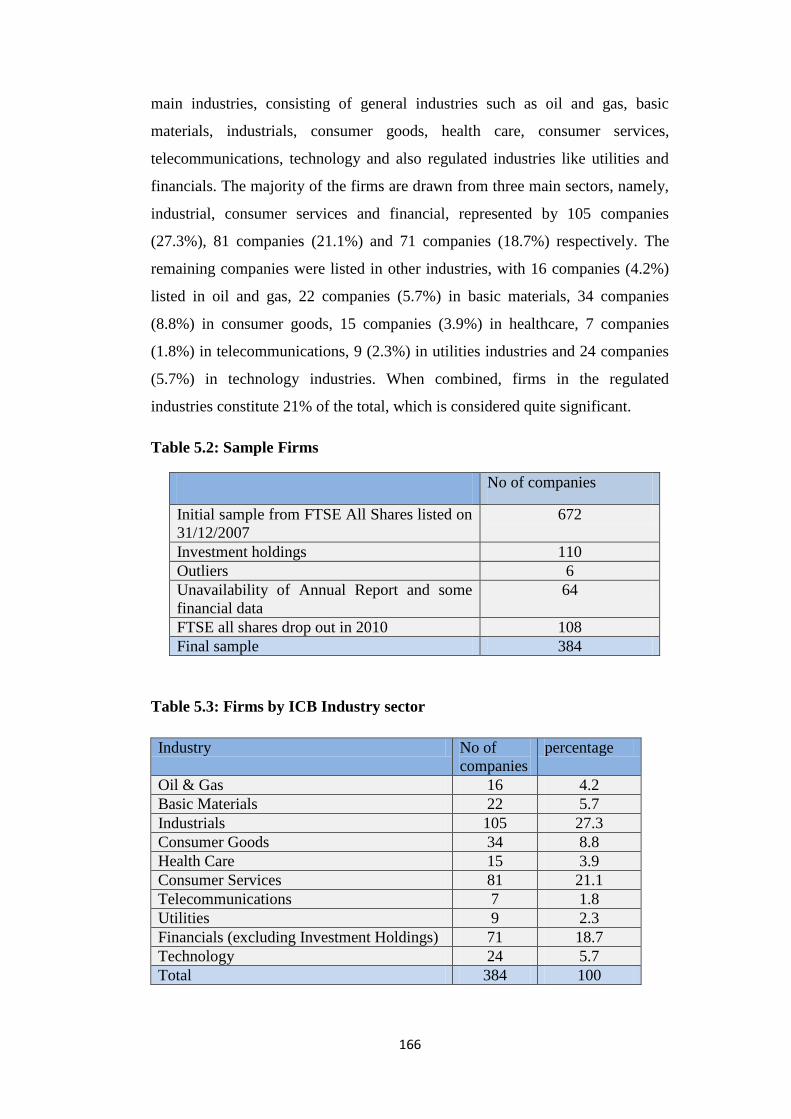
166
main industries, consisting of general industries such as oil and gas, basic
materials, industrials, consumer goods, health care, consumer services,
telecommunications, technology and also regulated industries like utilities and
financials. The majority of the firms are drawn from three main sectors, namely,
industrial, consumer services and financial, represented by 105 companies
(27.3%), 81 companies (21.1%) and 71 companies (18.7%) respectively. The
remaining companies were listed in other industries, with 16 companies (4.2%)
listed in oil and gas, 22 companies (5.7%) in basic materials, 34 companies
(8.8%) in consumer goods, 15 companies (3.9%) in healthcare, 7 companies
(1.8%) in telecommunications, 9 (2.3%) in utilities industries and 24 companies
(5.7%) in technology industries. When combined, firms in the regulated
industries constitute 21% of the total, which is considered quite significant.
Table 5.2: Sample Firms
No of companies
Initial sample from FTSE All Shares listed on
31/12/2007
672
Investment holdings 110
Outliers 6
Unavailability of Annual Report and some
financial data
64
FTSE all shares drop out in 2010 108
Final sample 384
Table 5.3: Firms by ICB Industry sector
Industry No of
companies
percentage
Oil & Gas 16 4.2
Basic Materials 22 5.7
Industrials 105 27.3
Consumer Goods 34 8.8
Health Care 15 3.9
Consumer Services 81 21.1
Telecommunications 7 1.8
Utilities 9 2.3
Financials (excluding Investment Holdings) 71 18.7
Technology 24 5.7
Total 384 100

167
5.4 Research Design and Measurement Procedures
The first objective of the study is to test the relationship between the internal
governance characteristics of sample companies and audit quality. Although
potentially many aspects of internal governance can be considered, this study
focuses on the impact of characteristics of the board of directors, audit
committee and ownership structure on audit quality as proxied by audit fees.
This study uses audit fee as the dependent variable. O’Sullivan (2000) provides
three justifications for the use of the audit fee as a proxy for audit quality. The
first justification is that audit fees reflect the extent of auditor investigation and
quality of staff used by the auditor. Second, existing audit pricing studies
acknowledge the link between audit quality and pricing by including a binary
variable to represent auditor type, with the expectation that big audit firms have
better quality auditors and charge an audit fee premium to reflect this (e.g. Chan
et al., 1993; Wang et al., 2009). Third, O’Sullivan (2000) stressed that the link
between audit quality and fees has been raised both by Cadbury (1992) and the
Chartered Accountants’ Joint Ethics Committee (1993) report, warning of the
likelihood that audit quality may be compromised by low fees.
5.4.1 Measurement for Independent Variables
Board Independence
Board independence is a continuous variable measured by the proportion of non-
executives on the board of directors. Prior studies in the US (Carcello et al.,
2002; Lee at al., 2004; Boo and Sharma, 2008) and in the UK (O’Sullivan, 1999;
O’Sullivan 2000; Peel and Clatworthy, 2001; Adelopo and Jallow, 2008) have
used the same variable to test the extent of board independence. It is expected
that the proportion of non-executive directors on the board will affect audit fees
as non-executive directors will be more concerned with the accuracy of financial
statements and thus higher quality audits will be required from the auditor,
leading to higher audit fees.
In the wake of increasing concern regarding the independence of the board, this
study also tests the independence of directors in terms of the proportion of
independent non-executives on the board. This is in line with the requirement of
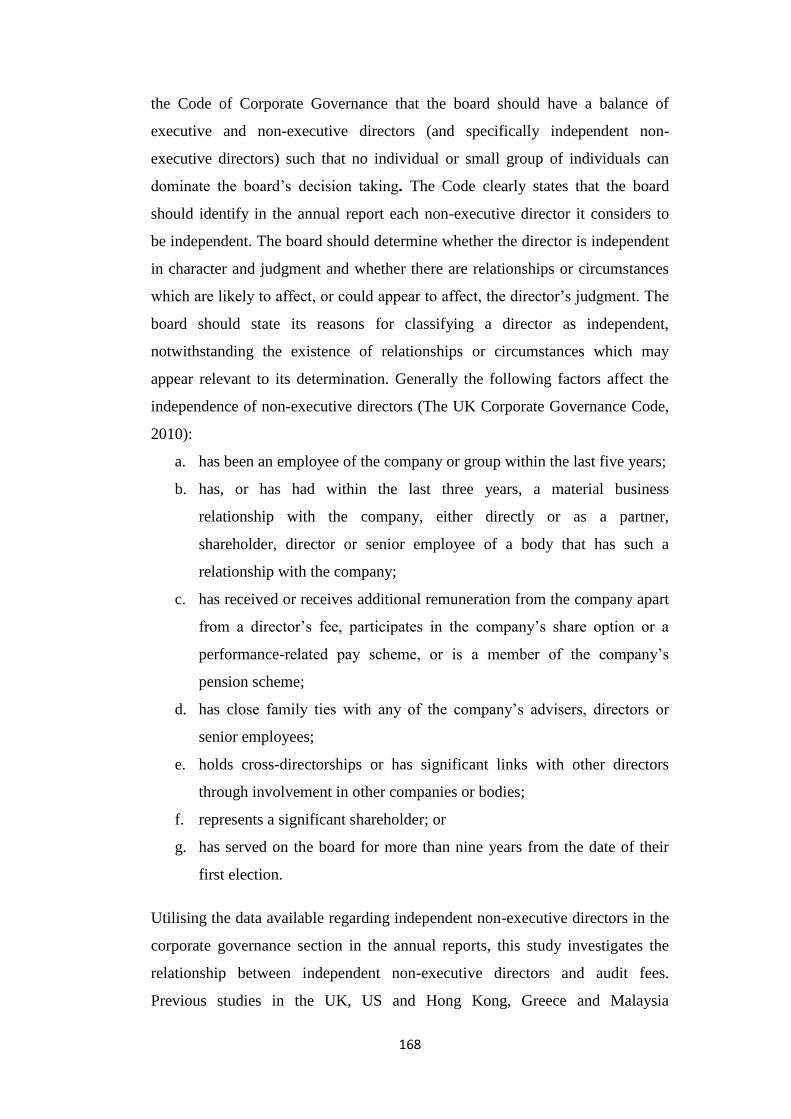
168
the Code of Corporate Governance that the board should have a balance of
executive and non-executive directors (and specifically independent non-
executive directors) such that no individual or small group of individuals can
dominate the board’s decision taking. The Code clearly states that the board
should identify in the annual report each non-executive director it considers to
be independent. The board should determine whether the director is independent
in character and judgment and whether there are relationships or circumstances
which are likely to affect, or could appear to affect, the director’s judgment. The
board should state its reasons for classifying a director as independent,
notwithstanding the existence of relationships or circumstances which may
appear relevant to its determination. Generally the following factors affect the
independence of non-executive directors (The UK Corporate Governance Code,
2010):
a. has been an employee of the company or group within the last five years;
b. has, or has had within the last three years, a material business
relationship with the company, either directly or as a partner,
shareholder, director or senior employee of a body that has such a
relationship with the company;
c. has received or receives additional remuneration from the company apart
from a director’s fee, participates in the company’s share option or a
performance-related pay scheme, or is a member of the company’s
pension scheme;
d. has close family ties with any of the company’s advisers, directors or
senior employees;
e. holds cross-directorships or has significant links with other directors
through involvement in other companies or bodies;
f. represents a significant shareholder; or
g. has served on the board for more than nine years from the date of their
first election.
Utilising the data available regarding independent non-executive directors in the
corporate governance section in the annual reports, this study investigates the
relationship between independent non-executive directors and audit fees.
Previous studies in the UK, US and Hong Kong, Greece and Malaysia

169
(O’Sullivan, 2000; Carcello et al., 2000; Tsui et al., 2001; Leventis and
Dimitropoulos, 2010; Bliss et al., 2007; Bliss, 2011) found a significant positive
relationship between audit fees and the proportion of non-executive directors.
Therefore this study expect a positive relationship between audit fees and both
measures of board independence.
CEO duality
CEO duality arises when the same individual occupies the positions of company
chairman and CEO. This study use a Binary variable: = 1 if CEO is also
Chairman of the Board and; = 0 otherwise to measure CEO duality. Prior
researchers in the UK, such as O’Sullivan (1999), O’Sullivan (2000) and Peel
and Clatworthy (2001), have included this variable in their studies as have
researchers in Hong Kong, France and Spain (Tsui et al., 2001; Desender et al.,
2009). Past studies have suggested that CEO duality constrains board
independence and in presence of a dominant CEO, non-executive directors are
expected to have reduced influence in seeking an intensive audit and as a result
companies with CEO duality are more likely to have lower demand for external
audit services (Bliss, 2011; Desender et al., 2009; O’Sullivan, 2000). Tsui et al.
(2001) found a negative relationship between audit fees and CEO Duality.
Therefore it is expected that the existence of CEO duality will have a negative
impact on audit fees.
Board size
Board size is a continuous variable measured by the number of directors on the
board. This measurement has been used by US studies (Boo and Sharma, 2008;
Chan et al., 2012) and also previous UK studies (Adelopo and Jallow, 2008). It
is therefore expected that board size will have a positive relationship with audit
fees. This is because Chan et al. (2012) found a significant positive relationship
betweent board size and audit fees.

170
Board diligence
Board diligence is a continuous variable measured by the number of board
meetings held during the year. One of the requirements of Schedule C of the
Combined Code 2006, dealing with the disclosure of corporate governance
arrangements, is the disclosure of the number of meetings of the board and
individual attendance by directors (A.1.2). A previous US study (Carcello et al.,
2002) and a UK study (Zaman et al., 2011) have used this measurement and
found a positive relationship between audit fees and board diligence. Therefore,
it is expected that the number of board meetings will have a positive relationship
with audit fees as diligent boards will demand higher quality audits, requiring
more audit assurance and audit hours, which will lead to higher audit fees.
Board Expertise
Board expertise is a continuous variable measured by the Percentage of non-
executive directors holding one or more other directorships in LSE listed
companies. This is because prior research, particularly audit pricing studies, (e.g.
Carcello et al., 2002) has typically based the measurement of board expertise on
multiple directorships held by the directors. The use of this measurement is
justified by Mace (1986), who suggests that outside directorships are perceived
to be valuable because they provide executives with prestige, visibility and
commercial contacts. O’Sullivan (1999), on the other hand, utilised number of
other directorships because of its potential to reflect the market’s perception of
an individual non-executive’s monitoring capability. Since the directors who
hold multiple directorships would suffer more reputational damage if the
company collapsed due to opportunistic financial reporting behaviour by
management, they are expected to provide a higher quality monitoring service
on behalf of shareholders. It is expected that the board expertise variable will
have a positive relationship with audit fees. This is because expert boards will be
more supportive of the purchase of higher quality audit services, resulting in
higher audit fees.
171
5.4.2 Audit Committee Characteristics
Audit Committee Effectiveness
Many past studies have measured audit committee effectiveness using a
composite variable consisting of audit committee independence and diligence
variables. Lee and Mande (2005) found a positive association between audit fees
and audit committee effectiveness in US listed companies. A year later, in an
Australian study, Goodwin-Steward and Kent (2006) used three-way interaction
between audit committee independence, expertise and meeting frequency.
Although they found the interaction between these variables to be significant,
they found that expertise is positively associated with audit fees only when
meeting frequency and independence are low. This may reflect that an audit
committee with accounting expertise demands a higher level of assurance in
these circumstances. In Malaysia, Mat Zain and Subramaniam (2007) also used
the form of interaction utilised by Goodwin-Steward and Kent (2006) and found
a positive relationship between Internal audit contribution to financial statement
audit and audit committee effectiveness. However, in New Zealand, Rainsbury
et al. (2009) found no significant association between the quality of the audit
committee and the quality of financial reporting. In the UK, drawing upon
recommendations in the Smith Report (2003), Zaman et al. (2011) based their
composite measure for audit committee effectiveness on the following 4
variables: size of the committee (at least 3 members), independence of the
committee members (contains only non-executive directors), number of
committee meetings (a minimum of 3 meetings per year) and existence of
expertise on the committee (at least one finance expert on the committee). An
audit committee is only considered effective if all four criteria are met. A
dummy variable is used to indicate the fulfilling of this condition where Binary
variable;= 1 if all audit committee members are non-executive directors, at least
one member has relevant financial expertise, meet at least three times a year and
having minimum size of three audit committee members;= 0 otherwise. Inspired
by Zaman et al. (2011), this study uses the same method of measurement for
audit fee effectiveness. Zaman et al. (2011) found a positive association between
audit committee effectiveness and audit fees; and this study expects the same
172
finding as an effective audit committee will demand a higher quality audit from
the incumbent auditor.
Audit Committee Independence.
Studies in the US and UK, including those of Abbott et al. (2009), Vafeas and
Waegelein (2007) and Zaman et al. (2011), found that audit committee
independence is positively associated with audit fee levels, consistent with the
notion that audit committees serve as a complement to external auditors in
monitoring management. Both Abbott et al. (2009) and Zaman et al. (2011) use
a Binary variable; = 1 if all audit committee members are non-executive
directors; = 0 otherwise. However, in contrast, Vafeas and Waegelein (2007)
used a binary variable 1 to indicate the presence of at least one insider on the
committee, =0 otherwise. This study uses a binary variable similar to that used
by Abbott et al. (2009) and Zaman et al. (2011), namely, = 1 if all audit
committee members are non-executive directors; = 0 otherwise. It is expected
that audit committee independence will have a positive association with audit
fees as directors who are independent of management will require a higher
quality audit, which will lead to higher audit fees.
Audit Committee Size
Audit committee size is a continuous variable measured by the number of audit
committee members. According to the Combined Code of Corporate
Governance, Schedule C.3.1, the board should have an audit committee
consisting of at least three or in the case of smaller companies two members,
who should all be independent non-executive directors. Previous studies such as
Pincus et al. (1989), Kalbers and Fogarty (1993), Vafeas and Waegelein (2007),
Zaman et al. (2011) have used this measurement to measure audit committee
size. It is expected that larger audit committees will demand higher quality
audits, resulting in higher audit fees.
Audit Committee Expertise
Audit committee expertise is measured by three different measurements. First,
audit committee overall financial expertise is measured by the number of audit

173
committee members with overall financial expertise as well as a dummy variable
indicating instances where the audit committees fulfil the requirement of having
a financial expert. The current SEC definition for financial expertise is used to
measure the audit committee’s financial expertise. Therefore, members with
work experience as a certified public accountant, auditor, chief financial officer,
financial comptroller or accounting officer and also those with work experience
as an investment banker, financial analyst, or in any other financial management
role and/or as a chief executive officer, chairman or company president are
considered as having general financial expertise. This study expects a positive
relationship between audit fees and the number of financial expert. This is
because, having a larger number of directors with financial knowledge and
experience (financial expert) on the audit committee may increase the
committee’s demand for higher quality audits which will lead to higher audit
fees. This is supported by evidence from the US whixh suggests that financial
expertise is positively associated with audit fees (e.g. Carcello et al., 2002;
Abbott et al., 2003a)
The SEC definition of financial expert suggests that the term financial expertise
could entail accounting and finance expertise, as well as any expertise in the
preparation of financial statements. Therefore, the second measurement used is
audit committee accounting expertise. It is again a continuous variable measured
as the proportion of audit committee members with accounting expertise. The
notion of accounting expertise is measured by using a strict definition proposed
by the SEC and later used by Krishnan and Visvanathan (2008), Krishnan and
Lee (2009) and Dhaliwal et al., (2010). The SEC defines the accounting expert
as ‘a member with experience as a certified public accountant (CPA), auditor,
chief financial officer (CFO), chief financial controller or chief accounting
officer’. The Audit committee non accounting expertise is also a continuous
variable measured as the proportion of audit committee members with non-
accounting expertise i.e. finance and supervisory expertise. This would include
members with work experience as an investment banker, financial analyst, or
experience of supervising the preparation of financial statements (e.g. chief
executive officer or company president). Davidson et al. (2004) and DeFond et
al. (2005) have used the same measurement to measure audit committee

174
supervisory expertise. The biographical data disclosed in the annual reports for
members of the audit committee was perused to identify those serving on other
audit committees and with financial expertise, i.e. accounting and non-
accounting expertise. This study expects a positive relationship between audit
fees and supervisory financial expert and negative relationship with accounting
financial expert. This is supported by findings of Krishnan and Visvanathan
(2009) and Hoitash and Hoitash (2009) who report that experts with supervisory
experience demand a higher level of assurance in comparison to accounting
experts as they do not have the necessary experience to understand complex
accounting issues.
Audit Committee Diligence and Commitment
Audit committee diligence is a continuous variable measured by the number of
or frequency of audit committee meetings held. Other studies that have used this
measurement include Menon and Williams (1994), Carcello et al. (2002) ,
Hoitash and Hoitash (2009), Abbott et al.(2003a), Goodwin-Stewart and Kent
(2006), Hoitash and Hoitash ( 2009) and Zaman et al.(2011). Prior studies (e.g
Zaman et al., 2011; Abbott et al.2003a; Goodwin-Stewart and Kent,2006) found
a positive relationship between audit committee meeting and audit fees.
Therefore, this study anticipates that audit committee diligence will be
associated with higher audit fees.
Audit committee commitment will be measured by the weighted average
attendance of all audit committee members to audit committee meetings. As
highly committed members indirectly promote efficiency and effectiveness of
the committee, a positive association is expected between audit fees and the
proportion of audit committee members who attended all meetings scheduled for
the year.
5.4.3 Ownership Structure
The essence of ownership structure is captured using blockholder ownership,
executive ownership and non-executive ownership. Blockholder ownership is
measured by two different measurements. First, it is measured by the percentage
of total shares held by substantial shareholders (holding 3% or more
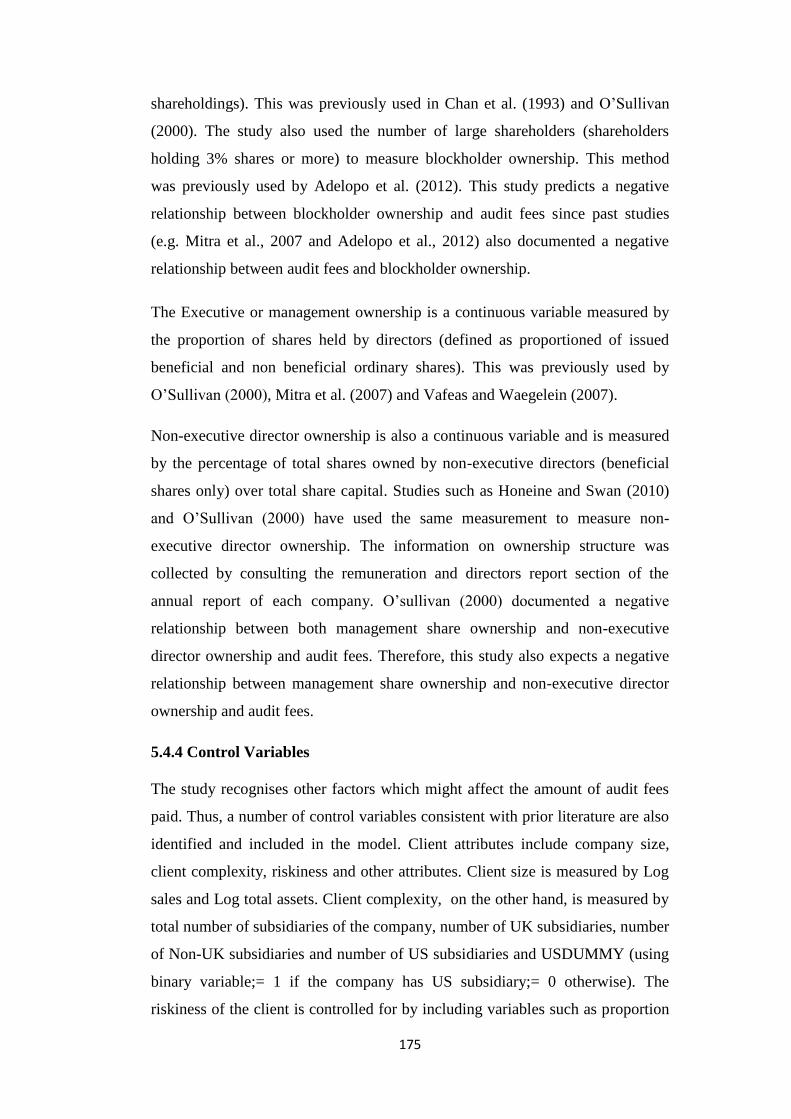
175
shareholdings). This was previously used in Chan et al. (1993) and O’Sullivan
(2000). The study also used the number of large shareholders (shareholders
holding 3% shares or more) to measure blockholder ownership. This method
was previously used by Adelopo et al. (2012). This study predicts a negative
relationship between blockholder ownership and audit fees since past studies
(e.g. Mitra et al., 2007 and Adelopo et al., 2012) also documented a negative
relationship between audit fees and blockholder ownership.
The Executive or management ownership is a continuous variable measured by
the proportion of shares held by directors (defined as proportioned of issued
beneficial and non beneficial ordinary shares). This was previously used by
O’Sullivan (2000), Mitra et al. (2007) and Vafeas and Waegelein (2007).
Non-executive director ownership is also a continuous variable and is measured
by the percentage of total shares owned by non-executive directors (beneficial
shares only) over total share capital. Studies such as Honeine and Swan (2010)
and O’Sullivan (2000) have used the same measurement to measure non-
executive director ownership. The information on ownership structure was
collected by consulting the remuneration and directors report section of the
annual report of each company. O’sullivan (2000) documented a negative
relationship between both management share ownership and non-executive
director ownership and audit fees. Therefore, this study also expects a negative
relationship between management share ownership and non-executive director
ownership and audit fees.
5.4.4 Control Variables
The study recognises other factors which might affect the amount of audit fees
paid. Thus, a number of control variables consistent with prior literature are also
identified and included in the model. Client attributes include company size,
client complexity, riskiness and other attributes. Client size is measured by Log
sales and Log total assets. Client complexity, on the other hand, is measured by
total number of subsidiaries of the company, number of UK subsidiaries, number
of Non-UK subsidiaries and number of US subsidiaries and USDUMMY (using
binary variable;= 1 if the company has US subsidiary;= 0 otherwise). The
riskiness of the client is controlled for by including variables such as proportion
176
of total assets represented by stock (stock/total assets), proportion of total assets
represented by debtors (debtors/total assets), return on assets (earnings before
interest and tax/total assets), leverage ratio (long term liabilities/total assets) and
whether the company experienced loss during the year (using binary variable; =1
if the company experienced loss during the year; =0 otherwise). The client
attribute of whether the company belongs to a regulated industry (financial and
utilities) is also included. This is measured by binary variable; =1 if the company
belongs to financial or utilities industry; =0 otherwise. Since this study also
includes financial institutions, a binary variable; =1 if the company belongs to
financial institutions; =0 otherwise is also used.
Auditor related attributes included in the study are auditor size and location of
the auditor. Auditor size (BIG4) is measured by a Binary variable; =1 if auditor
is Deloitte & Touche, Ernst & Young, KPMG or PricewaterhouseCoopers; =0 if
otherwise. The location of the auditor labelled as LONDON is also measured by
a binary variable; =1 if the auditor has a London address; =0 if otherwise.
Consistent with prior literature, attributes such as report lag labelled DELAY,
which represents the elapsed time from the audit client’s financial year-end date
until the audit report is signed off, and whether the auditing is done during the
busy season labelled BUSY are also included in the audit pricing model. The
report lag is measured by the number of days between the accounting year end
and the date of the audit report. The busy season, which is labelled as BUSY, is
measured by a binary variable; =1 if the financial year end is between 31st
December and 31st March; =0 otherwise. A list of variables used in this study
and the methods of measurement used are shown in Table 4.4.
5.4.5 Non-Audit Fee
The study is also aimed at finding the association between non-audit fees and
audit fees. First, Non-audit fees are measured by the natural log of the total
amount of non-audit fees the company pays to its auditor. Theoretically the
relationship between audit fees and non-audit fees is expected to be negative.
Second, this study unbundles the non-audit service. This study contributes
significantly to the existing literature by investigating the relationship between
177
audit fees and details of non-audit services using published data. Previous
research (Palmrose, 1988; Beattie and Fearnley, 2002; Ezzamel et al., 2002 and
Lai and Krishnan, 2009) have unbundled the non-audit service using information
from survey responses. In the Post-SOX period, the issue of non-audit fees and
auditor independence has become controversial following a series of corporate
collapses and this has triggered a demand for more detailed disclosures from
regulators. One of the responses from the regulators was the establishment of the
Companies (Disclosure of Auditor Remuneration and Liability Agreements)
Regulations 2005. Under these regulations, UK companies are required to
disclose details in the annual report of non-audit fees paid to their incumbent
auditors. The availability of this data made possible investigation of the
relationship between audit fees and individual non-audit fees. Although many
individual non-audit services are disclosed in the annual report, some services
are not very widely used and the values as a proportion of total non-audit fees
are too small for meaningful study. For the purposes of this study, it was decided
that it would be more practical to condense non-audit services into four
categories: other services related to legislation, tax services, corporate finance
services and other services (other services relates to pension plan, actuarial
service, IT service and any other service). The other services related to
legislation are measured using the percentage of other services related to
legislation over total non-audit fee (other services related to legislation/total non-
audit fee) x 100. Each of the other non-audit service categories is calculated in
the same manner.
The study also measures non-audit using binary variable ;= 1 if total non-audit
fees is greater than audit fees;=0 otherwise. This is to capture the relationship
between audit fees and the incident where non-audit service is more dominant
than audit service. Other measurements used include the percentage of total
audit remuneration from non-audit fee.

178
5.5 Empirical Research Models and Tests
The study utilises four main empirical models to test the relationship between
audit fees and governance characteristics.
5.5.1 Audit fees and Governance Model
Model 1
LogAUDIT = b0 + b1 LOGTOTASSETS+ b2 UKSUBS + b3 USSUBS + b4
ROA + b5 STOCK + b6 DEBTORS + b7 REG + b8 BUSY + b9 LOGDELAY +
b10 LONDON + b11 BIG4 + b12 3YEARSLOSS + b13LOGTOTNONAUDIT
+ b14 %INDIRS + b15 BOARDMEET + b16ACSIZE + b17 % ACNEXEC+
b18 % ACMEET + b19 %ACCOMM + b20 %ACFINEXPERT+ b21
ABLOCKOWN+ b22 ANEXSHARES+ b23 AEXESHARES + b24 PERIOD
Model 2
LogAUDIT = b0 + b1 LOGTOTASSETS+ b2 UKSUBS + b3 USSUBS + b4
ROA + b5 STOCK + b6 DEBTORS + b7 REG + b8 BUSY + b9 LOGDELAY +
b10 LONDON + b11 BIG4 + b12 3YEARSLOSS + b13LOGTOTNONAUDIT
+ b14 BOARDSIZE + b15 %INDIRS + b16 BOARDMEET + b17ACSIZE +
b18%ACNEXEC + b19 %ACMEET + b20 %ACCOMM +
b21%ACFINEXPERT + b22 ABLOCKOWN + b23 ANEXSHARES+ b24
AEXESHARES + b25 PERIOD
Model 3
LogAUDIT = b0 + b1 LOGTOTASSETS+ b2 UKSUBS + b3 USSUBS + b4
ROA + b5 STOCK + b6 DEBTORS + b7 REG + b8 BUSY + b9 LOGDELAY +
b10 LONDON + b11 BIG4 + b12 3YEARSLOSS + b13LOGTOTNONAUDIT
+ b14 %INDIRS + b15 BOARDMEET + b16ACSIZE + b17 % ACNEXEC+
b18 % ACMEET + b19 %ACCOMM + b20 %ACSUEXPERT + b21%
ACACCEXPERT + b22 ABLOCKOWN+ b23 ANEXSHARES+ b24
AEXESHARES + b25 PERIOD
Model 4
LogAUDIT = b0 + b1 LOGTOTASSETS+ b2 UKSUBS + b3 USSUBS + b4
ROA + b5 STOCK + b6 DEBTORS + b7 REG + b8 BUSY + b9 LOGDELAY +
b10 LONDON + b11 BIG4 + b12 3YEARSLOSS + b13LOGTOTNONAUDIT
+ b14 %INDIRS + b15 BOARDMEET + b16 ACE + b17 ABLOCKOWN+
b18 ANEXSHARES+ b19 AEXESHARES + b20 PERIOD
In addition, this study presents various robustness tests of the impact of various
governance characteristics and control variables on audit quality, utilising
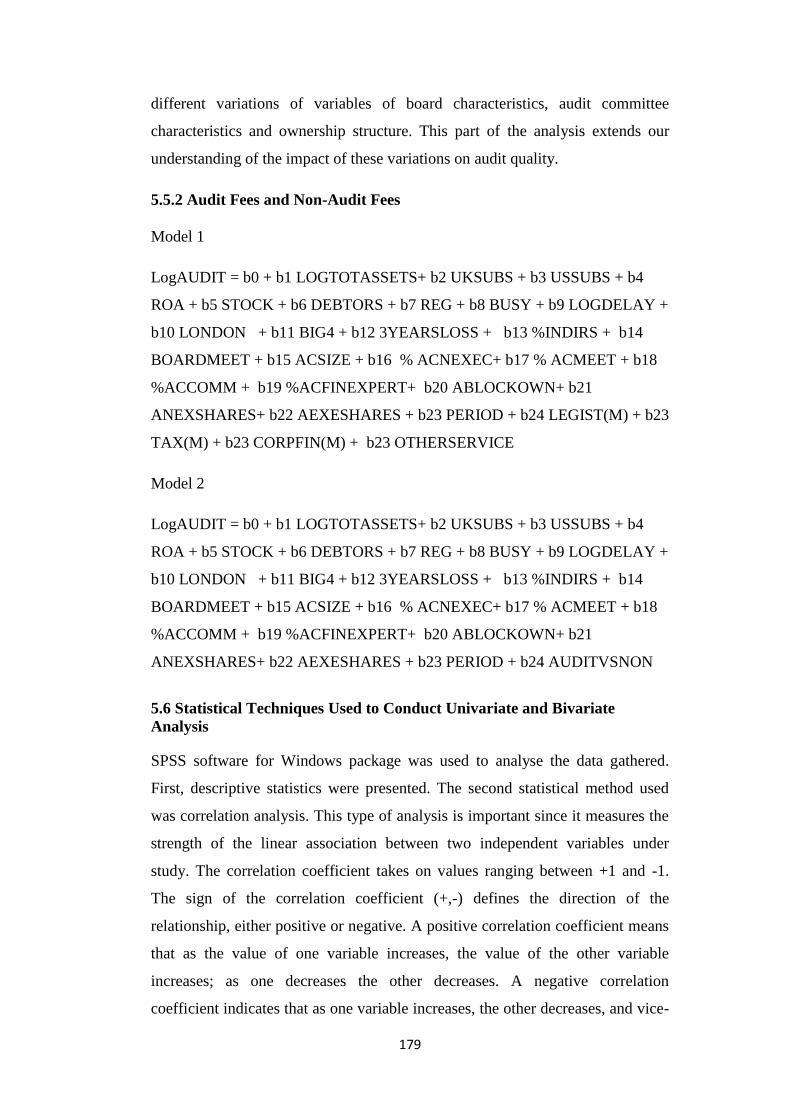
179
different variations of variables of board characteristics, audit committee
characteristics and ownership structure. This part of the analysis extends our
understanding of the impact of these variations on audit quality.
5.5.2 Audit Fees and Non-Audit Fees
Model 1
LogAUDIT = b0 + b1 LOGTOTASSETS+ b2 UKSUBS + b3 USSUBS + b4
ROA + b5 STOCK + b6 DEBTORS + b7 REG + b8 BUSY + b9 LOGDELAY +
b10 LONDON + b11 BIG4 + b12 3YEARSLOSS + b13 %INDIRS + b14
BOARDMEET + b15 ACSIZE + b16 % ACNEXEC+ b17 % ACMEET + b18
%ACCOMM + b19 %ACFINEXPERT+ b20 ABLOCKOWN+ b21
ANEXSHARES+ b22 AEXESHARES + b23 PERIOD + b24 LEGIST(M) + b23
TAX(M) + b23 CORPFIN(M) + b23 OTHERSERVICE
Model 2
LogAUDIT = b0 + b1 LOGTOTASSETS+ b2 UKSUBS + b3 USSUBS + b4
ROA + b5 STOCK + b6 DEBTORS + b7 REG + b8 BUSY + b9 LOGDELAY +
b10 LONDON + b11 BIG4 + b12 3YEARSLOSS + b13 %INDIRS + b14
BOARDMEET + b15 ACSIZE + b16 % ACNEXEC+ b17 % ACMEET + b18
%ACCOMM + b19 %ACFINEXPERT+ b20 ABLOCKOWN+ b21
ANEXSHARES+ b22 AEXESHARES + b23 PERIOD + b24 AUDITVSNON
5.6 Statistical Techniques Used to Conduct Univariate and Bivariate
Analysis
SPSS software for Windows package was used to analyse the data gathered.
First, descriptive statistics were presented. The second statistical method used
was correlation analysis. This type of analysis is important since it measures the
strength of the linear association between two independent variables under
study. The correlation coefficient takes on values ranging between +1 and -1.
The sign of the correlation coefficient (+,-) defines the direction of the
relationship, either positive or negative. A positive correlation coefficient means
that as the value of one variable increases, the value of the other variable
increases; as one decreases the other decreases. A negative correlation
coefficient indicates that as one variable increases, the other decreases, and vice-

180
versa. The correlation coefficient is also helpful in determining variables suitable
for inclusion in the regression model. Correlation analysis can be used to trace
any multicollinearity problems among independent variables. Multicollinearity
exists when the independent variables are highly correlated (r=.8 and above).
The data were further tested using multiple regression analysis, based on a series
of Ordinary Least Squares (OLS) regressions. The study will also use Variance
Inflation Factors (VIF) to detect multi-collinearity problems. This study noted
that the threshold, for instance, of severe multi-collinearity is indicated by a VIF
of 10 (Hair et al., 1998). Thus, throughout the investigations, the researcher will
compare the results of the correlation matrix with the VIF values to determine
instances of severe multi-collinearity. One of the key assumptions of regression
is that the variance of the errors is constant across observations, to test for
heteroscedasticity problems, this study uses the Durbin Watson test. The
variables and their definitions are summarised in table 5.4.
Table 5.4: Definitions of Variables
Variables Description
Dependent
LOGAUDIT Natural log of audit fee (source: Financial statements)
Control variables
LOGTOTASSETS Natural log of total assets (source: Financial statements)
UKSUBS Number of subsidiaries located in UK (source: Financial
statements)
USSUBS Number of US subsidiaries (source: Financial statements)
REG Binary variable;= 1 if the company belongs to a closely regulated
industry that is a financial or utilities industry;= 0 otherwise
ROA Profit before interest and taxation (EBIT)/total assets (%) (source:
Datastream )
STOCK % total assets represented by stock (source: Datastream)
DEBTORS % total assets represented by debtors (source: Datastream)
GEARING % of long term liabilities over total assets
LOSS3YEARS Binary variable;= 1 if the company incurred a loss in the previous 3
years; = 0 otherwise
LOGDELAY Natural log of the Numbers of days between financial year-end and
date audit report signed by auditor (source: Financial statements)
LONDON Binary variable;= 1 if auditor has a London address;= 0 otherwise
BIG4 Binary variable;= 1 if auditor is Deloitte & Touche, Ernst &
Young, KPMG or PricewaterhouseCoopers;= 0 otherwise
BUSY Binary variable:= 1 if company’s financial year-end is between 31
December and 31 March inclusive; = 0 otherwise
Governance
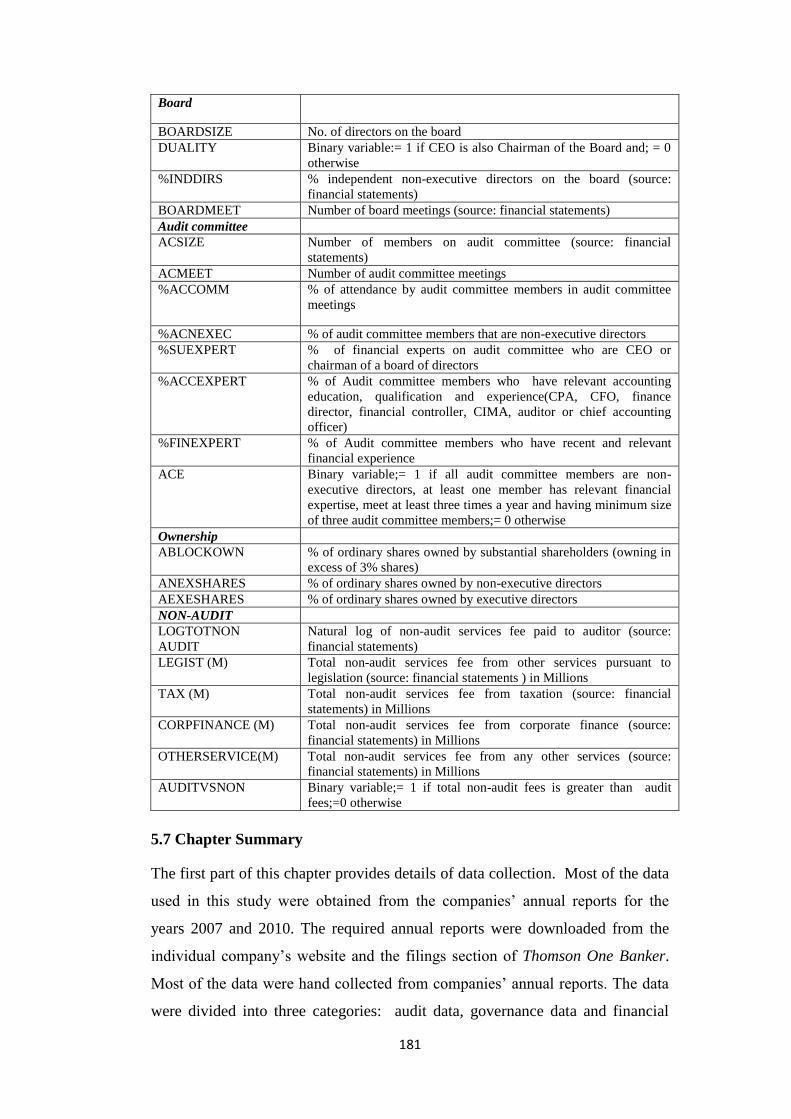
181
Board
BOARDSIZE No. of directors on the board
DUALITY Binary variable:= 1 if CEO is also Chairman of the Board and; = 0
otherwise
%INDDIRS % independent non-executive directors on the board (source:
financial statements)
BOARDMEET Number of board meetings (source: financial statements)
Audit committee
ACSIZE Number of members on audit committee (source: financial
statements)
ACMEET Number of audit committee meetings
%ACCOMM
% of attendance by audit committee members in audit committee
meetings
%ACNEXEC % of audit committee members that are non-executive directors
%SUEXPERT % of financial experts on audit committee who are CEO or
chairman of a board of directors
%ACCEXPERT % of Audit committee members who have relevant accounting
education, qualification and experience(CPA, CFO, finance
director, financial controller, CIMA, auditor or chief accounting
officer)
%FINEXPERT % of Audit committee members who have recent and relevant
financial experience
ACE Binary variable;= 1 if all audit committee members are non-
executive directors, at least one member has relevant financial
expertise, meet at least three times a year and having minimum size
of three audit committee members;= 0 otherwise
Ownership
ABLOCKOWN % of ordinary shares owned by substantial shareholders (owning in
excess of 3% shares)
ANEXSHARES % of ordinary shares owned by non-executive directors
AEXESHARES % of ordinary shares owned by executive directors
NON-AUDIT
LOGTOTNON
AUDIT
Natural log of non-audit services fee paid to auditor (source:
financial statements)
LEGIST (M) Total non-audit services fee from other services pursuant to
legislation (source: financial statements ) in Millions
TAX (M) Total non-audit services fee from taxation (source: financial
statements) in Millions
CORPFINANCE (M) Total non-audit services fee from corporate finance (source:
financial statements) in Millions
OTHERSERVICE(M) Total non-audit services fee from any other services (source:
financial statements) in Millions
AUDITVSNON Binary variable;= 1 if total non-audit fees is greater than audit
fees;=0 otherwise
5.7 Chapter Summary
The first part of this chapter provides details of data collection. Most of the data
used in this study were obtained from the companies’ annual reports for the
years 2007 and 2010. The required annual reports were downloaded from the
individual company’s website and the filings section of Thomson One Banker.
Most of the data were hand collected from companies’ annual reports. The data
were divided into three categories: audit data, governance data and financial

182
data. Audit fee and non-audit fee data were collected from the notes to the
accounts listing details of the remuneration paid to the company’s auditor.
Governance data were collected from annual reports, in particular, the corporate
governance section. Board of directors’ profiles, remuneration report,
governance statement, directors’ report and audit committee reports were
analysed in order to obtain relevant governance information. Financial data for
the study were obtained from Datastream and from financial statements in cases
where any data were missing from the Datastream database.
The second part of the chapter provides details of sample firms. The sample
selected for this study consisted of all companies listed on the FTSE All Share
(UK) as at 31st December 2007, information which is available on the FTSE
website. The initial number of companies was 672, including investment holding
companies. The removal of investment holding companies from the list reduced
the final sample of companies to 492 in 2007. Of these 492 companies, 385
remained and were usable at the end of 2010. This study includes financial
institutions in the sample as the current economic crisis and the collapse of
banks and financial institutions has increased interest and concern regarding the
governance of these institutions. The sample was drawn from 10 different
sectors which were identified from the FTSE All Share Index Series,
constituents, weightings & performance reports as at 31st December 2007. The
biggest industry was the Industrials sector and the smallest was the
Telecommunications sector.
Discussion of the sample is followed by description of the research design and
measurement procedures. The measurements used to measure the dependent
variable (LOGAUDIT) and various audit fee determinants covering board
characteristics, audit committee characteristics, ownership structure and non-
audit are described. The discussion of the research design comprises an
explanation of the independent variables and control variables, including
measurement procedures and the relationship expected between each
independent and control variable. Relevant past literature is used to support the
choice of variables and the respective forms of measurement.

183
Lastly, details of data analysis are described. SPSS for windows package is used
to analyse the data gathered. First, descriptive statistics are presented. The
second statistical method used was correlation analysis. The relationships
between dependent variable and independent variables were tested using
multiple regression analysis, based on a series of Ordinary Least Squares (OLS)
regressions. The variables and their definitions are summarised in Table 5.4.
184
CHAPTER 6: DATA ANALYSIS
6.1 Introduction
The data analysis chapter will be organised into three sections. First, descriptive
statistics will be presented, showing mean, median, standard deviations as well
as maximum and minimum values for each variable employed in the empirical
analysis investigating the impact of governance characteristics and non-audit
fees on audit pricing. The descriptive analysis includes: a combined analysis of
the overall sample for both the pre-economic crisis period (2007) and post-
economic crisis period (2010) and a detailed analysis based on the individual
years. This is followed by a correlation matrix, showing a two way Pearson
correlations between the variables included in this study. The correlation matrix
is important as it could highlight the associations between audit fees and the
explanatory variables used in the study. It therefore could support the
relationship found in the regression analysis. In addition, correlations areuseful
in detecting the possibility of multicollinearity between the independent
variables that could serve to undermine the subsequent multiple regression
results. The chapter continues with the results of detailed multivariate regression
analysis (pooled dataset) to investigate the hypotheses set out in chapter 4. The
multivariate analysis includes robustness tests on the impact of various control
and governance characteristics variables on audit fees.
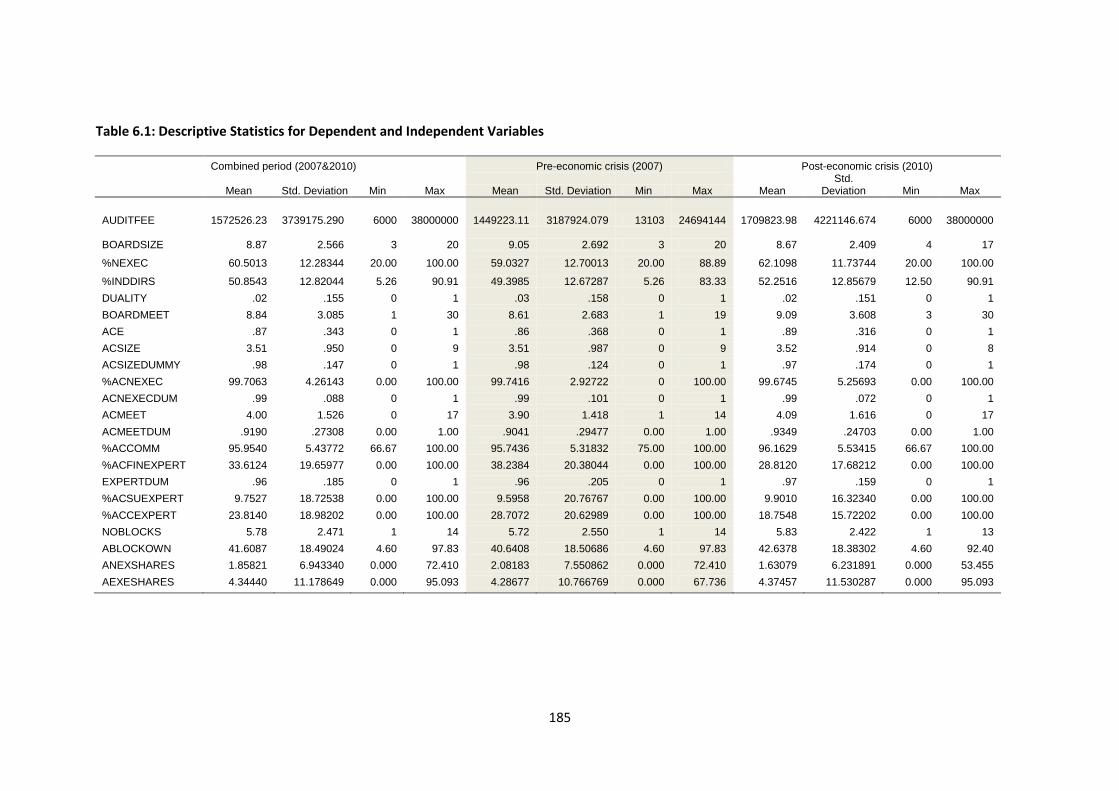
185
Table 6.1: Descriptive Statistics for Dependent and Independent Variables
Combined period (2007&2010) Pre-economic crisis (2007) Post-economic crisis (2010)
Mean Std. Deviation Min Max Mean Std. Deviation Min Max Mean Std.
Deviation Min Max
AUDITFEE 1572526.23
3739175.290 6000 38000000 1449223.11 3187924.079 13103 24694144 1709823.98 4221146.674 6000 38000000
BOARDSIZE 8.87 2.566 3 20 9.05 2.692 3 20 8.67 2.409 4 17
%NEXEC 60.5013 12.28344 20.00 100.00 59.0327 12.70013 20.00 88.89 62.1098 11.73744 20.00 100.00
%INDDIRS 50.8543 12.82044 5.26 90.91 49.3985 12.67287 5.26 83.33 52.2516 12.85679 12.50 90.91
DUALITY .02 .155 0 1 .03 .158 0 1 .02 .151 0 1
BOARDMEET 8.84 3.085 1 30 8.61 2.683 1 19 9.09 3.608 3 30
ACE .87 .343 0 1 .86 .368 0 1 .89 .316 0 1
ACSIZE 3.51 .950 0 9 3.51 .987 0 9 3.52 .914 0 8
ACSIZEDUMMY .98 .147 0 1 .98 .124 0 1 .97 .174 0 1
%ACNEXEC 99.7063 4.26143 0.00 100.00 99.7416 2.92722 0 100.00 99.6745 5.25693 0.00 100.00
ACNEXECDUM .99 .088 0 1 .99 .101 0 1 .99 .072 0 1
ACMEET 4.00 1.526 0 17 3.90 1.418 1 14 4.09 1.616 0 17
ACMEETDUM .9190 .27308 0.00 1.00 .9041 .29477 0.00 1.00 .9349 .24703 0.00 1.00
%ACCOMM 95.9540 5.43772 66.67 100.00 95.7436 5.31832 75.00 100.00 96.1629 5.53415 66.67 100.00
%ACFINEXPERT 33.6124 19.65977 0.00 100.00 38.2384 20.38044 0.00 100.00 28.8120 17.68212 0.00 100.00
EXPERTDUM .96 .185 0 1 .96 .205 0 1 .97 .159 0 1
%ACSUEXPERT 9.7527 18.72538 0.00 100.00 9.5958 20.76767 0.00 100.00 9.9010 16.32340 0.00 100.00
%ACCEXPERT 23.8140 18.98202 0.00 100.00 28.7072 20.62989 0.00 100.00 18.7548 15.72202 0.00 100.00
NOBLOCKS 5.78 2.471 1 14 5.72 2.550 1 14 5.83 2.422 1 13
ABLOCKOWN 41.6087 18.49024 4.60 97.83 40.6408 18.50686 4.60 97.83 42.6378 18.38302 4.60 92.40
ANEXSHARES 1.85821 6.943340 0.000 72.410 2.08183 7.550862 0.000 72.410 1.63079 6.231891 0.000 53.455
AEXESHARES 4.34440 11.178649 0.000 95.093 4.28677 10.766769 0.000 67.736 4.37457 11.530287 0.000 95.093

186
Table 6.1: Continued.
Combined period(2007&2010) Pre-economic crisis (2007) Post-economic crisis (2010)
Mean Std. Deviation Min Max Mean Std. Deviation Min Max Mean Std. Deviation Min Max
TOTASSETS 21368.97 139975.364 25 1900519 18969.34 132811.963 25 1900519 23656.99 146158.802 26 1576305
LOGTOTASSETS 9.077810 .7994683 7.4063 12.2789 9.041856 .7950327 7.4063 12.2789 9.117324 .8034189 7.4090 12.1976
%DEBTORS 13.4636 14.59576 0.00 96.93 13.7464 13.93614 0.00 94.05 13.2439 15.22426 0.00 96.93
%STOCK 8.4271 13.95982 0.00 93.97 8.2879 14.10809 0.00 93.97 8.5239 13.75137 0.00 86.93
ROA 9.6326 10.42299 -54.00 103.06 10.7815 10.80705 -54.00 79.83 8.3994 9.88103 -46.02 103.06
%GEARING 26.9709 20.11744 0.00 109.95 28.1695 20.21335 0.00 109.95 25.8093 19.93283 0.00 93.04
LIQUIDITY 3.86795 40.267709 0.000 947.661 6.11115 56.665713 .108 947.661 1.59204 2.209905 0.000 31.857
BUSY .76 .430 0 1 .77 .419 0 1 .74 .439 0 1
SUBS 22.66 22.793 1 294 23.25 25.253 1 294 22.17 20.026 1 179
UKSUBS 9.53 10.325 0 73 9.68 10.563 0 73 9.33 10.046 -1 65
USSUBS 2.14 3.846 0 29 2.23 4.062 0 29 USDUMMY .48 .500 0 1 .48 .500 0 1 .47 .500 0 1
FTSE350 .67708 .467896 0.000 1.000 .67609 .468568 0.000 1.000 .67188 .470143 0.000 1.000
REG .21 .408 0 1 .21 .407 0 1 .21 .409 0 1
FINANCIALS .19 .391 0 1 .19 .389 0 1 .19 .391 0 1
BIG4 .95 .220 0 1 .94 .236 0 1 .96 .200 0 1
LONDON .61 .488 0 1 .61 .488 0 1 .61 .488 0 1
DELAY 66.30 38.328 23 181 68.02 20.201 25 181 67.02 50.118 23 181
%LEGIST 16.2576 24.00805 0.00 100.00 14.8862 22.64597 0.00 100.00 17.7408 25.31626 0.00 100.00
%TAX 40.5945 34.15486 0.00 100.00 38.6316 33.09848 0.00 100.00 42.6987 35.13304 0.00 100.00
%CORPFIN 12.9585 25.80181 0.00 100.00 13.4754 25.59198 0.00 100.00 12.5944 26.13764 0.00 100.00
%OTHERSERVIS 30.1454 32.95001 0.00 100.00 32.9280 34.22503 0.00 100.00 26.9661 31.22725 0.00 100.00
TOTNONAUDIT 1114399.74 2359931.886 0 25000000 1194188.17 2413265.850 0 25000000 1045098.14 2298944.768 0 18706882
LOGNONAUDIT 5.366634 1.2364728 0.0000 7.3979 5.451576 1.1471731 0.0000 7.3979 5.290364 1.3134461 0.0000 7.2720
AUDITVSNON .29 .456 0 1 .33 .470 0 1 .26 .439 0 1

187
6.2 Descriptive Statistics
Table 6.1 presents the descriptive statistics for dependent (audit fees),
independent variables such as board characteristics variables, audit committee
characteristics variables, ownership variables, non-audit fees variables and
control variables for the combined period (2007 and 2010), for the pre-economic
crisis period (2007) and post-economic crisis period (2010). The mean for audit
fee is approximately £ 1,572526 for the combined period, with a standard
deviation of £3,739,175. The range of fees paid by the audit clients starts as low
as £6,000 and goes as high as £38,000,000. It is observed that there is an
increase in audit fees from a mean of £1,449,223 pre-economic crisis to
£1,709,823 in the post-economic crisis period or an increase of 18% in audit fees
over these two periods. These results suggest that auditors have increased their
fees over the years, especially when the economic environment has become
more complicated, since more audit work is needed. The mean for non-audit fee
is £1,114,399 for the combined period, with a median of £356,000. It is observed
that the average non-audit fees paid to the auditor decreased significantly from
£1,194,199 in the year 2007 to £1,045,098 in the year 2010, with a decrease in
median from £400,000 to £300,000. Over reliance of the companies’ auditors on
non-audit services could affect their independence, especially independence in
appearance. On average, 29% of the sample companies pay more non-audit fees
to their auditor as compared to audit fees in the combined period. This study
observes a reduction of 7% in the number of companies paying more for non-
audit services: from 33% in 2007 to 26% in 2010. Using the detailed disclosure
of Non-audit fees in annual reports, non-audit fees are categorised into four
services. On average, 16% or £248,503 of the total non-audit fees paid by listed
companies in UK for the combined period derived from other services supplied
pursuant to such legislation (%LEGIST). There was an increase in this type of
non-audit service during the combined period: from 15% in 2007 to 18% in
2010. Tax services are the services most often provided by the company’s
auditor to their audit client. On average, 41% or £326,313 of the total non-audit
fees of the sample companies derived from tax services and the study observes
an increase in these services from 38% in 2007 to 43% in 2010. Other services
that are also frequently provided by the auditor are corporate finance related

188
services. The average proportion of corporate finance related transactions to total
non-audit fees wass 13% for the combined period and there was a slight decrease
of 1% from 13% in 2007 to 12% in 2010. This study found that other non-audit
services such as pension scheme audits, SOX related compliance services, other
services related to pensions, actuarial services and IT services were not popular
among the companies and the proportion to total non-audit fees was too
insignificant (below 1%). Therefore, these services were combined with other
services figures disclosed in the annual reports. Combining these services, other
non-audit services constituted 30% of total non-audit fees for the combined
period and showed a downward trend of 33% in 2007 and 27% in 2010. Overall,
this study observes a reduction in total non-audit fees, the number of companies
paying more for non-audit services as compared to audit fees, fees paid for
corporate finance related transactions and other non-audit services. This
reduction could be due to an increase in awareness of the effect of non-audit
services on auditor independence. However, the increase in fees for other
services supplied pursuant to such legislation (%LEGIST) and tax services
(%TAX) could reflect that companies have increased their reliance on the
auditor to help them in filing for documents with the authorities, including tax
authorities.
Table 6.1 also shows that, on average, the size of the board is approximately
nine members, with a standard deviation of 2.56. This figure is lower than
Adelopo and Jallow’s (2008) finding of an average board size of 11 but is
consistent with Chan et al. (2012). There is no obvious change in board size over
the two periods; however, table 6.1 shows an increase in the proportion of non-
executive directors from 59% in 2007 to 62% in 2010, suggesting that the
companies have increased the number of non-executive directors on their board
to replace executive directors. There is an upward trend in the proportion of non-
executives on boards, especially post-Cadbury. Conyon (1994) found a
proportion of 37.77% in 1993, while O’Sullivan (1999), using 1995 data,
documented average representation of 50.2% by non-executives on boards. Most
recently, by reporting an average proportion of non-executives of 54% (using
2004 data), Zaman et al. (2011) confirmed that non-executive representation on
boards is becoming more important. Further analysis of non-executive directors

189
shows that on average only 85% of the non-executives are independent as
defined by the code (UK Corporate Governance Code, 2010). Independence was
determined after reading the disclosure in the companies’ governance reports
regarding board members, as companies are required by the code of corporate
governance to disclose detailed information regarding board independence. This
proportion is consistent over the two periods. The average proportion of
independent non-executive directors on the board was 51% in the combined
period, suggesting that UK companies have followed the requirement by the UK
Corporate Governance Code (2010) for there to be a majority of independent
directors on the board. There was an increase in the proportion of independent
non-executive directors on the boards from 49% pre-economic crisis (2007) to
52% in the post-economic crisis period (2010), suggesting an increase in
compliance to the requirement of the Code by UK companies.
In terms of board leadership, only two percent of the companies in the combined
period have the same individual occupying the positions of company chairman
and CEO. There is also a reduction of one percent of CEO duality case from
three percent in 2007 to two percent in 2010. It appears that large UK
companies are now less likely to exhibit CEO duality than was the case in the
1990s. There has been a significant reduction in the percentage of companies
having the same individual in the position of company chairman and CEO. For
example, Conyon (1994) reported 23% CEO duality in 1993, O’Sullivan (1999)
reported 15% for the year 1995 and recently Zaman et al. (2011) reported a
significant reduction as only 3% of their 135 sample firms in 2004 had the same
person occupying these two important positions. The continuous reduction in the
CEO duality case is a result of the recommendation of the codes of corporate
governance (e.g. UK Corporate Governance Code, 2010). Section A.2.1 of the
most recent codes highlighted that the roles of chairman and chief executive
should not be fulfilled by the same individual and the division of responsibilities
between the chairman and chief executive should be clearly established, set out
in writing and agreed by the board. The average frequency of board meetings is
eight, with a minimum of one and a maximum of 30 meetings a year. The
average meeting frequency is similar to prior UK and US studies such as Zaman
et al. (2011) and Abbott et al. (2003). There was only a slight increase in the

190
number of meetings over the two periods. However, a further investigation of
the maximum value reveals that the company which had 30 meetings (in 2010)
disclosed in their annual report that their board’s agenda was considerably
challenged during the period under review by the market environment.
Consequently, more board meetings were necessary for the year 2010 as
compared to previous years (e.g. 10 meetings in the year 2007).
As for the audit committee characteristics, table 6.1 illustrates that on average,
the number of audit committee members is slightly more than 3 (3.51) and 98%
of sample firms have at least three audit committee members. The audit
committee’s average size remains constant over the two periods; however, the
number of companies having a minimum of three members, or in smaller
companies two, declined by 1% in 2010 as compared to the year 2007. This
finding shows that most of the listed companies in the UK have followed the
requirement of the Code of Corporate Governance that audit committees of
FTSE 350 firms should have at least three members and smaller firms should
have at least two. This is supported by results of detailed analysis (see appendix
1) which reveal that FTSE 350 firms have an average 4 audit committee
members while non FTSE 350 firms on average have 3 members. However, it is
interesting to point out that even though the maximum number of audit
committee members in the sample is 9, the minimum number is 0. This result
reveals that there is a company fully listed on London Stock Exchange (listed on
FTSE 350) which still does not have an audit committee. The result highlights
the existence of a company which does not comply with the requirement of The
Combined Code and also the recommendation of the Cadbury (1992) report and
other reports (e.g. Smith Report, 2003; Higgs Report, 2003) that a company
should have an audit committee to enhance governance effectiveness. A detailed
investigation on this particular company reveals that it also has CEO duality,
does not have a strong independent non-executive element or meet certain other
requirements stated in the Combined Codes (Combined Code 2003, 2006, 2008
or 2010). However, the company has provided in the annual report an
explanation for non-compliance with the Code as required under the “comply or
explain” stipulation by the UK Combined Code. It seems that the company is
191
taking advantage of the UK corporate governance system, which is more open,
and is self regulated.
To be more effective, the Codes (e.g. UK Corporate Governance Code, 2010)
also recommend that not only should the committee number at least three but
also the membership should only consist of independent non-executive directors.
This is to ensure optimal effectiveness as independent non-executive directors
could act on behalf of the shareholders. Almost all the companies have complied
with this recommendation as 98% of the companies in the study only have non-
executive directors on their audit committee. Consequently the average
percentage of non-executive membership on the audit committee is 99.70%,
with a median value of 100%. Similar to audit committee size, the proportion of
non-executive directors on audit committees is also consistent over the two
periods under study. Partitioning firms into FTSE 350 and Non FTSE 350
reveals that there is no significant difference between the mean percentages of
non-executives between the two groups (99.09% for non-FTSE 350 and 99.78%
for FTSE 350 firms). The result of this study is similar to Zaman et al.’s (2011)
finding of 99% compliance with the requirement that the audit committee should
only consist of independent non-executive directors. In addition, this study
captures the share-ownership of non-executive and executive directors. On
average, only 1.8% of total company shares are owned by non-executive
directors while 4.3% are held by executive directors for the combined period.
There is only a slight decrease in non-executive ownership from the year 2007 to
the year 2010 while executive share ownership remains the same.
The average frequency of audit committee meetings is about 4 times per year
(3.84), with a maximum of 17 meetings per-year and a minimum of none. This is
in line with the recommendation of the corporate governance code, which
recommends a minimum of 3 meetings per year. Aware of this recommendation,
91.90% of the sample companies have at least 3 meetings per year. Both FTSE
350 firms and smaller firms in the sample company have meetings more than
three times a year (an average of 4.59 times for FTSE 350 and 3.85 for non
FTSE 350 firms). This figure is significantly higher than the percentage
identified by Zaman et al. (2011). Based on 195 sample firms listed on FTSE
192
350 in 2004, the researchers found that only 39% of their sample had at least 3
audit committee meetings per year. This lower percentage could be due to the
time factor as both the Higgs Report and Smith Report were released in 2003
and the listed companies needed some time to consider and apply their
recommendations. Comparing the two periods (pre- and post-economic crisis), it
is found that compliance with the recommendation of the Codes regarding the
minimum number of meetings increased by 4% from the year 2007 to the year
2010. The incidence of high profile business failures such as Northern Rock has
increased pressure on listed companies to strengthen their governance to
safeguard the company and their shareholders and hence to comply with the
recommendations of the Code of Corporate Governance. Commitment of audit
committee members to attend scheduled meetings is important to ensuring the
committee’s effectiveness.
Another measure of effectiveness for audit committees is the existence of a
financial expert on the committee, which could be especially helpful in detecting
material misstatements in financial reports. On average, 96% of the sample firms
(combined period) have at least one supervisory or accounting expert. On
average the proportion of audit committee members who are either accounting or
supervisory finance experts is 34%, with a minimum of 0% and a maximum of
100%. There was an increase of 1% in the existence of finance experts on audit
committees among UK listed companies from 96% in 2007 to 97% in 2010. The
result of this study shows that the number of audit committees with at least one
member with finance expertise has increased considerably in the last few years
as a previous UK study (Zaman et al., 2011) indicated only 70% compliance in
2004. This figure is also higher than the finding by a US study (Abbott et al.,
2003) that 80% of audit committees in the US had at least one member with
financial expertise. Analysing further, the expertise is divided on the basis of
accounting expertise and supervisory expertise. The mean proportion of
accounting experts on audit committees who have relevant accounting
education, qualifications and experience (Certified Public Accountant, Chief
Financial Officer, finance director, financial controller, CIMA, auditor or chief
accounting officer) is 24%. On the other hand, the average proportion of
supervisory finance experts who are current or former CEOs or chairmen of the
193
board of directors on an audit committee is 10%. Analysis was also carried out
to investigate whether FTSE 350 companies have a higher proportion of audit
committee finance expertise. The descriptive statistics show that non FTSE 350
have a higher proportion of audit committee finance expert as compared to
FTSE 350 companies (34% for non FTSE 350, 32% for FTSE 350). The same
trend is found for accounting finance expert and supervisory finance expert
(Please see appendix 1).
Zaman et al. (2011) used a composite measure for audit committee effectiveness
based on 4 variables: size of the committee (at least 3 members for FTSE 350
and 2 members for FTSE small capital firms), independence of the committee
members (contains only non-executive directors), number of committee
meetings (a minimum of 3 meetings per year) and existence of expertise on the
committee (existence of at least one finance expert on the committee). An audit
committee is only considered effective if all four criteria are met. Using a
dummy variable to indicate whether these conditions were fulfilled, 87% of the
sample firms were found to have effective audit committees in the combined
period. There is an increase of 3% in audit committee effectiveness in these two
periods: from 86 % in 2007 to 87% in 2010. The result shows a significant
increase in the effectiveness of the audit committee over the last few years in the
UK compared to earlier UK-based evidence provided by Zaman et al. (2011),
which documented that only 16% of sample firms had effective audit
committees in the year 2004. Further analysis reveals that there has been a
considerable increase in the number of companies having a minimum of 3 (or 2
in the case of smaller firms) audit committee members (21% in Zaman et al.,
2011) and in the committees’ activity (only 39% had a minimum of 3 meetings
per year).
In addition to audit committee characteristics recommended by the Codes, this
study adds a variable measuring audit committee commitment (ACCOMM)
since commitment of audit committee members to attend scheduled meetings is
also important in enhancing committee effectiveness. On average, the audit
committee members gave 96% commitment to attend the scheduled audit
committee meetings for the combined period and the years 2007 and 2010.
194
Table 6.1 also shows the descriptive statistics for other determinants of audit
fees. The average number of companies with block shareholders holding 3%
shares or more is 6, with average share ownership of 41% of shares. The average
number of block holders remained constant over the two periods while share
ownership increased from 40% in the year 2007 to 43% in the year 2010.Total
assets are used to measure client size. The average company size based on total
assets is £21,368 million for combined period; 13% and 8% of total assets are
represented by debtors and stock respectively. Despite the economic crisis in
2008 and 2009, the average total assets of the companies increased from an
average of £18,969 millions in 2007 to £23,657 million in 2010. The average
return on assets (ROA) is 9.63%, with a minimum return as low as -54 % and a
maximum return of 103%.There was a decrease of 1% in ROA between these
two periods. The gearing ratio ranges from 0 to 109%, showing that some
companies rely heavily on long term liabilities to finance their assets, which
exposes them to significant financial risk, especially during difficult economic
conditions. However, the average gearing is only 26.97%, with a median value
of 25.20%. On average 20% of the companies experienced financial loss for the
three years of the combined period, made up of 11% loss occurrence in 2007 and
29% in 2010. There was apparently an increase of 18% in the number of
companies experiencing losses in the last three years, including 2010, which
might be due to the losses incurred in 2008 and 2009 when the economic crisis
was most severe. 67.71 % of the sample firms are listed on the FTSE 350 of
London Stock Exchange, while the remainder are listed on FTSE Small Capital.
21% of the company represent regulated industries, with 19% being financial
companies. The number of subsidiary companies held by the sample firms
ranges from a minimum of one to a maximum of 294 subsidiaries and the
average holding is 22 subsidiary companies. Partitioning the subsidiaries into
UK and US subs revealed that more than half of the holdings are in companies
operating outside the UK (average of 90% subsidiaries) and 48% of the
companies have subsidiaries in the US. In terms of ownership, on average the
firms under study are owned by 5.81 block- holders who hold at least 3% share
ownership. On average, 76% of the sample companies have an accounting year
that ends between 31st December and 31
st March (BUSY) for the combined
period and interestingly the percentage dropped from 77% in 2007 to 74% in
195
2010, indicating that 3% of companies changed their accounting period between
these two periods. 95% of the sample companies are audited by one of Big Four
auditing firms, whilst 61% of the companies are audited by a London-based
auditor. There is a slight decrease (2%) in the percentage of companies audited
by the Big Four auditing firms in 2010, while the number of companies audited
by London auditors remained the same. The average audit delay (DELAY) is 66
days, with a standard deviation of 38 days for the combined period and with the
length of the audit period ranging from a minimum of 25 days to a maximum of
181 days. There is a decrease of 6 days average report lag between the years
2007 and 2010.
6.3 Correlation Matrix
Table 6.2 contains a correlation matrix showing two-way Pearson correlations
between all variables included in this study. An examination of correlations is
useful in identifying associations between individual variables, especially
between the dependent variable and each independent variable as this could
assist in understanding the subsequent multivariate results. Another use of
correlation analysis is to trace any multicollinearity problems among
independent variables. According to Judge et al. (1988), multicollinearity exists
when the independent variables are highly correlated (r=.8 and above). In the
same vein, Hair et al. (1995) and Gujrati (2003) suggests that a correlation value
of below 0.80 is deemed to be safe for the variables to be included together in
the multivariate regression analysis. Singularity is another related issue.
Singularity occurs when one independent variable is actually a combination of
other independent variables. The existence of multicollinearity and singularity
breaches the OLS assumption of no multicollinearity, which could cause
problems in generalising the regression results. Multiple regressions do not
relate well to multicollinearity or singularity, and such combinations do not
produce a good regression model (Pallant, 2001). The double and single
asterisks in table 6.2 signify statistically significant correlations at one percent
and five percent respectively. The correlations in column 1 show how each of
the explanatory variables relates to audit fees. As expected, the variable
measuring client size (LOGTOTASSETS) correlates significantly with audit
fees, with correlation values of 0.784 reflecting that bigger companies pay
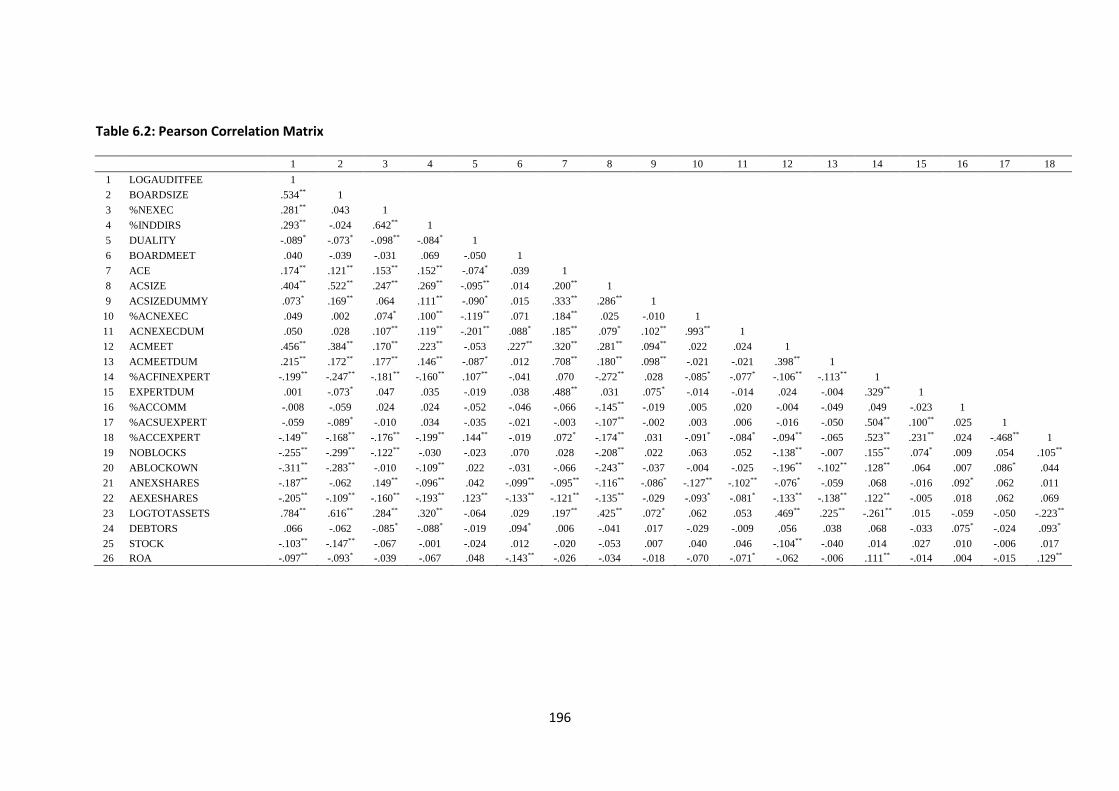
196
Table 6.2: Pearson Correlation Matrix
1 2 3 4 5 6 7 8 9 10 11 12 13 14 15 16 17 18
1 LOGAUDITFEE 1
2 BOARDSIZE .534** 1
3 %NEXEC .281** .043 1
4 %INDDIRS .293** -.024 .642** 1
5 DUALITY -.089* -.073* -.098** -.084* 1
6 BOARDMEET .040 -.039 -.031 .069 -.050 1
7 ACE .174** .121** .153** .152** -.074* .039 1
8 ACSIZE .404** .522** .247** .269** -.095** .014 .200** 1
9 ACSIZEDUMMY .073* .169** .064 .111** -.090* .015 .333** .286** 1
10 %ACNEXEC .049 .002 .074* .100** -.119** .071 .184** .025 -.010 1
11 ACNEXECDUM .050 .028 .107** .119** -.201** .088* .185** .079* .102** .993** 1
12 ACMEET .456** .384** .170** .223** -.053 .227** .320** .281** .094** .022 .024 1
13 ACMEETDUM .215** .172** .177** .146** -.087* .012 .708** .180** .098** -.021 -.021 .398** 1
14 %ACFINEXPERT -.199** -.247** -.181** -.160** .107** -.041 .070 -.272** .028 -.085* -.077* -.106** -.113** 1
15 EXPERTDUM .001 -.073* .047 .035 -.019 .038 .488** .031 .075* -.014 -.014 .024 -.004 .329** 1
16 %ACCOMM -.008 -.059 .024 .024 -.052 -.046 -.066 -.145** -.019 .005 .020 -.004 -.049 .049 -.023 1
17 %ACSUEXPERT -.059 -.089* -.010 .034 -.035 -.021 -.003 -.107** -.002 .003 .006 -.016 -.050 .504** .100** .025 1
18 %ACCEXPERT -.149** -.168** -.176** -.199** .144** -.019 .072* -.174** .031 -.091* -.084* -.094** -.065 .523** .231** .024 -.468** 1
19 NOBLOCKS -.255** -.299** -.122** -.030 -.023 .070 .028 -.208** .022 .063 .052 -.138** -.007 .155** .074* .009 .054 .105**
20 ABLOCKOWN -.311** -.283** -.010 -.109** .022 -.031 -.066 -.243** -.037 -.004 -.025 -.196** -.102** .128** .064 .007 .086* .044
21 ANEXSHARES -.187** -.062 .149** -.096** .042 -.099** -.095** -.116** -.086* -.127** -.102** -.076* -.059 .068 -.016 .092* .062 .011
22 AEXESHARES -.205** -.109** -.160** -.193** .123** -.133** -.121** -.135** -.029 -.093* -.081* -.133** -.138** .122** -.005 .018 .062 .069
23 LOGTOTASSETS .784** .616** .284** .320** -.064 .029 .197** .425** .072* .062 .053 .469** .225** -.261** .015 -.059 -.050 -.223**
24 DEBTORS .066 -.062 -.085* -.088* -.019 .094* .006 -.041 .017 -.029 -.009 .056 .038 .068 -.033 .075* -.024 .093*
25 STOCK -.103** -.147** -.067 -.001 -.024 .012 -.020 -.053 .007 .040 .046 -.104** -.040 .014 .027 .010 -.006 .017
26 ROA -.097** -.093* -.039 -.067 .048 -.143** -.026 -.034 -.018 -.070 -.071* -.062 -.006 .111** -.014 .004 -.015 .129**

197
Table 6.2 : Continued
1 2 3 4 5 6 7 8 9 10 11 12 13 14 15 16 17 18
27 3YEARSLOSS -.113** -.017 .021 -.001 .048 .162** -.051 -.044 -.037 -.001 -.001 .049 -.038 -.053 .005 .002 .012 -.068
28 GEARING .105** .076* .046 .048 -.044 -.015 .053 .061 .041 -.011 -.015 -.035 .035 -.074* .041 -.039 -.050 -.030
29 LIQUIDITY -.090* -.055 -
.140** -.091* -.007 .015 -.034
-.094**
.009 .004 .005 -.027 -.053 .095** .012 -.028 .001 .097**
30 BUSY .202** .138** .045 -.008 -.046 -.010 .021 .029 .038 .037 .029 .136** .000 .017 .022 .057 .045 -.028
31 SUBS .377** .171** .017 .014 .009 -.085* .055 .132** .024 .006 -.019 .098** .086* -.045 -.048 -.017 -.051 .002
32 USDUMMY .399** .086* .132** .173** .016 -.077* .051 .100** -.016 .001 -.020 .138** .116** -.035 -
.074* .039 -.055 .018
33 FTSE350 .462** .324** .153** .173** -.033 -.071 .171** .303** .010 -.009 -.021 .236** .221** -
.168** .004 -.056 -.074*
-.106**
34 REG .049 .217** -.041 -.045 .041 .002 .038 .118** .013 -.010 -.038 .200** .021 -.046 .011 -.068 .026 -.075*
35 FINANCIALS .026 .199** -.046 -.055 .052 -.007 .028 .086* .004 -.015 -.044 .198** .004 -.030 .018 -.041 .022 -.055
36 BIG4 .204** .094** .071* .137** -.001 .061 .140** .118** .046 .071 .055 .112** .177** -
.126** -.012 -.021 -.049 -.093*
37 LONDON .323** .238** .152** .129** .058 -.059 .059 .159** .007 -.018 -.031 .204** .112** -.039 -.008 -.062 -.022 -.016
38 DELAY -.118** -.020 -
.094** -.069 .019 .005 -.045 -.063 -.032 -.039 -.055 .025 -.051 .028 .000 -.004 .010 .017
39 LEGIST .464** .169** .064 .113** .005 .022 .040 .095** .014 .027 .037 .179** .025 -.008 .049 .061 .060 -.069
40 TAX .511** -
.141**
-
.114** -.056 .047 -.040 -.027 -.056 .071 .002 -.034
-
.147** -.056 .022 -.040 .068 -.028 .056
41 CORPFIN .251** -.031 .056 -.020 -.039 .036 -.002 -.059 -.057 -.040 -.020 -.014 .000 .018 .029 -.052 .028 -.011
42 OTHERSERVIS .494** .048 .028 -.008 -.021 -.002 .000 .036 -.039 .009 .023 .032 .039 -.034 -.018 -
.076* -.040 .002
43 LOGTOTNONAUDIT .490** .267** .100** .160** -.084* .129** .032 .212** .022 .074* .071* .193** .061 -
.120** -.038 -.031 -.062 -.062
44 AUDITVSNON -.226** -.074* -.054 -.045 .044 .101** -.031 -.039 -.020 .004 .017 -.085* -.022 -.004 -.001 -.004 .022 -.022

198
Table 6.2 : Continued
19 20 21 22 23 24 25 26 27 28 29 30 31 32 33 34 35 36
19 NOBLOCKS 1
20 ABLOCKOWN .529** 1
21 ANEXSHARES -.098** .087* 1
22 AEXESHARES -.137** .089* .055 1
23 LOGTOTASSETS -.336** -.378** -.161** -.183** 1
24 DEBTORS .000 -.068 .021 -.009 -.166** 1
25 STOCK .106** -.007 .043 -.009 -.089* -.048 1
26 ROA -.014 -.035 .056 .091* -.167** .064 .024 1
27 3YEARSLOSS .049 .103** -.011 -.023 -.060 -.144** .043 -.326** 1
28 GEARING -.034 -.071 -.027 -.133** .250** -.260** -.122** -.062 -.005 1
29 LIQUIDITY -.015 -.011 -.010 .032 -.087* .013 .003 .002 .000 -.032 1
30 BUSY -.088* -.103** .007 -.090* .174** .024 -.172** -.053 -.017 -.048 .033 1
31 SUBS -.083* -.052 -.121** -.006 .237** .026 -.063 .031 -.086* .019 -.023 .081* 1
32 USDUMMY .001 -.078* -.150** -.071 .148** .105** -.081* .006 -.092* -.125** -.007 .113** .347** 1
33 FTSE350 -.157** -.266** -.165** -.089* .547** -.099** -.014 .151** -
.166** .136** -.085* .086* .169** .145** 1
34 REG -.059 -.064 -.056 -.010 .312** -.112** -.216** -.077* .108** .098** -.027 .064 -.013 -.113** .084* 1
35 FINANCIALS -.017 -.019 -.043 .013 .262** -.082* -.196** -.083* .142** .000 -.025 .033 -.014 -.114** .046 .929** 1
36 BIG4 .027 -.071 -.100** -.104** .185** .060 .007 -.011 .024 .159** -.212** -.090* .023 .102** .183** .018 .005 1
37 LONDON -.091* -.048 -.010 -.038 .262** -.051 -.092* -.004 -.044 -.063 -.020 .148** .143** .181** .202** .079* .089* -.112**
38 DELAY .003 .046 .082* .042 -.130** .091* -.010 -.046 .009 -.081* -.009 -.068 -.023 -.073* -
.104** .068 .085* -.085*
39 LEGIST -.046 -.017 -.030 -.009 .192** -.042 -.077* -.043 .057 -.003 .017 -.001 .011 .015 .051 .193** .181** .040
40 TAX .053 -.033 .024 -.067 -.166** .128** .071 .036 -.017 -.055 -.011 -.007 .048 .047 -.076* -
.187** -.156** .005
41 CORPFIN -.047 .055 .014 .114** .020 -.059 -.037 -.095** .010 .095* -.007 .021 -.057 -.079* -.001 -.024 -.055 -.052
42 OTHERSERVIS .013 .003 -.013 -.013 .017 -.056 .011 .069 -.031 -.016 .005 -.008 -.012 .002 .043 .072 .073* .009
43 LOGTOTNONAUDIT -.162** -.181** -.149** -.110** .408** .051 -.009 -.051 -.028 .095** -.062 .075* .166** .194** .291** .035 .024 .271**
44 AUDITVSNON .007 .051 .030 .065 -.108** -.137** .079* -.044 .107** .072 .034 -.024 -.144** -.135** -.031 -.033 -.039 .058

199
Table 6.2 : Continued
37 38 39 40 41 42 43 44
37 LONDON 1
38 DELAY -.018 1
39 LEGIST .120** .022 1
40 TAX -.056 -.043 -.341** 1
41 CORPFIN -.005 .017 -.166** -.317** 1
42 OTHERSERVIS -.025 .015 -.246** -.540** -.333** 1
43 LOGTOTNONAUDIT .085* -.060 .050 -.108** .223** -.091* 1
44 AUDITVSNON -.100** -.019 -.128** -.116** .293** -.015 .263** 1
Variable definitions:
Variable Definition
LOGAUDITFEE Natural log of audit fee
LOGTOTASSETS Natural log of total assets
SUBS Number of subsidiaries
USDUMMY Binary variable;= 1 if the company has US subsidiary ;= 0 otherwise
REG Binary variable;= 1 if the company belongs to regulated industry;= 0 otherwise
FTSE350 Binary variable;= 1 if the company belongs to FTSE 350;= 0 otherwise
FINANCIALS Binary variable;= 1 if the company belongs to financial industry;= 0 otherwise
NOBLOCKS The number of block share holders holding 3% or more shares.
ABLOCKOWN % of block-holder ownership

200
ANEXSHARES % of non-executive director ownership
AEXESHARES % of executive director ownership
ROA Profit before interest and taxation (EBIT) /total asset (%)
STOCK % total assets represented by stock
DEBTORS % total assets represented by debtors
GEARING % of long term liabilities / total assets
3YEARSLOSS Binary variable;= 1 if the company incurred losses in (2005, 2006 or 2007) for 2007 or
(2008, 2009 or 2010) for 2010 ;= 0 otherwise
DELAY Numbers of days between financial year-end and audit report being signed by auditor
(source: financial statements)
LONDON Binary variable;= 1 if auditor has a London address;= 0 otherwise
BIG4 Binary variable;= 1 if auditor is Deloitte & Touche, Ernst & Young, KPMG or Price
Waterhouse Coopers;= 0 otherwise
BUSY Binary variable:= 1 if financial year-end is between 31 December and 31 March
inclusive; = 0 otherwise
BOARDSIZE No of directors on board
DUALITY Binary variable:= 1 if CEO is Chairman of the Board and; = 0 otherwise
%NEXEC % non-executive directors on board (source: financial statements)
%INDDIRS % independent non-executive directors on board (source: financial statements)
BOARDMEET Number of board meetings (source: financial statements)
ACSIZE Number of members on audit committee (source: financial statements)
ACSIZEDUM Binary variable;= 1 if audit committee members number more than 3;= 0 otherwise
ACMEET Number of audit committee meetings
ACMEETDUM Binary variable;= 1 if audit committee meetings are more than 3;= 0 otherwise

201
%ACCOMM % of audit committee commitment in attending audit committee meetings
%ACNEXEC % of audit committee that are non-executives
ACNEXECDUM Binary variable;= 1 if all audit committee members are non-executive directors;= 0
otherwise
%SUEXPERT % of financial experts on audit committee who are a CEO or chairman of a board of
directors
%ACCEXPERT % of Audit committee that have relevant accounting education, qualification and
experience(CPA, CFO, finance director, financial controller, CIMA, auditor or chief
accounting officer)
%FINEXPERT % of Audit committee that are financial experts
ACE Binary variable;= 1 if all audit committee members are non-executive directors, at
least one member with relevant financial expertise, meet at least three times a year and
have a minimum of three audit committee members;= 0 otherwise
LOGTOTNONAUDIT Natural log of non-audit services fee ( source: financial statements )
LEGIST Non-audit services fee from other services pursuant to legislation (source: financial
statements ) in Millions
TAX Non-audit services fee from taxation (source: financial statements ) in Millions
CORPFINANCE Non-audit services fee from corporate finance (source: financial statements ) in
Millions
OTHERSERVIS Non-audit services fee from any other services (source: financial statements ) in
Millions
AUDITVSNON Binary variable;= 1 if all non-audit fees exceeds audit fees;=0 otherwise

202
higher audit fees. Most of the variables measuring client riskiness show a
significant correlation with audit fees. Again as expected, return on assets
(ROA) and liquidity ratio has a significant negative correlation with audit fees
while gearing ratio shows a significant positive correlation with audit fees. The
negative correlation between audit fee and the proportion of assets in the form of
stocks or inventory may reflect the reality that stocks are now relatively easier to
audit due to advancement in stock inventory system and auditing technology.
The losses incurred within the last three years (3YEARSLOSS) show a
significant negative correlation with audit fees. This could imply that the
companies that have experienced continuous losses may have less funds and
therefore lower audit fees are charged by their auditor. The significant
correlation results for these variables are consistent with the argument that client
riskiness is an important audit fees determinant, as highlighted by much of the
earlier literature (e.g. Simunic, 1980; O’Sullivan, 2000; Hay et al., 2006). The
correlation between audit fees and variables measuring complexity is also
consistent with the prediction. Audit fees are found to be significantly correlated
with number of subsidiaries. It is assumed that a bigger company that has many
subsidiary companies will pay higher audit fees and this is reflected in the
inclusion of the component of audit fees paid for audits of companies’
subsidiaries within the total audit fees category. Hence, it is understandable that
the more subsidiary companies a group has, the more audit fees the auditor
charges as remuneration for audit work. Further analysis of the subsidiaries
reveals that audit fees are also significantly correlated with the existence of US
subsidiaries since additional listing requirements of security commissions and
SOX may demand more audit work. Similarly, companies listed on FTSE 350
pay higher audit fees as compared to smaller capital companies listed on the
London stock exchange. This study, however, does not find any significant
correlation between audit fees and regulated companies, which signals that
auditors do not treat regulated clients and their non-regulated counterparts
differently. Accounting year ending during the busy period (BUSY) has a
significant positive association with audit fees. This result suggests that the
company whose accounting period is between 31st December and 31
st March
pays higher audit fees than do other companies as this is the busiest period for
the auditor due to most companies’ accounting years ending during this period.
203
This study finds a significant negative correlation between audit fees and report
lag (DELAY), which is counterintuitive as the period between the company’s
financial year-end and the signing of the audit report could reflect the
complexity of the account audited and thus affect audit fee charges. As expected,
Log total non-audit fees, individual components of non-audit fees, big audit
firms (BIG4) and auditors with London addresses (LONDON) have a significant
positive association with audit fees. The study also documented a significant and
negative correlation between the number of block holders and the equity owned
by the block holders and audit fees, which is consistent with prior studies (e.g.
Zaman et al., 2011; Krishnan and Visvanathan, 2009).
With respect to board characteristics, almost all variables show a correlation
result, which is consistent with the prediction except for the number of board
meetings. The board size, proportion of non-executive directors on the board and
also the proportion of independent directors on the board are positively
correlated with audit fees, suggesting that larger and independent boards are
associated with more expensive audits. This is consistent with prior studies such
as Adelopo and Jallow (2008) and O’Sullivan (2000). However, existence of
CEO duality shows a significant negative correlation with audit fees only at 5%
significant level. Similar to Zaman et al. (2011), this study fails to find any
significant correlation between audit fees and number of board meetings. The
study also finds the equity owned by non-executive directors and the equity
owned by executive directors to be significant and to negatively correlate with
audit fees. This is consistent with O’Sullivan’s (2000) finding of a significant
positive correlation between audit fees and executive and non-executive share
ownership.
With regards to audit committee characteristics, a number of variables show
significant and positive correlations with audit fees, for example, audit
committee size, annual audit committee meetings, and the existence of effective
audit committee members. This result suggests that larger, more diligent and
effective audit committees are associated with more expensive audit. There is a
significant negative association between audit fees and the proportion of finance
expert on audit committees, suggesting that greater expertise on the committee
reduces the need for more intensive and expensive audits. Splitting audit
204
committee finance experts into audit committee supervisory experts and audit
committee accounting experts reveals that only audit committee accounting
expertise has a significant negative association with audit fees. This is consistent
with the argument that accounting experts provide better monitoring, resulting in
the charging of lower audit fees by the auditor (Krishnan and Visvanathan,
2009). Only two proxies for audit committee effectiveness representing
compliance with the four core components of present audit committee regulation
(UK Corporate Governance Code, 2010), namely dummy variables representing
the existence of 3 (2 in a smaller company) audit committee members and at
least 4 meetings a year, have a positive and significant correlation with audit
fees.
A positive correlation between independent board and audit committee
effectiveness variable could reflect that independent directors promote audit
committee effectiveness to complement their own monitoring responsibilities
towards good corporate governance. It is also interesting to see the association
between other independent variables and client size. As expected, larger firms
are associated with larger board size and dominance by independent non-
executive directors. In addition, they are associated with more effective audit
committees which are also bigger in size and more diligent as measured by the
annual frequency of audit committee meetings. However, these firms are
associated with lesser proportion of finance experts, especially accounting
finance experts, on their audit committees. Ownership wise, larger firms are
associated with fewer numbers of block holders and also less block holder
ownership, suggesting that their equity is more likely to be owned by small
holdings. In addition, they are associated with lower executive and non-
executive share ownership, which might imply that bigger companies are more
concerned with the issue of board independence. A positive correlation between
company size and the number of subsidiaries and the existence of US
subsidiaries is expected as larger firms are more likely to have more subsidiaries
and some operate in bigger markets like the US. Riskiness wise, bigger firms are
associated with lower debtor to total assets ratio; however, they are also
associated with lower profitability, which is reflected by a lower return on asset
ratio (ROA). It seems that bigger firms are also highly geared as the correlation
205
value shows a significant positive value with gearing ratio. Other correlation
results show that bigger firms are positively and significantly associated with
regulated industries, financial industries, big audit firms and also auditors with a
London address. Correlation results also show that larger firms pay more in total
non-audit fees, which is not surprising; however, maybe due to concern over
auditor independence issues, they are less likely to obtain more non-audit
services as compared to audit service from their auditors. Scanning the
correlation results among the variables used in this study reveals only two
correlation values that are considered high. The first correlation value is between
company size and log audit fees, with a correlation value of 0.784. However, this
value is considered acceptable as Hair et al. (1995) and Gujrati (2003) suggest
that a correlation value below 0.80 is acceptable. In addition, other UK studies
such as O’Sulivan (2000) and Zaman et al. (2011) have recorded the same high
correlation for these two variables, with correlation values of 0.783 and 0.688
respectively. Correlation between proportion of non-executives on audit
committee (%ACNEXEC) and the dummy variable representing the existence of
all non-executives on audit committee (ACNEXECDUMMY) is in fact very
high, with a value of 0.993. Therefore, to avoid multicollinearity problems, these
variables are not included in the same regression model.
6.4 Multivariate Regression Analysis
Regression analysis is devided into two parts, the relationship between audit fees
and governance characteristics and the relationship between audit fees and
detailed non-audit fees. The study uses Ordinary Least Square (OLS) models to
explain the relationship existing between variables under study. Skewness and
kurtosis values are presented in appendix 3, which indicates that some of the
variables were transformed using natural logarithms in order to satisfy the
normality assumption for OLS. This study also conducted analysis of residuals
and Q-Q plot analysis to test for homoscedasticity and linearity. To deal with
possible multicollinearity issues, especially due to the presence of significant
correlations amongst some of the independent variables, as shown in table 6.2,
this study calculates the variance inflation factors (VIF) for all regression models
used. The variance inflation factors (VIF) values in all cases were significantly
less than 10 (generally seen as the level of concern) as Gujrati (2003, p339)

206
states that a VIF value of less than 10 is acceptable. In addition, as presented
earlier in the correlation matrix, the correlation values of the variables included
in each of the regression models were at an acceptable level (Correlation value
less than 8).
6.4.1 Governance Characteristics and Ownership Structure on Audit Fees
Table 6.3 contains the results of four main multivariate regression models that
test the relationship between governance characteristics and ownership structure
on audit fees. In all regression models, control variables are used to control for
client characteristics such as client size, complexity level, industry, and client
riskiness. Also included are variables to control for auditor characteristics such
as the presence of big four audit firms and those with a London address. Control
variables such as busy period, report lag and period to reflect the year dummies
to control for the fact that the study uses the same sample of firms in each of the
two years (2007 and 2010) are also included in the regression models.
F-statistics of each model in table 6.3 are significant at one percent level,
suggesting that the models are statistically valid. The R square values range
between 73.6% and 74.4%, while the adjusted R square value for all models
ranges between 72.7% and 73.4%. This shows that each model has a high
explanatory power. The total number of observations is 768. The VIF values for
all variables are mostly below 2 except for LOGTOTALASSETS, which shows
a slightly higher value (2.899 in model 2). This indicates that there is no
multicollinearity problem in the model.
The results of the control variables in all four models are consistent with existing
research. Both audit client size and complexity have a positive and significant
impact on audit fees. In this respect, many studies (e.g. Low et al., 1990; Firth,
1997; Carson et al., 2004; Lawrence et al., 2011) have found that the size of the
client company as measured by their total assets is the major factor in
determining the audit fee. Additionally, in his latest paper, Hay (2012) confirms
that in research conducted between 1980 and 2007 client size was the most
consistent and important audit fee determinant. This is consistent with the
expectation that the auditor charges higher audit fees to a bigger company as
more audit effort is needed in auditing the financial statements in the form of
207
testing and analysis of data and information (Simunic, 1980; Firth, 1985; Chan
et al., 1993; Pong and Whittington, 1994; Simon, 1995; Firth, 1997; Adams et
al., 1997).
The level of audit effort is expected to increase with the increasing complexity
of the audit task, thereby directly influencing audit fees. Past studies like Maher
et al. (1992), Brinn et al. (1994), Chan et al. (1993), Pong and Whittington
(1994), Gist (1994a), O’Sullivan (1999), O’Sullivan (2000), O’Sullivan and
Diacon (2002) and Basioudis and Fifi (2004) have found that the number of
subsidiaries had a significant positive impact on the audit fees in their sample
companies. The finding is consistent with the expectation that more audit effort
is needed as a result of consolidation and elimination of intra-group transactions.
This study however further analyses the subsidiaries as number of UK
subsidiaries (UKSUBS) and number of US subsidiaries (USSUBS), as suggested
by O’Sullivan (2000). The result of the four models shows that the number of
UK subsidiaries has a negative and significant relationship with audit fees at
10% confidence level, while the number of US subsidiaries shows a positive and
significant relationship at 1% confidence level. Taken together, the log total
number of subsidiaries also shows a positive relationship with audit fees. The
negative relationship between audit fees and number of UK subsidiaries may
reflect that the auditor gives discount to companies with UK subsidiaries,
probably because auditing these is less hassle as compared to overseas
subsidiaries. The result for US subsidiaries is consistent with O’Sullivan (2000),
who found a significant positive relationship between US subsidiaries and audit
fees. The result could reflect that more audit work is required to audit companies
with US subsidiaries due to cross listing and more complex regulation, such as
SOX. Regulated industry (REG) is another complexity measure that has a
significant negative impact on audit fees (significant at 1% confidence level).
Studies have typically found reduced audit fees for companies operating in
regulated industries (e.g. Ezzamel et al., 1996; O’Sullivan, 1999; O’Sullivan,
2000). This could be due to less audit work being needed as regulated companies
are closely governed by oversight bodies. This finding suggests that regulatory
oversight partially substitutes for external auditors as a monitoring mechanism,
which leads to lower audit fees. Only two variables measuring riskiness: ratio of

208
debtors to total assets (DEBTORS) and ratio of stocks to total assets (STOCK),
show significant impact on audit fees. As expected, the ratio of debtors to total
assets (DEBTORS) has a significant positive impact on audit fees, which
suggests that auditors perceive companies with higher debtors to total assets
ratios as risky and charge higher audit fees. This is supported by Carcello et al.
(2002), who reported that the receivable to total asset ratio has a significant
positive impact on audit fees in a study using data from 258 fortune 1000 US
companies from 1992-93. However, contrary to the expectation and findings of
past studies, the ratio of stock to total assets (STOCK) has a negative and
significant relationship with audit fees. This result could reflect that the
contemporary auditing practice, especially with the availability of modern
auditing technologies to deal with auditing of stock, simplified the auditing
process. Therefore, lower audit fees will be charged. It was expected that report
lag (LOGDELAY) would have a significant positive impact on audit fees as the
longer time taken is likely to be due to a need for more audit testing and
investigation. The regression results show a significant positive relationship (at
10% confidence level) between report lag and audit fees. The result is supported
by other UK studies such as Chan et al. (1993), Ezzamel et al. (1996) and
O’Sullivan (2000), which found a significant positive relationship between audit
fees and lag between year end and date of the audit report. Although it is
predicted that auditing during the auditing busy season (normally at the
beginning of the calendar year) could lead to higher audit fees, there is no
evidence that audits undertaken in this busy period (i.e. between 31st December
and 31st March) do in fact lead to higher audit fees. This is supported by
O’Sullivan (1999 and 2000), who also failed to find any evidence that auditing
during the busy season has a significant impact on audit fees. This is further
confirmed by Hay et al. (2006), who found that out of 32 studies between 1980
and 2003 that examined the relationship between audit fees and busy season,
only 5 reported a significant positive relationship, 2 reported negative results and
the remaining results were insignificant. For auditor related variables, the current
study provides evidence that the address of the audit firm could itself affect audit
pricing. Consistent with prior research such as that of O’Sullivan (2000), this
study finds that London-based auditors charge their audit clients higher audit
fees than do their regional counterparts. Hay (2012) found that audit pricing

209
studies, especially those conducted in the UK, that use this measurement show a
very consistent positive relationship with audit fee. It is widely hypothesized that
large audit firms will demand higher fees (Cameran, 2005) due to higher level of
audit quality (DeAngelo, 1981), higher litigation risk (Al-Harshani, 2008) and
possession of a stronger brand name (Basioudis and Fifi, 2004). However, this
study finds no evidence that Big Four (BIG4) auditors are more expensive
auditors. This is consistent with studies in USA and UK that have found no
significant difference between fees paid to big audit firms and non-big firms
(Simunic, 1980 and Brinn et al., 1994). However, further analysis reveals that
the average total assets of the sample companies are £21,368 million. Early
studies conducted between the early and mid-1980s (Simunic, 1980; Simon,
1986; Francis and Stokes, 1986; Palmrose, 1986) found that auditor size was not
significant in cases of very large companies with assets of over $600 million.
For relatively small companies, with mean assets of less than $100 million,
auditor size had a positive relationship with audit fees (Francis, 1984; Francis
and Stokes, 1986; Palmrose, 1986; Francis and Simon, 1987; Lee, 1996;
McMeeking et al, 2006). One possible explanation for this result is that
economies of scale offset the price premium for Big auditors in the large client
segment (Francis and Stokes, 1986) and the positive relationship among smaller
clients reflects the effect of product differentiation by the auditor rather than
abuse of monopolistic power (McMeeking et al., 2006). Despite “knowledge
spill-over” and “loss-leader” theories that could lead to a negative relationship
between non-audit fees and audit fee, many studies have found that non-audit
fees are positively related to audit fees ( e.g. Ezzamel et al., 2002; Firth, 2002;
McMeeking et al., 2006; Hay et al., 2006; Che Ahmad et al., 2006; ). The results
of this study support the positive relationship between non-audit fees and audit
fee as a regression that shows a significant positive impact of non-audit fees on
audit fees. A detailed discussion on this relationship is provided in the discussion
of specific results that test the hypothesis on the impact of non-audit fees on
audit fees. The dummy variable indicating the period shows an insignificant
relationship with audit fees.
Hypotheses H1a, H1b and H1c test the relationship between audit fees and board
independence. Contrary to the expectation that independent board will support
210
the purchase of higher quality audit, board independence variables, the
percentage of independent non-executive directors (%INDDIRS) has an
insignificant negative relationship with audit fees. The result is similar when the
independence variable is substituted for the percentage of non-executive
directors (%NEXEC). Therefore both H1a and H1b are rejected. The finding of
this study is therefore inconsistent with those from prior studies in the UK, US,
Hong Kong and Malaysia (O’Sullivan, 2000; Carcello et al., 2002; Tsui et al.,
2001 and Bliss et al., 2007), which found that the percentage of non-executive
directors has a significant positive impact on audit fees. Two UK studies, Bliss
et al. (2007) and Zaman et al. (2011), have documented that CEO/chairman
duality has a significant impact on audit fees. However, the result of this study
fails to document the same finding. Therefore, the third Hypothesis (H1c): that
CEO duality has a significant negative impact on audit fees, is also rejected. The
result of this study, however, is consistent with O’ Sullivan’s (2000) finding of
an insignificant relationship between CEO/chairman duality and audit fees. The
small variation in the incident of CEO duality ( 2%) as shown by descriptive
statistics earlier might explain why the result is not significant.
It is expected that more experienced and larger boards could enhance board
effectiveness; thus a higher quality audit would be required that would lead to
higher audit fees. Therefore, model 2 tests the impact of board size
(BOARDSIZE) on audit fees. To avoid multicollinearity effects, as these two
variables have quite high correlation with each other, audit committee size
(ACSIZE) is not included in the model. Consistent with previous UK studies
(e.g. Boo and Sharma, 2008 and Adelopo and Jallow, 2008), this study finds an
insignificant positive relationship between board size and audit fees.
Consequently, hypothesis H2, predicting a positive relationship between board
size and audit fees, is rejected. Hypothesis H3 tests whether there will be a
positive relationship between the number of board meetings and the audit fee.
However, this study fails to find any significant relationship between board
diligence and audit fees. While standard coefficient values show that board
diligence, measured by the number of board meetings held during the year show
a positive association, the relationship found is not statistically significant ( p =
0.113). As a result, hypothesis H3 is also rejected. Overall, results show that
211
board characteristics, including board size, board independence and board
diligence, have no significant impact on audit pricing decisions. This could be
due to the fact that price discount as a result of improved internal control by
having an effective board in place is offset by additional testing and audit work
requested by an effective board to complement their monitoring role. This is
because, in the wake of corporate scandal and failure, an effective board may
encourage increased testing by the auditors so as to minimise the likelihood of
future financial problems to the firm and to avoid subsequent criticism
associated with it.
Hypothesis H4 tests the relationship between audit committee effectiveness and
audit fee. Four cornerstones of good audit committee as required by the Codes
(e.g. UK Codes of Corporate Governance, 2010), comprising audit committee
size (at least 3 or 2 for small companies), meeting frequency (a minimum of 3
meetings a year), independence (all audit committee members should be non-
executive directors) and the presence of a financial expert, are used. A dummy
variable is used to indicate the presence of an effective audit committee which
fulfils all these conditions. It is expected that effective audit committee will
request a higher quality audit to safeguard the shareholder against any financial
fraud and irregularities. A similar composite measure of audit committee
effectiveness is used by Zaman et al. (2011). However, contrary to the result of
their study, this study fails to document the same significant positive relationship
between effective audit committee (ACE) and audit fees. Therefore, hypothesis
H4, predicting a positive relationship between audit committee effectiveness and
audit fees, is rejected. The result may indicate that widespread adoption of the
minimum requirements for an effective audit committee as set out by the Codes
serves to eliminate fee reductions that were previously enjoyed by better
governed companies.
This study also tests the relationship between audit fees and individual audit
committee characteristics. In models 1 to 3, the variables measuring audit
committee independence, size, finance expertise, activity and commitment are
tested against audit fees. Hypothesis H5 predicts that there will be a positive
relationship between audit committee independence (measured by the
percentage of non-executive directors on audit committee) and audit fee. The
212
study, however, fails to document any significant positive impact of the
percentage of non-executive directors on the audit committee on audit fees. The
result of this study is inconsistent with those found in Zaman et al. (2011).
Descriptive statistics show that 99% of the sample companies have 100% non-
executive membership on their audit committees and the average percentage of
non-executive directors on audit committees is 99.7%. Again, widespread
adoption of the requirements of the Combined Code of Corporate Governance
(2003) and also the UK Corporate Governance Code (2010) has reduced the
empirical power, leading to an insignificant result. Therefore, Hypothesis H5 is
also rejected.
Hypothesis 6 tests the impact of audit committee size on audit fee. The study
documents a significant positive relationship between audit committee size and
audit fees. Therefore, Hypothesis H6 is accepted. This finding is supported by
Kalbers and Fogarty (1993), who suggest that a large audit committee is more
likely to enhance the status and power of the committee within the organisation
and demand higher quality audits. The enhanced status and access to more
resources enable the audit committee to function effectively, thereby increasing
quality of internal governance (Zaman et al., 2011; Pincus et al., 1989). A UK
study (Zaman et al., 2011) and US study (Vafeas and Waegelein, 2007) also
produced evidence that audit committee size is positively associated with audit
fees.
Hypothesis H7 tests the relationship between the proportion of audit committee
finance experts on audit committee and audit fees. Models 1 and 2 test the
relationship between the proportion of audit committee finance expertise and
audit fees. Model 3 provides detailed analysis of finance expertise, which is
divided into supervisory expertise and accounting expertise. However, this study
fails to find any significant relationship between audit fees and any of the
measures of audit committee expertise. The result indicates that audit committee
expertise is not an important factor in determining audit pricing decision.
Therefore, hypotheses H7a, H7b and H7c are not supported. The result of this
study is supported by Zaman et al. (2011), who also found an insignificant
relationship.

213
Hypotheses H8a and H8b test the relationship between audit committee
diligence and audit committee commitments and audit fee. It was expected that
there would be a positive relationship between number of audit committee
meetings (measuring audit committee diligence) and audit fee. The study finds
enough evidence to conclude that there is a significant positive relationship
between audit fees and audit committee diligence. Therefore Hypothesis H8a is
supported. The result of this study is also supported by a US study (Abbott et. al,
2004) and an Australian study (Goodwind-Steward and Kent, 2006). The result
implies that active audit committees support the purchase of higher quality
audits to complement their monitoring function to safeguard the shareholders
against any financial irregularities and fraud. Related to this, hypothesis H8b
tests the relationship between audit committee commitment and audit fee.
Commitment is measured by the weighted percentage of audit committee
members’ attendance at the scheduled audit committee meetings. It is expected
that audit committee commitment will have a significant positive relationship
with audit fees since committed audit committee members will demand higher
quality audit from the auditor which will lead to a higher audit fee. As expected,
the study finds that audit committee commitment has a significant positive
relationship with audit fees at 10% confidence level. Therefore, hypothesis H8b
is accepted. This is an important contribution of the study as no previous audit
pricing studies have considered audit committee commitment.
This study also considers ownership structure in an audit pricing model.
Hypothesis H9a tests the relationship between large blockholder share
ownership and audit fee. It is expected that share ownership by large
blockholders will have a negative impact on audit fee. This is based on the
argument that major shareholders in companies with more concentrated
ownership are more likely to be actively involved in monitoring managerial
behaviour thus reducing the need for more extensive audit, which will then lead
to a lower audit fee. However, this study fails to find any evidence that share
ownership by large blockholders has a significant impact on audit fees. The
insignificant result is supported by another UK study (O’Sullivan, 2000).
Hypotheses H9b and H9c test the relationship between the percentage of
executive share ownership and non-executive share ownership and audit fee. It is
214
predicted that both types of ownership will have a negative relationship with
audit fees. As expected, both types of ownership have a significant negative
impact on the audit fee. The regression results show that proportion of non-
executive director share ownership has a very significant negative relationship
with audit fees (at 1% confidence level) while proportion of executive director’s
share ownership shows a significant negative relationship with audit fees at 10%
confidence level. Therefore, both hypothesis H9b and H9c are accepted. The
result of this study is supported by O’Sullivan’s (2000) finding of a significant
negative relationship between both types of share ownership (non-executive and
executive share ownership) and audit fee. The result of the study pertaining to
executive share ownership implies that insider ownership reduces agency cost as
it acts as a substitute for external audit effort in monitoring management and
therefore leads to lower audit fee. In the same vein, non-executive directors
possessing significant equity shares may have business or family links with the
company and consequently behave in a similar manner to their executive
director colleagues.
6.4.2 Non-Audit and Audit Fees
Hypothesis H10 tests the relationship between non-audit and audit fees.
Additional analysis is run to test the relationship between audit fees and
individual components of non-audit service. In earlier models, Log total non-
audit fee was used as a control variable to assess the impact of governance and
ownership structure on audit fees. Consistent throughout all the models, it is
found that log non-audit fees have a very significant and positive impact on audit
fees (p=000). Therefore, Hypothesis H10, predicting a positive relationship
between non-audit fees provided by the auditor and the audit fee, is accepted.
This finding is strongly supported by Hay et al. (2006), who affirm that the
majority of studies undertaken between 1977 and 2003 found a positive
relationship between non-audit fees and audit fees. Joint provision of non-audit
and audit services reduces the price per unit of audit services and triggers the
purchase of more audit services (Simunic, 1984; Firth, 2002). In addition, client
specific events such as mergers and acquisitions, share issues, implementation of
new accounting and information services generate demand for consultancy
services and this increases the amount of audit work (Ezzamel et al., 2002; Firth,
215
2002). A client’s financial position and weaknesses are exposed as a result of
joint provision of audit and non-audit services; consequently, the auditor may
price the risk identified by charging higher audit fees for problematic clients.
Monopolistic power over non-audit services also allows the auditor to charge an
audit fee premium (Hay et al., 2006), especially with accounting firms
increasingly promoting themselves as “one stop” service providers (McMeeking,
2006). The finding of a significant positive relationship contradicts the
theoretical logic of a negative relationship between audit fees and non-audit fees
as a result of knowledge spillover (Simunic, 1984; Antle et al., 1997; Whisenant
et al., 2003; Clatworthy et al., 2002; Antle et al., 2006) and loss leader theory
(Hillison and Kennelley, 1988; Hay et al., 2006a). This finding does not support
the total prohibition of non-audit service which is proposed by the Green Paper
on audit policy (European Commission, 2010) as the provision of non-audit
services actually increases the quality of audit service (at least when higher audit
fees means more intensive audits).
As additional analysis, individual component of non-audit is tested against audit
fees. Individual investigation is possible as the Companies (Disclosure of
Auditor Remuneration and Liability Agreements) Regulations 2005 require
listed companies to disclose individual non-audit services in their annual report.
First, the study predicts a positive relationship between other services supplied
pursuant to legislation and audit fees. This study supports the finding that non-
audit services supplied pursuant to legislation are an important audit fee
determinant. The regression result in model 5 shows that other non-audit
services pursuant to legislation have a significant positive impact on audit fees.
This is supported by Beattie et al. (1996), who stated that most of the non-audit
services provided by auditors are not management consultancy tasks, but instead
are essential accounting services that enable listed companies to comply with
legal and regulatory requirements. Second, this study predicts a positive
relationship between other services relating to taxation and audit fees. The
regression results show that non-audit services relating to taxation have a
significant positive relationship with audit fees, therefore hypothesis 10c is
supported. This is supported by Davis et al. (1993), who found a significant
positive relationship between tax services and their measures of audit efforts:

216
unweighted audit hours, audit hours weighted by billing rate ratios, and audit
hours weighted by billing rate. Similarly, Palmrose (1986a) documented that
audit fees are even higher when the client purchases non-accounting advisory
and tax services from the incumbent auditor. This study also predicts a positive
relationship between services relating to corporate finance transactions and audit
fees, while a positive relationship between other non-audit services and audit
fees is predicted. However, the result for non-audit services relating to corporate
finance (LOGCORPFIN) shows no significant impact on audit fees. This is
inconsistent with Firth (2002), who predicts that corporate restructuring will
result in more audit effort as the auditor will have to learn the new organisational
structure and its impact on the financial accounts. Using survey questionnaires to
obtain information on the different categories of non-audit services provided by
auditors and by non-auditors, Ezzamel et al. (1999) concluded that corporate
finance provided by incumbent auditors significantly and positively correlated
with audit fees. The regression result shows that other non-audit services have a
significant positive impact on audit fees. Other non-audit services here is a
combination of many non-audit services, such as services related to pension
scheme, information system, actuarial service, SOX related services and other
services. As discussed earlier, a client’s financial position and weaknesses are
exposed as a result of joint provision of audit and non-audit services. As a result,
the auditor may price the risk identified by charging higher audit fees for
problematic clients. The regression results for other variables are broadly
consistent with the results in the main models except for audit committee
meetings and audit committee commitment, which are found not significant in
model 5. In addition, big four auditor (BIG4) is found to have a significant
positive relationship with audit fees.
In addition, this study also tests the relationship between audit fees and the
instance where non-audit fee is more dominant than audit fee. A dummy variable
(AUDITVSNON) is used to measure this. The regression result in model 6
shows that audit fees has a significant negative relationship with the variable.
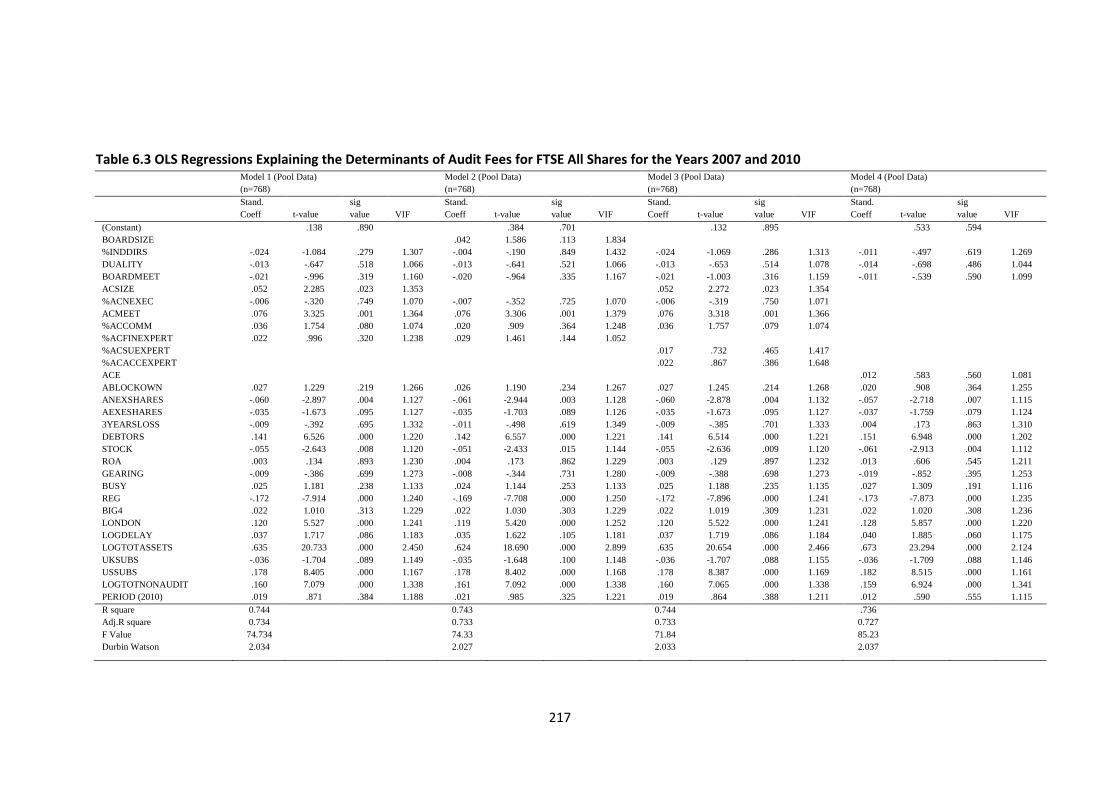
217
Table 6.3 OLS Regressions Explaining the Determinants of Audit Fees for FTSE All Shares for the Years 2007 and 2010 Model 1 (Pool Data) Model 2 (Pool Data) Model 3 (Pool Data) Model 4 (Pool Data)
(n=768) (n=768) (n=768) (n=768)
Stand.
Coeff t-value
sig
value VIF
Stand.
Coeff t-value
sig
value VIF
Stand.
Coeff t-value
sig
value VIF
Stand.
Coeff t-value
sig
value VIF
(Constant) .138 .890 .384 .701 .132 .895 .533 .594
BOARDSIZE .042 1.586 .113 1.834
%INDDIRS -.024 -1.084 .279 1.307 -.004 -.190 .849 1.432 -.024 -1.069 .286 1.313 -.011 -.497 .619 1.269
DUALITY -.013 -.647 .518 1.066 -.013 -.641 .521 1.066 -.013 -.653 .514 1.078 -.014 -.698 .486 1.044
BOARDMEET -.021 -.996 .319 1.160 -.020 -.964 .335 1.167 -.021 -1.003 .316 1.159 -.011 -.539 .590 1.099
ACSIZE .052 2.285 .023 1.353
.052 2.272 .023 1.354
%ACNEXEC -.006 -.320 .749 1.070 -.007 -.352 .725 1.070 -.006 -.319 .750 1.071
ACMEET .076 3.325 .001 1.364 .076 3.306 .001 1.379 .076 3.318 .001 1.366
%ACCOMM .036 1.754 .080 1.074 .020 .909 .364 1.248 .036 1.757 .079 1.074
%ACFINEXPERT .022 .996 .320 1.238 .029 1.461 .144 1.052
%ACSUEXPERT .017 .732 .465 1.417
%ACACCEXPERT .022 .867 .386 1.648
ACE .012 .583 .560 1.081
ABLOCKOWN .027 1.229 .219 1.266 .026 1.190 .234 1.267 .027 1.245 .214 1.268 .020 .908 .364 1.255
ANEXSHARES -.060 -2.897 .004 1.127 -.061 -2.944 .003 1.128 -.060 -2.878 .004 1.132 -.057 -2.718 .007 1.115
AEXESHARES -.035 -1.673 .095 1.127 -.035 -1.703 .089 1.126 -.035 -1.673 .095 1.127 -.037 -1.759 .079 1.124
3YEARSLOSS -.009 -.392 .695 1.332 -.011 -.498 .619 1.349 -.009 -.385 .701 1.333 .004 .173 .863 1.310
DEBTORS .141 6.526 .000 1.220 .142 6.557 .000 1.221 .141 6.514 .000 1.221 .151 6.948 .000 1.202
STOCK -.055 -2.643 .008 1.120 -.051 -2.433 .015 1.144 -.055 -2.636 .009 1.120 -.061 -2.913 .004 1.112
ROA .003 .134 .893 1.230 .004 .173 .862 1.229 .003 .129 .897 1.232 .013 .606 .545 1.211
GEARING -.009 -.386 .699 1.273 -.008 -.344 .731 1.280 -.009 -.388 .698 1.273 -.019 -.852 .395 1.253
BUSY .025 1.181 .238 1.133 .024 1.144 .253 1.133 .025 1.188 .235 1.135 .027 1.309 .191 1.116
REG -.172 -7.914 .000 1.240 -.169 -7.708 .000 1.250 -.172 -7.896 .000 1.241 -.173 -7.873 .000 1.235
BIG4 .022 1.010 .313 1.229 .022 1.030 .303 1.229 .022 1.019 .309 1.231 .022 1.020 .308 1.236
LONDON .120 5.527 .000 1.241 .119 5.420 .000 1.252 .120 5.522 .000 1.241 .128 5.857 .000 1.220
LOGDELAY .037 1.717 .086 1.183 .035 1.622 .105 1.181 .037 1.719 .086 1.184 .040 1.885 .060 1.175
LOGTOTASSETS .635 20.733 .000 2.450 .624 18.690 .000 2.899 .635 20.654 .000 2.466 .673 23.294 .000 2.124
UKSUBS -.036 -1.704 .089 1.149 -.035 -1.648 .100 1.148 -.036 -1.707 .088 1.155 -.036 -1.709 .088 1.146
USSUBS .178 8.405 .000 1.167 .178 8.402 .000 1.168 .178 8.387 .000 1.169 .182 8.515 .000 1.161
LOGTOTNONAUDIT .160 7.079 .000 1.338 .161 7.092 .000 1.338 .160 7.065 .000 1.338 .159 6.924 .000 1.341
PERIOD (2010) .019 .871 .384 1.188 .021 .985 .325 1.221 .019 .864 .388 1.211 .012 .590 .555 1.115
R square 0.744
0.743
0.744
.736
Adj.R square 0.734
0.733
0.733
0.727
F Value 74.734
74.33
71.84
85.23
Durbin Watson 2.034
2.027
2.033
2.037

218
This result implies that when non-audit service is dominant, the auditor will give
a price discount to their audit client. Both models produce a high R square value
of 0.743 and 0.734 and F value of 66.264 and 70.96 respectively, showing that
the models are statistically valid and have high explanatory power.
Table 6.4: OLS Regressions Explaining the Determinants of Audit Fees
(Details of Non-Audit) for FTSE All Shares for the Years 2007 and 2010
Model 5 (n=768) Model 6(n=768)
Stand.
Coeff t-value
sig
value VIF
Stand.
Coeff t-value
sig
value VIF
(Constant) .938 .349 -.234 .815
BOARDSIZE -.023 -1.014 .311 1.308 -.024 -1.059 .290 1.307
%INDDIRS -.020 -.967 .334 1.066 -.017 -.817 .414 1.065
BOARDMEET .000 -.022 .982 1.152 .006 .284 .776 1.155
ACSIZE .053 2.305 .021 1.359 .060 2.569 .010 1.352
%NEXEC -.004 -.185 .854 1.070 -.002 -.097 .923 1.069
ACMEET .029 1.167 .244 1.596 .066 2.834 .005 1.361
%ACCOMM .030 1.447 .148 1.078 .037 1.781 .075 1.074
%ACFINEXPERT .020 .921 .357 1.239 .016 .732 .464 1.240
ABLOCKOWN .038 1.698 .090 1.273 .030 1.318 .188 1.266
ANEXSHARES -.080 -3.791 .000 1.140 -.068 -3.207 .001 1.122
AEXESHARES -.038 -1.785 .075 1.152 -.022 -1.051 .294 1.135
3YEARSLOSS -.006 -.276 .782 1.331 .000 .002 .999 1.334
DEBTORS .158 7.293 .000 1.219 .142 6.396 .000 1.231
STOCK -.047 -2.274 .023 1.124 -.048 -2.252 .025 1.124
ROA .009 .396 .692 1.231 .003 .128 .898 1.231
GEARING .004 .185 .853 1.292 -.006 -.271 .787 1.275
BUSY .031 1.488 .137 1.137 .029 1.369 .171 1.134
REG -.164 -7.446 .000 1.258 -.179 -8.085 .000 1.236
BIG4 .052 2.446 .015 1.178 .061 2.792 .005 1.181
LONDON .117 5.328 .000 1.245 .116 5.234 .000 1.244
LOGDELAY .029 1.366 .173 1.195 .038 1.771 .077 1.183
LOGTOTASSETS .611 18.902 .000 2.702 .689 23.009 .000 2.255
UKSUBS -.020 -.968 .334 1.151 -.029 -1.370 .171 1.146
USSUBS .176 8.268 .000 1.173 .178 8.228 .000 1.172
LEGIST(M) .050 1.982 .048 1.646
TAX(M) .105 4.298 .000 1.556
CORPFIN(M) .000 .007 .995 1.122
OTHERSERVICE(M) .064 2.711 .007 1.422
AUDITVSNON -.100 -4.806 .000 1.099
PERIOD .013 .588 .557 1.186 -.009 -.429 .668 1.186
R square .743
0.734
Adj.R square .731
0.724
F Value 66.264
70.96
Durbin Watson 2.07 1.976
219
6.4.3 Economic Crisis Effect
Hypothesis H11a tests whether the relationship between governance
characteristics and audit fees is stronger after the economic crisis. Table 6.5
shows the regression results of two models testing the relationship between
various audit fees determinants and audit fee. Model 7 is for the regression result
for the year 2007 (pre-economic crisis period) while model 8 shows the 2010
result (post-economic crisis period). The regression results show that the impact
of board independence and board activity on audit fee remains insignificant for
both periods, with p value of more than 0.1. With regards to the audit committee
characteristics, it is found that audit committee size and audit committee activity
or diligence have significant positive impact on audit fees before the economic
crisis (2007). However, the significant positive relationships found earlier (2007)
between audit fees and two of audit committee characteristics, audit committee
size (ACSIZE) and audit committee activity (ACMEET) disappear in the year
2010. Taken together, the regression results show that the relationship between
governance characteristics (board characteristics and audit committee
characteristics) is weaker after the economic crisis as compared to before the
economic crisis. Therefore, Hypothesis H11a is rejected. The insignificant result
in 2010 is inconsistent with Zaman et al. (2011), who found a significant
relationship between governance characteristics (especially audit committee
characteristics and audit fees). The significant relationship found in Zaman et al.
(2011) may be because the study utilised governance data from 2001 to 2004,
before the full implementation of the Smith Report (2003), when some of the
recommendations had not yet been enforced. This study (for the 2010 analysis)
uses data produced seven years after the publication of the report (Smith Report,
2003). Hence, it is believed that Smith’s recommendations regarding audit
committee effectiveness have been widely adopted by UK listed companies.
This is confirmed by descriptive statistics showing that in 2010, 89% of the
sample firms had effective audit committees as compared to the finding of 16%
by Zaman et al. (2011) a year after the implementation of Smith Report (2003).
The economic crisis and consequently the failure of many companies puts
additional pressures on the companies to follow the requirement of the Codes
and also guidance on the audit committee as close as possible to avoid being
220
blamed by the shareholders for ineffective Corporate Governance. Therefore, the
variation between companies, especially after the economic crisis, is likely to be
small and this weakens the power of the empirical tests. In a study on the impact
of governance characteristics during the post-Cadbury period, O’Sullivan (1999)
also found an insignificant relationship, whereby none of his board and audit
committee characteristics had a significant impact on audit fees, despite the
increased emphasis on internal governance mechanisms. Hypothesis 11b tests
whether the relationship between non-audit fees and audit fees is stronger after
the economic crisis. The results in table 6.4 show that non-audit fees remain as a
very significant audit fee determinant, even after the economic crisis. Therefore,
hypothesis H11b, predicting that the relationship between audit fees and non-
audit fees is stronger after the economic crisis, is rejected.
For the control variable, table 6.4 shows that company size (LOGTOTASSETS)
continues to have a significant impact on audit fees in 2010. This is supported by
many prior audit pricing studies, such as those of Low et al. (1990), Firth (1997),
Carson et al. (2004) and Lawrence et al. (2011), which find that the size of the
client as measured by their total assets is the major factor in determining the
audit fee. It seems that economic factors do not have any impact on the
relationship between audit fees and company size, as company size continues to
significantly affect audit pricing. This is consistent with the expectation that the
bigger the company, the more audit effort is needed in auditing the financial
statements in the form of testing and analysis of data and information (Simunic,
1980; Firth, 1985; Chan et al., 1993; Pong and Whittington, 1994; Simon, 1995;
Firth, 1997; Adams et al., 1997). For 2010, the variables measuring client
complexity, USSUBS, consistent with the 2007 result, show a positive
significant impact on audit fees. This proves that in 2010 auditors continued to
consider companies with many subsidiaries, especially those with US
subsidiaries, as more complex, and were charging higher audit fees. This is
because audits of accounts of companies with many subsidiaries require a
greater degree of testing and effort across all subsidiaries, involving a variety of
statutory and disclosure requirements, and hence incurring higher fees. In
addition, the auditor also has to bear inquiry costs and to deal with intra group
transactions, which could complicate the auditing process. The industry in which

221
the client operates also determines the audit fees charged by an auditor. This
study finds evidence that in 2010, regulated industries (REG) paid less in audit
fees than their non-regulated counterparts. This finding is consistent with the
2007 result and with the finding by Ezzamel et al. (1996), O’Sullivan (1999) and
O’Sullivan (2000) that audit fees are typically lower among companies operating
in regulated industries. The results on variables measuring company risk are
mixed with the inventory over total assets ratio (STOCK), existence of loss in
the current year (LOSS10) and gearing ratio (GEARING), showing an
insignificant relationship. The results on both gearing ratio (GEARING) and
LOSS10 are consistent with 2007. It could be concluded that in 2010 there is no
evidence to suggest that auditors saw the stock to total assets ratio and the
incidence of loss in the current year as an important indicator of client riskiness
or charged higher audit fees accordingly. This is supported by the finding of
Carcello et al. (2002) that stock to total assets ratio has no significant
relationship with audit fees. It seems that since the economic crisis the gearing
ratio has become less important in auditors’ determination of pricing. This
finding is inconsistent with studies in the Netherlands, Australia and Bahrain
(Langendijk, 1997; Francis and Stokes, 1986; Joshie and Al-Bastaki, 2000),
which reported a significant positive relationship between gearing ratio and audit
fees. The debtors to total assets ratio (DEBTORS) shows a significant positive
impact on audit fees. This result is consistent with the result for 2007 and
supported by Simunic (1980), who considered receivables as “risky” balance
sheet items that generally represent a material portion of the balance sheet figure
and could increase the level of audit effort and also the risk of a material
misstatement due to items being missed by the auditor. Similar to the results of
the 2007 analysis, this study finds that in 2010 the length of delay between a
company’s financial year-end and the signing of the audit report had a positive
impact on the audit fees; however, the relationship is not significant. This
finding is inconsistent with the prior expectation that report lag would have a
significant positive impact on audit fees as a longer time is taken, most likely
because of the need for more audit testing and investigation. This result does not
support the finding by Chan et al. (1993), Ezzamel et al. (1996) and O’Sullivan
(2000) of a significant positive relationship between report lag and audit fees.
Similarly, no evidence is found in either period that audits undertaken in the

222
busy period (i.e. between 31st December and 31
st March) attract an audit fee
premium, although it was predicted that auditing during the auditing busy season
(normally at the beginning of the calendar year) could lead to higher audit fees.
This finding is supported by O’Sullivan (1999 and 2000), who also failed to find
any evidence that auditing during the busy season has a significant impact on
audit fees. In respect to auditor-related variables, this study finds no evidence
that big audit firms (BIG4) have a significant positive impact on audit fees in
both periods. Like the 2007 analysis, this study also finds evidence that in 2010
the location of the auditor affected audit pricing. It is found that auditors with a
London address (LONDON) charge significantly higher audit fees to their audit
clients than their regional counterparts. This is consistent with other UK studies,
such as those of Chan et al. (1993), Ezzamel et al (1996), O’Sullivan (2000) and
Chaney et al. (2004), who found a significant positive relationship between audit
fees and whether the auditor was based in London.

223
Table 6.5: OLS Regressions Explaining the Determinants of Audit Fees for
FTSE All Shares for the Year 2007 (Pre Economic Crisis) and 2010 (Post
Economic Crisis)
model 7 (Pre-crisis 2007) Model 8 (Post crisis 2010)
(n=384) (n=384)
Stand.
Coeff
t-
value
sig
value VIF
Stand.
Coeff
t-
value
sig
value VIF
(Constant) .430 .668 -.415 .678
%INDDIRS .002 .082 .934 1.318 -.053 -1.548 .123 1.332
DUALITY -.027 -.988 .324 1.101 .003 .083 .934 1.210
BOARDMEET -.021 -.739 .461 1.167 -.019 -.574 .566 1.217
ACSIZE .066 2.065 .040 1.525 .033 .957 .339 1.340
%ACNEXEC -.007 -.247 .805 1.144 -.006 -.183 .855 1.332
ACMEET .094 3.057 .002 1.414 .057 1.638 .102 1.371
%ACCOMM .031 1.067 .287 1.235 .010 .335 .738 1.072
%ACFINEXPERT .028 1.018 .309 1.128 .048 1.538 .125 1.105
ABLOCKOWN .014 .490 .624 1.261 .041 1.192 .234 1.322
ANEXSHARES -.048 -1.728 .085 1.170 -.070 -2.225 .027 1.124
AEXESHARES -.050 -1.748 .081 1.223 -.020 -.641 .522 1.118
3YEARSLOSS -.013 -.465 .642 1.183 -.012 -.320 .749 1.507
DEBTORS .150 5.117 .000 1.285 .133 4.047 .000 1.213
STOCK -.054 -1.921 .056 1.161 -.054 -1.668 .096 1.165
ROA -.015 -.531 .596 1.192 .017 .503 .615 1.332
GEARING -.002 -.067 .947 1.324 -.020 -.599 .550 1.296
BUSY .042 1.528 .127 1.130 .000 -.003 .998 1.172
REG -.195 -6.692 .000 1.271 -.137 -3.983 .000 1.325
BIG4 .005 .178 .858 1.301 .034 1.029 .304 1.204
LONDON .119 4.073 .000 1.270 .123 3.672 .000 1.259
LOGDELAY .034 1.212 .227 1.175 .042 1.281 .201 1.232
LOGTOTASSETS .607 14.098 .000 2.758 .656 14.659 .000 2.245
UKSUBS -.039 -1.394 .164 1.145 -.039 -1.170 .243 1.264
USSUBS .179 6.314 .000 1.194 .182 5.627 .000 1.176
LOGTOTNONAUDIT .165 5.086 .000 1.568 .165 4.933 .000 1.255
R square 0.783
0.713
Adj.R square 0.766
0.690
F Value 46.684
31.958
Durbin Watson 2.093 2.004

224
6.4.4 Test of Robustness
As a robustness measure and to improve understanding, this study re-runs the
main regression model to test for the impact of using other measures of company
size, industry effect and client complexity on the audit fee. Table 6.6 presents
details of the regression models. In model 9, a dummy variable FINANCIALS
(indicating whether the company is a financial company or not) has been
included in the model to replace variable REG which indicates whether the
companies are in regulated industries. The regression result shows that variable
FINANCIALS has a significant negative relationship with audit fee. The result
indicates that financial companies enjoy price discounts from the auditor. As
stated earlier in the discussion of main regression models, less audit work is
needed for financial institutions as regulated companies are closely governed by
oversight bodies. In addition, regulatory oversight partially substitutes the
external auditors as a monitoring mechanism, which leads to lower audit fees.
Model 9 also substitutes the variable USSUBS (the number of US Subsidiaries)
with OSSUBS (the number of over-sea subsidiaries). As expected, the number of
overseas subsidiaries has significant positive impact on audit fees, similar to the
impact of the number of US subsidiaries on audit fees. Other variables show
consistent results with the main regression models.
Model 10 replaces the measure of company size, log total assets with log
turnover. As expected, log turnover also has a very significant positive
relationship with audit fee (p=0.000). The result is consistent with other studies
like Chan et al. (1993), Collier and Gregory (1996) and Owusu-Ansah et al.
(2010). It is interesting that one of the board variables, the annual number of
board meetings, now shows a very significant positive impact on audit fees. In
addition, return on asset ratio and busy period also show a very significant
impact on audit fees. Contrary to other models, it is found that the variable
measuring regulated industries no longer has a significant impact on audit fee.
Other variables behave similarly to the main model. The F-statistics for both
models are significant at one percent level, suggesting that the models are
statistically valid. Table 5.4 also shows that both models 9 and 10 have a very
high R square value at 0.746 and 0.744 respectively, showing that each model

225
has a high explanatory power. There are no heteroscedasticity problems as
Durbin Watson values show a figure around 2 (2.071 and 2.034 respectively).
This study also re-ran the regression using different variations of ownership
structure variables (see Appendix 3). The regression model used the number of
multiple large shareholders or the number of shareholders holding 3% or more
shares and the proportion of non-executive and executive directors holding
company shares. Contrary to expectation, the regression result shows that the
number of blockholders or large shareholders has significant positive impact on
audit fees. The result is inconsistent with Adelopo et al. (2012), who found a
significant negative relationship between audit fees and number of blockholders.
Proportion of non-executive and executive directors holding company shares are
both found to be not significantly related to audit fees. The results of other
variables are consistent with results for the main models.
It is argued that larger firms behave differently as compared to smaller firms in
terms of their demand for audit quality. Following the example of a previous UK
study (e.g. Zaman et al., 2011) that separated the sample into small and larger
firms, this study also runs separate regressions for larger and smaller firms by
splitting the sample companies into two parts, based on the median of total
assets. Models 11 and 12 represent small and big companies respectively. For
small companies, the log total asset shows a very significant positive impact on
audit fees. The same significant positive relationship with audit fee is found for
log total non-audit fees and the number of US subsidiaries. As expected, this
study finds enough evidence to argue that the proportion of assets represented by
debtors and regulated companies has a very significant positive impact on audit
fees in smaller companies. Contrary to the result of the pooled data (main
models), it is found that the proportion of assets represented by stocks is not
significantly related to audit fee. Other measures of client riskiness and
profitability (3 YEARSLOSS, ROA and GEARING) show consistent results
with the main model based on pooled data. In terms of auditor related variables,
this study documents a very interesting finding on big four audit firms (BIG4).
Contrary to the finding in the main model, this study finds enough evidence to
conclude that big four audit firms charge higher audit fees to their small audit

226
clients (p=0.031). This result is consistent with previous studies (e.g. Francis,
1984; Francis and Stokes, 1986; Palmrose, 1986; Francis and Simon, 1987; Lee,
1996; McMeeking et al, 2006) that have documented that relatively small
companies had a positive relationship with audit fees. The positive relationship
among smaller clients reflects the effect of product differentiation of the auditor
rather than abuse of monopolistic power (McMeeking et al., 2006). Similar to
the main models, auditor with a London address (LONDON) has a very
significant positive impact on audit fees. This result implies that auditors with a
London address also charge higher audit fees to their smaller size clients. None
of the board variables show any significant impact on audit fees. As for audit
committee characteristics, the regression results show that audit committee
diligence, measured by annual number of audit committee meetings (ACMEET),
has a very significant impact on audit fees. Besides diligence, this study also
documents that audit committee commitment (ACCOMM) has a positive and
significant relationship with audit fees. These two regression results imply that
diligent and committed audit committees in the small companies segment
require higher quality audits that lead to higher audit fees.
For big companies, the log total asset also shows a very significant positive
impact on audit fees. Similar to the small companies segment, the same
significant positive relationship with audit fee is found for log total non-audit
fees and number of US subsidiaries. For client riskiness variables, this study
finds enough evidence to conclude that the proportion of assets represented by
debtors has a very significant positive impact on audit fees. Contrary to the
result for the small companies segment, it is found that the proportion of assets
represented by stocks is negative and significantly related to audit fee. This
negative relationship could be the result of the relative ease of auditing with the
availability of auditing technology, which enables the auditor to give price
discounts to their audit clients in the big companies segment. Another interesting
finding for the big companies segment is that incidence of any loss in the past
three years (3YEARSLOSS) shows a significant positive impact on audit fee.
This result implies that auditors charge higher audit fees for big companies that
have experienced any loss in the past three years. Similar to the small companies
segment and the main models, other measures of client riskiness and profitability
227
show insignificant impact on audit fee. Similar to small companies, regulated
companies among big companies are paying less audit fees as a result of closer
supervison by regulatory bodies. For auditor characteristics, it is found that only
auditor with London address has a significant positive impact on audit fees while
Big4 auditor has no significant impact on audit fee. The insignificant impact of
Big4 auditors on audit fees in the big companies segment could be explained by
the fact that price discount as a result of economies of scale is offset by the price
premium for Big four auditors (Francis and Stokes, 1986). This is supported by
Simunic (1980), Simon (1986), Francis and Stokes (1986) and Palmrose (1986),
who found that auditor size was not significant in cases of very large companies.
Governance characteristics and ownership structure wise, it is found that
contrary to the result for the small companies segment and also the main models,
CEO duality shows a very significant negative impact on audit fees. The result is
consistent with Bliss (2011), who claimed that CEO duality constrains board
independence. In addition, in the presence of a dominant CEO, non-executive
directors are expected to have reduced influence in seeking an intensive audit
and this leads to lower audit fees (Desender et al., 2009; O’Sullivan, 2000). For
audit committee characteristics, only audit committee size and annual number of
audit committee meetings are found to have significant and positive impact on
audit fees. The results imply that in the big companies segment, audit
committees which are bigger in size and more diligent require higher quality
audits and this leads to higher audit fees. In contrast to the result in the small
companies segment and the main models, none of the ownership structure
variables show a significant impact on audit fee.
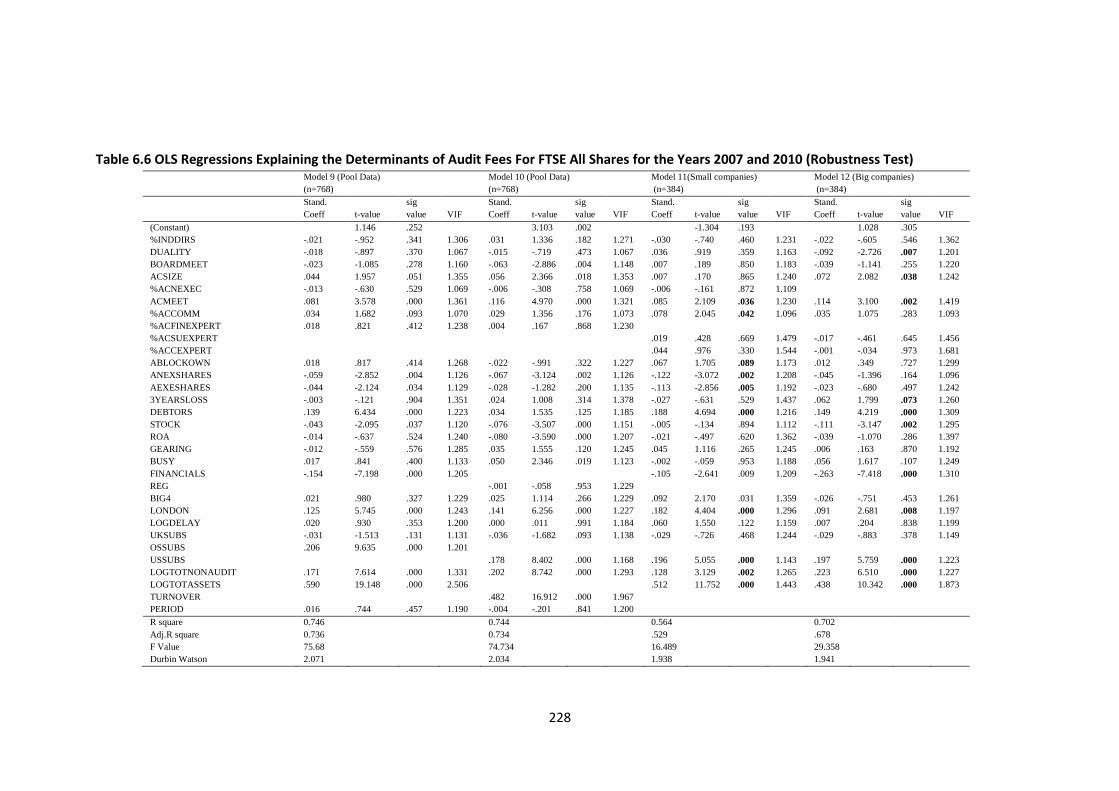
228
Table 6.6 OLS Regressions Explaining the Determinants of Audit Fees For FTSE All Shares for the Years 2007 and 2010 (Robustness Test) Model 9 (Pool Data) Model 10 (Pool Data) Model 11(Small companies) Model 12 (Big companies)
(n=768) (n=768) (n=384) (n=384)
Stand.
Coeff t-value
sig
value VIF
Stand.
Coeff t-value
sig
value VIF
Stand.
Coeff t-value
sig
value VIF
Stand.
Coeff t-value
sig
value VIF
(Constant) 1.146 .252 3.103 .002 -1.304 .193 1.028 .305
%INDDIRS -.021 -.952 .341 1.306 .031 1.336 .182 1.271 -.030 -.740 .460 1.231 -.022 -.605 .546 1.362
DUALITY -.018 -.897 .370 1.067 -.015 -.719 .473 1.067 .036 .919 .359 1.163 -.092 -2.726 .007 1.201
BOARDMEET -.023 -1.085 .278 1.160 -.063 -2.886 .004 1.148 .007 .189 .850 1.183 -.039 -1.141 .255 1.220
ACSIZE .044 1.957 .051 1.355 .056 2.366 .018 1.353 .007 .170 .865 1.240 .072 2.082 .038 1.242
%ACNEXEC -.013 -.630 .529 1.069 -.006 -.308 .758 1.069 -.006 -.161 .872 1.109
ACMEET .081 3.578 .000 1.361 .116 4.970 .000 1.321 .085 2.109 .036 1.230 .114 3.100 .002 1.419
%ACCOMM .034 1.682 .093 1.070 .029 1.356 .176 1.073 .078 2.045 .042 1.096 .035 1.075 .283 1.093
%ACFINEXPERT .018 .821 .412 1.238 .004 .167 .868 1.230
%ACSUEXPERT .019 .428 .669 1.479 -.017 -.461 .645 1.456
%ACCEXPERT .044 .976 .330 1.544 -.001 -.034 .973 1.681
ABLOCKOWN .018 .817 .414 1.268 -.022 -.991 .322 1.227 .067 1.705 .089 1.173 .012 .349 .727 1.299
ANEXSHARES -.059 -2.852 .004 1.126 -.067 -3.124 .002 1.126 -.122 -3.072 .002 1.208 -.045 -1.396 .164 1.096
AEXESHARES -.044 -2.124 .034 1.129 -.028 -1.282 .200 1.135 -.113 -2.856 .005 1.192 -.023 -.680 .497 1.242
3YEARSLOSS -.003 -.121 .904 1.351 .024 1.008 .314 1.378 -.027 -.631 .529 1.437 .062 1.799 .073 1.260
DEBTORS .139 6.434 .000 1.223 .034 1.535 .125 1.185 .188 4.694 .000 1.216 .149 4.219 .000 1.309
STOCK -.043 -2.095 .037 1.120 -.076 -3.507 .000 1.151 -.005 -.134 .894 1.112 -.111 -3.147 .002 1.295
ROA -.014 -.637 .524 1.240 -.080 -3.590 .000 1.207 -.021 -.497 .620 1.362 -.039 -1.070 .286 1.397
GEARING -.012 -.559 .576 1.285 .035 1.555 .120 1.245 .045 1.116 .265 1.245 .006 .163 .870 1.192
BUSY .017 .841 .400 1.133 .050 2.346 .019 1.123 -.002 -.059 .953 1.188 .056 1.617 .107 1.249
FINANCIALS -.154 -7.198 .000 1.205 -.105 -2.641 .009 1.209 -.263 -7.418 .000 1.310
REG -.001 -.058 .953 1.229
BIG4 .021 .980 .327 1.229 .025 1.114 .266 1.229 .092 2.170 .031 1.359 -.026 -.751 .453 1.261
LONDON .125 5.745 .000 1.243 .141 6.256 .000 1.227 .182 4.404 .000 1.296 .091 2.681 .008 1.197
LOGDELAY .020 .930 .353 1.200 .000 .011 .991 1.184 .060 1.550 .122 1.159 .007 .204 .838 1.199
UKSUBS -.031 -1.513 .131 1.131 -.036 -1.682 .093 1.138 -.029 -.726 .468 1.244 -.029 -.883 .378 1.149
OSSUBS .206 9.635 .000 1.201
USSUBS .178 8.402 .000 1.168 .196 5.055 .000 1.143 .197 5.759 .000 1.223
LOGTOTNONAUDIT .171 7.614 .000 1.331 .202 8.742 .000 1.293 .128 3.129 .002 1.265 .223 6.510 .000 1.227
LOGTOTASSETS .590 19.148 .000 2.506 .512 11.752 .000 1.443 .438 10.342 .000 1.873
TURNOVER .482 16.912 .000 1.967
PERIOD .016 .744 .457 1.190 -.004 -.201 .841 1.200
R square 0.746
0.744
0.564
0.702
Adj.R square 0.736
0.734
.529
.678
F Value 75.68
74.734
16.489
29.358
Durbin Watson 2.071 2.034 1.938 1.941

229
6.5 Chapter Summary
The chapter discusses empirical results of the study. The empirical results are
divided into descriptive analysis, correlation coefficients and regression results.
Descriptive statistics are used to explore the data. In descriptive analysis, details
of sample firms are first presented. The study focuses on 384 final samples of
FTSE companies, with all shares listed on the London Stock Exchange on 31st
December 2007, drawn from 10 different industries. This is followed by
descriptive statistics on all variables used in the regression models, including
control variables. For each variable, mean, median, standard deviation, min and
max values are presented in table 6.1 and this is followed by a write-up
describing the values found.
The analysis chapter continues with correlation coefficient results based on
Pearson correlations. Table 5.2 presents correlation results for all variables used
in the regression models. The analysis is important to selection of suitable
variables for later inclusion in the regression models. Any highly correlated
independent variables (r=0.8 and above) are excluded from regression models, to
avoid multicollinearity problems. No significant correlation is found between
independent variables. However, significant correlation (r=0.8 and above) is
found between some related variables due to singularity (e.g. between REG and
FINANCIAL). Singularity occurs when one independent variable is actually a
combination of other independent variables. As multiple regression does not
relate well to multicollinearity or singularity, variables with high singularity
problems are not included in the same regression model.
The relationship between audit fees and governance as well as ownership
structure is tested using four main regression models. The first model is
developed to test the relationship between the dependent variable LOGAUDIT
and board characteristics, audit committee characteristics, ownership structure
variables. Included in the models are control variables to control for client-
related variables, auditor-related variables and engagement related variables.
This is followed by another model where the audit committe size is replaced by
board size since both variables cannot be included in the same model due to the
230
quite high correlation coefficient between the two variables. The third model
splits the audit committee expertise into supervisory finance expertise and
accounting finance expertise. Finally, the last model tests the relationship
between audit fees and audit committee effectiveness (ACE), replacing
individual audit committee characteristics with composite variables measuring
audit committee effectiveness. The relationship between audit fees and non-audit
fees is tested in models 5 and 6. Model 5 tests the relationship between audit
fees and individual non-audit fees while model 6 tests the relationship between
audit fees and instances where non-audit services cost more than audit fees. It
can be summarised from the regression results that the R square value of all
models ranges from 0.736 to 0.908, while the F value is significant at 1%
confidence level, with a minimum value of 16.7 and a maximum value of 85.23.
The results for all models are broadly consistent with existing research. Both
audit client size and complexity have a positive and significant impact on audit
fees. However, the variables measuring client riskiness show mixed results, with
the ratio of debtors to total assets (DEBTORS) having a positive and significant
impact on audit fees, while the stock to total assets ratio (STOCKS) shows a
significant negative impact on audit fees. The variables measuring client
profitability/loss show an insignificant impact on audit fees. Consistent with
prior research, such as that of O’Sullivan (2000), this study finds that London-
based auditors charge their audit clients higher audit fees than their regional
counterparts. Consistent with most prior literature, this study finds that non-audit
fees have a significant positive impact on audit fees. It is also found that
management ownership and non-executive share ownership has a significant
negative impact on audit pricing. None of the board characteristics variables,
including board size, board independence (%NEXEC and %INDIRS) and board
diligence (BOARDMEET), is found to have a significant impact on audit fees
across the four main models tested. On the other hand, three audit committee
characteristics variables: audit committee size, audit committee diligence
(ACMEET) and audit committee commitment, are found to have a significant
impact on audit fees. As for the detailed non-audit fees variable, it is found that
other services supplied pursuant to legislation (LEGIST(M)), other services
relating to taxation (TAX(M) ) and other non-audit services

231
(OTHERSERVICE(M)) have a significant positive impact on audit fees while
other services relating to corporate finance are not significant.
Additional analysis reveals that when total non-audit fees are greater than the
audit fees (AUDITVSNON) this has a significant negative impact on audit fees,
signalling that auditor independence might be affected when non-audit services
provided by the auditor to their audit client exceed the audit service itself. The
regression results and the hypotheses tested are summarised in Table 6.7. This
study runs separate analyses to test the impact of economic crisis on the
relationship between audit fees and governance characteristics and the
relationship between audit fees and non-audit. The regression results show that
the economic crisis has not had any significant impact on either relationship.
Finally, robustness is tested by splitting the sample into small and big company
segments; the use of variations of client size, industry and ownership structure
variables is employed to increase understanding of the relationship between
audit fees and various audit fee determinants.
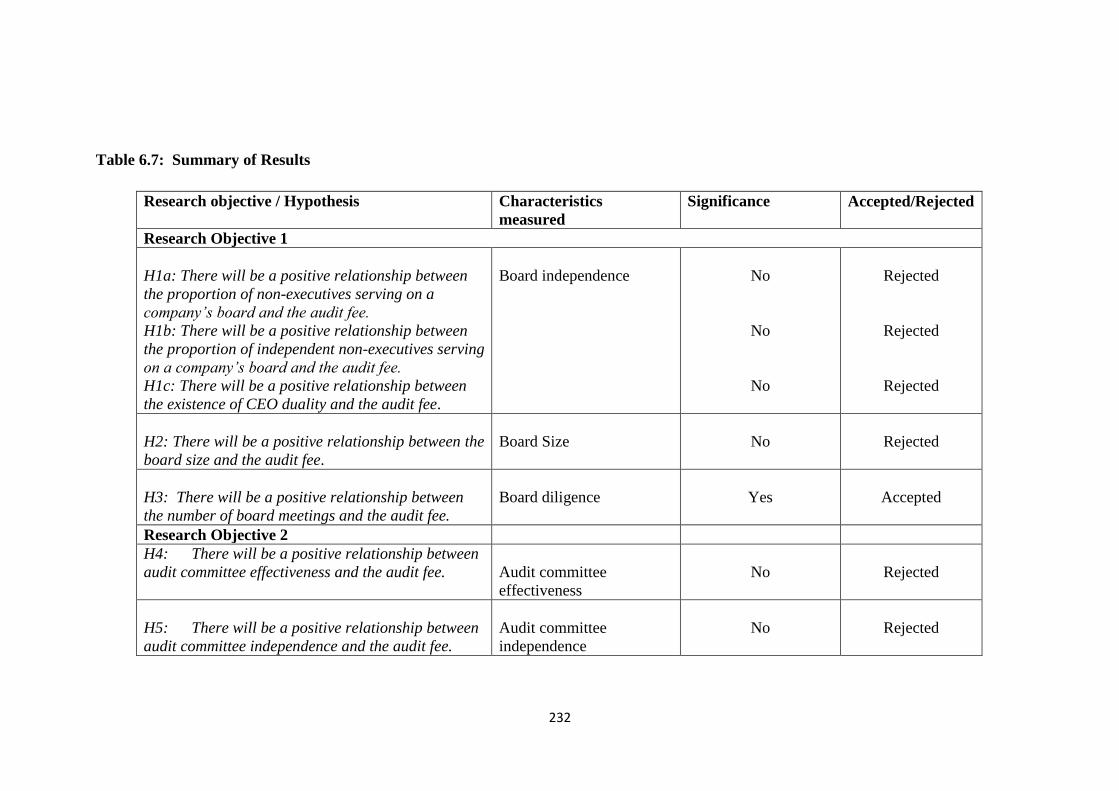
232
Table 6.7: Summary of Results
Research objective / Hypothesis Characteristics
measured
Significance Accepted/Rejected
Research Objective 1
H1a: There will be a positive relationship between
the proportion of non-executives serving on a
company’s board and the audit fee.
H1b: There will be a positive relationship between
the proportion of independent non-executives serving
on a company’s board and the audit fee.
H1c: There will be a positive relationship between
the existence of CEO duality and the audit fee.
Board independence
No
No
No
Rejected
Rejected
Rejected
H2: There will be a positive relationship between the
board size and the audit fee.
Board Size
No
Rejected
H3: There will be a positive relationship between
the number of board meetings and the audit fee.
Board diligence
Yes
Accepted
Research Objective 2
H4: There will be a positive relationship between
audit committee effectiveness and the audit fee.
Audit committee
effectiveness
No
Rejected
H5: There will be a positive relationship between
audit committee independence and the audit fee.
Audit committee
independence
No
Rejected
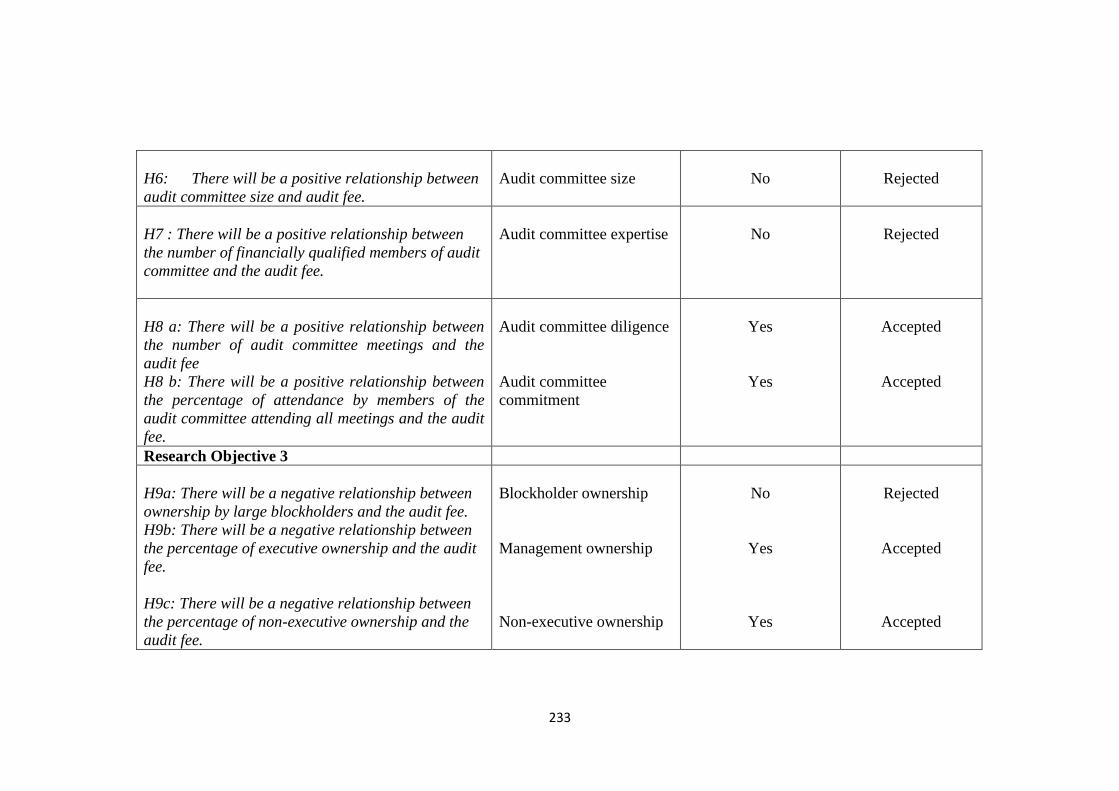
233
H6: There will be a positive relationship between
audit committee size and audit fee.
Audit committee size
No
Rejected
H7 : There will be a positive relationship between
the number of financially qualified members of audit
committee and the audit fee.
Audit committee expertise
No
Rejected
H8 a: There will be a positive relationship between
the number of audit committee meetings and the
audit fee
H8 b: There will be a positive relationship between
the percentage of attendance by members of the
audit committee attending all meetings and the audit
fee.
Audit committee diligence
Audit committee
commitment
Yes
Yes
Accepted
Accepted
Research Objective 3
H9a: There will be a negative relationship between
ownership by large blockholders and the audit fee.
H9b: There will be a negative relationship between
the percentage of executive ownership and the audit
fee.
H9c: There will be a negative relationship between
the percentage of non-executive ownership and the
audit fee.
Blockholder ownership
Management ownership
Non-executive ownership
No
Yes
Yes
Rejected
Accepted
Accepted
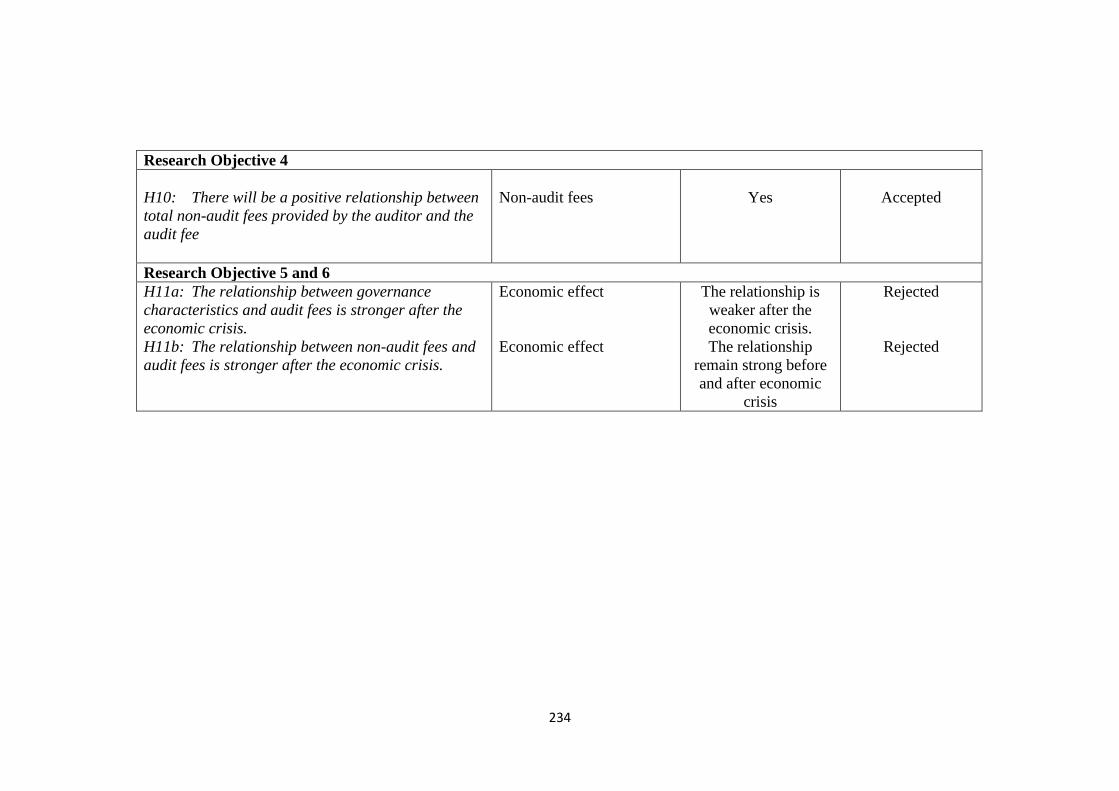
234
Research Objective 4
H10: There will be a positive relationship between
total non-audit fees provided by the auditor and the
audit fee
Non-audit fees
Yes
Accepted
Research Objective 5 and 6
H11a: The relationship between governance
characteristics and audit fees is stronger after the
economic crisis.
H11b: The relationship between non-audit fees and
audit fees is stronger after the economic crisis.
Economic effect
Economic effect
The relationship is
weaker after the
economic crisis.
The relationship
remain strong before
and after economic
crisis
Rejected
Rejected

235
CHAPTER 7: CONCLUSIONS
7.1 Introduction
Following the increase in concern regarding corporate governance, especially due
to the numerous corporate scandals and collapses (e.g. Enron, WorldCom and
Lehman Brothers in the US and Northern Rock in the UK), understanding the role
of external auditors in ensuring the transparency of Financial Statements and the
relationship between relevant governance characteristics and audit quality,
typically proxied by audit fees, has become more relevant. A few studies (e.g.
O’Sullivan 1999; O’Sullivan, 2000; Goddard and Master, 2000; Peel and
Clatworthy, 2001; O’Sullivan and Diacon, 2002; Zaman et al., 2011 and Adelopo
et al., 2012) based on the UK have examined the relationship between governance
characteristics and audit fees. With the exception of Adelopo et al. (2012) and
Zaman et al. (2011), who utilise data from the years 2005/2006 and the period
between 2001-2004 respectively, most of the research in the UK concerning
governance characteristics and audit pricing has used data from the 1990s.
Governance reforms, and particularly those introduced in the 2000s, may have
created a different relationship between governance characteristics and audit fees
from that found in earlier studies. In addition, prior studies only focus on certain
aspects and do not include comprehensive governance characteristics in their
study (e.g. Zaman et al. only focused on audit committee effectiveness while
Adelopo focused on multiple large shareholders). Therefore, the aim of this study
was to fill the research gap by providing more contemporary data based on the
years 2007 and 2010 and to include more comprehensive governance
characteristics.
The controversial corporate collapses and scandals that have occurred since the
early 2000s have negatively affected the reputation of auditors, especially as most
of the companies failed shortly after receiving a clean report from their auditors.
The issue of independence in appearance and independence in fact of the auditors
is now subject to increased discussion and investigation (e.g., Srinidhi and Gul,
2007; Lim and Tan, 2008; Krishnan et al., 2005; Francis and Ke, 2006). The
provision of non-audit services may tarnish the independence of the auditor in

236
terms of passing judgment on whether a financial statement is a true and fair view
and disclosing any risk or possibility of going concern issues. This being the case,
the payment of higher non-audit fees to auditors is expected to reduce the amount
of audit work and investigation, leading to lower audit fees. Responding to this
scenario, this study investigates the impact of total non-audit fees on total audit
fees. The relationship between audit fees and non-audit fees and whether the
provision of non-audit fees actually has a negative relationship with audit fees and
consequently affects auditor independence are extremely interesting areas for
investigation.
In addition, on a more specific level, the new requirement for disclosure of details
of audit fees in companies’ annual reports in The Companies (Disclosure of
Auditor Remuneration and Liability Agreements) Regulations 2005, later
superseded by The companies (Disclosure of Auditor Remuneration and Liability
Agreements) Regulations 2008 provides the opportunity for this study to
investigate individual relationships between audit fees and specific components of
non-audit fees.
The conclusion chapter next presents a summary of the results from the previous
chapter. This is followed by discussion of the theoretical and policy implications
of the study. Finally, limitations of the current study and avenues for future
research are highlighted.
7.2 Summary of the Empirical Findings
The first research objective is to investigate the relationship between companies’
internal governance characteristics, which comprise the board of directors and the
audit committee and audit quality, proxied by the audit fees paid by listed
companies in the United Kingdom. The data are drawn from 384 companies listed
in the FTSE All Shares Index, excluding investment holdings, which remained in
the FTSE All Shares Index until 2010.
The first step of the analysis was to assess the impact of an effective board of
directors on audit fees. Results of this study show that the presence of
Independent non-executive directors on the board (based on % of non-executive
directors, % of independent non-executive directors) had no significant impact on

237
the total fee paid to external auditors. This finding does not support the
recommendation by the Cadbury Committee and the combined codes that non-
executive directors should play a crucial role in the oversight of management and
that non-executive directors tend to purchase more services from external auditors
as a sign of their competence and possibly of their diligent attitude towards
reporting and auditing quality. The presence of more independent non-executives
may mean more coverage in the auditing and reporting sense. This result is
inconsistent with Lee and Mande (2004) and Collier and Gregory (1999) but is
supported by O’Sullivan (1999) and Peel and Clatworthy (2001), who also found
no evidence that board independence influences auditors’ pricing decisions in
their studies covering large UK companies in the post-Cadbury period.
Inconsistent with Bliss et al. (2007) and Zaman et al. (2011), this study finds no
evidence that CEO/chairman duality (for either year) has a significant impact on
audit fees. This result is, however, consistent with another UK study, based on
402 UK quoted companies in 1992 (O’Sullivan, 2000). Similar to previous studies
(e.g. Boo and Sharma, 2008 and Adelopo and Jallow, 2008), this study finds that
board size has no significant impact on audit fees. This is inconsistent with the
notion that more experienced and larger boards could enhance board
effectiveness; thus a higher quality audit would be required, leading to higher
audit fees. The results of the remaining board characteristics, such as board
diligence also show no significant impact on audit fees in either 2007 or 2010.
Audit committees have come under scrutiny from many interested parties,
especially the regulators. It has been suggested that the main board should
delegate its financial oversight functions to the audit committee. However, other
writers have argued that the committee is no more than a ceremonial group and
that it is not an effective means of constraining management and may be even less
effective in ensuring reporting and audit quality (Sommer 1991; Menon and
Williams, 1994). Therefore, the second research objective is to analyse the impact
of an effective audit committee on audit fees. This study finds that audit
committee size has a significant positive impact on audit fees. This is consistent
with the notion that larger audit committees are likely to flex their power and
status and demand higher quality audit to reflect their effective monitoring role.
This result is supported by Vafeas and Waegelein (2007), Boo and Sharma (2009)
238
and Zaman et al. (2011). This study also documents that audit committee meetings
have a significant positive impact on total fees paid to auditors. This is consistent
with prior studies by such as Abbott et al. (2003a), Goodwin-Stewart and Kent
(2006), Hoitash and Hoitash (2009) and Zaman et al. (2011). Hoitash and Hoitash
(2009) suggest that increased audit committee activity could signal an effort to
resolve financial irregularities and thus lead to higher audit fees. Another
explanation could be that diligent audit committees are more effective and require
higher quality audits to safeguard the shareholder, which will also lead to higher
audit fees. This study highlights the significant positive impact of audit committee
commitment on audit fees. This is one of the contributions of the study as
previous audit pricing study did not include this variable. The finding supports the
expectation that committed audit committees demand higher audit quality to
complement their monitoring function. However, this study fails to find evidence
that other audit committee characteristics, such as audit committee effectiveness,
independence and finance expertise have any significant impact on audit fees.
These results are similar to the findings of O’Sullivan 1999, Collier and Gregory
1996, Lee and Mande 2004, Adelopo and Jallow, 2008.
The third research objective is to analyse the impact of ownership structure on
audit fees. The results on the impact of ownership structure on audit quality are
mixed. The study finds that average executive director shareholding or
management shareholding have a significant negative impact on audit fees. This
is supported by prior studies by O’Sullivan (2000) in the UK and Vafeas and
Waegelein (2007) and Mitra et al. (2007) in the US, who also document an
inverse significant relationship between audit fee level and insider ownership. The
results indicate that auditors possibly view executive shareholding as reducing
agency conflict and involvement of management in earnings management, thereby
incurring lower audit fees. This study also documents a significant negative
relationship between average non-executive director shareholding and audit fees.
This finding is consistent with O’Sullivan’s (2000) finding for his model I of a
significant negative relationship between non-executive share-ownership and
audit fees. He concluded that non-executives possessing significant equity
interests might have business or family links with the company and behave
similarly to executive directors. Another explanation could be that non-executive
239
shareholdings reduce the independence of non-executive directors, and therefore,
a lower quality audit is required from the auditor. However, contrary to
expectation, large blockholder ownership has insignificant impact on audit fees.
The fourth research objective is to establish the relationship between non-audit
fees and audit fees. Consistent with other UK studies (e.g. O’Sullivan, 2000;
Ezzamel et al., 1996; Firth, 1997; Firth, 2002; Hay et al., 2006; Che Ahmad et al.,
2006) it is found that log total non-audit fees have a significant positive impact on
audit fees at 1% confidence level in all models tested, for both 2007 and 2010.
This is further supported by a result from a meta-analysis covering audit fee
literature up to 2007 (Hay, 2012), which confirms that audit fees and non-audit
fees have a significant positive association. This finding is inconsistent with
knowledge-spillover theory and also could counter the claim that the provision of
non-audit services may affect auditor independence. However, it should be
highlighted that this study finds that when total non-audit fees are dominant over
total audit fees this indeed has a significant negative impact on audit fees. There
could be an implication that auditors might give discount to clients to gain more
non-audit work from them and this could hence affect auditor independence. The
availability of published data relating to details of non-audit fees in annual
reporting, effective from the year ending on 31st December 2005, enabled this
study to investigate the relationship between individual components of non-audit
services and audit fees. The regression results show that non-audit services related
to legislation, tax and other non-audit services have a significant positive impact
on audit fees. However, there is not enough evidence to conclude that non-audit
fees related to corporate finance services have a significant impact on audit fees.
This is consistent with Palmrose (1986b) and Davis et al. (1993), who found a
significant positive relationship between audit fees and accounting-related
management services, non-accounting management services and tax services.
Analysis of 2010 data shows a consistent result with 2007 regarding the
relationship between details of non-audit services and audit fees. These findings
reflect that increasing the provision of tax services and services relating to
legislation increases the audit fees that auditors charge their audit clients. The
reason could be that these two kinds of non-audit service expose the real financial

240
position and weaknesses of the client and consequently the auditor may price the
relevant risk identified by charging higher audit fees to problematic clients.
The fifth research objective is to analyse the impact of economic crisis on the
relationship between governance characteristics and audit fees. The study
documents a significant relationship between audit committee size, audit
committee diligence and commitment and audit fees in 2007. However, this study
fails to find any significant relationship between most of the board characteristics
and the audit committee and audit fees in 2010. This insignificant result may be
due to a number of reasons. First, while improvements in internal governance
characteristics (both board and audit committees) are expected to indicate stronger
internal controls and reduced demand for extensive audit testing, the increased
independence of the audit function from the control of management may allow the
undertaking of more extensive audits that would consequently incur higher fees
(O’Sullivan, 2000). Moreover, as the expectations of the users of the Financial
Statements, particularly the shareholders, in terms of the monitoring responsibility
of the board and audit committee have increased, the audit committee might
transfer some of this responsibility to auditors by requiring them to carry out more
thorough and higher quality audit work. Finally, since the recommendations of the
various versions of the Code of Corporate Governance (1998-2010) have been
widely adopted by UK listed companies, the variation between companies in
respect of governance characteristics is likely to be small, therefore weakening the
power of the empirical tests. This is especially true in the aftermath of the
economic crisis (2010) as companies have become more aware that good
corporate governance is essential to maintaining effective overall corporate
monitoring mechanisms and company success. For ownership structure, a
comparison analysis shows that in 2007 both executive and non-executive director
share ownership had a significant negative impact on audit fees. However, after
the economic crisis, only non-executive director share ownership still has a
significant impact on audit fees. The significant result for non-executive share
ownership could imply that in the aftermath of the economic crisis, auditors see
non-executive share-ownership as a way to offset the potential drawbacks of Non-
executive directors, especially those who are former employees of the firm or
have personal relationships with the management. This is because, through having
241
substantial share ownership in the company, non-executive directors become more
motivated to enhance the company’s performance and thus audit risk is reduced.
Finally, the study also provides evidence consistent with most prior audit pricing
literature regarding control variables. First, firm size (LOGTOTASSETS)
consistently shows a significant positive impact on audit fees at 1% confidence
level in all models tested. This has been confirmed in previous studies (e.g. Hay et
al., 2012; Hay et al., 2006; Collier and Gregory, 1996). This study also documents
evidence that client complexity, proxied by Log total subsidiaries, number of
overseas subsidiaries and the number of US subsidiaries and regulated industry, is
an important determinant of the total fees paid to external auditors. However, the
control variables measuring client riskiness produce mixed results. From the
results it could be concluded that only the ratio of debtors to total assets
(DEBTORS) and the ratio of stocks to total assets (STOCKS) are important
determinants of audit fees. Consistent with other UK studies, such as Chan et al.
(1993), Ezzamel et al. (1996), O’Sullivan (2000) and Chaney et al. (2004), this
study finds a significant positive relationship between audit fees and whether the
auditor was based in London. Splitting the sample into small and big companies
segments reveals the existence of a Big Four audit premium among small audit
clients. Finally, the study finds no evidence that an audit carried out during the
busy period (31st December to 31
st March), report lag, company listing on the
FTSE 350 and company profitability have significant impact on audit fees.
7.3 Theoretical and Policy Implications
The results of the study have some general implications for the current debate on
corporate governance issues, especially in relation to the role of the audit
committee in promoting good corporate governance. First, this study finds that
audit committee size has significant positive impact on audit fees. Therefore, it
supports the Code of Best Practice on Corporate Governance (2006) and the UK
Corporate Governance Code (2010), which suggests that the audit committee
should have at least three members in order to provide necessary strength and
diversity of expertise and views to ensure appropriate monitoring. In addition, this
study supports the recommendation of the Smith Report (2003) for audit
committees to hold a minimum of 3 meetings per year as it is found that the
242
annual number of audit committee meetings has a positive impact on audit fees. In
addition, the study contributes to the literature on the relationship between audit
committee characteristics and audit pricing as it is found that audit committee
commitment also has a significant positive impact on audit fees. This study also
supports the notion that executive share ownership and non-executive share
ownership could help reduce agency costs by reducing the scope and intensity of
audit work.
Finally, the findings on the impact of non-audit fees on audit fees have
implications for the current debate on whether regulators should ban all non-audit
services. This study finds that total non-audit fees have a significant positive
impact on audit fees, despite its theoretical expectation of a negative relationship.
Therefore, the total prohibition of non-audit services is not supported. Financial
directors of the FTSE 100 also believe that there is no real threat to independence
and that a ban on auditors undertaking non-audit services would have a negative
impact on the competitiveness of UK companies (Christodoulou, 2010). In
addition, the study contributes by providing further understanding on the
relationship between non-audit fees and audit fees. This study unbundles the total
non-audit fees into nine types of non-audit service. However, as some of the
services are not widely used, the study finally proceeded with four types of non-
audit service. This study finds that tax services, other services relating to
legislation and other non-audit services significantly contribute to the creation of a
positive relationship between non-audit and audit fees. This is supported by the
finding of Beattie et al. (1996) that most of the Non-audit services provided by
auditors are not management consultancy tasks, but instead are essential
accounting services that enable listed companies to comply with legal and
regulatory requirements. Beattie et al. (1996) suggested that the unbundling of
non-audit fees is beneficial to the Accounting Profession since previous practice
invited unnecessary criticism by bundling essential compliances services with a
limited amount of consultancy work for disclosure as one fee figure.
7.4 Limitations of the Study and Avenues for Future Research
This study is subject to certain limitations. First, the study relies heavily on
published data, hand collected from annual reports. Therefore, the quality of the
243
data collected is dependent on the disclosure quality of companies listed on the
London Stock Exchange. In addition, even though care has been taken to avoid
errors during data collection, it is possible that small mistakes might have been
made. However, the study makes a worthwhile contribution to audit pricing
literature by providing empirical results using a unique data set, hand collected
from the annual reports of the sample firms.
Second, the data collected generally relate to large firms fully listed on the
London Stock Exchange. Future research should expand the study to AIM listed
companies to explore whether the impact of governance characteristics of such
firms on audit fees differs significantly from that of fully listed companies.
Third, although this study tried to fit in as many control variables as possible and
also test as many governance characteristics as possible, some important variables
might have been omitted and some have been intentionally ignored: mainly due to
time limitations as manual data collection is a time consuming process. It is
suggested that future research should include important variables ignored in this
study, such as auditor tenure and audit committee tenure, in the audit-pricing
model.
Fourth, the study is based purely on quantitative data. It is found that most of the
governance characteristics, including audit committee characteristics, have no
significant impact on audit pricing. Therefore, future research should complement
the current findings by undertaking qualitative research to further explore the role
of governance mechanisms, in particular the audit committee. The use of
qualitative research methods might also shed light on concerns raised by Spira
(1999) regarding the ceremonial role of audit committees. It seems that this issue
is still relevant in the post-governance reform period. A qualitative study
undertaken in 2007 (Fearnley et al., 2011) revealed the fact that neither audit
committees nor audit committee chairs are fully engaged in all aspects of
decision-making on financial reporting therefore supporting the claim by Beasley
et al. (2009) and Cohen et al. (2010) that audit committee is regarded as just a
symbolic endeavour. Therefore, the following research questions adopted from
Gafran and O’Sullivan (2013) might be particularly useful in obtaining additional
data to further understand the relationship identified through quantitative analysis:

244
How do audit committee members decide whether to continue with or replace the
external auditor?
How do audit committees members decide on the extent and type of non-audit
services to be requested from their incumbent auditor?
How do audit committee members decide on the balance between audit and non-
audit work done by external auditors?
At what point do they believe the independence of the audit could become
impaired?
How are audit and non-audit fee negotiations undertaken between the audit
committee and the auditor?
What factors influence audit committee members/non-executive directors in
deciding the extent and scope of the audit?
Finally, whilst this study investigates the impact of governance characteristics
using data for the years 2007 and 2010, a study using longitudinal data from 2007
to 2011 might be useful in explaining the relationship between governance
characteristics and audit quality when proxied by audit fees. In addition, future
studies could expand the governance characteristics to include the internal audit
function and qualitative research methods such as interviews and questionnaire
surveys could be usefully applied in gathering data, as the data currently published
are not adequate for this purpose.

245
REFERENCES
Abbott, L. J., Parker, S. and Peters, G. F. (2012). Audit Fee Reductions from
Internal Audit-Provided Assistance: The Incremental Impact of Internal Audit
Characteristics. Contemporary Accounting Research, 29(1), 94–118.
Abbott, L. J., Park, Y. and Parker, S. (2000). The Effects of Audit Committee
Activity And Independence On Corporate Fraud. Managerial Finance, 26(11),
55-68.
Abbott, L. J.,Parker, S. and Peters, G. F. (2004). Audit committee characteristics
and financial misstatement: A study of the efficacy of certain blue ribbon
committee recommendations. Auditing: A Journal of Practice andTheory, 23(1),
69–87.
Abbott, L. J., Parker, S. and Peters, G. F. (2010). Agency-based demand for audit
quality: The impact of disclosure-imposed agency costs on non-audit services.
Working paper. University of Wisconsin–Milwaukee, Milwaukee, WI.
Abbott, L. J., Parker, S.,Peters, G. F. and Raghunandan, K. (2003a). The
Association between Audit Committee Characteristics and Audit Fees. Auditing:
A Journal of Practice & Theory, 22(2), 1-2.
Abbott, L. J., Parker, S., Peters, G. F. and Raghunandan, K. (2003b). An empirical
investigation of audit fees, non-audit fees, and audit committees. Contemporary
Accounting Research, 20(2), 215-234.
Abdel-Khalik, A. R. (1990). The Jointness of Audit Fees and Demand for MAS:
A Self-Selection Analysis. Contemporary Accounting Research, 6(2), 295-322.
Abidin, S., Beattie, V. and Goodacre, A. (2010). Audit market structure, fees and
choice in a period of structural change: Evidence from the UK - 1998-2003. The
British Accounting Review, 42(3), 187-206.
ACCA (2009), Corporate governance sustainability briefing, ACCA, London
Adams, M., Sherris, M. and Hossain, M. (1997). The determinants of external
audit costs in the New Zealand life insurance industry. Journal of International
Financial Management and Accounting, 8(1), 69-86.
Adelopo, I. A., Jallow, K. and Scott, P. (2009). Multiple Large Shareholders,
Audit Committee Activity and Audit Fees. SSRN eLibrary.
Adelopo, I. And Jallow, K. (2008), “Board Structure, Audit Committee
Characteristics and Fees Behaviours” 2nd European Risk and Governance
Conference, Bocconi University, Milan, Italy 10-12 September 2008.
246
Adelopo, I. A., Jallow, Dr. Kumba Jallow And Scott, Peter (2009) Multiple Large
Shareholders, Audit Committee Activity and Audit Fees (November 7, 2009).
Available at SSRN: http://ssrn.com/abstract=1501806
Adelopo,I, Jallow,K and Scott,P (2012) Multiple large ownership structure, audit
committee activity and audit fees: Evidence from the UK, Journal of Applied
Accounting Research, 13(2), 100 – 121
Aguilera, R. V., Williams, C. A., Conley, J. M. And Rupp, D. E. (2006),
Corporate Governance and Social Responsibility: a comparative analysis of the
UK and the US. Corporate Governance: An International Review, 14: 147–158
Akhtaruddin, M. and Haron, H. (2010). Board ownership, audit committees'
effectiveness and corporate voluntary disclosures. Asian Review of Accounting,
18, 68-82.
Archambeault, D. And Dezoort, F. T. (2001), Auditor Opinion Shopping and the
Audit Committee: An Analysis of Suspicious Auditor Switches. International
Journal of Auditing, 5, 33–52.
Alzoubi, E.S and Selamat, M.H. (2012). The Effectiveness of Corporate
Governance Mechanisms on Constraining Earning Management: Literature
Review and Proposed Framework, International Journal of Global Business, 5,
17-35.
Anderson, R. C., Mansi, S. A. and Reeb, D. M. (2004). Board characteristics,
accounting report integrity, and the cost of debt, Journal of Accounting and
Economics, 37, 315-342.
Anderson, T. and Zéghal, D. (1994). The pricing of audit services: Further
evidence from the Canadian market. Accounting and Business Research, 24, 195-
208.
André, Paul, Broye, Géraldine, Pong, Christopher K.M. And Schatt, Alain (2012)
Do Joint Audits Lead to Greater Audit Fees? (April 12). Available at SSRN:
http://ssrn.com/abstract=2039001
Ang, J. S., Cole, R. A. and Lin, J. W. (2000). Agency costs and ownership
structure. The Journal of Finance, 55, 81-106.
Antle R, Griffin P, Teece D and Williamson O. (1997). An economic analysis of
auditor independence for a multi-client, multi-service public accounting firm. This
paper appears as Appendix B to serving the public interest: A new conceptual
framework for auditor independence, a white paper submitted to the independence
standards board on behalf of the AICPA, (October 20, 1997) available at
http://www.aicpa.org/members/div/secps/isb/white.htm.

247
Antle, R., Gordon, E.,Narayanamoorthy, G. and Zhou, L. (2006). The joint
determination of audit fees, non-audit fees, and abnormal accruals. Review of
Quantitative Finance and Accounting, 27, 235-266.
Arens, A. and Loebbecke, J. (1994). Auditing: An integrated approach (6th ed.),
Englewood Cliffs, NJ: Prentice-Hall.
Arens,Elder, R. J. and Beasley, M. S. (2006). Auditing and Assurance,
Pearson.US
Arruñada, B. (1999). The provision of Non-Audit Services by Auditors: Let the
market envolve and decide, International Review of Law and Economics, 19(4),
513–531.
Ashbaugh, H., Lafond, R.,Mayhew, B. and . (2003). Do non-audit services
compromise auditor independence? Further Evidence. Account Review 78, 611-
640.
Balachandran, B. V. and Simon, D. (1993). Audit services and fees of large
accounting firms. Journal of Economics and Management Strategy , 2, 339-348.
Balsam, S.,Krishnan, J. and Yang, J. S. (2003). Auditor industry specialization
and earnings quality. Auditing: A Journal of Practice & Theory. 22(2), 71-97.
Basioudis, I and Francis, J (2007) Big 4 Audit Fee Premiums for National and
Office‐Level Industry Leadership in the United Kingdom. AUDITING: A Journal
of Practice & Theory, 2, 143-166
Barker, R., (2008), The UK model of corporate governance:An assessment from
the midst of a financial crisis, Corporate Governance Briefing, London.
Basioudis, I. and Fifi, F. (2004). The market for professional services in
Indonesia. International Journal of Auditing, 8, 153-164.
Basioudis, I. G. (2002). The UK market for audit services: deregulation and audit
pricing in the small client segment, Birmingham, Aston Business School Research
Institute.
Baysinger, B. D. and Butler, H. N. (1985). Corporate governance and the board of
directors: Performance effects of changes in board composition. Journal of Law,
Economics, and Organization, 1, 101.
Beasley, M. S. (1996). An empirical analysis of the relation between the board of
director composition and financial statement fraud. Accounting Review, 71, 443-
465.

248
Beasley, M. S.,Carcello, J. V.,Hermanson, D. R. and Lapides, P. D. (2000).
Fraudulent Financial Reporting: Consideration of Industry Traits and Corporate
Governance Mechanisms. Accounting Horizons, 14, 441-454.
Beasley, M. S.,Carcello, J. V.,Hermanson, D. R. and Neal, T. L.(2009). The Audit
Committee Oversight Process, Contemporary Accounting Research, 26, 65-122.
Beasley, M.S. (1996). An empirical analysis of the relation between the board of
director composition and financial statement fraud, The Accounting Review, 71(4),
443- 465.
Beattie, V.,Goodacre, A. and Fearnley, S. (2003). And then there were four: A
study of UK audit market concentration-causes, consequences and the scope for
market adjustment. Journal of Financial Regulation and Compliance, 11, 250-
265.
Beattie, V. and Fearnley, S. (2002). Auditor Independence and Non-audit
Services: A Literature Review. London: The Institute of Chartered Accountants in
England and Wales.
Beattie, V., Brandt, R. and Fearnley, S. (1996). Consulting? More Like
Compliance. Accountancy, 118, 126-127.
Bedard, J. C. and Johnstone, K. M. (2010). Audit Partner Tenure and Audit
Planning and Pricing. Auditing: A Journal of Practice & Theory, 29(2), 45-70.
Bedard, J. C. (2012), Discussion of “Audit Partner Specialization and Audit Fees:
Some Evidence from Sweden”. Contemporary Accounting Research, 29, 341–
348.
Bedard, J. C.,Hoitash, U. and Hoitash, R. (2008). Audit pricing and internal
control disclosures among non-accelerated filers. Research in Accounting
Regulation, 20, 103-126.
Bedard, J. C. and Johnstone, K. M. (2004). Earnings manipulation risk, corporate
governance risk, and auditors' planning and pricing decisions. Accounting Review,
79, 277-304.
Behn, B. K., Lee, J. W. and Jin, L. H. (2009). An empirical analysis of audit fee
price competition after the Korean 1999 Omnibus Cartel Repeal Act. Journal of
International Accounting, Auditing & Taxation, 18, 132-140.
Bell, T. B.,Landsman, W. R. and Shackelford, D. A. (2001). Auditors' perceived
business risk and audit fees: Analysis and evidence. Journal of Accounting
Research, 39, 35-43.

249
Bigus, J. and Zimmerman, R. (2008). Non Audit Fees, Market Leaders and
Concentration in the German Audit Market: A Descriptive Analysis. International
Journal of Auditing, 12, 174.
Bliss, M. A. (2011), Does CEO duality constrain board independence? Some
evidence from audit pricing. Accounting & Finance, 51: 361–380.
Bliss, M. A. (2010). Does CEO duality constrain board independence? Some
evidence from audit pricing. Journal of Accounting & Finance
Bliss, M. A.,Muniandy, B. and Majid, A. (2007). CEO duality, audit committee
effectiveness and audit risks: A study of the Malaysian market. Managerial
Auditing Journal, 22, 716-728.
Blue Ribbon Committee (BRC) (1999). Report and Recommendations of the Blue
Ribbon Committee on Improving the Effectiveness of Corporate Audit
Committees, New York Stock Exchange, New York, NY.
Boo, E. and Sharma, D. (2008). Effect of regulatory oversight on the association
between internal governance characteristics and audit fees. Accounting and
Finance, 48, 51-71.
Boon, K.,Crowe, S.,Mckinnon, J. and Ross, P. (2005). Compulsory audit
tendering and audit fees: Evidence from Australian Local Government.
International Journal of Auditing, 9, 221-241.
Booth , J.R, Booth, L.C And Daniel Deli,D. (2012)Managerial Incentives and
Audit Fees: Evidence from the Mutual Fund Industry, Accounting and Finance
Research Vol. 1, No. 1 pp 76-94
Boyd, B. K.,Gove, S. and Hitt, M. A. (2005). Consequences of measurement
problems in strategic management research: the case of Amihud and Lev.
Strategic Management Journal, 26, 367-375.
Brinn, T., Peel, M. J. and Roberts, R. (1994). Audit Fee Determinants of
Independent & Subsidiary Unquoted Companies in the UK--An Exploratory
Study. The British Accounting Review, 26, 101-121.
Bushman, R., Q. Chen, E. Engel, and A. Smith, (2004), Financial accounting
information, organizational complexity and corporate governance systems,
Journal of Accounting and Economics, 37, 167–201.
Butterworth, S. and Houghton, K. A. (1995). Auditor switching: The pricing of
audit services. Journal of Business Finance and Accounting, 22, 323-344.
Cadbury, A. (1992). The financial aspects of corporate governance, London:
GEE.
250
Cameran, M. (2005). Audit fees and the large auditor premium in the Italian
market. International Journal of Auditing, 9, 129-146.
Caramanis, C. V. (1998). Assessing the impact of ‘liberalization’ on auditor
behaviour: Accounting research in politically charged contexts. Accounting,
Auditing and Accountability Journal, 11, 562-592.
Carcello, J. and Neal, T. (2000). Audit committee composition and auditor
reporting. Accounting Review, 75, 453-467.
Carcello, J. V. and Nagy, A. L. (2004). Client size, auditor specialization and
fraudulent financial reporting. Managerial Auditing Journal, 19, 651-668.
Carcello, J. V. and Neal, T. L. (2003). Audit committee characteristics and auditor
dismissals following" new" going-concern reports. Accounting Review, 78, 95-
117.
Carcello, J. V.,Hermanson, D. R., Neal, T. L. and Riley Jr, R. A. (2002). Board
Characteristics and Audit Fees. Contemporary Accounting Research, 19, 365-384.
Carey, P. and Simnett, R. (2006). Audit partner tenure and audit quality. The
Accounting Review, 81(3), 653-676
Carson, E. (2009). Industry Specialization by Global Audit Firm Networks.
Accounting Review, 84, 355-382.
Carson, E. and Fargher, N. (2007). Note on audit fee premiums to client size and
industry specialization. Accounting & Finance, 47, 423-446.
Carson, E.,Fargher, N. L.,Simon, D. T. and Taylor, M. H. (2004). Audit Fees and
Market Segmentation - Further Evidence on How Client Size Matters within the
Context of Audit Fee Models. International Journal of Auditing, 8, 79-91.
Carter, D. A., Simkins, B. J. and Simpson, W. G. (2003). Corporate governance,
board diversity, and firm value. Financial Review, 38, 33-53.
Carver, J. (2006. Boards that make a difference, Ebooks Corporation, Jossey-Bass
San Francisco.
Chan, K.C, Jacob,Lee, P. and Seow,G. (2012) The effects of Section 404 of
Sarbanes-Oxley Act of 2002 on the audit fees of foreign firms listed on US
exchanges, Review of Accounting and Finance, Vol. 11,.236 - 256
Chan, A. M. Y., Liu, G. And Sun, J. (2012), Independent audit committee
members’ board tenure and audit fees. Accounting and Finance.
doi: 10.1111/j.1467-629X.2012.00490.x
Chan, K. C., Jacob, R. A.,Lee, P. and Seow, G.-S. (2008). The Effects of Section
404 of Sarbanes-Oxley Act of 2002 on the Audit Fees of Foreign Firms Listed on
U.S. Exchanges. SSRN eLibrary.
251
Chan, P.,Ezzamel, M. and Gwilliam, D. (1993). Determinants of audit fees for
quoted UK companies. Journal of Business Finance & Accounting, 20, 765-786.
Chaney, P. K.,Jeter, D. C. and Shivakumar, L. (2004). Self-selection of auditors
and audit pricing in private firms. Accounting Review, 79, 51-72.
Charles, S. L.,Glover, S. M. and Sharp, N. Y. (2010). The Association between
Financial Reporting Risk and Audit Fees before and after the Historic Events
Surrounding SOX. Auditing: A Journal of Practice & Theory, 29, 15-39.
Che Ahmad, A. and Mansor, N. (2009). Board independence, ownership structure,
audit quality and income smoothing activities: A study on Malaysian market.
Journal of Modern Accounting and Auditing, 5, 1-13.
Che Ahmad, A.,Shafie, R. and Mohamad Yusof, N. Z. (2006). The Provision Of
Non-Audit Services, Audit Fees And Auditor Independence. Asian Academy of
Management Journal of Accounting and Finance, 2, 21-40.
Chen, C. J. P.,Su, X. and Wu, X. (2007). Market competitiveness and Big 5
pricing: Evidence from China's binary market. The International Journal of
Accounting, 42, 1-24.
Chen, C. Y.,Lin, C. J. and Lin, Y. C. (2008). Audit partner tenure, audit firm
tenure, and discretionary accruals: Does long auditor tenure impair earnings
quality? Contemporary Accounting Research, 25, 415-445.
Chen, Y.M., Moroney, R. And Houghton, K. (2005). Audit committee
composition and the use of an industry specialist audit firm. Accounting and
Finance, 45, 217–239.
Chi, W. (2004). The effect of the Enron-Andersen affair on audit pricing.
Available at SSRN: http://ssrn.com/abstract=614884.
Chi, W. (2006). The effect of the Enron-Andersen affair on audit pricing. The
ICFAI Journal of Audit Practice, 3, 35-59.
Choi, J.-H.,Kim, C.,Kim, J.-B. and Zang, Y. (2010). Audit Office Size, Audit
Quality, and Audit Pricing. Auditing: A Journal of Practice & Theory, 29, 73-97.
Choi, J.-H.,Kim, C.,Kim, J.-B. and Zang, Y. (2010) Do Abnormally High Audit
Fees Impair Audit Quality? Auditing: A Journal of Practice & Theory: November
2010, 29(2), 115-140.
Choi, J.,Kim, J.-B., V,Liu, X. and Simunic, D. A. (2009b). Cross-Listing Audit
Fee Premiums: Theory and Evidence. Accounting Review, 84, 1429-1463.
Choi, J.H.,Kim, J.B. and Zang, Y. (2009a). Do Abnormally High Audit Fees
Impair Audit Quality? Available at SSRN: http://ssrn.com/abstract=1521324.

252
Choi, J. H.,Kim, J. B.,Liu, X. H. and Simunic, D. A. (2008). Audit pricing, legal
liability regimes, and Big 4 premiums: Theory and cross-country evidence.
Contemporary Accounting Research, 25, 55-100
Choi, J-H, Kim, J-B, Qiu, A. and Zang, Y.(2008). Auditor Locality, Audit Quality
and Audit Pricing. Available at SSRN: http://ssrn.com/abstract=966022
Chow, C. W. (1982). The Demand for External Auditing: Size, Debt and
Ownership Influences. Accounting Review, 57, 272.
Christodoulou, M. (2010). Hundred Group opposes non-audit restrictions.
Accountancy Age, available at
http://www.accountancyage.com/aa/news/1808217/hundred-group-opposes-audit-
restrictions
Chung, D. Y. and Lindsay, W. D. (1988). The pricing of audit services: The
Canadian perspective. Contemporary Accounting Research, 5, 19-46.
Chung, H. and Kallapur, S. (2003). Client importance, nonaudit services, and
abnormal accruals. Accounting Review, 78, 931-955.
Clatworthy, M. A., H. J. Mellett and M. J. Peel (2002). The Market for External
Audit Services in the Public Sector: An Empirical Analysis of NHS Trusts,
Journal of Business Finance & Accounting, 29(9), 1399–439.
Cohen, J. R., Krishnamoorthy, G. and Wright, A. M. (2008). Form versus
substance: The implications for auditing practice and research of alternative
perspectives on corporate governance. Auditing: A Journal of Practice & Theory,
27(2), 181-198.
Cohen, J., Krishnamoorthy, G. and Wright, A. (2002). Corporate governance and
the audit process. Contemporary Accounting Research, 19(4), 573-594.
Cohen, J., Krishnamoorthy, G. and Wright, A. (2010). Corporate Governance in
the Post-Sarbanes-Oxley Era: Auditors’ Experiences. Contemporary Accounting
Research, 27, 751-786.
Collier, P. and Gregory, A. (1996). Audit committee effectiveness and the audit
fee. European Accounting Review, 5, 177-198.
Collier, P. and Gregory, A. (1999). Audit committee activity and agency costs.
Journal of Accounting and Public Policy, 18, 311-332.
Combined Code (1998). Combined Code, Principles of Corporate Governance,
London: Gee & Co. Ltd.
Combined Code (1999; 2003; 2006; 2008). The Combined Code on Corporate
Governance. London: Financial Reporting Council.

253
Combined Code (1999; 2003; 2006; 2008;2010;2012). The Combined Code on
Corporate Governance. London: Financial Reporting Council.
Companies Act (2008). Disclosure of Auditor Remuneration and Liability
Limitation Agreements Regulations 2008/489. United Kingdom.
Conger, J. A.,Finegold, D. and Lawler, E. (1998). Appraising boardroom
performance. Harvard Business Review, 76, 136-164.
Core, J.,Holthausen, R. and David Larcker, , (1999). Corporate governance, chief
executive officer compensation, and firm performance. Journal of Financial
Economics 51, 371–406.
Core, John, Robert Holthausen, and David Larcker, (1999), Corporate
governance, chief executive officer compensation, and firm performance, Journal
of Financial Economics 51, 371–406.
Cosh, A.,Guest, P. M. and Hughes, A. (2006). Board Share-Ownership and
Takeover Performance. Journal of Business Finance & Accounting, 33, 459-510.
Coulton, J.,Craswell, A. and Taylor, S. (2001). Do board characteristics influence
audit fees? Working Paper, University of Technology, Sydney and University of
Sydney.
Craswell, A. T.,Guest, R. S. and Australia, Q. (2010). Price and demand effects in
the market for audit services. American Accounting Association.
Craswell, A., Stokes, D. J. and Laughton, J. (2002). Auditor independence and fee
dependence. Journal of Accounting and Economics, 33, 253-275.
Craswell, A. T.,Francis, J. R. and Taylor, S. L. (1995). Auditor brand name
reputations and industry specializations. Journal of Accounting & Economics, 20,
297-322.
Cullinan, C. P. (1997). Audit pricing in the pension plan audit market. Accounting
and Business Research and Development Report. , 27, 91-98.
Cullinan, C. P. (1998). Evidence of non-big 6 market specialization and pricing
power in a niche assurance service market. Auditing-a Journal of Practice &
Theory, 17, 47-57.
Dao, M., Raghunandan, K and Rama, D (2012) Shareholder Voting on Auditor
Selection, Audit Fees, and Audit Quality. The Accounting Review, 87, 149-171.
Dallas, L. ( 2002). The new managerialism and diversity on corporate boards of
directors. Tulane Law Review, 76.
254
Dass, N., Kini, O., Nanda, V. K., Onal, B. and Wang, J., (2009). Board Expertise:
Do Directors from Related Industries Help Bridge the Information Gap? Available
at SSRN: http://ssrn.com/abstract=1572668
Davidson ,W.N, Xie,B. and Xu,W. (2004). Market reaction to voluntary
announcements of audit committee appointments: The effect of financial
expertise, Journal of Accounting and Public Policy, 23, 279-293
Davis, S. M. and Hollie, D. Y. (2004). An Experimental Investigation of Non-
Audit Service Fees and Investors’ Perceptions of Auditor Independence: Post-
Enron Era. A paper presented at the British Accounting Association Auditing
Special Interest Group held at Aston Business School between, 11.
Davis, L. R.,Ricchiute, D. N. and Trompeter, G. (1993). Audit effort, audit fees,
and the provision of nonaudit services to audit clients. Accounting Review, 68,
135-150.
Davis, L. R. and Simon, D. T. (1992). The impact of SEC disciplinary actions on
audit fees. Auditing: A Journal of Practice & Theory, 11, 58-68.
Deangelo, L. E. (1981). Auditor size and audit quality. Journal of Accounting and
Economics, 3, 183-199.
Dechow, P. M., Sloan, R. G. and Sweeney, A. P. (1996). Causes and
Consequences of Earnings Manipulation: An Analysis of Firms Subject to
Enforcement Actions by the SEC*. Contemporary Accounting Research, 13, 1-36.
Defond, M. L., Hann, R. N. and Hu, X. (2005), Does the Market Value Financial
Expertise on Audit Committees of Boards of Directors?. Journal of Accounting
Research, 43: 153–193.
Defond, M. L., Raghunandan, K and Subramanyam.K.R ( 2002). Do nonaudit
service fees impair auditor independence? Evidence from going concern audit
opinions. Journal of Accounting Research 40 (4): 1247–1274
Defond, M. L., Francis, J. R. and Wong, T. J. (2000). Auditor industry
specialization and market segmentation: Evidence from Hong Kong. Auditing-a
Journal of Practice & Theory, 19, 49-66.
Deis, D. R. (1996). The effect of auditor changes on audit fees, audit hours, and
audit quality, Journal of Accounting and Public Policy, 15, 55-76.
Demsetz, H. and Lehn.K (1985).The Structure of Corporate Ownership: Causes
and Consequences, Journal of Political Economy, Vol. 93, pp. 1155–77.
Donald R. Deis Jr., Gary Giroux (1996). The effect of auditor changes on audit
fees, audit hours, and audit quality, Journal of Accounting and Public Policy,
Volume 15, Issue 1, Spring 1996, Pages 55-76,

255
Demb, A. and Neubauer, F. F. (1992). The corporate board: Confronting the
paradoxes. Long Range Planning, 25, 9-20.
Demsetz, H. and Lehn, K. (1985). The structure of corporate ownership: Causes
and consequences. The Journal of Political Economy, 93, 1155-1177.
Desender, K. A.,Garcia-Cestona, M.,Crespi, R. andAguilera, R. (2009). Board
Characteristics and Audit Fees: Why Ownership Structure Matters? Working
Papers.
Dezoort, F. T., Hermanson, D. R. and Houston, R. W. (2003). Audit Committee
Member Support for Proposed Audit Adjustments: A Source Credibility
Perspective. Auditing: A Journal of Practice & Theory, 22, 9-10.
Dezoort, F. T. and Salterio, S. (2001). The effects of corporate governance
experience and financial reporting and audit knowledge on audit committee
members’ judgments. Auditing: A Journal of Practice & Theory, 20, 31-47.
Dhaliwal, D.S, Naiker, V. and Navissi, F. (2006) Audit Committee Financial
Expertise, Corporate Governance and Accruals Quality: An Empirical Analysis
(May 2006). Available at SSRN: http://ssrn.com/abstract=906690
Doogar, R.,Sivadasan, P. and Solomon, I. (2010). The Regulation of Public
Company Auditing: Evidence from the Transition to AS5. Journal of Accounting
Research, 48, 795-814.
Duh, R.R., Lee, W.C. and Hua, C.Y. (2009). Non-audit service and auditor
independence: an examination of the Procomp effect. Review of Quantitative
Finance & Accounting, 32, 33-59.
Dunn, K. A. and Mayhew, B. W. (2004). Audit firm industry specialization and
client disclosure quality. Review of Accounting Studies, 9, 35-58.
Eagly, A. H. and Carli, L. L. (2003). The female leadership advantage: An
evaluation of the evidence. The Leadership Quarterly, 14, 807-834.
Engel, E.,Hayes, R. M. and Wang, X. (2010). Audit committee compensation and
the demand for monitoring of the financial reporting process. Journal of
Accounting and Economics, 49, 136-154.
Erhardt, N. L.,Werbel, J. D. and Shrader, C. B. (2003). Board of director diversity
and firm financial performance. Corporate Governance: An International Review,
11, 102-111.
Erkens D. H., M. Hung, and P. Matos, 2012,“Corporate governance in the 2007–
2008 financial crisis: Evidence from financial institutions worldwide”, Journal of
Corporate Finance 18, pp. 389–411.
256
Ethington, C.A., Thomas, S.L and Pike G.R (2002) Back to Basic: Regression as
it Should Be. In: Smart, J.C. Higher Education Handbook Theory and Research,
The Netherlands, Kluwer Academic publisher
Ettredge, M. L., Li, C. and Emeigh, E. (2011) Fee Pressure and Audit Quality,
Available at SSRN: http://ssrn.com/abstract=1903860
Ettredge, M. and Greenberg, R. (1990). Determinants of fee cutting on initial audit
engagements. Journal of Accounting Research, 28, 198-210.
Ettredge, M.,Li, C. and Scholz, S. (2007). Audit fees and auditor dismissals in the
Sarbanes-Oxley era. Accounting Horizons, 21.371-386
European Commission (2010) Green Paper. Audit Policy: Lessons from the Crisis
(Brussels: European Commission).
European Commission (2011) Proposal for a Regulation of the European
Parliament and the Council on Specific Requirements Regarding Statutory Audit
of Public-Interest Entities (Brussels: European Commission).
Evans, J. and Weir, C. (1995). Decision processes, monitoring, incentives and
large firm performance in the UK, Management Decision, 33, pp.32 - 38
Ezzamel, M., Gwilliam, D. and Holland, K. (2002). The Relationship between
Categories of Non Audit Services and Audit Fees: Evidence from UK Companies.
International Journal of Auditing, 6, 13-35.
Ezzamel, M., Gwilliam, D. R. and Holland, K. M. (1996). Some Empirical
Evidence from Publicly Quoted UK Companies on the Relationship Between the
Pricing of Audit and Non-audit Services. Accounting & Business Research, 27, 3-
16.
Fama, E. and Jensen, M. (1983). The separation of ownership and control. Journal
of Law and Economics 26, 301–325.
Fama, E. F. (1980). Agency problems and the theory of the firm. Journal of
Political Economy, 88 (April), 288-307.
Fan, J. P. H. and Wong, T. (2005). Do external auditors perform a corporate
governance role in emerging markets? Evidence from East Asia. Journal of
Accounting Research, 43, 35-72.
Farber, D. B. (2005). Restoring trust after fraud: does corporate governance
matter? The Accounting Review 80, 539-561.
Fearnley and Beattie (2004). “The reform of the UK’s auditor independence
framework after the Enron collapse: an example of evidence-based policy
making” International Journal of Auditing, 8, pp. 17-138

257
Feldmann, D. A., Read, W. J. and Abdolmohammadi, M. I. (2009). Financial
Restatements, Audit Fees, and the Moderating Effect of CFO Turnover. Auditing-
a Journal of Practice & Theory, 28, 205-223.
Felix, W. L.,Gramling, A. A. and Maletta, M. J. (2001). The contribution of
internal audit as a determinant of external audit fees and factors influencing this
contribution. Journal of Accounting Research, 39, 513-534.
Felix, W. L.,Gramling, A. A. and Maletta, M. J. (2005). The Influence of
Nonaudit Service Revenues and Client Pressure on External Auditors' Decisions
to Rely on Internal Audit, Contemporary Accounting Research, 22, 31-53.
Ferguson, A. and Stokes, D. (2002). Brand name audit pricing, industry
specialization, and leadership premiums post-big 8 and big 6 mergers.
Contemporary Accounting Research, 19, 77-110.
Ferguson, A. C.,Francis, J. R. and Stokes, D. J. (2006). What matters in audit
pricing: industry specialization or overall market leadership? Accounting &
Finance, 46, 97-106.
Ferguson, A.,Francis, J. R. and Stokes, D. J. (2003). The effects of firm-wide and
office-level industry expertise on audit pricing. Accounting Review, 78, 429-448.
Ferris, S.,Jagannathan, M. and Pritchard, A. (2003). Too busy to mind the
business? Monitoring by directors with multiple board appointments. Journal of
Finance, 58, 1087–1111.
Ferris, Stephen, Murali Jagannathan, and Adam Pritchard, (2003), Too busy to
mind the business? Monitoring by directors with multiple board appointments,
Journal of Finance 58, 1087–1111.
Fich, E. M. and Shivdasani, A. (2006). Are Busy Boards Effective Monitors? The
Journal of Finance, 61, 689-724.
Financial Reporting Council (2008). Challenges for Audit Committees arising
from Current economic conditions, London: Financial Reporting Council.
Financial Reporting Council (2012). Revisions to the Corporate Governance Code
and Guidance on Audit Committees. London: Financial Reporting Council.
Financial Reporting Council’s Guidance (2009). Going Concern and Liquidity
Risk: Guidance for directors of UK companies 2009. London: Financial Reporting
Council.
Firth, M. (2002), ‘Auditor-Provided Consultancy Services and their Associations
with Audit Fees and Audit Opinions’, Journal of Business Finance & Accounting,
Vol. 29, No. 5, pp. 661–93,

258
Firth, M. (1997a). The Provision of Nonaudit Services by Accounting Firms to
their Audit Clients. Contemporary Accounting Research , 14 No. 2 (Summer
1997) pp. 1-21
Firth, M. (1997b). The Provision of Non-Audit Services and The Pricing of Audit
Fees. Journal of Business Finance & Accounting, 24, 511-525.
Firth, M. (1985). An Analysis of Audit Fees and their Determinants in New
Zealand. Auditing: A Journal of Practice and Theory 4:23-37
Fleming, D.M. and Romanus, R.N (2007). Auditor Industry Specialization and
Audit Fees Surrounding Section 404 Implementation Available at SSRN:
http://ssrn.com/abstract=1012202
Fondas, N. and S. Sassalos (2000). A different voice in the boardroom: how the
presence of women directors affects board influence over management. Global
Focus 12, 13-22.
Fondas, N. (1997). Feminization unveiled: Management qualities in contemporary
writings. Academy of Management Review, 22, 257-282.
Fosberg, R. H. and Nelson, M. R. (1999). Leadership structure and firm
performance. International Review of Financial Analysis, 8, 83-96.
Francis, J. R. and Simon, D. T. (1987). A test of audit pricing in the small-client
segment of the US audit market. Accounting Review, 62, 145-157.
Francis, J.R. and Ke, B., (2006). Disclosure of fees paid to auditors and the
market valuation of earnings surprises. Review of Accounting Studies 11 (4), 495–
523.
Francis, J. R.,Reichelt, K. and Wang, D. (2005). The pricing of national and city-
specific reputations for industry expertise in the US audit market. Accounting
Review, 80, 113-136.
Francis, J. R.,Maydew, E. L. and Sparks, H. C. (1999). The role of Big 6 auditors
in the credible reporting of accruals. Auditing: A Journal of Practice and Theory,
18, 17-34.
Francis, J. R. and Stokes, D. J. (1986). Audit prices, product differentiation, and
scale economies: Further evidence from the Australian market. Journal of
Accounting Research, 24, 383-393.
Francis, J. R. (1984). The effect of audit firm size on audit prices:: A study of the
Australian Market. Journal of Accounting and Economics, 6, 133-151.
Frankel, R.,Johnson, M. and Nelson, K. (2002). The relation between auditors’
fees for non-audit services and earnings quality. Account Review, 77, 77-104.
259
Ghafran, C.M. and O'Sullivan, N. (2012). The governance role of audit
committees: reviewing a decade of evidence. International Journal of
Management Reviews, 15 (4) 381-407.
Gaynor, L. M., Mcdaniel, L. S. and Neal, T. L. (2006). The Effects of Joint
Provision and Disclosure of Non-Audit Services on Audit Committee Members'
Decisions and Investors' Preferences. Accounting Review, 81, 873-896.
Geiger, M. A. and Raghunandan, K. (2002). Auditor tenure and audit reporting
failures. Auditing: A Journal of Practice & Theory, 21, 67-78.
Geiger, M. A. and Rama, D. V. (2003). Audit Fees, Nonaudit Fees, and Auditor
Reporting on Stressed Companies. Auditing: A Journal of Practice & Theory, 22,
53-70.
Ghosh, A., Kallapur, S. and Moon, D. (2009) Audit and non-audit fees and capital
market perceptions of auditor independence, Journal of Accounting and Public
Policy, 28, 369-385
Ghosh, A. and Pawlewicz, R. (2009). The Impact of Regulation on Auditor Fees:
Evidence from the Sarbanes-Oxley Act. Auditing-a Journal of Practice & Theory,
28, 171-197.
Ghosh, A. and Moon, D. (2005). Does auditor tenure impair audit quality? The
Accounting Review, 80, 585-612.
Gilson, S. (1990). Bankruptcy, boards, banks and blockholders: Evidence on
changes on corporate ownership and control when firms default. Journal of
Financial Economics 27, 355–387.
Gist, W. E. (1995). A test of audit pricing in the small-client segment: A
comment. Journal of Accounting, Auditing and Finance 10, 223-233.
Gist, W. E. (1994a). A research note on the relationship between regulation and
audit firm size on audit fees. Journal of Accounting, Auditing and Finance, 9,
381-396.
Gist, W. E. (1994b). Empirical evidence on the effect of audit structure on audit
pricing. Auditing:A Journal of Practice and Theory, 13, 25-40.
Gist, W. E. (1992). Explaining variability in external audit fees. Accounting and
Business Research, 23, 79-79.
Goodstein, J.,Gautam, K. and Boeker, W. (1994). The effects of board size and
diversity on strategic change. Strategic Management Journal, 15, 241-250.
260
Goodwin-Stewart, J. and Munro, L. (2003). The Impact of Audit Committee
Meeting Frequency on the External Audit: Perceptions of Australian Auditors.
working paper Queensland University of Technology, Brisbane, Qld
Goodwin-Stewart, J. and Kent, P. (2006). Relation between external audit fees,
audit committee characteristics and internal audit. Accounting & Finance, 46,
387-404.
Gotti,G., Han, S., Higgs,J. and Kang,T (2012)“Managerial Stock Ownership,
Analyst Coverage, and Audit Fee” Journal of Accounting, Auditing & Finance
July 2012 vol. 27 no. 3 412-437
Gregory, A. and Collier, P. (1996). Audit fees and auditor change; an
investigation of the persistence of fee reduction by type of change. Journal of
Business Finance & Accounting, 23, 13-28.
Griffin, P. A. and Lont, D. H. (2007). An analysis of audit fees following the
passage of Sarbanes-Oxley. Asia Pacific Journal of Accounting and Economics,
14, 161.
Griffin, P. A.,Lont, D. H. and Sun, Y. (2009). Governance regulatory changes,
International Financial Reporting Standards adoption, and New Zealand audit and
non-audit fees: empirical evidence. Accounting and Finance, 49, 697-724.
Griffin, P. A.,Lont, D. H. and Sun, Y. (2010). Agency problems and audit fees:
further tests of the free cash flow hypothesis. Accounting & Finance, 50, 321-350.
Gul, F. A. (1999). Audit prices, product differentiation and economic equilibrium.
Auditing, 18, 90-100.
Gul, F.A. and Goodwin, J. (2010). Short-term debt maturity structures, credit
ratings, and the pricing of audit services. The Accounting Review, 85, pp. 877–
909.
Gupta, Parveen P., Krishnan, Gopal V. and Yu, Wei (2012) Do Auditors Allow
Earnings Management When Audit Fees are Low?, Available at SSRN:
http://ssrn.com/abstract=1836829
Hackenbrack, K., Jensen, K. L. and Payne, J. L. (2000). The effect of a bidding
restriction on the audit services market. Journal of Accounting Research, 38, 355-
374.
Hampel, R. (1998). Committee on Corporate Governance, GEE, London.
Harrison, D. A. (1995). Volunteer Motivation and Attendance Decisions:
Competitive Theory Testing in Multiple Samples from a Homeless Shelter,
Journal of Applied Psychology, 80, 371–385.

261
Hay, D. and W.R. Knechel (2004). "Evidence on the Association among Elements
of Control and External Assurance", Working paper, University of Auckland.
Hay, D.,Knechel, R. and Li, V. (2006a). Non-audit services and auditor
independence: New Zealand evidence. Journal of Business Finance &
Accounting, 33, 715-734.
Hay, D. C., KNECHEL, W. R. and WONG, N. (2006b) Audit fees: A meta-
analysis of the effect of supply and demand attributes, Contemporary Accounting
Research, 23(1), pp. 141-191.
Hay, D.,Knechel, W. R. and Ling, H. (2008). Evidence on the impact of internal
control and corporate governance on audit fees. International Journal of Auditing,
12, 9-24.
Hay, D. and Knechel, W. R. (2010). The effects of advertising and solicitation on
audit fees. Journal of Accounting and Public Policy, 29, 60-81.
Hay, D. (2012), Further Evidence from Meta-Analysis of Audit Fee Research.
International Journal of Auditing. doi: 10.1111/j.1099-1123.2012.00462.x
Hay, D (2012). New audit requirements could mean higher fees. CA Journal,
August, Available from: http://www.gaaaccounting.com/gaa_issues.aspx?q
=August%202012%5C%5CNZICA_issue4_article2&t=GAA%20Issue%20-
%20August%202012 (Accessed 17 January 2013)
Hennink, M., Hutter,I. and Bailey, A. (2011). A Qualitative Research Methods,
Sage Publication, London.
Higgs, D. (2003), Review of the Role and Effectiveness of Non-Executive
Directors, Department for Trade and Industry, London
Hillison, W. and Kennelley, M. (1988) The economics of nonaudit services,
AccountingHorizons, 2(3), 32-40.
Ho, S. and Hutchinson, M. (2010). Internal audit department
characteristics/activities and audit fees: Some evidence from Hong Kong firms.
Journal of International Accounting, Auditing and Taxation, 19, 121-136.
Ho, S.S.M. and Wong, K.S. (2001). A study of the relationship between corporate
governance structure and the extent of voluntary disclosure, Journal of
International Accounting, Auditing and Taxation, 10(2), 139-156.
Hoitash, R. and Hoitash, U. (2009). The role of audit committees in managing
relationships with external auditors after SOX: evidence from the USA.
Managerial Auditing Journal, 24, 368–397.
262
Hoitash, R.,Hoitash, U. and Bedard, J. C. (2008). Internal control quality and
audit pricing under the Sarbanes-Oxley act. Auditing-a Journal of Practice &
Theory, 27, 105-126.
Hope, O.K. andLangli, J. C. (2010). Auditor independence in a private firm and
low litigation risk setting. Accounting Review, 85, 573-605.
Houston, R. W.,Peters, M. F. and Pratt, J. H. (2005). Nonlitigation risk and
pricing audit services. Auditing-a Journal of Practice & Theory, 24, 37-53.
Hu, F., Percy, M. and Yao, D.F. (2012) Asset Revaluations and Audit Fees:
Evidence from Australia Securities Exchange (ASX) 300 Firms (August 16,
2012). SSRN e- library, Available at SSRN: http://ssrn.com/abstract=2130963
Hudaib, M. and Cooke, T.E. (2005). The impact of managing director changes
and financial distress on audit qualification and auditor switching, Journal of
Business Finance & Accounting, 32, 1703-1739.
Huse, M. and Solberg, A. G. (2006). Gender-related boardroom dynamics: How
Scandinavian women make and can make contributions on corporate boards.
Women in Management Review, 21, 113-130.
ICAS (2010). Working Group issues Report on the Provision of Non-audit
services by Audit Firms to their Listed Audit Clients. Available at
http://www.icas.org.uk/site/cms/ contentvie warticle.asp?article=6645.
Ireland, J. C. and Lennox, C. S. (2002). The large audit firm fee premium: A case
of selectivity bias? Journal of Accounting, Auditing and Finance 17(1), 73-91.
Ittonen, K.,Miettinen, J. and Vahamaa, S. (2008). Does Female Representation in
Audit Committees Affect Audit Fees? SSRN eLibrary.
Iyer, V. M. and Iyer, G. S. (1996). Effect of big 8 mergers on audit fees: Evidence
from the United Kingdom. Auditing-a Journal of Practice & Theory, 15, 123-132.
Jensen, K. L. and Payne, J. L. (2005). The introduction of price competition in a
municipal audit market. Auditing-A Journal of Practice & Theory, 24, 137-152.
Jensen, M. C. and Meckling, W. H. (1976). Theory of the firm: Managerial
behavior, agency costs and ownership structure. Journal of Financial Economics,
3, 305-360.
Jensen, M.C (1993). The modern industrial revolution, exit, and failure of internal
control system, The journal of Finance, XLVIII, 831-112
Jeong, S. W.,Jung, K. and Lee, S.J. (2005). The effect of mandatory auditor
assignment and non-audit service on audit fees: Evidence from Korea. The
International Journal of Accounting, 40, 233-248.

263
Jeong-Bon Kim, Xiaohong X. Liu, and Liu ZHENG (2012) The Impact of
Mandatory IFRS Adoption on Audit Fees: Theory and Evidence. The Accounting
Review In-Press
Jianakoplos, N. A. and Bernasek, A. (1998). Are women more risk averse?
Economic Inquiry, 36, 620-630.
Ji-Hong, L. (2007). On determinants of audit fee: New evidence from China,
Journal of Modern Accounting and Auditing, Vol. 3 (4), 2007; 60-64.
Joe, J. R. and Vandervelde, S. D. (2007). Do auditor-provided non audit services
improve audit effectiveness? Contemporary Accounting Research, 24, 467-487.
Johnson, V, E., I. K. Khurana., and J. K. Reynolds.( 2002). Audit firm tenure and
the quality of financial reports, Contemporary Accounting Research, 19 (4) pp
637-660.
Johnson, E. N.,Walker, K. B. and Westergaard, E. (1995). Supplier Concentration
and Pricing Of Audit Services In New-Zealand. Auditing-a Journal of Practice &
Theory, 14, 74-89.
Joshi, P. L. and Al-Bastaki, H. (2000) Determinants of Audit Fees: Evidence from
the Companies Listed in Bahrain. International Journal of Auditing, 4: 129–138
Jubb, C.,Houghton, K. and Butterworth, S. (1996). Audit fee determinants: the
plural nature of risk. Managerial Auditing Journal, 11, 25-40.
Judge, G.G., Hill, R.C., Griffiths, W.E., Lutkepohl, H. and Lee, T.C. (1988).
Introduction to the Theory and Practice of Econometrics, 2nd edition, Wiley,
New York.
Kalbers, L.P. and T. Fogarty (1993), ‘Audit Committee Effectiveness; An
Empirical Investigation of the Contribution of Power’, Auditing: A Journal of
Practice and Theory, 12, 24–49.
Kend, M. (2008). Client industry audit expertise: towards a better understanding,
Pacific Accounting Review, 20, 49 - 62
Kesner, I. F. and Johnson, R. B. (1990). An investigation of the relationship
between board composition and stockholder suits. Strategic Management Journal,
11, 327-336.
Khalil, S.,Magnan, M. L. and Cohen, J. R. (2008). Dual-Class Shares and Audit
Pricing: Evidence from the Canadian Markets. Auditing-a Journal of Practice &
Theory, 27, 199-216.
Kim, Jeong-Bon, Liu, Xiaohong and Zheng, Liu (2012), The Impact of Mandatory
IFRS Adoption on Audit Fees: Theory and Evidence, Accounting Review, 87,
2061-2094.
264
Kinney, W. R.,Palmrose, Z. V. and Scholz, S. (2004). Auditor independence, non-
audit services, and restatements: Was the US government right? Journal of
Accounting Research, 42, 561-588.
Klein, A. (2002). Audit committee, board of director characteristics, and earnings
management. Journal of Accounting and Economics, 33, 375-400.
Knapp, M. C. (1987). An empirical study of audit committee support for auditors
involved in technical disputes with client management. Accounting Review, 62,
578-588.
Knechel, W. R. & Payne, J. L. (2001). Additional evidence on audit report lag.
Auditing, 20, 137-146.
Knechel, W. R. and Willekens, M. (2006). The role of risk management and
governance in determining audit demand. Journal of Business Finance &
Accounting, 33, 1344-1367.
Knechel, W. R., Sharma, D. S. and Sharma, V. D. (2012), Non-Audit Services
and Knowledge Spillovers: Evidence from New Zealand. Journal of Business
Finance & Accounting, 39: 60–81
Kole, S. R. (1995). Measuring managerial equity ownership: a comparison of
sources of ownership data. Journal of Corporate Finance, 1, 413-435.
Krishnan,G.V, Mikhail,P and Sengupta,P (2011). How do auditors view
managers’ voluntary disclosure strategy? The effect of earnings guidance on audit
fees, Journal of Accounting and Public Policy, 31,pp 492-515
Krishnan, G. and Visvanathan, G. (2009). Do auditors price audit committee’s
expertise? The case of accounting versus non-accounting financial experts.
Journal of Accounting, Auditing & Finance, 24, 115–144.
Krishnan, G. V. and Visvanathan, G. (2007). Reporting Internal Control
Deficiencies in the Post-Sarbanes-Oxley Era: The Role of Auditors and Corporate
Governance. International Journal of Auditing, 11, 73-90.
Krishnan, G. V. (2003). Does big 6 auditor industry expertise constrain earnings
management? Accounting Horizons, 17, 1-17.
Krishnan, G.,Pevzner, M. and Sengupta, P. (2009). How do Auditors View
Managers' Voluntary Disclosure Strategy? The Effect of Earnings Guidance on
Audit Fees. SSRN eLibrary.
Krishnan, J., Sami, H. and Zhang, Y., (2005). Does the provision of non-audit
services affect investor perceptions of auditor independence? Auditing: A Journal
of Practice and Theory 24 (2), 111–135.
265
Lai, K. W. and Krishnan, G. V. (2009). Are non-audit services associated with
firm value? Evidence from financial information system-related services.
Accounting and Finance, 49, 599-617.
Langendijk, H. (1997). The market for audit services in the Netherlands. The
European Accounting Review, 6, 253-264.
Larcker, D. F. and Richardson, S. A. (2004). Fees Paid to Audit Firms, Accrual
Choices and Corporate Governance. Journal of Accounting Research, 42(3), 625-
658.
Laux, V. and Newman, D. P. (2010). Auditor Liability and Client Acceptance
Decisions. Accounting Review, 85, 261-285.
Lawrence, A.,Minutti-Meza, M. and Zhang, P. (2011). Can Big 4 versus Non-Big
4 Differences in Audit-Quality Proxies Be Attributed to Client Characteristics?
The Accounting Review, 86, 259-286.
Lee, H.,Mande, V. and Son, M. (2009). Do lengthy auditor tenure and the
provision of non-audit services by the external auditor reduce audit report lags?
International Journal of Auditing, 13, 87-104.
Lee, H. Y. and Mande, V. (2005). The Relationship of Audit Committee
Characteristics with Endogenously Determined Audit and Non-Audit Fees.
Quarterly Journal of Business and Economics, 44, 93-113.
Lee, H. Y., Mande, V. and Ortman, R.(2004). The Effect of Audit Committee and
Board of Director Independence on Auditor Resignation. Auditing: A Journal of
Practice & Theory, 23, 131-146.
Lee, D. S. (1996). Auditor market share, product differentiation and audit fees.
Accounting and Business Research 26, 315-324.
Lennox,C.S. (1999): Non-audit fees, disclosure and audit quality, European
Accounting Review, 8:2, 239-252
Leventis, S and Dimitropoulos, P. E. (2010). Audit pricing, quality of earnings
and board independence: The case of the Athens stock exchange. Advances in
Accounting, 26, 325-332.
Levitt, A. (1998). Corporate governance: Integrity in the information age,
Remarks by Chairman Arthur Levitt, U.S. Securities and Exchange commission, at
the Corporate Law Institude, New Orleans, LA: Tulane University
Lipton, M. and Lorsch,J. (1992). A Modest Proposal for Improved Corporate
Governance, Business Lawyer, 48(1), 59–77
Lim, C. and Tan, H.T, ( 2008). Non-audit service fees and audit quality: The
impact of auditor specialization. Journal of Accounting Research 46 (1), 199–246.

266
Lim, C.Y. and Tan, H.T. (2010). Does Auditor Tenure Improve Audit Quality?
Moderating Effects of Industry Specialization and Fee Dependence,
Contemporary Accounting Research, 27, 923-957.
Lintner, J. (1965). The valuation of risk assets and the selection of risky
investments in stock portfolios and capital budgets. Review of Economics and
Statistics, 47.
Low, K. (2004). The effects of industry specialization on audit risk assessments
and audit-planning decisions. Accounting Review, 79, 201-219.
Low, L.,Tan, P. H. and Koh, H. (1990). The determination of audit fees: an
analysis in the Singapore context. Journal of Business Finance & Accounting, 17,
285-295.
Lu, T. and Sapra, H. (2009). Auditor Conservatism and Investment Efficiency.
Accounting Review, 84(6) 1933-1958.
Mace, M. (1986). Directors: Myth and Reality, Harvard University Press, Boston ,
MA.
Maher, M. W.,Tiessen, P.,Colson, R. and Broman, A. J. (1992). Competition and
audit fees. Accounting Review, 67, 199-211.
Mak, Y. T. and Li, Y. (2001). Determinants of corporate ownership and board
structure: evidence from Singapore. Journal of Corporate Finance, 7, 235-256.
Malloy, C. J. (2005). The geography of equity analysis. The Journal of Finance,
60, 719-755.
Mansi, S. A.,Maxwell, W. F. and Miller, D. P. (2004). Does auditor quality and
tenure matter to investors? Evidence from the bond market. Journal of Accounting
Research, 42, 755-793.
Masli, A.,Peters, G. F.,Richardson, V. J. and Sanchez, J. M. (2010). Examining
the Potential Benefits of Internal Control Monitoring Technology. Accounting
Review, 85, 1001-1034.
Mat Zain, M. and Subramaniam, N. (2007). Internal auditor perceptions on audit
committee interactions : a qualitative study in Malaysian public corporations.
Corporate Governance: An International Review 15, 894–908.
Mayhew, B. W. and Wilkins, M. S. (2003). Audit Firm Industry Specialization as
a Differentiation Strategy: Evidence from Fees Charged to Firms Going Public.
Auditing: A Journal of Practice & Theory, 22, 33-53.
267
Mcmeeking, K. P.,Peasnell, K. V. and Pope, P. F. (2007). The effect of large audit
firm mergers on audit pricing in the UK. Accounting and Business Research, 37,
301-319.
Mcmeeking, K.,Pope, P.andPeasnell, K. (2006). The determinants of the UK big
six premium. Accounting and Business Research, 36, 207-231.
Mcmullen, D., and Raghunandan, K. (1996). Enhancing audit committee
effectiveness. Journal of Accountancy, August, 79-81
Mcmullen, D. A. (1996). Audit committee performance: an investigation of the
consequences associated with audit committees. Auditing: A Journal of Practice
and Theory, 15, 87-103.
Menon, K. and Williams, D. D. (2001). Long-term trends in audit fees. Auditing:
A Journal of Practice & Theory, 20, 115-136.
Meshari O. Al-Harshani, (2008). The pricing of audit services: evidence from
Kuwait, Managerial Auditing Journal, 23(7), 685-696
Messier, W. F., Jr.,Reynolds, J. K.,Simon, C. A. and Wood, D. A. (2011). The
Effect of Using the Internal Audit Function as a Management Training Ground on
the External Auditor's Reliance Decision. The Accounting Review, 86(6) 2131-
2154.
Mitra, S. and Hossain, M. (2007). Ownership composition and non-audit service
fees. Journal of Business Research, 60, 348-356.
Mitra, S., Hossain, M. and Deis, D. R. (2007). The empirical relationship between
ownership characteristics and audit fees. Review of Quantitative Finance and
Accounting, 28, 257-285.
Mossin, J. (1966). Equilibrium in a capital asset market. Econometrica: Journal of
the Econometric Society, 34(4), 768-783.
National Association of Corporate Directors (NACD) (1999). Report of the NACD
Blue Ribbon Commission on Audit Committees: A Practical Guide, Washington,
D.C: National association of Corporate Directors.
Niemi, L. (2002). Do firms pay for audit risk? Evidence on risk premiums in audit
fees after direct control for audit effort. International Journal of Auditing, 6, 37-
51.
Niemi, L. (2004). Auditor size and audit pricing: Evidence from small audit firms.
European Accounting Review, 13, 541–60.
268
Nikkinen, J. and Sahlstrom, P. (2003). Do Auditors Assess The Systematic
Market Risk In Their Audit Pricing Decisions? International Evidence. Advances
in Accounting, 20, 233-244.
Nikkinen, J. P. S. (2004). Does agency theory provide a general framework for
audit pricing? International Journal of Auditing, 8, 253–262.
O'keefe, T. B.,King, R. D. and Gaver, K. M. (1994). Audit Fees, Industry
Specialization, and Compliance with GAAS Reporting Standards , Auditing: A
Journal of Practice and Theory, 13(2), 41–55
Olson, J. 1999. How to really make audit committees more effective. The
Business Lawyer. 54 (3), 1097-1111.
O'sullivan, N. (2009). The impact of directors' and officers' insurance on audit
pricing: Evidence from UK companies. Accounting Forum, 33(2), 146-161
O'sullivan, N. and Diacon, S. R. (2002). The Impact of Ownership, Governance
and Non-Audit Services on Audit Fees: Evidence from the Insurance Industry.
International Journal of Auditing, 6, 93-107.
O'sullivan, N. (2000). The Impact of Board Composition And Ownership on
Audit Quality: Evidence From Large UK Companies. The British Accounting
Review, 32, 397-414.
O'sullivan, N. and Diacon, S. (1999). Internal and External Governance
Mechanisms: evidence from the UK insurance industry. Corporate Governance:
An International Review, 7, 363-373.
Owhoso, V. E., Messier Jr, W. F. and Lynch Jr, J. G. (2002). Error Detection by
Industry Specialized Teams during Sequential Audit Review. Journal of
Accounting Research, 40, 883-900.
Owusu-Ansah, S.,Leventis, S.andCaramanis, C. (2010). The pricing of statutory
audit services in Greece. Accounting Forum, 34, 139-152.
Palmrose, Z. V. (1986a). Audit fees and auditor size: Further evidence. Journal of
Accounting Research, 24, 97-110.
Palmrose, Z. V. (1986b). The effect of nonaudit services on the pricing of audit
services: Further evidence. Journal of Accounting Research, 24, 405-411.
Palmrose, Z.-V. (1988). Public Accounting Firms and the Acquisition of Nonaudit
Services by Public and Closely-Held Companies. Auditing: A Journal of Practice
& Theory, 6(1), 63-71.
Parker, R. H. (1992). MacMillan Dictionary of Accounting. Second Edition.
MacMillan.London

269
Paterson, J. S. and Valencia, A. (2011), The Effects of Recurring and
Nonrecurring Tax, Audit-Related, and Other Nonaudit Services on Auditor
Independence. Contemporary Accounting Research, 28: 1510–1536.
doi: 10.1111/j.1911-3846.2010.01060.x
Patton, A. and Baker, J. (1987). Why won’t directors rock the boat? Harvard
Business Review, 65, 10-12.
Pearson, T. and Trompeter, G. (1994). Competition in the Market for Audit
Services: The Effect of Supplier Concentration on Audit Fees. Contemporary
Accounting Research, 11, 115-135.
Peasnell, K.V., Pope, P.F. and Young, S. (2005). Board Monitoring and Earnings
Management: Do Outside Directors Influence Abnormal Accruals?, Journal of
Business Finance & Accounting, 32, 1311–1346.
Peel, M. J. and Clatworthy, M. A. (2001). The Relationship Between Governance
Structure and Audit Fees Pre-Cadbury: some empirical findings. Corporate
Governance: An International Review, 9, 286-297.
Peterson, C.A and Philpot,J. (2007). Women’s Roles on U.S. Fortune 500 Boards:
Director Expertise and Committee Memberships, Journal of business ethics, 72,
177-196
Pfeffer, J., & Salancik, G. R. (1978). The external control of organizations: A
resource dependence perspective.New York: Harper & Row.
Pfeffer, J. (1973). Size, composition, and function of hospital boards of directors:
A study of organizationenvironment linkage. Administrative Science Quarterly,
18, 349-364.
Pincus, K., M. Rubarsky and J. Wong (1989), ‘Voluntary Formation of Corporate
Audit Committees Among NASDAQ Firms,’ Journal of Accounting and Public
Policy, 8(4), 239–65.
Pong, C. and Whittington, G. (1994). The determinants of audit fees: Some
empirical models. Journal of Business Finance & Accounting, 21, 1071-1095.
Plender, J. (2008), Mind the gap: Why business face a crisis of legitimacy,
Financial times (UK), 8 April, p.9.
Preston, J. B. and Brown, W. A. (2004), Commitment and performance of
nonprofit board members. Nonprofit Management and Leadership, 15: 221–238.
doi: 10.1002/nml.63
Quick, R. and Warming Rasmussen, B. (2009). Auditor Independence and the
Provision of Non Audit Services: Perceptions by German Investors. International
Journal of Auditing, 13, 141-162.
270
Rainsbury, E.,Bradbury, M. and Cahan, S. (2009). The impact of audit committee
quality on financial reporting quality and audit fees. Journal of Contemporary
Accounting &Economics, 5, 20-33.
Raghunandan, K, Rama, D.V. and Read,W.J (2001) Audit Committee
Composition, “Gray Directors,” and Interaction with Internal Auditing.
Accounting Horizons, 15, 105-118.
Raman, K. K. and Wilson, E. R. (1992). An empirical investigation of the market
for ‘single audit’ services. Journal of Accounting and Public Policy, 11, 271-295.
Redmayne, N. B., Bradbury, M. E. and Cahan, S. F. (2011), The Association
between Audit committees and Audit Fees in the Public Sector. International
Journal of Auditing, 15: 301–315. doi: 10.1111/j.1099-1123.2011.00436.x
Reynolds, J. K. and Francis, J. R. (2001). Does size matter? The influence of large
clients on office-level auditor reporting decisions. Journal of Accounting and
Economics, 30, 375-400.
Reynolds, J. K.,Deis, D. and Francis, J. R. (2004). Professional service fees and
auditor objectivity. Auditing, 23, 29-52.
Reiner, Q. and Bent, W. (2009): Auditor Independence and the Provision of Non-
Audit Service. Perceptions by German Investors. International Journal of
Auditing, 13(2), 141-165.
Rezaee, Z. (2009), Corporate Governance and Ethics, United States: John Wiley
& Sons, INC.
Robinson, G. and Dechant, K. (1997). Building a business case for diversity. The
Academy of Management Executive (1993-2005), 11, 21-31.
Rose, Andrew K. and Spiegel, Mark M. (2009) “Cross-Country Causes And
Consequences Of The 2008 Crisis: Early Warning” NBER Working Paper Series,
National Bureau Of Economic Research, Cambridge.
Rose, C. (2007). Does female board representation influence firm performance?
The Danish evidence. Corporate Governance: An International Review, 15, 404-
413.
Sarbanes-Oxley Act of 2002 (2002). The Public Company Accounting Reform and
Investor Protection Act, Pub. L. no. 107-204. Online
at http:www.whitehouse.govinfocus corporateresponsibility.
Salman, F. M. and Carson, E. (2009). The Impact of the Sarbanes Oxley Act on
the Audit Fees of Australian Listed Firms. International Journal of Auditing, 13,
127-140.
271
Sanders, G.,Allen, A. and Korte, L. (1995). Municipal audit fees: Has increased
competition made a difference? Auditing: A Journal of Practice and Theory, 14,
105-114.
Schubert, R. (2006). Analyzing and managing risks – on the importance of gender
difference in risk attitudes. Managerial Finance, 32, 706-715.
Securities and Exchange Commission (2003). United States Securities and
Exchange Commission (SEC), 2003. International Accounting Standards,
Securities and Exchange Commission, Washington, DC
Securities and Exchange Commission (2000). United States Securities and
Exchange Commission (SEC), 2000. International Accounting Standards,
Securities and Exchange Commission, Washington, DC
Swan, Peter L and Honeine, Serkan (2010). Is Company Performance Dependent
on Outside Director 'Skin in the Game'? Available at SSRN:
http://ssrn.com/abstract=1746536
Sharma, D. S. (2003). The efficacy of audit committee monitoring of audit
quality: tests of main and interaction effects. Paper presented at AFAANZ
Conference, Brisbane, Australia.
Sharpe, W. F. (1964). Capital asset prices: A theory of market equilibrium under
conditions of risk. Journal of Finance, 19, 425-442.
Short, H. and Keasey, K. (1999). Managerial Ownership and the Performance of
Firms: Evidence from the UK. Journal of Corporate Finance, 5, 79-101.
Simon D., Taylor, M. H.(1997). The market for audit services in Pakistan,
Advances in International Accounting, Vol. 10.pp 253-261
Simon, D. T. and Taylor, M. H. (2002). A survey of audit pricing in Ireland.
International Journal of Auditing, 6, 3-12.
Simon, D. T. (1995). The market for audit services in South Africa. The
International Journal of Accounting & Business Research, 30, 356-365.
Simon, D.,Ramanan, R. and Dugar, A. (1986). The Market for Audit Services in
India: An Empirical Examination. International Journal of Accounting Education
and Research, 27-35.
Simunic, D. A. and Stein, M. T. (1996). The impact of litigation risk on audit
pricing: A review of the economics and the evidence. Auditing-a Journal of
Practice & Theory, 15, 119-134.
Simunic, D. A. (1980). The Pricing of Audit Services - Theory and Evidence.
Journal of Accounting Research, 18, 161-190.
272
Simunic, D. A. (1984). Auditing, consulting, and auditor independence. Journal
of Accounting Research, 22, 679-702.
Smith Committee (2003). Audit Committee Combined Code Guidance. London:
Financial Reporting Council.
Solomon, I., Shields, M. D. and Whittington, O. R. (1999). What do industry-
specialist auditors know? Journal of Accounting Research, 37, 191-208.
Srinidhi, B.,Lim, C. Y. and Hossain, M. (2009). Effects of country-level legal,
extra-legal and political institutions on auditing: A cross-country analysis of the
auditor specialization premium. Journal of Contemporary Accounting &
Economics, 5, 34-46.
Srinidhi, B.N. and Gul, F.A. (2007) “The differential effects of auditors’ nonaudit
and audit fees on accrual quality” Contemporary Accounting Research, 24 (2),
595–629
Stanley, J. D. and Todd Dezoort, F. (2007). Audit firm tenure and financial
restatements: An analysis of industry specialization and fee effects. Journal of
Accounting and Public Policy, 26, 131-159.
Stein, M. T. (2006). Discussion of "An economic analysis of audit and nonaudit
services: The trade-off between competition crossovers and knowledge
spillovers". Contemporary Accounting Research, 23, 555-564.
Sudarsanam, S.,Holl, P. and Salami, A. (1996). Shareholder wealth gains in
mergers: effect of synergy and ownership structure. Journal of Business Finance
& Accounting, 23, 673-698.
Sullivan, M. W. (2002). The effect of the big eight accounting firm mergers on the
market for audit services. Journal of Law and Economics, 375-399.
Sun, J. and Liu, G. (2011). Industry specialist auditors, outsider directors, and
financial analysts. Journal of Accounting and Public Policy, 30(4), 367-382
Tafara, E. Taffler, R. and Ramalinggam, K. (1982). The determinants of the audit
fee in the UK: an exploratory study. Working paper.City University Business
School, London.
Tafara, E (2007). Remarks on UK and US approaches to corporate governance
and on the market for corporate control. A briefing, International Conference
Corporate Governance and Securities Markets, Madrid, Spain, February 8, 2007.
Taub, S. (2005). The auditor-investor ‘‘expectations gap.’’ CFO (October 17): 1.
Tauringana, V., Kyeyune, M. F and Opio P. J. (2008). Corporate governance, dual
language reporting and the timeliness of annual reports on the Nairobi Stock
Exchange. Research in Accounting in Emerging Economies, 8, 13-37.
273
Taylor, M. H. (1997). The market of audit services in Japan. Pacific Accounting
Review, 9(2), 59-74.
Taylor M. and D. Simon. 2003. The Market for Audit Services in Nigeria.
Research in Accounting in Emerging Economies, 5, 165-175
Taylor, M. H., Simon, D. T., & Greg Burton, F. (1999). A survey of audit service
pricing in South Korea, Research in Accounting Regulation, 13, 201-7.
Tengamnuay, K. and Stapleton, P. (2009). The role of the audit committee in
Thailand: a mature monitoring mechanism or an evolving process? Journal of
Management & Governance, 13, 131-161.
The Companies Act (1985). Disclosure of Remuneration for Non-Audit Work,
Regulations 1991(1991 No. 2128).
The Companies Act (2005). Disclosure of Auditor Remuneration and Liability
Agreements, Regulations 2005 (SI 2005/2417). United Kingdom.
Thinggaard, F. and Kiertzner, L. (2008). Determinants of audit fees: evidence
from a small capital market with a joint audit requirement. International Journal
of Auditing, 12, 141-158.
Tsui , J. S. L., and, B. J. and Gul, F. A. (2001). Ceo Domination, Growth
Opportunities,and Their Impact on Audit Fees. Journal of Accounting, Auditing
and Finance, 16, 189-210.
Turnbull Review Group (2005). Internal Control: Guidance for Directors on the
Combined Code, London, Financial Reporting Council.
Turpen, R. A. (1990). Differential pricing on auditors’ initial engagements:
Further evidence. Auditing: A Journal of Practice and Theory, 9, 60-76.
Stewardship Code (2010). UK Stewardship Code 2010. London, Financial
Reporting Council
Us House Of Representatives, Committee On Financial Services (2002).
Sarbanes–Oxley Act of 2002. Public Law No.107-204. Washington DC:
Government Printing Office.
Vafeas, N. and Waegelein, J. F. (2007). The association between audit
committees, compensation incentives, and corporate audit fees. Review of
Quantitative Finance and Accounting, 28, 241-255.
Vafeas, N. (1999).Board Meeting Frequency and Firm Performance. Journal of
Financial Economics, 53, 113-142.
Van Der Laan, S. And Christodoulou, D. (2012), Audit Fees and Deeds of Cross
Guarantee: An Empirical Evaluation. Abacus, 48, 293–315.

274
Van Caneghem, T. (2010). Audit pricing and the Big4 fee premium: evidence
from Belgium. Managerial Auditing Journal, 25, 122-139.
Vanderstoep, S.W. and Johnston, D.D. (2009). Research Methods for Everyday
Life, Jossey-Bass, San Francisco.
Venkataraman, R.,Weber, J. P. and Willenborg, M. (2008). Litigation risk, audit
quality, and audit fees: Evidence from initial public offerings. The Accounting
Review, 83, 1315.
Villalonga, B. and Amit, R. (2006). How do family ownership, control and
management affect firm value? Journal of Financial Economics, 80, 385-417.
Vinatoru, S.-S. and Calota, G. (2009). Non-Audit Service Fees, Auditor
Characteristics and Earnings Restatements. Annals of the University of Petrosani
Economics, 9, 321-328.
Walker’s Committee (2010). A review of corporate governance in UK banks and
other financial industry entities, The Walker review secretariat, London
Ward, D.D., Elder, R.J., Kattelus, S.C., 1994. Determinants of municipal audit
fees. The Accounting Review 69, 399–411.
Waresulkarim, A. K. M., and Moizer, P. (1996). Determinants of audit fees in
Bangladesh. International Journal of Accounting, 31(4), 497-509.
http://dx.doi.org/10.1016/S0020-7063(96)90034-5
Wang, K.,O, Sewon. and Iqbal, Z. (2009). Audit pricing and auditor industry
specialization in an emerging market: Evidence from China. Journal of
International Accounting, Auditing & Taxation, 18, 60-72.
Whisenant, S.,Sankaraguruswamy, S. and Raghunandan, K. (2003). Evidence on
the Joint Determination of Audit and Non Audit Fees. Journal of Accounting
Research, 41, 721-744.
Wines, G. (1994). Auditor independence, audit qualifications and the provision of
non-audit services: A note. Accounting & Finance, 34, 75-86.
Wong, S. (2009). Audit Pricing In Australia In 2000s, International Review of
Business Research Papers, 5, 82-89
Wu, M. G. H. (2006). An economic analysis of audit and non-audit services: The
trade-off between competition crossovers and knowledge spillovers.
Contemporary Accounting Research, 23, 527-554.
Xie, B., Davidson Iii, W. N. and Dadalt, P. J. (2003). Earnings management and
corporate governance: the role of the board and the audit committee. Journal of
Corporate Finance, 9, 295-316.

275
Yermack, D. (1996). Higher market valuation for firms with a small board of
directors, Journal of Financial Economics 40, 185-211.
Zaman, M., Hudaib, M. and Haniffa, R. (2011). Corporate governance quality,
audit fees and non-audit services fees. Journal of Business Finance and
Accounting, 38, 165–197.
Zhao, S. D.,Chen, L. P. and Hua, L. (2006). Study of American Audit Failure.
Journal of Modern Accounting and Auditing, 2, 64-70
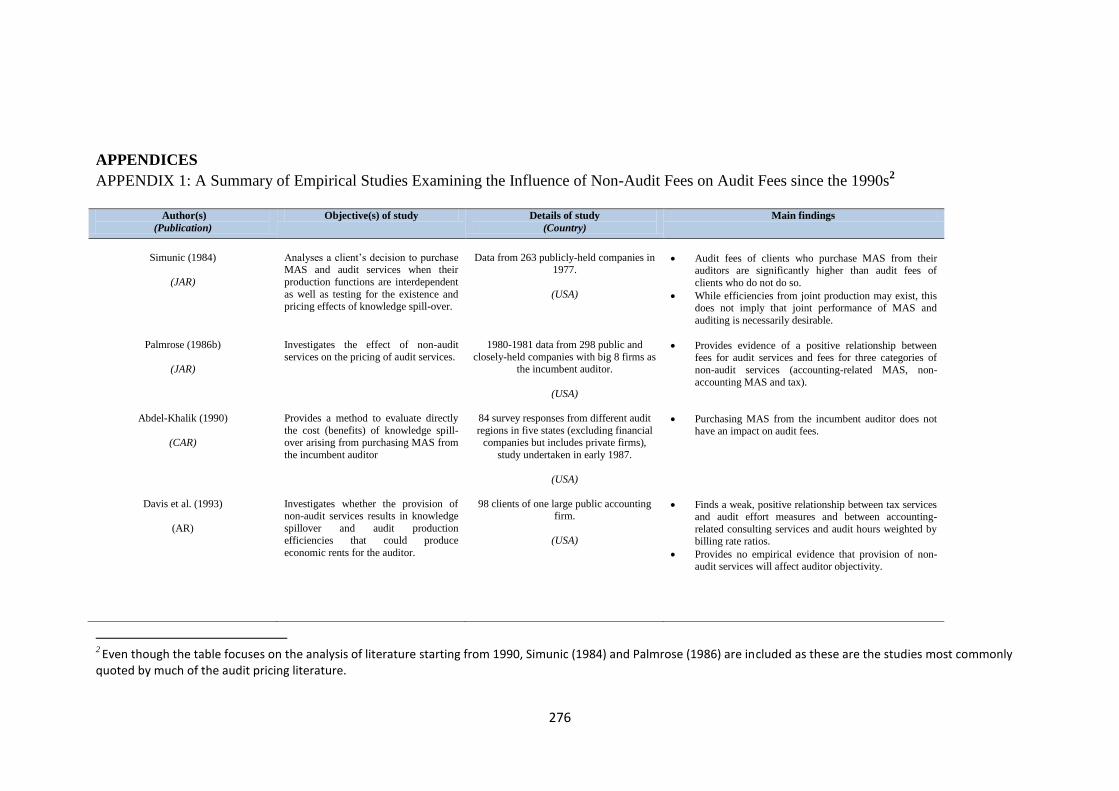
276
APPENDICES
APPENDIX 1: A Summary of Empirical Studies Examining the Influence of Non-Audit Fees on Audit Fees since the 1990s2
2
Even though the table focuses on the analysis of literature starting from 1990, Simunic (1984) and Palmrose (1986) are included as these are the studies most commonly quoted by much of the audit pricing literature.
Author(s)
(Publication)
Objective(s) of study Details of study
(Country)
Main findings
Simunic (1984)
(JAR)
Analyses a client’s decision to purchase MAS and audit services when their
production functions are interdependent
as well as testing for the existence and pricing effects of knowledge spill-over.
Data from 263 publicly-held companies in 1977.
(USA)
Audit fees of clients who purchase MAS from their auditors are significantly higher than audit fees of
clients who do not do so.
While efficiencies from joint production may exist, this does not imply that joint performance of MAS and
auditing is necessarily desirable.
Palmrose (1986b)
(JAR)
Investigates the effect of non-audit
services on the pricing of audit services.
1980-1981 data from 298 public and
closely-held companies with big 8 firms as the incumbent auditor.
(USA)
Provides evidence of a positive relationship between fees for audit services and fees for three categories of
non-audit services (accounting-related MAS, non-
accounting MAS and tax).
Abdel-Khalik (1990)
(CAR)
Provides a method to evaluate directly
the cost (benefits) of knowledge spill-over arising from purchasing MAS from
the incumbent auditor
84 survey responses from different audit
regions in five states (excluding financial companies but includes private firms),
study undertaken in early 1987.
(USA)
Purchasing MAS from the incumbent auditor does not have an impact on audit fees.
Davis et al. (1993)
(AR)
Investigates whether the provision of non-audit services results in knowledge
spillover and audit production efficiencies that could produce
economic rents for the auditor.
98 clients of one large public accounting firm.
(USA)
Finds a weak, positive relationship between tax services and audit effort measures and between accounting-
related consulting services and audit hours weighted by billing rate ratios.
Provides no empirical evidence that provision of non-audit services will affect auditor objectivity.
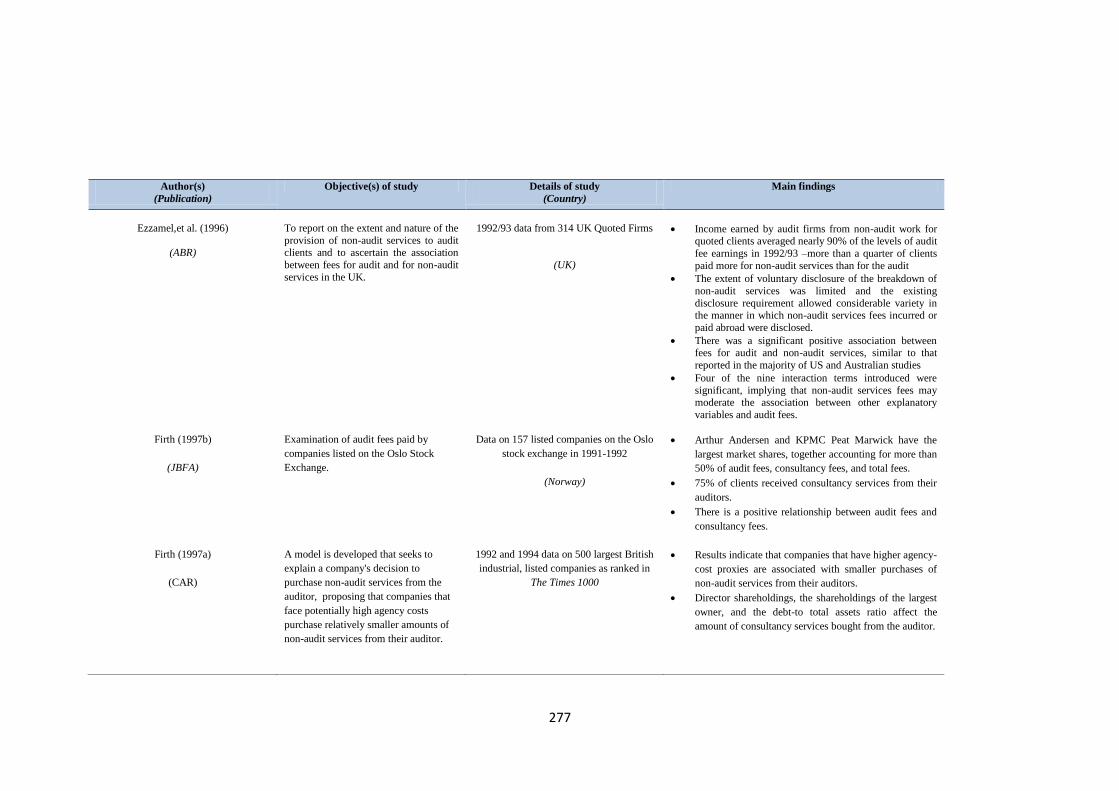
277
Author(s)
(Publication)
Objective(s) of study Details of study
(Country)
Main findings
Ezzamel,et al. (1996)
(ABR)
To report on the extent and nature of the
provision of non-audit services to audit
clients and to ascertain the association
between fees for audit and for non-audit
services in the UK.
1992/93 data from 314 UK Quoted Firms
(UK)
Income earned by audit firms from non-audit work for quoted clients averaged nearly 90% of the levels of audit
fee earnings in 1992/93 –more than a quarter of clients
paid more for non-audit services than for the audit
The extent of voluntary disclosure of the breakdown of
non-audit services was limited and the existing
disclosure requirement allowed considerable variety in the manner in which non-audit services fees incurred or
paid abroad were disclosed.
There was a significant positive association between fees for audit and non-audit services, similar to that
reported in the majority of US and Australian studies
Four of the nine interaction terms introduced were
significant, implying that non-audit services fees may moderate the association between other explanatory
variables and audit fees.
Firth (1997b)
(JBFA)
Examination of audit fees paid by
companies listed on the Oslo Stock
Exchange.
Data on 157 listed companies on the Oslo
stock exchange in 1991-1992
(Norway)
Arthur Andersen and KPMC Peat Marwick have the
largest market shares, together accounting for more than
50% of audit fees, consultancy fees, and total fees.
75% of clients received consultancy services from their
auditors.
There is a positive relationship between audit fees and
consultancy fees.
Firth (1997a)
(CAR)
A model is developed that seeks to
explain a company's decision to
purchase non-audit services from the
auditor, proposing that companies that
face potentially high agency costs
purchase relatively smaller amounts of
non-audit services from their auditor.
1992 and 1994 data on 500 largest British
industrial, listed companies as ranked in
The Times 1000
Results indicate that companies that have higher agency-
cost proxies are associated with smaller purchases of
non-audit services from their auditors.
Director shareholdings, the shareholdings of the largest
owner, and the debt-to total assets ratio affect the
amount of consultancy services bought from the auditor.

278
Author(s)
(Publication)
Objective(s) of study Details of study
(Country)
Main findings
Lennox (1999)
(EAR)
Investigates the effect of non-audit
services on audit quality
Data from 537 listed companies in 1988-
1994
(UK)
Following the announcement of the requirement to
disclose non-audit fees, approximately 1/3
of UK quoted companies disclosed before the
requirement became effective.
Auditor size, directors’ shareholdings and non-audit
fees were not significantly correlated
with early disclosure.
Indicates a positive weakly significant relationship
between disclosed non-audit fees and audit
qualifications- suggests that when non-audit fees are
disclosed, the provision of non-audit services does not
reduce audit quality.
Clatworthy et al. (2002)
(JBFA)
Investigate the market for audit services
for UK National Health Service (NHS)
trusts.
459 NHS Trust for the year ended 31st March 1997
(UK)
A negative association between audit and non-audit fees
in the UK National Health Service sector consistent with
knowledge spillover.
Firth (2002)
(JBFA)
To examine the provision of non-audit
services (also termed here as
consultancy services) to audit clients
using data from UK
1,112 observations of company listed on
International Stock Exchange in 1996 Positive association between audit and non-audit fees
observed in the UK is primarily driven by company
specific events (e.g. mergers and acquisitions,
restructuring, new finance, change in management) that
result in the demand for more consultancy and audit
services.
O’Sullivan, and Diacon (2002)
(IJA)
Compare the pricing of audits in mutual
and proprietary insurance companies (including audit committees and non-
audit fees)
1992 data from 117 UK insurance
companies (UK)
There is weak evidence of the relationship between provision of non-audit service and audit fees. No
evidence between audit fees and nature of non-audit
service. Company size and complexity are the most
important determinants of audit pricing in insurance
companies, with significant price reductions earned by
insurers specializing in either general or life insurance business

279
Author(s)
(Publication)
Objective(s) of study Details of study
(Country)
Main findings
Frankel et al. (2002)
(AR)
Examines whether auditor fees are associated with earnings management
and investigates the market reaction to
the disclosure of auditor fees.
2001 data from 3,074 proxy statements on the SEC”S EdGAR database with filing
date between February 5, 2001 and June
15 2001.
(USA)
Presents evidence that non-audit fees are positively associated with small earnings surprise and the
magnitude of discretionary accruals
Found that audit fees are negatively associated with
these earnings management indicators.
Also found a negative association between non-audit fees and share values on the date the fees were
disclosed, although the effect is small in economic terms.
Ashbaugh et al. (2003)
(AR)
Further investigation of the association
between non-audit fees and biased
financial reporting.
2001 data from 3,170 U.S. registrant firms for which 2,000 proxy statements were
available on EDGAR or Global Access
during November and December 2001 (excluding financial institutions)
(USA)
Finds no relationship between positive discretionary accruals and any of the auditor fee metrics when
discretionary accruals are adjusted for firm performance and sample firms are partitioned by income-increasing
versus income decreasing accruals
In the earnings benchmark tests, they find no relation between fee ratio and the likelihood that firms beat
analysts' forecasts.
Also finds no evidence that the market reacts to the
magnitude of non-audit fees relative to total fees
Whisenant et al. (2003)
(IJA)
Investigates whether the characteristics
of clients, auditors, and the auditor-client relationship simultaneously
determine audit and non-audit fees.
2001 data from 2,666 listed firms
disclosing fiscal year 2000 audit and non-audit fee data in proxy statements filed at
the SEC from January 1 to August 31
2001.
(USA)
The results of the study show that audit and non-audit fees are endogenous.
It was found that inferences are different on the relation between audit and non-audit fees after considering the
simultaneity of audit and non-audit services compared
with those inferences from single-equation estimations.
Estimating the system of fee equations simultaneously,
they find that provision of audit and non-audit services
leads to no relation with audit fees, with suggestion that
single-equation estimations suffer from simultaneous-
equation bias.
Findings also suggest that either there is no knowledge spillover or equal knowledge spillover exists between
audit and non-audit services.
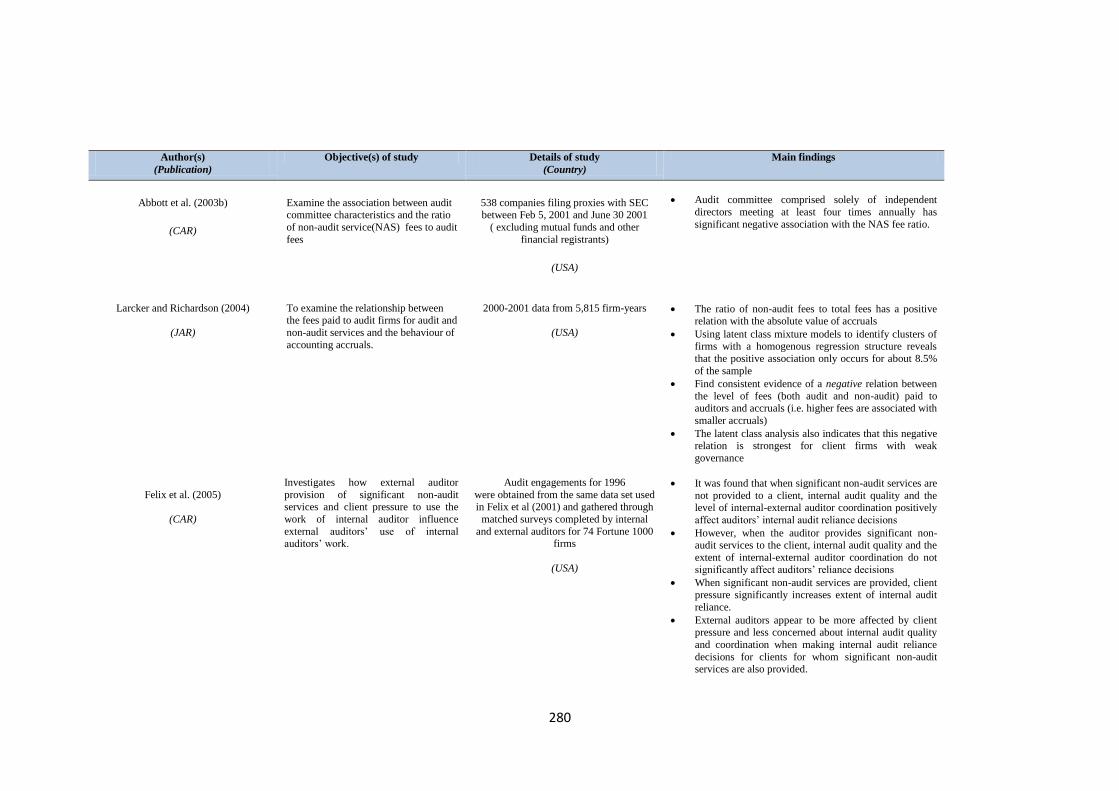
280
Author(s)
(Publication)
Objective(s) of study Details of study
(Country)
Main findings
Abbott et al. (2003b)
(CAR)
Examine the association between audit committee characteristics and the ratio
of non-audit service(NAS) fees to audit
fees
538 companies filing proxies with SEC between Feb 5, 2001 and June 30 2001
( excluding mutual funds and other
financial registrants)
(USA)
Audit committee comprised solely of independent
directors meeting at least four times annually has
significant negative association with the NAS fee ratio.
Larcker and Richardson (2004)
(JAR)
To examine the relationship between the fees paid to audit firms for audit and
non-audit services and the behaviour of
accounting accruals.
2000-2001 data from 5,815 firm-years
(USA)
The ratio of non-audit fees to total fees has a positive relation with the absolute value of accruals
Using latent class mixture models to identify clusters of firms with a homogenous regression structure reveals
that the positive association only occurs for about 8.5%
of the sample
Find consistent evidence of a negative relation between
the level of fees (both audit and non-audit) paid to auditors and accruals (i.e. higher fees are associated with
smaller accruals)
The latent class analysis also indicates that this negative relation is strongest for client firms with weak
governance
Felix et al. (2005)
(CAR)
Investigates how external auditor
provision of significant non-audit services and client pressure to use the
work of internal auditor influence
external auditors’ use of internal auditors’ work.
Audit engagements for 1996
were obtained from the same data set used in Felix et al (2001) and gathered through
matched surveys completed by internal
and external auditors for 74 Fortune 1000 firms
(USA)
It was found that when significant non-audit services are
not provided to a client, internal audit quality and the level of internal-external auditor coordination positively
affect auditors’ internal audit reliance decisions
However, when the auditor provides significant non-audit services to the client, internal audit quality and the
extent of internal-external auditor coordination do not significantly affect auditors’ reliance decisions
When significant non-audit services are provided, client
pressure significantly increases extent of internal audit
reliance.
External auditors appear to be more affected by client pressure and less concerned about internal audit quality
and coordination when making internal audit reliance
decisions for clients for whom significant non-audit services are also provided.

281
Author(s)
(Publication)
Objective(s) of study Details of study
(Country)
Main findings
Lee and Mande (2005)
(QJBE)
Examine the association between the
fees paid to the external auditor and
effective audit committees
2000 data from 792 firms from the
Investor Responsibility Research Center’s
(IRRC) database
(US)
Initial results also suggest that effective audit committees seek to increase audit quality by reducing
the non-audit services provided by the external auditor.
Once the non-audit fee is modelled endogenously the results show that there is no statistically significant
association between the non-audit fees and audit
committee effectiveness. Jeong et al. (2005)
(IJOA)
Investigate the relationship among audit
fees, mandatory auditor assignment and
the joint provision of Non-audit and auditor services.
Data from 2025 firm year observations of
companies listed on Korean Stock
Exchange for the period between 1999 and 2002.
(Korea)
Assigned auditors charge significantly higher audit fees
than freely selected auditors.
Joint provision of audit fees and non-audit fees does
intensify the relationship between auditor assignment and audit fees.
Suggest that mandatory auditor assignment may improve auditor independence.
Antle et al. (2006)
(RQFA)
Addresses the endogeneity issue by
modelling the confluence of audit fees,
fees for non-audit services and abnormal
accruals in a system of simultaneous
equations.
Data from 2,294 Firm year observations
from 25 industries for fiscal year 1994-
2000 and 1,570 USA firms’ year
observations for fiscal year 1994.
(UK)
Finds evidence consistent with knowledge spillover (or
economies of scope) from auditing to non-audit services
and from non-audit services to auditing.
Do not find support for the assertion that fees for non-audit services increase abnormal accruals.
Found that non-audit fees decrease abnormal accruals, which is attributed to the productive effects of non-audit
services.
Hay et al. (2006)
(JBFA)
Examines evidence in New Zealand as to whether auditors providing more non-
audit services are less independent.
1999-2001 data from top companies in New Zealand (177 for 1999, 224 in 2000
and 243 in 2001).
(New Zealand)
Found positive relationship between audit fees and non-audit fees.
No significant relationship between audit qualification or modification and non-audit fees.
There is no significant relationship between auditor change and non-audit fees.
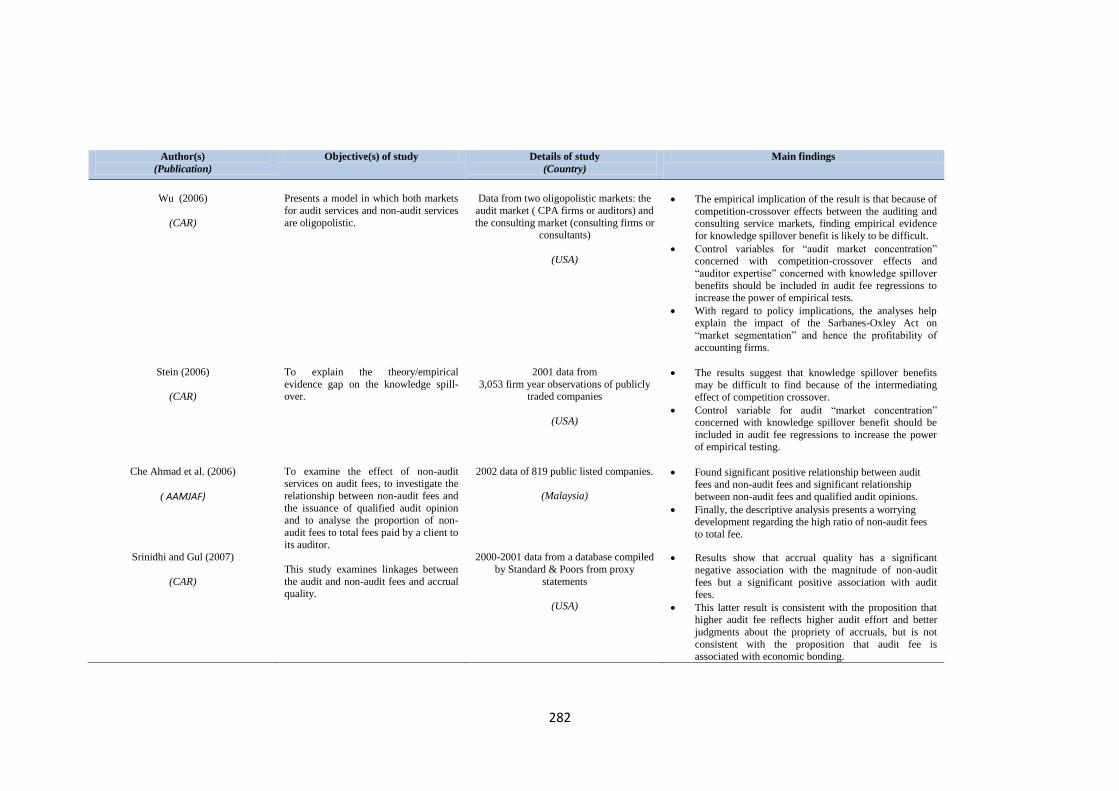
282
Author(s)
(Publication)
Objective(s) of study Details of study
(Country)
Main findings
Wu (2006)
(CAR)
Presents a model in which both markets
for audit services and non-audit services
are oligopolistic.
Data from two oligopolistic markets: the
audit market ( CPA firms or auditors) and
the consulting market (consulting firms or consultants)
(USA)
The empirical implication of the result is that because of
competition-crossover effects between the auditing and consulting service markets, finding empirical evidence
for knowledge spillover benefit is likely to be difficult.
Control variables for “audit market concentration” concerned with competition-crossover effects and
“auditor expertise” concerned with knowledge spillover
benefits should be included in audit fee regressions to increase the power of empirical tests.
With regard to policy implications, the analyses help explain the impact of the Sarbanes-Oxley Act on
“market segmentation” and hence the profitability of
accounting firms.
Stein (2006)
(CAR)
To explain the theory/empirical
evidence gap on the knowledge spill-over.
2001 data from
3,053 firm year observations of publicly traded companies
(USA)
The results suggest that knowledge spillover benefits may be difficult to find because of the intermediating
effect of competition crossover.
Control variable for audit “market concentration”
concerned with knowledge spillover benefit should be
included in audit fee regressions to increase the power of empirical testing.
Che Ahmad et al. (2006)
( AAMJAF)
To examine the effect of non-audit services on audit fees, to investigate the
relationship between non-audit fees and
the issuance of qualified audit opinion and to analyse the proportion of non-
audit fees to total fees paid by a client to
its auditor.
2002 data of 819 public listed companies.
(Malaysia)
Found significant positive relationship between audit fees and non-audit fees and significant relationship
between non-audit fees and qualified audit opinions.
Finally, the descriptive analysis presents a worrying development regarding the high ratio of non-audit fees
to total fee.
Srinidhi and Gul (2007)
(CAR)
This study examines linkages between
the audit and non-audit fees and accrual
quality.
2000-2001 data from a database compiled
by Standard & Poors from proxy
statements
(USA)
Results show that accrual quality has a significant
negative association with the magnitude of non-audit
fees but a significant positive association with audit
fees.
This latter result is consistent with the proposition that higher audit fee reflects higher audit effort and better
judgments about the propriety of accruals, but is not
consistent with the proposition that audit fee is associated with economic bonding.
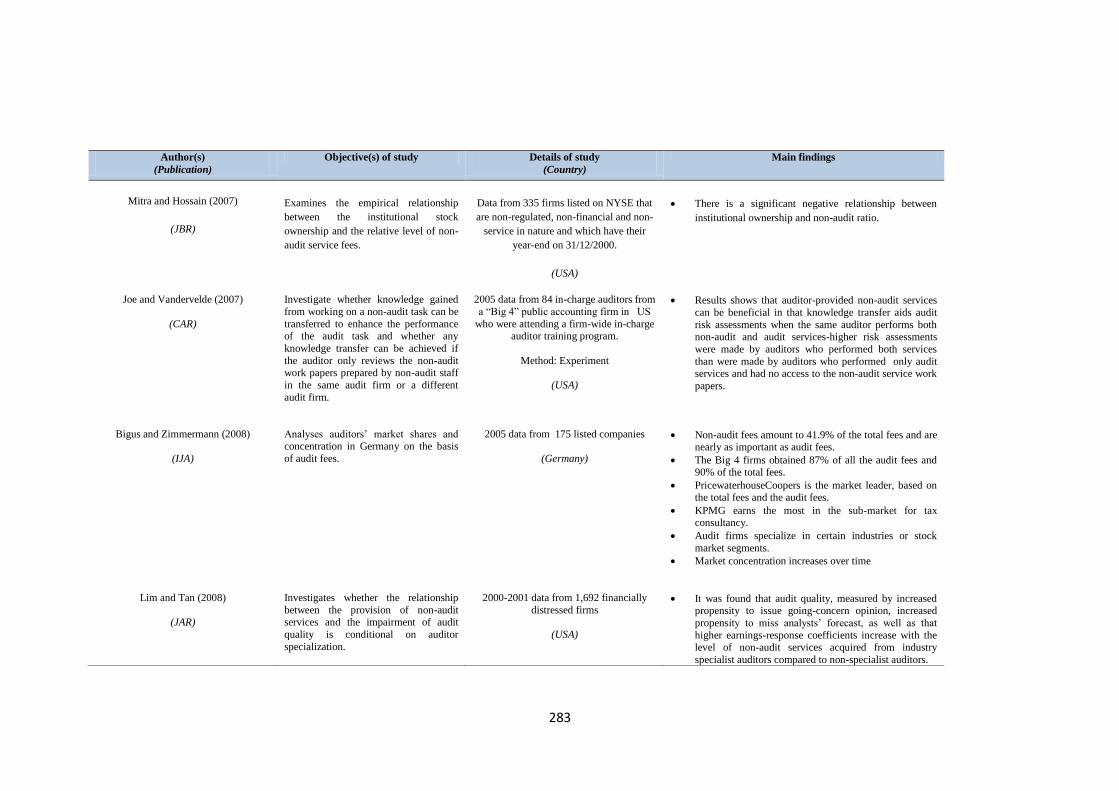
283
Author(s)
(Publication)
Objective(s) of study Details of study
(Country)
Main findings
Mitra and Hossain (2007)
(JBR)
Examines the empirical relationship
between the institutional stock
ownership and the relative level of non-
audit service fees.
Data from 335 firms listed on NYSE that
are non-regulated, non-financial and non-
service in nature and which have their
year-end on 31/12/2000.
(USA)
There is a significant negative relationship between
institutional ownership and non-audit ratio.
Joe and Vandervelde (2007)
(CAR)
Investigate whether knowledge gained
from working on a non-audit task can be
transferred to enhance the performance of the audit task and whether any
knowledge transfer can be achieved if
the auditor only reviews the non-audit work papers prepared by non-audit staff
in the same audit firm or a different
audit firm.
2005 data from 84 in-charge auditors from
a “Big 4” public accounting firm in US
who were attending a firm-wide in-charge auditor training program.
Method: Experiment
(USA)
Results shows that auditor-provided non-audit services
can be beneficial in that knowledge transfer aids audit
risk assessments when the same auditor performs both non-audit and audit services-higher risk assessments
were made by auditors who performed both services
than were made by auditors who performed only audit services and had no access to the non-audit service work
papers.
Bigus and Zimmermann (2008)
(IJA)
Analyses auditors’ market shares and concentration in Germany on the basis
of audit fees.
2005 data from 175 listed companies
(Germany)
Non-audit fees amount to 41.9% of the total fees and are nearly as important as audit fees.
The Big 4 firms obtained 87% of all the audit fees and 90% of the total fees.
PricewaterhouseCoopers is the market leader, based on the total fees and the audit fees.
KPMG earns the most in the sub-market for tax consultancy.
Audit firms specialize in certain industries or stock
market segments.
Market concentration increases over time
Lim and Tan (2008)
(JAR)
Investigates whether the relationship
between the provision of non-audit services and the impairment of audit
quality is conditional on auditor
specialization.
2000-2001 data from 1,692 financially
distressed firms
(USA)
It was found that audit quality, measured by increased propensity to issue going-concern opinion, increased
propensity to miss analysts’ forecast, as well as that
higher earnings-response coefficients increase with the level of non-audit services acquired from industry
specialist auditors compared to non-specialist auditors.

284
Author(s)
(Publication)
Objective(s) of study Details of study
(Country)
Main findings
Lee et al. (2009)
(IJA)
To examine whether audit report lags
decrease as auditor tenure increases and
to study whether the provision of non-audit services by external auditor
reduces report lags
2000-2005 data from
18,473 firms-years representing 15
industries
(USA)
Both audit tenure and non-audit services are negatively
significantly associated with ARLs.
Indicates that the longer the audit tenure, the more efficient auditors are in auditing their clients and the
more non-audit services they supply, meaning more learning, thus reducing audit delays.
Quick and Warming-Rasmussen (2009)
(IJA)
Investigate the influence of NAS on the perceived auditor independence.
2006 data from 98 survey responses from “Borsen-Team” an academic investment
club at Darmstadt University of
Technology
(Germany)
Shareholders generally perceive a negative effect on auditor’s independence if NAS are provided, especially
if NAS is provided by separate department of audit firm
Griffin et al. (2009)
( A&F)
Examines the association between
overseas and New Zealand governance
regulatory reforms and New Zealand companies’ audit and non-audit fees
Data from 653 company-year observations
for the period 2002-2007.
(New Zealand)
Found that audit fees increased in New Zealand over
2002–2006 and such increases associate reliably with the transition to and adoption of NZ IFRS and not with
earlier overseas governance reforms.
Also document a decrease in non-audit fees over the same period, but find no IFRS effect for non-audit fees.
Lu and Sapra (2009)
(AR)
Develop a theoretical framework to
investigate the determinants and
consequences of auditor Conservatism
in a capital market and implications of
Section 201 of SOX for auditor
conservatism and investment efficiency.
A theoretical paper: Model the interactions
between corporate decisions and investors’
decisions and assess how auditing
mediates these interactions.
By adjusting the mix of audit and non-audit fees,
companies with high business risk induce auditor
conservatism, while companies with low business risk
induce auditor aggressiveness.
The nature of investment inefficiency (over or under)
depends on its auditor attestation (conservative or
aggressive)
Mandatory restriction of non-audit services imposed by
section 201 increases audit conservatism, decreases a
conservative auditor’s audit quality and increases an
aggressive auditor’s audit quality, increases
overinvestment and decreases under-investments and
increases the audit fees.
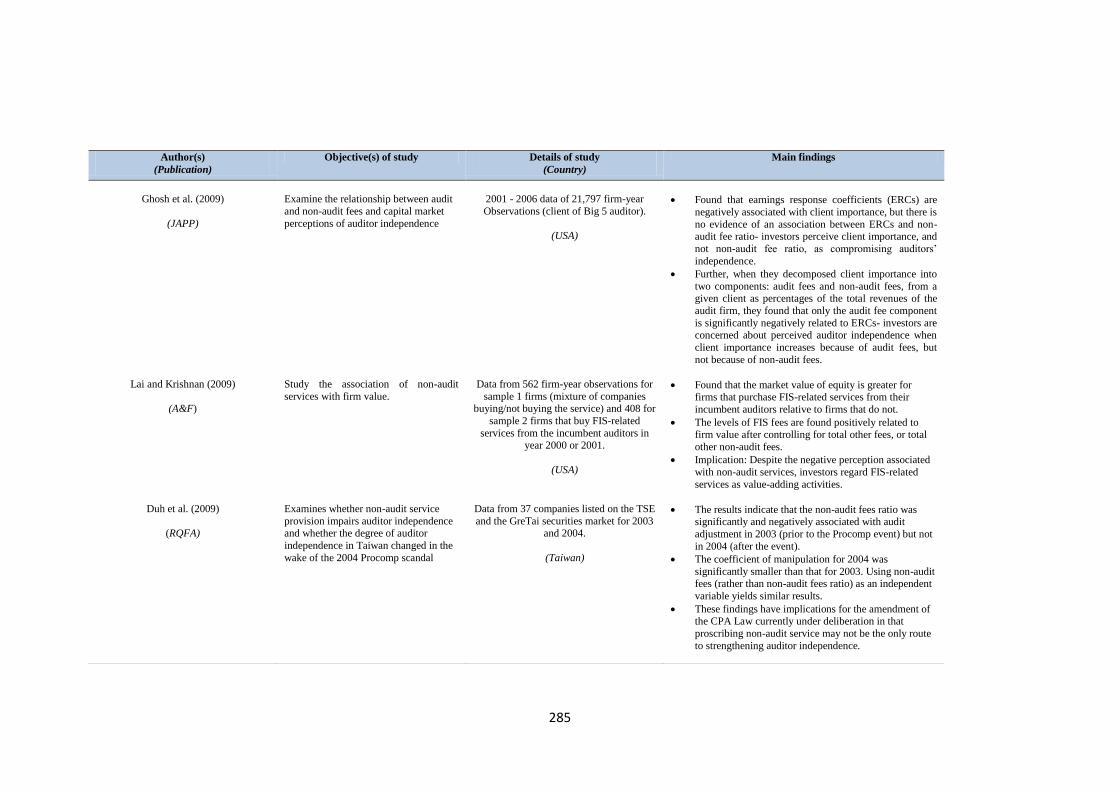
285
Author(s)
(Publication)
Objective(s) of study Details of study
(Country)
Main findings
Ghosh et al. (2009)
(JAPP)
Examine the relationship between audit
and non-audit fees and capital market
perceptions of auditor independence
2001 - 2006 data of 21,797 firm-year
Observations (client of Big 5 auditor).
(USA)
Found that earnings response coefficients (ERCs) are
negatively associated with client importance, but there is
no evidence of an association between ERCs and non-audit fee ratio- investors perceive client importance, and
not non-audit fee ratio, as compromising auditors’
independence.
Further, when they decomposed client importance into
two components: audit fees and non-audit fees, from a given client as percentages of the total revenues of the
audit firm, they found that only the audit fee component
is significantly negatively related to ERCs- investors are concerned about perceived auditor independence when
client importance increases because of audit fees, but
not because of non-audit fees.
Lai and Krishnan (2009)
(A&F)
Study the association of non-audit
services with firm value.
Data from 562 firm-year observations for
sample 1 firms (mixture of companies buying/not buying the service) and 408 for
sample 2 firms that buy FIS-related
services from the incumbent auditors in year 2000 or 2001.
(USA)
Found that the market value of equity is greater for firms that purchase FIS-related services from their
incumbent auditors relative to firms that do not.
The levels of FIS fees are found positively related to firm value after controlling for total other fees, or total
other non-audit fees.
Implication: Despite the negative perception associated
with non-audit services, investors regard FIS-related
services as value-adding activities.
Duh et al. (2009)
(RQFA)
Examines whether non-audit service
provision impairs auditor independence and whether the degree of auditor
independence in Taiwan changed in the
wake of the 2004 Procomp scandal
Data from 37 companies listed on the TSE
and the GreTai securities market for 2003 and 2004.
(Taiwan)
The results indicate that the non-audit fees ratio was significantly and negatively associated with audit
adjustment in 2003 (prior to the Procomp event) but not
in 2004 (after the event).
The coefficient of manipulation for 2004 was
significantly smaller than that for 2003. Using non-audit fees (rather than non-audit fees ratio) as an independent
variable yields similar results.
These findings have implications for the amendment of the CPA Law currently under deliberation in that
proscribing non-audit service may not be the only route
to strengthening auditor independence.
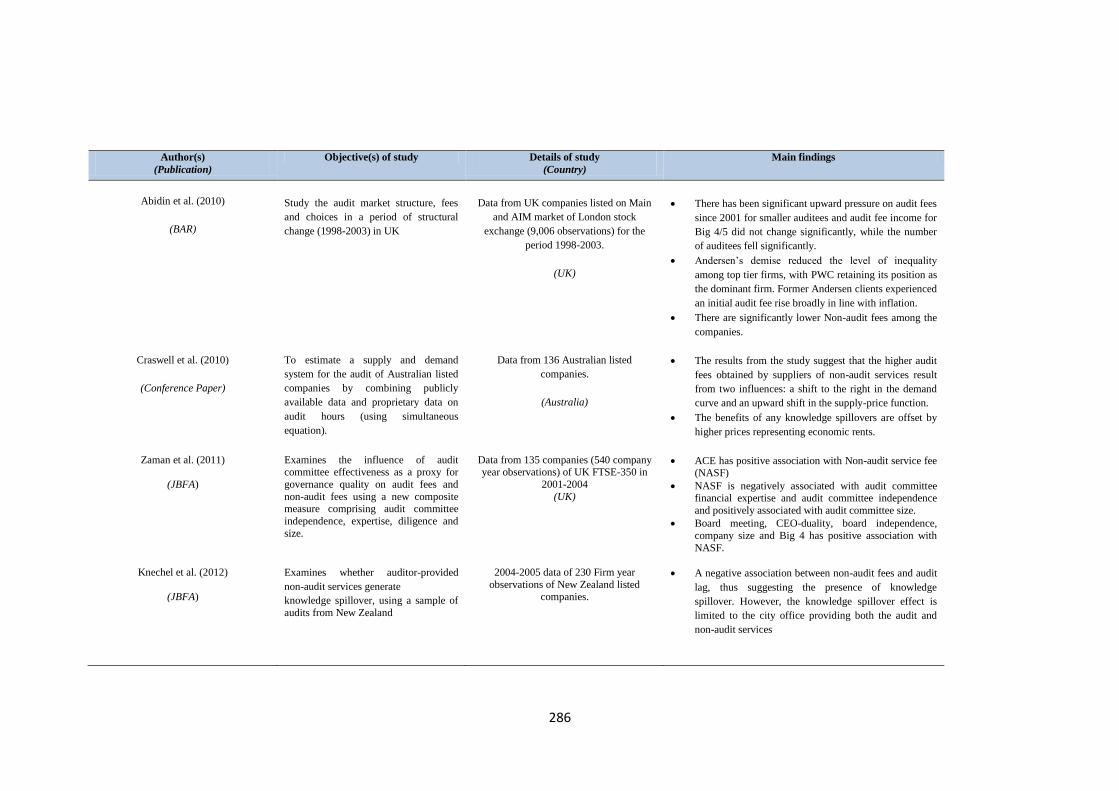
286
Author(s)
(Publication)
Objective(s) of study Details of study
(Country)
Main findings
Abidin et al. (2010)
(BAR)
Study the audit market structure, fees
and choices in a period of structural
change (1998-2003) in UK
Data from UK companies listed on Main
and AIM market of London stock
exchange (9,006 observations) for the
period 1998-2003.
(UK)
There has been significant upward pressure on audit fees
since 2001 for smaller auditees and audit fee income for
Big 4/5 did not change significantly, while the number
of auditees fell significantly.
Andersen’s demise reduced the level of inequality
among top tier firms, with PWC retaining its position as
the dominant firm. Former Andersen clients experienced
an initial audit fee rise broadly in line with inflation.
There are significantly lower Non-audit fees among the
companies.
Craswell et al. (2010)
(Conference Paper)
To estimate a supply and demand
system for the audit of Australian listed
companies by combining publicly
available data and proprietary data on
audit hours (using simultaneous
equation).
Data from 136 Australian listed
companies.
(Australia)
The results from the study suggest that the higher audit
fees obtained by suppliers of non-audit services result
from two influences: a shift to the right in the demand
curve and an upward shift in the supply-price function.
The benefits of any knowledge spillovers are offset by
higher prices representing economic rents.
Zaman et al. (2011)
(JBFA)
Examines the influence of audit committee effectiveness as a proxy for
governance quality on audit fees and
non-audit fees using a new composite measure comprising audit committee
independence, expertise, diligence and
size.
Data from 135 companies (540 company year observations) of UK FTSE-350 in
2001-2004
(UK)
ACE has positive association with Non-audit service fee (NASF)
NASF is negatively associated with audit committee financial expertise and audit committee independence
and positively associated with audit committee size.
Board meeting, CEO-duality, board independence,
company size and Big 4 has positive association with
NASF.
Knechel et al. (2012)
(JBFA)
Examines whether auditor-provided
non-audit services generate
knowledge spillover, using a sample of
audits from New Zealand
2004-2005 data of 230 Firm year
observations of New Zealand listed
companies.
A negative association between non-audit fees and audit
lag, thus suggesting the presence of knowledge
spillover. However, the knowledge spillover effect is
limited to the city office providing both the audit and
non-audit services

287
Author(s)
(Publication)
Objective(s) of study Details of study
(Country)
Main findings
Chan et al (2012)
(AF)
Examines whether independent audit
committee members’ board tenure
affects audit fees
1524 firm-year observations for the years
2005 and 2006.
(USA)
Find that audit fees are negatively associated
with the proportion of long board tenure directors on the
independent audit committee, consistent with the notion that audit committee members’ long board tenure
results in lower audit effort.
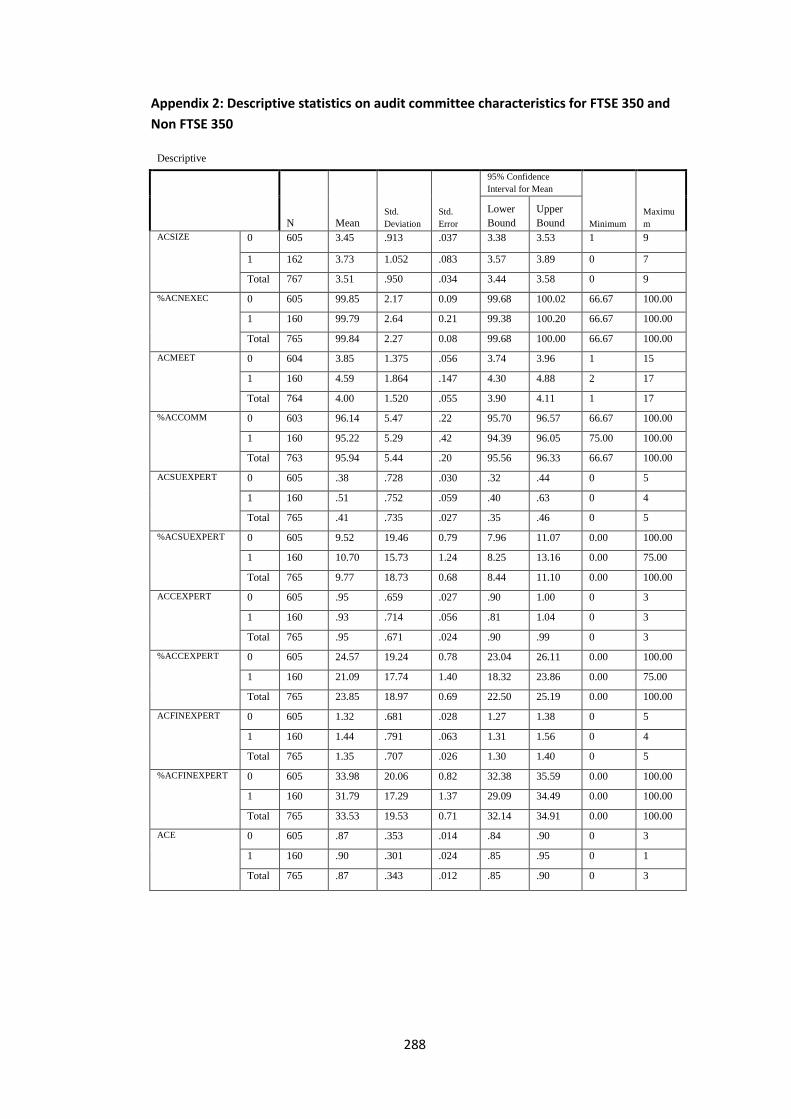
288
Appendix 2: Descriptive statistics on audit committee characteristics for FTSE 350 and
Non FTSE 350
Descriptive
N Mean Std.
Deviation
Std.
Error
95% Confidence
Interval for Mean
Minimum
Maximu
m
Lower
Bound
Upper
Bound
ACSIZE 0 605 3.45 .913 .037 3.38 3.53 1 9
1 162 3.73 1.052 .083 3.57 3.89 0 7
Total 767 3.51 .950 .034 3.44 3.58 0 9
%ACNEXEC 0 605 99.85 2.17 0.09 99.68 100.02 66.67 100.00
1 160 99.79 2.64 0.21 99.38 100.20 66.67 100.00
Total 765 99.84 2.27 0.08 99.68 100.00 66.67 100.00
ACMEET 0 604 3.85 1.375 .056 3.74 3.96 1 15
1 160 4.59 1.864 .147 4.30 4.88 2 17
Total 764 4.00 1.520 .055 3.90 4.11 1 17
%ACCOMM 0 603 96.14 5.47 .22 95.70 96.57 66.67 100.00
1 160 95.22 5.29 .42 94.39 96.05 75.00 100.00
Total 763 95.94 5.44 .20 95.56 96.33 66.67 100.00
ACSUEXPERT 0 605 .38 .728 .030 .32 .44 0 5
1 160 .51 .752 .059 .40 .63 0 4
Total 765 .41 .735 .027 .35 .46 0 5
%ACSUEXPERT 0 605 9.52 19.46 0.79 7.96 11.07 0.00 100.00
1 160 10.70 15.73 1.24 8.25 13.16 0.00 75.00
Total 765 9.77 18.73 0.68 8.44 11.10 0.00 100.00
ACCEXPERT 0 605 .95 .659 .027 .90 1.00 0 3
1 160 .93 .714 .056 .81 1.04 0 3
Total 765 .95 .671 .024 .90 .99 0 3
%ACCEXPERT 0 605 24.57 19.24 0.78 23.04 26.11 0.00 100.00
1 160 21.09 17.74 1.40 18.32 23.86 0.00 75.00
Total 765 23.85 18.97 0.69 22.50 25.19 0.00 100.00
ACFINEXPERT 0 605 1.32 .681 .028 1.27 1.38 0 5
1 160 1.44 .791 .063 1.31 1.56 0 4
Total 765 1.35 .707 .026 1.30 1.40 0 5
%ACFINEXPERT 0 605 33.98 20.06 0.82 32.38 35.59 0.00 100.00
1 160 31.79 17.29 1.37 29.09 34.49 0.00 100.00
Total 765 33.53 19.53 0.71 32.14 34.91 0.00 100.00
ACE 0 605 .87 .353 .014 .84 .90 0 3
1 160 .90 .301 .024 .85 .95 0 1
Total 765 .87 .343 .012 .85 .90 0 3

289
ANOVA
Sum of Squares df Mean Square F Sig.
ACSIZE Between
Groups
9.699 1 9.699 10.880 .001
Within Groups 681.957 765 .891
Total 691.656 766
ACSIZEDUM Between
Groups
.115 1 .115 1.694 .194
Within Groups 51.797 765 .068
Total 51.911 766
ACSIZEDUMMY Between
Groups
.003 1 .003 .126 .723
Within Groups 16.620 765 .022
Total 16.623 766
%ACNEXEC Between
Groups
.408 1 .408 .079 .779
Within Groups 3937.500 763 5.161
Total 3937.909 764
ACNEXECDUM Between
Groups
.007 1 .007 1.091 .297
Within Groups 4.960 764 .006
Total 4.967 765
ACMEET Between
Groups
70.408 1 70.408 31.698 .000
Within Groups 1692.581 762 2.221
Total 1762.988 763
ACMEETDUM Between
Groups
.025 1 .025 .338 .561
Within Groups 56.105 762 .074
Total 56.130 763
ACALLMEET Between
Groups
.005 1 .005 .006 .939
Within Groups 673.182 761 .885
Total 673.187 762
%ACCOMM Between
Groups
105.535 1 105.535 3.577 .059
Within Groups 22452.234 761 29.504
Total 22557.769 762
ACSUEXPERT Between
Groups
2.272 1 2.272 4.224 .040
Within Groups 410.296 763 .538
Total 412.567 764
%ACSUEXPERT Between
Groups
177.336 1 177.336 .505 .478
Within Groups 267966.982 763 351.202
Total 268144.317 764
ACCEXPERT Between
Groups
.082 1 .082 .181 .670
Within Groups 343.612 763 .450
Total 343.694 764
%ACCEXPERT Between
Groups
1536.485 1 1536.485 4.286 .039
Within Groups 273538.358 763 358.504
Total 275074.844 764
ACFINEXPERT Between
Groups
1.631 1 1.631 3.276 .071
Within Groups 379.877 763 .498
Total 381.508 764
%ACFINEXPERT Between
Groups
608.750 1 608.750 1.598 .207
Within Groups 290655.770 763 380.938
Total 291264.521 764
EXPERTDUM Between
Groups
.003 1 .003 .097 .756
Within Groups 26.044 763 .034
Total 26.047 764
ACE Between
Groups
.131 1 .131 1.117 .291
Within Groups 89.821 763 .118
Total 89.953 764
* 0= non FTSE 350 **1= FTSE 350

290
APPENDIX 3: Skewness and Kurtosis for variables used.
Skewness Std. Error of Skewness Kurtosis
Std. Error of Kurtosis
AUDITFEE 5.583 .088 37.736 .176
BOARDSIZE 1.018 .088 1.418 .176
%NEXEC -.133 .088 .080 .176
%INDNEXEC -.941 .088 .649 .176
%INDDIRS -.032 .088 .139 .176
DUALITY 6.131 .088 35.686 .176
BOARDMEET 1.851 .088 8.255 .176
ACE -1.778 .088 4.422 .176
ACSIZE 1.057 .088 3.177 .176
%ACNEXEC -18.875 .088 407.591 .176
ACMEET 2.466 .088 13.599 .177
%ACCOMM -1.341 .088 1.736 .177
%ACFINEXPERT 1.255 .088 2.031 .176
%ACSUEXPERT 2.606 .088 8.123 .176
%ACCEXPERT .774 .088 1.024 .176
NOBLOCKS .301 .089 -.245 .178
ABLOCKOWN .158 .089 -.391 .178
ANEXSHARES 5.479 .089 34.774 .177
AEXESHARES 3.836 .089 16.531 .177
LOSS050607 1.540 .088 .373 .176
TOTASSETS 9.980 .088 106.536 .176
LOGTOTASSETS 1.073 .088 1.669 .176
DEBTORS 2.160 .090 6.875 .179
STOCK 3.232 .088 13.339 .176
ROA 1.622 .088 16.409 .176
GEARING .772 .090 .447 .180
LIQUIDITY 20.063 .089 433.490 .177
BUSY -1.189 .088 -.587 .176
SUBS 4.276 .088 34.687 .177
UKSUBS 2.362 .088 7.436 .177
FTSE350 -.759 .088 -1.428 .176
REG 1.420 .088 .016 .176
FINANCIALS 1.604 .088 .576 .176
BIG4 -4.100 .088 14.850 .176
LONDON -.455 .088 -1.798 .176
DELAY 19.036 .089 459.373 .177
LEGIST 7.788 .088 76.948 .176
%LEGIST 1.810 .090 2.855 .179
TAX 5.906 .088 47.946 .176
%TAX .371 .090 -1.175 .179
CORPFIN 7.027 .088 63.258 .176
%CORPFIN 1.941 .090 2.513 .179
OTHERSERVICE 4.955 .088 28.913 .176
%OTHERSERVICE .897 .090 -.461 .179
TOTNONAUDIT 4.791 .088 29.864 .176
LOGTOTNONAUDIT -2.865 .088 10.365 .176
AUDITVSNON .905 .088 -1.185 .176
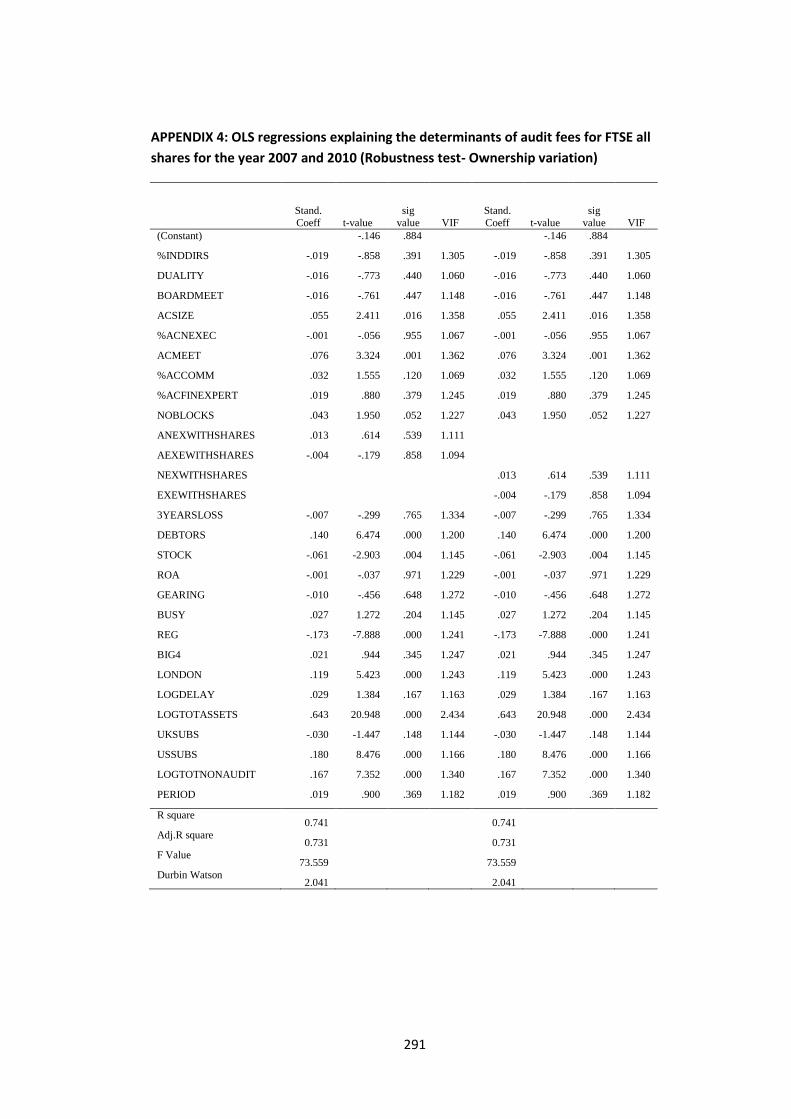
291
APPENDIX 4: OLS regressions explaining the determinants of audit fees for FTSE all
shares for the year 2007 and 2010 (Robustness test- Ownership variation)
Stand.
Coeff t-value
sig
value VIF
Stand.
Coeff t-value
sig
value VIF
(Constant) -.146 .884 -.146 .884
%INDDIRS -.019 -.858 .391 1.305 -.019 -.858 .391 1.305
DUALITY -.016 -.773 .440 1.060 -.016 -.773 .440 1.060
BOARDMEET -.016 -.761 .447 1.148 -.016 -.761 .447 1.148
ACSIZE .055 2.411 .016 1.358 .055 2.411 .016 1.358
%ACNEXEC -.001 -.056 .955 1.067 -.001 -.056 .955 1.067
ACMEET .076 3.324 .001 1.362 .076 3.324 .001 1.362
%ACCOMM .032 1.555 .120 1.069 .032 1.555 .120 1.069
%ACFINEXPERT .019 .880 .379 1.245 .019 .880 .379 1.245
NOBLOCKS .043 1.950 .052 1.227 .043 1.950 .052 1.227
ANEXWITHSHARES .013 .614 .539 1.111
AEXEWITHSHARES -.004 -.179 .858 1.094
NEXWITHSHARES .013 .614 .539 1.111
EXEWITHSHARES -.004 -.179 .858 1.094
3YEARSLOSS -.007 -.299 .765 1.334 -.007 -.299 .765 1.334
DEBTORS .140 6.474 .000 1.200 .140 6.474 .000 1.200
STOCK -.061 -2.903 .004 1.145 -.061 -2.903 .004 1.145
ROA -.001 -.037 .971 1.229 -.001 -.037 .971 1.229
GEARING -.010 -.456 .648 1.272 -.010 -.456 .648 1.272
BUSY .027 1.272 .204 1.145 .027 1.272 .204 1.145
REG -.173 -7.888 .000 1.241 -.173 -7.888 .000 1.241
BIG4 .021 .944 .345 1.247 .021 .944 .345 1.247
LONDON .119 5.423 .000 1.243 .119 5.423 .000 1.243
LOGDELAY .029 1.384 .167 1.163 .029 1.384 .167 1.163
LOGTOTASSETS .643 20.948 .000 2.434 .643 20.948 .000 2.434
UKSUBS -.030 -1.447 .148 1.144 -.030 -1.447 .148 1.144
USSUBS .180 8.476 .000 1.166 .180 8.476 .000 1.166
LOGTOTNONAUDIT .167 7.352 .000 1.340 .167 7.352 .000 1.340
PERIOD .019 .900 .369 1.182 .019 .900 .369 1.182
R square 0.741
0.741
Adj.R square 0.731
0.731
F Value 73.559
73.559
Durbin Watson 2.041 2.041

292
Appendix 5: Abbreviations Used in the Literature Summary
Abbreviation Journal
AAMJAF Asian Academy of Management Journal of Accounting And Finance
A&F Accounting & Finance
AFR Accounting and Finance Research
AA Advances in Accounting
ABR Accounting and Business Research
ABRv Accounting and Business Review
ABACUS A Journal of Business Finance and Accounting Studies
AIA Advances in International Accounting
AJPT Auditing: A Journal of Practice & Theory
AR The Accounting Review
ARA Asian Review of Accounting
ARJ Accounting Research Journal
BAR British Accounting Review
CAR Contemporary Accounting Research
CGIR Corporate Governance: An International Review
EAR European Accounting Review
FAM Financial Accountability & Management
FCS Finance Contrôle Stratégie
FE Financial Executive
GAJ Government Accountants Journal
HBR Harvard Business Review
ICFAI ICFAI Journal of Audit Practice
IJA International Journal of Accounting
IJAu International Journal of Auditing
IJCM International Journal of Commerce and Management
IJRM International Journal of Research in Marketing
JAAF Journal of Accounting, Auditing and Finance
JAE Journal of Accounting & Economics
JAPP Journal of Accounting and Public Policy
JAR Journal of Accounting Research
JAAR Journal of Applied Accounting Research
JBFA Journal of Business Finance & Accounting
JBR Journal of Business Research
JCAE Journal of Contemporary Accounting & Economics
JEMS Journal of Economics & Management Strategy
JIAAT Journal of International Accounting Auditing and Taxation
JIFMA Journal of International Financial Management & Accounting
JMG Journal of Management and Governance
293
JSM Journal of Strategic Marketing
MAJ Managerial Auditing Journal
MSE Management Science and Engineering
PAR Pacific Accounting Review
QJBE Quarterly Journal of Business and Economics
RAEE Research in Accounting in Emerging Economies
RAR Research in Accounting Regulation
RIGNA Research in Governmental and Nonprofit Accounting
RAF Review of Accounting and Finance
RQFA Review of Quantitative Finance and Accounting
SMJ Strategic Management Journal
TaiAR Taiwan Accounting Review