Forced auditor change, industry specialization and audit fees
27
Forced auditor change, industry specialization and audit fees Winifred D. Scott College of Business, Zayed University, Dubai, United Arab Emirates, and Willie E. Gist School of Accountancy, College of Business, Ohio University, Athens, Ohio, USA Abstract Purpose – The purpose of this study is to explore the effect of industry specialization on the absorption and competitive pricing (or lack thereof) of audits of large Andersen clients (S&P 1500 companies) who switched to the remaining Big 4 international accounting firms in 2002 due to the demise of Arthur Andersen LLP (Andersen). Did the audit clients pay a premium or discount in audit fees to their new auditor who specialized in their industry? Design/methodology/approach – Ordinary least squares regression is used to test hypothesis of a positive association between industry specialization and audit fees charged to former Andersen’s audit clients in 2002 following Andersen’s demise. This study provides more control over size effects by design. Test variables are constructed based on national market share of audit fees within an industry. Logistic regression is used to examine the likelihood of choosing new auditor that is an industry specialist. Findings – Results support hypothesis, consistent with auditor differentiation explanation. Proportion of clients that had engaged an industry specialist in 2001 increased from 38 percent (84 clients) to 48 percent (105 clients) in 2002. No evidence of price-gouging in 2002 although clients who aligned with industry specialist paid a 23.2 percent premium in audit fees. Large clients lost bargaining power to negotiate lower fees. Findings are robust to the inclusion of additional alternative measures of company size. Research limitations/implications – Results of logistic regression analysis imply that large audit clients with former auditor of tarnished reputation, long auditor tenure and high leverage are more likely to switch to an industry specialist to possibly signal audit/financial reporting quality. Large sample companies may limit the ability to generalize findings to smaller companies. Practical implications – Mandatory audit firm rotation (currently being debated in the profession) will have costly effect on the pricing of Big 4 audits for companies wanting to signal audit and financial reporting quality to affect market perception, and large companies would likely lose their ability to bargain for lower audit fees. Originality/value – The paper focus on the alignment of Andersen clients and impact on audit fees with Big 4 industry specialists resulting from the sudden increase in audit market concentration. Prior to Andersen’s collapse, evidence on the association of audit fees premium and industry specialists was mixed, and little attention has been given to the influence of auditor industry specialization on both audit fees and alignment of former Andersen clients with a Big 4 specialist. This paper fills that void. Keywords Andersen, Industry specialization, Auditor switching, Involuntary auditor change, Audit fees, Audit market concentration, Price-gouging, Bargaining power, Mandatory auditor rotation, Auditors, Auditing Paper type Research paper The current issue and full text archive of this journal is available at www.emeraldinsight.com/0268-6902.htm The authors are very thankful for the valuable and constructive comments of anonymous referees in significantly improving this manuscript. Data availability. Data are publicly available from the sources identified in the paper. Managerial Auditing Journal Vol. 28 No. 8, 2013 pp. 708-734 q Emerald Group Publishing Limited 0268-6902 DOI 10.1108/MAJ-11-2012-0779 MAJ 28,8 708
-
Upload
independent -
Category
Documents
-
view
1 -
download
0
Transcript of Forced auditor change, industry specialization and audit fees

Forced auditor change, industryspecialization and audit fees
Winifred D. ScottCollege of Business, Zayed University, Dubai, United Arab Emirates, and
Willie E. GistSchool of Accountancy, College of Business, Ohio University,
Athens, Ohio, USA
Abstract
Purpose – The purpose of this study is to explore the effect of industry specialization on theabsorption and competitive pricing (or lack thereof) of audits of large Andersen clients (S&P 1500companies) who switched to the remaining Big 4 international accounting firms in 2002 due to thedemise of Arthur Andersen LLP (Andersen). Did the audit clients pay a premium or discount in auditfees to their new auditor who specialized in their industry?
Design/methodology/approach – Ordinary least squares regression is used to test hypothesis of apositive association between industry specialization and audit fees charged to former Andersen’s auditclients in 2002 following Andersen’s demise. This study provides more control over size effects by design.Test variables are constructed based on national market share of audit fees within an industry. Logisticregression is used to examine the likelihood of choosing new auditor that is an industry specialist.
Findings – Results support hypothesis, consistent with auditor differentiation explanation.Proportion of clients that had engaged an industry specialist in 2001 increased from 38 percent(84 clients) to 48 percent (105 clients) in 2002. No evidence of price-gouging in 2002 although clientswho aligned with industry specialist paid a 23.2 percent premium in audit fees. Large clients lostbargaining power to negotiate lower fees. Findings are robust to the inclusion of additional alternativemeasures of company size.
Research limitations/implications – Results of logistic regression analysis imply that large auditclients with former auditor of tarnished reputation, long auditor tenure and high leverage are morelikely to switch to an industry specialist to possibly signal audit/financial reporting quality. Largesample companies may limit the ability to generalize findings to smaller companies.
Practical implications – Mandatory audit firm rotation (currently being debated in the profession)will have costly effect on the pricing of Big 4 audits for companies wanting to signal audit andfinancial reporting quality to affect market perception, and large companies would likely lose theirability to bargain for lower audit fees.
Originality/value – The paper focus on the alignment of Andersen clients and impact on audit feeswith Big 4 industry specialists resulting from the sudden increase in audit market concentration. Priorto Andersen’s collapse, evidence on the association of audit fees premium and industry specialists wasmixed, and little attention has been given to the influence of auditor industry specialization on bothaudit fees and alignment of former Andersen clients with a Big 4 specialist. This paper fills that void.
Keywords Andersen, Industry specialization, Auditor switching, Involuntary auditor change,Audit fees, Audit market concentration, Price-gouging, Bargaining power, Mandatory auditor rotation,Auditors, Auditing
Paper type Research paper
The current issue and full text archive of this journal is available at
www.emeraldinsight.com/0268-6902.htm
The authors are very thankful for the valuable and constructive comments of anonymousreferees in significantly improving this manuscript.
Data availability. Data are publicly available from the sources identified in the paper.
Managerial Auditing JournalVol. 28 No. 8, 2013pp. 708-734q Emerald Group Publishing Limited0268-6902DOI 10.1108/MAJ-11-2012-0779
MAJ28,8
708
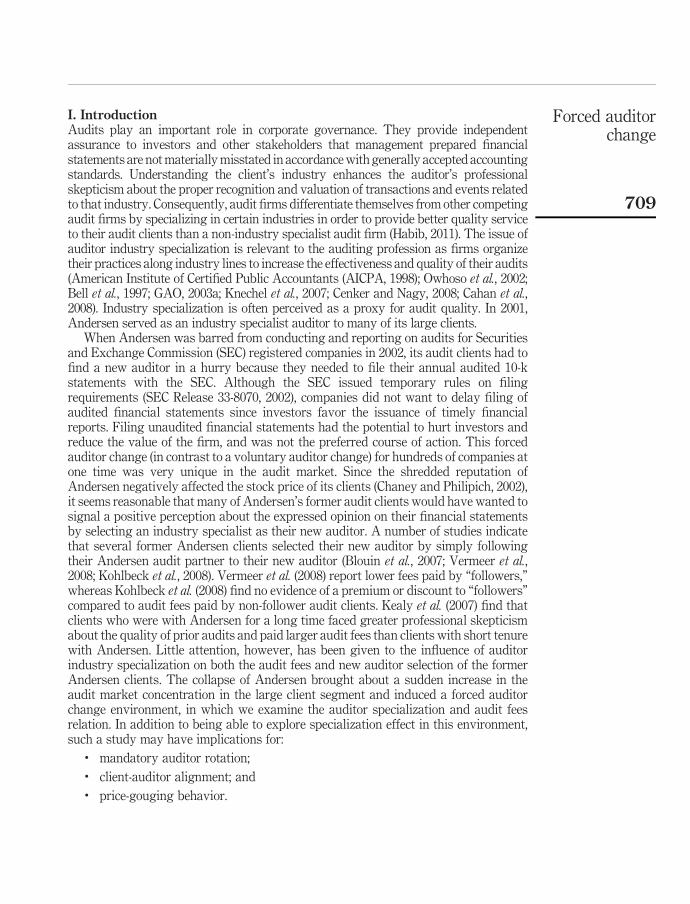
I. IntroductionAudits play an important role in corporate governance. They provide independentassurance to investors and other stakeholders that management prepared financialstatements are not materially misstated in accordance with generally accepted accountingstandards. Understanding the client’s industry enhances the auditor’s professionalskepticism about the proper recognition and valuation of transactions and events relatedto that industry. Consequently, audit firms differentiate themselves from other competingaudit firms by specializing in certain industries in order to provide better quality serviceto their audit clients than a non-industry specialist audit firm (Habib, 2011). The issue ofauditor industry specialization is relevant to the auditing profession as firms organizetheir practices along industry lines to increase the effectiveness and quality of their audits(American Institute of Certified Public Accountants (AICPA, 1998); Owhoso et al., 2002;Bell et al., 1997; GAO, 2003a; Knechel et al., 2007; Cenker and Nagy, 2008; Cahan et al.,2008). Industry specialization is often perceived as a proxy for audit quality. In 2001,Andersen served as an industry specialist auditor to many of its large clients.
When Andersen was barred from conducting and reporting on audits for Securitiesand Exchange Commission (SEC) registered companies in 2002, its audit clients had tofind a new auditor in a hurry because they needed to file their annual audited 10-kstatements with the SEC. Although the SEC issued temporary rules on filingrequirements (SEC Release 33-8070, 2002), companies did not want to delay filing ofaudited financial statements since investors favor the issuance of timely financialreports. Filing unaudited financial statements had the potential to hurt investors andreduce the value of the firm, and was not the preferred course of action. This forcedauditor change (in contrast to a voluntary auditor change) for hundreds of companies atone time was very unique in the audit market. Since the shredded reputation ofAndersen negatively affected the stock price of its clients (Chaney and Philipich, 2002),it seems reasonable that many of Andersen’s former audit clients would have wanted tosignal a positive perception about the expressed opinion on their financial statementsby selecting an industry specialist as their new auditor. A number of studies indicatethat several former Andersen clients selected their new auditor by simply followingtheir Andersen audit partner to their new auditor (Blouin et al., 2007; Vermeer et al.,2008; Kohlbeck et al., 2008). Vermeer et al. (2008) report lower fees paid by “followers,”whereas Kohlbeck et al. (2008) find no evidence of a premium or discount to “followers”compared to audit fees paid by non-follower audit clients. Kealy et al. (2007) find thatclients who were with Andersen for a long time faced greater professional skepticismabout the quality of prior audits and paid larger audit fees than clients with short tenurewith Andersen. Little attention, however, has been given to the influence of auditorindustry specialization on both the audit fees and new auditor selection of the formerAndersen clients. The collapse of Andersen brought about a sudden increase in theaudit market concentration in the large client segment and induced a forced auditorchange environment, in which we examine the auditor specialization and audit feesrelation. In addition to being able to explore specialization effect in this environment,such a study may have implications for:
. mandatory auditor rotation;
. client-auditor alignment; and
. price-gouging behavior.
Forced auditorchange
709
The purpose of this study is to explore the effects of industry specialization oncompetitive pricing (or lack thereof) of audits for large Andersen clients that switched tothe remaining Big 4 international accounting firms (hereafter, the Big 4) in 2002. Giventhe necessity of the involuntary switching of former Andersen clients, did the auditclients pay a premium or discount in audit fees to their new auditor who specialized intheir industry? Whether a fee premium or discount is associated with auditor industryspecialization has not been convincingly documented in the literature; the results aremixed (Mayhew and Wilkins, 2003; Casterella et al., 2004; Hay et al., 2006; Ghosh andLustgarten, 2006; Kohlbeck et al., 2008; Habib, 2011). This study contributes to ourunderstanding of the effect that industry specialization and involuntary auditorswitching had on the audit fees of hundreds of large audit clients who changed auditorat the same time for the same reason. We believe that given the tarnished reputation ofAndersen, the large former Andersen clients wanted to signal the quality of theirfinancial reporting, and would likely have done so by engaging a Big 4 industryspecialist. Furthermore, a more likely competitive response by a Big 4 network firm(discussed below) absorbing these clients would be to increase audit fees (rather thandiscount them) to better reflect the value of the audit (whether due to actual or perceivedhigher quality) and earn an appropriate return on the additional investment made bythe firm to differentiate its product as a specialist.
This study is restricted to the former Andersen clients who had been part of theS&P 1500 in 2001 and who chose one of the remaining Big 4 audit firms as their newauditor. We limit our study to the largest of Arthur Andersen’s former clients toprovide more control over size effects by design, and to reduce or eliminate possibleconfounding effects between any premiums resulting from industry specialization orfrom low bargaining power of the smaller audit clients. For example, Casterella et al.(2004) find that premiums for industry specialization arise when clients have lowbargaining power (in the case of smaller clients). Also, by focusing our study on largerclients we avoid the size effect issue reported by Francis et al. (2005) and Craswell et al.(1995) whereby the premiums for industry leadership in their samples are driven by theupper half of company size. We find that 48 percent of the 221 former Andersen clientsselected an industry specialist auditor in 2002. While 40 former Andersen audit clientslost the privilege of having an industry specialist auditor in 2002, 61 former Andersenclients (who did not have Andersen as their industry specialist in 2001) gained theadvantage of having an industry specialist auditor to express an opinion on thereliability and faithful representation of their 2002 financial statements to investorsand other stakeholders.
Given the size, resources, and national/international presence of the S&P 1500, thesecompanies are more likely concerned with the firm-wide and international reputation oftheir auditors as oppose to the auditors’ local-office reputation. A Big 4 network firmrefers to the organizational structures and operations of national and internationalaccounting firm networks that may produce positive synergies which benefit verylarge companies to a great degree (Carson, 2009). Therefore, we examine nationalindustry leadership as opposed to city-specific industry leadership. Francis et al. (2005)examine both national and city-specific industry expertise and find that they jointlyaffect audit fees. City-specific industry expertise may be an appropriate considerationfor the companies in their sample with average total assets of $1.9 billion, however, it isdifficult for us to argue that the average company of $11 billion total assets as in our
MAJ28,8
710

sample would fixate on local-office rather than national/international expertise of itsauditors from a Big 4 network firm.
Ordinary least squares (OLS) regression analysis is used to test the associationbetween the audit fees of Andersen’s former clients and auditor industry specialization.As hypothesized we find that the association between audit fees and auditor industryspecialization is positive and significant at 0.05 level or better, consistent with theFrancis et al. (2005) model that considers only national industry leaders. Our findingsupports the product differentiation explanation. OLS results indicate that the formerAndersen clients paid, on average, a fee premium of 23 percent to their new industryspecialist auditor. We also find that these very large companies did not have thebargaining power to negotiate lower fees, in contrast to Casterella et al. (2004). Sinceprior studies (Huang et al., 2007; Kohlbeck et al., 2008) indicate a potential large-clientsize effect on pricing audit services, additional tests are conducted to examine whetherthe results are driven by client size. We find the inferences of our results unchanged.Tests also did not indicate that price-gouging or low-balling were pervasive in thepricing of audits of Andersen’s former clients. Further, results of logistic regressionanalysis indicate that the likelihood of choosing a new industry specialist auditorincreased as the length of the client-auditor tenure with Andersen increased, consistentwith Kealy et al. (2007).
The remainder of the paper is organized into four sections. The next sectionprovides some background and the hypothesis development. Section III discusses themethodology and Section IV describes the sample selection. Results of the analyses arepresented in Section V and the conclusion, contribution, and implications are discussedin Section VI.
II. Background and hypothesis developmentAuditor switching and the pricing of audit servicesTheoretical models of audit pricing suggest that when a client voluntarily switchesauditors, the client should initially enjoy lower audit fees because non-incumbentauditors “low-ball” or discount the initial audit engagement to earn the right to futurequasi-rents of audit fees (DeAngelo, 1981; Beck et al., 1988). Prior to Andersen’s demise,empirical studies reported evidence of persistent initial price cutting (Simon andFrancis, 1988; Turpin, 1990; Yardley et al., 1992; Whisenant et al., 2003).
Voluntary auditor switching, in general, focuses on matters such as pressuringincumbent auditors to issue clean audit opinions, brand name reputation, industryspecialization, market power, and low-balling/price-gouging (DeAngelo, 1981; Chowand Rice, 1982; Palmrose, 1986a, b; Ettredge and Greenberg, 1990; Yardley et al., 1992;Craswell et al., 1995; Deis and Giroux, 1996; AICPA, 1998; Owhoso et al., 2002;Balsam et al., 2003; Krishnan, 2003; Knechel et al., 2007; Kohlbeck et al., 2008). AfterAndersen’s demise, the Herfindahl-Hirschman Index for audit firms increased to 2,566,well above the score of 1,800 that indicates audit firms have the potential to exercisemarket power (Eisenberg and Macey, 2003)[1]. In this unique setting regulators wereconcerned about excessive pricing for the hundreds of involuntary auditor switchingcompanies.
Some studies indicate that several former Andersen audit clients chose to followtheir Andersen audit partner to the new auditor. For example, Blouin et al. (2007) findthat slightly more than half of their sample, 226 out of 407, followed their Andersen
Forced auditorchange
711
audit partner to the new auditor. In their follow/non-follow logistic regression model,they find that audit clients with greater switching costs as well as industries with themost number of clients in a single industry (CLIENT variable) were more likely tofollow Andersen’s audit team. However, their CLIENT variable may also be capturinga lack of competition and less of an indicator of switching costs. While Vermeer et al.(2008) find that half their sample of 575 former Andersen clients who followed theAndersen audit partner/team to the new auditor paid lower audit fees, Kohlbeck et al.(2008) in contrast find that former Andersen clients who were early switchers andthose who followed the audit team did not experience fee discounts or premiums.
Other studies indicate that the larger audit clients of Andersen were more likely tobe early switchers (Kohlbeck et al., 2008; Barton, 2005; Chen and Zhou, 2007). Forexample, Chen and Zhou (2007) find that companies with larger audit committees withgreater financial expertise and companies with larger boards were more likely todismiss Andersen sooner and choose a Big 4 successor auditor.
In addition, some studies indicate that the perceived riskiness of former Andersenaudit clients influence audit pricing. One measure of client risk of former Andersenclients is client-auditor tenure. The longer that a company was a client of Andersen, thegreater the skepticism about the quality of prior audits and greater the risk that priorfinancial statements of former Andersen clients were not audited independently.Regulatory limits on client-auditor tenure have not been set by the SEC or PCAOB,however, a GAO (2003b) report finds that the average client-auditor tenure ofFortune-1000 companies is 22 years. In our usable sample of large Andersen clients(S&P 1500 companies), the average client-auditor tenure at the time of Andersen’sdemise is 15.75 years with 37 percent of sample companies having 17 years or moretenure with Andersen. Kealy et al. (2007) find a positive and significant associationbetween audit firm tenure and audit fees paid to the successor auditors by formerAndersen clients. They interpret the results as supporting the perception that longclient-auditor tenure is a factor that increases the risk of a new client. On the otherhand, some view short auditor-tenure as risky. For example, Landsman et al. (2009) usean multinomial logistic auditor switch model (involving lateral, upward, anddownward moves to/from the Big N auditors) to examine whether company-specificrisk factors and client misalignment are differentially associated with Big N auditorswitch decisions in the pre-Enron period (1993-2001) and post-Enron period(2002-2005). In their study, short tenure is viewed as a risk proxy that increases thelikelihood of audit failure. Although their evidence is consistent with the Big 4becoming more sensitive to client risk in the post-Enron period, their post-Enronsample excludes former Andersen clients from the analysis. Our study controls for theeffect that client-auditor tenure has on the pricing of audit services.
Attention to the influence of auditor industry specialists on both the involuntaryauditor switches by former Andersen clients and audit fees is generally lacking. Thisstudy fills that void. Although Blouin et al. (2007) include an industry specialist variablein their follow/non-follow model, the association between auditor industry specialistand audit fees was not examined. Huang et al. (2007) examine the association betweenindustry specialist, client bargaining power, and audit fees, however, they excludedformer Andersen audit clients from their sample. Huang et al. (2007) fail to find audit feepremiums charged to small and large audit clients in 2003, but in 2004 evidenceindicates that the smaller audit clients paid an industry specialist fee premium.
MAJ28,8
712
Several (Kohlbeck et al., 2008; Huang et al., 2007) of the studies discussed aboveindicate a potential size effect on pricing audit services. In this study, the analysisfocuses on very large Andersen clients providing more control over a potential sizeeffect in our research design. The audit market for the S&P 1500 public corporations isheavily concentrated because the Big 4/Big 5 firms audit approximately 98 percent ofthese companies (GAO, 2008). This study includes only those Andersen clients whoswitched to the remaining Big 4 firms, hence, brand name reputation is not adifferentiating factor.
Industry specialization and the pricing of audit servicesAuditor industry specialists are perceived to offer a higher level of audit effectivenessand quality relative to non-industry specialists (Bell et al., 1997; AICPA, 1998;Owhoso et al., 2002; Balsam et al., 2003; Krishnan, 2003; Carcello and Nagy, 2004;Knechel et al., 2007). According to a GAO (2003a) survey, 81 percent of the respondentscited industry specialization or expertise as an important factor in choosing a newauditor. Habib (2011) states that it is costly to develop specialization in an industrybecause a significant amount of resources are required by the audit firm. But oncedeveloped, a specialist’s knowledge of an industry and its accounting will increase theauditors ability to detect and curb earnings management and minimize intentionalerrors (Balsam et al., 2003). Auditor expertise in an industry is an important factor inreducing litigation risk, and improving auditor retention and audit quality (Cenker andNagy, 2008). Knechel et al. (2007) find that firms who switch from (to) a nonspecialistBig 4 auditor to (from) a specialist Big 4 auditor experience positive (negative)abnormal stock returns during 2000-2003, however, their sample excludes auditorchanges that involve former Andersen clients. Their results indicate that industryspecialization matters to investors. Hence, it seems reasonable to assume that formerAndersen audit clients may have wanted to contract with a Big 4 industry specialist tosignal a positive perception about financial reporting and audit quality.
The effect of industry specialization on audit fees is still an open question. Theassociation of audit fees and industry specialization can have three outcomes – positive,negative, or no association. A positive association indicates a fee premium. A feepremium from industry specialization would be consistent with auditor differentiationthrough the acquisition of industry specialized knowledge and with seeking to recouphigher audit production costs (Palmrose, 1986a). Craswell et al. (1995) failed to findconsistent support for the presence of an industry specialist audit fee premium in thepost merger years of 1990, 1992, and 1994. A significant and negative relationshipbetween industry specialization and audit fees indicates a fee discount (Casterella et al.,2004). A fee discount from auditor industry specialization would be consistent withauditor production efficiency or production economies where auditors pass on their costsavings to clients. An insignificant relationship between audit fees and auditor industryspecialization could mean industry specialization has no effect on audit fees. Thisneutral position could also mean the presence of both differentiation and productioneconomies offsetting each other. Furthermore, studies show that the effect of industryspecialization on audit fees is not only mixed, but varies with firm size (Habib, 2011).
The present study explores the effect of industry specialization at the national levelon audit fees from 2001 to 2002 and involuntary auditor change by former Andersenlarge audit clients. Prior studies suggest that the effects of the forced auditor change
Forced auditorchange
713

may vary between the smaller and larger companies (Kohlbeck et al., 2008; Huang et al.,2007) or according to whether the firm is a national or city-specific leader (Francis et al.,2005). The effect of industry specialization on audit fees related to city-specific industryleaders is not examined. Given the size, resources, and national/international presenceof our sample clients, they would more likely be looking for national level expertise asopposed to local-office expertise. National and international accounting firm networksmay produce positive synergies that benefit very large companies. As stated byReichelt and Wang (2010):
[. . .] at the firm-wide (national) level, positive synergies arise when accounting firms captureindustry expertise through knowledge-sharing practices, such as internal benchmarking ofbest practices, the use of standardized industry-tailored audit programs, and extending thereach of professionals from their primary local-office clientele to other clients through traveland internal consultative practices.
Thus, while industry knowledge of individual auditors in local offices may play a rolein helping to establish the national reputation of accounting firms, it would be difficultto argue that very large companies (average total assets of $11 billion) with nationaland international operations fixate on local expertise rather than national/internationalexpertise of their auditors[2]. City-specific industry expertise was more likely anappropriate consideration for smaller audit clients, such as those in the Francis et al.sample with an average total assets of $1.9 billion, than for the clients in our sample.
Further, the Big 4 accounting firms are identified as global audit firm networks(Carson, 2009) which create industry specialist groupings to share knowledge, staff,and resources with the intention of improving audit quality. Carson (2009) argues thatthe industry specialist teams of these large audit firms are supported by knowledgemanagement databases and common industry-specific work programs and training;and that given the significant investments in audit technology, global audit firmnetworks are efficient mechanisms for developing, retaining, and transferring codifiedknowledge. These networks have been developed in part because large companies,especially multinational operations, demand consistent auditing throughout the world.
Many studies on the determinants of audit fees have shown that audit fees arehigher for larger companies, but very large audit clients may be of economicimportance to the audit firm and may have bargaining power to attain lower audit fees(Casterella et al., 2004). By limiting our study to the largest of Arthur Andersen formerclients we reduce or eliminate possible confounding effects between any premiums thatresult from industry specialization or that may arise from low bargaining power ofsmaller audit clients. Casterella et al. (2004) find that premiums for industryspecialization arise when clients have low bargaining power (in the case of smallerclients). Companies in our sample may not have bargaining power to attain lower auditfees due to the forced change resulting from the demise of their former auditor.Therefore, a secondary issue in testing the auditor specialization effect is to control andtest for the bargaining power of former Andersen large clients.
The unique event of involuntary auditor switching by hundreds of firms,simultaneously, presents an opportunity to draw implications on competitive pricing(or lack thereof), price-gouging, auditor alignment and mandatory auditor rotation.While prior research has been mixed with respect to the effect of auditor specializationon audit fees, we believe (like Carson, 2009) that a more competitive response by anetwork firm to a client seeking a specialist to signal its financial reporting quality,
MAJ28,8
714

especially given the tarnished reputation of its former auditor, is to increase the auditfees to better reflect the value of the audit (whether due to actual or perceived higherquality) and achieve an appropriate return on the additional capital invested by thefirm to differentiate its product. Thus, our hypothesis (in the alternative form) is:
H1. There is a positive association between national industry specialization andaudit fees charged to former Andersen’s largest clients, ceteris paribus.
This is a one-tailed test. A positive and significant coefficient will indicate that theformer Andersen clients incurred a fee premium for having a national industryspecialist to audit their financial statements, possibly to signal the quality of theirfinancial reporting.
III. MethodologyTo test our hypothesis we construct the national market share specialist variable,SPECMS, based on prior studies[3]. By accounting firm, industries of specializationbefore and after Andersen’s demise are identified based on the national market share ofaudit fees of the S&P 1500 companies. Industry membership of our sample isdetermined by SIC codes similar to those of Frankel et al. (2002) and Whisenant et al.(2003)[4]. The national market share of audit fees per year for each accounting firm,SPECMS_c, is used to identify the auditor industry specialists for that year.SPECMS_c is calculated as the sum of audit fees of all companies audited by anaccounting firm in a given industry divided by the sum of all audit fees across all firmswithin the same industry, similar to Casterella et al. (2004). Prior studies determiningauditor industry specialization used sales revenues and total assets as proxies for auditfees (Palmrose, 1986a; Mayhew and Wilkins, 2003; Balsam et al., 2003; Neal and Riley,2004) since actual audit fee data was not readily available publicly. Francis et al. (2005)is the first study of industry specialist pricing in the USA to use newly mandated auditfees disclosures beginning with 2000 fiscal-year data. While we also use mandatoryaudit fees disclosures to determine specialization, it is worth noting that Francis et al.investigate Big 5 industry expertise prior to the demise of Andersen, whereas ourstudy focuses on the alignment of former Andersen clients with a Big 4 industryspecialist after Andersen’s demise.
In our analysis we use two measures of specialization:
(1) the calculated percentage of audit fees in an industry is our continuous measure(SPECMS_c); and
(2) SPECMS is our dichotomous measure based on an audit fee market sharespecialist minimum threshold.
Based upon the methodology used by Palmrose (1986a), an audit fee market sharespecialist minimum threshold is 24 percent in 2001 among the Big 5, and 30 percent in2002 among the remaining Big 4[5]. If the audit fee market share for a firm is equal to orgreater than the minimum threshold then SPECMS equals 1, otherwise 0.
To test the hypothesis, OLS regression analysis is used to examine the associationbetween industry specialization and audit fees. The natural log of audit fees (LnAF) isregressed on a set of variables that control for auditee size, profitability, complexity,risk, client bargaining power and industry membership similar to those used in priorstudies. The audit fees OLS model is specified as follows:
Forced auditorchange
715

LnAF ¼ b0 þ b1LnTA þ b2LOSS þ b3ROA þ b4AR þ b5NewFIN þ b6TENUREþ b7LEV þ b8INV þ b9MERGER þ b10EXDisc þ b11FOREIGNþ b12SpecItems þ b13AAfee þ b14POWER þ b15REGþ b16SPECMS ðor SPECMS_cÞ þ 1
Variable definitions:
LnAF Natural log of audit fees, the dependent variable.
LnTA Natural log of total assets.
LOSS Indicator variable equals 1 if the client reported a net loss for the year,and 0 otherwise.
ROA Return on assets, measured as net income divided by total assets.
AR Accounts receivable divided by total assets.
NewFIN Indicator variable equals 1 for clients that issued new equity greaterthan $10 million and long-term debt greater than $1 million, and 0otherwise.
TENURE The number of years Andersen audited the company.
LEV Leverage, measured as long-term debt divided by total assets.
INV Inventory divided by total assets.
MERGER Indicator variable equals 1 if the client engaged in merger activity, and0 otherwise.
EXDisc Indicator variable equals 1 if the client reported extraordinary items ordiscontinued operations during the period, and 0 otherwise.
Foreign Indicator variable equals 1 for foreign operations if the client reportedforeign currency adjustments, and 0 otherwise.
SpecItems Indicator variable equals 1 if the client recognized special items, and 0otherwise. Special items are unusual in nature or infrequent inoccurrence, but not both.
AAfee Indicator variable equals 1 if audit client paid fees to Anderson foraudit work performed on 2002 financial statements prior to beingbarred, and 0 otherwise.
POWER Natural log of company audit fees divided by the sum of industryaudit fees for all companies in the industry audited by the company’sauditor.
REG Indicator variable equals 1 if client is a member of the financialservices industry or utilities industry, and 0 otherwise.
SPECMS Industry specialist indicator variable measured based on nationalmarket share of audit fees; equals 1 if minimum threshold forspecialist is met, and 0 otherwise.
MAJ28,8
716

SPECMS_c Industry specialist continuous variable measured based on nationalmarket share of audit fees.
1 Error term.
Control variables expected to influence the level of audit fees (LnAF) are included in themodel for proper specification and to avoid an omitted variable problem. In theliterature, total assets have been found to explain much of the variability in audit fees(Gist, 1994; Palmrose, 1986a; Simunic, 1980). The proxy for auditee size (LnTA) isexpected to be positively associated with LnAF. A profitable company is considered tohave less business risk and is not expected to be charged an audit risk premium.Therefore, the reporting of a net loss (LOSS) or a negative return on assets (ROA)suggests increased business risk and is expected to have a positive coefficientreflecting an increasing effect on LnAF. Other factors that increase risk such as AR,INV, and LEV are expected to be positively associated with LnAF. Prior studies tendnot to associate long audit tenure with low audit quality (Nagy, 2005), yet the uniqueenvironment of forced auditor change from an auditor who was barred fromconducting and reporting on audits may lead to the perception of longer tenure posinggreater risk to the new auditor (Kealy et al., 2007). A positive coefficient for TENURE isconsistent with increased skepticism by the new auditor. Obtaining new financing maylower audit risk because of the additional scrutiny of management by creditors thatoccurs during the loan process. A negative coefficient for NewFIN is expected. Factorsthat increase audit complexity such as SpecItems, EXDisc, Foreign, and MERGER areexpected to be positively associated with LnAF. A variable (AAfee) to control for feespaid to Andersen for audit work completed in 2002 prior to its dismissal is included inthe model. AAfee may have a decreasing effect on year 2002 audit fees if it decreasesthe amount of audit effort by the new auditor.
POWER is a continuous variable intended to capture the importance of a singleclient company in an industry to its auditor. Casterella et al. (2004) argues that thelarger the audit client the greater is its economic importance to the auditor, which leadsto greater bargaining power of the audit client to attain lower audit fees. A negativecoefficient for POWER represents the ability of large audit clients to negotiate and usetheir bargaining power to obtain lower fees. On the other hand, one can question howmuch bargaining power Andersen clients really had to negotiate lower audit fees. Sinceformer Andersen clients were operating in a different environment of mandatoryauditor change where hundreds of clients needed to find a new auditor quickly toreplace Andersen, this may have reduced clients’ bargaining power. Nevertheless,controlling and testing bargaining power of former Andersen clients will help to isolateits effect from that of the auditor industry specialization variable. A positive coefficientfor POWER may indicate large audit clients’ inability to negotiate and use theirbargaining power to obtain lower fees. A positive coefficient for POWER could alsorepresent a size effect for very large audit clients.
Simunic (1980) and Palmrose (1986a) reports significantly lower audit fees in theregulated industries of financials and utilities. We therefore use indicator variables tomeasure and control the effects of regulated financial services and utilities industries(REG) in our model. Many studies (Simunic, 1980; Palmrose, 1986a; Davidson and Gist,1996; Carson, 2009) in the literature have captured and controlled the effects ofregulated industries on audit fees or audit effort using dummy variables.
Forced auditorchange
717
A separate regression model is run using each measure of auditor industryspecialist market share. A positive coefficient would indicate an increase in audit feesconsistent with audit quality differentiation. In contrast, a negative coefficient wouldindicate a decrease in audit fees consistent with auditor production efficiency where theaudit firm passes cost savings on to the audit client.
IV. Data collectionAuditor identification and company characteristics of the S&P 1500 were collectedfrom the University of Pennsylvania’s Wharton Research Database (WRDS). Of theS&P 1500 companies, 1,406 public companies audited by the Big 5 internationalaccounting firms in 2001 were identified. To control for audit quality (or brand name)only audits by the Big 5 (Big 4) firms were considered in this study (Palmrose, 1988).We excluded 25 Andersen client companies from the sample that switched to a non-Big5 auditor in 2002 for a total of 1,381 companies. Of the 1,381 companies, 269 (20 percent)were audited by Andersen. To be included in the analysis, a former Andersen auditclient had to have auditor fees publicly available for both 2001 and 2002; 48 clients didnot have both years of audit fees data (most often due to mergers or bankruptcyfilings). Thus, the final sample consists of 221 former Andersen audit clients who wereabsorbed by the remaining Big 4 firms in 2002. Prior to the felony conviction, Andersenwas still performing services for its audit clients. Hand collected data was obtainedfrom the proxy statements on audit fees received by Andersen for audit workperformed on the 2002 financial statements (AAfee) prior to being barred fromconducting and reporting on audits for SEC-registered companies. Under the SEC’s(2001) proxy disclosure rule S7-13-00, registrants are required to disclose audit fees forthe most recent fiscal year.
V. Analyses and resultsDescriptive statisticsTable I shows descriptive data on the distribution of the S&P 1500 in 2001 and 2002among the international accounting firms before and after the demise of Andersen.Panel A indicates that PricewaterhouseCoopers (PWC) enjoyed the largest share of theS&P 1500 audit market with 362 audits or 26.2 percent of the market. Ernst & Young(E&Y) was second with 335 audits or 24.3 percent. Andersen followed E&Y in thirdplace with 269 or 19.5 percent of the market. KPMG had the lowest share with 195audits or 14.1 percent. There are no statistically significant differences in the mean andmedian total assets, sales, and net income of clients among auditors.
Panel B of Table I presents descriptive data of the Big 4 after the collapse ofAndersen. While PWC had the most S&P 1500 audit clients in 2001, PWC lost that leadby a very slight margin to E&Y in 2002. Both E&Y and PWC have 30 percent of themarket. KPMG maintained the lowest share of audit clients (18 percent) among theS&P 1500. Analysis of variance and median tests indicate that clients’ average andmedian total assets, sales, and net income do not differ significantly among the Big 4after Andersen’s demise.
Panel C of Table I shows the distribution of the 221 former Andersen audit clientsacross the remaining Big 4 accounting firms in 2002. Deloitte & Touche (D&T) gainedthe most former Andersen audit clients (65 clients or 29.4 percent), and PWC gained thefewest (40 clients or 18.1 percent). PWC gained significantly fewer Andersen clients than
MAJ28,8
718
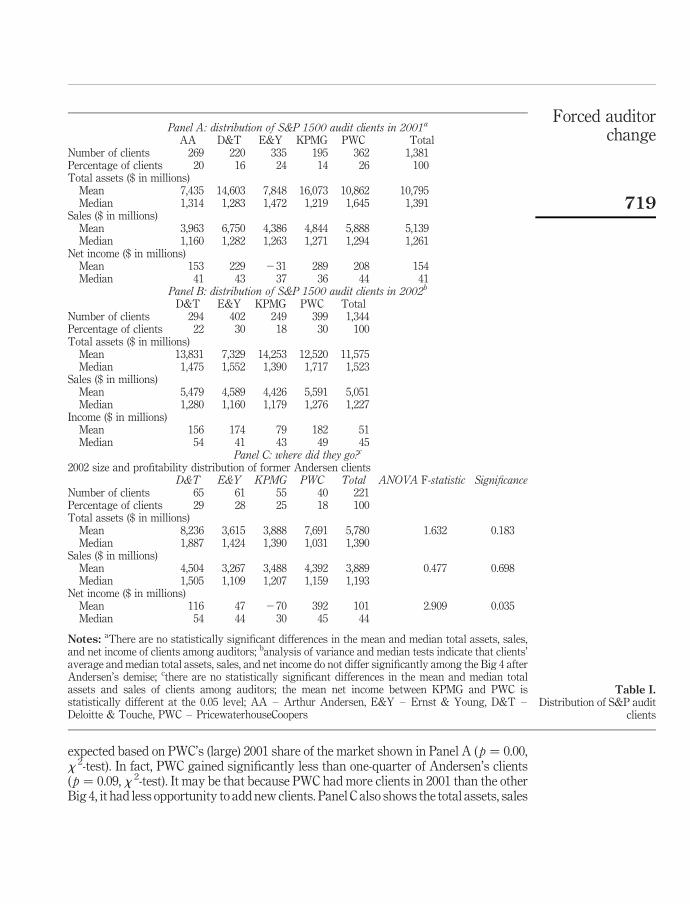
expected based on PWC’s (large) 2001 share of the market shown in Panel A ( p ¼ 0.00,x 2-test). In fact, PWC gained significantly less than one-quarter of Andersen’s clients( p ¼ 0.09, x 2-test). It may be that because PWC had more clients in 2001 than the otherBig 4, it had less opportunity to add new clients. Panel C also shows the total assets, sales
Panel A: distribution of S&P 1500 audit clients in 2001a
AA D&T E&Y KPMG PWC TotalNumber of clients 269 220 335 195 362 1,381Percentage of clients 20 16 24 14 26 100Total assets ($ in millions)
Mean 7,435 14,603 7,848 16,073 10,862 10,795Median 1,314 1,283 1,472 1,219 1,645 1,391
Sales ($ in millions)Mean 3,963 6,750 4,386 4,844 5,888 5,139Median 1,160 1,282 1,263 1,271 1,294 1,261
Net income ($ in millions)Mean 153 229 231 289 208 154Median 41 43 37 36 44 41
Panel B: distribution of S&P 1500 audit clients in 2002b
D&T E&Y KPMG PWC TotalNumber of clients 294 402 249 399 1,344Percentage of clients 22 30 18 30 100Total assets ($ in millions)
Mean 13,831 7,329 14,253 12,520 11,575Median 1,475 1,552 1,390 1,717 1,523
Sales ($ in millions)Mean 5,479 4,589 4,426 5,591 5,051Median 1,280 1,160 1,179 1,276 1,227
Income ($ in millions)Mean 156 174 79 182 51Median 54 41 43 49 45
Panel C: where did they go?c
2002 size and profitability distribution of former Andersen clientsD&T E&Y KPMG PWC Total ANOVA F-statistic Significance
Number of clients 65 61 55 40 221Percentage of clients 29 28 25 18 100Total assets ($ in millions)
Mean 8,236 3,615 3,888 7,691 5,780 1.632 0.183Median 1,887 1,424 1,390 1,031 1,390
Sales ($ in millions)Mean 4,504 3,267 3,488 4,392 3,889 0.477 0.698Median 1,505 1,109 1,207 1,159 1,193
Net income ($ in millions)Mean 116 47 270 392 101 2.909 0.035Median 54 44 30 45 44
Notes: aThere are no statistically significant differences in the mean and median total assets, sales,and net income of clients among auditors; banalysis of variance and median tests indicate that clients’average and median total assets, sales, and net income do not differ significantly among the Big 4 afterAndersen’s demise; cthere are no statistically significant differences in the mean and median totalassets and sales of clients among auditors; the mean net income between KPMG and PWC isstatistically different at the 0.05 level; AA – Arthur Andersen, E&Y – Ernst & Young, D&T –Deloitte & Touche, PWC – PricewaterhouseCoopers
Table I.Distribution of S&P audit
clients
Forced auditorchange
719
and net income of former Andersen audit clients partitioned by their new auditor.Statistically, client firm size is similarly distributed across auditors. It seems though thatthe most profitable audit clients selected PWC as their new auditor.
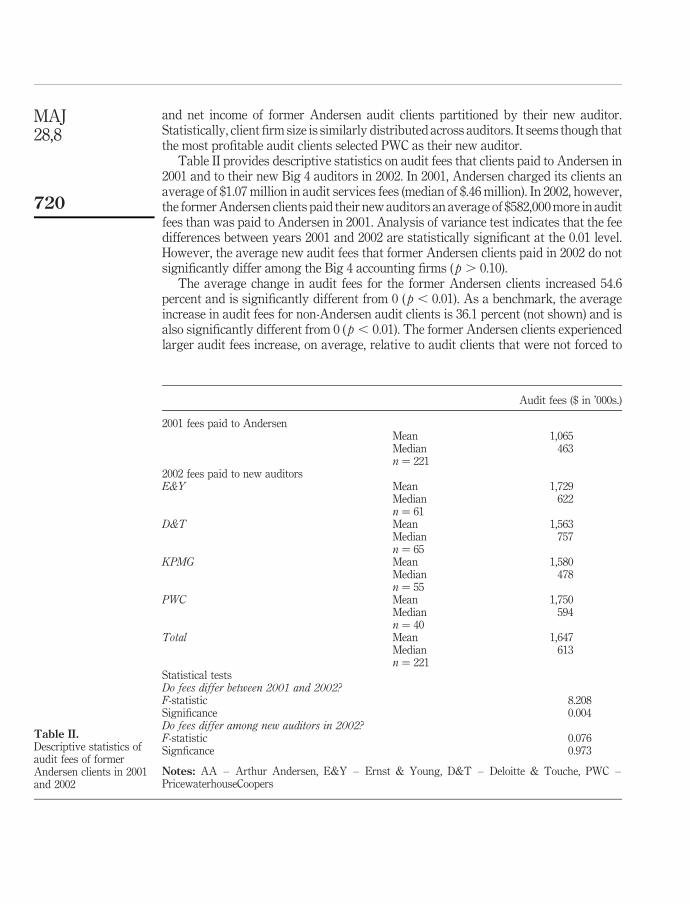
Table II provides descriptive statistics on audit fees that clients paid to Andersen in2001 and to their new Big 4 auditors in 2002. In 2001, Andersen charged its clients anaverage of $1.07 million in audit services fees (median of $.46 million). In 2002, however,the former Andersen clients paid their new auditors an average of $582,000 more in auditfees than was paid to Andersen in 2001. Analysis of variance test indicates that the feedifferences between years 2001 and 2002 are statistically significant at the 0.01 level.However, the average new audit fees that former Andersen clients paid in 2002 do notsignificantly differ among the Big 4 accounting firms ( p . 0.10).
The average change in audit fees for the former Andersen clients increased 54.6percent and is significantly different from 0 ( p , 0.01). As a benchmark, the averageincrease in audit fees for non-Andersen audit clients is 36.1 percent (not shown) and isalso significantly different from 0 ( p , 0.01). The former Andersen clients experiencedlarger audit fees increase, on average, relative to audit clients that were not forced to
Audit fees ($ in ’000s.)
2001 fees paid to AndersenMean 1,065Median 463n ¼ 221
2002 fees paid to new auditorsE&Y Mean 1,729
Median 622n ¼ 61
D&T Mean 1,563Median 757n ¼ 65
KPMG Mean 1,580Median 478n ¼ 55
PWC Mean 1,750Median 594n ¼ 40
Total Mean 1,647Median 613n ¼ 221
Statistical testsDo fees differ between 2001 and 2002?F-statistic 8.208Significance 0.004Do fees differ among new auditors in 2002?F-statistic 0.076Signficance 0.973
Notes: AA – Arthur Andersen, E&Y – Ernst & Young, D&T – Deloitte & Touche, PWC –PricewaterhouseCoopers
Table II.Descriptive statistics ofaudit fees of formerAndersen clients in 2001and 2002
MAJ28,8
720

change auditors. Further tests are warranted to determine whether the larger audit feesrepresents evidence of price-gouging.
Industry specialist by auditorAuditor market specialist by industry among the S&P 1500 companies shifted slightlyin 2002. In 2002 (2001), an auditor is identified as SPECMS if a company’s auditor has30 percent (24 percent) or more market share based on audit fees. Of the 221 Andersenclients in 15 industries, four industries made up over half of Andersen’s audit clients:46 clients in durable manufacturing, 28 clients in utilities, 20 clients in services, and 20clients in extractive. E&Y and D&T each gained 16 of the 46 audit clients in thedurable manufacturers industry, while PWC absorbed only five and maintained itsindustry specialist position. D&T absorbed 14 of the 28 utilities audit clients andmaintained its leadership position in the industry. Across the 15 industries and the Big4 auditors, 21 industry specialists (SPECMS) were identified. Further analysisindicates that of the 84 clients for which Andersen served as SPECMS in 2001, 52percent were able to obtain a Big 4 industry specialist in 2002. Of the remaining 137Andersen clients, 45 percent (61 clients) selected a new auditor who specialized in theirindustry, possibly to communicate financial reporting quality. Overall, the number ofAndersen clients who had engaged an industry specialist increased from 38 percent (84clients) in 2001 to 48 percent (105 clients) in 2002, a net increase of 10 percentattributable to the alignment with a Big 4 industry specialist.
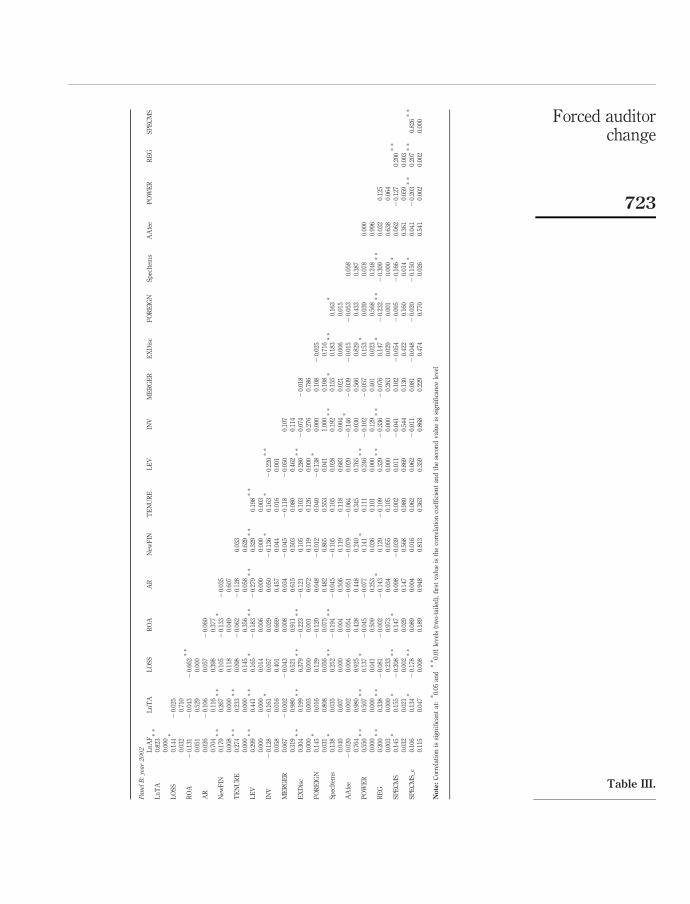
Correlation analysisTable III shows positive and significant correlations for year 2001 between LnAF andLnTA (0.80), EXDisc (0.31), TENURE (0.27), and POWER (0.45). As expected, SPECMSand SPECMS_c are highly correlated at (0.86). In addition, positive and significantcorrelations exist between LnTA and NewFIN (0.36), TENURE (0.25), LEV(0.41),EXDisc (0.33), POWER (0.37), and REG (0.34). Positive and significant correlations foryear 2002 are similar to year 2001. The correlations do not appear to present a problemwith collinearity. This observation is confirmed by the calculated variance inflationfactors (VIFs) reported for the models. Variable definitions are given in Section III.
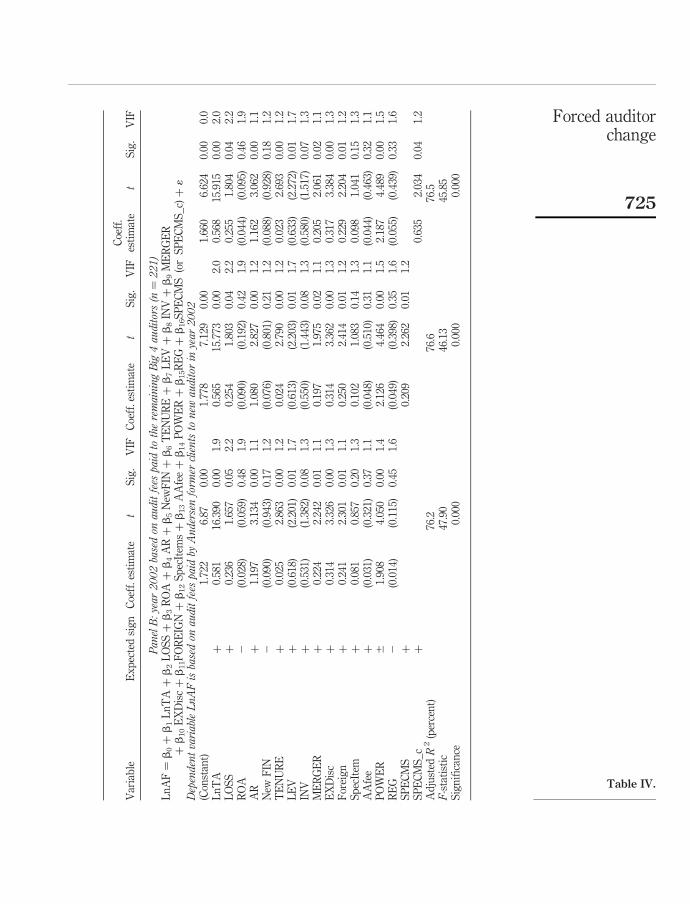
Regression analysisOLS regression models for testing the hypothesis are presented in Table IV. Models inPanel A are based on audit fees paid to Andersen in 2001, while the models in Panel B arebased on audit fees paid by former Andersen clients to new auditors in 2002. For eachyear, the audit fees model is run three times. The first model is the base model withoutthe test variable. The second model includes the SPECMS indicator variable. In the thirdmodel, the SPECMS_c continuous variable is substituted for the SPECMS variable. Inthe 2001 OLS regressions (Panel A), the adjusted R 2 of 72.8 percent indicates the powerof the independent variables (excluding the specialist test variable) to explain thedependent variable, LnAF, the natural log of audit fees. In 2002 (Panel B), the adjustedR 2 indicates that the independent variables (excluding the specialist test variable)explain 76.2 percent of audit fees. For both years, the models are significant at the 0.01level. Also for both years, the F-tests for incremental explanatory power of the industryspecialist variables are significant at the 0.05 level. The OLS assumptions are notviolated. Since all VIFs are below 3.0, multicollinearity does not appear to be a problem.
Forced auditorchange
721

PanelA:year2001 Ln
AF
Ln
TA
LO
SS
RO
AA
RN
ewF
INT
EN
UR
EL
EV
INV
ME
RG
ER
EX
Dis
cF
OR
EIG
NS
pec
Item
sP
OW
ER
RE
GS
PE
CM
SL
nT
A0.
804
**
0.00
0L
OS
S2
0.12
02
0.17
4*
*
0.07
60.
010
RO
A2
0.01
80.
002
20.
646
**
0.78
80.
973
0.00
0A
R0.
095
20.
079
20.
082
0.05
60.
159
0.24
00.
223
0.40
7N
ewF
IN0.
211
**
0.36
4*
*2
0.08
02
0.04
72
0.07
50.
002
0.00
00.
233
0.48
70.
270
TE
NU
RE
0.27
2*
*0.
253
**
0.10
22
0.08
02
0.11
50.
084
0.00
00.
000
0.12
90.
236
0.08
70.
215
LE
V0.
187
**
0.41
1*
*0.
139
*2
0.21
3*
*2
0.28
7*
*0.
272
**
0.21
9*
*
0.00
50.
000
0.03
90.
001
0.00
00.
000
0.00
1IN
V2
0.01
72
0.15
3*
0.05
30.
047
0.03
52
0.07
10.
156
*2
0.18
0*
*
0.80
60.
023
0.42
90.
491
0.60
30.
293
0.02
00.
007
ME
RG
ER
0.12
10.
145
*0.
037
20.
058
20.
037
0.22
4*
*0.
010
0.11
70.
004
0.07
10.
031
0.58
70.
393
0.58
90.
001
0.87
70.
083
0.94
8E
XD
isc
0.31
3*
*0.
331
**
0.00
82
0.10
62
0.16
6*
0.13
20.
141
*0.
298
**
20.
129
0.11
60.
000
0.00
00.
908
0.11
80.
013
0.05
00.
036
0.00
00.
055
0.08
5F
OR
EIG
N0.
102
20.
010
0.04
82
0.06
00.
050
0.01
40.
060
20.
119
20.
003
0.08
72
0.11
90.
129
0.88
00.
477
0.37
30.
463
0.84
10.
378
0.07
80.
962
0.19
80.
077
Sp
ecIt
ems
0.13
10.
038
0.29
2*
*2
0.27
1*
*0.
013
20.
022
0.09
30.
023
0.03
50.
010
0.05
80.
006
0.05
10.
576
0.00
00.
000
0.84
30.
747
0.16
60.
729
0.60
90.
888
0.38
90.
933
PO
WE
R0.
446
**
0.36
7*
*2
0.10
70.
110
0.06
40.
157
*0.
174
**
0.03
90.
027
0.11
30.
164
*0.
022
0.11
20.
000
0.00
00.
113
0.10
40.
343
0.01
90.
010
0.56
60.
691
0.09
40.
015
0.74
30.
098
RE
G0.
105
0.34
3*
*2
0.21
6*
*2
0.00
32
0.12
80.
157
*2
0.10
90.
278
**
20.
341
**
20.
060
0.15
2*
20.
205
**
20.
234
**
20.
087
0.11
80.
000
0.00
10.
969
0.05
80.
019
0.10
50.
000
0.00
00.
376
0.02
40.
002
0.00
00.
198
SP
EC
MS
0.20
3*
*0.
211
**
0.00
12
0.07
00.
033
0.14
1*
0.13
8*
0.22
1*
*2
0.09
40.
019
0.13
22
0.09
32
0.05
72
0.04
90.
252
**
0.00
20.
002
0.99
00.
302
0.62
10.
036
0.04
00.
001
0.16
60.
783
0.05
00.
166
0.39
60.
466
0.00
0S
PE
CM
S_
c0.
200
**
0.24
1*
*2
0.07
32
0.03
12
0.03
70.
142
*0.
136
*0.
241
**
20.
084
0.03
80.
137
*2
0.09
82
0.11
42
0.14
0*
0.26
5*
*0.
864
**
0.00
30.
000
0.28
00.
647
0.58
90.
035
0.04
40.
000
0.21
30.
577
0.04
20.
145
0.09
10.
037
0.00
00.
000
(continued
)
Table III.Correlation matrix
MAJ28,8
722
PanelB:year2002 Ln
AF
Ln
TA
LO
SS
RO
AA
RN
ewF
INT
EN
UR
EL
EV
INV
ME
RG
ER
EX
Dis
cF
OR
EIG
NS
pec
Item
sA
Afe
eP
OW
ER
RE
GS
PE
CM
SL
nT
A0.
823
**
0.00
0L
OS
S0.
144
*2
0.02
50.
032
0.71
0R
OA
20.
131
20.
043
20.
662
**
0.05
10.
529
0.00
0A
R0.
026
20.
106
0.05
72
0.06
00.
704
0.11
60.
398
0.37
7N
ewF
IN0.
179
**
0.26
7*
*0.
105
20.
133
*2
0.03
50.
008
0.00
00.
118
0.04
90.
607
TE
NU
RE
0.27
4*
*0.
233
**
0.09
82
0.06
22
0.12
80.
033
0.00
00.
000
0.14
50.
356
0.05
80.
629
LE
V0.
299
**
0.44
1*
*0.
165
*2
0.18
3*
*2
0.27
9*
*0.
329
**
0.19
8*
*
0.00
00.
000
0.01
40.
006
0.00
00.
000
0.00
3IN
V2
0.12
82
0.16
1*
0.05
70.
029
0.05
02
0.13
6*
0.16
3*
20.
220
**
0.05
80.
016
0.40
10.
669
0.45
70.
044
0.01
60.
001
ME
RG
ER
0.06
72
0.00
22
0.04
30.
008
0.03
42
0.04
52
0.11
82
0.05
00.
107
0.31
90.
980
0.52
10.
911
0.61
50.
503
0.08
00.
462
0.11
4E
XD
isc
0.30
4*
*0.
199
**
0.37
9*
*2
0.22
3*
*2
0.12
10.
105
0.10
30.
280
**
20.
074
20.
018
0.00
00.
003
0.00
00.
001
0.07
20.
119
0.12
60.
000
0.27
60.
786
FO
RE
IGN
0.14
5*
0.01
60.
129
20.
120
0.04
82
0.01
20.
040
20.
138
*0.
000
0.10
82
0.02
50.
031
0.80
80.
056
0.07
50.
482
0.86
50.
553
0.04
11.
000
0.10
80.
716
Sp
ecIt
ems
0.13
8*
0.03
50.
252
**
20.
194
**
20.
045
20.
105
0.10
50.
028
0.19
2*
*0.
155
*0.
183
**
0.16
3*
0.04
00.
607
0.00
00.
004
0.50
60.
119
0.11
80.
683
0.00
40.
021
0.00
60.
015
AA
fee
20.
020
0.00
20.
006
20.
054
20.
051
20.
079
20.
064
0.02
02
0.14
6*
20.
039
20.
015
20.
053
0.05
80.
764
0.98
00.
925
0.42
80.
448
0.24
00.
345
0.76
50.
030
0.56
60.
829
0.43
30.
387
PO
WE
R0.
550
**
0.50
7*
*0.
137
*2
0.04
52
0.07
70.
141
*0.
111
0.24
6*
*2
0.10
22
0.05
70.
153
*0.
039
0.07
80.
000
0.00
00.
000
0.04
10.
509
0.25
30.
036
0.10
10.
000
0.12
90.
401
0.02
30.
568
0.24
80.
996
RE
G0.
200
**
0.33
8*
*2
0.08
12
0.00
22
0.14
3*
0.12
92
0.10
90.
329
**
20.
336
**
20.
076
0.14
7*
20.
232
**
20.
309
**
0.03
20.
125
0.00
30.
000
0.23
30.
973
0.03
40.
055
0.10
50.
000
0.00
00.
263
0.02
90.
001
0.00
00.
638
0.06
4S
PE
CM
S0.
145
*0.
155
*2
0.20
8*
*0.
147
*0.
098
20.
039
0.00
20.
011
20.
041
0.10
22
0.05
42
0.09
52
0.16
6*
0.06
22
0.12
70.
200
**
0.03
20.
021
0.00
20.
029
0.14
70.
568
0.98
00.
869
0.54
40.
130
0.42
20.
160
0.01
40.
361
0.05
90.
003
SP
EC
MS
_c
0.10
60.
134
*2
0.17
8*
*0.
089
0.00
40.
016
0.06
20.
062
20.
011
0.08
12
0.04
82
0.02
02
0.15
0*
0.04
12
0.20
3*
*0.
207
**
0.82
6*
*
0.11
50.
047
0.00
80.
189
0.94
80.
813
0.36
30.
359
0.86
80.
229
0.47
40.
770
0.02
60.
541
0.00
20.
002
0.00
0
Note:
Cor
rela
tion
issi
gn
ifica
nt
at:
* 0.05
and
** 0.
01le
vel
s(t
wo-
tail
ed),
firs
tv
alu
eis
the
corr
elat
ion
coef
fici
ent
and
the
seco
nd
val
ue
issi
gn
ifica
nce
lev
el
Table III.
Forced auditorchange
723

Var
iab
leE
xp
ecte
dsi
gn
Coe
ff.e
stim
ate
tS
ig.
VIF
Coe
ff.e
stim
ate
tS
ig.
VIF
Coe
ff.
esti
mat
et
Sig
.V
IF
PanelA:year2001basedon
auditfees
paid
Andersen(n
¼221)
Ln
AF¼
b0þ
b1
Ln
TA
þb
2L
OS
Sþ
b3
RO
Aþ
b4
ARþ
b5
New
FIN
þb
6T
EN
UR
Eþ
b7
LE
Vþ
b8
INVþ
b9
ME
RG
ERþ
b10
EX
Dis
cþ
b11
FO
RE
IGNþ
b12
Sp
ecIt
emsþ
b13
AA
feeþ
b14
PO
WE
Rþ
b15
RE
Gþ
b16
SP
EC
MS
(or
SP
EC
MS
_c)þ
1DependentvariableLnAFisbasedon
auditfees
paid
toAndersenin
year2001
(Con
stan
t)1.
809
7.54
80.
000
1.84
77.
777
0.00
01.
767
7.42
80.
000
Ln
TA
þ0.
589
17.2
660.
000
1.9
0.58
317
.257
0.00
01.
90.
578
16.9
760.
000
1.9
LO
SS
þ(0
.055
)(0
.394
)0.
347
2.0
(0.0
65)
(0.4
69)
0.32
02.
0(0
.042
)(0
.300
)0.
382
2.0
RO
A2
(0.6
52)
(1.0
46)
0.14
81.
9(0
.638
)(1
.034
)0.
151
1.9
(0.6
21)
(1.0
07)
0.15
81.
9A
Rþ
1.17
63.
266
0.00
11.
11.
058
2.94
30.
002
1.2
1.11
83.
132
0.00
11.
1N
ewF
IN2
(0.2
00)
(1.9
11)
0.02
91.
2(0
.215
)(2
.076
)0.
020
1.2
(0.2
10)
(2.0
32)
0.02
21.
2T
EN
UR
Eþ
0.00
91.
088
0.13
91.
20.
006
0.76
30.
223
1.2
0.00
60.
774
0.22
01.
2L
EV
þ(0
.680
)(2
.504
)0.
007
1.6
(0.7
35)
(2.7
28)
0.00
31.
6(0
.737
)(2
.733
)0.
003
1.6
INV
þ0.
546
1.55
30.
061
1.2
0.55
61.
600
0.05
61.
20.
544
1.56
40.
060
1.2
ME
RG
ER
þ(0
.012
)(0
.130
)0.
448
1.1
(0.0
13)
(0.1
42)
0.44
41.
1(0
.018
)(0
.199
)0.
421
1.1
EX
Dis
cþ
0.22
82.
488
0.00
71.
20.
217
2.39
70.
009
1.2
0.21
82.
403
0.00
91.
2F
orei
gn
þ0.
235
2.19
70.
015
1.1
0.24
92.
351
0.01
01.
10.
251
2.36
50.
009
1.1
Sp
ecIt
emþ
0.10
71.
234
0.10
91.
20.
114
1.33
70.
091
1.2
0.12
21.
417
0.07
91.
2P
OW
ER
^0.
962
2.82
10.
005
1.3
1.04
73.
088
0.00
21.
31.
142
3.30
20.
001
1.4
RE
G2
(0.2
20)
(1.7
93)
0.03
71.
6(0
.266
)(2
.164
)0.
016
1.7
(0.2
52)
(2.0
61)
0.02
01.
6S
PE
CM
Sþ
0.20
52.
407
0.00
81.
2S
PE
CM
S_
cþ
0.87
52.
346
0.01
01.
2A
dju
sted
R2
(per
cen
t)72
.873
.573
.4F
-sta
tist
ic43
.15
41.5
941
.52
Sig
nifi
can
ce0.
000
0.00
00.
000
(continued
)
Table IV.OLS regression
MAJ28,8
724
Var
iab
leE
xp
ecte
dsi
gn
Coe
ff.e
stim
ate
tS
ig.
VIF
Coe
ff.e
stim
ate
tS
ig.
VIF
Coe
ff.
esti
mat
et
Sig
.V
IF
PanelB:year2002basedon
auditfees
paid
totheremainingBig
4auditors(n
¼221)
Ln
AF¼
b0þ
b1
Ln
TA
þb
2L
OS
Sþ
b3
RO
Aþ
b4
ARþ
b5
New
FIN
þb
6T
EN
UR
Eþ
b7
LE
Vþ
b8
INVþ
b9
ME
RG
ER
þb
10
EX
Dis
cþ
b11F
OR
EIG
Nþ
b12
Sp
ecIt
emsþ
b13
AA
feeþ
b14
PO
WE
Rþ
b15R
EGþ
b16S
PE
CM
S(o
rS
PE
CM
S_
c)þ
1DependentvariableLnAFisbasedon
auditfees
paid
byAndersenform
erclientsto
new
auditor
inyear2002
(Con
stan
t)1.
722
6.87
0.00
1.77
87.
129
0.00
1.66
06.
624
0.00
0.0
Ln
TA
þ0.
581
16.3
900.
001.
90.
565
15.7
730.
002.
00.
568
15.9
150.
002.
0L
OS
Sþ
0.23
61.
657
0.05
2.2
0.25
41.
803
0.04
2.2
0.25
51.
804
0.04
2.2
RO
A2
(0.0
28)
(0.0
59)
0.48
1.9
(0.0
90)
(0.1
92)
0.42
1.9
(0.0
44)
(0.0
95)
0.46
1.9
AR
þ1.
197
3.13
40.
001.
11.
080
2.82
70.
001.
21.
162
3.06
20.
001.
1N
ewF
IN2
(0.0
90)
(0.9
43)
0.17
1.2
(0.0
76)
(0.8
01)
0.21
1.2
(0.0
88)
(0.9
28)
0.18
1.2
TE
NU
RE
þ0.
025
2.86
30.
001.
20.
024
2.79
00.
001.
20.
023
2.69
30.
001.
2L
EV
þ(0
.618
)(2
.201
)0.
011.
7(0
.613
)(2
.203
)0.
011.
7(0
.633
)(2
.272
)0.
011.
7IN
Vþ
(0.5
31)
(1.3
82)
0.08
1.3
(0.5
50)
(1.4
43)
0.08
1.3
(0.5
80)
(1.5
17)
0.07
1.3
ME
RG
ER
þ0.
224
2.24
20.
011.
10.
197
1.97
50.
021.
10.
205
2.06
10.
021.
1E
XD
isc
þ0.
314
3.32
60.
001.
30.
314
3.36
20.
001.
30.
317
3.38
40.
001.
3F
orei
gn
þ0.
241
2.30
10.
011.
10.
250
2.41
40.
011.
20.
229
2.20
40.
011.
2S
pec
Item
þ0.
081
0.85
70.
201.
30.
102
1.08
30.
141.
30.
098
1.04
10.
151.
3A
Afe
eþ
(0.0
31)
(0.3
21)
0.37
1.1
(0.0
48)
(0.5
10)
0.31
1.1
(0.0
44)
(0.4
63)
0.32
1.1
PO
WE
R^
1.90
84.
050
0.00
1.4
2.12
64.
464
0.00
1.5
2.18
74.
489
0.00
1.5
RE
G2
(0.0
14)
(0.1
15)
0.45
1.6
(0.0
49)
(0.3
98)
0.35
1.6
(0.0
55)
(0.4
39)
0.33
1.6
SP
EC
MS
þ0.
209
2.26
20.
011.
2S
PE
CM
S_
cþ
0.63
52.
034
0.04
1.2
Ad
just
edR
2(p
erce
nt)
76.2
76.6
76.5
F-s
tati
stic
47.9
046
.13
45.8
5S
ign
ifica
nce
0.00
00.
000
0.00
0
Table IV.
Forced auditorchange
725

For both years in each model run, the coefficients for LnTA, AR, EXDisc, and Foreignare positive and significant at the 0.01 levels indicating that size, risk and complexityare positively associated with audit fees. POWER is also positive and significant at the0.01 level in each model. Rather than observing negative coefficients, indicating thebargaining power of large audit clients to negotiate lower audit fees consistent with theresults of Casterella et al. (2004), these findings indicate that large audit clients ofAndersen are charged a premium fee, possibly to compensate the auditor for greateraudit effort due to increased risk and complexity of the audit. Another possibleexplanation for the result of the POWER variable is that former Andersen clients didnot have much bargaining power due to the forced change and the need to quicklyengage a new auditor. In 2001, but not in 2002, the coefficients for INV (proxy for risk)and SpecItem (proxy for complexity) are consistently positive and significant asexpected at the 0.10 levels. In year 2001, but not in 2002, the coefficients for NewFIN(proxy for increased scrutiny) and REG (regulated industries) are significantlynegative as expected in each run at the 0.05 level or better. In 2002, but not in 2001, thecoefficients for LOSS (proxy for low profitability), Merger (proxy for audit complexity)and TENURE (proxy for professional skepticism) are consistently positive andsignificant as expected at the 0.05 levels or better. The TENURE variable indicates thataudit fee premiums are associated with clients who were with the Andersen accountingfirm for many years, and is consistent with increased risk perception and a healthydose of professional skepticism by the new auditor (Kealy et al., 2007).
Support is provided for H1. As Table IV, Panel B shows for year 2002, formerAndersen clients who were absorbed by a Big 4 industry specialist paid an audit feespremium. The coefficients for SPECMS (0.209) and SPECMS_c (0.635) are positive andsignificant at the 0.01 and 0.05 levels, respectively. For year 2001, Panel A shows thatclients for which Andersen represented an industry specialist paid an audit feespremium to Andersen. The coefficients for SPECMS (0.205) and SPECMS_c (0.875) arepositive and significant at the 0.01 level. These findings suggest that Andersen and thenew auditors who specialized in an industry based upon market share (of audit fees)charged the Andersen clients an incremental fee consistent with the productdifferentiation explanation. We use the procedure described by Craswell et al. (1995)and Simon and Francis (1988) to calculate the audit fee premium[6]. On average, theformer Andersen audit clients paid a premium of 23.2 percent to their Big 4 industryspecialist auditor in 2002; this compares to a 22.8 percent premium paid to Andersenby clients for which it represented an industry specialist in 2001.These results aresubstantially unchanged when replacing the regulated industry indicator variable withindicator variables for all industries except for one, the effect of which is embedded inthe intercept.
Additional analysesMembers of the Big 4 could exercise their dominant market power to charge formerAndersen clients uncompetitive fees (Yardley et al., 1992; AccountingWEB.com, 2002;Wall Street Journal, 2003). As we reported previously, former Andersen clientsexperienced larger audit fee increases from 2001 to 2002, on average, relative to auditclients that were not forced to change auditors. Since regulators have expressedconcern for potential price-gouging (GAO, 2003a, 2008), we test for it following themethodology employed by Ettredge and Greenberg (1990), which requires analyzing
MAJ28,8
726
the difference in deflated residuals (residual/audit fees) between 2001 and 2002 forevidence of price-gouging and/or low-balling. Regressions are run for each year and theresiduals saved. Next, ratios are calculated by dividing the residuals derived from theregression by its dependent variable. Then the 2001 ratios are subtracted from the 2002ratios to calculate the change in deflated residuals. Results of parametric(nonparametric) tests of the mean (median) values (not shown) indicate that neitherprice-gouging nor low-balling were pervasive in the pricing of audits of Andersen’sformer clients after controlling for factors that are related to audit fees.
Next, we use a logistic model to explore the probability of factors that mayinfluence former Andersen clients switching to an industry specialist since auditorexpertise in an industry is an important factor affecting the positive perception ofaudit effectiveness and audit quality relative to non-industry specialists (AICPA, 1998;Owhoso et al., 2002; Balsam et al., 2003; Cenker and Nagy, 2008). We expect thatformer Andersen clients are motivated to signal a perception of lower risk, high auditquality and increased reliability of financial statements. In the logistic model, auditorindustry specialist, a dichotomous variable, is the dependent variable. This testprovides an indication of the likelihood of former Andersen audit clients switching to anew industry specialist Big 4 auditor in 2002. The model appears to appropriatelycapture variation in the dependent variable as evidenced by the inability to reject thenull of an appropriate model fit indicated by the Omnibus test of model coefficients(results not shown). In SPSS binary logistic regression report, significance levels bythe traditional x 2 method are an alternative to the Hosmer-Lemeshow x 2-testgoodness-of-fit. The pseudo R 2 is 27.6 percent for the logistic regression. Resultsindicate that large audit clients who had long auditor tenure with Andersen and highleverage were more likely to switch to an industry specialist. This finding is notinconsistent with a management risk perspective in which former Andersen clientslikely want to signal to the market their financial reporting quality because of theirlong tenure with an auditor who had been barred from performing audits, and becauseof higher than normal business risk.
Since our sample consists of very large companies as a design feature controllingextraneous size effects, additional tests are performed to determine whether companysize still could be driving the results as suggested by prior studies (Huang et al., 2007;Hay and Jeter, 2011): for example, Hay and Jeter (2011) state that the specialistpremium applies most consistently to larger client companies; and Carcello and Nagy(2004) find a positive and significant interaction between industry specialization andclient size. Although client size (LnTA) and bargaining power (POWER) are controlledin our model, an additional size variable (MedTA) is included to ascertain whetherthere is any change in coefficient of our specialization test variable. MedTA equals 1 iftotal assets is above its median, and 0 otherwise. When the regressions in Table IV arererun with MedTA included, MedTA is significant ( p ¼ 0.01) and the industryspecialization variables continue to be positive and significant at the 0.05 level orbetter. Similarly, another additional size measure, MedPOWER, is included in theoriginal regressions. MedPOWER equals 1 if POWER is above its median, and 0otherwise. When MedPOWER is tested, the findings on the specialization test variablesremain unchanged. Hence, our findings are robust to the inclusion of additionalalternative measures of company size in the regression models, suggesting that size isnot driving our results as in prior research studies.
Forced auditorchange
727
We further explore the industry specialization variable by partitioning it into twoindicator variables:
. first variable indicates industry specialist in 2002 that was also considered anindustry specialist in 2001 (n ¼ 44); and
. second variable indicates industry specialist in 2002 that was not considered anindustry specialist in 2001 (n ¼ 61).
The adjusted R 2 increased slightly to 77.4 percent from 76.6 percent, and only the firstindicator variable is positive and significant (at the 0.01 level). This finding suggeststhat auditors who became industry specialist because of the new Andersen clients intheir portfolio did not charge a specialist premium to former Andersen clients. Perhapsas knowledge and experience is acquired from serving these new clients an audit feespremium may be charged.
Finally, we ran a change regression to ascertain whether “a forced change” isassociated with a significant fee premium for clients with specialist auditors. Theadjusted R 2 is 54 percent, and the auditor industry specialization variable is notsignificant. When the specialization variable is partitioned into two indicator variablesas discussed above, neither indicator variable is significant. This finding suggests thatthe “forced change” is not driving the result on the auditor specialization variable in thelevel regressions. Further, while we test for and find a significant increase in audit fees(after controlling for other factors) from 2001 to 2002, there is no evidence ofprice-gouging as previously reported in this section.
VI. Conclusion, contribution, and implicationsThis study explores the effect of industry specialization and competitive pricing (orlack thereof) of audits of the S&P 1500 former Andersen clients who switched to one ofthe remaining Big 4 auditors in 2002. The collapse of Andersen increased audit marketconcentration significantly in the large client segment and induced an abrupt forcedauditor change for hundreds of audit clients at one time, allowing us the opportunityto examine the effect of auditor specialization on audit fees in this uniqueenvironment and its implications for mandatory auditor rotation. Because prior auditorspecialization studies report size effects, we limit our study to the largest ofArthur Andersen’s former clients to provide more control over size, by design, and toreduce or eliminate possible confounding effects between any premiums resulting fromindustry specialization and those that may arise from a company’s potentialbargaining power to obtain lower audit fees. We argue that given the size, resources,and national/international presence of the S&P 1500, that these companies are morelikely concerned with the firm-wide and international reputation of their auditors asoppose to the auditor’s local-office reputation. A basis for this study is that we believe,given the tarnished reputation of Andersen, its large former clients:
. wanted to send a positive signal about the quality of their financial reporting;and
. would likely have done so by engaging a Big 4 industry specialist.
We also believe that a more likely competitive response by a Big 4 network firm wouldbe to increase audit fees (rather than discount them) to better reflect the value of the
MAJ28,8
728
audit and earn an appropriate return on the investment in specialization. Consequently,we examine if there is a positive association between national industry specializationand audit fees charged to former Andersen’s largest clients.
As hypothesized, we find that the association between audit fees and auditorindustry specialization is positive and significant at the 0.05 level or better, whichsupports the product differentiation explanation. Our finding is consistent with theFrancis et al. (2005) model, which considers national-only industry leaders. On average,the former Andersen audit clients paid a premium of 23.2 percent to their Big 4industry specialist auditor in 2002; this compares to a 22.8 percent premium paid toAndersen by clients for whom it represented an industry specialist in 2001.
This study makes a contribution to the literature beyond Francis et al. (2005) byfocusing on the alignment of former Andersen clients with a Big 4 industry specialist(in a forced auditor change) after the demise of Andersen. In contrast, Francis et al.investigate Big 5 industry expertise prior to Andersen’s demise. While both this studyand Francis et al. (2005) use the newly required mandatory audit fees disclosures, wefocus our study on large S&P 1500 clients, and are able to avoid size effect issuesreported by Francis et al. and other prior studies because the premium for industryleadership is driven by the upper half of company size.
This study contributes to the literature beyond the primary finding as it relates toclient bargaining power, price-gouging, and the likely characteristics of companiesinfluencing the choice of an auditor industry specialist. When testing the auditorindustry specialization hypothesis, we include a POWER variable in the model as aproxy for client bargaining power to attain lower audit fees, similar to Casterella et al.(2004). We find that the POWER variable is positive and significant ( p , 0.01),suggesting that POWER represents a size effect of the large and complex formerAndersen audit clients. Further, results of the POWER variable remained unchangedwhen conducting additional analyses. Contrary to Casterella et al. (2004), ourexplanation is that large former Andersen clients did not have much bargaining powerdue to the forced change and the need to quickly engage a new auditor. This may haveimplications for mandatory auditor rotation (discussed below), whereby largecompanies would likely lose their ability to bargain for lower audit fees.
Additionally, given the significant increase in audit market concentration for largepublic companies along with involuntary auditor switching, regulators have expressedconcern about potential price-gouging (GAO, 2003a, 2008). We test for excessivepricing (and low-balling) using a method employed by Ettredge and Greenberg (1990),but could not find any evidence of price-gouging by the Big 4 as had been feared byregulators after the demise of Anderson. It is difficult to extend pricing implications ifone or more of the international accounting firms is abruptly barred from providingaudit services to their clients because the accounting profession will be faced with ahost of complex problems (including lost investor confidence) along with an increase inaudit market concentration and the possibility of excessive pricing.
Finally, our study provides further evidence of how companies perceive theimportance of having the financial statements audited by an industry specialist in orderto signal quality financial reporting to the market. First, we analyzed the companiesthat had a specialist (non-specialist) in 2001 and retained a specialist in 2002. The dataindicates that the tarnished audit quality reputation of Andersen resulted in a net 10percent increase in the number of Andersen’s former clients who obtained an industry
Forced auditorchange
729
specialist in 2002 (over 2001). Second, we employed a logistic model using an auditorindustry specialist dichotomous variable as the dependent variable to determinecompany characteristics that are more likely to influence the engagement of anindustry specialist among the large former Andersen clients. We find that formerAndersen clients with the characteristics of long tenure and high business risk weremore likely to switch to an industry audit specialist. Supporting the basic premise ofour study, this finding implies that companies align with a specialist for the majorbenefit of signaling financial reporting and audit quality to the market. Our study isalso consistent with a GAO (2003a) survey which indicated that 81 percent ofrespondents cited industry specialization or expertise as an important factor inchoosing a new auditor.
Implications of this research are that mandatory audit firm rotation (which iscurrently being debated in the profession) or involuntary change of auditors will have acostly effect on the pricing of audit services for those companies that use a Big 4network firm. The GAO (2003b) report states that most public companies will only usethe Big 4 firms for audit services. Given this preference, these public companies mayonly have one or two real choices for an auditor of record under any mandatoryrotation system given the importance of industry expertise and the Sarbanes-OxleyAct’s auditor independence requirements. Under the Sarbanes-Oxley Act’s auditorindependence requirements, audit firms are prohibited from providing both audit andnon-audit services to the same client. With the limited choices for an auditor of recordamong the Big 4, involuntary auditor changes for those firms wanting an auditor thatspecializes in their industry will more than likely incur additional cost in the form ofhigher audit fees.
The sample only includes relatively large companies, which may limit the ability togeneralize the findings to smaller companies.
Notes
1. The Herfindahl-Hirschman Index measures the relative concentration of market power heldby the largest firms in an industry and represents the degree to which the industry isoligopolistic.
2. For a general discussion of network synergies, please refer to studies by Katz and Shapiro(1985) and Bental and Spiegel (1995) about scope and size of relevant (appropriate) networks,network externalities, and the quality of a network product.
3. Methodologies used to identify firms as industry audit specialists lack consistency and arethus difficult to compare and evaluate findings (Neal and Riley, 2004).
4. Industry membership is determined by SIC code as follows: mining and construction(1000-1999, excluding 1300-1399), food (2000-2111), textiles and printing/publishing(2200-2799), chemicals (2800-2824 and 2840-2899), biotechnology/pharmaceuticals(2830-2836 and 8731-8734), extractive (1300-1399 and 2900-2999), durable manufacturers(3000-3999, excluding 3570-3579 and 3670-3674), computers (3570-3579 and 7370-7379),transportation (4000-4899), retail-wholesale (5000-5999, excluding 5200-5961), services(7000-8999, excluding 7370-7379), financial services (6021-6798), utilities electric and gas(4900-4940), retail-other (5200-5961), and other (000-0999, 9000-9999).
5. The specialist cutoff is based on studies by Palmrose (1986a) and Neal and Riley (2004).When the audit market consisted of the Big 8, each firm without specialization holds anequal market share of 12.5 percent. Palmrose (1986a) specified an auditor as a specialist if the
MAJ28,8
730
market share was 20 percent or greater above this, thereby specifying the specialist cutoff at15 percent (0.125 £ 1.2 ¼ 0.15). Using this same methodology, the calculated specialist cutoffis 24 percent (30 percent) when the industry consisted of the Big 5 (Big 4) auditors.
6. The procedure described by Craswell et al. (1995) and Simon and Francis (1988) is used tocalculate the audit fee premium. The percentage shift in audit fees in the fitted regressionmodel is estimated to infer the magnitude of change in audit price attributable to industryspecialization. Therefore, in addition to the statistical tests of parameter b15 to determinewhether there is a significant intercept shift, the magnitude of the intercept shift iscalculated. The shift in the intercept term affects audit fees in the fitted model in thefollowing manner.
eðxþzÞ 2 ex
ex
where, ex ¼ audit fees of clients without an industry specialist auditor; e(xþ z) ¼ audit feesof clients with an industry specialist auditor, where z is the upward shift in the intercept termdue to the SPECMS variable. The above equation simplifies to ez 2 1, which is solved usingthe mean parameter value (z) of the SPECMS variable in the fitted regression model. Thisexpresses the mean shift in industry specialist audit fees as a percentage of non-industryspecialist audit fees.
References
AccountingWEB.com (2002), “Accounting firms expect double-digit hikes in audit fees”,August 13.
AICPA (1998), “CPA vision project identifies top five issues for profession”, The CPA Letter,Vol. 78, April, p. 12.
Balsam, S., Krishnan, J. and Yang, J.G.S. (2003), “Auditor industry specialization and theearnings response coefficient”, Auditing: A Journal of Practice and Theory, Vol. 22September, pp. 71-97.
Barton, J. (2005), “Who cares about auditor reputation?”, Contemporary Accounting Research,Vol. 22, pp. 549-586.
Beck, P.J., Frecka, T.J. and Solomon, I. (1988), “A model of the market for MAS and audit services:knowledge spillovers and auditor-auditee bonding”, Journal of Accounting Literature,Vol. 7, pp. 50-64.
Bell, T., Marrs, F., Solomon, I. and Thomas, H. (1997), Auditing Organizations Through aStrategic Systems Lens: The KPMG Peat Marwick Business Measurement Process, KPMGPeat Marwick, Montvale, NJ.
Bental, B. and Spiegel, M. (1995), “Network competition, product quality, and market coverage inthe presence of network externalities”, Journal of Industrial Economics, Vol. 43, pp. 197-208.
Blouin, J., Grein, B.M. and Rountree, B.R. (2007), “An analysis of forced auditor change: the caseof former Arthur Andersen clients”, The Accounting Review, Vol. 82 No. 3, pp. 621-650.
Cahan, S.F., Godfrey, J.M., Hamilton, J. and Jeter, D. (2008), “Auditor specialization, auditordominance, and audit fees: the role of investment opportunities”, The Accounting Review,Vol. 83 No. 6, pp. 1393-1423.
Carcello, J. and Nagy, A.L. (2004), “Client size, auditor specialization and fraudulent financialreporting”, Managerial Auditing Journal, Vol. 19, pp. 651-668.
Carson, E. (2009), “Industry specialization by global audit firm networks”, The AccountingReview, Vol. 84 No. 2, pp. 355-382.
Forced auditorchange
731
Casterella, J.R., Francis, J.R., Lewis, B.L. and Walker, P.L. (2004), “Auditor industryspecialization, client bargaining power, audit pricing”, Auditing: A Journal of Practiceand Theory, Vol. 23 No. 1, pp. 123-140.
Cenker, W.J. and Nagy, A.L. (2008), “Auditor resignations and auditor industry specialization”,Accounting Horizons, Vol. 22 No. 3, pp. 279-295.
Chaney, P.K. and Philipich, K.L. (2002), “Shredded reputation: the cost of audit failure”, Journal ofAccounting Research, Vol. 40 No. 4, pp. 1221-1245.
Chen, K.Y. and Zhou, J. (2007), “Audit committee, board characteristics, and auditor switchdecisions by Andersen’s clients”, Contemporary Accounting Research, Vol. 24 No. 4,pp. 1085-1117.
Chow, C. and Rice, S. (1982), “Qualified audit opinions and auditor switching”, The AccountingReview, Vol. 57 April, pp. 326-335.
Craswell, A., Francis, J.R. and Taylor, S.L. (1995), “Auditor brand name reputations and industryspecializations”, Journal of Accounting and Economics, Vol. 20 December, pp. 297-322.
Davidson, R.A. and Gist, W.E. (1996), “Empirical evidence on the functional relation betweenaudit planning and total audit effort”, Journal of Accounting Research, Vol. 34 No. 1,pp. 111-124.
DeAngelo, L.E. (1981), “Auditor independence, low-balling and disclosure regulation”, Journal ofAccounting and Economics, Vol. 3, pp. 113-127.
Deis, D.R. Jr and Giroux, G. (1996), “The effect of auditor changes, audit hours, audit quality”,Journal of Accounting and Public Policy, Vol. 15 Spring, pp. 55-76.
Eisenberg, T. and Macey, J.R. (2003), “Was Arthur Andersen different? An empiricalexamination of major accounting firms’ audits of large clients”, Research Paper No. 287,Yale Law School.
Ettredge, M. and Greenberg, R. (1990), “Determinants of fee cutting on initial auditengagements”, Journal of Accounting Research, Vol. 28 No. 1, pp. 198-210.
Francis, J.R., Reichelt, K. and Wang, D. (2005), “The pricing of national and city-specificreputation for industry expertise in the US audit market”, The Accounting Review, Vol. 80,pp. 113-136.
Frankel, R.M., Johnson, M.F. and Nelson, K.K. (2002), “The relation between auditors’ fees fornon-audit services and earnings management”, The Accounting Review, Vol. 77,Supplement, pp. 71-106.
GAO (2003a), Public Accounting Firms Mandated Study on Consolidation and Competition,GAO-03-864, US General Accounting Office, Government Printing Office, Washington, DC.
GAO (2003b), Public Accounting Firms Required Study on the Potential Effects of MandatoryAudit Firm Rotation, GAO-04-216, US General Accounting Office, Government PrintingOffice, Washington, DC.
GAO (2008), Audits of Public Companies: Continued Concentration in Audit Market for LargePublic Companies Does Not Call for Immediate Action, GAO-08-163, US GeneralAccounting Office, Government Printing Office, Washington, DC.
Ghosh, A. and Lustgarten, S. (2006), “Pricing of initial engagements by large and small auditfirms”, Contemporary Accounting Research, Vol. 24 No. 2, pp. 333-368.
Gist, W.E. (1994), “Empirical evidence on the effect of audit structure on audit pricing”, Auditing:A Journal of Practice & Theory, Vol. 13 No. 2, pp. 25-40.
Habib, A. (2011), “Audit firm industry specialization and audit outcomes: insights from academicliterature”, Research in Accounting Regulation, Vol. 23 August, pp. 114-129.
MAJ28,8
732

Hay, D. and Jeter, D. (2011), “The pricing of industry specialization by auditors in New Zealand”,Accounting and Business Research, Vol. 41 No. 2, p. 171.
Hay, D., Knechel, W. and Wong, N. (2006), “Audit fees: a meta-analysis of the effect and demandand supply attributes”, Contemporary Accounting Research, Vol. 23 No. 1, pp. 141-191.
Huang, H., Liu, L., Raghunandan, K. and Rama, D.V. (2007), “Auditor industry specialization,client bargaining power, and audit fees: further evidence”, Auditing: A Journal of Practice& Theory, Vol. 26 No. 1, pp. 147-158.
Katz, M.L. and Shapiro, C. (1985), “Network externalities, competition, and compatability”, TheAmerican Economic Review, Vol. 75, pp. 424-440.
Kealy, B.T., Lee, H.Y. and Stein, M.T. (2007), “The association between audit-firm tenure andaudit fees paid to successor auditors: evidence from Arthur Andersen”, Auditing: AJournal of Practice and Theory, Vol. 26 November, pp. 95-116.
Knechel, R., Naiker, V. and Pacheco, F. (2007), “Does auditor industry specialization matter?Evidence from market reaction to auditor switches”, Auditing: A Journal of Practice andTheory, Vol. 26, May, pp. 19-45.
Kohlbeck, M., Brian, W., Mayhew, W., Murphy, P. and Wilkins, M.S. (2008), “Competition forAndersen’s clients”, Contemporary Accounting Research, Vol. 25 No. 4, pp. 1099-1136.
Krishnan, G.V. (2003), “Does Big 6 auditor industry expertise constrain earnings management?”,Accounting Horizons, Vol. 17, pp. 1-16.
Landsman, W.R., Nelson, K.K. and Rountree, B.R. (2009), “Auditor switches in the pre- andpost-Enron eras: risk or realignment?”, The Accounting Review, Vol. 84 No. 2, pp. 531-558.
Mayhew, B.W. and Wilkins, M. (2003), “Audit firm industry specialization as a differentiationstrategy: evidence from fees charged to firms going public”, Auditing: A Journal ofPractice and Theory, Vol. 22 September, pp. 33-52.
Nagy, A.L. (2005), “Mandatory audit firm turnover, financial reporting quality, and clientbargaining power: the case of Arthur Andersen”, Accounting Horizons, Vol. 19 No. 2,pp. 51-68.
Neal, T.L. and Riley, R.R. Jr (2004), “Industry specialist research design”, Auditing: A Journal ofPractice and Theory, Vol. 19 September, pp. 169-177.
Owhoso, V.E., Messier, W.F. Jr and Lynch, J.G Jr (2002), “Error detection by industry-specializedteams during sequential audit review”, Journal of Accounting Research, Vol. 40 June,pp. 883-900.
Palmrose, S.V. (1986a), “Audit fees and auditor size: further evidence”, Journal of AccountingResearch, Vol. 24, Spring, pp. 97-110.
Palmrose, S.V. (1986b), “The effect of non-audit services on the pricing of audit services: furtherevidence”, Journal of Accounting Research, Vol. 24, Autumn, pp. 405-411.
Palmrose, S.V. (1988), “An analysis of auditor litigation audit service quality”, The AccountingReview, Vol. 63 January, pp. 55-73.
Reichelt, K.J. and Wang, D. (2010), “National and office-specific measures of auditor industryexpertise and effects on audit quality”, Journal of Accounting Research, Vol. 48 No. 3,pp. 647-686.
SEC (2001), Final Rule: Revision of the Commission’s Auditor Independence RequirementsSecurities and Exchange Commission 17 CFR Parts 210 and 240, File No. S7-13-00 [RIN3235-AH91, available at: www.sec.gov/RULES/FINAL/33-7919.HTM; www.sec.gov/rules/final/33-7919.htm
Forced auditorchange
733

SEC (2002), Final Rule: Strengthening the Commission’s Requirements Regarding AuditorIndependence, 17 CFR Parts 210, 240, 249 and 274, Release No. 33-8070, File No. S7-49-02[RIN 3235-AI73].
Simon, D.T. and Francis, F.R. (1988), “The effects of auditor change on audit fees: tests of pricecutting and price recovery”, The Accounting Review, Vol. 63, pp. 255-269.
Simunic, D.A. (1980), “The pricing of audit services: theory and evidence”, Journal of AccountingResearch, Vol. 18, Spring, pp. 161-190.
Turpin, R.A. (1990), “Differential pricing on auditors’ initial engagements: further evidence”,Auditing: A Journal of Practice & Theory, Vol. 9, Spring, pp. 60-76.
Vermeer, T.E., Rama, D.V. and Raghunandan, K. (2008), “Partner familiarity and audit fees:evidence from former Andersen clients”, Auditing: A Journal of Practice & Theory, Vol. 27No. 2, pp. 217-229.
Wall Street Journal (2003), “Corporate reform: the first year, cleaner living, no easy riches”, WallStreet Journal, July 22, p. C1.
Whisenant, S., Sankaraguruswamy, S. and Raghunandan, K. (2003), “Evidence on the jointdetermination of audit and non-audit fees”, Journal of Accounting Research, Vol. 41 No. 4,pp. 721-744.
Yardley, J., Kauffman, L. and Cairney, T. (1992), “Supplier behavior in the US audit market”,Journal of Accounting Literature, Vol. 11, pp. 151-184.
Further reading
Bell, T.B., Landsman, W.R. and Shackelford, D.A. (2001), “Auditors’ perceived business risk andaudit fees: analysis and evidence”, Journal of Accounting Research, Vol. 39 No. 1, pp. 35-44.
SEC (1971), September, Release 34-9344: Notice of Adoption of Amendments to Form 8-K, Form7-Q, Form IO-Q, Form IO-K and Form N-1Q, 1-5, Securities and Exchange Commission,Washington, DC.
Simunic, D.A. and Stein, M.T. (1990), “Audit risk in a client portfolio context”, ContemporaryAccounting Research, Vol. 6, Spring, pp. 329-340.
Simunic, D.A. and Stein, M.T. (1996), “The impact of litigation risk on audit pricing: a review ofthe economics and the evidence”, Auditing: A Journal of Practice & Theory, Vol. 15,Supplement, pp. 119-134.
US Congress (2002), HR 3763 Sarbanes-Oxley Act 2002, Public Accounting Reform and InvestorProtection Act.
Corresponding authorWinifred D. Scott can be contacted at: [email protected]
MAJ28,8
734
To purchase reprints of this article please e-mail: [email protected] visit our web site for further details: www.emeraldinsight.com/reprints