
Historical Antisemitism, Ethnic Specialization, and Financial ...
68
Electronic copy available at: https://ssrn.com/abstract=3147101 1126 E. 59th St, Chicago, IL 60637 Main: 773.702.5599 bfi.uchicago.edu WORKING PAPER · NO. 2018-19 Historical Antisemitism, Ethnic Specialization, and Financial Development Francesco D'Acunto, Marcel Prokopczuk, and Michael Weber March 2018
-
Upload
khangminh22 -
Category
Documents
-
view
1 -
download
0
Transcript of Historical Antisemitism, Ethnic Specialization, and Financial ...

Electronic copy available at: https://ssrn.com/abstract=3147101
1126 E. 59th St, Chicago, IL 60637 Main: 773.702.5599
bfi.uchicago.edu
WORKING PAPER · NO. 2018-19
Historical Antisemitism, Ethnic Specialization, and Financial DevelopmentFrancesco D'Acunto, Marcel Prokopczuk, and Michael WeberMarch 2018

Historical Antisemitism, Ethnic Specialization,
and Financial Development
Francesco D’Acunto Marcel Prokopczuk Michael Weber ∗
This Version: March 2018
Abstract
Historically, European Jews have specialized in financial services while being the
victims of antisemitism. We find that the present-day demand for finance is lower
in German counties where historical antisemitism was higher, compared to otherwise
similar counties. Households in counties with high historical antisemitism have similar
saving rates but invest less in stocks, hold lower saving deposits, and are less likely to
get a mortgage to finance homeownership after controlling for wealth and a rich set of
current and historical covariates. Present-day antisemitism and supply-side forces do
not fully explain the results. Households in counties where historical antisemitism was
higher distrust the financial sector more – a potential cultural externality of historical
antisemitism that reduces wealth accumulation in the long run.
JEL: D91, G11, J15, N90, Z10, Z12.
Keywords: Cultural Economics, Cultural Finance, Intergenerational
Transmission of Norms, Stereotypes, Household Finance, History & Finance.∗D’Acunto is at the Carroll School of Management, Boston College ([email protected]). Prokopczuk is at
Leibniz University Hannover and the University of Reading ([email protected]). Weber is atthe Booth School of Business, University of Chicago and NBER ([email protected]). Theviews expressed in this paper do not reflect those of the DIW, the Bundesbank, GESIS, or the Banque deFrance. We thank the Editor, Nicola Gennaioli, and four anonymous referees for many excellent commentswhich helped improve the paper. We thank Joachim Voth and Nico Voigtlaender for making their data onanti-Jewish violence publicly available, Thomas Kick for his help with the Bundesbank data on county-levelbank branches, the ifo-Prussian Economic History project, Michael Koetter for sharing his data on theefficiency of the local German banking system, and Martin Eisele for his great assistance in the access of thePHF Bundesbank data. In addition, we are indebted to ALLBUS and DIW Berlin for allowing us to mergetheir two proprietary data sources. In particular, we thank Andre Kastilan and Julia Klinger for creatingmeasures of antisemitism at the county level from ALLBUS, and Jan Goebel for allowing the merging ofthese measures based on county identifiers to the SOEP. For very helpful comments and discussions, wethank Ran Abramitzky, Nick Barberis, Zahi Ben-David, Kelley Bergsma, Johannes Buggle, Davide Cantoni,Jason Chen, Pierluigi D’Acunto, Stefano DellaVigna, Barry Eichengreen, Ruben Enikolopov, Paola Giuliano,Rick Green, Tarek Hassan, Danling Jiang, Samuli Knupfer, Ross Levine, Sonya Lim, Dmitry Livdan, UlrikeMalmendier, Gustavo Manso, Petra Moser, Rabbi Adam Naftalin-Kelman, Terry Odean, Martha Olney,Christine Parlour, Chris Parsons, Caitlin Rosenthal, Paola Sapienza, Andrei Shleifer, Stephan Siegel, AndreiSimonov, Paul Smeets, Robert Vishny, Jason Wittenberg, Noam Yuchtman, and especially Luigi Guiso,Nico Voigtlaender, and Joachim Voth, as well as participants at several seminars and conferences. Wealso thank Stephen Lamb for excellent research assistance. All errors are our own. Weber acknowledgesfinancial support from the Cohen Keenoy Faculty Research Fund at the University of Chicago Booth Schoolof Business.
1 Introduction
Financial development varies persistently across space, and this systematic variation might
contribute to spatial inequalities, because households accumulate wealth through the stock
market (Guiso, Sapienza, and Zingales (2004a)). Households’ trust in the financial sector
might help explain variation in the demand for financial services across space, including
within countries whose regions have faced the same regulatory environment and the same
financial institutions for decades (Gennaioli, La Porta, Lopez-de Silanes, and Shleifer (2013),
Guiso, Sapienza, and Zingales (2009)). Measuring the size and determinants of trust in
finance is challenging, because such determinants should persist for decades despite the
implementation of institutional reforms and place-based policies.
A potential route to measure the spatial variation in households’ trust in the financial
sector is to exploit its origins in history, because inter-ethnic tensions can produce persistent
anti-minority sentiment, which can survive the physical presence of minorities themselves
(Voigtlaender and Voth, 2012). If different ethnic groups specialized in different economic
activities in the past, ethnic tensions could lead one group to discriminate against the activity
led by the other group. Parallel to the discrimination against minorities, discrimination
against economic activities might persist even after ethnic specialization fades (Jha (2013),
Grosfeld, Rodnyansky, and Zhuravskaya (2013), Jha (2014)), hence capturing the deep-
rooted variation in the localized trust in economic activities across space.
We build on this framework and test whether the historical specialization of Jews in
financial services, paired with persistent historical antisemitism across space, helps explain
the present-day regional variation in the demand for finance. Our analysis focuses on
Germany – where Jewish persecution has persisted across space for centuries (Voigtlaender
and Voth, 2012) – as an ideal laboratory. Crucially, the ethnic specialization of Jews in
finance was an important component of historical antisemitism. It led to the emergence of
negative stereotypes attached to Jews but unrelated to religious creed, which Reuveni and
Wobick-Segev (2011) label “economic antisemitism.” The baseline setting for our empirical
tests is the Nazi period, which represented the most dramatic peak of economic antisemitism
in Germany, because Jews were blatantly and unsubstantiatedly accused by the dictatorship
of manipulating the German economy and causing economic depression “by means of their
predominance in the stock exchange.”1 Jewish persecution also arguably peaked during the
Nazi period, when the dictatorship required the broader German population to persecute
and delate Jews through widespread and pervasive propaganda.
1See Vol. I, chapter XI, of Hitler (1939) for a delirious interpretation of Jews as manipulators of the stockmarket.
1

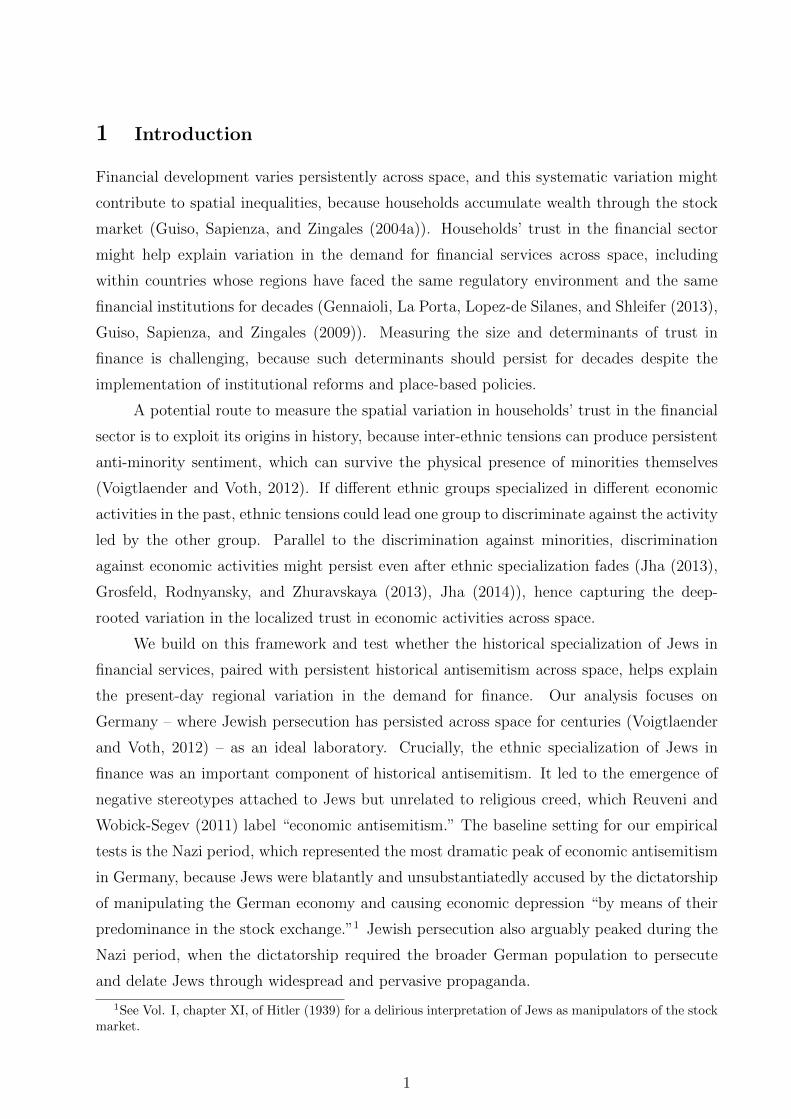
We document that present-day households in German counties with higher anti-Jewish
sentiment during the Nazi period participate in the stock market less than other households.
Figure 1 plots the negative correlation between stock market participation and historical
antisemitism at the county level conditional on a large set of historical and present-day
observables. Present-day households in counties where historical antisemitism was one
standard deviation higher are about 9% less likely to hold stocks. The size of this association
is similar to the effect of holding a college degree, and college education is one of the most
studied determinants of stock market participation (van Rooij, Lusardi, and Alessie, 2011).
Figure 1: Historical Antisemitism and Present-Day Stock Market Participation
-.2
0.2
Rat
io H
ouse
hold
s w
ho O
wn
Sto
cks
(res
idua
ls)
-2 -1 0 1 2VV Principal Component of Jewish Persecution (residuals)
Each point is a German county. The vertical axis plots the residuals from estimating the following equation,
Ratio Stockholdersk = α+K′k × δ + εk,
where Kk is the set of historical and present-day observables described in section 3. The horizontal axis plots the residuals of aregression of the Voigtlaender-Voth (VV) principal component of Jewish persecution in the 1920s and 1930s, which is our mainmeasure of historical antisemitism (see section 3.A), and the same set of covariates Kk.
The baseline association between local historical antisemitism and stock market
participation by present-day German households is a robust feature of the data, and survives
a large set of robustness tests, such as restricting the geographic variation we use in the
analysis and using alternative proxies for local antisemitism during the Nazi period.
Although the defamation of Jews as stock market manipulators was salient in the press
and popular culture even after the Jewish presence in banking had faded after the spread
of credit unions and public savings banks at the end of the 18th and early 19th centuries
(Kohler, 2005), historians documented a stereotype of Jews as moneylenders and bankers
that was common in the German lands for centuries. The Jewish ethnic specialization in
the provision of financial services was the main driver of this stereotype, and was largely
driven by the fact that Christians were banned from lending money at interest throughout
the Middle Ages. Consistent with the stereotype of Jews as moneylenders, we find historical
antisemitism during the Nazi period is also negatively associated with households’ use of
2

banking services today. Households in counties with higher historical antisemitism are 10%
less likely to have a mortgage, but as likely as other households to own a house. The ratio of
retail deposits over total assets of the banks in counties with higher historical antisemitism
is 2% lower than in other counties, even if saving propensities and the concentration of bank
branches do not differ systematically across counties. We also find suggestive evidence that
households in counties with higher historical antisemitism hold a larger fraction of their
wealth in cash.
Several channels, both on the demand side and the supply side, might explain our
baseline results. We therefore exploit our setting further by focusing on our historical
approach. To further disentangle the hypothesis that historical antisemitism relates to
present-day financial decisions from other explanations related to localized economic shocks
during the Nazi period, we build on the fact that the spatial variation in historical
antisemitism within Germany has persisted for centuries since the Middle Ages (Voigtlaender
and Voth, 2012). We test whether deep-rooted measures of historical antisemitism based on
the violence against local Jewish communities during the Black Death of 1349 can predict
the present-day stock market participation of German households similar to antisemitism
during the Nazi period. Indeed, households in counties that persecuted the local Jewish
communities more as far back as in the Middle Ages are less likely to invest in stocks today,
and the mere presence of Jews in a county in the distant past does not explain the effect.
To assess the remaining concerns that unobservable dimensions not captured by our
controls and robustness tests drive both historical antisemitism and present-day financial
development, we exploit a historical natural experiment (D’Acunto, 2016). We instrument
the probability that a county engaged in Jewish persecution in the past with its distant
from the Rhine Valley, which captures the paths of forced migrations of the first Ashkenazi
communities because of the Crusades. This test confirms our baseline results.
In the last part of the paper, we study a set of potential supply- and demand-side
channels that might have transmitted the effect of historical antisemitism to present-day
financial development.
On the supply side, we note that all German counties have faced the same financial-
sector regulation since the 19th century,2 but locally-run independent financial institutions
are still an important pillar of the German banking system. Historical antisemitism might
have triggered the establishment of local banks of different quality and efficiency across
counties. We find the present-day supply of finance and the present-day efficiency of the
local banking sector do not vary systematically with historical antisemitism. We therefore
2Eastern German counties during the Cold War are an obvious exception, but the shock of facing acommunist economic system is exogenous to the spatial variation of historical anti-Jewish sentiment.
3

conclude that the present-day local supply of financial services cannot fully explain our
results.
Alternatively, economic antisemitism might have worsened the historical local supply
and efficiency of financial services. Even if these differences in supply had disappeared over
time, present-day households might still be less accustomed to accessing financial services
in counties with higher historical antisemitism. We collect data on the supply of financial
services in the past, which we can measure at the county level in the 19th century, and we
do not find evidence that this channel is relevant to our results.
On the demand side, we first test whether present-day households that are antisemitic
might still associate financial services with Jews, and thus invest less in stocks and demand
fewer financial services. We test this channel using data on present-day antisemitism at
the county level. We find that present-day antisemitism and stock market participation
are negatively associated, as predicted by the long-term persistence of local antisemitism
(Voigtlaender and Voth, 2013). At the same time, however, we find no association between
present-day antisemitism and stock market participation after controlling for historical
antisemitism. Our measures of historical antisemitism are arguably subject to higher
measurement error than the measures of present-day antisemitism, and hence this test
should bias us towards detecting an effect of present-day antisemitism on top of historical
antisemitism even if such an autonomous effect did not exist. Thus, the results suggest
the variation in antisemitism produced in the last decades has no role in explaining the
present-day demand for finance.
Apart from present-day antisemitism, historical anti-Jewish sentiment might correlate
with other retrograde beliefs such as xenophobia, racism, or distrust of the unfamiliar, which
we label collectively “backwardness.” Using county-level data on present-day xenophobic
beliefs, we propose a set of tests that suggest our results are not consistent with these
alternative demand-side channels.
Motivated by Gennaioli, Shleifer, and Vishny (2015), we move on to test for the
possibility that a persistent cultural norm of distrust in finance, transmitted across
generations, has developed more in counties in which historical antisemitism was stronger.
Past households in counties with higher antisemitism might have developed a negative
sentiment toward the economic activity in which Jews specialized, namely, financial
services. This sentiment might have persisted to the present day even if its underlying
determinants–specifically, the discrimination against Jews and the association of Jews with
financial services–have faded.
We use novel survey data on a representative sample of 1,000 present-day Germans
4

to elicit their distrust in finance.3 The survey also elicits measures of risk tolerance and
generalized trust at the individual level, both of which are strong determinants of stock
market participation (Guiso et al. (2009)). Indeed, present-day distrust in finance is higher
for respondents in counties with higher historical antisemitism, even after controlling for
their risk tolerance and average generalized trust. Consistent with a relevant role of this
channel in explaining our results, households that distrust finance more also report they
invest less in stocks and bonds.
Several theoretical channels, which we discuss in more detail in section 7, are consistent
with our results and interpretation. Overall, our findings suggest historical antisemitism in
the form of economic antisemitism (Reuveni and Wobick-Segev, 2011) might have started a
norm of distrust in finance, which has transmitted across generations and manifests itself in
lower present-day demand for finance.
A Related Literature
This paper builds on several strands of literature. First, we build on the literature that
studies the non-institutional determinants of the spatial variation of economic development.
Banfield (1958) and Putnam (1993), who emphasize the importance of demand-side factors,
such as social capital and generalized trust, in explaining persistent localized differences
in development. Guiso et al. (2004b) and Algan and Cahuc (2010) investigate these
determinants of present-day financial development and economic growth. Gennaioli et al.
(2013) use data from 110 countries covering 97% of the world GDP to show human capital is
crucial in accounting for regional differences in development. This literature has introduced
measures of present-day social capital and trust, and has documented the robust association
between these dimensions and financial development. Our contribution to this literature
is to propose a determinant of local demand-side characteristics that is not prone to the
concern of reverse causality because of its deep-rooted nature.
Second, we build on recent research documenting the long-run persistence of
discrimination due to historical inter-ethnic tensions. Voigtlaender and Voth (2012) and
Voigtlaender and Voth (2013) show that localized historical anti-Jewish sentiment persisted
for centuries and can still be detected today. Anderson, Johnson, and Koyama (2017) show
that low agricultural yield explains the time-series and spatial variation of pogroms against
Jews across Europe from 1100 to 1800. Grosfeld, Sakalli, and Zhuravskaya (2017) argue
economic specialization combined with negative shocks was crucial to the emergence of
pogroms against Jews. Becker and Pascali (2017) argue the Protestant Reformation led
3We thank Stefano DellaVigna and Noam Yuchtman for inspiring this test.
5

to the entry of non-Jews in moneylending, which reduced the incentives to persecute Jews.
Previous work shows persistent anti-minority sentiment due to historical inter-ethnic
tensions might be rooted in the historical economic specialization of ethnic groups. Jha
(2014) shows that areas in Gujarat that enjoyed inter-ethnic economic complementarity
in the past were less likely to engage in ethnic violence in 2002. Grosfeld et al. (2013)
show a positive effect of the Pale of Settlement–a region of present-day Ukraine in which
Jews were confined–on post-Soviet electoral support for left-wing parties and on generalized
trust. Our results cannot reflect the generic anti-market beliefs studied by Grosfeld et al.
(2013). In untabulated results, we find no effect of historical antisemitism on the electoral
support for left-wing parties of present-day Germans. Moreover, Grosfeld et al. (2013) find
a positive association between generic anti-market beliefs and generalized trust. Generalized
trust increases households’ likelihood of demanding financial services (Guiso et al., 2009).
Hence, if the anti-market beliefs proposed by Grosfeld et al. (2013) explained our results,
we should detect a positive effect of historical anti-Jewish sentiment on households’ demand
for financial services, which is the opposite of what we find. We see our demand-side results
as complementary to recent work on the supply-side effects of Jewish persecution (e.g.,
Acemoglu, Hassan, and Robinson (2011), Waldinger (2010), Akbulut-Yuksel and Yuksel
(2015)).
An additional contribution of our paper is to bring together the two lines of research
described above. The first literature has focused mainly on documenting the role of present-
day determinants in explaining present-day regional differences. The second literature has
focused mainly on establishing the long-run persistence of political and sociological beliefs.
Our paper builds on both approaches to study the deep-rooted determinants of present-day
variation in economic outcomes and the channels through which these determinants affect
present-day economic outcomes. This step is relevant also as a basis for informing policy
makers about the demand- and supply-side dimensions on which they might intervene to
modify households’ economic behavior.
The paper also relates to the body of research that uses historical natural experiments
to understand present-day outcomes, surveyed by Spolaore and Wacziarg (2013) and
Nunn (2014). For the case of financial outcomes, D’Acunto (2016) labels this nascent
approach “History & Finance.” Recent contributions include Pascali (2016), who shows
Jewish-managed banking in Southern Italy triggered the establishment of competing
Christian financial institutions, whose influence on financial development is detectable today.
Pierce and Snyder (2017) find that firms in African countries with higher historical extraction
of slaves face lower access to formal and informal credit, whereas D’Acunto (2017) shows
6

that spatial variation in basic education has persisted for centuries, and helps explain the
present-day regional differences in income and innovation across European regions.
Finally, we contribute to the literature on the stock-market-participation puzzle–the
fact that many households do not actively invest in stocks despite the high expected
returns in the stock market. Other explanations include background risk (Paxson (1990),
Guiso, Jappelli, and Terlizzese (1996)), social interactions (Hong, Kubic, and Stein (2004)),
awareness (Guiso and Jappelli (2005)), generalized trust (Guiso et al. (2009)), insurance
motives (Gormley, Liu, and Zhou (2010)), financial literacy (van Rooij et al. (2011)),
macroeconomic experiences (Malmendier and Nagel (2011)), labor-income risk (Betermier,
Jansson, Parlour, and Walden (2012)), and corporate scandals (Giannetti and Wang (2016)).
2 Jewish Specialization in Finance and Historical Antisemitism
Our analysis is based on two features of the history of Jewish minorities across Europe since
the Middle Ages. On the one hand, Jews had specialized in the provision of financial services
after the fall of the Roman Empire. The sorting of Jews into the mercantile and financial
sectors started around the eighth century, largely because of their human capital and their
tradition in contract enforcement (Botticini and Eckstein (2012)).
Bans on lending money at interest for Christians and Muslims may have contributed
to crystallizing this sorting. Pope Leo IX banned Christians from lending money at interest
as far back as 1049, and Gratian formalized the ban in the Corpus Iuris Canonici in 1150.
The human capital Jews had accumulated since the second century facilitated their sorting
into trade and finance well before 1049. At the same time, an important push for the
specialization of Jews in financial services and trade came also from the contemporaneous
bans on owning land Jewish communities faced, which were common all over Europe during
the Middle Ages (e.g., see Roth (1938) and Roth (1960)).
Financial activities run by Christians, such as the Medici family in Italy or the Fuggers
family in the German lands, were active since the 15th century. In the German lands, the
oldest non-Jewish full-service bank, called Berenberg Bank, was founded in 1590. Despite
these cases, the Catholic Church maintained a formal ban on usury for centuries. For
instance, Pope Benedict XIV condemned firmly the sin of usury in his encyclical letter
“Vix Perveni” of 1745. At the same time, the specialization of Jews in finance persisted
even after the elimination of the ban on moneylending for all Christian denominations. For
instance, in 1882, 3% of German workers were Jewish, but 23% of the overall financial sector
workforce, and more than 85% of the brokers in the Berlin stock exchange, were Jewish (see
7

Glagau (1876) and Fritsch (1892)).45 The drop in Jewish specialization in financial services
was mainly driven by the diffusion of local private credit unions such as the Raiffeisenbanken
and the Volksbanken, as well as the saving-bank system known as Sparkassen, which were
owned and run by local governments. Both types of banks diffused swiftly throughout the
German lands in the 19th century and the beginning of the 20th century.
Localized inter-ethnic tensions and outright violence against Jews also accompanied
European Jewish communities since the Middle Ages. On top of religious antisemitism, the
Jewish specialization in trading and finance led to the emergence of “economic antisemitism,”
that is, a set of negative stereotypes related to the role of Jews in the economy (Reuveni and
Wobick-Segev, 2011).
To date, the historiography of economic antisemitism is still debating the relationship
between economic antisemitism and the discrimination and persecution of Jewish commu-
nities over the centuries. In particular, the debate is still open on whether violence against
religious minorities existed beyond the minorities’ occupational specializations, or whether
hatred toward specific occupations led to the persecution of ethnic minorities that specialized
in those occupations. Penslar (2001) argues the distrust of trade and the mercantile
economy has roots in ancient Greece and Rome, and translated into distrust of Jews once
Jewish communities sorted into running financial services. In sociology, Bonacich (1972),
Bonacich (1973), and Horowitz (1985) propose a theory of ethnic tensions deriving from
the specialization of ethnicities in different economic occupations. Ethnicities specializing in
middlemen activities are especially prone to being subject to inter-ethnic violence.
Other historians argue the motivations for Jewish persecutions in Europe were at
first mainly cultural, political, and religious (e.g., see Flannery (1985)). This position is
based on the observation that the first recorded acts of violence against Jews, such as the
Alexandria pogrom in 38 CE, happened when Jews had not yet sorted into the mercantile
and financial sectors (Barclay (1996)). Historians who support the non-economic roots of the
early instances of persecution against Jewish minorities argue that the hatred against Jews
as economic exploiters of the Christian majority appeared at a later stage (e.g., Poliakov
(1975) and Perry and Schweitzer (2002)).
4Table A.6 of the Online Appendix reports the share of Jewish workers across sectors in 1882 Germany.5Gross (1975) argues that Jewish brokers started the Berlin stock exchange and enjoyed a monopoly on
brokerage activities, to the extent that the few non-Jewish brokers would not work on Saturdays, becauseof the lack of traders, even though the market was open.
8

3 Data
Our tests require that we define proxies for local historical antisemitism across German
counties, and that we assess the association between historical antisemitism and the
likelihood that present-day households access financial services.
A Measures of Historical Antisemitism
We propose three proxies for historical antisemitism. The first and main proxy is the
first principal component of six measures of anti-Jewish violence in Voigtlaender and Voth
(2012). The measures cover several types of acts of violence perpetrated against local
Jewish communities in Germany in the 1920s and 1930s, which includes the Nazi period.
The variables that enter the Voigtlaender-Voth principal component (VV P.C.; Historical
Antisemitism) are as follows: (i) the number of documented pogroms, that is, recorded acts of
physical violence, against Jewish communities in the 1920s based on the information in Alicke
(2008); (ii) the share of votes for the far-right and strongly antisemitic Deutschvolkische
Freiheitspartei (DVFP) in 1924, which obtained a large share of the then-banned Nazi Party
(NSDAP), based on the election data in Falter and Hanisch (1988); (iii) the share of votes
for the NSDAP in 1928, which is also based on the data in Falter and Hanisch (1988); (iv)
the logarithm of the number of “letters to the editor” published by the Nazi newspaper Der
Sturmer from 1935 to 1938; (v) the share of Jews deported in 1933; and (vi) a dummy
variable that equals 1 if a synagogue was destroyed or damaged in the 1920s and 1930s in
the location. We consider the authors’ extended sample of cities, which include all cities
with Jewish communities during the Weimar Republic. The only difference between the
original version of the VV P.C. and the one we use in this paper is the level of aggregation
of the information. Voigtlaender and Voth (2012) compute their variables at the city level,
which we cannot do in this paper, because the finest geographic partition for which we
observe financial data of present-day households is county (Kreis). We therefore compute the
principal component by aggregating the city-level variables at the county level. Aggregation
consists of summing up the count variables (number of pogroms in the 1920s and number
of letters to Sturmer), averaging the share variables (share of DVFP votes in 1924, share of
NSDAP votes in 1928, and share of Jews deported in 1933), and defining a dummy variable
equal to 1 if a synagogue was destroyed or damaged in the 1920s and 1930s in any city within
a county.
We also propose two additional proxies for our analysis that aim to capture localized
and deep-rooted historical antisemitism at the time when Jews still had the monopoly on
9

the provision of financial services. One proxy, Pogrom 1349 (Medieval Antisemitism), is also
based on observed violence against Jewish communities. It is a dummy that equals 1 if any
town in the county experienced at least one anti-Jewish pogrom during the years of the Black
Death around 1349. The Black Death was arguably the worst pandemic in human history,
and up to one half of the European population at the time may have died. Unsubstantiated
theories on the origins of the pandemic diffused all over Europe. Accusations against Jews
were common and led to persecution, especially in the German lands. Voigtlaender and Voth
(2012) find the incidence of pogroms during the Black Death period predict the extent of
Jewish persecution during the 1920s and 1930s at the town level. Similar to the principal-
component measure, the level of resolution of our financial data dictates that we depart from
the city-level analysis.
Our third proxy for historical antisemitism is the mere presence of a Jewish community
in each county at any point in time before 1300. This measure aims to capture the possibility
that historical antisemitism arose in counties even if it did not necessarily express itself
through pogroms or major acts of violence against Jews. This measure also allows us to
assess separately the effects of exposure to Jews before the Black Death period and the
actual explosion of anti-Jewish tensions at the time of the Black Death.
The two medieval proxies allow us to track the origin of historical persecution, but the
variation in these dummy variables is rather coarse. At the same time, the proxy from the
Nazi period allows for a more granular variation across counties and occurs at a time when
the association of Jews with the stock market, our main outcome variable, was strongest.
For alternative sources of variation in anti-Jewish sentiment during the Nazi period, see the
discussion in section 1 of the Online Appendix.
B Other Data Sources
To run the tests in this paper, we collect data from 13 additional sources.
The characteristics of German households are from the Socio-Economic Panel (SOEP)
run by the Deutches Institut fur Wirtschaftsforschung Berlin (DIW). The SOEP has
conducted interviews on a yearly basis since 1984. For each wave, the SOEP includes
households that have been interviewed in previous waves, as well as new households. Because
we are interested in the cross-sectional association between historical antisemitism and
financial development, we only include non-repeated observations when running the main
analysis. A drawback of the SOEP data is that they do not provide the complete financial
portfolios of households; hence, we cannot document how anti-Jewish sentiment affects every
component of households’ financial portfolios. Moreover, the SOEP data set does not include
10

measures of the household head’s risk aversion, financial literacy, or generalized trust, which
the literature on stock market participation identifies as important determinants for investing
in stocks.
To address these shortcomings of the SOEP data, we show our results are robust to
using the balance sheets of the German households in the 2011 wave of the Panel of Household
Finances (PHF) run by the Deutsche Bundesbank. We can match the PHF sample with
the historical data for 1,256 households across 99 counties, and hence this data set is too
small to be our main working sample. But in the PHF data, we can control directly for
households’ wealth, as well as the elicited risk aversion, financial literacy, and generalized
trust of household heads. To test for the effects of historical antisemitism on present-day
bank deposits, we collect information on German banks’ balance sheets from Bankscope.
We obtain county-level historical characteristics from the Ifo Prussian Economic
History Database, described in detail by Becker, Cinnirella, Hornung, and Woessmann
(2014). We also collect a set of present-day county-level controls: socio-demographics
from DeStatis ; the index of land quality from Ramankutty, Foley, Norman, and McSweeney
(2002); and the coordinates of the centroid of each county from Eurostat, which we use to
measure the Euclidean distance of each county from the Rhine Valley in our distance-based
three-stage least-squares test we describe below. We construct a placebo test on the
association between the distance from the Rhine Valley and stock market participation for
French households to the West of the Rhine, using the micro data underlying the 2014
Enquete Patrimoine run by the Banque de France, which provides geo-coded information on
the investment decisions of a representative set of present-day French households.
To assess the association between present-day antisemitism and financial development,
we use data on present-day antisemitism at the county level from the German Social Survey
(ALLBUS ), which gathered information on Germans’ attitudes toward Jews in 1996 and
2006. The data are described in detail in Voigtlaender and Voth (2013). We also use the
ALLBUS data on present-day xenophobic attitudes to differentiate the role of antisemitism
from generic xenophobia. To use these data, we arranged a special agreement between
ALLBUS and DIW to merge these two proprietary data sources. Moreover, we use the
micro data underlying the World Value Survey ’s 2006 wave, in which households were asked
about the importance of religion for their life, and other questions related to religiosity. This
survey allows us to create regional-level measures of the importance of religion to present-day
households irrespective of their creed or denomination.
In the analysis of the channels that transmitted the long-run association between
localized historical antisemitism and financial decisions, we also introduce three sources of
11

data that are in large part new to research in economics: (i) data on the market structure,
competition, and efficiency in German banking at the county level from the German Council
of Economic Experts6–an advisory institution to the German administration similar to the
US Council of Economic Advisers (see Koetter (2013)); (ii) data on the foundation dates
of German’s Volksbanken and Raiffeisenbanken from the Hoppenstedt database, which allow
us to construct the spatial-diffusion pattern of credit unions across the German lands in
the second half of the 19th century; and (iii) our own survey aimed at eliciting present-day
German households’ distrust in financial services. We ran the survey through the company
Clickworker because we are not aware of any data on a representative set of German
households regarding their trust in financial services. We describe the survey design and
characteristics in more detail in section 7. These data include elicitation of several types of
financial beliefs and attitudes, and are publicly available to any authors interested in their
use.
C Summary Statistics
The full sample of non-repeated households in the SOEP county-level data set includes 29,680
observations. The county of residence is not available for 2,655 households. Moreover, we are
missing the county-level historical information for 9,207 households. The remaining missing
observations are due to refusal to answer demographic questions, such as the income or age
of the household head.
We report the basic summary statistics for the variables in the main analysis in Table 1.
The top panel of Table 1 describes the measures of historical antisemitism at the county level.
We observe the emergence of pogroms during the Black Death and a county’s exposure to
Jewish communities before 1300 in 307 counties, whereas we can compute the VV P.C. of
Jewish persecution for 298 counties. During the Black Death period, 54% of counties faced
a pogrom against the local Jewish community, whereas 92% of the counties were exposed
to local Jewish presence at least once before 1300. In the regression analysis, we assign the
county-level value of each variables to all SOEP households residing in the county.
The middle panel of Table 1 reports the other observables measured at the county
level, whereas the bottom panel describes household-level variables. The average fraction
of households owning stocks between 1984 and 2011 is 16%. The average age of the person
who makes financial decisions is 49 years. Thirty-nine percent of responding households are
homeowners, and the average self-reported income is 31,355 euros. The SOEP survey does
6The original label of this institution is Sachverstandigenrat zur Begutachtung der gesamtwirtschaftlichenEntwicklung, which is also referred to as the five wise men of the German economy (FunfWirstchaftensweisen).
12

not ask households for an estimate of their overall wealth. We use income and homeownership
to proxy for wealth. About 77% of responding households have a high school degree or higher
levels of education. Moreover, about 13% of the households we observe reside in Eastern
Germany.7
Figure 2 depicts the properties of historical antisemitism and present-day stock market
participation at the county level. To allow easier interpretation of the magnitudes and
variation of historical antisemitism in the cross-section of counties, we consider the ratio of
the local Jewish population as of 1933 that was deported during the Nazi period as a proxy
for historical antisemitism. Panels (a) and (b) of Figure 2 show the spatial distribution
of the share of the deported Jewish population during the Nazi period and of the average
ratio of households that own stocks from 1984 to 2011. In both maps, the darker the
county, the higher the value of the variable. The data are not available for blank counties.
Relative deportations of Jews during the Nazi period were higher in western counties. Stock
market participation is higher in the south and in the north. As expected, participation is
systematically lower in Eastern Germany. Panels (c) and (d) of Figure 2 plot the densities
of the ratio of deported Jews, which obtains over the full range of [0,100], and present-day
stock market participation, both measured at the county level. Panel (e) plots the correlation
between the ratio of deported Jews and the average ratio of households that own stocks from
1984 to 2011, which is negative (-0.13, p-value=0.03). Note Panel (e) corresponds to the
figure we reported in the Introduction, but we replace the VV P.C. of Jewish persecution
with the ratio of Jews deported during the Nazi period. Panel (f) of Figure 2 shows the
average participation across counties with and without pogroms during the Black Death.
Participation is higher in counties with no pogroms, but a t-test for the difference between
the two means does not reject the null that the means are equal. We find the negative,
although statistically insignificant, association between experiencing a pogrom around 1349
and present-day stock participation encouraging. Of course, the non-significant difference in
stock market participation in the raw data might reflect substantial variation in important
determinants of participation across counties, such as income, age, or education, which is
why we can only assess the precision of this negative association by running a multivariate
analysis that keeps constant other determinants of participation across counties.
The Online Appendix describes additional characteristics of the raw data. Figure
A.1 shows the spatial distribution of pogroms against Jews during the Black Death. In
Figure A.2, we plot the correlations between stockholdings and additional proxies for
historical antisemitism in the raw data, all of which are negative.
7Note that we only observe information for Eastern-German households starting in 1991.
13

4 Historical Antisemitism and Stock Market Participation
In the baseline analysis, we estimate the association between historical antisemitism
measured at the county level and stock market participation by German households from
1984 to 2011. The following is our most general specification:
Pr(HoldsStocksikt|Xikt,Kk) = Φ(α+βHistorical Antisemitismk+X ′iktγ+K ′kδ+Income deciles+ηt+εikt),
(1)
where HoldsStocksikt is a dummy that equals 1 if household i in county k and surveyed in
wave t holds any stocks, and Historical Antisemitismk is one of the proxies for historical
antisemitism we describe in section 3. Xikt includes the following individual-level controls:
gender, single status, age (second-degree polynomial), and dummies for college education,
homeownership, and investment in life insurance. Kk includes the following county-level
current and historical controls: latitude, income per capita, share of college-educated
population, index of quality of cultivable land, log of population in 1933, log of Jewish
population in 1933, share of population employed in the retail sector in 1933, share of
population employed in manufacturing in 1933, and share of Catholic population in 1925.
Income deciles are dummies indicating the decile of the income distribution to which the
household belongs, and Φ is the standard normal cdf.8 ηt are a set of survey-wave group fixed
effects, each capturing a group of four adjacent years.9 We allow for correlation of unknown
form across residuals at the county level, because attributing county-level measures to each
household induces a mechanical correlation of residuals across households in the same county.
Table 2 reports the average marginal effects for our baseline specification. All the
variables are standardized, with the exception of dummy variables. Columns (1)-(2) report
the results for the baseline specification on the full sample. In column (1), we only include
the logarithm of the number of Jews residing in each county in 1933 to scale the persecution
measure by the size of the local Jewish community, and hence the scope for persecution, on
the right-hand side. A one-standard-deviation increase in the VV P.C. (1.02) is associated
with 0.9-percentage-point-lower stock market participation. In column (2), we add the full
set of historical and present-day controls, a dummy that equals 1 for households in Eastern
Germany, and survey-wave group fixed effects. Adding this set of controls increases the size
of the negative association between historical antisemitism and stock market participation
to 1.4 percentage points. Because the average stock market participation rate in our sample
is 16%, this association corresponds to about 9% of the average participation.
8All the results are virtually identical if we include second- or third-degree income polynomials insteadof deciles.
9Results do not change if we make the survey-wave fixed effects coarser or finer.
14

A Robustness
German counties are likely to differ along several dimensions, such as geography, history, and
the quality of current and historical institutions. For these reasons, in the rest of the Table 2,
we assess the robustness of the baseline negative association between historical antisemitism
at the county level and the likelihood that present-day households living in those counties
participate in the stock market today.
We first verify that the baseline results hold when only considering counties in West
Germany. Note that the baseline specifications already include a dummy variable for whether
a county was part of Eastern Germany after the Second World War, but one might still be
concerned about systematic non-linear differences in the effect across the two areas. In
column (3) of Table 2, we find our results do not change if we look only at Western counties.
In our second test, we add the longitude of the counties’ centroids to the baseline
specification as a direct control. This control is motivated by the fact that important
shocks related to counties’ longitude had differential long-run effects on the growth of
German regions. For instance, Acemoglu, Cantoni, Johnson, and Robinson (2011) show
that institutions imposed by the French on German areas closer to the French border after
the French Revolution had a long-run effect on growth through their effect on institutions.
In column (4) of Table 2, we find our results are similar if we include longitude explicitly
as a control in the baseline specification. Note that the shocks that had long-run effects on
growth and were correlated with longitude happened after the Black Death of 1349. Such
shocks then would only be able to explain the results if their geographic dispersion were
highly correlated with the geographic distribution of medieval pogroms.
Finally, in columns (5)-(8) of Table 2, we exclude groups of counties, which perform
worst based on economic indicators in the present day. In column (5), we exclude the bottom
quarter of counties by population density and hence the most rural counties; in column (6),
we exclude the top quarter of counties by income inequality; in column (7), we exclude the
bottom quarter of counties by average income and hence the poorest counties; and in column
(8), we exclude the bottom quarter of counties by share of college-educated inhabitants and
hence the least educated counties. Across all subsamples, we do not detect substantial
differences compared to our baseline results.
We propose additional robustness tests in Table A.1 and Table A.2 of the Online
Appendix, and confirm the negative association between historical antisemitism and present-
day stock market participation is a robust feature of the data.
15

B Alternative Samples and Sources of Variation
The SOEP sample does not allow us to keep constant dimensions that previous research
has shown to be important determinants of financial decision-making. Prior research shows
financial literacy (van Rooij et al., 2011), risk aversion (Samuelson, 1969), and household
wealth are first-order determinants of stock market participation. Moreover, an important
determinant of historical antisemitism could be households’ religiosity, which might have
also persisted over time irrespective of households’ religious denomination, and hence might
confound our interpretation of the baseline results.
To assess the extent to which any of these dimensions might explain our results, we
replicate the cross-sectional analysis on the German households in the 2011 wave of the
Panel of Household Finances (PHF). The size of the PHF sample is more than one order
of magnitude lower than the SOEP sample, and we can only exploit the variation in Jewish
persecution across 99 German counties for which we have both historical data on persecution
and PHF observations. For these reasons, we cannot use the PHF sample as the main
sample in our analysis, but we believe it provides a useful alternative data set to assess the
robustness of our baseline results. The PHF questionnaire asks households to provide an
estimate of their overall wealth. It also elicits households’ financial literacy and risk aversion
using qualitative scales, as well as the frequency with which respondents attend religious
functions, irrespective of their religious denomination.
All the results based on the PHF sample are reported in Table A.3 in the Online
Appendix. In column (1) of Table A.3, we replicate our baseline results by estimating the
specification in equation (1) and augmenting the right-hand side with direct measures of
financial literacy, risk tolerance, and the religiosity of the respondent, as well as a full set
of dummies for wealth deciles. As expected, the measures of risk tolerance and financial
literacy are positively associated with the likelihood of holding stocks, on top of the effect of
being male and holding a college degree. We estimate a larger negative association between
historical antisemitism and the likelihood that respondents hold stocks in the PHF sample
than in the SOEP sample, even after controlling for additional important determinants
of stock market participation. One-standard-deviation-higher historical antisemitism in the
county decreases the likelihood that the household owns stocks by 7 percentage points, which
is about 24% of the average likelihood of holding stocks in this sample. The likelihood of
holding stocks in the PHF sample is 29%, which is similar to the likelihood of holding stocks
for the SOEP households in the 2010 wave (28%).
In section 1 of the Online Appendix, we also propose an alternative test to address
the concern that historical persecution against Jews might have been perpetrated due to
16

incentives unrelated to antisemitism. For instance, individuals and political leaders may
have hoped to seize Jewish property if they took part in or promoted the attacks against
Jews, which would have affected historical persecution against Jews as well as the long-run
wealth of local households.
The test exploits political support for the Nazi party as an alternative proxy for
historical antisemitism, because antisemitism was a major pillar of the Nazi party’s ideology
in the late 1920s and early 1930s. But motivations other than antisemitism contributed to
the political support for the Nazi party. In particular, the prolonged economic recession
that hit Germany after 1929 was famously a major determinant of Nazi support. We
therefore conjecture that voting support for the Nazi party should be a more direct proxy
for antisemitism in counties in which unemployment was lower than the national average,
whereas it should be a noisier proxy for antisemitism in counties in which unemployment
was high, and hence motivations other than antisemitism might have increased Nazi votes.
Armed with this interpretation, we estimate the effect of county-level Nazi votes in the
general elections of September 1930 and of 1933 on present-day stock market participation.
Consistent with our conjecture, we find Nazi votes are strongly negatively associated
with present-day stockholdings in counties at the bottom of the distribution by unemploy-
ment, whereas this association stays negative but smaller in size and statistically insignificant
for counties at the top of the distribution by unemployment. The negative association
declines monotonically as the share of a county’s unemployment decreases, as depicted in
Figure A.3 of the Online Appendix. Contrary to Nazi votes, all the other dimensions we
measure at the county level in the early 1930s do not produce the pattern described above,
including the vote shares for non-antisemitic parties (see Figure A.4 and discussion in Section
1 of the Online Appendix).
These results corroborate our baseline analysis by using a different source of variation
and proxy for historical antisemitism than the ones we used above.
5 Historical Antisemitism and Banking: Mortgages and
Deposits
So far, we have focused on the likelihood that German households hold stocks. Focusing on
stock market participation is meaningful, because the defamation of Jews as stock-market
manipulators survived in the press and popular culture even after the Jewish presence in
other financial institutions, such as banking, had faded. The role of Jews in banking services
started to decrease substantially with the foundation of the first Raiffeisenbank in 1843
and the subsequent diffusion of Volksbanken across German counties. Several generations
17

of Germans have accessed banking services run by the non-Jewish population. But if the
historical association between Jews and financial services affects current financial decisions
through channels other than current antisemitism, we would expect also to find an effect of
historical antisemitism on present-day Germans’ access to banking services.
We first look at the decision to get a mortgage to finance homeownership. This decision
allows us to observe whether households increase their debt through bank financing, or if they
use their own savings, keeping constant the likelihood that they are homeowners. For the
case of Germany, looking at this margin is quite relevant: in 2001, 43% of German households
owned their home, but only 20% of households have ever held mortgages; that is, only 47% of
homeowners had financed their homeownership via a mortgage (Georgarakos et al. (2010)).
In Table 3, we find that historical antisemitism is unrelated to households’ decision to buy
their home, but it significantly decreases the likelihood that households hold a mortgage.
In columns (1)-(2), we report the coefficients for estimating two probit specifications whose
outcome variable is a dummy equal to 1 if the household owns any real estate properties. The
effect of antisemitism on the likelihood of homeownership is economically and statistically
insignificant. In columns (3)-(4), we report the coefficients for the same specifications, but
now the outcome variable is a dummy equal to 1 if the household has ever held a mortgage. A
one-standard-deviation increase in historical antisemitism reduces the likelihood of holding
a mortgage by 0.7 percentage points, which is 10% of the average likelihood of holding
mortgages in our sample (6.9%).10 The size and statistical significance of this association
are in line with the effect of antisemitism on present-day stockholdings, which we documented
above.
The second decision that relates households to banking services is their likelihood
of saving through bank deposits. In the SOEP data set, we observe whether households
declare that they regularly save part of their income. Reassuringly, in columns (5)-(6) of
Table 3, we find historical antisemitism is unrelated to the likelihood that the households
in our sample declare they regularly save part of their monthly income. This non-result
suggests households in counties with higher or lower historical antisemitism do not differ
in their wealth or overall saving behavior. Ideally, we would like to observe the share of
households’ savings in bank deposits. Unfortunately, we do not observe this information
in the SOEP sample. Our second source of household-level data, the PHF, does include
information on whether households declare they have a checking/ savings account. We find
that 99.35% of respondents declare they have a checking/ savings account, which does not
provide us with enough variation in this outcome to compare the behavior of households
10The average in our cross section of households observed from 1984 to 2011 is lower than the average forthe cross section of households studied by Georgarakos et al. (2010), which are all observed in 2001.
18

across counties with different levels of historical antisemitism. Because aggregate deposits of
bank customers appear as liabilities in the balance sheets of banks, we can use aggregate data
on the ratio of deposits to total assets for the banks that operate in each county. We obtain
this information from Bankscope, and we regress this ratio on historical antisemitism and the
other observables. This test aims to check the amount of money households deposit in local
banks, keeping constant the size of the local banks’ activities. In columns (7)-(8) of Table 3,
we find that a one-standard-deviation increase in antisemitism reduces the county-level ratio
of deposits over the sum of local bank assets by 1.5 percentage points, which is 2% of the
average ratio of deposits over assets across counties (76%). This result is consistent with
the notion that households in counties with higher historical antisemitism tend to use bank
services less than other households.
For robustness purposes, in Table A.3 of the Online Appendix, we replicate the results
described above in the PHF sample of German households surveyed in 2010. Historical
antisemitism is unrelated to the likelihood that households save a part of their monthly
income regularly, and it is unrelated to the likelihood that the household is a homeowner.
Instead, higher antisemitism is associated with a lower likelihood of holding a mortgage,
even after controlling for wealth and for the elicited risk tolerance, financial literacy, and
religiosity of the household head. In addition, we find historical antisemitism is unrelated to
outcomes that do not require accessing financial services (see columns (6)–(11)). In column
(12) of Table A.3 of the Online Appendix, we also find suggestive evidence that households
in counties with higher historical antisemitism keep a higher fraction of their wealth in
cash form, although this effect is barely statistically significant. Overall, the PHF data
also provide results consistent with the notion that present-day households in counties with
higher historical antisemitism access financial services less than other households.
6 The Deep Roots of Historical Antisemitism
Our measure of historical antisemitism during the Nazi period might raise concerns it
captures spatial variation in economic conditions in the Inter War period, which might have
persisted for decades. To further disentangle the hypothesis that historical antisemitism
relates to present-day financial decisions from other explanations related to localized
economic shocks during the Nazi period, we build on the fact that the spatial variation
in historical antisemitism within Germany has persisted for centuries since the Middle
Ages, and especially since the Black Death of 1349 (Voigtlaender and Voth, 2012). The
Black Death was arguably the worst pandemic in human history, and up to one half of the
European population at the time may have died. Unsubstantiated theories on the origins of
19

the pandemic diffused all over Europe. Accusations against Jews were common and led to
persecution, especially in the German lands. Voigtlaender and Voth (2012) document that
areas of Germany in which more pogroms against the local Jewish communities occurred
during the Black Death of 1349 also displayed higher levels of antisemitism during the Nazi
period.
In this section, we first test whether deep-rooted measures of historical antisemitism
based on the violence against local Jewish communities during the Black Death of 1349
can predict the present-day stock market participation of German households in a similar
manner as antisemitism during the Nazi period. Then, we exploit the deep roots of historical
antisemitism and build on an historical natural experiment – the forced migrations of the
first Ashkenazi Jewish communities through the German Lands after the First Crusade –
to design a strategy that exploits quasi-exogenous variation in the likelihood that German
counties engaged in anti-Jewish violence in the past.
A Medieval Pogroms, Historical Antisemitism, and Stock Market
Participation
We first replicate our baseline analysis by regressing the likelihood that households hold
stocks today on the medieval-persecution proxy: the dummy equals 1 if a pogrom was
documented in the county during the Black Death around 1349 (column (1) of Table 4).
Pogroms in 1349 are associated with a 2-percentage-point-lower stock market participation
by present-day households, which is 12.5% of the average participation rate. Thus, the
association between our proxy for antisemitism in the Middle Ages and present-day stock
market participation is statistically significant and economically large.
In columns (2)-(4) of Table 4, we assess the robustness of this result. First, we find that
controlling for counties’ longitude does not modify the result substantially. Then, we consider
two subsamples of households when excluding areas in which one might believe historical
antisemitism was either particularly high or particularly low in the past. In column (3), we
exclude counties whose cities hosted at least one bishop seat. The rationale for this exclusion
is that in counties with bishop seats, the ban on locals from engaging in moneylending might
have been enforced more strictly than in other counties, and at the same time, a culture of
distrust of moneylending might have been stronger. We find our baseline result is robust
to this exclusion. In column (4), instead, we exclude cities that were part of the Hanseatic
League. Hanseatic towns were more open to commerce and hence potentially more cultural
tolerant than other counties, and at the same time, their trade activities required a large
amount of financing compared to local economic activities in other counties. Even in this
20

case, we find our baseline result is replicated.
In Table A.4 of the Online Appendix, we propose a large set of additional robustness
tests and find that the negative associations between medieval antisemitism and current-day
stock market participation are a robust feature of the data.
An important point to assess is whether our proxies for historical antisemitism are
merely capturing Jewish settlements in the Middle Ages, because unobservables that favored
the settlement of Jewish communities in the past could drive both historical antisemitism
and present-day stockholdings. To address this point, we estimate specifications that include
a dummy that equals 1 if the county was exposed to a Jewish community before the Black
Death. Note the exposure to a Jewish community in the Middle Ages might be interpreted as
a proxy for historical anti-Jewish sentiment by itself, as we discuss in section 3. This dummy
might capture the potential for localized anti-Jewish sentiment that did not necessarily
express itself in pogroms or major acts of violence against Jews. We compute the dummy at
two horizons – exposure before 1300 and exposure just before the Black Death of 1349. In
columns (5)-(6) of Table 4, we find the baseline associations between historical antisemitism
and present-day stock market participation do not change in terms of magnitude or statistical
significance once we add the dummy for exposure to Jewish communities before the Black
Death. Exposure is negatively associated with present-day stock market participation, which
suggests that either historical antisemitism that did not erupt in violence against Jews also
helps explain stock market participation, or that counties with medieval exposure to Jews
became less financially developed in the long run irrespective of antisemitism. In both cases,
controlling directly for exposure to Jews does not change the baseline result that historical
antisemitism is negatively related to present-day financial development.
Because medieval persecution and medieval exposure to Jewish communities aim to
capture the deep roots of persecution, as opposed to unobservables related to the historical
presence of Jews in a county, we would also expect that the baseline results do not change
when using our measure of historical antisemitism during the Nazi period controlling for
medieval exposure to Jewish communities. Indeed, in columns (7)-(8) of Table 4, we replicate
our baseline results on the negative association between historical antisemitism and present-
day stock market participation when controlling directly for the medieval exposure of counties
to Jewish communities.
B Forced Migrations of Ashkenazi Jews and Three-Stage Least Squares
Unobservable characteristics of German counties may have jointly determined Jewish
persecution and long-run financial development. Ideally, we would have assigned anti-Jewish
21

sentiment across similar German counties randomly before the Black Death of 1349, because
the variation of historical antisemitism across counties has persisted since the Middle Ages.
To get close to such an experiment, we look at the forced migrations of Ashkenazi
Jews out of the Rhine Valley after the 11th century. We provide intuition for this strategy
in Figure 3. In the top map of Figure 3, the darker is a county, the earlier is the first
Jewish community documented in the county. Blank counties are those with missing data.
The earliest Jewish presence in the German lands was found in the cities of Trier, along the
Mosel, and Cologne, along the Rhine. Archaeologists date this presence to the ninth century.
Research has found evidence of Jewish communities in the 10th century along the entire Rhine
Valley.11 The Jewish population in other areas of current Germany was sparse before the
11th century (Engelman (1944)). At the onset of the Crusades, Christian knights traveling
from England and France to the Holy Land persecuted Jewish communities. Several towns
on the Rhine expelled Jews, causing a massive Jewish migration toward Eastern, Northern,
and Southern Germany. Evidence of sizable Jewish communities dates back to the late 13th
and 14th centuries in Munich (south) and Berlin (east) (Toch, 2012).12 The bottom maps
of Figure 3 show the location of the cities of Trier, on the Mosel, and Emmerich, on the
northern end of the German Rhine. The age of the first documented Jewish community in
a county increases as one moves toward each of these cities.
We argue the distance of counties from the Rhine Valley determined the existence of
Jewish communities at the time of medieval persecutions. In a first step, we use the distance
of a county from the Rhine Valley to predict the probability that a Jewish community
existed in the county before the Black Death. In a second step, we use the existence to
predict the extent of Jewish persecution. The rationale is as follows: in counties with no
Jewish communities before the Black Death, violence against Jews cannot have emerged,
because no targets for such violence existed. In counties where early Jewish communities
existed, the probability of an historical pogrom against the local Jews is strictly positive ex
ante, because of the mere presence of Jews.13 In a third step, we use the persecution to
predict present-day stock market participation.
Note this source of variation does not capture the different attitudes toward Jewish
persecution across the counties that hosted Jewish communities, but only the variation in
the likelihood of persecution between the counties that hosted a community and those that
11We refer to Toch (2012) as a comprehensive economic history of European Jews in the Middle Ages.12Only in the 15
thcentury did Ashkenazi Jews merge with the communities of Khazar origin who had
moved from the Black Sea to current Poland. See van Straten (2004) for archaeological evidence and Elhaik(2013) for genetic-based evidence.
13Of course, we will not necessarily observe a positive realization, that is, a pogrom in all of these countiesex post.
22

did not. Both margins of variation in persecution are relevant to the effects we document.
For this test, we consider five measures of the distance of a county from the Rhine
Valley. They are the Euclidean distances of a county’s centroid from five large cities that
lie at different longitudes on the Rhine and Mosel rivers, namely, Mainz, Worms, Speyer,
Trier, and Emmerich, on the northern end of the German Rhine. The shortest distance
is about 2 km, whereas the greatest distance is 1100 km. The alternative measures aim
to capture alternative gradients of the distance from the Rhine Valley, ranging from the
southwest/northeast gradient and the northwest/southeast gradient. Across all gradients,
the likelihood that a Jewish community existed in the Middle Ages increases toward the
Rhine Valley.
If we wanted to interpret this strategy as a causal test for the effect of Jewish
persecution on present-day financial development, we should assume a demanding exclusion
restriction. The distance of a county from the Rhine Valley should not affect current stock
market participation through channels different from the county-level historical persecution
against Jewish communities. Moreover, Jewish communities escaping from the Rhine Valley
should have been equally likely to settle in any counties at the same distance from the Rhine
Valley. Note if the latter condition did not hold, we would expect, if anything, that Jewish
communities were more likely to settle in counties with higher demand for financial services;
hence, the selection would bias our reduced-form coefficients downward.
We propose two tests to assess the extent to which this exclusion restriction may be
economically plausible. First, in Panel A of Table 5, we estimate the reduced-form effect
of the distances from the Rhine Valley on the ratio of households that own stocks when
the distance, instead of historical antisemitism, enters as a regressor, and when both the
distance and the VV P.C. enter jointly. All the coefficients refer to OLS regressions. In odd
columns, all five distances are positively associated with the likelihood that households hold
stocks. Once the VV P.C. enters the reduced-form specifications, the estimated autonomous
associations between the distances and stockholdings drop in magnitude, whereas the
estimated standard errors attached to coefficients barely change. This result suggests the
distance from the Rhine Valley is unlikely to capture unobserved determinants of present-day
stockholdings, which are not already captured by historical antisemitism.
Second, in Panel B of Table 5, we look at the effect of the distance on the likelihood that
French households own stocks. If the distance from the Rhine captures anything peculiar to
the spatial diffusion of development or wealth, we should observe an effect of the distance on
the stockholdings by French households to the west of the Rhine. Instead, if distance captures
Jewish persecution, we should find no effect of distance on the stockholdings of French
23

households, because Jews did not escape to France, where Crusaders were already persecuting
local Jewish communities. Across all our measures, we find no economically or statistically
significant association between the distance from the Rhine and the stockholdings of French
households.
To implement the three-stage strategy, we estimate the following linear system by OLS
(see Becker and Woessmann (2009)):
Community 1349ik = α + β × Log Distance Rhineik +K ′ik × δ + εik
Historical Antisemitismik = α + β × Community 1349ik +K ′ik × δ + εik
Stockholdik = α + β × Historical Antisemitismk +X ′ik × δ + εik,
where Community1349ik and Persecutionik are the predicted values for county k when
estimating the system of three simultaneous equations.
Panel A of Table 6 reports the results for estimating the first stage of the system, that
is, the association between each measure of distance from the Rhine Valley and the likelihood
that a Jewish community existed in the county in 1349, the time of the Black Death. Panel
B reports the results for estimating the second stage of the system, whereas Panel C refers
to the third stage.
In Panel A, the farther a German county is from the Rhine, the less likely a Jewish
community is to have existed there in 1349. A one-standard-deviation increase in any of the
distance measures is associated with a 13- (Trier) to 23-percentage-point (Worms) drop in
the likelihood a community existed in 1349. In Panel B, the instrumented likelihood of a
Jewish community in a county in 1349 increases the VV P.C. of historical Jewish persecution
across all measures of distance. In Panel C, consistent with the baseline results, an increase
in the instrumented persecution of Jews significantly reduces stock market participation
when using any of the measures of distance from the Rhine Valley.
In Table 6, the measure of historical antisemitism we use is the Voigtlaender-Voth
principal component of Jewish persecution during the 1920s and 1930s, because this
component is the baseline measure we proposed throughout the analysis. In Table A.5 of
the Online Appendix, we run the same three-stage least-squares analysis using the measure
of medieval antisemitism in the second stage, and we show all the results are similar.
24

7 Channels Mediating the Effect of Historical Antisemitism on
Financial Decisions
Several supply- and demand-side channels could explain the relationship between historical
antisemitism, Jewish specialization in finance, and present-day financial development. After
describing briefly the channels we consider, we proceed to assess their potential role in
explaining our results.
On the supply side, historical persecution of local Jewish communities paired with the
Jewish economic specialization in the financial sector could have represented a negative
shock to the local availability and/or quality of local financial services. This negative
shock could reflect on the quality and efficiency of present-day local financial services, as
long as the segmentation across local financial markets has not completely disappeared
over time. The negative shock could have persisted if, for instance, lower-quality local
financial institutions replaced Jewish-run financial institutions in areas in which the Jewish
population was persecuted more in the past.14 In this section, we use two sources of
data to assess the possibility that this channel explains our results, namely, data on the
efficiency of the present-day German banking sector at the county level from the German
Council of Economic Experts and data on the foundation dates of German Volksbanken and
Raiffeisenbanken from the Hoppenstedt database, which allows us to construct the spatial
pattern of diffusion of credit unions across the German lands in the second half of the 19th
century.
On the demand side, any potential channel that might partially explain our findings
requires that historical antisemitism reduces households’ present-day demand for financial
services at the local level. Voigtlaender and Voth (2015) show that present-day antisemitic
beliefs across Germany are positively correlated with historical antisemitism. This fact
suggests three potential demand-side channels for our results. First, historical antisemitism
might capture present-day households’ “backwardness,” that is, a set of cultural cues and
beliefs that promote distrust of the unfamiliar, including but not limited to stocks and
financial services. Second, present-day households that are antisemitic may still associate
financial services with Jews based on the historical economic specialization of Jews in finance,
and thus invest less in stocks and demand fewer financial services. Third, the combination of
historical antisemitism with the Jewish specialization in financial services in the past might
have produced a local cultural norm of distrust in finance. This norm might have persisted
14Note that this potential channel would be the opposite of the channel documented by Pascali (2016).In Pascali (2016), the areas of Southern Italy from which Jews were expelled had seen the development ofcompeting Christian financial institutions that explain the higher quality of the banking sector in those areastoday, compared to areas that had never hosted Jews.
25

over time alongside antisemitism, and hence might still affect the financial decision-making
of present-day households–even those current-day households that are not antisemitic. In
this section, we use two sources of data to address the possibility that one or more of these
channels help explain our results: (i) confidential data on present-day antisemitism as well
as other forms of xenophobia and racist beliefs from ALLBUS, which we were able to merge
with the confidential information in SOEP for the first time; and (ii) a survey of present-day
German households in which we elicited households’ trust in banks and the stock market, in
addition to several other sets of beliefs and attitudes.
A Supply-Side Channels
To assess the possibility that historical antisemitism paired with the Jewish specialization
in finance is associated with the quality of the present-day supply side of financial services
across German counties, we start with testing whether historical antisemitism correlates
negatively with the present-day efficiency of the local banking sector.
To this aim, we obtained data on the efficiency of the present-day German banking
sector at the county level from the German Council of Economic Experts. The data include a
wealth of measures of efficiency of present-day local banking systems, each of which captures
a different aspect of efficiency and competitiveness. The data cover measures of (i) cost
efficiency, (ii) price efficiency, and (iii) Lerner indices, defined as the difference between
average revenues and marginal cost of the bank scaled by average revenues. Higher values
of the Lerner index indicate higher market power for the banks in the county, because in a
perfectly competitive market, average revenues equal marginal cost. Koetter (2013) describes
the calculation of these measures in detail. For each measure, the data include a bank-level
fixed-effect-panel stochastic frontier version (FEM), a latent-class stochastic frontier model
version (LCM), and a cross-sectional stochastic frontier version (CSSF).
Table 7 reports the results of this analysis. We run a set of county-level regressions,
whose right-hand side includes the same county-level controls as in equation (1). The measure
of historical antisemitism is the VV P.C. of Jewish persecution. In each column of Table 7,
the outcome variable is the measure of efficiency of the local banking system indicated at
the top. Across the board, we fail to detect any systematic association between historical
antisemitism and the present-day efficiency of the local banking sector, irrespective of the
measure of efficiency we consider. The coefficients we estimate are neither economically
nor statistically different from zero, and the sign of the point estimates changes across
specifications. We interpret these results as direct evidence that historical antisemitism is
not related to the present-day efficiency of the the local German banking sector.
26

These non-results are inconsistent with a long-run effect of Jewish persecution on
the present-day supply of finance, although they might be consistent with a decrease in
the supply side of finance in the past, alongside the decrease in the demand for finance.
Whereas the county-level segmentation of financial services may have faded over time due
to financial integration of German regions, the demand for financial services may not have
changed. In particular, since 1843, credit unions (Volks- and Raiffeisenbanken) have diffused
across Germany. They did and still do specialize in financing local businesses and collecting
households’ savings. If credit unions diffused early into more antisemitic areas, current
households in those areas might be less aware of the opportunity to invest in stocks.
To assess this hypothesis, we collected data on the foundation dates of credit unions
across German counties from the proprietary registry of the Hoppenstedt Firmendatenbank.15
Panel (a) of Figure A.5 of the Online Appendix shows the diffusion path of credit unions
across Germany. In Panel (b) of Figure A.5 of the Online Appendix, we plot the year the
first credit union is documented in a county against the ratio of deported Jews over the 1933
Jewish population at the county level. The two dimensions are not negatively correlated, so
credit unions did not diffuse earlier in the more antisemitic counties.
A third potential supply-side channel concerns the skill structure of counties.
Persecution may have reduced local financial services because a large share of finance workers
were Jewish. If the depletion of human capital needed to run financial institutions drove our
baseline effect, the effect should be larger in counties with a higher ratio of Jewish workers in
finance in the past. We find no systematic association between the ratio of Jews in finance as
of 1882 or 1933 and present-day stockholdings (see Panel (a) and Panel (b) of Figure A.6 of
the Online Appendix). In untabulated results, we estimate our baseline specification using
the present-day number of bank branches per capita at the county level as our dependent
variable on the measures of historical antisemitism, and we find these two dimensions are
also unrelated.
Note that, unlike the case of Italy studied by Pascali (2016), institutions the Church
supported to compete with the Jewish monopoly in banking did not diffuse in Germany. In
Pascali (2016), Christian financial institutions founded in areas with ethnic tension against
Jews improved the strength of the financial sector in areas with higher historical ethnic
tensions.
15The registry reconstructs the chains of mergers and acquisitions over the decades for currently existingGerman banks. They collect the foundation date, the type, and other characteristics of any entity involvedin these chains as far back as any information is retraceable.
27

B Demand-Side Channels
Moving on to assessing potential demand-side channels, we first study the relationship
between historical antisemitism, present-day antisemitism, and present-day stock market
participation. Voigtlaender and Voth (2013) show that county-level historical antisemitism
explains the spatial variation in present-day antisemitism. Based on this result, county-level
measures of present-day antisemitism should be negatively associated with stock market
participation. Note that present-day antisemitism could even be a demand-side channel
that in part explains our results. Present-day households that are antisemitic may still
associate financial services with Jews, and thus invest less in stocks and demand fewer
financial services. Instead, if variation in historical antisemitism drives our results, and
if historical antisemitism is not measured with substantial error, we should not detect
a negative association between present-day antisemitism and stock market participation
once we control for both historical antisemitism and present-day antisemitism in the same
specification.
To discriminate between these alternative channels, we combined for the first time two
proprietary individual-level geolocated German data sources, namely, the ALLBUS data on
present-day social beliefs and the SOEP. From the ALLBUS data, we construct a measure
of present-day antisemitism as the county-level average of individual responses regarding
attitudes toward Jews, which were elicited in 1996 and 2006. As a main measure of current
antisemitism, we use the reciprocal of the answer to question 307, which reads as follows:
“Jewish people living in Germany should have the same rights as Germans in every respect.”
The answer scale ranges from 1 (Completely disagree) to 7 (Completely agree).16
Table 8 provides evidence that supports our conjectures. Column (1) regresses the
dummy for stockholdings only on the measure of present-day antisemitism. Present-day
antisemitism predicts present-day stock market participation negatively, as we would expect
based on the long-run persistence of antisemitism at the local level, which Voigtlaender and
Voth (2013) document. Column (2) regresses the dummy for stockholdings on the measure
of present-day antisemitism as well as the set of historical controls in our baseline analysis.
Again, we find a negative, statistically significant association just as in column (1). In
column (3), we add our measure of historical antisemitism (VV P.C.) to the specification
of column (2), and we see that adding this variable makes the association between present-
day antisemitism and stockholdings insignificant, both economically and statistically. At
the same time, the size and statistical significance of our baseline effect do not change
16In untabulated results, we find that all the results are virtually identical when we use alternative questionsrelated to current antisemitism and xenophobia.
28

once present-day antisemitism enters the set of controls. Finally, column (4) reports the
specification with the full set of controls from Table 2 and confirms our findings.
A related potential demand-side channel is present-day households’ “backwardness,”
that is, a set of cultural cues and beliefs that promote distrust of the unfamiliar, including
stocks and financial services. Present-day antisemitism might be a weak proxy for
backwardness, which would be why we do not detect an association with stock market
participation once we control for historical antisemitism. To test whether “backwardness”
might explain our results, we construct a measure for present-day xenophobia at the county
level using the ALLBUS data, similar to the way we constructed the measure of present-day
antisemitism described above. The measure of present-day xenophobia is the reciprocal of
the answer to question 306, which reads as follows: “Turkish people living in Germany
should have the same rights as Germans in every respect.” The answer scale ranges from 1
(Completely disagree) to 7 (Completely agree). We also use answers for the same question
referring to other minorities, namely, Italians and asylum seekers. In columns (5)-(10) of
Table 8, we find that present-day xenophobia does not explain stock market participation,
whether we control directly for historical antisemitism or not, whereas the size and statistical
significance of our baseline effect are unchanged.
Motivated by Gennaioli et al. (2015), we move on to test directly whether a persistent
cultural norm of distrust in finance, transmitted across generations, might contribute to
explaining our results. Past households in counties where strong negative stereotypes against
the Jews had developed might have also developed a negative stereotype toward what the
Jews represented at the time, namely, the financial sector.
We do not observe distrust of financial institutions for the households in the SOEP
sample, and hence, we run our own survey on a sample of 1,000 German households, asking
them the extent to which they trust the stock market, commercial banks (Privatbanken),
and local banks (Sparkassen and Genossenschaftsbanken). The company ClickWorker
administered the survey on a stratified sample of the German population that sign up to the
platform to perform tasks and surveys for pay. The respondents only know they are part of
a survey, and they ignore the identity or scopes of the researchers. This protocol is crucial
to avoid demand effects invalidating the procedure. We also ask for demographics and the
zip code in which respondents reside, which we map into counties.
We adapted the questions developed for the United States in the Kellogg-Booth Index
of Financial Trust (Sapienza and Zingales (2012)). After providing their demographics, the
respondents answered a set of four questions asking the extent to which they trust others
(generalized trust), the stock market, commercial banks, and local banks, on a scale from
29

1 (do not trust at all) to 7 (trust completely). We also elicited households’ willingness to
take risks in general and in financial decisions, on a similar scale from 1 to 7. Finally, the
respondents reported whether they owned stocks and whether they had a primary banking
relationship with a commercial bank or with a local bank. The final sample on which we can
run the analysis is about one half the original 1,000 households. This drop in the sample size
is due to the loss of respondents in counties for which we have no historical persecution data.
Also, our final sample is distributed across 57 counties, because we don’t have respondents
for all German counties in the survey, and we only consider counties for which we have at
least five respondents, to guarantee the representativeness of the answers.17
To make the results directly comparable to the baseline analysis, we transform the trust
measures into dummy variables that equal 1 if the measure is larger than or equal to 5, and
zero otherwise, and we estimate probit specifications whose outcomes are the trust in each of
the financial institutions.18 Table A.7 of the Online Appendix reports the summary statistics
and the correlational structure across these trust measures. Interestingly, the correlations
across the financial trust measures, and with generalized trust, are positive but not high.
A “pecking-order” of trust exists in financial institutions: on average, 41% of respondents
trust local banks, 17% trust commercial banks, and only 13% trust the stock market. The
average generalized trust is 39%, and its correlation with the measures of financial trust
varies from 9% to 11% across measures. Risk tolerance is correlated with the trust in the
stock market (38%), but not with the trust in local banks (2%), which suggests controlling
for the respondent’s risk tolerance in the analysis is important.
In Panel A of Table 9, we regress the trust in the stock market on VV P.C. (columns (1)-
(2)), after controlling for generalized trust, risk tolerance, and demographics at the individual
level. A one-standard-deviation increase in historical antisemitism is associated with a 4-
percentage-point drop in the respondents’ trust in the stock market. Columns (3)-(4) of
Table 9 report a similar specification whose outcome is the dummy for whether respondents
trust commercial banks, and columns (5)-(6) of Table 9, for whether respondents trust
local banks. We do not detect an association between Jewish persecution and the trust
in commercial banks, but we find that a one-standard-deviation increase in persecution is
associated with an 8-percentage-point drop in the trust in local banks.
Panel B of Table 9 shows the trust measures we elicit are positively associated with
the trusted outcomes, even when controlling for generalized trust, risk tolerance, and
respondents’ demographics.
17The results are similar if we change this threshold.18All the results are qualitatively similar if we instead use the original categorical variables and estimate
multinomial logit specifications.
30

Finally, in Panel C of Table 9, we replicate our baseline result – the negative association
between historical antisemitism and present-day stockholdings – also in the sample of
households that respond to our survey. Despite the substantially smaller size of the survey
sample, we do find that a one-standard-deviation-higher measure of historical antisemitism
is associated with about a -1.5-percentage-point likelihood that households hold stocks.
C Discussion
Overall, the tests in this section do not allow us to assess definitively the extent to which
each potential channel migth help explain our results. At the same time, we do not find
supporting evidence for any of the supply- and demand-side channels we consider, with the
exception of a cultural norm of distrust in finance, transmitted locally across generations
and still influencing German households’ financial decisions.
Theoretically, localized norms can persist through two forces – vertical transmission
from parents to offspring within a household and horizontal transmission through the
homogenization of norms within communities, to which individual members belong (e.g.,
see Bisin and Verdier (2000) and Bisin and Verdier (2001)). Recent research has provided
empirical support for these theoretical mechanisms of transmission of cultural norms (e.g.,
see Dohmen, Falk, Huffman, and Sunde (2012)). A theoretical framework for our results
should also explain under which conditions the initial norm of antisemitism created an
independent norm of distrust in finance. Several potential theoretical channels exist, which
we discuss in more detail below. Our findings are most consistent with a norm of distrust in
finance that developed in the Middle Ages and transmitted across generations independent
of antisemitism.
First, antisemitism in the Middle Ages might have persisted at the local level and
resulted in higher antisemitism during the Nazi period. Because of the strong rhetoric
against Jews as manipulators of the stock market during the Nazi regime, to which all
Germans were exposed via mass media such as the radio (Adena et al., 2015), a norm of
distrust in finance might have started at that point in time and then transmitted over the
last few decades independently from antisemitism. This channel is not fully consistent with
the fact that we find a negative effect of medieval and Nazi-period antisemitism on several
financial outcomes above and beyond stock market participation, such as the willingness to
take on mortgages to finance homeownership as well as lower retail deposits at the local
level. Jews were not associated with the banking system during the Nazi period, but they
were in the previous centuries.
A second explanation is that distrust in finance pre-dates historical antisemitism and
31

in fact caused pogroms against Jews in the Middle Ages. Localized antisemitism and distrust
in finance then might have persisted for centuries at the local level. We cannot test directly
whether distrust in finance caused ethnic tensions between Christians and Jews, or whether
ethnic tensions paired with ethnic specialization produced a norm of distrust in finance over
time, because we cannot observe households’ attitudes toward finance in the Middle Ages.
But if the cross-sectional variation of distrust in finance existed prior to antisemitism, it
would have been produced by religious norms, and hence should have reflected the extent
of religiosity across German counties in the distant past and possibly at the present day.19
We use the World Value Survey to construct a direct measure of the importance of religion
at the local level for present-day households, irrespective of their religious denomination.
Region-wide religiosity is negatively related to present-day stock market participation, but
controlling for it does not change our results.
Third, persecution against Jews in the Middle Ages might have also included a norm
of distrust in moneylending and financial activities at its very origin, in the Middle Ages,
and the two norms of antisemitism and distrust in finance might have transmitted in
parallel over time. Antisemitism faded because of the vigorous interventions by the German
administration to eradicate antisemitic beliefs from Germany after WWII, especially in
schools, whereas no systematic interventions have addressed a potential norm of distrust
in finance. This latter theoretical framework for the transmission of two parallel norms
seems the only one consistent with all our evidence, but ultimately we cannot provide direct
tests to disentangle the three theoretical explanations in our setting.
8 Conclusions
Historical ethnic tensions paired with ethnic specialization produce long-run discrimination
against the economic activities in which minorities specialized. We show this combination
has substantial effects on long-run economic decision-making and helps us understand the
persistent spatial variation in financial development. Households in German counties where
historical antisemitism was higher in the Middle Ages and the Nazi period access financial
services less than other households. They are less likely to hold stocks, they have fewer
mortgages, but not lower homeownership, and they put less savings into bank accounts, but
are as likely as other households to save. We find suggestive evidence that households in
counties with higher historical antisemitism are more likely to keep their money in cash form.
We assess a set of channels that might explain how ethnic tensions and ethnic
specialization can affect economic outcomes in the long run. A set of supply-side explanations
19We thank Paola Sapienza, our NBER discussant, for proposing this argument.
32

do not appear to be able to fully explain our findings. On the demand side, our results are
consistent with a lingering discrimination against financial services by households in counties
in which historical antisemitism was higher.
Future research should study which policy interventions might moderate the transmis-
sion of norms that affect the economic decision-making process of households in the long
run. For instance, can financial education dissipate a deep-rooted norm of discrimination
against financial services, by making households aware of the costs of not accessing finance?
Or do households decide not to invest despite knowing the negative effects of their actions
on the long-run accumulation of financial wealth? Answering these questions is crucial to
designing policies that might increase financial development in the long run, and to inform
governments on which costly place-based policies they implement might be ineffective simply
because they do not affect the ultimate determinants of local underdevelopment.
Our results contribute to the interdisciplinary debate on inter-ethnic tensions, hatred
beliefs, and their long-term consequences on societies. Because of the historically high equity
premium and the reliance of firms on equity capital, hatred against Jews in the past reduces
the long-term wealth not only of the persecuted, but of the persecutors as well.
33

References
Acemoglu, D., D. Cantoni, S. Johnson, and J. Robinson (2011). The consequences of radicalreform: The French Revolution. American Economic Review 101 (7), 3286–3307.
Acemoglu, D., T. Hassan, and J. Robinson (2011). Social structure and development: Alegacy of the holocaust in Russia. Quarterly Journal of Economics 126 (2), 895–946.
Adena, M., R. Enikolopov, M. Petrova, V. Santarosa, and E. Zhuravskaya (2015). Radioand the rise of the Nazis in prewar Germany. Quarterly Journal of Economics 130 (4),1885–1939.
Akbulut-Yuksel, M. and M. Yuksel (2015). The longer-term direct and external effects ofJewish expulsions in Nazi Germany. American Economic Journal: Economic Policy 7 (3),58–85.
Algan, Y. and P. Cahuc (2010). Inherited trust and growth. American EconomicReview 100 (5), 2060–2092.
Alicke, K.-D. (2008). Lexikon der Judischen Gemeinden im deutschen Sprachraum.Gutersloh, Germany: Gutersloher Verlagshaus.
Anderson, R., N. Johnson, and M. Koyama (2017). Jewish persecution and weather shocks:1100-1800. Economic Journal 127 (602), 924–958.
Banfield, E. (1958). The Moral Basis of a Backward Society. Glencoe, IL: Free Press.
Barclay, J. (1996). Jews in the Mediterranean Diaspora: From Alexander to Trajan (323BCE-117 CE). Berkeley, CA: University of California Press.
Becker, S., F. Cinnirella, E. Hornung, and L. Woessmann (2014). iPEHD – The PrussianIfo economic history database. Historical Methods 47 (2), 57–66.
Becker, S. and L. Pascali (2017). Religion, division of labor and conflict: Anti-semitism ingerman regions over 600 years. Working Paper .
Becker, S. and L. Woessmann (2009). Was Weber wrong? A human capital theory ofProtestant economic history. Quarterly Journal of Economics 124 (2), 531–596.
Betermier, S., T. Jansson, C. Parlour, and J. Walden (2012). Hedging labor income risk.Journal of Financial Economics 105 (3), 622–639.
Bisin, A. and T. Verdier (2000). Beyond the melting pot: Cultural transmission, marriage,and the evolution of ethnic and religious traits. Quarterly Journal of Economics 115 (3),955–988.
Bisin, A. and T. Verdier (2001). The economics of cultural transmission and the dynamicsof preferences. Journal of Economic Theory 97 (2), 298–319.
Bonacich, E. (1972). A theory of ethnic antagonism: The split labor market. AmericanSociological Review 37 (5), 547–559.
Bonacich, E. (1973). A theory of middleman minorities. American Sociological Review 38 (5),583–594.
Botticini, M. and Z. Eckstein (2012). The Chosen Few: How Education Shaped JewishHistory, 70-1492. The Princeton Economic History of the Western World. Princeton, NJ:Princeton University Press.
D’Acunto, F. (2016). From financial history to history & finance. Working Paper .
34

D’Acunto, F. (2017). Basic education and persistent regional inequalities. Working Paper .
de Bromhead, A., B. Eichengreen, and K. O’Rourke (2013). Political extremism in the1920s and 1930s: Do the German lessons generalize? Journal of Economic History 73 (2),371–406.
Dohmen, T., A. Falk, D. Huffman, and U. Sunde (2012). The intergenerational transmissionof risk and trust attitudes. Review of Economic Studies 79 (2), 645–677.
Elhaik, E. (2013). The missing link of Jewish European ancestry: Contrasting the Rhinelandand the Khazarian hypotheses. Genome Biology and Evolution 5 (1), 61–74.
Engelman, U. Z. (1944). The Rise of the Jew in the Western World: A Social and EconomicHistory of the Jewish People of Europe. New York, NY: Arno Press.
Falter, J. and D. Hanisch (1988). Wahl- und Sozialdaten der Kreise und Gemeinden desDeutschen Reiches 1920-1933. Koln, Germany: GESIS Datenarchiv.
Flannery, E. (1985). The Anguish of the Jews: Twenty-Three Centuries of Antisemitism.New York, NY: Paulist Press.
Fritsch, T. (1892). Statistik des Judenthums. Number 10 in Kleine Aufkl arungs-Schriften.Leipzig, Germany.
Gennaioli, N., R. La Porta, F. Lopez-de Silanes, and A. Shleifer (2013). Human capital andregional development. Quarterly Journal of Economics 128 (1), 105–164.
Gennaioli, N., A. Shleifer, and R. Vishny (2015). Money doctors. Journal of Finance 70 (1),91–114.
Georgarakos, D., A. Lojschova, and M. Ward-Warmedinger (2010). Mortgage indebtednessand household financial distress. ECB Working Paper Series No. 1156 .
Giannetti, M. and T. Wang (2016). Corporate scandals and stock market participation.Journal of Finance 71 (6), 2591–2636.
Glagau, O. (1876). Der Borsen- und Grundungs-Schwindel in Berlin. Verlag v. PaulFrohberg.
Gormley, T., H. Liu, and G. Zhou (2010). Limited participation and consumption-savingpuzzles: A simple explanation and the role of insurance. Journal of FinancialEconomics 96 (2), 331–344.
Grosfeld, I., A. Rodnyansky, and E. Zhuravskaya (2013). Persistent anti-market culture:A legacy of the Pale of Settlement after the Holocaust. American Economic Journal:Economic Policy 5 (3), 189–226.
Grosfeld, I., S. Sakalli, and E. Zhuravskaya (2017). Middlemen minorities and ethnic violence:Anti-Jewish pogroms in the Russian Empire. Working paper .
Gross, N. (Ed.) (1975). Economic History of the Jews. Library of Jewish Knowledge.Jerusalem: Keter Publishing House Jerusalem.
Guiso, L. and T. Jappelli (2005). Awareness and Stock Market Participation. Review ofFinance 9(4), 537–567.
Guiso, L., T. Jappelli, and D. Terlizzese (1996). Income risk, borrowing constraints, andportfolio choice. American Economic Review 86 (1), 158–172.
35

Guiso, L., P. Sapienza, and L. Zingales (2004a). Does local financial development matter?Quarterly Journal of Economics 119 (3), 929–969.
Guiso, L., P. Sapienza, and L. Zingales (2004b). The role of social capital in financialdevelopment. American Economic Review 94 (3), 526–556.
Guiso, L., P. Sapienza, and L. Zingales (2009). Trusting the stock market. Journal ofFinance 63 (6), 2557–2600.
Hitler, A. (1939). Mein Kampf - Murphy Translation, Vol. I, chapter XI: Race and People.Hurst and Blackett.
Hong, H., J. Kubic, and J. Stein (2004). Social interaction and stock market participation.Journal of Finance 59 (1), 137–163.
Horowitz, D. (1985). Ethnic Groups in Conflict. Berkeley, CA: University of CaliforniaPress.
Jha, S. (2013). Trade, institutions, and ethnic tolerance: Evidence from South Asia.American Political Science Review 107 (4), 806–832.
Jha, S. (2014). ‘Unfinished business’: Historic complementarities, political competition andethnic violence in Gujarat. Journal of Economic Behavior and Organization 104, 18–36.
King, G., O. Rosen, M. Tanner, and A. Wagner (2008). Ordinary economic voting behaviorin the extraordinary election of Adolf Hitler. Journal of Economic History 68 (4), 951–996.
Koetter, M. (2013). Market structure and competition in German banking. Working Paper .
Kohler, I. (2005). Die “Ariesirung” der Privatbanken im Dritten Reich: Verdrangung,Ausschaltung und die Frage der Wiedergutmachung. Munich, Germany: Beck.
Malmendier, U. and S. Nagel (2011). Depression babies: do macroeconomic experiencesaffect risk-taking? Quarterly Journal of Economics 126 (1), 373–416.
Nunn, N. (2014). Handbook of Economic Growth, Volume 2, Chapter Historical Development,pp. 347–402. Amsterdam: Elsevier North Holland.
Pascali, L. (2016). Banks and development: Jewish communities in the Italian Renaissanceand current economic performance. Review of Economics and Statistics 98 (1), 140–158.
Paxson, C. (1990). Borrowing constraints and portfolio choice. Quarterly Journal ofEconomics 105 (2), 535–543.
Penslar, D. (2001). Shylock’s Children: Economics and Jewish Identity in Modern Europe.Berkeley, CA: University of California Press.
Perry, M. and T. Schweitzer (2002). Antisemitism: Myth and Hate from Antiquity to thePresent. New York, NY: Palgrave Macmillan.
Pierce, L. and J. Snyder (2017). The historical slave trade and firm access to finance inAfrica. Review of Financial Studies .
Poliakov, L. (1975). The History of Anti-Semitism, Volume 3. London, UK: Routledge &Kegan Paul Publishers. trans. Miriam Kochan.
Putnam, R. (1993). Making Democracy Work: Civic Traditions in Modern Italy. Princeton,NJ: Princeton University Press.
36

Ramankutty, N., J. Foley, J. Norman, and K. McSweeney (2002). The global distributionof cultivable lands: Current patterns and sensitivity to possible climate change. GlobalEcology and Biogeography 11 (5), 377–392.
Reuveni, G. and S. Wobick-Segev (Eds.) (2011). The Economy in Jewish History: NewPerspectives on the Interrelationship between Ethnicity and Economic Life. New York,NY: Berghahn Books.
Roth, C. (1938). The Jewish Contribution to Civilization. London, UK: Macmillan and Co.
Roth, C. (1960). The Jews: Their History, Culture, and Religion (3rd ed.)., Chapter TheEuropean Age in Jewish History, pp. 216–286. New York, NY: Harper & Brothers.
Samuelson, P. (1969). Lifetime portfolio selection by dynamic stochastic programming.Review of Economics and Statistics 51 (3), 239–246.
Sapienza, P. and L. Zingales (2012). A trust crisis. International Review of Finance 12 (2),123–131.
Spolaore, E. and R. Wacziarg (2013). How deep are the roots of economic development?Journal of Economic Literature 51 (2), 325–369.
Toch, M. (2012). The Economic History of European Jews: Late Antiquity and Early MiddleAges. Leiden: Brill.
van Rooij, M., A. Lusardi, and R. Alessie (2011). Financial literacy and stock marketparticipation. Journal of Financial Economics 101 (2), 449–472.
van Straten, J. (2004). Jewish migrations from Germany to Poland: the Rheinlandhypothesis revisited. The Mankind Quarterly 44 (3-4), 367–384.
Voigtlaender, N. and H. Voth (2012). Persecution perpetuated: The medieval origins of anti-Semitic violence in Nazi Germany. Quarterly Journal of Economics 127 (3), 1339–1392.
Voigtlaender, N. and H. Voth (2013). Married to intolerance: Attitudes towards intermar-riage in Germany, 1900-2006. American Economic Review Papers and Proceedings 103 (3),79–85.
Voigtlaender, N. and H. Voth (2015). Nazi indoctrination and anti-Semitic beliefs inGermany. Proceedings of the National Academy of Sciences 112 (26), 7931–7936.
Waldinger, F. (2010). Quality matters: The expulsion of professors and the consequences forPhD students’ outcomes in Nazi Germany. Journal of Political Economy 118 (4), 787–831.
37

Figure 2: Data Properties: Historical Antisemitism and Stock Market Participa-tion
(a) Ratio Deported Jews Nazi Period (b) Stock Market Participation
(c) Ratio Deported Jews Nazi Period (d) Stock Market Participation Density
0.0
1.0
2.0
3.0
4D
ensi
ty
0 20 40 60 80 100Ratio Deported Jewish Population (base: 1933)
02
46
8D
ensi
ty
0 .1 .2 .3 .4 .5Ratio of Households which Own Stocks (1984-2010)
(e) Ratio Deported Jews Nazi Period (f) Pogroms and Participation
0.2
.4.6
Rat
io o
f Hou
seho
lds
who
Ow
n S
tock
s (a
vera
ge 1
984-
2010
)
0 20 40 60 80Ratio Deported Jewish Population
.14
.15
.16
.17
.18
Rat
io o
f Hou
seho
lds
who
Ow
n S
tock
s (a
vera
ge 1
984-
2010
)
No Pogroms in 1349 At Least one Pogrom in 1349
In Panels (a) and (b), the darker a county is, the higher the value of the depicted variable. Blank counties are
those for which the data are not available. Panel (a) plots the ratio of Jews deported during the Nazi period
over the Jewish population in the county as of 1933. Panel (b) plots the average yearly ratio of households
who have invested in stocks from 1984 to 2011. Panels (c) and (d) plot the sample distributions of the same
measures as above. Panel (e) depicts the unconditional correlation between stock market participation and
the ratio of Jews deported during the Nazi period over the Jewish population in the county as of 1933. Panel
(f) shows the mean stock market participation in counties that experienced and did not experience a pogrom
in 1349.
38

Figure 3: Settlement of Jewish Communities and Distance from the Rhine Valley
(a) Year when the first Jewish community was documented
(b) Counties at same distance from Trier (c) Counties at same distance from Emmerich
The maps document the foundation dates of Jewish communities at the county level. The darker a county is,
the earlier a Jewish community was documented in that county. Blank counties are those for which the data
are not available. The bottom maps show the location of the cities of Trier, on the Mosel, and Emmerich,
on the northern end of the river Rhine in Germany. The isodistance curves centered around those two cities
emphasize which counties are at the same distance from Trier or Emmerich.
39

Table 1: Summary Statistics
This table reports summary statistics for measures of historical antisemitism in Germany, and for the characteristics
of households and counties where households live. Each observation is a German household interviewed by SOEP
any time between 1984 and 2011. For each variable, the table reports the number of observations for which the
variable is observed, its mean, standard deviation, minimal, and maximal values. The table reports statistics for
households for which we observe the county of residence. We exclude repeated observations. Historical Antisemitism
(VV P.C.) is the principal component of Voigtlaender and Voth (2012) of their different measures of Jewish
persecution in the 1920s-1930s, Medieval Antisemitism (Pogrom 1349) is a dummy variable that equals 1 if a
pogrom against Jews occurred during the Black Death, and Exposure to Jews pre-1300 is a dummy variable that
equals 1 if a county hosted a Jewish community before 1300.
Obs. Mean Std Min Max
(1) (2) (3) (4) (5)
Antisemitism
Historical Antisemitism (VV P.C.) 298 −0.61 1.02 −3.84 2.25
Medieval Antisemitism (Pogrom1349) 307 0.54 0.50 0.00 1.00
Exposure to Jews pre-1300 307 0.92 0.27 0.00 1.00
County characteristics
Log Jews 1933 307 5.43 1.76 0.00 11.99
Percentage unemployed 1933 307 16.24 8.26 2.62 40.52
Percentage blue collars 1933 307 42.86 11.32 16.49 72.40
Percentage self-employed 1933 307 21.01 4.55 9.10 32.74
Percentage Catholics 1925 307 36.75 34.62 0.50 98.77
Latitude 443 50.64 1.72 47.95 54.03
Land-quality index 442 0.56 0.14 0.31 0.87
Income per capita 2005 413 17,294 2,280 12,846 27,253
Population density 2005 425 2,308 2,549 546 29,036
Percentage college graduates 2005 430 24.49 5.03 17.60 34.60
Household characteristics
Holds stocks 26,761 0.16 0.37 0.00 1.00
Homeowner 27,064 0.39 0.49 0.00 1.00
Has life insurance 26,761 0.47 0.50 0.00 1.00
Income 26,761 31,522 26,614 -36 986,400
Age 21,981 48.62 17.64 17.00 97.00
Female 21,982 0.49 0.50 0.00 1.00
Single 27,064 0.18 0.38 0.00 1.00
High school or higher 27,079 0.77 0.42 0.00 1.00
Eastern Germany 27,079 0.13 0.34 0.00 1.00
40

Table 2: Historical Antisemitism and Present-Day Stock Market ParticipationThis table reports average marginal effects computed after estimating the following probit specification:
Pr(HoldsStocksik|Xik,Kk) = Φ(α+ β ×Historical Antisemitismk +X′ik × γ +K′
k × δ + Income deciles+ ηt + εik).
Each observation is a German household interviewed by SOEP between 1984 and 2011. In all columns, the dependent variable
is a dummy that equals 1 if the household holds stocks. The main covariate of interest, Historical Antisemitism, is the
Voigtlaender-Voth principal component (VV P.C.) of Jewish persecution in the 1920s-1930s,. Xik includes the following
individual-level controls: gender, single-status dummy, age (second-degree polynomial), college-education dummy. Other
individual controls include: homeownership dummy and life and social insurance dummy. Other historical controls include:
log of population in 1933, ratio of population employed in the retail sector in 1933, and ratio of population employed in
manufacturing in 1933. Other regional controls include: population density, latitude, index of quality of cultivable land.
Income deciles are dummies indicating the decile of the income distribution to which the household belongs, and Φ is the
standard normal cdf. We cluster standard errors at the county level. ∗p < 0.10, ∗ ∗ p < 0.05, ∗ ∗ ∗p < 0.01.
Fu
ll
Sam
ple
Fu
ll
Sam
ple
On
lyW
este
rn
Ger
many
Ad
din
g
Lon
git
ud
e
Excl
.L
east
Pop
ula
ted
Excl
.H
igh
Ineq
uali
ty
Excl
.P
oore
st
Cou
nti
es
Excl
.L
east
Ed
uca
ted
(1) (2) (3) (4) (5) (6) (7) (8)
Historical Antisemitism −0.009∗∗ −0.014∗∗∗ −0.015∗∗∗ -0.010** −0.013∗∗∗ −0.016∗∗∗ −0.020∗∗∗ -0.013**
(VV P.C.) (0.005) (0.004) (0.005) (0.004) (0.005) (0.005) (0.005) (0.005)
Log Jews 1933 0.007∗∗∗ 0.003 0.000 -0.001 0.000 0.000 −0.003 0.004
(0.003) (0.005) (0.005) (0.005) (0.007) (0.006) (0.007) (0.006)
% Catholics 1925 0.000 0.000 0.000 0.000 0.000 0.000 0.000
(0.000) (0.000) (0.000) (0.000) (0.000) (0.000) (0.000)
Age −0.002∗ −0.002 -0.002** −0.002 −0.003∗∗∗ −0.003∗∗ -0.003**
(0.001) (0.001) (0.001) (0.001) (0.001) (0.001) (0.001)
Age2/100 0.043∗∗∗ 0.044∗∗∗ 0.043*** 0.041∗∗∗ 0.045∗∗∗ 0.048∗∗∗ 0.047**
(0.011) (0.012) (0.011) (0.012) (0.012) (0.012) (0.012)
Female −0.001 0.000 -0.002 0.000 0.000 −0.001 0.004
(0.006) (0.006) (0.006) (0.007) (0.007) (0.007) (0.007)
Single 0.060∗∗∗ 0.066∗∗∗ 0.053*** 0.056∗∗∗ 0.047∗∗∗ 0.065∗∗∗ 0.050***
(0.010) (0.010) (0.009) (0.010) (0.010) (0.010) (0.011)
College 0.011∗∗∗ 0.011∗∗∗ 0.012*** 0.013∗∗∗ 0.013∗∗∗ 0.013∗∗∗ 0.010**
(0.004) (0.004) (0.004) (0.004) (0.004) (0.004) (0.004)
Eastern Germany −0.024 -0.033* −0.006 −0.030 −0.045∗ -0.020
(0.021) (0.018) (0.028) (0.019) (0.024) (0.020)
Income p.c. 2005 0.005∗∗∗ 0.005∗∗∗ 0.005*** 0.008∗∗∗ 0.003 0.007∗∗∗ 0.007***
(0.002) (0.002) (0.002) (0.002) (0.003) (0.002) (0.002)
% College graduates 2005 0.001 0.001 -0.001 0.000 0.001 −0.001 0.002
(0.001) (0.001) (0.001) (0.002) (0.002) (0.002) (0.002)
Income deciles X X X X X X X
Other individual controls X X X X X X X
Other historical controls X X X X X X X
Other regional controls X X X X X X X
Wave groups f.e. X X X X X X X
Observations 13,599 13,599 12,701 13,599 11,168 11,012 11,144 10,128
N. of clusters 261 261 226 261 188 206 200 191
(Pseudo-) R2 0.001 0.105 0.106 0.093 0.095 0.094 0.094 0.090
41

Table 3: Historical Antisemitism, Mortgages, and Deposits
Columns (1)-(6) report average marginal effects computed after estimating the following probit specification:
Pr(Depvarik|Xik,Kk) = Φ(α+ β ×Historical Antisemitismk +X′ik × γ +K′
k × δ + Income deciles+ ηt + εik).
Each observation is a German household interviewed by SOEP between 1984 and 2011. The main covariate of interest,
Historical Antisemitism, is the Voigtlaender-Voth principal component (VV P.C.) of measures of Jewish persecution in the
1920s-1930s. Xik includes the following individual-level controls: gender, single status dummy, age (2nd degree polynomial), college
education dummy. Other individual controls include: homeownership dummy and life and social insurance dummy. Other historical
controls include: log of population in 1933, ratio of population employed in the retail sector in 1933, and ratio of population employed in
manufacturing in 1933. Other regional controls include: population density, latitude, index of quality of cultivable land. Income deciles
are dummies indicating the decile of the income distribution to which the household belongs, and Φ is the standard normal cdf. The
outcome variable, Depvarik, is a dummy that equals 1 if the household owns any real estate property in columns (1)-(2), a dummy
that equals 1 if the household has ever had a mortgage outstanding in columns (3)-(4), and a dummy that equals 1 if the household
declares they save part of their monthly income regularly in columns (5)-(6). Columns (7)-(8) report the results for a county-level OLS
regression of the ratio of total bank deposits in each county to total assets of banks in the county. We aggregate the branch-level deposits
and assets from Bankscope at the county level. We cluster standard errors at the county level. ∗p < 0.10, ∗ ∗ p < 0.05, ∗ ∗ ∗p < 0.01.
Regularly Saves Deposits/Assets
Home Owner Has a Mortgage Part of Income Local Banks
Probit Probit Probit Probit Probit Probit OLS OLS
(1) (2) (3) (4) (5) (6) (7) (8)
Historical Antisemitism −0.009 −0.008 −0.007∗∗ −0.007∗∗ 0.006 0.005 -0.015** −0.015∗∗(VV P.C.) (0.010) (0.011) (0.003) (0.003) (0.007) (0.020) (0.007) (0.006)
Log Jews 1933 −0.007 −0.011 0.004 0.004 −0.001 −0.001 -0.025** −0.021∗∗(0.011) (0.012) (0.003) (0.003) (0.009) (0.007) (0.011) (0.010)
% Catholics 1925 0.002 0.000 0.000 −0.001 0.000 0.000 0.000 0.000
(0.002) (0.001) (0.001) (0.001) (0.001) (0.001) (0.001) (0.001)
Age 0.000 −0.001 0.011∗∗∗ 0.01∗∗∗ −0.001 −0.005∗∗∗ -0.002
(0.002) (0.002) (0.001) (0.001) (0.002) (0.002) (0.002)
Age2 /100 0.000 −0.001 −0.001∗∗∗ −0.001∗∗∗ 0.001∗∗∗ 0.001∗∗∗(0.001) (0.001) (0.000) (0.000) (0.000) (0.000)
Female 0.019∗ 0.019∗ −0.005 −0.004 −0.034∗∗∗ −0.032∗∗∗ 0.005
(0.010) (0.010) (0.004) (0.004) (0.009) (0.008) (0.044)
Single 0.153∗∗∗ 0.147∗∗∗ −0.001 0.006 0.077∗∗∗ 0.092∗∗∗ −0.035
(0.013) (0.013) (0.006) (0.007) (0.017) (0.018) (0.072)
College 0.036∗∗∗ 0.033∗∗∗ −0.001 0.003 −0.016∗∗∗ −0.012∗∗∗ 0.230
(0.006) (0.005) (0.002) (0.002) (0.005) (0.005) (0.177)
Eastern Germany 0.068 0.065 −0.019∗ −0.019∗ 0.005 0.005 0.079∗∗∗(0.049) (0.048) (0.011) (0.010) (0.030) (0.028) (0.020)
Income p.c. 2005 −0.004 −0.003 0.001 0.002 0.003 0.001 −0.001
(0.004) (0.004) (0.001) (0.001) (0.003) (0.003) (0.007)
% College graduates 2005 0.001 −0.003 0.001 0.001 0.001 0.001
(0.030) (0.003) (0.001) (0.001) (0.002) (0.002)
Income deciles X X X X X X
Other individual controls X X X X
Other historical controls X X X X
Other regional controls X X X X
Wave groups f.e. X X X
Observations 11,484 11,484 11,484 11,484 10,900 10,900 236 236
N. of clusters 236 236 236 236 236 236
(Pseudo-) R2 0.05 0.06 0.16 0.18 0.09 0.11 0.07 0.19
42

Table 4: The Deep Roots of Antisemitism
This Table reports average marginal effects computed after estimating the following probit specification:
Pr(HoldsStocksik|Xik,Kik) = Φ(α+ β ×Medieval Antisemitismk +X′ik × γ +K′
ik × δ + Income deciles+ ηt + εik),
Each observation is a German household interviewed by the SOEP any time between 1984 and 2011. In all columns, the dependent
variable is a dummy that equals 1 if the household holds stocks. The main covariate of interest, Medieval Antisemitism, is a
dummy variable that equals 1 if a pogrom happened in county k during the Black Death period (around 1349), and zero otherwise.
Historical Antisemitism is the Voigtlaender-Voth principal component (VV P.C.) of measures of Jewish persecution in the 1920s-
1930s. Xik includes the following individual-level controls: gender, single/marital status, income (second-degree polynomial), age
(second-degree polynomial); college education, homeownership, and life and social insurance. Kk includes the following county-level
current and historical controls: latitude, income per capita, share of college-educated population, index of quality of cultivable land,
log of population in 1933, log of Jewish population in 1933, ratio of population employed in the retail sector in 1933, ratio of
population employed in manufacturing in 1933, and ratio of Catholic population in 1925. Income deciles are dummies indicating
the decile of the income distribution to which the household belongs, and Φ is the standard normal cdf. We cluster standard erorrs
at the county level. ∗p < 0.10, ∗ ∗ p < 0.05, ∗ ∗ ∗p < 0.01
Medieval Antisemitism Exposure to Jews
Fu
llS
am
ple
Ad
din
g
Lon
git
ud
e
Excl
ud
ing
Bis
hop
Sea
ts
Excl
ud
ing
Han
seati
c
Lea
gu
e
Exp
ose
dP
re
1300
Exp
ose
dP
re
Bla
ckD
eath
Exp
ose
dP
re
1300
Exp
ose
dP
re
Bla
ckD
eath
(1) (2) (3) (4) (5) (6) (7) (8)
Medieval Antisemitism −0.020∗∗ −0.016∗ −0.018∗ −0.019∗ −0.019∗∗ −0.019∗∗(Pogrom1349) (0.009) (0.009) (0.010) (0.010) (0.009) (0.009)
Exposure to Jews −0.020∗∗ −0.024∗∗ −0.025∗∗ −0.030∗∗(0.010) (0.010) (0.012) (0.012)
Historical Antisemitism −0.014∗∗∗ −0.014∗∗∗(VV P.C.) (0.004) (0.004)
Log Jews 1933 −0.001 −0.003 0.001 −0.002 −0.001 −0.001 0.001 0.001
(0.004) (0.004) (0.004) (0.004) (0.004) (0.004) (0.005) (0.005)
% Catholics 1925 0.000 0.000 −0.000 −0.000 −0.000 −0.000 0.000 0.000
(0.001) (0.000) (0.000) (0.000) (0.000) (0.000) (0.000) (0.000)
Age −0.002∗∗ −0.003∗∗ −0.002∗ −0.003∗∗ −0.002∗∗ −0.002∗∗ −0.002∗ −0.002∗(0.001) (0.001) (0.001) (0.001) (0.001) (0.001) (0.001) (0.001)
Age2 /100 0.046∗∗∗ 0.045∗∗∗ 0.044∗∗∗ 0.048∗∗∗ 0.046∗∗∗ 0.046∗∗∗ 0.043∗∗∗ 0.043∗∗∗(0.011) (0.011) (0.012) (0.012) (0.011) (0.011) (0.011) (0.011)
Female −0.002 −0.003 −0.004 −0.003 −0.002 −0.002 −0.001 −0.005
(0.006) (0.006) (0.006) (0.007) (0.006) (0.006) (0.006) (0.006)
Single 0.060∗∗∗ 0.053∗∗∗ 0.060∗∗∗ 0.059∗∗∗ 0.060∗∗∗ 0.060∗∗∗ 0.060∗∗∗ 0.060∗∗∗(0.009) (0.009) (0.010) (0.010) (0.009) (0.009) (0.010) (0.010)
College 0.010∗∗ 0.011∗∗∗ 0.012∗∗∗ 0.010∗∗ 0.010∗∗∗ 0.010∗∗∗ 0.011∗∗∗ 0.011∗∗∗(0.004) (0.004) (0.004) (0.004) (0.004) (0.004) (0.004) (0.004)
Eastern Germany −0.021 −0.031∗ 0.006 −0.001 −0.021 −0.021 −0.025 −0.026
(0.020) (0.017) (0.018) (0.021) (0.020) (0.020) (0.021) (0.021)
Income p.c. 2005 0.003∗ 0.004∗∗ 0.004∗∗ 0.005∗∗ 0.003∗ 0.003∗ 0.005∗∗∗ 0.004∗∗∗(0.002) (0.002) (0.002) (0.002) (0.002) (0.002) (0.002) (0.002)
% College graduates 2005 0.001 −0.001 0.001 0.001 0.001 0.001 0.001 0.001
(0.001) (0.001) (0.001) (0.001) (0.001) (0.001) (0.001) (0.001)
Income deciles X X X X X X X X
Other historical controls X X X X X X X X
Wave groups f.e. X X X X X X X X
Regional controls X X X X X X X X
Observations 13,870 13,870 12,423 11,560 13,870 13,870 13,599 13,599
N. of clusters 270 270 249 244 270 270 261 261
(Pseudo-) R2 0.106 0.093 0.093 0.094 0.106 0.106 0.106 0.106
43

Tab
le5:
Excl
usi
on
Rest
rict
ion:
Dis
tance
from
Rhin
e,
and
His
tori
cal
Anti
sem
itis
mP
an
elA
repo
rts
ave
rage
ma
rgin
al
effec
tsfo
res
tim
ati
ng
the
foll
ow
ing
pro
bit
spec
ifica
tio
n:
Pr(HoldsStocks i|X
i,K
k)
=Φ
(α+β1×DistanceRhine k
+β2×HistoricalAntisemitism
k+X
′ i×δ
+K
′ k×δ
+Incomedeciles
+ηt
+ε i
k),
wh
ereDistanceRhine
isth
en
atu
ral
loga
rith
mo
fd
iffer
ent
mea
sure
so
fd
ista
nce
fro
mth
eR
hin
eV
all
eyin
dic
ate
da
bove
each
colu
mn
,a
ndHistoricalAntisemitism
,is
the
Vo
igtl
aen
der
-Vo
th
pri
nci
pal
com
pon
ent
of
mea
sure
so
fJ
ewis
hpe
rsec
uti
on
inth
e1
92
0s-
19
30
s(V
VP
.C.)
.P
an
elB
repo
rts
the
coeffi
cien
tsfo
rre
gres
sin
ga
du
mm
yth
at
equ
als
1if
the
ho
use
ho
ldh
old
sst
ocks
on
the
mea
sure
of
dis
tan
cefr
om
the
Rh
ine
Va
lley
ind
ica
ted
abo
veea
chco
lum
n,
on
the
sam
ple
of
Fre
nch
ho
use
ho
lds
fro
mth
eE
nqu
ete
Pa
trim
oin
e,w
hic
hli
veto
the
wes
to
fth
eR
hin
e
Va
lley
.In
div
idu
al
con
tro
lsin
clu
de:
gen
der
,si
ngl
est
atu
sd
um
my,
age
(sec
on
d-d
egre
epo
lyn
om
ial)
,co
lleg
eed
uca
tio
nd
um
my,
ho
meo
wn
ersh
ipd
um
my,
an
dli
fea
nd
soci
al
insu
ran
ced
um
my.
His
tori
cal
con
tro
lsin
clu
de:
log
of
Jew
ish
pop
ula
tio
nin
19
33
,ra
tio
of
Ca
tho
lic
pop
ula
tio
nin
19
25
,lo
go
fpo
pu
lati
on
in1
93
3,
rati
oo
fpo
pu
lati
on
emp
loyed
inth
ere
tail
sect
or
in1
93
3,
an
d
rati
oo
fpo
pu
lati
on
emp
loyed
inm
an
ufa
ctu
rin
gin
19
33
.R
egio
na
lco
ntr
ols
incl
ud
e:in
com
epe
rca
pit
a,
pop
ula
tio
nd
ensi
ty,
sha
reo
fco
lleg
e-ed
uca
ted
pop
ula
tio
n,
lati
tud
e,a
nd
ind
exo
fqu
ali
ty
of
cult
iva
ble
lan
d.Incomedeciles
are
du
mm
ies
ind
ica
tin
gth
ed
ecil
eo
fth
ein
com
ed
istr
ibu
tio
nto
wh
ich
the
ho
use
ho
ldbe
lon
gs,
an
dΦ
isth
est
an
da
rdn
orm
al
cdf.
We
clu
ster
sta
nd
ard
erro
rsa
tth
eco
un
tyle
vel.∗p<
0.1
0,∗∗p<
0.0
5,∗∗∗p<
0.0
1
Dis
tan
ceM
ain
zD
ista
nce
Worm
sD
ista
nce
Sp
eyer
Dis
tan
ceT
rier
Dis
tan
ceE
mm
eric
h
(1)
(2)
(3)
(4)
(5)
(6)
(7)
(8)
(9)
(10)
PanelA:Reduced
Form
Log
Dis
tan
ce0.0
117∗∗
0.0
076
0.0
127∗∗
0.0
089
0.0
149∗∗
0.0
111∗
0.0
129∗∗
0.0
104
0.0
165∗∗
0.0
109
(0.0
06)
(0.0
06)
(0.0
06)
(0.0
06)
(0.0
06)
(0.0
06)
(0.0
07)
(0.0
07)
(0.0
07)
(0.0
08)
His
tori
cal
Anti
sem
itis
m−
0.0
133∗∗∗
−0.0
132∗∗∗
−0.0
129∗∗∗
−0.0
132∗∗∗
−0.0
127∗∗∗
(VV
P.C
.)(0.0
04)
(0.0
04)
(0.0
04)
(0.0
04)
(0.0
05)
Inco
me
dec
iles
XX
XX
XX
XX
XX
Ind
ivid
ual
contr
ols
XX
XX
XX
XX
XX
His
tori
cal
contr
ols
XX
XX
XX
XX
XX
Wave
gro
up
f.e.
XX
XX
XX
XX
XX
Reg
ion
al
contr
ols
XX
XX
XX
XX
XX
Ob
serv
ati
on
s13,8
70
13,8
70
13,8
70
13,8
70
13,8
70
13,8
70
13,8
70
13,8
70
13,8
70
13,8
70
Ad
just
edR
20.0
68
0.0
68
0.0
68
0.0
68
0.0
68
0.0
68
0.0
68
0.0
68
0.0
68
0.0
68
Dis
tan
ceT
rier
Dis
tan
ceE
mm
eric
hM
inim
al
Dis
tan
ce
(1)
(2)
(3)
(4)
(5)
(6)
(7)
(8)
(9)
PanelB:French
House
hold
s:W
est
ofth
eRhin
eValley,No
Jewish
migrations
Log
Dis
tan
ce−
0.0
03
-0.0
05−
0.0
04
0.0
05
−0.0
03
-0.0
03
-0.0
03−
0.0
05
−0.0
04
(0.0
13)
(0.0
11)
(0.0
11)
(0.0
28)
(0.0
24)
(0.0
24)
(0.0
13)
(0.0
11)
(0.0
11)
Inco
me
qu
inti
les
XX
XX
XX
Ind
ivid
ual
contr
ols
XX
XX
XX
Reg
ion
al
contr
ols
XX
XX
XX
XX
X
Siz
eof
tow
nX
XX
Ob
serv
ati
on
s9,6
92
9,3
83
9,3
83
9,6
92
9,3
83
9,3
83
9,6
92
9,3
83
9,3
83
Ad
just
edR
20.0
10.1
30.1
30.0
10.1
30.1
30.0
10.1
30.1
3
44

Table 6: Three-Stage OLS: Distance from Rhine, Historical Antisemitism,Stockholdings
This table reports OLS coefficients for the three-stage instrumental-variable procedure described in section 6. In the first stage (Panel
A), the probability that a Jewish community existed in 1349 in each German county is predicted by the distance of the county from
the Rhine Valley. In the second stage (Panel B), the Voigtlaender and Voth (2012) principal component (VV P.C.) of measures of
Jewish persecution in the 1920s and 1930s is predicted with the predicted probability that a Jewish community existed in a county
in 1349. In the third stage (Panel C), the ratio of households who own stocks in each county is predicted with the predicted extent
of Jewish persecution. In all stages, coefficients are estimated with OLS. Individual controls include: gender, single status dummy,
age (second-degree polynomial), college education dummy, homeownership dummy, and life and social insurance dummy. Historical
controls include: log of Jewish population in 1933, ratio of Catholic population in 1925, log of population in 1933, ratio of population
employed in the retail sector in 1933, and ratio of population employed in manufacturing in 1933. Regional controls include: income
per capita, population density, share of college-educated population, latitude, and index of quality of cultivable land. We cluster
standard errors at the county level. ∗p < 0.10, ∗ ∗ p < 0.05, ∗ ∗ ∗p < 0.01.
Distance Distance Distance Distance Distance
Mainz Worms Speyer Trier Emmerich
Panel A. First Stage: Jewish Community Exists in 1349
(1) (2) (3) (4) (5)
Log Distance −0.227∗∗∗ −0.199∗∗∗ −0.186∗∗∗ −0.131∗∗∗ −0.196∗∗∗(0.006) (0.006) (0.007) (0.007) (0.008)
Adj. R2 0.35 0.34 0.33 0.30 0.32
Panel B. Second Stage: Historical Antisemitism (V.V. PC)
Existence 1349 1.244∗∗∗ 1.375∗∗∗ 1.599∗∗∗ 2.418∗∗∗ 2.36∗∗∗(0.050) (0.058) (0.064) (0.098) (0.070)
Adj. R2 0.51 0.50 0.51 0.51 0.52
Panel C. Third Stage: Holds Stocks
Historical Antisemitism −0.044∗∗ −0.050∗∗ −0.053∗∗ −0.044∗∗ −0.035∗∗(VV P.C.) (0.021) (0.022) (0.021) (0.021) (0.016)
Adj. R2 0.08 0.08 0.08 0.08 0.08
Income deciles X X X X X
Individual controls X X X X X
Historical controls X X X X X
Regional controls X X X X X
Wave group f.e. X X X X X
Observations 13,599 13,599 13,599 13,599 13,599
45

Tab
le7:
His
tori
cal
Anti
sem
itis
mand
Loca
lB
ankin
gE
ffici
ency
Th
ista
ble
repo
rts
OL
Sco
effici
ents
for
the
foll
ow
ing
spec
ifica
tio
n:
BankEfficiency
k=α
+β×HistoricalAntisemitism
k+K
′ k×δ
+ε k.
BankEfficiency
are
diff
eren
tm
easu
res
for
the
effici
ency
of
the
loca
lba
nki
ng
syst
emfr
om
the
Ger
ma
nC
ou
nci
lo
fE
con
om
icE
xper
tsli
sted
at
the
top
of
each
colu
mn
.T
he
ma
inco
vari
ate
of
inte
rest
,HistoricalAntisemitism
,is
the
Vo
igtl
aen
der
-Vo
thp
rin
cipa
lco
mpo
nen
t(V
VP
.C.)
of
mea
sure
so
fJ
ewis
hpe
rsec
uti
on
inth
e1
92
0s-
19
30
s.H
isto
rica
lco
ntr
ols
incl
ud
e:lo
go
f
Jew
ish
pop
ula
tio
nin
19
33
,ra
tio
of
Ca
tho
lic
pop
ula
tio
nin
19
25
,lo
go
fpo
pu
lati
on
in1
93
3,
rati
oo
fpo
pu
lati
on
emp
loyed
inth
ere
tail
sect
or
in1
93
3,
an
dra
tio
of
pop
ula
tio
nem
plo
yed
in
ma
nu
fact
uri
ng
in1
93
3.
Reg
ion
al
con
tro
lsin
clu
de:
inco
me
per
cap
ita
,po
pu
lati
on
den
sity
,sh
are
of
coll
ege-
edu
cate
dpo
pu
lati
on
,la
titu
de,
an
din
dex
of
qua
lity
of
cult
iva
ble
lan
d.
We
repo
rt
Hu
bert
-Wh
ite
sta
nd
ard
erro
rs.∗p<
0.1
0,∗∗p<
0.0
5,∗∗∗p<
0.0
1.
Cos
tE
ffici
ency
Pri
ceE
ffici
ency
Ler
ner
Ind
ices
FE
ML
CM
CS
SF
FE
ML
CM
CS
SF
OL
SF
EM
LC
MC
SO
LS
CS
SF
(1)
(2)
(3)
(4)
(5)
(6)
(7)
(8)
(9)
(10)
(11)
His
tori
cal
Anti
sem
itis
m0.
000
−0.
002
0.00
6−
0.001
−0.
002
0.004
0.003
0.002
0.000
0.0
02
0.0
02
(VV
P.C
.)(0.0
02)
(0.0
03)
(0.0
04)
(0.0
04)
(0.0
02)
(0.0
06)
(0.0
04)
(0.0
04)
(0.0
03)
(0.0
03)
(0.0
04)
His
tori
cal
contr
ols
XX
XX
XX
XX
XX
X
Reg
ion
alco
ntr
ols
XX
XX
XX
XX
XX
X
Ob
serv
atio
ns
231
231
231
231
231
231
231
231
231
231
231
R2
0.00
80.
049
0.03
30.0
01
0.0
24
0.0
29
0.0
74
0.0
66
0.0
27
0.0
51
0.0
66
46

Tab
le8:
Pre
sent-
Day
Anti
sem
itis
mand
Xenophobia
Th
ista
ble
repo
rts
ave
rage
ma
rgin
al
effec
tsco
mp
ute
da
fter
esti
ma
tin
gth
efo
llo
win
gp
robi
tsp
efica
tio
n:
Pr(HoldsStocks i
k|X
ik,K
k)
=Φ
(α+β×HistoricalAntisemitism
k+X
′ ik×γ
+K
′ k×δ
+Incomedeciles
+ηt
+ε i
k).
Ea
cho
bser
vati
on
isa
Ger
ma
nh
ou
seh
old
inte
rvie
wed
byS
OE
Pbe
twee
n1
98
4a
nd
20
11
.In
all
colu
mn
s,th
ed
epen
den
tva
ria
ble
isa
du
mm
yth
at
equ
als
1if
the
ho
use
ho
ldh
old
sst
ocks
.T
he
ma
inco
vari
ate
of
inte
rest
,HistoricalAntisemitism
,is
the
Vo
igtl
aen
der
-Vo
thp
rin
cipa
lco
mpo
nen
t(V
VP
.C.)
of
mea
sure
so
fJ
ewis
h
pers
ecu
tio
nin
the
19
20
s-1
93
0s.Present−DayAntisemitism
an
dPresent−DayXenophobia
are
du
mm
ies
con
stru
cted
fro
mco
un
ty-l
evel
mea
sure
so
bta
ined
fro
mA
LL
BU
S.X
ikin
clu
des
the
foll
ow
ing
ind
ivid
ua
l-le
vel
con
tro
ls:
gen
der
,si
ngl
est
atu
sd
um
my,
age
(sec
on
d-d
egre
epo
lyn
om
ial)
,co
lleg
eed
uca
tio
nd
um
my.
Oth
erin
div
idu
al
con
tro
lsin
clu
de:
ho
meo
wn
ersh
ipd
um
my
an
dli
fea
nd
soci
al
insu
ran
ced
um
my.
Oth
erh
isto
rica
lco
ntr
ols
incl
ud
e:lo
go
fpo
pu
lati
on
in1
93
3,
rati
oo
fpo
pu
lati
on
emp
loyed
inth
ere
tail
sect
or
in1
93
3,
an
dra
tio
of
pop
ula
tio
nem
plo
yed
inm
an
ufa
ctu
rin
gin
19
33
.O
ther
regi
on
al
con
tro
lsin
clu
de:
pop
ula
tio
n
den
sity
,la
titu
de,
ind
exo
fqu
ali
tyo
fcu
ltiv
abl
ela
nd
.Incomedeciles
are
du
mm
ies
ind
ica
tin
gth
ed
ecil
eo
fth
ein
com
ed
istr
ibu
tio
nto
wh
ich
the
ho
use
ho
ldbe
lon
gs,
an
dΦ
isth
est
an
da
rdn
orm
al
cdf.
We
clu
ster
sta
nd
ard
erro
rsa
tth
eco
un
tyle
vel.∗p<
0.1
0,∗∗p<
0.0
5,∗∗∗p<
0.0
1.
Pre
sent-
Day
Anti
sem
itis
mX
enop
hob
iaX
enop
hob
iaX
enop
hob
ia
Tu
rks
Italian
sA
sylu
mS
eeker
s
(1)
(2)
(3)
(4)
(5)
(6)
(7)
(8)
(9)
(10)
Pre
sent-
Day
Anti
sem
itis
m−
0.0
08∗∗∗−
0.0
08∗∗
−0.0
05
−0.0
03
(0.0
03)
(0.0
04)
(0.0
04)
(0.0
05)
His
tori
cal
Anti
sem
itis
m−
0.0
20∗∗∗−
0.0
24∗∗∗
−0.0
24∗∗∗
−0.0
24∗∗∗
−0.0
24∗∗∗
(VV
P.C
.)(0.0
07)
(0.0
05)
(0.0
05)
(0.0
05)
(0.0
05)
Pre
sent-
day
Xen
op
hob
ia−
0.0
02
0.0
03
−0.0
04
0.0
05
0.0
03
0.0
01
(0.0
03)
(0.0
05)
(0.0
05)
(0.0
05)
(0.0
05)
(0.0
04)
Log
Jew
s1933
−0.0
14∗∗
−0.0
11∗
−0.0
10
−0.0
08
−0.0
08
−0.0
09
(0.0
07)
(0.0
07)
(0.0
08)
(0.0
08)
(0.0
08)
(0.0
08)
%C
ath
olics
1925
0.0
00∗
0.0
00
0.0
00
0.0
00
0.0
00
0.0
00
(0.0
00)
(0.0
00)
(0.0
00)
(0.0
00)
(0.0
00)
(0.0
00)
Age
−0.0
03
−0.0
03∗∗
−0.0
03∗∗
−0.0
03∗∗
(0.0
01)
(0.0
01)
(0.0
01)
(0.0
01)
Age2
/100
0.0
52
0.0
52∗∗∗
0.0
52∗∗∗
0.0
52∗∗∗
(0.0
14)
(0.0
14)
(0.0
13)
(0.0
014)
Fem
ale
−0.0
03
−0.0
03
−0.0
04
−0.0
03
(0.0
08)
(0.0
08)
(0.0
08)
(0.0
08)
Sin
gle
0.0
58∗∗∗
0.0
58∗∗∗
0.0
58∗∗∗
0.0
58∗∗∗
(0.0
11)
(0.0
11)
(0.0
11)
(0.0
11)
Colleg
e0.0
13∗∗∗
0.0
13∗∗∗
0.0
13∗∗∗
0.0
13∗∗∗
(0.0
05)
(0.0
05)
(0.0
05)
(0.0
05)
East
ern
Ger
many
−0.0
44∗
−0.0
46∗
−0.0
47∗
−0.0
45∗
(0.0
24)
(0.0
24)
(0.0
24)
(0.0
24)
Inco
me
p.c
.2005
0.0
02
0.0
00
0.0
00
0.0
00
(0.0
02)
(0.0
00)
(0.0
00)
(0.0
00)
%C
olleg
egra
du
ate
s2005
0.0
03∗
0.0
03∗
0.0
03∗
0.0
03∗
(0.0
02)
(0.0
02)
(0.0
02)
(0.0
02)
Inco
me
dec
iles
XX
XX
Oth
erin
div
idu
al
contr
ols
XX
XX
Oth
erh
isto
rica
lco
ntr
ols
XX
XX
XX
Oth
erre
gio
nal
contr
ols
XX
XX
Wave
gro
up
f.e.
XX
XX
Ob
serv
ati
on
s16,0
06
11,2
65
11,2
65
9,1
14
16,0
06
9,1
14
16,0
06
9,1
14
16,0
06
9,1
14
N.
of
clu
ster
s216
146
146
134
216
134
216
134
216
134
(Pse
ud
o-)
R2
0.0
01
0.0
04
0.0
04
0.1
12
0.0
00
0.1
12
0.0
00
0.1
11
0.0
00
0.1
11
47

Table 9: Historical Antisemitism, Distrust in Finance, and Financial Decisions
This table reports average marginal effects computed after estimating the following probit spefication:
Pr(Depvarik|Xik,Kk) = Φ(α+ β ×Historical Antisemitismk +X′k × γ + εik),
where the main covariate of interest, Historical Antisemitism, is the Voigtlaender-Voth principal component (VV P.C.) of
measures of Jewish persecution in the 1920s-1930s. Xik includes the following individual-level controls: gender, age-group fixed
effects (15-28, 29-35, 36-45, 46-60, 61+), education-group fixed effects (Hauptschule, Realschule, Abitur, Hochschulabschluss),
respondent’s elicited generalized trust, respondent’s elicited financial risk tolerance, and a dummy that equals 1 if the respondent
resides in Eastern Germany. Φ is the standard normal cdf. The outcome variables, Depvarik, are dummy variables indicated
at the top of each column. The outcome variables and the household-level demographics are from our own survey of present-day
Germans run by the company Clickworker, as described in section 7 of the paper. We cluster standard errors at the county level.
∗p < 0.10, ∗ ∗ p < 0.05, ∗ ∗ ∗p < 0.01.
Panel A: Historical Antisemitism and Distrust in Finance
Trust the Trust Commercial Trust Local
Stock Market Banks Banks
(1) (2) (3) (4) (5) (6)
Historical Antisemitism −0.047∗∗ −0.041∗∗ −0.001 0.001 −0.083∗∗∗ −0.082∗∗∗(VV P.C.) (0.020) (0.018) (0.021) (0.021) (0.025) (0.026)
Generalized Trust −0.002 0.041 0.066∗ 0.078∗ 0.100∗∗ 0.102∗∗(0.045) (0.032) (0.039) (0.039) (0.047) (0.047)
Risk Tolerance, East DE X X X X X X
Age group f.e. X X X
Gender f.e. X X X
Education group f.e. X X X
Observations 495 495 495 495 495 495
N. of clusters 57 57 57 57 57 57
Pseudo-R2 0.21 0.26 0.03 0.06 0.03 0.04
Panel B: Distrust in Finance and Stock Market Participation
Holds Relationship with Relationship with
Stocks Commercial Banks Local Banks
(1) (2) (3) (4) (5) (6)
Trust the Stock Market 0.224∗∗∗ 0.230∗∗∗ 0.032 −0.018 −0.093∗ −0.076
(0.065) (0.062) (0.070) (0.068) (0.055) (0.057)
Trust Commercial Banks 0.070 0.060 0.260∗∗∗ 0.279∗∗∗ −0.140∗∗∗ −0.145∗∗∗(0.060) (0.061) (0.068) (0.065) (0.051) (0.049)
Trust Local Banks 0.014 0.011 −0.039 −0.049 0.203∗∗∗ 0.211∗∗∗(0.049) (0.048) (0.055) (0.051) (0.048) (0.045)
Generalized Trust −0.011 −0.005 −0.089∗ −0.090∗∗ 0.096∗∗∗ 0.097∗∗(0.044) (0.042) (0.046) (0.043) (0.040) (0.038)
Risk Tolerance, East DE X X X X X X
Age group f.e. X X X
Gender f.e. X X X
Education group f.e. X X X
Observations 488 488 490 490 490 490
N. of clusters 57 57 57 57 57 57
Pseudo-R2 0.22 0.24 0.06 0.10 0.08 0.12
Panel C: Historical Antisemitism and Stock Market Participation
Hold Relationship with Relationship with
Stocks Commercial Banks Local Banks
(1) (2) (3) (4) (5) (6)
Historical Antisemitism −0.016∗∗ −0.014∗∗ 0.006∗∗ 0.008∗∗∗ 0.006 0.006
(VV P.C.) (0.007) (0.007) (0.003) (0.003) (0.006) (0.007)
Generalized Trust −0.002 0.004 −0.133∗∗ −0.127∗∗∗ 0.097∗ 0.098∗∗(0.046) (0.045) (0.051) (0.047) (0.054) (0.048)
Risk Tolerance, East DE X X X X X X
Age group f.e. X X X
Gender f.e. X X X
Education group f.e. X X X
Observations 342 342 344 344 344 344
N. of clusters 42 42 42 42 42 42
Pseudo-R2 0.20 0.23 0.03 0.10 0.02 0.0948

Online Appendix:
Historical Antisemitism, Ethnic Specialization,and Financial Development
Francesco D’Acunto, Marcel Prokopczuk, and Michael Weber
Not for Publication
1

1 Anti-Jewish Ideology, Nazi Votes, and Stockholdings
Incentives unrelated to antisemitism may have driven Jewish persecution. For instance,
individuals and political leaders may have hoped to seize Jewish property if they took part
in or promoted the attacks against Jews.
We therefore study the association between historical antisemitism and current
stockholdings, using a source of variation of ideological anti-Jewish sentiment different from
persecution, namely, voting. Unlike persecution, voting is unobservable and not verifiable.
Voting choices were unlikely to raise the expectation of rewards by the Nazis before the
start of the Third Reich. The Nazis rose to power during a long and deep economic crisis:
hyperinflation was a major concern, and unemployment plagued several counties. Many
voters supported the Nazi party (which had not been in power before 1933) in the hope
of improving their economic conditions. de Bromhead, Eichengreen, and O’Rourke (2013)
show that persistently depressed economic conditions are a strong predictor of the electoral
support of right-wing, anti-system parties in Europe in the 1930s. Thus, voting for the Nazi
party in 1933 should be a valid proxy for anti-Jewish sentiment in areas where unemployment
in 1933 was low. The economic crisis was less severe in those areas, and votes for the Nazis
were more likely to capture the local support for their ideological platform. By contrast,
votes for the Nazis should be a noisier proxy for anti-Jewish sentiment in counties where
unemployment was high, that is, where voters were likely driven by economic motives when
voting for the Nazis. This argument does not imply the Nazis had higher support, on average,
in counties with higher unemployment,1 but it exploits the different motives within the group
of Nazi voters in 1933.
If indeed past anti-Jewish sentiment reduces stock market participation, we would
expect a negative association between Nazi vote shares in 1933 and present-day stockholdings
in counties where unemployment was low in 1933, and a less negative effect in other counties.
We find exactly this pattern. In Figure A.3, the left vertical axis reports the average marginal
effect of the Nazi vote share in 1933 elections on households’ stockholdings, and is associated
with the histograms. The horizontal axis indicates the percentile of the distribution of
counties by the unemployment rate in 1933. We sort counties in cumulative percentiles of
this distribution. For instance, the histogram labeled “20” reports the average marginal
1In fact, King, Rosen, Tanner, and Wagner (2008) find that voters hit by the economic crisis but withouta high risk of unemployment supported the Nazi party in 1933.
2

effect for households in counties in which the unemployment rate in 1933 was below the
20th percentile. The right vertical axis reports the standard errors attached to the marginal
effects, which are clustered at the county level. They are associated with the black line.
The average marginal effect of Nazi vote shares in 1933 is negative in counties with low
unemployment in 1933, up to the 45th percentile of the distribution. The magnitude of the
effect and its statistical significance decrease up to the 80th percentile. The effect becomes
economically and statistically insignificant once we add households in counties above the
85th percentile of the distribution of unemployment in 1933.
In Figure A.4 of the Online Appendix, we find a virtually identical pattern to that in
Figure A.3 for the September 1930 elections. These elections were held during the economic
crisis but in a time when the Nazis had no control of the German mass media, such as the
radio (Adena, Enikolopov, Petrova, Santarosa, and Zhuravskaya, 2015). We also propose
a set of placebo analyses to corroborate our interpretation of the evidence. Figure A.4
of the Online Appendix shows that votes for the Social-Democrats or Communists do not
predict the same pattern as Nazi votes. Whereas the economic motives to vote for these
parties might be similar to the motives to vote for the Nazis, these parties should not have
attracted antisemite more than the Nazis. In Panels (d), (e), and (f), we show the Nazi
votes are uncorrelated with the likelihood that households invest in life insurance products,
that the household head is a woman, or with household income.2
2 Additional Robustness Checks
We check the robustness of the negative association between historical antisemitism and
present-day stock market participation by considering partitions of the full sample and
adding additional covariates.
In Table A.1, we first add religiosity from the world value survey in column (1). Column
(2) excludes current households in counties that were wealthy in the distant past, that
is, counties hosting any Hanseatic League cities, and column (3) excludes counties whose
cities hosted at least one bishop seat. The rationale for the latter exclusion is that in
counties with bishop seats, the ban on locals to engage in moneylending might have been
enforced more strictly than in other counties, and at the same time, a culture of distrust
2In unreported results, we also find no significant associations if using the age, the education level, or thehomeownership status of the household head as alternative outcomes.
3

toward moneylending might have been stronger. Across all columns, we confirm our baseline
findings.
Table A.2 augments equation 1 with geographic fixed effects, which only exploit the
variation in Jewish persecution across counties close in space. In column (1), we look
at counties in the same state (Bundesland). Counties in the same state are exposed
to the same current institutions, but are not necessarily exposed to the same historical
institutions, because the borders of states do not always coincide with the borders of
historical administrative regions. Moreover, some states consist of a few counties, and
hence have minor variation in Jewish persecution. To address these issues, in columns
(2)-(3) of Table A.2 , we divide Germany into 9 and 16 arbitrary squares of similar size
by longitude and latitude, which we label ”virtual states.” We only exploit the variation
in Jewish persecution across counties that fall in the same squares.3 This method also
overcomes the endogeneity of state borders. In column (4) of Table A.2, we only exploit
the variation in Jewish persecution within occupation zones after the Second World War.
These zones do not perfectly overlap with the present-day state boundaries, and occupants
implemented different denazification policies across zones. All specifications replicate the
baseline results. In column (5), we estimate the baseline specification at the county level.
This test addresses the concern that individual observations in a county may be spatially
correlated in a way not properly accounted for by the clustering of the standard errors at
the county level. Across all specifications, the results are similar to the baseline analysis.
3Figure A.7 of the Online Appendix plots the composition of the virtual states.
4

Figure A.1: Medieval Jewish Persecution: Pogroms during the Black Deatharound 1349
The figure plots the values of our proxy for historical Jewish persecution in the Middle Ages – a dummy
variable for whether a pogrom against the local Jewish communities in a county was documented in 1349.
Black counties are those for which we observe a pogrom against the local Jewish community in 1349, whereas
grey counties are those for which we observe no pogroms despite the presence of a community in 1349. Blank
counties are those for which we observe no communities in 1349, or we have no data about medieval Jewish
persecution.
5

Figure A.2: Historical Antisemitism and Stockholdings: Raw Data
(a) Voigtlaender-Voth Principal Component (VV P.C.) (b) Logarithm Jews Deported
0.2
.4.6
Rat
io o
f Hou
seho
lds
who
Ow
n S
tock
s (a
vera
ge 1
984-
2010
)
-4 -2 0 2 4Principal Component Measures of Jewish Persecution
0.2
.4.6
Rat
io H
ouse
hold
s w
ho O
wn
Sto
cks
(ave
rage
198
4-20
10)
0 2 4 6 8 10Log Total Jewish Deportations
(c) Ratio Jews Deported (d) Pogrom in 1349
0.2
.4.6
Rat
io H
ouse
hold
s w
ho O
wn
Sto
cks
(ave
rage
198
4-20
10)
0 20 40 60 80 100Ratio Deported Jewish Population (base: 1933)
.14
.15
.16
.17
.18
Rat
io o
f Hou
seho
lds
who
Ow
n S
tock
s (a
vera
ge 1
984-
2010
)
No Pogroms in 1349 At Least one Pogrom in 1349
The figures plot the correlation between proxies of historical antisemitism and current-day stock market
participation at the county level. We average the micro data from the SOEP to obtain measures of stock
market participation at the county level. The sample period is 1984-2011.
6

Figure A.3: Nazi Votes, Economic Crisis, and Stock Market Participation
0.00
0.05
0.10
0.15
0.20
0.25
0.30
0.35
0.40‐0.40
‐0.35
‐0.30
‐0.25
‐0.20
‐0.15
‐0.10
‐0.05
0.0020 25 30 35 40 45 50 55 60 65 70 75 80 85 90 95 100
Stan
dard
Err
ors
Effe
ct o
f 193
3 N
azi
Vote
s o
n S
tock
hold
ings
Percentile county-level unemployment 1933
The figure plots the average marginal effects of the variable V oteShareNazi1933 on current-day stock market participation computed after estimating the following
probit specification in subsamples of households sorted by the unemployment rate in their county of residence as of 1933:
Pr(HoldsStocksik|Xi,Kk) = Φ(α+ β × V oteShareNazi1933k +X ′i × γ +K ′k × δ + ηt + εik).
Each observation is a German household interviewed by SOEP between 1984 and 2011. The left vertical axis reports the average marginal effect of
V oteShareNazi1933, and it is associated with the histograms. The horizontal axis indicates the percentile of the distribution of counties by the unemployment
rate in 1933. For instance, the histogram labeled “20” reports the average marginal effect for estimating the probit model only for households that live in counties
where the unemployment rate in 1933 was below the 20th percentile; the histogram labeled “30” reports the average marginal effect for estimating the probit model
only for households that live in counties where the unemployment rate in 1933 was below the 30th percentile. The right vertical axis reports standard errors
attached to each marginal effect. We cluster standard errors at the county level, and they are associated with the black line. Dark brown histograms are marginal
effects that are significant at the 1% level or lower; orange histograms, at the 5% level; white histograms are not significant at any conventional level.
7

Figure A.4: Votes and Placebo Outcomes
Nazi Votes in 1930 SPD Votes in 1933 KPD Votes in 1933
-0.05
0
0.05
0.1
0.15
0.2
0.25
0.3
0.35
0.4
0.45-0.45
-0.4
-0.35
-0.3
-0.25
-0.2
-0.15
-0.1
-0.05
0
0.05
20 25 30 35 40 45 50 55 60 65 70 75 80 85 90 95 100
Sta
md
ard
err
ors
M.E
. Per
c. V
otes
Naz
i 30
on c
urr
ent
stoc
kh
old
ings
Percentile unemployment Kreis 1930
-0.1
0
0.1
0.2
0.3
0.4
-0.1
0
0.1
0.2
0.3
0.4
20 25 30 35 40 45 50 55 60 65 70 75 80 85 90 95 100
0
0.2
0.4
0.6
0.8
1-1
-0.8
-0.6
-0.4
-0.2
020 25 30 35 40 45 50 55 60 65 70 75 80 85 90 95 100
Female Household Head Household Income Invest in Life Insurance
0
0.05
0.1
0.15
0.2
0.25‐0.25
‐0.2
‐0.15
‐0.1
‐0.05
020 25 30 35 40 45 50 55 60 65 70 75 80 85 90 95 100
‐6000
‐4000
‐2000
0
2000
4000
6000
8000
10000‐10000
‐8000
‐6000
‐4000
‐2000
0
2000
4000
6000
20 25 30 35 40 45 50 55 60 65 70 75 80 85 90 95 100
‐0.05
0
0.05
0.1
0.15
0.2
0.25
‐0.05
0
0.05
0.1
0.15
0.2
0.25
20 25 30 35 40 45 50 55 60 65 70 75 80 85 90 95 100
The figure plots the average marginal effects of the variables listed on top of each figure for the top panel on current-day stock market participation computed after
estimating the probit specification of Figure A.3 or the following OLS specifications for the bottom panel in subsamples of households sorted by the unemployment
rate in their county of residence as of 1933:DepV arik = α+ β × V oteSharek +X ′i × γ +K ′k × δ + ηt + εik.
Each observation is a German household interviewed by SOEP between 1984 and 2011. DepV ar is indicated on top of each figure for the bottom three figures.
In each graph, the left vertical axis reports the OLS coefficient on V oteShare, and it is associated with the histograms. In the top panel, V oteShare is indicated
on top of each figure, whereas it is V oteShareNazi1933 in the bottom panel. The horizontal axis indicates the percentile of the distribution of counties by the
unemployment rate in 1933. For instance, the histogram labeled “20” reports the average marginal effect for estimating the OLS coefficient only for households that
live in counties where the unemployment rate in 1933 was below the 20th percentile; the histogram labeled “30” reports the OLS coefficient only for households
which live in counties where the unemployment rate in 1933 was below the 30th percentile. The right vertical axis reports standard errors attached to each
coefficient. We cluster standard errors at the county level, and they are associated with the black line. Dark brown histograms are marginal effects that are
significant at the 1% level or lower; orange histograms, at the 5% level; white histograms are not significant at any conventional level.
8

Figure A.5: Supply-Side Channel 2: Historical Antisemitism & Spread of CreditUnions
(a) Diffusion Path of Credit Unions Across Space and Over Time
Until 1860 Until 1875
4850
5254
Latit
ude
6 8 10 12 14 16Longitude
4850
5254
Latit
ude
6 8 10 12 14 16Longitude
Until 1900 Up to the present
4850
5254
Latit
ude
6 8 10 12 14 16Longitude
4850
5254
Latit
ude
6 8 10 12 14 16Longitude
(b) Historical Antisemitism and the Foundation of Credit Unions
1850
1900
1950
Yea
r F
irst V
B-R
aiffe
isen
bank
foun
ded
in K
reis
0 20 40 60 80 100Fraction Deported Jewish Population (base: 1933)
Panel (a) plots the Germans counties with existing credit unions at different points in time. Each marker
represents a different county. Panel (b) plots the correlation between the founding year of the first credit
union in a given county and the ratio of Jews deported during the Nazi period over the total Jewish population
in 1933. The underlying data on the foundation dates is obtained from the Hoppenstedt database.
9

Figure A.6: Supply-Side Channel 3: Jews in Finance & Present-Day Stockholdings
(a) Ratio of Jews in Finance in 1882 and Present-Day Stockholdings-.
04-.
020
.02
.04
.06
Like
lihoo
d H
ouse
hold
Hol
ds S
tock
s (r
esid
uals
)
10 20 30 40 50 60 70 80 90 100
Ratio Jews in Finance 1882 (county)
(b) Ratio of Jews in 1933 and Present-Day Stockholdings
-.08
-.04
0.0
4.0
8Li
kelih
ood
Hou
seho
ld H
olds
Sto
cks
(res
idua
l)
10 20 30 40 50 60 70 80 90 100Ratio Jews over Population 1933 (county)
This figure plots the average residuals from regressing a dummy that equals 1 if the household holds stocks on
the controls of equation (1) in the main body of the paper, across the deciles of the distribution of the share of
Jewish employees in the financial sector in a county as of 1882 in Panel (a) and of the ratio of Jews over the
total German population in a county as of 1933 in Panel (b). Intervals represent 95% confidence intervals
for the estimated averages. We use the micro data underlying SOEP to measure stock market participation,
and the Ifo Prussian Economic History Database to measure the share of employees in the financial sector.
10

Figure A.7: Virtual States
(a) 9 Virtual States
4850
5254
56LA
T
6 8 10 12 14LON
(b) 16 Virtual States
4850
5254
56LA
T
6 8 10 12 14LON
11

Table A.1: Historical Antisemitism and Present-Day Stock Market Participation:Robustness
This table reports average marginal effects computed after estimating the following probit
spefication:
Pr(HoldsStocksik|Xik,Kk) = Φ(α+β×Historical Antisemitismk+X ′ik×γ+K ′k×δ+Income deciles+ηt+εik),
across subsamples defined by the column headings. Each observation is a German household
interviewed by SOEP between 1984 and 2011. In all columns, the dependent variable is
a dummy that equals 1 if the household holds stocks. The main covariate of interest,
Historical Antisemitism, is the Voigtlaender-Voth principal component (VV P.C.) of measures of
Jewish persecution in the 1920s-1930s. Individual controls include: gender, single status dummy,
age (second-degree polynomial), college education dummy, homeownership dummy, and life and
social insurance dummy. Historical controls include: log of Jewish population in 1933, ratio of
Catholic population in 1925, log of population in 1933, ratio of population employed in the retail
sector in 1933, and ratio of population employed in manufacturing in 1933. Regional controls
include: income per capita, population density, share of college-educated population, latitude, and
index of quality of cultivable land. Φ is the standard normal cdf. We cluster standard errors at the
county level. ∗p < 0.10, ∗ ∗ p < 0.05, ∗ ∗ ∗p < 0.01.
Ad
din
g
Rel
igio
sity
Excl
.
Han
se
Excl
.B
ish
op
Sea
ts
(1) (2) (3)
Historical Antisemitism −0.010∗∗ −0.011∗∗∗ −0.013∗∗∗(VV P.C.) (0.005) (0.004) (0.004)
Observations 13,599 13,599 11,289
N. of clusters 261 261 235
(Pseudo-) R2 0.093 0.093 0.093
Income deciles X X X
Individual controls X X X
Historical controls X X X
Regional controls X X X
Wave group f.e. X X X
12

Table A.2: Geographically Close Counties
This Table reports average marginal effects computed after estimating the following probit specification:
Pr(HoldsStocksik|Xik,Kk) = Φ(α+β×Historical Antisemitismk +X ′ik×γ+K ′k×δ+Income deciles+ηt +εik)
adding the geographic fixed effects described on the column headings. Each observation is a German household
interviewed by SOEP between 1984 and 2011. In all columns, the dependent variable is a dummy that
equals 1 if the household holds stocks. The main covariate of interest, Historical Antisemitism, is the
Voigtlaender-Voth principal component (VV P.C.) of Jewish persecution in the 1920s-1930s,. Xik includes the
following individual-level controls: gender, single status dummy, age (second-degree polynomial), college education
dummy. Other individual controls include: homeownership dummy and life and social insurance dummy. Other
historical controls include: log of population in 1933, ratio of population employed in the retail sector in 1933, and
ratio of population employed in manufacturing in 1933. Other regional controls include: population density, latitude,
index of quality of cultivable land. Income deciles are dummies indicating the decile of the income distribution to
which the household belongs, and Φ is the standard normal cdf. We cluster standard errors at the county level.
∗p < 0.10, ∗ ∗ p < 0.05, ∗ ∗ ∗p < 0.01.
Wit
hin
Sta
tes
Wit
hin
9
Vir
tual
Sta
tes
Wit
hin
16
Vir
tual
Sta
tes
Wit
hin
WW
2
Occ
up
atio
n
Zon
e
Cou
nty
Lev
el
(1) (2) (3) (4) (5)
Historical Antisemitism −0.012∗∗ −0.012∗∗ −0.010∗ −0.018∗∗∗ −0.021∗∗∗(VV P.C.) (0.006) (0.005) (0.006) (0.006) (0.007)
Observations 13,870 13,870 13,870 13,870
N. of clusters 270 270 270 270 270
(Pseudo-) R2 0.12 0.12 0.11 0.10 0.25
Individual contr. X X X X
Historical contr. X X X X X
Regional controls X X X X X
Wave group f.e X X X X
Standard errors in parentheses
∗p < 0.10, ∗ ∗ p < 0.05, ∗ ∗ ∗p < 0.01
13

Tab
leA
.3:
Wealt
h,
Fin
anci
al
Lit
era
cy,
and
Ris
kT
ole
rance
:T
he
PH
FSam
ple
This
tabl
ere
port
save
rage
marg
inal
effec
tsfo
rva
riou
ssp
ecifi
cati
on
s.T
he
main
cova
riate
of
inte
rest
,HistoricalAntisemitism
,is
the
Voig
tlaen
der
-Voth
pri
nci
pal
com
pon
ent
(VV
P.C
.)of
mea
sure
sof
Jew
ish
pers
ecu
tion
inth
e1920s-
1930s.
Indiv
idu
al
con
trols
incl
ude:
gen
der
,si
ngl
est
atu
sdu
mm
y,age
(sec
on
d-d
egre
e
poly
nom
ial)
,co
lleg
eed
uca
tion
du
mm
y,hom
eow
ner
ship
du
mm
y,li
fean
dso
cial
insu
ran
cedu
mm
y,fi
nan
cial
lite
rary
,ri
skto
lera
nce
,an
dre
ligi
osi
ty.
His
tori
cal
con
trols
incl
ude:
log
of
Jew
ish
popu
lati
on
in1933,
rati
oof
Cath
oli
cpo
pu
lati
on
in1925,
log
of
popu
lati
on
in1933,
rati
oof
popu
lati
on
emplo
yed
inth
ere
tail
sect
or
in1933,
an
dra
tio
of
popu
lati
on
emplo
yed
inm
an
ufa
ctu
rin
gin
1933.
Reg
ion
al
con
trols
incl
ude:
inco
me
per
capit
a,
popu
lati
on
den
sity
,sh
are
of
coll
ege-
edu
cate
d
popu
lati
on
,la
titu
de,
an
din
dex
of
quali
tyof
cult
ivabl
ela
nd.
The
ou
tcom
eva
riabl
esan
dth
ehou
sehold
-lev
eldem
ogra
phic
sare
from
the
firs
tw
ave
of
the
Pan
elof
Hou
sehold
Fin
an
ces
of
the
Ger
man
Bu
ndes
ban
k.A
llco
lum
ns
con
tain
all
indiv
idu
al
con
trols
,his
tori
cal
con
trols
,re
gion
al
con
trols
,an
dw
ealt
hdec
iles
.W
ecl
ust
er
stan
dard
erro
rsat
the
cou
nty
leve
l.∗p<
0.1
0,∗∗p<
0.05,∗∗∗p<
0.01.
Hold
sH
old
sS
aves
Has
Hom
e-E
ntr
e-H
as
Gover
n.
Has
HH
isH
as
Cre
dit
Tru
sts
Cash
/
Sto
cks
Sto
cks
dir
ectl
yM
ort
gage
ow
ner
neu
rb
on
ds
Com
mod
itie
scr
edit
or
Card
Oth
ers
Wea
lth
Pro
bit
Pro
bit
Pro
bit
OL
SP
rob
itP
rob
itP
rob
itP
rob
itP
rob
itP
rob
itP
rob
itO
LS
(1)
(2)
(3)
(4)
(5)
(6)
(7)
(8)
(9)
(10)
(11)
(12)
His
tori
cal
Anti
sem
itis
m−
0.0
71
−0.0
17
0.0
22
−0.0
41
−0.0
29
−0.0
17
−0.0
07
−0.0
13
0.0
38
−0.0
31
−0.0
26
0.0
35
(VV
P.C
.)(0.0
31)∗∗
(0.0
08)∗∗
(0.0
32)
(0.0
21)∗∗
(0.0
27)
(0.0
25)
(0.0
05)
(0.0
29)
(0.0
23)∗
(0.0
40)
(0.0
42)
(0.0
21)∗
Log
Jew
s1933
−0.0
05
−0.0
01
−0.0
17
0.0
13
−0.0
28
0.0
15
0.0
01
−0.0
09
−0.0
11
0.0
40
0.0
11
0.0
04
(0.0
10)
(0.0
02)
(0.0
11)
(0.0
07)∗
(0.0
09)∗∗∗
(0.0
08)∗
(0.0
02)
(0.0
09)
(0.0
06)∗
(0.0
13)∗∗∗
(0.0
12)
(0.0
08)
%C
ath
olics
1925
0.0
33
0.0
11
0.0
15
0.0
28
−0.0
21
0.0
31
0.0
06
0.0
03
−0.0
07
−0.0
71
−0.0
34
−0.0
24
(0.0
36)
(0.0
10)
(0.0
49)
(0.0
24)
(0.0
36)
(0.0
35)
(0.0
06)
(0.0
36)
(0.0
31)
(0.0
56)
(0.0
49)
(0.0
29)
Age
0.0
04
0.0
02
0.0
13
0.0
27
0.0
20
0.0
15
0.0
01
−0.0
04
0.0
11
0.0
21
−0.0
15
−0.0
09
(0.0
06)
(0.0
02)
(0.0
07)∗
(0.0
06)∗∗∗
(0.0
05)∗∗∗
(0.0
06)∗∗∗
(0.0
01)
(0.0
04)
(0.0
05)∗∗
(0.0
06)∗∗∗
(0.0
07)∗∗
(0.0
04)∗∗
Age2
/100
0.0
00
0.0
00
−0.0
01
−0.0
01
−0.0
01
−0.0
01
0.0
00
0.0
00
0.0
00
−0.0
01
0.0
01
0.0
01
(0.0
01)
(0.0
01)
(0.0
00)∗∗
(0.0
01)∗∗∗
(0.0
00)∗∗∗
(0.0
00)∗∗
(0.0
01)
(0.0
01)
(0.0
00)∗∗
(0.0
00)∗∗∗
(0.0
00)∗∗
(0.0
00)∗∗
Male
0.0
69
0.0
03
−0.0
06
−0.0
16
−0.0
05
0.0
06
0.0
11
0.0
14
0.0
23
0.0
40
−0.0
38
0.0
18
(0.0
17)∗∗∗
(0.0
05)
(0.0
28)
(0.0
15)
(0.0
22)
(0.0
21)
(0.0
06)∗
(0.0
19)
(0.0
18)
(0.0
28)
(0.0
30)
(0.0
18)
Sin
gle
−0.0
31
−0.0
07
−0.0
42
−0.0
79
−0.0
38
0.0
40
0.0
15
−0.0
05
0.0
67
0.0
05
0.0
66
0.0
24
(0.0
47)
(0.0
18)
(0.0
49)
(0.0
47)∗
(0.0
38)
(0.0
43)
(0.0
10)
(0.0
41)
(0.0
34)∗
(0.0
44)
(0.0
66)
(0.0
50)
Colleg
e0.0
55
−0.0
01
0.0
76
0.0
08
−0.0
58
0.0
43
0.0
10
0.0
31
−0.0
10
0.1
74
0.0
40
0.0
08
(0.0
29)∗
(0.0
07)
(0.0
37)∗∗
(0.0
21)
(0.0
30)∗
(0.0
29)
(0.0
05)∗
(0.0
24)
(0.0
22)
(0.0
31)∗∗∗
(0.0
41)
(0.0
21)
East
ern
Ger
many
0.0
04
0.0
07
−0.1
07
−0.0
61
−0.0
62
−0.0
16
0.0
03
0.0
30
0.0
44
0.0
01
−0.0
42
0.0
96
(0.0
50)
(0.0
10)
(0.0
47)∗∗
(0.0
33)∗
(0.0
36)∗
(0.0
59)
(0.0
11)
(0.0
42)
(0.0
36)
(0.0
54)
(0.0
53)
(0.0
35)∗∗
Fin
.L
iter
acy
0.0
62
0.0
00
0.0
03
0.0
17
0.0
78
0.0
32
−0.0
03
−0.0
36
0.0
09
0.0
36
−0.0
57
−0.0
73
(0.0
25)∗∗
(0.0
08)
(0.0
38)
(0.0
23)
(0.0
28)∗∗∗
(0.0
24)
(0.0
04)
(0.0
22)∗
(0.0
19)
(0.0
28)
(0.0
38)
(0.0
29)∗∗
Ris
kL
ovin
g0.2
28
0.0
23
0.0
32
0.0
34
−0.0
12
0.0
80
0.0
03
0.0
17
0.0
28
0.1
38
0.1
00
−0.0
66
(0.0
21)∗∗∗
(0.0
10)∗∗
(0.0
32)
(0.0
19)∗
(0.0
20)
(0.0
23)∗∗∗
(0.0
06)
(0.0
21)
(0.0
19)
(0.0
25)∗∗∗
(0.0
29)∗∗∗
(0.0
26)∗∗
Rel
igio
sity
−0.0
02
−0.0
06
−0.0
26
−0.0
40
−0.0
39
−0.0
16
0.0
05
0.0
19
−0.0
23
−0.0
92
0.0
64
0.0
32
(0.0
26)
(0.0
09)
(0.0
37)
(0.0
29)
(0.0
29)
(0.0
33)
(0.0
06)
(0.0
28)
(0.0
29)
(0.0
43)∗∗
(0.0
44)
(0.0
30)
Ob
serv
ati
on
s1,2
56
1,2
56
1,2
56
1,2
56
1,2
56
1,2
56
1,2
56
1,2
56
1,2
56
1,2
56
1,2
56
1,2
56
N.
of
clu
ster
s99
99
99
99
99
99
99
99
99
99
99
99
Pse
ud
o-R
20.2
70.2
80.0
60.1
60.1
50.1
10.1
70.0
20.0
40.2
10.0
50.0
8
14

Tab
leA
.4:
Med
ieval
Anti
sem
itis
mand
Pre
sent-
Day
Sto
ckM
ark
et
Part
icip
ati
on:
Robust
ness
This
Tabl
ere
port
save
rage
marg
inal
effec
tsco
mpu
ted
aft
eres
tim
ati
ng
the
foll
ow
ing
pro
bit
spefi
cati
on
:
Pr(HoldsStocks i
k|X
ik,K
k)
=Φ
(α+β×MedievalAntisemitism
k+X′ ik×γ
+K′ k×δ
+Incomedeciles
+η t
+ε ik),
acr
oss
subs
am
ple
sdefi
ned
byth
eco
lum
nhea
din
gs.
Each
obs
erva
tion
isa
Ger
man
hou
sehold
inte
rvie
wed
byS
OE
Pbe
twee
n1984
an
d2011.
Inall
colu
mn
s,th
e
dep
enden
tva
riabl
eis
adu
mm
yth
at
equ
als
1if
the
hou
sehold
hold
sst
ocks
.T
he
main
cova
riate
of
inte
rest
,MedievalAntisemitism
,is
adu
mm
yva
riabl
eth
at
equ
als
1if
apo
grom
happe
ned
inco
un
tyk
du
rin
gth
eB
lack
Dea
thpe
riod
(aro
un
d1349),
an
dze
rooth
erw
ise.
Indiv
idu
al
con
trols
incl
ude:
gen
der
,si
ngl
est
atu
s
du
mm
y,age
(sec
on
d-d
egre
epo
lyn
om
ial)
,co
lleg
eed
uca
tion
du
mm
y,hom
eow
ner
ship
du
mm
y,an
dli
fean
dso
cial
insu
ran
cedu
mm
y.H
isto
rica
lco
ntr
ols
incl
ude:
log
of
Jew
ish
popu
lati
on
in1933,
rati
oof
Cath
oli
cpo
pu
lati
on
in1925,
log
of
popu
lati
on
in1933,
rati
oof
popu
lati
on
emplo
yed
inth
ere
tail
sect
or
in1933,
an
dra
tio
of
popu
lati
on
emplo
yed
inm
an
ufa
ctu
rin
gin
1933.
Reg
ion
al
con
trols
incl
ude:
inco
me
per
capit
a,
popu
lati
on
den
sity
,sh
are
of
coll
ege-
edu
cate
dpo
pu
lati
on
,la
titu
de,
an
din
dex
of
quali
tyof
cult
ivabl
ela
nd.
Φis
the
stan
dard
norm
al
cdf.
We
clu
ster
stan
dard
erro
rsat
the
cou
nty
leve
l.∗p<
0.1
0,∗∗p<
0.05,∗∗∗p<
0.01.
OnlyWestern
Germany
Adding
Longitude
Adding
Religiosity
Excl.
Hanse
Excl.Bishop
Seats
Excl.Least
Populated
Excl.High
Inequality
Excl.Poorest
Counties
ExclLeast
Educated
(1)
(2)
(3)
(4)
(5)
(6)
(7)
(8)
(9)
PanelA.All
Counties
Med
ieva
lA
nti
sem
itis
m−
0.02
1∗∗
−0.
016∗
−0.
018∗
−0.
019∗
−0.0
18∗
−0.0
19∗
−0.0
16∗
−0.0
16∗
−0.
025∗∗
(Pog
rom
1349
)(0.0
10)
(0.0
09)
(0.0
10)
(0.0
10)
(0.0
10)
(0.0
11)
(0.0
09)
(0.0
09)
(0.0
12)
Ob
serv
atio
ns
12,8
7513
,870
13,8
70
11,5
60
12,4
23
11,3
19
11,2
58
11,2
95
10,3
87
N.
ofcl
ust
ers
232
270
270
244
249
193
214
205
199
(Pse
ud
o-)
R2
0.10
70.
093
0.0
93
0.0
94
0.0
93
0.0
96
0.0
94
0.0
96
0.0
91
PanelB.Only
ifJewish
Communityin
1300
Med
ieva
lA
nti
sem
itis
m−
0.01
9∗
−0.
014∗
−0.
016∗
−0.
016∗
−0.0
15∗
−0.0
19∗
−0.0
15∗
−0.0
12
−0.
026∗∗
(Pog
rom
1349
)(0.0
10)
(0.0
08)
(0.0
09)
(0.0
09)
(0.0
09)
(0.0
11)
(0.0
09)
(0.0
09)
(0.0
12)
Ob
serv
atio
ns
11,9
3312
,873
12,8
73
10,5
63
11,4
26
10,6
01
10,6
12
10,5
09
9,6
30
N.
ofcl
ust
ers
212
248
248
222
227
180
197
189
184
(Pse
ud
o-)
R2
0.10
70.
093
0.0
93
0.0
94
0.0
93
0.0
96
0.0
94
0.0
97
0.0
91
Inco
me
dec
iles
XX
XX
XX
XX
X
Ind
ivid
ual
contr
ols
XX
XX
XX
XX
X
His
tori
cal
contr
ols
XX
XX
XX
XX
X
Reg
ion
alco
ntr
ols
XX
XX
XX
XX
X
Wav
egr
oup
f.e.
XX
XX
XX
XX
X
15

Table A.5: Three-stage OLS: Distance from Rhine, Medieval Antisemitism, andStockholdings
This table reports OLS coefficients for the three-stage instrumental variable procedure described in section 6. In the
first stage (Panel A), the probability that a Jewish community existed in 1349 in each German county is predicted
by the distance of the county from the Rhine Valley. In the second stage (Panel B), a dummy variable that equals
1 if a pogrom happened in county k during the Black Death period (around 1349), and zero otherwise is predicted
with the predicted probability that a Jewish community existed in a county in 1349. In the third stage (Panel C), the
ratio of households who own stocks in each county is predicted with the predicted extent of Jewish persecution. In
all stages observations are German counties and coefficients are estimated with OLS. Individual controls include:
gender, single status dummy, age (second-degree polynomial), college education dummy, homeownership dummy,
and life and social insurance dummy. Historical controls include: log of Jewish population in 1933, ratio of Catholic
population in 1925, log of population in 1933, ratio of population employed in the retail sector in 1933, and ratio of
population employed in manufacturing in 1933. Regional controls include: income per capita, population density,
share of college-educated population, latitude, and index of quality of cultivable land. We report Hubert-White
standard errors. ∗p < 0.10, ∗ ∗ p < 0.05, ∗ ∗ ∗p < 0.01.
Distance Distance Distance Distance Distance
Mainz Worms Speyer Trier Emmerich
Panel A. First Stage: Jewish Community Exists in 1349
(1) (2) (3) (4) (5)
Log Distance −0.227∗∗∗ −0.199∗∗∗ −0.186∗∗∗ −0.131∗∗∗ −0.196∗∗∗(0.006) (0.006) (0.007) (0.007) (0.008)
Adj. R2 0.35 0.34 0.33 0.30 0.32
Panel B. Second Stage: Medieval Antisemitism (Pogrom1349)
Existence 1349 0.784∗∗∗ 0.752∗∗∗ 0.697∗∗∗ 0.897∗∗∗ 0.842∗∗∗(0.029) (0.034) (0.038) (0.057) (0.041)
Adj. R2 0.38 0.37 0.36 0.36 0.37
Panel C. Third Stage: Holds Stocks
Medieval Antisemitism −0.016∗∗ −0.016∗∗ −0.017∗∗ −0.017∗∗ −0.017∗∗(Pogrom1349) (0.008) (0.008) (0.008) (0.008) (0.008)
Adj. R2 0.08 0.08 0.08 0.08 0.08
Income deciles X X X X X
Individual controls X X X X X
Historical controls X X X X X
Regional controls X X X X X
Wave group f.e. X X X X X
Observations 13,870 13,870 13,870 13,870 13,870
16

Table A.6: Jewish Population and Geman Sectors in 1882
This table reports the number of Jewish employees by sector and the total sector size. The data are from the first
Census in Prussia in 1882.
Jews Total sector Jews/ Total sector/
Total sector overall workers
(1) (2) (3) (4)
Total working population 357,546 11,037,320 3.24% 100.00%
Unemployed 2.60% 6.12%
Agriculture, Manufacturing, Trade
Agriculture 1,641 4,625,893 0.04% 41.91%
Forestry and fishing 65 66,455 0.10% 0.60%
Mining and metal transf. 1,255 866,794 0.15% 7.85%
Chemical 266 28,908 0.92% 0.26%
Textile 1,724 385,565 0.45% 3.49%
Food and beverage 9,239 363,837 2.54% 3.30%
Building and construction 1,312 533,925 0.25% 4.84%
Printing 555 35,352 1.57% 0.32%
Retail trade 70,175 466,249 15.05% 4.22%
Bookshops, art dealers 485 9,580 5.06% 0.09%
Services
Engineering services 591 146,650 0.40% 1.33%
Health care 1,108 40,883 2.71% 0.37%
Transportation 421 128,136 0.33% 1.16%
Hotels and restaurants 3,654 147,061 2.49% 1.33%
Household services 692 278,927 0.25% 2.53%
Military 918 25,860 0.36% 2.34%
Administration 1,093 119,140 0.92% 1.08%
Finance 3,042 13,324 22.99% 0.12%
Insurance 223 6,655 3.35% 0.06%
17

Table A.7: Summary Statistics: Survey
This table reports summary statistics for the survey on trust in banks run on a representative sample of German
households in 2015.
Panel A. Descriptive Statistics
Obs. Mean Std Min Max
(1) (2) (3) (4) (5)
Trust in the stock market 981 0.13 0.34 0 1
Trust in commercial banks 981 0.17 0.38 0 1
Trust in local banks 981 0.41 0.49 0 1
Generalized trust 1000 0.39 0.49 0 1
Risk tolerance (1 to 7) 989 3.04 1.44 1 7
Panel B. Correlations
Trust in Trust in Trust in
stock commercial local Generalized
market banks banks trust
(1) (2) (3) (4)
Trust commercial banks 0.264
(0.000)
Trust local banks 0.132 0.252
(0.002) (0.000)
Generalized trust 0.093 0.095 0.106
(0.026) (0.023) (0.013)
Risk tolerance 0.383 0.127 0.022 0.161
(0.000) (0.002) (0.594) (0.000)
18