The Impact of Electronic Health Records on Healthcare ...
153
University of Nebraska Medical Center University of Nebraska Medical Center DigitalCommons@UNMC DigitalCommons@UNMC Theses & Dissertations Graduate Studies Fall 12-16-2016 The Impact of Electronic Health Records on Healthcare Service The Impact of Electronic Health Records on Healthcare Service Delivery, Patient Safety, and Quality Delivery, Patient Safety, and Quality Kate Elizabeth Trout University of Nebraska Medical Center Follow this and additional works at: https://digitalcommons.unmc.edu/etd Part of the Health and Medical Administration Commons, Health Information Technology Commons, Health Services Administration Commons, and the Health Services Research Commons Recommended Citation Recommended Citation Trout, Kate Elizabeth, "The Impact of Electronic Health Records on Healthcare Service Delivery, Patient Safety, and Quality" (2016). Theses & Dissertations. 173. https://digitalcommons.unmc.edu/etd/173 This Dissertation is brought to you for free and open access by the Graduate Studies at DigitalCommons@UNMC. It has been accepted for inclusion in Theses & Dissertations by an authorized administrator of DigitalCommons@UNMC. For more information, please contact [email protected].
-
Upload
khangminh22 -
Category
Documents
-
view
0 -
download
0
Transcript of The Impact of Electronic Health Records on Healthcare ...
University of Nebraska Medical Center University of Nebraska Medical Center
DigitalCommons@UNMC DigitalCommons@UNMC
Theses & Dissertations Graduate Studies
Fall 12-16-2016
The Impact of Electronic Health Records on Healthcare Service The Impact of Electronic Health Records on Healthcare Service
Delivery, Patient Safety, and Quality Delivery, Patient Safety, and Quality
Kate Elizabeth Trout University of Nebraska Medical Center
Follow this and additional works at: https://digitalcommons.unmc.edu/etd
Part of the Health and Medical Administration Commons, Health Information Technology Commons,
Health Services Administration Commons, and the Health Services Research Commons
Recommended Citation Recommended Citation Trout, Kate Elizabeth, "The Impact of Electronic Health Records on Healthcare Service Delivery, Patient Safety, and Quality" (2016). Theses & Dissertations. 173. https://digitalcommons.unmc.edu/etd/173
This Dissertation is brought to you for free and open access by the Graduate Studies at DigitalCommons@UNMC. It has been accepted for inclusion in Theses & Dissertations by an authorized administrator of DigitalCommons@UNMC. For more information, please contact [email protected].
i
THE IMPACT OF ELECTRONIC HEALTH RECORDS ON
HEALTHCARE SERVICE DELIVERY, PATIENT SAFETY, AND QUALITY
by
Kate E. Trout
A DISSERTATION
Presented to the Faculty of
the University of Nebraska Graduate College
in Partial Fulfillment of the Requirements
for the Degree of Doctor of Philosophy
Health Services Research, Administration, and Policy
Graduate Program
Under the Supervision of Professor Li-Wu Chen
University of Nebraska Medical Center
Omaha, Nebraska
December, 2016
Supervisory Committee:
Li-Wu Chen, Ph.D. Fernando Wilson, Ph.D. David Palm, Ph.D.
Hyo Jung Tak, Ph.D. Patrik Johansson, M.D.

i
ACKNOWLEGEMENTS
First, I would like to thank Dr. Li-Wu Chen, my chair, and Dr. Fernando Wilson.
As my research advisors and mentors, they have provided me with many opportunities
to excel in an academic and professional environment. Additionally, I would like to thank
my committee for always encouraging my research and helping me to grow as a
research scientist in health services research and health policy, including Dr. Li-Wu
Chen, Dr. Fernando Wilson, Dr. David Palm, Dr. Hyo Jung Tak, and Dr. Patrik
Johansson. I greatly appreciate the time, feedback, and expertise that you have
contributed to both my dissertation and research.
Second, I would like to express my gratitude to Dr. Richard Clopton for engaging
me in his research, which commenced my career in scientific inquiry. The Natural
Science faculty at Peru State College had a significant impact on my decision to pursue
a scientific career, including Dr. Richard Clopton, Dr. Michael Barger, Dr. John Hnida,
Dr. Dennis Welsh, and Debra Clopton.
I must recognize my family’s continuous support, especially while pursing my
personal and professional goals in research and service that required global travel.
Finally, I would like to dedicate this dissertation to my grandparents, who had always
demonstrated, that above all, to first be a good human being.
ii
ABSTRACT
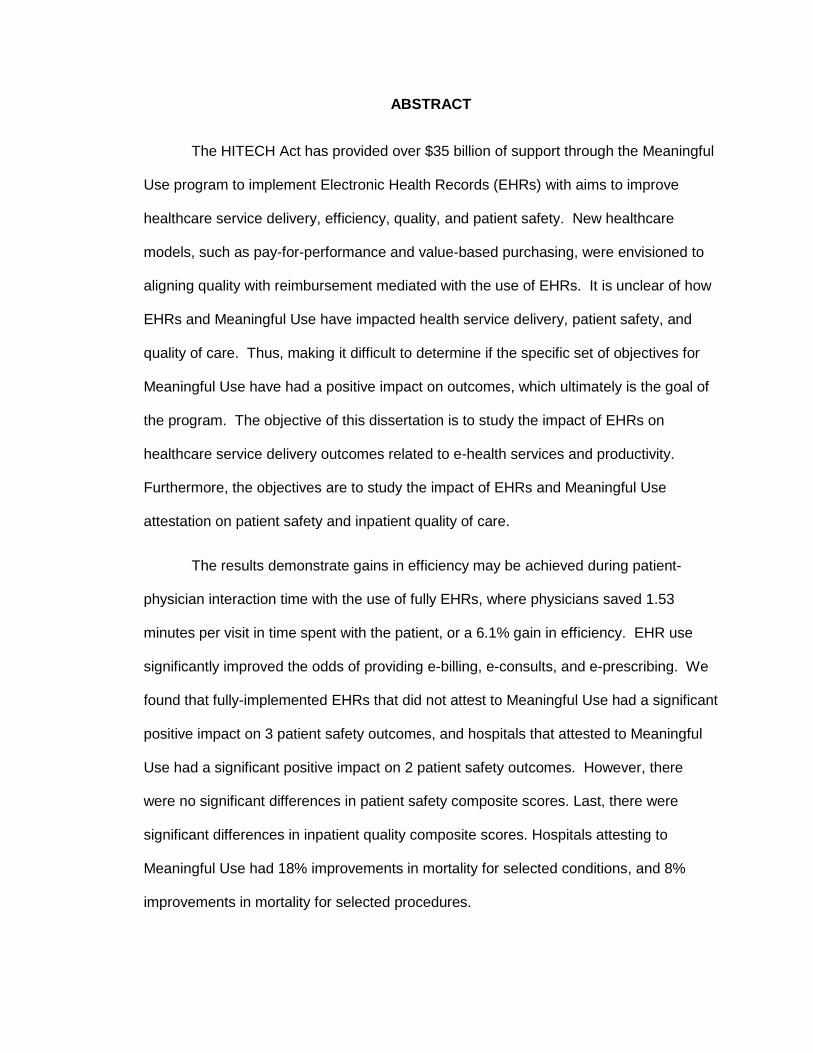
The HITECH Act has provided over $35 billion of support through the Meaningful
Use program to implement Electronic Health Records (EHRs) with aims to improve
healthcare service delivery, efficiency, quality, and patient safety. New healthcare
models, such as pay-for-performance and value-based purchasing, were envisioned to
aligning quality with reimbursement mediated with the use of EHRs. It is unclear of how
EHRs and Meaningful Use have impacted health service delivery, patient safety, and
quality of care. Thus, making it difficult to determine if the specific set of objectives for
Meaningful Use have had a positive impact on outcomes, which ultimately is the goal of
the program. The objective of this dissertation is to study the impact of EHRs on
healthcare service delivery outcomes related to e-health services and productivity.
Furthermore, the objectives are to study the impact of EHRs and Meaningful Use
attestation on patient safety and inpatient quality of care.
The results demonstrate gains in efficiency may be achieved during patient-
physician interaction time with the use of fully EHRs, where physicians saved 1.53
minutes per visit in time spent with the patient, or a 6.1% gain in efficiency. EHR use
significantly improved the odds of providing e-billing, e-consults, and e-prescribing. We
found that fully-implemented EHRs that did not attest to Meaningful Use had a significant
positive impact on 3 patient safety outcomes, and hospitals that attested to Meaningful
Use had a significant positive impact on 2 patient safety outcomes. However, there
were no significant differences in patient safety composite scores. Last, there were
significant differences in inpatient quality composite scores. Hospitals attesting to
Meaningful Use had 18% improvements in mortality for selected conditions, and 8%
improvements in mortality for selected procedures.

iii
In conclusion, EHRs and the Meaningful Use program have had positive impacts
on healthcare service delivery and inpatient quality of care. More efforts may be needed
to improve patient safety with the use of EHRs, which may need to focus on EHR
certification or Meaningful Use objectives. Future studies should determine specific EHR
functionalities and Meaningful Use objectives that are associated with positive outcomes
to further direct policy development.
ii
TABLE OF CONTENTS
ACKNOWLEGEMENTS ................................................................................................................ i
ABSTRACT .................................................................................................................................... ii
TABLE OF CONTENTS ............................................................................................................... ii
LIST OF FIGURES....................................................................................................................... iv
LIST OF TABLES .......................................................................................................................... v
LIST OF ABBREVIATIONS ........................................................................................................ vi
CHAPTER 1: How are Electronic Health Records changing the way we offer healthcare
services? ......................................................................................................................................... 1
ABSTRACT ..................................................................................................................................... 1
INTRODUCTION ............................................................................................................................ 5
THEORETICAL FRAMEWORK ...................................................................................................... 10
METHODS ................................................................................................................................... 18
RESULTS ..................................................................................................................................... 21
DISCUSSION................................................................................................................................ 38
CONCLUSION .............................................................................................................................. 52
CHAPTER 2: Does attesting to Meaningful Use with Electronic Health Records Improve
Hospital Patient Safety? ............................................................................................................. 54
ABSTRACT ................................................................................................................................... 54
INTRODUCTION .......................................................................................................................... 57
THEORETICAL FRAMEWORK ...................................................................................................... 59
METHODS ................................................................................................................................... 66
RESULTS ..................................................................................................................................... 71
DISCUSSION................................................................................................................................ 78
CONCLUSION .............................................................................................................................. 86
iii
CHAPTER 3: The Impact of Electronic Health Records and Meaningful Use on Inpatient
Quality ........................................................................................................................................... 87
ABSTRACT ................................................................................................................................... 87
INTRODUCTION .......................................................................................................................... 90
THEORETICAL FRAMEWORK ...................................................................................................... 92
METHODS ................................................................................................................................... 99
RESULTS ................................................................................................................................... 105
DISCUSSION.............................................................................................................................. 111
CONCLUSION ............................................................................................................................ 116
BIBLIOGRAPHY ........................................................................................................................ 117
APPENDIX A. Primary, Surgical, Medical Specialties ......................................................... 140
APPENDIX B. The impact of EHR use on Patient Safety Outcomes treating state as a
cluster effect ............................................................................................................................... 143
iv
LIST OF FIGURES
Figure 1. A framework for HIT impact on healthcare service efficiency and productivity:
Information Technology- Technology, Organizational, Provider, and Environmental (IT-
TOPE) ........................................................................................................................................... 17
Figure 2. Average unadjusted and adjusted number of minutes spent with patients
stratified by EHR use .................................................................................................................. 28
Figure 3. Average unadjusted and adjusted number of minutes spent with patients
stratified by EHR use among physician specialties ............................................................... 31
Figure 4. Average unadjusted and adjusted number of minutes spent with patients
stratified by EHR use among solo and group practices ........................................................ 34
Figure 5. Average unadjusted and adjusted number of minutes spent with patients
stratified by EHR use among physicians practicing in urban and rural areas ................... 37
Figure 6. A framework for HIT impact on patient safety: Information Technology-
Technology, Organizational, Provider, and Environmental (IT-TOPE) ............................... 65
Figure 7. A framework for HIT impact on inpatient quality: Information Technology-
Technology, Organizational, Provider, and Environmental (IT-TOPE) ............................... 98
v
LIST OF TABLES
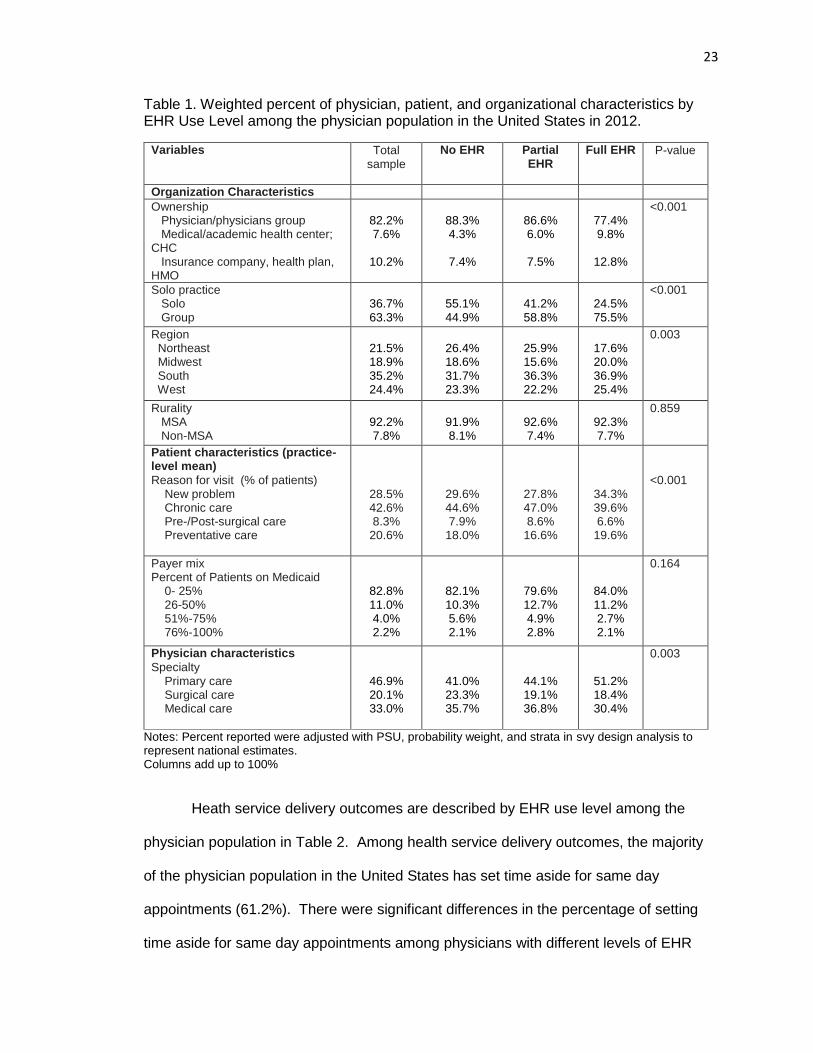
Table 1. Weighted percent of physician, patient, and organizational characteristics by
EHR Use Level among the physician population in the United States in 2012. ................ 23
Table 2. Weighted percent of health service delivery outcomes by EHR use among the
physician population in the United States ............................................................................... 25
Table 3. Adjusted odds ratios of EHR use on health service delivery outcomes .............. 26
Table 4. Adjusted odds ratios of EHR use on health service delivery outcomes for
physicians with primary care, surgical, and medical specialties .......................................... 29
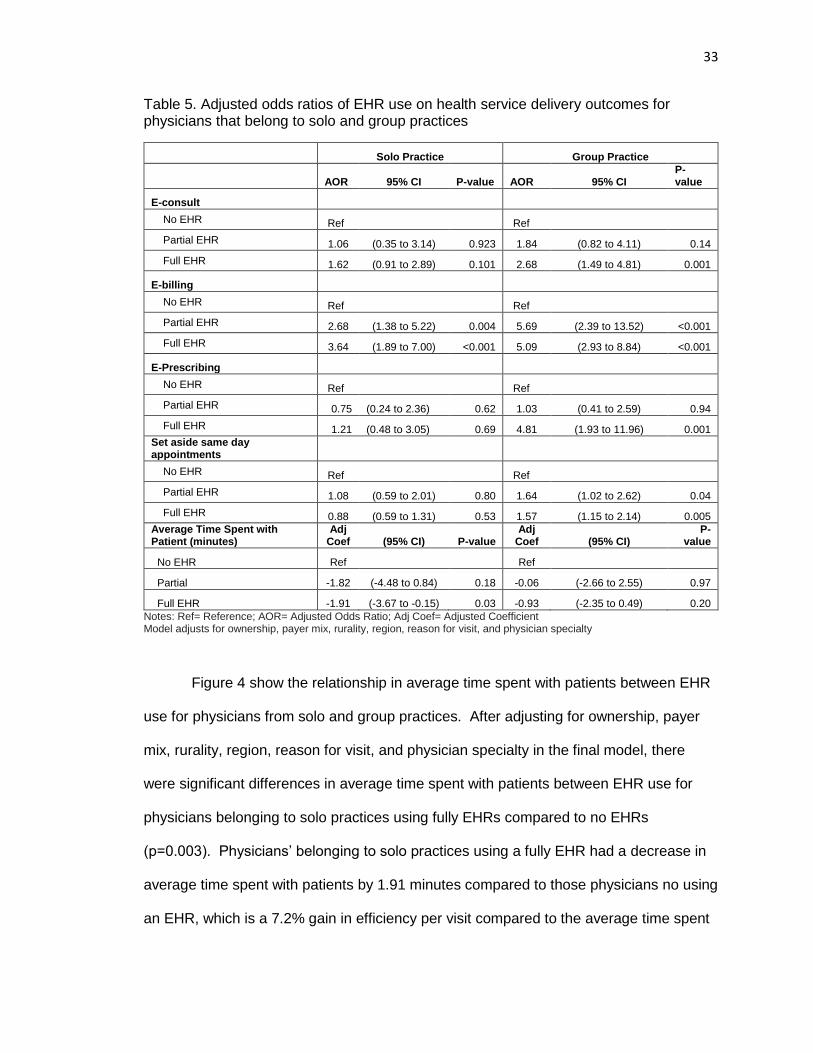
Table 5. Adjusted odds ratios of EHR use on health service delivery outcomes for
physicians that belong to solo and group practices ............................................................... 33
Table 6. Adjusted odds ratios of EHR use on health service delivery outcomes for
physicians are located in urban and rural areas..................................................................... 36
Table 7. Description of EHR use and Hospital Characteristics ............................................ 72
Table 8. Summary Statistics of Patient Safety among EHR use ......................................... 74
Table 9. The impact of EHR use on Patient Safety Outcomes ............................................ 77
Table 10. AHRQ IQI Composite Measure Components and Weights .............................. 101
Table 11. Description of EHR use and Hospital Characteristics ....................................... 106
Table 12. Summary Statistics of Inpatient Quality among EHR use ................................. 108
Table 13. The impact of EHR use on IQI Outcomes ........................................................... 110

vi
LIST OF ABBREVIATIONS
ACA Affordable Care Act
AHA American Hospital Association
AHRQ Agency for Healthcare Research and Quality
AOR Adjusted Odds Ratio
APR-DRG All Patient Refined Diagnosis Related Groups
CHPL Certified Health IT Product List
CI Confidence Interval
CMS Centers for Medicare and Medicaid Services
EHR Electronic Health Record
GLM Generalized Linear Model
HCUP Healthcare Cost and Utilization Project
HHI Herfindahl-Hirschman Index
HIT Health Information Technology
HITECH Health Information Technology for Economic and Clinical Health
IQI Inpatient Quality Indicator
IQR Hospital Inpatient Quality Reporting Program
MU Meaningful Use
NAMCS National Ambulatory Medical Care Survey
OLS Ordinary least squares
ONC-ACB Office of the National Coordinator Authorization Certification Body
ONC-HIT Office of the National Coordinator for Health Information Technology
OR Odds Ratio
PCMH Patient Centered Medical Home
PR Population Rate
PSI Patient Safety Indicator
PSU Primary Sampling Unit
RAR Reliability Adjustment Ratio
RHQDAPU Reporting Hospital Quality Data for Acute Payment Update program
SD Standard Deviation
SID State Inpatient Database
SVY Survey Design
VBP Value-Based Purchasing
1
CHAPTER 1: How are Electronic Health Records changing the way we offer healthcare
services?
Kate E. Trout, Ph.D.
University of Nebraska, 2016
Supervisor: Li-Wu Chen, Ph.D.
ABSTRACT
Background: New healthcare models were envisioned to be mediated with the use of
Electronic Health Records (EHRs), and aimed to deliver patient-centered care that
increases patient access to their physicians by focusing on physician time spent with the
patient, same-day scheduling, telephone consults, e-consults, and e-prescribing. These
outcomes are aimed at improving patient satisfaction while aligning quality with
reimbursement, through pay-for-performance and value-based payment. It is unclear of
how these technologies have changed processes impacting patients during health
service delivery, given the mixed results regarding EHR efficiency and productivity.
Studying the impact of EHRs ability to transform healthcare services will be important to
direct policy efforts.
Objective: The objective of this study was to determine the impact of EHR use on health
service delivery outcomes, including providing set aside same day appointments, e-
billing, e-consults, e-prescribing, and physician time spent with the patient, among a
nationally representative sample of office-based physician population in the United
States. Additionally, we provided subsample analyses stratified by physician specialty,
group and solo practices, and rurality to determine the impact of EHR on health delivery
outcomes.
2
Methods: We used a nationally representative sample of office-based physicians using
2012 National Ambulatory Medical Care Survey (NAMCS) survey data. There were a
total of 3,583 physicians who participated in the study. The estimation model adjusted
for solo or group practice (practice size), ownership of organization, percent of revenue
from Medicaid patients (payer mix), rurality, region, physician-level patients’ reason for
visit, and physician specialty. An ordinary least squares (OLS) method was used to
determine the effect between EHR use and average time spent with patients. A logit
model was used to determine the effect of EHR on the other health service delivery
outcomes, including set aside same day appointment, e-consults, e-prescribing, and e-
billing. All analysis were adjusted with primary sampling unit (PSU), probability weight,
and strata in survey design analysis (SVY) to provide nationally representative individual
physician level estimates using Stata/IC v.14.1.
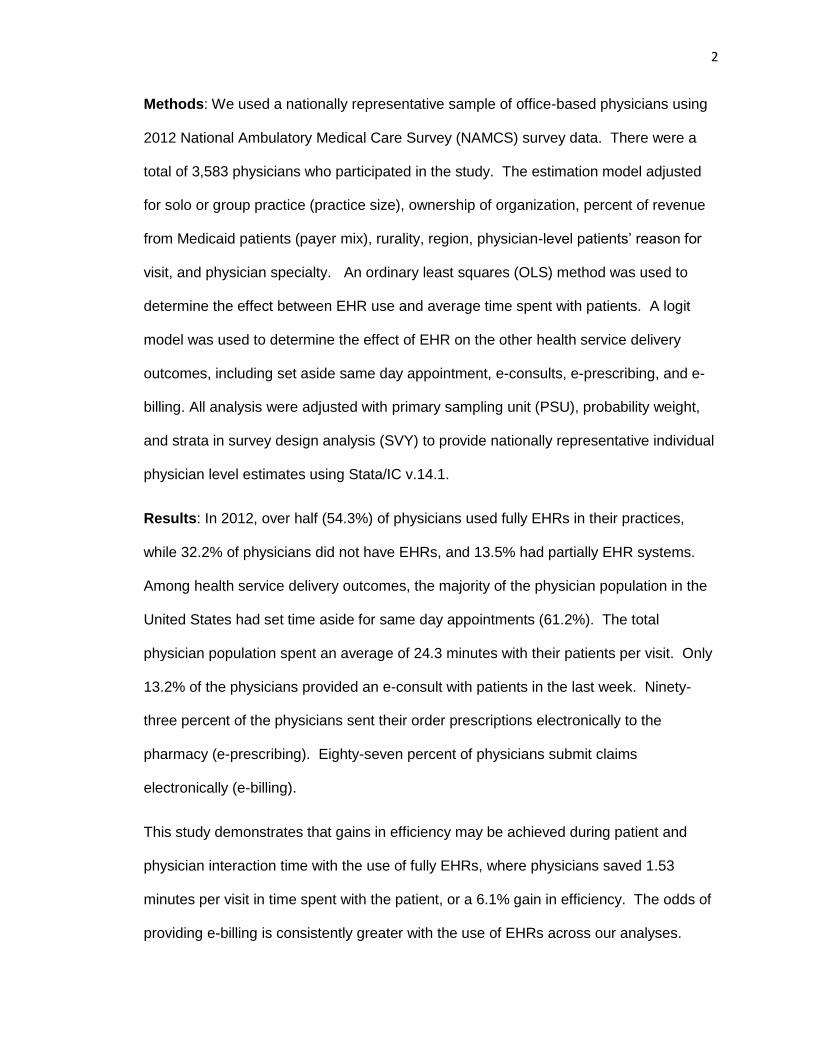
Results: In 2012, over half (54.3%) of physicians used fully EHRs in their practices,
while 32.2% of physicians did not have EHRs, and 13.5% had partially EHR systems.
Among health service delivery outcomes, the majority of the physician population in the
United States had set time aside for same day appointments (61.2%). The total
physician population spent an average of 24.3 minutes with their patients per visit. Only
13.2% of the physicians provided an e-consult with patients in the last week. Ninety-
three percent of the physicians sent their order prescriptions electronically to the
pharmacy (e-prescribing). Eighty-seven percent of physicians submit claims
electronically (e-billing).
This study demonstrates that gains in efficiency may be achieved during patient and
physician interaction time with the use of fully EHRs, where physicians saved 1.53
minutes per visit in time spent with the patient, or a 6.1% gain in efficiency. The odds of
providing e-billing is consistently greater with the use of EHRs across our analyses.
3
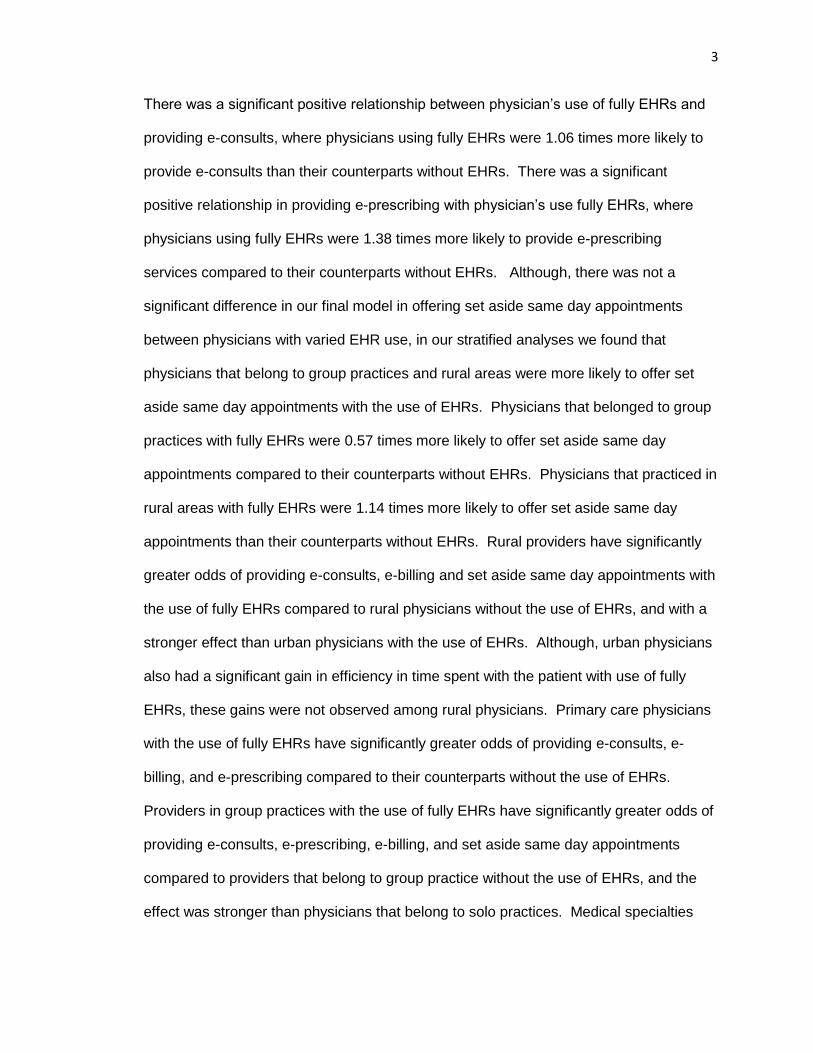
There was a significant positive relationship between physician’s use of fully EHRs and
providing e-consults, where physicians using fully EHRs were 1.06 times more likely to
provide e-consults than their counterparts without EHRs. There was a significant
positive relationship in providing e-prescribing with physician’s use fully EHRs, where
physicians using fully EHRs were 1.38 times more likely to provide e-prescribing
services compared to their counterparts without EHRs. Although, there was not a
significant difference in our final model in offering set aside same day appointments
between physicians with varied EHR use, in our stratified analyses we found that
physicians that belong to group practices and rural areas were more likely to offer set
aside same day appointments with the use of EHRs. Physicians that belonged to group
practices with fully EHRs were 0.57 times more likely to offer set aside same day
appointments compared to their counterparts without EHRs. Physicians that practiced in
rural areas with fully EHRs were 1.14 times more likely to offer set aside same day
appointments than their counterparts without EHRs. Rural providers have significantly
greater odds of providing e-consults, e-billing and set aside same day appointments with
the use of fully EHRs compared to rural physicians without the use of EHRs, and with a
stronger effect than urban physicians with the use of EHRs. Although, urban physicians
also had a significant gain in efficiency in time spent with the patient with use of fully
EHRs, these gains were not observed among rural physicians. Primary care physicians
with the use of fully EHRs have significantly greater odds of providing e-consults, e-
billing, and e-prescribing compared to their counterparts without the use of EHRs.
Providers in group practices with the use of fully EHRs have significantly greater odds of
providing e-consults, e-prescribing, e-billing, and set aside same day appointments
compared to providers that belong to group practice without the use of EHRs, and the
effect was stronger than physicians that belong to solo practices. Medical specialties
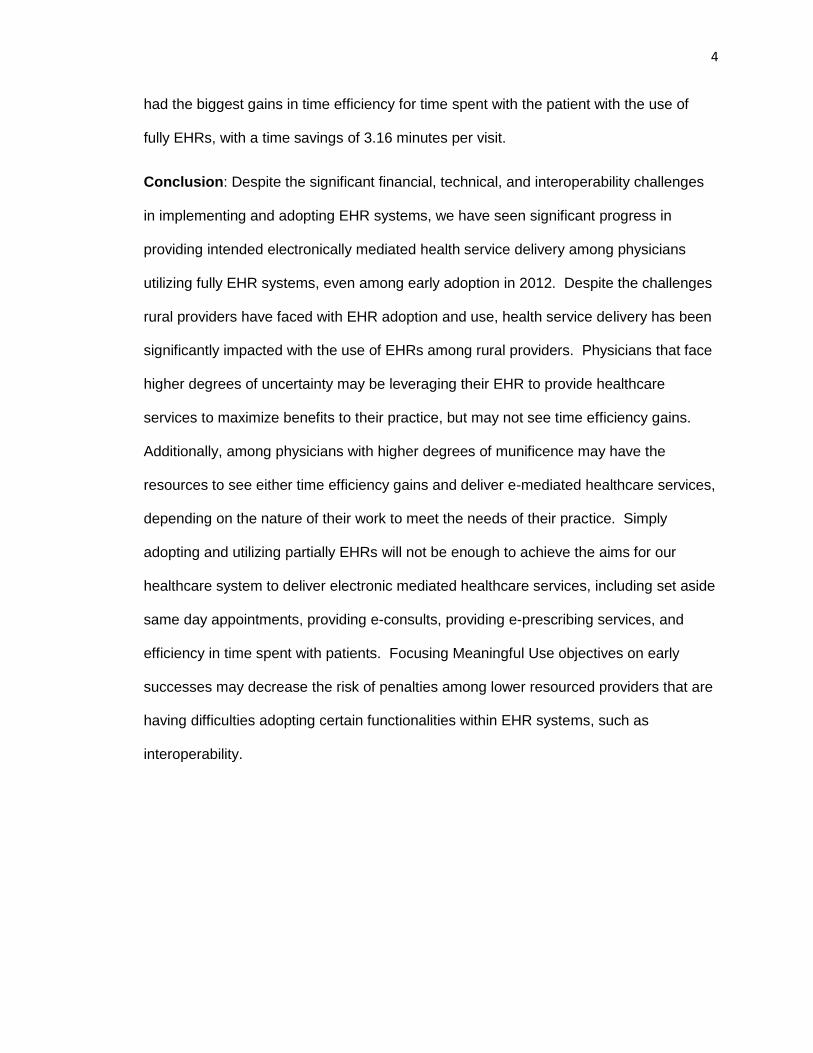
4
had the biggest gains in time efficiency for time spent with the patient with the use of
fully EHRs, with a time savings of 3.16 minutes per visit.
Conclusion: Despite the significant financial, technical, and interoperability challenges
in implementing and adopting EHR systems, we have seen significant progress in
providing intended electronically mediated health service delivery among physicians
utilizing fully EHR systems, even among early adoption in 2012. Despite the challenges
rural providers have faced with EHR adoption and use, health service delivery has been
significantly impacted with the use of EHRs among rural providers. Physicians that face
higher degrees of uncertainty may be leveraging their EHR to provide healthcare
services to maximize benefits to their practice, but may not see time efficiency gains.
Additionally, among physicians with higher degrees of munificence may have the
resources to see either time efficiency gains and deliver e-mediated healthcare services,
depending on the nature of their work to meet the needs of their practice. Simply
adopting and utilizing partially EHRs will not be enough to achieve the aims for our
healthcare system to deliver electronic mediated healthcare services, including set aside
same day appointments, providing e-consults, providing e-prescribing services, and
efficiency in time spent with patients. Focusing Meaningful Use objectives on early
successes may decrease the risk of penalties among lower resourced providers that are
having difficulties adopting certain functionalities within EHR systems, such as
interoperability.
5
INTRODUCTION
The goals set for the United States healthcare system by the Affordable Care Act
(ACA) were envisioned to be Health Information Technology (HIT) mediated, with a $35
billion dollar investment provided through the Health Information Technology and
Economic and Clinical Health (HITECH) Act. The HITECH Act was signed into law on
February 17, 2009 with aims to promote the adoption and Meaningful Use of HITs in the
United States healthcare systems, such as the adoption of EHRs. With the use of
Electronic Health Records (EHRs), these goals were to achieve more affordable care at
a higher quality, increase patient satisfaction, increase provider productivity and
efficiency, and increase access to healthcare services for patients. Wide-scale adoption
and implementation of EHRs across the healthcare system were aimed at achieving
diverse efficiencies in healthcare service delivery by the ability to better record, store,
and share information, including increased productivity, reduction in waste, reduced
transcription costs, reduction in record storage and retrieval, reduction in medical errors,
improved safety and quality, and provide a cost savings (Kumar and Bauer, 2011).
However, it is currently unknown how EHRs have mediated changes in the United
States healthcare service delivery to increase efficiency and improve access to care with
electronic-mediated services.
Studying the impact of EHRs ability to transform healthcare services will be
important to direct policy efforts in the future, especially where it has been identified as a
top challenge for physicians in the United States to overcome the penalties if they are
not able to meet the requirements of the federal Meaningful Use incentive program
(Bendix et al., 2013). In order to receive Meaningful Use incentives, providers must
demonstrate “Meaningful Use” with the use of their EHRs by meeting the criteria and
objectives outlined in the different stages of the program. Stage 1 of the Meaningful Use
6
program focuses on data capturing and sharing information between patients and
providers. Objectives of the Meaningful Use of EHRs may need to be re-visited, and re-
directed to focus on early successes in order to avoid penalizing physicians facing
challenges in implementation and utilization. Stage 2 focus on advance clinical
processes, such as health information exchange, increased requirements for e-
prescribing and digitizing laboratory results, and incorporating patient controlled
information. However in 2013, only 5.8 percent of hospitals met the criteria for Stage 2
Meaningful Use readiness with their EHR systems (Adler-Milstein et al, 2014). Due to
the challenges in meeting Stage 2 Meaningful Use, further modifications to Meaningful
Use were implemented in 2015 with the creation of “Modified Stage 2”, making it a
pivotal time to study the ability of EHRs to impact positive change in our healthcare
system. Stage 3 will likely focus on improving outcomes by incorporating clinical decision
support, patient data self-management tools, and comprehensive data available through
health information exchanges.
EHRs have the ability to deliver information to diverse members of healthcare
teams at different times during the workflow and decision making processes (Grossman,
et al, 2011), where implementation also requires restructuring healthcare service
processes to incorporate the use of information technologies during service delivery. It
is unclear of how these technologies have changed processes impacting providers and
patients during health service delivery, given the literature warrants mixed results
regarding efficiency and productivity (Miller et al, 2004; Miller et al, 2005; Baron, et al,
2005; Miller and Newman, 2004; Miller et al, 2005). Implementing EHRs have not come
without challenges, where physicians report dissatisfaction including poor usability, time-
consuming data entry, interference with face-to-face patient care, inefficient and less
fulfilling work content, inability to exchange health information, and degradation of
7
clinical documentation (Friedberg et al, 2013). The literature has suggested mixed
results regarding the benefits and costs of EHR systems (Baron, et al, 2005; Miller and
Newman, 2004; Miller et al, 2005), and some studies suggest that EHRs may not be
worth the high cost and disruptions (Verdon, 2014). Providers may have to extend,
rather than reduce, their hours per patient visit when EHRs decreased the efficiency of
service delivery to avoid financial losses in covering the cost of implementing EHRs
(Miller, et al, 2005). Achieving the intended positive outcomes may be more complicated
than first envisioned by the ACA and the HITECH Act. It is unclear if the national
investment of EHRs have been effective in creating efficiencies in healthcare service
delivery and increasing patient’s access to physician services.
Offering patient-center care has been a focus of our healthcare system, and has
led to the implementation of models such as the patient centered medical homes
(PCMH) and pay for performance, which focuses on improving patient satisfaction
through dimensions related to scheduling, access to care, e-health, and time spent with
physicians (Lewis, 2009). These new healthcare models are mediated with the use of
EHRs, and aimed to deliver patient-centered care that increases patient access to their
physicians and patient satisfaction. Health service delivery practices that are critical to
deliver patient-centered care include offering same-day scheduling, email consults,
telephone consults, and e-prescribing. Same-day scheduling, email consults, telephone
consults, and e-prescribing improve patient satisfaction while aligning quality with
reimbursement, which are applied in pay-for-performance and value-based designs
(Carrier et al., 2009). Additionally, moving toward a PCMH model was listed as one of
the top ten challenges facing physicians in the United States in 2014 that focuses on
outcomes in offering electronic mediated healthcare services, fully utilizing EHRs to
8
improve workflow and processes, and offering set aside same day appointments as part
of offering patient-center care (Bendix et al., 2013).
The literature suggests that providers lag behind in the ability to offer e-health
resources and e-business tools (such as e-billing) to meet the consumers’ needs, and
researchers rarely study the efforts in providing these services to meet the patients’
needs (Huang et al., 2012). There is considerable interest in finding digital solutions to
enhance the quality, safety, and efficiency of care in healthcare (Black et al, 2011).
Widely utilizing e-billing in the healthcare system through the use of EHRs will change
the paradigm of outcomes research, making it possible to link billing claims with health
outcomes and maybe even survey data (Zacker et al., 2010; Hogan, Mattison, 1993).
Additionally, it will improve provider’s productivity and financial outcomes by better
documenting services provided to their patients (Miller & Sim, 2004). To our knowledge,
there are no studies determining the impact of EHRs on improving the physicians’ ability
to provide e-billing services in the United States. Furthermore, e-consults are
interactions between physicians and patients located outside of their practices mediated
by electronic modes. E-consults significantly improve both the timeliness of and access
to care as compared to traditional consultation processes, and is perceived as highly
beneficial by providers and patients (Keely et al., 2013). Furthermore, e-prescribing is
another electronic-mediated service that improves healthcare efficiency and increases
medication safety (Weingart et al, 2009; Hollingworth, et al, 2007; Schade, et al, 2006).
E-prescribing systems are used to enter, modify, review, and communicate pharmacy
orders (Car et al, 2008). As EHR adoption has increased significantly across the United
States, we should also determine its impact on e-billing, e-consults, and e-prescribing.
Lastly, it is unclear if the use of EHRs during the patient visit has translated into
improving productivity for physicians during time spent with patients. One study reported
9
that with the use of an EHR, physicians were able to see patients in less time, but the
study was only conducted among 14 solo and small group practices (Miller et al, 2005).
The ability to reduce the time to collect patient information during patients’ visits
improved physicians’ productivity. One time-in-motion study found there were no
significant differences in time spent with patient for direct care (time spent examining
and talking to the patient) post-implementation of EHR systems (13.4 minutes vs. 13.6
minutes; p=0.86) (Pizziferri, et al., 2005). However, this study was based on a small
sample size of only 20 physicians (Pizziferri, et al., 2005). Other studies suggest that
efficiency may not be gained by increasing the reporting of quality measures and
complexity of medical care standardization, but does not show the direct impact on time
spent with patients (Casalino, et al., 2016). In fact, one recent study shows that
physicians in the United States among four common specialties spend as much as 785
hours on average per physician each year and more than $15.4 billion dealing with the
reporting of quality measures, due to both fragmentation of the healthcare system and
poor standardization, functionality, and interoperability in EHRs (Casalino, et al., 2016).
Therefore, it is unclear if the increased documentation during the visit actually increases
time spent with patients resulting in decreased productivity. Given the current state of
the literature, more research is warranted to determine the impact of EHRs on
physicians’ productivity with national physician samples. Nationally representative
studies are needed to better understand the impact of EHRs on time spent with patients.
Are barriers to implementing and utilizing EHR systems out-weighing the
benefits, thus making it difficult to move toward offering more efficient and productive
healthcare service delivery methods, or have EHRs made a positive impact on how we
deliver healthcare services? The objective of this study was to determine the impact of
EHR use on health service delivery outcomes, including offering set aside same day
appointments, providing e-billing, e-consults, e-prescribing, and physician time spent
10
with patient, using a nationally representative office-based physician population in the
United States. Additionally, we provided supplemental analyses to determine the impact
of EHR use on these health service delivery outcomes by physician specialty, group and
solo practices, and rurality.
THEORETICAL FRAMEWORK
Resource Dependence Theory central proposition is that organizations will alter
their behaviors to manage their resource dependencies in order to achieve greater
autonomy and reduce uncertainty in the flow of vital resources from the environment
(Pfeffer and Salancik, 1978; Pfeffer and Salancik, 2003). EHRs were envisioned to
create service efficiency and increase productivity for providers, allowing physicians to
serve more patients with higher quality of care. However, it is costly to purchase and
implement EHR systems which contribute to high fixed costs for providers. One study
suggests that EHRs may not be worth the high cost and disruptions, since nearly 45% of
physicians from the national survey report spending more than $100,000 on an EHR,
and 77% of the largest practices spent nearly $200,000 on their systems (Verdon, 2014).
EHRs may also contribute to variable costs, such as staff training or technical support
required to implement the system and keep it functional for users.
Constructs of the RDT are uncertainty, munificence, and interdependence.
Uncertainty refers “to the degree to which future states of the world cannot be
anticipated and accurately predicted” (Pfeffer and Salancik, 1978). Munificence refers to
the abundance of critical resources in the environment to support the organization’s
survival. Through the adoption of EHRs, providers may be eligible to receive Meaningful
Use incentives by meeting a set of objectives through the use of their EHRs. By
receiving these incentives for the use of their EHRs, they are able to secure resources in
their environment. EHRs have the ability to deliver information to diverse members of
11
healthcare teams at different times during the workflow and decision making processes
(Grossman, et al, 2011). We make the following hypotheses of the impact of EHRs on
the following heath service delivery outcomes:
(H1) Physicians using EHRs are more likely to achieve better service delivery
outcomes, including e-consults, e-billing, e-prescribing, and set aside same day
appointments, as compared to their counterparts without EHR use.
(H2) Physicians using EHRs are more likely to achieve higher productivity by
efficiency gains in time spent during patient visits, as compared to their
counterparts without EHR use.
However, rurality may impose higher uncertainty and lower munificence to
providers, as rural healthcare organizations face challenges in resource acquisition
through serving a smaller population and operating in environments with less adequate
resources. Incorporating concepts of RDT is appropriate in describing the relationship
between EHR adoption and rurality of providers. Health care providers located in areas
with a high degree of rurality, such as Critical Access Hospitals (CAH), may not have
adequate and stable resources required to address challenges in implementing and
maintaining HITs after purchasing. Sixty percent of Critical Access Hospitals (CAHs)
reported financial challenges, while over half reported significant workflow or staffing
challenges regarding HIT use and implementation (Gabriel, Jones, Samy, 2014).
RDT states “organizations are constrained and affected by their environments
and that they act to attempt to manage resource dependencies” (Pfeffer and Salancik,
2003). Interdependence refers to organizations reliance on one another for the
acquisition of resources. Rural health care providers may adopt EHRs to secure more
resources provided through the Meaningful Use Incentive program. However, rural
12
providers may incur more unexpected costs and have un-stabilized revenue as a result
of EHR implementation. Therein, rural providers may not be receiving the adequate
amount of incentives and support services required to help these lower resourced
providers to use their EHRs to improve the service efficiency and productivity among
providers, compared to their urban counterparts. One study reported that initial cost for
EHRs among solo or small group practices averaged $44,000 per full-time-equivalent
(FTE) provider with an average of $8,412 (19.5% of initial costs) of ongoing costs per
year per provider (Miller et al, 2005). The study also reported that some providers
experienced losses from reduced visits, but the losses were dependent on whether
providers worked longer hours instead of reducing patient visits (Miller et al, 2005),
suggesting that they did not see uniform gains in service efficiency or service
productivity. In fact, practices vary in benefits and costs, with providers being able to pay
back the cost of their EHRs ranging from 4 years to never being able to pay for their
EHRs (Miller et al, 2005).
(H3) The effect of EHR use for physicians practicing in rural areas is smaller
than physicians practicing in urban areas, when compared to their counterparts
without EHRs.
(H4) Physicians practicing in rural areas using EHRs are less likely to achieve
higher productivity by efficiency gains in time spent during patient visits than
physicians practicing in urban areas, when compared to their counterparts
without EHRs.
Physicians’ characteristics are important factors when studying health service
delivery outcomes. In a recent study which included 59 primary care providers,
physician specialty impacts e-consult outcomes, where e-consults are delivered most
commonly by physicians in dermatology (20%), endocrinology (13%), neurology (11%),
13
internal medicine (10%), cardiology (10%) and hematology (9%) specialties. In our
analysis, we also provided a subsample analyses to further explore the impact of EHRs
on health service delivery outcomes between provider specialties. Furthermore,
engagement in new delivery models may impact the ability to achieve outcomes related
to service efficiency and productivity, such as set aside same day appointments, e-
consults, telephone consults, and time spent with patients (Carrier et al., 2009). The
physicians’ perceived usefulness of the technology will also impact the outcomes of
health information technology (Ketikidis et al, 2012), and may impact the way physicians
interact and utilize their EHR systems.
Finally, practice size is another important organizational characteristics that
influences the ability to adopt advanced technologies and impacts health service delivery
outcomes (HSRA, 2010; MGMA, 2010; Casalino et al, 2004; Welch et al, 2013).
Physicians have started to move toward belonging to group practices in the last decade
in order to increase munificence and sharing of resources (Liebhaber, Grossman, 2007;
Welch et al, 2013), which decreasing uncertainty for healthcare providers. Group
practices have certain advantages over solo practices that would make it easier to
achieve outcomes related to improved quality and healthcare service efficiency including
greater access to capital to make technology investments, shared resources, greater
ability to standardize processes, and the ability to accept more insurance risk (HSRA,
2010; MGMA, 2010; Casalino et al, 2004; Welch et al, 2013). The literature also reports
that solo and small group practices can absorb significant financial risk when
implementing EHR systems (Miller et al., 2005). Based on the constructs of the RDT,
group practices may have greater munificence and face less uncertainty compared to
solo practices. The resources provided from the Meaningful Use incentive program may
have positively impacted outcomes among group practices compared to solo practices,
14
where group practices are getting incentives awarded based on the number of providers
utilizing EHR systems that meet “Meaningful Use”. Therein, allowing group practice may
have more resources (or munificence) to purchase EHR systems with advanced
functionalities, higher usability, and seek more technical support, making it easier to
transform their health service delivery patterns.
(H5) The effect of EHR use for solo providers is smaller than that for their
counterparts practicing in group practices, when compared to their counterparts
without EHRs.
(H6) Physicians that belong to solo practices using EHRs are less likely to
achieve higher productivity by efficiency gains in time spent during patient visits
than physicians that belong to group practices, when compared to their
counterparts without EHRs.
Furthermore, HIT adoption and use are influenced by institutional
pressures/norms. Institutional theory declares that something identified at a higher level,
such as organizational characteristics, can explain processes and outcomes at a lower
level of analysis (Clemens and Cook 1999; Amenta 2005). An organization must
conform to the rules, belief systems, and norms in the environment in order to gain
organization legitimacy (Scott, 1995; Suchman, 1995). In fact, research shows that
organizational factors appear to be more influential than market factors when it comes to
information technology adoption and use (Zhang, et al, 2013). Furthermore, evidence
suggests that there may be a relationship between intuitional factors and resource
factors in the provision of services (Goodrick and Salancik, 1996), and the adoption and
use of HITs vary by organizational characteristics (Zhang, et al, 2013). Ownership of the
organizations may influence the adoption of certain health delivery services based on
their institutional norms and values. Furthermore, the patient characteristics related
15
types of conditions and payer mix may impact heath service delivery, where the
literature states resource factors are important in the provision of services (Goodrick and
Salancik, 1996)
Technology context must not be overlooked when researching HITs, including
interoperability, functionality, and usability of EHR systems. Health information
exchanges and health information sharing of patient records is an important means to
improve care coordination across providers. It is widely cited that interoperability and
information sharing will play a large role in improving the healthcare system (Cutler et
al., 2006; Kvedar et al., 2014; Tan, 1999), but its design and implementation has been a
challenge in the healthcare sector. Second, HITs highly vary in functionalities, especially
when EHR systems are developed in different sectors of academia and industry. Next,
users interact with HITs in different ways with different backgrounds and needs.
Implementing HITs with high usability that are easy for providers with different
backgrounds to use will be necessary to reduce waste. Furthermore, usability testing
should direct future development efforts by focusing on measuring the technology’s
ability to meet the intended purpose. HIT usability evaluation has been overlooked
widely during technology development, and has impacted the inability to accomplish
system efficiency, effectiveness, and satisfaction (Minshall, 2013; Yen & Bakken, 2012),
and needs to be controlled for when studying HIT adoption and utilization. HIT adoption
can be highly complicated by marketing strategies, rather than be influenced by the true
usability and functionality of the technologies. Transparency needs to be created among
technological factors in order to effectively study HITs. In this study we could not
determine the specific functionalities beyond partially electronic and fully EHR systems
used by providers due to the lack of data. These EHRs in each group may vary by
16
functionalities and usability. Future studies should incorporate these factors into their
theoretical framework, as they impact outcomes of technology use.
The newly developed framework views the impact of technology adoption and
utilization on health service delivery outcomes from an institutional and resource
dependence perspective, and focuses on describing characteristics of providers that
influence health service delivery outcomes with the use of EHR technologies. The
constructs of the newly develop framework includes: (1) external environment, (2)
organizational context, (3) provider characteristics, and (4) technological context (Figure
1).
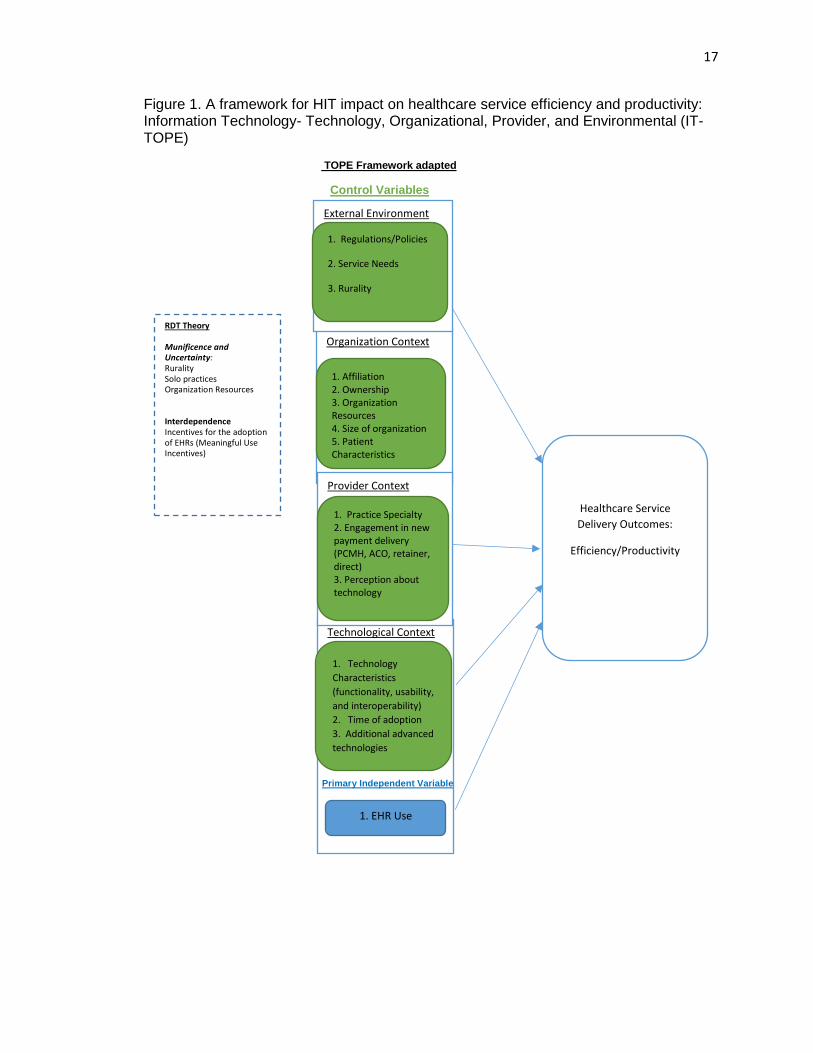
17
Figure 1. A framework for HIT impact on healthcare service efficiency and productivity: Information Technology- Technology, Organizational, Provider, and Environmental (IT-TOPE)
TOPE Framework adapted
Control Variables
Primary Independent Variable
Technological Context
Organization Context
1. Affiliation 2. Ownership 3. Organization Resources 4. Size of organization 5. Patient Characteristics
Healthcare Service
Delivery Outcomes:
Efficiency/Productivity
RDT Theory
Munificence and Uncertainty: Rurality Solo practices Organization Resources Interdependence Incentives for the adoption of EHRs (Meaningful Use Incentives)
External Environment
1. Regulations/Policies
2. Service Needs
3. Rurality
1. Technology
Characteristics
(functionality, usability,
and interoperability)
2. Time of adoption
3. Additional advanced
technologies
Provider Context
1. Practice Specialty 2. Engagement in new payment delivery (PCMH, ACO, retainer, direct) 3. Perception about technology
1. EHR Use
18
METHODS
Data and Study Sample
We used a nationally representative sample of office-based physicians from the
2012 National Ambulatory Medical Care Survey (NAMCS) survey data. The NAMCS is
conducted by the National Center for Health Statistics, Center for Disease Control and
Prevention (CDC) annually. The sampling frame for the 2012 NAMCS includes all non-
federally employed physicians listed in the files maintained by the American Medical
Association (AMA) and the American Osteopathic Association (AOA) of physicians
providing “office-based” patient care, which was sampled about 6 months prior to the
beginning of the survey year. Physicians were included if they are: (1) not in specialties
of anesthesiology, pathology, and radiology; and (2) younger than 85 years of age at the
time of the survey.
Individuals that did not see any patients during the sample week were excluded
from the study. Based on the number of full responders and those who saw no patients
during their sample week, the unweighted response rate was 39.3 percent and the
weighted response rate was 39.4 percent. Based on the total of full and minimal
responders (those that submitted fewer than half of the expected number of patient
record forms) including those who saw no patients during their reporting week, the
weighted participation rate was 45.6 percent. There were a total of 3,583 physicians
included in the study sample. NAMCS data is constructed of both patient-level and
physician level data. Patient-level data was collected using information from the patient
office-based visits. Physician-level responses were collected through the Physician
Induction Interview. For the purposes of this study, we utilized physician-level
responses and physician-level estimates were also computed using patient-level data for
the physicians included in the study.
19
Dependent and Independent Variables
Outcome variables included in the study were healthcare service delivery
variables related to service efficiency/productivity to mediate new healthcare delivery
models, including e-consult, e-prescribing, e-billing, set aside same day appointments,
and time spent with patients. These outcomes also associated with increased patient
satisfaction by their ability to deliver timely care. E-consult, e-prescribing, and e-billing
were answered by physicians if they used the service with patients during the last week
of practice at the time of the survey, and were coded as dichotomous variables: “yes” (1)
and “no” (0). Set aside same day appointments was also a dichotomous variable
(yes=1; no=0) from the survey question, “Does your practice set aside for same day
appointments?” Time spent with patients was calculated as a physician-level average
from patient-level information for each unique physician included in the sample. The
primary independent variable is EHR use based on the question “Does your practice use
an electronic health record (EHR) or electronic medical record (EMR) system?”
Responses were coded as “no EHR”, “Yes, part paper and part electronic” (partially
EHR), and “Yes, all electronic” (fully EHR).
Other independent variables included: solo or group practice (practice size),
ownership of organization, percent of revenue from Medicaid patients (payer mix),
rurality, region, physician-level patients’ reason for visit, and physician specialty. Group
and solo practice were self-reported by physicians, and used as a proxy for organization
size. Physicians that belong to group practices may have greater resources and shared
resources compared to physicians that belong to solo practices (HSRA, 2010; MGMA,
2010; Casalino et al, 2004; Welch et al, 2013). Ownership of the organization were self-
reported by physicians from the survey question “Who owns this practice at the visit
location?” Responses were recoded by NAMCS into the following categories: (1)
20
physician or physicians group; (2) medical/academic health center and other hospital;
and (3) insurance company, company, health plan, HMO, other health care corporation,
and other. Percent of revenue from Medicaid patients was used as a proxy for payer
mix to describe the patient population for each physician. Physicians were asked in the
survey, “Roughly, what percent of your patient care revenue comes from Medicaid?”
Metropolitan statistical area (MSA) and geographic region were used to determine the
location characteristics of the physician’s practice. Patient-level data was used to
determine patients’ reason for visit for each physician. The distribution of patients’
characteristics regarding major reason for visit were calculated for each physicians
including: new problem (<3 months onset), chronic problem (routine and flare-up),
chronic problem, pre-/post-surgical care, and preventive care (e.g. routine prenatal, well-
baby, screening, insurance, general exams). Physician specialty was included as a
provider characteristic that influences health service delivery outcomes based on the
nature of their work, and categorized as medical, surgical, and primary care specialties
internally by NAMCS. See Appendix A for more information of AMA specialties that
were regrouped into medical, surgical, and primary care specialties.
Statistical Analysis
First, we produced data summary statistics and performed bivariate analysis to
examine the difference in outcome variables and explanatory variables by EHR use
level. Then, we conducted multivariate regression analyses to examine the association
of EHR use and outcome variables. An ordinary least squares (OLS) method was used
to determine the effect between EHR use and physician’s average time spent with
patients. A logit model was used to determine the effect of EHR on the probability of
having other health service delivery outcomes, including set aside same day
appointment, e-consults, e-prescribing, and e-billing. Model selection was determined
21
by forward selection. We first adjusted for basic practice and location characteristics of
the providers, including solo or group practice (practice size), ownership of organization,
percent of Medicaid revenue (payer mix), and region. The final model adjusted for solo
or group practice (practice size), ownership of organization, percent of Medicaid revenue
(payer mix), rurality, region, physician-level patients’ reason for visit, and physician
specialty. All analysis were adjusted with primary sampling unit (PSU), probability
weight for physician, and strata in survey design analysis (SVY) to estimate nationally
representative physician level estimates using Stata/IC v.14.1.
RESULTS
A. Descriptive Statistics
Over half (54.3%) of physicians used fully EHRs in their practices, while 32.2% of
physicians did not have EHRs, and 13.5% had partially EHR systems. The majority of
the physician practices were owned by physician or physician groups (82.2%), were
group practices (63.3%), located in the south region of the United States (35.2%), and
were located in metropolitan statistical areas (92.2%). The majority of physicians had a
payer mix of 0 to 25 percent of revenue from Medicaid patients (82.8%), and the majority
of their patients sought care for chronic care (41.9%, mean). The majority of physicians
specialties were primary care (46.9%), followed by medical (33.0%) and surgical
(20.1%). See Appendix A for AMA physician specialties regrouped into primary care,
surgical, and medical specialties.
Table 1 shows the characteristics of the sample by EHR use. There were
significant differences in ownership, solo or group practice, region, patients’ reason for
visit, and physician specialty among physicians with different EHR use levels.
Physicians with fully EHRs had a higher percentage of ownership by insurance
22
companies, health plans, and HMOs (12%), and medical/academic health centers and
community health centers (9.8%) compared to the other two EHR groups (p<0.001).
The majority of physicians without an EHR belong to solo group practices (55.1%),
compared to the majority of physicians with partially EHRs (58.8%) and fully EHRs
(75.5%) belong to group practices (p<0.001). There were also significant differences
(p=0.003) in geographic region between EHR groups, where the majority of physicians
without EHRs were from the South and Northeast regions, physicians with partial EHRs
from the South and Northeast regions, and physicians with full EHRs from the South and
West regions. There were no significant differences in rurality between the EHR groups.
Physicians without EHRs saw 44.6% for chronic care, compared to 47.0% for physicians
with partially EHRs, and 39.6% for physicians with fully EHRs (p<0.001). There were no
significant differences in percent of revenue from Medicaid patients between EHR
groups (p=0.164). Over half of the physicians that have fully EHRs (51.2%) belong to
primary care specialty, compared to 44.1% of physicians with partially EHRs and 41.0%
of physicians without an EHR (p=0.003).
23
Table 1. Weighted percent of physician, patient, and organizational characteristics by EHR Use Level among the physician population in the United States in 2012.
Variables Total sample
No EHR
Partial EHR
Full EHR
P-value
Organization Characteristics
Ownership Physician/physicians group Medical/academic health center; CHC Insurance company, health plan, HMO
82.2% 7.6%
10.2%
88.3% 4.3%
7.4%
86.6% 6.0%
7.5%
77.4% 9.8%
12.8%
<0.001
Solo practice Solo Group
36.7% 63.3%
55.1% 44.9%
41.2% 58.8%
24.5% 75.5%
<0.001
Region Northeast Midwest South West
21.5% 18.9% 35.2% 24.4%
26.4% 18.6% 31.7% 23.3%
25.9% 15.6% 36.3% 22.2%
17.6% 20.0% 36.9% 25.4%
0.003
Rurality MSA Non-MSA
92.2% 7.8%
91.9% 8.1%
92.6% 7.4%
92.3% 7.7%
0.859
Patient characteristics (practice-level mean)
Reason for visit (% of patients) New problem Chronic care Pre-/Post-surgical care Preventative care
28.5% 42.6% 8.3%
20.6%
29.6% 44.6% 7.9%
18.0%
27.8% 47.0% 8.6%
16.6%
34.3% 39.6% 6.6%
19.6%
<0.001
Payer mix Percent of Patients on Medicaid 0- 25% 26-50% 51%-75% 76%-100%
82.8% 11.0% 4.0% 2.2%
82.1% 10.3% 5.6% 2.1%
79.6% 12.7% 4.9% 2.8%
84.0% 11.2% 2.7% 2.1%
0.164
Physician characteristics
Specialty Primary care Surgical care Medical care
46.9% 20.1% 33.0%
41.0% 23.3% 35.7%
44.1% 19.1% 36.8%
51.2% 18.4% 30.4%
0.003
Notes: Percent reported were adjusted with PSU, probability weight, and strata in svy design analysis to represent national estimates. Columns add up to 100%
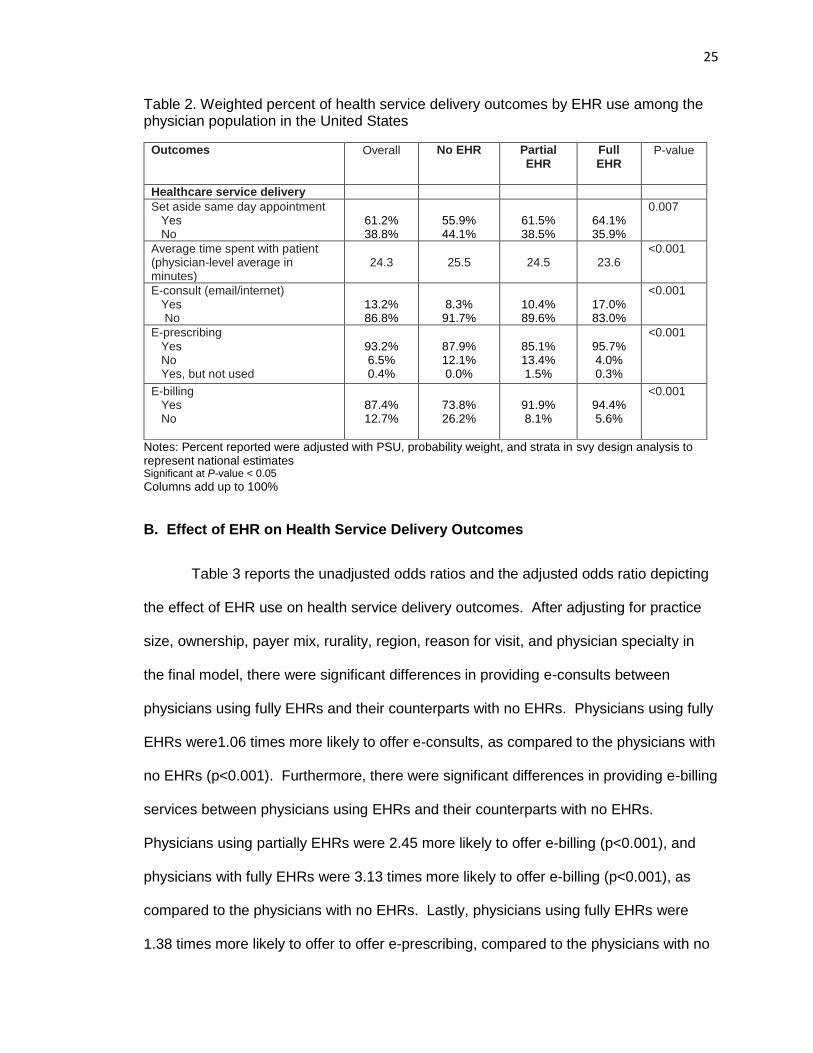
Heath service delivery outcomes are described by EHR use level among the
physician population in Table 2. Among health service delivery outcomes, the majority
of the physician population in the United States has set time aside for same day
appointments (61.2%). There were significant differences in the percentage of setting
time aside for same day appointments among physicians with different levels of EHR
24
use, where 64.1% of physicians that used fully EHRs and 61.5% of physicians using
partially EHRs did set time aside for same day appointments, respectively, but only
55.9% of physicians that did not use an EHR system set aside same day appointments.
The total physician population spent an average of 24.3 minutes with their
patients per visit. There were significant differences in the average time spent with
patients among physicians with different levels of EHR use, where the average time
spent with patient decreased to 23.6 minutes in physicians using a fully EHR from 25.5
minutes in physicians that did not use an EHR (Table 2). Only 13.2% of the physicians
provided an e-consult with patients in the last week. There were significant differences
in the percentage of e-consults among physicians with different levels of EHR use,
where 17.0% of physicians with fully EHRs provided e-consults, followed by 10.4% with
partially EHRs, and only 8.3% with no EHR systems. Ninety-three percent of the
physicians sent their prescription orders electronically to the pharmacy (e-prescribing).
There were significant differences in the percentage of e-prescribing among physicians
with different levels of EHR use, where 95.7% of physicians with fully EHRs and 87.9%
with no EHR systems provided e-prescribing, respectively, but only 85.1% of physicians
with partially EHRs provided e-prescribing services. Eighty-seven percent of physicians
submit claims electronically (e-billing). There were significant differences in the
percentage of e-billing among physicians with different levels of EHR use, where 94.4%
of physicians with fully EHRs provided e-billing, followed by 91.9% with partially EHRs,
and only 73.8% with no EHR systems.
25
Table 2. Weighted percent of health service delivery outcomes by EHR use among the physician population in the United States
Outcomes Overall No EHR
Partial EHR
Full EHR
P-value
Healthcare service delivery
Set aside same day appointment Yes No
61.2% 38.8%
55.9% 44.1%
61.5% 38.5%
64.1% 35.9%
0.007
Average time spent with patient (physician-level average in minutes)
24.3
25.5
24.5
23.6
<0.001
E-consult (email/internet) Yes No
13.2% 86.8%
8.3%
91.7%
10.4% 89.6%
17.0% 83.0%
<0.001
E-prescribing Yes No Yes, but not used
93.2% 6.5% 0.4%
87.9% 12.1% 0.0%
85.1% 13.4% 1.5%
95.7% 4.0% 0.3%
<0.001
E-billing Yes No
87.4% 12.7%
73.8% 26.2%
91.9% 8.1%
94.4% 5.6%
<0.001
Notes: Percent reported were adjusted with PSU, probability weight, and strata in svy design analysis to represent national estimates Significant at P-value < 0.05
Columns add up to 100%
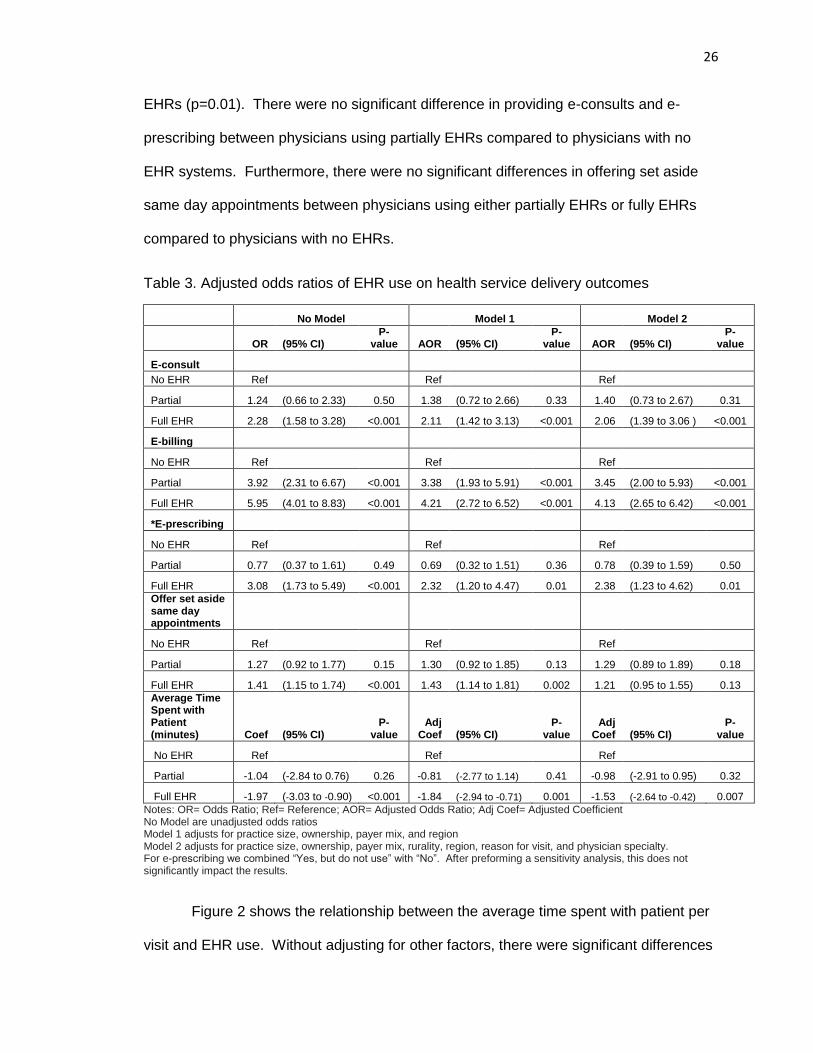
B. Effect of EHR on Health Service Delivery Outcomes
Table 3 reports the unadjusted odds ratios and the adjusted odds ratio depicting
the effect of EHR use on health service delivery outcomes. After adjusting for practice
size, ownership, payer mix, rurality, region, reason for visit, and physician specialty in
the final model, there were significant differences in providing e-consults between
physicians using fully EHRs and their counterparts with no EHRs. Physicians using fully
EHRs were1.06 times more likely to offer e-consults, as compared to the physicians with
no EHRs (p<0.001). Furthermore, there were significant differences in providing e-billing
services between physicians using EHRs and their counterparts with no EHRs.
Physicians using partially EHRs were 2.45 more likely to offer e-billing (p<0.001), and
physicians with fully EHRs were 3.13 times more likely to offer e-billing (p<0.001), as
compared to the physicians with no EHRs. Lastly, physicians using fully EHRs were
1.38 times more likely to offer to offer e-prescribing, compared to the physicians with no
26
EHRs (p=0.01). There were no significant difference in providing e-consults and e-
prescribing between physicians using partially EHRs compared to physicians with no
EHR systems. Furthermore, there were no significant differences in offering set aside
same day appointments between physicians using either partially EHRs or fully EHRs
compared to physicians with no EHRs.
Table 3. Adjusted odds ratios of EHR use on health service delivery outcomes
No Model Model 1 Model 2
OR (95% CI) P-
value AOR (95% CI) P-
value AOR (95% CI) P-
value
E-consult
No EHR Ref Ref Ref
Partial 1.24 (0.66 to 2.33) 0.50 1.38 (0.72 to 2.66) 0.33 1.40 (0.73 to 2.67) 0.31
Full EHR 2.28 (1.58 to 3.28) <0.001 2.11 (1.42 to 3.13) <0.001 2.06 (1.39 to 3.06 ) <0.001
E-billing
No EHR Ref Ref Ref
Partial 3.92 (2.31 to 6.67) <0.001 3.38 (1.93 to 5.91) <0.001 3.45 (2.00 to 5.93) <0.001
Full EHR 5.95 (4.01 to 8.83) <0.001 4.21 (2.72 to 6.52) <0.001 4.13 (2.65 to 6.42) <0.001
*E-prescribing
No EHR Ref Ref Ref
Partial 0.77 (0.37 to 1.61) 0.49 0.69 (0.32 to 1.51) 0.36 0.78 (0.39 to 1.59) 0.50
Full EHR 3.08 (1.73 to 5.49) <0.001 2.32 (1.20 to 4.47) 0.01 2.38 (1.23 to 4.62) 0.01
Offer set aside same day appointments
No EHR Ref Ref Ref
Partial 1.27 (0.92 to 1.77) 0.15 1.30 (0.92 to 1.85) 0.13 1.29 (0.89 to 1.89) 0.18
Full EHR 1.41 (1.15 to 1.74) <0.001 1.43 (1.14 to 1.81) 0.002 1.21 (0.95 to 1.55) 0.13
Average Time Spent with Patient (minutes) Coef (95% CI)
P-value
Adj Coef (95% CI)
P-value
Adj Coef (95% CI)
P-value
No EHR Ref Ref Ref
Partial -1.04 (-2.84 to 0.76) 0.26 -0.81 (-2.77 to 1.14) 0.41 -0.98 (-2.91 to 0.95) 0.32
Full EHR -1.97 (-3.03 to -0.90) <0.001 -1.84 (-2.94 to -0.71) 0.001 -1.53 (-2.64 to -0.42) 0.007
Notes: OR= Odds Ratio; Ref= Reference; AOR= Adjusted Odds Ratio; Adj Coef= Adjusted Coefficient No Model are unadjusted odds ratios Model 1 adjusts for practice size, ownership, payer mix, and region Model 2 adjusts for practice size, ownership, payer mix, rurality, region, reason for visit, and physician specialty. For e-prescribing we combined “Yes, but do not use” with “No”. After preforming a sensitivity analysis, this does not significantly impact the results.
Figure 2 shows the relationship between the average time spent with patient per
visit and EHR use. Without adjusting for other factors, there were significant differences
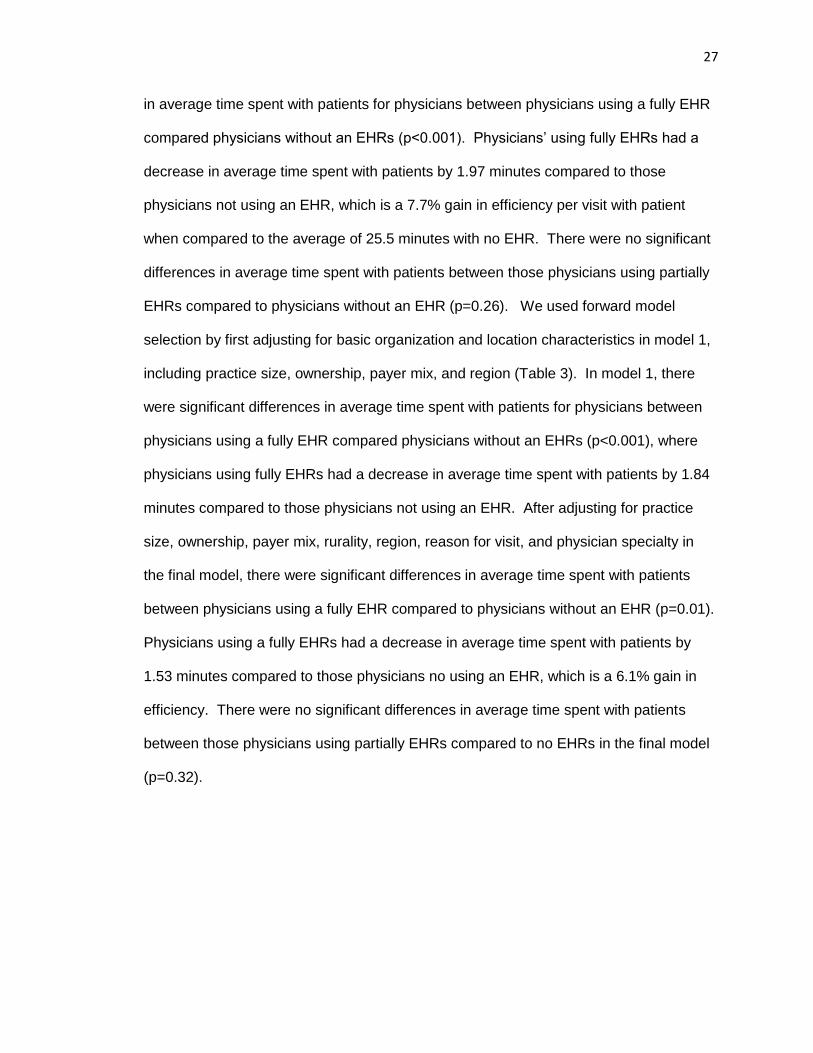
27
in average time spent with patients for physicians between physicians using a fully EHR
compared physicians without an EHRs (p<0.001). Physicians’ using fully EHRs had a
decrease in average time spent with patients by 1.97 minutes compared to those
physicians not using an EHR, which is a 7.7% gain in efficiency per visit with patient
when compared to the average of 25.5 minutes with no EHR. There were no significant
differences in average time spent with patients between those physicians using partially
EHRs compared to physicians without an EHR (p=0.26). We used forward model
selection by first adjusting for basic organization and location characteristics in model 1,
including practice size, ownership, payer mix, and region (Table 3). In model 1, there
were significant differences in average time spent with patients for physicians between
physicians using a fully EHR compared physicians without an EHRs (p<0.001), where
physicians using fully EHRs had a decrease in average time spent with patients by 1.84
minutes compared to those physicians not using an EHR. After adjusting for practice
size, ownership, payer mix, rurality, region, reason for visit, and physician specialty in
the final model, there were significant differences in average time spent with patients
between physicians using a fully EHR compared to physicians without an EHR (p=0.01).
Physicians using a fully EHRs had a decrease in average time spent with patients by
1.53 minutes compared to those physicians no using an EHR, which is a 6.1% gain in
efficiency. There were no significant differences in average time spent with patients
between those physicians using partially EHRs compared to no EHRs in the final model
(p=0.32).
28
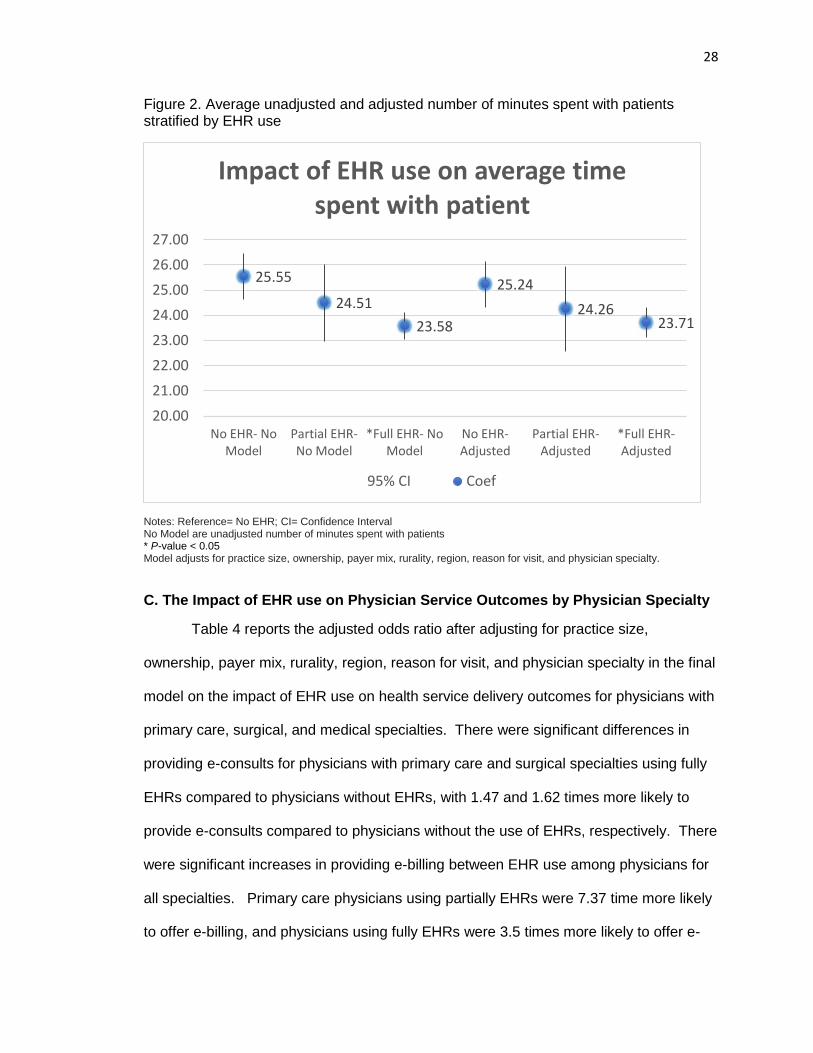
Figure 2. Average unadjusted and adjusted number of minutes spent with patients stratified by EHR use
Notes: Reference= No EHR; CI= Confidence Interval No Model are unadjusted number of minutes spent with patients * P-value < 0.05 Model adjusts for practice size, ownership, payer mix, rurality, region, reason for visit, and physician specialty.
C. The Impact of EHR use on Physician Service Outcomes by Physician Specialty
Table 4 reports the adjusted odds ratio after adjusting for practice size,
ownership, payer mix, rurality, region, reason for visit, and physician specialty in the final
model on the impact of EHR use on health service delivery outcomes for physicians with
primary care, surgical, and medical specialties. There were significant differences in
providing e-consults for physicians with primary care and surgical specialties using fully
EHRs compared to physicians without EHRs, with 1.47 and 1.62 times more likely to
provide e-consults compared to physicians without the use of EHRs, respectively. There
were significant increases in providing e-billing between EHR use among physicians for
all specialties. Primary care physicians using partially EHRs were 7.37 time more likely
to offer e-billing, and physicians using fully EHRs were 3.5 times more likely to offer e-
25.55
24.51
23.58
25.24
24.2623.71
20.00
21.00
22.00
23.00
24.00
25.00
26.00
27.00
No EHR- NoModel
Partial EHR-No Model
*Full EHR- NoModel
No EHR-Adjusted
Partial EHR-Adjusted
*Full EHR-Adjusted
Impact of EHR use on average time spent with patient
95% CI Coef
29
billing compared to physicians without the use of EHRs. Among primary care
physicians, physicians using a fully EHRs were 3.56 times more likely to offer e-
prescribing compared to physicians without EHRs. However, there were no significant
differences in providing e-prescribing between EHR use among surgical and medical
specialties. Additionally, there were no significant differences in offering set aside same
day appointments between EHR use across the three specialties.
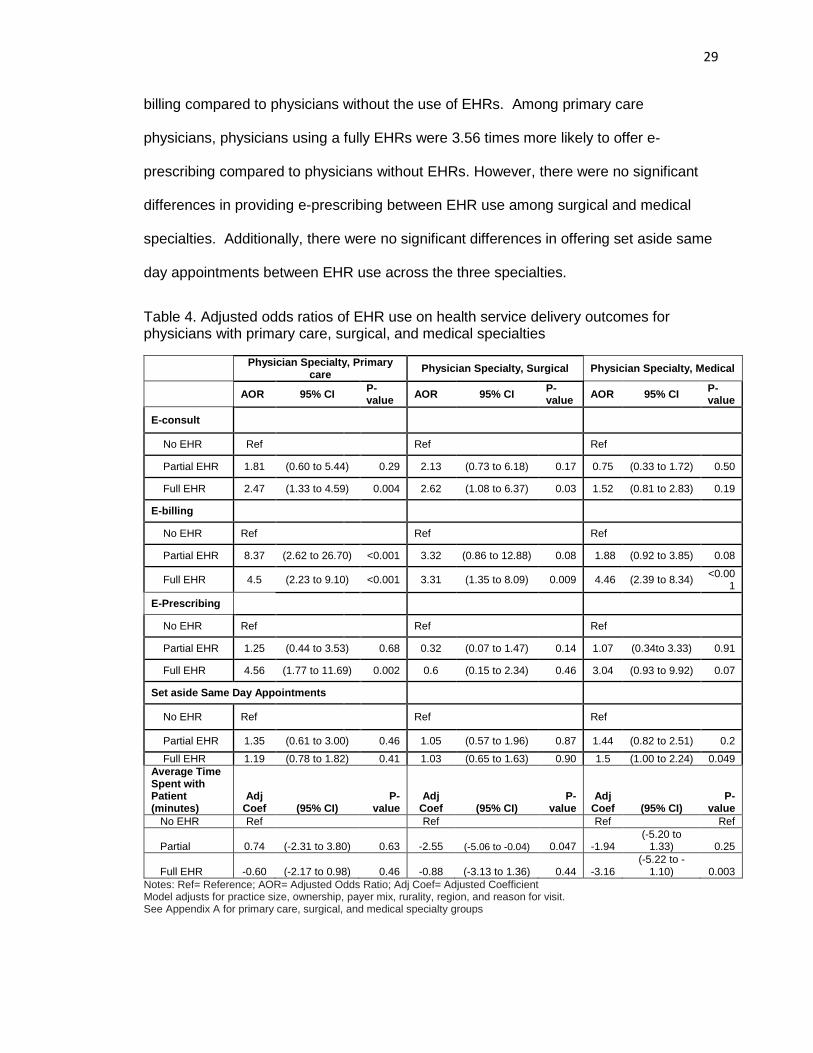
Table 4. Adjusted odds ratios of EHR use on health service delivery outcomes for physicians with primary care, surgical, and medical specialties
Physician Specialty, Primary
care Physician Specialty, Surgical Physician Specialty, Medical
AOR 95% CI
P-value
AOR 95% CI P-value
AOR 95% CI P-value
E-consult
No EHR Ref Ref Ref
Partial EHR 1.81 (0.60 to 5.44) 0.29 2.13 (0.73 to 6.18) 0.17 0.75 (0.33 to 1.72) 0.50
Full EHR 2.47 (1.33 to 4.59) 0.004 2.62 (1.08 to 6.37) 0.03 1.52 (0.81 to 2.83) 0.19
E-billing
No EHR Ref Ref Ref
Partial EHR 8.37 (2.62 to 26.70) <0.001 3.32 (0.86 to 12.88) 0.08 1.88 (0.92 to 3.85) 0.08
Full EHR 4.5 (2.23 to 9.10) <0.001 3.31 (1.35 to 8.09) 0.009 4.46 (2.39 to 8.34) <0.00
1
E-Prescribing
No EHR Ref Ref Ref
Partial EHR 1.25 (0.44 to 3.53) 0.68 0.32 (0.07 to 1.47) 0.14 1.07 (0.34to 3.33) 0.91
Full EHR 4.56 (1.77 to 11.69) 0.002 0.6 (0.15 to 2.34) 0.46 3.04 (0.93 to 9.92) 0.07
Set aside Same Day Appointments
No EHR Ref
Ref Ref
Partial EHR 1.35 (0.61 to 3.00) 0.46 1.05 (0.57 to 1.96) 0.87 1.44 (0.82 to 2.51) 0.2
Full EHR 1.19 (0.78 to 1.82) 0.41 1.03 (0.65 to 1.63) 0.90 1.5 (1.00 to 2.24) 0.049
Average Time Spent with Patient (minutes)
Adj Coef (95% CI)
P-value
Adj Coef (95% CI)
P-value
Adj Coef (95% CI)
P-value
No EHR Ref Ref Ref Ref
Partial 0.74 (-2.31 to 3.80) 0.63 -2.55 (-5.06 to -0.04) 0.047 -1.94 (-5.20 to
1.33) 0.25
Full EHR -0.60 (-2.17 to 0.98) 0.46 -0.88 (-3.13 to 1.36) 0.44 -3.16 (-5.22 to -
1.10) 0.003
Notes: Ref= Reference; AOR= Adjusted Odds Ratio; Adj Coef= Adjusted Coefficient Model adjusts for practice size, ownership, payer mix, rurality, region, and reason for visit. See Appendix A for primary care, surgical, and medical specialty groups
30
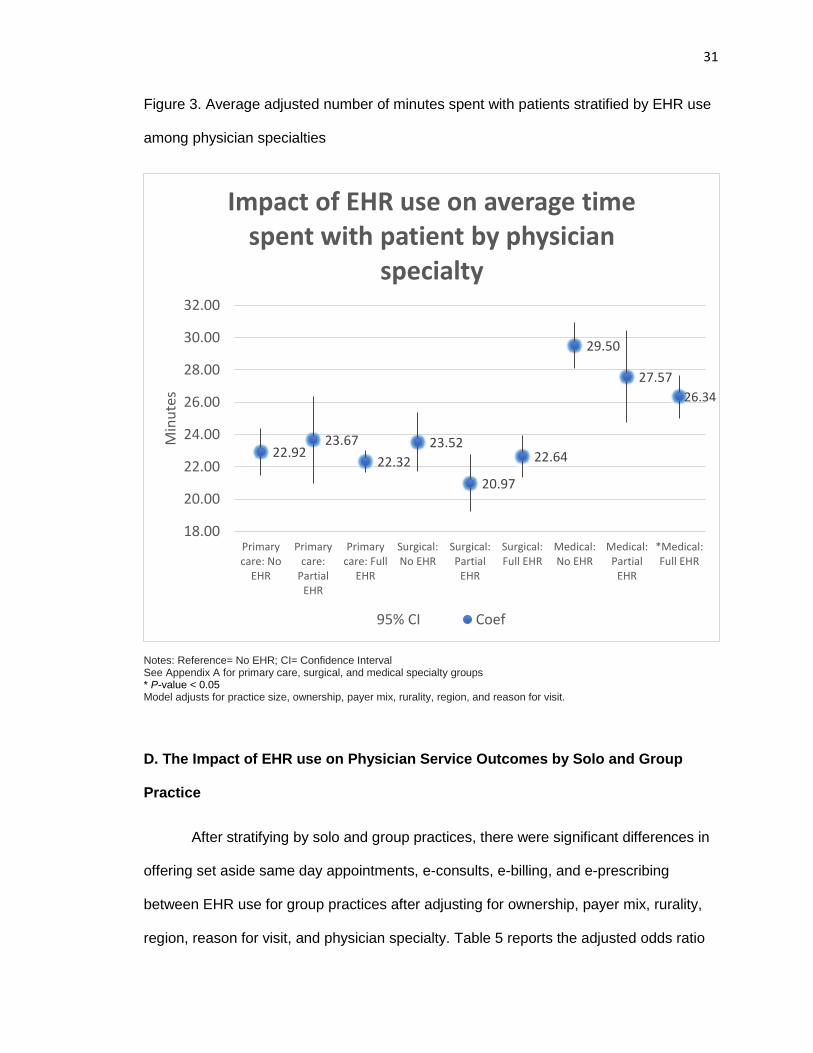
Figure 3 shows the relationship in average time spent with patients between
physicians with varied EHR use for physicians with primary care, surgical and medical
specialties. After adjusting for practice size, ownership, payer mix, rurality, region, and
reason for visit in the final model, there were significant differences in average time
spent with patients between physicians with fully EHRs that belong to the medical
specialties compared to physicians with medical specialties that did not use EHRs
(p=0.003). Physicians’ with medical specialties using a fully EHR had a decrease in
average time spent with patients by 3.16 minutes as compared to their counterparts
without EHRs, which is a 10.7% gain in efficiency per visit compared to the average time
spent with patient for physicians without an EHR. There were no significant differences
in time spent with patents for physicians with primary care or surgical specialties
between EHRs use in the final model.
31
Figure 3. Average adjusted number of minutes spent with patients stratified by EHR use
among physician specialties
Notes: Reference= No EHR; CI= Confidence Interval See Appendix A for primary care, surgical, and medical specialty groups * P-value < 0.05 Model adjusts for practice size, ownership, payer mix, rurality, region, and reason for visit.
D. The Impact of EHR use on Physician Service Outcomes by Solo and Group
Practice
After stratifying by solo and group practices, there were significant differences in
offering set aside same day appointments, e-consults, e-billing, and e-prescribing
between EHR use for group practices after adjusting for ownership, payer mix, rurality,
region, reason for visit, and physician specialty. Table 5 reports the adjusted odds ratio
22.9223.67
22.32
23.52
20.97
22.64
29.50
27.57
26.34
18.00
20.00
22.00
24.00
26.00
28.00
30.00
32.00
Primarycare: No
EHR
Primarycare:
PartialEHR
Primarycare: Full
EHR
Surgical:No EHR
Surgical:Partial
EHR
Surgical:Full EHR
Medical:No EHR
Medical:Partial
EHR
*Medical:Full EHR
Min
ute
s
Impact of EHR use on average time spent with patient by physician
specialty
95% CI Coef
32
in the final model on the impact of EHR use on health service delivery outcomes for
physicians that belong to solo and group practices.
Among physicians that belong to group practices, there were significant
differences in providing e-consults for physicians between using fully EHRs compared to
no EHRs, where they were 1.68 times more likely to provide e-consults compared to
physicians without the use of EHRs. Furthermore, among physicians that belong to
group practices using fully EHRs were 3.81 times more likely to provide e-prescribing
than physicians that belong to group practices without EHRs. Among physicians that
belong to group practices, there were significant differences in offering set aside same
day appointments between physicians with varied EHR use, but the same impact was
not observed for solo practices. Physicians that belong to group practices using partially
EHRs were 0.64 times more likely to offer set aside same day appointments compared
to their counterparts without the use of EHRs, although with marginal significance
(p=0.04). There were significant differences in offering set aside same day
appointments between physicians with the use of fully EHRs that belong to group
practices, where they were 0.57 times more likely to offer set aside same day
appointments compared their counterparts without the use of EHRs.
33
Table 5. Adjusted odds ratios of EHR use on health service delivery outcomes for physicians that belong to solo and group practices
Solo Practice Group Practice
AOR 95% CI P-value AOR 95% CI P-value
E-consult
No EHR Ref Ref
Partial EHR 1.06 (0.35 to 3.14) 0.923 1.84 (0.82 to 4.11) 0.14
Full EHR 1.62 (0.91 to 2.89) 0.101 2.68 (1.49 to 4.81) 0.001
E-billing
No EHR Ref Ref
Partial EHR 2.68 (1.38 to 5.22) 0.004 5.69 (2.39 to 13.52) <0.001
Full EHR 3.64 (1.89 to 7.00) <0.001 5.09 (2.93 to 8.84) <0.001
E-Prescribing
No EHR Ref Ref
Partial EHR 0.75 (0.24 to 2.36) 0.62 1.03 (0.41 to 2.59) 0.94
Full EHR 1.21 (0.48 to 3.05) 0.69 4.81 (1.93 to 11.96) 0.001
Set aside same day appointments
No EHR Ref Ref
Partial EHR 1.08 (0.59 to 2.01) 0.80 1.64 (1.02 to 2.62) 0.04
Full EHR 0.88 (0.59 to 1.31) 0.53 1.57 (1.15 to 2.14) 0.005
Average Time Spent with Patient (minutes)
Adj Coef (95% CI) P-value
Adj Coef (95% CI)
P-value
No EHR Ref Ref
Partial -1.82 (-4.48 to 0.84) 0.18 -0.06 (-2.66 to 2.55) 0.97
Full EHR -1.91 (-3.67 to -0.15) 0.03 -0.93 (-2.35 to 0.49) 0.20
Notes: Ref= Reference; AOR= Adjusted Odds Ratio; Adj Coef= Adjusted Coefficient Model adjusts for ownership, payer mix, rurality, region, reason for visit, and physician specialty
Figure 4 show the relationship in average time spent with patients between EHR
use for physicians from solo and group practices. After adjusting for ownership, payer
mix, rurality, region, reason for visit, and physician specialty in the final model, there
were significant differences in average time spent with patients between EHR use for
physicians belonging to solo practices using fully EHRs compared to no EHRs
(p=0.003). Physicians’ belonging to solo practices using a fully EHR had a decrease in
average time spent with patients by 1.91 minutes compared to those physicians no using
an EHR, which is a 7.2% gain in efficiency per visit compared to the average time spent
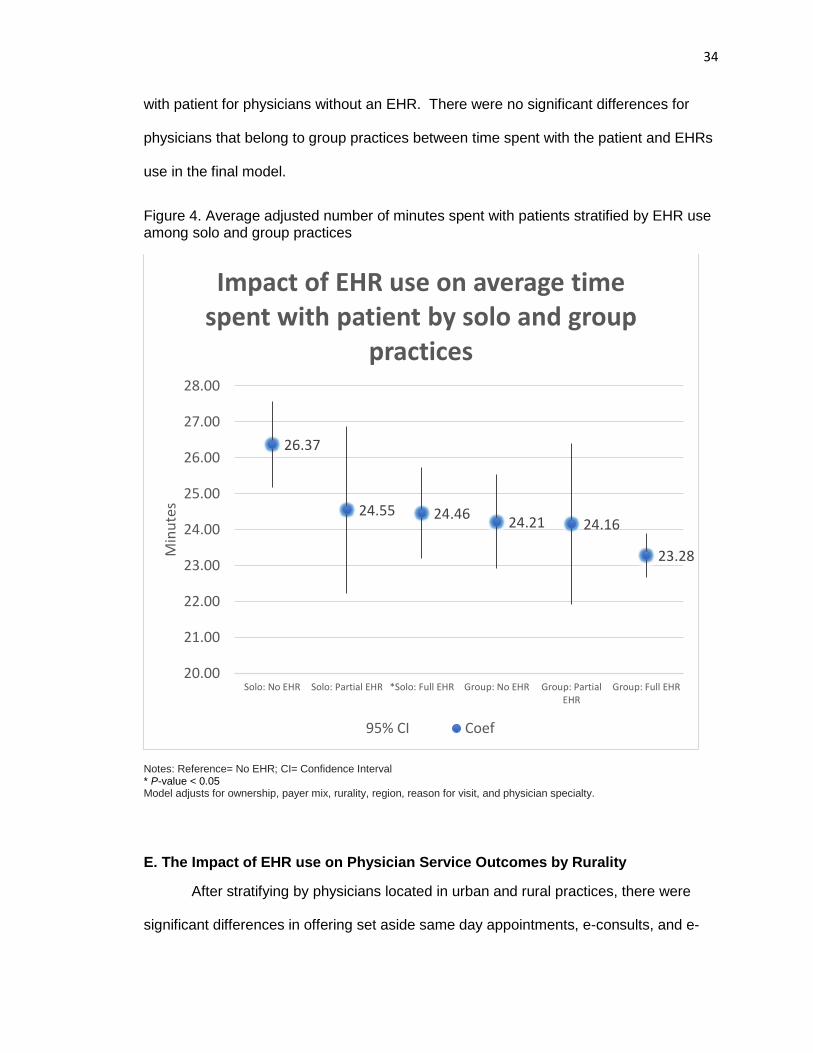
34
with patient for physicians without an EHR. There were no significant differences for
physicians that belong to group practices between time spent with the patient and EHRs
use in the final model.
Figure 4. Average adjusted number of minutes spent with patients stratified by EHR use among solo and group practices
Notes: Reference= No EHR; CI= Confidence Interval * P-value < 0.05 Model adjusts for ownership, payer mix, rurality, region, reason for visit, and physician specialty.
E. The Impact of EHR use on Physician Service Outcomes by Rurality
After stratifying by physicians located in urban and rural practices, there were
significant differences in offering set aside same day appointments, e-consults, and e-
26.37
24.55 24.4624.21 24.16
23.28
20.00
21.00
22.00
23.00
24.00
25.00
26.00
27.00
28.00
Solo: No EHR Solo: Partial EHR *Solo: Full EHR Group: No EHR Group: PartialEHR
Group: Full EHR
Min
ute
s
Impact of EHR use on average time spent with patient by solo and group
practices
95% CI Coef
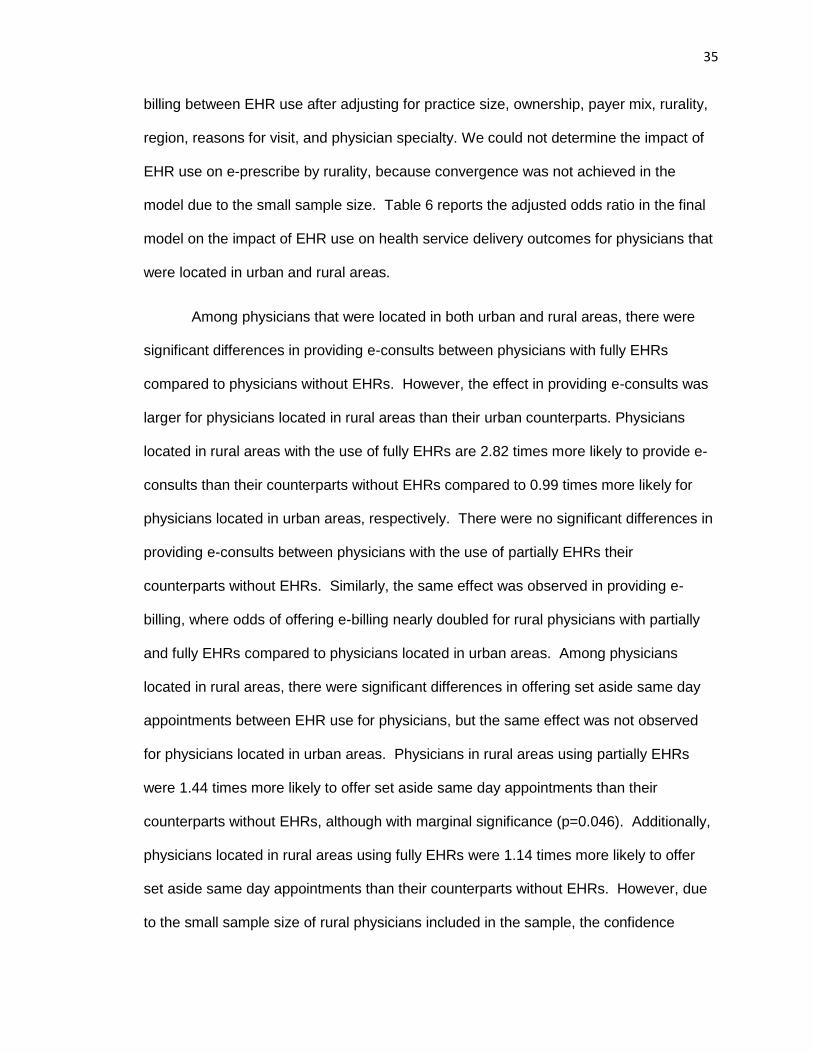
35
billing between EHR use after adjusting for practice size, ownership, payer mix, rurality,
region, reasons for visit, and physician specialty. We could not determine the impact of
EHR use on e-prescribe by rurality, because convergence was not achieved in the
model due to the small sample size. Table 6 reports the adjusted odds ratio in the final
model on the impact of EHR use on health service delivery outcomes for physicians that
were located in urban and rural areas.
Among physicians that were located in both urban and rural areas, there were
significant differences in providing e-consults between physicians with fully EHRs
compared to physicians without EHRs. However, the effect in providing e-consults was
larger for physicians located in rural areas than their urban counterparts. Physicians
located in rural areas with the use of fully EHRs are 2.82 times more likely to provide e-
consults than their counterparts without EHRs compared to 0.99 times more likely for
physicians located in urban areas, respectively. There were no significant differences in
providing e-consults between physicians with the use of partially EHRs their
counterparts without EHRs. Similarly, the same effect was observed in providing e-
billing, where odds of offering e-billing nearly doubled for rural physicians with partially
and fully EHRs compared to physicians located in urban areas. Among physicians
located in rural areas, there were significant differences in offering set aside same day
appointments between EHR use for physicians, but the same effect was not observed
for physicians located in urban areas. Physicians in rural areas using partially EHRs
were 1.44 times more likely to offer set aside same day appointments than their
counterparts without EHRs, although with marginal significance (p=0.046). Additionally,
physicians located in rural areas using fully EHRs were 1.14 times more likely to offer
set aside same day appointments than their counterparts without EHRs. However, due
to the small sample size of rural physicians included in the sample, the confidence
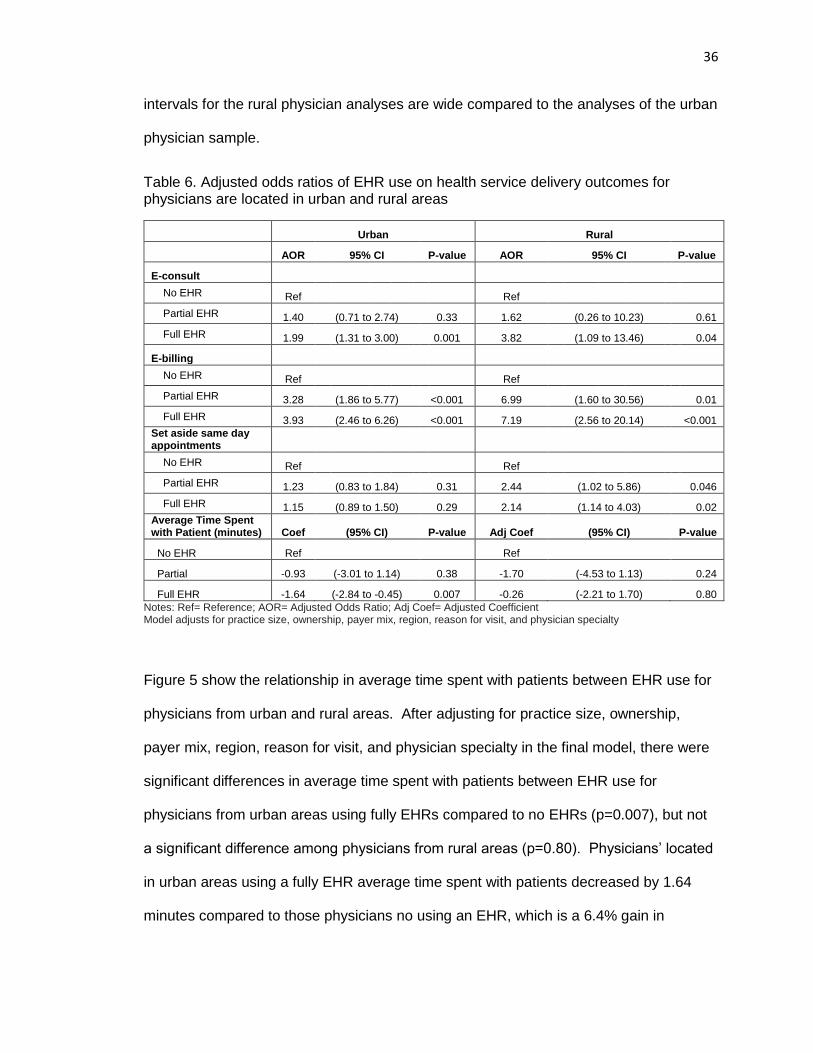
36
intervals for the rural physician analyses are wide compared to the analyses of the urban
physician sample.
Table 6. Adjusted odds ratios of EHR use on health service delivery outcomes for physicians are located in urban and rural areas
Urban Rural
AOR 95% CI P-value AOR 95% CI P-value
E-consult
No EHR Ref Ref
Partial EHR 1.40 (0.71 to 2.74) 0.33 1.62 (0.26 to 10.23) 0.61
Full EHR 1.99 (1.31 to 3.00) 0.001 3.82 (1.09 to 13.46) 0.04
E-billing
No EHR Ref Ref
Partial EHR 3.28 (1.86 to 5.77) <0.001 6.99 (1.60 to 30.56) 0.01
Full EHR 3.93 (2.46 to 6.26) <0.001 7.19 (2.56 to 20.14) <0.001
Set aside same day appointments
No EHR Ref Ref
Partial EHR 1.23 (0.83 to 1.84) 0.31 2.44 (1.02 to 5.86) 0.046
Full EHR 1.15 (0.89 to 1.50) 0.29 2.14 (1.14 to 4.03) 0.02
Average Time Spent with Patient (minutes) Coef (95% CI) P-value Adj Coef (95% CI) P-value
No EHR Ref Ref
Partial -0.93 (-3.01 to 1.14) 0.38 -1.70 (-4.53 to 1.13) 0.24
Full EHR -1.64 (-2.84 to -0.45) 0.007 -0.26 (-2.21 to 1.70) 0.80
Notes: Ref= Reference; AOR= Adjusted Odds Ratio; Adj Coef= Adjusted Coefficient Model adjusts for practice size, ownership, payer mix, region, reason for visit, and physician specialty
Figure 5 show the relationship in average time spent with patients between EHR use for
physicians from urban and rural areas. After adjusting for practice size, ownership,
payer mix, region, reason for visit, and physician specialty in the final model, there were
significant differences in average time spent with patients between EHR use for
physicians from urban areas using fully EHRs compared to no EHRs (p=0.007), but not
a significant difference among physicians from rural areas (p=0.80). Physicians’ located
in urban areas using a fully EHR average time spent with patients decreased by 1.64
minutes compared to those physicians no using an EHR, which is a 6.4% gain in
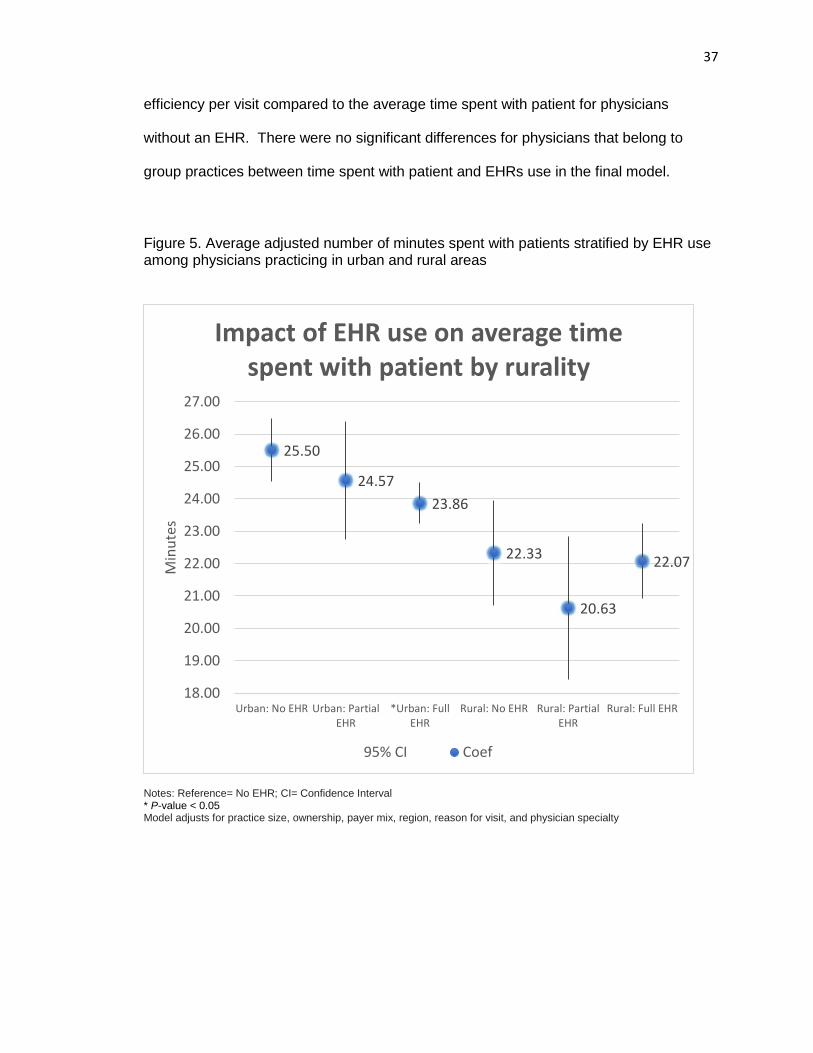
37
efficiency per visit compared to the average time spent with patient for physicians
without an EHR. There were no significant differences for physicians that belong to
group practices between time spent with patient and EHRs use in the final model.
Figure 5. Average adjusted number of minutes spent with patients stratified by EHR use among physicians practicing in urban and rural areas
Notes: Reference= No EHR; CI= Confidence Interval * P-value < 0.05 Model adjusts for practice size, ownership, payer mix, region, reason for visit, and physician specialty
25.50
24.57
23.86
22.33
20.63
22.07
18.00
19.00
20.00
21.00
22.00
23.00
24.00
25.00
26.00
27.00
Urban: No EHR Urban: PartialEHR
*Urban: FullEHR
Rural: No EHR Rural: PartialEHR
Rural: Full EHR
Min
ute
s
Impact of EHR use on average time spent with patient by rurality
95% CI Coef
38
DISCUSSION
This study demonstrates gains in efficiency may be achieved during patient and
physician interaction time with the use of fully EHRs, where physicians saved 1.53
minutes per visit in time spent with the patient, or a 6% gain in efficiency. The odds of
providing e-billing is consistently greater with the use of EHRs across our analyses, with
both partial and fully EHR systems. There was a significant positive relationship
between the physicians that use fully EHRs and providing e-consults, e-billing, and e-
prescribing compared to those physicians without the use of an EHR system. One
strength of this study is that the providers were asked if they provided the service in the
past week, not only if they were capable of providing the service. Physicians may have
EHR systems that contain the ability or functionality to improve the mediation of
delivering certain services, but that does not mean that physicians are utilizing the
system to its capacity. In our study physicians are asked if they have utilized the
electronic-consult health service delivery outcomes in the survey one week prior to
completing the survey. Therein, the study is representative of providers that are utilizing
the electronic health service delivery methods, and not just capable of providing the
service.
Our results suggest that physicians using partially EHRs do not widely impact the
majority of health service delivery outcomes in this study compared to fully EHRs, such
as providing e-consults, e-prescribing, set aside same day appointments, and time spent
with patients. Partially EHR systems may have limited amount of viewable data and
limited functionalities available in their electronic systems, as compared to fully EHRs.
Quality benefits depend on the amount of viewable clinical data (Miller & Sim, 2004),
which is more limited in partially EHRs. Partially EHRs require part paper-based health
records and part electronic health records that still requires staff time spent finding,
39
pulling, and filing charts and physician time spent locating information (Miller & Sim,
2004). Partially EHRs may not offer enough functionality to experience gains in
efficiency, and offer electronically mediated services to move toward new healthcare
models that focus on patient-center care and electronic-mediated healthcare service
delivery.
Providing e-consults, e-prescribing, and referrals are all outcomes related to the
continuity of care, and a priority under the National Committee for Quality Assurance
(Carrier, et al, 2009). It is reported that it would be difficult to achieve these outcomes
without the use of EHRs, but, to our knowledge, there have been no national studies that
determine the ability of EHRs to achieve these outcomes. We conducted an analysis
between EHRs use and providing referrals that is not reported in this analyses, but found
no significant differences. There was a significant positive relationship in providing e-
consults between the physicians that use fully EHRs compared to their counterparts
without EHRs, where physicians were 1.06 times more likely to provide e-consults
respectively. However, more efforts will be needed for physicians to offer e-consults,
where only 13.2% of physician provided e-consults in our study sample. There was a
significant positive relationship in providing e-prescribing between the physicians that
use fully EHRs compared their counterparts without EHRs, where physicians were 1.38
times more likely to offer e-prescribing services respectively. This is consistent with one
study that found that e-prescribing with the use of EHRs had significantly increased from
2008 to 2012 using data from one e-prescribing network, but did not determine the
differences among those physicians with no EHR or partially EHRs (Hufstader, Swain,
Furukawa, 2012). We found that only fully EHRs have a significant impact on providing
e-prescribing, but there were no significant impact with the use of partially EHRs.
40
E-prescribing systems are used to enter, modify, review, and communicate
orders (Car et al, 2008). Just like e-billing, e-prescribing can be integrated into EHRs,
but can also be submitted through stand-alone systems. In fact, the majority of e-
prescribing in the United States is facilitated through the use Surescripts-certified
software to rout prescriptions, where approximately 95 percent of all community
pharmacies utilize the e-prescription network (Hufstader, Swain, Furukawa, 2012). It is
unknown the number of e-prescribing systems that are integrated into EHR systems in
this study. It was previously unclear of the impact of EHRs to improve the use of e-
prescribing, as EHRs may integrate e-prescribing systems but may not necessarily be
utilized by providers.
Movement toward the medical home would require considerable shift in daily
routine, where the National Committee for Quality Assurance outlines principles that
focus on increasing same-day appointments and expanded hours (Carrier, et al, 2009).
We analyzed the relationship between EHR use and offering evening or weekend
appointments that is not reported in this analysis, but found no significant differences.
We found that more efforts are also needed for providers to have the ability to offer set
aside same day appointments. After adjusting for confounding factors, there was not a
significant relationship between the physicians that use EHRs and offering set aside
same day appointments. Set aside same day appointments are an important outcome in
offering patient-centered care and increase patient satisfaction (Carrier et al., 2009).
There are several factors that may impact the ability of providers to offer set aside same
day appointments. First, EHR architecture may need to be strengthened to support
offering these services. EHR functionalities that support the ability of physicians to offer
patient-center healthcare services can be incorporated into the Office of the National
Coordinator for Health Information Technology (ONC) Health IT Certification Program,
41
which oversees the certification criteria and associated standards of EHRs.
Furthermore, literature reports that process improvement strategies are needed with the
use of EHR system to repair suboptimal workflows (Zaroukian and Sierra, 2006).
Process improvement workflow strategies regarding scheduling may need to be
implemented in order to effectively utilize EHR systems to offer set aside same day
appointments.
The odds of providing e-billing is consistently greater with the use of EHR across
our analyses for physicians using both partially and fully EHRs. Integration of billing
software and EHR software can produce additional financial benefits through better
documentation of services provided, better documentation for Medicare coding at higher
levels, and reductions in data-entry staff (Miller & Sim, 2004), suggesting it may be a
priority when implementing EHR systems. To increase financial incentives, focusing on
integration of e-billing may be a priority for physicians with partially EHRs. It is unknown
whether these e-billing systems are incorporated into a comprehensive EHR system or
are stand-alone e-billing software, which may or may not be integrated into their EHR
software. To our knowledge, this is the first study to determine the impact of EHRs on
the utilization of e-billing among a nationally representative office-based physician
population. Future studies should determine the distribution of e-billing that is a part of
comprehensive EHR systems and stand-alone e-billing software, and its impact on
financial and productivity outcomes.
This study demonstrates that with the use of EHRs, slight gains in efficiency may
be gained during patient and physician interaction time. It is likely that this time may be
saved in information gathering, where EHRs can immediately retrieve data about the
patients’ medical history and conditions. In the final model we found that physicians
saved 1.53 minutes per visit in time spent with patient, or a 6.1% gain in efficiency when
42
compared to the average time spent with patient for physicians without an EHR.
Because it was a slight change, it is not likely the result spending less time with the
patients. Rather, it is possible the results suggest that EHRs may act as an efficient way
for physician’s to review and retrieve data and information about their patient’s case or
medical history during the time spent with patients. Other savings outside of the face-
to-face time spent with patient may be gained with the use of EHRs, where financial
savings accrued from less staff time spent finding, pulling, and filing charts and less
physician time spent locating information (Miller & Sim, 2004). It is unclear of the impact
on the quality of time spent with the patient during the interaction, as EHRs decreases in
average time spent with patients. However, it is reported in the literature that EHRs
have the ability to achieve improved healthcare quality benefits depending on the
amount of viewable clinical data (Miller & Sim, 2004). Future studies need to determine
how this decrease in time spent with patient impacts the quality of these interactions
between patients and their providers.
Stratified Analyses
We conducted several stratified analyses based on significant factors that may
impact the relationship between EHR utilization and health service delivery outcomes.
First, we stratified by physician specialty. In the field of consumer health informatics and
the field of human–computer interaction, the literature states that diverse users interact
with HITs in different ways to meet their needs (ISO/IEC, 2008; ISO/IEC, 2010; Mayhew,
1999; Stone et al, 2005; Rosson and Carroll, 2002). Therein, physicians with different
specialties may interact with EHRs in different ways to meet their service needs.
Second, we stratified by group and solo practice. Physicians are incentivized per
physician from the Meaningful Use program, suggesting that group physicians have
more financial resources to adopt and implement EHR systems. Physicians that belong
43
to group practices may have greater munificence and less uncertainty than solo
practices, based on the constructs of the RDT. Third, we performed a stratified analysis
among physicians in urban and rural areas, because the literature consistently states
that rural providers continuously fall behind in EHR adoption and use compared to their
urban counterparts (DesRoches et al., 2012; Tietze MF, Williams J, Galimbertti, 2009;
Boon, 2007; Memel et al., 2001). Rural providers face lower munificence and a higher
degree of uncertainty, based on the constructs of the RDT.
After our stratified analyses, consistent with the un-stratified model results above,
we found that physicians using partially and fully EHR systems increases the odds of
providing e-billing services from both group and solo practices, as well as physicians
from rural and urban areas. However, the effect is stronger for physicians that belong to
group practices compared to solo practices. From this study we know that physicians
using partially EHRs in group practices were more than two times more likely to provide
e-billing than solo practices. Physicians that belong to group practices were 4.69 times
more likely to provide e-billing verses 1.68 times more likely for physicians that belong to
solo practices, compared to their counterparts without EHRs respectively. In addition,
physicians using fully EHRs that belong to group practices were 4.09 times more likely to
provide e-billing verses 2.64 times more likely for physicians that belong to solo
practices, compared to their counterparts without EHRs respectively. Furthermore, we
found a stronger effect in providing e-billing for physicians located in rural areas than
urban areas with the use of EHRs. Physicians using partially and fully EHR systems
located in rural areas have seen significant gains for providing e-billing compared to their
counterparts without the use of EHR systems. Physicians located in rural areas have
odds that were 2 times greater than their urban counterparts in providing e-billing with
the use of EHRs. For example, we found that physicians located in rural areas using
44
partially EHRs were 5.99 times more likely to provide e-billing verses physicians located
in urban areas using partially EHRs were 2.28 times more likely to provide e-billing,
compared to their counterparts without EHRs. These results suggest that rural
providers maybe focusing on using their EHR systems to increase the use of e-billing,
even though rural providers face lower munificence and a higher degree of uncertainty.
In order to meet the needs of rural providers with lower resources, they may be
leveraging their EHRs to focus on improve accuracy in documentation related to billing in
order to improve revenue with their EHR systems. More studies are needed to
determine if rural physicians are receiving the same financial benefits as their urban
counterparts with the use of e-billing technologies. Our stratified analyses suggests that
even partially EHRs are able to improve outcomes in offering e-billing, but especially for
physicians with primary care specialties, physicians part of group practices, and
physicians located in rural areas.
Additionally, we found that physicians with primary care specialties, and
physicians that belong to group practices were more likely to provide e-prescribing
services that use fully EHRs compared to no EHR system, with large effects. Physicians
with primary care specialties using fully EHRs were 3.56 times more likely to offer e-
prescribing compared to primary care physicians without EHRs. Physicians that belong
to group practices with fully EHRs were 4.81 times greater than the odds to provide e-
prescribing than physicians that belonged to group practices without EHRs. However,
we were not able to determine the impact of rurality on e-prescribing because we were
not able to meet model convergence due to the small rural physician sample size. In the
final model there was not a significant relationship between the physicians that use
EHRs and offering set aside same day appointments. However, after our stratified
analyses we found that with the use of EHRs, physicians that belong to group practices
45
and rural areas were more likely to offer set aside same day appointments. For
physicians that belonged to group practices with partially EHRs were 0.64 times more
likely to offer set aside same day appointments, and physicians that belong to group
practices with fully EHRs were 0.57 times more likely to offer set aside same day
appointments than their counterparts without EHRs respectively.
Increasingly over the past decade, physicians have started to move toward group
practices (Liebhaber, Grossman, 2007; Welch et al, 2013), which results in increasing
munificence and sharing of resources while decreasing uncertainty. Our analyses
shows that it may be easier for group practices to achieve the outcomes with the use of
EHRs in healthcare service delivery, which is consistent with the evidence suggested
within the literature. Our results show that providers in group practices provide
significantly greater odds of providing e-consults, e-prescribing, e-billing, and set aside
same day appointments with the use of fully EHRs compared to group practices without
the use of EHRs. The only significant outcomes among solo practices was e-billing, but
at a lower effect than group practices. From the RDT, group practices may have greater
munificence and less uncertainty than solo practices. The resources provided from the
Meaningful Use incentive program may have positively impacted outcomes among
group practices compared to solo practices, where group practices are getting incentives
awarded based on the number of providers utilizing EHR systems. Group practices
have certain advantages over solo practices that would make it easier to achieve
outcomes related to improved quality and healthcare service efficiency including greater
access to capital to make technology investments, shared resources, greater ability to
standardize processes, and the ability to accept more insurance risk (HSRA, 2010;
MGMA, 2010; Casalino et al, 2004; Welch et al, 2013). These providers belonging to
group practice may have more resources (or munificence) to purchase systems with
46
more functionalities with better usability than providers that belong to solo practices,
making it easier to transform their health service delivery patterns. One study found that
solo and small group practices can absorb significant financial risk when implementing
EHR systems (Miller et al., 2005). However, there is no comparative literature for solo
and group practices in achieving outcomes with the use of EHRs. Additionally, group
practices may have the ability to seek more technical support due to the sharing of
resources, and increased information sharing between providers regarding improving
workflow processes with the use of EHR systems. Evidence also suggests that
physicians may find it is easier to achieve greater care coordination and increased
accountability for care delivery to improve the quality of care when they are organized
into group practices rather than when they are in solo practices (Ketcham, et al, 2007;
Welch et al, 2013). Group practices may be facing an increased accountability to adopt
efficient health service delivery methods that accompany the use of EHRs, such as
electronic mediated services, after the costly investment.
There were significant differences among health service delivery outcomes with
the use of EHRs among physician specialties. Primary care physicians provide
significantly greater odds of providing e-consults, e-billing, and e-prescribing with the use
of fully EHRs than primary care physicians without the use of EHRs. We found that
primary care physicians with fully EHRs were 1.47 times more likely to provide e-
consults than their counterparts without EHRs. Additionally, physicians with surgical
specialties using fully EHRs were 1.62 times more likely to provide e-consults than their
counterparts without EHRs. There were no significant results among physicians with
medical specialties regarding e-consults and the use of EHRs. With the use of an EHR
system, the literature reports that Kaiser Permanente specialty care physicians can e-
consult with primary care physicians and coordinate treatment plans much more quickly
47
and effectively than traditional referral-based models of care (Chen et al., 2009). In the
study of consumer health informatics and the field of human–computer interaction,
physicians may interact with EHRs in different ways to meet their needs (ISO/IEC, 2008;
ISO/IEC, 2010; Mayhew, 1999; Stone et al, 2005; Rosson and Carroll, 2002). Due to
the nature of primary care and surgical cases, the need to consult with specialists may
be higher than other specialties. In conjunction with the use of their EHR systems, this
may imply that primary care physicians are seeking e-consults more frequently as
compared to medical specialties to meet the needs in delivering efficient and timely care
to their patients. However, medical specialties had the biggest gains in time efficiency
for average time spent with patient with the use of fully EHRs, with a time savings of
3.16 minutes per visit. This may be achieved efficiency in gaining access to patient
health information and provider documentation that is contained in EHR systems, such
as e-prescribing. Medical specialties were 2.04 times more likely to provide e-
prescribing than their counterparts without the use of EHRs. More research is needed to
determine the factors attributable to efficiency gains in time spent with patients among
medical care specialties.
A large body of literature demonstrates that rural providers continuously fall
behind in EHR adoption and use compared to their urban counterparts (DesRoches et
al., 2012; Tietze MF, Williams J, Galimbertti, 2009; Boon, 2007; Memel et al., 2001).
Based on our central hypothesis from the RDT, our results support that rural physicians
may not be achieving the same gains in efficiency compared to their urban counterparts.
Our results show only urban physicians utilizing fully EHR systems had significant
efficiency gains in time spent with patients compared physicians with no EHR use (1.64
minute decrease per visit), but the effect was not observed among physicians and EHR
use in rural areas. Urban physicians that used fully EHRs had significantly greater odds
48
of providing e-consult and e-billing services than urban physicians without the use of an
EHR. More evidence is required to identify the effect of EHRs in rural areas in achieving
diverse healthcare service efficiency outcomes. The literature reports that rural hospitals
experience significant workflow, staffing, and technical challenges with EHR use (Gabriel
et al, 2014), which may make it difficult to gain the additional resources to overcome
these challenges to achieve efficiency outcomes of their urban counterparts.
Providers with higher degrees of uncertainty may be leveraging their EHR
systems to offer services that benefit their practices. Rural office-based physicians have
significantly greater odds of providing e-consults, e-billing, and set aside same day
appointments compared to physicians with no EHR, with greater effects than urban
physicians with the use of EHRs. For physicians in rural areas using partially EHRs
were 1.44 times more likely in offering set aside same day appointments, and physicians
in rural areas using fully EHRs are 1.14 times more likely in offering set aside same day
appointments, compared to their counterparts without EHRs respectively. Although
there is little evidence provided in the literature about rural hospitals ability to set aside
same day appointments, past studies have reported that generalist physicians were
significantly more likely to offer same day appointments than specialty physicians (Hing
and Schappert, 2012). The same mechanism may be acting with rural providers due to
the variability (uncertainty) of their day-to-day cases in rural areas. From the constructs
of the RDT, rural hospitals may face greater uncertainty regarding patient cases and the
number of same day appointments that will be needed. Under a higher degree of
uncertainty, physicians may utilize their EHR systems in different ways to improve
financial viability. In the study of consumer health informatics and the field of human–
computer interaction, the literature states that diverse users interact with HITs in different
ways to meet their needs (ISO/IEC, 2008; ISO/IEC, 2010; Mayhew, 1999; Stone et al,
49
2005; Rosson and Carroll, 2002). It may be a priority for rural providers to focus on
providing same day appointments with the use of their EHR systems given their
geographic isolation of their patient population for urgent cases, and the pressures faced
by agreeing to treat patient that receives government reimbursement. Rural providers
patient population may consist of a higher proportion of lower income patients that are
part of state and government programs (such as Children’s Health Insurance Program),
which require providers to offer same day appointments and urgent care (DPHHS,
2015).
Even though the literature reports that it will be a challenge for small and rural
hospitals to meet stage 2 meaningful use criteria, as they continue to lag behind their
better-resourced urban counterparts (Alder-Milstein et al., 2014), rural providers are
making changes in their health service delivery with the use of EHRs. Providers with
higher degrees of uncertainty may be leveraging their EHR systems to offer services that
benefit their practices. Our results suggests that rural providers were providing e-billing,
e-consults, e-billing, and set aside same day appointments with odds ratios that were
nearly doubled that of their urban counterparts with the use of EHRs, although with large
confidence intervals due to the small sample size. Again, the results show that they are
providing these health care services, but it is unknown if they are able to achieve
efficiency of their urban counterparts that are utilizing the same electronic mediated
services. Future studies need to increase the sample size of physicians located in rural
areas. Due to the cross-sectional design of the study we were not able to determine the
causality, but the results suggest a significant impact of EHRs among rural physicians in
delivering electronic-mediated healthcare services delivery outcomes that support
productivity.
50
Limitations
First, due to the secondary data source we were limited to adjust for factors that
are included in the dataset. There may be unobserved effects that were not accounted
for in our model, including the perception about technology, engagement in new delivery
models (such as patient center medical homes or pay-for-performance), and the
organization’s financial resources. However, every effort was made to include significant
factors in the final model that were included in the NAMCS survey dataset. Second, it is
unknown whether there is an unobserved clustering effect if more than one physician
was sampled belonging to the same organization or clinic.
Third, there was a small sample size of physicians practicing in rural areas,
producing large confidence intervals in our analysis stratified by rurality. More studies
are needed with a larger sample of rural physician that are nationally representative,
although this study provides insight of the interaction between EHR use of rural
physicians and health service delivery outcomes.
Another limitation is that e-consult were representative of services provided in the
past week before they completed the survey, and may not represent their full healthcare
service delivery patterns or frequency of utilization. The results may be underestimated
by those physicians that may utilize these services, but did not prior to the week of
survey. However, the results appear to have a consistent relationship between
increasing healthcare service delivery outcomes (such as e-consult, e-billing, and e-
prescribing) with increasing functionality of partial and fully EHR use. Future studies are
needed to determine patterns of engagement in these healthcare service delivery
outcomes.
51
Furthermore, we were not able to identify specific functionalities included among
partially or fully EHRs. Variability may exist in the functionalities offered in partially and
fully EHRs, making it difficult to identify the specific functionalities and their association
with the identified outcomes. However, the study offers insight into a nationally
representative sample of physicians with partially electronic and fully EHRs in the year
2012.
Due to the temporality of the data the results may be underestimated, as 2012
was early adoption of EHR use in receiving Meaningful Use incentives. However, we
used the most recent NAMCS data that was available at the time of analysis. Since
2012, Meaningful Use criteria and objectives have been modified to better align with
EHR use, and require the use of certified EHRs by an ONC Authorized Certification
Body (ONC-ACB). EHR certification was developed to improve EHRs transparency for
purchasers for EHRs that meet federal requirements for technological capability,
functionality, usability, and security requirement (Federal Register, 2015). Widely
adopting EHRs that are more highly functional and easier to use would increase the
effectiveness to utilize healthcare service delivery that is mediated with the use of EHRs.
More recent studies are needed to determine how widely these healthcare service
delivery outcomes are utilized among the United States healthcare system among
hospitals utilizing certified EHRs, and the impact on physicians’ time spent with patients.
Lastly, based on the cross-sectional survey data, we were not able to establish
causality between EHR use and the impact of healthcare service delivery outcomes
included in this study. Longitudinal, prospective studies are needed to establish
causality on the impact of EHR use on healthcare service delivery outcomes.
52
CONCLUSION
Despite the significant financial, technical, and interoperability challenges in
implementing and adopting EHR systems, we have seen significant changes in health
service delivery among physicians utilizing fully EHR systems even among early
adoption in 2012. Physicians who face higher degrees of uncertainty may be leveraging
their EHR to provide healthcare services to maximize benefits to their practice, but do
not see time efficiency gains. Rural physicians face greater uncertainty in their
geographic isolation with lower munificence. Our results found that rural providers with
the use of fully EHRs have significantly greater odds of providing e-consults, e-billing,
and set aside same day appointments than rural providers without EHR use, and the
effect was stronger for rural providers than for their urban counterparts. Furthermore,
primary care physicians have higher uncertainty about cases they will see compared to
other specialties. Primary care physicians with the use of fully EHRs have significantly
greater odds of providing e-consults, e-billing, and e-prescribing compared to primary
care physicians without the use of EHRs, and the effect was stronger for primary care
provider than for other specialties. Both groups with higher uncertainty did not have
significant time efficiency gains with time spent with patients. Furthermore, among
physicians with higher degrees of munificence and low degrees of uncertainty (such as
group practices, urban physicians, and medical specialties) may have the resources to
see either time efficiency gains or to deliver e-mediated healthcare services, depending
on the nature of their work. Providers in group practices provide significantly more e-
consults, e-prescribing, e-billing, and set aside same day appointments with the use of
fully EHRs compared to physicians without the use of EHRs, and with strong effect than
physicians that belong to solo practices. Furthermore, physicians that belong to urban
practices had significant efficiency gains in time spent with patients, and significantly
53
greater odds of providing e-consult and e-billing services than urban physicians without
the use of EHRs. Medical specialties had the biggest gains in time efficiency for time
spent with the patient with the use of fully EHRs, with a time savings of 3.16 minutes per
visit.
Simply adopting and utilizing partially EHRs will not be enough to achieve the
aims for our healthcare system to deliver electronic mediated healthcare services,
including set aside same day appointments, providing e-consults, providing e-prescribing
services, and efficiency in time spent with patients. Meaningful Use objectives should be
tailored around early EHR successes in order to motivate efforts, and develop more
uniform health service delivery reform across the providers in the United States, such as
providing e-billing, e-consults, and e-prescribing services. Focusing on early successes
that may be easier to achieve will decrease the risk of Meaningful Use penalties among
lower resourced providers that are having difficulties adopting certain functionalities
within EHR systems, such as interoperability. More efforts may be needed for providers
to have the ability to set aside same day appointments to achieve this outcome that
impacts patient satisfaction, and EHR architecture may need to be strengthened within
EHR systems to support offering this service.
54
CHAPTER 2: Does attesting to Meaningful Use with Electronic Health Records Improve
Hospital Patient Safety?
Kate E. Trout, Ph.D.
University of Nebraska, 2016
Supervisor: Li-Wu Chen, Ph.D.
ABSTRACT
Background: Providers and healthcare organizations may be eligible to receive
financial incentives for demonstrating “meaningful use” with their EHR systems by
meeting a set of objectives and criteria specified by Medicare and Medicaid Services,
aimed to improve patient safety and care outcomes. The impact of Meaningful Use
attestation with the use of EHRs on patient safety has been understudied, making it
difficult to determine if the specific set of Meaningful Use objectives and the government
benchmark set for EHR use has had a positive impact on patient safety outcomes.
Objective: The objective of this study is to determine the impact of hospitals attesting to
Meaningful Use with the use of their Electronic Health Records (EHRs) on patient safety
outcomes.
Methods: We used three data sources to study the impact of EHRs on patient safety
outcomes. Inpatient hospitalization information was used from Healthcare Cost and
Utilization Project (HCUP) 2013 State Inpatient Databases (SID) of Florida, Nebraska,
New York, and Washington. We used the AHRQ PSI software version 5.0 and SAS
version 9.4 statistical software to determine the hospital-level risk-adjusted standardized
rates for eight patient safety indicators, and the PSI 90 composite score. Additionally, we
used 2013 American Hospital Association (AHA) annual survey data and CMS
Meaningful Use attestation records to gather information regarding hospital
characteristics and the use of EHR systems in 2013. Our final sample included 349
55
hospitals from Florida, Nebraska, New York, and Washington that provided information
about their EHR systems.
Data summary statistics and bivariate analysis were performed to examine the
difference in outcome variables and explanatory variables by EHR use. Then, we
performed multivariate regression analysis using generalized linear model (GLM)
method with log link function and gamma family distribution to examine the impact of
EHR use on the individual PSIs and the PSI 90 composite score. In the final model, we
adjusted for minor teaching hospital status, major teaching hospital status, for profit
status, nurse to staffed bed ratio, state, and staffed beds.
Results: The majority of hospitals in the study sample attested to Meaningful Use
Stage 1 with the use of their EHR systems (82.2%), followed by having partially-
implemented or no EHR system (9.2%) and having a fully-implemented EHR system that
does not attest to Meaningful Use (8.6%). The majority of hospitals had 100-299 beds
(38.7%), had non-profit status (91.4%), were not teaching hospitals (57.0%), located in a
metropolitan area (74.8%), from New York (37.3%), and had an average nurse to bed
ratio of 1.73.
After adjusting for other factors in our model, fully-implemented EHRs that did not attest
to Meaningful Use had a significant positive impact on 3 patient safety outcomes, and
EHRs that attested to Meaningful Use had a significant positive impact on 2 patient
safety outcomes. Fully-implemented EHRs that did not attest to Meaningful Use had a
significant positive impact on death rate in low-mortality DRGs, postoperative physiologic
and metabolic derangement rate, and wounds split open after surgery compared to
hospitals with a partially-implemented or no EHR. Furthermore, EHRs that attested to
Meaningful Use had a significant positive impact on postoperative physiologic and
metabolic derangement rate, and perioperative pulmonary embolism or deep vein
56
thrombosis rate (serious blood clots after surgery) compared to hospitals with a partially-
implemented or no EHR. However, there was no significant impact of attesting to
Meaningful Use or having a fully-implemented EHR that did not attest to Meaningful Use
on the PSI 90 composite score compared to hospitals with partially-implemented or no
EHR.
Conclusion: Our study demonstrates that hospitals attesting to Meaningful Use with
their EHR systems improved 2 patient safety outcomes. More research needs to be
conducted to determine which functionality or set of functionalities that contribute to
these increases in patient safety to direct future of the Meaningful Use program, as fully-
implemented EHRs that did not attest to Meaningful Use had greater effects on patient
safety among some indicators. However, EHR use did not have a significant impact on
PSI composite scores in 2013. The evidence suggests that hospitals will not see
significant differences in their PSI 90 composite scores with the adoption and use of
EHR systems as they move toward pay-for-performance models that incorporate the PSI
90 in the total performance score (TPS). Policy makers may want to focus on specific
patient safety indicators that are highly preventable in payment models to avoid
penalizing hospitals through reimbursement, rather than incorporating the PSI 90
composite score.
57
INTRODUCTION
The United States has made a significant investment on the adoption and use of
Health Information Technology (HIT) in the healthcare system, providing over 35 billion
dollars of support through the Health Information Technology for Economic and Clinical
Health (HITECH) Act. Into the 21st century, the Affordable Care Act (ACA) aimed to
improve the efficiency, quality, patient safety, and health outcomes of health service
delivery by using of Electronic Health Records (EHRs) to establish better care
coordination across providers, standardization across health data, and develop clinical
decision support systems. Providers and healthcare organizations may be eligible to
receive financial incentives for demonstrating “meaningful use” with their EHR systems
by meeting a set of objectives and criteria specified by Medicare and Medicaid Services,
aimed to improve patient safety and care outcomes. Many studies show that EHRs
have improved patient satisfaction, quality, clinical outcomes, risk management, and
decision support (Jamoom et al., 2012; Duffy et al., 2010; Kern et al., 2012; Bell et al.,
2011; Holt et al., 2010; Barlow, Johnson, & Steck, 2003). However, recent literature has
provided mixed empirical evidence regarding the impact of EHRs on achieving other
outcomes, including patient safety, quality, and cost-efficiency (Jones et al., 2014;
Verdon, 2014; Adler-Milstein, Salzberg, Franz, Orav, & Bates, 2013). It will be important
to study the impact of Meaningful Use attestation on the ability to achieve intended
outcomes envisioned by the ACA and the HITECH Act to direct policy and
implementation efforts, such as the ability of EHRs to achieve patient safety.
The current state of literature warrants that more attention should focus on
studying the impact of use of EHRs on patient safety, given the mix results. One study
found that EHRs and HITs had little to no association with hospital readmission rates
(Himmelstein et. al, 2010). A study by Jones and colleagues found Stage 1 Meaningful
58
Use electronic medication ordering will not likely have a significant impact on hospital
deaths with only 1.2 percent fewer deaths from medication errors, suggesting that
Meaningful Use will need to be held at a higher standard using electronic orders to have
a significant reduction in medication errors (Jones, et al., 2011a). The study suggested
that Meaningful Use threshold set for hospitals is likely too low to have a significant
impact on deaths related to heart failure and heart attacks, where Stage 1 requires
electronic orders for at least 30 percent of eligible patients (Jones, et al., 2011a). The
majority of studies that demonstrated a positive impact of EHRs on patient safety only
focus on specific functionalities with the use of EHRs, such as clinical decision support
or computerized provider order entry (Jones et al., 2014). Only one study has
investigated the impact of Stage 1 Meaningful Use capable EHR systems on patient
safety, where they found Stage 1 Meaningful Use capable EHR systems were
associated with improvements on 3 of 8 patient safety measures with 7% to 11% lower
rates of adverse events (Appari et al., 2014). However, the limitation of this study is that
Stage 1 Meaningful Use was determined by classifying functionalities that could potential
meet Stage 1 Meaningful Use, but not actually attesting to Meaningful Use. There
remains a significant gap in the literature in studying the impact of Meaningful Use
attestation with EHR use on patient safety outcomes. To the best of our knowledge,
there has not been a study determining the impact of hospital Meaningful Use attestation
with their EHR systems on patient safety.
Achieving positive patient safety outcomes will become increasingly important as
Centers for Medicare and Medicaid Services (CMS) are moving toward value-based
purchasing models by linking quality scores to Medicare payments. In value-based
purchasing, a percentage (from 1.00% in 2013 to 2.00% in 2018) of the total payment is
taken-out and then paid back based on the total performance score (TPS) of the
59
provider. Patient Safety Indicator (PSI) 90 composite score is a component of TPS in the
value based purchasing model in the safety domain, where safety accounts for 20% in
2017 and 25% in 2018 of the TPS for value-based purchasing. Patient Safety
Indicators (PSIs) developed by Agency for Healthcare Research and Quality (AHRQ) are
a set of indicators providing information on patient potential in hospital complications and
adverse events following surgeries and procedures. Patient safety and Meaningful Use
attestation have been understudied. It is difficult to determine if the specific set of
Meaningful Use objectives chosen by CMS have had a positive impact on outcomes.
To our knowledge, only one study has examined the impact of Meaningful use on
patient safety by classifying EHRs functionalities that could potentially meet Meaningful
Use Stage 1 (Appari et al., 2014). However, the classification is not actually attesting to
Meaningful Use. Furthermore, information regarding the EHR systems were collected
from 2007 data, but classified by 2011 Meaningful Use functionalities with patient safety
estimates between 2008 to 2010. This kind of gap could misclassify many hospitals that
adopted the Stage 1 functionalities for Meaningful Use after 2007, which is likely
because of the steep increase in EHR adoption that took place in 2009 and after with the
implementation of the Affordable Care Act (DesRoches, et al., 2013). The objective of
this study is to determine the impact of hospital Meaningful Use attestation with the use
of their EHRs on patient safety outcomes.
THEORETICAL FRAMEWORK
Technology, Organizational, and Environment (TOE) framework adapted
The framework used in this study is a modification of Tornatzky and Fleischer
(1990) technology, organizational, and environment (TOE) innovation adoption
framework. TOE framework incorporates three contexts that impact the adoption of
60
technological innovations, including: (1) environmental context, (2) organizational
context, and (3) technology context. Environmental context is defined by the
organization’s environment to conduct business, which includes its industry, competitors,
and governmental factors (Tornatzky and Fleischer 1990). The organizational context
provides information about the size, scope of organization, managerial structures, and
other descriptives about the organization. Technological context takes into account both
the internal and external technologies relevant to the organization. TOE framework has
been highly utilized and supported by results of previous research to explain technology
adoption across organizations (Brancheau and Wetherbe, 1990; Baker, 2012; Fichman,
1992; Bretschneider, 1990; Cooper and Zmud, 1990). TOE framework provides
elements that are important in studying outcomes of technology use, as it accounts for
technology, organizational, and environmental factors. TOE framework can be modified
and applied to include important factors when studying the impact of EHRs on care
outcomes. We have expanded this framework to incorporated important factors that
impact patient safety in the literature to study the impact of EHRs on patient safety
outcomes.
Organizational characteristics have a significant impact on patient safety and
care outcomes (Armstrong et al., 2009; Donabedian, 2003; Lehrman et al., 2010).
Studies have shown that organization support of nurses may affect patient outcomes
(Aiken et al., 2002; Rivard et al., 2010). Nurse-to-bed ratio has been used in previous
literature to adjust for the effect of nurse support within the organization (Appari et al.,
2014). Furthermore, engagement in safety/quality metrics that is linked to compensation
may have an impact on patient safety at the facility-level (Appari, et al., 2014). There
has been inconsistent findings of adverse effects with hospital size (Iezzoni et al., 1994;
Slonim et al., 2007; Smith et al., 2007). However, the inconsistency in findings may be
61
due to inadequate risk adjustment (Sax and Pittet, 2002; Rivard et al., 2010), but have
not yet been determined. Other organizational characteristics that could have a
significant impact on quality and safety outcomes include for-profit status, teaching
hospital status, and academic hospital status (Appari et al., 2014).
HITs were envisioned to improve patient safety and quality. Furthermore, there
are several important factors that impact the use of HITs, including interoperability,
functionality, and usability of systems. It is widely cited that interoperability and
information sharing will play a large role in improving the healthcare system and health
outcomes (Cutler et al., 2006; Kvedar et al., 2014; Tan, 1999), but has been a challenge
to achieve in system design in the healthcare sector. It is a goal of the Meaningful Use
program to achieve information sharing and interoperability in the later stages of the
program. EHRs may vary by functionalities and usability. In this study, we aim to
determine the impact of EHRs on patient safety by focusing on a set of functionalities in
order to attest to Meaningful Use, which represents the government standard for EHR
adoption and use. In 2013, eligible hospitals for Stage 1 Meaningful Use had to have
met all 12 core objectives of Meaningful Use, choose 5 of 10 menu objectives (at least 1
public health measure), and report all 15 clinical quality measures (CQMs). The 12 core
objectives included: (1) Use computerized provider order entry (CPOE) for medication
orders directly entered by any licensed healthcare professional who can enter orders
into the medical record per state, local and professional guidelines; (2) Implement drug-
drug and drug-allergy interaction checks; (3) Maintain an up-to-date problem list of
current and active diagnoses; (4) Maintain active medication list; (5) Maintain active
medication allergy list; (6) Record all of the following demographics: preferred language,
gender, race, ethnicity, date of birth, and date and preliminary cause of death in the
event of mortality in the eligible hospital or CAH; (7) Record and chart changes in vital
62
signs: height, weight, blood pressure, calculate and display body mass index (BMI), plot
and display growth charts for children 2-20 years, including BMI; (8) Record smoking
status for patients 13 years or older; (9) Implement one clinical decision support rule
related to a high priority hospital condition with the ability to track compliance with that
rule; (10) Provide patients with an electronic copy of their health information (including
diagnostic test results, problem list, medication lists, medication allergies, discharge
summary, procedures), upon request; (11) Provide patients with an electronic copy of
their discharge instructions at the time of discharge, upon request; and (12) Protect
electronic health information created or maintained by the certified EHR technology
through the implementation of appropriate technical capabilities. It is unclear if the
specific set of objectives chosen for the Meaningful Use program have had a positive
impact on outcomes.
In addition, users with different backgrounds and needs interact with HITs in
different ways. Implementing HITs with high usability are necessary to reduce waste
and direct development through focusing on measuring the technology’s ability to meet
the intended purpose. HIT usability evaluation has been overlooked widely during
technology development, which has negatively impacted the ability to accomplish
system’s efficiency, effectiveness, and satisfaction (Minshall, 2013; Yen & Bakken,
2012), and needs to be controlled for when studying HIT adoption and utilization.
However, the Office of the National Coordinator for Health Information Technology
(ONC-HIT) created a Certified Health IT Product List (CHPL). The purpose of certifying
EHRs was to implement systems with higher functionality, interoperability, and usability.
In order to receive EHR incentives in 2016, providers and hospitals must use a CMS
certified EHR by ONC Authorized Certification Body (ONC-ACB). Study the impact of
the national certification of EHRs will help better predict the impact on the system design
63
thresholds set by ONC. Therein, ONC certified EHR systems may have higher levels of
functionality, interoperability, and usability, impacting the ability of the hospital to achieve
intended outcomes. Studying the EHR certification into the future will provide an
opportunity to study the standards set by the ONC. Future studies should incorporate
these factors into their theoretical framework, as they impact outcomes of technology
use.
In this study, we apply the RDT to hypothesize the effect of Meaningful Use
attestation and rurality on the impact of EHR use on patient safety outcomes. Resource
Dependence Theory (RDT) central proposition is that organizations will alter their
behaviors to manage their resource dependencies in order to achieve greater autonomy
and reduce uncertainty in the flow of vital resources from the environment (Pfeffer and
Salancik, 1978; Pfeffer and Salancik, 2003). Constructs of the RDT are uncertainty,
munificence, and interdependence. Uncertainty refers “to the degree to which future
states of the world cannot be anticipated and accurately predicted” (Pfeffer and Salancik,
1978). Munificence refers to the abundance of critical resources in the environment to
support the organizations survival. Interdependence refers to organizations reliance on
one another for the acquisition of resources.
Hospitals may be adopting and implementing EHRs to attest to Meaningful Use
in order to secure resources “to achieve greater autonomy and reduce uncertainty in the
flow of vital resources from the environment,” as stated in the RDT. Securing these
resources may be the driving factor in adopting Meaningful Use capable EHR systems.
Other resources hospitals may secure by adopting Meaningful Use capable EHR
systems include coverage by insurance networks and increased revenue through patient
satisfaction, while avoiding financial penalties in Medicare reimbursement. In contrast,
those hospitals that have fully-implemented EHR systems that are not receiving
64
incentives through the Meaningful Use program may face more pressure to improve
outcomes to receive the financial benefits from their EHR system.
H1.Hospitals that attest to Meaningful Use and receive incentives for their EHR
systems will have greater gains in patient safety outcomes than hospitals that
have fully-implemented EHR systems that do not receive Meaningful Use
incentives, when compared to their counterparts with partially-implemented or no
EHRs.
The newly developed framework views the utilization of advanced information
technology’s impact on patient safety from an institutional and resource dependence
perspective, and focuses on describing the organizational, environmental, and external
characteristics of hospitals that influence patient safety with the use of EHR
technologies. The constructs of the newly develop framework includes: (1) external
environment, (2) organizational context, and (3) technological context (Figure 6).
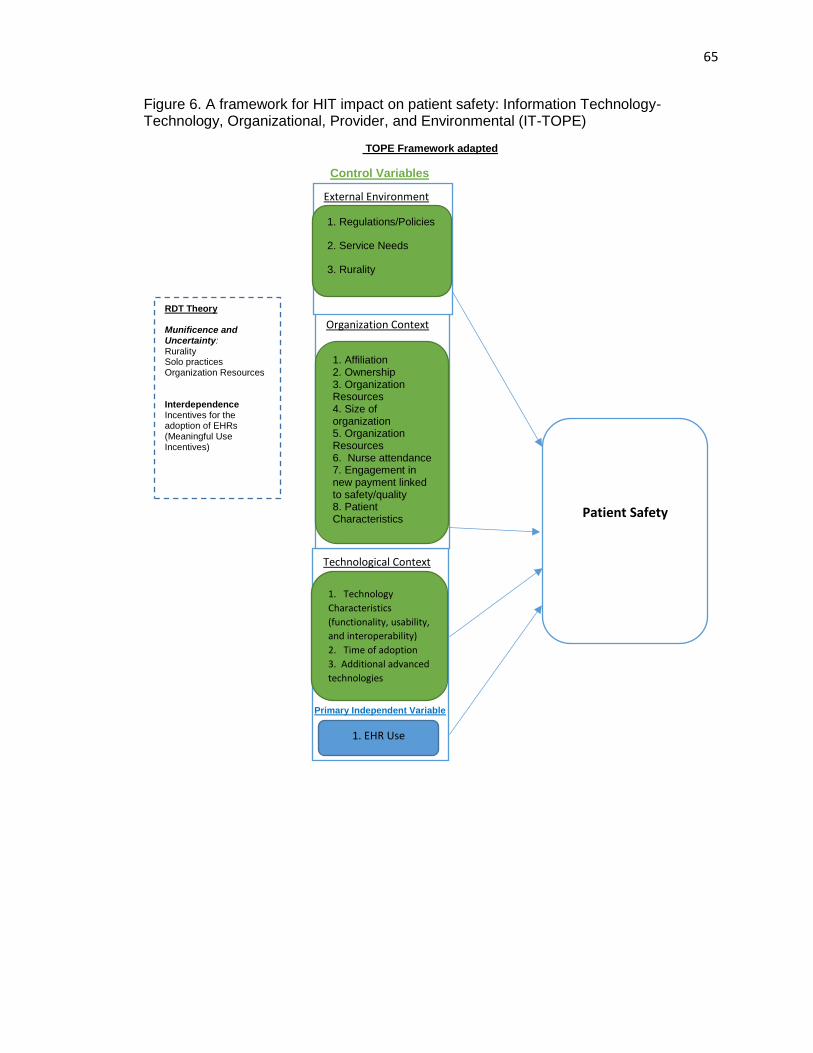
65
Figure 6. A framework for HIT impact on patient safety: Information Technology- Technology, Organizational, Provider, and Environmental (IT-TOPE)
TOPE Framework adapted
Control Variables
Primary Independent Variable
Technological Context
Organization Context
1. Affiliation 2. Ownership 3. Organization Resources 4. Size of organization 5. Organization Resources 6. Nurse attendance 7. Engagement in new payment linked to safety/quality 8. Patient Characteristics
Patient Safety
RDT Theory
Munificence and Uncertainty: Rurality Solo practices Organization Resources Interdependence Incentives for the adoption of EHRs (Meaningful Use Incentives)
External Environment
1. Regulations/Policies
2. Service Needs
3. Rurality
1. Technology
Characteristics
(functionality, usability,
and interoperability)
2. Time of adoption
3. Additional advanced
technologies
1. EHR Use
66
METHODS
Data and Study Sample
We used three data sources in this study to examine the impact of EHRs on
patient safety outcomes. Inpatient hospitalization information was used from Healthcare
Cost and Utilization Project (HCUP) 2013 State Inpatient Databases (SID) of Florida,
Nebraska, New York, and Washington. One state was chosen from each of the census
regions to be more geographically representative to a national sample. Additionally, we
used 2013 American Hospital Association (AHA) annual survey data and CMS
Meaningful Use attestation records to gather hospital characteristics and information
regarding their EHR systems. Our final sample included 349 hospitals from Florida,
Nebraska, New York, and Washington that provided information about their EHR
systems.
Data Elements
Outcomes variables
We used the Agency for Healthcare Research and Quality (AHRQ) PSI software
version 5.0 and SAS version 9.4 statistical software to determine the hospital-level risk-
adjusted standardized rates for 8 patient safety indicators (PSIs), and the PSI 90
composite score. PSIs developed by AHRQ are a set of indicators providing information
on patient’s potential hospital complications and adverse events following surgeries and
procedures. Risk-adjustment using the AHRQ software includes a complex algorithm to
adjust for patient characteristics (age, gender), severity of illness, and 25 comorbidities
as covariates (Geppert, Rhoda, & Morara, 2013). The 2013 population file was used in
the software to produce risk-adjusted rates based on the general population at risk
during the year 2013. Death related PSIs included in the study were: death rate in low-
67
mortality diagnosis related groups (DRGs), and death rate among surgical inpatients
with serious treatable complications. Non-death related PSIs included: iatrogenic
pneumothorax rate (collapsed lung due to medical treatment), postoperative physiologic
and metabolic derangement rate, postoperative respiratory failure rate (breathing failure
after surgery), perioperative pulmonary embolism or deep vein thrombosis rate (serious
blood clots after surgery), postoperative sepsis rate, and postoperative wound
dehiscence rate (wounds split open after surgery). Rates were transformed to represent
rates per 1,000 patients.
Additionally, the PSI 90 composite scores were calculated by the AHRQ PSI
software to determine the overall impact on patient safety. PSI 90 composite scores are
the weighted average of the reliability-adjusted observed-to-expected ratios. Each of the
PSI components are weighted by component weights and reliability-adjusted ratios
(RARs) among 11 PSI component indicators, including PSI #03 Decubitus Ulcer, PSI
#06 Iatrogenic Pneumothorax, PSI #11 Postoperative Respiratory Failure, PSI #07
Selected Infection Due to Medical Care, PSI #08 Postoperative Hip Fracture, PSI #09
Postop Hemorrhage or Hematoma, PSI #10 Postoperative Physiologic and Metabolic
Derangements, PSI #12 Postoperative Pulmonary Embolism or Deep Vein Thrombosis,
PSI #13 Postoperative Sepsis, PSI #14 Postoperative Wound Dehiscence, PSI #15
Accidental Puncture or Laceration. First, the component weights are numerator weights,
which is determined by the relative frequency of the numerators for the component
indicators in the reference population. Therein, the weighting of the individual
component indicators is based on only volume weights (numerator weights), calculated
in the software on the number of safety-related events for the component indicators in
the all-payer reference population. Second, the reliability-adjusted ratios are determined
empirically. The reliability-adjusted weights are the signal-to-noise ratio, where the signal
68
variance is estimated from the reference population, and the noise variance is estimated
from the dataset and is unique to each provider in the dataset. Each weighted reliability-
adjusted ratio for each indicator is summed to determine the composite score (AHRQ,
2015).
Composite = [indicator1 RAR × weight1] + [indicator2 RAR × weight2] + . . . +
[indicatorN RAR × weightN]
The component measures are expressed as a ratio to the reference population
rate, where a provider will have a composite rate of 1 if the risk adjusted ratio component
score that are the same as the reference population. Composite scores that include 1
represent the same quality as the national average.
Primary Independent Variable
The primary independent variable was determined by combining the Meaningful
Use attestation records and the AHA annual survey question about EHR use.
Meaningful Use attestation is process for healthcare providers and organizations to
secure financial incentives by CMS for demonstrating “meaningful use” of their EHR.
Meaningful Use attestation was determined from the CMS attestation records which
identifies the stage of Meaningful Use attested to by the hospital, the incentives they
received, and the years they attested. The CMS attestation records provided
information on the providers who received incentives and attested to Meaningful Use in
2013. The 2013 American Hospital Association (AHA) annual survey data was used to
identify information regarding the use of an EHR system. The AHA survey provided the
option for providers to report either using no EHR, a partially-implemented EHR, or fully-
implemented EHR. Hospitals were categorized into three group for this study: (1)
69
attesting to Meaningful Use with the use of their EHRs, (2) having a fully-implemented
EHR but have not attested to Meaningful Use, and (3) having partially-implemented EHR
or no EHR system. This categorization has never been compared in the literature, but
provides the opportunity to study outcomes among hospitals that attest to Meaningful
Use with the use of their EHRs (the government standard for EHR functionality) and
those that have fully-implemented EHR systems that do not attest to Meaningful Use.
Our sample included in the study had 90.8% of hospitals had an EHR system, either that
attested to Meaningful Use or fully implemented. This is fairly consistent with the
national sample where about 94% of hospitals reported having a certified EHR in 2013
(Henry, et al., 2016).
Other Independent Variables
The 2013 American Hospital Association (AHA) annual survey data was used to
identify hospital characteristics, such as number of staffed beds, ownership, teaching
hospital status, rurality of facility, and nurse-to-staffed bed ratio. Total facility staffed
beds were reported as set up and staffed at the end of reporting period in the AHA
annual survey. Teaching hospital status was coded as a categorical variable including
major teaching hospital, minor teaching hospital, and non-teaching hospital. Hospitals
that reported having Council of Teaching Hospitals designation of the Association of
American Medical Colleges were categorized as major teaching hospital. Hospitals
were categorized as minor teaching hospitals if they reported any one or more of the
following: (1) approval to participate in residency and/or internship training by the
Accreditation Council for Graduate Medical Education (ACGME), (2) medical school
affiliation reported to the American Medical Association (AMA), (3) Internship approved
by American Osteopathic Association, and/or (4) residency approved by American
Osteopathic Association. Ownership status was categorized by for-profit and non-
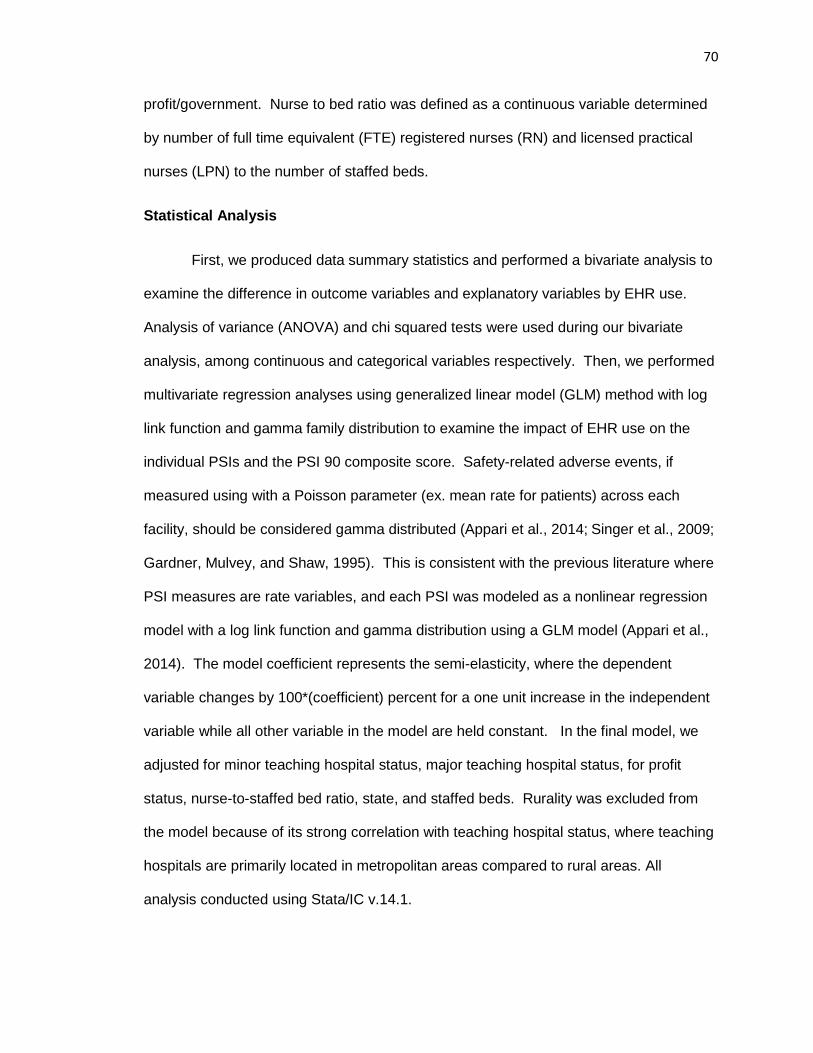
70
profit/government. Nurse to bed ratio was defined as a continuous variable determined
by number of full time equivalent (FTE) registered nurses (RN) and licensed practical
nurses (LPN) to the number of staffed beds.
Statistical Analysis
First, we produced data summary statistics and performed a bivariate analysis to
examine the difference in outcome variables and explanatory variables by EHR use.
Analysis of variance (ANOVA) and chi squared tests were used during our bivariate
analysis, among continuous and categorical variables respectively. Then, we performed
multivariate regression analyses using generalized linear model (GLM) method with log
link function and gamma family distribution to examine the impact of EHR use on the
individual PSIs and the PSI 90 composite score. Safety-related adverse events, if
measured using with a Poisson parameter (ex. mean rate for patients) across each
facility, should be considered gamma distributed (Appari et al., 2014; Singer et al., 2009;
Gardner, Mulvey, and Shaw, 1995). This is consistent with the previous literature where
PSI measures are rate variables, and each PSI was modeled as a nonlinear regression
model with a log link function and gamma distribution using a GLM model (Appari et al.,
2014). The model coefficient represents the semi-elasticity, where the dependent
variable changes by 100*(coefficient) percent for a one unit increase in the independent
variable while all other variable in the model are held constant. In the final model, we
adjusted for minor teaching hospital status, major teaching hospital status, for profit
status, nurse-to-staffed bed ratio, state, and staffed beds. Rurality was excluded from
the model because of its strong correlation with teaching hospital status, where teaching
hospitals are primarily located in metropolitan areas compared to rural areas. All
analysis conducted using Stata/IC v.14.1.
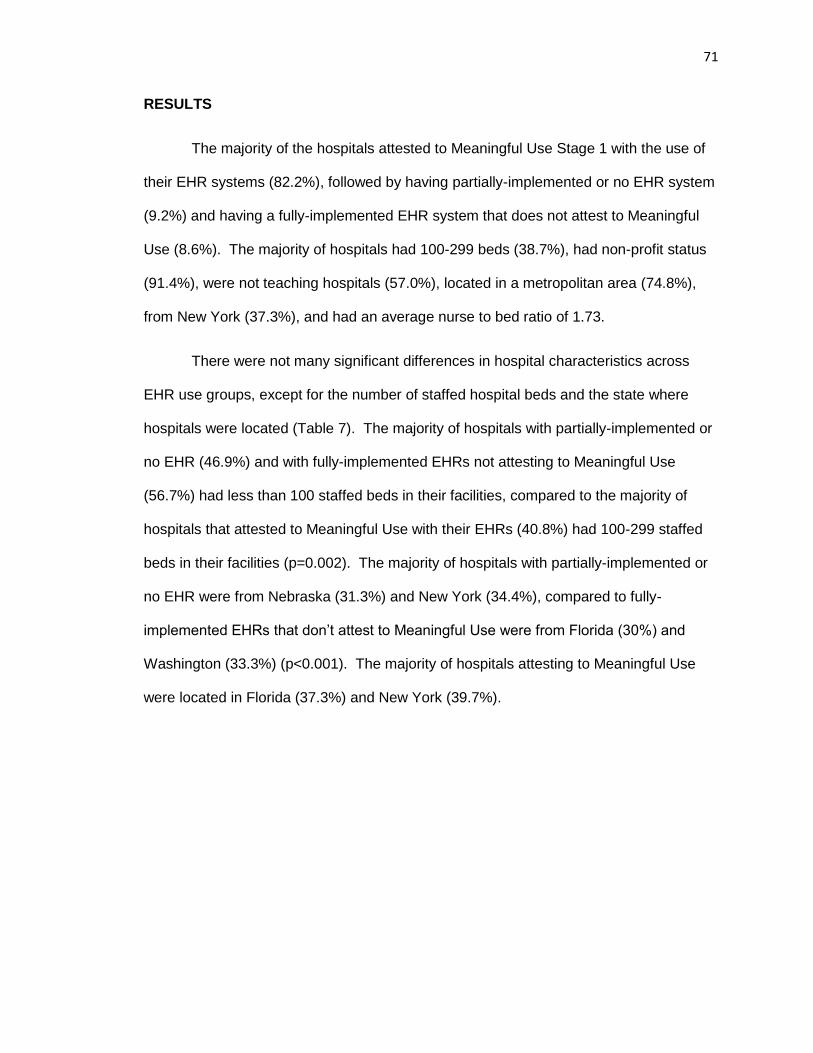
71
RESULTS
The majority of the hospitals attested to Meaningful Use Stage 1 with the use of
their EHR systems (82.2%), followed by having partially-implemented or no EHR system
(9.2%) and having a fully-implemented EHR system that does not attest to Meaningful
Use (8.6%). The majority of hospitals had 100-299 beds (38.7%), had non-profit status
(91.4%), were not teaching hospitals (57.0%), located in a metropolitan area (74.8%),
from New York (37.3%), and had an average nurse to bed ratio of 1.73.
There were not many significant differences in hospital characteristics across
EHR use groups, except for the number of staffed hospital beds and the state where
hospitals were located (Table 7). The majority of hospitals with partially-implemented or
no EHR (46.9%) and with fully-implemented EHRs not attesting to Meaningful Use
(56.7%) had less than 100 staffed beds in their facilities, compared to the majority of
hospitals that attested to Meaningful Use with their EHRs (40.8%) had 100-299 staffed
beds in their facilities (p=0.002). The majority of hospitals with partially-implemented or
no EHR were from Nebraska (31.3%) and New York (34.4%), compared to fully-
implemented EHRs that don’t attest to Meaningful Use were from Florida (30%) and
Washington (33.3%) (p<0.001). The majority of hospitals attesting to Meaningful Use
were located in Florida (37.3%) and New York (39.7%).
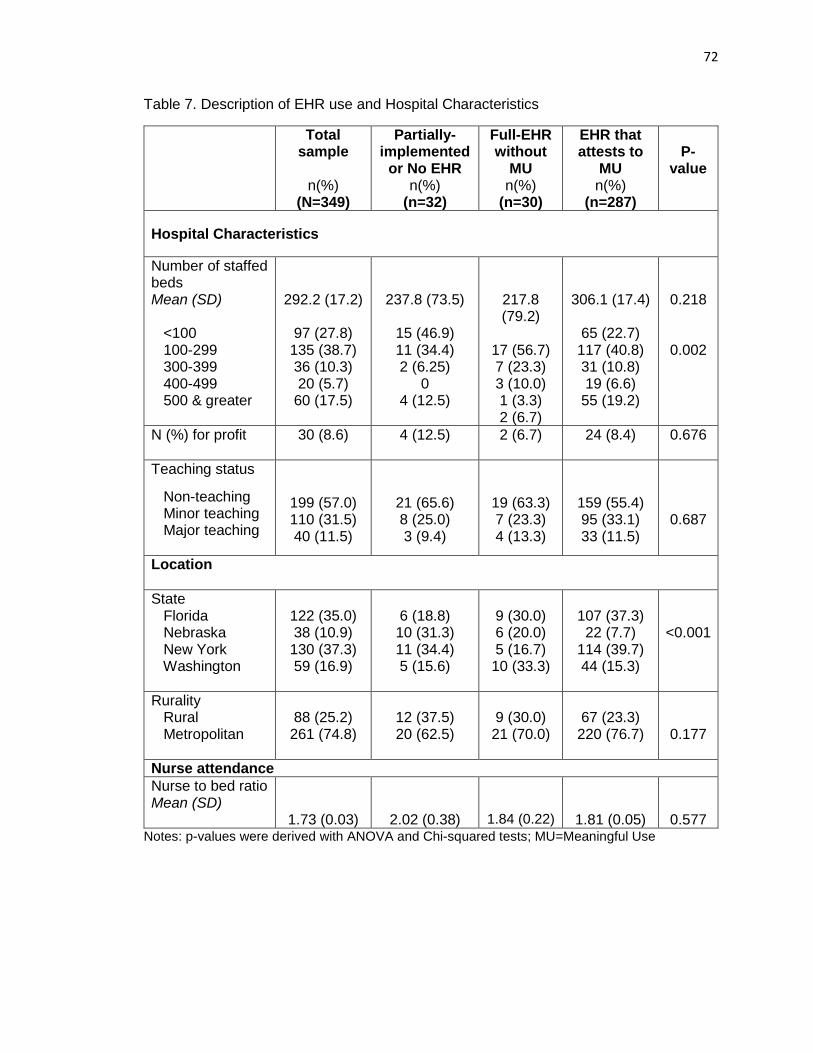
72
Table 7. Description of EHR use and Hospital Characteristics
Total sample
n(%)
(N=349)
Partially-implemented
or No EHR n(%)
(n=32)
Full-EHR without
MU n(%)
(n=30)
EHR that attests to
MU n(%)
(n=287)
P-
value
Hospital Characteristics
Number of staffed beds Mean (SD) <100 100-299 300-399 400-499 500 & greater
292.2 (17.2)
97 (27.8) 135 (38.7) 36 (10.3) 20 (5.7)
60 (17.5)
237.8 (73.5)
15 (46.9) 11 (34.4) 2 (6.25)
0 4 (12.5)
217.8 (79.2)
17 (56.7) 7 (23.3) 3 (10.0) 1 (3.3) 2 (6.7)
306.1 (17.4)
65 (22.7) 117 (40.8) 31 (10.8) 19 (6.6)
55 (19.2)
0.218
0.002
N (%) for profit 30 (8.6) 4 (12.5) 2 (6.7) 24 (8.4) 0.676
Teaching status
Non-teaching Minor teaching Major teaching
199 (57.0) 110 (31.5) 40 (11.5)
21 (65.6) 8 (25.0) 3 (9.4)
19 (63.3) 7 (23.3) 4 (13.3)
159 (55.4) 95 (33.1) 33 (11.5)
0.687
Location
State Florida Nebraska New York Washington
122 (35.0) 38 (10.9) 130 (37.3) 59 (16.9)
6 (18.8) 10 (31.3) 11 (34.4) 5 (15.6)
9 (30.0) 6 (20.0) 5 (16.7) 10 (33.3)
107 (37.3) 22 (7.7)
114 (39.7) 44 (15.3)
<0.001
Rurality Rural Metropolitan
88 (25.2) 261 (74.8)
12 (37.5) 20 (62.5)
9 (30.0) 21 (70.0)
67 (23.3) 220 (76.7)
0.177
Nurse attendance
Nurse to bed ratio Mean (SD)
1.73 (0.03)
2.02 (0.38)
1.84 (0.22)
1.81 (0.05)
0.577 Notes: p-values were derived with ANOVA and Chi-squared tests; MU=Meaningful Use
73
Impact of EHR Use on Patient Safety
Among EHR use groups, there were significant differences in 7 patient safety
outcomes, including: the death rate in low-mortality diagnosis related groups (DRGs),
the death rate among surgical inpatients with serious treatable complications,
postoperative physiologic and metabolic derangement rate, postoperative respiratory
failure rate (breathing failure after surgery), perioperative pulmonary embolism or deep
vein thrombosis rate (serious blood clots after surgery), postoperative sepsis rate, and
postoperative wound dehiscence rate (wounds split open after surgery) (Table 8).
Partially-implemented or no EHR had a higher mean incidence for the following patient
safety outcomes: low-mortality diagnosis related groups (DRGs) with a mean death rate
of 1.04 deaths per 1,000 patients (p=0.022); postoperative physiologic and metabolic
derangement rate with a mean incidence of 2.20 incidence per 1,000 patients (p=0.004);
serious blood clots after surgery with a mean incidence of 9.21 incidence per 1,000
patients (p=0.007); and wounds split open after surgery with a mean incidence rate of
5.90 incidence per 1,000 patients (p=0.006).
Furthermore, fully-implemented EHRs that did not attest to Meaningful Use had
the highest mean incidence rate of postoperative sepsis with a mean of 19.34 incidence
per 1,000 patients, and breathing failure after surgery with a mean incidence of 9.25
incidence per 1,000 patients (p=0.004). Although not significantly different, EHRs that
attested to Meaningful Use had the highest mean death rate among surgical inpatients
with serious treatable complications with a mean of 124.83 deaths per 1,000 patients
(p=0.222). There were no significant differences among EHR groups and collapsed lung
due to medical treatment (p=0.897) and the PSI 90 composite score (p=0.407).
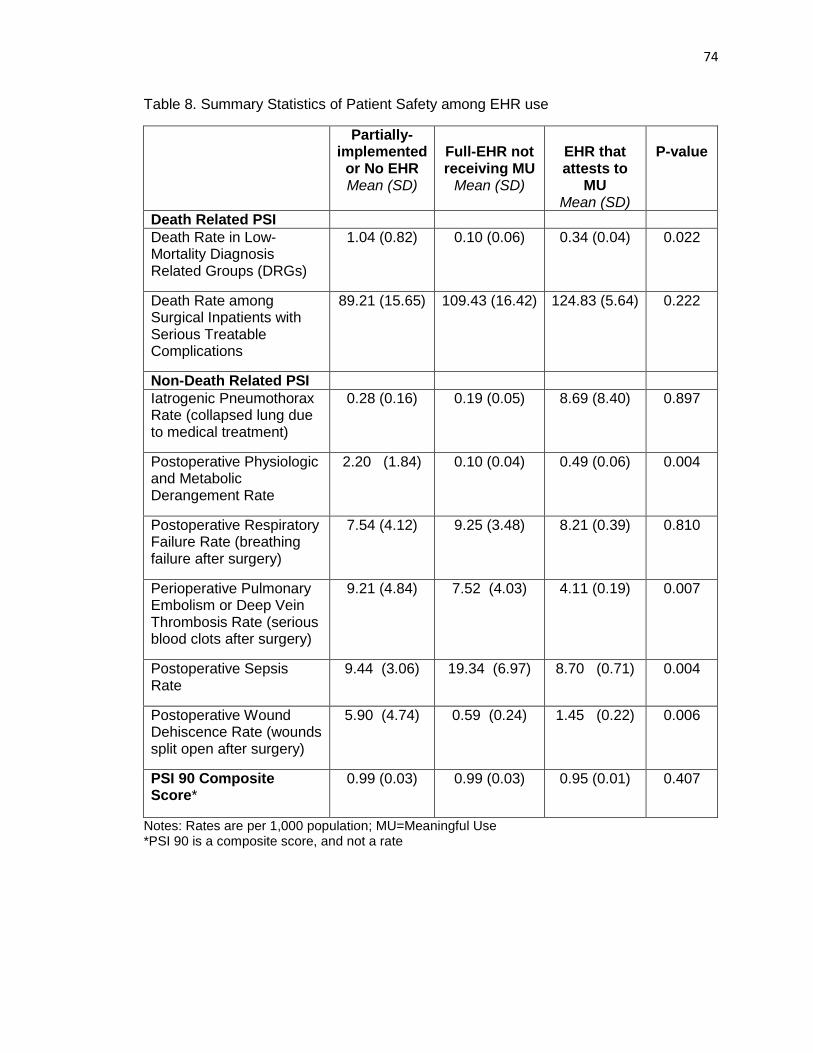
74
Table 8. Summary Statistics of Patient Safety among EHR use
Partially-implemented
or No EHR Mean (SD)
Full-EHR not receiving MU
Mean (SD)
EHR that attests to
MU Mean (SD)
P-value
Death Related PSI
Death Rate in Low-Mortality Diagnosis Related Groups (DRGs)
1.04 (0.82) 0.10 (0.06) 0.34 (0.04) 0.022
Death Rate among Surgical Inpatients with Serious Treatable Complications
89.21 (15.65) 109.43 (16.42) 124.83 (5.64) 0.222
Non-Death Related PSI
Iatrogenic Pneumothorax Rate (collapsed lung due to medical treatment)
0.28 (0.16) 0.19 (0.05) 8.69 (8.40) 0.897
Postoperative Physiologic and Metabolic Derangement Rate
2.20 (1.84) 0.10 (0.04) 0.49 (0.06) 0.004
Postoperative Respiratory Failure Rate (breathing failure after surgery)
7.54 (4.12) 9.25 (3.48) 8.21 (0.39) 0.810
Perioperative Pulmonary Embolism or Deep Vein Thrombosis Rate (serious blood clots after surgery)
9.21 (4.84) 7.52 (4.03) 4.11 (0.19) 0.007
Postoperative Sepsis Rate
9.44 (3.06) 19.34 (6.97) 8.70 (0.71) 0.004
Postoperative Wound Dehiscence Rate (wounds split open after surgery)
5.90 (4.74) 0.59 (0.24) 1.45 (0.22) 0.006
PSI 90 Composite Score*
0.99 (0.03) 0.99 (0.03) 0.95 (0.01) 0.407
Notes: Rates are per 1,000 population; MU=Meaningful Use *PSI 90 is a composite score, and not a rate
75
Table 9 shows that after adjusting for minor teaching hospital, major teaching
hospital, for-profit status, state, nurse-to-staffed bed ratio, and staffed beds in our model,
fully-implemented EHRs that did not attest to Meaningful Use had a significant decrease
in adverse events on 3 patient safety outcomes, and EHRs that attested to Meaningful
Use had a significant decrease in adverse events on 2 patient safety outcomes. EHRs
that attested to Meaningful Use had a significant decrease in adverse events on
postoperative physiologic and metabolic derangement rate and in perioperative
pulmonary embolism or deep vein thrombosis rate (serious blood clots after surgery).
However, there was no significant impact of attesting to Meaningful Use or having a
fully-implemented EHR not attesting to Meaningful Use on the PSI 90 composite score
compared partially-implemented or no EHR systems.
The effect of fully-implemented EHRs that did not attest to Meaningful Use were
larger than those EHRs that attested to Meaningful Use. The death rate in low-mortality
DRGs decreased by 291% for those hospitals with a fully-implemented EHR system that
did not attest to Meaningful Use compared to hospitals with a partially-implemented or
no EHR, indicating a positive impact (p<0.001). The effect was less among hospitals
attesting to Meaningful Use, decreasing by 93% compared to hospitals with a partially-
implemented or no EHR, although not statistically significant (p=0.086). This same
effect between groups was observed among postoperative physiologic and metabolic
derangement rate, and wounds split open after surgery. Postoperative physiologic and
metabolic derangement rate decreased by 242% for those hospitals with a fully-
implemented EHR system that did not attest to Meaningful Use compared to hospitals
with a partially-implemented or no EHR (p=0.014). Among hospitals attesting to
Meaningful Use postoperative physiologic and metabolic derangement rate decreased
by 119% compared to hospitals with a partially-implemented or no EHR (p=0.002).
Postoperative wound dehiscence rate (wounds split open after surgery) decreased by
76
193% for those hospitals with a fully-implemented EHR system that did not attest to
Meaningful Use compared to hospitals with a partially-implemented or no EHR
(p=0.011). Among hospitals attesting to Meaningful Use, there were not significant
differences in postoperative wound dehiscence rate compared to hospitals with a
partially-implemented or no EHR (p=0.152).
However, Meaningful Use attestation did have a significant decrease in
perioperative pulmonary embolism or deep vein thrombosis rate (serious blood clots
after surgery). Among hospitals attesting to Meaningful Use perioperative pulmonary
embolism or deep vein thrombosis rate decreased by 89% compared to hospitals with a
partially-implemented or no EHR (p=0.001). Although, there was not a significant impact
observed among fully-implemented EHRs that did not attest to Meaningful Use
compared to partially-implemented or no EHR system (p=0.744).
There were not significant differences in death rate among surgical inpatients with
serious treatable conditions, iatrogenic pneumothorax rate, postoperative respiratory
failure rate, and postoperative sepsis rate between EHR groups.
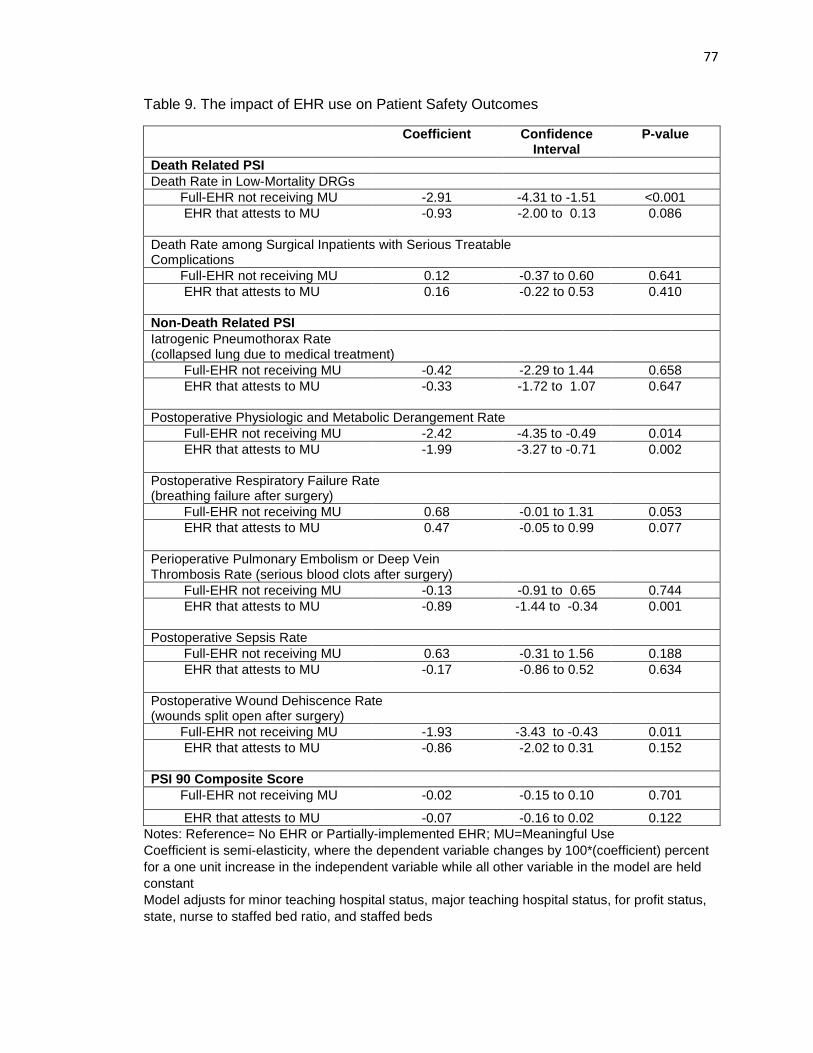
77
Table 9. The impact of EHR use on Patient Safety Outcomes
Coefficient Confidence Interval
P-value
Death Related PSI
Death Rate in Low-Mortality DRGs
Full-EHR not receiving MU -2.91 -4.31 to -1.51 <0.001
EHR that attests to MU
-0.93 -2.00 to 0.13 0.086
Death Rate among Surgical Inpatients with Serious Treatable Complications
Full-EHR not receiving MU 0.12 -0.37 to 0.60 0.641
EHR that attests to MU
0.16 -0.22 to 0.53 0.410
Non-Death Related PSI
Iatrogenic Pneumothorax Rate (collapsed lung due to medical treatment)
Full-EHR not receiving MU -0.42 -2.29 to 1.44 0.658
EHR that attests to MU
-0.33 -1.72 to 1.07 0.647
Postoperative Physiologic and Metabolic Derangement Rate
Full-EHR not receiving MU -2.42 -4.35 to -0.49 0.014
EHR that attests to MU
-1.99 -3.27 to -0.71 0.002
Postoperative Respiratory Failure Rate (breathing failure after surgery)
Full-EHR not receiving MU 0.68 -0.01 to 1.31 0.053
EHR that attests to MU
0.47 -0.05 to 0.99 0.077
Perioperative Pulmonary Embolism or Deep Vein Thrombosis Rate (serious blood clots after surgery)
Full-EHR not receiving MU -0.13 -0.91 to 0.65 0.744
EHR that attests to MU
-0.89 -1.44 to -0.34 0.001
Postoperative Sepsis Rate
Full-EHR not receiving MU 0.63 -0.31 to 1.56 0.188
EHR that attests to MU
-0.17 -0.86 to 0.52 0.634
Postoperative Wound Dehiscence Rate (wounds split open after surgery)
Full-EHR not receiving MU -1.93 -3.43 to -0.43 0.011
EHR that attests to MU
-0.86 -2.02 to 0.31 0.152
PSI 90 Composite Score
Full-EHR not receiving MU -0.02 -0.15 to 0.10 0.701
EHR that attests to MU -0.07 -0.16 to 0.02 0.122
Notes: Reference= No EHR or Partially-implemented EHR; MU=Meaningful Use
Coefficient is semi-elasticity, where the dependent variable changes by 100*(coefficient) percent
for a one unit increase in the independent variable while all other variable in the model are held
constant
Model adjusts for minor teaching hospital status, major teaching hospital status, for profit status,
state, nurse to staffed bed ratio, and staffed beds
78
DISCUSSION
The impact of Meaningful Use attestation on patient safety has been
understudied, making it difficult to determine if the specific set of objectives for
Meaningful Use Objectives have had a positive impact on outcomes. Our study
demonstrates that hospitals attesting to Meaningful Use with their EHR systems
improved 2 patient safety outcomes. However, EHR use did not have a significant
impact on PSI composite scores in 2013, which is consistent with previous literature
(Appari et al., 2014). The evidence suggests that hospitals will not see significant
differences in their PSI 90 composite scores with the adoption and use of EHR systems,
as they move toward pay-for-performance models that incorporate the PSI 90 in the total
performance score (TPS). The hospitals with low TPSs will need to focus on other
factors and strategies that may significantly impact the PSI 90 composite score to avoid
reductions in reimbursement, such as process improvement and staff training. More
research is needed to determine strategies that significantly improve the PSI 90
composite score for providers. Furthermore, policy makers may want to focus on
specific patient safety indicators that are highly preventable in payment models to avoid
penalizing hospitals through reimbursement, rather than incorporating the PSI 90
composite score.
Our results show that hospitals that had EHR systems attesting to Meaningful
Use had significantly decreased risk of perioperative pulmonary embolism or deep vein
thrombosis by 89% relative to those hospitals with a partially implemented or no EHR
system. Surgery is one of the leading causes of blood clot problems, resulting in
conditions such as pulmonary embolism or deep vein thrombosis (Heit, et al., 2002).
Venous thromboembolism and pulmonary embolism are often lethal diseases, where 1-
week survival rate after a pulmonary embolism is only 71%, and results in sudden death
79
in almost 25% of cases (Heit, et al., 1999). Survivors of both conditions may experience
serious and costly long-term complications (Bergqvist, et al., 1997). The appropriate
medication can be given before and after major surgeries to greatly reduce the risk and
prevent blood clots with low, fixed doses of anticoagulant drugs (Goldhaber, and
Bounameaux, 2012). We did not find a significant affect among the fully-implemented
EHRs that did not meet Meaningful Use, suggesting the functionalities chosen for Stage
1 had a positive impact of EHR use related to the prevention of perioperative pulmonary
embolism or deep vein thrombosis. More research needs to be conducted among the
specific functionalities of Stage 1 Meaningful Use that contribute to the increased patient
safety related to the prevention of perioperative pulmonary embolism or deep vein
thrombosis, which could potentially be related to medication monitoring and decision
support.
Previous literature found that the odds of an EHR capable of Stage 1 Meaningful
Use (but not attest) had decreased the incidence risk of perioperative pulmonary
embolism or deep vein thrombosis by 4% (Incident Rate Ratio=0.96), although not
significantly different from their reference group. However, this insignificant finding may
have accrued because information regarding the EHR systems were collected from 2007
data, but classified by 2011 Meaningful Use functionalities with patient safety estimates
between 2008 to 2010. This kind of gap could misclassify many hospitals that adopted
the Stage 1 functionalities for Meaningful Use after 2007, which is likely because of the
steep increase in EHR adoption that took place in 2009 and after with the
implementation of the Affordable Care Act (DesRoches, et al., 2013). Our study also
provides the strength in providing a reference group with limited to no EHR functionality
compared with two advanced EHR systems, one being the government standard for
EHR use supported by the Meaningful Use program. Not separating the other fully-
80
implemented EHRs out of the reference group may dilute the results, and underestimate
the observed impact of EHR use on outcomes. To our knowledge, this comparison has
not yet been made in the literature in studying the impact of EHRs.
Furthermore, we found that among both advanced EHR groups (fully-
implemented EHRs that did not attest to Meaningful Use and hospitals that attested to
Meaningful Use) had a significant positive impact on reducing postoperative physiologic
and metabolic derangement rate compared to hospitals that had a partially-implemented
or no EHR system including. Meaningful Use had a positive impact on these patient
safety indicators, but gains observed among EHRs that did not attest to Meaningful use
were greater when comparing to hospitals with partially-implemented or no EHR. EHRs
that did not attest to Meaningful Use had significant positive impacts on reducing death
rate in low-mortality DRGs and postoperative wound dehiscence rate. Our findings are
consistent with previous literature where EHRs saw reductions in postoperative wound
dehiscence (Appari, et al., 2014). These results may suggest that hospitals purchasing
EHR systems without the Meaningful Use incentives may face more pressure to receive
the financial benefits, and may focus their efforts on improving selected outcomes to
meet the needs of their practices. The postoperative physiologic and metabolic
derangement rate decreased by 242% for those hospitals with a fully-implemented EHR
system that did not attest to Meaningful Use compared to hospitals with a partially-
implemented or no EHR, and decreased by 199% among hospitals attesting to
Meaningful Use respectively. Although not statistically significant for EHRs attesting to
Meaningful Use, this same effect between groups was observed among death rate in
low-mortality DRGs (291% vs. 93% reductions), and postoperative wound dehiscence
(193% vs. 86% reductions). More research is needed to determine the functionalities
and drivers behind these gains in patient safety among hospitals not receiving
81
Meaningful Use incentives. It is possible that these hospitals that do not receive
incentives are better leveraging functionalities outside of the Meaningful Use objectives
to achieve these heightened gains in patient safety, which may need to be considered in
adding to the Meaningful Use objectives.
We did not find significant differences among most individual indicators between
EHR groups. When using individual indicators, it is difficult to find significant variation
among events that are rare, such as adverse patient safety events. Additionally, some
single indicators face criticism for low predictability and reliability to determine hospital’s
patient safety. For example, we did not find significant differences in respiratory failure
between EHR groups. AHRQ and literature reports that this indicator presents issues
related to accuracy, reliability of physician diagnosis, and questionable preventability,
where diagnosis often overlaps with airway management and most are not preventable
cases (Scanlon, et al., 2008; Arozullah, et al., 2001; Lawrence et al., 2006; Utter et al.,
2010). It may be likely that this PSI has little to no relation with EHR use, rather more
related to the sample. It is reported that there is relatively little surgeons can do to
minimize the risk of respiratory failure (Lawrence et al., 2006). Most prominent non-
modifiable risks are advanced age, a major operation involving the torso, and substantial
neurologic, cardiovascular, or pulmonary comorbidity that might have greatly increased
the risk of PRF among our groups with EHRs (Arozullah, et al., 2001; Lawrence et al.,
2006; Utter et al., 2010). Furthermore, hospitals with EHRs may have the capacity to
take on cases with these complicated risk factors due to their technological capacity.
Therein, it is difficult to make inferences on overall patient safety using single indicators
where composite scores may be more useful in determining the overall impact on patient
safety (AHRQ, 2008).
82
Given these limitations with using postoperative respiratory failure, previous
literature demonstrated a reduction in postoperative respiratory failure rate by 11%
(Incident Rate Ratio=0.89) (Appari et al., 2014), which included the use of surgical IT
systems and historical composite quality scores as a predictors in their model, which
was not available in our datasets. Therein, there is the potential for unobserved effects
that were not included into our model due to data availability. Although, every effort was
made to include significant factors within our model that was included in our datasets.
Future longitudinal studies need to be conducted among a national sample of hospitals
to provide an understanding of EHR use on postoperative respiratory failure rate.
Moreover, policy makers should take caution when using postoperative respiratory
failure rate as a PSI to influence policy decisions, given its concerns to reliability,
accuracy, and preventability.
Additionally, it is unclear if rurality impacts patient safety outcomes with the use
of EHRs in healthcare delivery, especially given the difficulties rural hospitals have faced
to achieve Meaningful Use Stage 2 objectives (Adler-Milstein, et al., 2014). Rural
hospitals continually fall behind in HIT adoption in the literature (DesRoches et al., 2013;
Tietze MF, Williams J, Galimbertti, 2009; Boon, 2007; Memel et al., 2001; Adler-Milstein
et al., 2014). Rural hospitals face unique challenges because they have a smaller
population base, serve population with higher uninsurance rate, have more limited
supply of health professionals due to difficulties in recruitment and retention, and have
financial and human-capital constraints. Furthermore, rural hospitals have reported
many challenges, mainly financial, work flow, and staffing challenges in EHR adoption
(Gabriel, Jones, Samy, 2015). Therein, rural hospitals may be limited by the ability to
afford and receive technical support, train staff, and purchase higher quality EHR
systems. As a result, rural hospitals may be limited by the inability to afford and receive
83
technical support, train staff, and purchase higher quality EHR systems that may affect
outcomes. Due to the relatively small sample size of rural hospitals, we were unable to
achieve model convergence to study the effects of rurality between patient safety and
EHR use. Future studies should include larger sample sizes of rural hospitals to study
their impact on patient safety outcomes with the use of EHR systems. Hospitals with
higher degrees of rurality may implement EHRs to secure resources through Meaningful
Use incentives. However, due to unexpected costs and ongoing costs that arise with the
implementation and use of EHRs (Miller et al., 2005), hospitals with higher degrees of
rurality have limited resources to overcome these challenges, making it more difficult to
achieve gains in outcomes when compared to hospitals with partially-implemented or no
EHR. Urban hospitals may have better resources and decreased uncertainty to achieve
higher gains in patient safety outcomes compared to hospitals with partially-implemented
or no EHR. Rural hospitals attesting to Meaningful Use may experience lesser gains in
patient safety than their urban counterparts when compared to hospitals with partially-
implemented or no EHRs, given the financial and staffing challenges faced by small rural
hospitals.
Limitations
First, due to the cross-sectional nature to our study, we were not able to establish
a causal relationship between EHR use and patient safety. Longitudinal studies are
needed to show the long-term impacts these systems have on patient safety outcomes
over time. Second, more studies need to be conducted with larger samples in the
references group. Our study included 32 hospitals in the reference group, with hospitals
containing partially-implemented and no EHR systems. National studies are needed to
produce larger sample sizes, where these may be classified into two separate groups on
varied EHR functionalities. Furthermore, the sample size was also relatively small in the
84
EHR group with fully-implemented EHRs that did not attest to Meaningful Use (n=30).
We were also not able to study the impact of rurality on patient safety, because of the
small sample size we were not able to achieve model convergence. More studies need
to be conducted to determine the impact of rurality on outcomes with the use of EHR
systems among a nationally representative sample.
Our sample included significant differences between states and EHR use, where
72.3% of our sample was from the states of Florida and New York. Furthermore, we
performed a sensitivity analysis to determine the impact of state as a cluster effect in our
GLM model (Appendix B). We found consistency within our effects, but the sensitivity
analysis did show some differences in our significant findings, suggesting the effect of
state may need to be further explored for future studies. Among EHRs that did not attest
to Meaningful Use, we still found significant improvements in death rate in low mortality
DRGs, postoperative physiologic and metabolic derangement rate, and postoperative
would dehiscence rate when treating state as a cluster effect. Furthermore, between the
two models we found the same significant improvements in postoperative physiologic
and metabolic derangement rate for EHRs that attested to Meaningful Use compared to
partially-implemented or no EHR. However, the significant outcome in perioperative
pulmonary embolism or deep vein thrombosis rate for EHRs that attested to Meaningful
Use was no longer a significant finding when treating state as a cluster effect, where we
observed an increase in the standard error. Although, we did find a significant
improvement (157% decrease) in postoperative wound dehiscence rate for EHRs that
attested to Meaningful Use compared to partially-implemented to or EHR. In our study,
we adjusted for state in our regression analysis, and our post-estimation link test showed
that the model used in this study was a good predictor of patient safety (p=0.793). By
including state as a cluster effect in the model also showed that our model was a good
85
predictor of patient safety (p=0.603). Although, using state as a cluster effect in the GLM
model may not be the most efficient model to account for this effect. Studies with larger
samples within states should be conducted to be able to more accurately capture the
fixed effect at the state-level in studying patient safety and EHR use.
Furthermore, we did not study the impact of specific EHR functionalities, but
rather a set of functionalities chosen for Stage 1 Meaningful Use in 2013. The results
show that Stage 1 Meaningful Use did have a positive impact on 2 patient safety
indicators. Although based on the results of this study, policymakers may need to revisit
the current Meaningful Use objectives and standards in order for hospitals to have a
larger impact on patient safety with the use of their EHRs. Standards of Meaningful Use
may need to be more stringent or functionalities may need to be expanded in order to
have a significant impact on patient safety. However, to direct future development and
implementation of the Meaningful Use objectives, studies need to be conducted to show
the relationship between specific EHR functionalities within Meaningful Use objectives
that are associated with positive outcomes. Although, this study demonstrates the
impact of the government benchmark for EHR use has had on achieving in patient safety
in 2013. Lastly, there is the potential for unobserved effects due to limited data
availability for confounders correlated with the explanatory variable that were not
included into our model, including leadership positions in safety/quality, having a surgical
IT system, and historical composite scores of quality (Appari et al., 2014). Additionally,
future studies should include hospital’s financial condition as it may have an impact on
technology adoption and patient safety outcomes. Although, it is likely that
postoperative respiratory failure has low reliability and preventability. The strength of our
study is that we were able to classify hospital that actually attested to Meaningful Use,
which to our knowledge is the first study to do so in studying patient safety.
86
CONCLUSION
Our study demonstrates that hospitals attesting to Meaningful Use with their EHR
systems improved 2 patient safety outcomes. More research needs to be conducted to
determine which functionality or set of functionalities that contribute to these increases in
patient safety to direct future Meaningful Use incentives, as hospitals with fully-functional
EHRs that did not attest to Meaningful Use had greater effects on patient safety among
some indicators. However, EHR use did not have a significant impact on PSI composite
scores in 2013, suggesting that hospitals will not see significant differences in their PSI
90 composite scores with the adoption and use of EHR systems as they move toward
pay-for-performance models that incorporate the PSI 90 in the total performance score
(TPS). Policy makers may want to focus on specific patient safety indicators that are
highly preventable when incorporating patient safety into payment models to avoid
penalizing hospitals through reimbursement, rather than incorporating the PSI 90
composite score. Longitudinal studies are needed to show the long term impacts these
systems have on patient safety outcomes.
87
CHAPTER 3: The Impact of Electronic Health Records and Meaningful Use on Inpatient
Quality
Kate E. Trout, Ph.D.
University of Nebraska, 2016
Supervisor: Li-Wu Chen, Ph.D.
ABSTRACT
Background: The HITECH Act’s goal was not solely for providers to make “meaningful
use” of EHRs, but also achieve significant improvements in care processes and
outcomes. However, it is unclear if the investments into EHRs have improved the quality
of inpatient care given the current state of the literature.
Objective: The objective of this study is to determine the impact of EHRs use and
Meaningful Use on inpatient quality.
Methods: Inpatient hospitalization information and discharge data were obtained from
Healthcare Cost and Utilization Project (HCUP) 2013 State Inpatient Databases (SID)
from Florida, Nebraska, New York, and Washington. Additionally, we used 2013
American Hospital Association (AHA) annual survey data and CMS Meaningful Use
attestation records to gather hospital characteristics, Meaningful Use attestation, and
information regarding their EHR systems. Our final sample included 349 hospitals from
Florida, Nebraska, New York, and Washington that provided information about their EHR
systems. We used the Agency for Healthcare Research and Quality (AHRQ) IQI
software version 5.0 and SAS version 9.4 statistical software to determine the hospital-
level risk-adjusted standardized rates for IQI indicators and composite scores.
First, we produced data summary statistics and performed a bivariate analysis to
examine the difference in outcome variables and explanatory variables by EHR use.
Then, we performed multivariate regression analysis for IQI composite scores to
88
examine the impact of EHR use. Generalized linear model (GLM) method was used
with log link function and gamma family distribution to determine the effect between EHR
use on patient inpatient quality. In the final model, we adjusted for minor teaching
hospital status, major teaching hospital status, for profit status, state, nurse-to-staffed
bed ratio, staffed beds squared, facility payer mix squared, and Herfindahl-Hirschman
index (HHI).
Results: The majority of the hospitals included in the sample attested to Meaningful Use
Stage 1 with the use of their EHR systems (82.2%), followed by having partially-
implemented or no EHR system (9.2%) and having a fully-implemented EHR system that
does not attest to Meaningful Use (8.6%). The majority of hospitals had 100-299 beds
(38.7%), were non-profit hospitals (91.4%), were non-teaching hospitals (57.0%),
located in a metropolitan area (74.8%), from New York (37.3%), had an average
Medicare and Medicaid payers per total admissions payer mix ratio of 0.68, had an
average HHI of 0.35, and had an average nurse-to-bed ratio of 1.73.
There were significant differences in the mean IQI 90 composite scores (p=0.001) and
IQI 91 composite scores (p<0.001) between EHR groups. Hospitals with fully-
implemented EHRs (mean=0.90) that did not attest to Meaningful Use and hospitals with
partially-implemented or no EHR (mean=0.89) had the highest mean composite scores
for IQI 90 as compared to hospitals with EHRs that attested to Meaningful Use
(mean=0.79), indicating lower quality than EHRs that attested to Meaningful Use.
Hospitals with fully-implemented EHRs (mean=0.88) that did not attest to Meaningful
Use and hospitals with partially-implemented or no EHR (mean=0.89) had the highest
mean composite scores for IQI 91 as compared to hospitals with EHRs that attested to
Meaningful Use (mean=0.73), indicating lower quality than EHRs that attested to
Meaningful Use.
89
After adjusting for confounding factors, there were no significant differences in IQI 90 or
91 composite scores between fully-implemented EHRs that did not attest to Meaningful
Use compared to their counterparts that had partially-implemented or no EHRs. There
were significant differences in IQI 90 and IQI 91 composite scores between EHRs that
attested to Meaningful Use compared to partially-implemented or no EHRs, with a 8%
decrease composites for mortality for selected procedures and 18% decrease in
composites for mortality for selected conditions compared to hospitals with partially-
implemented or no EHR.
Conclusion: Meaningful Use attestation may be an important driver related to inpatient
quality. In this study, we found that hospitals that have EHRs attesting to Meaningful
Use have significantly better inpatient quality for IQI 90 and 91 composite scores
compared to hospitals with a partially-implemented or no EHR. We did not observe
significant differences in IQI composite scores for hospitals that had EHRs that did not
attest to Meaningful Use with their EHR systems compared to hospitals with partially-
implemented or no EHR. Policymakers should focus on setting priorities in order to
improve population health by studying the impact of Meaningful Use on quality of care
with composite measures. More research is needed to determine the Meaningful Use
objectives that are associated with higher inpatient quality.
90
INTRODUCTION
The use of Health Information Technologies (HITs), such as Electronic Health
Records (EHRs), will be critical in transforming the United States healthcare system
(Chaudhry, et al, 2006; Jones, et al, 2014). The adoption and use of EHRs has been
accelerated by the implementation of the Meaningful Use incentive program supported
through The Health Information Technology for Economic and Clinical Health Act
(HITECH) Act. Through the Meaningful Use program, many healthcare providers and
organizations have been eligible to receive financial incentives for demonstrating
“meaningful use” with their EHR systems by meeting a set of objectives and criteria
specified by Medicare and Medicaid Services (CMS) (Blumenthal and Tavenner, 2010).
Although, the HITECH Act authorized the incentive payments through CMS, its goal is
not solely for providers to make “meaningful use” of EHRs, but also achieve significant
improvements in care processes and outcomes (Blumenthal and Tavenner, 2010).
Studying the ability of providers to improve outcomes through attesting to Meaningful
Use is a timely topic for researchers, policy makers, healthcare providers, payers, and
consumers.
The volume of inpatient care has increased over the past decade, and it is
projected to increase by approximately 19 percent between the years 2013 to 2025 (Dall
et al, 2013). It will be important for the healthcare system to improve the quality of
inpatient care to avoid any negative impacts of population health. However, it is unclear
if the investments into EHRs have improved the quality of inpatient care. About half of
the research studies in the literature has demonstrated mixed and neural impacts of
EHR use on quality outcomes (Jones et al, 2011; Cochran, et al, 2011; Lapane, et al.,
2011; Wiljer et al, 2010; Cook, et al, 2011; Furukawa et al., 2010; Jones et al, 2011a;
Lakshminarayan et al, 2012; Austrian, et al, 2011; Milani, et al, 2011; Schenarts, et al,
91
2012; Connelly, et al, 2012; Dowding, et al., 2012; Mazars, et al., 2012). Furthermore,
no studies have used Meaningful Use attestation records to determine the impact of
EHR that attest to Meaningful Use on quality outcomes (Jones, et al, 2014). The
majority of studies only focus on specific Meaningful Use functionalities and their ability
to achieve positive outcomes among single quality indicators (Jones et al, 2014; Quinn
et al, 2011; Lavinge, et al, 2011; Neafsey et al, 2011; O’Connor, et al., 2011; Holt, et al,
2010; Williams, et al, 2010; Holbrook, et al., 2011; Virga, et al, 2012; Tang et al, 2012;
Gustafson, et al, 2012; Wagner, et al, 2012; Tenforde, et al, 2012; Shelley et al, 2011),
where it is difficult to determine the overall impact on quality of care from single
indicators (AHRQ, 2008). For example, one study found mixed results when studying
the impact of computerized provider order entry, and found a 2.1% reduction in mortality
among heart attack and heart failure patients (Jones et al, 2011). The results of these
studies are also largely mixed (Jones et al, 2014). Given the currently state of the
literature, it is difficult to make general inferences about whether or not the Meaningful
Use program has produced a positive impact on the overall quality of care. More
research is needed to determine if providers attesting to Meaningful Use are improving
the overall quality of care.
Inpatient Quality Indicators (IQIs) and composite scores developed by the
Agency for Healthcare Research and Quality (AHRQ) have been extensively tested, and
used to study the variation in quality across a variety of payer settings (e.g., Medicaid,
Medicare, and commercial), patient cohorts, and facilities (Haytham et al, 2011; AHRQ
2008). However, to our knowledge IQIs have not yet been used to study the impact of
hospitals attesting to Meaningful Use on quality of care. IQI composite scores are useful
to monitor performance regarding inpatient quality, as it is difficult to determine overall
differences in quality based on specific indicators (AHRQ, 2008). Currently, there are
92
two composite scores developed by AHRQ that describe inpatient quality including (1)
IQI 90 based on mortality for selected procedures and (2) IQI 91 based on mortality for
selected conditions. Furthermore, IQI 91 (mortality for selected conditions) is also
endorsed by the National Quality Forum (NQF) (AHRQ, 2011; NQF, 2009). These IQI
composite scores were created with aims to monitor performance regarding inpatient
quality and represent the quality of care “inside hospitals and include measures of
utilization of procedures for which there are questions of overuse, underuse, or misuse”
(AHRQ, 2007). Furthermore, IQI composite scores pose a wide variety of benefits
including: (1) identifying the drivers in quality, (2) detecting differences in quality, and (3)
prioritizing actions for quality improvement (AHRQ, 2008).
AHRQ IQI composite scores can provide useful information for consumers to
select hospitals, for providers to identify the drivers of quality, for purchasers to select
hospitals to improve health outcomes, and for policymakers to set policy priorities
(AHRQ, 2008). To our knowledge no studies have determined the impact of Meaningful
Use attestation on overall inpatient quality. Studying IQI composite scores will allow us
to detect the impact of EHR use on the overall inpatient quality of care. The objective of
this study is to determine the impact of EHRs use and Meaningful Use on inpatient
quality of care.
THEORETICAL FRAMEWORK
In this study we adapted technology, organizational, and environment (TOE)
innovation adoption framework developed by Tornatzky and Fleischer (1990) to describe
the impact of EHR use on inpatient quality of care. TOE framework incorporates three
contexts that impact the adoption of technological innovations, including: (1)
environmental context, (2) organizational context, and (3) technology context.
Environmental context is defined by the organization’s environment to conduct business,
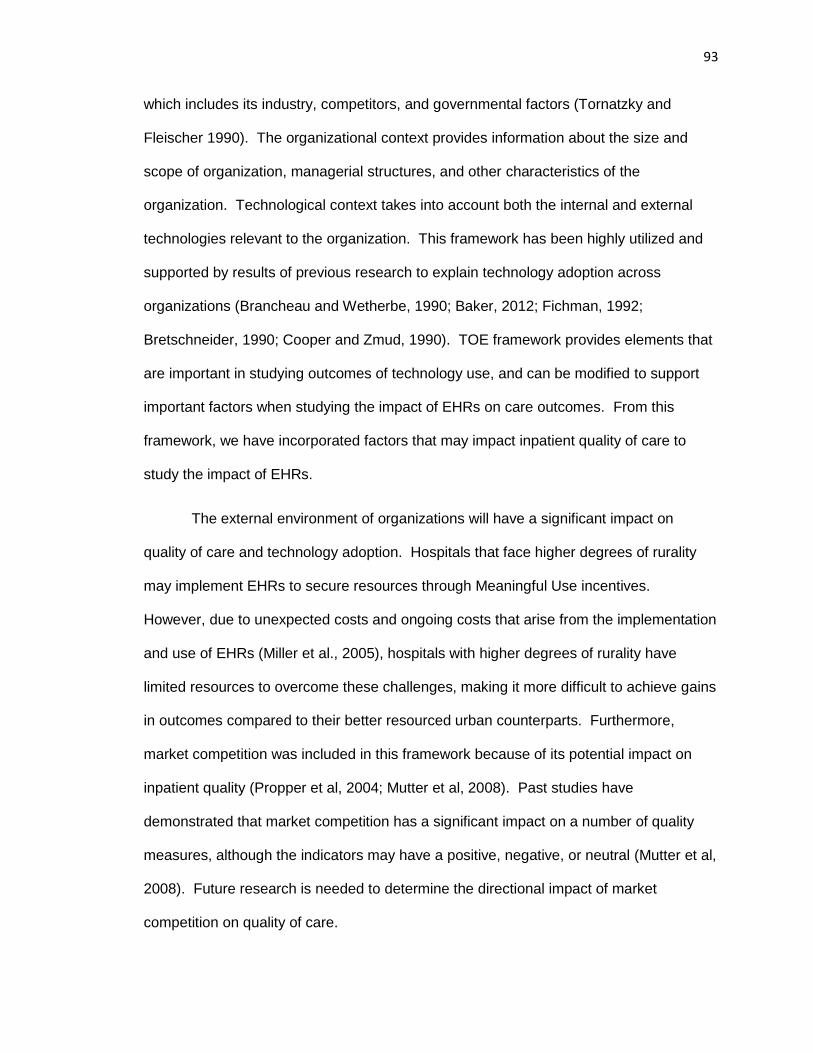
93
which includes its industry, competitors, and governmental factors (Tornatzky and
Fleischer 1990). The organizational context provides information about the size and
scope of organization, managerial structures, and other characteristics of the
organization. Technological context takes into account both the internal and external
technologies relevant to the organization. This framework has been highly utilized and
supported by results of previous research to explain technology adoption across
organizations (Brancheau and Wetherbe, 1990; Baker, 2012; Fichman, 1992;
Bretschneider, 1990; Cooper and Zmud, 1990). TOE framework provides elements that
are important in studying outcomes of technology use, and can be modified to support
important factors when studying the impact of EHRs on care outcomes. From this
framework, we have incorporated factors that may impact inpatient quality of care to
study the impact of EHRs.
The external environment of organizations will have a significant impact on
quality of care and technology adoption. Hospitals that face higher degrees of rurality
may implement EHRs to secure resources through Meaningful Use incentives.
However, due to unexpected costs and ongoing costs that arise from the implementation
and use of EHRs (Miller et al., 2005), hospitals with higher degrees of rurality have
limited resources to overcome these challenges, making it more difficult to achieve gains
in outcomes compared to their better resourced urban counterparts. Furthermore,
market competition was included in this framework because of its potential impact on
inpatient quality (Propper et al, 2004; Mutter et al, 2008). Past studies have
demonstrated that market competition has a significant impact on a number of quality
measures, although the indicators may have a positive, negative, or neutral (Mutter et al,
2008). Future research is needed to determine the directional impact of market
competition on quality of care.
94
Furthermore, the literature demonstrates that organizational characteristics have
a significant impact on healthcare outcomes (Armstrong et al., 2009; Donabedian, 2003;
Lehrman et al., 2010). Important organizational characteristics that may impact on
quality and safety outcomes include for-profit status, teaching hospital status, and
academic hospital status (Appari et al., 2014). Additionally, studies have shown that
organizational support of nurses may affect patient outcomes (Aiken et al., 2002; Rivard
et al., 2010). The nurse-to-bed ratio has been used in previous studies to adjust for the
effect of nurse support within the organization (Appari et al., 2014). Furthermore,
engagement in safety/quality metrics that is linked to compensation may have an impact
on patient safety and quality of care at the facility-level (Appari, et al., 2014). Hospital
size using number of hospital beds may be a potential confounding factor that impacts
the quality of care (Jha, and Epstein, 2010). One view is that larger hospitals may have
more resource, technologies, and be involved in teaching activities to produce higher
quality of care compared to their smaller counterparts with less resources (Shotel, and
LoGerfo et al, 1981). Conversely, other studies have found that medium size hospitals
have greater quality compared to large hospitals, where there large size may limit their
quality improvement implementation efforts (El-Jardali et al, 2008). Patient
characteristics are important to determine the risk adjustment for quality related
indicators at the facility-level (Coffey et al, 2013). Previous literature has included facility
payer mix to study the impact of advanced information technology use on quality of care
(Bourgeois, and Yaylacicegi, 2012). Facility payer mix is associated with organizational
resources and may impact the provision of quality (Grabowski, 2001; Bourgeois, and
Yaylacicegi, 2012).
HITs were envisioned to improve patient safety and quality. Furthermore, there
are several important factors that impact the use of HITs, including interoperability,
95
functionality, and usability of systems. It is widely cited that interoperability and
information sharing will play a large role in improving the healthcare system and health
outcomes (Cutler et al., 2006; Kvedar et al., 2014; Tan, 1999), but has been a challenge
to achieve an efficient system design in the healthcare sector. One of the long term
goals of the Meaningful Use program is to achieve information sharing and
interoperability in order to improve quality of care and process outcomes. EHRs may
vary by functionalities and usability. In this study, we aim to determine the impact of
EHRs on patient safety by focusing on a set of functionalities in receiving Meaningful
Use incentives, which represents the government standard for EHR adoption and use. It
is unclear if the specific set of objectives chosen for the Meaningful Use program have
had a positive impact on outcomes.
In addition, users with different backgrounds and needs interact with HITs in
different ways. Implementing HITs with high usability are necessary to reduce waste
and direct development through focusing on measuring the technology’s ability to meet
the intended purpose. HIT usability evaluation has been overlooked widely during
technology development, which has negatively impacted the system’s efficiency,
effectiveness, and satisfaction (Minshall, 2013; Yen & Bakken, 2012), and needs to be
controlled for when studying HIT adoption and utilization. However, the Office of the
National Coordinator for Health Information Technology (ONC-HIT) created a Certified
Health IT Product List (CHPL). The purpose of certifying of EHRs was to implement
systems with higher functionality, interoperability, and usability. In order to receive EHR
incentives in 2016, providers and hospitals must use a CMS certified EHR by an ONC
Authorized Certification Body (ONC-ACB). Study the impact of the national certification
of EHRs will help better predict the impact on the system design thresholds set by the
ONC. Therein, ONC certified EHR systems may have higher levels of functionality,
96
interoperability, and usability, impacting the ability of the hospital to achieve intended
outcomes. Studying the EHR certification into the future will provide an opportunity to
study the standards set by the ONC. Future studies should incorporate these factors
into their theoretical framework, as they impact outcomes of technology use.
In our framework, we apply the RDT to hypothesize the effect of Meaningful Use
attestation on the impact of EHR use on inpatient quality outcomes. The Resource
Dependence Theory (RDT) central proposition is that organizations will alter their
behaviors to manage their resource dependencies in order to achieve greater autonomy
and reduce uncertainty in the flow of vital resources from the environment (Pfeffer and
Salancik, 1978; Pfeffer and Salancik, 2003). Constructs of the RDT are uncertainty,
munificence, and interdependence. Uncertainty refers “to the degree to which future
states of the world cannot be anticipated and accurately predicted” (Pfeffer and Salancik,
1978). Munificence refers to the abundance of critical resources in the environment to
support the organizations survival. Interdependence refers to organizations reliance on
one another for the acquisition of resources.
According to the RDT, hospitals may be adopting and implementing EHRs to
attest to Meaningful Use in order to secure resources “to achieve greater autonomy and
reduce uncertainty in the flow of vital resources from the environment.” Securing these
resources may be the driving force in adopting Meaningful Use capable EHR systems,
while improve the resources in order to adopt and implement more comprehensive EHR
systems. Meaningful Use objectives allow facilities to capture and share better data,
which should result in improvements in quality, safety, efficiency, and reduce health
disparities. In essence, the ability to adopt necessary functionalities and securing
resources to properly implement and use their EHR systems may allow these hospitals
to achieve higher quality of care and better outcomes. In contrast, those hospitals that
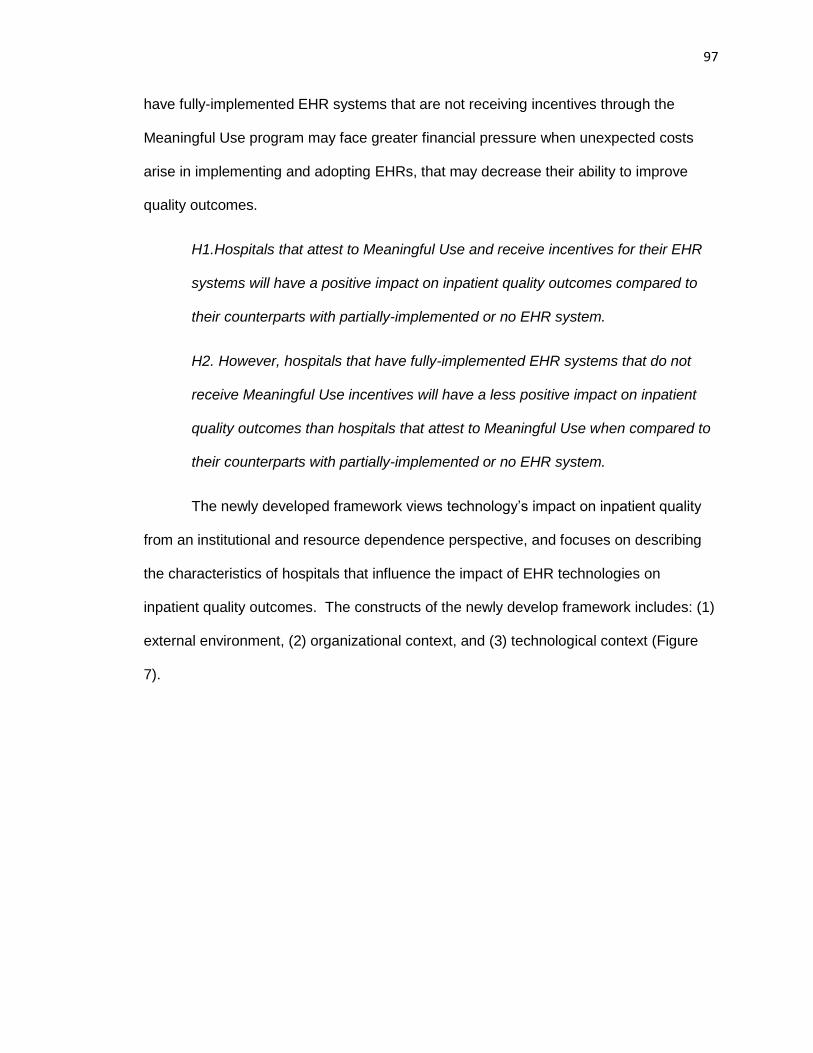
97
have fully-implemented EHR systems that are not receiving incentives through the
Meaningful Use program may face greater financial pressure when unexpected costs
arise in implementing and adopting EHRs, that may decrease their ability to improve
quality outcomes.
H1.Hospitals that attest to Meaningful Use and receive incentives for their EHR
systems will have a positive impact on inpatient quality outcomes compared to
their counterparts with partially-implemented or no EHR system.
H2. However, hospitals that have fully-implemented EHR systems that do not
receive Meaningful Use incentives will have a less positive impact on inpatient
quality outcomes than hospitals that attest to Meaningful Use when compared to
their counterparts with partially-implemented or no EHR system.
The newly developed framework views technology’s impact on inpatient quality
from an institutional and resource dependence perspective, and focuses on describing
the characteristics of hospitals that influence the impact of EHR technologies on
inpatient quality outcomes. The constructs of the newly develop framework includes: (1)
external environment, (2) organizational context, and (3) technological context (Figure
7).
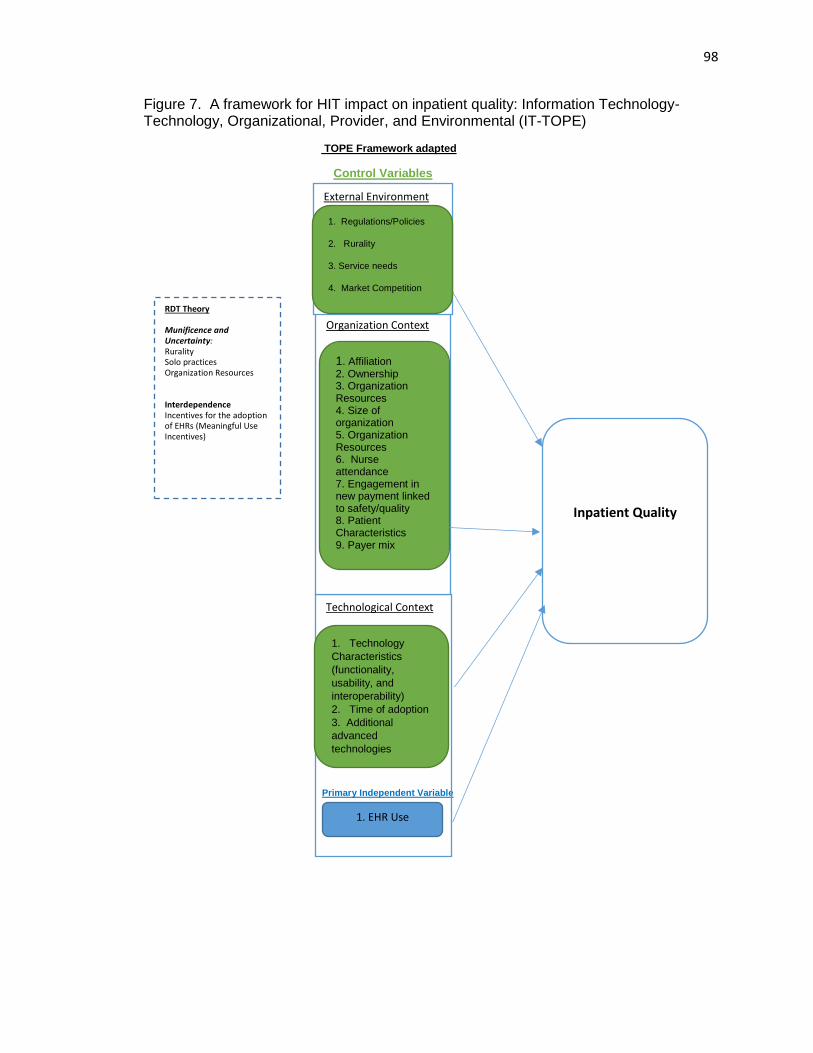
98
Figure 7. A framework for HIT impact on inpatient quality: Information Technology- Technology, Organizational, Provider, and Environmental (IT-TOPE)
TOPE Framework adapted
Control Variables
Primary Independent Variable
Technological Context
Organization Context
1. Affiliation 2. Ownership 3. Organization Resources 4. Size of organization 5. Organization Resources 6. Nurse attendance 7. Engagement in new payment linked to safety/quality 8. Patient Characteristics 9. Payer mix
Inpatient Quality
RDT Theory
Munificence and Uncertainty: Rurality Solo practices Organization Resources Interdependence Incentives for the adoption of EHRs (Meaningful Use Incentives)
External Environment
1. Regulations/Policies
2. Rurality
3. Service needs
4. Market Competition
1. Technology
Characteristics
(functionality,
usability, and
interoperability)
2. Time of adoption
3. Additional
advanced
technologies
1. EHR Use
99
METHODS
Data and Study Sample
We used three data sources in this study to determine the impact of EHRs on
patient safety outcomes. Inpatient hospitalization information and discharge data was
obtained from Healthcare Cost and Utilization Project (HCUP) 2013 State Inpatient
Databases (SID) from Florida, Nebraska, New York, and Washington. One state was
chosen from each of the census regions to help us generalize the study sample to a
geographically representative national sample. Additionally, we used 2013 American
Hospital Association (AHA) annual survey data and CMS Meaningful Use attestation
records to gather hospital characteristics and information regarding their EHR systems.
Our final sample included 349 hospitals from Florida, Nebraska, New York, and
Washington that provided information about their EHR systems.
Data Elements
Outcomes Variables
We used the Agency for Healthcare Research and Quality (AHRQ) IQI software
version 5.0 and SAS version 9.4 statistical software to determine the hospital-level risk-
adjusted standardized rates for IQIs and composite scores. IQI composite scores were
developed by AHRQ, and are comprised of a set of indicators providing information on
mortality for certain conditions or procedures (Table 10). Composite scores for mortality
for selected procedures (IQI 90) and mortality for selected conditions (IQI 91) were
created with aims to monitor performance regarding inpatient quality, as it is difficult to
determine overall differences in quality based on specific indicators (AHRQ, 2008). The
AHRQ IQIs represent the quality of care “inside hospitals and include measures of
100
utilization of procedures for which there are questions of overuse, underuse, or misuse”
(AHRQ, 2007).
Risk adjustments for IQIs were made for age, gender, age-gender interaction,
and 3M™. The 3M™ All Patient Refined Diagnosis Related Groups (APR-DRG) System
with severity score and risk of mortality were used for risk adjustment of the utilization
indicators and the in-hospital mortality indicators through regression-based prior to
loading the data (Coffey et al, 2013). First, the risk adjusted rate (RR) is computed
through a simple logistic regression model to determine the predicted value (PV). The
predicted value for all the cases in each facility are summed to determine the expected
rate (ER). The risk-adjusted rate is determined by indirect standardization of the
observed rate (OR) divided by the expected rate (ER) and multiplied by the reference
population rate (PR) (AHRQ 2008). The 2013 population file was used in the software to
produce risk-adjusted rates based on the population at risk during the year 2013.
(RR) = (OR/ER × PR)
Second, the risk-adjusted rate is scaled by the reference population. Each IQI
indicator risk-adjusted rate is divided by the reference population rate to determine the
ratio to the reference population rate for each indicator. The indicators that are part of
the composite score are scaled by the reference population rate to reflect the degree of
deviation from the overall average performance. Third, the reliability-adjustment ratio
(RAR) is computed using the weighted average of the risk adjusted ratio and the
reference population ratio. The reliability weights are assigned by the software ranging
from 0 to 1, and determined through empirical analysis based on provider size and the
indicator (AHRQ 2008).
RAR = [risk-adjusted ratio × weight] + [reference population ratio × (1 – weight)]
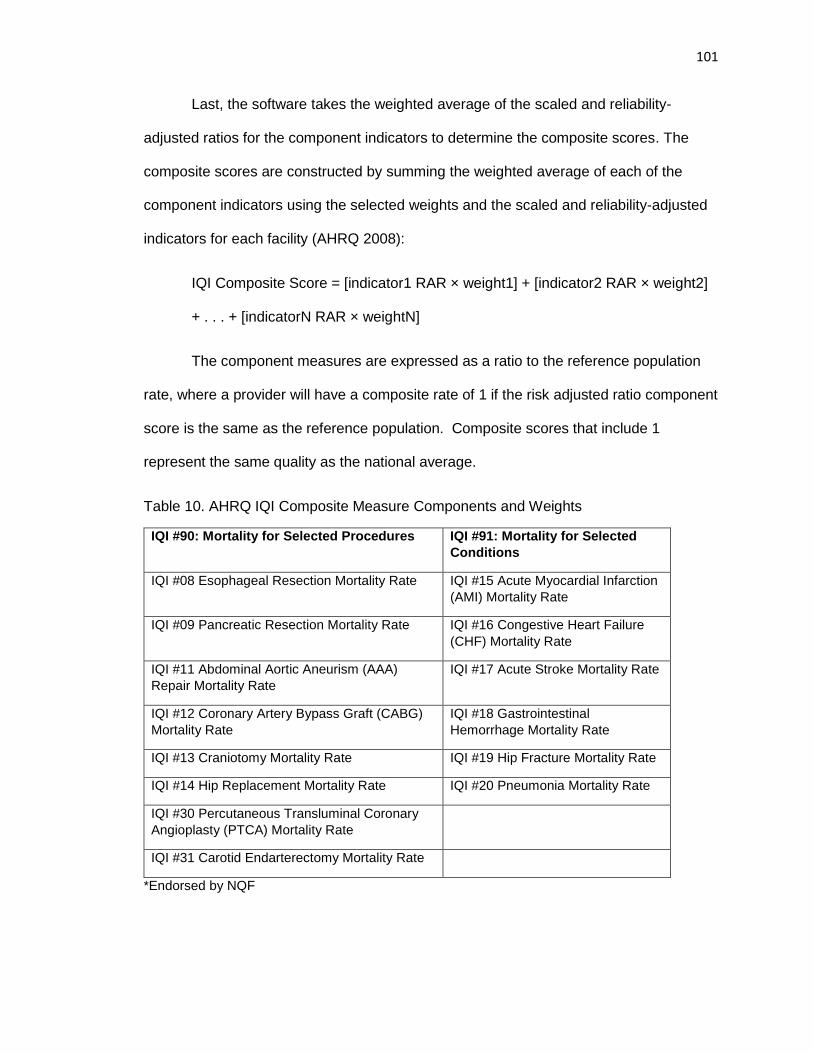
101
Last, the software takes the weighted average of the scaled and reliability-
adjusted ratios for the component indicators to determine the composite scores. The
composite scores are constructed by summing the weighted average of each of the
component indicators using the selected weights and the scaled and reliability-adjusted
indicators for each facility (AHRQ 2008):
IQI Composite Score = [indicator1 RAR × weight1] + [indicator2 RAR × weight2]
+ . . . + [indicatorN RAR × weightN]
The component measures are expressed as a ratio to the reference population
rate, where a provider will have a composite rate of 1 if the risk adjusted ratio component
score is the same as the reference population. Composite scores that include 1
represent the same quality as the national average.
Table 10. AHRQ IQI Composite Measure Components and Weights
IQI #90: Mortality for Selected Procedures IQI #91: Mortality for Selected
Conditions
IQI #08 Esophageal Resection Mortality Rate IQI #15 Acute Myocardial Infarction
(AMI) Mortality Rate
IQI #09 Pancreatic Resection Mortality Rate IQI #16 Congestive Heart Failure
(CHF) Mortality Rate
IQI #11 Abdominal Aortic Aneurism (AAA)
Repair Mortality Rate
IQI #17 Acute Stroke Mortality Rate
IQI #12 Coronary Artery Bypass Graft (CABG)
Mortality Rate
IQI #18 Gastrointestinal
Hemorrhage Mortality Rate
IQI #13 Craniotomy Mortality Rate IQI #19 Hip Fracture Mortality Rate
IQI #14 Hip Replacement Mortality Rate IQI #20 Pneumonia Mortality Rate
IQI #30 Percutaneous Transluminal Coronary
Angioplasty (PTCA) Mortality Rate
IQI #31 Carotid Endarterectomy Mortality Rate
*Endorsed by NQF
102
Primary Independent Variable
The primary independent variable was determined by combining the Meaningful
Use attestation records and the AHA annual survey question about EHR use.
Meaningful Use attestation was determined from the CMS attestation records which
identifies the stage of Meaningful Use attested to by the hospital, the incentives they
received, and the years they attested. The CMS attestation records provided
information on the providers who received incentives and attested to Meaningful Use in
2013. The 2013 American Hospital Association (AHA) annual survey data was used to
identify information regarding the use of an EHR system. The AHA survey asks “Does
your hospital have an electronic health record?” with where providers can report either
using no EHR, a partially-implemented EHR, or fully-implemented EHR. Hospitals were
categorized into three group: (1) meeting Meaningful Use with the use of their EHRs, (2)
having a fully-implemented EHR but have not attested to Meaningful Use, and (3) having
partially-implemented EHR or no EHR system from the AHA survey. This categorization
has never been compared in the literature, but provides the opportunity to study
outcomes among hospitals that attest to Meaningful Use with the use of their EHRs (the
government standard for EHR functionality) and those that have fully-implemented EHR
systems that do not attest to Meaningful Use compared to those hospitals with limited
EHR use. Our sample included in the study had 90.8% of hospitals had an EHR system,
either that attested to Meaningful Use or fully implemented. This is fairly consistent with
the national sample where about 94% of hospitals reported having a certified EHR in
2013 (Henry, et al., 2016).
103
Other Independent Variables
The 2013 American Hospital Association (AHA) annual survey data was used to
identify hospital characteristics, such as number of staffed beds, ownership, teaching
hospital status, rurality, facility payer mix, nurse-to-staffed bed ratio, and Herfindahl-
Hirschman index (HHI). Total facility staffed beds were reported as set up and staffed at
the end of reporting period in the AHA annual survey. Teaching hospital status was
coded as a categorical variable including major teaching hospital, minor teaching
hospital, and non-teaching hospital. Hospitals that reported having Council of Teaching
Hospitals designation of the Association of American Medical Colleges were categorized
as major teaching hospital. Hospitals were categorized as minor teaching hospitals if
they reported any one or more of the following: (1) approval to participate in residency
and/or internship training by the Accreditation Council for Graduate Medical Education
(ACGME), (2) medical school affiliation reported to the American Medical Association
(AMA), (3) Internship approved by American Osteopathic Association, and/or (4)
residency approved by American Osteopathic Association. Ownership status was
categorized by for-profit and non-profit/government. Nurse to bed ratio was determined
by number of full time equivalent (FTE) registered nurses (RN) and licensed practical
nurses (LPN) to the number of staffed beds. Facility payer mix was included because it
is associated with organizational resources and can impact the provision of quality
(Grabowski, 2001; Bourgeois, and Yaylacicegi, 2012), which has also been used in
previous literature to study the impact of advanced information technology use on quality
of care (Bourgeois, and Yaylacicegi, 2012). Facility payer mix ratio was determined by
adding the total number of Medicare and Medicaid admissions divided by the total
admissions for each facility. We constructed a Herfindahl-Hirschman Index (HHI) on bed
shares at the county-level to represent the market competition. We calculate the county-
104
level bed share by dividing the total facility beds in the facility by the sum of the total
facility beds in the county. Herfindahl-Hirschman Index was constructed by summing the
squares of the county-level bed shares.
Statistical Analysis
First, we produced data summary statistics and performed a bivariate analysis to
examine the differences between outcome variables and explanatory variables by EHR
use. Analysis of variance (ANOVA) and chi squared tests were used during our
bivariate analysis, among continuous and categorical variables respectively. Then, we
performed multivariate estimation to examine the impact of EHR use on IQI composite
scores. Generalized linear model (GLM) method was used with log link function and
gamma family distribution to determine the effect between EHR use on inpatient quality.
This is consistent with the previous literature where adverse events, if measured using
with a Poisson parameter (ex. mean rate for patients) across each facility, should be
considered gamma distributed (Appari et al., 2014; Singer et al., 2009; Gardner, Mulvey,
and Shaw, 1995). The model coefficient represents the semi-elasticity, where the
dependent variable changes by 100*(coefficient) percent for a one unit increase in the
independent variable while all other variable in the model are held constant. In the final
model, we adjusted for minor teaching hospital status, major teaching hospital status, for
profit status, state, nurse-to-staffed bed ratio, staffed beds, facility payer mix squared,
and HHI. Due to model convergence, we used staffed beds as a continuous variable in
the final model. Rurality was excluded from the model because of its strong correlation
with teaching hospital status, where teaching hospitals are primarily located in
metropolitan areas compared to rural areas. Post-estimation link test was performed,
and determined final model as a well-fit model. All analysis conducted using Stata/IC
v.14.1.
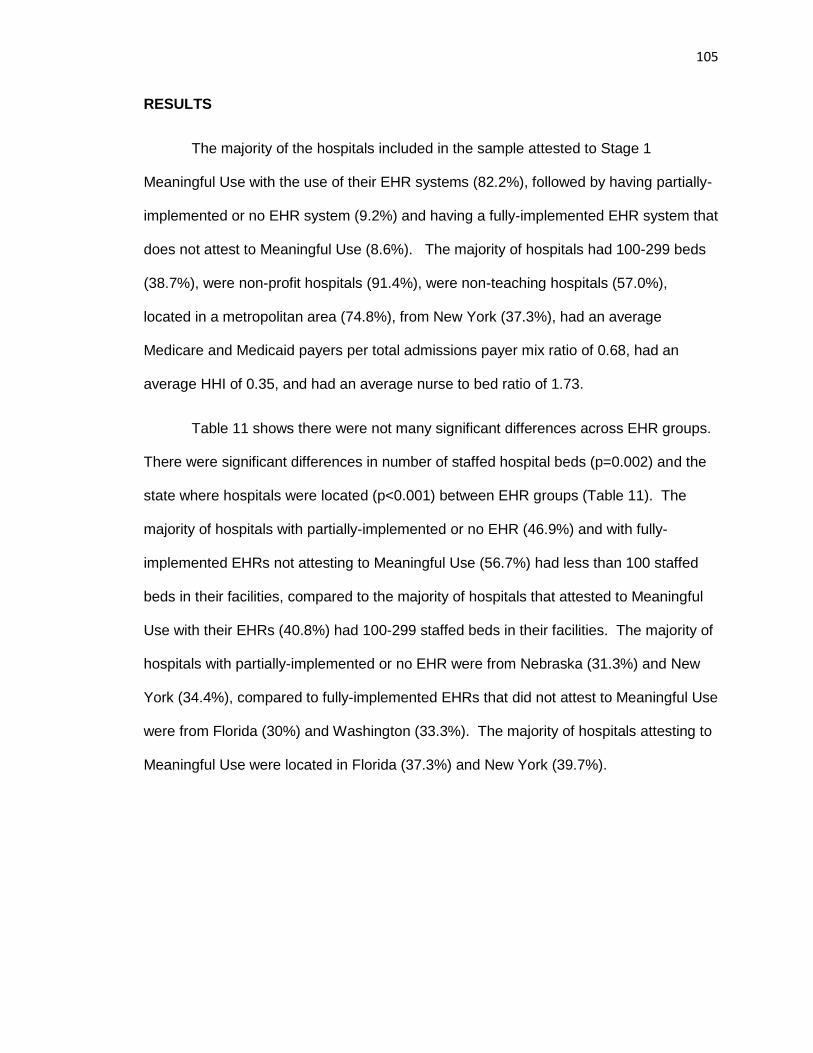
105
RESULTS
The majority of the hospitals included in the sample attested to Stage 1
Meaningful Use with the use of their EHR systems (82.2%), followed by having partially-
implemented or no EHR system (9.2%) and having a fully-implemented EHR system that
does not attest to Meaningful Use (8.6%). The majority of hospitals had 100-299 beds
(38.7%), were non-profit hospitals (91.4%), were non-teaching hospitals (57.0%),
located in a metropolitan area (74.8%), from New York (37.3%), had an average
Medicare and Medicaid payers per total admissions payer mix ratio of 0.68, had an
average HHI of 0.35, and had an average nurse to bed ratio of 1.73.
Table 11 shows there were not many significant differences across EHR groups.
There were significant differences in number of staffed hospital beds (p=0.002) and the
state where hospitals were located (p<0.001) between EHR groups (Table 11). The
majority of hospitals with partially-implemented or no EHR (46.9%) and with fully-
implemented EHRs not attesting to Meaningful Use (56.7%) had less than 100 staffed
beds in their facilities, compared to the majority of hospitals that attested to Meaningful
Use with their EHRs (40.8%) had 100-299 staffed beds in their facilities. The majority of
hospitals with partially-implemented or no EHR were from Nebraska (31.3%) and New
York (34.4%), compared to fully-implemented EHRs that did not attest to Meaningful Use
were from Florida (30%) and Washington (33.3%). The majority of hospitals attesting to
Meaningful Use were located in Florida (37.3%) and New York (39.7%).
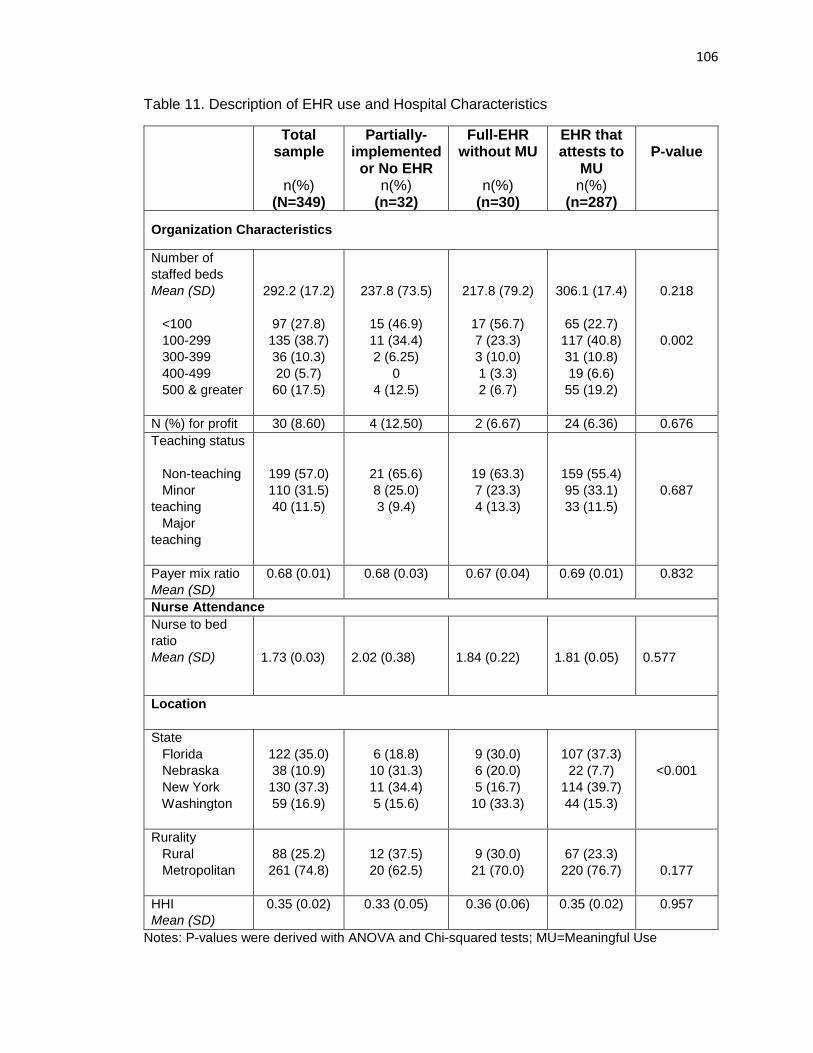
106
Table 11. Description of EHR use and Hospital Characteristics
Total sample
n(%)
(N=349)
Partially-implemented
or No EHR n(%)
(n=32)
Full-EHR without MU
n(%)
(n=30)
EHR that attests to
MU n(%)
(n=287)
P-value
Organization Characteristics
Number of
staffed beds
Mean (SD)
<100
100-299
300-399
400-499
500 & greater
292.2 (17.2)
97 (27.8)
135 (38.7)
36 (10.3)
20 (5.7)
60 (17.5)
237.8 (73.5)
15 (46.9)
11 (34.4)
2 (6.25)
0
4 (12.5)
217.8 (79.2)
17 (56.7)
7 (23.3)
3 (10.0)
1 (3.3)
2 (6.7)
306.1 (17.4)
65 (22.7)
117 (40.8)
31 (10.8)
19 (6.6)
55 (19.2)
0.218
0.002
N (%) for profit 30 (8.60) 4 (12.50) 2 (6.67) 24 (6.36) 0.676
Teaching status
Non-teaching
Minor
teaching
Major
teaching
199 (57.0)
110 (31.5)
40 (11.5)
21 (65.6)
8 (25.0)
3 (9.4)
19 (63.3)
7 (23.3)
4 (13.3)
159 (55.4)
95 (33.1)
33 (11.5)
0.687
Payer mix ratio
Mean (SD)
0.68 (0.01) 0.68 (0.03) 0.67 (0.04) 0.69 (0.01) 0.832
Nurse Attendance
Nurse to bed
ratio
Mean (SD)
1.73 (0.03)
2.02 (0.38)
1.84 (0.22)
1.81 (0.05)
0.577
Location
State
Florida
Nebraska
New York
Washington
122 (35.0)
38 (10.9)
130 (37.3)
59 (16.9)
6 (18.8)
10 (31.3)
11 (34.4)
5 (15.6)
9 (30.0)
6 (20.0)
5 (16.7)
10 (33.3)
107 (37.3)
22 (7.7)
114 (39.7)
44 (15.3)
<0.001
Rurality
Rural
Metropolitan
88 (25.2)
261 (74.8)
12 (37.5)
20 (62.5)
9 (30.0)
21 (70.0)
67 (23.3)
220 (76.7)
0.177
HHI
Mean (SD)
0.35 (0.02) 0.33 (0.05) 0.36 (0.06) 0.35 (0.02) 0.957
Notes: P-values were derived with ANOVA and Chi-squared tests; MU=Meaningful Use
107
Impact of EHR Use on Inpatient Quality
Table 12 shows the mean IQI 90 composite score for mortality for selected
procedures was 0.81, and 0.76 for IQI 91 for mortality for selected conditions (Table 12),
indicating inpatient quality better than the national average. The component measures
are expressed as a ratio to the reference population rate, where a provider will have a
composite rate of 1 if the risk adjusted ratio component score was the same as the
reference population. Composite scores that include 1 represent the same quality as the
national average. There were significant differences in the mean IQI 90 composite
scores (p=0.001) and IQI 91 composite scores (p<0.001) between EHR groups. Fully-
implemented EHRs (mean=0.90) that did not attest to Meaningful Use and partially-
implemented or no EHR (mean=0.89) that did not attest to Meaningful Use had the
highest mean composite scores for IQI 90 as compared to EHRs that attested to
Meaningful Use (mean=0.79), indicating lower quality than EHRs that attested to
Meaningful Use. Furthermore, similar effects were observed for IQI 91 composite
scores. Fully-implemented EHRs (mean=0.88) that did not attest to Meaningful Use
and partially-implemented or no EHR (mean=0.89) had the highest mean composite
scores for IQI 91 as compared to EHRs that attested to Meaningful Use (mean=0.73),
indicating lower quality than EHRs that attested to Meaningful Use.
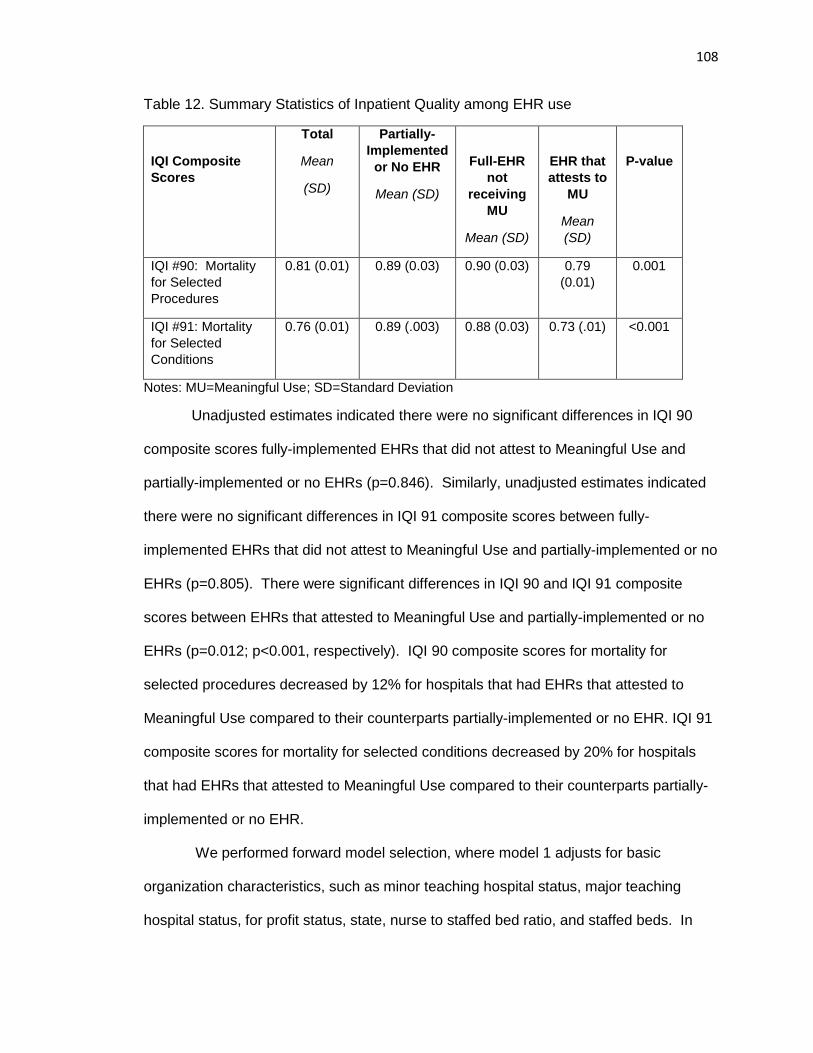
108
Table 12. Summary Statistics of Inpatient Quality among EHR use
IQI Composite
Scores
Total
Mean
(SD)
Partially-
Implemented
or No EHR
Mean (SD)
Full-EHR
not
receiving
MU
Mean (SD)
EHR that
attests to
MU
Mean
(SD)
P-value
IQI #90: Mortality
for Selected
Procedures
0.81 (0.01) 0.89 (0.03) 0.90 (0.03) 0.79
(0.01)
0.001
IQI #91: Mortality
for Selected
Conditions
0.76 (0.01) 0.89 (.003) 0.88 (0.03) 0.73 (.01) <0.001
Notes: MU=Meaningful Use; SD=Standard Deviation
Unadjusted estimates indicated there were no significant differences in IQI 90
composite scores fully-implemented EHRs that did not attest to Meaningful Use and
partially-implemented or no EHRs (p=0.846). Similarly, unadjusted estimates indicated
there were no significant differences in IQI 91 composite scores between fully-
implemented EHRs that did not attest to Meaningful Use and partially-implemented or no
EHRs (p=0.805). There were significant differences in IQI 90 and IQI 91 composite
scores between EHRs that attested to Meaningful Use and partially-implemented or no
EHRs (p=0.012; p<0.001, respectively). IQI 90 composite scores for mortality for
selected procedures decreased by 12% for hospitals that had EHRs that attested to
Meaningful Use compared to their counterparts partially-implemented or no EHR. IQI 91
composite scores for mortality for selected conditions decreased by 20% for hospitals
that had EHRs that attested to Meaningful Use compared to their counterparts partially-
implemented or no EHR.
We performed forward model selection, where model 1 adjusts for basic
organization characteristics, such as minor teaching hospital status, major teaching
hospital status, for profit status, state, nurse to staffed bed ratio, and staffed beds. In
109
model 1, there were no significant differences in IQI 90 composite scores between fully-
implemented EHRS that did not attest to Meaningful Use (p=0.836) compared to their
counterparts that had partially-implemented or no EHRs. In model 1, there were
significant differences in IQI 90 composite scores between EHRs that attested to
Meaningful Use (p=0.009) compared to their counterparts that had partially-implemented
or no EHRs. IQI 90 composite scores for mortality for selected procedures decreased
by 11% for hospitals that had EHRs that attested to Meaningful Use compared to their
counterparts partially-implemented or no EHR. Similarly, there were no significant
differences in IQI 91 composite scores between fully-implemented EHRS that did not
attest to Meaningful Use compared to partially-implemented or no EHRs (p=0.431).
There were significant differences in IQI 91 composite scores between EHRs that
attested to Meaningful Use and partially-implemented or no EHRs (p<0.001). IQI 91
composite scores for mortality for selected conditions decreased by 21% for hospitals
that had EHRs that attested to Meaningful Use compared to their counterparts partially-
implemented or no EHR.
In model 2, we adjust for all significant factors that may impact quality of care and
the use of EHR systems, including minor teaching hospital status, major teaching
hospital status, for profit status, state, nurse-to-staffed bed ratio, staffed beds, facility
payer mix squared, and HHI. In model 2, there were no significant differences in IQI 90
composite scores between fully-implemented EHRs that did not attest to Meaningful Use
(p=0.723) compared to their counterparts that had partially-implemented or no EHRs.
However, there were significant differences in IQI 90 composite scores between EHRs
that attested to Meaningful Use (p=0.033) compared to their counterparts that had
partially-implemented or no EHRs. For example, IQI 90 composite scores for mortality
for selected procedures decreased by 8% for hospitals that had EHRs that attested to
Meaningful Use compared to their counterparts partially-implemented or no EHR.
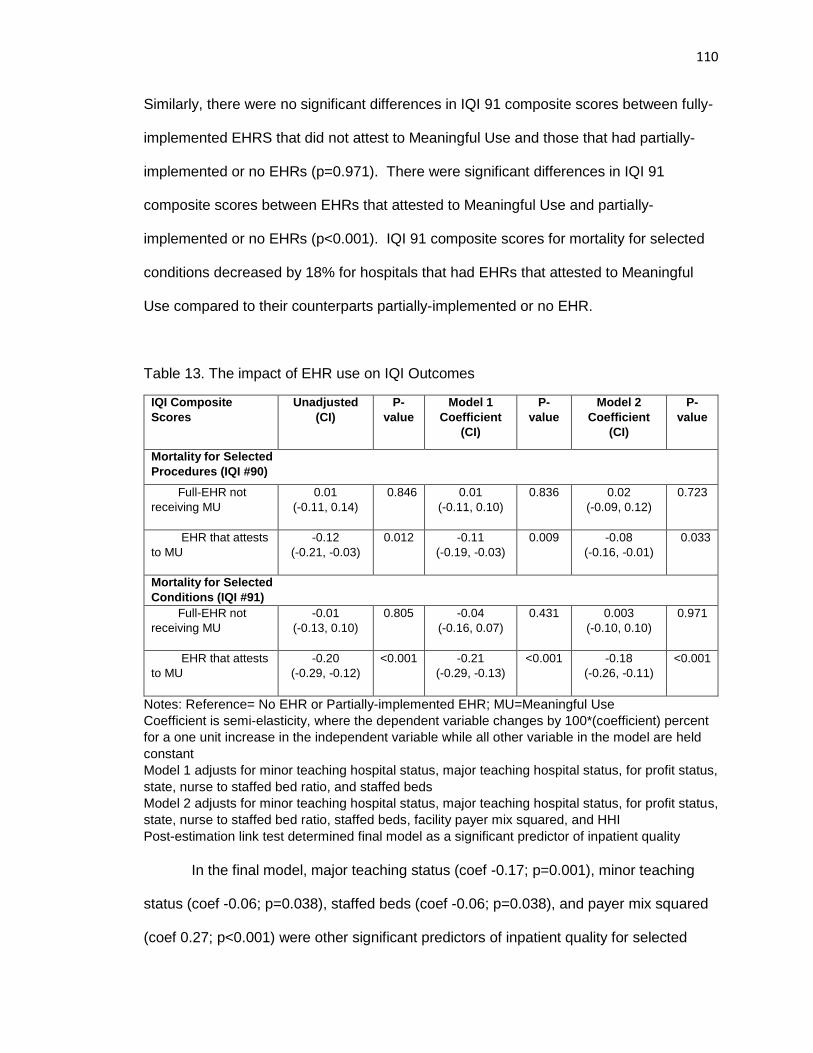
110
Similarly, there were no significant differences in IQI 91 composite scores between fully-
implemented EHRS that did not attest to Meaningful Use and those that had partially-
implemented or no EHRs (p=0.971). There were significant differences in IQI 91
composite scores between EHRs that attested to Meaningful Use and partially-
implemented or no EHRs (p<0.001). IQI 91 composite scores for mortality for selected
conditions decreased by 18% for hospitals that had EHRs that attested to Meaningful
Use compared to their counterparts partially-implemented or no EHR.
Table 13. The impact of EHR use on IQI Outcomes
IQI Composite
Scores
Unadjusted
(CI)
P-
value
Model 1
Coefficient
(CI)
P-
value
Model 2
Coefficient
(CI)
P-
value
Mortality for Selected
Procedures (IQI #90)
Full-EHR not
receiving MU
0.01
(-0.11, 0.14)
0.846 0.01
(-0.11, 0.10)
0.836 0.02
(-0.09, 0.12)
0.723
EHR that attests
to MU
-0.12
(-0.21, -0.03)
0.012 -0.11
(-0.19, -0.03)
0.009 -0.08
(-0.16, -0.01)
0.033
Mortality for Selected
Conditions (IQI #91)
Full-EHR not
receiving MU
-0.01
(-0.13, 0.10)
0.805 -0.04
(-0.16, 0.07)
0.431 0.003
(-0.10, 0.10)
0.971
EHR that attests
to MU
-0.20
(-0.29, -0.12)
<0.001 -0.21
(-0.29, -0.13)
<0.001 -0.18
(-0.26, -0.11)
<0.001
Notes: Reference= No EHR or Partially-implemented EHR; MU=Meaningful Use
Coefficient is semi-elasticity, where the dependent variable changes by 100*(coefficient) percent
for a one unit increase in the independent variable while all other variable in the model are held
constant
Model 1 adjusts for minor teaching hospital status, major teaching hospital status, for profit status,
state, nurse to staffed bed ratio, and staffed beds
Model 2 adjusts for minor teaching hospital status, major teaching hospital status, for profit status,
state, nurse to staffed bed ratio, staffed beds, facility payer mix squared, and HHI
Post-estimation link test determined final model as a significant predictor of inpatient quality
In the final model, major teaching status (coef -0.17; p=0.001), minor teaching
status (coef -0.06; p=0.038), staffed beds (coef -0.06; p=0.038), and payer mix squared
(coef 0.27; p<0.001) were other significant predictors of inpatient quality for selected
111
procedures (IQI 90). Additionally, the state was also a significant predictor where Florida
(coef -0.11; p<0.001) and Washington (coef -0.08; p=0.017) had significantly better
inpatient quality for IQI 90 composite scores compared to New York. In the final model,
major teaching status (coef 0.12; p=0.009), staffed beds (coef -0.0002; p<0.001), and
HHI (coef 0.12; p=0.004) were other significant predictors of inpatient quality for selected
conditions (IQI 91). Additionally, the state was also a significant predictor where Florida
(coef -0.23; p<0.001) and Washington (coef -0.09; p=0.008) had significantly better
inpatient quality for IQI 91 composite scores compared to New York.
DISCUSSION
Section 1886 of the Social Security Act states, “The Secretary shall seek to
improve the use of electronic health records and health care quality over time by
requiring more stringent measures of meaningful use.” However, it is unclear if inpatient
quality of care has been positively impacted by the use of EHRs and the Meaningful Use
program given the current state of the literature (Jones, et al, 2014). Both IQI composite
scores 90 and 91 are used for quality reporting measures under Centers for Medicare
and Medicaid Services (CMS) program to achieve aims described in the Section 1886 of
the Social Security Act. The composite scores were used under the Reporting Hospital
Quality Data for Acute Payment Update (RHQDAPU) program by CMS, currently known
as Hospital Inpatient Quality Reporting (IQR) Program (AHRQ, February 2010). The
RHQDAPU was adopted with aims to move toward implementing value-based
purchasing to incorporate quality into payment. Under the program, hospitals receive
financial incentive to report the quality of care metrics, and provides CMS with data to
help consumers make more informed decisions about their health care.
In this study, we found that hospitals that have EHRs that attest to Meaningful
Use have significantly better inpatient quality for IQI 90 (mortality for selected
112
procedures) and 91 (mortality for selected conditions) composite, with a 8% decrease in
IQI 90 composite scores and 18% decrease in IQI 91 in composite scores compared to
hospitals with partially-implemented or no EHR. Based on constructs of the RDT, the
Meaningful Use incentives may be providing the additional financial support needed to
overcome challenges related to EHR use and adoption in order to see improvements in
quality, including technical support, staff training, workflow disruption, and purchase
more advanced functionalities. This evidence suggests that in 2013 the Meaningful Use
objectives set by the CMS in the government incentive program has improved inpatient
quality related to mortality and procedures for selected conditions. This is consistent
with other research, where one study found a significant association between EHR use
and inpatient quality for conditions (IQI 91) among large hospitals, but not for mortality
for selected procedures (IQI 90) (Michell and Yaylacicegi, 2012). However, this study
was a single state study with relative small sample size conducted only among Texas
acute care hospitals. Furthermore, they did not classify EHR status by the ability of the
system to attest to Meaningful Use. From our results, hospitals that do not attest to
Meaningful Use may not observe the same significant gains in inpatient quality.
Furthermore, there we Meaningful use had smaller effect among mortality for selected
procedures (IQI 90) composite scores compared to inpatient quality for conditions (IQI
91) composite scores. Our study helps provide insight of the impact of hospitals attesting
to Meaningful Use with their EHRs. Future studies should determine which Meaningful
Use objectives are associated with higher quality of care to help tailor and prioritize
Meaningful Use objectives for providers, as it has been a challenge for hospitals to
achieve Stage 2 Meaningful Use.
Studying IQI composite scores has strengthened our study in several ways.
First, by combining multiple indicators allows researchers to detect the impact of EHRs
113
on the overall inpatient quality of care, and determine the differences between the
inpatient quality of care between hospitals with varied EHR use. Using individual
indicators may not be able to provide enough discrimination in performance of hospitals
as compared to combining the indicators in the composite scores (AHRQ 2008). In our
preliminary analysis, we were not able to detect any variation among individual
indicators, because mortality outcomes are rare. In order to detect differences in
individual indicators, national samples are needed to increase the sample size. Second,
the composite scores are comprised of weighed indicators based on the probability for
each condition, and offers greater reliability by providing information to maximize the
outcomes for the population (AHRQ 2008; NQF, 2009).
Among our study sample, the mean IQI 91 score for mortality for selected
conditions was 0.73 for hospitals that attest to Meaningful Use compared to a mean of
0.89 for hospitals with partially-implemented or no EHR, indicating better inpatient quality
than the national average. The composite scores are a weighted average of the
component measures expressed as a ratio to the reference population rate. For an
example, a providers with a composite score of 1 will have risk adjusted component
scores that are the same as the reference population, indicating that the provider’s
inpatient quality is not different from the national average. However, if a provider has a
composite score below 1, then provider is doing better than the national average for
inpatient quality. Our estimates may provide as a reference for providers regarding IQI
composite measures, where hospitals that attested to Meaningful Use with their EHRs
had an average IQI 91 score of 0.73 and IQI 90 of 0.79 in our sample. Policymakers
might need to set policy priorities in order to improve population health through research
studying the impact of Meaningful Use on quality of care with composite measures. For
example, national studies are needed to determine the benchmarks for the IQI
114
composite measures with the use of EHRs, which may be linked to reimbursement. This
study validates that Meaningful Use of EHRs may be an important driver related to
quality of inpatient care, where the study suggests the national investments in the
technology have had system-level improvements on inpatient quality. Although,
healthcare stakeholders may need to prioritize their actions for quality improvement in
order to leverage their EHRs to better improve IQI 90 composite score for mortality for
selected procedures, as we saw a lesser impact on IQI 90 compared to IQI 91.
Last, it should be warranted that hospitals that attest to Meaningful Use may
have become interdependent on the Meaningful Use incentives in order to secure
resources in supporting their EHR implementation and use efforts. This study has
demonstrated improvements in inpatient quality among hospitals that receive Meaningful
Use incentives. As the Meaningful Use program is eventually phased out, healthcare
stakeholders may experience unintended consequences that may negatively impact the
ability of hospitals to achieve improvements in outcomes with the use of their EHR
systems, especially as ongoing software updates, technical support infrastructure, and
staff training will still be needed. Future research should examine factors that require
ongoing support in order to fully utilize EHRs among hospitals that attest to Meaningful
Use in order to avoid negative unintended consequences in achieving gains in outcomes
after the term of the program, such as inpatient quality.
Limitations
Due to data availability, we have a relatively small sample size in the reference
group that included 32 hospitals. Furthermore, the sample size was also relatively small
in the EHR group with fully-implemented EHRs that did not attest to Meaningful Use
(n=30). We were unable to detect variance between specific indicators that contribute to
the significant differences in IQI composite scores, as mortality related events are rare
115
as compared to adverse events. However, it is difficult to determine differences in
quality of care by using single indicators (AHRQ, 2008). This study does provide insight
of the impact of Meaningful Use on overall inpatient quality. Future studies need to
include national samples of providers to determine the impact of EHR use on specific
quality indicators, where we found significant differences in IQI composite scores
between hospitals with varied EHR use. Second, we were not able to establish causality
due to the cross-sectional study design. Longitudinal studies are needed to determine
the impact of EHRs on quality of care regarding the change in regulations of the
Meaningful Use objectives and stages.
Our sample included significant differences between states and EHR use, where
72.3% of our sample was from the states of Florida and New York. Furthermore, there
may be a cluster effect at the state-level that was not accounted for in our study. After a
sensitivity analysis treating state as a cluster effect, there were no significant differences
observed in the IQI 91 scores (coef -0.21; p=0.093) for EHRs that attested to Meaningful
Use compared to partially-implemented or no EHR. Similarly, there were no significant
differences observed in the IQI 90 scores (coef -0.10; p=0.061) for EHRs that attested to
Meaningful Use compared to partially-implemented or no EHR. Using cluster effect for
the state in our GLM model may not be the most efficient way to account for this effect
resulting in an increased standard error. However, the state was accounted for in our
regression analysis and post-estimation link test determined our model to be a good
predictor of inpatient quality (p=0.520). Post-estimation link test also showed that
treating the state as a cluster effect in our GLM model was a significant predictor of
inpatient quality (p=0.385). Future studies should include larger samples at the state-
level to more accurately account for this fixed effect in studying the impact of inpatient
quality and EHR use.
116
CONCLUSION
To our knowledge, this is the first study to determine the impact of Meaningful
Use attestation on overall inpatient quality of care among hospitals in the United States.
Meaningful Use attestation may be an important driver related to inpatient quality. In this
study, we found that hospitals that have EHRs attesting to Meaningful Use have
significantly better inpatient quality for IQI 90 and IQI 91 composite scores, with a 8%
decrease composites for mortality for selected procedures and 18% decrease in
composites for mortality for selected conditions compared to hospitals with partially-
implemented or no EHR. Although, we did not observe significant differences in IQI
composite scores among hospitals with EHRs that did not attest to Meaningful Use with
their EHR systems. Policymakers should focus on setting priorities in order to improve
population health by studying the impact of Meaningful Use on quality of care with
composite measures, especially related to the IQI 91 composite score. More research is
needed to determine the Meaningful Use objectives that are associated with higher
inpatient quality.
117
BIBLIOGRAPHY
Adler-Milstein, J., DesRoches, C. M., Furukawa, M. F., Worzala, C., Charles, D.,
Kralovec, P., ... & Jha, A. K. (2014). More than half of US hospitals have at least a basic
EHR, but stage 2 criteria remain challenging for most. Health Affairs, 10-1377.
Adler-Milstein, J., Kvedar, J., & Bates, D. W. (2014). Telehealth among US hospitals:
several factors, including state reimbursement and licensure policies, influence adoption.
Health Affairs, 33(2), 207-215.
Adler-Milstein, J., Salzberg, C., Franz, C., Orav, E. J., & Bates, D. W. (2013). The Impact
of Electronic Health Records on Ambulatory Costs Among Medicaid Beneficiaries.
Medicare & Medicaid Research Review, 3(2).
Agency for Healthcare Research and Quality (AHRQ). (2008). Inpatient Quality
Indicators Composite Measure Workgroup. Agency for Healthcare Research and
Quality. Accessed: October 10, 2-16. Retrieved from:
http://www.qualityindicators.ahrq.gov/Downloads/Modules/IQI/IQI_Composite_Developm
ent.pdf.
Agency for Healthcare Research and Quality (AHRQ). (2011). AHRQ Quality Indicator:
National Quality Forum (NQF) Endorsed Composite and Individual Measures. Rockville,
MD: AHRQ.
Agency for Healthcare Research and Quality (AHRQ). (February 2010). AHRQ Quality
Indicators Computing Composites of the AHRQ QI Rates Under the RHQDAPU
Program. Available at:
http://qualityindicators.ahrq.gov/downloads/iqi/AHRQ_IQI_Workgroup_Final.pdf.
118
Agency for Healthcare Research and Quality. AHRQ Quality Indicators-Guide to
Inpatient Quality Indicators: Quality of Care in Hospitals-Volume, Mortality, and
Utilization, Version 3.1. Rockville, MD: Agency for Healthcare Research and Quality,
2007.
Agency for Healthcare Research and Quality (AHRQ). (2015). Patient Safety for
Selected Indicators Technical Specifications. Accessed: October 3, 2016. Retrieved
from:
http://www.qualityindicators.ahrq.gov/Downloads/Modules/PSI/V50/TechSpecs/PSI_90_
Patient_Safety_for_Selected_Indicators.pdf
Aiken, L. H., Clarke, S. P., Sloane, D. M., Sochalski, J., & Silber, J. H. (2002). Hospital
nurse staffing and patient mortality, nurse burnout, and job dissatisfaction. JAMA,
288(16), 1987-1993.
Amenta, E. (2005). State-Centered and Political Institutionalist Theory: Retrospect and
Prospect. In Handbook of Political Sociology: States, Civil Societies, and Globalization.
Ed. Janoski, R. Alford, A. Hicks, and M. A. Schwartz. New York, NY: Cambridge
University Press: 96–114.
Appari, A., Johnson, E. M., & Anthony, D. L. (2014). Information technology and hospital
patient safety: a cross-sectional study of US acute care hospitals. The American Journal
of Managed Care, 20(SP17), eSP39-eSP47.
Armstrong, K., Laschinger, H., & Wong, C. (2009). Workplace empowerment and
magnet hospital characteristics as predictors of patient safety climate. Journal of Nursing
Care Quality, 24(1), 55-62.
119
Arozullah, A. M., Khuri, S. F., Henderson, W. G., & Daley, J. (2001). Development and
validation of a multifactorial risk index for predicting postoperative pneumonia after major
noncardiac surgery. Annals of Internal Medicine, 135(10), 847-857.
Austrian, J. S., Adelman, J. S., Reissman, S. H., Cohen, H. W., & Billett, H. H. (2011).
The impact of the heparin-induced thrombocytopenia (HIT) computerized alert on
provider behaviors and patient outcomes. Journal of the American Medical Informatics
Association, 18(6), 783-788.
Baker, J. (2012). The technology–organization–environment framework. In Information
systems theory (pp. 231-245). Springer New York.
Barlow, S., Johnson, J., & Steck, J. (2003). The economic effect of implementing an
EMR in an outpatient clinical setting. Journal of Healthcare Information Management:
JHIM, 18(1), 46-51.
Baron, R. J., Fabens, E. L., Schiffman, M., & Wolf, E. (2005). Electronic health records:
just around the corner? Or over the cliff?. Annals of Internal Medicine, 143(3), 222-226.
Bell, B, Thornton, K. (2011). From promise to reality achieving the value of an EHR.
Healthcare Financial Management, 65(2), 51-56.
Bell, L. M., Grundmeier, R., Localio, R., Zorc, J., Fiks, A. G., Zhang, X., ... & Guevara, J.
P. (2010). Electronic health record–based decision support to improve asthma care: a
cluster-randomized trial. Pediatrics, 125(4), e770-e777.
Belletti, D., Zacker, C., & Mullins, C. D. (2010). Perspectives on electronic medical
records adoption: electronic medical records (EMR) in outcomes research. Patient Relat
Outcome Meas, 1, 29-37.
120
Bendix, J., Verdon, D. R., Ritchie, A., Marbury, D., & Mazzolini, C. (2013). Top 10
challenges facing physicians in 2014. Medical economics.
Bergqvist, D., Jendteg, S., Johansen, L., Persson, U., & Odegaard, K. (1997). Cost of
long-term complications of deep venous thrombosis of the lower extremities: an analysis
of a defined patient population in Sweden. Annals of Internal Medicine, 126(6), 454-457.
Black, A. D., Car, J., Pagliari, C., Anandan, C., Cresswell, K., Bokun, T., ... & Sheikh, A.
(2011). The impact of eHealth on the quality and safety of health care: a systematic
overview. PLoS Medicine, 8(1), e1000387.
Blumenthal, D., & Tavenner, M. (2010). The “meaningful use” regulation for electronic
health records. New England Journal of Medicine, 363(6), 501-504.
Boon, A. D. (2007). Telepharmacy at a critical access hospital. American journal of
health-system pharmacy: AJHP: official journal of the American Society of Health-
System Pharmacists, 64(3), 242.
Bourgeois, S., & Yaylacicegi, U. (2012). Electronic Health Records: Improving Patient
Safety and Quality of Care in Texas Acute Care Hospitals. In: Advancing Technologies
and Intelligence in Healthcare and Clinical Environments Breakthroughs, 18.
Brancheau, J.C. and Wetherbe, J.C. (1990). The Adoption of Spreadsheet Software:
Testing Innovation Diffusion Theory in the Context of End-User Computing. Information
Systems Research, 1(2), 115-143.
Bretschneider, S. (1990). Management Information Systems in Public and Private
Organizations: An Empirical Test. Public Administration Review, 50(5), 536-545.
121
Car J, Black A, Anandan C, Cresswell K, Pagliari C, et al. (2008) The impact of eHealth
on the quality and safety of healthcare. Available:
http://www.haps.bham.ac.uk/publichealth/cfhep/001.shtml.
Carrier, E., Gourevitch, M. N., & Shah, N. R. (2009). Medical homes: challenges in
translating theory into practice. Medical care, 47(7), 714.
Casalino, L. P., Gans, D., Weber, R., Cea, M., Tuchovsky, A., Bishop, T. F., ... &
Evenson, T. B. (2016). US physician practices spend more than $15.4 billion annually to
report quality measures. Health Affairs, 35(3), 401-406.
Casalino, L. P., Pham, H., & Bazzoli, G. (2004). Growth of single-specialty medical
groups. Health Affairs, 23(2), 82-90.
Centers for Medicare and Medicaid Services. (2012). National health expenditure
projections 2012–2022. Washington (DC). Accessed: July 20, 2016. Retrieved from:
http://www.cms.gov/Research-Statistics-Data-and-Systems/Statistics-Trendsand-
Reports/NationalHealthExpendData/downloads/proj2012.pdf
Chaudhry, B., Wang, J., Wu, S., Maglione, M., Mojica, W., Roth, E., ... & Shekelle, P. G.
(2006). Systematic review: impact of health information technology on quality, efficiency,
and costs of medical care. Annals of Internal Medicine, 144(10), 742-752.
Chen, C., Garrido, T., Chock, D., Okawa, G., & Liang, L. (2009). The Kaiser Permanente
Electronic Health Record: transforming and streamlining modalities of care. Health
Affairs, 28(2), 323-333.
Clemens, E.S. and Cook, J.M. (1999). Politics and Institutionalism: Explaining Durability
and Change. Annual Review of Sociology, 25,441–466.
122
Cochran MB, Snyder RR, Thomas E, Freeman DH, Hankins GD. (2011). Implementation
of Health Information Technology to Maximize Efficiency of Resource Utilization in a
Geographically Dispersed Prenatal Care Delivery System. American Journal of
Perinatology, Epub 2011/08/03.
Coffey R, Barrett, M, Houchens R, Moy E, Andrews R, Moles E, Coenen N. (2013).
Methods Applying AHRQ Quality Indicators to Healthcare Cost and Utilization Project
(HCUP) Data for the Eleventh National Healthcare Quality Report (NHQR) and National
Healthcare Disparities Report (NHDR). HCUP Methods Series Report #2012-03.
ONLINE November 12, 2012. U.S. Agency for Healthcare Research and Quality.
Accessed: July 6, 2016. Retreived from: http://www.hcup-
us.ahrq.gov/reports/methods/methods.jsp.
Connelly DP, Park YT, Du J, Theera-Ampornpunt N, Gordon BD, Bershow BA, et al.
(2012). The impact of electronic health records on care of heart failure patients in the
emergency room. Journal of the American Medical Informatics Association, 19(3), 334-
40. Epub 2011/11/11.
Cook PP, Rizzo S, Gooch M, Jordan M, Fang X, Hudson S. (2011). Sustained reduction
in antimicrobial use and decrease in methicillin-resistant Staphylococcus aureus and
Clostridium difficile infections following implementation of an electronic medical record at
a tertiary-care teaching hospital. Journal of Antimicrobial Chemotherapy, 66(1), 205-9.
Cooper, R. and Zmud, R. (1990). Information Technology Implementation: A
Technological Diffusion Approach. Management Science, 36(2), 156-172.
Cutler, D. M., & Morton, F. S. (2013). Hospitals, market share, and consolidation. JAMA,
310(18), 1964-1970.
123
Cutler, D.M., et al. (2006). The value of medical spending in the Unitied States, 1960-
2000. The New England Journal of Medicine, 335(9), 920-927.
Dall, T. M., Gallo, P. D., Chakrabarti, R., West, T., Semilla, A. P., & Storm, M. V. (2013).
An aging population and growing disease burden will require alarge and specialized
health care workforce by 2025. Health Affairs, 32(11).
Deily, M. E., Hu, T., Terrizzi, S., Chou, S. Y., & Meyerhoefer, C. D. (2013). The impact of
health information technology adoption by outpatient facilities on pregnancy outcomes.
Health Services Research, 48(1), 70-94.
DesRoches, C. M., Charles, D., Furukawa, M. F., Joshi, M. S., Kralovec, P., Mostashari,
F., ... & Jha, A. K. (2013). Adoption of electronic health records grows rapidly, but fewer
than half of US hospitals had at least a basic system in 2012. Health Affairs, 10-1377.
DesRoches, C. M., Charles, D., Furukawa, M. F., Joshi, M. S., Kralovec, P., Mostashari,
F., ... & Jha, A. K. (2013). Adoption of electronic health records grows rapidly, but fewer
than half of US hospitals had at least a basic system in 2012. Health Affairs, 10-1377.
DiMaggio, P. J., & Powell, W. W. (1983). The iron cage revisited: Institutional
isomorphism and collective rationality in organizational. American Sociological Review,
48(2), 147-160.
Doeksen, G. A., Clair, C. F. S., & Eilrich, F. C. (2012). The Economic Impact of a Critical
Access Hospital on a Rural Community. National Center for Rural Health Works (www.
ruralhealthworks. org).
Donabedian A. (2003). An Introduction to Quality Assurance in Health Care. New York,
NY: Oxford University Press.
124
Dowding DW, Turley M, Garrido T. (2012). The impact of an electronic health record on
nurse sensitive patient outcomes: an interrupted time series analysis. Journal of the
American Medical Informatics Association, 19(4), 615-20. Epub 2011/12/17.
Duffy, R. L., Yiu, S. S., Molokhia, E., Walker, R., & Perkins, R. A. (2010). Effects of
electronic prescribing on the clinical practice of a family medicine residency. Family
Medicine Journal, 42(5), 358-63.
El-Jardali, F., Jamal, D., Dimassi, H., Ammar, W., & Tchaghchaghian, V. (2008). The
impact of hospital accreditation on quality of care: perception of Lebanese nurses.
International Journal for Quality in Health Care, 20(5), 363-371.
Falck, S., Adimadhyam, S., Meltzer, D. O., Walton, S. M., & Galanter, W. L. (2013). A
trial of indication based prescribing of antihypertensive medications during computerized
order entry to improve problem list documentation. International Journal of Medical
Informatics, 82(10), 996-1003.
Federal Register. (2015). Subpart B—Standards and Implementation Specifications for
Health Information Technology. 75 FR 44649, July 28, 2010 Revisions: 80 FR 62745,
Oct. 16, 2015.
Fichman, R.G. (1992). Information Technology Diffusion: A Review of Empirical
Research. Proceedings of the Twelfth International Conference on Information Systems,
Dallas TX, pp.195-206.
Friedberg, M. W., Chen, P. G., Aunon, F. M., Van Busum, K. R., Pham, C., Caloyeras, J.
P., ... & Crosson, F. J. (2013). Factors affecting physician professional satisfaction and
their implications for patient care, health systems, and health policy. Rand Corporation.
Retrieved from: http://www.rand.org/pubs/research_reports/RR439.html
125
Furukawa MF. (2011). Electronic medical records and efficiency and productivity during
office visits. American Journal of Managed Care, 17(4), 296-303. Epub 2011/05/28.
Furukawa, Michael F., Noel Eldridge, Yun Wang, and Mark Metersky. (2016) Electronic
Health Record Adoption and Rates of In-hospital Adverse Events. Journal of Patient
Safety. (Ahead of Print)
Gabriel, M. H., Jones, E. B., Samy, L., & King, J. (2014). Progress and challenges:
implementation and use of health information technology among critical-access
hospitals. Health Affairs, 33(7), 1262-1270.
Gabriel, M. H., Jones, E. B., Samy, L., & King, J. (2014). Progress and challenges:
implementation and use of health information technology among critical-access
hospitals. Health Affairs, 33(7), 1262-1270.
Gantenbein, R. E., Robinson, B. J., Wolverton, R. L., & Earls, J. E. (2011, October).
Developing Telehealth in Rural America: The Wyoming Network for Telehealth. In Global
Humanitarian Technology Conference (GHTC), 2011 IEEE(pp. 366-370). IEEE.
Gardner, W., Mulvey, E. P., & Shaw, E. C. (1995). Regression analyses of counts and
rates: Poisson, overdispersed Poisson, and negative binomial models. Psychological
Bulletin, 118(3), 392.
Geppert, J., Rhoda, D., Morara, M. (2013). Quality Indicator Empirical Methods (Revised
by Battelle, under Contract No. HHSA290201200001C). Rockville, MD: Agency for
Healthcare Research and Quality. Accessed January 13, 2016. Retrieved from:
http://www.qualityindicators.ahrq.gov/Downloads/Resources/Publications/2013/Empirical
_Methods_r.pdf
126
Goldhaber, S. Z., & Bounameaux, H. (2012). Pulmonary embolism and deep vein
thrombosis. The Lancet, 379(9828), 1835-1846.
Goodrick, E., & Salancik, G. R. (1996). Organizational discretion in responding to
institutional practices: Hospitals and cesarean births. Administrative Science Quarterly,
1-28.
Grabowski, D. C. (2001). Does an increase in the Medicaid reimbursement rate improve
nursing home quality?. The Journals of Gerontology Series B: Psychological Sciences
and Social Sciences, 56(2), S84-S93.
Grossmann, C., Goolsby, W. A., Olsen, L., & McGinnis, J. M. (Eds.). (2011). Chapter 3
Healthcare System Complexities, Impediments, and Failures. In: Engineering a Learning
Healthcare System: A Look at the Future: Workshop Summary. National Academies
Press.
Gustafson D, Wise M, Bhattacharya A, Pulvermacher A, Shanovich K, Phillips B, et al.
(2012). The effects of combining Web-based eHealth with telephone nurse case
management for pediatric asthma control: a randomized controlled trial. Journal of
Medical Internet Research, 14(4), e101. Epub 2012/07/28.
Hajjar, I., Kotchen, J. M., & Kotchen, T. A. (2006). Hypertension: trends in prevalence,
incidence, and control. Annu. Rev. Public Health, 27, 465-490.
Health Resources and Services Administration. (2010). The physician workforce:
projections and research into current issues affecting supply and demand. Rockville
(MD): HRSA.
Heit, J. A., O'Fallon, W. M., Petterson, T. M., Lohse, C. M., Silverstein, M. D., Mohr, D.
N., & Melton, L. J. (2002). Relative impact of risk factors for deep vein thrombosis and
127
pulmonary embolism: a population-based study. Archives of Internal Medicine, 162(11),
1245-1248.
Heit, J. A., Silverstein, M. D., Mohr, D. N., Petterson, T. M., O'Fallon, W. M., & Melton, L.
J. (1999). Predictors of survival after deep vein thrombosis and pulmonary embolism: a
population-based, cohort study. Archives of Internal Medicine, 159(5), 445-453.
Higgins C, Dunn E, Conrath D (1984). Telemedicine: an historical perspective.
Telecommunications Policy, (8), 307-313.
Henry, J., Pylypchuk, Y., Searcy T. & Patel V. (May 2016). Adoption of Electronic Health
Record Systems among U.S. Non-Federal Acute Care Hospitals: 2008-2015. ONC Data
Brief, no.35. Office of the National Coordinator for Health Information Technology:
Washington DC.
Himmelstein, D. U., Wright, A., & Woolhandler, S. (2010). Hospital computing and the
costs and quality of care: a national study. The American Journal of Medicine, 123(1),
40-46.
Hing, Esther, and Schappert, Susan. (2012). Generalist and Specialty Physicians:
Supply and Access, 2009–2010. NCHS Data Brief: No 105.
Hogan, R. W., & Mattison, J. (1993). Toward the electronic medical record: in pursuit of
an electronic Holy Grail in a cost conscious era. HMO practice/HMO Group, 7(2), 54-55.
Holbrook A, Pullenayegum E, Thabane L, Troyan S, Foster G, Keshavjee K, et al.
(2011). Shared electronic vascular risk decision support in primary care:
Computerization of Medical Practices for the Enhancement of Therapeutic Effectiveness
(COMPETE III) randomized trial. Archives of Internal Medicine, 171(19),1736-44.
128
Hollingworth, W., Devine, E. B., Hansen, R. N., Lawless, N. M., Comstock, B. A., Wilson-
Norton, J. L., ... & Sullivan, S. D. (2007). The impact of e-prescribing on prescriber and
staff time in ambulatory care clinics: a time–motion study. Journal of the American
Medical Informatics Association, 14(6), 722-730.
Holt TA, Thorogood M, Griffiths F, Munday S, Friede T, Stables D. (2010). Automated
electronic reminders to facilitate primary cardiovasculardisease prevention: randomised
controlled trial. British Journal of General Practice, 60(573), e137-43. Epub 2010/04/01.
Holt, J., Warsy, A., & Wright, P. (2010). Medical decision making: guide to improved
CPT coding. Journal of Southern Medical Association, 103(4), 316-2.
Huang, E., Angela Chang, C. C., & Khurana, P. (2012). Users' preferred interactive e-
health tools on hospital web sites. International Journal of Pharmaceutical and
Healthcare Marketing, 6(3), 215-229.
Hufstader, M., Swain, M., and Furukawa, MF. (2012). State Variation in E-Prescribing
Trends in the United States. The Office of the National Coordinator for Health
Information Technology. ONC Data Brief, No. 4. Accessed July 14, 2016. Retrieved
from: https://www.healthit.gov/sites/default/files/us_e-
prescribingtrends_onc_brief_4_nov2012.pdf.
Iezzoni, L. I., Daley, J., Heeren, T., Foley, S. M., Fisher, E. S., Duncan, C., et al. (1994).
Identifying complications of care using administrative data. Medical Care, 32, 700-715.
ISO/IEC. (2010). International standard 9241-210: Ergonomics of human–system
interaction, Part 210: Human-centered design for interactive systems. Ed ISOIEC
129
Jamoom, E., Patel, V., King, J., & Furukawa, M. (2012, August). National perceptions of
ehr adoption: Barriers, impacts, and federal policies. National conference on health
statistics.
Jha, A., & Epstein, A. (2010). Hospital governance and the quality of care. Health Affairs,
29(1), 182-187.
Jones SS, Friedberg MW, Schneider EC. (2011). Health information exchange, Health
Information Technology use, and hospital readmission rates. AMIA Annual Symposium
Proceedings.
Jones SS, Heaton P, Friedberg MW, Schneider EC. (2011a). Today's 'meaningful use'
standard for medication orders by hospitals may save few lives; later stages may do
more. Health Affairs (Millwood), 30(10), 2005-12. Epub 2011/09/16.
Jones, S. S., Rudin, R. S., Perry, T., & Shekelle, P. G. (2014). Health information
technology: an updated systematic review with a focus on meaningful use. Annals of
Internal Medicine, 160(1), 48-54.
Kaafarani, H. M., Borzecki, A. M., Itani, K. M., Loveland, S., Mull, H. J., Hickson, K., ... &
Rosen, A. K. (2011). Validity of selected patient safety indicators: opportunities and
concerns. Journal of the American College of Surgeons, 212(6), 924-934.
Keely, E., Liddy, C., & Afkham, A. (2013). Utilization, benefits, and impact of an e-
consultation service across diverse specialties and primary care providers. Telemedicine
and e-Health, 19(10), 733-738.
Kern, L. M., Barrón, Y., Dhopeshwarkar, R. V., Edwards, A., Kaushal, R., & with the
HITEC Investigators. (2013). Electronic health records and ambulatory quality of care.
Journal of General Internal Medicine, 28(4), 496-503.
130
Ketcham, J. D., Baker, L. C., & MacIsaac, D. (2007). Physician practice size and
variations in treatments and outcomes: evidence from Medicare patients with AMI.
Health Affairs, 26(1), 195-205.
Ketikidis, P., Dimitrovski, T., Lazuras, L., & Bath, P. A. (2012). Acceptance of health
information technology in health professionals: An application of the revised technology
acceptance model. Health Informatics Journal, 18(2), 124-134.
Kumar, S., & Bauer, K. (2011). The business case for implementing electronic health
records in primary care settings in the United States. Journal of Revenue and Pricing
Management, 10(2), 119-131.
Kvedar, J., Coye, M. J., & Everett, W. (2014). Connected health: A review of
technologies and strategies to improve patient care with telemedicine and telehealth.
Health Affairs, 33(2), 194-199.
Lakshminarayan K, Rostambeigi N, Fuller CC, Peacock JM, Tsai AW. (2012). Impact of
an electronic medical record-based clinical decision support tool for Dysphagia
screening on care quality. Stroke, 43(12), 3399-401.011:644-53. Epub 2011/12/24.
Lapane KL, Hughes CM, Daiello LA, Cameron KA, Feinberg J. (2011). Effect of a
pharmacist-led multicomponent intervention focusing on the medication monitoring
phase to prevent potential adverse drug events in nursing homes. Journal of the
American Geriatric Society, 59(7), 1238-45.
Lavigne JV, Dulcan MK, LeBailly SA, Binns HJ, Cummins TK, Jha P. (2011). Computer-
assisted management of attention-deficit/hyperactivity disorder. Pediatrics, 128(1), e46-
53. Epub 2011/06/15.
131
Lawrence, V. A., Cornell, J. E., & Smetana, G. W. (2006). Strategies to reduce
postoperative pulmonary complications after noncardiothoracic surgery: systematic
review for the American College of Physicians. Annals of internal medicine, 144(8), 596-
608.
Lehrman, W. G., Elliott, M. N., Goldstein, E., Beckett, M. K., Klein, D. J., & Giordano, L.
A. (2010). Characteristics of hospitals demonstrating superior performance in patient
experience and clinical process measures of care. Medical Care Research and Review,
67(1), 38-55.
Lewis, J. B., & Linzer, D. A. (2005). Estimating regression models in which the
dependent variable is based on estimates. Political Analysis, 13(4), 345-364.
Lewis, S. (2009). Patient-centered care: an introduction to what it is and how to achieve
it. Saskatchewan Ministry of Health. Accessed October 3, 2016. Retrieved from:
http://www.southeastlhin.on.ca/~/media/sites/se/uploadedfiles/Public_Community/Board
_of_Directors/Board_Committee/Collaborative_Governance_and_Community_Engagem
ent/Ppatient-Centred-Care%20Steven%20Lewis%202009.pdf.
Liebhaber A, Grossman JM. (2007). Physicians moving to mid-sized, single-specialty
practices [Internet]. Washington (DC): Center for Studying Health System Change.
(Tracking Report No. 18).
Mayhew, D.J. (1999). The usability engineering life cycle: a practitioner's handbook for
user interface design. Ed. Morgan-Kaufmann
Mazars N, Milesi C, Carbajal R, Mesnage R, Combes C, Rideau Batista Novais A, et al.
(2012). Implementation of a neonatal pain management module in the computerized
physician order entry system. Annals of Intensive Care, 2(1), 38.
132
Medical Group Management Association. (2011). Physician placement starting salary
survey: 2010 survey based on 2009 data. Englewood (CO): MGMA.
Memel DS, Scott JP, McMillan DR, Easton SM, Donelson SM, Compbell G, et al. (2001).
Development and implementation of an information management and information
technology strategy for improving healthcare services: a case study. Journal of Health
Information Mangement, 15(3), 261–85.
Milani RV, Oleck SA, Lavie CJ. (2011). Medication errors in patients with severe chronic
kidney disease and acute coronary syndrome: the impact of computer-assisted decision
support. Mayo Clinic Proceedings, 86(12), 1161-4. Epub 2011/12/03.
Miller, R. H., & Sim, I. (2004). Physicians’ use of electronic medical records: barriers and
solutions. Health affairs, 23(2), 116-126.
Miller, R. H., Sim, I., & Newman, J. (2003). Electronic medical records in solo/small
groups: a qualitative study of physician user types. Studies in Health Technology and
Informatics, 107(Pt 1), 658-662.
Miller, R. H., West, C., Brown, T. M., Sim, I., & Ganchoff, C. (2005). The value of
electronic health records in solo or small group practices. Health Affairs, 24(5), 1127-
1137.
Minshall S. (2013). A review of healthcare information system usability and safety. Stud
Studies in Health Technology and Informatics, 183, 151-6.
Mitchell, S., & Yaylacicegi, U. (2012). EHR prescription for small, medium, and large
hospitals: an exploratory study of Texas acute care hospitals. International Journal of
Electronic Healthcare, 7(2), 125-140.
133
Montana Department of Public Health and Human Services (DPHHS). (2015). Children’s
Health Insurance Plan. Accessed July 18, 2016. Retrieved from:
http://chip.mt.gov/index.html.
Mueller, K. J., Potter, A. J., MacKinney, A. C., & Ward, M. M. (2014). Lessons From
Tele-Emergency: Improving Care Quality And Health Outcomes By Expanding Support
For Rural Care Systems. Health Affairs, 33(2), 228-234.
Mutter, R. L., Wong, H. S., & Goldfarb, M. G. (2008). The effects of hospital competition
on inpatient quality of care. INQUIRY: The Journal of Health Care Organization,
Provision, and Financing, 45(3), 263-279.
National Quality Forum (NQF). (2009). Composite Measure Evaluation Framework and
National Voluntary Consensus Standards for Mortality and Safety— Composite
Measures: A Consensus Report. Washington, DC: NQF.
Neafsey PJ, M'Lan C E, Ge M, Walsh SJ, Lin CA, Anderson E. (2011). Reducing
Adverse Self-Medication Behaviors in Older Adults with Hypertension: Results of an e-
health Clinical Efficacy Trial. Ageing International, 36(2), 159-91. Epub 2011/06/10.
O'Connor PJ, Sperl-Hillen JM, Rush WA, Johnson PE, Amundson GH, Asche SE, et al.
(2011). Impact of electronic health record clinical decision support on diabetes care: a
randomized trial. The Annals of Family Medicine, 9(1), 12-21. Epub 2011/01/19.
Oliver. (1997). Sustainable competitive advantage: Combining institutional and resource-
based views. Strategic Management Journal, 18, (9)697–713.
Pfeffer, J., & Salancik, G. R. (2003). The external control of organizations: A resource
dependence perspective. 2nd ed. Stanford, CA: Stanford University Press.
134
Pizziferri, L., Kittler, A. F., Volk, L. A., Honour, M. M., Gupta, S., Wang, S., ... & Bates, D.
W. (2005). Primary care physician time utilization before and after implementation of an
electronic health record: a time-motion study. Journal of Biomedical Informatics, 38(3),
176-188.
Preffer, J., & Salancik, G. (1978). The external control of organizations: a resource
dependence perspective. York: Harper and Row.
Propper, C., Burgess, S., & Green, K. (2004). Does competition between hospitals
improve the quality of care?: Hospital death rates and the NHS internal market. Journal
of Public Economics, 88(7), 1247-1272.
Quinn CC, Shardell MD, Terrin ML, Barr EA, Ballew SH, Gruber-Baldini AL. (2011).
Cluster-randomized trial of a mobile phone personalized behavioral intervention for
blood glucose control. Diabetes Care, 34(9), 1934-42. Epub 2011/07/27.
Rivard, P. E., Elixhauser, A., Christiansen, C. L., Zhao, S., & Rosen, A. K. (2010).
Testing the association between patient safety indicators and hospital structural
characteristics in VA and nonfederal hospitals. Medical Care Research and Review,
67(3), 321-341.
Roberge, C. M. (2012). Who stays in rural nursing practice? An international review of
the literature on factors influencing rural nurse retention. Online Journal of Rural Nursing
and Health Care, 9(1), 82-93.
Roberge, C. M., & Lavoie, J. G. (2012). Who Stays in Rural Practice?: An Internatinal
Review of the Literature on Factors Influencing Rural Nurse Retention. Online Journal of
Rural Nursing and Health Care, 8(2), 42-53.

135
Rosson, M.B., Carroll, J.M. (2002). Usability engineering: scenario-based development
of human–computer interaction. CA: Morgan-Kaufmann
Sax, H., & Pittet, D. (2002). Interhospital differences in nosocomial infection rates:
Importance of case-mix adjustment. Archives of Internal Medicine, 162, 2437-2442.
Scanlon, M.C., Harris, J.M. 2nd, Levy, F., Sedman, A.. (2008). Evaluation of the Agency
for Healthcare Research and Quality Pediatric Quality Indicators. Pediatrics. 121:
e1723–e1731.
Schade, C. P., Sullivan, F. M., De Lusignan, S., & Madeley, J. (2006). e-Prescribing,
efficiency, quality: lessons from the computerization of UK family practice. Journal of the
American Medical Informatics Association, 13(5), 470-475.
Schenarts PJ, Goettler CE, White MA, Waibel BH.(2012). An objective study of the
impact of the electronic medical record on outcomes in trauma patients. The American
Journal of Surgery, 78(11), 1249-54.
Scott, W.R. (1987). The adolescence of institutional theory. Administrative Science
Quarterly, 32, 493–511.
Scott, W.R. (1995). Institutions and Organizations. Thousand Oaks, CA: Sage.
Shelley D, Tseng TY, Matthews AG, Wu D, Ferrari P, Cohen A, et al. (2011).
Technology-driven intervention to improve hypertension outcomes in community health
centers. American Journal of Managed Care, 17(12 Spec No.), SP103-10. Epub
2012/06/27.
Shore, J. H., Brooks, E., Savin, D. M., Manson, S. M., & Libby, A. M. (2007). An
economic evaluation of telehealth data collection with rural populations. Psychiatric
Services, 58(6), 830-835.
136
Shortell, S. M., & LoGerfo, J. P. (1981). Hospital medical staff organization and quality of
care: results for myocardial infarction and appendectomy. Medical care, 1041-1055.
Singer, S., Lin, S., Falwell, A., Gaba, D., & Baker, L. (2009). Relationship of safety
climate and safety performance in hospitals. Health Services Research, 44(2p1), 399-
421.
Slonim, A. D., Marcin, J. P., Turenne, W., Hall, M., & Joseph, J. G. (2007). Pediatric
patient safety events during hospitalization: approaches to accounting for institution-level
effects. Health Services Research, 42, 2275-2293.
Smith, R. B., Cheung, R., Owens, P., Wilson, R. M., & Simpson, L. (2007). Medicaid
markets and pediatric patient safety in hospitals. Health Services Research, 42, 1981-
1998.
Steventon, A., Bardsley, M., Billings, J., Dixon, J., Doll, H., Hirani, S., ... & Newman, S.
(2012). Effect of telehealth on use of secondary care and mortality: findings from the
Whole System Demonstrator cluster randomised trial. BMJ: British Medical Journal, 344.
Stone D., Jarrett C., Woodroffe M., Minocha, S. (2005). User interface design and
evaluation. Ed. Morgan-Kaufmann.
Suchman, Mark C. (1995). Localism and globalism in institutional analysis: The
emergence of contractual norms in venture finance. In The Institutional Construction of
Organizations: International and Longitudinal Studies, 39-63, W. Richard Scott, and
Soren Christensen, ed. Thousand Oaks, CA: Sage.
Tan, F.B. & G. Gunasekara, (1999). Managing Health Information Management In New
Zealand: An Analysis Of The Health Information Privacy Principles. Journal Of
International Information Management, 8(1), 39-50.
137
Tang PC, Overhage JM, Chan AS, Brown NL, Aghighi B, Entwistle MP, et al. (2012).
Online disease management of diabetes: Engaging and Motivating Patients Online With
Enhanced Resources-Diabetes (EMPOWER-D), a randomized controlled trial. Journal of
the American Medical Informatics Association. doi: 10.1136/amiajnl-2012-001263.
Tenforde M, Nowacki A, Jain A, Hickner J. (2012). The association between personal
health record use and diabetes quality measures. Journal of General Internal Medicine,
27(4), 420-4. Epub 2011/10/19.
The Office of the National Coordinator for Health Information Technology (ONC). (2016).
ONC Health IT Certification Program: Enhanced Oversight and Accountability” Proposed
Rule. Accessed at: http://www.healthit.gov/policy-researchers-implementers/standards-
and-certification-regulations.
Tietze, M. F., Williams, J., & Galimbertti, M. (2009). Rural hospital information
technology implementation for safety and quality improvement: lessons learned.
Computers Informatics Nursing, 27(4), 206-214.
Tornatzky, L.G. and Fleischer, M. (1990). The Process of Technological Innovation,
Lexington Books: Lexington, MA.
Utter, G. H., Cuny, J., Sama, P., Silver, M. R., Zrelak, P. A., Baron, R., ... & Romano, P.
S. (2010). Detection of postoperative respiratory failure: how predictive is the Agency for
Healthcare Research and Quality's Patient Safety Indicator?. Journal of the American
College of Surgeons, 211(3), 347-354.
Verdon, D. R. (2014). Medical Economics EHR survey probes physician angst about
adoption, use of technology: 2014 EHR Survey. Medical Economics. Retrieved from:
http://medicaleconomics.modernmedicine.com/medical-
138
economics/content/tags/ehr/slideshow-medical-economics-ehr-survey-probes-physician-
angst-abo.
Virga PH, Jin B, Thomas J, Virodov S. (2012). Electronic health information technology
as a tool for improving quality of care and health outcomes for HIV/AIDS patients.
International Journal of Medical Informatics, 81(10), e39-45. Epub 2012/08/15.
Wagner PJ, Dias J, Howard S, Kintziger KW, Hudson MF, Seol YH, et al. (2012).
Personal health records and hypertension control: a randomized trial. Journal of the
American Medical Informatics Association. Epub 2012/01/12.
Wang, T. J., & Vasan, R. S. (2005). Epidemiology of uncontrolled hypertension in the
United States. Circulation, 112(11), 1651-1662.
Weingart, S. N., Simchowitz, B., Shiman, L., Brouillard, D., Cyrulik, A., Davis, R. B., ... &
Spencer, J. (2009). Clinicians' assessments of electronic medication safety alerts in
ambulatory care. Archives of Internal Medicine, 169(17), 1627-1632.
Welch, W. P., Cuellar, A. E., Stearns, S. C., & Bindman, A. B. (2013). Proportion of
physicians in large group practices continued to grow in 2009–11. Health Affairs, 32(9),
1659-1666.
Wiljer D, Leonard KJ, Urowitz S, Apatu E, Massey C, Quartey NK, et al. (2010). The
anxious wait: assessing the impact of patient accessible EHRs for breast cancer
patients. BMC Medical Informatics and Decision Making, 10:46.
Williams EC, Lapham G, Achtmeyer CE, Volpp B, Kivlahan DR, Bradley KA. (2010). Use
of an electronic clinical reminder for brief alcohol counseling is associated with resolution
of unhealthy alcohol use at follow-up screening. Journal of General Internal Medicine, 25
Suppl 1:11-7. Epub 2010/01/28.
139
Yen PY, Bakken S. (2012). Review of health information technology usability study
methodologies. Journal of the American Medical Informatics Association, 19(3), 413-22.
Zaroukian, M. H., & Sierra, A. (2006). Benefiting from ambulatory EHR implementation:
solidarity, six sigma, and willingness to strive. Journal of healthcare information
management, 20(1), 53.
Zawada Jr, E. T., Herr, P., Larson, D., Fromm, R., Kapaska, D., & Erickson, D. (2009).
Impact of an intensive care unit telemedicine program on a rural health care system.
Postgraduate medicine, 121(3), 160-170.
Zhang, N. J., Seblega, B., Wan, T., Unruh, L., Agiro, A., & Miao, L. (2013). Health
information technology adoption in US acute care hospitals. Journal of medical systems,
37(2), 1-9.
Zweifel, P., & Manning, W. G. (2000). Moral hazard and consumer incentives in health
care. Handbook of health economics, 1, 409-459.
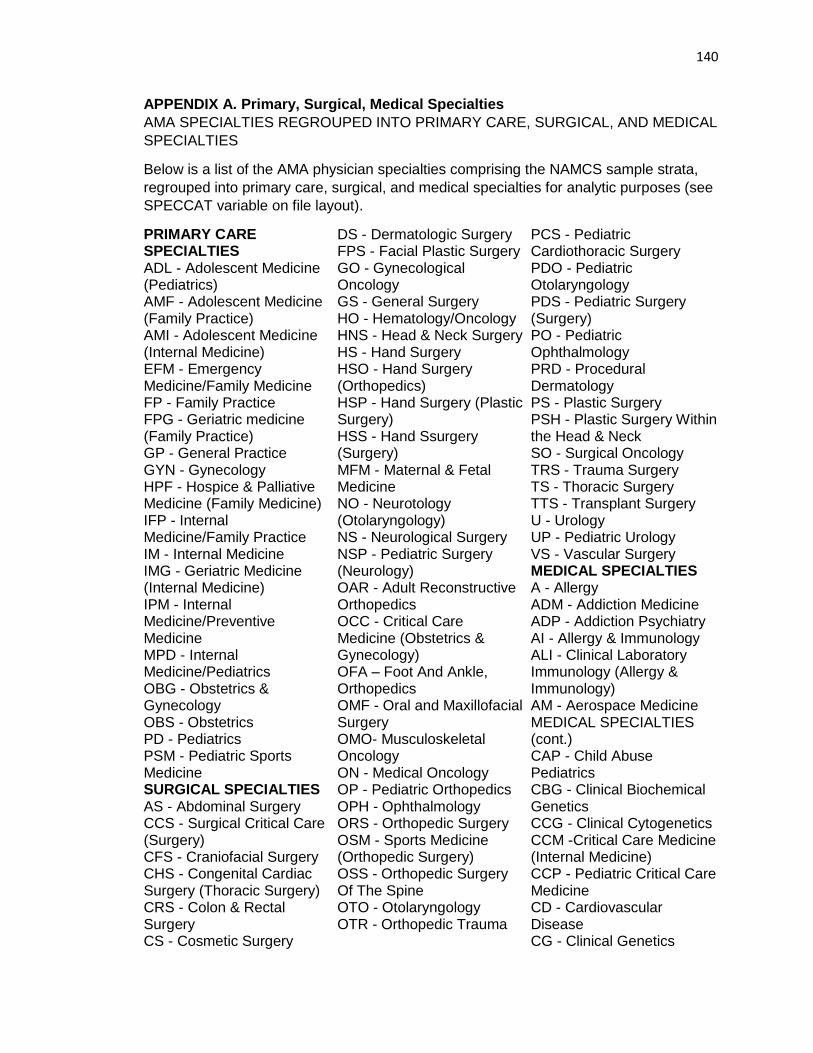
140
APPENDIX A. Primary, Surgical, Medical Specialties
AMA SPECIALTIES REGROUPED INTO PRIMARY CARE, SURGICAL, AND MEDICAL
SPECIALTIES
Below is a list of the AMA physician specialties comprising the NAMCS sample strata,
regrouped into primary care, surgical, and medical specialties for analytic purposes (see
SPECCAT variable on file layout).
PRIMARY CARE SPECIALTIES ADL - Adolescent Medicine (Pediatrics) AMF - Adolescent Medicine (Family Practice) AMI - Adolescent Medicine (Internal Medicine) EFM - Emergency Medicine/Family Medicine FP - Family Practice FPG - Geriatric medicine (Family Practice) GP - General Practice GYN - Gynecology HPF - Hospice & Palliative Medicine (Family Medicine) IFP - Internal Medicine/Family Practice IM - Internal Medicine IMG - Geriatric Medicine (Internal Medicine) IPM - Internal Medicine/Preventive Medicine MPD - Internal Medicine/Pediatrics OBG - Obstetrics & Gynecology OBS - Obstetrics PD - Pediatrics PSM - Pediatric Sports Medicine SURGICAL SPECIALTIES AS - Abdominal Surgery CCS - Surgical Critical Care (Surgery) CFS - Craniofacial Surgery CHS - Congenital Cardiac Surgery (Thoracic Surgery) CRS - Colon & Rectal Surgery CS - Cosmetic Surgery
DS - Dermatologic Surgery FPS - Facial Plastic Surgery GO - Gynecological Oncology GS - General Surgery HO - Hematology/Oncology HNS - Head & Neck Surgery HS - Hand Surgery HSO - Hand Surgery (Orthopedics) HSP - Hand Surgery (Plastic Surgery) HSS - Hand Ssurgery (Surgery) MFM - Maternal & Fetal Medicine NO - Neurotology (Otolaryngology) NS - Neurological Surgery NSP - Pediatric Surgery (Neurology) OAR - Adult Reconstructive Orthopedics OCC - Critical Care Medicine (Obstetrics & Gynecology) OFA – Foot And Ankle, Orthopedics OMF - Oral and Maxillofacial Surgery OMO- Musculoskeletal Oncology ON - Medical Oncology OP - Pediatric Orthopedics OPH - Ophthalmology ORS - Orthopedic Surgery OSM - Sports Medicine (Orthopedic Surgery) OSS - Orthopedic Surgery Of The Spine OTO - Otolaryngology OTR - Orthopedic Trauma
PCS - Pediatric Cardiothoracic Surgery PDO - Pediatric Otolaryngology PDS - Pediatric Surgery (Surgery) PO - Pediatric Ophthalmology PRD - Procedural Dermatology PS - Plastic Surgery PSH - Plastic Surgery Within the Head & Neck SO - Surgical Oncology TRS - Trauma Surgery TS - Thoracic Surgery TTS - Transplant Surgery U - Urology UP - Pediatric Urology VS - Vascular Surgery MEDICAL SPECIALTIES A - Allergy ADM - Addiction Medicine ADP - Addiction Psychiatry AI - Allergy & Immunology ALI - Clinical Laboratory Immunology (Allergy & Immunology) AM - Aerospace Medicine MEDICAL SPECIALTIES (cont.) CAP - Child Abuse Pediatrics CBG - Clinical Biochemical Genetics CCG - Clinical Cytogenetics CCM -Critical Care Medicine (Internal Medicine) CCP - Pediatric Critical Care Medicine CD - Cardiovascular Disease CG - Clinical Genetics

141
MEDICAL SPECIALTIES (continued) CHN - Child Neurology CHP - Child and Adolescent Psychiatry CMG -Clinical Molecular Genetics CN - Clinical Neurophysiology CPP - Pediatrics/Psychiatry/Child & Adolescent Psychiatry D - Dermatology DBP - Developmental-Behavioral Pediatrics DDL – Clinical And Lab Derm Immunology DIA - Diabetes EM - Emergency Medicine EMP - Pediatrics/Emergency Medicine END - Endocrinology, Diabetes and Metabolism EP - Epidemiology ESM - Sports Medicine (Emergency Medicine) ETX - Medical Toxicology (Emergency Medicine) FPP – Psychiatry/Family Practice FSM – Family Practice/Sports Medicine GE - Gastroenterology GPM -General Preventive Medicine HEM - Hematology (Internal Medicine) HEP - Hepatology HO - Hematology/Oncology HPE - Hospice & Palliative Medicine (Emergency Medicine) HPI - Hospice & Palliative Medicine (Internal Medicine) HPM - Hospice & Palliative Medicine HPR - Hospice & Palliative Medicine (Physical Medicine) IC - Interventional Cardiology
ICE - Clinical Cardiac Electrophysiology ID - Infectious Disease IEC - Internal Medicine/Emergency Medicine/ Critical Care Medicine IG - Immunology ILI - Clinical and Laboratory Immunology (Internal Medicine) IMD - Internal Medicine/Dermatology ISM – Internal Medicine – Sports Medicine LM - Legal Medicine MDM -Medical Management MEM- Internal Medicine/Emergency Medicine MG - Medical Genetics MN - Internal Medicine/Neurology MP - Internal Medicine/Psychiatry MPM - Internal Medicine/Physical Medicine And Rehabilitation N - Neurology NC - Nuclear Cardiology NDN - Neurodevelopmental Disabilities (Psychiatry & Neurology) NDP - Neurodevelopmental Disabilities (Pediatrics) NEP - Nephrology NMN – Neuromuscular Medicine NMP – Neuromuscular Medicine (Physician Medicine and Rehabilitation) NPM - Neonatal-Perinatal Medicine NRN - Neurology/Diagnostic Radiology/Neuroradiology NTR - Nutrition NUP - Neuropsychiatry OM - Occupational Medicine OMM - Osteopathic Manipulative Medicine ON - Medical Oncology
P - Psychiatry PA - Clinical Pharmacology PCC - Pulmonary Critical Care Medicine PDA - Pediatric Allergy PDC - Pediatric Cardiology PDD - Pediatric Ddermatology PDE - Pediatric Endocrinology PDI - Pediatric Infectious Diseases PDM - Pediatrics/Dermatology PDP - Pediatric Pulmonology PDT - Medical Toxicology (Pediatrics) PE - Pediatric Emergency Medicine (Emergency Medicine) PEM - Pediatric Emergency Medicine (Pediatrics) PFP - Forensic Psychiatry PG - Pediatric Gastroenterology PHL - Phlebology PHM - Pharmaceutical Medicine PHO - Pediatric Hematology/Oncology PHP - Public Health and General Preventive Medicine PLI - Clinical and Laboratory Immunology (Pediatrics) PLM - Palliative Medicine PM - Physical Medicine & Rehabilitation PMM - Pain Medicine PMN - Pain Medicine (Neurology) PMP - Pain Management (Physical Medicine & Rehabilitation) PN - Pediatric Nephrology PPM - Pediatrics/Physical Medicine & Rehabilitation PPN - Pain Medicine (Psychiatry)
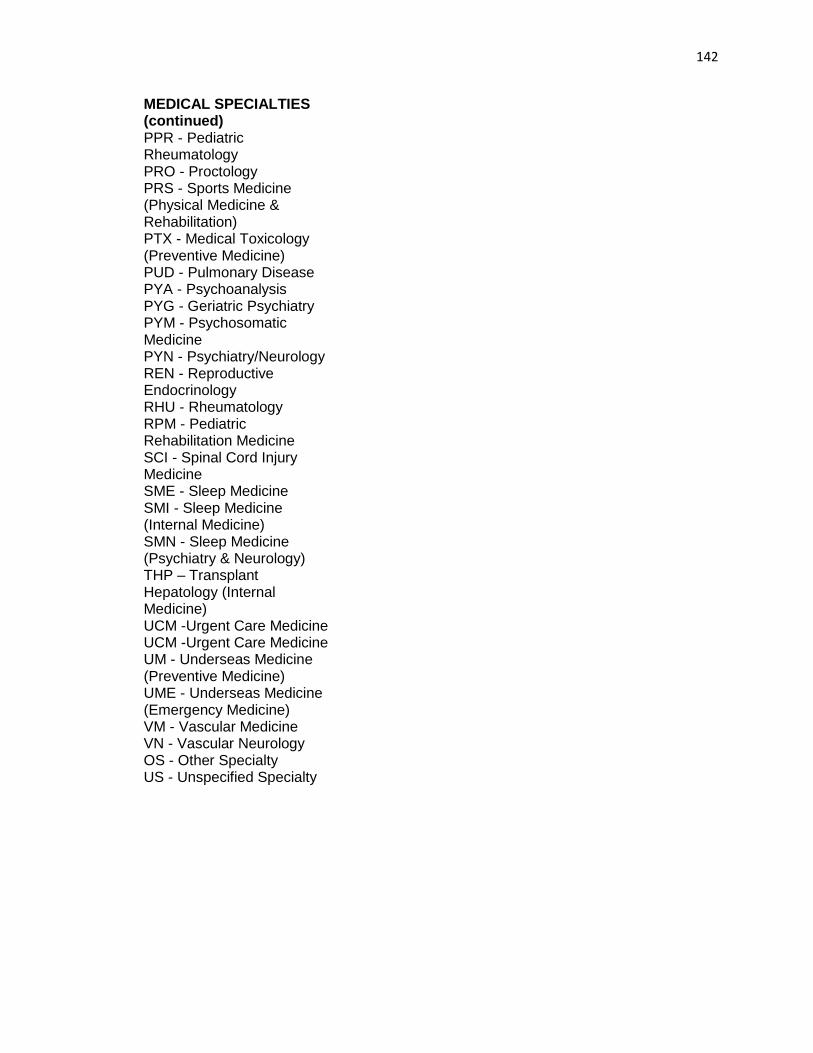
142
MEDICAL SPECIALTIES (continued) PPR - Pediatric Rheumatology PRO - Proctology PRS - Sports Medicine (Physical Medicine & Rehabilitation) PTX - Medical Toxicology (Preventive Medicine) PUD - Pulmonary Disease PYA - Psychoanalysis PYG - Geriatric Psychiatry PYM - Psychosomatic Medicine PYN - Psychiatry/Neurology REN - Reproductive Endocrinology RHU - Rheumatology RPM - Pediatric Rehabilitation Medicine SCI - Spinal Cord Injury Medicine SME - Sleep Medicine SMI - Sleep Medicine (Internal Medicine) SMN - Sleep Medicine (Psychiatry & Neurology) THP – Transplant Hepatology (Internal Medicine) UCM -Urgent Care Medicine UCM -Urgent Care Medicine UM - Underseas Medicine (Preventive Medicine) UME - Underseas Medicine (Emergency Medicine) VM - Vascular Medicine VN - Vascular Neurology OS - Other Specialty US - Unspecified Specialty
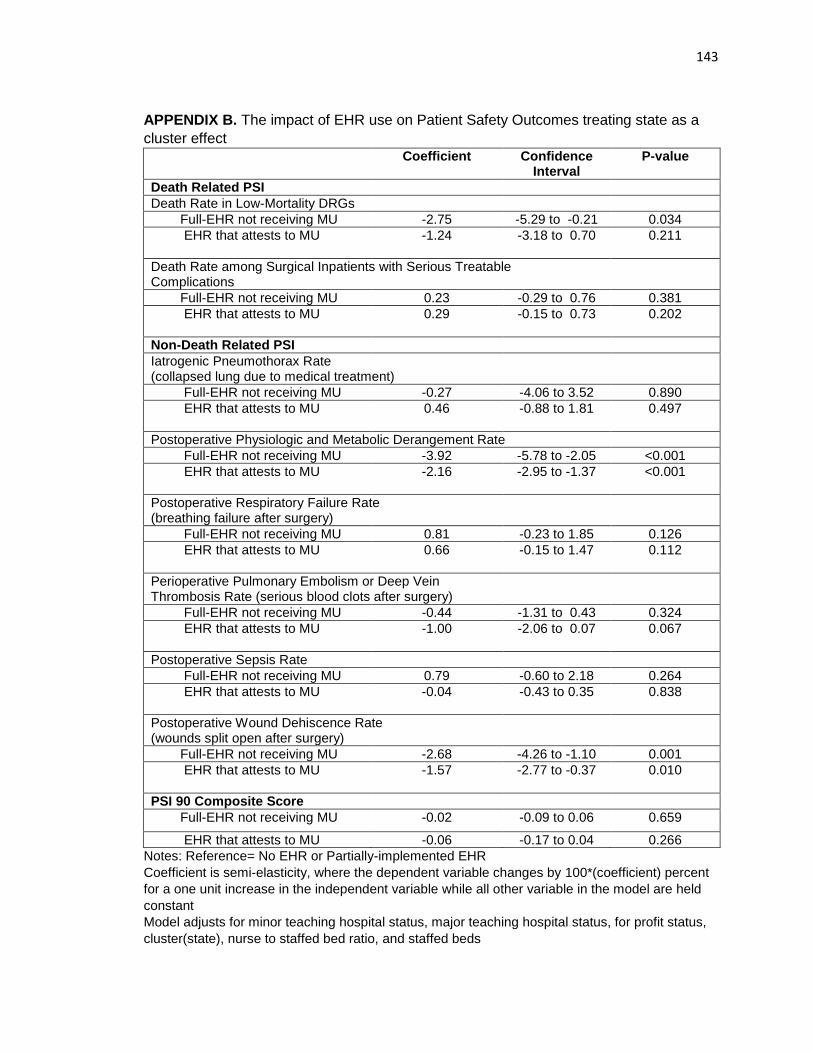
143
APPENDIX B. The impact of EHR use on Patient Safety Outcomes treating state as a
cluster effect
Coefficient Confidence Interval
P-value
Death Related PSI
Death Rate in Low-Mortality DRGs
Full-EHR not receiving MU -2.75 -5.29 to -0.21 0.034
EHR that attests to MU
-1.24 -3.18 to 0.70 0.211
Death Rate among Surgical Inpatients with Serious Treatable Complications
Full-EHR not receiving MU 0.23 -0.29 to 0.76 0.381
EHR that attests to MU
0.29 -0.15 to 0.73 0.202
Non-Death Related PSI
Iatrogenic Pneumothorax Rate (collapsed lung due to medical treatment)
Full-EHR not receiving MU -0.27 -4.06 to 3.52 0.890
EHR that attests to MU
0.46 -0.88 to 1.81 0.497
Postoperative Physiologic and Metabolic Derangement Rate
Full-EHR not receiving MU -3.92 -5.78 to -2.05 <0.001
EHR that attests to MU
-2.16 -2.95 to -1.37 <0.001
Postoperative Respiratory Failure Rate (breathing failure after surgery)
Full-EHR not receiving MU 0.81 -0.23 to 1.85 0.126
EHR that attests to MU
0.66 -0.15 to 1.47 0.112
Perioperative Pulmonary Embolism or Deep Vein Thrombosis Rate (serious blood clots after surgery)
Full-EHR not receiving MU -0.44 -1.31 to 0.43 0.324
EHR that attests to MU
-1.00 -2.06 to 0.07 0.067
Postoperative Sepsis Rate
Full-EHR not receiving MU 0.79 -0.60 to 2.18 0.264
EHR that attests to MU
-0.04 -0.43 to 0.35 0.838
Postoperative Wound Dehiscence Rate (wounds split open after surgery)
Full-EHR not receiving MU -2.68 -4.26 to -1.10 0.001
EHR that attests to MU
-1.57 -2.77 to -0.37 0.010
PSI 90 Composite Score
Full-EHR not receiving MU -0.02 -0.09 to 0.06 0.659
EHR that attests to MU -0.06 -0.17 to 0.04 0.266
Notes: Reference= No EHR or Partially-implemented EHR
Coefficient is semi-elasticity, where the dependent variable changes by 100*(coefficient) percent
for a one unit increase in the independent variable while all other variable in the model are held
constant
Model adjusts for minor teaching hospital status, major teaching hospital status, for profit status,
cluster(state), nurse to staffed bed ratio, and staffed beds