THE IMPACT OF CRIME VICTIMISATION ON INDIVIDUAL ...
12
THE IMPACT OF CRIME VICTIMISATION ON INDIVIDUAL WELL-BEING: EVIDENCE FROM AUSTRALIA Malathi Velamuri Victoria University of Wellington Steven Stillman Motu Economic and Public Policy Research Abstract This paper examines the impact of being a victim of violent or property crime on labour market outcomes and general well-being using longitudinal data from the nationally representative Household Income and Labour Dynamics of Australia (HILDA) survey. We estimate fixed effects regression models that examine changes in outcomes for individuals before/after victimisation relative to changes in outcomes over time for non-victims. Our results highlight considerable heterogeneity in the causal impact of crime victimisation: (I) the impacts of violent crime victimisation are stronger and more wide-ranging than those of property crime victimisation; (2) male victims of viol em crime experience poorer employment prospects following victimisation; (3) older victims of violent crime report a deterioration in mental health for two years after the event; (-1) women face reduced, persistent prospects of marriage/co-habitation following crime victimisation,· and (5) there is strong evidence of a negative impact of victimisation on l{fe satisfaction measures but these effects do not persist. Introduction Criminal activity imposes significant costs on society. Government expenditures on the crimina l justice system are sizeable in most OECD countries. These expenditures generally comprise crime prevention, detection and investigation, judicial processes and dispute resolution, prisoner and offender management, and rehabilitation services. In addition, crime victim compensation schemes offer direct reimbursement to, or on behalf of, a crime victim for statutorily identified crime-related expenses such as medical costs. funeral and burial costs, mental health counselling, lost wages or loss of support. These costs, together with private outlays on crime prevention measures, are a measure of the direct cost of crime. The direct, dollar cost grossly understates the real cost of crime to society since many private precautionary expenses against crime and public expenditures incurred in enforcing certain types of legislation are not included (Becker, 1968). Furthermore, police crime statistics understate the incidence of crime, largely because many crimes are not reported. Moreover, as Viscusi (1993) suggests, health and safety risks contribute to human unhappiness. One possible source of health risk, in addition to physical injury, is the post-traumatic stress and the psychological impact of injury on its victims. These effects can be relatively short-lived or can ·activate long-term trajectories of mental distress' (Macmillan, 2001 ). However, it is generally impossible to put an accurate price on the emotional and psychological sufferings caused by victimisation. Finally, as Rizzo ( 1979) points out, in the presence of risk aversion, the true cost of crime will exceed the expected value of losses. Research on crime by economists has focussed on trying to explain individuals' decision to commit crime within an optimization framework. on analyses of public policies to mitigate criminal behaviour and on the economic consequences of incarceration for individuals. However. they have largely ignored the impact of crime on victims. This is surprising. given the level of interest in the impact of other life-changing events like divorce and unemployment. The need for accurately estimating both the direct and indirect costs of crime cannot be over-emphasised. Crime has the potential to incapacitate otherwise productive people, and to impose financial and psychological costs on their families. These are costs that are ultimately borne by society. In this paper, we estimate the causal effect of crime victimisation on labour market outcomes and general well-being using longitudinal data fi·om the nationally representative Househ old Income and Labow· Dynamics of Australia (l-llLDA) survey. 1 Crucially for ow· analysis. individuals in HILDA are asked whether they experienced a number of major life events in the previous year including being a victim of violent or property crime. We estimate fixed effects regressions which allow us to control for characteristics that may s imultaneously cause certain individuals to become victims of crime and put them at higher risk of poor outcomes and examine Labour, Emp l oyment and Work in New Zealand 2008 583
-
Upload
khangminh22 -
Category
Documents
-
view
2 -
download
0
Transcript of THE IMPACT OF CRIME VICTIMISATION ON INDIVIDUAL ...
THE IMPACT OF CRIME VICTIMISATION ON
INDIVIDUAL WELL-BEING: EVIDENCE FROM AUSTRALIA
Malathi Velamuri
Victoria University of Wellington
Steven Stillman
Motu Economic and Public Policy Research
Abstract
This paper examines the impact of being a victim of violent or property crime on labour market outcomes and general well-being using longitudinal data from the nationally representative Household Income and Labour Dynamics of Australia (HILDA) survey. We estimate fixed effects regression models that examine changes in outcomes for individuals before/after victimisation relative to changes in outcomes over time for non-victims. Our results highlight considerable heterogeneity in the causal impact of crime victimisation: (I) the impacts of violent crime victimisation are stronger and more wide-ranging than those of property crime victimisation; (2) male victims of viol em crime experience poorer employment prospects following victimisation; (3) older victims of violent crime report a deterioration in mental health for two years after the event; (-1) women face reduced, persistent prospects of marriage/co-habitation following crime victimisation,· and (5) there is strong evidence of a negative impact of victimisation on l{fe satisfaction measures but these effects do not persist.
Introduction
Criminal activity imposes significant costs on society. Government expenditures on the criminal justice system are sizeable in most OECD countries. These expenditures generally comprise crime prevention, detection and investigation, judicial processes and dispute resolution, prisoner and offender management, and rehabilitation services. In addition, crime victim compensation schemes offer direct reimbursement to, or on behalf of, a crime victim for statutorily identified crime-related expenses such as medical costs. funeral and burial costs, mental health counselling, lost wages or loss of support. These costs, together with private outlays on crime prevention measures, are a measure of the direct cost of crime.
The direct, dollar cost grossly understates the real cost of crime to society since many private precautionary expenses against crime and public expenditures incurred in enforcing certain types of legislation are not included (Becker, 1968). Furthermore, police crime statistics understate the incidence of crime, largely because many crimes are not reported. Moreover, as Viscusi (1993) suggests, health and safety risks contribute to human unhappiness. One possible source of health risk, in addition to physical injury, is the post-traumatic stress and the psychological impact of injury on its victims. These effects can be relatively short-lived or can ·activate long-term trajectories of mental distress' (Macmillan, 2001 ). However, it is generally impossible to put an accurate price on the emotiona l and psychological
sufferings caused by victimisation. Finally, as Rizzo ( 1979) points out, in the presence of risk aversion , the true cost of crime will exceed the expected value of losses.
Research on crime by economists has focussed on trying to explain individuals' decision to commit crime within an optimization framework. on analyses of public policies to mitigate criminal behaviour and on the economic consequences of incarceration for individuals. However. they have largely ignored the impact of crime on victims. This is surprising. given the level of interest in the impact of other life-changing events like divorce and unemployment. The need for accurately estimating both the direct and indirect costs of crime cannot be over-emphasised. Crime has the potential to incapacitate otherwise productive people, and to impose financial and psychological costs on their families. These are costs that are ultimately borne by society.
In this paper, we estimate the causal effect of crime victimisation on labour market outcomes and general well-being using longitudinal data fi·om the nationally representative Household Income and Labow· Dynamics of Australia (l-llLDA) survey. 1 Crucially for ow· analysis. individuals in HILDA are asked whether they experienced a number of major life events in the previous year including being a victim of violent or property crime. We estimate fixed effects regressions which allow us to control for characteristics that may simultaneously cause certain individuals to become victims of crime and put them at higher risk of poor outcomes and examine
Labour, Employment and Work in New Zealand 2008 583
the impact of victimisation on both labour market outcomes and general well-being.
Related Literature
Research on criminal victimisation by sociologists and criminologists burgeoned after the advent of crime victimisation surveys, especially in the United States (Sampson, 1987). 2 The micro aspects of this literature examine variation in the risk of victimisation with the characteristics of individuals on the one hand, and the psychological consequences of victimisation on the other. From a more macro perspective, this literature investigates how rates of victimisation vary with the characteristics of neighbourhoods, and the socioeconomic impact of crime on neighbourhoods (Jatjoura and Smith, 1989).
Individual-level studies examining the characteristics of victims reveal that rates of victimisation are highest among males. young and unmarried individuals. This is consistent ''~th findings from crime victimisation surveys. Increasing economic inequalities in the 1970s led to spatial segregation a long racial lines in U.S. cities. resulting in concentrations of poverty (Wilson, 1987). The racial underclass theory of crime argues that the gradual migration of middle-class and working-class African Americans from inner city areas to suburban neighbourhoods left the most economically marginalised racia l minorities behind. According to Wilson ( 1987), thi~ ~hettoization is the result of the failure of public poltctes to combat poverty and is the source of the increased incidence of crime. This theory implies that the poor. inner-city residents in w·ban areas are more at risk of dctimisation re lathe to the rich.
Relati\ e deprh·ation theor) of crime suggests that crime increases ''ith economic inequality. and is not related to poverty per se. Blau and Blau ( 1982). for instance. find that neither race nor poverty explain differences in urban crime rates across the U.S .. once inequality is controlled for. Lev~tt ( 199?) also finds a strong relationship between mcome mequality and incidence of crime. He analys~s the. re.lat.i on~hip between race, income inequality and cnme \'tCttmtsatton in the U.S. from the 1970s to the 1990s. This was a period of rising income inequality in the U.S. He finds that whi le property crime became more c?ncentrated among the poor over this time period, the nch are now much more likely to become victims of violent crime.
Levin's ( 1999) results are also consistent with the routine . activities/! i festyle theory of crime, which hypothestses that social differences in crime victimisation can be explained by differences in routine activities which put ce11ain individuals at closer proximit) to offenders and increase their risk of 'ictimisation. Miethe and Stafford (1987). analysing surv~y dat~ ~ea~urin~ the quantity and nature of daily routme acttv tty m th trteen cities in the U.S .. find that
these variables are strong predictors of victimisation but not of violent victimisation.
property
~other strand of the literature suggests that netghbow·hood characteristics predict victimisation risk independent of individual characteristics such as age' race, sex, income, and marital status. Sampson (1985) finds that structural density, residential mobility and female-headed families have strong positive effe~s on rates of personal victimisation. He also finds that inequality and racial composition have negligible effects on victimisation when family structure, residential mobility and neighbourhood density factors are accounted for. These findings are consistent with an opportunity model of predatory victimisation.
Our reading of this literature suggests that there are a few exogenous individual characteristics that are good predictors of victimisation, such as age, ethnicity and gender. However, there are a number of variables such as income and residential neighbourhood characteristics that increase the risk of victimisation and may be correlated with labour market outcomes. Moreover there . . ' ts constderable heterogeneity in the risk of victimisation.
There is also compelling evidence that crime victims suffer psychological trauma following the incident. The intensity and duration of these effects vary with the characteristics of the victim and the nature of the crime. For instance, Freedy et. al. (1994) examine the incidence of post-traumatic stress disorder (PTSD) among recent vict ims and their family members involved in the criminal justice system in the U.S. dw·ing the late 1980s. Th:y find a high prevalence (over 50%) of PTSD among thetr respondents, with victims of violent crime being more at risk of suffering psychological damage. Macmillan (200 I) suggests that since victims of violent crimes tend to be young and since victimisation has an acute psychological impact. at least in the short-run, these incidents have a life-altering effect on young
'ictims.
There is a relatively large literature that studies whether happiness levels adapt to life events, a process referred to as hedonic adaptation (Frederick and Lowenstein, 1999). The early empirical literature in this area was based on cross-sectional data. The findings from this early literatw·e gave rise to the ' hedonic treadmill ' theory, suggesting that individuals enjoy stable levels of wellbeing over their lifetime (Brickman and Campbell, 1971 ). While positive and negative life events affect subjective well-being levels at the time of the event, individuals return to their initial levels of satisfaction
eventually.
Later studies using panel data find that while on average, individuals do return to baseline satisfaction levels over time. the rate of adaptation varies depending on the type of event as well as characteristics of the individuals experiencing these events. For example, Lucas et. al. (2003) use the Getman Socio-Economic Panel Data
Labour, Employment and Work in New Zealand 2008 584
(GSOEP) to study how individuals adapt to marital transitions. Their estimates reveal that individuals who get married experience increased well-being following the event but return to baseline well-being levels quickly, while those experiencing widowhood do not adapt.
Clark et. al. (2003) use the same German panel data to investigate how individuals adapt to major life-events. They fmd that the impact of negative life shocks on wellbeing vary according to the type of event. Men are more affected by negative labour-market outcomes such as unemployment and layoffs compared to women, and take longer to return to baseline well-being levels while women appear more sensitive to personal life events such as marriage and divorce. Moreover, they fmd that those with higher baseline satisfaction levels are more adversely affected by negative shocks.
In this paper, we attempt to add to the micro aspects of the victimisation literature. The dataset we use in this paper has a rich set of variables that will allow us to control for socio-demographic and neighbourhood characteristics in estimating the impact of victimisation on our chosen outcomes. In addition, it asks respondents
a number of questions related to health and general wellbeing. To our knowledge, this is the first economic analysis of the impact of crime victimisation on labourmarket outcomes and subjective well-being.
Crime in Australia- Recent Trends
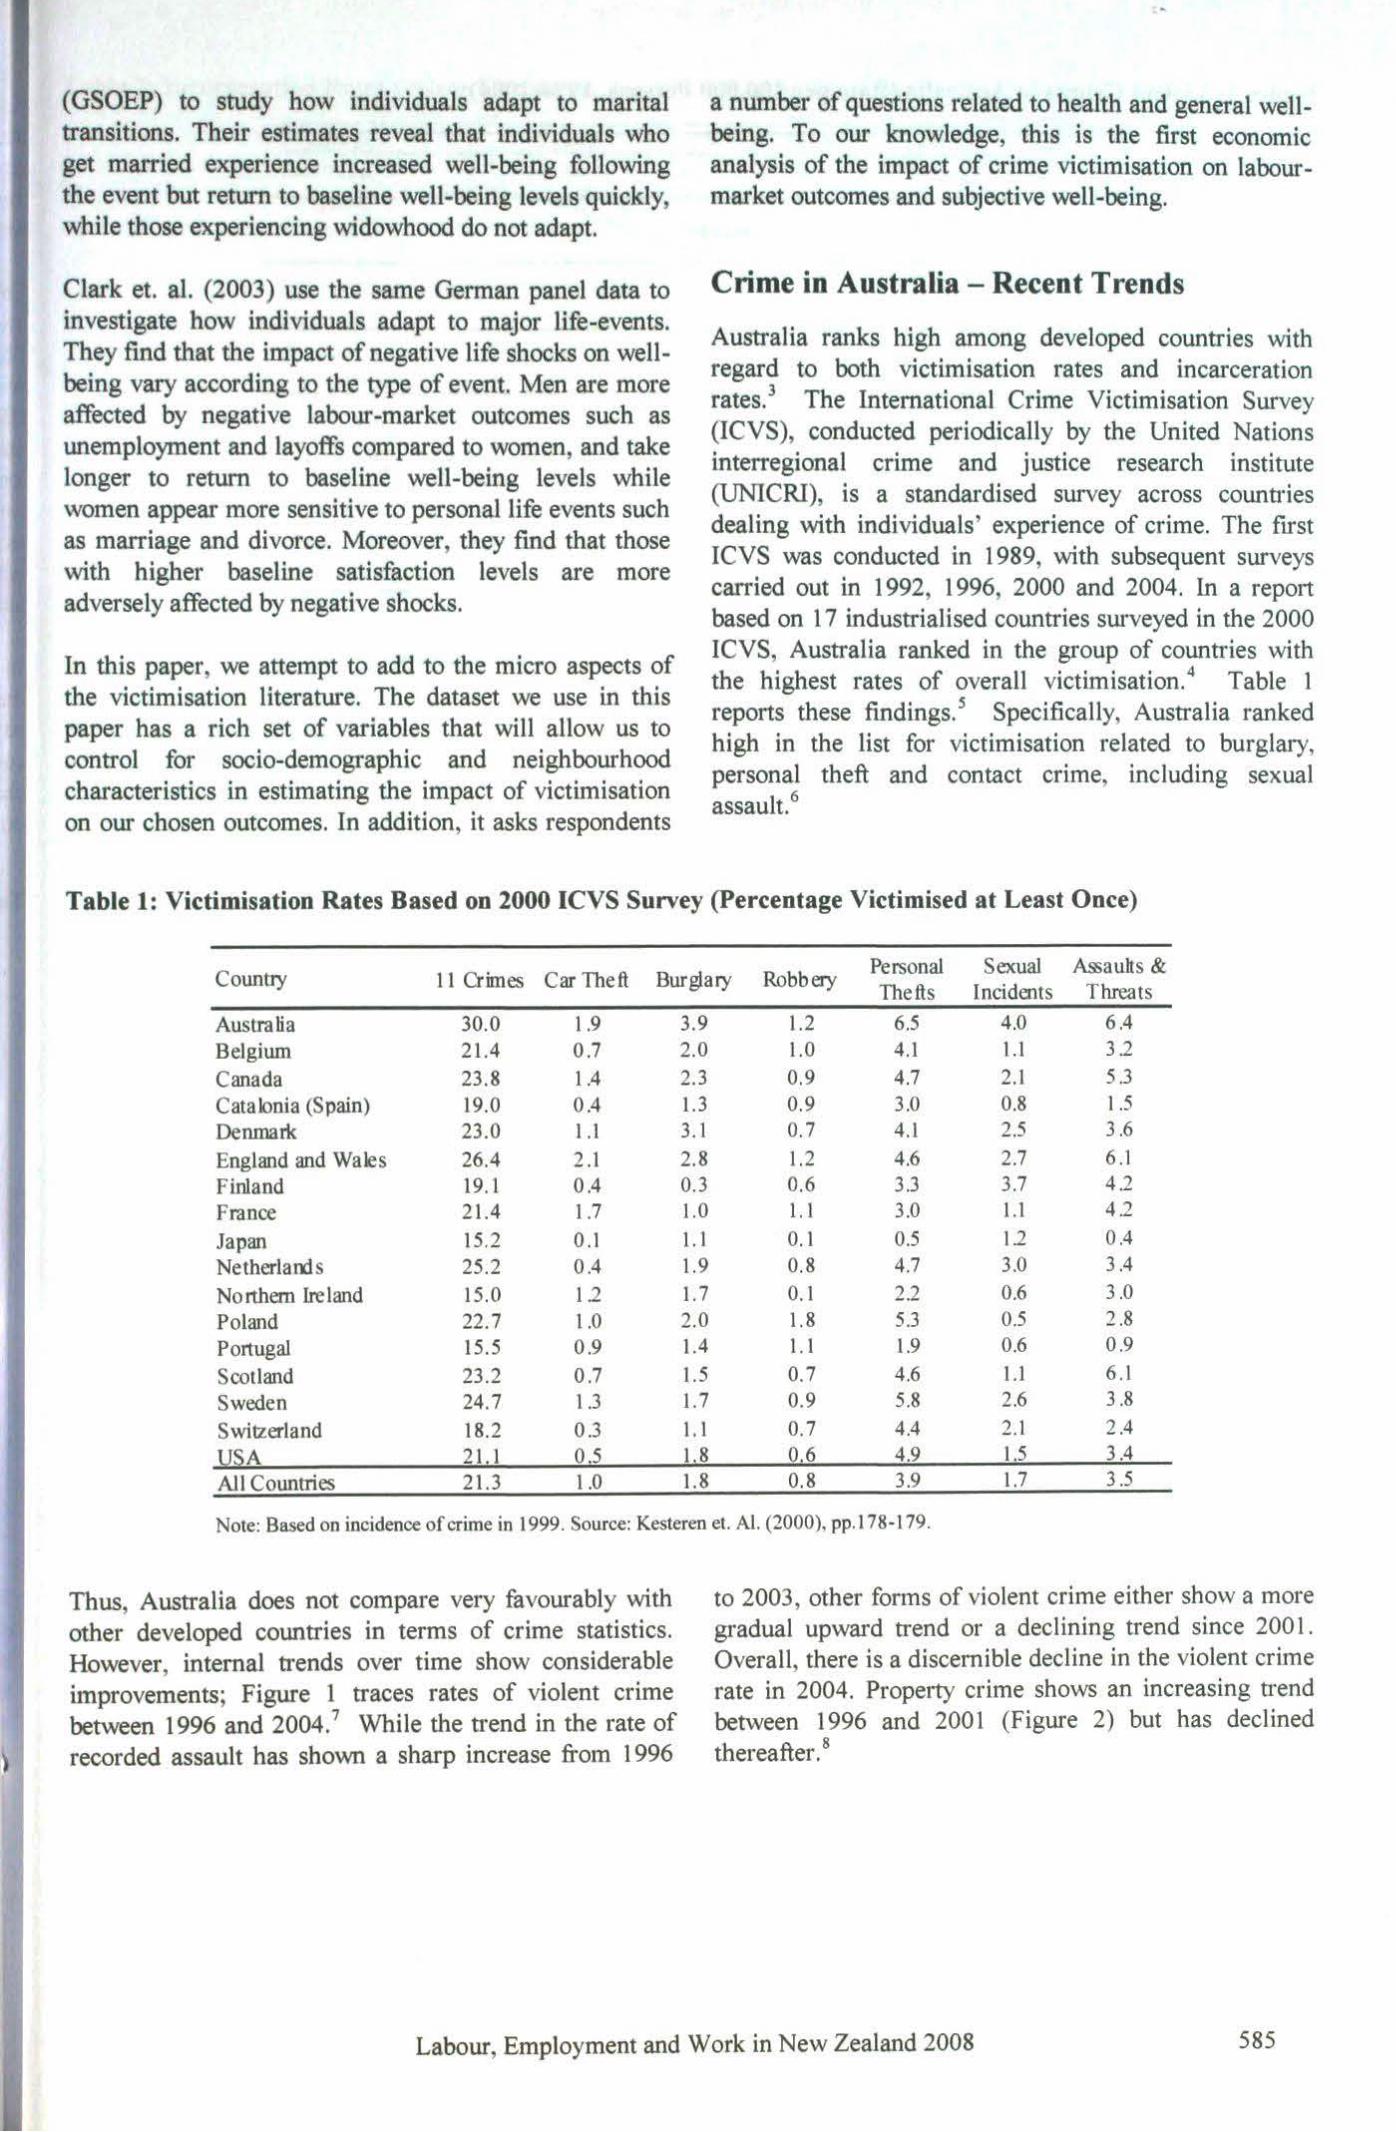
Australia ranks high among developed countries with regard to both victimisation rates and incarceration rates. 3 The International Crime Victimisation Survey (ICVS), conducted periodically by the United Nations interregional crime and justice research institute (UNICRI), is a standardised survey across countries dealing with individuals' experience of crime. The first ICVS was conducted in 1989, with subsequent surveys carried out in 1992, 1996, 2000 and 2004. In a report based on 1 7 industrialised countries surveyed in the 2000 ICVS, Australia ranked in the group of countries with the highest rates of overall victimisation. 4 Table 1 reports these findings. 5 Specifically, Australia ranked high in the list for victimisation related to burglary, personal theft and contact crime, including sexual assault.6
Table 1: Victimisation Rates Based on 2000 ICVS Survey (Percentage Victimised at Least Once)
Countty 11 Oimes Car Theft Burglary Robbery Personal Sexual A$auhs & Thefts Incidents Threats
Australia 30.0 1.9 3.9 1.2 6.5 4.0 6.4
Belgium 21.4 0.7 2.0 1.0 4.1 1.1 32
Canada 23.8 1 .4 2.3 0.9 4.7 2.1 5.3
Catalonia (Spain) 19.0 0.4 1.3 0.9 3.0 0.8 1.5
Denmark 23.0 1.1 3.1 0.7 4.1 2.5 3.6
England and Wales 26.4 2.1 2.8 1.2 4.6 2.7 6.1
Finland 19.1 0.4 0.3 0.6 3.3 3.7 4.2
France 21.4 1 .7 1.0 1.1 3.0 1.1 42
Japan 15.2 0.1 1.1 0. 1 0.5 12 0.4
Netherlarxi s 25.2 0.4 1.9 0.8 4.7 3.0 3.4
Northern Ireland 15.0 12 1.7 0.1 2.2 0.6 3.0
Poland 22.7 1.0 2.0 1.8 5.3 0.5 2.8
Portugal 15.5 0.9 1.4 1.1 1.9 0.6 0.9
Scotland 23.2 0.7 1.5 0.7 4.6 1.1 6.1
Sweden 24.7 1.3 1.7 0.9 5.8 2.6 3.8
Switzerland 18.2 0.3 1.1 0.7 4.4 2.1 2.4
:USA 21.1 0.5 1.8 0.6 4.9 1.5 3.4
All Countries 21.3 1.0 1.8 0.8 3.9 1.7 3.5
Note: Based on incidence of crime in 1999. Source: Kesteren et. Al. (2000), pp.l78-179.
Thus, Australia does not compare very favourably with other developed countries in terms of crime statistics. However, internal trends over time show considerable improvements; Figure 1 traces rates of violent crime between 1996 and 2004.7 While the trend in the rate of recorded assault has shown a sharp increase from 1996
to 2003, other forms of violent crime either show a more gradual upward trend or a declining trend since 2001. Overall, there is a discernible decline in the violent crime rate in 2004. Property crime shows an increasing trend between 1996 and 2001 (Figure 2) but has declined thereafter. 8
Labour, Employment and Work in New Zealand 2008 585
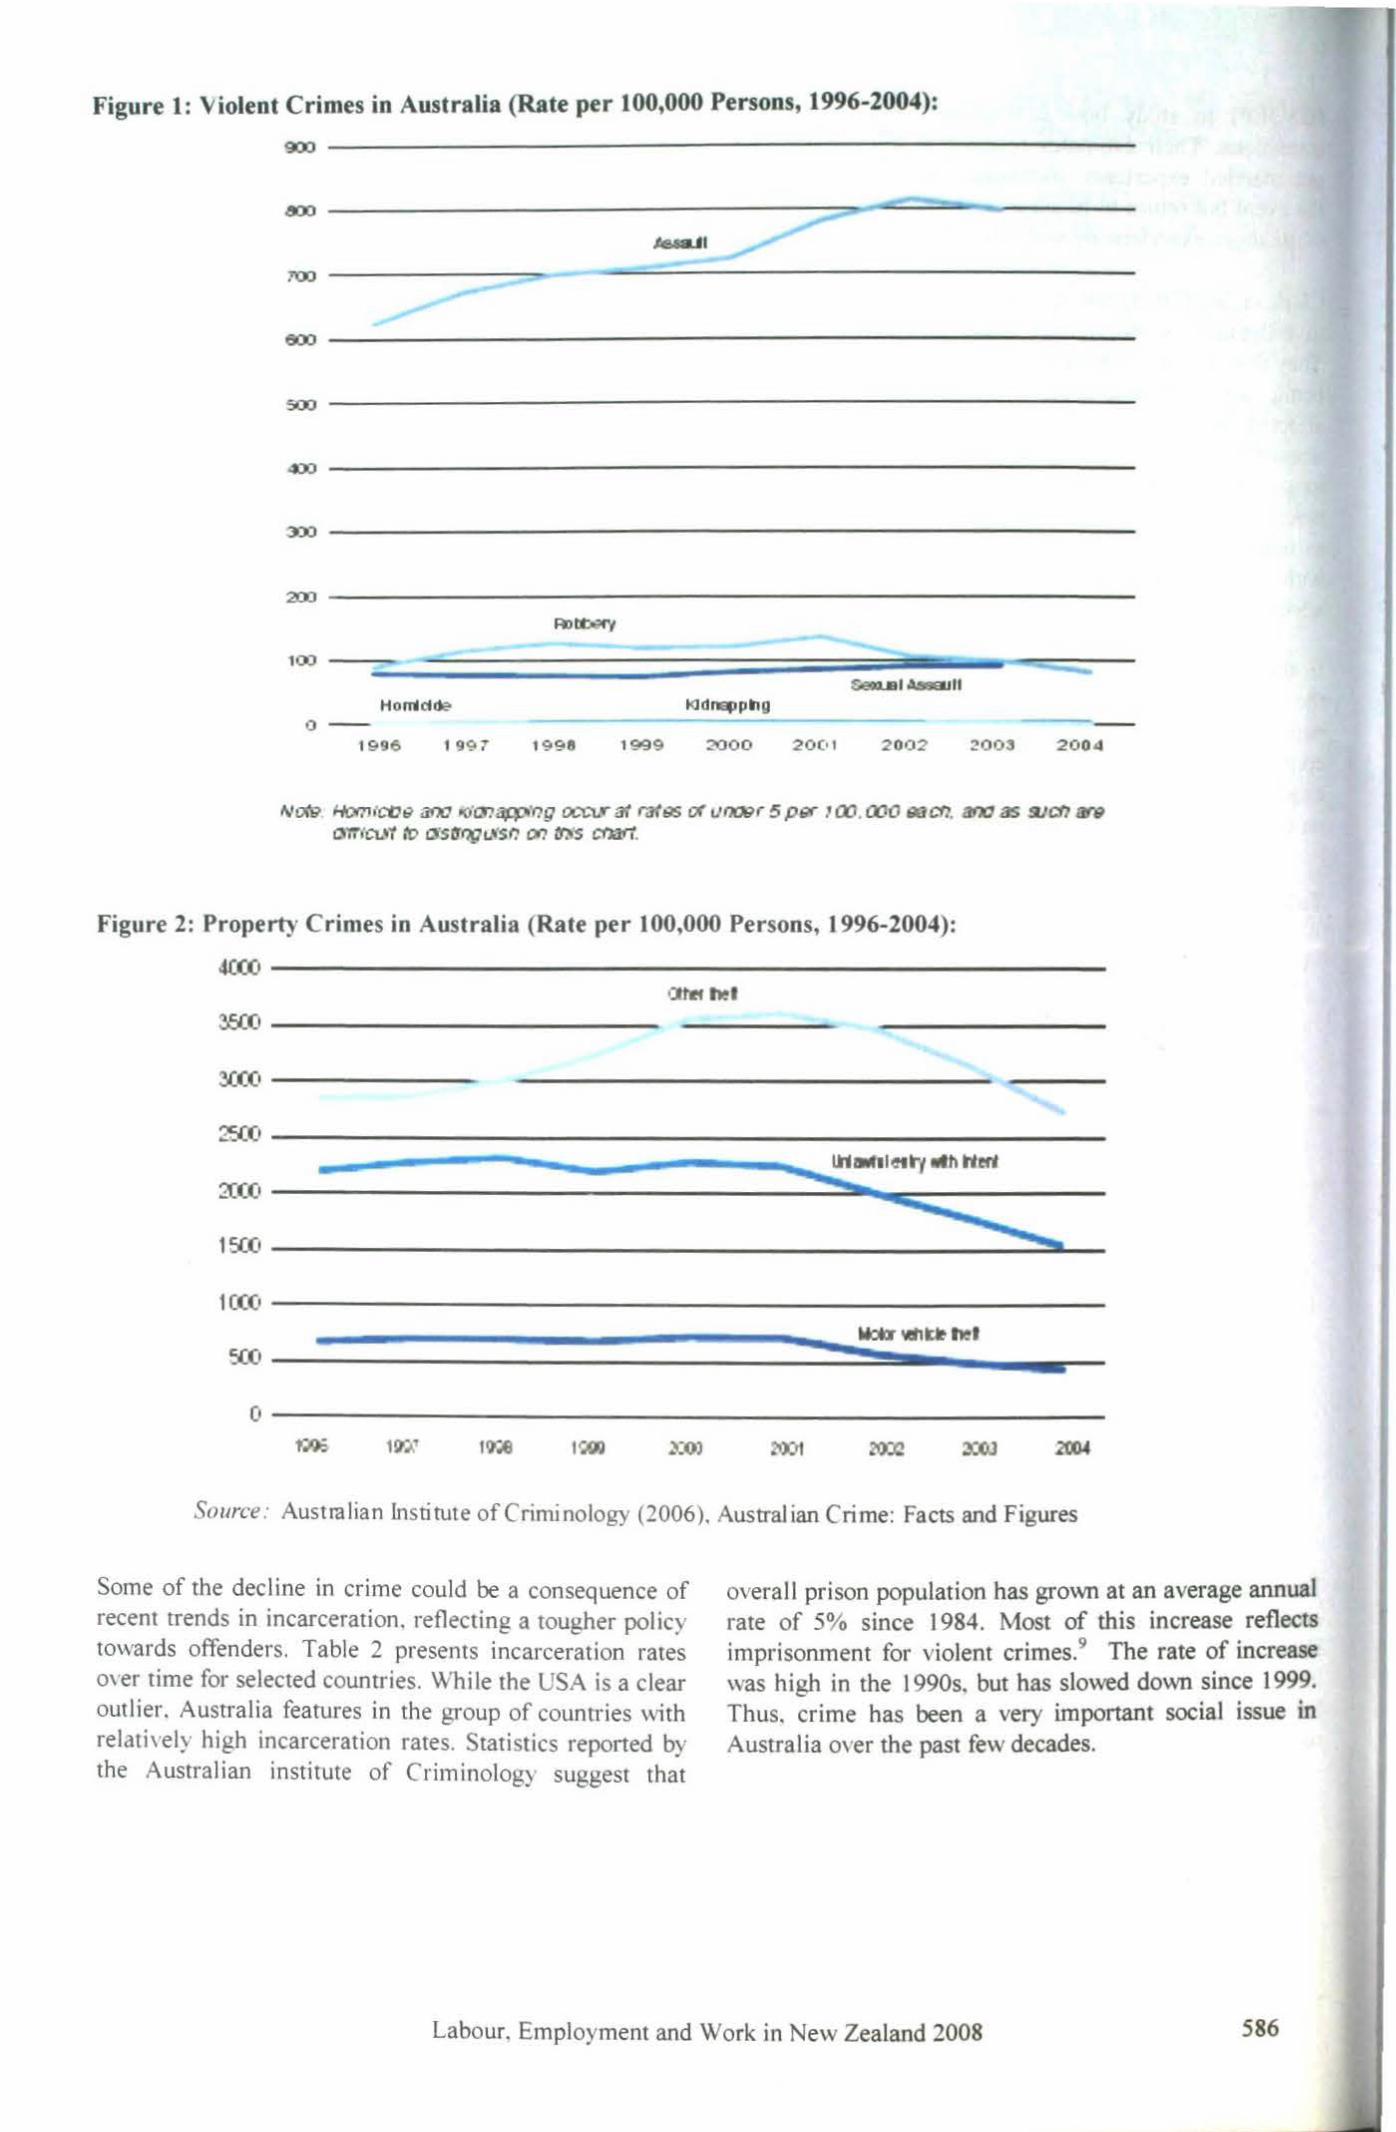
Figure 1: Violent Crimes in Australia (Rate per 100,000 Persons, 1996-2004):
9D ----------------------------------------------------------
r.sa •t
Homldde ICldrEpptlg 0 ---
1996 1997 1998 1999 :;.:)00 20(11 2002 :!003 2004
11.•001. Hcm(CCtJ ana t<ic:na{Png OIX\.'t" at ratgs ot uf109r 5 pgr 1 oo. ooo aJCf1. ana as suc::n ar9
orr;c;uy I'D ast!f1fla.~n oo rno·s ctm1.
Figure 2: Property Crimes in Australia (Rate per 100,000 Persons, 1996-2004):
~0) -----------------------------------------------------•:::IM het
~· -----------------------------
~ --------------------------------------------------------------------
18Xt ----------------------------------------------------~ L--
1((fj ----------------------------------------------------------
';{fj ---~::::::::::::::~::::::::::::::::::~~~~;=:·~Wh::~~he::·~ .... ~
0 --------------------------------------------------------------
Source: Australian Institute of Criminology (2006). Australian Crime: Facts and Figures
Some of the decline in crime could be a consequence of recent trends in incarceration. reflecting a tougher policy towards offenders. Table 2 presents incarceration rates over time for selected countries. While the USA is a clear outlier. Australia features in the group of countries with relatively high incarceration rates. Statistics reported by the Australian institute of Criminology suggest that
overall prison population has grown at an average annual rate of 5% since 1984. Most of this increase reflects imprisonment for violent crimes.9 The rate of increase was high in the 1990s. but has slowed down since 1999. Thus. crime has been a very important social issue in Australia over the past few decades.
Labour, Employment and Work in New Zealand 2008 586
•
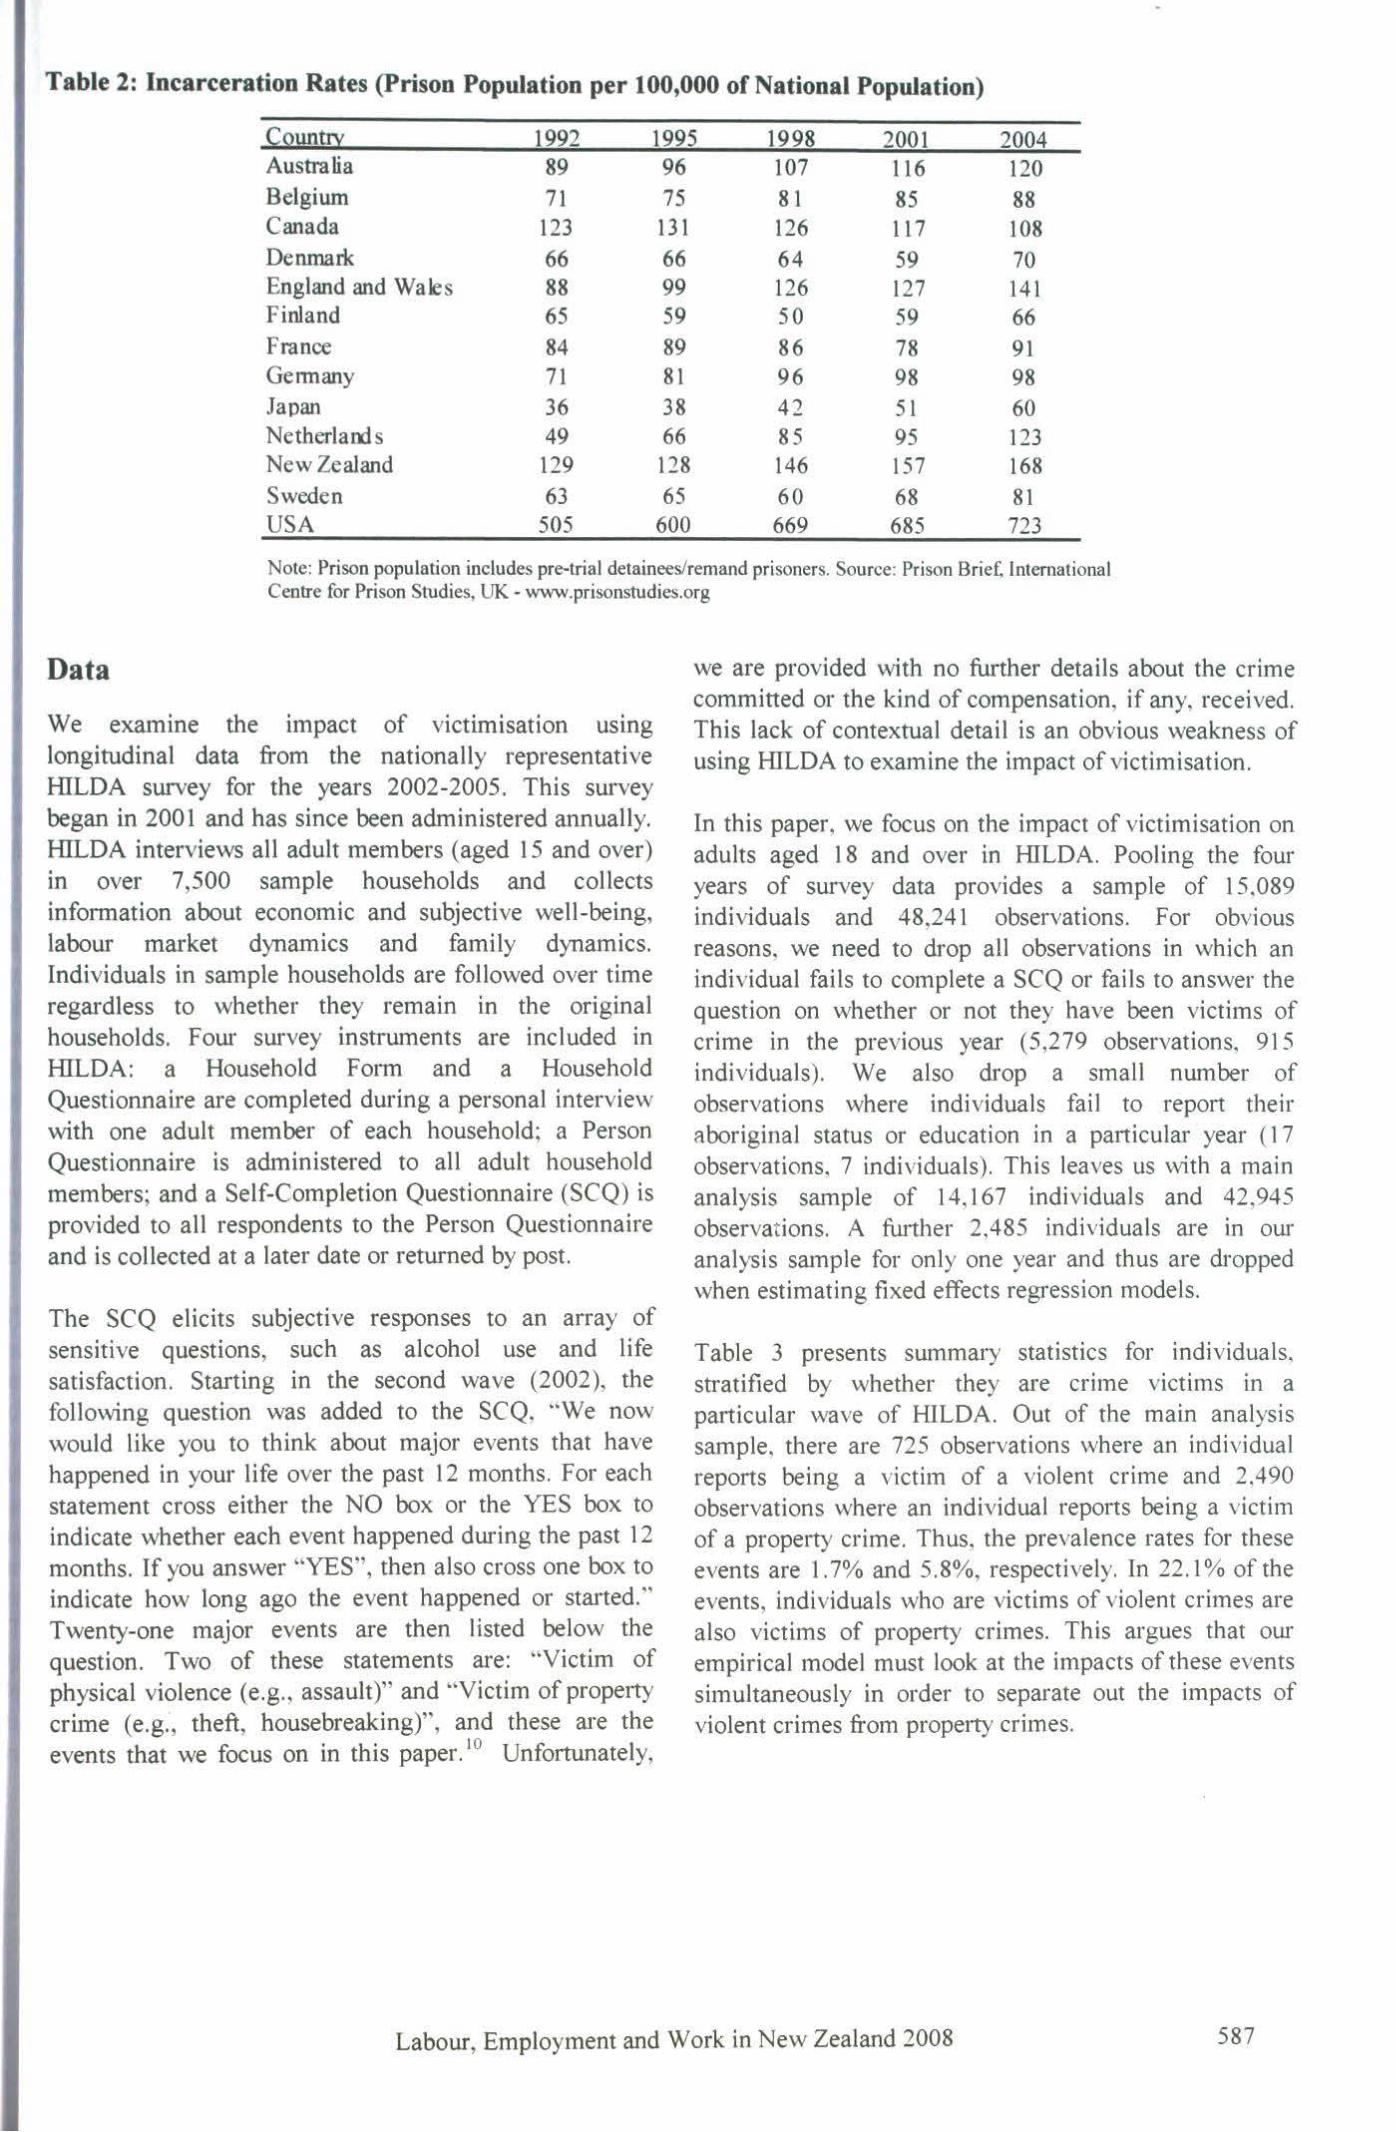
Table 2: Incarceration Rates (Prison Population per 100,000 of National Population)
~~unto: 1992 1995 1998 2001 2004 Australia 89 96 107 116 120 Belgium 71 75 81 85 88 Canada 123 131 126 117 108 Denmark 66 66 64 59 70 England and Wales 88 99 126 127 141 Finland 65 59 50 59 66 France 84 89 86 78 91 Gennany 71 81 96 98 98 Japan 36 38 42 51 60 Netherlarxis 49 66 85 95 123 New Zealand 129 128 146 157 168 Sweden 63 65 60 68 81 USA 505 600 669 685 723
Note: Prison population includes pre-trial detainees/remand prisoners. Source: Prison Brief. International Centre for Prison Studies, UK - www.prisonstudies.org
Data
We examine the impact of victimisation using longitudinal data from the nationally representative HILDA survey for the years 2002-2005. This survey began in 2001 and has since been administered annually. HILDA interviews all adult members (aged 15 and over) in over 7,500 sample households and collects information about economic and subjective well-being, labour market dynamics and family dynamics. Individuals in sample households are followed over time regardless to whether they remain in the original households. Four survey instruments are included in HILDA: a Household Form and a Household Questionnaire are completed during a personal interview with one adult member of each household; a Person Questionnaire is administered to all adult household members; and a Self-Completion Questionnaire (SCQ) is provided to all respondents to the Person Questionnaire and is collected at a later date or returned by post.
The SCQ elicits subjective responses to an array of sensitive questions, such as alcohol use and life satisfaction. Starting in the second wave (2002), the following question was added to the SCQ, ''We now would like you to think about major events that have happened in your life over the past 12 months. For each statement cross either the NO box or the YES box to indicate whether each event happened during the past 12 months. If you answer ''YES", then also cross one box to indicate how long ago the event happened or started." Twenty-one major events are then listed below the question. Two of these statements are: "Victim of physical violence (e.g., assault)" and "Victim of propetty crime (e.g. , theft, housebreaking)", and these are the events that we focus on in this paper. 10 Unfortunately,
we are provided with no further details about the crime committed or the kind of compensation, if any, received. This lack of contextual detail is an obvious weakness of using HILDA to examine the impact of victimisation.
In this paper, we focus on the impact of victimisation on adults aged 18 and over in IDLDA. Pooling the four years of survey data provides a sample of 15,089 individuals and 48,241 observations. For obvious reasons, we need to drop all observations in which an individual fails to complete a SCQ or fails to answer the question on whether or not they have been victims of crime in the previous year (5,279 observations, 915 individuals). We also drop a small number of observations where individuals fail to report their aboriginal status or education in a particular year ( 1 7 observations, 7 individuals). This leaves us with a main analysis sample of 14,167 individuals and 42,945 observations. A further 2,485 individuals are in our analysis sample for only one year and thus are dropped when estimating fixed effects regression models.
Table 3 presents summary statistics for individuals, stratified by whether they are crime victims in a particular wave of IDLDA. Out of the main analysis sample, there are 725 observations where an individual reports being a victim of a violent crime and 2,490 observations where an individual reports being a victim of a property crime. Thus, the prevalence rates for these events are 1.7% and 5.8%, respectively. In 22.1% of the events, individuals who are victims of violent crimes are also victims of property crimes. This argues that owempirical model must look at the impacts of these events simultaneously in order to separate out the impacts of violent crimes from property crimes.
Labour, Employment and Work in New Zealand 2008 587
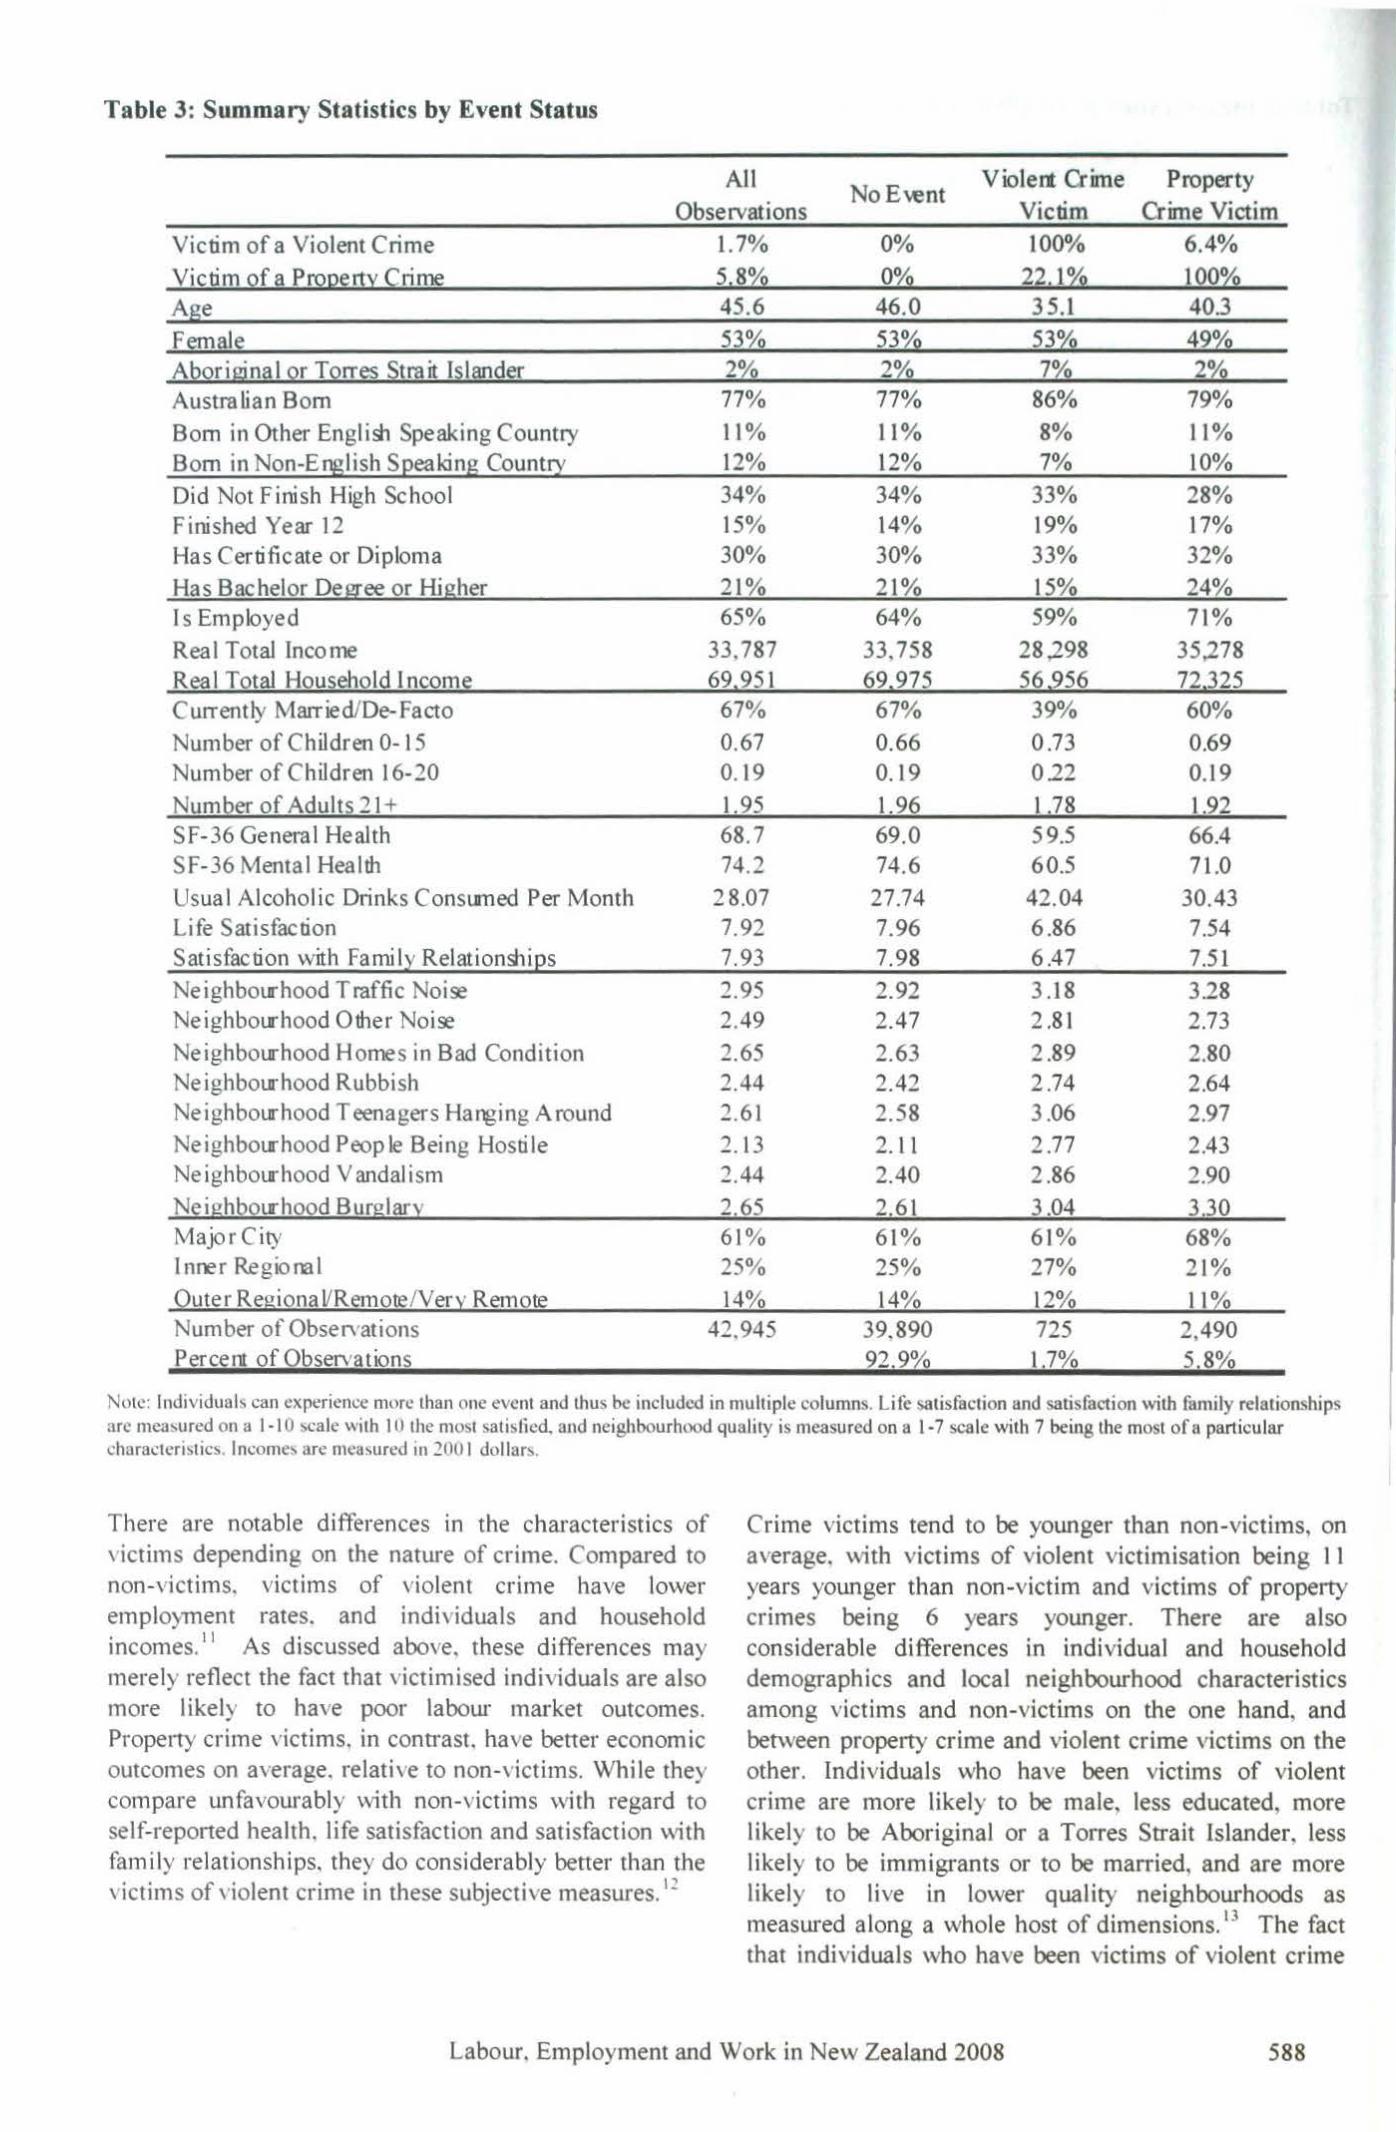
Table 3: Summary Statistics by Event Status
All Violert Crime Property Observations
No Event Victim Crime Victim
Victim of a Violent Crime 1.7% 0% 100% 6.4% Victim of a P!:Q12e!l~ ~rime 5,8~ 0% 22, 1~ 1 OOez'Q A se 45.6 46.0 35.1 403 Female 53ez'Q 53% 53ez'Q 49~
Aboriginal Qr TQrres Strait I~lander 2~ 2% 7% 2~ Australian Born 77% 77% 86% 79% Born in Other Engli~ Speaking Country 11% 11 % 8% 11% Born in Non-E!Jglish SEeaking Count~ 12% 12% 7% 10% Did Not Finish High School 34% 34% 33% 28% Finished Year 12 15% 14% 19% 17% Has Certi ficate or Diploma 30% 30% 33% 32% Has Bachelor De !?lee or Higher 21% 21% 15% 24% Is Employed 65% 64% 59% 71% Rea I Total Income 33,787 33,758 28,298 35,278 Real Total Household Income 691951 691975 561956 721325 Currently Married/De-Facto 67% 67% 39% 60% Number of Children 0- 15 0.67 0.66 0.73 0.69 Number of Children 16-20 0.19 0.19 022 0.19 Number of Adults 21 + 1.95 1.96 1.78 1.92 SF-36 General Health 68.7 69.0 59.5 66.4 SF-36 Mental Health 74.2 74.6 60.5 71.0 Usual Alcoholic Drinks Consumed Per Month 28.07 27.74 42.04 30.43 Life Satisfaction 7.92 7.96 6.86 7.54 Satisfaction with Farnil;t Rel ation~iEs 7.93 7.98 6.47 7.51 Neighbourhood Traffic Noi~ 2.95 2.92 3.18 3.28 Neighbourhood Other Noi~ 2.49 2.47 2.81 2.73 Neighbourhood Homes in Bad Condition 2.65 2.63 2.89 2.80 Neighbourhood Rubbish 2.44 2.42 2.74 2.64 Neighbourhood Teenagers Hanging Around 2.61 2.58 3.06 2.97 Neighbotrhood People Being Hostile 2.13 2. 11 2.77 2.43 Neighbourhood Vandalism 2.44 2.40 2.86 2.90 Neighbourhood Burglar~ 2.65 2.61 3.04 3.30 Major City 61% 61% 61% 68% Inrer Regional 25% 25% 27% 21% Quter RegionaVR~mote/Ver~ Remote 14% 14~ 12% 11~ Number of Observations 42.945 39,890 725 2,490 Percent of Observations 92.9% 1.7% 5.8%
Note: lndividuab can experience more than one event and thus be included in multiple columns. Life satisfaction and satisfaction with family relationships arc measured on a 1-10 ~ea le with In the most satisfied, and neighbourhood quality is measured on a 1-7 scale with 7 being the most of a particular characterbtics. Income~ are mea~ured in 200 I dollar~.
There are notable differences in the characteristics of \ ictims depending on the nature of crime. Compared to non-victims. victims of violent crime have lower emplo)Tilent rates. and individuals and household incomes. 11 As discussed above, these differences may merely reflect the fact that victimised individuals are also more likely to have poor labow· market outcomes. Property crime victims, in contrast, have better economic outcomes on average. relative to non-victims. While they compare unfavourably with non-victims with regard to self-reported health, life satisfaction and satisfaction with family relationships, they do considerably better than the \ ictims of violent crime in these subjective measures. 1
:!
Crime victims tend to be younger than non-victims, on average, with victims of violent victimisation being l 1 years younger than non-victim and victims of property crimes being 6 years younger. There are also considerable differences in individual and household demographics and local neighbourhood characteristics among victims and non-victims on the one hand, and between property crime and violent crime victims on the other. Individuals who have been victims of violent crime are more likely to be male, less educated, more likely to be Aboriginal or a Torres Strait Islander, less likely to be immigrants or to be married, and are more likely to live in lower quality neighbourhoods as measured along a whole host of dimensions. 13 The fact that individuals who have been victims of violent crime
Labour, Employment and Work in New Zealand 2008 588
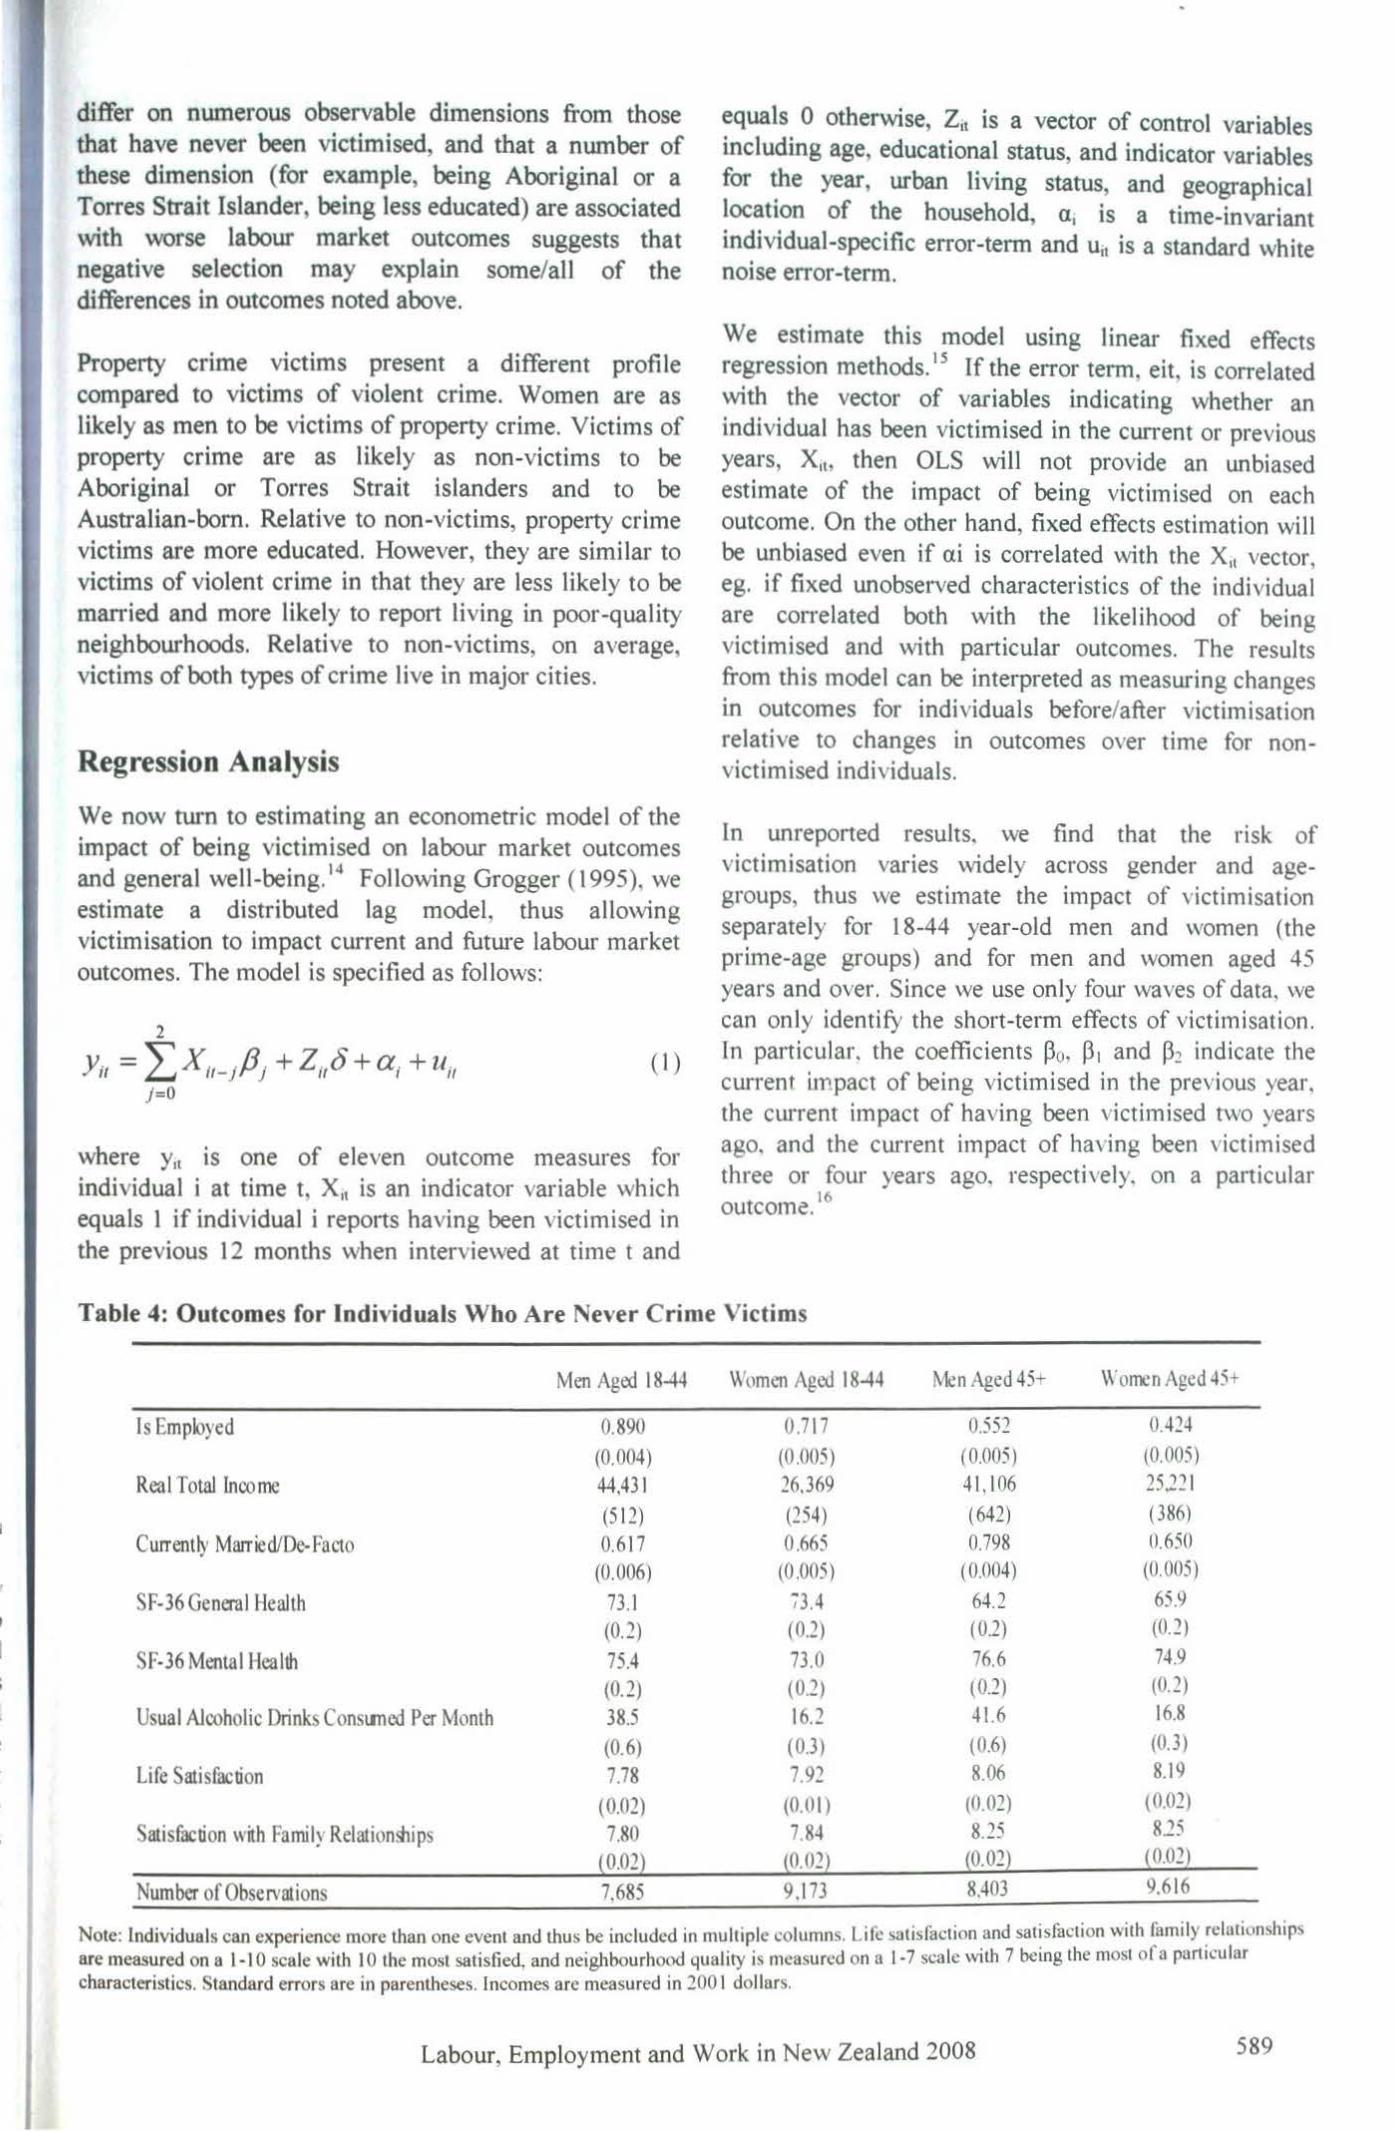
differ on numerous observable dimensions from those that have never been victimised, and that a number of these dimension (for example, being Aboriginal or a Torres Strait Islander, being less educated) are associated with worse labour market outcomes suggests that negative selection may explain some/all of the differences in outcomes noted above.
Property crime victims present a different profile compared to victims of violent crime. Women are as likely as men to be victims of property crime. Victims of property crime are as likely as non-victims to be Aboriginal or Torres Strait islanders and to be Australian-bom. Relative to non-victims, property crime victims are more educated. However, they are similar to victims of violent crime in that they are less likely to be married and more likely to report living in poor-quality neighbourhoods. Relative to non-victims, on average, victims of both types of crime live in major cities.
Regression Analysis
We now turn to estimating an econometric model of the impact of being victimised on labour market outcomes and general well-being. 14 Following Grogger (1995), we estimate a distributed lag model, thus allowing victimisation to impact current and futw·e labour market outcomes. The model is specified as follows:
2
Yu = L X 11 _ 1/]1 + Zu8 + a 1 + u;, }=0
(1)
where y11 is one of eleven outcome measures for individual i at time t, x.t is an indicator variable which equals 1 if individual i reports having been victimised in the previous 12 months when interviewed at time t and
equals 0 otherwise, Zit is a vector of control variables including age, educational status, and indicator variables for the year, urban living status, and geographical location of the household, a, is a time-invariant individual-specific error-term and u,t is a standard white noise error-term.
We estimate this model using linear fixed effects regression methods. 15 If the error term, eit, is correlated with the vector of variables indicating whether an individual has been victimised in the current or previous years, X111 then OLS will not provide an unbiased estimate of the impact of being victimised on each outcome. On the other hand, fixed effects estimation will be unbiased even if ai is correlated with the X,1 vector, eg. if fixed unobserved characteristics of the individual are correlated both with the likelihood of being victimised and with particular outcomes. The results from this model can be interpreted as measuring changes in outcomes for individuals before/after victimisation relative to changes in outcomes over time for nonvictimised individuals.
In unreported results, we find that the risk of victimisation varies widely across gender and agegroups, thus we estimate the impact of victimisation separately for 18-44 year-old men and women (the prime-age groups) and for men and women aged 45 years and over. Since we use only four waves of data, we can only identify the short-term effects of victimisation. In particular, the coefficients ~0, ~~ and ~2 indicate the current impact of being victimised in the previous year, the ctu·rent impact of having been victimised two years ago, and the current impact of having been victimised three or four years ago, respectively, on a particular outcome.16
Table 4: Outcomes for Individuals Who Are Never Crime Victims
Men Aged 18-44 Women Aged 18-44 Men Aged 45+ \\'omen Aeed 45+ v
Is Employed 0.890 0.7 17 0 ... ) ,))_ 0.424 (0.004) (0.005) (0.005) (0.005)
Real Total Income 44,431 26.369 41,106 25,2~ I
(512) (254) (642) (386) Currently Married/De-Facto 0.617 0.665 0.798 0.650
(0.006) (0.005) (0.004) (0.005)
SF-36 Genernl Health 73.1 13.4 64.2 65.9 (0.~) (0.2) (01) (0.2)
SF-36 Mental Health 75.4 73.0 76.6 74.9 (0.2) (0.2) (0.2) (0.2)
Usual Alcoholic Drinks Conslllled Per Month 38.5 16.2 41.6 16.8
(0.6) (0.3) (0.6) (0.3)
Life Satisfaction 7.78 7.92 8.06 8.19
(0.02) (0.01) (0.02) ( 0.02)
7.80 7.84 p· 8.25 ,_)
(0.02) (0. 02) (0.02) ( 0.02) Satisfaction with Famil~ Relatiomhips
Number of Observations 7.685 9,173 8.403 9.616
· · · · d d · 1 · 1 . 1 L' ~ · ( f: (on and satisfaction with family relationships Note: lndtvtduals can expenence more than one event and thus be tnclu e tn mu ttp e ~.:o umns. ue sa ts ac ' . are measured on a 1-10 scale with 10 the most satisfied, and neighbourhood quality is measured on a 1· 7 scale with 7 being the most of a parttcular characteristics. Standard errors are in parentheses. Incomes are measured in 200 I dollars.
Labour, Employment and Work in New Zealand 2008 589
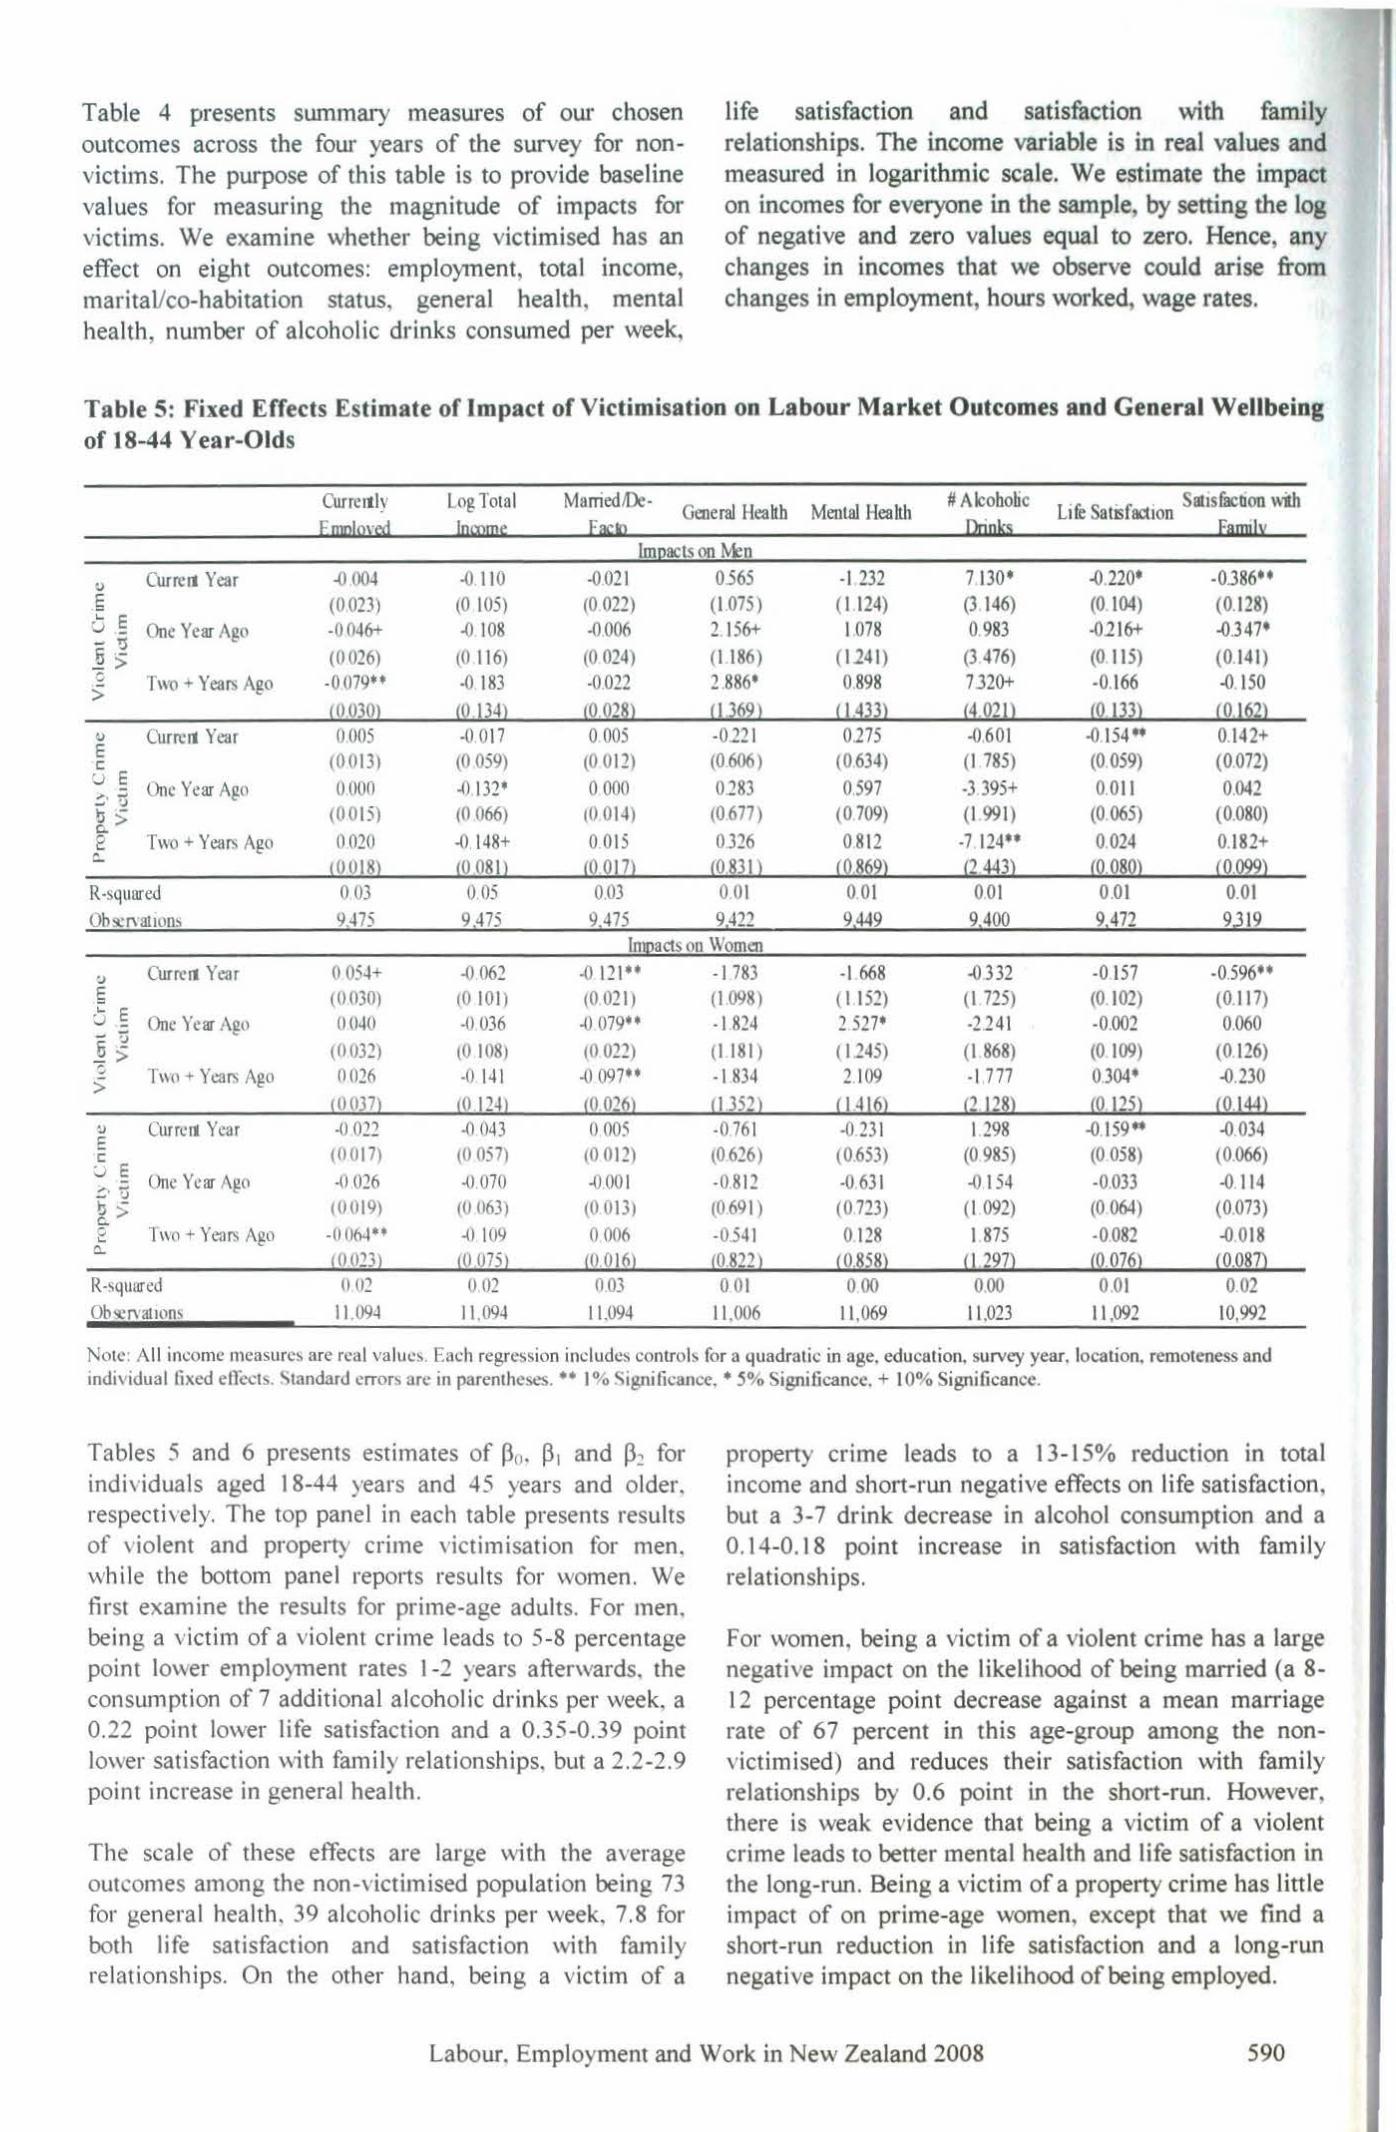
Table 4 presents summary measures of ow· chosen outcomes across the four years of the survey for nonvictims. The purpose of this table is to provide baseline values for measuring the magnitude of impacts for victims. We examine whether being victimised has an effect on eight outcomes: employment, total income, maritaVco-habitation status, general health, mental health, number of alcoholic drinks consumed per week,
life satisfaction and satisfaction with family relationships. The income variable is in real values and measured in logarithmic scale. We estimate the impact on incomes for everyone in the sample, by setting the log of negative and zero values equal to zero. Hence, any changes in incomes that we observe could arise from changes in employment, hours worked, wage rates.
Table 5: Fixed Effects Estimate of Impact of Victimisation on Labour Market Outcomes and General Wellbeing of 18-44 Y ear-Oids
Curre1tly Log Total MarriediDe-General Health Mental Heahh
# Alcobohc Life Satisfaction
Sat1sfacbon with E amlal!W EIIO&l Origb familY Icwm'
Im acts on Mw
u CUrrelt Year -0 00-t -0 llO -0021 0.565 -1 232 7 130• -0.220' -0.386 .. .5 (0.023) (0 .105) (0.022) (1075) ( 1.124) (3.146) (0. 104) (0.128) ._ E
One Year Ago -0046+ -0 108 -0.006 2.156+ 1.078 0.983 -0216+ -0.347• () -- u ij - (0 026) (0 116) (0.024) (1.1 86) ( 1241) (3 476) (0 115) (0.141) -> c Two+ Years Ago -0.079 .. -0 183 -0.022 2.886• 0.898 7320+ -0.166 -0.150 >
(0.030) (0 134) (O.Q28l (1.~62) '1.4~3) (4.Q21l (Q, lJJl (O. l~Zl () Currclt Year 0005 -0.017 0.005 -0221 0.275 -0.601 -0.154" 0.142+ E (0 0 13) (0 059) (0 012) (0 606) (0 634) (I 785) (0.059) (0.072) ·c U E One Year Ago 0000 ..() 132• 0 000 0.283 0.597 -3.395+ 0.011 0.042 ;::1 ';j b - (0 0 15) (0 066) (0 014) (0.677) (0 709) (I 991) (0.065) (0.080) Cl. > e Two+ Years Ago 0020 -0. 148+ 0.015 0.326 0.812 -7.124 .. 0.024 0. 182+ c..
' 0 0 !8) (0 081} (Q.017) (0 831) (Q,862l a 443) (Q.08Ql (O.Q2.2) R-squared 0.03 0.05 0.03 0.01 0 01 001 0.01 0.01 Ob9.!Jvation~ 9,475 9,475 9,475 9,422 9,449 9,400 9,472 9JI9
lnmacts on Women ..., 0 .1rre 11 Year 0 054+ -0 062 -0 121 .. -I 783 -1 668 -0.332 -0 157 -0.596 .. 5 (0.030) (0 I 0 I) (0 021) (I 098) (I 152) (I 725) (0 102) (0.117) b § One Year Ago 0040 -0 036 -0 079 .. -I 824 2 527• -2.241 -0.002 0.060 -- :.J ij - (0 032) (0 I 08) (0.022) (I 181 ) ( 1145) (I 868) (0 109) (0.126) - > 0 Two + Years Ago 0026 -0.141 -0 097 .. -I 834 2.109 -1.777 0.304• -0.230 >
(0 037} (0 12-1) (0,026) " 352) (I .t I~ (2 128) (0. 125) (0.144) ~ Cur reil Y car -0 .022 -0 043 0.005 -0.761 -0 231 1.298 -0.159 .. -0.034 E (0 0 17) (0 057) (0012) (0 626) (0653) (0 985) (0.058) (0.066) c
'.....J E One Year Ago -0 026 -0070 -0.001 -0.812 -0 631 -0.154 -0.033 -0. 114
~· !) b - (0 019) (0 063) (0 013) (0 691) (0.723) (I 092) (0.064) (0.073) c.. > 0 Two+ Years Ago -0064 .. .. () 109 0.006 -0.541 0.128 I 875 -0.082 -0.018 ...
0.. (0 023} (0 075} (0.0 16} ,o.8;m (0,858) (1,,27) (Q.076) (O,O§Zl
R-squared 0 02 0.02 0.03 0 01 000 0.00 0 01 0.02 Ob q:n•at 1ons 11.094 11.094 11.094 11,006 11 ,069 11 ,023 11 ,092 10,992
Note: All income measures arc real values. Each regression includes controls for a quadratic in age, education, survey year, location. remoteness and indi\idual fixed effects. Standard error~ are in parentheses. •• I% Signifi cance .. • 5% Significance. + I 0% Significance.
Tables 5 and 6 presents estimates of Po. P1 and P~ for individuals aged 18-44 years and 45 years and older, respectively. The top panel in each table presents results of 'iolent and property crime victimisation for men. while the bottom panel repot1s results for women. We first examine the results for prime-age adults. For men, being a victim of a violent crime leads to 5-8 percentage point lower employment rates 1-2 years afterwards, the consumption of 7 additional alcoholic drinks per week, a 0 .. 22 point lower life satisfaction and a 0.35-0.39 point lower satisfaction with family relationships, but a 2.2-2.9 point increase in general health.
The scale of these effects are large with the average outcomes among the non-victimised population being 73 for general health, 39 alcoholic drinks per week, 7.8 for both life satisfaction and satisfaction with family relationships. On the other hand, being a victim of a
property crime leads to a 13-1 5% reduction in total income and short-run negative effects on life satisfaction, but a 3-7 drink decrease in alcohol consumption and a 0.14-0.18 point increase in satisfaction with family relationships.
For women, being a victim of a violent crime has a large negative impact on the likelihood of being married (a 8-12 percentage point decrease against a mean marriage rate of 67 percent in this age-group among the nonvictimised) and reduces their satisfaction with family relationships by 0.6 point in the short-run. However, there is weak evidence that being a victim of a violent crime leads to better mental health and life satisfaction in the long-run. Being a victim of a property crime has Little impact of on prime-age women, except that we flnd a short-run reduction in life satisfaction and a long-run negative impact on the likelihood of being employed.
Labour. Employment and Work in New Zealand 2008 590
1 G
•
•
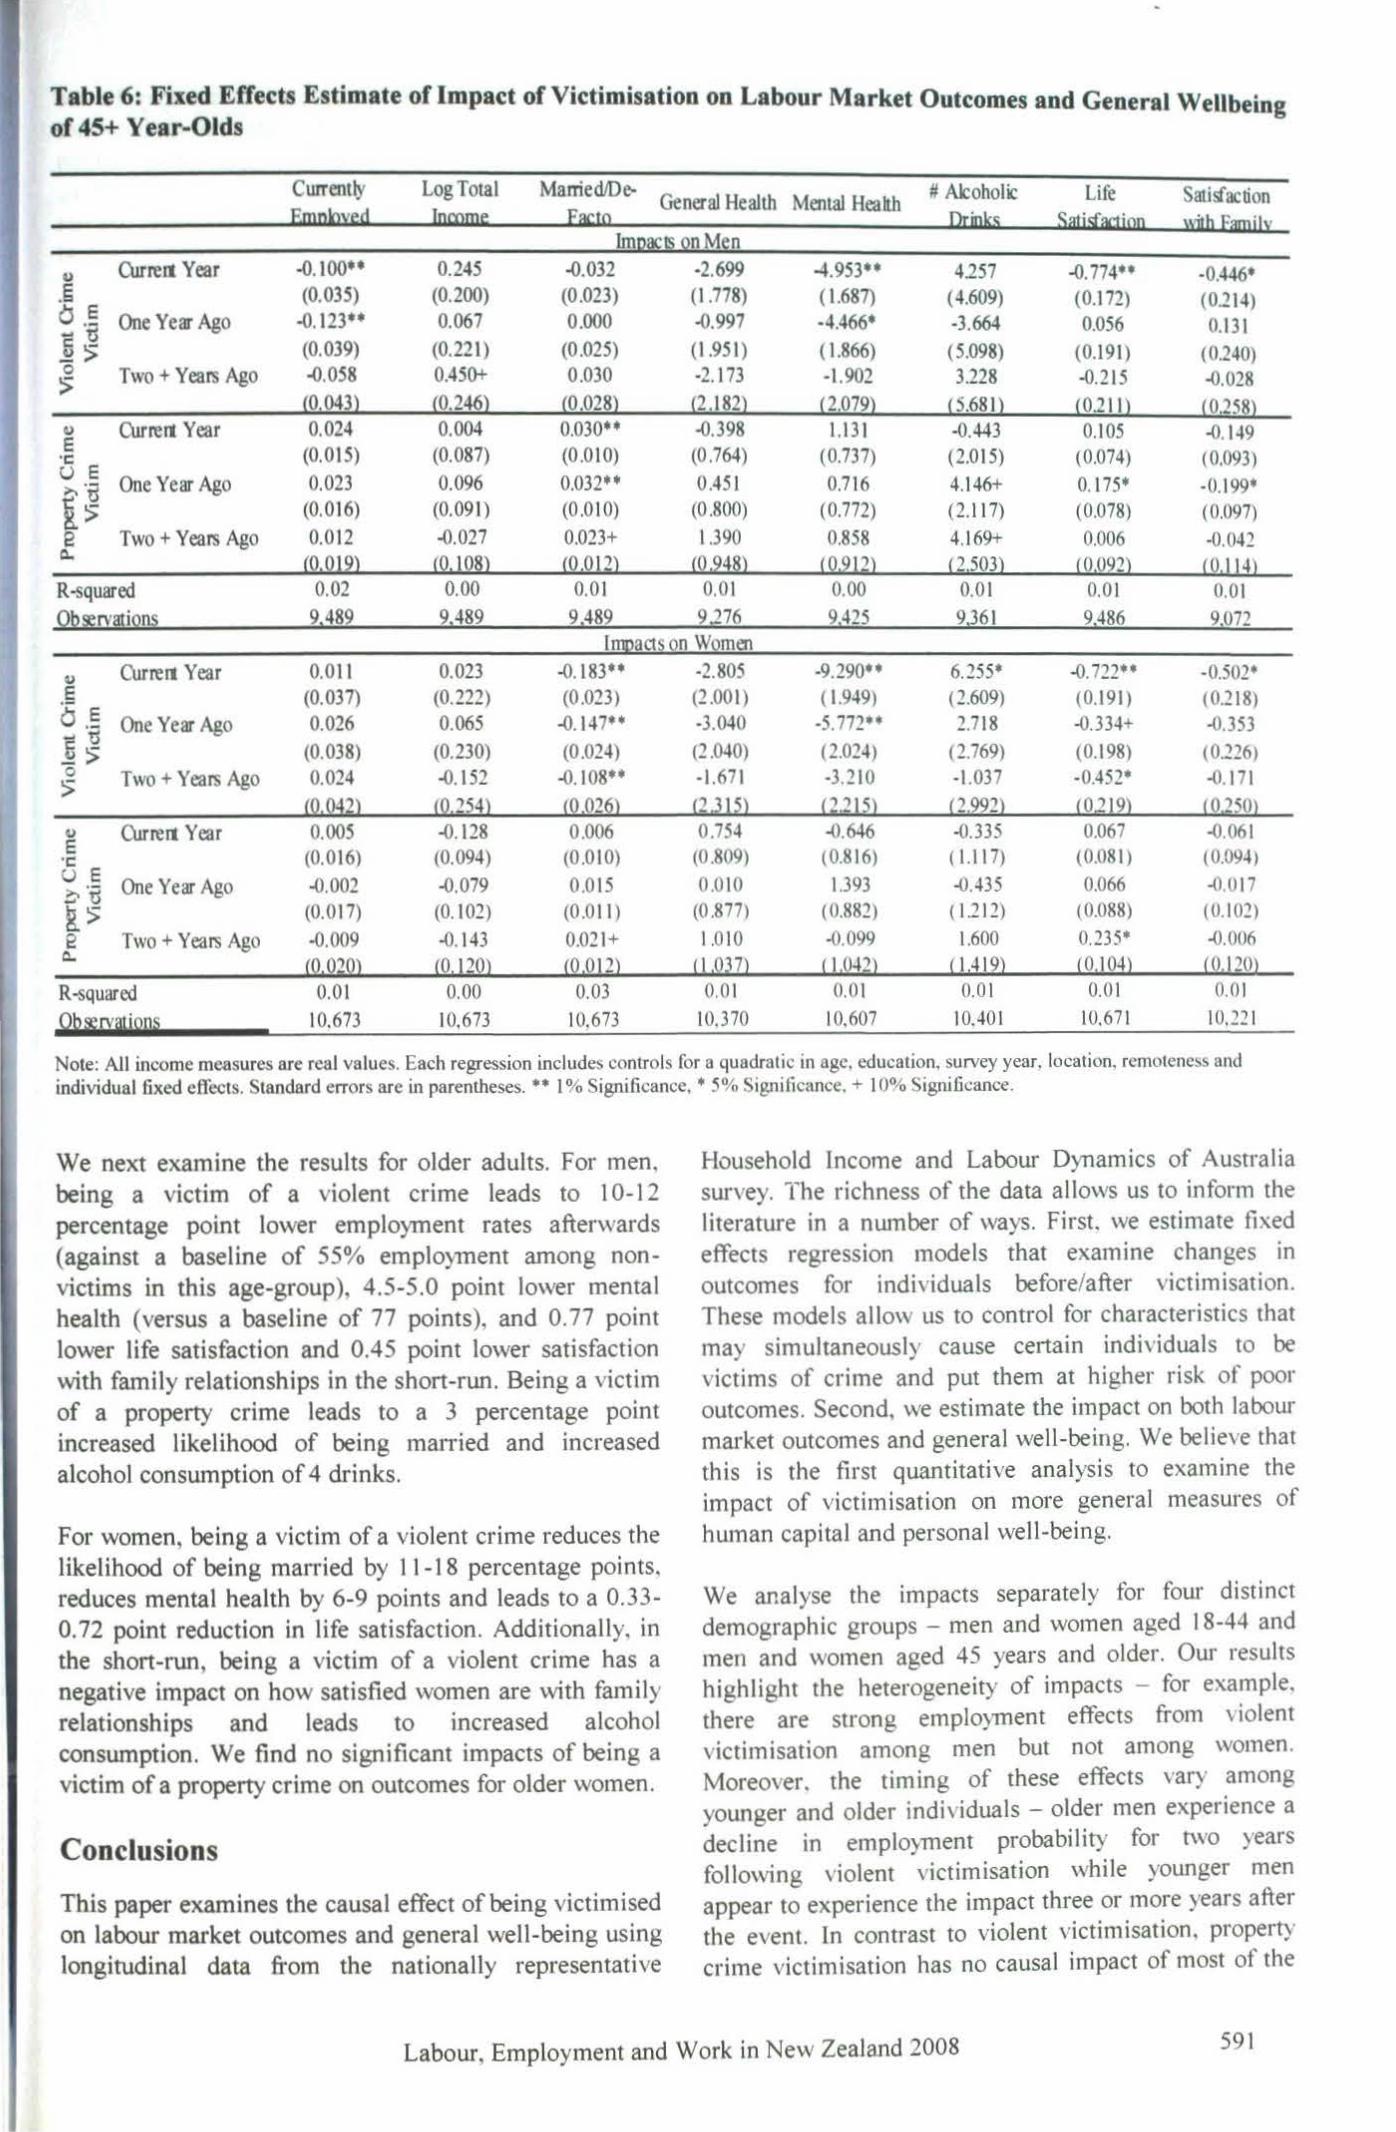
Table 6: Fixed Effects Estimate of Impact of Victimisation on Labour Market Outcomes and General Wellbein of 45+ Year-Olds g
Currently Log Total Ma tried/De-General Health Mental Health
# AJcoholic Life Satisfaction Ewckl:s:cd Iawmc ElK: IQ Ill:iDks Sill i :iac i OD
lmJ2i!£§ Qn M~n ~b F:~mjl:s:
4.) C\u'rett Year -0.100 .. 0.245 -0.032 -2.699 -4.953 .. 4257 -0.774 .. -0.446• .5 (0.035) (0.200) (0.023) (1.778) ( 1.687) (4.609) (0.172) (0.214)
~ ·~ One Year Ago -0.123 .. 0.067 0.000 -0.997 -4.466• -3.664 0.056 0.131 5> (0.039) (0.221) (0.025) (1.951) ( 1.866) (5.098) (0.191) (0.240) 0 Two+ Years Ago -0.058 0.450+ O.o30 -2.173 > -I. 902 3.228 -0.215 -0.028
(0.043) (0.246} (0.028) (2 .182) (2.079) '5.681) (0211) (0,258) 4.) C\u'rert Year 0.024 0.004 0.030 .. -0.398 1.131 -0.443 0.105 -0.149 E ·c (0.015) (0.087) (0.010) (0.764) (0.737) (2.015) (0.074) (0.093) U E t' 'fj One Year Ago 0.023 0.096 0.032 .. 0.451 0.716 4.146+ 0.175* -0.199•
&> (0.016) (0.091) (0.010) (0.800) (0.772) (2.117) (0.078) (0.097) e Two+ Years Ago 0.012 -0.027 0.023+ 1.390 0.858 4.169+ 0.006 -0.042
0.. (Q,Ql2l (Q,IOBl (Q,Q12l £Q,2~Bl (Q,21~) (2,503) (0,022) (Q,II4l
R-squared 0.02 0.00 0.01 0.01 0.00 0.01 0.01 0.01
Ql2zrvi!liQ~ 9,489 9,489 9,489 9116 9,425 9,361 9,486 9,072 l!!J12act~ gn WQmen
Q) Currert Year 0.011 0.023 -0.183•• -2.805 -9.290 .. 6.255• -0.722 .. -0.502• E (0.037) (0.222) (0.023) (2 .001) ( 1.949) (2.609) (0.191) (0.218) (5 .§ One Year Ago 0.026 0.065 -0.147•• -3.040 -5. 772•• 2.718 -0.334+ -0.353 .... t$ !> (0.038) (0.230) (0.024) (2 .040) (2.024) (2.769) (0.198) ( 0.226) 0 Two+ Years Ago 0.024 -0.152 -0.108 .. -1.671 -3.210 -1.037 -0.452* -0. 171 >
£Q,Q4Zl (0,154) (0,026) IZ,31 ~l ,~,2l~l (2,991} (0,219) (0,250} 4.) Currert Year 0.005 -0.128 0.006 0.754 -0.646 -0.335 0.067 -0.061 E ·c: (0.016) (0.094) (0.010) (0.809) (0.816) ( 1.117) (0.081) (0.094) u E o'B One Year Ago -0.002 -0.079 0.015 0.010 1.393 -0.435 0.066 -0.017
R> (0.017) (0.102) (0.011 ) (0 .877) (0.882) ( 1.212) (0.088) (0.10::!)
e Two+ Years Ago -0.009 -0.143 0.021+ 1.010 -0.099 1.600 0.235* -0.006 0..
(Q,Q,Ql (0,120) (0,012) !I.Q~7l (l,Q4~) ",412) (0,104) (Q,l~Q)
R-squared 0.01 0.00 0.03 0.01 0.01 0.01 0.01 0.01
Ob ;ryaUons 10.673 10,673 I 0.673 I 0.370 10.607 I 0.40 I 10.671 10,221
Note: All income measures are real values. Each regression includes controls for a quadratic in age, education. survey year. location, remoteness and individual fixed effects. Standard errors are in parentheses. •• I% Significance, • 5% Significance.+ I 0% Significance.
We next examine the results for older adults. For men, being a victim of a violent crime leads to I 0-12 percentage point lower employment rates afterwards (against a baseline of 55% employment among nonvictims in this age-group), 4.5-5.0 point lower mental health (versus a baseline of 77 points), and 0. 77 point lower life satisfaction and 0.45 point lower satisfaction with family relationships in the short-run. Being a victim of a property crime leads to a 3 percentage point increased likelihood of being married and increased alcohol consumption of 4 drinks.
For women, being a victim of a violent crime reduces the likelihood of being married by 1 1-18 percentage points, reduces mental health by 6-9 points and leads to a 0.33-0.72 point reduction in life satisfaction. Additionally, in the short-run, being a victim of a violent crime has a negative impact on how satisfied women are with family relationships and leads to increased alcohol consumption. We find no significant impacts of being a victim of a property crime on outcomes for older women.
Conclusions
This paper examines the causal effect of being victimised on labour market outcomes and general well -being using longitudinal data from the nationally representative
Household Income and Labour Dynamics of Australia survey. The richness of the data allows us to inform the literature in a number of ways. First. we estimate fixed effects regression models that examine changes in outcomes for individuals before/after victimisation. These models allow us to control for characteristics that may simultaneously cause certain individuals to be victims of crime and put them at higher risk of poor outcomes. Second, we estimate the impact on both labour market outcomes and general well-being. We believe that this is the first quantitative analysis to examine the impact of victimisation on more general measures of human capital and personal well-being.
We analyse the impacts separately for four distinct demographic groups - men and women aged 18-44 and men and women aged 45 years and older. Our results highlight the heterogeneity of impacts - for example. there are strong employment effects from violent victimisation among men but not among women. Moreover, the timing of these effects vary among younger and older individuals - older men experience a decline in employment probability for two years following violent victimisation while younger men appear to experience the impact three or more years after the event. ln contrast to violent victimisation, property crime victimisation has no causal impact of most of the
Labour, Employment and Work in New Zealand 2008 591

outcomes we consider in this paper. There is a temporary setback to life satisfaction following property crime victimisation.
Consistent with the adaptation literature, we find that although individuals experience lowered life satisfaction following victimisation, these impacts are not persistent and they return to baseline levels of satisfaction quickly. However, our results suggest strong, negative and persistent effects of violent victimisation on marriage/cohabitation probabilities for women but not for men. We think that this is an important channel through which women ·s long-term well-being can be adversely affected and is a significant social cost of crime.
Future Research
We are extending this research to examine the role that observable and unobservable characteristics play in determining the likelihood a person is victimised. The goal of this analysis is to highlight the circumstances in which OLS estimates of cross-sectional data are likely to give biased estimates of the impact of victimisation on individuals. We are also extending this research by examining the process of adapting to the event in more details
Notes
I. This paper uses confidentialised unit record file data from the Household. Income and Labour Dynamics in Australia (HILDA) survey. The HILDA Project \vas initiated and is funded by the Depattment of Families. Housing. Community Sen ices. and Indigenous Affairs (FaHCSIA) and is managed by the Melbourne Institute of Applied Economic and Social Research (MIAESR). The findings and views repo11ed in th is paper. however, are those of the authors and should not be attributed to FaHCSIA. MlAESR. or Motu.
2. Most industrialised countries and many developing countries now rely on these national victimisation surveys to provide inf01mation on crime. independent of police statistics. The information includes rates of victimisation, , ·anatJons in rates of 'ictimisation among segments of the population. the percentage of crimes reported to police. reasons for not reporting. fear of crime and perceptions of safety. and efforts undertaken by individuals to protect themselves from crime.
3. Victimisation rates are prevalence rates that count the percentage of people or households ,·ictimised at least once.
4. The other countries in this group were England and Wales. the Netherlands and Sweden, all wi th victimisation rates over 24%.
5.
6.
7.
8.
9.
I 0.
11.
12 .
Changes in rates of recorded crime may be the result of changes in the way crime data are collected, or changes in the proportion of victims reporting criminal offences to police. Thus, differences in crime rates across countries are not necessarily an indicator of differences in actual levels of crime in those countries.
See also Leigh (2004 ).
Violent crime comprises homicide, assault, sexual assault, robbery and abduction.
Property crime comprises burglary, motor vehicle theft (MVT) and other theft like pick-pocketing, bag snatching, shoplifting and bicycle theft.
The percentage of prisoners sentenced for violent offences increased from 38% in 1986 to 47% in 1995 and remained steady thereafter (Australian Institute of Criminology 2006. Ausu·alian crime: facts and figures 2005).
Other examples include "Pregnancy I pregnancy of partner", '·Death of a close friend", and ''Promoted at work".
Employment status measures whether the individual is currently employed, benefit receipt measures whether an individual receives income from any government benefit, total annual income is the summation of all income sources for the individual in the last year, and total annual household income is the summation of all income sources in the last year for all household members. All wage and income measures are in 2001 Australian dollars.
The SF-36 questionnaire collects data on eight health domains: physical functioning, rolephysical, bodily pain, general health , vitality, social functioning, role-emotional, and mental health. Index scores are created for each domain by transforming the appropriate questions from among the thirty-six. These indexes are scored 0-1 00, with I 00 representing perfect health on each index. HILDA asks a general question on each individual' s overall life satisfaction. Another question asks how satisfied or dissatisfied each individual is with a number of personal relationships. We calculate the mean response across all of the following relationships which are applicable to the individual: i) their relationship with their parmer, ii) their relationship with their children, iii) their partner 's relationship with their children. iv) how well the children in the household get along with each other, v) their relationship with their parents, and vi) their relationship with their (most recent) former spouse or parmer. Each of these measures is asked on a 0-1 0 scale with a 0 indicating an individual
Labour. Employment and Work in New Zealand 2008 592
13.
14.
15.
16.
is totally dissatisfied and a 1 0 indicating they are totally satisfied with their life or relationships.
HILDA asks individuals a number of questions about their neighbourhood. We examine each individual's opinion on the frequency of the following events in their neighbourhood: traffic noise, noise from airplanes, trains or industry, homes and gardens in bad condition, rubbish and litter lying around, teenagers hanging around, people being hostile and aggressive, vandalism and damage to property, and burglary and theft. These questions are asked on a l-5 scale with a 1 indicating that an event never happens in their neighbourhood and a 5 indicating that an event is very common.
Although we interpret the results in terms of the impact of having been victimised, it is worth emphasising that we are actually measuring the impact of reporting having been victimised. Given the nature of the event. it is reasonable to assume that victimisation may be under-reported or over-reported. However, our results will be unbiased as long as the likelihood of reporting being victimised conditional on having actually been victimised is not systematically related to the examined outcomes. It is difficult to know apriori if this is likely to be the case, but it is difficult to tell a compelling story on why the likelihood of reporting this event would be related to any particular outcome.
This implies using linear probability models (LPM) when the outcome variable is binary.
It is worth noting that the impact of having been victimised two years ago is only identified from the outcomes for individuals victimised in the previous year in 2002 and 2003 and the impact of having been victimised three or four years ago is only identified from the outcomes for individuals victimised in the previous year in 2002. Thus. if the impact of being victimised changes over this time period, these results will be confounded. We do not suspect that this is likely to be an issue over such a short time period.
References
Angrist, J.D. (2001 ), ''Estimation of Limited-Dependent Variable Models with Binary Endogenous Regressors: Simple Strategies for Empirical Practice," Journal of Business and Economic Statistics, Vol. 19, No. 1.
Becker, G. ( 1968), "Crime and Punishment: An Economic Analysis", Journal of Political Economy, Vol. 76, No.2, pp.169-217.
Blau, J. and Peter B. ( 1982), "The Cost of Inequality: Metropolitan Structw·e and Violent Crime"
' American Sociological Review, Vol. 47, No. 1, pp.114-129.
Brickman, P. & Camp bell, D. T. ( 1971 ). Hedonic relativism and planning the good society. In M. H. Appley (Ed.), Adaptation-level theory (pp.287-305). New York: Academic Press.
Clark, A. E., Diener, E., Georgellis, Y. and Lucas, R.E. (2003), "Lags and Leads in Life Satisfaction: A Test of the Baseline Hypothesis", DELTA Working Paper, No.2003-14.
Cohen, M. (2000), "Measuring the Costs and Benefits of Crime and Justice", Criminal Justice, Chapter in Vol.4: Measurement and Analysis of Crime and Justice, pp.263-316.
Freedy, J ., Heidi R., Dean K., Bonnie D. and Ritchie T. (1994), "The Psychological Adjustment of Recent Crime Victims in the Criminal Justice System··. Journal of Interpersonal Violence. Vol.9, No.4, pp.450-468
Frey, B. and Alois S. (2002), ''What Can Economists Learn from Happiness Research?". Journal of Economic Literature, Vol. 40, No. 2, pp. 402-435.
Gibson, J. and Bonggeun K.(2006), ''Measw·ement Error and the Effect of Inequality on Experienced versus Reported Crime'', University of Waikato Working Papers in Economics #06/05
Glaeser, E., Bruce S. and Jose S. ( 1996), "Crime and Social Interactions'', Quarterly Journal of Economics. Vol.lll. No.2. pp.507-548.
Grogger, J ( 1995). "The Effect of Arrests on the Employment and Earnings of Young Men". Quarterly Journal of Economics. Vol.11 0, No.1. pp. 51-71.
Jarjoura, R. and Douglas S. ( 1989), "Household Characteristics, Neighborhood Composition and Victimization Risk''. Social Forces. Vol.68. No.2, pp.62 1-640.
Kesteren, J.N. van, Mayhew, P. and Nieuwbeerta, P. (2000), "Criminal Victimisation in Seventeen Industrialised Counn·ies: Key-findings from the :woo international Crime Victims Survey". The Hague. Ministry of Justice. WODC
Leigh, A. (2004 } ... More Police Mean Fewer Mean Streets··. The Australian. May 11.
Levitt, S. ( 1999), "The Changing Relationship Between Income and Crime Victimisation'', Federal Reserve Bank ofNY Economic Policy Review: 87-98
Labour, Employment and Work in New Zealand 2008 593
Lucas, R.E., Clark, A. E., Diener, E., and Georgellis, Y. (2003), "Re-examining adaptation and the setpoint model of happiness: Reactions to changes in marital status", Journal of Personality and Social Psychology, 84 (3), 527-539.
Lurigio, A. (1987), "Are all Victims Alike? The Adverse, Generalized, and Differential Impact of Crime", Crime and Delinquency, Vol.33, No.4, pp.452-467
Macmillan, R. (200 1 ), "Violence and the Life Course: The Consequences of Victimization for Personal and Social Development", Annual Review of Sociology, Vol. 27, pp. 1-22.
Meier, R. and Terance M. (1993), "Understanding Theories of Criminal Victimization", Crime and Justice, Vol. 17, pp. 459-499.
Mietbe, T., Mark S. and Scott L. ( 1987), ··social Differentiation in Criminal Victimization: A Test of Routine Activities/Lifestyle Theories", American Sociological Review, Vol. 52, No. 2, pp. 184-194
Rizzo, M. ( 1979), "The Cost of Crime to Victims: An Empirical Analysis", Journal of Legal Studies, Vol.8, No. 1, pp.177-205.
Sampson, R. ( 1985), ''The Structural Determinants of Personal Victimization", Journal of Research in Crime and Delinquency, No. 1, pp. 7-40.
Sampson, R. ( 1987), "Personal Violence by Strangers: An Extension and Test of the Opportunity Model of Predatory Victimization", Journal of Criminal Law and Criminology, Vol. 78, No. 2., pp.327-356.
Viscusi, K. ( 1993), ''The Value of Risks to Life and Health'', Journal of Economic Literature, Vol.31, No.4: 1912-1946.
Wilson, W. J . ( 1987), The Truly Disadvantaged: The Inner City, the Underclass, and Public Policy, University of Chicago Press. Chicago.
Authors
Malathi Velamuri Lecturer School of Economics and Finance Victoria University of Wellington P.O. Box 600 Wellington 6140 Malathi. [email protected]. nz
Steven Stillman Senior Fellow Motu Economic and Public Policy Research P.O. Box 24390 Wellington Steven. [email protected]. nz
Labour, Employment and Work in New Zealand 2008 594