
The impact of corporate and personal income taxes on the location of firms and on employment: some...
29
A joint Initiative of Ludwig-Maximilians-Universität and Ifo Institute for Economic Research Working Papers April 2001 CESifo Center for Economic Studies & Ifo Institute for Economic Research Poschingerstr. 5, 81679 Munich, Germany Tel.: +49 (89) 9224-1410 Fax: +49 (89) 9224-1409 e-mail: [email protected] ˝ An electronic version of the paper may be downloaded • from the SSRN website: www.SSRN.com • from the CESifo website: www.CESifo.de * Paper presented at the Trans-Atlantic Public Economics Seminar on ‘Taxation of Financial Income’ in Gerzensee (Switzerland), May 22 – 24, 2000. We would like to thank Lans Bovenberg, Roger Gordon, and Jim Poterba as well as the participants of the seminar for valuable suggestions and discussions. Any errors in the paper should be solely attributed to the authors. THE IMPACT OF CORPORATE AND PER- SONAL INCOME TAXES ON THE LOCATION OF FIRMS AND ON EMPLOYMENT: Some Panel Evidence for the Swiss Cantons Lars P. Feld Gebhard Kirchgässner* CESifo Working Paper No. 455 Direct URL: http://papers.ssrn.com/paper.taf?abstract_id=270181
Transcript of The impact of corporate and personal income taxes on the location of firms and on employment: some...
A joint Initiative of Ludwig-Maximilians-Universität and Ifo Institute for Economic Research
Working Papers
April 2001
CESifo
Center for Economic Studies & Ifo Institute for Economic ResearchPoschingerstr. 5, 81679 Munich, Germany
Tel.: +49 (89) 9224-1410Fax: +49 (89) 9224-1409e-mail: [email protected]
ÍAn electronic version of the paper may be downloaded• from the SSRN website: www.SSRN.com• from the CESifo website: www.CESifo.de
* Paper presented at the Trans-Atlantic Public Economics Seminar on ‘Taxation ofFinancial Income’ in Gerzensee (Switzerland), May 22 – 24, 2000. We would like to thankLans Bovenberg, Roger Gordon, and Jim Poterba as well as the participants of theseminar for valuable suggestions and discussions. Any errors in the paper should be solelyattributed to the authors.
THE IMPACT OF CORPORATE AND PER-SONAL INCOME TAXES ON THE LOCATION
OF FIRMS AND ON EMPLOYMENT:Some Panel Evidence for the Swiss Cantons
Lars P. FeldGebhard Kirchgässner*
CESifo Working Paper No. 455
Direct URL: http://papers.ssrn.com/paper.taf?abstract_id=270181
CESifo Working Paper No. 455April 2001
THE IMPACT OF CORPORATE AND PERSONALINCOME TAXES ON THE LOCATION OF FIRMS
AND ON EMPLOYMENT:SOME PANEL EVIDENCE FOR THE SWISS CANTONS
Abstract
The impact of corporate income taxes on location decisions of firms is widelydebated in the tax competition literature. Tax rate differences acrossjurisdictions may lead to distortions of firms’ investment decisions. Empiricalevidence on tax induced relocation and subsequent economic development inthe U.S. and Europe is still inconclusive. Much the same applies to Switzerland.While there is some evidence on personal income tax competition betweenSwiss cantons, evidence on the impact of intercantonal corporate income taxdifferences on the location of business within Switzerland is missing. In thispaper, we present econometric evidence on the influence of corporate andpersonal income taxes on the regional distribution of firms in 1981 and 1991and on cantonal employment using a panel data set of the 26 Swiss cantonsfrom 1985 to 1997. The results show that corporate and personal income taxesdeter firms to locate in a canton and subsequently reduce cantonal employment.
JEL Classification: H71, H73, H25
Keywords: Corporate income taxes, personal income taxes, tax competition,business location
Lars P. FeldUniversity of St. Gallen
SIAWDufourstr. 48
9000 St. GallenSwitzerland
Gebhard KirchgässnerUniversity of St. Gallen
SIAWDufourstr. 48
9000 St. GallenSwitzerland
1 Introduction
The interest of politicians, economists and the general public in international and interregional
tax competition is lasting for decades now. This holds for example for the European Union
(EU) where proposals about a minimum harmonisation of corporate and capital income taxes
are presented again and again. It also holds for the group of OECD countries that pushes in the
direction of a basic harmonisation and information exchange about corporate and capital in-
come (OECD, 1998). Although Switzerland, often blamed of being one of the tax havens in
OECD countries, still refuses to adjust to international tax harmonisation pressures, some dis-
cussion about corporate and personal income tax harmonisation in Switzerland at the level of
the states (cantons) takes place, that has resulted in a tax harmonisation law for the Swiss
cantons in 1993. This law forces the Swiss cantons to comply with a set of minimum stan-
dards of personal and corporate income taxation in order to prevent harmful tax competition
among them. Indeed, tax competition for business location should be considerable in Swit-
zerland given the large variation in corporate income tax burden between the cantons.
Theoretically, corporate income tax competition will lead to allocative distortions which can
be circumvented by proper economic policy. According to H.-W. SINN (1997), tax competi-
tion results in a suboptimal provision of public services if the latter are public goods in the
Samuelsonian sense and if governments do „what they ought to do“ (p. 254). R.H. GORDON
(1983, 1986, 1992) and A. RAZIN and E. SADKA (1991) show how tax harmonisation or at
least co-operation between governments may lead to Pareto-improvements as compared to the
competition case. The precondition for allocative distortions to arise is that private investment
is actually influenced by fiscal incentives.
The evidence on the impact of taxes on location and investment decisions of firms and subse-
quent economic development is however inconclusive. On the one hand, some authors, like
M.P. DEVEREUX and R. GRIFFITH (1998) or R. ALTSHULER and H. GRUBERT (1999), find a
strong impact of corporate income taxes on investment and financing decisions of multina-
tionals. T.J. BARTIK (1985), L.E. PAPKE (1991) and J.R. HINES (1996) present evidence on the
negative relationship between taxes and firms’ location decisions in U.S. states. ST.T. MARK,
TH.J. MCGUIRE and L.E. PAPKE (2000) report a significant negative impact of business taxes
on annual employment growth in the metropolitan area of Washington, D.C. On the other
hand, D.W. CARLTON (1983) and R. TANNENWALD (1996), among others, find contradicting
evidence.1)
These studies mainly use data on the regional location decisions of U.S. firms or on invest-
ment decisions of U.S. multinationals. Given that the U.S. studies do not tell an unambiguous
1. J.R. HINES (1997) provides a survey of the studies of international tax competition while R.J. NEWMAN and
D.H. SULLIVAN (1988), M.J. WASYLENKO (1991), ST.T. MARK, TH.J. MCGUIRE and L.E. PAPKE (1997) andL.P. FELD (2000) summarise the empirical results of interregional fiscal competition for business.
– 2 –
story about the impact of taxes on private investment and firm location, evidence from Euro-
pean countries may be welcome to lend support for or against this relationship. However,
there is only limited evidence on corporate income tax competition in the European context.
Despite its strong variation in the firms’ tax burden, much the same holds for Switzerland,
although there are consistent results about personal income tax competition.2) The reason for
this lack of results is that micro-level data on individual firms are seldom available in Euro-
pean countries and particularly not in Switzerland.3)
In this paper, we present first econometric evidence on the impact of taxes on the regional
distribution of firms using two pooled cross sections of the 26 Swiss cantons for the tax peri-
ods 1981/82 and 1991/92 and on total cantonal employment using a panel data set of the can-
tons from 1985 to 1997. We focus on the role that the corporate and the personal income tax
burden play for location decisions and the subsequent changes in employment by following
the approach of D.W. CARLTON (1983). In addition to taxes, we introduce real wages, public
education and public capital spending and some socio-demographic variables as explanatory
factors in order to control for other determinants of business climate at the Swiss cantonal
level. Our results indicate that corporate and personal income taxes contribute significantly to
the explanation of the regional distribution of firms and of regional differences in employment
in Switzerland. This result can be interpreted as an outcome of competition for business be-
tween Swiss cantons and of tax incentives for profit shifting.
The paper is organised as follows: First, we give a short description of the Swiss fiscal con-
stitution in Section 2. In Section 3 the model which serves as the basis of our estimates is de-
scribed. The estimation results for the impact of corporate and personal income taxes on the
regional distribution of small and medium sized firms and on cantonal employment are pre-
sented in Section 4. We conclude with some final remarks in Section 5.
2 The Swiss Fiscal Constitution
Switzerland consists of three government levels, which establish strong fiscal competencies of
the single cantons and local government units. This holds especially true for the tax structure:
The main progressive taxes on personal and corporate income are state and local taxes. The
cantons have the basic power to tax income, wealth and capital. The local jurisdictions can
2. See, e.g., G. KIRCHGÄSSNER and W.W. POMMEREHNE (1996), L.P. FELD (2000a) or L.P. FELD and G.
KIRCHGÄSSNER (2001).
3. Nevertheless, there are studies using time series to analyse the impact of corporate income taxes on Swissaggregate investment. G. JUNGE and M. ZARIN-NEJADAN (1986) find a significant negative relationship bet-ween corporate income taxes and the share of investment from GDP for the period 1953 to 1980. M. ZARIN-NEJADAN (1992) confirms these results in a similar model for the time period 1953 to 1986. M. ZARIN-NEJADAN (1991) also computes effective marginal corporate income tax rates for the Swiss cantons in 1987,but does not use them in a cross section regression analysis.
– 3 –
levy a surcharge on cantonal direct taxes and raise own property and wealth taxes. The central
government relies mainly on indirect (proportional) taxes, the VAT and specific consumption
taxes like the mineral oil tax. It also relies on a source tax on interest income. There is as well
a small but highly progressive federal income tax, which, together with revenue from the
source tax on interest income, amounts to 34 percent of total federal tax revenue in 1995,
while the cantons and municipalities rely on income, wealth and property taxes to about 50
percent of their total revenue and 95 percent of their tax revenue. Private capital gains are not
taxed at all in Switzerland. While there is no federal or cantonal deductibility of taxes paid at
the cantonal or local level in the case of personal income taxes, such a tax deductibility exists
in the case of corporate income taxes.
All in all, corporate income taxes in Switzerland vary considerably between the cantons. From
anecdotal evidence it is known that two tax havens are in or close to Switzerland, the small
country of Liechtenstein, which forms an economic union with Switzerland, and the canton of
Zug. Taking the value of the (weighted) average for Switzerland as 100, the index of the tax
burden of corporate income and capital taxes varied from 56.8 in the canton of Zug to 144.2 in
Neuchâtel in 1990, the respective average tax burden for the whole country being 100, while
the standard deviation was only slightly reduced from 18.33 in 1970 to 17.94 in 1990. In
1994, it varied from 57.9 in the canton of Zug to 146.0 in the canton of Graubünden, and the
standard deviation even increased to 18.67.
Switzerland is supposed to have a relatively low average effective tax burden in comparison to
other OECD countries. Since 1998, corporate income is taxed proportionally by a rate of 8.5
percent at the federal level. Revenue from taxes on profits and capital amounted to 1.9 percent
of GDP in 1996. In the OECD and the EU, this figure was 3.1 percent and thus considerably
higher.4) On the other hand, the Swiss system of corporate income taxation appears to be quite
complicated not only but also because of the sub-federal competencies. All in all, capital may
bear seven different taxes: the corporate income tax on profits, the capital tax, the federal
source tax on interest and dividend income, an emission charge, the property tax, the church
tax and – in some cantons – a minimum tax if revenue from the corporate income tax does not
reach a certain amount. M. ZARIN-NEJADAN (1997) estimates that taxation of profits and
capital induces administrative costs of about SFr 14’000 per firm and year, an amount which
is about 40 percent of the average administrative costs small and medium sized firms bear due
to public regulation and about 3 percent of their investment in equipment.
Three characteristics are fundamental to the taxation of corporate income:
(1) In many cantons, the tax on profits follows a progressive tax schedule according to the
rate of return on capital. For reasons of taxation, this rate of return is measured by the
firm’s effective profits divided by the amount of capital and reserves according to the 4. See OECD, Revenue Statistics of OECD Member Countries 1965-1997, Paris, OECD 1998, pp. 79ff.
– 4 –
firm’s accounts. As mentioned above, the federal level levies a proportional tax on cor-
porate profits since the tax reform act of 1998. Seven cantons have used a proportional
tax rate before that reform while the canton of Geneva introduced it after the reform.
(2) In addition to taxation of profits according to the rate of return on capital, capital is
taxed separately by all cantons. In most cases a proportional rate is used. The federal
government abolished its tax on firms’ capital in 1998.
(3) The Swiss corporate income tax has to be characterised as a classical corporate income
tax as it is employed in the U.S. Thus, profits are taxed at the corporate level and again
at the shareholder level as dividend income.
BEFR
NE
SO
JU
GE
VD
VS
UR
LU
OW NW
SZ
ZG
BL
BS
SH
GL
ZHAG AR
AI
SG
GR
TG
TI
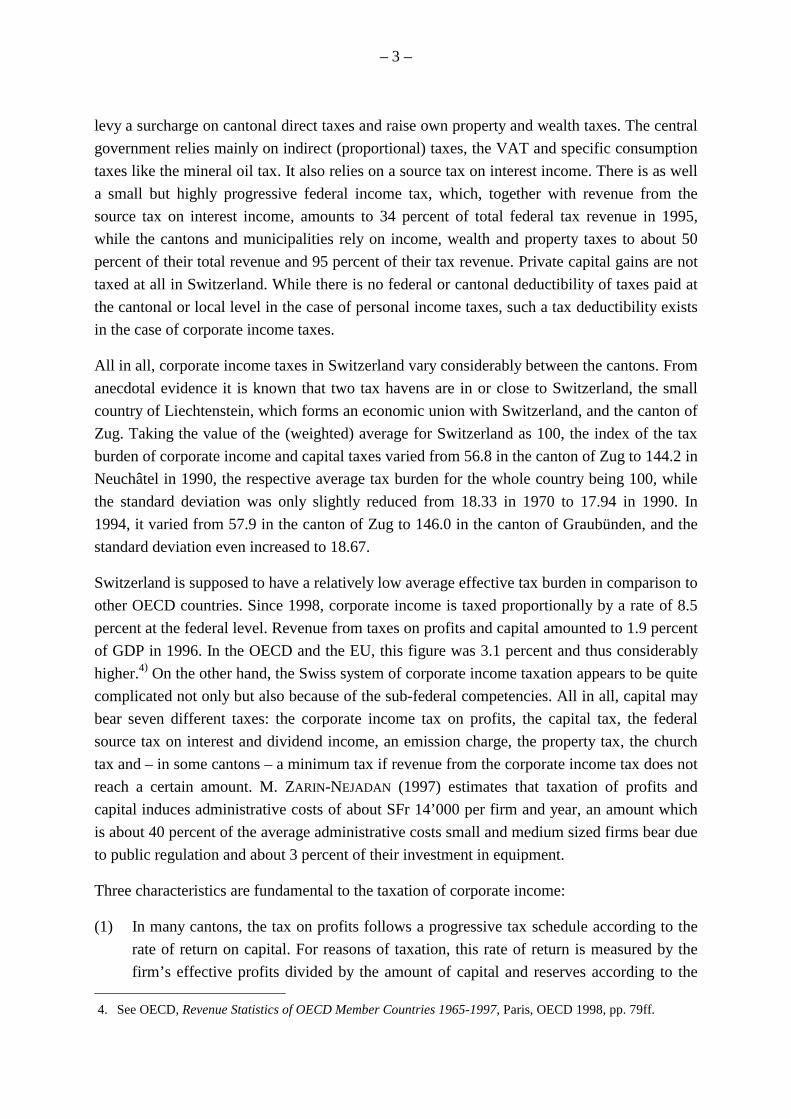
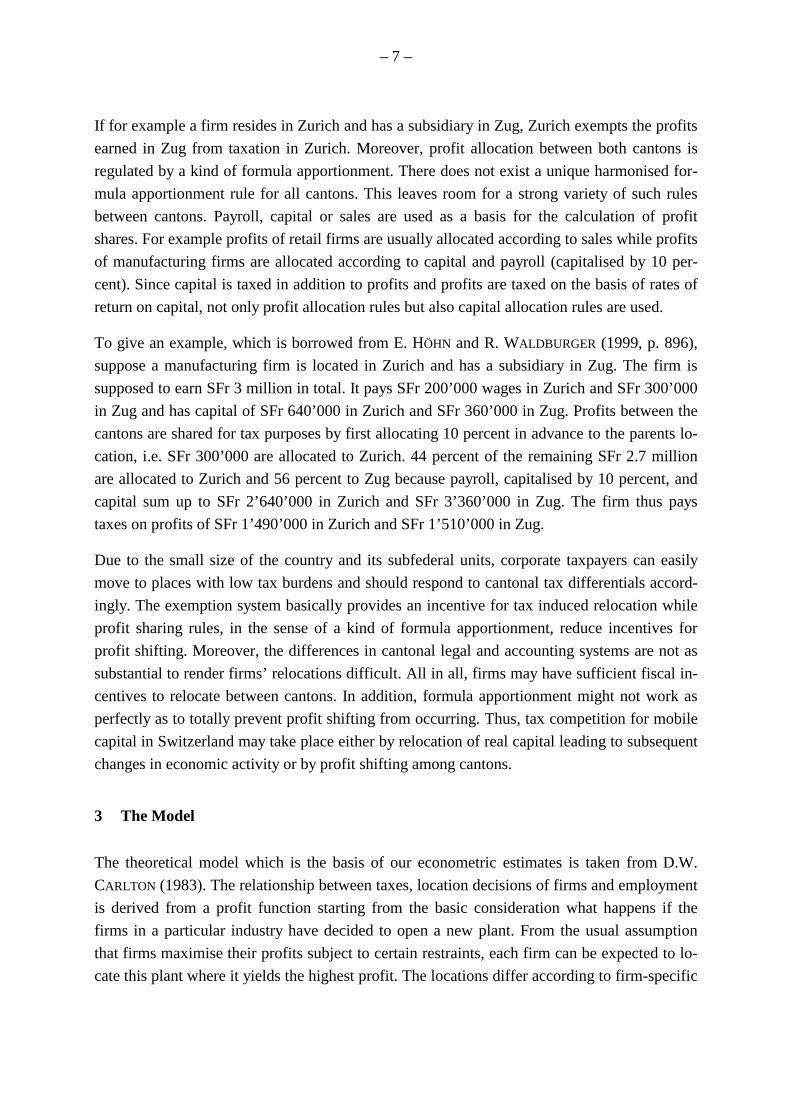
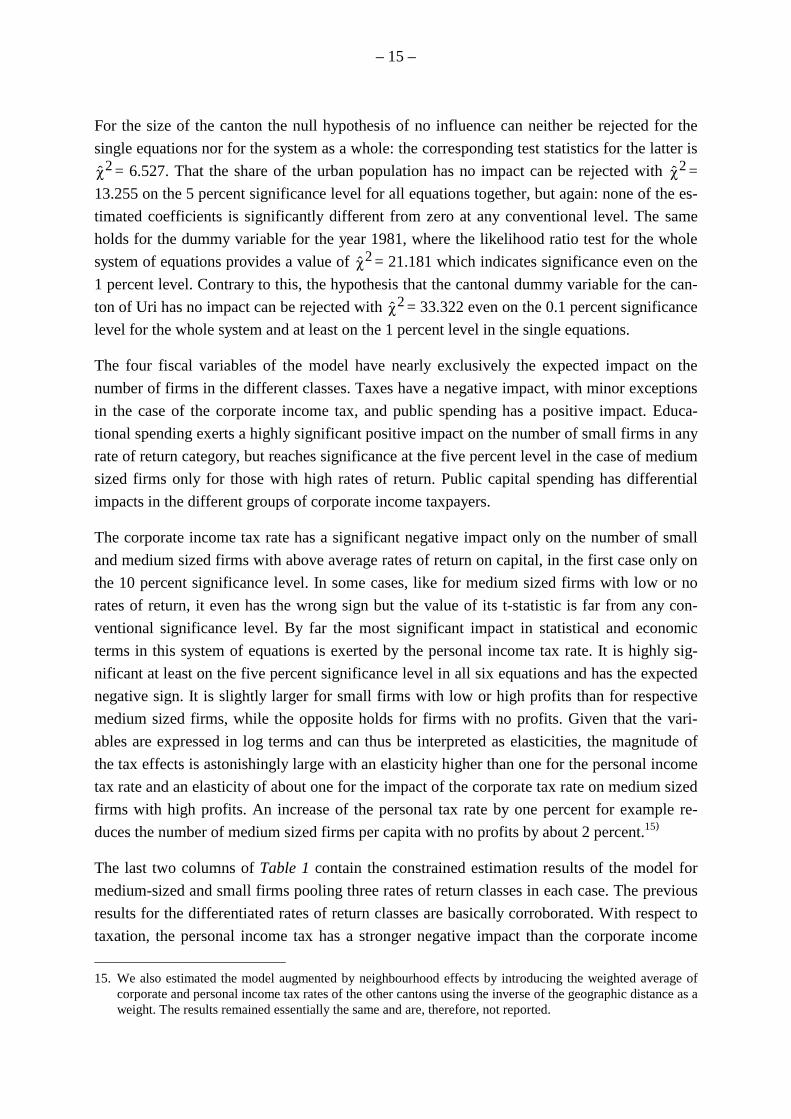
Figure 1: The Six Regimes of Corporate Income Taxation in the 26 Cantons, August 1999
Before the tax reform act of 1998, the federal level taxed profits progressively in a three step
schedule using a proportional basic tax rate and two surcharges according to the firm’s rate of
return. It is still the form of progressive corporate income taxation that is most often used at
the cantonal level. Figure 1 shows the six regimes of the taxation of profits in Switzerland.
Profits are taxed:
(1) Progressively according to the amount of taxable profit in the canton of Graubünden,
GR (light grey).
– 5 –
(2) In three steps according to the rate of return in the cantons of Zurich, ZH, Glarus, GL,
Vaud, VD, Valais, VS, Neuchâtel, NE (middle dark grey).
(3) In two steps according to the rate of return in the cantons of Uri, UR, Solothurn, SO,
Aargau, AG and Thurgau, TG (shaded white).
(4) Progressively according to the rate of return on capital in the cantons of Schwyz, SZ,
Zug, ZG, Fribourg, FR, Basel-city, BS and Basel-county, BL (darkest area).
(5) Some intermediate systems, mixing a taxation according to the rate of return and taxable
profits in the cantons of Bern, BE, Schaffhausen, SH and St. Gallen, SG (dark grey).
(6) A proportional tax rate is levied in the cantons of Lucerne, LU, Obwalden, OW, Nid-
walden, NW, Appenzell a.Rh., AR, Appenzell i.Rh., AI, Ticino, TI, Geneva, GE and
Jura, JU (white areas) and at the federal level.
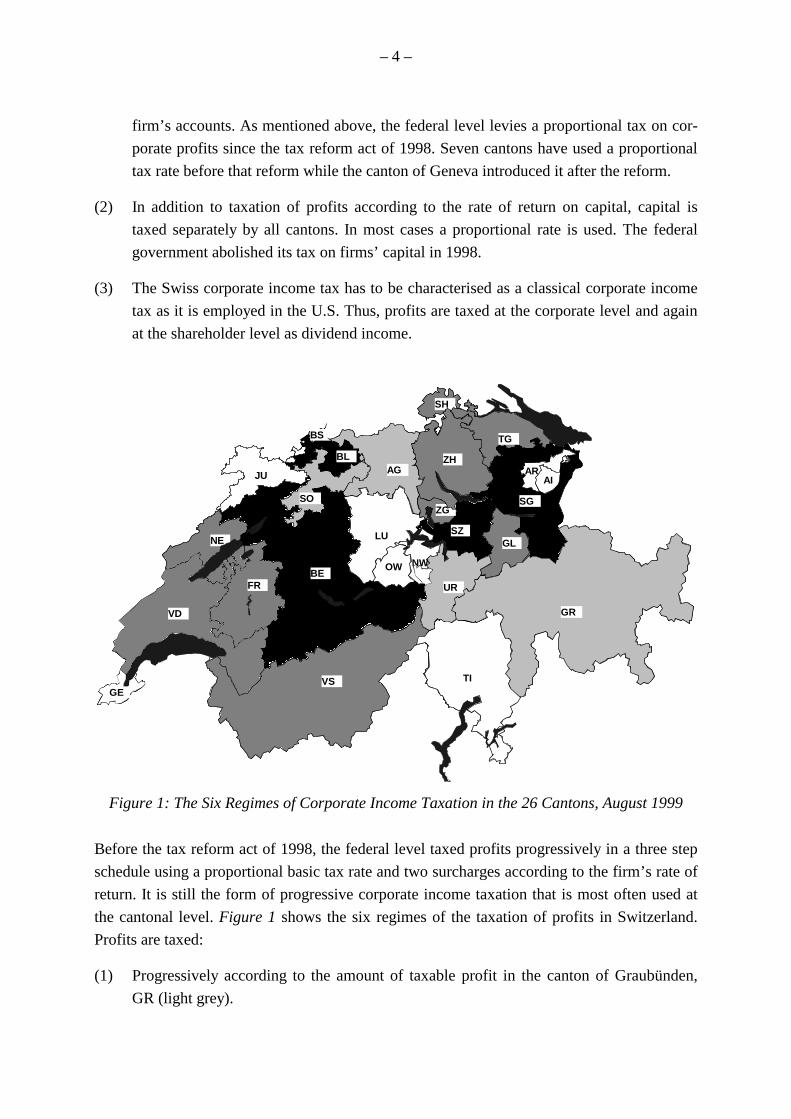
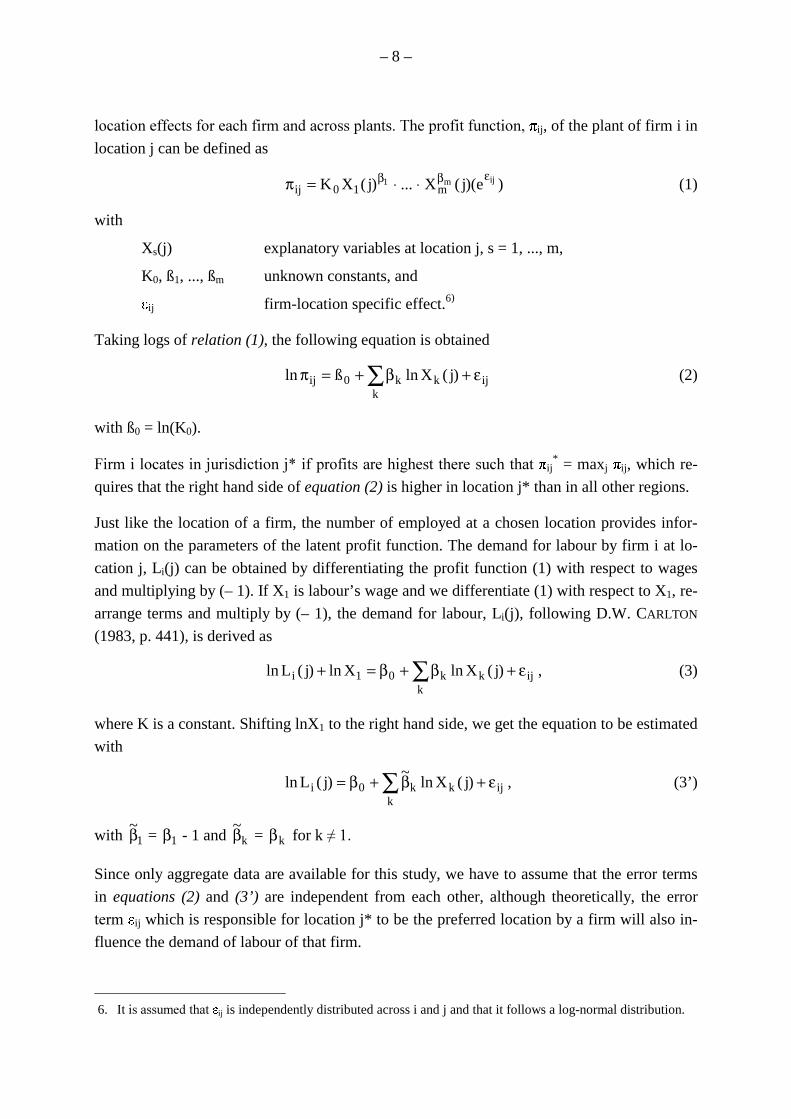
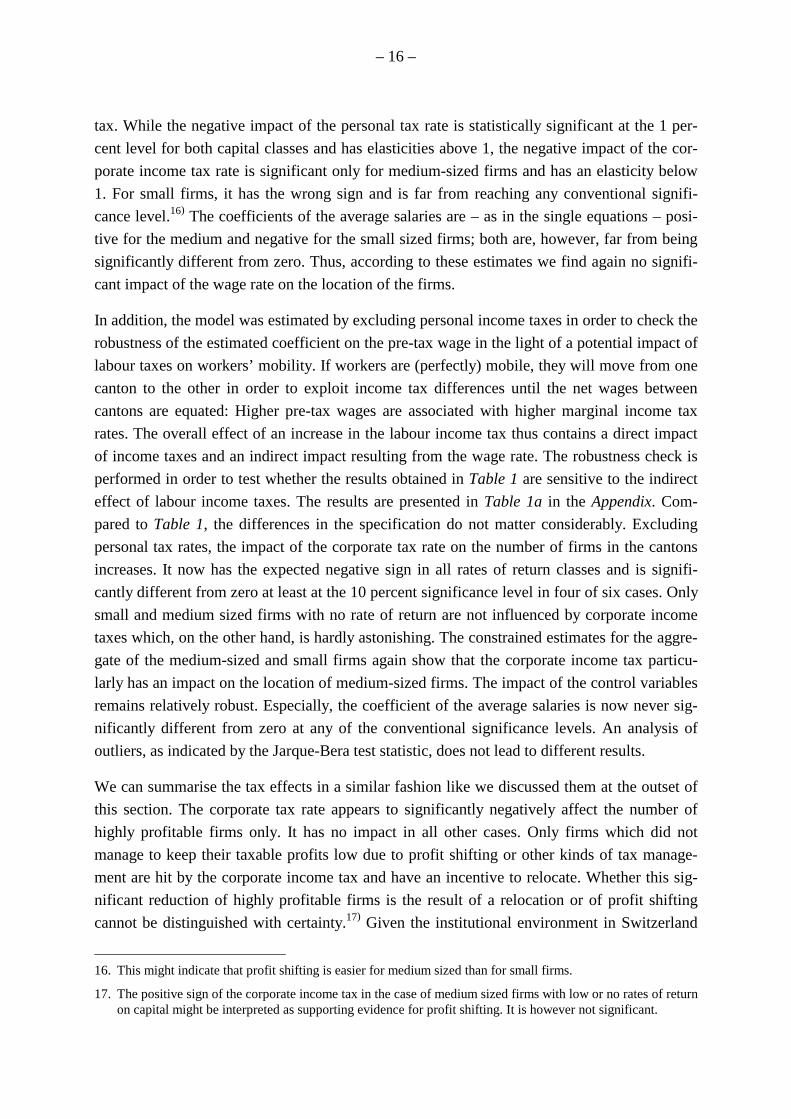
Figure 2: The Distribution of Firms in Different Rate of Return Classes,in Switzerland, Taxation Period 1991/1992
Because of the importance of the rates of return in Swiss taxation, it is necessary to have a
look at the distribution of firms according to their rate of return (in percent) shown by Figure
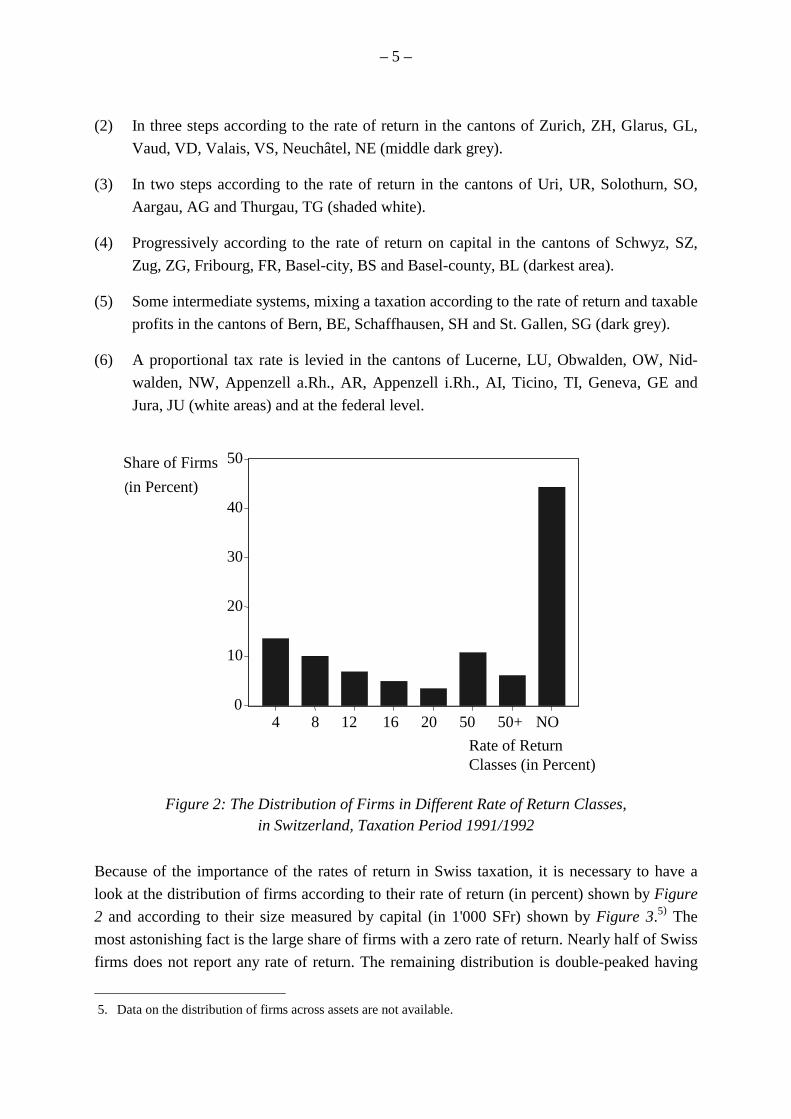
2 and according to their size measured by capital (in 1'000 SFr) shown by Figure 3.5) The
most astonishing fact is the large share of firms with a zero rate of return. Nearly half of Swiss
firms does not report any rate of return. The remaining distribution is double-peaked having
5. Data on the distribution of firms across assets are not available.
0
10
20
30
40
50
4 8 12 16 20 50 50+ NO
Share of Firms
(in Percent)
Rate of ReturnClasses (in Percent)
– 6 –
the second highest share of firms at a rate of return of 4 percent, the third highest share at one
of 50 percent, and a continuously declining importance of rate of returns in between. This rate
of return distribution of firms points to the fact that firms appear to be rather successful in
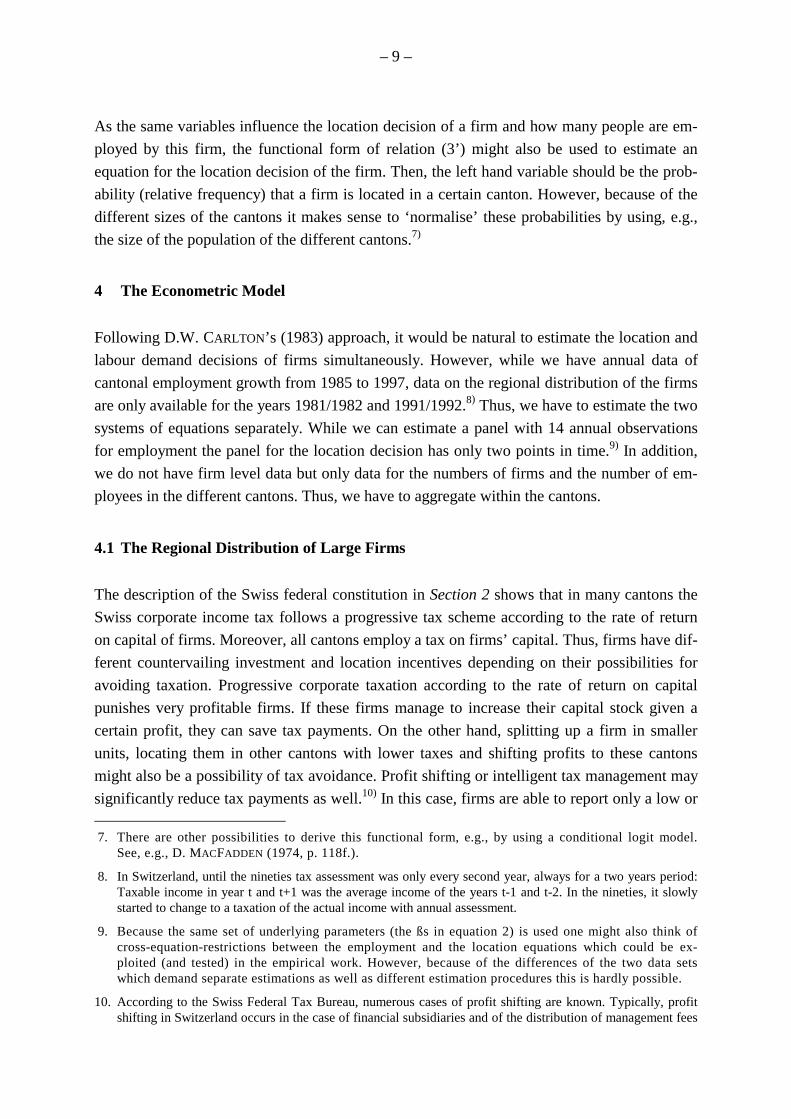
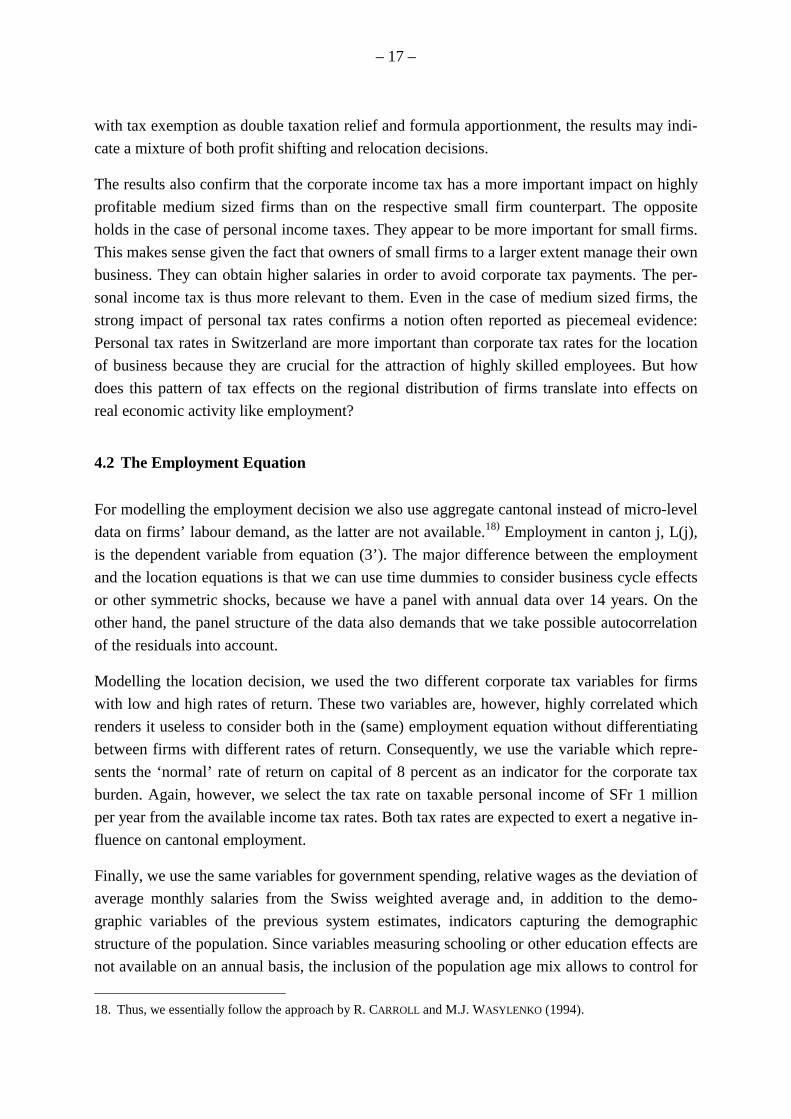
their tax management. The size distribution of firms is positively skewed with the highest
share of firms having a capital between SFr 50'000 and SFr 100'000. Large firms in Switzer-
land are those with SFr 5 million capital or more, a figure that may at best characterise me-
dium-sized firms in other countries. Anyway, small and medium sized firms in Switzerland
appear to be relatively more important in sheer number than large firms.
Figure 3: The Distribution of Firms in Different Capital Classes,
in Switzerland, Taxation Period 1991/1992
A particular feature of corporate income taxation in Switzerland is the fact that holding com-
panies are taxed with lower rates or, in some cantons, not at all in order to avoid double taxa-
tion of profits of parent and affiliate companies. On the other hand, generous tax exemptions
for holding companies give incentives for profit shifting of firms. The canton of Zug is sup-
posed to owe its economic wealth from such a policy. In addition, nearly all cantons, with the
notable exceptions of Zug and Aargau, have special tax holidays for ‘newly founded’ firms
which are restricted by the federal tax harmonisation law of 1993 to be limited to ten years at
most in all cantons from 2001 on. ‘Newly founded’ may mean anything from the construction
of new firms or affiliates to the relocation of companies traditionally having been located in
other cantons for years.
Given the strong differences in tax burdens between Swiss cantons, double taxation agree-
ments between cantons and profit allocation rules for firms with plants in different cantons
play a non-negligible role. Between Swiss cantons, an exemption system is used exclusively.
0
5
10
15
20
25
30
35
50 100 200 500 1000 2000 5000 5000+
Share of Firms(in Percent)
Capital Classes(in SFr 1'000)
– 7 –
If for example a firm resides in Zurich and has a subsidiary in Zug, Zurich exempts the profits
earned in Zug from taxation in Zurich. Moreover, profit allocation between both cantons is
regulated by a kind of formula apportionment. There does not exist a unique harmonised for-
mula apportionment rule for all cantons. This leaves room for a strong variety of such rules
between cantons. Payroll, capital or sales are used as a basis for the calculation of profit
shares. For example profits of retail firms are usually allocated according to sales while profits
of manufacturing firms are allocated according to capital and payroll (capitalised by 10 per-
cent). Since capital is taxed in addition to profits and profits are taxed on the basis of rates of
return on capital, not only profit allocation rules but also capital allocation rules are used.
To give an example, which is borrowed from E. HÖHN and R. WALDBURGER (1999, p. 896),
suppose a manufacturing firm is located in Zurich and has a subsidiary in Zug. The firm is
supposed to earn SFr 3 million in total. It pays SFr 200’000 wages in Zurich and SFr 300’000
in Zug and has capital of SFr 640’000 in Zurich and SFr 360’000 in Zug. Profits between the
cantons are shared for tax purposes by first allocating 10 percent in advance to the parents lo-
cation, i.e. SFr 300’000 are allocated to Zurich. 44 percent of the remaining SFr 2.7 million
are allocated to Zurich and 56 percent to Zug because payroll, capitalised by 10 percent, and
capital sum up to SFr 2’640’000 in Zurich and SFr 3’360’000 in Zug. The firm thus pays
taxes on profits of SFr 1’490’000 in Zurich and SFr 1’510’000 in Zug.
Due to the small size of the country and its subfederal units, corporate taxpayers can easily
move to places with low tax burdens and should respond to cantonal tax differentials accord-
ingly. The exemption system basically provides an incentive for tax induced relocation while
profit sharing rules, in the sense of a kind of formula apportionment, reduce incentives for
profit shifting. Moreover, the differences in cantonal legal and accounting systems are not as
substantial to render firms’ relocations difficult. All in all, firms may have sufficient fiscal in-
centives to relocate between cantons. In addition, formula apportionment might not work as
perfectly as to totally prevent profit shifting from occurring. Thus, tax competition for mobile
capital in Switzerland may take place either by relocation of real capital leading to subsequent
changes in economic activity or by profit shifting among cantons.
3 The Model
The theoretical model which is the basis of our econometric estimates is taken from D.W.
CARLTON (1983). The relationship between taxes, location decisions of firms and employment
is derived from a profit function starting from the basic consideration what happens if the
firms in a particular industry have decided to open a new plant. From the usual assumption
that firms maximise their profits subject to certain restraints, each firm can be expected to lo-
cate this plant where it yields the highest profit. The locations differ according to firm-specific
– 8 –
������������������ ������������������������� ���������������� ij, of the plant of firm i in
location j can be defined as
)e)(j(X...)j(XK ijm1m10ij
εββ ⋅⋅=π (1)
with
Xs(j) explanatory variables at location j, s = 1, ..., m,
K0, ß1, ..., ßm unknown constants, and
ij firm-location specific effect.6)
Taking logs of relation (1), the following equation is obtained
∑ ε+β+=πk
ijkk0ij )j(Xlnßln (2)
with ß0 = ln(K0).
��������������������������������������������� �� ���� ����� �� ��� ij* = maxj� ij, which re-
quires that the right hand side of equation (2) is higher in location j* than in all other regions.
Just like the location of a firm, the number of employed at a chosen location provides infor-
mation on the parameters of the latent profit function. The demand for labour by firm i at lo-
cation j, Li(j) can be obtained by differentiating the profit function (1) with respect to wages
and multiplying by (– 1). If X1 is labour’s wage and we differentiate (1) with respect to X1, re-
arrange terms and multiply by (– 1), the demand for labour, Li(j), following D.W. CARLTON
(1983, p. 441), is derived as
∑ ε+β+β=+k
ijkk01i )j(XlnXln)j(Lln , (3)
where K is a constant. Shifting lnX1 to the right hand side, we get the equation to be estimated
with
∑ ε+β+β=k
ijkk0i )j(Xln~
)j(Lln , (3’)
with 1~β = 1β - 1 and k
~β = kβ for k ����
Since only aggregate data are available for this study, we have to assume that the error terms
in equations (2) and (3’) are independent from each other, although theoretically, the error
���� ij which is responsible for location j* to be the preferred location by a firm will also in-
fluence the demand of labour of that firm.
6. �������������� ��� ij is independently distributed across i and j and that it follows a log-normal distribution.
– 9 –
As the same variables influence the location decision of a firm and how many people are em-
ployed by this firm, the functional form of relation (3’) might also be used to estimate an
equation for the location decision of the firm. Then, the left hand variable should be the prob-
ability (relative frequency) that a firm is located in a certain canton. However, because of the
different sizes of the cantons it makes sense to ‘normalise’ these probabilities by using, e.g.,
the size of the population of the different cantons.7)
4 The Econometric Model
Following D.W. CARLTON’s (1983) approach, it would be natural to estimate the location and
labour demand decisions of firms simultaneously. However, while we have annual data of
cantonal employment growth from 1985 to 1997, data on the regional distribution of the firms
are only available for the years 1981/1982 and 1991/1992.8) Thus, we have to estimate the two
systems of equations separately. While we can estimate a panel with 14 annual observations
for employment the panel for the location decision has only two points in time.9) In addition,
we do not have firm level data but only data for the numbers of firms and the number of em-
ployees in the different cantons. Thus, we have to aggregate within the cantons.
4.1 The Regional Distribution of Large Firms
The description of the Swiss federal constitution in Section 2 shows that in many cantons the
Swiss corporate income tax follows a progressive tax scheme according to the rate of return
on capital of firms. Moreover, all cantons employ a tax on firms’ capital. Thus, firms have dif-
ferent countervailing investment and location incentives depending on their possibilities for
avoiding taxation. Progressive corporate taxation according to the rate of return on capital
punishes very profitable firms. If these firms manage to increase their capital stock given a
certain profit, they can save tax payments. On the other hand, splitting up a firm in smaller
units, locating them in other cantons with lower taxes and shifting profits to these cantons
might also be a possibility of tax avoidance. Profit shifting or intelligent tax management may
significantly reduce tax payments as well.10) In this case, firms are able to report only a low or 7. There are other possibilities to derive this functional form, e.g., by using a conditional logit model.
See, e.g., D. MACFADDEN (1974, p. 118f.).
8. In Switzerland, until the nineties tax assessment was only every second year, always for a two years period:Taxable income in year t and t+1 was the average income of the years t-1 and t-2. In the nineties, it slowlystarted to change to a taxation of the actual income with annual assessment.
9. Because the same set of underlying parameters (the ßs in equation 2) is used one might also think ofcross-equation-restrictions between the employment and the location equations which could be ex-ploited (and tested) in the empirical work. However, because of the differences of the two data setswhich demand separate estimations as well as different estimation procedures this is hardly possible.
10. According to the Swiss Federal Tax Bureau, numerous cases of profit shifting are known. Typically, profitshifting in Switzerland occurs in the case of financial subsidiaries and of the distribution of management fees
– 10 –
no rate of return on capital and are thus taxed less. All in all, an interesting pattern of interde-
pendencies emerges between investment, location and profit shifting incentives that are
caused by corporate income taxation.
This picture is complicated by the fact that Switzerland uses a classical corporate income tax
which provides incentives for firms to finance investment by retained earnings. Moreover, no
capital gains tax for private persons exists in Switzerland. Dividend payments to shareholders
are thus reduced in order to avoid double taxation of dividends by the corporate and personal
income tax and replaced by income from capital gains which are tax exempt. Differences in
personal income taxes between cantons may first play a role for small firms which can reduce
their tax burden by paying higher management salaries to their owners. In this case, personal
income taxes are more relevant to owners of small firms than corporate income taxes. Second,
personal income tax differences play a role for large firms to the extent to which they deter
high income and highly skilled managers from accepting an offer in a high tax jurisdiction.
A data set suitable to model these different tax incentives would normally have to be a micro-
data set consisting of individual firms. The available Swiss data for the study of the location
decision of firms are, however, aggregate data on the cantonal distribution of corporate tax-
payers according to classes of rates of return and of capital with the respective average statu-
tory tax rates in the rate of return classes. Instead of considering all capital classes, we had to
concentrate on firms with a capital between SFr 100'000 and 200'000, subsequently called the
small firms, and on firms with a capital between SFr 2 million and 5 million, the medium
sized firms.11) In addition, we use data for different classes of rates of return which are aggre-
gated to one with firms having low rates of return on capital, higher than zero and lower than
12 percent, firmlt, one with high rates of return on capital above 12 percent, firmh
t, and one
with a rate of return of zero, firmnt. For two capital classes times three rates of return classes,
we thus obtain six groups of firms. To illustrate the structure of the data, an inspection of Fig-
ures 2 and 3 is useful. The data cover all rates of return classes shown in Figure 2 by aggre-
gating them to three classes, i.e. the group with no rate of return, the lower three and the
higher four classes. With respect to the capital classes shown in Figure 3, only the third and
the seventh group are represented in our data set. Loosely speaking, we analyse the impact of
between parents and subsidiaries. In the foods industry for example, when Nestlé purchased Hero, a smallerfirm in Lenzburg (canton of Aargau), management fees were allocated in the size of 3 to 5 percent of turn-over of Hero in order to increase costs and to allow for profit shifting. Unfortunately, systematic evidenceillustrating the importance of profit-shifting in Switzerland does not exist, but the tax administration believesthat profit shifting is ubiquitous.
11. It was not possible to obtain more data than those on these two groups of capital from the Federal Tax Bu-reau for several reasons. Data on the distribution of firms with a capital of more than SFr 5 million are notprovided due to data protection laws. In small cantons there may be only one such large firm. In addition,many rates of return classes would not contain any observation in the case of large firms. This would notmake sense for this analysis. In our sample, only the canton of Appenzell i. Rh. does not have a firm with acapital between SFr 2 and 5 million and no rate of return in 1981. Finally, data on the remaining capitalclasses are only partly available making a concentration necessary.
– 11 –
taxes on the cantonal distribution of two groups of small and medium sized firms in classes of
no, low and high rates of return on capital. The different tax incentives discussed above may
be observed more easily in such a combination of small and medium sized firms according to
capital and of different rates of return than in aggregate investment or in the aggregate number
of firms.
The explanatory variables, Xk, of the model outlined in Section 3 are derived from the consid-
eration which factors influence the decision to locate a firm in a certain jurisdiction j*. First,
we include ln X1, the wage rate, as an explanatory variable in order to see how strong the ex-
pected negative effects of wages on the location decision of firms as well as on labour demand
are. Data on average cantonal hourly wages and monthly salaries for males and females are
available. We use cantonal averages of monthly salaries of males, w, as an indicator for labour
costs.
Second, four variables capturing the impact of the public budget are included in the model.
Aside from the tax rates on corporate income, personal income tax rates may have an impact
on the location decision as well because personal income taxes drive a wedge between the
marginal productivity of labour and the wage rate. Plenty of different corporate and personal
income tax rates are available and could be used in the model. We assume a rate of return on
capital of 8 percent as being normal and include the respective tax rate in the equation for
firms with no or low profits, i.e. with a rate of return not above 12 percent. In the equation for
the firms with above normal profits we include the tax rate for a rate of return of 40 percent.12)
The corporate tax rate is obtained by dividing real effective average cantonal and (weighted)
local tax payments in a certain class of rate of return and of capital by respective profits. This
implicit tax rate thus is an average effective tax rate, neither a statutory nor a marginal tax
rate. The corporate income tax rate is assumed to have a negative impact. In a slightly differ-
ent fashion, we select the tax rate on taxable personal income of SFr 1 million per year from
the available income tax rates in the statistics. The personal income tax rate is also expected to
exert a negative influence on the location decision.
The other two fiscal variables are from the spending side of the public budget. Data on firm-
specific benefits from public spending are not available.13) Thus, real public educational
spending per capita and real public investment spending per capita are introduced in the model
as indicators of public services benefiting firms at least indirectly. The higher public infra-
structural spending in a canton is, the higher is public investment, the more attractive is a
canton for firms as a location for new plants. Public educational spending may serve as a
proxy for cantonal human capital or for quantity and quality of schools and universities. In the
12. We use the cantonal and (weighted) local tax rate on rates of return of 8 percent as being representative for
the corporate taxpayers with no or low rates of return and the cantonal and (weighted) local tax rate on ratesof return of 40 percent for the taxpayers with high rates of return on capital.
13. Similarly, data on tax holidays are not available from most cantons.
– 12 –
first case, it can be expected that firms are attracted by higher human capital in a canton as a
production factor. In the second case, a firm will be attracted because better schools and uni-
versities are attractive for (the children of) highly skilled employees and the firm would like to
hire them as people incorporating human capital.
The share of the urban population is included in the model in order to control for agglomera-
tion effects. In addition, population serves as an explanatory variable to capture the sizes of
the cantons. Moreover, a year dummy for 1981 is introduced in order to control for time ef-
fects. Finally, after an analysis of outliers we decided to include a dummy variable for the
canton of Uri in order to capture the effect caused by this negative outlier.14) Following equa-
tion (3’), all variables are expressed in log terms. Thus, the model for the regional distribution
of firms is as follows:
firmi – pop = f(w, ctaxi, ptax, edexp, pubinv, urbpop, pop, d1981, duri) (4)
with:
firmi number of firms in the i-th class of rate of return, i = 1, 2, 3;
pop population;
w average real monthly salaries of the male population;
ctaxi corporate income tax rate for corporations with a rate of return on capital of 8(i = 1) or 40 (i = 2) percent;
ptax personal income tax rate for the income group of taxable income of SFr 1million per year;
edexp real public educational expenditure per capita;
pubinv real public investment per capita;
urbpop share of urban population;
d1981 dummy variable for the year 1981 (d1981=1 for the first 26 observations andzero otherwise);
duri dummy variable for the canton Uri (duri=1 for Uri and zero otherwise).
As described above, we use a panel of the 26 Swiss cantons for the two periods 1981/82 and
1991/92. With two capital classes and six classes of rates of return on capital, six equations
have to be estimated. These six equations are estimated simultaneously using the Zellner-Ait-
ken seemingly unrelated regression procedure (SUR). This procedure is used because the six
different equations may be dependent from each other following the discussion of the different
interdependencies of tax induced investment, location and profit shifting incentives outlined
in the beginning of this section. If for example a canton – ceteris paribus – increases the cor-
14. The results are relatively robust to the inclusion or exclusion of outliers. Mainly the test statistics on normal-
ity of the residuals are influenced by these changes in the specification. – Uri is special in some sense be-cause it is known as a canton that gains the most from vertical fiscal equalisation.
– 13 –
porate tax rate for very profitable medium sized firms with a high rate of return on capital, i.e.
it increases the progressivity of the corporate income tax schedule, the number of firms in this
group of taxpayers in the respective canton can be expected to be reduced. This might happen
because, first, the firm relocates to a canton with lower taxes for highly profitable firms, and
second, because it shifts profits to other low tax cantons, or third, successfully manages taxes
by seeking tax loopholes. The latter two strategies reduce the number of firms in the group of
medium sized firms with high rates of return on capital in the particular canton and increase
the number of medium sized firms with low or no rates of return in the same canton such that
the aggregate number of firms in the canton remains the same. A simultaneous equations
model captures these countervailing effects.
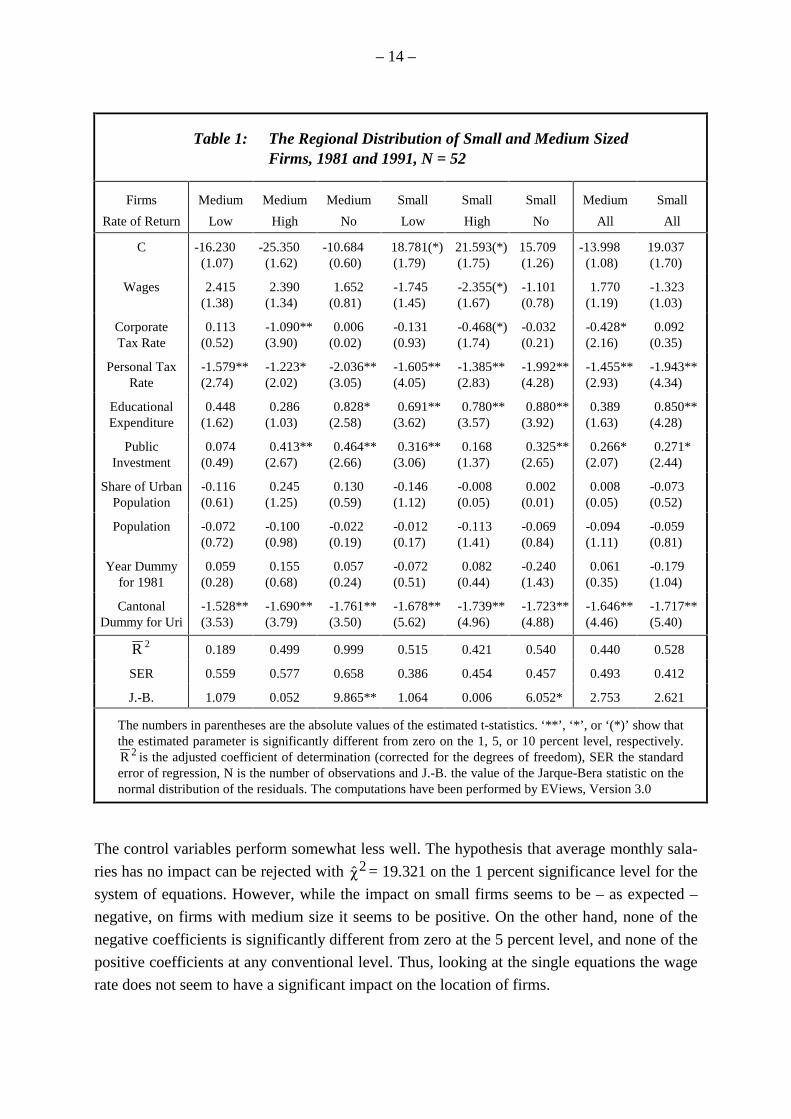
The results we obtain for the system of six equations are presented in Table 1. The model ex-
plains the number of small and medium sized firms per capita with no or high rates of return
reasonably well. In this case, at least 42 percent of the variation are explained by the model. In
the case of small firms with low rates of return, much the same holds in explaining the varia-
tion by about 50 percent. The cantonal variation of the number of medium sized firms with
normal rates of return is only explained to about 19 percent. The values of the Jarque-Bera
statistics show that the null hypothesis of normal distribution of the residuals cannot be re-
jected on any conventional significance level in the case of firms with low and high rates of
return. The hypothesis of normal distribution of the residuals is rejected for the firms with no
rates of return despite the inclusion of the dummy variable for the canton of Uri which has al-
ready been identified as an outlier. Another outlier according to the residuals of the two equa-
tions of firms with no rate of return is the canton of Jura. Excluding this observation from the
sample does not change the estimation results considerably, while the hypothesis of a normal
distribution of the residuals cannot be rejected in the case of this reduced sample.
In the whole system of equations, the hypothesis that corporate income taxes do not have any
impact on the distribution of large firms in the three classes of rates of return for small and
medium sized firms can be rejected with 2χ̂ = 19.471 on the 1 percent significance level.
Similarly, the hypothesis that personal income taxes do not have any impact on the distribu-
tion of large firms in the three classes of rates of return for small and medium sized firms can
be rejected with 2χ̂ = 23.214 even on the 0.1 percent significance level. Cantonal education
spending per capita and cantonal real capital spending per capita have a significant impact on
the system with 2χ̂ = 33.773 and 2χ̂ = 29.416 on the 0.1 percent level as well.
– 14 –
Table 1: The Regional Distribution of Small and Medium SizedFirms, 1981 and 1991, N = 52
Firms
Rate of Return
Medium
Low
Medium
High
Medium
No
Small
Low
Small
High
Small
No
Medium
All
Small
All
C -16.230(1.07)
-25.350(1.62)
-10.684(0.60)
18.781(*)(1.79)
21.593(*)(1.75)
15.709(1.26)
-13.998(1.08)
19.037(1.70)
Wages 2.415(1.38)
2.390(1.34)
1.652(0.81)
-1.745(1.45)
-2.355(*)(1.67)
-1.101(0.78)
1.770(1.19)
-1.323(1.03)
CorporateTax Rate
0.113(0.52)
-1.090**(3.90)
0.006(0.02)
-0.131(0.93)
-0.468(*)(1.74)
-0.032(0.21)
-0.428*(2.16)
0.092(0.35)
Personal TaxRate
-1.579**(2.74)
-1.223*(2.02)
-2.036**(3.05)
-1.605**(4.05)
-1.385**(2.83)
-1.992**(4.28)
-1.455**(2.93)
-1.943**(4.34)
EducationalExpenditure
0.448(1.62)
0.286(1.03)
0.828*(2.58)
0.691**(3.62)
0.780**(3.57)
0.880**(3.92)
0.389(1.63)
0.850**(4.28)
PublicInvestment
0.074(0.49)
0.413**(2.67)
0.464**(2.66)
0.316**(3.06)
0.168(1.37)
0.325**(2.65)
0.266*(2.07)
0.271*(2.44)
Share of UrbanPopulation
-0.116(0.61)
0.245(1.25)
0.130(0.59)
-0.146(1.12)
-0.008(0.05)
0.002(0.01)
0.008(0.05)
-0.073(0.52)
Population -0.072(0.72)
-0.100(0.98)
-0.022(0.19)
-0.012(0.17)
-0.113(1.41)
-0.069(0.84)
-0.094(1.11)
-0.059(0.81)
Year Dummyfor 1981
0.059(0.28)
0.155(0.68)
0.057(0.24)
-0.072(0.51)
0.082(0.44)
-0.240(1.43)
0.061(0.35)
-0.179(1.04)
CantonalDummy for Uri
-1.528**(3.53)
-1.690**(3.79)
-1.761**(3.50)
-1.678**(5.62)
-1.739**(4.96)
-1.723**(4.88)
-1.646**(4.46)
-1.717**(5.40)
2R 0.189 0.499 0.999 0.515 0.421 0.540 0.440 0.528
SER 0.559 0.577 0.658 0.386 0.454 0.457 0.493 0.412
J.-B. 1.079 0.052 9.865** 1.064 0.006 6.052* 2.753 2.621
The numbers in parentheses are the absolute values of the estimated t-statistics. ‘**’, ‘*’, or ‘(*)’ show thatthe estimated parameter is significantly different from zero on the 1, 5, or 10 percent level, respectively.
2R is the adjusted coefficient of determination (corrected for the degrees of freedom), SER the standarderror of regression, N is the number of observations and J.-B. the value of the Jarque-Bera statistic on thenormal distribution of the residuals. The computations have been performed by EViews, Version 3.0
The control variables perform somewhat less well. The hypothesis that average monthly sala-
ries has no impact can be rejected with 2χ̂ = 19.321 on the 1 percent significance level for the
system of equations. However, while the impact on small firms seems to be – as expected –
negative, on firms with medium size it seems to be positive. On the other hand, none of the
negative coefficients is significantly different from zero at the 5 percent level, and none of the
positive coefficients at any conventional level. Thus, looking at the single equations the wage
rate does not seem to have a significant impact on the location of firms.
– 15 –
For the size of the canton the null hypothesis of no influence can neither be rejected for the
single equations nor for the system as a whole: the corresponding test statistics for the latter is2χ̂ = 6.527. That the share of the urban population has no impact can be rejected with 2χ̂ =
13.255 on the 5 percent significance level for all equations together, but again: none of the es-
timated coefficients is significantly different from zero at any conventional level. The same
holds for the dummy variable for the year 1981, where the likelihood ratio test for the whole
system of equations provides a value of 2χ̂ = 21.181 which indicates significance even on the
1 percent level. Contrary to this, the hypothesis that the cantonal dummy variable for the can-
ton of Uri has no impact can be rejected with 2χ̂ = 33.322 even on the 0.1 percent significance
level for the whole system and at least on the 1 percent level in the single equations.
The four fiscal variables of the model have nearly exclusively the expected impact on the
number of firms in the different classes. Taxes have a negative impact, with minor exceptions
in the case of the corporate income tax, and public spending has a positive impact. Educa-
tional spending exerts a highly significant positive impact on the number of small firms in any
rate of return category, but reaches significance at the five percent level in the case of medium
sized firms only for those with high rates of return. Public capital spending has differential
impacts in the different groups of corporate income taxpayers.
The corporate income tax rate has a significant negative impact only on the number of small
and medium sized firms with above average rates of return on capital, in the first case only on
the 10 percent significance level. In some cases, like for medium sized firms with low or no
rates of return, it even has the wrong sign but the value of its t-statistic is far from any con-
ventional significance level. By far the most significant impact in statistical and economic
terms in this system of equations is exerted by the personal income tax rate. It is highly sig-
nificant at least on the five percent significance level in all six equations and has the expected
negative sign. It is slightly larger for small firms with low or high profits than for respective
medium sized firms, while the opposite holds for firms with no profits. Given that the vari-
ables are expressed in log terms and can thus be interpreted as elasticities, the magnitude of
the tax effects is astonishingly large with an elasticity higher than one for the personal income
tax rate and an elasticity of about one for the impact of the corporate tax rate on medium sized
firms with high profits. An increase of the personal tax rate by one percent for example re-
duces the number of medium sized firms per capita with no profits by about 2 percent.15)
The last two columns of Table 1 contain the constrained estimation results of the model for
medium-sized and small firms pooling three rates of return classes in each case. The previous
results for the differentiated rates of return classes are basically corroborated. With respect to
taxation, the personal income tax has a stronger negative impact than the corporate income
15. We also estimated the model augmented by neighbourhood effects by introducing the weighted average of
corporate and personal income tax rates of the other cantons using the inverse of the geographic distance as aweight. The results remained essentially the same and are, therefore, not reported.
– 16 –
tax. While the negative impact of the personal tax rate is statistically significant at the 1 per-
cent level for both capital classes and has elasticities above 1, the negative impact of the cor-
porate income tax rate is significant only for medium-sized firms and has an elasticity below
1. For small firms, it has the wrong sign and is far from reaching any conventional signifi-
cance level.16) The coefficients of the average salaries are – as in the single equations – posi-
tive for the medium and negative for the small sized firms; both are, however, far from being
significantly different from zero. Thus, according to these estimates we find again no signifi-
cant impact of the wage rate on the location of the firms.
In addition, the model was estimated by excluding personal income taxes in order to check the
robustness of the estimated coefficient on the pre-tax wage in the light of a potential impact of
labour taxes on workers’ mobility. If workers are (perfectly) mobile, they will move from one
canton to the other in order to exploit income tax differences until the net wages between
cantons are equated: Higher pre-tax wages are associated with higher marginal income tax
rates. The overall effect of an increase in the labour income tax thus contains a direct impact
of income taxes and an indirect impact resulting from the wage rate. The robustness check is
performed in order to test whether the results obtained in Table 1 are sensitive to the indirect
effect of labour income taxes. The results are presented in Table 1a in the Appendix. Com-
pared to Table 1, the differences in the specification do not matter considerably. Excluding
personal tax rates, the impact of the corporate tax rate on the number of firms in the cantons
increases. It now has the expected negative sign in all rates of return classes and is signifi-
cantly different from zero at least at the 10 percent significance level in four of six cases. Only
small and medium sized firms with no rate of return are not influenced by corporate income
taxes which, on the other hand, is hardly astonishing. The constrained estimates for the aggre-
gate of the medium-sized and small firms again show that the corporate income tax particu-
larly has an impact on the location of medium-sized firms. The impact of the control variables
remains relatively robust. Especially, the coefficient of the average salaries is now never sig-
nificantly different from zero at any of the conventional significance levels. An analysis of
outliers, as indicated by the Jarque-Bera test statistic, does not lead to different results.
We can summarise the tax effects in a similar fashion like we discussed them at the outset of
this section. The corporate tax rate appears to significantly negatively affect the number of
highly profitable firms only. It has no impact in all other cases. Only firms which did not
manage to keep their taxable profits low due to profit shifting or other kinds of tax manage-
ment are hit by the corporate income tax and have an incentive to relocate. Whether this sig-
nificant reduction of highly profitable firms is the result of a relocation or of profit shifting
cannot be distinguished with certainty.17) Given the institutional environment in Switzerland
16. This might indicate that profit shifting is easier for medium sized than for small firms.
17. The positive sign of the corporate income tax in the case of medium sized firms with low or no rates of returnon capital might be interpreted as supporting evidence for profit shifting. It is however not significant.
– 17 –
with tax exemption as double taxation relief and formula apportionment, the results may indi-
cate a mixture of both profit shifting and relocation decisions.
The results also confirm that the corporate income tax has a more important impact on highly
profitable medium sized firms than on the respective small firm counterpart. The opposite
holds in the case of personal income taxes. They appear to be more important for small firms.
This makes sense given the fact that owners of small firms to a larger extent manage their own
business. They can obtain higher salaries in order to avoid corporate tax payments. The per-
sonal income tax is thus more relevant to them. Even in the case of medium sized firms, the
strong impact of personal tax rates confirms a notion often reported as piecemeal evidence:
Personal tax rates in Switzerland are more important than corporate tax rates for the location
of business because they are crucial for the attraction of highly skilled employees. But how
does this pattern of tax effects on the regional distribution of firms translate into effects on
real economic activity like employment?
4.2 The Employment Equation
For modelling the employment decision we also use aggregate cantonal instead of micro-level
data on firms’ labour demand, as the latter are not available.18) Employment in canton j, L(j),
is the dependent variable from equation (3’). The major difference between the employment
and the location equations is that we can use time dummies to consider business cycle effects
or other symmetric shocks, because we have a panel with annual data over 14 years. On the
other hand, the panel structure of the data also demands that we take possible autocorrelation
of the residuals into account.
Modelling the location decision, we used the two different corporate tax variables for firms
with low and high rates of return. These two variables are, however, highly correlated which
renders it useless to consider both in the (same) employment equation without differentiating
between firms with different rates of return. Consequently, we use the variable which repre-
sents the ‘normal’ rate of return on capital of 8 percent as an indicator for the corporate tax
burden. Again, however, we select the tax rate on taxable personal income of SFr 1 million
per year from the available income tax rates. Both tax rates are expected to exert a negative in-
fluence on cantonal employment.
Finally, we use the same variables for government spending, relative wages as the deviation of
average monthly salaries from the Swiss weighted average and, in addition to the demo-
graphic variables of the previous system estimates, indicators capturing the demographic
structure of the population. Since variables measuring schooling or other education effects are
not available on an annual basis, the inclusion of the population age mix allows to control for
18. Thus, we essentially follow the approach by R. CARROLL and M.J. WASYLENKO (1994).
– 18 –
differences in the number of people in working age. We thus expect both variables for the
demographic structure to exert a negative impact on cantonal employment. Following equa-
tion (3’), all variables are expressed in log terms. Thus, our econometric model for the em-
ployment equation is as follows:
empl – pop = f(w, ctax, ptax, edexp, pubinv, pop, old, young, urbpop) (5)
with:
empl number of employed persons;
w deviation of the average real monthly salaries of the male population from theweighted Swiss average;
ctax corporate income tax rate for corporations with a rate of return on capital of 8percent;
ptax personal income tax rate for the income group of taxable income of SFr 1million per year;
edexp real public educational expenditure per capita;
pubinv real public investment per capita;
pop population;
old share of people with age above 65 years;
young share of young people not over 20 years old;
urbpop share of urban population.
In addition to these variables we always use time dummies for each point of time. We use a
panel over the 26 Swiss cantons and for the 14 years from 1984 to 1997. Thus, our observa-
tional period covers the boom period during the end of the eighties and the long recession
which lasted from the beginning until nearly the end of the nineties.
In estimating this model, we face several problems. There is first the possible simultaneity
between the dependent and many of the right hand side variables. E.g., cantonal tax rates are
adjusted to the economic (employment) situation. In such a situation, an instrumental variable
estimator should be employed. However, due to the small number of time series points (14) in
relation to the number of cross-section points (26), the usual instrumental variable estimator
cannot be used.19) The potential simultaneity bias should however not severely affect the re-
sults because of the natural lags that occur in tax assessment in Switzerland. In the period
covered by our data, tax assessment was only every second year, and always for a two years
period: Taxable income in year t and t+1 was the average income of the years t-1 and t-2.
Government officials would thus have to have very rational expectations to adjust tax rates
19. In addition, other more advanced estimators like GMM also cannot be used for this reason.
– 19 –
according to projected growth and employment developments. Thus, even if we do not get ef-
ficient, we should at least get consistent estimates.
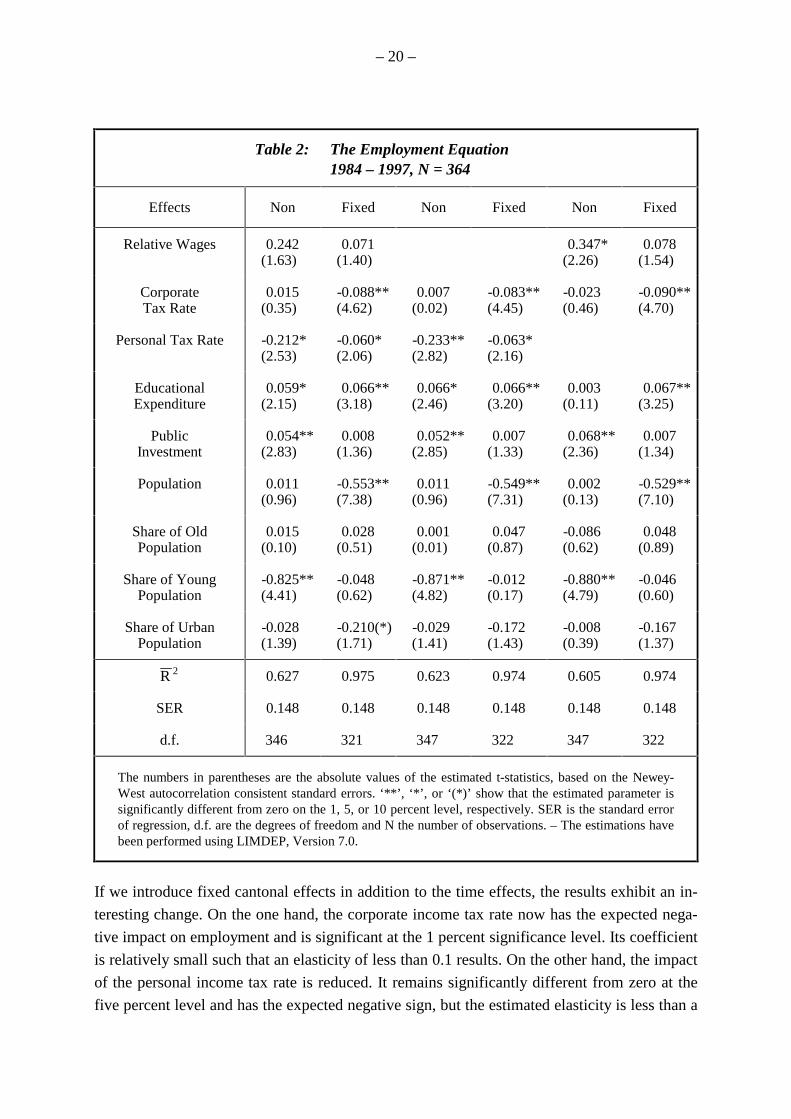
Second we have high positive autocorrelation of the estimated residuals. This does not neces-
sarily affect the consistency of the estimated parameters but leads in any case to inconsistently
estimated standard errors. Thus, using a GMM procedure we correct the standard errors to
take autocorrelation as well as heteroscedasticity of the residuals into account.20) The estima-
tion results of the model are presented in Table 2.
We start with a pooled cross section time series model of cantonal employment. All in all, the
model explains the variation of cantonal employment to about 60 percent. Of the tax vari-
ables, only the personal income tax rate has the expected negative sign and is significant on
the 5 percent level. The coefficient of the corporate income tax rate is not significant and has
the ‘wrong’ (positive) sign. In addition, the coefficient of the corporate tax variable is rather
small, while the personal income tax exerts a non-negligible impact on cantonal employment
with an elasticity of 0.2. Public educational expenditure is significant at the five percent sig-
nificance level and public investment is significant at the one percent significance level. If we
look at the structural coefficients, only the share of young people has the expected negative
impact on employment: the smaller the part of the population younger than 20, the smaller
employment will – ceteris paribus – be. The share of the old population has a positive sign,
but is far from any conventional significance level. On the other hand, it is interesting to note
that the share of the urban population from total population has nearly no effect on employ-
ment: There appears to be no systematic difference between the employment situations in the
cities and in rural areas.
A surprising result is that the log of the deviation of real monthly salaries from the Swiss
weighted average has a positive coefficient: Contrary to the expectation an increase of real
monthly salaries may lead to an increase of employment. This coefficient could also reflect a
causation in the opposite direction: an increase of employment might tighten the labour mar-
ket and, thus, lead to a wage increase. It could also suggest that employment expands because
of a dominance of labour demand shocks over labour supply shocks. However, this positive
effect of the wage proxy does not gain statistical significance in most of the specifications
used and should thus not worry too much. As the results in column 3 and 4 of Table 2 show,
dropping this variable from the equation renders virtually the same results. Checking the ro-
bustness of the estimates with respect to the indirect effect of personal income taxes in the
light of worker mobility by dropping the personal income tax rate (columns 5 and 6) increases
the importance of the wage variable. In this specification, the deviation of real monthly sala-
ries has a significantly positive impact on employment. The coefficients of the control vari-
ables remain however rather stable.
20. See for this W.H. GREENE (1998, p. 408).
– 20 –
Table 2: The Employment Equation1984 – 1997, N = 364
Effects Non Fixed Non Fixed Non Fixed
Relative Wages 0.242(1.63)
0.071(1.40)
0.347*(2.26)
0.078(1.54)
CorporateTax Rate
0.015(0.35)
-0.088**(4.62)
0.007(0.02)
-0.083**(4.45)
-0.023(0.46)
-0.090**(4.70)
Personal Tax Rate -0.212*(2.53)
-0.060*(2.06)
-0.233**(2.82)
-0.063*(2.16)
EducationalExpenditure
0.059*(2.15)
0.066**(3.18)
0.066*(2.46)
0.066**(3.20)
0.003(0.11)
0.067**(3.25)
PublicInvestment
0.054**(2.83)
0.008(1.36)
0.052**(2.85)
0.007(1.33)
0.068**(2.36)
0.007(1.34)
Population 0.011(0.96)
-0.553**(7.38)
0.011(0.96)
-0.549**(7.31)
0.002(0.13)
-0.529**(7.10)
Share of OldPopulation
0.015(0.10)
0.028(0.51)
0.001(0.01)
0.047(0.87)
-0.086(0.62)
0.048(0.89)
Share of YoungPopulation
-0.825**(4.41)
-0.048(0.62)
-0.871**(4.82)
-0.012(0.17)
-0.880**(4.79)
-0.046(0.60)
Share of UrbanPopulation
-0.028(1.39)
-0.210(*)(1.71)
-0.029(1.41)
-0.172(1.43)
-0.008(0.39)
-0.167(1.37)
2R 0.627 0.975 0.623 0.974 0.605 0.974
SER 0.148 0.148 0.148 0.148 0.148 0.148
d.f. 346 321 347 322 347 322
The numbers in parentheses are the absolute values of the estimated t-statistics, based on the Newey-West autocorrelation consistent standard errors. ‘**’, ‘*’, or ‘(*)’ show that the estimated parameter issignificantly different from zero on the 1, 5, or 10 percent level, respectively. SER is the standard errorof regression, d.f. are the degrees of freedom and N the number of observations. – The estimations havebeen performed using LIMDEP, Version 7.0.
If we introduce fixed cantonal effects in addition to the time effects, the results exhibit an in-
teresting change. On the one hand, the corporate income tax rate now has the expected nega-
tive impact on employment and is significant at the 1 percent significance level. Its coefficient
is relatively small such that an elasticity of less than 0.1 results. On the other hand, the impact
of the personal income tax rate is reduced. It remains significantly different from zero at the
five percent level and has the expected negative sign, but the estimated elasticity is less than a
– 21 –
third of the coefficient estimated in a specification without fixed cantonal and with fixed time
effects. Again dropping the deviation of real monthly salaries does not change these results
and the impact of the corporate tax rate remains robust in the two sided fixed effects specifi-
cation if the personal income tax rate is dropped. In all specifications with fixed cantonal ef-
fects, the deviation of real monthly salaries does not reach any conventional significance level.
In addition to both tax rates, educational spending per capita keeps its significantly positive
impact while the impact of public investment spending per capita is not robust to the intro-
duction of fixed cantonal effects. The demographic structure does not have any impact on em-
ployment in this specification. Population is significantly negative and the share of the urban
population has a marginally significant negative impact on employment which is however not
robust to the inclusion of the deviation of real monthly salaries and the personal income tax
rate.
By estimating the model with fixed time effects, we focus on the cross sectional variation of
cantonal employment. Estimating the model with fixed cantonal effects puts a stronger em-
phasis on the variation of employment over time. Including both, spurious factors are rela-
tively satisfactorily controlled for. Some authors refer to such a specification as the ‘gold
standard’ in panel data analysis. With respect to the impact of taxes on employment as an in-
dicator to what extent tax rate differences and subsequent location decisions lead to real eco-
nomic outcomes, these results of a model with and without fixed effects indicate the differ-
ence in the emphasis of cross section effects. The fixed cantonal effects might capture some of
the differences in the personal income tax rate between cantons and thus reduce the impact of
this variable on employment. That the corporate tax rate becomes significant if fixed cantonal
effects are included might be interpreted as a particular influence of corporate tax rates on
employment over time.
All in all, the results of the employment equation show that taxes do not appear to have a
dramatic impact on cantonal employment despite their strong importance in the explanation of
the regional distribution of firms. While the impact of corporate and personal income taxes on
cantonal employment is significantly different from zero in the fixed cantonal and time effects
specification, their coefficients are relatively small. Although the coefficient of personal in-
come taxes in the fixed time effects specification is larger, it is still far from being impressive.
Much the same holds with respect to the other fiscal variables. Thus, tax rate differences be-
tween the Swiss cantons do not exert major effects on employment although their impact on
the regional distribution of taxpayers is considerable.
5 Concluding Remarks
The results in this paper provide empirical evidence that corporate and personal income taxes
have an impact on the regional distribution of small and medium sized firms with no, low or
– 22 –
high rates of return on capital in Switzerland in 1981/82 and 1991/92, and on cantonal em-
ployment from 1984 to 1997. Though the empirical evidence has to be interpreted cautiously,
the empirical results show that corporate income taxes have at least some influence on loca-
tion and employment decisions of private firms. The most interesting characteristic of the re-
sults is that corporate and in particular personal income taxes have a stronger impact on the
cantonal distribution of firms than on employment. Together with the differential impact of
both taxes in the different classes of rates of return on capital for differently sized firms, this
difference provides some indirect evidence for the existence of profit shifting among cantons
or for smart tax management for a firm located in one canton only. This holds despite the sev-
eral incentives provided by intercantonal tax laws such as the tax exemption system and for-
mula apportionment.
These results do not necessarily imply that only small and medium-sized firms, which do not
employ many people, are sensitive to taxes and large firms with a higher employment leverage
are not. First, the number of small and medium-sized firms is relatively high such that in sum
total employment created by that business segment easily exceeds that of large firms. Second,
our empirical results on the distribution of small and medium-sized firms cannot be extended
towards large firms unless we do not include this group in the empirical analysis. To obtain a
clearer impression whether and to what extent profit shifting or tax induced relocation of
firms results in subsequent changes of employment, it appears to be necessary to analyse firm-
level data which are not yet available.
That the evidence of the impact of taxes on employment is not stronger might also be due to
the fact that the Swiss system of corporate income taxation has been rather complicated in the
past which creates severe problems to construct a single really informative indicator of the
corporate income tax burden. Moreover, at least with respect to firms moving into a canton,
there often are special tax holidays over the first ten years, which makes the official tax rates
even less indicative for the tax burden of those firms which are most relevant in the tax com-
petition between the cantons. Similarly, hidden subsidies are paid to firms in the form of spe-
cific public services which are not fully paid for by the firms. Moreover, administrative costs
of taxation impose indirect taxes on firms as well and are also not captured by our tax variable
measure. A final reason might be that, as many other studies show, the tax burden is just one
factor for the location decision of private firms; many other factors can play a much more im-
portant role.21)
A very interesting feature of our results is that personal income taxes seem to have a much
smaller impact on employment decisions than on the distribution of firms in different capital
and rates of return classes. The negative incentive exerted by high personal income taxes to
21. See, e.g., F.J. CALZONETTI and R.T. WALKER (1991), who show in a survey that most studies concede only a
minor role for fiscal variables with respect to location decisions of firms.
– 23 –
locate in a canton does not appear to translate in a similar negative incentive for real activity.
This might either be the result of the limitation of our data sets or be the result of the fact that
tax competition for real activity is stronger with corporate rather than personal income taxes.
This is in line with casual evidence about the effects of tax competition within the European
Union. The Netherlands, e.g., which still have one of the highest marginal tax rates for per-
sonal labour income of all member states, with a maximum of 60 percent (excluding social
security contributions), were nevertheless very successful in attracting foreign direct invest-
ment during the eighties and nineties: Between 1985 and 1995 they attracted more foreign di-
rect investment even in absolute terms than, e.g. the Federal Republic of Germany.22) This has
interesting policy implications: If there is any necessity to harmonise direct taxes within the
European Union, it certainly exists to a higher extent for corporate than for personal income
taxes. On the other hand, as the experience of the recent decades shows, international tax
competition will reduce corporate income taxes in any case and, therefore, diminish their im-
portance for government revenue.
Last, but not least, is should be noticed that – at least up to now – corporate income tax com-
petition might play a lesser role for real economic decisions as is often assumed. Switzerland
is a small country, and costs for moving inside the country are low compared to moving costs
between, e.g., member states of the European Union. If in such a situation the employment
decisions are only to a small extent influenced by corporate income tax rates, it is reasonable
to assume that differences in corporate income tax rates will have an even smaller impact on
employment in the different EU member states. The main impact of such differences is pre-
sumably not the impact on the location decisions of the actual production, i.e. on employment,
but on the firm’s decision where corporate income taxes are paid. As the example of BMW
shows, these points might be very far away from each other.23) All in all, our results provide
some support for the conjecture that profit shifting remains important even if tax rules like
formula apportionment are used. The main problem with respect to tax competition today is
not the regional impact on the employment decisions but on the incentives for profit shifting
and thus for the tax revenues.
22. See, e.g., G. KIRCHGÄSSNER (1999, p. 53).
23. Over many years, BMW which produced in Germany paid hardly any corporate income taxes there, but paidthem in Dublin. (See: So viele Inseln: Die hohen deutschen Steuern jagen immer mehr Unternehmen in dieFlucht; das Ausland lockt mit attraktiven Sätzen und Vergünstigungen, in: Wirtschaftswoche No. 47, No-vember 14, 1996, pp. 80 – 101.) For a description of the mechanisms which allow such a ‘splitting’ see, e.g.,W. MÜLLER (1998).
– 24 –
References
R. ALTSHULER and H. GRUBERT (1999), Multinational Financial Policy and the Cost of Capital: TheMany Roads Home, Unpublished Manuscript, U.S. Treasury, Washington, D.C. 1999.
T.J. BARTIK (1985), Business Location Decisions in the United States: Estimates of the Effects ofUnionization, Taxes, and Other Characteristics of States, Journal of Business and Economic Sta-tistics 3 (1985), pp. 14 – 22.
F.J. CALZONETTI and R.T. WALKER (1991), Factors Affecting Industrial Location Decisions: A Sur-vey Approach, in: H.W. HERZOG, JR. and A.M. SCHLOTTMANN (eds.), Industry Location andPublic Policy, University of Tennessee Press, Knoxville 1991, pp. 221 – 240.
D.W. CARLTON (1983), The Location and Employment Choices of New Firms: An EconometricModel with Discrete and Continuous Endogenous Variables, Review of Economics and Statistics65 (1983), pp. 440 – 449.
R. CARROLL and M.J. WASYLENKO (1994), Do State Business Climates Still Matter? – Evidence of aStructural Change, National Tax Journal 47 (1994), pp. 19 – 37.
M.P. DEVEREUX and R. GRIFFITH (1998), Taxes and the Location of Production: Evidence from aPanel of US Multinationals, Journal of Public Economics 68 (1998), pp. 335 – 367.
L.P. FELD (2000), Steuerwettbewerb und seine Auswirkungen auf Allokation und Distribution: EinÜberblick und eine empirische Analyse für die Schweiz, Beiträge zur Finanzwissenschaft 10,Mohr Siebeck, Tübingen 2000.
L.P. FELD (2000a), Tax Competition and Income Redistribution: An Empirical Analysis for Switzer-land, Public Choice 105 (2000), pp. 125 – 164.
L.P. FELD and G. KIRCHGÄSSNER (2001), Income Tax Competition at the State and Local Level inSwitzerland, forthcoming in: Regional Science and Urban Economics 31 (2001).
R.H. GORDON (1983), An Optimal Taxation Approach to Fiscal Federalism, Quarterly Journal ofEconomics 98 (1983), pp. 567 – 586.
R.H. GORDON (1986), Taxation of Investment and Savings in a World Economy, American EconomicReview 76 (1986), pp. 1086 – 1102.
R.H. GORDON (1992), Can Capital Income Taxes Survive in Open Economies?, Journal of Finance47 (1992), pp. 1159 – 1180.
W.H. GREENE (1998), LIMDEP Version 7.0: User’s Manual, Econometric Software, Inc., Plainview1998.
J.R. HINES (1996), Altered States: Taxes and the Location of Foreign Direct Investment in America,American Economic Review 86 (1996), pp. 1076 – 1094.
J.R. HINES (1997), Tax Policy and the Activities of Multinational Corporations, in: A.J. AUERBACH(ed.), Fiscal Policy: Lessons from Economic Research, MIT Press, Cambridge 1997, pp. 401 –445.
E. HÖHN and R. WALDBURGER (1999), Steuerrecht, Band II, Haupt, Bern, 8th edition 1999.
G. JUNGE and M. ZARIN-NEJADAN (1986), A Rate-of-Return Model of Investment Behavior for Swit-zerland, Empirical Economics 11 (1986), pp. 153 – 167.
G. KIRCHGÄSSNER (1999), Eine moderne Steuer- und Abgabenordnung für die Schweiz: Vorüberle-gungen und Grundzüge, Rüegger, Chur/Zürich 1999.
G. KIRCHGÄSSNER and W.W. POMMEREHNE (1996), Tax Harmonisation and Tax Competition in theEuropean Union: Lessons from Switzerland, Journal of Public Economics 60 (1996), pp. 351 –371.
– 25 –
D. MACFADDEN (1974), Conditional Logit Analysis of Qualitative Choice Behavior, in: P. ZA-REMBKA (ed.), Frontiers in Econometrics, Academic Press, New York 1974, pp. 105 – 142.
ST.T. MARK, TH.J. MCGUIRE and L.E. PAPKE (1997), What Do We Know about the Effect of Taxeson Economic Development? Lessons from the Literature for the District of Columbia, State TaxNotes (August 2000), pp. 493 – 510.
ST.T. MARK, TH.J. MCGUIRE and L.E. PAPKE (2000), The Influence of Taxes on Employment andPopulation Growth: Evidence from the Washington, D.C. Metropolitan Area, National Tax Jour-nal 53 (2000), pp. 105 – 123.
W. MÜLLER (1998), Was ist ‘fairer’ Steuerwettbewerb und welche Regeln braucht er?, Konjunktur-politik 44 (1998), pp. 313 – 352.
R.J. NEWMAN and D.H. SULLIVAN (1988), Econometric Analysis of Business Tax Impacts on Indus-trial Location: What Do We Know, and How Do We Know It?, Journal of Urban Economics 23(1988), pp. 215 – 234.
OECD (1998), Harmful Tax Competition: An Emerging Global Issue, OECD, Paris 1998.
L.E. PAPKE (1991), Interstate Business Tax Differentials and New Firm Location: Evidence fromPanel Data, Journal of Public Economics 45 (1991), pp. 47 – 68.
A. RAZIN and E. SADKA (1991), International Tax Competition and Gains from Tax Harmonisation,Economics Letters 37 (1991), pp. 69 – 76.
H.-W. SINN (1997), The Selection Principle and Market Failure in Systems Competition, Journal ofPublic Economics 66 (1997), pp. 247 – 274.
R. TANNENWALD (1996), State Business Tax Climate: How Should It Be Measured and How Impor-tant Is It?, Federal Reserve Bank of Boston, New England Economic Review (January-February1996), pp. 23 – 38.
M.J. WASYLENKO (1991), Empirical Evidence on Interregional Business Location Decisions and theRole of Fiscal Incentives in Economic Development, in: H.W. HERZOG, JR. and A.M. SCHLOTT-MANN (eds.), Industry Location and Public Policy, University of Tennessee Press, Knoxville1991, pp. 13 – 30.
M. ZARIN-NEJADAN (1991), L’imposition des revenues du capital en Suisse: Une approche de simu-lation, Schweizerische Zeitschrift für Volkswirtschaft und Statistik 127 (1991), pp. 445 – 463.
M. ZARIN-NEJADAN (1992), Fiscalité, q de Tobin et investissement privé en Suisse, Recherches Eco-nomiques de Louvain 58 (1992), pp. 213 – 235.
M. ZARIN-NEJADAN (1997), Die Besteuerung der KMU in der Schweiz, Die Volkswirtschaft (2)(1997), pp. 56 – 59.
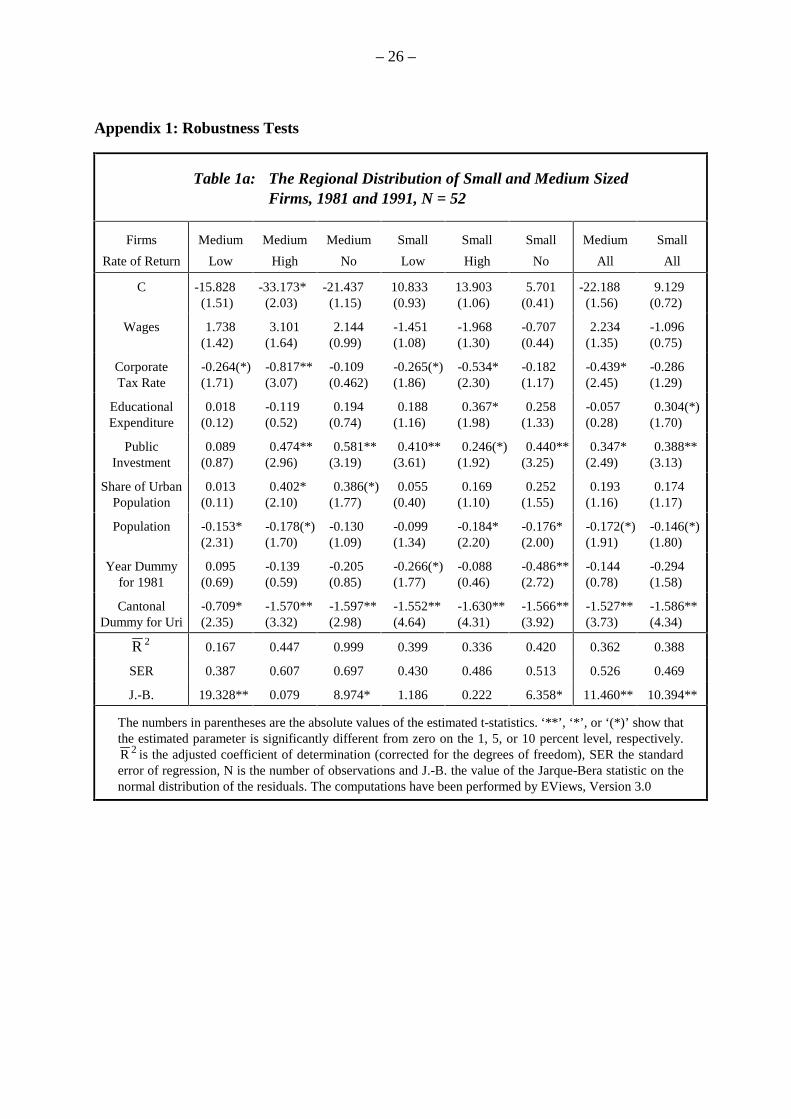
– 26 –
Appendix 1: Robustness Tests
Table 1a: The Regional Distribution of Small and Medium SizedFirms, 1981 and 1991, N = 52
Firms
Rate of Return
Medium
Low
Medium
High
Medium
No
Small
Low
Small
High
Small
No
Medium
All
Small
All
C -15.828(1.51)
-33.173*(2.03)
-21.437(1.15)
10.833(0.93)
13.903(1.06)
5.701(0.41)
-22.188(1.56)
9.129(0.72)
Wages 1.738(1.42)
3.101(1.64)
2.144(0.99)
-1.451(1.08)
-1.968(1.30)
-0.707(0.44)
2.234(1.35)
-1.096(0.75)
CorporateTax Rate
-0.264(*)(1.71)
-0.817**(3.07)
-0.109(0.462)
-0.265(*)(1.86)
-0.534*(2.30)
-0.182(1.17)
-0.439*(2.45)
-0.286(1.29)
EducationalExpenditure
0.018(0.12)
-0.119(0.52)
0.194(0.74)
0.188(1.16)
0.367*(1.98)
0.258(1.33)
-0.057(0.28)
0.304(*)(1.70)
PublicInvestment
0.089(0.87)
0.474**(2.96)
0.581**(3.19)
0.410**(3.61)
0.246(*)(1.92)
0.440**(3.25)
0.347*(2.49)
0.388**(3.13)
Share of UrbanPopulation
0.013(0.11)
0.402*(2.10)
0.386(*)(1.77)
0.055(0.40)
0.169(1.10)
0.252(1.55)
0.193(1.16)
0.174(1.17)
Population -0.153*(2.31)
-0.178(*)(1.70)
-0.130(1.09)
-0.099(1.34)
-0.184*(2.20)
-0.176*(2.00)
-0.172(*)(1.91)
-0.146(*)(1.80)
Year Dummyfor 1981
0.095(0.69)
-0.139(0.59)
-0.205(0.85)
-0.266(*)(1.77)
-0.088(0.46)
-0.486**(2.72)
-0.144(0.78)
-0.294(1.58)
CantonalDummy for Uri
-0.709*(2.35)
-1.570**(3.32)
-1.597**(2.98)
-1.552**(4.64)
-1.630**(4.31)
-1.566**(3.92)
-1.527**(3.73)
-1.586**(4.34)
2R 0.167 0.447 0.999 0.399 0.336 0.420 0.362 0.388
SER 0.387 0.607 0.697 0.430 0.486 0.513 0.526 0.469
J.-B. 19.328** 0.079 8.974* 1.186 0.222 6.358* 11.460** 10.394**
The numbers in parentheses are the absolute values of the estimated t-statistics. ‘**’, ‘*’, or ‘(*)’ show thatthe estimated parameter is significantly different from zero on the 1, 5, or 10 percent level, respectively.
2R is the adjusted coefficient of determination (corrected for the degrees of freedom), SER the standarderror of regression, N is the number of observations and J.-B. the value of the Jarque-Bera statistic on thenormal distribution of the residuals. The computations have been performed by EViews, Version 3.0

– 27 –
Appendix 2: Data Sources
firmi number of firms with a capital of SFr 2 million in the i-th class of rate of re-turn;
Source: EIDGENÖSSISCHE STEUERVERWALTUNG, Bern, Unpublished data on the re-gional distribution of corporate income taxpayers.
ctaxi corporate income tax rate for corporations with a rate of return on capital of 8(i = 1) or 40 (i = 2) percent;
ptax personal income tax rate for the income group of taxable income of SFr 1million per year;
Source: EIDGENÖSSISCHE STEUERVERWALTUNG, Steuerbelastung in der Schweiz, Ta-bles 23 and 43, Bern, various years.
empl number of employed persons;
Source: BAK BASEL, personal correspondence.
w average real monthly salaries of the male population;
Source: BUNDESAMT FÜR INDUSTRIE, GEWERBE UND ARBEIT (BIGA), Abteilung Wirt-schaft und Statistik, Sektion Lohnstatistik, Durchschnittliche Löhne nachKantonen und Agglomerationen, Bern, various years.
edexp real public educational expenditure per capita;
Source: EIDGENÖSSISCHE FINANZVERWALTUNG, Öffentliche Finanzen der Schweiz,Table 28, Bern, various years.
pubinv real public investment per capita;
Source: EIDGENÖSSISCHE FINANZVERWALTUNG, Öffentliche Finanzen der Schweiz1989, Table 29, Bern, 1991.
pop population;
old share of people with age above 65 years;
young share of young people not over 20 years old;
urbpop share of urban population;
Source: BUNDESAMT FÜR STATISTIK, Informationsdienst, Sektion Bevölkerungsent-wicklung, personal correspondence with Ursula Wegmüller.