The impact of algal properties and pre-oxidation on solid–liquid separation of algae
19
Available at www.sciencedirect.com journal homepage: www.elsevier.com/locate/watres Review The impact of algal properties and pre-oxidation on solid–liquid separation of algae Rita Henderson, Simon A. Parsons, Bruce Jefferson Centre for Water Science, Cranfield University, Cranfield, Bedfordshire MK43 0AL, UK article info Article history: Received 14 August 2007 Received in revised form 9 November 2007 Accepted 11 November 2007 Available online 23 December 2007 Keywords: Algae Coagulation Filtration Flotation Sedimentation abstract Algae are traditionally classified according to biological descriptors which do not give information on surface characteristics that are important with respect to removal by water treatment processes. This review examines the character of freshwater algal populations from a water treatment perspective and evaluates the impact of their varying properties and the use of pre-oxidation on their removal by solid–liquid separation processes.. The characteristics shown to impact on treatment were morphology, motility, surface charge, cell density and the extracellular organic matter (EOM) composition and concentration. With the exception of density, these are not phyla specific. It was also shown that dissolved air flotation (DAF) was the most robust clarification method, where up to 99.8% removal was achieved compared to 94% for sedimentation when using metal coagulants. However, successful clarification relied heavily on the optimisation of preceding coagulation and flocculation and coagulant demand was important in this respect. Comparison of all available data reveals a relationship between cell surface area and coagulant demand. It is thus suggested that cell surface area would provide a basis for regrouping algae such that the classification is informative with respect to water treatment. However, the absolute coagulant demand is a result of both surface area and EOM influences. The latter are relatively poorly understood in comparison to natural organic matter (NOM) systems and this remains a limit in current knowledge. & 2007 Elsevier Ltd. All rights reserved. Contents 1. Introduction .................................................................................. 1828 2. Algae characteristics from a water treatment perspective ............................................... 1828 3. Algae removal treatment processes ................................................................ 1830 3.1. Algae inactivation by pre-oxidation ........................................................... 1830 3.2. Coagulation/flocculation.................................................................... 1832 3.3. Clarification processes ..................................................................... 1836 3.3.1. Sedimentation ..................................................................... 1836 3.3.2. Dissolved air flotation ............................................................... 1837 3.3.3. Direct filtration ..................................................................... 1839 ARTICLE IN PRESS 0043-1354/$ - see front matter & 2007 Elsevier Ltd. All rights reserved. doi:10.1016/j.watres.2007.11.039 Corresponding author. Tel.: +44 1234 754813; fax: +44 1234 751651. E-mail address: b.jefferson@cranfield.ac.uk (B. Jefferson). WATER RESEARCH 42 (2008) 1827– 1845
Transcript of The impact of algal properties and pre-oxidation on solid–liquid separation of algae

ARTICLE IN PRESS
Available at www.sciencedirect.com
WAT E R R E S E A R C H 4 2 ( 2 0 0 8 ) 1 8 2 7 – 1 8 4 5
0043-1354/$ - see frodoi:10.1016/j.watres
�Corresponding auE-mail address:
journal homepage: www.elsevier.com/locate/watres
Review
The impact of algal properties and pre-oxidation onsolid–liquid separation of algae
Rita Henderson, Simon A. Parsons, Bruce Jefferson�
Centre for Water Science, Cranfield University, Cranfield, Bedfordshire MK43 0AL, UK
a r t i c l e i n f o
Article history:
Received 14 August 2007
Received in revised form
9 November 2007
Accepted 11 November 2007
Available online 23 December 2007
Keywords:
Algae
Coagulation
Filtration
Flotation
Sedimentation
nt matter & 2007 Elsevie.2007.11.039
thor. Tel.: +44 1234 [email protected]
a b s t r a c t
Algae are traditionally classified according to biological descriptors which do not give
information on surface characteristics that are important with respect to removal by water
treatment processes. This review examines the character of freshwater algal populations
from a water treatment perspective and evaluates the impact of their varying properties
and the use of pre-oxidation on their removal by solid–liquid separation processes.. The
characteristics shown to impact on treatment were morphology, motility, surface charge,
cell density and the extracellular organic matter (EOM) composition and concentration.
With the exception of density, these are not phyla specific. It was also shown that dissolved
air flotation (DAF) was the most robust clarification method, where up to 99.8% removal
was achieved compared to 94% for sedimentation when using metal coagulants. However,
successful clarification relied heavily on the optimisation of preceding coagulation and
flocculation and coagulant demand was important in this respect. Comparison of all
available data reveals a relationship between cell surface area and coagulant demand. It is
thus suggested that cell surface area would provide a basis for regrouping algae such that
the classification is informative with respect to water treatment. However, the absolute
coagulant demand is a result of both surface area and EOM influences. The latter are
relatively poorly understood in comparison to natural organic matter (NOM) systems and
this remains a limit in current knowledge.
& 2007 Elsevier Ltd. All rights reserved.
Contents
1. Introduction . . . . . . . . . . . . . . . . . . . . . . . . . . . . . . . . . . . . . . . . . . . . . . . . . . . . . . . . . . . . . . . . . . . . . . . . . . . . . . . . . . 1828
2. Algae characteristics from a water treatment perspective . . . . . . . . . . . . . . . . . . . . . . . . . . . . . . . . . . . . . . . . . . . . . . . 1828
3. Algae removal treatment processes . . . . . . . . . . . . . . . . . . . . . . . . . . . . . . . . . . . . . . . . . . . . . . . . . . . . . . . . . . . . . . . . 1830
3.1. Algae inactivation by pre-oxidation . . . . . . . . . . . . . . . . . . . . . . . . . . . . . . . . . . . . . . . . . . . . . . . . . . . . . . . . . . . 1830
3.2. Coagulation/flocculation. . . . . . . . . . . . . . . . . . . . . . . . . . . . . . . . . . . . . . . . . . . . . . . . . . . . . . . . . . . . . . . . . . . . 1832
3.3. Clarification processes . . . . . . . . . . . . . . . . . . . . . . . . . . . . . . . . . . . . . . . . . . . . . . . . . . . . . . . . . . . . . . . . . . . . . 1836
3.3.1. Sedimentation . . . . . . . . . . . . . . . . . . . . . . . . . . . . . . . . . . . . . . . . . . . . . . . . . . . . . . . . . . . . . . . . . . . . . 1836
3.3.2. Dissolved air flotation . . . . . . . . . . . . . . . . . . . . . . . . . . . . . . . . . . . . . . . . . . . . . . . . . . . . . . . . . . . . . . . 1837
3.3.3. Direct filtration . . . . . . . . . . . . . . . . . . . . . . . . . . . . . . . . . . . . . . . . . . . . . . . . . . . . . . . . . . . . . . . . . . . . . 1839
r Ltd. All rights reserved.
; fax: +44 1234 751651.k (B. Jefferson).

ARTICLE IN PRESS
WAT E R R E S E A R C H 4 2 ( 2 0 0 8 ) 1 8 2 7 – 1 8 4 51828
4. Discussion . . . . . . . . . . . . . . . . . . . . . . . . . . . . . . . . . . . . . . . . . . . . . . . . . . . . . . . . . . . . . . . . . . . . . . . . . . . . . . . . . . . . 1841
5. Conclusions . . . . . . . . . . . . . . . . . . . . . . . . . . . . . . . . . . . . . . . . . . . . . . . . . . . . . . . . . . . . . . . . . . . . . . . . . . . . . . . . . . . 1843
Acknowledgements . . . . . . . . . . . . . . . . . . . . . . . . . . . . . . . . . . . . . . . . . . . . . . . . . . . . . . . . . . . . . . . . . . . . . . . . . . . . . 1843
References . . . . . . . . . . . . . . . . . . . . . . . . . . . . . . . . . . . . . . . . . . . . . . . . . . . . . . . . . . . . . . . . . . . . . . . . . . . . . . . . . . . . 1843
1. Introduction
Algae are photosynthetic, aquatic plants that utilise inorganic
nutrients such as nitrogen and phosphorus (Manahan, 2000).
Cyanobacteria are typically referred to as blue-green algae
because they perform photosynthesis and are similar in size
and colour, even though they are bacteria (WHO, 2004). Algae
are ubiquitous in surface water but do not pose a problem to
water treatment processes provided populations are rela-
tively low. However, seasonal algal blooms can dramatically
increase populations on relatively rapid timescales and as a
result water treatment process efficiency can be impaired. On
one occasion this has led to the presence of algae in treated
water or even to the closure of a particular site. For example,
in the Anglian Region of the UK, a cyanobacteria bloom of
400,000 cells ml�1 of Microcystis could not be treated, resulting
in the treatment plant being out of service for an 8-week
period (Greene and Hayes, 1981). Furthermore, algal cells and
associated algogenic material are trihalomethane (THM)
precursors (Oliver, 1983; Wachter and Andelman, 1984;
Graham et al., 1998), which has resulted in the restriction of
chlorine usage. Similarly, the potential for toxin release by
cyanobacteria, in particular from Microcystis, has resulted in
the World Health Organisation (WHO) setting a guideline
value of 1 mg l�1 for the associated toxin, microcystin-LR
(MCLR) (WHO, 1998). Finally, the presence of offensive taste
and odour compounds including 2-methylisoborneol (2-MIB)
and geosmin in the resultant drinking water supply has also
been attributed to high alga populations (Burlingame et al.,
1992; Rosen et al., 1992; Kim et al., 1997).
Algae are traditionally characterised according to differences
in pigmentation and cell complexity arising as a result of
evolution (Bellinger, 1992). Cyanobacteria existed prior to all
algal phylum and are prokaryotic cells. Algae evolved as a result
of primary endosymbiosis, whereby a prokaryotic cell engulfed
a bacterium on two occasions to produce eukaryotic green and
red algal phyla, differentiated by the quantity of chlorophyll a in
the cell pigmentation. Current opinion is that secondary
endosymbiosis, whereby eukaryotic cells engulfed other eukar-
yotic cells, produced phyla including diatoms, chrysophytes,
cryptomonads, brown algae and dinoflagellates (Palmer, 2003).
While this classification method is satisfactory from a biologist’s
perspective, its usefulness with respect to water treatment is
less, as algae are not grouped according to the characteristics
that affect treatment processes. Within a particular phylum, the
species can vary significantly in terms of their morphology and
other important functionalities including the composition and
quantity of excreted extracellular organic matter (EOM). This
suggests that a water treatment process may well be able to
successfully remove a number of species from particular phyla,
while struggle with others.
It is required that algae are removed from drinking water,
preferably during the initial stages to ensure minimal impact
on subsequent processes. This review examines the character
of freshwater algal populations from a water treatment
perspective and evaluates the impact of their varying
functionality, specifically their morphological, physiological
as well as EOM character, and pre-oxidation on their
treatability with respect to processes including sedimenta-
tion, flotation and direct filtration. The review will focus on
the following phyla: green algae, blue-green algae and
diatoms, which are regularly responsible for algae blooms in
the UK. This review seeks to establish a basis for regrouping
these algae such that the classification is informative with
respect to water treatment.
2. Algae characteristics from a watertreatment perspective
All algal phyla have key characteristics that allow identifica-
tion. For example, green algae are typified by the grass-green
pigmentation that dominates as a result of the high
chlorophyll a content, while cyanobacteria have a blue-green
shade, accounting for the common reference to ‘‘blue-green
algae’’, and diatoms are brown in colour (Bellinger, 1992). In
addition to pigmentation, cell structure is important with
respect to identification. Cyanobacteria are prokaryotic and as
such have no internal cell organelles, such as chloroplasts. In
contrast, green algae and diatoms contain chloroplasts that
are arranged to give characteristic patterns that allow
determination to species level when combined with morpho-
logical and reproductive features. For example, Spirogina and
Zygnema are both filamentous green algae differentiated by
spiral- and star-shaped chloroplasts, respectively (John et al.,
2002). Additionally, diatoms have a hard outer cell wall due to
high silica concentrations as well as distinct morphologies:
centric and pennate. The former is cylindrical and radially
symmetric, for example, Stephanodiscus and Cyclotella, while
the latter is pen-shaped with bilateral symmetry, examples
being Synedra and Asterionella (Cox, 1996).
Cell morphology, including shape, size, and appendages, is
used for classification purposes but only once identified to
phylum level as key cell shapes exist in all phyla. Single,
spherical cells of less that 5 mm are common to both green
algae and cyanobacteria, e.g. Chlorella sp. and Synechocystis
minuscula, respectively (Table 1). Furthermore, single cells can
colonise to produce more complex structures such as
filaments. For example, the cyanobacteria Anabaena, the
green algae Spirogina and the diatom Melosira can all form
chains of cells (John et al., 2002). Appendages including
flagella, bristles or spines are also common among the
different phyla. Spines can be found both on the green
Scenedesmus and the diatom Stephanodiscus (Table 1). Of the
three phyla examined in the current paper, only green algae
are found with flagella facilitating motility. However, motion
of a gliding nature is observed for both cyanobacteria, for

ARTICLE IN PRESS
Ta
ble
1–
Ch
ara
cteri
stic
so
fa
lga
ea
nd
oth
er
coll
oid
al
pa
rtic
ula
tes
incl
ud
ing
size
,sh
ap
e,
surf
ace
cha
rge
an
dis
oele
ctri
cp
oin
t(i
.e.p
.)
Pa
rtic
leS
ize
(mm
)C
olo
nia
lS
ha
pe
Den
sity
(km�
3)
Zeta
po
ten
tia
l,z
(mV
)T
est
con
dit
ion
s
(pH
;te
stw
ate
r)
Refe
ren
ce
Cya
no
ba
cteri
a
Mic
rocy
stis
aer
ugi
nos
a3–7
Glo
bu
lar
Sp
her
eo
1200
�25
to�
30
9.5
;m
atu
rati
on
po
nd
wa
ter
Jam
eso
n(1
999);
Vla
ski
et
al.
(1996)
Mic
rocy
stis
N/A
Glo
bu
lar
Sp
her
eo
1200
�7.5
to�
26a
5.5
9–7
.94;
syn
theti
c
test
wa
ter
Cla
sen
et
al.
(2000)
Syn
ech
ocys
tis
min
usc
ula
6S
ingle
cell
or
mic
ro-
colo
nie
s
Sp
her
e–
�22.3
;�
28.5
;32.2
a4;
5;
6B
ern
ha
rdt
an
dC
lase
n
(1994)
Syn
ech
ocys
tis
min
usc
ula
5S
ingle
cell
or
mic
ro-
colo
nie
s
Sp
her
e–
�14.9
to�
24.8
4.5
2–7
.58;
syn
theti
c
test
wa
ter
Cla
sen
et
al.
(2000)
Gre
en
alg
ae
Ch
lore
lla
vu
lgari
s5.3
Sin
gle
cell
Sp
her
e1070
�10.0
a7;
dis
till
ed
wa
ter
6.5
;
rese
rvo
irw
ate
r
Ives
(1959)
�19.8
(lo
ggro
wth
)
�17.4
(sta
tio
na
ry
gro
wth
)a
Ed
zwa
lda
nd
Win
gle
r
(1990)
Ch
lore
lla
sp3.5
Sin
gle
cell
Sp
her
e1070
�10;
4–8
;d
isti
lled
wa
ter
Liu
et
al.
(1999)
�14.9
to�
19.8
a5.4
1–7
.08;
syn
theti
c
test
wa
ter
Cla
sen
et
al.
(2000)
Sce
ned
esm
us
qu
adri
cau
da
13.1
Ro
w(s
)o
f4–1
6ce
lls
wit
h
spin
al
ap
pen
da
ges
Ell
ipso
ida
l–
�25
to�
35
7–1
0;
dis
till
ed
wa
ter
Ph
oo
chin
da
an
dW
hit
e
(2003)
18
(d);
25
(l)
�23
to�
25
7–1
0;
dis
till
ed
wa
ter
Ch
en
et
al.
(1998)
Sce
ned
esm
us
obli
qu
us
3–9
(d);
6–1
7(l
)R
ow
(s)
of
4–1
6ce
lls
wit
h
spin
al
ap
pen
da
ges
Ell
ipso
ida
l–
�11.2
a7
Bern
ha
rdt
an
dC
lase
n
(1991)
Sel
enas
tru
m
capri
con
utu
m
2–3
(d);
6–8
(l)
Sin
gle
cell
Cre
scen
tsh
ap
ed
1090
�35
6–1
0;
10�
3M
Na
ClO
4
solu
tio
n
Hu
an
get
al.
(1999)
Dia
tom
s
Cyc
lote
lla
sp.
6.1
Ch
ain
Sp
her
e1140
�19.8
to�
22.3
a4–1
0;
rese
rvo
irw
ate
rE
dzw
ald
an
dW
ingle
r
(1990)
Ste
phan
odis
cus
han
tzsc
ii8–2
0(d
);40
(sp
ines)
Ch
ain
Dis
csh
ap
ed
wit
h
spin
es
–�
12.4
a7
Bern
ha
rdt
an
dC
lase
n
(1991)
Fragi
llari
acr
oton
ensi
s2–3
(d);
40–1
50
(l)
Cell
sjo
ined
alo
ng
len
gth
Elo
nga
ted
–�
18.6
a7
Bern
ha
rdt
an
dC
lase
n
(1991)
Nit
zsch
iali
nea
ris
35
(l)
No
Elo
nga
ted
–�
30
(in
itia
l)�
35
(lo
g
gro
wth
)�
28
(sta
tio
na
ry)
–K
on
no
(1993)
Sye
ndra
acu
s4.5
–6(d
);100–3
00
(l)
No
Need
le1100
�30
to�
40
7.5
–7.7
Jun
et
al.
(2001)
Ino
rga
nic
Ka
oli
n4.3
N/A
Cry
sta
llin
e2670
�46
7;
10�
3M
Na
ClO
4
solu
tio
n
Hu
an
get
al.
(1999)
15
�13
7.1
;ta
pw
ate
rH
an
et
al.
(2001)
�31
to43.4
a3–8
;d
eio
nis
ed
wa
ter
Bla
cka
nd
Ch
en
(1967)
Ben
ton
ite
–N
/AC
ryst
all
ine
–�
24.8
a6;
dis
till
ed
wa
ter
Lev
yet
al.
(1992)
Sil
ica
3.6
N/A
Sp
her
e–
�45
7;
dis
till
ed
wa
ter
Jam
eso
n(1
999)
l¼
len
gth
;d¼
dia
mete
r.a
Co
nv
ert
ed
fro
mele
ctro
ph
ore
tic
mo
bil
ity
toze
tap
ote
nti
al
usi
ng
Hen
ry’s
eq
ua
tio
na
nd
hen
cea
con
vers
ion
fact
or
of
12.4
.
WA T E R R E S E A R C H 4 2 ( 2 0 0 8 ) 1 8 2 7 – 1 8 4 5 1829

ARTICLE IN PRESS
0
10
20
30
40
50
60
70
80
90
DO
C (
mg
l-1 a
s C
)
Log growth phase Early stationary phase Late stationary phase
0
5
10
15
20
25
Scenedesmus (G) Chlorella (G) Synechocystis(CB)
Pseudanabaena(CB)
% E
OM
as
Uro
nic
Aci
d
Fig. 2 – Extracellular organic matter (EOM) character of green
(G) algae Scenedesmus and Chlorella and cyanobacteria (CB)
Synechocystis and Pseudanabaena, where (a) demonstrates
increasing EOM concentration with algal age and (b)
demonstrates decrease in uronic acid concentration with
age (adapted from Hoyer et al., 1985).
WAT E R R E S E A R C H 4 2 ( 2 0 0 8 ) 1 8 2 7 – 1 8 4 51830
example Oscillatoria and diatoms, known as ‘‘raphid pen-
nates’’ e.g. Navicula (Cox, 1996).
Cell density is observed to vary from 1070 to 114 kg m�3 for
green algae and diatoms, respectively (Table 1) (Edzwald and
Wingler, 1990), although densities as low as 1020 kg m�3 have
been quoted for a ‘‘typical algal entity’’ (Pieterse and Cloot,
1997). In general, diatoms are heavier than the other species
as a result of their silica-rich hard outer wall. However,
cyanobacteria cells have the ability to adjust the content of
water within the cell using gas vacuoles (John et al., 2002),
thus most cyanobacteria species have a variable density and
can even maintain a lower density than that of water.
Algae suspension surface charge is species but not phyla
dependent, although all algal cells have a negative zeta
potential at natural water pH (Table 1). This arises as a result
of the dissociation of functional groups at the cell surface,
particularly carboxylic acid groups in either the cell wall
(Northcote et al., 1958) or in EOM attached at the cell surface
(Bernhardt et al., 1985). Hence, algae suspensions behave
according to an acidic dissociation model in that the surface
charge only changes over acidic pHs (Hunter, 1994). The zeta
potential of an algal cell is typically electronegative for pH
4–10, ranging from �10 mV for Chlorella to �35 mV for
Scenedesmus and Selenastrum (Table 1). In general, an iso-
electric point of around pH 3–4 is determined for all algal
species (Stumm and Morgan, 1996; Liu et al., 1999; Clasen
et al., 2000; Phoochinda and White, 2003). The stage of life
cycle can also influence zeta potential. To illustrate, the
diatom Nitzschia had a zeta potential of �30 mV at the initial
growth phase, �35 mV in the log growth phase and �28 mV in
the stationary phase (Konno, 1993) and the surface charge of
Chlorella also became less negative on transition from log
growth phase to stationary phase, measured as �1.6 to
�1.4 mm V s�1 cm�1 (�19.8 to �17.4 mV) (Edzwald and Wingler,
1990). It has been postulated that this phenomenon is due to
variations in quantity and composition of EOM attached to
the cell surface (Bernhardt et al., 1985). This implies that it is
the organic matter present that controls the surface charge as
opposed to the cell surface itself.
EOM can influence the surface chemistry of mineral
particles similar to natural organic matter (NOM) (Bernhardt
et al., 1985; Beckett and Le, 1990; Paralkar and Edzwald, 1996;
Leppard, 1997), as well as promoting or inhibiting floc
formation (Passow et al., 1994; Bernhardt et al., 1985; Kioerboe
and Hansen, 1993) and chelating metal cations (Kaplan et al.,
1988; Gregor et al., 1996; Leppard, 1997). Reported EOM
concentrations range from 1.8 mg l�1 for the cyanobacteria
Synechocystis to 81 mg l�1 from the green genus Chlorella (Hoyer
et al., 1985). Whilst actual levels vary, similar trends have
been observed for all species examined to date. For example,
HO
O
OH OH H OH
H H OH H
O
Fig. 1 – Structure of glucuronic acid.
the EOM concentration increases with the age of the algae
while the uronic acid content (Fig. 1) measured within the
EOM decreases with increasing population age (Fig. 2). The
latter observation is highly relevant with respect to algae
character as it has been shown that increasing uronic acid
content can be correlated with greater metal complexing
capacity whereby a marked difference in uronic acid content
and hence complexing capacity was found between species of
the same genera. Specifically, Chlorella stigmatophora and
Chlorella salina were found to contain 30% and 6% uronic
acid, respectively (Kaplan et al., 1988).
3. Algae removal treatment processes
Algae are typically removed using the following treatment
chain: pre-oxidation, coagulation and flocculation, and clar-
ification either by dissolved air flotation (DAF) or sedimenta-
tion, followed by granular media filtration. Direct filtration can
also be used as a clarification process. More recently, ozone
and granular-activated carbon (GAC) filters have been installed
downstream of clarification, primarily for pesticide removal.
3.1. Algae inactivation by pre-oxidation
Pre-treatment, using oxidants such as ozone, chlorine,
potassium permanganate and potassium ferrate, has been

ARTICLE IN PRESS
WA T E R R E S E A R C H 4 2 ( 2 0 0 8 ) 1 8 2 7 – 1 8 4 5 1831
shown in many instances to improve algae removal as a
result of ‘‘algal inactivation’’ (Table 2). For example, pre-
ozonation improved Scenedesmus quadricauda removal by 99%
on sedimentation (Plummer and Edzwald, 2002). Improved
removal was also demonstrated in a flotation/filtration pilot
scale study, where inclusion of pre-ozonation increased
removal of algae from 75% to 93% (Montiel and Welte, 1998).
The improvement in algae removal has been attributed to
four mechanisms as follows:
(a)
Ta
Sp
Gr
Ch
sp
Sc
Sc
qu
Sc
Gr
m
D
Cy
Eu
Eu
A significant change in external cell architecture after
oxidation. To illustrate, spinal appendages of green algae
Scenedesmus and Chlorococum cells become detached (Ma
and Liu, 2002; Plummer and Edzwald, 2002); there may be
noticeable damage to the outer cell, although cell wall
perforation may not occur until after relatively high ozone
doses (Plummer and Edzwald, 2002); and, row organisa-
tion of Scenedesmus colonies may be disturbed (Ma and
Liu, 2002).
(b)
The motion of flagellated species including Rhodomonasminuta, Cryptomonas sp., Euglena sp. and the gliding action
of species such as Navicula sp. and Nitzschia sp. is
completely impeded (Petrusevski et al., 1996). In fact, in
all cases examining the removal of flagellated algae
treated with pre-oxidation removal was improved by
85–95% depending on the oxidant employed (Steynberg
et al., 1996).
(c)
The excretion of chitin containing fibrils by diatomsincluding Cyclotella and Stephanodiscus hantzschii has been
shown to occur to a much greater degree relative to
normal rate of release on pre-oxidation. This particular
ble 2 – Observations on pre-oxidisation of algae suspensions
ecies Cellconcentration
Oxidant Dose(mg/l)
een algae
lamydomonas
.
50 mg l�1 as
chlorophyll a
ClO2 0.8
Cl2 2
enedesmus 2� 106 cells ml�1 O3 4.6
ClO2 5
Cl2 2–20
enedesmus
adricauda
20,000 cells ml�1 O3 1.2
Cl2 1.0
enedesmus sp. 3.9�108 cells ml�1 K2FeO4 5 Get en
een algae
ixture
Up to 70,000 cells/
ml
O3 1 In
iatom
clotella sp. 20,000 cells ml�1 O3 0–3
Cl2 0–3
glenophyta
glena gracilis 50 mg l�1 as
chlorophyll a
ClO2 0.8
Cl2 2
polymeric material has a glue-like consistency and as
such behaves as a coagulant aid in a similar manner to
anionic and non-anionic polyelectrolytes and thus im-
proves agglomeration (Petrusevski et al., 1996).
(d)
EOM may be degraded such that it no longer impairsflocculation as was observed for the diatom Fragillaria and
the blue-green species Pseudanabaena at a dose of
0.8 mg mg�1 C (Hoyer et al., 1987).
However, there are a number of drawbacks to pre-oxidation.
Disinfection by-products (DBPs) can form when using chlor-
ine or chlorine dioxide, specifically trihalomethanes (THMs).
For example, blooms of the diatom Asterionella formosa
(105 cells ml�1) and the blue-green algae Anabaena flos-aquae
(106 cells ml�1) produced 0.27 and 0.45 mg chloroform mg�1
TOC, respectively from the cell material while 0.15 and
0.35 mg chloroform mg�1 TOC, respectively were produced
from associated EOM (Graham et al., 1998). Ozone was
investigated as an alternative oxidant; however, the dissolved
organic carbon (DOC) content of the green algae S. quadricauda
increased by 400%, increasing the THM formation potential by
34% (Plummer and Edzwald, 2002). Other alternatives are
potassium permanganate and potassium ferrate oxidants;
however, these have been demonstrated to cause increases in
residual manganese and turbidity. Petrusevski et al. (1996)
noted that permanganate dose and residual manganese were
positively correlated, although it was observed that the
subsequent application of cationic polymer ensured that
residual manganese levels were acceptable.
Irrespective of oxidant utilised, overdosing cannot only
induce cell lysis, releasing undesirable toxins or taste and
Observations Reference
90% improvement (ascribed to
immobilisation)
Steynberg et al.
(1996)
85% improvement
Coagulant demand halved Sukenik et al. (1987)
Coagulant demand quartered
Coagulant demand increased
99% improvement Plummer and
Edzwald (2002)
10% improvement
hanced algae removal at all coagulant
dosages, �10%
Ma and Liu (2002)
crease in removal from 75% to 93% Montiel and Welte
(1998)
No improvement Plummer and
Edzwald (2002)
No improvement
90% improvement (ascribed to
immobilisation)
Steynberg et al.
(1996)
95% improvement

ARTICLE IN PRESS
0
2
4
6
8
-25 -15 -5 5 15
Zeta Potential (mV)
Tur
bidi
ty (
NT
U)
1: Nile Water - mixed phytoplankton1: Seine River Water - Pediastrum (G) + Melosira (D)2: Chlorella vulgaris (G) + alum2: Chlorella vulgaris (G) + PAC2: Cyclotella (D) + alum2: Cyclotella (D) + PAC
Fig. 3 – Turbidity versus zeta potential for various species
(CB ¼ cyanobacteria; G ¼ green; D ¼ diatom), coagulants and
removal processes as follows: (1) sedimentation (Mouchet
and Bonnelye, 1998) and (2) flotation (Edzwald and Wingler,
1990).
WAT E R R E S E A R C H 4 2 ( 2 0 0 8 ) 1 8 2 7 – 1 8 4 51832
odour compounds, but also degrade EOM to the extent that
compounds with interfering properties including mono and
dicarboxylic acids and glycaric acids are formed (Hoyer et al.,
1987). The optimum dose is that which achieves cell
modification without cell lysis and this has been shown to
be species dependent. To illustrate, application of a dose of
3 mg l�1 of ozone (O3) to 100,000 cells ml�1 of the diatom
Cyclotella did not cause significant damage to the relatively
strong, silica containing, cell wall, however the same dose
applied to 100,000 cells ml�1 of the green algae Scenedesmus
caused significant alterations to cell morphology and in some
instances induced cell lysis (Plummer and Edzwald, 2002). It
was observed for the EOM of green algae Dictyosphaerium that
a dose as little as 0.3 mg O3 mg�1 EOM as C impaired
flocculation (Hoyer et al., 1987).
The sensitivity of pre-oxidation success in relation to algae
species indicates that successful application of pre-oxidation
treatment is highly dependent on an evaluation of the
influent algae system. However, the recent inclusion in many
water treatment works of processes such as post-ozone and
GAC allows treatment of increased DOC content that may
contribute to DBP precursor formation. For example, GAC has
been demonstrated to remove exo-MCLR to below the given
current guideline value of 1 mg l�1 as MCLR (Lambert et al.,
1996). It has also been demonstrated that excreted odorous
compounds such as geosmin and 2-MIB can be removed by
adsorption onto GAC with post-ozonation, using an empty
bed contact time (EBCT) of 15 min and ozone dose of 3–5 mg
O3 l�1 with an hydraulic retention time (HRT) of 7.5 min (Ando
et al., 1992; Kim et al., 1997).
3.2. Coagulation/flocculation
Ives (1959) conducted some of the original research into the
significance of surface charge with respect to algal coagula-
tion. It was suggested that the coagulation mechanism was
‘‘one of mutual attraction and charge neutralisation of the
algae and the incipient hydroxide flocculi’’ and as such the
hydroxide precipitant should be positively charged. In a more
recent study, the flocculation mechanism of Synechocystis
minuscula (diameter of 6 mm) using alum coagulant was
investigated. It was determined that at pH 5 charge reversal
was achieved with 7 mg l�1 as Al and cells started to form
distinctive aggregates. It was suggested that aggregation
occurred as a result of the cationic aluminium hydroxo
complexes interacting with the algal surface, in accordance
with the principle of adsorption coagulation with charge
neutralisation (Bernhardt and Clasen, 1994).
Certain coagulation experiments have taken surface charge
into account by measuring the zeta potential when examin-
ing conditions for optimal removal. On comparing two such
studies (Edzwald and Wingler, 1990; Mouchet and Bonnelye,
1998), it was observed that on adjusting the zeta potential of
an algal suspension with a specific operational range,
removal was significantly improved (Fig. 3). The range was
noted to alter depending on the clarification procedure. To
illustrate, for both sedimentation examples the bands are
fairly narrow, with optimum removal occurring at between�5
to 0 mV and �8 to 0 mV for Seine and Nile river water,
respectively (Mouchet and Bonnelye, 1998). Use of flotation as
opposed to sedimentation widened the zeta potential range
for optimum removal; such that successful removal was
obtained at more negative zeta potential ranges of �15 to
0 mV. Additionally, the residual turbidities were much lower
for DAF processes than for sedimentation (Fig. 3). This
occurred irrespective of phyla, where green algae were
represented by Chlorella vulgaris and Pediastrum, diatoms by
Cyclotella and Melosira and cyanobacteria by Synechocystis
miniscula. Furthermore, the varying morphology did not
appear to impact on the requirement to operate within a
specific zeta potential range whilst Chlorella and Synechocystis
are micro-algae with spherical cells, Cyclotella, Melosira and
Pediastrum are barrel shaped with spines, filamentous and
disc shaped, respectively.
The relationship between algae cell destabilisation by
reduction of the magnitude of the zeta potential and coagulant
dose has been shown to be time dependent, particularly for
relatively low aluminium doses (Clasen et al., 2000). For
example, on dosing 1 mg l�1 of Al to 1�106 cells ml�1 of the
spherical cyanobacteria cells, Synechocystis, the zeta potential
took over 6 min to decrease to the final value. The time lag was
reduced to 2 min when the dose was increased to 10 mg l�1.
This phenomenon was attributed to algae actively influencing
the surface charge by ion transfer across the cell membrane to
restore the negative charge, as has been discussed in previous
studies (Pieterse and Cloot, 1997; Ulberg and Marochko, 1999).
It was supposed that higher Al dosages disrupted the cell
repair mechanism, leading to more immediate destabilisation.
This observation held for four additional species of algae—the
spherical green algae Chlorella and other cyanobacteria species
including spherical Microcystis and filamentous Pseudanabaena
and Planktothrix. It was further concluded that algae may
therefore need more time to flocculate than other particles.
This was demonstrated when comparing kaolin, NOM and
the spherical green algae Chlorella vulgaris, where steady state
floc size was achieved after 4, 5 and 25 min, respectively
(Henderson et al., 2006). Furthermore, no observable growth
was observed for the C. vulgaris until after 7 min.

ARTICLE IN PRESS
WA T E R R E S E A R C H 4 2 ( 2 0 0 8 ) 1 8 2 7 – 1 8 4 5 1833
It has been demonstrated that the impact of some algal
characteristics means removal by charge neutralisation
mechanisms is unfeasible. Removal by charge neutralisation
can be obtained if the algal cell is spherical, free from
protruding appendages or polymeric substances and micro-
scopic in size (Bernhardt and Clasen, 1991; Pieterse and Cloot,
Table 3 – Alternative algae flocculation mechanisms (adapted
Algal species Cell description Removal
Diatoms
Stephanodiscus
hantzschii
Small, spherical cell with
bristles of up to 40mm in
length
Steric interaction
con
Asterionella
formosa and
Fragillaria
crotonensis
Individual cells congregate
to form large colonies
Easily removed, ho
and surface filtrati
larg
Blue-green algae
Oscillatoria
rubenscens
Small cells but large
filaments reaching up to
several mm in length
Large filaments exc
hydrox
Green algae
Dictyosphaerium
pulchellum
Cell is coated in
macromolecular
compounds (EOM) which
give surface a gelatinous
consistency
Compounds have s
weak anionic polym
hydroxide flocs can
due to c
Rhodophyta
Rhodomonas Algae have flagella Flagellates are able t
from floc
0
20
40
60
80
100
Mic
rocy
stis
aeru
gino
sa(C
B)
Ana
baen
a fl
os-
aqua
e (C
B)
Ast
erio
nell
afo
rmos
a (D
)
Ped
iast
rum
/M
elos
ira
(G/D
)
Rem
oval
Eff
icie
ncy
%
DAF Filtrati
Fig. 4 – Comparison of removal efficiency using dissolved air flota
1993) and sedimentation (Jiang et al., 1993; Mouchet and Bonne
(CB ¼ cyanobacteria; D ¼ diatom; G ¼ green; CP ¼ cryptophyta).
1997). Deviation from this optimum conformation is common
among algae cells and hence the optimum removal condi-
tions cannot always be predicted by charge measurement
data (Table 3). In many instances, even increasing the
coagulant dose to enable removal by sweep flocculation
mechanisms does not improve removal. For example, the
from Bernhardt and Clasen, 1991)
difficulty Flocculation mechanism
prevents direct cell
tact
Sweep coagulation, hydroxide floc fills
gaps between bristles—charge
neutralisation occurs after 120 mg alum l�1
whereas 80–100 mg alum l�1 gives longest
filter run time
wever, filter clogging
on dominate due to
e size
Low dosage of alum (10 mg l�1 as alum)
required for elimination—charge
neutralisation occurs when 20 mg alum l�1
has been dosed
eed the size of metal
ide flocs
Addition of anionic or non-ionic flocculant
aid reduced alum dose from 100 to
10 mg l�1
imilar properties to a
er. On metal addition,
breakthrough filter
helation
As EOM acts as coagulant aid, metal dose
required is significantly less, unless EOM
concentration exceeds 1–2 mg l�1 as C
o liberate themselves
aggregates
Large metal salt dosages only achieve 50%
removal at best by sweep
coagulation—require inactivation by
oxidation
Chl
orel
la (
G)
Cyc
lote
lla
(D)
Step
hano
disc
usha
ntzs
cii (
D)
Rho
dom
onas
min
uta
(R)
Mic
ro a
lgae
on Sedimentation
tion (Edwald and Wingler, 1990), filtration (Petrusevski et al.,
lye, 1998; Drikas et al., 2001) for a variety of species

ARTICLE IN PRESS
Ta
ble
4–
Effi
cien
cyo
fa
lga
ere
mo
va
lb
yco
ag
ula
tio
n/fl
occ
ula
tio
na
nd
sed
imen
tati
on
Alg
ae
So
urc
ew
ate
rA
lga
eco
nce
ntr
ati
on
pH
Co
agu
lan
t/fl
occ
ula
nt
do
se(m
gl�
1)
Ra
pid
mix
(rp
m;
s)
Flo
ccu
lati
on
(rp
m;
min
)S
ett
lin
gti
me
(min
)aC
ell
rem
ova
l(%
)
Refe
ren
ce
Cy
an
ob
act
eri
a
Mic
rocy
stis
aer
ugi
nos
a
Rese
rvo
irw
ate
r5.0�
10
5to
1.5�
10
6ce
lls
ml�
1
7.2
10.3
mg
l�1
as
Al
(Al 2
(SO
4) 3
)230;
60
25;1
415
75
Dri
ka
set
al.
(2001)
Mic
rocy
stis
aer
ugi
nos
a
Rese
rvo
irw
ate
r1�
10
4ce
lls
ml�
1;
3–3
.5N
TU
810
mg
l�1
as
Fe;
1.0
mg
l�1
as
sup
erfl
oc
C-5
73
G:
10
3s�
1;
30
G¼
30
s�1;
X30
min
60;
filt
rati
on
at
10
mh�
1;
200
mm
san
db
ed
98.9
Vla
ski
et
al.
(1996)
Mic
rocy
stis
aer
ugi
nos
a
Gro
wth
med
ia5.8�
10
4ce
lls
ml�
1;
6.1
NT
U
7.5
5m
gl�
1a
sFe
(Fe
2(S
O4) 3
)300;
60
35;
20
60
62
Jia
ng
an
d
Gra
ha
m
(1998)
Mic
rocy
stis
aer
ugi
nos
a
Gro
wth
med
ia5.8�
10
4ce
lls
ml�
1;
6.1
NT
U
7.5
5m
gl�
1a
sFe
(PFS
)300;
60
35;
20
60
81.6
Jia
ng
an
d
Gra
ha
m
(1998)
An
abaen
afl
os-
aqu
ae
Gro
wth
med
ia2�
10
5ce
lls�
17.5
11.2
mg
l�1
as
Fe(F
e2(S
O4) 3
)300;
120
35;
25
120
74
Jia
ng
et
al.
(1993)
An
abaen
afl
os-
aqu
ae
Gro
wth
med
ia2�
10
5ce
lls
ml�
17.5
5.4
mg
l�1
as
Al
(Al 2
(SO
4) 3
)300;
120
35;
25
120
78
Jia
ng
et
al.
(1993)
An
abaen
afl
os-
aqu
ae
Gro
wth
med
ia2�
10
5ce
lls
ml�
17.5
11.2
mg
l�1
as
Fe(P
FS
)300;
120
35;
25
120
94
Jia
ng
et
al.
(1993)
An
abaen
afl
os-
aqu
ae
Gro
wth
med
ia2�
10
5ce
lls
ml�
17.5
5.4
mg
l�1
as
Al
(PA
Cl)
300;
120
35;
25
120
68
Jia
ng
et
al.
(1993)
Dia
tom
s
Ast
erio
nel
la
form
osa
Gro
wth
med
ia2�
10
5ce
lls
ml�
17.5
11.2
mg
l�1
as
Fe(F
e2(S
O4) 3
)300;
120
35;
25
120
63
Jia
ng
et
al.
(1993)
Ast
erio
nel
la
form
osa
Gro
wth
med
ia2�
10
5ce
lls
ml�
17.5
5.4
mg
l�1
as
Al
(Al 2
(SO
4) 3
)300;
120
35;
25
120
79
Jia
ng
et
al.
(1993)
Ast
erio
nel
la
form
osa
Gro
wth
med
ia2�
10
5ce
lls
ml�
17.5
5.4
mg
l�1
as
Al
(PA
C)
300;
120
35;
25
120
68
Jia
ng
et
al.
(1993)
WAT E R R E S E A R C H 4 2 ( 2 0 0 8 ) 1 8 2 7 – 1 8 4 51834
ARTICLE IN PRESS
Ast
erio
nel
la
form
osa
Gro
wth
med
ia2�
10
5ce
lls
ml�
17.5
11.2
mg
l�1
as
Fe(P
FS
)300;
120
35;
25
120
87
Jia
ng
et
al.
(1993)
Syn
edra
acu
s/
Mel
osir
a
Rese
rvo
irw
ate
r1500
cell
sm
l�1
6.8
1.6
2m
gl�
1a
sA
l(A
l 2(S
O4) 3
)135;
60
45;
10
30
88
Jun
et
al.
(2001)
Syn
edra
acu
sR
ese
rvo
irw
ate
r1040
cell
sm
l�1
72.1
6m
gl�
1a
sA
l(P
AC
)135;
60
45;
10
30
76
Jun
et
al.
(2001)
Syn
edra
acu
sR
ese
rvo
irw
ate
r760
cell
sm
l�1
72.1
6m
gl�
1a
sA
l(P
AH
CS
)135;
60
45;
10
30
54
Jun
et
al.
(2001)
Syn
edra
acu
sR
ese
rvo
irw
ate
r1040
cell
sm
l�1
5.3
14
mg
l�1
as
Fe(F
eC
l 3)
135;
60
45;
10
30
74
Jun
et
al.
(2001)
Syn
edra
acu
sR
ese
rvo
irw
ate
r1480
cell
sm
l�1
6.8
2.1
6m
gl�
1a
sA
l(A
l 2(S
O4) 3
);
0.2
5m
gl�
1ca
t-io
nic
po
lym
er
C-5
99A
135;
60
45;
10
30
99
Jun
et
al.
(2001)
Ch
loro
ph
yta
Ch
lore
lla
sp.
Deio
nis
ed
wa
ter;
0.0
5M
na
no
3
6.8�
10
5ce
lls
ml�
18
8m
gl�
1a
sA
l(A
l 2(S
O4) 3
)100;
120
25;
20
30
80
Liu
et
al.
(1999)
Ch
lore
lla
sp.
Deio
nis
ed
wa
ter;
0.0
5M
Na
NO
3
6.8�
10
5ce
lls
ml�
17
8m
gl�
1a
sA
l(P
AC
)100;
120
25;
20
30
85
Liu
et
al.
(1999)
Mix
ture
Spir
uli
na,
osci
llato
ria,
chlo
rell
a
Nu
trie
nt
med
iaa
nd
tap
wa
ter;
14
mg
l�1
as
Ca
CO
3
55
NT
U7
5.0
mg
l�1
as
chit
osa
n5
s60;
30
30
90
Div
ak
ara
n
an
dP
illa
i
(2002)
Pedia
stru
m
clath
ratu
ma
nd
Mel
osir
a
Sein
eR
iver
wa
ter
1–3�
10
4ce
lls
ml�
1–
9.5
mg
l�1
as
Al
––
10
70–8
0M
ou
chet
an
d
Bo
nn
ely
e
(1998)
aN
.B.
No
loa
din
gra
ted
ata
wa
sava
ila
ble
for
Ta
ble
4a
sa
llre
po
rtre
sult
so
bta
ined
fro
mja
rte
stex
peri
men
ts.
WA T E R R E S E A R C H 4 2 ( 2 0 0 8 ) 1 8 2 7 – 1 8 4 5 1835

ARTICLE IN PRESS
WAT E R R E S E A R C H 4 2 ( 2 0 0 8 ) 1 8 2 7 – 1 8 4 51836
diatoms Asterionella formosa and Fragillaria crotonensis are so
large that filter clogging occurs rapidly and increasing
coagulant addition only decreases run times (Bernhardt and
Clasen, 1991). Pieterse and Cloot (1997) noted that large algal
cells such as the aforementioned can no longer be treated as
colloidal entities, and therefore discussion of system ‘‘desta-
bilisation’’ may not be appropriate. They identified the
likelihood of the presence of an additional short range force
of mutual attraction (universal gravitation) favouring the
coagulation process.
EOM acting as a polymer aid can also decrease the amount
of coagulant required, for example, the green algae Dictyo-
sphaerium pulchellum had an EOM composition that en-
hanced flocculation, when present in small concentrations
(0.1–2.0 mg l�1 as C). However, at increased EOM concentra-
tions (41–2 mg l�1 as C) flocculation was inhibited for a dose
of 3 mg l�1 as Fe, and only when 10 mg l�1 as Fe had been
added was coagulation satisfactory (Bernhardt et al., 1985).
This was attributed to either steric hindrance or to metal
complexation. Another study determined that the coagulant
demand did not wholly correlate with cell surface area as
0.25 mg l�1 as Al was required for destabilisation of Pseudana-
baena compared to 1 mg l�1 for a similar surface area of
Synechocystis—both of which are cyanobacteria, the former
filamentous and the latter spherical (Clasen et al., 2000).
Differences in removals by sedimentation have been
observed when using various coagulants. This will be
addressed in Section 3.3.1.
3.3. Clarification processes
Sedimentation and flotation are typical clarification processes
utilised upstream of granular media filtration when high algal
populations are common in the supply water. Direct filtration
may also be utilised, although this is less typical for very high
algae concentrations are anticipated at a water treatment
works. Overall, DAF tends to have the most efficient removal
rates, consistently removing greater than 90% of cells.
Sedimentation reliably removed between 70% and 80% of
cells, while it is suggested that direct filtration is the most
susceptible to changing algae character (Fig. 4).
3.3.1. SedimentationSedimentation is the most traditional separation technique
and relies on efficient coagulation and flocculation to produce
flocs with good settling properties (Vlaski et al., 1997). It is
difficult to achieve such large, compact flocs from algae cells
given the cell density can be as low as 1.02 g cm�3 (Pieterse
and Cloot, 1997). For example, in a flotation study, Edzwald
(1993) estimated that a Cyclotella-aluminium floc had a
density of 1100 kg m�3; half that of a typical turbidity floc of
approximately 2.2 g cm�3 (assuming a solid density of
2670 kg m�3 (Huang et al., 1999) and volume fraction of the
solid within the aggregate of 70%). This low density is likely to
be responsible for the relatively inefficient removal rates
reported for sedimentation studies of 63–94% (Table 4).
In general, settlement achieved between 70% and 80%
removal efficiency for settlement times varying from 10 min
to 2 h when using aluminium sulphate (AS) for a variety of
species (Jiang et al., 1993; Mouchet and Bonnelye, 1998; Liu
et al., 1999; Drikas et al., 2001) (Fig. 4 and Table 4).
Interestingly, there were no significant variations observed
on the basis of morphology. For example, the spherical
microscopic species, Microcystis and Chlorella (Table 1), were
not removed to any greater extent than cells with the more
complex structures of Asterionella (star-shaped diatom cell
colony) or Pediastrum (disc-shaped green algal colony). This is
despite the differences in algal density that would be
affecting the floc properties. For example, Microcystis aerugi-
nosa contains gas vacuoles to aid buoyancy thus lowering the
density whereas the diatoms A. formosa will have a relatively
higher density as a result of its heavy cell wall (Table 1).
Autoflotation has also been observed to impact on the floc
settleability whereby oxygen produced by algae during
photosynthetic processes can exceed the saturation level
leading to bubble formation within flocs (Jod"owski, 2002),
thus reducing settling rates.
A variety of chemicals have been trialled for coagulating
algal particles in addition to AS, including metal coagulants
(ferric sulphate (FS) and ferric chloride (FC)) and inorganic
polymers, for example polyaluminium chloride (PAC) and
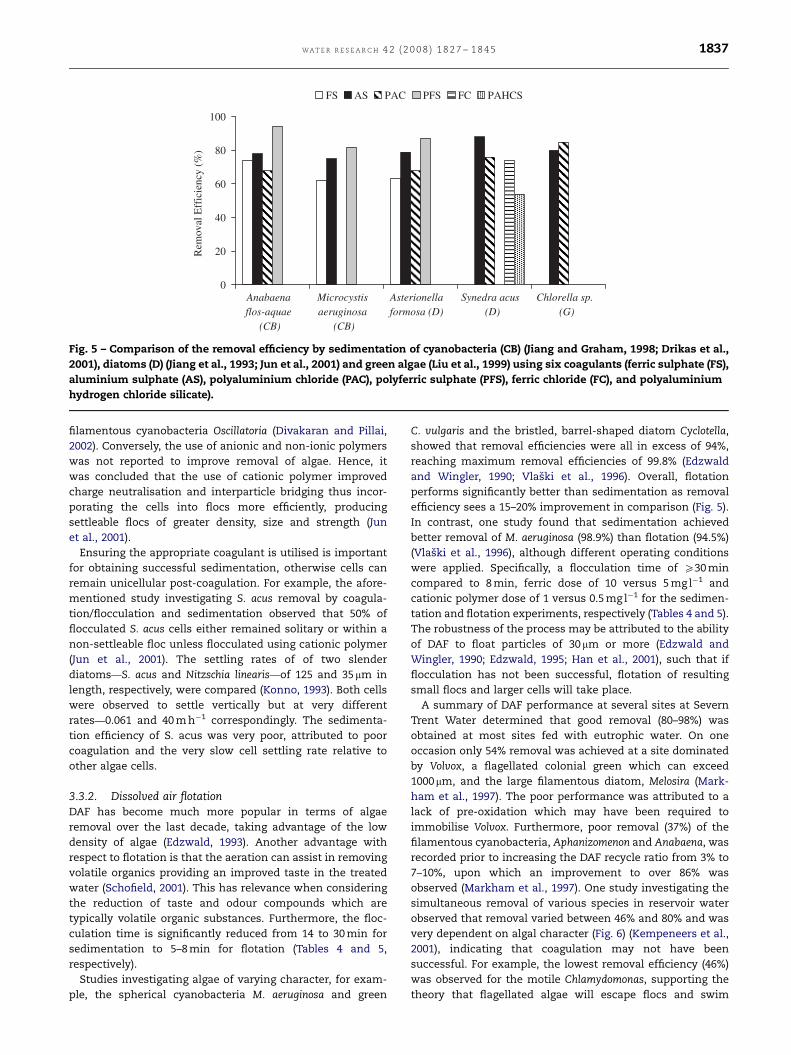
polyferric sulphate (PFS) (Table 4). On examining the removal
efficiency for various algae of differing character by sedimen-
tation for a range of metal-based coagulants, there does not
appear to be a relationship between either algal phyla or algal
character and coagulant type (see Table 4 for specific test
conditions) (Fig. 5). For example, FS removes both M. 386
aeruginosa and A. formosa by 62% and 63 % despite the fact
that they are a cyanobacterium and a diatom, with simple
spherical and complex colonial morphologies, respectively.
Overall, coagulation using AS consistently achieved 475%
removal irrespective of the species (Jiang et al., 1993; Jiang and
Graham, 1998; Liu et al., 1999; Drikas et al., 2001; Jun et al.,
2001), contrasting with FS and FC which achieved only
between 62% and 74 % removal respectively (Jiang et al.,
1993; Jiang and Graham, 1998; Jun et al., 2001). This suggests
that alum is less sensitive to changing algae character.
However, when ferric was applied in its polymerised form
(PFS), removal of each species tested was improved relative to
the addition of FS by 21–27% (Jiang et al, 1993; Jiang and
Graham, 1998). In contrast, when alum was applied as a
polymer (PAC rather than AS), a general decrease in removal
efficiency of 13–14% was observed (Jiang et al., 1993; Jun et al.,
2001) with the exception of Chlorella sp. (Liu et al., 2001).
Improved removal (99% and 98.9%) was only obtained when
a cationic polymer was utilised and, in the latter, an
additional filtration step (Vlaski et al., 1996; Jun et al., 2001)
(Table 4) and this again appeared to be irrespective of the
differing algae characteristics. For example, the use of
Superfloc C-573 with ferric generated a removal efficiency of
98.9 % for the spherical cyanobacteria M. aeruginosa (Vlaski
et al., 1996) whilst the use of cationic polymer C-599A
alongside alum improved the removal of the needle-shaped
diatom Synedra acus from 88% (for alum alone) to 99% (Jun
et al., 2001) (Table 4). However, it is noted that in the former
example, filtration was also applied which is likely to have
helped improve removal efficiency. Additionally, employing
chitosan alone obtained removal efficiencies of 90% for a
mixture of species of differing character—the green species of
spherical celled Chlorella and filamentous Spirulina, and the
ARTICLE IN PRESS
0
20
40
60
80
100
Anabaenaflos-aquae
(CB)
Microcystisaeruginosa
(CB)
Asterionellaformosa (D)
Synedra acus(D)
Chlorella sp.(G)
Rem
oval
Eff
icie
ncy
(%)
FS AS PAC PFS FC PAHCS
Fig. 5 – Comparison of the removal efficiency by sedimentation of cyanobacteria (CB) (Jiang and Graham, 1998; Drikas et al.,
2001), diatoms (D) (Jiang et al., 1993; Jun et al., 2001) and green algae (Liu et al., 1999) using six coagulants (ferric sulphate (FS),
aluminium sulphate (AS), polyaluminium chloride (PAC), polyferric sulphate (PFS), ferric chloride (FC), and polyaluminium
hydrogen chloride silicate).
WA T E R R E S E A R C H 4 2 ( 2 0 0 8 ) 1 8 2 7 – 1 8 4 5 1837
filamentous cyanobacteria Oscillatoria (Divakaran and Pillai,
2002). Conversely, the use of anionic and non-ionic polymers
was not reported to improve removal of algae. Hence, it
was concluded that the use of cationic polymer improved
charge neutralisation and interparticle bridging thus incor-
porating the cells into flocs more efficiently, producing
settleable flocs of greater density, size and strength (Jun
et al., 2001).
Ensuring the appropriate coagulant is utilised is important
for obtaining successful sedimentation, otherwise cells can
remain unicellular post-coagulation. For example, the afore-
mentioned study investigating S. acus removal by coagula-
tion/flocculation and sedimentation observed that 50% of
flocculated S. acus cells either remained solitary or within a
non-settleable floc unless flocculated using cationic polymer
(Jun et al., 2001). The settling rates of of two slender
diatoms—S. acus and Nitzschia linearis—of 125 and 35mm in
length, respectively, were compared (Konno, 1993). Both cells
were observed to settle vertically but at very different
rates—0.061 and 40 m h�1 correspondingly. The sedimenta-
tion efficiency of S. acus was very poor, attributed to poor
coagulation and the very slow cell settling rate relative to
other algae cells.
3.3.2. Dissolved air flotationDAF has become much more popular in terms of algae
removal over the last decade, taking advantage of the low
density of algae (Edzwald, 1993). Another advantage with
respect to flotation is that the aeration can assist in removing
volatile organics providing an improved taste in the treated
water (Schofield, 2001). This has relevance when considering
the reduction of taste and odour compounds which are
typically volatile organic substances. Furthermore, the floc-
culation time is significantly reduced from 14 to 30 min for
sedimentation to 5–8 min for flotation (Tables 4 and 5,
respectively).
Studies investigating algae of varying character, for exam-
ple, the spherical cyanobacteria M. aeruginosa and green
C. vulgaris and the bristled, barrel-shaped diatom Cyclotella,
showed that removal efficiencies were all in excess of 94%,
reaching maximum removal efficiencies of 99.8% (Edzwald
and Wingler, 1990; Vlaski et al., 1996). Overall, flotation
performs significantly better than sedimentation as removal
efficiency sees a 15–20% improvement in comparison (Fig. 5).
In contrast, one study found that sedimentation achieved
better removal of M. aeruginosa (98.9%) than flotation (94.5%)
(Vlaski et al., 1996), although different operating conditions
were applied. Specifically, a flocculation time of X30 min
compared to 8 min, ferric dose of 10 versus 5 mg l�1 and
cationic polymer dose of 1 versus 0.5 mg l�1 for the sedimen-
tation and flotation experiments, respectively (Tables 4 and 5).
The robustness of the process may be attributed to the ability
of DAF to float particles of 30mm or more (Edzwald and
Wingler, 1990; Edzwald, 1995; Han et al., 2001), such that if
flocculation has not been successful, flotation of resulting
small flocs and larger cells will take place.
A summary of DAF performance at several sites at Severn
Trent Water determined that good removal (80–98%) was
obtained at most sites fed with eutrophic water. On one
occasion only 54% removal was achieved at a site dominated
by Volvox, a flagellated colonial green which can exceed
1000mm, and the large filamentous diatom, Melosira (Mark-
ham et al., 1997). The poor performance was attributed to a
lack of pre-oxidation which may have been required to
immobilise Volvox. Furthermore, poor removal (37%) of the
filamentous cyanobacteria, Aphanizomenon and Anabaena, was
recorded prior to increasing the DAF recycle ratio from 3% to
7–10%, upon which an improvement to over 86% was
observed (Markham et al., 1997). One study investigating the
simultaneous removal of various species in reservoir water
observed that removal varied between 46% and 80% and was
very dependent on algal character (Fig. 6) (Kempeneers et al.,
2001), indicating that coagulation may not have been
successful. For example, the lowest removal efficiency (46%)
was observed for the motile Chlamydomonas, supporting the
theory that flagellated algae will escape flocs and swim

ARTICLE IN PRESS
Ta
ble
5–
Effi
cien
cyo
fa
lga
ere
mo
va
lb
yco
ag
ula
tio
n/fl
occ
ula
tio
na
nd
dis
solv
ed
air
flo
tati
on
(DA
F)
Alg
ae
So
urc
ew
ate
rA
lga
eab
un
da
nce
pH
Co
agu
lan
t/fl
occ
ula
nt
do
se(m
gl�
1)
Ra
pid
mix
(rp
m;
s)Flo
ccu
lati
on
(rp
m;
min
)Flo
tati
on
/Rr/
bu
bb
leco
nce
ntr
ati
on
(min
;%
;p
pm
)
Rem
ova
leffi
cien
cy(%
)
Refe
ren
ce
Ch
loro
ph
yta
Ch
lore
lla
vu
lgari
sR
ese
rvo
ir
wa
ter
1.1
–1.3�
10
5ce
lls
ml�
15.5
0.5
mg
l�1
as
Al
(PA
Cl)
400;
120
30;
510;
8;
4600
97–9
9E
dzw
ald
an
d
Win
gle
r(1
990)
Ch
lore
lla
vu
lgari
sR
ese
rvo
ir
wa
ter
1.1
–1.3�
10
5ce
lls
ml�
16.5
1.6
mg
l�1
as
Al
(Al 2
(SO
4) 3
)
400;
120
30;
510;
8;
4600
96.8
Ed
zwa
lda
nd
Win
gle
r(1
990)
Dia
tom
s
Cyc
lote
lla
sp.
Rese
rvo
ir
wa
ter
4.7
–5.3�
10
4ce
lls
ml�
15.5
0.5
–1m
gl�
1a
sA
l+
(PA
Cl)
400;
120
30;
510;
8;
4600
97–9
9E
dzw
ald
an
d
Win
gle
r(1
990)
Cyc
lote
lla
sp.
Rese
rvo
ir
wa
ter
4.7
–5.3�
10
4ce
lls
ml�
16.5
1.6
mg
l�1
as
Al
(Al 2
(SO
4) 3
)
400;
120
30;
510;
8;
4600
99.8
Ed
zwa
lda
nd
Win
gle
r(1
990)
Cy
an
op
hy
ta
Mic
rocy
stis
aer
ugi
nos
a
Rese
rvo
ir
wa
ter
1�
10
4ce
lls
ml�
1;
3–3
.5N
TU
85
mg
l�1
as
Fe;
0.5
mg
l�1
Su
perfl
oc
C-5
73
G:
10
3s�
1;
30
G¼
10
s�1;
8m
in
5;
7;
Pre
ssu
re:
600
kP
;94.5
Vla
ski
et
al.
(1996)
Fil
tra
tio
n:
10
mh�
1
Mix
ture
Mel
osir
aC
yclo
tell
a/
Ste
ph
an
odis
cus
Rese
rvo
ir
wa
ter
1.5�
10
57.7
41.3
0m
gl�
1a
sA
l(P
AC
l)S
tati
cm
ix3;4
7.2
9.5
;6;
80
Kem
pen
eers
et
al.
(2001)
Syn
edra
1.2�
10
6P
ress
ure¼
6b
ar;
76
Ast
erio
nel
la4.0�
10
4Lo
ad
ing
rate¼
15
mh�
1
58
Ch
lam
ydom
onas
3.4�
10
466
Sce
ned
esm
us
4.2�
10
446
2.6�
10
4ce
lls�
ml�
171
WAT E R R E S E A R C H 4 2 ( 2 0 0 8 ) 1 8 2 7 – 1 8 4 51838

ARTICLE IN PRESS
0
20
40
60
80
100
Melosira (D) Cyclotella / Stephanodiscus
(D)
Synedra (D) Asterionella (D) Chlamydomonas(G)
Scenedesmus (G)
% R
emov
al
Fig. 6 – 5% removal of algal species within a reservoir water using polyaluminium chloride and dissolved air flotation
(Kempeneers et al., 2001).
WA T E R R E S E A R C H 4 2 ( 2 0 0 8 ) 1 8 2 7 – 1 8 4 5 1839
through the clarification process. Synedra, a needle-shaped
diatom (Table 1), was removed by only 58%; however, these
cells have been previously reported to be very difficult to
coagulate, requiring cationic polymer to obtain efficient
incorporation into the floc (Jun et al., 2001) and are therefore
likely to be solitary. Individual Syendra cells are known to
settle vertically (Konno, 1993), such that a rising bubble may
collide only with the 5 mm wide tip of a cell, greatly decreasing
the likelihood of collision and explaining the low removal
rate. The low removal rate of Asterionella (66%) could also be
explained in this way, as in one dimension the cell width is
only 2–3mm (Table 1), despite a long cell length of 30–70mm.
The larger colonies (approximately 30–40mm by 15–25mm) of
diatoms Cyclotella/Stephanodiscus and green algae Scenedesmus
saw an increase in removal (76% and 71%, respectively), while
the largest species present, the filamentous diatom Melosira,
was removed by 80%. This indicates either that these species
had been more successfully coagulated or that the individual
colonies were already large enough to be floated.
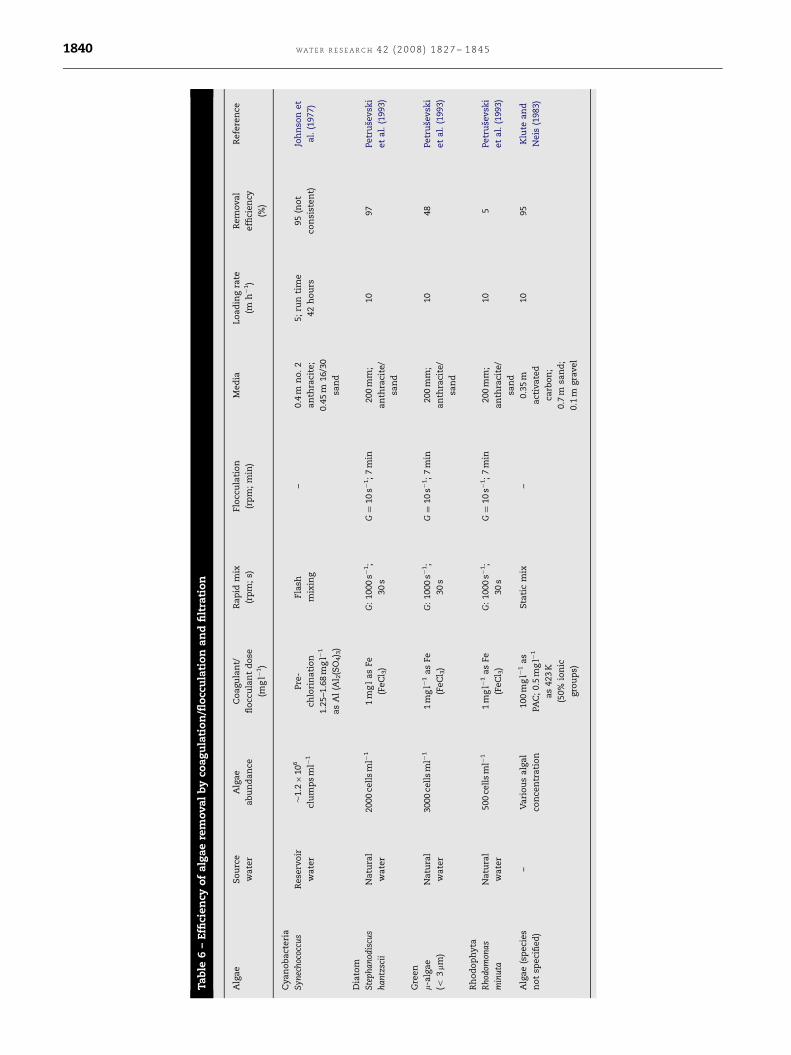
3.3.3. Direct filtrationFiltration can be applied as a polishing step after either
settlement or flotation or used directly as a clarification
process. Direct filtration appears to be the clarification
process most susceptible to variations in algal functionality
(Fig. 5) where one study demonstrated that small spherical
green micro-algae were only removed by 48% in a dual media
filter after dosing 1 mg l�1 as Fe, while Stephanodiscus hantzschii
were removed by 97% given their larger size and Rhodomonas
minuta were removed by only 5% on account of their flagella
(Table 6) (Petrusevski et al., 1993). Similarly, motile Crypoto-
monas and Rhodomonas could only be removed by 50%, even
after adding large doses of metal salts and metal-hydroxide
formations (Bernhardt and Clasen, 1991). It was further noted
that anionic flocculants did not aid removal. Filter penetra-
tion has also been observed whereby the proportion of a
population of microscopic cyanobacteria increased from
approximately 10–50% of the total algal population to
85–100% on settlement and filtration (Mouchet and Bonnelye,
1998), indicating that the filter preferentially removed other
species, while these smaller cells were allowed through the
filter.
A further difficulty is filter blockage by large algae species.
Blockages alter the removal mechanism from one of depth to
surface filtration, thus dramatically reducing run times. For
example, a cell population of 2700 cells ml�1 of the filamen-
tous diatom, Melosira, at Wahnbach Reservoir, Germany,
resulted in reduction of the filter run time from 30 to 8 h,
which was further reduced to 4 h as a result of a simultaneous
influx of smaller cyanobacteria Coelosphaerium naegelianum
that required the addition of a much greater flocculant dose
(Bernhardt, 1984). Similarly, as little as 250–1000 cells ml�1 of
the needle-like diatom, S. acus, blocked filters resulting in run
times decreasing from 35 to 3.5 h (Jun et al., 2001). Diatoms
alone are not responsible for the problem, as the presence of
flagellated colonial green algae, Volvox, which can exceed
1000mm, reduced run times from 24 to 11 h (Markham et al.,
1997).
The filterability of two green algal—the spherical Chlorella
and colonial Dictyosphaerium—was compared in one bench
scale study. Interestingly, while termination of filtration of the
former was always a result of penetration, it was a result of
blockage for the latter (Kunicane et al., 1986). Additionally, the
study determined that Chlorella was most likely to break-
through the filter whilst in the early growth phase as opposed
to its stationary phase and that as the culture age of
Dictyosphaerium increased, a decrease in filter run time was
observed from 33 to 3.5 min. It was observed that both cells
passed through the filter in the absence of coagulation/
flocculation; hence, the filter clogging effects were attributed
to the specific ferric-algae floc character.
However, successful algae removal using direct filtration
has been achieved. Algae were removed by 95% using an
activated carbon, sand and gravel rapid sand filter with a
filtration rate of 10 m h�1 (Table 6) (Klute and Neis, 1983).
However, in this study, the species of algae present in the
tested water were not identified and hence this high removal
efficiency may have been due to the absence of problematic
ARTICLE IN PRESS
Ta
ble
6–
Effi
cien
cyo
fa
lga
ere
mo
va
lb
yco
ag
ula
tio
n/fl
occ
ula
tio
na
nd
filt
rati
on
Alg
ae
So
urc
e
wa
ter
Alg
ae
ab
un
da
nce
Co
agu
lan
t/
flo
ccu
lan
td
ose
(mg
l�1)
Ra
pid
mix
(rp
m;
s)
Flo
ccu
lati
on
(rp
m;
min
)
Med
iaLo
ad
ing
rate
(mh�
1)
Rem
ova
l
effi
cien
cy
(%)
Refe
ren
ce
Cya
no
ba
cteri
a
Syn
ech
ococ
cus
Rese
rvo
ir
wa
ter
�1.2�
10
6
clu
mp
sm
l�1
Pre
-
chlo
rin
ati
on
1.2
5–1
.68
mg
l�1
as
Al
(Al 2
(SO
4) 3
)
Fla
sh
mix
ing
–0.4
mn
o.
2
an
thra
cite
;
0.4
5m
16/3
0
san
d
5;
run
tim
e
42
ho
urs
95
(no
t
con
sist
en
t)
Joh
nso
net
al.
(1977)
Dia
tom
Ste
phan
odis
cus
han
tzsc
ii
Na
tura
l
wa
ter
2000
cell
sm
l�1
1m
gl
as
Fe
(FeC
l 3)
G:
1000
s�1;
30
s
G¼
10
s�1;
7m
in200
mm
;
an
thra
cite
/
san
d
10
97
Petr
use
vsk
i
et
al.
(1993)
Gre
en
m-a
lga
e
(o3mm
)
Na
tura
l
wa
ter
3000
cell
sm
l�1
1m
gl�
1a
sFe
(FeC
l 3)
G:
1000
s�1;
30
s
G¼
10
s�1;
7m
in200
mm
;
an
thra
cite
/
san
d
10
48
Petr
use
vsk
i
et
al.
(1993)
Rh
od
op
hy
ta
Rh
odom
onas
min
uta
Na
tura
l
wa
ter
500
cell
sm
l�1
1m
gl�
1a
sFe
(FeC
l 3)
G:
1000
s�1;
30
s
G¼
10
s�1;
7m
in200
mm
;
an
thra
cite
/
san
d
10
5Petr
use
vsk
i
et
al.
(1993)
Alg
ae
(sp
eci
es
no
tsp
eci
fied
)
–V
ari
ou
sa
lga
l
con
cen
tra
tio
n
100
mg
l�1
as
PAC
;0.5
mg
l�1
as
423
K
(50%
ion
ic
gro
up
s)
Sta
tic
mix
–0.3
5m
act
iva
ted
carb
on
;
0.7
msa
nd
;
0.1
mgra
vel
10
95
Klu
tea
nd
Neis
(1983)
WAT E R R E S E A R C H 4 2 ( 2 0 0 8 ) 1 8 2 7 – 1 8 4 51840

ARTICLE IN PRESS
WA T E R R E S E A R C H 4 2 ( 2 0 0 8 ) 1 8 2 7 – 1 8 4 5 1841
species such as motile algae. Good rates of removal (approxi-
mately 95%) were achieved using filtration during a pilot
study conducted at Loch Leven. The filter media comprised
anthracite and sand with a filtration rate of 5 m h�1 (Table 6).
It was concluded that in order to maintain this rate of
removal a coagulant dose of up to 1.68 mg l�1 as Al was
required in addition to pre-chlorination. However, this gen-
erally resulted in the failure to achieve an acceptable
aluminium residual of less than 0.1 mg l�1 (Johnson et al.,
1977).
Many Thames Water sites treating algae employ two-stage
filtration and to predict process performance a ‘‘treatability
index’’ has been implemented. The index is a function of filter
loading rate and clarification coefficient such that a higher
index corresponds to a shorter run length and thus a lower
throughput (Ta and Woodward, 1998). The clarification
coefficient was obtained by measuring the first-order decay
of algae concentration through a filter. In general, the highest
clarification coefficients were associated with closely packed
colonial algae, such as Melosira, or large single-celled algae,
such as the green species, Closterium. The clarification
coefficient was found to be closely associated with shape
and size, such that for unknown algae estimations could be
deduced based on the square of the algae size. It was
emphasised that this index was only applicable for waters
that had not been coagulated.
4. Discussion
Key algal characteristics that have been reported to influence
the performance of a water treatment works include:
morphology, specifically size, shape and any additional
appendages; motility, either by gliding or flagellated species;
surface charge as measured by the zeta potential; cell density;
and EOM composition and concentration. It has been
demonstrated that these characteristics in general have no
relation to the phyla from which the species originates and as
such monitoring algae on the basis of parameters such as cell
count and chlorophyll a will give limited data with which to
optimise treatment processes. One exception to this is
density which was shown to increase in the order cyanobac-
teria (on account of their gas vacuoles)ogreen algaeodia-
toms (on account of their hard, silica-rich cell wall).
Taking each treatment process in turn, the specific algae
character that affects it can be summarised as follows:
ell-1
)
�
c pre-oxidation: no conclusive relationship with character;m2
�
y = 3367.58x0.882
1000
a (µ
coagulation/flocculation: morphology, motility, EOM, sur-
face charge;
R = 0.94re � A sedimentation: morphology, motility, density;ce
�
a flotation: morphology, motility;urf
�
100.01 0.1 1 10
Coagulant Dose (ng Al cell-1)
Cel
l S
Fig. 7 – The correlation between aluminium dose per cell
and cell surface area as calculated in Table 7.
filtration: morphology, motility.
Pre-oxidation studies have been inconclusive to date with
respect to why certain species respond well to oxidation while
others do not. However, it has been shown to have a large
impact on the character of the algae, in terms of morphology,
motility and EOM concentration, which has in turn a
significant effect on downstream processes, particularly
coagulation, for which these characteristics are critical. There
is a general consensus that the use of pre-oxidation
specifically for motile species is advised to impede locomo-
tion and facilitate downstream coagulation (Petrusevski et al.,
1996; Steynberg et al., 1996). Coagulation is affected by
changes in all the various algae characteristics and thus is
most susceptible to changes in influent algae species.
Furthermore, as downstream clarification processes are
vulnerable to algal character, specifically that of morphology
and motility, if coagulation fails the treatment chain may
breakdown. The most robust process is flotation, not only
because of the low density of algae cells (Edzwald and
Wingler, 1990), but for the reason that micro-bubbles are able
to float particles as small as 30mm (Han et al., 2001), providing
a buffer to small flocs and larger solitary cells if coagulation is
unsuccessful.
Overall, the key process to consider with respect to algae
removal is coagulation. References in the literature were
frequently made with respect to the importance of coagulant
dose and how this could alter as a result of the algal character
described, resulting in many studies investigating the opti-
mum dose for a variety of species. There was controversy
particularly over the importance of cell surface area with
respect to coagulant dose. This was highlighted in one
experiment where coagulant dose was measured in relation
to cell surface area as opposed to the more conventional cell
number (Clasen et al., 2000), as a result of a previous study
emphasising the importance of cell morphology (Bernhardt
and Clasen, 1991). However, Clasen et al. (2000) concluded
that there was not a relationship between cell surface area
and coagulant dose. In contrast, Ta and Woodward (1998)
have developed a ‘‘treatability index’’ that is based on
assessing influent algae according to size.
Further elucidation of the relationship between cell surface
area and optimum coagulant dose is shown in Fig. 7. For all
analogous studies, the average cell surface area was calcu-
lated based on the cell dimensions reported in the studies
(where possible) and on corresponding geometric shapes, a
technique used previously (Clasen et al., 2000) and compared
with the reported optimum coagulant doses (Table 7). Overall
a reasonable log–log relationship was observed between cell
surface area and coagulant dose (Fig. 7) whereby very low

ARTICLE IN PRESS
Table 7 – Calculation of approximate surface area for individual cells and associated the associated optimum coagulantdemand, where CB ¼ cyanobacteria; G ¼ green algae and D ¼ diatom
Species Photo Cell sizea Surfacearea
equation
Cell surfacearea (mm2)
Coagulantdemand
(ng Al cell�1)
Reference
Chlorella
(G)
3.5 mm diameter 4pr2 38 0.0118 Liu et al. (1999)
Microcystis
(CB)
5mm diameter 4pr2 78.5 0.0103 Drikas et al. (2001)
Chlorella
(G)
5.3 mm diameter 4pr2 88 0.0133 Edzwald and Wingler
(1990)
Cyclotella
(D)
6.1 mm diameter 4pr2 117 0.0320 Edzwald and Wingler
(1990)
Anabaena
(CB)
6–7 mm diameter 4pr2 133 0.0270 Jiang et al. (1993)
Asterionella
(D)
2mm width;
40 mm length
2pr2+2prh 257 0.0270 Jiang et al. (1993)
Melosira (D) 15–20 mm
diameter;
30–40 mm length
2pr2+2prh 2320 0.4750; 1.08 Mouchet and Bonnelye (1998);
Jun et al. (2001)
Pediastrumb
(G)
65–250 mm
diameter (disc)
2pr2/15 2598 0.4750 Mouchet and Bonnelye
(1998)
Synedrab
(G)
4.5–6mm width;
100–300 mm
length
2pr2+2prh 3068 1.08 Jun et al. (2001)
a Where possible cell dimensions referenced by the study were used to calculate the surface area, otherwise most likely dimensions were
estimated (John et al., 2002).b Photos provided by Dr. Susanne Feist-Burkhardt, D. Eileen Cox and Prof. Elliot Shubert of the Natural History Museum.
WAT E R R E S E A R C H 4 2 ( 2 0 0 8 ) 1 8 2 7 – 1 8 4 51842
coagulant doses per cell were required for correspondingly
low cell surface areas and vice versa. This demonstrates that
cell surface area can be used to predict an approximate
coagulant dose, although additional data points would allow a
more accurate relationship between surface area and coagu-
lant dose to be established. However, the actual demand
varies depending on other characteristics, primarily that of
EOM character. It is expected that differences in EOM
composition and concentration would impact on the coagu-
lant dose either by affecting the surface charge of the algae
(Bernhardt et al., 1985), complexing the metal coagulant
(Kaplan et al., 1988) or sterically interfering with coagulation
(Bernhardt et al., 1985; Bernhardt and Clasen, 1991). The
impact of EOM thus accounts for deviations from the log–log
correlation observed in Fig. 7. Hence, it should be emphasised
that while surface area dominates the coagulant dose, EOM
interference is observable.
Overall, cell surface area provides a relatively simple basis
for reassessing algae such that the classification is informa-
tive with respect to water treatment. This proposition is
corroborated by the success of the treatability index already
established at Thames Water, where algae are classified
according to the square of the algae size (roughly approx-
imate to the area!) in order to estimate their filterability (Ta
and Woodward, 1998). Cell size and surface area can therefore
be used to estimate firstly the coagulant dose required to

ARTICLE IN PRESS
WA T E R R E S E A R C H 4 2 ( 2 0 0 8 ) 1 8 2 7 – 1 8 4 5 1843
ensure optimum removal, and secondly, the filter treatment
capability in the absence of coagulation, although it is
emphasised that filtration in the absence of 623 coagulation
is not advised.
It is of note that only the relationship between optimum
dose of aluminium sulphate at approximately pH 7 with no
pre-oxidation and that of surface area has been examined, as
there was insufficient data to compare with alternative
coagulants or with pre-oxidised algae systems. Further work
is required to determine how the coagulant dose–surface area
relationship would differ under these varying conditions. The
role of surface area in creating a coagulant demand is also
worthy of further investigation. For example, is charge
density evenly distributed across the surface of algae cells
such that as surface area increases a stoichiometric dose of
coagulant is required to neutralise these point charges?
Furthermore, if this were the case, is charge density a more
appropriate method of establishing coagulant demand as
opposed to surface area, given that charge density measure-
ment of an algae system would also take into account the
charge of associated charged EOM? Certainly, a reduction in
the magnitude of the surface charge measured using the zeta
potential was shown to be critical when achieving the
minimum algae residual (Fig. 3). Further work is therefore
required to assess precisely how coagulant demand can be
predicted. This would also involve a closer examination of the
parameters of EOM that impact on coagulation. Our under-
standing of the role of EOM in coagulation lags behind that of
other organic-based systems. For example, tools have been
developed to understand the coagulation mechanism and
predict treatability for NOM (Sharp et al., 2006). Application of
similar methods to improve knowledge of algae systems may
help explain algae coagulation and thus reduce the knowl-
edge gap.
5. Conclusions
The key algal characteristics that impact on treatment
processes are morphology, motility, surface charge, cell
density and the EOM composition and concentration. With
the exception of density, these are not phyla specific. The
optimisation of coagulation has been identified as a key step
for algae removal; however, this process is susceptible to
changes in almost all the aforementioned algae character-
istics. Furthermore, if coagulation is unsuccessful then
downstream clarification in turn becomes vulnerable to algae
character, particularly morphology and motility. DAF is the
most robust clarification process in this regard. Overall, if pre-
treatment and the DAF process are optimised, algae can be
successfully managed and cell removal of 96–99.8% or more is
achievable.
Surface area has been identified as a useful preliminary
indicator of coagulant dose required for optimum cell
removal. This would therefore provide a relatively simple
basis for regrouping algae such that the classification is
informative with respect to water treatment. The character of
the EOM will further alter the coagulant demand but to a
lesser extent. Additionally, the link between surface area and
coagulant dose would only hold when the concentration of
mineral turbidity and NOM, especially humic substances,
were low.
Further work is required to assess the influence of varying
coagulation conditions on the correlation of surface area and
coagulant demand, in addition to assessing the importance of
charge density. Importantly, the influence of EOM character
on coagulation mechanism requires addressing. Currently,
there is a lack of understanding of the impact of EOM on
coagulation in comparison to other organic systems such
as NOM.
Acknowledgements
The authors would like to thank the EPSRC, Thames Water,
Anglian Water, Yorkshire Water and Northumbrian Water for
their financial support.
R E F E R E N C E S
Ando, A., Miwa, M., Kajino, M., Tatsumi, S., 1992. Removal ofmusty-odorous compounds in water and retained in algal cellsthrough water purification processes. Water Sci. Technol. 25(2), 299–306.
Beckett, R., Le, N.P., 1990. The role of organic matter and ioniccomposition in determining the surface charge of suspendedparticles in natural waters. Colloids Surf. 44, 35–49.
Bellinger, E.G., 1992. A Key to Common Algae: Freshwater,Estuarine and Some Coastal Species. The Institution of Waterand Environmental Management, London.
Bernhardt, H., 1984. Treatment disturbances with water out ofeutrophic reservoirs as a consequence of extensive algaldevelopment. Water Supply 2 SS4-7–SS4-15.
Bernhardt, H., Hoyer, O., Schell, H., Lusse, B., 1985. Reactionmechanisms involved in the influence of algogenic matter onflocculation. Z. Wasser Abwasser Forsch. 18 (1), 18–30.
Bernhardt, H., Clasen, J., 1991. Flocculation of micro-organisms.J. Water Supply Res. Technol.-AQUA 40 (2), 76–87.
Bernhardt, H., Clasen, J., 1994. Investigations into the flocculationmechanisms of small algal cells. J. Water Supply Res. Technol.-AQUA 43 (5), 222–232.
Black, A.P., Chen, C., 1967. Electrokinetic behaviour of aluminiumspecies in dilute dispersed kaolinite systems. J. Am. WaterWorks Assoc. 59 (9), 1173–1183.
Burlingame, G.A., Muldowney, J.J., Maddrey, R.E., 1992. Cucumberflavour in Philadelphia’s drinking water. J. Am. Water WorksAssoc. 53, 438–452.
Chen, Y.M., Liu, J.C., Ju, Y., 1998. Flotation removal of algae fromwater. Colloids Surf. B: Biointerfaces 12, 49–55.
Clasen, J., Mischke, U., Drikas, M., Chow, C., 2000. An improvedmethod for detecting electrophoretic mobility of algae duringthe destabilisation process of flocculation: flocculant demandof different species and the impact of DOC. Aqua-J. WaterServices Res. Technol. 49 (2), 89–101.
Cox, E.J., 1996. Identification of Freshwater Diatoms from LiveMaterial. Chapman & Hall, London.
Divakaran, R., Pillai, V.N.S., 2002. Flocculation of algae usingchitosan. J. Appl. Phycol. 14, 419–422.
Drikas, M., Chow, C.W.K., House, J., Burch, M.D., 2001. Usingcoagulation, flocculation and settling to remove toxic cyano-bacteria. J. Am. Water Works Assoc. 93 (2), 100–111.
Edzwald, J.K., 1993. Algae, bubbles, coagulants, and dissolved airflotation. Water Sci. Technol. 27 (10), 67–81.
Edzwald, J.K., 1995. Principles and applications of dissolved airflotation. Water Sci. Technol. 31 (3–4), 1–23.
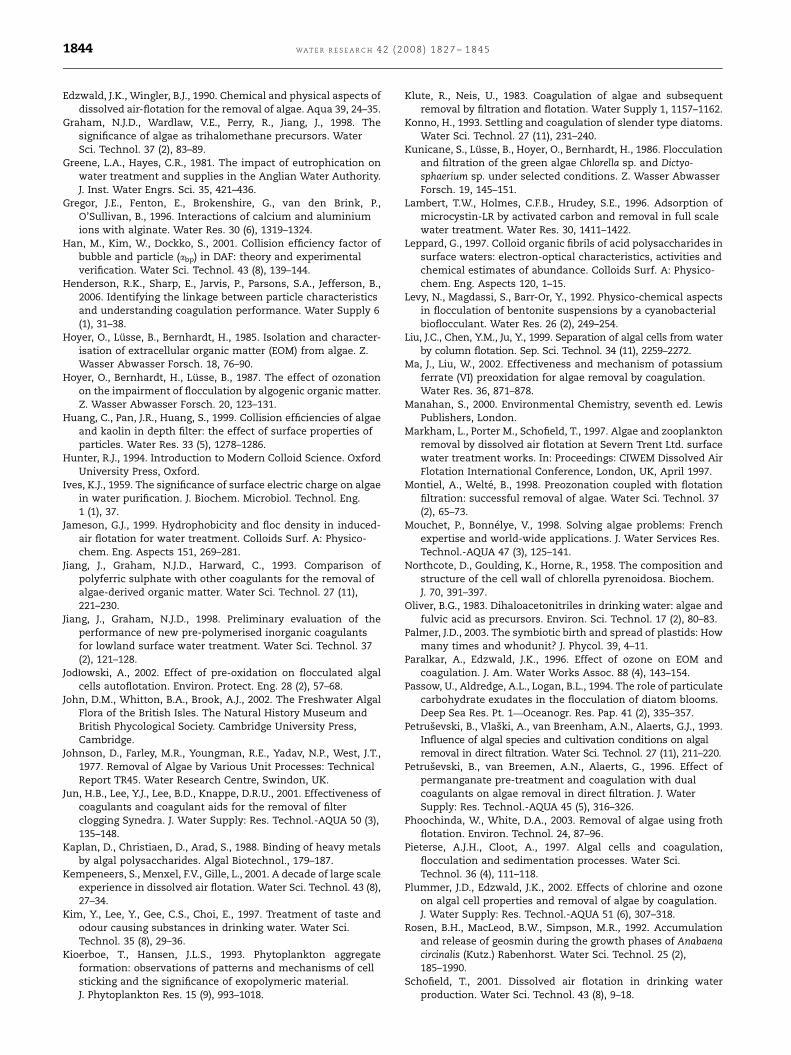
ARTICLE IN PRESS
WAT E R R E S E A R C H 4 2 ( 2 0 0 8 ) 1 8 2 7 – 1 8 4 51844
Edzwald, J.K., Wingler, B.J., 1990. Chemical and physical aspects ofdissolved air-flotation for the removal of algae. Aqua 39, 24–35.
Graham, N.J.D., Wardlaw, V.E., Perry, R., Jiang, J., 1998. Thesignificance of algae as trihalomethane precursors. WaterSci. Technol. 37 (2), 83–89.
Greene, L.A., Hayes, C.R., 1981. The impact of eutrophication onwater treatment and supplies in the Anglian Water Authority.J. Inst. Water Engrs. Sci. 35, 421–436.
Gregor, J.E., Fenton, E., Brokenshire, G., van den Brink, P.,O’Sullivan, B., 1996. Interactions of calcium and aluminiumions with alginate. Water Res. 30 (6), 1319–1324.
Han, M., Kim, W., Dockko, S., 2001. Collision efficiency factor ofbubble and particle (abp) in DAF: theory and experimentalverification. Water Sci. Technol. 43 (8), 139–144.
Henderson, R.K., Sharp, E., Jarvis, P., Parsons, S.A., Jefferson, B.,2006. Identifying the linkage between particle characteristicsand understanding coagulation performance. Water Supply 6(1), 31–38.
Hoyer, O., Lusse, B., Bernhardt, H., 1985. Isolation and character-isation of extracellular organic matter (EOM) from algae. Z.Wasser Abwasser Forsch. 18, 76–90.
Hoyer, O., Bernhardt, H., Lusse, B., 1987. The effect of ozonationon the impairment of flocculation by algogenic organic matter.Z. Wasser Abwasser Forsch. 20, 123–131.
Huang, C., Pan, J.R., Huang, S., 1999. Collision efficiencies of algaeand kaolin in depth filter: the effect of surface properties ofparticles. Water Res. 33 (5), 1278–1286.
Hunter, R.J., 1994. Introduction to Modern Colloid Science. OxfordUniversity Press, Oxford.
Ives, K.J., 1959. The significance of surface electric charge on algaein water purification. J. Biochem. Microbiol. Technol. Eng.1 (1), 37.
Jameson, G.J., 1999. Hydrophobicity and floc density in induced-air flotation for water treatment. Colloids Surf. A: Physico-chem. Eng. Aspects 151, 269–281.
Jiang, J., Graham, N.J.D., Harward, C., 1993. Comparison ofpolyferric sulphate with other coagulants for the removal ofalgae-derived organic matter. Water Sci. Technol. 27 (11),221–230.
Jiang, J., Graham, N.J.D., 1998. Preliminary evaluation of theperformance of new pre-polymerised inorganic coagulantsfor lowland surface water treatment. Water Sci. Technol. 37(2), 121–128.
Jod"owski, A., 2002. Effect of pre-oxidation on flocculated algalcells autoflotation. Environ. Protect. Eng. 28 (2), 57–68.
John, D.M., Whitton, B.A., Brook, A.J., 2002. The Freshwater AlgalFlora of the British Isles. The Natural History Museum andBritish Phycological Society. Cambridge University Press,Cambridge.
Johnson, D., Farley, M.R., Youngman, R.E., Yadav, N.P., West, J.T.,1977. Removal of Algae by Various Unit Processes: TechnicalReport TR45. Water Research Centre, Swindon, UK.
Jun, H.B., Lee, Y.J., Lee, B.D., Knappe, D.R.U., 2001. Effectiveness ofcoagulants and coagulant aids for the removal of filterclogging Synedra. J. Water Supply: Res. Technol.-AQUA 50 (3),135–148.
Kaplan, D., Christiaen, D., Arad, S., 1988. Binding of heavy metalsby algal polysaccharides. Algal Biotechnol., 179–187.
Kempeneers, S., Menxel, F.V., Gille, L., 2001. A decade of large scaleexperience in dissolved air flotation. Water Sci. Technol. 43 (8),27–34.
Kim, Y., Lee, Y., Gee, C.S., Choi, E., 1997. Treatment of taste andodour causing substances in drinking water. Water Sci.Technol. 35 (8), 29–36.
Kioerboe, T., Hansen, J.L.S., 1993. Phytoplankton aggregateformation: observations of patterns and mechanisms of cellsticking and the significance of exopolymeric material.J. Phytoplankton Res. 15 (9), 993–1018.
Klute, R., Neis, U., 1983. Coagulation of algae and subsequentremoval by filtration and flotation. Water Supply 1, 1157–1162.
Konno, H., 1993. Settling and coagulation of slender type diatoms.Water Sci. Technol. 27 (11), 231–240.
Kunicane, S., Lusse, B., Hoyer, O., Bernhardt, H., 1986. Flocculationand filtration of the green algae Chlorella sp. and Dictyo-sphaerium sp. under selected conditions. Z. Wasser AbwasserForsch. 19, 145–151.
Lambert, T.W., Holmes, C.F.B., Hrudey, S.E., 1996. Adsorption ofmicrocystin-LR by activated carbon and removal in full scalewater treatment. Water Res. 30, 1411–1422.
Leppard, G., 1997. Colloid organic fibrils of acid polysaccharides insurface waters: electron-optical characteristics, activities andchemical estimates of abundance. Colloids Surf. A: Physico-chem. Eng. Aspects 120, 1–15.
Levy, N., Magdassi, S., Barr-Or, Y., 1992. Physico-chemical aspectsin flocculation of bentonite suspensions by a cyanobacterialbioflocculant. Water Res. 26 (2), 249–254.
Liu, J.C., Chen, Y.M., Ju, Y., 1999. Separation of algal cells from waterby column flotation. Sep. Sci. Technol. 34 (11), 2259–2272.
Ma, J., Liu, W., 2002. Effectiveness and mechanism of potassiumferrate (VI) preoxidation for algae removal by coagulation.Water Res. 36, 871–878.
Manahan, S., 2000. Environmental Chemistry, seventh ed. LewisPublishers, London.
Markham, L., Porter M., Schofield, T., 1997. Algae and zooplanktonremoval by dissolved air flotation at Severn Trent Ltd. surfacewater treatment works. In: Proceedings: CIWEM Dissolved AirFlotation International Conference, London, UK, April 1997.
Montiel, A., Welte, B., 1998. Preozonation coupled with flotationfiltration: successful removal of algae. Water Sci. Technol. 37(2), 65–73.
Mouchet, P., Bonnelye, V., 1998. Solving algae problems: Frenchexpertise and world-wide applications. J. Water Services Res.Technol.-AQUA 47 (3), 125–141.
Northcote, D., Goulding, K., Horne, R., 1958. The composition andstructure of the cell wall of chlorella pyrenoidosa. Biochem.J. 70, 391–397.
Oliver, B.G., 1983. Dihaloacetonitriles in drinking water: algae andfulvic acid as precursors. Environ. Sci. Technol. 17 (2), 80–83.
Palmer, J.D., 2003. The symbiotic birth and spread of plastids: Howmany times and whodunit? J. Phycol. 39, 4–11.
Paralkar, A., Edzwald, J.K., 1996. Effect of ozone on EOM andcoagulation. J. Am. Water Works Assoc. 88 (4), 143–154.
Passow, U., Aldredge, A.L., Logan, B.L., 1994. The role of particulatecarbohydrate exudates in the flocculation of diatom blooms.Deep Sea Res. Pt. 1—Oceanogr. Res. Pap. 41 (2), 335–357.
Petrusevski, B., Vlaski, A., van Breenham, A.N., Alaerts, G.J., 1993.Influence of algal species and cultivation conditions on algalremoval in direct filtration. Water Sci. Technol. 27 (11), 211–220.
Petrusevski, B., van Breemen, A.N., Alaerts, G., 1996. Effect ofpermanganate pre-treatment and coagulation with dualcoagulants on algae removal in direct filtration. J. WaterSupply: Res. Technol.-AQUA 45 (5), 316–326.
Phoochinda, W., White, D.A., 2003. Removal of algae using frothflotation. Environ. Technol. 24, 87–96.
Pieterse, A.J.H., Cloot, A., 1997. Algal cells and coagulation,flocculation and sedimentation processes. Water Sci.Technol. 36 (4), 111–118.
Plummer, J.D., Edzwald, J.K., 2002. Effects of chlorine and ozoneon algal cell properties and removal of algae by coagulation.J. Water Supply: Res. Technol.-AQUA 51 (6), 307–318.
Rosen, B.H., MacLeod, B.W., Simpson, M.R., 1992. Accumulationand release of geosmin during the growth phases of Anabaenacircinalis (Kutz.) Rabenhorst. Water Sci. Technol. 25 (2),185–1990.
Schofield, T., 2001. Dissolved air flotation in drinking waterproduction. Water Sci. Technol. 43 (8), 9–18.

ARTICLE IN PRESS
WA T E R R E S E A R C H 4 2 ( 2 0 0 8 ) 1 8 2 7 – 1 8 4 5 1845
Sharp, E.L., Parsons, S.A., Jefferson, B., 2006. Coagulation of NOM:linking character to treatment. Water Sci. Technol. 53 (7), 67–76.
Steynberg, M.C., Pieterse, A.J.H., Geldenhuys, J.C., 1996. Improvedcoagulation and filtration as a result of morphological andbehavioural changes due to pre-oxidation. J. Water Supply:Res. Technol.-AQUA 45 (6), 292–298.
Stumm, W., Morgan, J.J., 1996. Aquatic Chemistry, third ed. Wiley,New York, USA, (551pp.).
Sukenik, A., Teltch, B., Wachs, A.W., Shelef, G., Nirl, G., Levanon,D., 1987. Effect of oxidants on microalgae flocculation. WaterRes. 21 (5), 533–539.
Ta, C.T., Woodward, C.A., 1998. A treatability index for reservoirwater. Water Sci. Technol. 37 (2), 27–33.
Ulberg, Z.R., Marochko, L.G., 1999. The electrophoretic propertiesand stability of cell suspensions. Colloids Surf. A: Physico-chem. Eng. Aspects 159, 513–518.
Vlaski, A., van Breemen, A.N., Alaerts, G.J., 1996. Optimisation ofcoagulation conditions for the removal of cyanobacteria bydissolved air flotation or sedimentation. J. Water Supply Res.Technol.-AQUA 45 (5), 253–261.
Vlaski, A., van Breemen, A.N., Alaerts, G.J., 1997. The role ofparticle size and density in dissolved air flotation andsedimentation. Water Sci. Technol. 36 (4), 177–189.
Wachter, J.K., Andelman, J.B., 1984. Organohalide formation onchlorination of algal extracellular products. Environ. Sci.Technol. 18 (11), 811–817.
WHO, 1998. Guidelines for Drinking Water Quality: Addendum toVolume 1—Recomendations. World Health Organisation,Geneva.
WHO, 2004. Algae and cyanobacteria in freshwater. In: Guidelinesfor Safe Recreational Waters Volume 1—Coastal and FreshWater. World Health Organisation, Geneva.