The Human Voice in Speech and Singing | SpringerLink
44
669 The Human Vo 16. The Human Voice in Speech and Singing This chapter describes various aspects of the human voice as a means of communication in speech and singing. From the point of view of function, vocal sounds can be regarded as the end result of a three stage process: (1) the compression of air in the respiratory system, which produces an exhalatory airstream, (2) the vibrating vocal folds’ transformation of this air stream to an intermittent or pulsating air stream, which is a complex tone, referred to as the voice source, and (3) the filtering of this complex tone in the vocal tract resonator. The main function of the respiratory system is to generate an overpressure of air under the glottis, or a subglottal pressure. Section 16.1 describes different aspects of the respiratory system of significance to speech and singing, including lung volume ranges, subglottal pressures, and how this pressure is affected by the ever-varying recoil forces. The complex tone generated when the air stream from the lungs passes the vibrating vocal folds can be varied in at least three dimensions: fundamental frequency, amplitude and spectrum. Section 16.2 describes how these properties of the voice source are affected by the subglottal pressure, the length and stiffness of the vocal folds and how firmly the vocal folds are adducted. Section 16.3 gives an account of the vocal tract filter, how its form determines the frequencies of its resonances, and Sect. 16.4 gives an account for how these resonance frequencies 16.1 Breathing ........................................... 669 16.2 The Glottal Sound Source ..................... 676 16.3 The Vocal Tract Filter ............................ 682 16.4 Articulatory Processes, Vowels and Consonants ........................ 687 16.5 The Syllable ........................................ 695 16.6 Rhythm and Timing ............................. 699 16.7 Prosody and Speech Dynamics .............. 701 16.8 Control of Sound in Speech and Singing 703 16.9 The Expressive Power of the Human Voice 706 References .................................................. 706 or formants shape the vocal sounds by imposing spectrum peaks separated by spectrum valleys, and how the frequencies of these peaks determine vowel and voice qualities. The remaining sections of the chapter describe various aspects of the acoustic signals used for vocal communication in speech and singing. The syllable structure is discussed in Sect. 16.5, the closely related aspects of rhythmicity and timing in speech and singing is described in Sect. 16.6, and pitch and rhythm aspects in Sect. 16.7. The impressive control of all these acoustic characteristics of vocal signals is discussed in Sect. 16.8, while Sect. 16.9 considers expressive aspects of vocal communication. 16.1 Breathing The process of breathing depends both on mechanical and muscular forces (Fig. 16.1). During inspiration the volume of the chest cavity is expanded and air rushes into the lungs. This happens mainly because of the contraction of the external in- tercostals and the diaphragm. The external intercostal muscles raise the ribs. The diaphragm which is the dome-shaped muscle located below the lungs, flattens on contraction and thus lowers the floor of the thoracic cavity. The respiratory structures form an elastic mechan- ical system that produces expiratory or inspiratory subglottal pressures, depending on the size of the lung volume, Fig. 16.2. Thus, exhalation and inhalation will always produce forces whose effect is to move the ribs and the lungs back to their resting state, often referred Part E 16
-
Upload
khangminh22 -
Category
Documents
-
view
1 -
download
0
Transcript of The Human Voice in Speech and Singing | SpringerLink

669
The Human Vo16. The Human Voice in Speech and Singing
This chapter describes various aspects of thehuman voice as a means of communication inspeech and singing. From the point of view offunction, vocal sounds can be regarded as the endresult of a three stage process: (1) the compressionof air in the respiratory system, which producesan exhalatory airstream, (2) the vibrating vocalfolds’ transformation of this air stream to anintermittent or pulsating air stream, which isa complex tone, referred to as the voice source,and (3) the filtering of this complex tone in thevocal tract resonator. The main function of therespiratory system is to generate an overpressureof air under the glottis, or a subglottal pressure.Section 16.1 describes different aspects of therespiratory system of significance to speech andsinging, including lung volume ranges, subglottalpressures, and how this pressure is affected bythe ever-varying recoil forces. The complex tonegenerated when the air stream from the lungspasses the vibrating vocal folds can be varied in atleast three dimensions: fundamental frequency,amplitude and spectrum. Section 16.2 describeshow these properties of the voice source areaffected by the subglottal pressure, the length andstiffness of the vocal folds and how firmly the vocalfolds are adducted. Section 16.3 gives an account ofthe vocal tract filter, how its form determines thefrequencies of its resonances, and Sect. 16.4 givesan account for how these resonance frequencies
16.1 Breathing ........................................... 669
16.2 The Glottal Sound Source ..................... 676
16.3 The Vocal Tract Filter ............................ 682
16.4 Articulatory Processes,Vowels and Consonants ........................ 687
16.5 The Syllable ........................................ 695
16.6 Rhythm and Timing ............................. 699
16.7 Prosody and Speech Dynamics .............. 701
16.8 Control of Sound in Speech and Singing 703
16.9 The Expressive Power of the Human Voice 706
References .................................................. 706
or formants shape the vocal sounds by imposingspectrum peaks separated by spectrum valleys,and how the frequencies of these peaks determinevowel and voice qualities. The remaining sectionsof the chapter describe various aspects of theacoustic signals used for vocal communicationin speech and singing. The syllable structure isdiscussed in Sect. 16.5, the closely related aspectsof rhythmicity and timing in speech and singingis described in Sect. 16.6, and pitch and rhythmaspects in Sect. 16.7. The impressive control of allthese acoustic characteristics of vocal signals isdiscussed in Sect. 16.8, while Sect. 16.9 considersexpressive aspects of vocal communication.
16.1 Breathing
The process of breathing depends both on mechanicaland muscular forces (Fig. 16.1).
During inspiration the volume of the chest cavity isexpanded and air rushes into the lungs. This happensmainly because of the contraction of the external in-tercostals and the diaphragm. The external intercostalmuscles raise the ribs. The diaphragm which is thedome-shaped muscle located below the lungs, flattens
on contraction and thus lowers the floor of the thoraciccavity.
The respiratory structures form an elastic mechan-ical system that produces expiratory or inspiratorysubglottal pressures, depending on the size of the lungvolume, Fig. 16.2. Thus, exhalation and inhalation willalways produce forces whose effect is to move the ribsand the lungs back to their resting state, often referred
PartE
16

670 Part E Music, Speech, Electroacoustics
Trachea
Abdominal wall
Internalintercostals
Externalintercostals
DiaphragmGravitation
Chest wallRightLung
LeftLung
Heart
Pleura
Internalintercostals
Externalintercostals
Diaphragm
Fig. 16.1 Directions of the muscular and elastic forces. Thedirection of the gravitation force is applicable to the uprightposition
to as the resting expiratory level (REL). The deeperthe breath, the greater this force of elastic recoil. Thiscomponent plays a significant part in pushing air outof the lungs, both in speech and singing, and especiallyat large lung volumes. The elasticity forces originateboth from the rib cage and the lungs. As illustratedin Fig. 16.2, the rib cage produces an exhalatory forceat high lung volumes and an inhalatory force at lowlung volumes, and the lungs always exert an exhala-tory force. As a consequence, activation of inspiratorymuscles is needed for producing a low subglottal pres-sure, e.g. for singing a soft (pianissimo) tone, at highlung volume. Conversely, activation of expiratory mus-cles is needed for producing a high subglottal pressure,e.g. for singing a loud (fortissimo) tone, at low lungvolume.
In addition to mechanical factors, exhaling may in-volve the activity of the internal intercostals and theabdominal muscles. Contraction of the former has theeffect of lowering the ribs and thus compressing thechest cavity. Activating the abdominal muscles gener-ates upward forces that also contribute towards reducingthe volume of the rib cage and the lungs. The functionof these muscles is thus expiratory.
Fig. 16.2 Subglottal pressures produced at different lungvolumes in a subject by the recoil forces of rib cage andlungs. The resting expiratory level (REL) is the lung volumeat which the inhalatory and the exhalatory recoil forcesare equal. The thin and heavy chain-dashed lines representsubglottal pressures typically needed for soft and very loudphonation
100
50
0
%
Residual volume
TLCVCREL
ERVFRC
IRV
Fig. 16.3 Definition of the various terms for lung volumes.The graph illustrates the lung volume changes during quietbreathing interrupted by a maximal inhalation followed bya maximal exhalation. VC is the vital capacity, TLC is thetotal lung capacity, IRV and ERV are the inspiratory andexpiratory reserve volume, REL is the resting expiratorylevel, FRC is the functional residual capacity
Another significant factor is gravity whose roledepends on body posture. In an upright position, the di-aphragm and adjacent structures tend to be pulled down,increasing the volume of the thoracic cavity. In this sit-
Lung volume (% of vital capacity)
Subglottal pressure (cm H2O)–30
100
–20 –10 0 10 20 30
90
80
70
60
50
40
30
20
10
0
Subglottal pressureneeded to sing ffpp
Rib cage
Lungs
Sum
REL
PartE
16.1

The Human Voice in Speech and Singing 16.1 Breathing 671
uation, the effect of gravity is inspiratory. In contrast, inthe supine position the diaphragm tends to get pushedup into the rib cage, and expiration is promoted [16.1].
The total air volume that is contained in a maxi-mally expanded rib cage is called the total lung capacity(TLC in Fig. 16.3). After maximum exhalation a smallair volume, the residual volume, is still left in the air-ways. The greatest air volume that can be exhaled aftera maximum inhalation is called the vital capacity (VC)and thus equals the difference between the TLC and theresidual volume. The lung volume at which the exha-latory and inhalatory recoil forces are equal, or REL,is reached after a relaxed sigh, see Figs. 16.2 and 16.3.During tidal breathing inhalation is initiated from REL,so that inhalation is active resulting from an activationof inspiratory muscles, and exhalation is passive, pro-duced by the recoil forces. In tidal breathing only some10% of VC is inhaled, such that a great portion of theVC, the inspiratory reserve volume, is left. The air vol-ume between REL and the residual volume is called theexpiratory reserve volume.
VC varies depending on age, body height and gender.At the age of about 20 years, an adult female has a vitalcapacity of 3–3.6 l depending on body height, and formales the corresponding values are about 4–5.5 l.
Experimental data [16.4] show that, during tidalbreathing, lung volume variations are characterized by
Lung volume
Rest
Reading
Unscripted speech
Counting loud
Fig. 16.4 Examples of speech breathing
Mean lung volume
60
50
40
30
20
10
REL
–10
–20
–30
Sopranos Mezzo-soprano
Baritones
Untrainedfemales’unscriptedspeeech
Singers’initiation LV
Singers’termination LV
Fig. 16.5 Lung volume averages used in speech andoperatic singing expressed as percentages of vital ca-pacity relative to the resting expiratory level REL. Theshaded band represents the mean lung volume rangeobserved in untrained female voices’ unscripted speech(after [16.2]). The filled and open symbols show the cor-responding measures for professional opera singers of theindicated classifications when performing opera arias ac-cording to Thomasson [16.3]. The bars represent ± oneSD
a regular quasi-sinusoidal pattern with alternating seg-ments of inspiration and expiration of roughly equalduration (Fig. 16.4). In speech and singing, the pat-tern is transformed. Inspirations become more rapidand expiration occurs at a slow and relatively steadyrate. Increasing vocal loudness raises the amplitude ofthe lung volume records but leaves its shape relativelyunchanged.
Figure 16.5 shows mean lung volumes used by pro-fessional singers when singing well-rehearsed songs.The darker band represents the mean lung volume rangeobserved in spontaneous speech [16.2]. The lung vol-umes of conversational speech are similar to those intidal breathing. Loud speech shows greater air con-sumption and thus higher volumes (Fig. 16.4). Breathgroups in speech typically last for 3–5 seconds andare terminated when lung volumes approach the relax-ation expiratory level REL, as illustrated in Fig. 16.5.Thus, in phonation, lung volumes below REL are mostlyavoided.
PartE
16.1

672 Part E Music, Speech, Electroacoustics
Fig. 16.6 The records show lung volume (relative to themid-respiratory level), subglottal (esophageal) pressureand stylized muscular activity for speaker counting fromone to 32 at a conversational vocal effort. (After Draperet al. [16.5]) . To the left of the vertical line recoil forces arestrongly expiratory, to the right they are inspiratory. Arrowshave been added to the x-axis to summarize the originalEMG measurements which indicate that the recoil forcesare balanced by muscular activity (EMG = electromyogra-phy, measurement of the electrical activity of muscles). Tothe left of the vertical line (as indicating by left-pointingarrow) the net muscular force is inspiratory, to the right itis expiratory (right-pointing arrow). To keep loudness con-stant the talker maintains a stable subglottal pressure andrecruits muscles according to the current value of the lungvolume. This behavior exemplifies the phenomenon knownas motor equivalence
In singing, breath groups tend to be about twice aslong or more, and air consumption is typically muchgreater than in conversational speech. Mostly they areterminated close to the relaxation expiratory level, as inspeech, but sometimes extend into the expiratory reservevolume as illustrated in Fig. 16.5. This implies that, insinging, breath groups typically start at much higher lungvolumes than in speech. This use of high lung volumesimplies that singers have to deal with much greater recoilforces than in speech.
Figure 16.6 replots, in stylized form, a diagrampublished by Ladefoged et al. [16.7]. It summarizesmeasurements of lung volume and subglottal pressure,henceforth referred to as Ps, recorded from a speakerasked to take a deep breath and then to start counting.The dashed line intersecting the Ps record represents therelaxation pressure. This line tells us that elastic recoilforces are strongly expiratory to the left of the verti-cal line. To the right they produce a pressure lower thanthe target pressure and eventually an inspiratory pres-sure. The Ps curve remains reasonably flat throughoutthe entire utterance.
The question arises: how can this relative constancybe achieved despite the continually changing contribu-tion of the relaxation forces? In a recent replicationof this classical work [16.8], various criticisms of theoriginal study are addressed but basically the originalanswer to this question is restated: the motor systemadapts to the external goal of keeping the Ps fairlyconstant (Fig. 16.6). Initially, when recoil forces arestrong, muscle activity is predominantly in the inspi-ratory muscles such as the diaphragm and the externalintercostals. Gradually, as recoil forces decline, the ex-
1.0
0
–1.0
–2.0
0
Pressure
Litres
0
0
(+) ExpiratoryInspiratory (–)
Speech
Lung volume
Subglottal pressure
1000
Pressure (cm H2O)
Air flow (ml/s)
500
0
10
5
0
Subglottal pressure
f o n ε t k æ s p ε k s
1s
Oralpressure
Fig. 16.7 Example of oral and subglottal pressure variationsfor the phrase “phonetic aspects” (after Netsell [16.6]). Asthe glottis opens and closes for voiceless and voiced soundsand the vocal tract opens or closes for vowels and conso-nants, the expired air is opposed by varying degrees ofglottal and supraglottal impedance. Both the oral and thesubglottal pressure records reflect the combined effect ofthese resistance variations
PartE
16.1

The Human Voice in Speech and Singing 16.1 Breathing 673
piratory muscles (the internal intercostals, the rectusabdominis among others) take over increasingly as theother group relaxes (cf. arrows, Fig. 16.6). Accordingto our present understanding [16.8, 9], this adapta-tion of breathing for speech is achieved by constantlyupdating the balance between agonist and antagonistmuscles in accordance with current conditions (lungvolume, body posture, etc.) and in order to meet thegoal of constant Ps. Muscle recruitment depends on lungvolume.
Figure 16.7 presents a representative example of oraland Ps records. The phrase is “phonetic aspects” (Af-ter Netsell [16.6]). The top panel shows a record of oralair flow. Vertical lines indicate acoustic segment bound-aries. The bottom diagram superimposes the curves fororal and subglottal pressure.
The Ps shows a falling pattern which becomes morepronounced towards the end of the phrase and which isreminiscent of the declination pattern of the fundamen-tal frequency contour typical of declarative sentences[16.10, p. 127]. The highest values occur at the mid-points of [�] and [], the stressed vowels of the utterance.For vowels, oral pressure is close to atmospheric pres-sure (near zero on the y-axis cm H2O scale). The [�]of phonetic and the [�] of aspects show highly sim-ilar traces. As the tongue makes the closure for [�],the air flow is blocked and the trace is brought downto zero. This is paralleled by the oral pressure risinguntil it equals the Ps. As the [�] closure progresses,a slight increase builds up in both curves. The releaseof the [�] is signaled by a peak in the air flow anda rapid decrease in Ps. An almost identical pattern isseen for [�].
In analyzing Ps records, phoneticians aim at iden-tifying variations based on an active control of therespiratory system and phenomena that can be attributedto the system’s passive response to ongoing activity else-where, e.g., in the vocal tract and or at the level of thevocal folds [16.11].
To exemplify passive effects let us consider theevents associated with [�] and [�] just discussed. Assuggested by the data of Figs 16.4 and 16.6, speechbreathing proceeds at a relatively steady lung volumedecrement. However, the open or closed state of the glot-tis, or the presence of a vocal tract constriction/closure,is capable of creating varying degrees of impedanceto the expired air. The oral pressure record reflectsthe combined effect of glottal and articulatory resis-tance variations. Ps is also affected by such changingconditions. As is evident from Fig. 16.7, the Ps tracesduring the [�] and [�] segments first increase during
the stop closures. Then they decrease rapidly duringthe release and the aspiration phases. These effectsare passive responses to the segment-based changes insupraglottal resistance and are unlikely to be activelyprogrammed [16.12, 13].
Does respiration play an active role in the productionof stressed syllables? In “phonetic aspects” main stressoccurs on [�] and []. In terms of Ps, these vowels exhibitthe highest values. Are they due to an active participationof the respiratory system in signaling stress, or are theyfortuitous by-products of other factors?
An early contribution to research on breathing andspeech is the work by Stetson [16.14]. On the basis ofaerodynamic, electromyographic and chest movementmeasurements, Stetson proposed the notion of the chestpulse, a chunk of expiratory activity corresponding tothe production of an individual syllable.
In the late fifties, Ladefoged and colleagues pub-lished an electromyographic study [16.7] which castdoubt on Stetson’s interpretations. It reported increasedactivity in expiratory muscles (internal intercostals)for English syllables. However, it failed to supportStetson’s chest pulse idea in that the increases werefound only on stressed syllables. Ladefoged [16.8] re-ports findings from a replication of the 1958 study inwhich greater activity in the internal intercostals forstressed syllables was confirmed. Moreover, reducedactivity in inspiratory muscles (external intercostals)was observed to occur immediately before each stressedsyllable.
Ps measurements provide further evidence for a pos-itive role for respiration in the implementation of stress.Ladefoged [16.15, p. 143] states: “Accompanying everystressed syllable there is always an increase in the Ps”.This claim is based on data on disyllabic English noun–verb pairs differing in the position of the main stress:TORment (noun)–torMENT (verb), INsult (noun)–inSULT (verb) etc. A clear distinction between the nounand verb forms was observed, the former having Ps peaksin the first syllable and the latter on the second syllable.
As for segment-related Ps variations (e.g., the stopsin Fig. 16.7), there is wide agreement that such localperturbations are induced as automatic consequences ofspeech production aerodynamics. Explaining short-termripple on Ps curves in terms of aerodynamics is consis-tent with the observation that the respiratory system ismechanically sluggish and therefore less suited to imple-ment rapid Ps changes in individual phonetic segments.Basically, its primary task is to produce a Ps contour sta-ble enough to maintain vocal intensity at a fairly constantlevel (Fig. 16.6).
PartE
16.1

674 Part E Music, Speech, Electroacoustics
PEsV (cm H2O)
F0 (Hz)
40200
300
150
75Time
1s
1s
Fig. 16.8 Changes in esophageal pressure, correspondingto subglottic pressure changes (upper curve) and phonationfrequency (middle) in a professional baritone singer per-forming the coloratura passage shown at the bottom. (AfterLeanderson et al. [16.17])
Singing provides experimental data on the behav-ior of the respiratory system that tend to reinforce theview that a time varying respiration activity can be anactive participant in the sound generation process. Al-though there is ample justification for saying that themechanical response of the respiratory structures is char-acterized by a long time constant, Ps in singing variesquickly and accurately. One example is presented inFig. 16.8. It shows variations in pressure, captured as thepressure variations in the esophagus and thus mirroringthe Ps variations [16.16], during a professional baritonesinger’s performance of the music example shown at thebottom. Each tone in the sequence of sixteenth notes isproduced with a pressure pulse. Note also that in thefundamental frequency curve each note corresponds toa small rise and fall. The tempo of about six sixteenthnotes per second implies that the duration of each rise–fall cycle is about 160 ms. It would take quite specialskills to produce such carefully synchronized Ps andfundamental frequency patterns.
Synthesis experiments have demonstrated that thisparticular fundamental frequency pattern is whatproduces what is perceived as a sung legato col-oratura [16.19, 20]. The voice organ seems incapableof producing a stepwise-changing F0 curve in legato,and such a performance therefore sounds as if it wasproduced by a music instrument rather than by a voice.In this sense this F0 variation pattern seems to be neededfor eliciting the perception of a sung sequence of shortlegato tones.
The pressure variations are not likely to result froma modulation of glottal adduction. A weak glottal ad-
F0 (Hz)
Time
20
Level
Poes (cm H2O)
100
Fig. 16.9 The three curves show, from top to bottom F0sound level and esophageal pressure in a professional bari-tone singer singing the music example shown in the graph,i. e. a descending scale with three tones on each scale tone.The singer marked the first beat in each bar by a pressurepulse. (After Sundberg et al. [16.18])
duction should result in a voice source dominated by thefundamental and with very weak high spectrum partials,and mostly the amplitudes of the high overtones do notvary in coloratura sequences.
It is quite possible that the F0 variations are causedby the Ps variations. In the example shown in Fig. 16.8,the pressure variations amount to about 10 cm H2O,which should cause a F0 modulation of about 30 Hzor so, corresponding to two semitones in the vicinityof 220 Hz. This means that the coloratura pattern maysimply be the result of a ramp produced by the F0 regu-lating system which is modulated by the pressure pulsesproduced by the respiratory system.
As another example of the skilled use of Ps insinging, Fig. 16.9 shows the pressure variation in theesophagus in a professional baritone singer performinga descending scale pattern in 3/4 time, with three toneson each scale step as shown by the score fragment inthe first three bars. The singer was instructed to markthe first tone in each bar. The pressure record demon-strates quite clearly that the first beat was produced witha marked pulse approximately doubling the pressure.Pulses of this magnitude must be produced by the res-piratory apparatus. When the subject was instructed toavoid marking the first tone in each bar, no pressurepulses were observed [16.18].
The effect of Ps on fundamental frequency has beeninvestigated in numerous studies. A commonly used
PartE
16.1

The Human Voice in Speech and Singing 16.1 Breathing 675
50
40
30
20
10
0420 6 12 18 24 30 36
Mean Ps (cm H2O)
Pitch relative to C3 (st)
DramaticLyric
Fig. 16.10 Mean subglottal pressure, captured as the oralpressure during /p/-occlusion, in five lyric and six dramaticprofessional sopranos (heavy and thin curves, respec-tively) who sang as loudly and as softly as possible atdifferent F0. The dashed curve shows Titze’s predictionof threshold pressure, i. e., the lowest pressure that pro-duces vocal fold vibration. The bars represent one SD(After [16.21])
method is to ask the subject to produce a sustainedvowel at a given steady pitch and then, at unpre-dictable moments, change the Ps by applying a pushto the subject’s abdomen or chest. The assumption un-derlying these studies is that there will be an initialinterval during which possible reflex action of laryn-geal muscles will not yet come into play. Hence thedata from this time segment should give a valid pictureof the relationship between fundamental frequency andPs.
In a study using the push method, Baer [16.22] estab-lished this relationship for a single male subject. Data onsteady phonations at 94, 110, 220 Hz and a falsetto con-dition (240 Hz) were collected. From electromyogramsfrom the vocalis and the interarytenoid it was possibleto tell that the first 30 ms after the push onset were un-contaminated by reflex muscle responses. Fundamentalfrequency was plotted against Ps for the four F0 condi-
Sound level (db)
Oral pressure (cm H2O)
100
40
90
80
30
20
10
0
F0 (Hz)
300
Time
200
200
100
Fig. 16.11 Simultaneous recordings of sound level, sub-glottic pressure (captured as the oral pressure during /p/occlusion) and F0 in a professional singer singing thenote example shown at the bottom. (After Leandersonet al. [16.17])
tions. These plots showed linear data clusters with slopesof 4, 4, 3 and 9 Hz/cm H2O respectively. Other studieswhich assumed a longer reflex response latency (100 ms)report that F0’s dependence on Ps occurs between 2 to7 Hz/cm H2O.
From such observations phoneticians have con-cluded that, in producing the F0 variations of naturalspeech, Ps plays only a secondary role. F0 control isprimarily based on laryngeal muscle activity. Nonethe-less, the falling F0 contours of phrases with statementintonation tend to have Ps contours that are also falling.Moreover, in questions with final F0 increases, the Psrecords are higher towards the end of the phrase than inthe corresponding statements [16.15].
There is clear evidence that the Ps needs to be care-fully adapted to the target fundamental frequency insinging, especially in the high range ([16.23], [16.24,
PartE
16.1

676 Part E Music, Speech, Electroacoustics
p. 36]). An example is presented in Fig. 16.10 whichshows mean Ps for five dramatic and five lyric sopra-nos when they sang pp and ff tones throughout theirrange [16.21]. The bars represent one standard devia-tion. The dashed curve is the threshold pressure, i. e. thelowest pressure that produced vocal fold vibration, fora female voice according to Titze [16.25, 26].
The singers mostly used more than twice as high Psvalues when they were singing their loudest as comparedwith their softest tones. The subjects reach up to 40 cmH2O. This can be compared with values typical of nor-mal adult conversational speech, which tend to occur inthe range of 5–10 cm H2O. However, loud speech andparticularly stage speech may occasionally approach thehigher values for singing.
Also interesting is the fact that lyric sopranos use sig-nificantly lower Ps values than dramatic sopranos bothin soft and loud phonation. It seems likely that this dif-ference reflects difference in the mechanical propertiesof the vocal folds.
Figure 16.11 presents another example of the closelink between Ps and fundamental frequency. From top tobottom it plots the time functions for sound level (SPLin dB), pressure (cm H2O), fundamental frequency (Hz)for a professional baritone singing an ascending triadfollowed by a descending dominant-seventh triad (ac-
cording to the score at the bottom). The pressure recordwas obtained by recording the oral pressure as the sub-ject repeated the syllable [�] on each note. Duringthe occlusion of the stop the peak oral pressure be-comes equal to the Ps (as discussed in connection withFig. 16.7). That means that the peak values shown in themiddle diagram are good estimates of the actual Ps. Itis important to note that, when the trace repeatedly re-turns to a value near zero, what we see is not the Ps,but the oral pressure reading for the [] vowel, which isapproximately zero.
The exercise in Fig. 16.11 is often sung staccato, i. e.with short pauses rather than with a /p/ consonant be-tween the tones. During these pauses the singer has toget ready for the next fundamental frequency value andmust therefore avoid exhaling the pressurized air beingbuilt up in the lungs. Singers do this by opening the glot-tis between the tones and simultaneously reducing theirPs to zero, so that no air will be exhaled during the silentintervals between the tones. A remarkable fact demon-strated here is that, particularly when sung loudly – sothat high Ps values are used – this exercise requires noth-ing less than a virtuoso mastering of both the timing andtuning of the breathing apparatus and the pitch controlprocess. A failure to reach a target pressure is likely toresult in a failure to reach the target F0.
16.2 The Glottal Sound Source
In speech and singing the general method to generatesound is to make a constriction and to let a strong flowof air pass through it. The respiratory component servesas the power source providing the energy necessary forsound production. At the glottis the steady flow of airgenerated by the respiratory component is transformedinto a quasiperiodic series of glottal pulses. In the vo-cal tract, the glottally modified breath stream undergoesfurther modifications by the resonance characteristics ofthe oral, pharyngeal and nasal cavities.
Constrictions are formed at the glottis - by adjustingthe separation of the vocal folds – and above the glot-tis – by positioning the articulators of the vocal tract.As the folds are brought close together, they respondto the air rushing through by initiating an open–closevibration and thereby imposing a quasiperiodic mod-ulation of airflow. Thus, in a manner of speaking, theglottal structures operate as a device that imposes anAC modulation on a DC flow. This is basically the waythat voicing, the sound source of voiced vowels and con-
sonants and the carrier of intonation and melody, getsmade.
A second mechanism is found in the production ofnoise, the acoustic raw materials for voiceless sounds(e.g., [f], [�], [�], [�]). The term refers to irregular turbu-lent fluctuations in airflow which arise when air comesout from a constriction at a high speed. This processcan occur at the glottis – e.g., in [��] sounds, whisperand breathy voice qualities – or at various places ofarticulation in the vocal tract.
The framework for describing both singing andspeech is that of the source-filter theory of speech pro-duction [16.27, 28]. The goal of this section is to putspeech and singing side by side within that frame-work and to describe how the speaker and the singercoordinate respiration, phonation and articulation toshape the final product: the acoustic wave to be perceivedby the listener.
Figure 16.12 [16.29] is an attempt to capture a fewkey aspects of vocal fold vibrations. At the center a sin-
PartE
16.2

The Human Voice in Speech and Singing 16.2 The Glottal Sound Source 677
Time
Glottal flow
Closed Opening Open Closing
Fig. 16.12 Relationship between the flow glottogram,showing transglottal airflow versus time, and glottal con-figurations in a coronal plane (upper series of images) andfrom above, as through a laryngeal mirror (lower seriesof images). The airflow increases when the folds open theglottis and allow air to pass and decreases quickly whenthey close the glottis and arrest the airflow. (After [16.29])
gle cycle of a glottal waveform is seen. It plots airflowthrough the glottis as a function of time. Alternatively,the graph can be used to picture the time variations ofthe glottal area which present a pattern very similar tothat for airflow. The top row shows stylized cross sec-tions of the vocal folds at selected time points during theglottal cycle. From left to right they refer to the openingof the folds, the point of maximum area and the point ofclosure. Below is a view of the vocal folds from abovecorresponding to the profiles at the top of the diagram.
There are a number of different methods for visual-izing vocal fold vibrations. By placing an electrode oneach side of the thyroid cartilage, a minute current canbe transferred across the glottis. This current increasessubstantially when the folds make contact. The result-ing electroglottogram, also called a laryngogram, thusshows how the contact area varies with time. It is quiteefficient in measurement of F0 and closed phase. Opti-cal glottograms are obtained by illuminating the tracheafrom outside by means of a strong light source and cap-turing the light traveling through the glottis by meansof an optical sensor in the pharynx. The signal thereforereflects the glottal area, but only as long as the light suc-
b)
a)
0.012
Differentiated flow
Flow
0 0.002 0.004 0.006 0.008 0.010Time (s)
Period
Closedphase
Peak-to-peakpulse amplitude
Glottalleakage
MFDR
Fig. 16.13a,b Illustration of measures commonly used tocharacterize a flow glottogram (a) and its time derivative,the differentiated flow glottogram (b). (The wiggles in thelatter are artifacts caused by an imperfect inverse filtering)
cessfully finds it way to the sensor. A posterior tilting ofthe epiglottis may easily disturb or eliminate the signal.
Flow glottograms show transglottal airflow versustime and are derived by inverse filtering the audio signal,often picked up as a flow signal by means of a pneumo-tachograph mask [16.30]. Inverse filtering implies thatthe signal is passed through a filter with a transfer func-tion equalling the inverted transfer function of the vocaltract. Therefore correct inverse filtering requires that theinverted resonance peaks of the inverse filter are tunedto the formant frequencies of the vowel being filtered.
As transglottal airflow is zero when the glottis isclosed and nonzero when it is open, the flow glot-togram is physiologically relevant. At the same timeit is a representation of the sound of the voice source.
A typical example of a flow glottogram is given inthe upper graph of Fig. 16.13. The classical parametersderived from flow glottograms are the durations of theperiod and of the closed phase, pulse peak-to-peak am-plitude, and glottal leakage. The lower graph shows thedifferentiated glottogram. The negative peak amplitudeis often referred to as the maximum flow declinationrate (MFDR). As we shall see it has special status in theprocess of voice production.
In the study of both speech and singing, the acous-tic parameter of main relevance is the time variationsin sound pressure produced by the vocal system and re-ceived by the listener’s ears. Theoretically, this signal
PartE
16.2

678 Part E Music, Speech, Electroacoustics
is roughly proportional to the derivative of the outputairflow at the lips [16.28, 31] and it is related to thederivative of the glottal waveform via the transfer func-tion of the vocal tract. Formally, the excitation signalfor voiced sounds is defined in terms of this differen-tiated signal. Accordingly, in source-filter theory, it isthe derivative of glottal flow that represents the sourceand is applied to the filter or resonance system of thevocal tract. The amplitude of the vocal tract excitation,generally referred to as the excitation strength, is quan-tified by the maximum velocity of flow decrease duringvocal-fold closing movement (the MFDR, Fig. 16.13)which is a determinant of the level of the radiated sound.At the moment of glottal closure a drastic modificationof the air flow takes place. This change is what gen-erates voicing for both spoken and sung sounds andproduces a sound with energy across a wide range offrequencies.
The Liljencrants–Fant (LF) model [16.32, 33] isan attempt to model glottal waveforms using parame-ters such as fundamental frequency, excitation strength,dynamic leakage, open quotient and glottal frequency(defined by the time period of glottal opening phase).Other proposals based on waveform parameters havebeen made by Klatt and Klatt [16.34], Ljungqvist andFujisaki [16.35], Rosenberg [16.36] and Rothenberget al. [16.37]. A second line of research starts out fromassumptions about vocal fold mechanics and appliesaerodynamics to simulate glottal vibrations [16.38, 39].Insights from such work indicate the importance of pa-rameters such as Ps, the adducted/abducted position ofvocal folds and their stiffness [16.28].
During the early days of speech synthesis it be-came clear that the simplifying assumption of a constantvoice source was not sufficient to produce high-quality
2500
Excitation strength
1500140013001200110010009008007006005004003002001000
2000
1500
1000
500
0
Time (ms)
n εt xd ao rh ndr a d ε
Fig. 16.14 Running speech data on the ‘excitation strength parameter’ of the LF model. (After [16.32])
natural-sounding copy synthesis. Experimental work onthe voice source and on speech synthesis has shownthat, in the course of an utterance, source parameters un-dergo a great deal of variation. The determinants of thisdynamics are in part prosodic, in part segmental. Fig-ure 16.14 [16.32] presents a plot of the time variationsof the excitation strength parameter (i. e. MFDR) duringthe Swedish utterance: Inte i DETta århundrade [���������a��������a��]. The upper-case letters indicate thatthe greatest prominence was on the first syllable of detta.Vertical lines represent acoustic segment boundaries.
Gobl collected flow data using the mask developedby Rothenberg [16.30] and applied inverse filtering toobtain records of glottal flow which, after differentia-tion, enabled him to make measurements of excitationstrength and other LF parameters.
Figure 16.14 makes clear that excitation strength is inno way constant. It varies depending on both prosodicand segmental factors. The effect of the segments isseen near the consonant boundaries. As the vocal tractis constricted, e.g., in [�] and [��], and as transglottalpressure therefore decreases (cf. the pressure records ofFig. 16.7), excitation strength is reduced. In part thesevariations also occur to accommodate the voicing and thevoicelessness of the consonant [16.28]. This influenceof consonants on the voice source has been documentedin greater detail by Ni Chasaide and Gobl [16.40] forGerman, English, Swedish, French, and Italian. Partic-ularly striking effects were observed in the context ofvoiceless consonants.
Prosodically, we note in Fig. 16.14 that excitationstrength exhibits a peak on the contrastively stressedsyllable in detta and that the overall pattern of thephrase is similar to the falling declination contour earliermentioned for declarative statements.
PartE
16.2

The Human Voice in Speech and Singing 16.2 The Glottal Sound Source 679
0.4
0.2
0
0.4
0.2
0
0.4
0.2
0
0.4
0.2
0
0.4
0.2
0
0.80.60.40.2
0
0.80.60.40.2
0
0.80.60.40.2
0
0.80.60.40.2
0
Transglottal airflow (l/s)
Time
Loudest
Loud
Neutral
Soft
Softest
Pressed
Neutral
Flowy
Breathy
Transglottal airflow (l/s)
Table 16.1 Measurements of subglottal pressure (cm H2O)and SPL at 0.3 m (dB) measured for the glottograms shownin Fig. 16.15
Table A Ps SPL at(cm H2O) 0.3 m(dB)
loudest 14.3 84
loud 7.3 82
neutral 5.7 78
soft 3.9 75
softest 3 70
Table B Ps SPL at(cm H2O) 0.3 m(dB)
pressed 11.4 83
neutral 5.1 79
flowy 8 88
breathy 6.6 84
Examples of the fact that the Ps has a strong influ-ence on the flow glottogram are given in the upper setof graphs of Fig. 16.15, which shows a set of flow glot-tograms for phonations produced at the same pitch butwith varying degrees of vocal loudness. As we exam-ine the series of patterns from loudest to softest we notethat both the peak flow and the maximum steepness ofthe trailing end of the pulse, i. e., MFDR, increase sig-nificantly with increasing Ps. These shape changes arelawfully related to the variations in Ps and are directlyreflected in sound pressure levels as indicated by thenumbers in Table 16.1.
Holmberg and colleagues [16.41] made acoustic andairflow recordings of 25 male and 20 female speakersproducing repetitions of [�] at soft, normal and loudvocal efforts [16.42, p. 136]. Estimates of Ps and glot-tal airflow were made from recordings of oral pressureand oral airflow. Ps was derived by interpolating betweenpeak oral pressures for successive [�] segments and thenaveraging across repetitions. A measure of average flowwas obtained by low-pass filtering the airflow signaland averaging values sampled at the vowel midpoints.
Fig. 16.15 Typical flow glottogram changes associated withchanges of loudness or mode of phonation (top and bot-tom series). As loudness of phonation is raised, the closingpart of the curve becomes more steep. When phonation ispressed, the glottogram amplitude is low and the closedphase is long. As the adduction force is reduced, pulse am-plitude grows and the closed phase becomes shorter (notethat the flow scales are different for the top and bottom se-ries of glottograms. Flowy phonation is the least adducted,and yet not leaky phonation
PartE
16.2

680 Part E Music, Speech, Electroacoustics
A copy of the airflow signal was low-pass filtered andinverse filtered to remove the effect of F1 and other for-mants. The output was then differentiated for the purposeof determining the MFDR (Fig. 16.13).
Figure 16.15 also illustrates how the voice sourcecan be continuously varied between different modes ofphonation. These modes range from hyperfunctional,or pressed, over neutral and flowy to hypofunctional,or breathy. The corresponding physiological control pa-rameter can be postulated to be glottal adduction, i. e.the force by which the folds press against each other.It varies from minimum in hypofunctional to extremein hyperfunctional. Flowy phonation is produced withthe weakest degree of glottal adduction compatible witha full glottal closure. The physiologically relevant prop-erty that is affected is the vibration amplitude of thevocal folds, which is small in hyperfunctional/pressedphonation and wide in breathy phonation.
As illustrated in Fig. 16.15 the flow glottogramis strongly affected by these variations in phonationmode [16.43]. In pressed phonation, the pulse ampli-tude is small and the closed phase is long. It is larger inneutral and even more so in flowy. In breathy phonation,typically showing a waveform similar to a sine wave, air-flow is considerable, mainly because of a large leakage,so there is no glottal closure.
Phonation mode affects the relation between Ps andthe SPL of the sound produced. As shown in Table 16.1B
Transglottal airflow (Falsetto)
Transglottal airflow (Modal)
Time Time Time
Transglottal airflow (Falsetto)
Transglottal airflow (Modal)
Transglottal airflow (Falsetto)
Transglottal airflow (Modal)
Baryton Tenor Countertenor
Baryton Tenor Countertenor
Fig. 16.16 Typical flow glottograms for falsetto and modal register in a baritone, tenor and countertenor singer, allprofessional. The flow scale is the same within subjects. The ripple during the closed phase in the lower middle glottogramis an artifact. In spite of the great inter-subject variability, it can be seen that the glottogram pulses are wider and morerounded in the falsetto register
pressed phonation is less economical from an acousticpoint of view: a Ps of 11.4 cm H2O produces an SPL at0.3 m of only 83 dB, while in flowy phonation a lowerPs produces a higher SPL.
Pitch, loudness and phonation mode are voice qual-ities that we can vary continuously. By contrast, vocalregisters, also controlled by glottal parameters, appearmore like toggles, at least in untrained voices. The voiceis operating either in one or another register. There are atleast three vocal registers, vocal fry, modal and falsetto.When shifting between the modal and falsetto registers,F0 discontinuities are often observed [16.44].
The definition of vocal registers is quite vague,a set of tones along the F0 continuum that soundsimilar and are felt to be produced in a similar way.As registers depend on glottal function, they producedifferent flow glottogram characteristics. Figure 16.16shows typical examples of flow glottograms for thefalsetto and modal registers as produced by profes-sional baritone, tenor and countertenor singers. Thepulses are more rounded, the closed phase is shorter,and the glottal leakage is greater in the falsetto than inthe modal register. However, the waveform of a givenregister often varies substantially between individuals.Classically trained sopranos, altos, and tenors learn tomake continuous transitions between the modal andthe falsetto registers, avoiding abrupt changes in voicetimbre.
PartE
16.2

The Human Voice in Speech and Singing 16.2 The Glottal Sound Source 681
–30
–40
–50
–60
–70
–80
–9060000 1000 2000 3000 4000 5000
Mean spectrum level (dB)
Frequency (Hz)
Fig. 16.17 Long-term-average spectra curves obtained froman untrained male speaker reading the same text at 6different degrees of vocal loudness. From top to bottomthe corresponding Leq values at 0.3 m were 93 dB, 88 dB,85 dB, 84 dB, 80 dB, and 76 dB
Variation of vocal loudness affects the spectrumslope as illustrated in Fig. 16.17, which shows long-term-average spectra (LTAS) from a male untrainedvoice. In the figure loudness is specified in terms of theso-called equivalent sound level Leq. This is a commonlyused time average of sound level, defined as
Leq = 10 log1
T
T∫
0
p2
p20
dt ,
where t is time and T the size of the time window. p andp0 are the sound pressure and the reference pressure,respectively.
When vocal loudness is changed, the higher over-tones change much more in sound level than the lowerovertones. In the figure, a 14 dB change of the levelnear 600 Hz is associated with a 22 dB change near3000 Hz, i. e., about 1.5 times the level change near600 Hz. Similar relationships have been observed forprofessional singers [16.47]. In other words, the slopeof the voice source spectrum decreases with increasingvocal loudness.
The physiological variable used for variation of vo-cal loudness is Ps. This is illustrated in the upper graphof Fig. 16.18, comparing averaged data observed in un-trained female and male subjects and data obtained fromprofessional operatic baritone singers [16.45, 46]. Therelationship between the Ps and MFDR is approximatelylinear. It can be observed that the pressure range usedby the singer is considerably wider than that used by theuntrained voices. The MFDR produced with a given Psby the untrained female and male subjects is mostly
2000
1500
1000
500
0300 5 10 15 20 25
95
90
85
80
75
70
65
602000300 500 1000
Mean MFDR (l/s2)
Mean Ps (cm H2O)
Untrained femalesUntrained menBaritone means
SPL at 0.3m (dB)
MFDR (l/s2)
196 Hz139 Hz278 Hz
Fig. 16.18 The top graph shows the relationship betweenthe mean subglottal pressure and the mean MFDR forthe indicated subject groups. The bottom graph shows therelationship between MFDR and the SPL at 0.3 m for a pro-fessional baritone singing the vowels /a/ and /æ/ at differentF0s. (After [16.45] p. 183, [16.46] p. 184)
higher than that produced by the baritones with thesame pressure.This may depend on different mechanicalcharacteristics of the vocal folds.
As we will see later, SPL depends on the strengthof the excitation of the vocal tract, i. e. on MFDR. Thisvariable, in turn, depends on Ps and F0; the higher thepressure, the greater the MFDR value and the higher theF0, the greater the MFDR. The top graph of Fig. 16.18
PartE
16.2

682 Part E Music, Speech, Electroacoustics
shows how accurately MFDR could be predicted fromPs and F0 for previously published data for untrainedmale and female singers and for professional baritonesingers [16.45, 46]. Both Ps and F0 are linearly relatedto MFDR. However, the singers showed a much greatervariation with F0 than the untrained voices. This differ-ence reflected the fact that unlike the untrained subjects
the singers could sing a high F0 much more softly thanthe untrained voices. The ability to sing high notes alsosoftly would belong to the essential expressive skills ofa singer. Recalling that an increase of Ps increases F0by a few Hz/cm H2O, we realize that singing high tonessoftly requires more forceful contraction of the pitch-raising laryngeal muscles than singing such tones loudly.
16.3 The Vocal Tract Filter
The source-filter theory, schematically illustrated inFig. 16.19, describes vocal sound production as a three-step process: (1) generation of a steady flow of air from
Velum
Vocalfolds
Trachea
Vocaltract
Level
Radiated spectrum
Frequency
Vocal tract frequency curve formants
Glottal voice source
Frequency
Spectrum
Level
LevelFrequency
Transplottal airflow
Waveform
Time
Lungs
Fig. 16.19 Schematic illustration of the generation of voicesounds. The vocal fold vibrations result in a sequence ofvoice pulses (bottom) corresponding to a series of harmonicovertones, the amplitudes of which decrease monotonicallywith frequency (second from bottom). This spectrum is fil-tered according to the sound transfer characteristics of thevocal tract with its peaks, the formants, and the valleys be-tween them. In the spectrum radiated from the lip opening,the formants are depicted in terms of peaks, because the par-tials closest to a formant frequency reach higher amplitudesthan neighboring partials
the lungs (DC component); (2) conversion of this airflowinto a pseudo-periodically pulsating transglottal airflow(DC-to-AC conversion), referred to as the voice source;and (3) response of the vocal tract to this excitation signal(modulation of AC signal) which is characterized by thefrequency curve or transfer function of the vocal tract.So far the first two stages, respiration and phonation,have been considered.
In this section we will discuss the third step, viz. howthe vocal tract filter, i. e. the resonance characteristics ofthe vocal tract, modifies, and to some extent interactswith, the glottal source and shapes the final sound outputradiated from the talker’s/singer’s lips.
Resonance is a key feature of the filter response.The oral, pharyngeal and nasal cavities of the vocal tractform a system of resonators. During each glottal cyclethe air enclosed by these cavities is set in motion by theglottal pulse, the main moment of excitation occurringduring the closing of the vocal folds, more precisely atthe time of the MFDR, the maximum flow declinationrate (cf. the previous section on source).
The behavior of a vocal tract resonance, or formant,is specified both in the time and the frequency domains.For any transient excitation, the time response is anexponentially decaying cosine [16.27, p. 46]. The fre-quency response is a continuous amplitude-frequencyspectrum with a single peak. The shape of either func-tion is uniquely determined by two numbers (in Hz): theformant frequency F and the bandwidth B. The band-width quantifies the degree of damping, i. e., how fast theformant oscillation decays. Expressed as sound pressurevariations, the time response is
p(t) = A e−πBt cos (2πFt) . (16.1)
For a single formant curve, the amplitude variationsas a function of frequency f is given (in dB) by
L(f)=20 log[F2 + ( B
2
)2]√( f − F)2 + ( B
2
)2√
( f + F)2 + ( B2
)2.
(16.2)
PartE
16.3

The Human Voice in Speech and Singing 16.3 The Vocal Tract Filter 683
10
3500
20
0
–10
–20
–30
–40
–50300025002000150010005000
i
y
u
eε æ
o
œ a
Fig. 16.20 Predictability of formant levels. Calculatedspectral envelopes for a set of Swedish vowels. The up-per graph illustrates how varying only the frequency of F1affects the amplitudes of other formants
In the frequency domain the bandwidth is definedas the width of the formant 3 dB down from the peak,that is, at the half-power points. A large bandwidthproduces a flat peak whereas a small value (less damp-ing, reduced acoustic losses) makes the peak higher andsharper.
Figure 16.20 shows spectral envelopes for a set ofSwedish vowels. They were calculated from formantfrequency data [16.48, 49] in accordance with source-filter theory which assumes that a vowel spectrum canbe decomposed into formants (all specified with re-spect to frequency and bandwidth), the spectrum of thevoice source, the contribution of formants above F4 andradiation [16.27].
The individual panels are amplitude versus fre-quency plots. Vowels are portrayed in terms of theirenvelopes rather than as line spectra with harmonics.
The panels are arranged in a formant space. From top tobottom the F2 in the panels decreases. From left to rightF1 increases. The frequency scale is limited to showingthe first three formant peaks.
We note that all envelopes have falling overall slopesand that the amplitudes of the formant peaks vary a greatdeal from vowel to vowel and depending on the relativeconfiguration of formant frequency positions.
In acoustic phonetic specifications of vowels, it iscustomary to report no more than the frequencies of thefirst two or three formants ([16.50, p. 59], [16.51]). Ex-periments in speech synthesis [16.52] have indicated thatthis compact description is sufficient to capture the qual-ity of steady-state vowels reasonably well. Its relativesuccess is explained by the fact that most of the buildingblocks of a vowel spectrum are either predictable (band-widths and formant amplitudes), or show only limitedspectral variations (source, radiation, higher-formantcorrection) [16.27].
Formant bandwidths [16.28, 53] reflect acousticlosses. They depend on factors such as radiation, soundtransmission through the vocal tract walls, viscosity, heatconduction, constriction size as well as the state of theglottis. For example, a more open glottis, as in a breathyvoice, will markedly increase the bandwidth of the firstformant.
Despite the complex interrelations among these fac-tors, bandwidths pattern in regular ways as a function offormant frequency. Empirical formulas have been pro-posed [16.54] that summarize bandwidth measurementsmade using transient and sweep-tone excitation of thevocal tract for closed-glottis conditions [16.55, 56].
To better understand how formant levels vary let usconsider the top diagram of Fig. 16.20. It compares en-velopes for two vowel spectra differing only in termsof F1. It is evident that the lowering of F1 (from 750to 250 Hz) reduces the amplitudes of F2 and F3 byabout 15 dB. This effect is predicted by acoustic the-ory which derives the spectral envelope of an arbitraryvowel as a summation of individual formant curves ona dB scale [16.27]. Figure 16.20 makes clear that, asF1 is shifted, its contribution to the envelope is drasti-cally changed. In this case the shift moves the entire F1curve down in frequency and, as a result, its upper skirt(dashed line) provides less of a lift to the upper formants.This interplay between formant frequency and formantlevels is the major determinant of the various envelopeshapes seen in Fig. 16.20.
One of the main lessons of Fig. 16.20 is accord-ingly that, under normal conditions of a stable voicesource, formant amplitudes are predictable. Another
PartE
16.3

684 Part E Music, Speech, Electroacoustics
important consequence of the source-filter theory isthat, since knowing the formants will enable us to re-construct the vowel’s envelope, it should also makeit possible to derive estimates about a vowel’s overallintensity.
A vowel’s intensity can be calculated from its powerspectrum as
I = 10 log[∑
(Ai)2]
, (16.3)
where Ai is the sound pressure of the i-th harmonic.This measure tends to be dominated by the strongestpartial or partials. In very soft phonation the strongestpartial is generally the fundamental while in neutral andlouder phonation it is the partial that lies closest to thefirst formant. Thus, typically all partials which are morethan a few dB weaker than the strongest partial in thespectrum do not contribute appreciably to the vowel’sintensity.
As suggested by the envelopes in Fig. 16.20, thestrongest harmonics in vowels tend to be found in the F1region. This implies that a vowel’s intensity is primarilydetermined by its F1. Accordingly, in the set shown inFig. 16.20, we would expect [��������] to be least intenseand [�a�] the most intense vowels. This is in goodagreement with experimental observations [16.57].
5000
4500
4000
3500
3000
2500
2000
1500
1000
500
00 0.5 1.0 1.5 2.0 2.5 3.0 3.5 4.0 4.5 5.0 5.5 6.0 6.5 7.0 7.5 8.0 8.5 9.0 9,5 10.0 10,5
Hz
TimeeS quel guerrie r lofo ss i s ei lmioso gno s’a veras e
Fig. 16.21 Spectrogram of operatic tenor Jussi Björling’s performance of an excerpt from Verdi’s opera Aida. The lyricsare given below the graph
The intrinsic intensity of vowels and other speechsounds has been a topic of interest to phoneticians study-ing the acoustic correlates of stress [16.58]. It is relatedto sonority, a perceptual attribute of speech sounds thattends to vary in a regular way in syllables [16.59]. Wewill return below to that topic in Sect. 16.5.
Let us continue to illustrate how formant levels de-pend on formant frequencies with an example fromsinging: the singer’s formant. This striking spectral phe-nomenon is characteristic of classically trained malesingers. It is illustrated in Fig. 16.21. The figure showsa spectrogram of a commercial recording of an operatictenor voice (Jussi Björling) performing a recitativo fromVerdi’s opera Aida. Apart from the vibrato undulation ofthe partials, the high levels of partials in the frequencyrange 2200–3200 Hz are apparent. They represent thesinger’s formant.
The singer’s formant is present in all voiced soundsas sung by operatic male singers. It was first discov-ered by Bartholomew [16.60]. It manifests itself asa high, marked peak in the long-term-average spectrum(LTAS).
A second example is presented in Fig. 16.22 show-ing an LTAS of the same tenor voice as in Fig. 16.21,accompanied by an orchestra of the traditional western
PartE
16.3

The Human Voice in Speech and Singing 16.3 The Vocal Tract Filter 685
0
–10
–20
–30
–4010 000100 1000
Mean level (dB)
Frequency (Hz)
Fig. 16.22 LTAS of the sound of a symphonic orchestrawith and without a singer soloist (dark and light curves).The singer’s formant constitutes a major difference be-tween the orchestra with and without the singer soloist.(After [16.61])
10
0
–10
–20
–30
–40
–50
–60
–7010 000100 1000
Level (dB)
Frequency (kHz)
F5 lowered from 4500 to 2700 Hz
Fig. 16.23 Effect on the spectrum envelope of lowering for-mants F4 and F5 from 3500 Hz and 4500 Hz to 2700 Hz and3500 Hz, respectively. The resulting gain in level at F3 ismore than 10 dB
opera type. The LTAS peak caused by the singer’s for-mant is just a few dB lower than the main peak in thelow-frequency range.
In the same figure an LTAS of a classical symphonyorchestra is also shown. On the average, the partials inthe low-frequency range are quite strong but those above600 Hz decrease by about 10 dB/octave with rising fre-quency. Even though this decrease varies depending on
how loudly the orchestra is playing, this implies that thelevel of the orchestral accompaniment is much lowerat 3000 Hz than at about 600 Hz. In other words, theorchestral sound offers the singer a rather reasonablecompetition in the frequency range of the singer’s for-mant. The fact of the matter is that a voice possessinga singer’s formant is much easier to hear when the or-chestral accompaniment is loud than a voice lackinga singer’s formant. Thus, it helps the singer’s voice to beheard when the orchestral accompaniment is loud.
The singer’s formant can be explained as a reso-nance phenomenon [16.62]. It is a product of the samerules that we invoked above to account for the formantamplitudes of vowels and for intrinsic vowel intensi-ties. The strategy of a classically trained male singeris to shape his vocal tract so as to make F3, F4, andF5 form a tight cluster in frequency. As the frequencyseparations among these formants are decreased, theirindividual levels increase, and hence a high spectral peakis obtained between 2500 and 3000 Hz.
Figure 16.23 shows the effects on the spectrum en-velope resulting from lowering F5 and F4 from 3500 Hzand 4500 Hz to 2700 Hz and 3500 Hz, respectively. Theresulting increase of the level of F3 amounts to 12 dB,approximately. This means that male operatic singersproduce a sound that can be heard more easily througha loud orchestral accompaniment by tuning vocal tractresonances rather than by means of producing an exces-sive Ps.
The acoustical situation producing the clustering ofF3, F4, and F5 is obtained by acoustically mismatchingthe aperture of the larynx tube, also referred to as theepilaryngeal tube, with the pharynx [16.62]. This canbe achieved by narrowing this aperture. Then, the lar-ynx tube acts as a resonator with a resonance that is notmuch affected by the rest of the vocal tract but ratherby the shape of the larynx tube. Apart from the size ofthe aperture, the size of the laryngeal ventricle wouldbe influential: the larger the ventricle, the lower the lar-ynx tube resonance. Presumably singers tune the larynxtube resonance to a frequency close to F3. The articula-tory means used to establish this cavity condition seemsmainly to be a lowering of the larynx, since this tendsto widen both the pharynx and the laryngeal ventricle.Many singing teachers recommend students to sing witha comfortably low larynx position.
The level of the singer’s formant is influenced also bythe slope of the source spectrum which, in turn, dependson vocal loudness, i. e. on Ps, as mentioned. Thus, thesinger’s formant tends to increase by about 15 dB for a10 dB change of the overall SPL [16.47].
PartE
16.3

686 Part E Music, Speech, Electroacoustics
0
–10
–20
–30
–4040000 500 1000 1500 2000 2500 3000 3500
Level (dB)
Frequency (Hz)
SopranosAltosTenorsBaritonesBassesUntrained males, 70 dB Leq at 0.3 mUntrained females, 70 dB Leq at 0.3 m
Fig. 16.24 Mean LTAS derived from commercial record-ings of four representatives of each of the indicated voiceclassifications. The dashed curves show LTAS of untrainedfemale (red) and male (blue) voices’ speech with an Leq
of 70 dB at 0.3 m. Note that the singer’s formant producesa prominent peak with a level well above the level of theuntrained voices’ LTAS only for the male singers
The center frequency of the singer’s formant variesslightly between voice classifications, as illustrated inthe mean LTAS in Fig. 16.24 which shows mean LTASderived from commercial recordings of singers classi-fied as soprano, alto, tenor, baritone and bass [16.63].Each group has four singers. The center frequency ofthe singer’s formant for basses, baritones and tenorsare about 2.4, 2.6, and 2.8 kHz, respectively. Thesesmall differences are quite relevant to the typical voicetimbres of these classifications [16.64]. Their originis likely to be vocal tract length differences, bassestending to have longer vocal tracts than baritones whoin turn have longer vocal tracts than tenors [16.65].On the other hand, substantial variation in the centerfrequency of the singer’s formant occurs also withinclassifications.
Also shown for comparison in Fig. 16.24 is a meanLTAS of untrained voices reading at an Leq of 70 dB at0.3 m distance. The singer’s formant produces a markedpeak some 15 dB above the LTAS of the untrained voicesfor the male singers. The female singers, on the otherhand, do not show any comparable peak in this fre-quency range. This implies that female singers do nothave a singer’s formant [16.67–69].
Female operatic singers’ lack of a singer’s formantis not surprising, given the fact that: (1) they sing athigh F0, i. e. have widely spaced spectrum partials, and(2) the F3, F4, F5 cluster that produces a singer’s for-mant is rather narrow in frequency. The latter means thata narrow formant cluster will be hit by a partial only in
95
90
85
80
75
7030201510
30201510
50
20
10
5
Peak SPL at 0.25 m
Subglottal pressure (cm H2O)
i, u
Subglottal pressure (cm H2O)
Loudness
, i, u
Fig. 16.25 Perceived loudness of a vowel (bottom panel)correlates better with subglottal pressure Ps than does SPL(top panel) which depends on the intrinsic intensity of thevowel. This, in turn, is determined by its formant pattern.(After [16.66])
some tones of a scale while in other scale tones therewill be no partial in the formant cluster. This would leadto salient and quasi-random variation of voice timbrebetween scale tones.
The singer’s formant is a characteristic of classi-cally trained male singers. It is not found in nonclassicalsinging, e.g. in pop or musical theater singing, where au-dibility is the responsibility of the sound engineer ratherthan of the singer. Likewise, choir singers generally donot possess a singer’s formant.
From the evidence in Fig. 16.18 we concluded thatthe logarithm of Ps does a good job of predicting theSPL over a large range of vocal intensities. This wasshown for untrained male and female speakers as well asa professional baritone singer. In the next few paragraphswe will look at how vowel identity affects that predictionand how listeners perceive loudness in the presence ofvowel-dependent variations in SPL at constant Ps.
PartE
16.3

The Human Voice in Speech and Singing 16.4 Articulatory Processes, Vowels and Consonants 687
This topic was addressed by Ladefoged [16.66] whomeasured the peak SPL and the peak Ps in 12 repeti-tions of bee, bay, bar, bore and boo spoken by a Britishtalker at varying degrees of loudness. SPL values wereplotted against log(Ps) for all tokens. Straight linescould readily be fitted to the vowels individually. Thevowels of bay and bore tended to have SPL valuesin between those of bar and bee/boo. The left half ofFig. 16.25 replots the original data for [] and [�]/[�]pooled. The [] line is higher by 5–6 dB as it should bein view of F1 being higher in [] than in [�] and [�] (cf.preceding discussion).
In a second experiment listeners were asked to judgethe loudness of the test words. Each item was presentedafter a carrier phrase: Compare the words: bar and .The word bar served as reference. The subjects wereinstructed to compare the test syllable and the referencein terms of loudness, to give the value of 10 to thereference and another relative number to the test word.The analysis of the responses in terms of SPL indicatedthat, for a given SPL, it was consistently the case thatbee and boo tended to be judged as louder than bar.On the other hand, there were instances of bee and barwith similar Ps that were judged to be equally loud. Thiseffect stood out clearly when loudness judgements wereplotted against log(Ps) as in the bottom half of Fig. 16.25.
Ladefoged concludes that “ . . . in the case of speechsounds, loudness is directly related to the physiologicaleffort” – in other words, Ps – rather than the SPL as formany other sounds.
Speech Soundswith Noise and Transient Excitation
A comprehensive quantitative treatment of the mecha-nisms of noise production in speech sounds is found inStevens [16.28, pp. 100–121]. This work also providesdetailed analyses of how the noise source and vocal tractfiltering interact in shaping the bursts of stops and thespectral characteristics of voiced and voiceless frica-tives. While the normal source mechanism for vowelsalways involves the glottis, noise generation may takeplace not only at the glottis but at a wide range of loca-tions along the vocal tract. A useful rule of thumb forarticulations excited by noise is that the output will spec-trally be dominated by the cavity in front of the noisesource. This also holds true for sounds with transient ex-citation such as stop releases and click sounds [16.28,Chapts. 7,8].
While most of the preceding remarks were devoted tothe acoustics of vowels, we should stress that the source-filter theory applies with equal force to the productionof consonants.
16.4 Articulatory Processes, Vowels and Consonants
X-ray films of normal speech movements reveal a highlydynamic process. Articulatory activity comes across asa complex flow of rapid, parallel lip, tongue and othermovements which shows few, if any, steady states. Al-though the speaker may be saying no more than a fewsimple syllables, one nonetheless has the impression ofa virtuoso performance of a polyphonic motor score.As these events unfold, they are instantly reflected inthe acoustic output. The articulatory movements modifythe geometry of the vocal tract. Accordingly, the filter(transfer function) undergoes continual change and, asa result, so do the output formant frequencies.
Quantitative modeling is a powerful tool for in-vestigating the speech production process. It has beensuccessfully applied to study the relations between for-mant and cavities. Significant insights into this mappinghave been obtained by representing a given vocal tractconfiguration as an area function – i. e., a series ofcylindrical cross sections of variable lengths and cross-sectional areas – and by simulating the effects of changesin the area function on the formant frequencies [16.27].
In the past, pursuing this approach, investigatorshave used lateral X-ray images – similar to the magnetic
i
y
u
eε æ
o
œ a
Fig. 16.26 Magnetic resonance images of the Swedishvowels of Fig. 16.20
PartE
16.4

688 Part E Music, Speech, Electroacoustics
8
6
4
2
00.0
Distance from glottis (cm)2.55.07.510.012.515.017.5
Cross-sectional area (cm2)c)
a) b)
Area functionDerived F-patternF1 650F2 1213F3 2578
Fig. 16.27a–c From articulatory profile to acoustic output.Deriving the formant patterns of a given vowel articulationinvolves (a) representing the vocal tract profile in terms ofthe cross-distances from the glottis to the lips; (b) convert-ing this specification into a cross-sectional area function;and (c) calculating the formant pattern from this area func-tion. To go from (a) to (b), profile data (top left) needto be supplemented by area measurements obtained fromtransversal (coronal and axial) images of the cross sections
resonance imaging (MRI) pictures in Fig. 16.26 – totrace the outlines of the acoustically relevant articula-tory structures. To make estimates of cross-sectionalareas along the vocal tract such lateral profiles need tobe supplemented with information on the transverse ge-ometry of the cross sections, e.g., from casts of the vocaltract [16.70] and tomographic pictures [16.27, 71].
More currently, magnetic resonance imaging meth-ods have become available, making it possible toobtain three-dimensional (3-D) data on sustained steadyarticulations [16.72–76]. Figure 16.26 presents MRIimages taken in the mid-sagittal plane of a malesubject during steady-state productions of a set ofSwedish vowels. These data were collected in con-nection with work on APEX, an articulatory modeldeveloped for studying the acoustic consequences of ar-
ticulatory movements, e.g., the lips, the tongue and thejaw [16.77–81].
Figure 16.27 highlights some of the steps involvedin deriving the formant pattern from lateral articulatoryprofiles such those of Fig. 16.26. The top-left picture isthe profile for the subject’s [a]. The white lines indicatethe coronal, coronal oblique and axial planes where ad-
i
u
o
X-ray data
Effect ofvaryingAPEX tongueposition
Neutral
Shape
Position
Idealization
Fig. 16.28 The top drawing shows superimposed observedtongue shapes for [�], [�], [�] and [] differing in the placeof the main constriction. Further analyses of similar datasuggest that, for vowels, two main dimensions are used:The anterior–posterior location of the tongue body and itsdisplacement from neutral which controls the degree ofvocal tract constriction (lower right). These parameters areimplemented numerically to produce vowels in the APEXarticulatory model
PartE
16.4

The Human Voice in Speech and Singing 16.4 Articulatory Processes, Vowels and Consonants 689
Fig. 16.29 Acoustic consequences of tongue body, jaw andlip movements as examined in APEX simulations. Thetongue moves continuously between palatal, velar andpharyngeal locations while maintaining a minimum con-striction area Amin of 0.25 cm, a 7 mm jaw opening anda fixed larynx height. The dashed and solid lines refer torounded and spread conditions. The lower diagram illus-trates the effect of varying the jaw. The thin lines showtongue movement at various degrees of jaw opening (6, 7,8, 9, 12, 15, 19 and 23 mm). The bold lines pertain to fixedpalatal, neutral or pharyngeal tongue contours
ditional MR images were taken to get information onthe cross sections in the transverse dimension.
The location of the transverse cut is indicated bythe bold white line segment in the lateral profile. In thecoronal section to the right the airway of the vocal tract isthe dark area at the center. Below it, the wavy surface ofthe tongue is evident. Since the teeth lack the density ofhydrogen nuclei needed to show up on MR images, theirintersection contours (green) were reconstructed fromcasts and added computationally to the image. The redlines indicate the outline of a dental plate custom-fitted tothe subject’s upper and lower teeth and designed to carrya contrast agent used to provide reference landmarks(tiny white dots) [16.82].
At any given point in the vocal tract, it would appearthat changes in cross-sectional area depend primarilyon the midsagittal distance from the tongue surface tothe vocal tract wall. An empirically adequate approach tocapturing distance-to-area relations is to use power func-tions of the form Ax = αdβ
x , where dx is the mid-sagittalcross distance at a location x in the vocal tract and α andβ are constants whose values tend to be different in dif-ferent regions and depend on the geometry of the vocaltract walls [16.24,70,72]. The cross-sectional area func-tion can be obtained by applying a set of d-to-A rulesof this type to cross distances measured along the vocaltract perpendicular to the midline. The final step con-sists in calculating the acoustic resonance frequenciesof the derived area function.
In producing a vowel and the vocal tract shape appro-priate for it, what are the main articulatory parametersthat the speaker has to control? The APEX model [16.80]assumes that the significant information about the vowelarticulations in Fig. 16.26 is the following. All the vow-els exhibit tongue shapes with a single constriction. Theydiffer with respect to how narrow this constriction is andwhere it is located. In other words, the vowels appearto be produced with control of two degrees of free-dom: the palatal–pharyngeal dimension (position) and
2500
2000
1500
1000
500
0
1.51.00.50–0.5–1–1.5
4000 200 600 800
3500
3000
2500
2000
1500
1000
500
0
Formant frequency (Hz)
Normalized place of constriction
Palatal Velar Pharyngeal
First formant (Hz)
Second formant (Hz)
Neutral
Palatal tongueshape
6 to 23 mm
Pharyngeal
SpreadRound
tongue height, or, in APEX terminology, displacementfrom neutral. This interpretation is presented in stylizedform in Fig. 16.28 together with APEX tongue shapessampled along the palatal–pharyngeal continuum. Thechoice of tongue parameters parallels the degree andplace of constriction in the area-function models ofStevens and House [16.83] and Fant [16.27].
A useful application of articulatory models is thatthey can be set up to change a certain variable whilekeeping others constant [16.84]. Clearly, asking a humansubject to follow such an instruction does not create aneasily controlled task.
PartE
16.4

690 Part E Music, Speech, Electroacoustics
120
100
80
60
40
20
0
–20120–20 0 20 40 60 80 100 120–20 0 20 40 60 80 100ph r
r
Fig. 16.30 Role of the tongue tip and blade in tuning F3. As the tongue is raised to produce the retroflex configurationrequired for the Swedish [��] sound an acoustically significant volume is created under the tongue blade. Simulations usingAPEX indicate that this cavity is responsible for the considerable lowering of the third formant associated with the [��]
Figure 16.29 plots results from APEX simulationexperiments. It demonstrates how F1, F2 and F3 varyin response to the tongue moving continuously betweenpalatal, velar and pharyngeal locations and maintaininga minimum constriction area Amin of 0.25 cm2, a 7 mmjaw opening and keeping the larynx height constant.The dashed and solid lines refer to rounded and spreadconditions. The calculations included a correction forthe impedance of the vocal tract walls ([16.54], [16.28,p. 158]).
It is seen that the tongue movement has strong ef-fect on F2. As the constriction becomes more posteriorF2 decreases and F1 rises. In general, rounding low-ers formants by varying degrees that depends on theformant-cavity relations that apply to the articulationin question. However, for the most palatal position inFig. 16.29 – an articulation similar to an [�] or an [�], ithas little effect on F2 whereas F3 is affected strongly.
The F2 versus F1 plot of the lower diagram ofFig. 16.29 was drawn to illustrate the effect of varyingthe jaw. The thin lines show how, at various degrees ofjaw opening (6, 7, 8, 9, 12, 15, 19 and 23 mm), the tonguemoves between palatal and pharyngeal constrictions byway of the neutral tongue shape. The bold lines pertainto fixed palatal, neutral or pharyngeal tongue contours.We note that increasing the jaw opening while keepingthe tongue configuration constant shifts F1 upward.
Figure 16.30 exemplifies the role of the tongue tipand blade in tuning F3. The data come from an X-raystudy with synchronized sound [16.79,85]. At the center
a spectrogram of the syllable “par” [���� ]. Perhapsthe most striking feature of the formant pattern is theextensive lowering of F3 and F4 into the [��].
The articulatory correlates are illustrated in the trac-ings. As we compare the profiles for [�] and [��], wesee that the major change is the raising of the tongueblade for [��] and the emergence of a significant cavityin front of, and below, the tongue blade. Simulations us-
3000
Third formant
500
3500
2500
2000
1500400200 600 800 1000
First formant
10001500
20002500
Secondformant
u
i
y
ε a
u
yi ε
a
C
C
Fig. 16.31 The acoustic vowel space: possible vowel for-mant combinations according to the APEX model
PartE
16.4

The Human Voice in Speech and Singing 16.4 Articulatory Processes, Vowels and Consonants 691
F2 (kHz)
F1 (kHz)
3.0
2.5
2.0
1.5
1.0
0.5
00 0.2 0.4 0.6 0.8 1.0 1.2 1.4
Soprano
Alto
Tenor
Bass
i e
aœ
ou
ε
æ
Fig. 16.32 Schematic illustration of the variation ranges ofF1 and F2 for various vowels as pronounced by female andmale adults. Above the graph F1 is given in musical scorenotation together with typical F0 ranges for the indicatedvoice classifications
ing APEX and other models [16.28,86] indicate that thissubapical cavity is responsible for the drastic loweringof F3.
The curves of Fig. 16.30 are qualitatively consis-tent with the nomograms published for three-parameterarea-function models, e.g., Fant [16.27]. An advantageof more-realistic physiological models is that the rela-tionships between articulatory parameters and formantpatterns become more transparent. We can summarizeobservations about APEX and the articulation-to-formants mapping as:
• F1 is controlled by the jaw in a direct way;• F2 is significantly changed by front–back movementof the tongue;
4500
4000
3500
3000
2500
2000
1500
1000
500
1001000100 200 400 800
Fn (Hz)
F0 (Hz)
F4
F3
F2
F1
i u e a
Fig. 16.33 Values of F1, F2, F3, and F4 for the indicatedvowels in a professional soprano as function of F0. F1 andF3 are represented by open symbols and F2 and F4 by filledsymbols. The values for F0 ≈180 Hz were obtained whenthe singer sustained the vowels in a speech mode. (AfterSundberg [16.87])
• F3 is influenced by the action of the tongue blade.
Another way of summarizing the acoustic proper-ties of a speech production model is to translate all of itsarticulatory capabilities into a formant space. By defini-tion that contains all the formant patterns that the modelis capable of producing (and specifying articulatorily).Suppose that a model uses n independent parametersand each parameter is quantized into a certain number ofsteps. By forming all legal combinations of those para-metric values and deriving their vocal tract shapes andformant patterns, we obtain the data needed to representthat space graphically.
The APEX vowel space is shown in 3-D inFig. 16.31. The x-axis is F1. The depth dimension isF2 and the vertical axis is F3. Smooth lines were drawnto enclose individual data points (omitted for clarity).
A cloud-like structure emerges. Its projection on theF2/F1 floor plane takes the form of the familiar trian-
PartE
16.4

692 Part E Music, Speech, Electroacoustics
50
40
30
20
10
010–30 0–10–20
50
40
30
20
10
020–30 100–10–20
Jaw opening (mm)
Interval to first formant [semitones]
Vowel [a:]
Mz 1Mz 2Mz 3Alt
Vowel [e]
SopMz1Mz 2Mz 3AltTenBar
Fig. 16.34 Singers’ jaw opening in the vowels [�] and [�]plotted as functions of the distance in semitones betweenF0 and the individual singer’s normal F1 value for thesevowels. The singers belonged to different classifications:Sop = soprano, Mz = mezzosoprano, Alt = alto, Ten = tenor,Bar = baritone. Symbols refer to subjects. (After Sundbergand Skoog [16.88])
gular pattern appears with [�], [a] and [�] at the corners.Adding F3 along the vertical axis offers additional roomfor vowel timber variations especially in the [�/�] region.
Figure 16.32 shows typical values for F1 and F2 forvarious vowels. At the top of the diagram, F1 is givenalso on the musical staff. The graph thus demonstratesthat the fundamental frequency in singing is often higherthan the normal value of F1. For example, the first for-mant of [��] and [��] is about 250 Hz (close to the pitchof C4), which certainly is a quite low note for a soprano.
Theory predicts that the vocal fold vibration will begreatly disturbed when F0 = F1 [16.89], and singersseem to avoid allowing F0 to pass F1 [16.87, 90]. In-stead they raise F1 to a frequency slightly higher thanF0. Some formant frequency values for a soprano singerare shown in Fig. 16.33. The results can be idealized interms of lines, also shown in the figure, relating F1, F2,F3, and F4 to F0. Also shown are the subject’s formantfrequencies in speech. The main principle seems to be asfollows. As long as fundamental frequency is lower thanthe normal value of the vowel’s first formant frequency,this formant frequency is used. At higher pitches, thefirst formant is raised to a value somewhat higher thanthe fundamental frequency. In this way, the singer avoidshaving the fundamental frequency exceed the first for-mant frequency. With rising fundamental frequency, F2of front vowels is lowered, while F2 of back vowels israised to a frequency just above the second spectrumpartial; F3 is lowered, and F4 is raised.
A commonly used articulatory trick for achievingthe increase of F1 with F0 is a widening of the jawopening [16.85]. The graphs of Fig. 16.34 show the jawopening of professional singers as a function of the fre-quency separation in semitones between F0 and the F1value that the singer used at low pitches. The graph re-ferring to the vowel [�] shows that most singers beganto widen their jaw opening when the F0 was about foursemitones below the normal F1 value. The lower graphof Fig. 16.34 shows the corresponding data for the vowel[�]. For this vowel, most subjects started to widen the jawopening when the fundamental was about four semitonesabove the normal value of F1. It is likely that below thispitch singers increase the first formant by other articula-tory means than the jaw opening. A plausible candidatein front vowels is the degree of vocal tract constriction;a reduced constriction increases the first formant. Manysinging teachers recommend their students to release thejaw or to give space to the tone; it seems likely that theacoustic target of these recommendations is to raise F1.
There are also other articulators that can be recruitedfor the purpose of raising F1. One is the lip opening. Byretracting the mouth corners, the vocal tract is short-ened; and hence the frequencies of the formants willincrease. The vocal tract can also be shortened by rais-ing the larynx, and some professional female singerstake advantage of this tool when singing at high pitches.
This principle of tuning formant frequencies depend-ing on F0 has been found in all singers who encounterthe situation that the normal value of the first formantis lower than their highest pitches. In fact, all singersexcept basses encounter this situation at least for some
PartE
16.4

The Human Voice in Speech and Singing 16.4 Articulatory Processes, Vowels and Consonants 693
100
80
60
40
20
0
–20
100
80
60
40
20
0
–20–20 0 20 40 60 80 100 120
100 200 300
3
2
1
kHz
400
100 200 300
3
2
1
kHz
u i
gu gi
[ε gu s]
[ε gi ]
Fig. 16.35 The universal phenomenon of coarticulation illustrated with articulatory and acoustic data on Swedish [ ].The influence of the following vowel extends throughout the articulation of the stop closure. There is no point in time atwhich a pure (context-free) sample of the [ ] could be obtained
vowels sung at high pitches. The benefit of these ar-rangements of the formant frequencies is an enormousincrease of sound level, gained by sheer resonance.
Vowel quality is determined mainly by F1 and F2,as mentioned. Therefore, one would expect drastic con-sequences regarding vowel intelligibility in these cases.However, the vowel quality of sustained vowels seemsto survive these pitch-dependent formant frequencychanges surprisingly well, except when F0 exceeds thepitch of F5 (about 700 Hz). Above that frequency noformant frequency combination seems to help, and be-low it, the vowel quality would not be better if normalformant frequencies were chosen. The amount of textintelligibility which occurs at very high pitches reliesalmost exclusively on the consonants surrounding thevowel. Thus, facing the choice between inaudible toneswith normal formant frequencies or audible tones withstrange vowel quality, singers probably make a wisechoice.
One of the major challenges both for applied andtheoretical speech research is the great variability of thespeech signal. Consider a given utterance as pronouncedby speakers of the same dialect. A few moments’ reflec-
tion will convince us that this utterance is certain to comein a large variety of physical shapes. Some variations re-flect the speaker’s age, gender, vocal anatomy as wellas emotional and physiological state. Others are stylis-tic and situational as exemplified by speaking clearlyin noisy environments, speaking formally in public, ad-dressing large audiences, chatting with a close friendor talking to oneself while trying to solve a problem.Style and situation make significant contributions to thevariety of acoustic waveforms that instantiate what welinguistically judge as the same utterance.
In phonetic experimentation investigators aim atkeeping all of these stylistic and situational factorsconstant. This goal tends to limit the scope of theresearch to a style labeled laboratory speech, whichconsists of test items that are chosen by the experi-menter and are typically read from a list. Despite themarked focus on this type of material, laboratory speechnonetheless presents several variability puzzles. We willmention two: segmental interaction, or coarticulation,and prosodic modulation. Both exemplify the ubiquitouscontext dependence of phonetic segments. First a fewremarks on coarticulation.
PartE
16.4

694 Part E Music, Speech, Electroacoustics
4000
3500
3000
2500
2000
1500
1000
500
025002000150010005000 25002000150010005000 25002000150010005000
F2 at vowel midpointF2 at vowel midpointF2 at vowel midpoint
F2 at Cons boundary
[bV]
F4
F3
F2[dV] [gV]
Front V Back V
Vowel midpoint
at Cons boundary
F4
F3
F2
Fig. 16.36 Coarticulation in [bV], [dV] and [gV] as reflected by measurements of F2, F3 and F4 onsets plotted againstan acoustic correlate of front back tongue movement, viz., F2 at the vowel midpoint
In Fig. 16.35 the phoneme [ ] occurs in two wordstaken from an X-ray film [16.79, 85] of a Swedishspeaker: [�� ��] and [�� ���]. In these words the first threephonemes correspond to the first three segments on thespectrogram: an initial [�] segment, the [ ] stop gap andthen the final vowel. So far, so good. However, if wewere to try to draw a vertical line on the spectrogram tomark the point in time where [�] ends and [ ] begins,or where [ ] ends and the final vowel begins, we wouldsoon realize that we have an impossible task. We wouldperhaps be able to detect formant movements in the [�]segment indicating that articulatory activity towards the[ ] had been initiated. However, that point in time oc-curs during the acoustic [�] segment. Similarly, we couldidentify the endpoint of the formant transitions follow-ing [ ] but that event occurs when the next segment, thefinal vowel, is already under way.
What we arrive at here is the classical conclusionthat strings of phonemes are not organized as beadson a necklace [16.91–93]. The acoustic correlates ofphonemes, the acoustic segments, are produced accord-ing to a motor schema that requires parallel activity inseveral articulatory channels and weaves the sequence
of phonemes into a smooth fabric of overlapping move-ments. We are talking about coarticulation, the overlapof articulatory gestures in space and time.
Not only does this universal of motor organizationgive rise to the segmentation problem, i. e., make it im-possible to chop up the time scale of the speech waveinto phoneme-sized chunks, it creates another dilemmaknown as the invariance issue. We can exemplify itby referring to Fig. 16.35 again and the arrows indi-cating the frequencies of F2 and F3 at the momentof [ ] release. With [��] following they are high infrequency. Next to [��] they are lower. What acousticattributes define the [ ] phoneme? How do we specifythe [ ] phoneme acoustically in a context-independentway?
The answer is that, because of coarticulation, wecannot provide an acoustic definition that is context in-dependent. There is no such thing as an acoustic puresample of a phoneme.
Articulatory observations confirm this account.There is no point in time where the shape of the tongueshows zero influence from the surrounding vowels. Thetracings at the top left of Fig. 16.35 show the tongue con-
PartE
16.4
The Human Voice in Speech and Singing 16.5 The Syllable 695
tours for [��] and [��] sampled at the vowel midpoints.The bottom left profiles show the tongue shapes at the[ ] release. The effect of the following vowel is readilyapparent.
So where do we look for the invariant phonetic corre-lates for [ ]? Work on articulatory modeling [16.49,94]indicates that, if there is such a thing as a single context-free target underlying the surface variants of [ ], it islikely to occur at a deeper level of speech production lo-cated before the motor commands for [ ] closure andfor the surrounding vowels blend.
This picture of speech production raises a numberof questions about speech perception that have beenaddressed by a large body of experimental work [16.95,96] but which will not be reviewed here.
It should be remarked though that, the segmenta-tion and invariance issues notwithstanding, the contextsensitivity of phonetic segments is systematic. As an il-lustration of that point Fig. 16.36 is presented. It showsaverage data on formant transitions that come from theSwedish speaker of Fig. 16.36 and Figs. 16.26–16.28.The measurements are from repetitions of CV test wordsin which the consonants were [�], [�] or [ ] and werecombined with [��] [��] [�] [a] [�] [��] and [��]. Formanttransition onsets for F2, F3 and F4 are plotted againstF2 midpoints for the vowels.
If the consonants are coarticulated with the vowelsfollowing, we would expect consonant onset patterns toco-vary with the vowel formant patterns. As shown byFig. 16.36 that is also what we find. Recall that, in thesection on articulatory modeling, we demonstrated thatF2 correlates strongly with the front–back movement ofthe tongue. This implies that, in an indirect way, the x-axis labeled ‘F2 at vowel midpoint’ can be said to rangefrom back to front. The same reasoning applies to F2onsets.
Figure 16.36 shows that the relationship between F2onsets and F2 at vowel midpoint is linear for bV anddV. For gV, the data points break up into back (lowF2) and front (high F2) groups. These straight lines– known as locus equations [16.97] – have receivedconsiderable attention since they provide a compactway of quantifying coarticulation. Data are availablefor several languages showing robustly that slopesand intercepts vary in systematic ways with places ofarticulation.
Furthermore, we see from Fig. 16.36 that lawful pat-terns are obtained also for F3 and F4 onsets. This makessense if we assume that vocal tract cavities are not com-pletely uncoupled and that hence, all formants – not onlyF2 – are to some extent influenced by where along thefront–back dimension the vowel is articulated.
16.5 The Syllable
A central unit in both speech and singing is the syllable.It resembles the phoneme in that it is hard to define butit can be described in a number of ways.
Linguists characterize it in terms of how vowels andconsonants pattern within it. The central portion, thenucleus, is normally a vowel. One or more consonantscan precede and/or follow forming the onset and thecoda respectively. The vowel/nucleus is always there;the onset and coda are optional.
Languages vary with respect to the way they com-bine consonants and vowels into syllables. Most of themfavor a frame with only two slots: the CV syllable. Oth-ers allow more-elaborated syllable structures with up tothree consonants initially and the mirror image in syl-lable final position. If there is also a length distinctionin the vowel and/or consonant system, syllables framescan become quite complex. A rich pattern with conso-nant clusters and phonological length usually impliesthat the language has a strong contrast between stressedand unstressed syllables.
In languages that allow consonant sequences, thereis a universal tendency for the segments to be seriallyordered on an articulatory continuum with the conso-nants compatible with the vowel’s greater jaw openingoccurring next to the vowel, e.g., [�] and [�], while thoseless compatible, e.g. [�], are recruited at the syllablemargins [16.98, 99]. In keeping with this observation,English and other languages use [���] as an initial, butnot final, cluster. The reverse sequence [���] occurs infinal, but not initial, position, cf. sprawl and harps.Traditionally and currently, this trend is explained interms of an auditory attribute of speech sounds, sonor-ity. The sonority principle [16.59] states that, as themost sonorous segments, vowels take the central nu-cleus position of the syllable and that the sonority of thesurrounding consonants must decrease to the left andto the right starting from the vowel. Recalling that thedegree of articulatory opening affects F1 which in turnaffects sound intensity, we realize that these articulatoryand auditory accounts are not incompatible. However,
PartE
16.5

696 Part E Music, Speech, Electroacoustics
the reason for the syllabic variations in sonority is artic-ulatory: the tendency for syllables to alternate close andopen articulations in a cyclical manner.
The syllable is also illuminated by a developmentalperspective. An important milestone of normal speechacquisition is canonical babbling. This type of vocal-ization makes its appearance sometime between 6–10months. It consists of sequences of CV-like events, e.g.,[��], [�a�a] [16.101–105]. The phonetic output ofdeaf infants differs from canonical babbling both quanti-tatively and quantitatively [16.106–108], suggesting thatauditory input from the ambient language is a prerequi-site for canonical babbling [16.109–112]. What babblingshares with adult speech is its “syllabic” organization,that is, the alternation of open and close articulations inwhich jaw movement is a major component [16.113].
As mentioned, the regular repetition of open-closevocal tract states gives rise to an amplitude modulationof the speech waveform. Vowels tend to show the highestamplitudes contrasting with the surrounding consonantswhich have various degrees of constriction and hencemore reduced amplitudes. At the acoustic boundary be-tween a consonant and a vowel, there is often an abruptrise in the amplitude envelope of the waveform.
When a Fourier analysis is performed on the wave-form envelope, a spectrum with primarily low, sub-audiofrequency components is obtained. This is to be expectedgiven the fact that amplitude envelopes vary slowly asa function of time. This representation is known asthe modulation spectrum [16.114]. It reflects recurringevents such as the amplitude changes at consonant-vowel boundaries. It provides an approximate record ofthe rhythmic pulsating stream of stressed and unstressedsyllables.
The time envelope may at first appear to be a rathercrude attribute of the signal. However, its perceptual im-portance should not be underestimated. Room acousticsand noise distort speech by modifying and destroying itsmodulation spectrum. The modulation transfer functionwas proposed by Houtgast and Steeneken as a measureof the effect of the auditorium on the speech signal andas a basis for an index, the speech transmission index(STI), used to predict speech intelligibility under dif-ferent types of reverberation and noise. The success ofthis approach tells us that the modulation spectrum, andhence the waveform envelope, contains information thatis crucial for robust speech perception [16.115]. Ex-perimental manipulation of the temporal envelope hasbeen performed by Drullman et al. [16.116, 117] whosework reinforces the conclusions reached by Houtgastand Steeneken.
There seems to be something special about the frontends of syllables. First, languages prefer CVs to VCs.Second, what children begin with is strings of CV-likepseudosyllables that emulate the syllable onsets of adultspeech. Third there is perceptually significant informa-tion for the listener in the initial dynamics of the syllable.Let us add another phenomenon to this list: the syllablebeat, or the syllable’s P-center [16.118, 119].
In reading poetry, or in singing, we have a very strongsense that the syllables are spoken/sung in accordancewith the rhythmic pattern of the meter. Native speak-ers agree more or less on how many syllables thereare in a word or a phrase. In making such judgments,they seem to experience syllables as unitary events.Although it may take several hundred milliseconds topronounce, subjectively a syllable appears to occur ata specific moment in time. It is this impression towhich the phonetic term syllable beat refers and thathas been studied experimentally in a sizable number ofpublications [16.120–126].
20
Percent occurrence
–300
10
0–200 –100 0 100 200 300 400
Temporal distribution of time markers (ms)
[str]
–300 –200 –100 0 100 200 300 400Location of segment boundaries relative to time marker (ms)
s
s
n
l
d
t
s
a
t r
t
d
[st]
[n]
[l]
[d]
[t]
[s]
n = 2095s = 20
Fig. 16.37 In Rapp [16.100] three male Swedish subjectswere asked to produce test words based on an [a����] framewith [�, �, �, �, �, ��, ���] as intervocalic segment(s). Theseitems were pronounced in synchrony with metronome beatspresented over headphones. The figure shows the tempo-ral distribution of the metronome beats (upper panel) inrelation to the average time location of acoustic segmentboundaries (lower panel)
PartE
16.5

The Human Voice in Speech and Singing 16.5 The Syllable 697
Rapp [16.100] asked three native speakers ofSwedish to produce random sets of test words built from[aC���] were the consonant C was selected from [�, �,�, �, �, ��, ���]. The instruction was to synchronize thestressed syllable with a metronome beat presented overearphones.
The results are summarized in Fig. 16.37. The x-axisrepresents distance in milliseconds from the point ofreference, the metronome beat. The top diagram showsthe total distribution of about 2000 time markers aroundthe mean. The lower graph indicates the relative locationof the major acoustic segment boundaries.
Several phonetic correlates have been proposed forthe syllable beat: some acoustic/auditory, others articu-latory. They all hover around the vowel onset, e.g., theamplitude envelope of a signal [16.127], rapid increasein energy in spectral bands [16.128,129] or the onset ofarticulatory movement towards the vowel [16.130].
Rapp’s data in Fig. 16.37 indicate that the mean beattime tends to fall close to the release or articulatoryopening in [�, �, �, �] but that it significantly precedesthe acoustic vowel onsets of [����], [���] and [��]. How-ever, when segment boundaries were arranged in relationto a fixed landmark on the F0 contour and vowel onsetswere measured relative to that landmark, the range ofvowel onsets was reduced. It is possible that the sylla-
Spoken Sung
some highway the rainbow upoverwhere some highway the rainbow upoverwhere
Fig. 16.38 Waveforms and spectrograms of the first few bars of Over the rainbow, spoken (left) and sung (right). Below:F0 traces in Hz. Vertical lines were drawn at time points corresponding to “vowel onsets” defined in terms of onset ofvoicing after a voiceless consonant, or the abrupt vocal tract opening following a consonant
ble beat may have its origin, not at the acoustic surface,nor at some kinematic level, but in a deeper motor con-trol process that coordinates and imposes coherence onrespiratory, phonatory and articulatory activity neededto produce a syllable.
Whatever the definitive explanation for the syllable’spsychological moment of occurrence will be, the sylla-ble beat provides a useful point of entry for attempts tounderstand how the control of rhythm and pitch worksin speech and singing. Figure 16.38 compares spectro-grams of the first few bars of Over the rainbow, spoken(left) and sung (right).
Vertical lines have been drawn at vowel onsets andpoints where articulators begin to move towards a moreopen configuration. The lines form an isochronous tem-poral pattern in the sung version which was performedat a regular rhythm. In the spoken example, they occurat intervals that seem more determined by the syllable’sdegree of prominence.
The subject reaches F0 targets at points near the beats(the vertical lines). From there target frequencies aremaintained at stationary values until shortly before it istime to go to the next pitch. Thus the F0 curve resemblesa step function with some smoothing applied to the steps.
On the other hand, the F0 contour for speech showsno such steady states. It makes few dramatic moves as it
PartE
16.5

698 Part E Music, Speech, Electroacoustics
7500
7000
6500
6000
5500
5000
4500
4000
3500
3000
2500
2000
1500
1000
500
00:39 0:40 0:41 0:42 0:43 0:44 0:45 0:46 0:47 0:48 0:49 0:50 0:51 0:52 0:53
Hz
Time
Die Ro se, die Li lie, die T au be, die So nne
Fig. 16.39 Spectrogram of Dietrich Fischer-Dieskau’s recording of song number 4 from Robert Schumann’s Dichterliebe,op. 48. The vertical bars mark the onset of the tones of the piano accompaniment. Note the almost perfect synchronybetween vowel onset and the piano. Note also the simultaneous appearance of high and low partials after the consonantsalso after the unvoiced /t/ in Taube
gradually drifts downward in frequency (the declinationeffect).
Figure 16.39 shows a typical example of classicalsinging, a spectrogram of a commercial recording ofDietrich Fischer-Dieskau’s rendering of the song “DieRose, die Lilie” from Robert Schumann’s Dichterliebe,op. 48. The vertical dashed lines show the onsets of thepiano accompaniment. The wavy patterns, often occur-ring somewhat after the vowel onset, reflect the vibrato.Apart from the vibrato undulation of the partials the gapsin the pattern of harmonics are quite apparent. At thesepoints we see the effect of the more constricted artic-
ulations for the consonants. Note the rapid and crisplysynchronous amplitude rise in all partials at the endof the consonant segments, also after unvoiced conso-nants, e.g. the /t/ in Taube. These rises are synchronizedwith the onset of the piano accompaniment tones, thusdemonstrating that in singing a beat is marked by thevowel. The simultaneous appearing of low and highpartials seems to belong to the characteristics of clas-sical singing as opposed to speech, where the higherpartials often arrive with a slight delay after unvoicedconsonants. As mentioned before, such consonants areproduced with abduction of the vocal folds. To generate
PartE
16.5

The Human Voice in Speech and Singing 16.6 Rhythm and Timing 699
T0
Utterance command
T3
Utterancecontrol
mechanism
T1
Accent command
T2
Accentcontrol
mechanism
Gu(t)
Ga(t)
Utterance control
Accent control
Glottalcontrol Glottal
oscilllationmechanism Fundamental
frequency
tTime
1n F0 (t)
Fig. 16.40 A quantitative approach to synthesizing F0 contours by rule (After Fujisaki [16.131]). The framework shownhere is an example of the so-called superposition models which generate F0 patterns by adding strongly damped responsesto input step function target commands for phrase and accents
also high partials in this context, the vocal folds need toclose the glottis at the very first vibratory cycle at thevowel onset. A potential benefit of this might be thatthis enhances the higher formants which are importantto text intelligibility.
Several quantitative frameworks have been pro-posed for generating speech F0 contours by rule (foroverview see Frid [16.132]). A subgroup of these hasbeen called superposition models [16.131,133]. A char-acteristic of such models is that they decompose theF0 curve into separate phrase and accent components.The accent commands are F0 step or impulse func-tions temporally linked to the syllables carrying stress.Accent pulses are superimposed on the phrase compo-nent. For a declarative sentence, the phrase componentis a falling F0 contour produced from rectangular stepfunction hat patterns [16.134]. The phrase and accentcommands are passed through critically damped filtersto convert their sum into the smoothly varying output
F0 contour. An example of this approach is shown inFig. 16.40 [16.131].
The last few figures suggest that the F0 patterns ofsinging and speech may be rather different if comparedin terms of the raw F0 curves. However, the superposi-tion models suggest that speech F0 contours have charac-teristics in part attributable to the passive response char-acteristics of the neuro-mechanical system that producesthem, and in part due to active control signals. These con-trol commands take the form of stepwise changes, someof short, others of longer duration. This representationis not unlike the sequence of F0 targets of a melody.
The implication of this analysis is that F0 is con-trolled in similar ways in speech and singing in the sensethat both are based on sequences of underlying steady-state targets. On the other hand, a significant differenceis that in singing high accuracy in attainment of acous-tic target frequencies is required whereas in speech suchdemands are relaxed and smoothing is stronger.
16.6 Rhythm and Timing
A striking characteristic of a foreign language is itsrhythm. Phoneticians distinguish between stress-timedand syllable-timed languages. English, Russian, Arabicand Thai are placed in the first group [16.135]. French,Spanish, Greek, Italian, Yoruba and Telugu are examplesof the second.
Stress timing means that stressed syllables recur atapproximately equal intervals. For instance, it is pos-sible to say “in ENGlish STRESses reCUR at EQualINtervals”, spacing the stressed syllables evenly in timeand without sounding too unnatural. Stress increasessyllable duration. In case several unstressed syllables
occur in between stresses they are expected to undergocompensatory shortening. Syllable, or machine-gun,timing [16.136] implies that syllables recur at approxi-mately equal intervals. In the first case it is the stressesthat are isochronous, in the second the syllables.
To what extent are speech rhythms explicitly con-trolled by the speaker? To what extent are theyfortuitous by-products of other factors? Does acquiringa new language involve learning new rhythmic targetpatterns?
The answer depends on how speech is defined.In the reading of poetry and nursery rhymes it is
PartE
16.6

700 Part E Music, Speech, Electroacoustics
clear that an external target, viz. the metric pattern,is a key determinant of how syllables are produced.Similarly, the groupings and the pausing in narrativeprose, as read by a professional actor, can exhibit ex-trinsic rhythmic stylization compared with unscriptedspeech [16.137].
Dauer [16.138] points the way towards addressingsuch issues presenting statistics on the most frequentlyoccurring syllable structures in English, Spanish andFrench. In Spanish and French, syllables were foundto be predominantly open, i. e. ending with a vowel,whereas English showed a preference for closed sylla-bles, i. e. ending with a consonant, especially in stressedsyllables. Duration measurements made for Englishand Thai (stress-timed) and Greek, Spanish and Ital-ian (syllable-timed) indicated that the duration of theinterstress intervals grew at the same constant rate asa function of the number of syllables between theinterstress intervals. In other words, no durational ev-idence was found to support the distinction betweenstress timing and syllable timing. How do we squarethat finding with the widely shared impression thatsome languages do indeed sound stress-timed and otherssyllable-timed?
Dauer [16.138, p. 55] concludes her study by statingthat: “ . . . the rhythmic differences we feel to exist be-tween languages such as English and Spanish are morea result of phonological, phonetic, lexical and syntacticfacts about that language than any attempt on the partof the speaker to equalize interstress or intersyllableintervals.”
It is clear that speakers are certainly capable of im-posing a rhythmic template in the serial read-out ofsyllables. But do they put such templates in play alsowhen they speak spontaneously? According to Dauerand others [16.139, 140] rhythm is not normally anexplicitly controlled variable. It is better seen as an emer-gent product of interaction among the choices languagesmake (and do not make) in building their syllables:e.g., from open versus closed syllable structures, heavyversus weak clusters, length distinctions and strongstressed/unstressed contrast. We thus learn that the dis-tinction between syllable timing and stress timing maybe a useful descriptive term but should primarily be ap-plied to the phonetic output, more seldom to its inputcontrol.
Do speech rhythms carry over into music? In otherwords, would music composed by speakers of syllable-timed or stress-timed languages also be syllable timed orstress timed? The question has been addressed [16.141,142] and some preliminary evidence has been reported.
There is more to speech timing than what happensinside the syllable. Processes at the word and phraselevels also influence the time intervals between syllables.Consider the English words digest, insult and pervert. Asverbs their stress pattern can be described as a sequenceof weak–strong syllables. As nouns the order is reversed:strong–weak. The syllables are the same but changingthe word’s stress contour (the lexical stress) affects theirtiming.
The word length effect has been reported for severallanguages [16.58, 143]. It refers to the tendency for thestressed vowel of the word to shorten as more syllablesare appended, cf. English speed, speedy, speedily. InLehiste’s formulation: “It appears that in some languagesthe word as a whole has a certain duration that tendsto remain relatively constant, and if the word containsa greater number of segmental sounds, the duration ofthe segmental sounds decreases as their number in theword increases.”
At the phrase level we find that rhythmic patternscan be used to signal differences in syntactic structure.Compare:
1. The 2000-year-old skeletons,2. The two 1000-year-old skeletons.
The phrases contain syllables with identical phoneticcontent but are clearly timed differently. The differenceis linked to that fact that in (1) 2000-year-old formsa single unit, whereas in (2) two 1000-year-old consistsof two constituents.
A further example is:
3. Johan greeted the girl with the flowers.
Hearing this utterance in a specific context a listenermight not find it ambiguous. But it has two interpreta-tions: (a) either Johan greeted the girl who was carryingflowers, or (b) he used the flowers to greet her. If spo-ken clearly to disambiguate, the speaker is likely toprovide temporal cues in the form of shortening thesyllables within each syntactic group to signal the co-herence of the constituent syllables (cf. the word lengtheffect above) and to introduce a short pause betweenthe two groups. There would be a lengthening of thelast syllable before the pause and of the utterance-finalsyllable.
Version (a) can be represented as
4. [Johan greeted] # [the girl with the flowers].
In (b) the grouping is
5. [Johan greeted the girl] # [with the flowers].
PartE
16.6
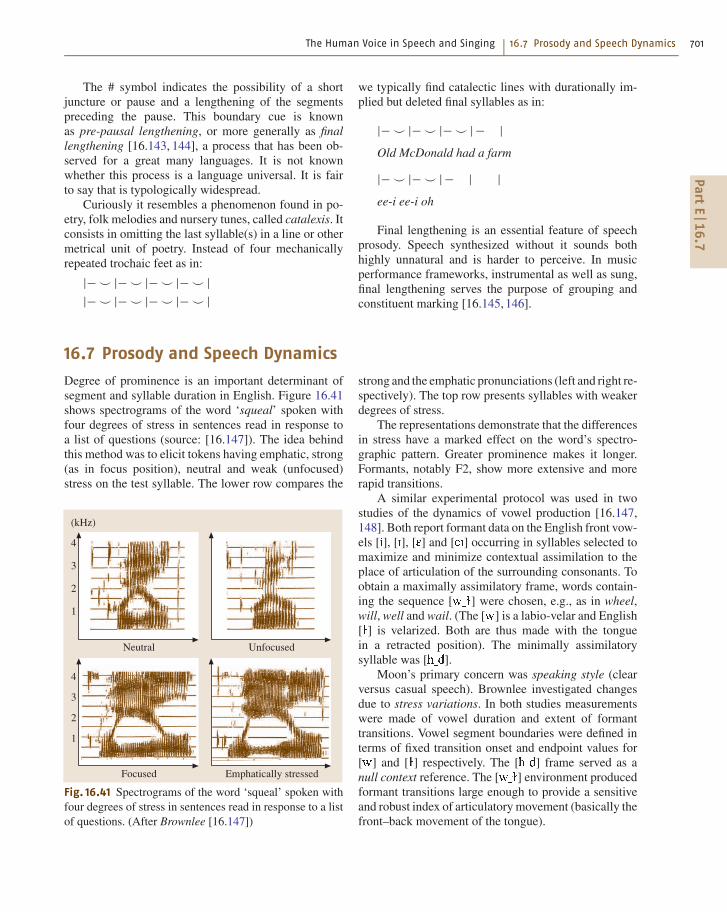
The Human Voice in Speech and Singing 16.7 Prosody and Speech Dynamics 701
The # symbol indicates the possibility of a shortjuncture or pause and a lengthening of the segmentspreceding the pause. This boundary cue is knownas pre-pausal lengthening, or more generally as finallengthening [16.143, 144], a process that has been ob-served for a great many languages. It is not knownwhether this process is a language universal. It is fairto say that is typologically widespread.
Curiously it resembles a phenomenon found in po-etry, folk melodies and nursery tunes, called catalexis. Itconsists in omitting the last syllable(s) in a line or othermetrical unit of poetry. Instead of four mechanicallyrepeated trochaic feet as in:
|− � |− � |− � |− � ||− � |− � |− � |− � |
we typically find catalectic lines with durationally im-plied but deleted final syllables as in:
|− � |− � |− � |− |Old McDonald had a farm
|− � |− � |− | |ee-i ee-i oh
Final lengthening is an essential feature of speechprosody. Speech synthesized without it sounds bothhighly unnatural and is harder to perceive. In musicperformance frameworks, instrumental as well as sung,final lengthening serves the purpose of grouping andconstituent marking [16.145, 146].
16.7 Prosody and Speech Dynamics
Degree of prominence is an important determinant ofsegment and syllable duration in English. Figure 16.41shows spectrograms of the word ‘squeal’ spoken withfour degrees of stress in sentences read in response toa list of questions (source: [16.147]). The idea behindthis method was to elicit tokens having emphatic, strong(as in focus position), neutral and weak (unfocused)stress on the test syllable. The lower row compares the
4
3
2
1
Neutral
4
3
2
1
Unfocused
Focused Emphatically stressed
(kHz)
Fig. 16.41 Spectrograms of the word ‘squeal’ spoken withfour degrees of stress in sentences read in response to a listof questions. (After Brownlee [16.147])
strong and the emphatic pronunciations (left and right re-spectively). The top row presents syllables with weakerdegrees of stress.
The representations demonstrate that the differencesin stress have a marked effect on the word’s spectro-graphic pattern. Greater prominence makes it longer.Formants, notably F2, show more extensive and morerapid transitions.
A similar experimental protocol was used in twostudies of the dynamics of vowel production [16.147,148]. Both report formant data on the English front vow-els [�], [�], [�] and [��] occurring in syllables selected tomaximize and minimize contextual assimilation to theplace of articulation of the surrounding consonants. Toobtain a maximally assimilatory frame, words contain-ing the sequence [��] were chosen, e.g., as in wheel,will, well and wail. (The [�] is a labio-velar and English[] is velarized. Both are thus made with the tonguein a retracted position). The minimally assimilatorysyllable was [���].
Moon’s primary concern was speaking style (clearversus casual speech). Brownlee investigated changesdue to stress variations. In both studies measurementswere made of vowel duration and extent of formanttransitions. Vowel segment boundaries were defined interms of fixed transition onset and endpoint values for[�] and [] respectively. The [���] frame served as anull context reference. The [��] environment producedformant transitions large enough to provide a sensitiveand robust index of articulatory movement (basically thefront–back movement of the tongue).
PartE
16.7

702 Part E Music, Speech, Electroacoustics
3000
2750
2500
2250
2000
1750
1500
1250
10001600 20 40 60 80 100 120 140
Frequency of F2 (Hz)
Vowel duration (ms)
Focused
Neutral/weak stress
Emphatic
Null context
Fig. 16.42 Measurements of F2 as function of vowel du-ration from tokens of [�] in the word ‘squeal’ spoken bya male subject under four conditions of stress: emphaticallystressed, focused, neutral stress and weak stress (out of fo-cus). Filled circles pertain to the individual measurementsfrom all the four stress conditions. The dashed horizontalline, is the average F2 value of citation form productions of[���]. The averages for the four stress conditions are indi-cated by the open squares. As duration increases – whichis approximately correlated with increasing stress – thesquare symbols are seen to move up along the smooth curveimplying decreasing undershoot. (After Brownlee [16.147])
Figure 16.42 presents measurements of F2 and vowelduration from tokens of [�] in the word ‘squeal’ spo-ken by a male subject under four conditions of stress:emphatically stressed, focused, neutral stress and weakstress (out of focus). The subject was helped to pro-duce the appropriate stress in the right place by readinga question before each test sentence.
Filled circles pertain to individual measurementspooled for all stress conditions. The points form a coher-ent cluster which is fairly well captured by an exponen-tial curve. The asymptote is the dashed horizontal line,i. e., the average F2 value of the [���] data for [�]. Theaverages for the stress conditions are indicated by the un-filled squares. They are seen to move up along the curvewith increasing stress (equivalently, vowel duration).
To understand the articulatory processes underlyingthe dynamics of vowel production it is useful to adopt
a biomechanical perspective. In the [��] test words thetongue body starts from a posterior position in [�] andmoves towards a vowel target located in the front re-gion of the vocal tract, e.g., [�], [�], [�] or [�]. Thenit returns to a back configuration for the dark []. Atshort vowel durations there is not enough time for thevowel gesture to be completed. As a result, the F2 move-ment misses the reference target by several hundred Hz.Note that in unstressed tokens the approach to targetis off by almost an octave. As the syllable is spokenwith more stress, and the vowel accordingly gets longer,the F2 transition falls short to a lesser degree. What isillustrated here is the phenomenon known as formantundershoot [16.149, 150].
Formant undershoot has received a fair amount of at-tention in the literature [16.151–155]. It is generally seenas an expression of the sluggish response characteristicsof the speech production system. The term sluggish heredescribes both neural delays and mechanical time con-stants. The response to the neural commands for a givenmovement is not instantaneous. It takes time for neuralimpulses to be transformed into muscular contractionsand it takes time for the tongue, the jaw and other artic-ulatory structures to respond mechanically to the forcesgenerated by those contractions. In other words, severalstages of filtering take place between control signals andthe unfolding of the movements. It is this filtering thatmakes the articulators sluggish. When commands forsuccessive phonemes arrive faster than the articulatorysystems are able to respond, the output is a set of in-complete movements. There is undershoot and failure toreach spatial, and thus also acoustic, targets.
However, biomechanics tells us that, in principle,it should be possible to compensate for system char-acteristics by applying greater force to the articulatorsthereby speeding up movements and improving target at-tainment [16.156]. Such considerations make us expectthat, in speech movement dynamics, a given trajectoryis shaped by
1. the distance between successive articulatory goals(the extent of movement);
2. articulatory effort (input force); and3. duration (the time available to execute the move-
ment).
The data of Brownlee are compatible with sucha mechanism in that the stress-dependent undershoot ob-served is likely to be a joint consequence of: (1) the largedistances between back and front targets; (2) the stressdifferences corresponding to variations in articulatoryeffort; and (3) durational limitations.
PartE
16.7

The Human Voice in Speech and Singing 16.8 Control of Sound in Speech and Singing 703
2500
2000
1500
1000
500
0
0
2500
2000
1500
1000
500
0100 200 300 0 100 200 300
Second formant frequency (Hz)
Vowel duration (ms)
[w]
Ref
i
Clear
Casual
[w]
[w]ε e
[w]
Ref
RefRef
Fig. 16.43 Measurements F2 as function of vowel durationfor five male subjects’ casual citation-form style pronuncia-tion of the words wheel, wheeling, Wheelingham, will, will-ing, willingly and for their pronunciation of the same wordswhen asked to say them clearly in an overarticulated way.Casual style is represented by the solid circles, clear speechby open circles. The frequency of F2 in [�] is indicated bythe arrows at 600 Hz. The mean F2 for the [���] data isentered as dashed horizontal lines. (After [16.157], Fig. 4)
The three factors – movement extent, effort and du-ration – are clearly demonstrated in Moon’s research onclear and casual speech. As mentioned, Moon’s test syl-lables were the same as Brownlee’s. He varied speakingstyle while keeping stress constant. This was achievedby taking advantage of the word-length effect.The seg-ment strings [���], [���], [���] and [���] were usedas the first main-stressed syllable in mono-, bi- and tri-
syllabic words to produce items such as wheel, wheeling,Wheelingham, will, willing, willingly, etc.
In the first part of his experiment, five male subjectswere asked to produce these words in casual citation-form style. In the second section the instruction wasto say them clearly in an overarticulated way. Forthe citation-form pronunciation the results replicatedpreviously observed facts in that: (a) all subjects exhib-ited duration-dependent formant undershoot, and (b) themagnitude of this effect varied in proportion to the ex-tent of the [�]–[vowel] transition. In the clear style,undershoot effects were reduced. The mechanism bywhich this was achieved varied somewhat from subjectto subject. It involved combinations of increased vowelduration and more rapid and more extensive formanttransitions. Figure 16.43 shows the response of one ofthe subjects to the two tasks [16.157].
Casual style is represented by the solid circles, clearspeech by open circles. The frequency of F2 in [�] isindicated by the arrows at 600 Hz. The mean F2 for the[���] data is entered as dashed horizontal lines.
The solid points show duration-dependent under-shoot effects in relation to the reference values for the[���] environment. The open circles, on the other hand,overshoot those values suggesting that this talker usedmore extreme F2 targets for the clear condition. The cen-ter of gravity of the open circles is shifted to the rightfor all four vowels showing that clear forms were longerthan citation forms. Accordingly, this is a subject whoused all three methods to decrease undershoot: clear pro-nunciations exhibited consistently more extreme targets(F2 higher), longer durations and more rapid formantmovements.
These results demonstrate that duration and contextare not the only determinants of vowel reduction since,for any given duration, the talker is free to vary the degreeof undershoot by choosing to articulate more forcefully(as in overarticulated hyperspeech) or in a more relaxedmanner (as in casual hypospeech). Taken together, thestudies by Moon and Brownlee suggest that the dy-namics of articulatory movement, and thus of formanttransitions, are significantly constrained by three factors:extent of movement, articulatory effort and duration.
16.8 Control of Sound in Speech and Singing
When we perform an action – walk, run, or reach for andmanipulate objects – our motor systems are faced withthe fact that the contexts under which movements are
made are never exactly the same. They change signifi-cantly from one situation to the next. Nonetheless, motorsystems adapt effortlessly to the continually changing
PartE
16.8

704 Part E Music, Speech, Electroacoustics
conditions presumably because, during evolution, theywere shaped by the need to cope with unforeseen eventsand obstacles [16.158]. Their default mode of operationis compensatory [16.159].
Handwriting provides a good illustration of this abil-ity. A familiar fact is that it does not matter if somethingis written on the blackboard or on a piece of paper.The characteristic features of someone’s handwriting arenevertheless easily recognized. Different sets of musclesare recruited and the size of the letters is different buttheir shapes remain basically similar. What this observa-tion tells us is that movements are not specified in termsof fixed set of muscles and constant contraction pat-terns. They are recruited in functionally defined groups,coordinative structures [16.160]. They are planned andexecuted in an external coordinate space, in other wordsin relation to the 3-D world in which they occur soas to attain goals defined outside the motor system it-self. The literature on motor mechanisms teaches usthat voluntary movements are prospectively organizedor future-oriented.
Speech and singing provide numerous examples ofthis output-oriented mode of motor control [16.161–163]. Earlier in the chapter we pointed out that, in up-right position, the diaphragm and adjacent structuresare influenced by gravity and tend to be pulled down,thereby causing the volume of the thoracic cavity toincrease. In this position, gravity contributes to the in-spiratory forces. By contrast, in the supine position, thediaphragm tends to get pushed up into the rib cage,which promotes expiration [16.1, p. 40].
Sundberg et al. [16.164] investigated the effect of up-right and supine positions in two baritone singers usingsynchronous records of esophageal and gastric pressure,EMG from inspiratory and expiratory muscles, lung vol-ume and sound. Reorganization of respiratory activitywas found and was interpreted as compensation for thedifferent mechanical situations arising from the uprightand supine conditions.
This finding is closely related to what we knowabout breathing during speech. As mentioned above(Fig. 16.6), the Ps tends to stay fairly constant for anygiven vocal effort. It is known that this result is achievedby tuning the balance between inspiratory and expi-ratory muscles. When the lungs are expanded so thatthe effect of elastic recoil creates a significant expi-ration force, inspiratory muscles predominate to puta brake on that force. For reduced lung volumes thesituation is the opposite. The effect of elastic recoil israther to increase lung volume. Accordingly, the mus-cle recruitment needed to maintain Ps is expected to
be primarily expiratory. That is indeed what the datashow [16.8, 66, 165].
The bite-block paradigm offers another speech ex-ample. In one set of experiments [16.166] subjects wereinstructed to pronounce syllables consisting only ofa long vowel under two conditions: first normally, thenwith a bite block (BB) between the teeth. The subjectsall non-phoneticians were told to try to sound as normalas possible despite the BB. No practice was allowed.The purpose of the BB was to create an abnormallylarge jaw opening for close vowels such as [�] and [�].It was argued that, if no tongue compensation occurred,this large opening would drastically change the areafunction of the close vowels and disrupt their formantpatterns. In other words, the question investigated waswhether the subjects were able to sound normal despitethe BB.
Acoustic recordings were made and formant patterndata were collected for comparisons between conditions,vowels and subjects. The analyses demonstrated clearlythat subjects were indeed able to produce normal sound-ing vowels in spite of the BB. At the moment of thefirst glottal pulse formant patters were well within thenormal ranges of variation.
In a follow-up X-ray investigation [16.167] it wasfound that compensatory productions of [�] and [�] weremade with super-palatal and super-velar tongue shapes.In other words, tongue bodies were raised high abovenormal positions so as to approximate the normal cross-sectional area functions for the test vowels.
Speech and singing share a lot of features but signif-icant differences are brought to light when we considerwhat the goals of the two behaviors are.
It is more than 50 years since the sound spectro-graph became commercially available [16.91]. In thistime we have learned from visible speech displays andother records that the relation between phonetic unitsand the acoustic signal is extremely complex [16.168].The lesson taught is that invariant correlates of linguis-tic categories are not readily apparent in the speechwave [16.169]. In the preceding discussion we touchedon some of the sources of this variability: coarticula-tion, reduction and elaboration, prosodic modulation,stylistic, situational and speaker-specific characteristics.From this vantage point it is astonishing to note that,even under noisy conditions, speech communication isa reliable and robust process. How is this remarkablefact to be accounted for?
In response to this problem a number of ideas and ex-planatory frameworks have been proposed. For instance,it has been suggested that acoustic invariants are rela-
PartE
16.8

The Human Voice in Speech and Singing 16.8 Control of Sound in Speech and Singing 705
tional rather than absolute (a la tone intervals defined asfrequency ratios).
Speech is rather a set of movements made audiblethan a set of sounds produced by movements [16.14,p. 33].
In keeping with this classical statement, many inves-tigators have argued that speech entities are to be foundat some upstream speech production level and should bedefined as gestures [16.170–173].
At the opposite end, we find researchers (e.g.,Perkell [16.163]) who endorse Roman Jakobson’s viewwhich, in the search for units gives primacy to the per-ceptual representation of speech sounds. To Jakobsonthe stages of the speech chain form an “ . . . operationalhierarchy of levels of decreasing pertinence: perceptual,aural, acoustical and articulatory (the latter carrying nodirect information to the receiver).” [16.174]
These viewpoints appear to conflict and do indeeddivide the field into those who see speech as a mo-toric code (the gesturalist camp) and those who maintainthat it is primarily shaped by perceptual processes (thelistener-oriented school).
There is a great deal of experimental evidence forboth sides, suggesting that this dilemma is not aneither–or issue but that both parties offer valuable com-plementary perspectives.
A different approach is taken by the H & H (Hy-per and Hypo) theory [16.175, 176]. This account isdeveloped from the following key observations aboutspeaker–listener interaction:
1. Speech perception is always a product of signalinformation and listener knowledge;
2. Speech production is adaptively organized.
Here is an experiment that illustrates the first claimabout perceptual processing. Two groups of subjectslisten to a sequence of two phrases: a question fol-lowed by an answer. The subject groups hear differentquestions but a single physically identical reply. Thesubjects’ task is to say how many words the replycontains.
The point made here is that Group 1 subjects hear[���� �a��] as “less than five”. Those in Group 2 in-terpret it as “lesson five”. The first group’s responseis “three words”, and the answer of the second is“two words”. This is despite the fact that physically the[���� �a��] stimulus is exactly the same. The syllabic [�]signals the word than in one case and the syllable –on inthe other. Looking for the invariant correlates of the ini-tial consonant than is doomed to failure because of thesevere degree of reduction.
To proponents of H & H theory this is not an iso-lated case. This is the way that perception in generalworks. The speech percepts can never be raw records ofthe signal because listener knowledge will inevitably in-teract with the stimulus and will contribute to shapingthe percept.
Furthermore, H & H theory highlights the fact thatspoken messages show a non-uniform distribution ofinformation in that predictability varies from situationto situation, from word to word and from syllable tosyllable. Compare (a) and (b) below. What word is likelyto be represented by the gap?
1. “The next word is .”2. “A bird in the hand is worth two in the .”
Any word can be expected in (1) whereas in (2) thepredictability of the word “bush” is high.
H & H theory assumes that, while learning and us-ing their native language, speakers develop a sense ofthis informational dynamics. Introducing the abstractionof an ideal speaker, it proposes that the talker estimatesthe running contribution that signal-complementary in-formation (listener knowledge) will make during thecourse of the utterance and then tunes his articula-tory performance to the presumed short-term listenerneeds. Statistically, this type of behavior has the long-term consequence of distributing phonetic output formsalong a continuum with clear and elaborated forms(hyperspeech) at one end and casual and reduced pro-nunciations (hypospeech) at the other.
The implication for the invariance issue is that thetask of the speaker is not to encode linguistic units asphysical invariants, but to make sure that the signal at-tributes (of phonemes, syllables, words and phrases)carry discriminative power sufficient for successful lex-ical access. To make the same point in slightly differentterms, the task of the signal is not to embody phoneticpatterns of constancy but to provide missing information.
It is interesting to put this account of speechprocesses next to what we know about singing. Ex-perimental observations indicate that singing in tuneis not simply about invariant F0 targets. F0 is af-fected by the singer’s expressive performance [16.177]and by the tonal context in which a given note isembedded [16.178]. Certain deviations from nominaltarget frequencies are not unlike the coarticulation andundershoot effects ubiquitously present in speech. Ac-cordingly, with respect to frequency control, speakingand singing are qualitatively similar. However, quantita-tively, they differ drastically. Recall that in describing thedynamics of vowel reduction we noted that formant fre-
PartE
16.8

706 Part E Music, Speech, Electroacoustics
quencies can be displaced by as much as 50% from targetvalues. Clearly, a musician or singer with a comparableunder-/overshoot record would be recommended to em-bark on an alternative career, the margins of perceptualtolerance being much narrower for singing.
What accounts for this discrepancy in target attain-ment? Our short answer is that singing or playing out oftune is a bad thing. Where does this taboo come from?From consonance and harmony constraints. In simplifiedterms, an arbitrary sample of tonal music can be analyzedinto a sequence of chords. Its melodic line is a rhythmicand tonal elaboration of this harmonic structure. Statisti-cally, long prominent melody tones tend to attract chordnotes. Notes of less prominence typically interpolate
along scales in smaller intervals between the metricallyheavier chord notes. The notion of consonance goesa long way towards explaining why singing or playingout of tune is tabooed in music: hitting the right pitch isrequired by the consonance and harmony constraints ex-pected by the listener and historically presumably linkedwith a combination of the polyphony in our Westerntradition of music composition and the fact that mostof our music instruments produce tones with harmonicspectra. This implies that intervals departing too muchfrom just intonation will generate beats between simul-taneously sounding and only nearly coinciding partials,particularly if the fundamental frequencies are constant,lacking vibrato and flutter.
16.9 The Expressive Power of the Human Voice
The human voice is an extremely expressive instrumentboth when used for speech and for singing. By meansof subtle variations of timing and pitch contour speakersand singers add a substantial amount of expressivenessto the linguistic or musical content and we are quiteskilled in deciphering this information. Indeed a gooddeal of vocal artistry seems to lie in the artist’s skill inmaking nothing but such changes of pitch, timbre, loud-ness and timing that a listener can perceive as carryingsome meaning.
We perceive the extra-linguistic or expressive in-formation in speech and singing in various shapes.For example, we can interpret certain combinations ofacoustic characteristics in speech in terms of a smileor a particular forming of the lips on the face of thespeaker [16.179]. For example Fónagy [16.180] foundthat listeners were able to replicate rather accurately thefacial expression of speakers only by listening to theirvoices.
The emotive transforms in speech and singing seempartly similar and sometimes identical [16.181,182]. Fi-nal lengthening, mentioned above, uses the same codefor marking the end of a structural element, such asa sentence in speech or a phrase in sung and played mu-sic performance. Emphasis by delayed arrival is anotherexample, i. e., delaying an emphasized stressed sylla-ble or note by lengthening the unstressed syllable/notepreceding it [16.183].
The expressive potential of the human voice is in-deed enormous, and would transpire from the ubiquitoususe of the voice for the purpose of communication.Correct interpretation of the extra-linguistic content ofa spoken utterance is certainly important in our daily life,so we are skilled in deciphering vocal signals also alongthose dimensions. The importance of correct encod-ing of the extra-linguistic implies that speakers acquirea great skill in this respect. This skill would be the basicrequirement for vocal art, in singing as well as in acting.
References
16.1 T.J. Hixon: Respiratory Function in Speech and Song(Singular, San Diego 1991) pp. 1–54
16.2 A. L. Winkworth, P. J. Davis, E. Ellis, R. D. Adams:Variability and consistency in speech breathingduring reading: Lung volumes, speech inten-sity, and linguistic factors, JSHR 37, 535–556(1994)
16.3 M. Thomasson: From Air to Aria, Ph.D. Thesis (MusicAcoustics, KTH 2003)
16.4 B. Conrad, P. Schönle: Speech and respiration,Arch. Psychiat. Nervenkr. 226, 251–268 (1979)
16.5 M.H. Draper, P. Ladefoged, D. Whitteridge: Respi-ratory muscles in speech, J. Speech Hear. Disord. 2,16–27 (1959)
16.6 R. Netsell: Speech physiology. In: Normal aspects ofspeech, hearing, and language, ed. by P.D. Mini-fie, T.J. Hixon, P. Hixon, P. Williams (Prentice-Hall,Englewood Cliffs 1973) pp. 211–234
PartE
16

The Human Voice in Speech and Singing References 707
16.7 P. Ladefoged, M.H. Draper, D. Whitteridge: Sylla-bles and stress, Misc. Phonetica 3, 1–14 (1958)
16.8 P. Ladefoged: Speculations on the control ofspeech. In: A Figure of Speech: A Festschrift forJohn Laver, ed. by W.J. Hardcastle, J. MackenzieBeck (Lawrence Erlbaum, Mahwah 2005) pp. 3–21
16.9 T.J. Hixon, G. Weismer: Perspectives on the Edin-burgh study of speech breathing, J. Speech Hear.Disord. 38, 42–60 (1995)
16.10 S. Nooteboom: The prosody of speech: melody andrhythm. In: The Handbook of Phonetic Sciences, ed.by W.J. Hardcastle, J. Laver (Blackwell, Oxford 1997)pp. 640–673
16.11 M. Rothenberg: The breath-stream dynamics ofsimple-released-plosive production BibliothecaPhonetica 6 (Karger, Basel 1968)
16.12 D.H. Klatt, K.N. Stevens, J. Mead: Studies of articu-latory activity and airflow during speech, Ann. NYAcad. Sci. 155, 42–55 (1968)
16.13 J.J. Ohala: Respiratory activity in speech. In:Speech production and speech modeling, ed. byW.J. Hardcastle, A. Marchal (Dordrecht, Kluwer1990) pp. 23–53
16.14 R.H. Stetson: Motor Phonetics: A Study of Move-ments in Action (North Holland, Amsterdam 1951)
16.15 P. Ladefoged: Linguistic aspects of respiratory phe-nomena, Ann. NY Acad. Sci. 155, 141–151 (1968)
16.16 L.H. Kunze: Evaluation of methods of estimatingsub-glottal air pressure muscles, J. Speech Hear.Disord. 7, 151–164 (1964)
16.17 R. Leanderson, J. Sundberg, C. von Euler: Role ofthe diaphragmatic activity during singing: a studyof transdiaphragmatic pressures, J. Appl. Physiol.62, 259–270 (1987)
16.18 J. Sundberg, N. Elliot, P. Gramming, L. Nord: Short-term variation of subglottal pressure for expressivepurposes in singing and stage speech. A prelimi-nary investigation, J. Voice 7, 227–234 (1993)
16.19 J. Sundberg: Synthesis of singing, in Musica e Tech-nologia: Industria e Cultura per lo Sviluppo delMezzagiorno. In: Proceedings of a symposium inVenice, ed. by R. Favaro (Unicopli, Milan 1987)pp. 145–162
16.20 J. Sundberg: Synthesis of singing by rule. In: Cur-rent Directions in Computer Music Research, SystemDevelopment Foundation Benchmark Series, ed. byM. Mathews, J. Pierce (MIT, Cambridge 1989), 45-55& 401-403
16.21 J. Molinder: Akustiska och perceptuella skillnadermellan röstfacken lyrisk och dramatisk sopran, un-published thesis work (Lund Univ. Hospital, Dept ofLogopedics, Lund 1997)
16.22 T. Baer: Reflex activation of laryngeal muscles bysudden induced subglottal pressure changes, J.Acoust. Soc. Am. 65, 1271–1275 (1979)
16.23 T. Cleveland, J. Sundberg: Acoustic analyses ofthree male voices of different quality. In: SMAC83. Proceedings of the Stockholm Internat Music
Acoustics Conf, Vol. 1, ed. by A. Askenfelt, S. Fe-licetti, E. Jansson, J. Sundberg (Roy. Sw. Acad.Music, Stockholm 1985) pp. 143–156, No. 46:1
16.24 J. Sundberg, C. Johansson, H. Willbrand, C. Ytter-bergh: From sagittal distance to area, Phonetica44, 76–90 (1987)
16.25 I.R. Titze: Phonation threshold pressure: A missinglink in glottal aerodynamics, J. Acoust. Soc. Am. 91,2926–2935 (1992)
16.26 I.R. Titze: Principles of Voice Production (Prentice-Hall, Englewood Cliffs 1994)
16.27 G. Fant: Acoustic theory of speech production(Mouton, The Hague 1960)
16.28 K.N. Stevens: Acoustic Phonetics (MIT, Cambridge1998)
16.29 M. Hirano: Clinical Examination of Voice (Springer,New York 1981)
16.30 M. Rothenberg: A new inversefiltering techniquefor deriving the glottal air flow waveform duringvoicing, J. Acoust. Soc. Am. 53, 1632–1645 (1973)
16.31 G. Fant: The voice source – Acoustic modeling.In: STL/Quart. Prog. Status Rep. 4 (Royal Inst. ofTechnology, Stockholm 1982) pp. 28–48
16.32 C. Gobl: The voice source in speech communicationproduction and perception experiments involvinginverse filtering and synthesis. D.Sc. thesis (RoyalInst. of Technology (KTH), Stockholm 2003)
16.33 G. Fant, J. Liljencrants, Q. Lin: A four-parametermodel of glottal flow. In: STL/Quart. Prog. StatusRep. 4, Speech, Music and Hearing (Royal Inst. ofTechnology, Stockholm 1985) pp. 1–13
16.34 D.H. Klatt, L.C. Klatt: Analysis, synthesis and pere-ception of voice quality variations among femaleand male talkers, J. Acoust. Soc. Am. 87(2), 820–857(1990)
16.35 M. Ljungqvist, H. Fujisaki: A comparative study ofglottal waveform models. In: Technical Report ofthe Institute of Electronics and CommunicationsEngineers, Vol. EA85-58 (Institute of Electron-ics and Communications Engineers, Tokyo 1985)pp. 23–29
16.36 A.E. Rosenberg: Effect of glottal pulse shape on thequality of natural vowels, J. Acoust. Soc. Am. 49,583–598 (1971)
16.37 M. Rothenberg, R. Carlson, B. Granström,J. Lindqvist-Gauffin: A three- parameter voicesource for speech synthesis. In: Proceedings of theSpeech Communication Seminar 2, ed. by G. Fant(Almqvist & Wiksell, Stockholm 1975) pp. 235–243
16.38 K. Ishizaka, J.L. Flanagan: Synthesis of voicedsounds from a two-mass model of the vocal cords,The Bell Syst. Tech. J. 52, 1233–1268 (1972)
16.39 Liljencrants: Chapter A translating and rotatingmass model of the vocal folds. In: STL/Quart. Prog.Status Rep. 1, Speech, Music and Hearing (RoyalInst. of Technology, Stockholm 1991) pp. 1–18
16.40 A. Ní Chasaide, C. Gobl: Voice source variation.In: The Handbook of Phonetic Sciences, ed. by
PartE
16

708 Part E Music, Speech, Electroacoustics
W.J. Hardcastle, J. Laver (Blackwell, Oxford 1997)pp. 427–462
16.41 E.B. Holmberg, R.E. Hillman, J.S. Perkell: Glottalair flow and pressure measurements for loudnessvariation by male and female speakers, J. Acoust.Soc. Am. 84, 511–529 (1988)
16.42 J.S. Perkell, R.E. Hillman, E.B. Holmberg: Groupdifferences in measures of voice production andrevised values of maximum airflow declinationrate, J. Acoust. Soc. Am. 96, 695–698 (1994)
16.43 J. Gauffin, J. Sundberg: Spectral correlates of glot-tal voice source waveform characteristics, J. SpeechHear. Res. 32, 556–565 (1989)
16.44 J. Svec, H. Schutte, D. Miller: On pitch jumps be-tween chest and falsetto registers in voice: Data onliving and excised human larynges, J. Acoust. Soc.Am. 106, 1523–1531 (1999)
16.45 J. Sundberg, M. Andersson, C. Hultqvist: Effects ofsubglottal pressure variation on professional bari-tone singers voice sources, J. Acoust. Soc. Am. 105,1965–1971 (1999)
16.46 J. Sundberg, E. Fahlstedt, A. Morell: Effects on theglottal voice source of vocal loudness variation inuntrained female and male subjects, J. Acoust. Soc.Am. 117, 879–885 (2005)
16.47 P. Sjölander, J. Sundberg: Spectrum effects ofsubglottal pressure variation in professional bari-tone singers, J. Acoust. Soc. Am. 115, 1270–1273(2004)
16.48 P. Branderud, H. Lundberg, J. Lander, H. Djamshid-pey, I. Wäneland, D. Krull, B. Lindblom: X-rayanalyses of speech: Methodological aspects, Proc.of 11th Swedish Phonetics Conference (StockholmUniv., Stockholm 1996) pp. 168–171
16.49 B. Lindblom: A numerical model of coarticula-tion based on a Principal Components analysisof tongue shapes. In: Proc. 15th Int. Congressof the Phonetic Sciences, ed. by D. Recasens,M. Josep Solé, J. Romero (Universitat Autònoma deBarcelona, Barcelona 2003), CD-ROM
16.50 G.E. Peterson, H. Barney: Control methods used in astudy of the vowels, J. Acoust. Soc. Am. 24, 175–184(1952)
16.51 Hillenbrand et al.: Acoustic characteristics of Amer-ican English vowels, J. Acoust. Soc. Am. 97(5),3099–3111 (1995)
16.52 G. Fant: Analysis and synthesis of speech processes.In: Manual of Phonetics, ed. by B. Malmberg(North-Holland, Amsterdam 1968) pp. 173–277
16.53 G. Fant: Formant bandwidth data. In: STL/Quart.Prog. Status Rep. 7 (Royal Inst. of Technology,Stockholm 1962) pp. 1–3
16.54 G. Fant: Vocal tract wall effects, losses, and res-onance bandwidths. In: STL/Quart. Prog. StatusRep. 2-3 (Royal Inst. of Technology, Stockholm 1972)pp. 173–277
16.55 A.S. House, K.N. Stevens: Estimation of formantbandwidths from measurements of transient re-
sponse of the vocal tract, J. Speech Hear. Disord. 1,309–315 (1958)
16.56 O. Fujimura, J. Lindqvist: Sweep-tone measure-ments of vocal-tract characteristics, J. Acoust. Soc.Am. 49, 541–558 (1971)
16.57 I. Lehiste, G.E. Peterson: Vowel amplitude andphonemic stress in American English, J. Acoust. Soc.Am. 3, 428–435 (1959)
16.58 I. Lehiste: Suprasegmentals (MIT Press, Cambridge1970)
16.59 O. Jespersen: Lehrbuch der Phonetik (Teubner,Leipzig 1926)
16.60 T. Bartholomew: A physical definition of good voicequality in the male voice, J. Acoust. Soc. Am. 6,25–33 (1934)
16.61 J. Sundberg: Production and function of the singingformant. In: Report of the eleventh congressCopenhagen 1972 (Proceedings of the 11th interna-tional congress of musicology), ed. by H. Glahn,S. Sörensen, P. Ryom (Wilhelm Hansen, Copen-hagen 1972) pp. 679–686
16.62 J. Sundberg: Articulatory interpretation of the’singing formant’, J. Acoust. Soc. Am. 55, 838–844(1974)
16.63 J. Sundberg: Level and center frequency of thesinger´s formant, J. Voice. 15, 176–186 (2001)
16.64 G. Berndtsson, J. Sundberg: Perceptual significanceof the center frequency of the singers formant,Scand. J. Logopedics Phoniatrics 20, 35–41 (1995)
16.65 L. Dmitriev, A. Kiselev: Relationship between theformant structure of different types of singingvoices and the dimension of supraglottal cavities,Fol. Phoniat. 31, 238–41 (1979)
16.66 P. Ladefoged: Three areas of experimental phonet-ics (Oxford Univ. Press, London 1967)
16.67 J. Barnes, P. Davis, J. Oates, J. Chapman: The re-lationship between professional operatic sopranovoice and high range spectral energy, J. Acoust.Soc. Am. 116, 530–538 (2004)
16.68 M. Nordenberg, J. Sundberg: Effect on LTAS on vocalloudness variation, Logopedics Phoniatrics Vocol-ogy 29, 183–191 (2004)
16.69 R. Weiss, W.S. Brown, J. Morris: Singer’s formant insopranos: Fact or fiction, J. Voice 15, 457–468 (2001)
16.70 J.M. Heinz, K.N. Stevens: On the relations be-tween lateral cineradiographs, area functions,and acoustics of speech. In: Proc. Fourth Int.Congress on Acoustics, Vol. 1a (1965), paperA44
16.71 C. Johansson, J. Sundberg, H. Willbrand: X-raystudy of articulation and formant frequencies intwo female singers. In: Proc. of Stockholm MusicAcoustics Conference 1983 (SMAC 83), Vol. 46(1), ed.by A. Askenfelt, S. Felicetti, E. Jansson, J Sundberg(Kgl. Musikaliska Akad., Stockholm 1985) pp. 203–218
16.72 T. Baer, J.C. Gore, L.C. Gracco, P. Nye: Analysis ofvocal tract shape and dimensions using magnetic
PartE
16

The Human Voice in Speech and Singing References 709
resonance imaging: Vowels, J. Acoust. Soc. Am.90(2), 799–828 (1991)
16.73 D. Demolin, M. George, V. Lecuit, T. Metens,A. Soquet: Détermination par IRM de l’ouverturedu velum des voyelles nasales du français. In:Actes des XXièmes Journées d’Études sur la Parole(1996)
16.74 A. Foldvik, K. Kristiansen, J. Kvaerness, A. Torp,H. Torp: Three-dimensional ultrasound and mag-netic resonance imaging: a new dimension inphonetic research (Proc. Fut. Congress PhoneticScience Stockholm Univ., Stockholm 1995), Vol. 4,46-49
16.75 B.H. Story, I.R. Titze, E.A. Hoffman: Vocal tractarea functions from magnetic resonance imaging,J. Acoust. Soc. Am. 100, 537–554 (1996)
16.76 O. Engwall: Talking tongues, D.Sc. thesis (RoyalInstitute of Technology (KTH), Stockholm 2002)
16.77 B. Lindblom, J. Sundberg: Acoustical consequencesof lip, tongue, jaw and larynx movement, J. Acoust.Soc. Am. 50, 1166–1179 (1971), also in Papers inSpeech Communication: Speech Production, ed. byR.D. Kent, B.S. Atal, J.L. Miller (Acoust. Soc. Am.,New York 1991) pp.329-342
16.78 J. Stark, B. Lindblom, J. Sundberg: APEX - anarticulatory synthesis model for experimentaland computational studies of speech produc-tion. In: Fonetik 96: Papers presented at theSwedish Phonetics Conference TMH-QPSR 2/1996(Royal Institute of Technology, Stockholm 1996)pp. 45–48
16.79 J. Stark, C. Ericsdotter, B. Lindblom, J. Sundberg:Using X-ray data to calibrate the APEX the synthe-sis. In: Fonetik 98: Papers presented at the SwedishPhonetics Conference (Stockholm Univ., Stockholm1998)
16.80 J. Stark, C. Ericsdotter, P. Branderud, J. Sundberg,H.-J. Lundberg, J. Lander: The APEX model as atool in the specification of speaker-specific ar-ticulatory behavior. In: Proc. 14th Int. Congressof the Phonetic Sciences, ed. by J.J. Ohala(1999)
16.81 C. Ericsdotter: Articulatory copy synthesis: Acousticperformane of an MRI and X-ray-based frame-work. In: Proc. 15th Int. Congress of the PhoneticSciences, ed. by D. Recasens, M. Josep Solé,J. Romero (Universitat Autònoma de Barcelona,Barcelona 2003), CD-ROM
16.82 C. Ericsdotter: Articulatory-acoustic relationshipsin Swedish vowel sounds, PhD thesis (StockholmUniversity, Stockholm 2005)
16.83 K.N. Stevens, A.S. House: Development of a quan-titative description of vowel articulation, J. Acoust.Soc. Am. 27, 484–493 (1955)
16.84 S. Maeda: Compensatory articulation duringspeech: Evidence from the analysis and synthesisof vocal-tract shapes using an articulatory model.In: Speech Production and Speech Modeling, ed.
by W.J. Hardcastle, A. Marchal (Dordrecht, Kluwer1990) pp. 131–150
16.85 P. Branderud, H. Lundberg, J. Lander, H. Djamshid-pey, I. Wäneland, D. Krull, B. Lindblom: X-rayanalyses of speech: methodological aspects. In:Proc. XIIIth Swedish Phonetics Conf. (FONETIK 1998)(KTH, Stockholm 1998)
16.86 C.Y. Espy-Wilson: Articulatory strategies, speechacoustics and variability. In: From sound to Sense:50+ Years of Discoveries in Speech Communica-tion, ed. by J. Slifka, S. Manuel, M. Mathies (MIT,Cambridge 2004)
16.87 J. Sundberg: Formant technique in a professionalfemale singer, Acustica 32, 89–96 (1975)
16.88 J. Sundberg, J. Skoog: Dependence of jaw openingon pitch and vowel in singers, J. Voice 11, 301–306(1997)
16.89 G. Fant: Glottal flow, models and interaction, J.Phon. 14, 393–399 (1986)
16.90 E. Joliveau, J. Smith, J. Wolfe: Vocal tract reso-nances in singing: The soprano voice, J. Acoust.Soc. Am. 116, 2434–2439 (2004)
16.91 R.K. Potter, A.G. Kopp, H.C. Green: Visible Speech(Van Norstrand, New York 1947)
16.92 M. Joosg: Acoustic phonetics, Language 24, 447–460 (2003), supplement 2
16.93 C.F. Hockett: A Manual of Phonology (Indiana Univ.Publ., Bloomington 1955)
16.94 F.H. Guenther: Speech sound acquisition, coarticu-lation, and rate effects in a neural network modelof speech production, Psychol. Rev. 102, 594–621(1995)
16.95 R.D. Kent, B.S. Atal, J.L. Miller: Papers in SpeechCommunication: Speech Perception (Acoust. Soc.Am., New York 1991)
16.96 S.D. Goldinger, D.B. Pisoni, P. Luce: Speech percep-tion and spoken word recognition. In: Principles ofexperimental phonetics, ed. by N.J. Lass (Mosby, StLouis 1996) pp. 277–327
16.97 H.M. Sussman, D. Fruchter, J. Hilbert, J. Sirosh: Lin-ear correlates in the speech signal: The orderlyoutput constraint, Behav. Brain Sci. 21, 241–299(1998)
16.98 B. Lindblom: Economy of speech gestures. In:The Production of Speech, ed. by P.F. MacNeilage(Springer, New York 1983) pp. 217–245
16.99 P.A. Keating, B. Lindblom, J. Lubker, J. Kreiman:Variability in jaw height for segments in Englishand Swedish VCVs, J. Phonetics 22, 407–422 (1994)
16.100 K. Rapp: A study of syllable timing. In: STL/Quart.Prog. Status Rep. 1 (Royal Inst. of Technology,Stockholm( 1971) pp. 14–19
16.101 F. Koopmans-van Beinum, J. Van der Stelt (Eds.):Early stages in the development of speech move-ments (Stockton, New York 1986)
16.102 K. Oller: Metaphonology and infant vocalizations.In: Precursors of early speech, ed. by B. Lindblom,R. Zetterström (Stockton, New York 1986) pp. 21–36
PartE
16

710 Part E Music, Speech, Electroacoustics
16.103 L. Roug, L. Landberg, L. Lundberg: Phonetic de-velopment in early infancy, J. Child Language 16,19–40 (1989)
16.104 R. Stark: Stages of speech development in the firstyear of life. In: Child Phonology: Volume 1: Pro-duction, ed. by G. Yeni-Komshian, J. Kavanagh,C. Ferguson (Academic, New York 1980) pp. 73–90
16.105 R. Stark: Prespeech segmental feature develop-ment. In: Language Acquisition, ed. by P. Fletcher,M. Garman (Cambridge UP, New York 1986) pp. 149–173
16.106 D.K. Oller, R.E. Eilers: The role of audition in infantbabbling, Child Devel. 59(2), 441–449 (1988)
16.107 C. Stoel-Gammon, D. Otomo: Babbling develop-ment of hearing-impaired and normally hearingsubjects, J. Speech Hear. Dis. 51, 33–41 (1986)
16.108 R.E. Eilers, D.K. Oller: Infant vocalizations and theearly diagnosis of severe hearing impairment, J.Pediatr. 124(2), 99–203 (1994)
16.109 D. Ertmer, J. Mellon: Beginning to talk at 20months: Early vocal development in a youngcochlear implant recipient, J. Speech Lang. Hear.Res. 44, 192–206 (2001)
16.110 R.D. Kent, M.J. Osberger, R. Netsell, C.G. Hustedde:Phonetic development in identical twins who differin auditory function, J. Speech Hear. Dis. 52, 64–75(1991)
16.111 M. Lynch, D. Oller, M. Steffens: Development ofspeech-like vocalizations in a child with congeni-tal absence of cochleas: The case of total deafness,Appl. Psychol. 10, 315–333 (1989)
16.112 C. Stoel-Gammon: Prelinguistic vocalizations ofhearing-impaired and normally hearing subjects:A comparison of consonantal inventories, J. SpeechHear. Dis. 53, 302–315 (1988)
16.113 P.F. MacNeilage, B.L. Davis: Acquisition of speechproduction: The achievement of segmental in-dependence. In: Speech production and speechmodeling, ed. by W.J. Hardcastle, A. Marchal (Dor-drecht, Kluwer 1990) pp. 55–68
16.114 T. Houtgast, H.J.M. Steeneken: A review of the MTFconcept in room acoustics and its use for estimat-ing speech intelligibility in auditoria, J. Acoust. Soc.Am. 77, 1069–1077 (1985)
16.115 T. Houtgast, H.J.M. Steeneken: Past, Present andFuture of the Speech Transmission Index, ed. byS.J. van Wijngaarden (NTO Human Factors, Soester-berg 2002)
16.116 R. Drullman, J.M. Festen, R. Plomp: Effect of tem-poral envelope smearing on speech reception, J.Acoust. Soc. Am. 95, 1053–1064 (1994)
16.117 R. Drullman, J.M. Festen, R. Plomp: Effect ofreducing slow temporal modulations on speechreception, J. Acoust. Soc. Am. 95, 2670–2680(1994)
16.118 J. Morton, S. Marcus, C. Frankish: Perceptual cen-ters (P-centers), Psych. Rev. 83, 405–408 (1976)
16.119 S. Marcus: Acoustic determinants of perceptualcenter (P-center) location, Perception & Psy-chophysics 30, 247–256 (1981)
16.120 G. Allen: The place of rhythm in a theory of lan-guage, UCLA Working Papers 10, 60–84 (1968)
16.121 G. Allen: The location of rhythmic stress beats inEnglish: An experimental study, UCLA Working Pa-pers 14, 80–132 (1970)
16.122 J. Eggermont: Location of the syllable beat in rou-tine scansion recitations of a Dutch poem, IPOAnnu. Prog. Rep. 4, 60–69 (1969)
16.123 V.A. Kozhevnikov, L.A. Chistovich: Speech Articula-tion and Perception, JPRS 30, 543 (1965)
16.124 C.E. Hoequist: The perceptual center and rhythmcategories, Lang. Speech 26, 367–376 (1983)
16.125 K.J. deJong: The correlation of P-center ad-justments with articulatory and acoustic events,Perception Psychophys. 56, 447–460 (1994)
16.126 A.D. Patel, A. Löfqvist, W. Naito: The acoustics andkinematics of regularly timed speech: a databaseand method for the study of the P-center problem.In: Proc. 14th Int. Congress of the Phonetic Sciences,ed. by J.J. Ohala (1999)
16.127 P. Howell: Prediction of P-centre location from thedistribution of energy in the amplitude envelope:I & II, Perception Psychophys. 43, 90–93, 99 (1988)
16.128 B. Pompino-Marschall: On the psychoacoustic na-ture of the Pcenter phenomenon, J. Phonetics 17,175–192 (1989)
16.129 C.A. Harsin: Perceptual-center modeling is affectedby including acoustic rate-of-change modula-tions, Perception Psychophys. 59, 243–251 (1997)
16.130 C.A. Fowler: Converging sources of evidence onspoken and perceived rhythms of speech: Cyclicproduction of vowels in monosyllabic stress feet,J. Exp. Psychol. Gen. 112, 386–412 (1983)
16.131 H. Fujisaki: Dynamic characteristics of voice fun-damental frequency in speech and singing. In:The Production of Speech, ed. by P.F. MacNeilage(Springer, New York 1983) pp. 39–55
16.132 J. Frid: Lexical and acoustic modelling of Swedishprosody, Dissertation (Lund University, Lund 2003)
16.133 S. Öhman: Numerical model of coarticulation, J.Acoust. Soc. Am. 41, 310–320 (1967)
16.134 J. t’Hart: F0 stylization in speech: Straight lines ver-sus parabolas, J. Acoust. Soc. Am. 90(6), 3368–3370(1991)
16.135 D. Abercrombie: Elements of General Phonetics(Edinburgh Univ. Press, Edinburgh 1967)
16.136 K.L. Pike: The intonation of America English (Univ.of Michigan Press, Ann Arbor 1945)
16.137 G. Fant, A. Kruckenberg: Notes on stress and wordaccent in Swedish. In: STL/Quart. Prog. Status Rep.2-3 (Royal Inst. of Technology, Stockholm 1994)pp. 125–144
16.138 R. Dauer: Stress timing and syllable-timing rean-alyzed, J. Phonetics 11, 51–62 (1983)
PartE
16

The Human Voice in Speech and Singing References 711
16.139 A. Eriksson: Aspects of Swedish rhythm, PhD thesis,Gothenburg Monographs in Linguistics (Gothen-burg University, Gothenburg 1991)
16.140 O. Engstrand, D. Krull: Duration of syllable-sizedunits in casual and elaborated speech: cross-language observations on Swedish and Spanish,TMH-QPSR 44, 69–72 (2002)
16.141 A.D. Patel, J.R. Daniele: An empirical comparisonof rhythm in language and music, Cognition 87,B35–B45 (2003)
16.142 D. Huron, J. Ollen: Agogic contrast in French andEnglish themes: Further support for Patel andDaniele (2003), Music Perception 21, 267–271 (2003)
16.143 D.H. Klatt: Synthesis by rule of segmental durationsin English sentences. In: Frontiers of speech com-munication research, ed. by B. Lindblom, S. Öhman(Academic, London 1979) pp. 287–299
16.144 B. Lindblom: Final lengthening in speech andmusic. In: Nordic Prosody, ed. by E. Gårding,R. Bannert (Department of Linguistics Lund Uni-versity, Lund 1978) pp. 85–102
16.145 A. Friberg, U Battel: Structural communication. In:The Science and Psychology of Music Performance,ed. by R. Parncutt, GE McPherson (Oxford Univ.,Oxford 2001) pp. 199–218
16.146 J. Sundberg: Emotive transforms, Phonetica 57,95–112 (2000)
16.147 Brownlee: The role of sentence stress in vowel re-duction and formant undershoot: A study of labspeech and informal spontaneous speech, PhDthesis (University of Texas, Austin 1996)
16.148 S.-J. Moon: An acoustic and perceptual study ofundershoot in clear and citation- form speech, PhDdissertation (Univ. of Texas, Austin 1991)
16.149 K.N. Stevens, A.S. House: Perturbation of vowel ar-ticulations by consonantal context. An acousticalstudy, JSHR 6, 111–128 (1963)
16.150 B. Lindblom: Spectrographic study of vowel reduc-tion, J. Acoust. Soc. Am. 35, 1773–1781 (1963)
16.151 P. Delattre: An acoustic and articulatory study ofvowel reduction in four languages, IRAL-Int. Ref.Appl. VII/ 4, 295–325 (1969)
16.152 D.P. Kuehn, K.L. Moll: A cineradiographic study ofVC and CV articulatory velocities, J. Phonetics 4,303–320 (1976)
16.153 J.E. Flege: Effects of speaking rate on tongueposition and velocity of movement in vowel pro-duction, J. Acoust. Soc. Am. 84(3), 901–916 (1988)
16.154 R.J.J.H. van Son, L.C.W. Pols: "Formant movementsof Dutch vowels in a text, read at normal and fastrate, J. Acoust. Soc. Am. 92(1), 121–127 (1992)
16.155 D. van Bergem: Acoustic and Lexical VowelReduction, Doctoral Dissertation (University of Am-sterdam, Amsterdam 1995)
16.156 W.L. Nelson, J.S. Perkell, J.R. Westbury: Mandiblemovements during increasingly rapid articulationsof single syllables: Preliminary observations, J.Acoust. Soc. Am. 75(3), 945–951 (1984)
16.157 S.-J. Moon, B. Lindblom: Interaction betweenduration, context and speaking style in Englishstressed vowels, J. Acoust. Soc. Am. 96(1), 40–55(1994)
16.158 C.S. Sherrington: Man on his nature (MacMillan,London 1986)
16.159 R. Granit: The Purposive Brain (MIT, Cambridge1979)
16.160 N. Bernstein: The coordination and regulation ofmovements (Pergamon, Oxford 1967)
16.161 P.F. MacNeilage: Motor control of serial ordering ofspeech, Psychol. Rev. 77, 182–196 (1970)
16.162 A. Löfqvist: Theories and Models of Speech Produc-tion. In: The Handbook of Phonetic Sciences, ed.by W.J. Hardcastle, J. Laver (Blackwell, Oxford 1997)pp. 405–426
16.163 J.S. Perkell: Articulatory processes. In: The Hand-book of Phonetic Sciences. 5, ed. by W.J. Hardcas-tle, J. Laver. (Blackwell, Oxford 1997) pp. 333–370
16.164 J. Sundberg, R. Leandersson, C. von Euler,E. Knutsson: Influence of body posture and lungvolume on subglottal pressure control duringsinging, J. Voice 5, 283–291 (1991)
16.165 T. Sears, J. Newsom Davis: The control of respira-tory muscles during voluntary breathing. In: Soundproduction in man, ed. by A. Bouhuys et al. (An-nals of the New York Academy of Science, New York1968) pp. 183–190
16.166 B. Lindblom, J. Lubker, T. Gay: Formant frequen-cies of some fixed-mandible vowels and a modelof motor programming by predictive simulation, J.Phonetics 7, 147–161 (1979)
16.167 T. Gay, B. Lindblom, J. Lubker: Production of bite-block vowels: Acoustic equivalence by selectivecompensation, J. Acoust. Soc. Am. 69(3), 802–810(1981)
16.168 W.J. Hardcastle, J. Laver (Eds.): The Handbook ofPhonetic Sciences (Blackwell, Oxford 1997)
16.169 J. S. Perkell, D. H. Klatt: Invariance and variabilityin speech processes (LEA, Hillsdale 1986)
16.170 A. Liberman, I. Mattingly: The motor theory ofspeech perception revised, Cognition 21, 1–36(1985)
16.171 C.A. Fowler: An event approach to the study ofspeech perception from a direct- realist perspec-tive, J. Phon. 14(1), 3–28 (1986)
16.172 E.L. Saltzman, K.G. Munhall: A dynamical approachto gestural patterning in speech production, Ecol.Psychol. 1, 91–163 (1989)
16.173 M. Studdert-Kennedy: How did language go dis-crete?. In: Evolutionary Prerequisites of Language,ed. by M. Tallerman (Oxford Univ., Oxford 2005)pp. 47–68
16.174 R. Jakobson, G. Fant, M. Halle: Preliminaries toSpeech Analysis, Acoustics Laboratory, MIT Tech.Rep. No. 13 (MIT, Cambridge 1952)
16.175 B. Lindblom: Explaining phonetic variation: Asketch of the H&H theory. In: Speech Produc-
PartE
16

712 Part E Music, Speech, Electroacoustics
tion and Speech Modeling, ed. by W.J. Hardcastle,A. Marchal (Dordrecht, Kluwer 1990) pp. 403–439
16.176 B. Lindblom: Role of articulation in speech per-ception: Clues from production, J. Acoust. Soc. Am.99(3), 1683–1692 (1996)
16.177 E. Rapoport: Emotional expression code in operaand lied singing, J. New Music Res. 25, 109–149(1996)
16.178 J. Sundberg, E. Prame, J. Iwarsson: Replicabil-ity and accuracy of pitch patterns in professionalsingers. In: Vocal Fold Physiology, Control-ling Complexity and Chaos, ed. by P. Davis,N. Fletcher (Singular, San Diego 1996) pp. 291–306,Chap. 20
16.179 J.J. Ohala: An ethological perspective on commoncross-language utilization of F0 of voice, Phonetica41, 1–16 (1984)
16.180 I. Fónagy: Hörbare Mimik, Phonetica 1, 25–35 (1967)16.181 K. Scherer: Expression of emotion in voice and
music, J. Voice 9, 235–248 (1995)16.182 P. Juslin, P. Laukka: Communication of emotions in
vocal expression and music performance: Differentchannels, same code?, Psychol. Rev. 129, 770–814(2003)
16.183 J. Sundberg, J. Iwarsson, H. Hagegård: A singersexpression of emotions in sung performance,. In:Vocal Fold Physiology: Voice Quality Control, ed. byO. Fujimura, M. Hirano (Singular, San Diego 1995)pp. 217–229
PartE
16