
When singing bowls don't sing: a numerical and experimental ...

Proc. of the 14th Int. Conference on Digital Audio Effects (DAFx-11), Paris, France, September 19-23, 2011
NON-PARALLEL SINGING-VOICE CONVERSION BY PHONEME-BASED MAPPING ANDCOVARIANCE APPROXIMATION
Fernando Villavicencio and Hideki Kenmochi
Corporate ResearchDevelopment CenterYamaha Corporation
Hamamatsu, Shizuoka, Japan{villavicencio,kenmochi}@beat.yamaha.co.jp
ABSTRACT
In this work we present an approach to perform voice timbre con-version from unpaired data. Voice Conversion strategies are com-monly restricted to the use of parallel speech corpora. Our propo-sition is based on two main concepts: the modeling of the timbrespace based on phonetic information and a simple approximationof the cross-covariance of source-target features. The experimen-tal results based on the mentioned strategy in singing-voice dataof the VOCALOID synthesizer showed a conversion performancecomparable to that obtained by Maximum-Likelihood, thereby al-lowing us to achieve singer-timbre conversion from real singingperformances.
1. INTRODUCTION
One of the main limitations of current Voice Conversion technolo-gies are the use of a parallel corpora of the source and the targetspeakers to perform training of a conversion model. This corpusconsists of a set of recordings in which both speakers pronouncethe same utterances (same phonetic content) without applying anydistinctive emotion or vocal quality. The acquisition of such paral-lel data may represent a number of difficulties, especially if aimingto apply it on target voices which are hardly available; for example:past celebrities.
Some proposals have been reported to achieve non-parallelconversion based on the alignment of originally unpaired data byexhaustive similarity search or the adaptation of an original paral-lel model. An approach following the latter concept [1], is basedon the assumption of a linear relation between the timbre featuresof originally paired speakers and unpaired ones. A conversionmodel trained from paired data is adapted accordingly; however,the source-to-target mapping is not defined directly from the un-paired data.
Previously, the authors introduced a strategy to derive the tim-bre conversion model exclusively from unpaired data consider-ing that the phonetic segmentation is available [2]. The propo-sition consists of a modification of the original Gaussian MixtureModel(GMM) based approach of [3] and [4] by applying phoneme-constrained modeling of the timbre space and an approximation ofthe joint-statistics following the same assumption considered in[1]. In terms of spectral conversion error, the conversion perfor-mance was found comparable to that obtained by parallel trainingwithout perceiving a significant reduction of the conversion effecton the converted signals.
In this work we extend the study of the proposition presentedin [2]. In particular, we are interested in clarifying issues as thelearning conditions of the phoneme-constrained modeling and theperformance of the proposed non-parallel approach when the na-ture of the source target corpora differs. We remark on our inter-est in applying this technology to the concatenative singing-voicesynthesizer VOCALOID [5] in order to perform singer-timbre con-version on the system databases by exclusively using real perfor-mances from target singers. According to the work presented in[6], the experimental study was carried out on full-quality singing-voice data (Sr = 44.1KHz). However, the proposal presented inthis work may represent a generalized solution for Voice Conver-sion purposes.
This paper is structured as follows: the phoneme-constrainedMulti Gaussian Modeling is presented in section 2, in section 3we show study of simple strategy to approximate the source-targetcross-covariance, the experimental framework of our study is de-scribed in section 4, to evaluate the performance of the proposedmethod and compare it with the one based on ML, the results ofobjective and subjective evaluations are reported and discussed insection 5, and the paper concludes with observations and proposi-tion for further study in section 6.
2. PHONEME-BASED ENVELOPE MAPPING
2.1. GMM-ML for features conversion
The conversion of the voice timbre is commonly achieved by mod-ification of the short-term spectral envelope information based ona probabilistic time-continuous transformation function [3]. Theconversion function is commonly derived from a Gaussian Mix-ture Model of joint timbre features trained in a ML basis. The tim-bre features correspond to all-pole based estimations of the spec-tral envelope parameterized as Line Spectral Frequencies (LSF)[4]. We remind, for clarity, the main expressions followed on thisstrategy
y =
Q∑
q=1
p(q|x) [µyq + Σyx
q Σxxq
−1(x − µxq )] (1)
p(q|x) =N (x; µx
q ; Σxxq )
∑Qq=1 N (x; µx
q ; Σxxq )
(2)
Eq.1 depicts the conversion function, denoting x,y and y thesource, target and converted envelope features respectively. TheGMM size (number of Gaussian components) is given by Q. Note
DAFX-1
Proc. of the 14th International Conference on Digital Audio Effects (DAFx-11), Paris, France, September 19-23, 2011
DAFx-241

Proc. of the 14th Int. Conference on Digital Audio Effects (DAFx-11), Paris, France, September 19-23, 2011
that an a priori weighting of the mixture components is not consid-ered. The term p(q|x) corresponds to the conditional probabilityor class membership, according to Eq.2.
In general, concerning the configuration of the GMM, the num-ber of Gaussian components depends on the amount of trainingdata as well as the form of the covariance matrices (full or diag-onal). Normally, an eight-sized GMM with full covariance ma-trices is in use to achieve learning generalization for voice con-version purposes [3]. Commonly, the resulting Gaussian means,when translated to the spectral domain, depict spectral envelopeswith formantic features. This is principally due to the restrictionof using only voiced speech and the significant amount of vocaliccontent on the data. Note, however, that a one-to-one correspon-dence cannot be straightforwardly stated between those envelopepatterns and the vocalic phonetic classes assumed to be containedin the data.
The vocalic speech is widely considered as provider for themost important perceptual cues for timbre identification. However,they represent only a subset of the phonetic elements of a language.Subsequently, we claim that if aiming to perform full timbre con-version we might map the envelope characteristics regardless, ingeneral, of their vocalic or voiced nature. Accordingly, a clus-tering of the envelope space by only eight gaussian componentsmay lead to a large averaging of the phonetic content. Note alsothe highly competitive behavior observed on the ML-based mix-ture, resulting in a full modeling of speech segments of differentphonetic nature by the same Gaussian distribution. These phenom-ena lead to a significant simplification of the phonetic space on themapping process and are found at the origin of some “reduction” ormodification of the phonetic content perceived in some convertedutterances.
2.2. Phoneme-constrained Multi-Gaussian Model
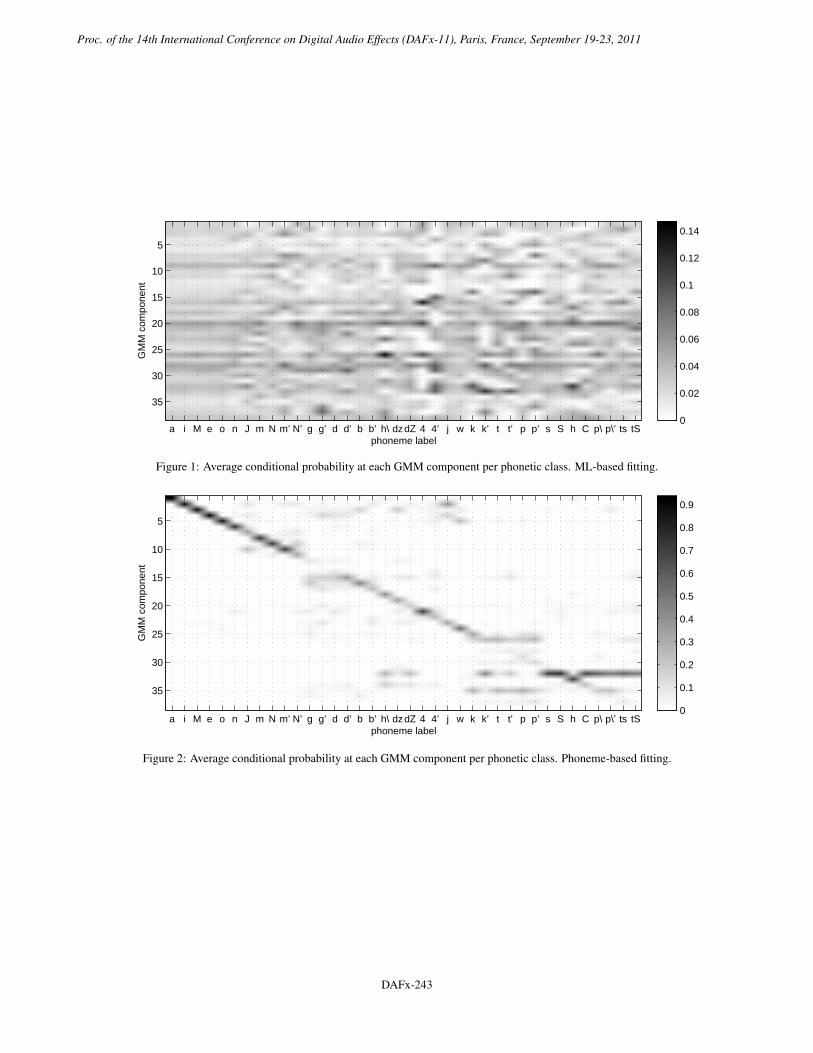
Moreover, by means of setting the GMM size close to the as-sumed number of phonetic events and restricting the covariancematrices to be diagonal, the behavior of the mixture was foundto be more cooperative but unstable. We show in Fig.1 the re-sulting component-to-phoneme correspondence for a GMM-MLin terms of the average membership of each gaussian per pho-netic class. The results were obtained by evaluating p(q|x) af-ter training the GMM with labeled data. The vertical axis rep-resents the GMM components whereas the horizontal axis liststhe phonemes included in VOCALOID according to the Japaneselanguage (SAMPA standard) ordered by phonetic group (vowels,nasals, voiced plosives, voiced affricates, liquids, semivowels, un-voiced plossives, fricatives, unvoiced affricates).
Clearly, following Fig.1, relationships between the clusteringachieved by the GMM-ML and the phonetic class of the featurescan hardly be established. An unstable activation of the mixturecomponents along with phonetic content may produce irregularevolution of the converted envelopes, representing a potential fac-tor of degradations on the converted signals.
Consequently, we propose to control the fitting of the statis-tical model by using the phonetic information; therefore, we re-strict the computation of each Gaussian distribution to the datacorresponding to a same phoneme. A phoneme-based modeling(pho-GMM) was already introduced in [7], showing some benefitsin terms of one-to-many mapping reduction compared to conven-tional GMM-ML.
Following this strategy the resulting component-to-phoneme
0 2000 4000 6000 8000 10000 12000
−20
0
20
40
Frequency (Hz)
A (
dB)
aeMio
0 2000 4000 6000 8000 10000 12000
−20
0
20
40
Frequency (Hz)
A (
dB)
nJmNm’N’N\
Figure 3: Corresponding spectral envelopes of the MGM meanswithin phonetic groups. Vowels (top), nasals (bottom).
correspondence is clearly increased [2], as shown in Fig.2. Themodel was therefore able to extract characteristic information formost of the phonemes, and to increase, consequently, the discrim-ination between them.
Note however some “shared” regions on the grid within ele-ments of a same phonetic group (e.g. nassals, plosives). Unlikethe case of the vowels, where the differences between the forman-tic structures represent an important discriminaton factor, the aver-age spectral patterns at these groups are relatively close. This canbe appreciated in Fig.3, where are shown the resulting envelopepatterns of the vowels (top) and nasals (bottom) sets. Although wehave not a theoretical basis to explain these similiarities, a furthersimplifaction of the phonetic space and the role of such a “charac-teristic envelope” on non-stationary phonemes (e.g. plosives) maybe studied.
Finally, keeping consideration that the phonetic informationis available, the conditional probability can be replaced by a pho-netic flag to directly assign the corresponding component at theconversion stage. However, this “forced” membership should besmoothed at the phonetic boundaries to avoid abrupt changes whentransforming the signal. As was already described, by forcing afull-competitive behavior we do not significantly differ from thereal role of p(q|x) observed in a GMM-ML. Moreover, followingthis proposition we aim to refine the envelope mapping in a pho-netic basis. Note however that, as comented in [7], without includ-ing more meaningful context information some mapping lossescan be hardly alleviated if the acoustic characteristics of same-phoneme data significantly differs. This is demonstrated further inour experimentation by using data of increasing heterogeneity.
Accordingly, the original conversion function expressed in Eq. 1is modified as
y = µyq(x) + Σyx
q(x)Σxxq(x)
−1 [x − µxq(x)] (3)
Moreover, the sub-index q(x), denotes the phonetic class of thesource input and therefore, defines the only gaussian componentinvolved in the mapping. Subsequently, since the resulting modeldoes not keep the “mixture” characteristic anymore, we refer to itas a “Multi-Gaussian Model” (MGM) [2].
DAFX-2
Proc. of the 14th International Conference on Digital Audio Effects (DAFx-11), Paris, France, September 19-23, 2011
DAFx-242
Proc. of the 14th Int. Conference on Digital Audio Effects (DAFx-11), Paris, France, September 19-23, 2011
phoneme label
GM
M c
ompo
nent
a i M e o n J m N m’ N’ g g’ d d’ b b’ h\ dzdZ 4 4’ j w k k’ t t’ p p’ s S h C p\ p\’ ts tS
5
10
15
20
25
30
35
0
0.02
0.04
0.06
0.08
0.1
0.12
0.14
Figure 1: Average conditional probability at each GMM component per phonetic class. ML-based fitting.
phoneme label
GM
M c
ompo
nent
a i M e o n J m N m’ N’ g g’ d d’ b b’ h\ dzdZ 4 4’ j w k k’ t t’ p p’ s S h C p\ p\’ ts tS
5
10
15
20
25
30
35
0
0.1
0.2
0.3
0.4
0.5
0.6
0.7
0.8
0.9
Figure 2: Average conditional probability at each GMM component per phonetic class. Phoneme-based fitting.
DAFX-3
Proc. of the 14th International Conference on Digital Audio Effects (DAFx-11), Paris, France, September 19-23, 2011
DAFx-243
Proc. of the 14th Int. Conference on Digital Audio Effects (DAFx-11), Paris, France, September 19-23, 2011
103
104
105
4.9
5
5.1
5.2
training vectors
erro
r (m
el d
B)
GMM38−MLMGM38−PC
101
102
103
104
4.8
5
5.2
5.4
5.6
training vectors (max. per gaussian)
erro
r (m
el d
B)
MGM38−PC
3 p8 p27 p
37 p
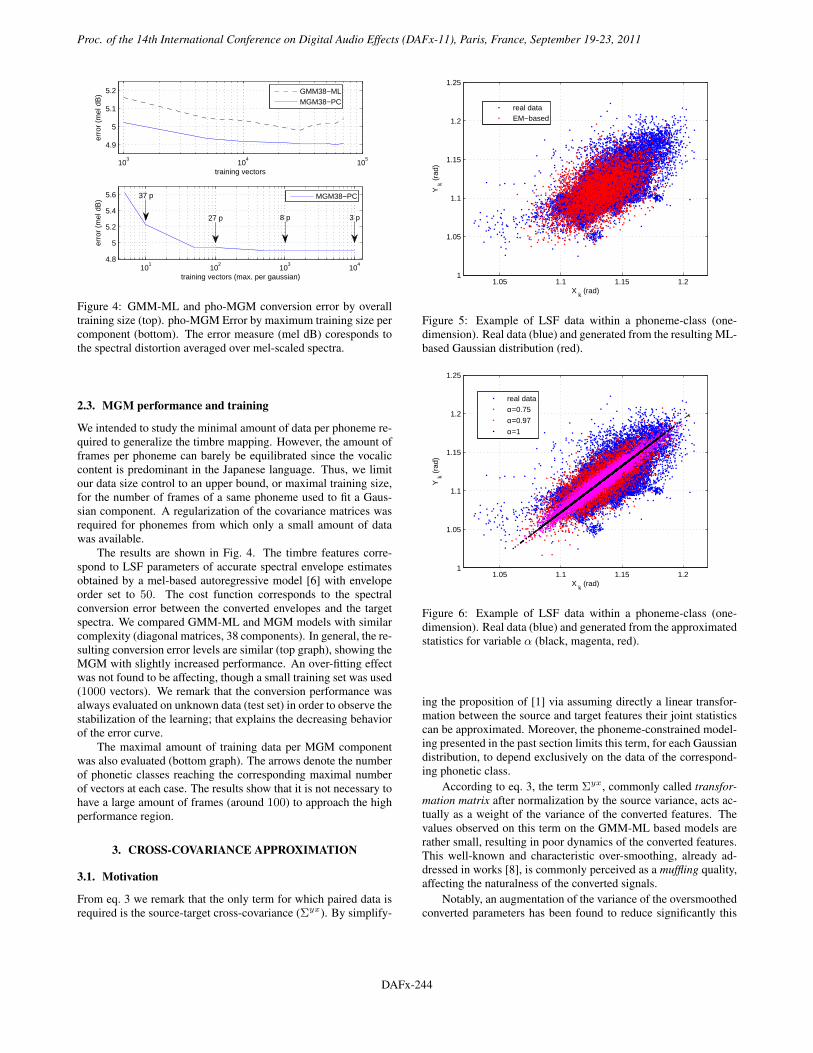
Figure 4: GMM-ML and pho-MGM conversion error by overalltraining size (top). pho-MGM Error by maximum training size percomponent (bottom). The error measure (mel dB) coresponds tothe spectral distortion averaged over mel-scaled spectra.
2.3. MGM performance and training
We intended to study the minimal amount of data per phoneme re-quired to generalize the timbre mapping. However, the amount offrames per phoneme can barely be equilibrated since the vocaliccontent is predominant in the Japanese language. Thus, we limitour data size control to an upper bound, or maximal training size,for the number of frames of a same phoneme used to fit a Gaus-sian component. A regularization of the covariance matrices wasrequired for phonemes from which only a small amount of datawas available.
The results are shown in Fig. 4. The timbre features corre-spond to LSF parameters of accurate spectral envelope estimatesobtained by a mel-based autoregressive model [6] with envelopeorder set to 50. The cost function corresponds to the spectralconversion error between the converted envelopes and the targetspectra. We compared GMM-ML and MGM models with similarcomplexity (diagonal matrices, 38 components). In general, the re-sulting conversion error levels are similar (top graph), showing theMGM with slightly increased performance. An over-fitting effectwas not found to be affecting, though a small training set was used(1000 vectors). We remark that the conversion performance wasalways evaluated on unknown data (test set) in order to observe thestabilization of the learning; that explains the decreasing behaviorof the error curve.
The maximal amount of training data per MGM componentwas also evaluated (bottom graph). The arrows denote the numberof phonetic classes reaching the corresponding maximal numberof vectors at each case. The results show that it is not necessary tohave a large amount of frames (around 100) to approach the highperformance region.
3. CROSS-COVARIANCE APPROXIMATION
3.1. Motivation
From eq. 3 we remark that the only term for which paired data isrequired is the source-target cross-covariance (Σyx). By simplify-
1.05 1.1 1.15 1.21
1.05
1.1
1.15
1.2
1.25
X k
(rad)
Y k
(ra
d)
real dataEM−based
Figure 5: Example of LSF data within a phoneme-class (one-dimension). Real data (blue) and generated from the resulting ML-based Gaussian distribution (red).
1.05 1.1 1.15 1.21
1.05
1.1
1.15
1.2
1.25
X k
(rad)
Y k
(ra
d)
real data
α=0.75
α=0.97
α=1
Figure 6: Example of LSF data within a phoneme-class (one-dimension). Real data (blue) and generated from the approximatedstatistics for variable α (black, magenta, red).
ing the proposition of [1] via assuming directly a linear transfor-mation between the source and target features their joint statisticscan be approximated. Moreover, the phoneme-constrained model-ing presented in the past section limits this term, for each Gaussiandistribution, to depend exclusively on the data of the correspond-ing phonetic class.
According to eq. 3, the term Σyx, commonly called transfor-mation matrix after normalization by the source variance, acts ac-tually as a weight of the variance of the converted features. Thevalues observed on this term on the GMM-ML based models arerather small, resulting in poor dynamics of the converted features.This well-known and characteristic over-smoothing, already ad-dressed in works [8], is commonly perceived as a muffling quality,affecting the naturalness of the converted signals.
Notably, an augmentation of the variance of the oversmoothedconverted parameters has been found to reduce significantly this
DAFX-4
Proc. of the 14th International Conference on Digital Audio Effects (DAFx-11), Paris, France, September 19-23, 2011
DAFx-244
Proc. of the 14th Int. Conference on Digital Audio Effects (DAFx-11), Paris, France, September 19-23, 2011
muffling effect. Therefore, we assert that this term when estimatedby ML represents a limitation on the resulting conversion qual-ity. Furthermore, having control of this value might represent aneffective way to increase the naturalness of the converted signals.
3.2. Covariance approximation by linear transformation
Following the phoneme-constrained modeling, the probabilistic lin-ear transformation between the timbre features of two speakersproposed in [1] can be simplified as y = Aq(x)x + bq(x), whereAq is, in general, a square matrix according to the dimensionalityof x, and bq is a bias vector. Therefore, considering the mentionedrelation in the computation of Σyx for each phonetic-componentof the MGM we obtain
Σyx = E[(y − µy)(x − µx)] (4)
= E{[(Ax + b) − (Aµx + b)] (x − µx)} (5)
= E[(A(x − µx)2] = AΣxx (6)
Where A can be approximated similarly by evaluating Σyy
Σyy = E{[(Ax + b) − (Aµx + b)]2} (7)
= E[(A2(x − µx)2] = A2Σxx (8)
A =√
ΣyyΣxx−1 (9)
Although the relation y = Ax + b is assumed between featurescorresponding to the same phoneme imposes a strong assump-tion and, by using diagonal covariance matrices, the resulting one-dimensional distributions restricts to narrow regions. As the normof A decreases, the “width” of the covariance region increases un-til it reaches a circular form at the full-uncorrelated case (A = 0).Thus, since the orientation of the modeled distribution is given ex-clusively by Σxx and Σyy the proposed Σyx may be rather seenas a lower bound of the real distribution width. Accordingly, weapply a weighting factor (0 < α < 1) to Σyx on the conversionfunction in order to impose a more realistic form on the approxi-mated distribution.
In Fig. 6 we show a comparison of real and approximatedsource-target distributions for several α values of one LSF dimen-sion within a phonetic class. Clearly, the distribution strictly fol-lowing the relation y = Ax+b (α = 1) does not suffice the data.However, by setting α around 0.75, the covariance region approachesthe covariance based on ML. This can be seen in Fig. 5, illustratingthe case when the Gaussian is fitted in a ML basis.
Then, based on eq. 3, the final expression for the conversionfeatures will be as follows
y = µyq(x) + α
√Σyy
q(x)Σxxq(x)
−1 [x − µxq(x)] (10)
Regarding the effect of the parameter α on the conversion perfor-mance, values within the range [0.5-0.7] provide the best percep-tual results. Further, we observe that, for the dimensions with alow correlation, the imposition of a covariance value higher thanthe real one was found to be beneficial. The naturalness of theconverted signals is improved by increasing the dynamics of thepredicted LSFs. Nevertheless, for clarity an objective and subjec-tive evaluation of α is presented in Section 5.
d a M d a e d a o
−0.4
−0.2
0
0.2
0.4
s(t)
phonemesd a M d a e d a o
200
250
300
f0k (
Hz)
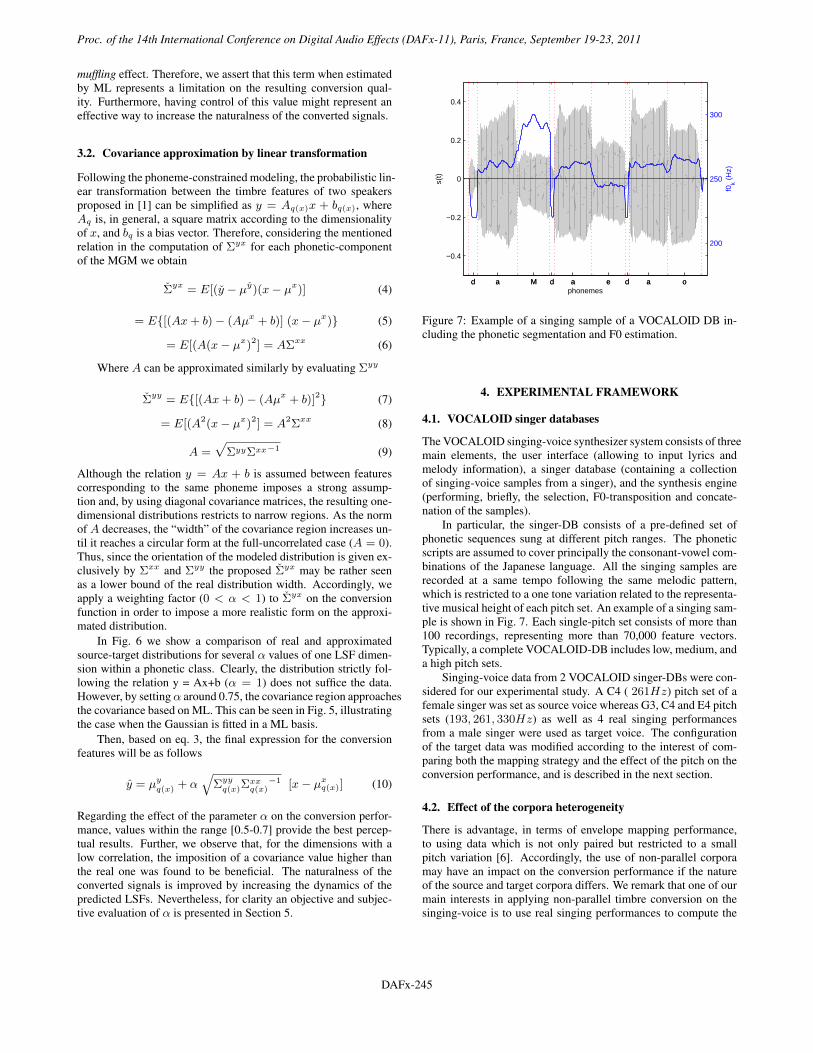
Figure 7: Example of a singing sample of a VOCALOID DB in-cluding the phonetic segmentation and F0 estimation.
4. EXPERIMENTAL FRAMEWORK
4.1. VOCALOID singer databases
The VOCALOID singing-voice synthesizer system consists of threemain elements, the user interface (allowing to input lyrics andmelody information), a singer database (containing a collectionof singing-voice samples from a singer), and the synthesis engine(performing, briefly, the selection, F0-transposition and concate-nation of the samples).
In particular, the singer-DB consists of a pre-defined set ofphonetic sequences sung at different pitch ranges. The phoneticscripts are assumed to cover principally the consonant-vowel com-binations of the Japanese language. All the singing samples arerecorded at a same tempo following the same melodic pattern,which is restricted to a one tone variation related to the representa-tive musical height of each pitch set. An example of a singing sam-ple is shown in Fig. 7. Each single-pitch set consists of more than100 recordings, representing more than 70,000 feature vectors.Typically, a complete VOCALOID-DB includes low, medium, anda high pitch sets.
Singing-voice data from 2 VOCALOID singer-DBs were con-sidered for our experimental study. A C4 ( 261Hz) pitch set of afemale singer was set as source voice whereas G3, C4 and E4 pitchsets (193, 261, 330Hz) as well as 4 real singing performancesfrom a male singer were used as target voice. The configurationof the target data was modified according to the interest of com-paring both the mapping strategy and the effect of the pitch on theconversion performance, and is described in the next section.
4.2. Effect of the corpora heterogeneity
There is advantage, in terms of envelope mapping performance,to using data which is not only paired but restricted to a smallpitch variation [6]. Accordingly, the use of non-parallel corporamay have an impact on the conversion performance if the natureof the source and target corpora differs. We remark that one of ourmain interests in applying non-parallel timbre conversion on thesinging-voice is to use real singing performances to compute the
DAFX-5
Proc. of the 14th International Conference on Digital Audio Effects (DAFx-11), Paris, France, September 19-23, 2011
DAFx-245
Proc. of the 14th Int. Conference on Digital Audio Effects (DAFx-11), Paris, France, September 19-23, 2011
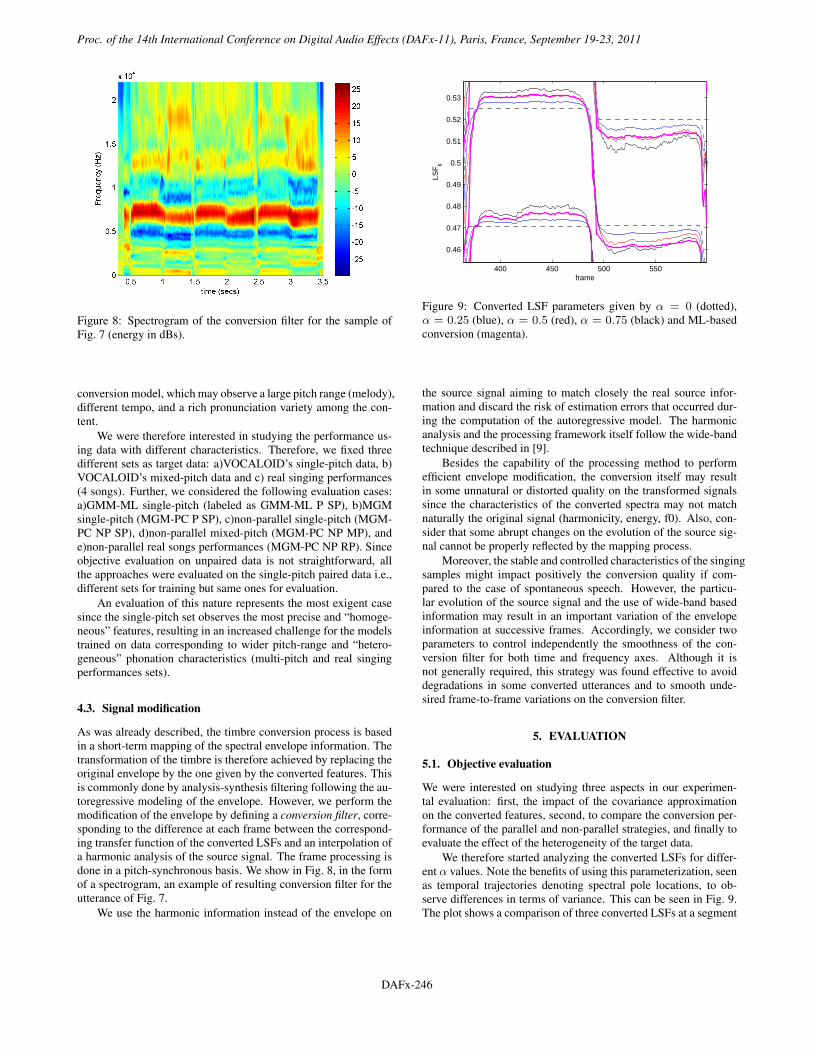
Figure 8: Spectrogram of the conversion filter for the sample ofFig. 7 (energy in dBs).
conversion model, which may observe a large pitch range (melody),different tempo, and a rich pronunciation variety among the con-tent.
We were therefore interested in studying the performance us-ing data with different characteristics. Therefore, we fixed threedifferent sets as target data: a)VOCALOID’s single-pitch data, b)VOCALOID’s mixed-pitch data and c) real singing performances(4 songs). Further, we considered the following evaluation cases:a)GMM-ML single-pitch (labeled as GMM-ML P SP), b)MGMsingle-pitch (MGM-PC P SP), c)non-parallel single-pitch (MGM-PC NP SP), d)non-parallel mixed-pitch (MGM-PC NP MP), ande)non-parallel real songs performances (MGM-PC NP RP). Sinceobjective evaluation on unpaired data is not straightforward, allthe approaches were evaluated on the single-pitch paired data i.e.,different sets for training but same ones for evaluation.
An evaluation of this nature represents the most exigent casesince the single-pitch set observes the most precise and “homoge-neous” features, resulting in an increased challenge for the modelstrained on data corresponding to wider pitch-range and “hetero-geneous” phonation characteristics (multi-pitch and real singingperformances sets).
4.3. Signal modification
As was already described, the timbre conversion process is basedin a short-term mapping of the spectral envelope information. Thetransformation of the timbre is therefore achieved by replacing theoriginal envelope by the one given by the converted features. Thisis commonly done by analysis-synthesis filtering following the au-toregressive modeling of the envelope. However, we perform themodification of the envelope by defining a conversion filter, corre-sponding to the difference at each frame between the correspond-ing transfer function of the converted LSFs and an interpolation ofa harmonic analysis of the source signal. The frame processing isdone in a pitch-synchronous basis. We show in Fig. 8, in the formof a spectrogram, an example of resulting conversion filter for theutterance of Fig. 7.
We use the harmonic information instead of the envelope on
400 450 500 550
0.46
0.47
0.48
0.49
0.5
0.51
0.52
0.53
frame
LSF
k
Figure 9: Converted LSF parameters given by α = 0 (dotted),α = 0.25 (blue), α = 0.5 (red), α = 0.75 (black) and ML-basedconversion (magenta).
the source signal aiming to match closely the real source infor-mation and discard the risk of estimation errors that occurred dur-ing the computation of the autoregressive model. The harmonicanalysis and the processing framework itself follow the wide-bandtechnique described in [9].
Besides the capability of the processing method to performefficient envelope modification, the conversion itself may resultin some unnatural or distorted quality on the transformed signalssince the characteristics of the converted spectra may not matchnaturally the original signal (harmonicity, energy, f0). Also, con-sider that some abrupt changes on the evolution of the source sig-nal cannot be properly reflected by the mapping process.
Moreover, the stable and controlled characteristics of the singingsamples might impact positively the conversion quality if com-pared to the case of spontaneous speech. However, the particu-lar evolution of the source signal and the use of wide-band basedinformation may result in an important variation of the envelopeinformation at successive frames. Accordingly, we consider twoparameters to control independently the smoothness of the con-version filter for both time and frequency axes. Although it isnot generally required, this strategy was found effective to avoiddegradations in some converted utterances and to smooth unde-sired frame-to-frame variations on the conversion filter.
5. EVALUATION
5.1. Objective evaluation
We were interested on studying three aspects in our experimen-tal evaluation: first, the impact of the covariance approximationon the converted features, second, to compare the conversion per-formance of the parallel and non-parallel strategies, and finally toevaluate the effect of the heterogeneity of the target data.
We therefore started analyzing the converted LSFs for differ-ent α values. Note the benefits of using this parameterization, seenas temporal trajectories denoting spectral pole locations, to ob-serve differences in terms of variance. This can be seen in Fig. 9.The plot shows a comparison of three converted LSFs at a segment
DAFX-6
Proc. of the 14th International Conference on Digital Audio Effects (DAFx-11), Paris, France, September 19-23, 2011
DAFx-246
Proc. of the 14th Int. Conference on Digital Audio Effects (DAFx-11), Paris, France, September 19-23, 2011
0 1000 2000 3000 4000 5000 6000 7000 8000−20
−10
0
10
20
30
40
Frequency (Hz)
A (
dB)
α= 0
α= 0.25
α= 0.5
α= 0.75
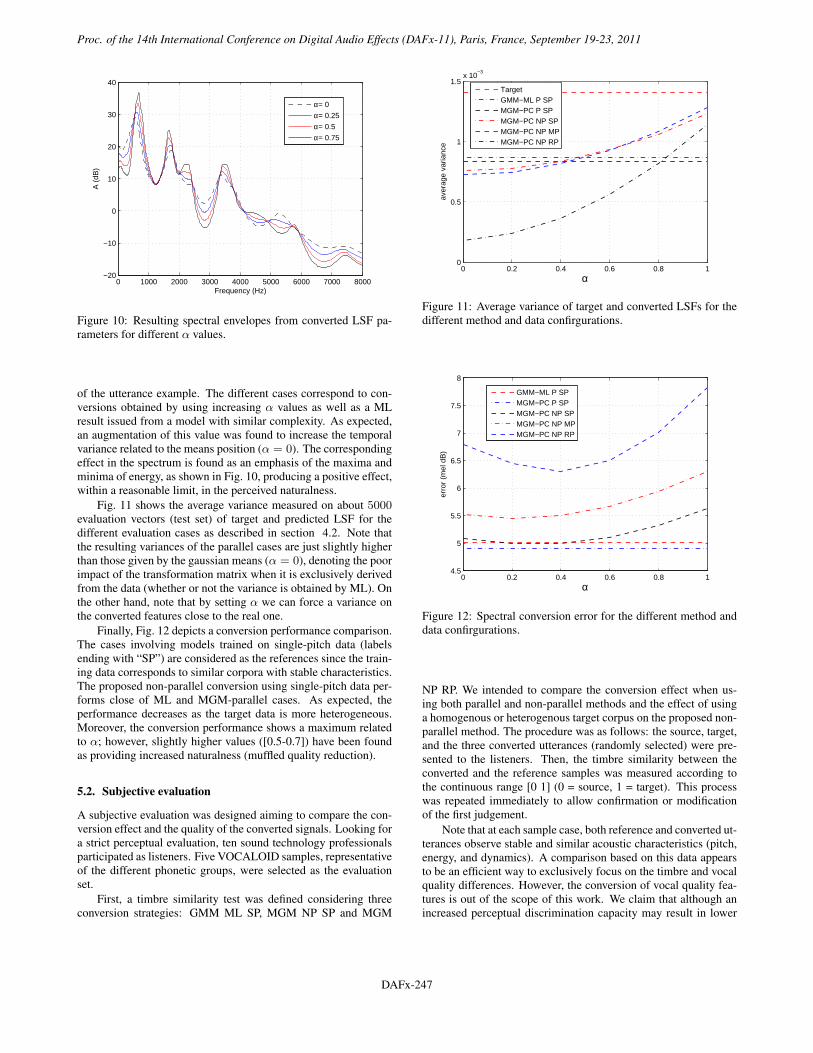
Figure 10: Resulting spectral envelopes from converted LSF pa-rameters for different α values.
of the utterance example. The different cases correspond to con-versions obtained by using increasing α values as well as a MLresult issued from a model with similar complexity. As expected,an augmentation of this value was found to increase the temporalvariance related to the means position (α = 0). The correspondingeffect in the spectrum is found as an emphasis of the maxima andminima of energy, as shown in Fig. 10, producing a positive effect,within a reasonable limit, in the perceived naturalness.
Fig. 11 shows the average variance measured on about 5000evaluation vectors (test set) of target and predicted LSF for thedifferent evaluation cases as described in section 4.2. Note thatthe resulting variances of the parallel cases are just slightly higherthan those given by the gaussian means (α = 0), denoting the poorimpact of the transformation matrix when it is exclusively derivedfrom the data (whether or not the variance is obtained by ML). Onthe other hand, note that by setting α we can force a variance onthe converted features close to the real one.
Finally, Fig. 12 depicts a conversion performance comparison.The cases involving models trained on single-pitch data (labelsending with “SP”) are considered as the references since the train-ing data corresponds to similar corpora with stable characteristics.The proposed non-parallel conversion using single-pitch data per-forms close of ML and MGM-parallel cases. As expected, theperformance decreases as the target data is more heterogeneous.Moreover, the conversion performance shows a maximum relatedto α; however, slightly higher values ([0.5-0.7]) have been foundas providing increased naturalness (muffled quality reduction).
5.2. Subjective evaluation
A subjective evaluation was designed aiming to compare the con-version effect and the quality of the converted signals. Looking fora strict perceptual evaluation, ten sound technology professionalsparticipated as listeners. Five VOCALOID samples, representativeof the different phonetic groups, were selected as the evaluationset.
First, a timbre similarity test was defined considering threeconversion strategies: GMM ML SP, MGM NP SP and MGM
0 0.2 0.4 0.6 0.8 10
0.5
1
1.5x 10
−3
α
aver
age
varia
nce
TargetGMM−ML P SPMGM−PC P SPMGM−PC NP SPMGM−PC NP MPMGM−PC NP RP
Figure 11: Average variance of target and converted LSFs for thedifferent method and data confirgurations.
0 0.2 0.4 0.6 0.8 14.5
5
5.5
6
6.5
7
7.5
8
α
erro
r (m
el d
B)
GMM−ML P SPMGM−PC P SPMGM−PC NP SPMGM−PC NP MPMGM−PC NP RP
Figure 12: Spectral conversion error for the different method anddata confirgurations.
NP RP. We intended to compare the conversion effect when us-ing both parallel and non-parallel methods and the effect of usinga homogenous or heterogenous target corpus on the proposed non-parallel method. The procedure was as follows: the source, target,and the three converted utterances (randomly selected) were pre-sented to the listeners. Then, the timbre similarity between theconverted and the reference samples was measured according tothe continuous range [0 1] (0 = source, 1 = target). This processwas repeated immediately to allow confirmation or modificationof the first judgement.
Note that at each sample case, both reference and converted ut-terances observe stable and similar acoustic characteristics (pitch,energy, and dynamics). A comparison based on this data appearsto be an efficient way to exclusively focus on the timbre and vocalquality differences. However, the conversion of vocal quality fea-tures is out of the scope of this work. We claim that although anincreased perceptual discrimination capacity may result in lower
DAFX-7
Proc. of the 14th International Conference on Digital Audio Effects (DAFx-11), Paris, France, September 19-23, 2011
DAFx-247
Proc. of the 14th Int. Conference on Digital Audio Effects (DAFx-11), Paris, France, September 19-23, 2011
GMM ML SP MGM NP SP MGM NP RP
0
0.25
0.5
0.75
1si
mila
rity
target
closer to target
in the middle
closer to source
source
alpha=0.2 alpha=0.6 alpha=1
1
2
3
4
5
MO
S
MGM NP SPMGM NP RP
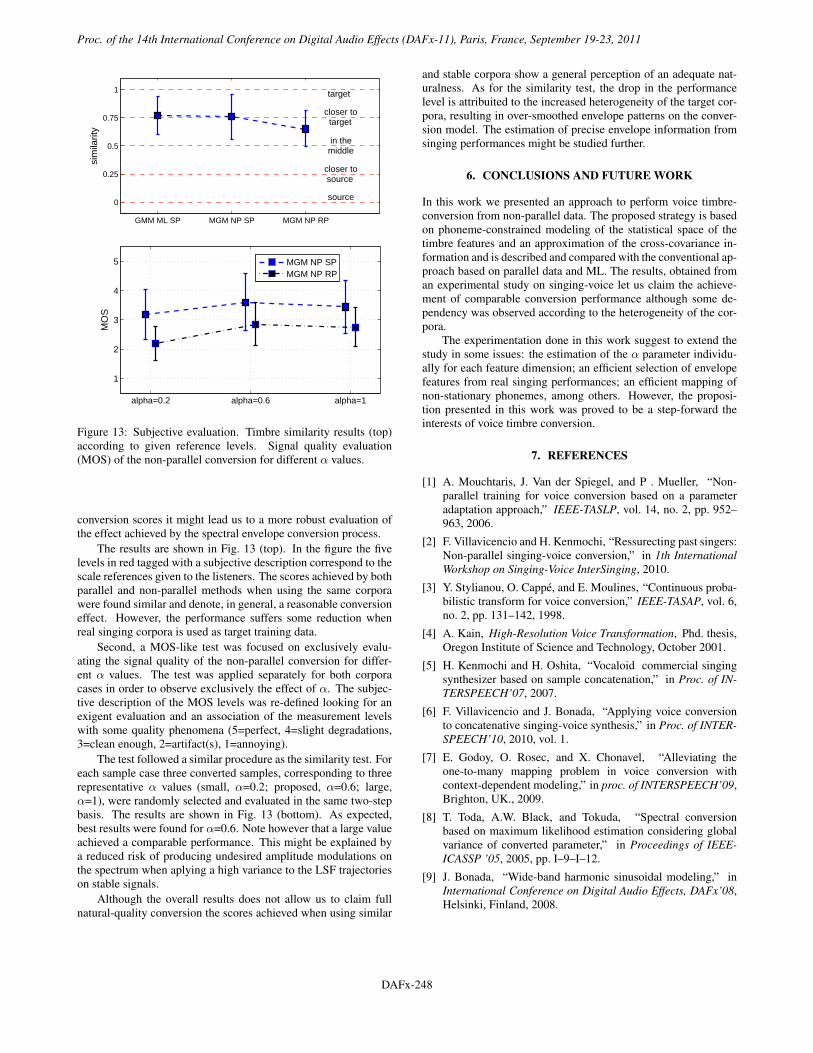
Figure 13: Subjective evaluation. Timbre similarity results (top)according to given reference levels. Signal quality evaluation(MOS) of the non-parallel conversion for different α values.
conversion scores it might lead us to a more robust evaluation ofthe effect achieved by the spectral envelope conversion process.
The results are shown in Fig. 13 (top). In the figure the fivelevels in red tagged with a subjective description correspond to thescale references given to the listeners. The scores achieved by bothparallel and non-parallel methods when using the same corporawere found similar and denote, in general, a reasonable conversioneffect. However, the performance suffers some reduction whenreal singing corpora is used as target training data.
Second, a MOS-like test was focused on exclusively evalu-ating the signal quality of the non-parallel conversion for differ-ent α values. The test was applied separately for both corporacases in order to observe exclusively the effect of α. The subjec-tive description of the MOS levels was re-defined looking for anexigent evaluation and an association of the measurement levelswith some quality phenomena (5=perfect, 4=slight degradations,3=clean enough, 2=artifact(s), 1=annoying).
The test followed a similar procedure as the similarity test. Foreach sample case three converted samples, corresponding to threerepresentative α values (small, α=0.2; proposed, α=0.6; large,α=1), were randomly selected and evaluated in the same two-stepbasis. The results are shown in Fig. 13 (bottom). As expected,best results were found for α=0.6. Note however that a large valueachieved a comparable performance. This might be explained bya reduced risk of producing undesired amplitude modulations onthe spectrum when aplying a high variance to the LSF trajectorieson stable signals.
Although the overall results does not allow us to claim fullnatural-quality conversion the scores achieved when using similar
and stable corpora show a general perception of an adequate nat-uralness. As for the similarity test, the drop in the performancelevel is attribuited to the increased heterogeneity of the target cor-pora, resulting in over-smoothed envelope patterns on the conver-sion model. The estimation of precise envelope information fromsinging performances might be studied further.
6. CONCLUSIONS AND FUTURE WORK
In this work we presented an approach to perform voice timbre-conversion from non-parallel data. The proposed strategy is basedon phoneme-constrained modeling of the statistical space of thetimbre features and an approximation of the cross-covariance in-formation and is described and compared with the conventional ap-proach based on parallel data and ML. The results, obtained froman experimental study on singing-voice let us claim the achieve-ment of comparable conversion performance although some de-pendency was observed according to the heterogeneity of the cor-pora.
The experimentation done in this work suggest to extend thestudy in some issues: the estimation of the α parameter individu-ally for each feature dimension; an efficient selection of envelopefeatures from real singing performances; an efficient mapping ofnon-stationary phonemes, among others. However, the proposi-tion presented in this work was proved to be a step-forward theinterests of voice timbre conversion.
7. REFERENCES
[1] A. Mouchtaris, J. Van der Spiegel, and P . Mueller, “Non-parallel training for voice conversion based on a parameteradaptation approach,” IEEE-TASLP, vol. 14, no. 2, pp. 952–963, 2006.
[2] F. Villavicencio and H. Kenmochi, “Ressurecting past singers:Non-parallel singing-voice conversion,” in 1th InternationalWorkshop on Singing-Voice InterSinging, 2010.
[3] Y. Stylianou, O. Cappé, and E. Moulines, “Continuous proba-bilistic transform for voice conversion,” IEEE-TASAP, vol. 6,no. 2, pp. 131–142, 1998.
[4] A. Kain, High-Resolution Voice Transformation, Phd. thesis,Oregon Institute of Science and Technology, October 2001.
[5] H. Kenmochi and H. Oshita, “Vocaloid commercial singingsynthesizer based on sample concatenation,” in Proc. of IN-TERSPEECH’07, 2007.
[6] F. Villavicencio and J. Bonada, “Applying voice conversionto concatenative singing-voice synthesis,” in Proc. of INTER-SPEECH’10, 2010, vol. 1.
[7] E. Godoy, O. Rosec, and X. Chonavel, “Alleviating theone-to-many mapping problem in voice conversion withcontext-dependent modeling,” in proc. of INTERSPEECH’09,Brighton, UK., 2009.
[8] T. Toda, A.W. Black, and Tokuda, “Spectral conversionbased on maximum likelihood estimation considering globalvariance of converted parameter,” in Proceedings of IEEE-ICASSP ’05, 2005, pp. I–9–I–12.
[9] J. Bonada, “Wide-band harmonic sinusoidal modeling,” inInternational Conference on Digital Audio Effects, DAFx’08,Helsinki, Finland, 2008.
DAFX-8
Proc. of the 14th International Conference on Digital Audio Effects (DAFx-11), Paris, France, September 19-23, 2011
DAFx-248
Copyright © 2022 FDOKUMEN