The-Human-Resources-Scorecard-Measuring-the-Return-on ...
537
-
Upload
khangminh22 -
Category
Documents
-
view
0 -
download
0
Transcript of The-Human-Resources-Scorecard-Measuring-the-Return-on ...


The Human Resources ScorecardMeasuring the Return on Investment


The Human Resources ScorecardMeasuring the Return on Investment
Jack J. PhillipsRon D. StonePatricia Pulliam Phillips
Boston Oxford Auckland Johannesburg Melbourne New Delhi

iv
Copyright © 2001 by Butterworth–Heinemann
A member of the Reed Elsevier group
All rights reserved.No part of this publication may be reproduced, stored in a retrieval system,or transmitted in any form or by any means, electronic, mechanical,photocopying, recording, or otherwise, without the prior written permissionof the publisher.
Recognizing the importance of preserving what has been written, Butterworth–Heinemann prints its books on acid-free paper whenever possible.
Library of Congress Cataloging-in-Publication Data
Phillips, Jack J., 1945–The human resources scorecard: measuring the return on investment /
Jack J. Phillips, Ron D. Stone, Patricia Pulliam Phillips.p. cm.
Includes index.ISBN 0-87719-367-31. Wages and labor productivity—Measurement. 2. Labor costs
Accounting. 3. Human capital—Cost effectiveness. 4. Manpowerplanning. 5. Labor ecomonics. 6. Rate of return. I. Stone, Ron D.II. Phillips, Patricia Pulliam. III. Title.
HD 4945.P44 2000331—dc21
00-062236
British Library Cataloguing-in-Publication Data
A complete record for this title is available from the British LibraryThe publisher offers special discounts on bulk orders of this book.For information, please contact:Manager of Special SalesButterworth–Heinemann225 Wildwood AvenueWoburn, MA 01801–2041Tel: 781-904-2500Fax: 781-904-2620For information on all Butterworth–Heinemann publications available,contact our World Wide Web home page at: http://www.bh.com
10 9 8 7 6 5 4 3 2 1Printed in the United States of America

v
Contents
Preface, x
Acknowledgments, xvii
P a r t I
The Need for ROI in Human Resources
C h a p t e r 1
The Business Case for ROI ...................................................... 12Approaches to HR Accountability, 3.
Why ROI?, 12. A Credible Approach, 18.Barriers to Implementing the ROI Process, 34.Benefits of Implementing the ROI Process, 36.
Final Thoughts, 38. References, 40.
C h a p t e r 2
Initial Analysis and Planning .................................................... 42Evaluation: Project Requirements, 43. Levels of
Objectives for HR Programs, 46. Linking Evaluationwith Needs, 52. Planning for Measurement andEvaluation, 57. Shortcut Ways to Plan for the
Evaluation, 62. Final Thoughts, 64.Further Reading, 64.

vi
P a r t I I
The ROI Process, Step-by-Step
C h a p t e r 3
Collecting Data During HR Program Implementation ......... 168Measuring Reaction and Satisfaction, 69. Measuring Skill
and Knowledge Changes, 83. Conclusion, 98.
C h a p t e r 4
Collecting Data After HR Program Implementation ............ 100Measuring Application and Implementation, 100.
Capturing Business Impact Data, 140. Selecting theAppropriate Method for Each Level, 163. Shortcut Waysto Capture Business Impact Data, 165. Conclusion, 167.
C h a p t e r 5
Isolating the Effects of an HR Program ................................ 168Preliminary Issues, 169. The Ten Strategies, 171. Using the
Strategies, 194. Conclusion, 195. References, 195.
C h a p t e r 6
Converting Data to Monetary Value ...................................... 197Preliminary Issues, 198. Strategies for Converting Data to
Monetary Values, 200. Converting Output Data toContribution, 200. Calculating the Cost of Quality, 203.Converting Employee Time, 204. Historical Costs, 205.Internal and External Experts’ Input, 205. Values from
External Databases, 206. Participant Estimates, 207.Supervisor Estimates, 208. Senior Manager Estimates, 209.
HR Staff Estimates, 210. Selecting the AppropriateStrategy, 210. Accuracy and Credibility of
Data, 211. Conclusion, 214. References, 215.
C h a p t e r 7
Monitoring the Cost of Human Resource Programs ............ 216Cost Strategies, 217. Major Cost Categories, 222.
Cost Accumulation and Estimation, 226.Summary, 232. Reference, 232.

vii
C h a p t e r 8
Calculating the Actual Return on Investment ....................... 233Basic Issues, 234. Benefit/Cost Ratio, 235. ROI Formula,
236. BCR/ROI Case Application, 237. Other ROI Measures,241. Utility Analysis, 243. Consequences of NotProviding an HR Solution, 244. ROI Issues, 245.
Conclusion, 248. References, 248.
C h a p t e r 9
Identifying Intangible Measures .............................................. 249Key Issues, 250. Employee Satisfaction, 252. Employee
Withdrawal, 254. Customer Service, 256. Team EffectivenessMeasures, 257. Conclusion, 260. References, 260.
C h a p t e r 10
Communicating Results ........................................................... 261Why Be Concerned About Communicating Results?, 262.Principles of Communicating Results, 264. A Model forCommunicating Results, 266. Shortcut Ways to Provide
Feedback and Communicate with Clients, 298.Final Thoughts, 299.
P a r t I I I
Important Issues with ROI Implementation
C h a p t e r 11
Forecasting the ROI ................................................................ 302Why Forecast ROI?, 302. The Tradeoffs of Forecasting, 304.
Pre-Project ROI Forecasting, 306. Forecasting ROI withReaction Data, 314. Forecasting ROI with Learning Data,
319. Forecasting ROI with Application of Skills andCompetencies, 322. ROI at Level 4: Business Results, 325.Shortcut Ways to Forecast ROI, 325. Final Thoughts, 326.
C h a p t e r 12
Implementation Issues ............................................................. 327Planning the Implementation, 327. Preparing the HR Staff,337. Initiating the ROI Process, 343. Management Team,
346. Monitoring Progress and Communicating Results,350. Conclusion, 350. References, 351.

viii
P a r t I V
Case Applications
C h a p t e r 13
Sexual Harassment Prevention (Healthcare Inc.) .................. 354Background, 355. Events Leading to Program, 355. The
Program: Design, Development, and Implementation, 356.Why ROI?, 357. Data Collection, 358. ROI Analysis, 360.ROI Analysis Plan, 361. Reaction and Learning Data, 363.
On-the-Job Application, 363. Business Impact, 364.Program Costs, 367. Monetary Benefits from Program, 368.
Program Costs, 370. ROI Calculation, 371.Questions for Discussion, 372.
C h a p t e r 14
Competency-Based Pay System(National Crushed Stone Company) ....................................... 373
Background, 373. Competency-Based Pay, 374. ROI Drivers,375. Development and Implementation, 376. Evaluation
Methodology, 377. Control Group Selection, 377. EvaluationPlanning, 378. Results: Reaction and Learning, 381.
Application/Use, 381. Business Impact, 384. Program Costs,386. Intangible Benefits, 387. Forecast Value, 389.
Questions for Discussion, 389.
C h a p t e r 15
Absenteeism Reduction Program(Metro Transit Authority)........................................................ 390
Background, 390. Causes of Problems and Solutions, 391.Objectives of the Initiatives, 392. Data Collection, 393.Isolating the Effects of the Initiatives, 395. Converting
Data to Monetary Values, 397. Costs for Initiatives, 399.Results: Reaction, Learning, and Application, 400.
Business Impact, 400. Monetary Benefits, 401. Costs, 402.ROI Calculation, 403. Questions for Discussion, 403.
C h a p t e r 16
Stress Management (Midwest Electric Inc.) ........................... 404Background, 404. Program Planning and Design, 407.Program Results, 419. Questions for Discussion, 438.

ix
C h a p t e r 17
Safety Incentive Program (National Steel) ............................. 439Background, 439. A Performance Problem, 440. TheNeeds Assessment, 440. The HR Solution, 441. TheMeasure of Success, 441. The Incentive Plan, 442.Implementation of the Incentive Plan, 442. Cost
Monitoring, 443. Data Collection and Analysis, 443. DataInterpretation and Conclusion, 446. Calculating the Return
on Investment, 447. Communication of Results, 447.Questions for Discussion, 448.
C h a p t e r 18
Executive Leadership Development(Imperial National Bank) ........................................................ 449
Background, 449. Initiation of the LeadershipDevelopment Program, 450. Data Collection Plan, 452.Reaction and Learning, 457. Application, 459. BusinessImpact, 461. Program Costs, 463. ROI Analysis, 469.
Intangible Benefits, 472. Results, 474.Questions for Discussion, 475.
C h a p t e r 19
Technology-Based Learning(United Petroleum International) ............................................ 477
Background, 478. Designing and Implementing theSolutions, 479. The Technology Learning CompetencyProgram (TLC), 480. Measurement Methods and DataAnalysis, 481. ROI Model and Process, 482. The Data
Collection Plan and ROI Analysis Plan, 483. Levels 1 and2 Data, 486. Levels 3 and 4 Data, 486. Isolating theEffects, 488. Design and Implementation Costs, 489.
Levels 3 and 4 Results, 491. ROI Results, 492. IntangibleBenefits, 492. Learning Issues from the Study, 493.
Reporting to Stakeholder Groups, 494.Questions for Discussion, 495.
a p p e n d i x
Self-Test: How Results-Oriented Are YourHuman Resources Programs? .................................................. 496
Index ......................................................................................... 505

x
Preface
INTEREST IN ROI
Today’s HR professionals need a balanced set of measures andprocesses to show the value of the HR contribution. Measuringthe return on investment (ROI) is emerging as a promising toolto provide convincing data about the contribution of specifichuman resources programs and processes. It is now a part of themeasurement mix.
The interest in ROI has been phenomenal. The topic appearson almost every HR conference and convention agenda. Articlesabout ROI appear regularly in HR practitioner and researchjournals. Several related books have been developed about thetopic, and consulting firms have sprung up almost overnight totackle this critical and important issue.
Several issues are driving the increased interest in ROI and itsapplication to a variety of HR programs. Pressure from clientsand senior managers to show the return on their HR investmentis probably the most influential driver. Competitive economicpressures are causing intense scrutiny of all expenditures, includ-ing all human resources costs. Total quality management,reengineering, and continuous process improvement have createda renewed interest in measurement and evaluation, includingmeasuring the effectiveness of HR. The general trend towardaccountability with all staff support groups is causing some HRdepartments to measure their contribution. A few progressive HRdepartments have taken a proactive approach by using ROI tomeasure their contribution without prodding or encouragement.In all, these and other factors have created an unprecedentedwave of applications of the ROI process.

xi
NEEDED: AN EFFECTIVE ROI PROCESS
Return on investment has become one of the most challengingand intriguing issues facing the human resources field. Thechallenging aspect of the process is the nature and accuracy ofits development. It sometimes seems confusing, surrounded bymodels, formulas, and statistics that often frighten the mostcapable practitioners. Coupled with this concern are misunder-standings about the process and the gross misuse of ROI tech-niques in some organizations. These issues sometimes leave HRpractitioners with a distaste for the process. Unfortunately, ROIcannot be ignored. To admit to clients and senior managers thatthe impact of HR cannot be measured is to admit that HRprograms do not add value or that HR should not be subjectedto accountability processes. In practice, ROI must be explored,considered, and ultimately implemented in most organizations.
What is needed is a rational, logical approach that can besimplified and implemented within the current budget constraintsand resources of the organization. This book presents a provenROI process based on almost twenty years of development andrefinement. It is a process that is rich in tradition and modifiedto meet the demands facing the diversity of current HR programs.
The ROI process described in this book meets the requirementsof three very important groups. First, HR practitioners who haveused this model and implemented the ROI process in their organi-zations continue to report their satisfaction with the process andthe success that it has achieved. The ROI process presented hereis user-friendly, is easy to understand, and has been proven topay for itself time and time again. A second important group,the clients and senior managers, who approve HR budgets, needmeasurable results, preferably expressed as a return on invest-ment. The ROI process presented here has fared well with thesegroups. Senior managers view the process as credible, logical,practical, and easy to understand. More importantly, they buyinto the process, which is critical for their future support. Thethird important group is the evaluation researchers who develop,explore, and analyze new processes and techniques. When exposedto this ROI process in a two-day or one-week workshop, theresearchers, without exception, give this process high marks. Theyoften applaud the strategies for isolating the effects of HR and

xii
the strategies for converting data to monetary values. Unanimously,they characterize the process as an important contribution to theHR field and to measurement science.
WHY THIS BOOK AT THIS TIME?
When examining current publications related to ROI, wediscovered there is no book with a comprehensive, practicalpresentation about ROI for HR using a process that meets thedemands of the three groups previously described. Most modelsand representations of the ROI process ignore or provide littleinsight into the two key elements essential to developing the ROI:isolating the effects of HR and converting data to monetaryvalues. Recognizing that many other factors will influence outputresults, this book provides ten strategies to isolate the effects ofHR, far more than any other presentation on the topic. Notenough attention has been provided to the issue of assigningmonetary values to the data derived from HR programs. Thisbook presents ten strategies for converting data to monetary values.
This book was developed at the request of many clients andcolleagues who asked for a simplified, concise description of theROI process, presented in a step-by-step approach. Our earliercontributions to the ROI process include two successful books,Return on Investment in Training and Performance ImprovementPrograms (Gulf Publishing) and The Consultant’s Scorecard(McGraw-Hill). What is needed, according to practitioners, is abook that addresses the ROI process for HR and presents amodel that is rational, feasible, and understandable to the typicalHR practitioner. This book should meet this need.
TARGET AUDIENCE
HR professionals are the primary audience for this book.Whether an individual is involved in the process of analysis,design, implementation, coordination, or evaluation, this bookwill be an indispensable reference. Individuals involved in allfunction aspects of HR should find the book valuable. Theseinclude recruiting and staffing, education and learning, compensa-tion and benefits, labor relations, compliance, fair employment

xiii
practices, human resource information systems, and HR consultingand services. The ROI process described in the book has beenused to measure a variety of human resources programs.
Individuals in HR leadership positions (managers, supervisors,team leaders, directors, vice presidents) make up the secondaudience. These HR leaders will find this book a helpful guideto ROI. With its step-by-step approach and case applications, itwill also be useful as a self-study guide.
A third audience is the management group. Because of thetremendous interest among the management team and clientsinvolved in ROI studies, this book should be a useful referencefor them. In a simple, easy-to-implement process, it shows howthe ROI is developed, in language that managers understand.
The fourth target audience is consultants, professionals,researchers, and seminar presenters who find this process to bean effective way to measure the impact of HR programs. Itprovides a workable model for consultants to evaluate changeinitiatives or consulting interventions. The book provides researcherswith a sound tool for evaluating a variety of HR programs. Itscontent should stimulate thought and debate about how the ROIis developed. The book should be a useful textbook or supple-mental book for a course on evaluation.
STRUCTURE OF THE BOOK
This book has two unique features that make it a useful guide.First, it presents the ROI model in a step-by-step process.Typically, a chapter is devoted to each major part of the modelas the pieces of the ROI puzzle are methodically assembled. Atthe conclusion, the reader has a clear understanding of the overallROI process.
The second unique feature is an application of the model indetailed cases based on actual situations. The cases reflect avariety of HR issues and programs. Readers can work througheach case step-by-step, exploring the issues and learning how toapply them to their own organizations. The actual results arepresented for each case. Case presentations represent a provenlearning tool to develop an understanding of the ROI process.

xiv
CHAPTER DESCRIPTIONS
Chapter 1, The Business Case for ROI, describes how the ROIprocess has evolved in recent years and how organizations aretackling this important issue. The chapter begins with a presenta-tion of the leading-edge approaches to measuring the HR contri-bution, of which the ROI process is one. Best practices for ROI,which form the basis for the book, are briefly described next.Various ROI criteria and requirements are presented to build afoundation for the remainder of the book. This chapter presentsa brief summary of the model for those who are being introducedto the process for the first time.
Chapter 2, Initial Analysis and Planning, shows the initialanalysis needed for an effective evaluation process. In somesituations the up-front analysis is the key to a successful evalua-tion. Planning for an ROI evaluation is fully described with anintroduction of the tools necessary to capture the details for acomprehensive impact study.
Chapter 3, Collecting Data During HR Program Imple-mentation, provides tools and techniques for capturing data tomeasure reaction, satisfaction, and learning as the HR programis being implemented. These measures are essential to provideimportant feedback, make process adjustments, and captureimportant building-block information needed to make theevaluation complete.
Chapter 4, Collecting Data After HR Program Implementation,presents a variety of approaches to one of the most fundamentalissues. Ranging from conducting surveys to monitoring per-formance data, the most common ways to collect data after anHR program has been implemented are described in this chapter.Useful tips and techniques to help select the appropriate methodfor a specific situation are presented.
Chapter 5, Isolating the Effects of an HR Program, presentswhat is perhaps the most important aspect of the ROI process.Ranging from the use of a control group arrangement to obtain-ing estimates directly from participants, several strategies arepresented that can determine the amount of improvement directlylinked to the HR program. The premise of this chapter is thatthere are many influences on business performance measures withHR being only one of them.

xv
Chapter 6, Converting Data to Monetary Value, presents anessential step for developing an economic benefit from HR.Ranging from determining the profit contribution of an increasedoutput to using expert opinion to assign a value to data, severalstrategies to convert both hard and soft data to monetary valuesare presented, along with many examples.
Chapter 7, Monitoring the Cost of Human Resource Programs,details specifically what types of costs should be included in theROI formula. Different categories and classifications of costs areexplored in this chapter, with the goal of developing a fullyloaded cost profile for each ROI calculation.
Chapter 8, Calculating the Actual Return on Investment,describes the actual ROI calculation and presents several issuessurrounding its development, calculation, and use. Examples arepresented to illustrate the process.
Chapter 9, Identifying Intangible Measures, is a brief chapterthat focuses on nonmonetary benefits from programs. Recognizingthat not all the output measures from HR can or should beconverted to monetary values, this chapter shows how the intangiblemeasures should be identified, monitored, and reported. Commonintangible measures are examined.
Chapter 10, Communicating Results, provides insight into themost appropriate and effective ways to communicate results toa variety of target audiences. Communication is critical and mustbe planned early in the process. This chapter shows how tocarefully select appropriate messages to meet the unique needsof important audiences.
Chapter 11, Forecasting the ROI, shows how the return oninvestment can be developed at different time frames, rangingfrom a pre-program measure to using post-program data. Severalexamples are presented to highlight each concept. This chapterunderscores the range of possibilities available for forecastingthe ROI.
Chapter 12, Implementation Issues, addresses a variety of issuesneeded to implement the ROI process effectively. Following logicalsteps and overcoming several hurdles, this chapter identifies theimportant issues that must be tackled for the ROI process tobecome a useful and long-lasting process.
The first case application, Sexual Harassment Prevention (Health-care Inc.), shows how the return on investment is developed for a

xvi
program aimed at reducing the number of sexual harassmentcomplaints. This case clearly shows that preventive programs canadd to the bottom line when the appropriate process is developedand an adequate measurement system is in place.
The next case, Competency-Based Pay System (National CrushedStone), shows the impact and return on investment of a competency-based pay system installed in construction aggregate plants. Thecase shows how the indisputable data were developed to showthe contribution of a new pay scheme and the effects that it hadon operations.
The third case, Absenteeism Reduction Program (Metro TransitAuthority), shows how an absenteeism reduction program addsto the bottom line, including a return on investment. The casereveals how comprehensive measurements are critical and howthe costing of absenteeism is a difficult and complex issue.
Stress Management (Midwest Electric Inc.) shows how theimpact of a stress management program is developed using a pilotgroup of six intact workteams. The analysis is comprehensive butnecessary to show senior management the actual value of thistype of program.
Safety Incentive Program (National Steel) shows how theimplementation of the simple safety incentive program hasdramatically lowered accidents and provided both short-term andlong-term payoffs, including a significant, positive ROI. Severalimportant issues are uncovered as the plan is implemented.
Case six, Executive Leadership Development (Imperial NationalBank), shows the monetary impact of the executive leadershipprogram. This case underscores the complexity of measuring theimpact of leadership development using an action learning process.More importantly, this case shows how changes in programdesign can significantly increase the actual return on investment.
The final case application, Technology-Based Learning (UnitedPetroleum International), shows how technology assisted learningcan add bottom-line value. This case illustrates how the use ofnontraditional training and delivery can add financial benefits toproduce a positive ROI.

xvii
Acknowledgments
No book is a work of the authors alone. We have receivedmuch help along the way to make this book a reality. Many ofthe concepts, issues, and techniques have been developed fromearlier research and application. Our previous, much publicizedwork on the ROI process provided the basic foundation for thisbook. In addition, many of our clients have provided helpfulsuggestions and allowed us to use their organizations to developnew tools and processes. Collectively they have made this animportant and rich new publication. To them we owe a debt ofgratitude, particularly for their interest in exploring new frontiersof measurement and evaluation.
Two individuals who stand out as pioneers in the early develop-ment of HR measurement and evaluation have influenced us.First, in the training and development field, Donald Kirkpatrickhas been a pioneer in the evaluation process. His ingeniousframework for the levels of evaluation have provided the founda-tion for many evaluation processes and models. Second, Jac Fitzenzhas been a pioneer in the development of HR measurements andHR benchmarking. Through his work at Saratoga Institute, Jachas made his mark on the HR field, clearly demonstrating andchallenging us with the measurement imperative. We are fortunateto count Jac and Don among our colleagues and are very proudto continue their work through ours.
Finally, we owe much appreciation to our staff at The ChelseaGroup, Performance Resources Organization, and Gulf. KellyPerkins has served us superbly in the managing and editing rolefor this publication and has kept us on schedule (or at least almoston schedule). Kelly Chappell and Jaime Beard provided excellentsupport in developing the manuscripts. At Gulf Publishing, we are

xviii
indebted to Kim Kilmer, who understood the tremendous timepressures we encountered as we attempted to develop this detailedmanuscript. To the folks at Gulf, PRO, and The Chelsea Group,we appreciate their support, encouragement, and understanding.
Jack J. PhillipsRon D. StonePatricia Pulliam PhillipsBirmingham, Alabama

P a r t I
The Need forROI in Human
Resources

2 THE HUMAN RESOURCES SCORECARD
2
Chapter 1
The Business Casefor ROI
There has been great debate about measuring the return oninvestment (ROI) in human resources (HR). Rarely does a topicstir up emotions to the degree the ROI issue does. Some indi-viduals characterize ROI as inappropriate. Others passionatelycharacterize ROI as the answer to their accountability concerns.The truth lies somewhere between these two extreme viewpoints.Understanding the drivers for the ROI process and the inherentweaknesses and advantages of ROI makes it possible to take arational approach to the issue and implement an appropriate mixof evaluation strategies within the HR function. This bookpresents the ROI process, a revolutionary approach to evaluatingan HR program that generates six types of measures representinga scorecard of results.
One thing is certain—ROI is not a fad. The concept of ROIhas been used for centuries. The seventy-fifth anniversary issueof Harvard Business Review traced the tools used to measureresults in organizations [1]. During the 1920s, ROI was theemerging tool to place a value on the payoff of investments. Inrecent years, the application of the concept has been expandedto all types of investments including human resources, trainingand education, change initiatives, and technology. Today, hun-dreds of organizations are developing ROI calculations for HRprograms. Two casebooks have been developed to show specificapplications [2]. As long as there is a need for accountability ofhuman resource expenditures and as long as the concept of an

THE BUSINESS CASE FOR ROI 3
Figure 1-1. Approaches to HR accountability.
investment payoff is desired, the ROI will be used to evaluatemajor HR investments.
APPROACHES TO HR ACCOUNTABILITY
Fortunately, the HR profession has made much progress withmeasurement and evaluation in recent years. Since the 1960s,several approaches have been used. These measurement approacheshave changed over time. Figure 1-1 illustrates the approximatetime frame for the use of particular measurement approaches.There is no argument that human resource functions must bemeasured, but determining the right approach is a significant chal-lenge. Following is a description of each of the twelve approaches.Although each one is presented separately, the techniques, processes,and focus of some approaches often overlap.
Early Approaches
The early approaches include those tried-and-true approacheswe are all so familiar with. Although these are still being used

4 THE HUMAN RESOURCES SCORECARD
by many organizations, other approaches are also being incor-porated as organizations work toward more effective measure-ment processes.
HR Management by Objectives (MBO). The evaluation processof measuring progress toward HR performance objectives gainedpopularity in the 1960s because of the widespread use of MBO[3]. With this approach, the HR department develops specificobjectives and evaluates performance against those objectives.Objectives are based on what management wants accomplishedor on what is perceived to be necessary to achieve an adequatelevel of performance. Measures of turnover, absenteeism, jobsatisfaction, employee health, and compensation expenses arequantifiable and are considered objectives for many HR functions.Whatever measures are determined, they must be related to organi-zation performance in order to represent meaningful approaches toreflecting the contribution HR makes to the organization.
Employee Attitude Surveys. Many organizations still use em-ployee attitude surveys to evaluate the effectiveness of their HRdepartments. These surveys attempt to link employee attitudes toorganizational performance. One study designed to measure theimpact of surveys on an organization compared the use of em-ployee surveys with the profitability of the company. As expected,those organizations responding as more profitable than most ofthe industry were high users of employees surveys. On the otherhand, those organizations describing themselves as less profitablerarely used surveys [4]. Other studies of organizations usingemployee surveys have proven positive relationships betweenorganization performance and the attitudes of employees. Al-though this is one method to collect information regardingorganization performance, it is often used in conjunction withother methodologies.
HR Case Studies. Another approach to evaluate the success ofHR programs is to present results in a case study format toselected audiences. For example, an organization may report thesuccess of a labor-management program in a case study reportto all employees. These case studies have significant value andcan be presented with little cost. They are developed using data

THE BUSINESS CASE FOR ROI 5
about HR performance, reaction from individuals, or interviewswith participants involved in HR programs or services.
The case study approach does have some weaknesses, however.It does not represent a balanced measure of the performance ofthe HR function but provides some evidence that certain pro-grams are successful. It usually does not represent an ongoingevaluation of any particular program or the overall function—only a one-shot examination. Also, it is often subjectively based,and a program’s success is usually judged by those providing thedata that is to be included in the case study. Finally quantitativedata are not always a part of these studies. Even with these weak-nesses, however, the case study approach of evaluation should bean important part of an organization’s overall measurement andevaluation program.
HR Auditing. A human resource audit is an investigative, analy-tical, and comparative process that attempts to reflect the effec-tiveness of the HR function. It undertakes a systematic searchthat gathers, compiles, and analyzes data in depth for an extendedperiod, usually one year, instead of with daily formal and infor-mal reports. The use of HR audits has increased significantly. Onereason for this is a commitment to moving the HR function fromservice to the strategic arena [5].
HR auditing is an extension of traditional auditing, which untilrecent years was limited to the financial practices of the organi-zation. There has been a tremendous expansion in the extent, scope,and types of information being audited. In addition to humanresources, auditing has now moved into production, operations,sales, quality, data processing, and engineering. It has become acritical analytical tool to assess how well—or how poorly—anactivity is performed. HR auditing provides the necessary baselinedata so that actions can be taken to improve HR performance. HRauditing is an important process that can help improve the efficiencyof the HR function; it does, however, fall short of a valid approachto measuring the contribution of the HR function.
Solid, Value-Added Approaches
The four techniques illustrated in the center group of Fig-ure 1-1 are considered sound approaches to generate increased

6 THE HUMAN RESOURCES SCORECARD
accountability to the HR function. These approaches are beingused regularly by most progressive organizations.
HR Key Indicators. In some HR evaluation efforts, key measuresare developed that reflect the major efforts of the HR function.In some cases, these measures are linked to organizational perfor-mance. The key indicators approach is perhaps the best knownand established method of HR evaluation. It uses a set of quanti-tative measures such as accident frequency rate, absenteeism rate,turnover rate, and average time to fill requisitions. Key indicatorsmay come from areas such as:
� Employment� Compensation administration� Diversity� Employee benefits� Learning and development� Work environment/safety� Performance� Labor relations� Careers� Overall effectiveness
Although this approach of tying key measures to organizationalperformance seems sound, there is little empirical evidence toshow this direct connection. This area still needs additionalsupport, research, and study.
HR Cost Monitoring. Although most executives are aware of thetotal cost of payroll and benefits, they do not understand thatchanges in HR practices can result in a tremendous increase incosts. One approach to evaluating HR performance is to developHR costs and use them in comparisons with cost standards. Someorganizations compare these costs with other internal costs; thesecomparisons, however, could possibly reinforce complacency. Com-parisons with other similar organizations may be more effective.Examples of HR costs monitored by organizations include:
� Employment—Cost per hire—Orientation cost

THE BUSINESS CASE FOR ROI 7
� Learning and development—Cost per employee—Total costs as a percent of payroll
� Benefits—Costs as a percent of payroll—Healthcare costs per employee
� Compensation—Compensation expense as a percent of operating expense—Total compensation costs
� Fair employment—Cost per complaint—Cost of litigation
� Labor relations—Cost per grievance—Cost of work stoppages
� Safety and health—Accident costs—Costs of citations/fines
� Overall HR—HR costs as a percent of operating expenses—Turnover costs
Tracking costs alone is no guarantee of a direct link to organi-zational performance. Also, although costs comparisons arehelpful, standard HR cost data are not yet available. From apractical approach, HR costs monitoring is necessary as input forother approaches to evaluation. For example, in the benefit/costanalysis, HR cost data are required for comparisons.
HR Reputation. Some HR professionals suggest that the effective-ness of the HR function should be judged by feedback fromthose it is designed to serve, often referred to as constituenciesor clients. Constituencies depend on, or exert control over, theHR function. Proponents of this approach argue that effective-ness is a value judgment. Even objective criteria are only onestep removed from subjectivity. Someone has to determine whatlevel of objective performance is considered effective and whatlevel is considered ineffective. For these proponents, it is moreimportant to measure the perception of the function in themind of constituents [6].

8 THE HUMAN RESOURCES SCORECARD
It is important that the HR function is perceived as effectiveand its clients and users are satisfied. However, there is littleconcrete evidence of a relationship between levels of satisfactionamong constituencies and overall organizational performance.This process ignores HR outcomes that may directly impact thebottom line.
Competitive HR Benchmarking. A few organizations developedkey measures that represent the output of the HR function. Themeasures are compared with measures from other organizationsregarded as having best practices within a given industry. Thisprocess, known as competitive benchmarking, began as an impor-tant development in the American quality movement. Despite thesurge of interest in the process, few companies know what theyare doing when they undertake a benchmarking study. Some seethe process as merely a comparison of processes to ensure func-tional similarity with other companies. Others take the processmore seriously and view it as a learning process that can improveoverall HR effectiveness. Although benchmarking has provensuccessful in quality and other areas, it is slow to develop withinthe human resources function, though progress is being made.
Leading-Edge Approaches
The last four techniques are often considered the leading-edgeapproaches based on interest in the issue. Although some organiza-tions have made progress with these techniques, they are still in adevelopmental stage within the vast majority of organizations.
Return on Investment. Probably the most convincing approachto HR evaluation is to compare the cost of HR programs withthe benefits derived from them. In most cases, the cost of HRprograms can be developed or monitored. Although confusionsometimes exists concerning ways to allocate specific costs, overallprogram costs can usually be pinpointed. The difficulty lies indetermining program benefits. In many cases, expert input is usedto assign monetary values to benefits derived from programs,particularly for intangible benefits. Consequently, this approachis sometimes avoided as an evaluation tool. However, reliabletechniques to generate accurate estimates do exist, and these arepresented in detail in the following chapters.

THE BUSINESS CASE FOR ROI 9
The ROI process is experiencing success in the HR field andeven more so in training and development, quality, technology,and change management. This approach to measurement andevaluation is used in the private and public sectors around theworld. The process is built around the basic financial equation,earnings divided by investment, or net benefits divided by costs.And although there are various processes on the market today thatmeasure some level of impact of HR programs, most do not meetthe criteria and credibility test needed for an effective ROI process.As compared with the other leading approaches presented below,the ROI approach presented in this book seems to have the greatestpromise as an evaluation methodology for today’s organizations.
HR Effectiveness Index. A few organizations have attemptedto develop a single composite index of effectiveness for theHR function. One of the first examples of such an index wasdeveloped and used by General Electric in the 1950s [7]. ThisEmployee Relations Index (ERI) was based on eight indicatorsselected from a detailed study of employee behavior. Among theindicators were absenteeism, initial dispensary visits, terminations,grievances, and work stoppages.
Another index attempt was the Human Resource PerformanceIndex (HRPX), which uses massive data banks made availableby human resources systems [8]. According to its developer, theHRPX has been successfully used to evaluate HR functions such asselection, compensation, development, and retention. No attempt wasmade to validate this index against organizational performance.
The most comprehensive study about this issue was conductedto develop and test a Human Resources Effectiveness Index(HREI) [9]. The study, involving seventy-one organizations fromeight industry segments, provided additional empirical evidenceof the relationship between HR performance and organizationaleffectiveness. Six measures of HR department performance wereidentified for use in the study:
� HR expenses/total operating expenses� Total compensation/total operating expenses� Total cost of benefits/total operating expenses� Training and development expenses/total employees� Absence rate� Turnover rate

10 THE HUMAN RESOURCES SCORECARD
The HREI represented a composite of the six measures, andsignificant correlations were developed with revenue/employees,assets/employee costs, operating income/employee costs, andoperating income/stockholders’ equity (ROE).
An index is appealing because it is simple to compute andeasy to understand. Many have been useful for comparing oneorganization with another and can be used for internal controland goal setting.
Human Capital Measurement. In the early 1960s and 1970s anovel approach to evaluation was taken: human resources account-ing (HRA). Interest in this approach seemed to diminish in theearly 1980s; however, it has recently obtained renewed emphasis.This concept, currently labeled human capital measurement,attempts to place a value on employees as assets in an organi-zation and to measure improvements or changes in these valuesusing standard accounting principles. It is an extension of theaccounting principles of matching cost and revenues and oforganizing data to communicate relevant information in financialterms. Human resources are viewed as assets or investments ofthe organization. Methods of measuring these assets are similarto those for measuring other assets.
Although the concept of measuring human capital has regainedpopularity, it is not without its share of critics. The conceptdeveloped slowly, primarily because of controversies surroundingthree important issues: (1) if human beings are indeed assets,(2) what costs should be capitalized, and (3) what methods aremost appropriate for establishing a value for employees with theeventual allocation of such value to expense. There are legitimateproblems concerning the concept that employees can be ownedor controlled by an organization, which is a prerequisite fordefining them as assets. Even with these concerns, however,promising signs indicate many corporations will begin listing thefinancial value of their human assets on the balance sheet. Thisaction can lead to benefits that greatly outweigh the cost of imple-menting an accounting system to measure human capital [10].
HR Profit Center. According to some researchers and prac-titioners, the ultimate approach to evaluation is the profit-centerapproach. This concept requires a shift from the traditional view

THE BUSINESS CASE FOR ROI 11
of the HR department as an expense center in which costs areaccumulated, to a view of HR as an investment that can achievea bottom-line contribution and, in some cases, actually operateas a profit center. Increases in the investment in HR throughadditional staff, programs, and resources are expected to improvethe performance of the organization. This is an important shiftin the perception of the HR function [11].
The underlying premise of this approach is that user depart-ments such as production, operations, sales, and engineering arecharged for the services of the HR department and, in some cases,have the option of using external services in lieu of those offeredby the HR function. In effect, the HR department either makesa profit, breaks even, or experiences a loss. Assuming the servicesare priced on a competitive basis, the profit represents a financialreturn on the investment allocated to the HR function [12].
Adoption of this approach requires the HR department tobecome client-oriented and quality conscious in delivering servicesand programs. Some organizations have expanded this conceptto include selling HR services to outside clients, thus generatingadditional income for the organization. Although the profit-centerapproach has made some progress and is generating considerableinterest, some legitimate barriers exist in its implementation. Theprofit center represents a significant departure from the tradi-tional HR management practices, and because of this, it maynever be fully implemented in most organizations.
Summary of Approaches
Although there are many approaches to bringing accountabilityto the HR function, using a variety of tools and based on avariety of assumptions, HR departments still have difficultyachieving success with current approaches. Unfortunately, thereare few success stories about comprehensive HR evaluationprograms that show the contribution of the function. Manyresearchers question the quantitative approach to evaluation,suggesting that a return on investment in employees must beapproached cautiously and judiciously, and that any such returnmay be the result of activities initiated by others rather than theHR staff. Some professionals even question the requirement ofbottom-line results from HR programs by arguing that it is not

12 THE HUMAN RESOURCES SCORECARD
possible to isolate monetary benefits an organization may receivefrom an HR program. Although there is an important trend towardHR accountability, a major problem is that evaluation approacheshave been unable to deliver what top management and even HRpractitioners want them to deliver: objective data showing thecontribution of the HR function to organizational effectiveness.
The twelve approaches presented provide an array of usefultools to help the HR department develop a comprehensive strategyto show its contribution. Table 1-1 shows a comparison of theseapproaches, as they are used to collect both qualitative andquantitative data from a multitude of sources. The measurementfocus is outlined, the relative cost is provided, and the relative valueof the information (from the perspective of the client) is presented.Table 1-2 shows how each approach could be used to provideinput about a particular issue—in this case, reporting employeeturnover [13]. Although use of multiple approaches is necessaryto measure important issues such as turnover, use of all approacheswould be a tremendous overkill.
Of the twelve approaches, the ROI process, described in detailin this book, provides a balanced approach to measuring thebottom-line impact of HR initiatives. It is being used by organi-zations around the world and can be implemented within the budgetand resource constraints of most organizations. The remainder ofthis chapter will present critical ROI issues, as well as the businesscase for implementing the ROI process within an organization.
WHY ROI?
Developing a balanced set of measures, including measuring theROI, has earned a place among the critical issues in the HR field.The topic routinely appears on conference agendas and at profes-sional meetings. Journals and newsletters embrace the conceptwith increasing print space. Clients are asking that ROI calcula-tions be conducted for specific programs and initiatives. Even topexecutives have increased their interest in ROI information.
Although the interest in ROI has heightened and progress isbeing made, it is still an issue that challenges even the mostsophisticated and progressive organizations. Some argue that it
(text continued on page 16)

THE BUSINESS CASE FOR ROI 13
Table 1-1Comparison of Approaches to Measure the HR Contribution
RelativeRelative Value of
Approach Measurement Focus Cost Information
1. HR Management Goal Setting for HR Low Moderateby Objectives Performance Measures
2. Surveys Attitudes/Perceptions Moderate Moderate
3. HR Case Qualitative Descrip- Low LowStudies tion with Data
4. HR Auditing Efficiency/Existence Low Lowof Practices
5. HR Key Program/Function Moderate ModerateIndicators Performance Measures
6. HR Cost Program/Function Low LowMonitoring
7. HR Reputation Attitudes/Perceptions Moderate Moderate
8. Competitive Performance High HighBenchmarking Measures/Practices
9. ROI Benefits vs. Costs High High
10. HR Effectiveness Multiple Key High HighIndex Indicators
11. Human Capital/ Value of Skills/ High ModerateHR Accounting Capabilities/
Performance ofEmployees
12. HR Profit Profit Contribution High HighCenters of Programs/Services

14T
HE H
UM
AN
RESO
UR
CES S
CO
REC
AR
D
Table 1-2Integrating the Various Approaches to Measuring HR Contribution:
Monitoring, Analyzing, and Reporting Information Related to Employee Turnover
1.
2.
3.
4.
5.
Approach toMeasure the
HR Contribution
Management byObjectives (MBO)
Employee SurveyData
Case Studies
HR Auditing
Key Indicators
Major Focus ofthe Approach
Here’s our targetfor turnover forthe next year . . .
Our turnover islinked to . . .
In one situation,we preventedturnover by . . .
Here’s how wellwe adhere to ourpractices to pre-vent turnover . . .
Here’s our pro-gress with thisimportant measureof HR perfor-mance . . .
How the Approach Can Be Used to Reflect Information About Turnover
Specific objectives are established for turnover measures, reflectingprevious performance, external factors, environmental pressures, andplanned efforts to prevent/reduce turnover.
Job satisfaction measures, which correlate with employee turnover, aremonitored. Correlations are established from research or from analysiswithin the firm.
Successful cases are documented in which turnover reduction projectsresulted in a reduction of turnover. Also, turnover prevention initiativesthat have prevented turnover from rising to expected levels, localbenchmarks, or industry standards are highlighted in case studies.
Various policies, procedures, and practices that prevent, monitor, andanalyze turnover are audited for completeness, accuracy, and effectiveness.The scope of this audit includes practices such as exit interviews, com-petitive pay, and complaint resolution systems.
Turnover is one of the key indicators tracked in most organizations andcompared with historical trends internally and with other organizationsthrough reports such as the Saratoga Human Resource Effectiveness report.

TH
E BU
SINESS C
ASE
FOR R
OI
156.
7.
8.
9.
10.
11.
12.
HR CostMonitoring
HR Reputation
CompetitiveBenchmarking
Return onInvestment
HR EffectivenessIndex
Human Capital/HR Accounting
Profit Center
Here’s the cost ofturnover . . .
Here’s how wellwe address theturnover issue . . .
Here’s what ourcompetitors areexperiencing withturnover . . .
Here’s the ROI forour turnover reduc-tion program . . .
Turnover is one ofseveral measuresin our HR index.
How we addressturnover reflectsour progress withhuman capital . . .
Here’s what itwould cost us toreduce turnover . . .
The fully loaded cost of turnover is calculated or estimated based oncomparative turnover studies. Absent an actual turnover cost study, it ishelpful to reach an agreement about the approximate cost of turnover andreport it routinely to the operating areas in which turnover is excessive.
The various stakeholders report how well the organization preventsturnover, reacts to turnover issues, and resolves turnover problems.
Employee turnover data by job category, classification, region, organization,and company are all benchmark items in an HR competitive benchmarkingproject. In addition, specific programs and practices to prevent turnover orreduce excessive turnover are also benchmarked in this type of project.
Specific programs, designed to either prevent or reduce turnover, aredeveloped and implemented and the actual return on investment iscalculated. The ROI compares the monetary benefit of the program withthe actual cost of the program.
The HR Effectiveness Index is composed of several measures, with turn-over reflecting the most important measure. When combined, the index iscorrelated with the productivity and profitability of the firm.
Employee turnover is one critical measure of human capital for most organi-zations. Low turnover is an indication that the organization is retainingtalented employees. High turnover reflects a drain on intellectual capital,whereas zero turnover reflects a lack of new ideas from new employees.
A department, division, region, operating unity, or subsidiary is chargedfees for specific programs or services related to turnover prevention orreduction. The client pays competitive rates for these services or programsand is usually free to buy the same services externally.

16 THE HUMAN RESOURCES SCORECARD
is not possible to calculate the ROI in HR programs, while othersquietly and deliberately proceed to develop measures and ROIcalculations. Regardless of the position taken on the issue, thereasons for measuring the ROI remain. Most HR staff membersshare a concern that they must eventually show a return on theinvestment in their programs. Otherwise, resources may be reduced,or the function as a whole may lose credibility with the organization.
Rationale for Developing ROI
Although the rationale for focusing on ROI may be obvious,it helps to explore the various reasons why now is the time topursue the actual calculations for the ROI. The HR function hasexisted for many years and is a core activity of most medium-sized and large organizations. Several issues create an explanationas to why now is the time to begin measuring HR programs andinitiatives more aggressively than ever before.
Client Demands. Today, more clients—those funding the HRinitiative—are requesting evaluation data, up to and includingmeasuring the actual ROI. Clients commonly ask the key questionat the beginning of most HR programs: “How do I know if thiswill pay off for me, and will this be a good return on myinvestment?” Although the accountability issue has always beenpresent, it has never existed at today’s level. When the clientdemands a process, it must be explored and implemented, andthe process must be credible enough for the client to believe theresults. Client questions must be addressed in a simple, rationalway. Avoiding the issue will create distrust between the client andthe HR staff and ultimately may cause the program to get off track.
Competitive Advantage. Perhaps one of the most importantreasons to pursue a more comprehensive measurement and evalu-ation, including ROI, is to meet or beat the competition for scarceresources. Many HR functions are beginning to develop the ROIaround initiatives and programs to stay competitive or perhapsto stay ahead of other functions competing for internal resourcesand funding. It is imperative to address the issue in a proactive
(text continued from page 12)

THE BUSINESS CASE FOR ROI 17
manner with a comprehensive approach to developing ROI forHR programs.
Resource Allocation. When HR can show the actual contributionof an initiative in monetary terms, an excellent case can be madefor additional resources. Some organizations are even using theROI process to drive additional funding and increased budgets,for example, by placing annual budgets at risk by basing themon a threshold ROI. If the minimum ROI is met for key HRprograms, the budget will remain level. Exceeding the thresholdcan result in increased budget; falling below the threshold cancause a reduction of budget. Although this provides an excellentmeans by which to focus only on those programs and initiativesthat positively impact the bottom line, the process needs to becarefully managed. Measuring the ROI should never be used toassess individual performance, and much can be learned from anegative ROI. Therefore, the HR function should not focus only onthose programs that are expected to result in a positive ROI. A clearset of criteria should be used to select programs for ROI evalua-tion. Program selection is discussed later in this book.
Case Study Database. Developing a history of ROI applicationsultimately builds an important database of results. The databasenot only shows clients and executive management the successwith previous programs, but it can eventually show various trendsand patterns of HR interventions within the organization. Asubstantial database of projects using a credible, accepted processcan be a crucial advantage and a persuasive selling point whenpursuing new initiatives.
Self-Satisfaction. Individuals engaged in professional work wantto know that their efforts make a difference. Most HR staffmembers want to know if they are making a contribution interms that managers respect and appreciate. Showing the ROImay be one of the most self-satisfying parts of an excellent HRprogram. In addition to completing projects on schedule, withinbudget, and with positive client feedback, the actual value-addedbenefits in monetary terms with an impressive ROI adds the finaltouch to a major project. This provides additional evidence thatwhat the HR function does makes a difference.

18 THE HUMAN RESOURCES SCORECARD
Consequences of Improper or Ineffective HR Practices. Many HRinterventions have not lived up to their promises or even expec-tations. They have not delivered the results the client expected—at least not in the terms management understands, primarilybottom-line contribution. As more and more HR projects areundertaken, consuming precious resources in an organization, theresults have simply not materialized. And when the results arereported, skepticism and concern often surrounds the credibilityof the data, the objectivity of data, and the thoroughness of theanalysis. This has caused executive management to rethink therole of HR, as well as the accountability of HR, and to placemore restraints and demands on the HR function, includingdeveloping ROI data for selected programs.
The Need for Balanced Measures. For years a debate has ensuedabout what should or should not be measured and how. Someprefer soft data directly from the client or consumers. Othersprefer hard data focused on key issues of output, quality, cost,and time. Still others have argued for a balance of measures, andthe latter camp seems to be winning. There exists a critical needto examine data from a variety of groups at different time framesand for different purposes. This mixture of data, often referredto as a balanced approach, is driving the need for the ROIprocess described in this book. The ROI process develops sixtypes of data.
Top Executive Requirement for HR Contribution. ROI is nowenjoying increased interest from the executive suite. Top execu-tives who have watched their HR budgets grow without theappropriate accountability measures have become frustrated and,in an attempt to respond to the situation, have demanded a returnon investment for HR programs. Measuring the ROI of HRprograms is becoming a global issue because executives fromaround the world are concerned about accountability. Whetherthe economy is mature or developing, the economic pressures ofrunning a global enterprise make the accountability of HR an issue.
A CREDIBLE APPROACH
For an ROI process to be feasible, it must balance many issues,including feasibility, simplicity, credibility, and soundness. More

THE BUSINESS CASE FOR ROI 19
specifically, three major target audiences must be satisfied. First,the HR staff members who use a process must have a simpleapproach. Unfortunately, when they attempt to look for an ROIprocess, they often find long formulas, complicated equations, andcomplex models. These make the process appear confusing andcomplex. This has caused many HR staff members to give up ina fit of frustration, assuming that the ROI cannot be developedor that it is too expensive for most applications. Because of theseconcerns, a simple, easy-to-understand process is necessary so thatthe steps and strategies can be implemented. Also, the processcannot take an excessive amount of time to implement, consum-ing too much staff time. Finally, the process should not be tooexpensive. Given the fierce competition for financial resources,the HR function needs a process that will not command a signifi-cant portion of the HR budget. The ROI process presented inthis book meets this important challenge.
Second, an ROI process that will meet the unique requirementsof the clients is needed. The clients who request the HR inter-ventions and approve projects need a process that will providequantitative and qualitative results. They need a process that willdevelop a calculation similar to the ROI formula applied to othertypes of investments. And, as with the HR staff, they want aprocess that is simple and easy to understand and that reflectstheir point of reference, background, and level of understanding.They neither want nor need a string of formulas, charts, orcomplicated models. Instead, they need a process that they canexplain to others if necessary. More importantly, they need aprocess with which they can identify—one that is sound andrealistic enough to earn their confidence. The process outlinedin this book meets the important needs of the client group.
Finally, researchers in measurement and evaluation need aprocess that they can support—one that holds up under theirscrutiny and close examination. Researchers want to use models,formulas, assumptions, and theories that are sound and based oncommonly accepted practices. Also, they want a process thatproduces accurate values and consistent outcomes. They want aprocess that can be replicated from one situation to another, areliable process that will result in the same measurements if twodifferent practitioners are pursuing a project. They want a processthat uses estimates carefully. If estimates are necessary, theresearchers want a process that provides the most accuracy within

20 THE HUMAN RESOURCES SCORECARD
the constraints of a given situation, recognizing that adjustmentsneed to be made when there is uncertainty in the process. Fortu-nately, the process presented in this book has met the needs ofresearchers who have examined the process closely.
Along with meeting the critical challenges of these three importantgroups, the ROI process must meet certain criteria to be acceptedand implemented fully within an organization. The following tencriteria are based on the input from HR managers and specialists.
1. SimpleThe ROI process must be simple and void of complexformulas, lengthy equations, and complicated method-ologies. Most ROI models have failed in this requirement.In an attempt to obtain statistical perfection using manytheories, several ROI models and processes have becometoo complex to understand and use. Consequently, theyhave not been implemented.
2. EconomicalThe ROI process must be economical, with the ability tobe implemented easily. The process should have the capa-bility to become a routine part of HR without requiringsignificant additional resources. Sampling for ROI calcu-lations and early planning for ROI are often necessary tomake progress without adding new staff.
3. CredibleThe assumptions, methodology, and outcomes must becredible. Logical, methodical steps are needed to earn therespect of practitioners, senior managers, and researchers.This requires a very practical approach for the process.
4. Theoretically SoundFrom a research perspective, the ROI process must betheoretically sound and based on generally accepted prac-tices. Unfortunately, this requirement can lead to an exten-sive, complicated process. Ideally, the process must strikea balance between maintaining a practical and sensibleapproach and a sound and theoretical basis for the proce-dures. This is perhaps one of the greatest challenges tothose who have developed models for the ROI process.
5. Account for Other FactorsAn ROI process must account for other factors that influ-ence output variables. Addressing one of the most often

THE BUSINESS CASE FOR ROI 21
overlooked issues, isolating the influence of an HR pro-gram, is necessary to build credibility and accuracy withinthe process. The ROI process should pinpoint the contribu-tion of the program when compared with other influences.
6. AppropriateThe ROI process must be appropriate for a variety of HRprograms. Some models apply to only a small number ofprograms, such as productivity improvements. Ideally, theprocess must be applicable to all types of HR initiatives.
7. FlexibleThe ROI process must have the flexibility to be appliedon a pre-program basis, as well as a post-program basis.In some situations, an estimate of the ROI is requiredbefore the actual program is developed. Ideally, the processshould be able to adjust to a range of potential timeframes for calculating the ROI.
8. ApplicableThe ROI process must be applicable with all types of data,including hard data, which are typically represented asoutput, quality, costs, and time; and soft data, whichinclude job satisfaction, customer satisfaction, absenteeism,turnover, grievances, and complaints.
9. Inclusive of CostsThe ROI process must include the costs of the HR pro-gram. The ultimate level of evaluation compares the bene-fits with costs. Although the term ROI has been looselyused to express any benefit of HR, an acceptable ROIformula must include costs. Omitting or understating costswill only destroy the credibility of the ROI values.
10. Successful Track RecordFinally, the ROI process must have a successful trackrecord in a variety of applications. In far too many situa-tions, models are created but are never successfully applied.An effective ROI process should withstand the wear andtear of implementation and prove valuable to users.
Because these criteria are considered essential, an ROI processshould meet the vast majority of, if not all, the criteria. The badnews is that most ROI processes do not meet these criteria. Thegood news is that the ROI process presented in this book meetsthe ten criteria listed above. Readers are encouraged to analyze

22 THE HUMAN RESOURCES SCORECARD
the process they are currently using and determine which of theabove criteria are being met by that process.
Not only does the ROI process meet these ten criteria, but italso provides the HR staff with a useful, helpful tool that canserve as a routine and integral part of HR interventions. Todevelop a credible approach for calculating the ROI in HR,several pieces of an important puzzle must be developed. Figure1-2 shows the major elements of the puzzle.
The Evaluation Framework
The ROI process adds a fifth level to the four levels of evalu-ation developed almost forty years ago by Donald Kirkpatrick[14]. The concept of different levels of evaluation is both helpfuland instructive in understanding how the return on investmentis calculated. Table 1-3 shows a modified version of Kirkpatrick’sfour-level framework—a fifth level is added to distinguish theultimate level of evaluation, which is ROI. At Level 1, reactionand satisfaction, reaction from participants involved in an HRprogram is measured, along with input about a variety of issues.Almost all HR programs are evaluated at this level in one wayor another, usually with generic questionnaires and surveys.
Figure 1-2. The evaluation puzzle.

THE BUSINESS CASE FOR ROI 23
Although reaction and satisfaction is important, a favorable inputdoes not ensure that participants will imple-ment the improve-ments or new process or that they will follow new guidelinesor procedures.
At Level 2, learning, measurements focus on what participantslearned during the HR program if there is a learning component.A learning check is helpful to ensure that participants absorb newskills and knowledge and that they know how to use it to makethe HR program successful. However, a positive measure at this levelis no guarantee that the program will be successfully implemented.
At Level 3, application and implementation, various follow-upmethods are used to determine if participants apply on the jobwhat is needed to make the initiative successful. The frequencyand use of skills are important measures at Level 3. In addition,this measure includes all the steps, actions, tasks, and processesinvolved in the implementation of the initiative. Although Level3 evaluation is important to gauge the success of the initiative’s
Table 1-3Characteristics of Evaluation Levels
Level Brief Description
1. Reaction and satisfaction Measures participants’ reactionto the initiative and stakeholdersatisfaction with the HR projectand the planned implementation
2. Learning Measures skills, knowledge, orattitude changes related to the HRprogram and implementation
3. Application and Measures changes in behavior on3. implementation the job and specific application and
implementation of the HR program
4. Business impact Measures business impact changesrelated to the HR initiative
5. Return on investment Compares the monetary value of thebusiness impact with the costs forthe HR program; usually expressedas a percentage

24 THE HUMAN RESOURCES SCORECARD
implementation, it still does not guarantee a positive impact onthe organization.
At Level 4, business impact, the measurement focuses on theactual results achieved by the HR initiative. Typical Level 4measures include output, quality, cost, time, and customer satis-faction. Although the HR initiative may produce a measurablebusiness impact, there is still a concern that the costs of the HRprogram may be too high. At Level 5, return on investment, themeasurement compares the program’s monetary benefits with thecosts. Although the ROI can be expressed in several ways, it isusually presented as a percentage or benefit/cost ratio. Theevaluation cycle is not complete until the Level 5 evaluation, theultimate level of evaluation, is conducted.
Although almost all HR functions conduct evaluations tomeasure satisfaction, few actually conduct evaluations at the ROIlevel. Perhaps the best explanation for this is that ROI evaluationis often characterized as a difficult and expensive process. Althoughbusiness results and ROI are desired, it is crucial to evaluate theother levels. A chain of impact should occur through the levels,as the skills and knowledge learned (Level 2) during the HRintervention are applied on the job as implementation takes place(Level 3) to produce business impact (Level 4). If measurementsare not taken at each level, it is difficult to conclude that theresults achieved were actually produced by the HR initiative.Because of this, it is recommended that evaluation be conductedat all levels when a Level 5 evaluation is planned.
The ROI Process Model
The ROI process, presented briefly in this chapter and exploredthroughout this book, had its beginnings several years ago as theprocess was applied to a variety of programs and initiatives. Sincethen, the process has been refined and modified, and is repre-sented by the model in Figure 1-3. As the figure illustrates, theprocess is comprehensive; data are developed at different timesand gathered from different sources to develop the six types ofmeasures that are the focal point of this book. To date, morethan 300 case studies demonstrate the use of the ROI process,and the number is growing rapidly. Each part of the process isbriefly mentioned below.

THE BUSINESS CASE FOR ROI 25
Figure 1-3. ROI process model.
Evaluation Planning. The first two parts of the ROI process focuson two critical planning issues. The first step is to developappropriate objectives for the HR initiatives. These are oftenreferred to as the ultimate objectives as a particular solution toa problem is implemented. These range from developing objectivesfor satisfaction to developing an objective for the ROI and aredefined in more detail in Chapter 2.
With the objectives in hand, the next step is to develop adetailed evaluation plan. This involves two important documents.A data collection plan indicates the type of data collected, themethod for data collection, data sources, the timing of collection,and the various responsibilities. The next document, the ROIanalysis plan, details how the HR program is isolated from otherinfluences, how data are converted to monetary values, theappropriate cost categories, the expected intangible measures, andthe anticipated target audience for communication. These plan-ning documents are necessary for the process to be implementedappropriately. This is also discussed in Chapter 2.
Collecting Data. Data collected during the HR program measurereaction and satisfaction at Level 1 and learning at Level 2.Collecting data during the HR program intervention ensures thatadjustments are made and the process is altered as necessary tokeep the assignment on track. The satisfaction and learning dataare critical for immediate feedback and necessary to make theHR intervention successful.
26 THE HUMAN RESOURCES SCORECARD
After program implementation, post-program data are collectedand compared with pre-program situations, control group dif-ferences, and expectations. Both hard data, representing output,quality, cost, and time; and soft data, including work habits, workclimate, and attitudes, are collected. Data are collected using avariety of methods, such as the following:
� Follow-up surveys measure satisfaction from stakeholders.� Follow-up questionnaires measure reaction and uncover
specific application issues with HR programs.� On-the-job observation captures actual application and use.� Tests and assessments are used to measure the extent of
learning (knowledge gained or skills enhanced).� Interviews measure reaction and determine the extent to
which the HR program has been implemented.� Focus groups determine the degree of application of the HR
solution in job situations.� Action plans show progress with implementation on the job
and the impact obtained.� Performance contracts detail specific outcomes expected or
obtained from the HR program.� Business performance monitoring shows improvement in
various performance records and operational data.
The important challenge in data collection is selecting themethod or methods appropriate for the setting and the specificprogram, within the time and budget constraints. Data collectionmethods are covered in more detail in Chapters 3 and 4.
Isolating the Effects of the HR Program. An often-overlookedissue in most evaluations is the process of isolating the effectsof an HR program. In this step of the process, specific strategiesare explored that determine the amount of performance improve-ment directly related to the program. This step is essential becausemany factors will influence performance data after an HR program.The specific strategies in this step will pinpoint the amountof improvement directly related to the intervention. The resultis increased accuracy and credibility of the ROI calculation.Organizations have used several strategies to tackle this impor-tant issue:

THE BUSINESS CASE FOR ROI 27
� A pilot group of participants in an HR program is com-pared with a control group not participating in the programto isolate program impact.
� Trendlines are used to project the values of specific outputvariables, and projections are compared with the actual dataafter an HR program.
� A forecasting model is used to isolate the effects of an HRprogram when mathematical relationships between inputand output variables are known.
� Participants/stakeholders estimate the amount of improvementrelated to an HR program.
� Supervisors and managers estimate the impact of an HRprogram on the output measures.
� External studies provide input about the impact of anHR program.
� Independent experts provide estimates of the impact of anHR program on the output data performance variable.
� When feasible, other influencing factors are identified, andthe impact is estimated or calculated, leaving the remainingunexplained improvement attributable to the HR program.
� Customers provide input about the extent to which theHR program has influenced their decisions to use a productor service.
Collectively, these strategies provide a comprehensive set oftools to tackle the important and critical issue of isolating theeffects of an HR program. Chapter 5 is devoted to this importantstep in the process.
Converting Data to Monetary Values. To calculate the return oninvestment, business impact data are converted to monetaryvalues and compared with intervention costs. This requires avalue to be placed on each unit of data connected with the HRprogram. The list below shows most of the key strategies avail-able to convert data to monetary values. The specific strategyselected usually depends on the type of data and the situation:
� Output data are converted to profit contribution or costsavings and reported as a standard value.
� The cost of a quality measure, such as number of accidents,is calculated and reported as a standard value.

28 THE HUMAN RESOURCES SCORECARD
� Employee time saved is converted to wages and benefits.� Historical costs of preventing a measure, such as a customer
complaint, are used when available.� Internal and external experts estimate a value of a measure.� External databases contain an approximate value or cost of
a data item.� Participants estimate the cost or value of the data item.� Supervisors or managers provide estimates of costs or value
when they are both willing and capable of doing so.� The HR staff estimates a value of a data item.� The measure is linked to other measures for which the costs
are easily developed.
This step in the ROI process is critical and is absolutelynecessary for determining the monetary benefits from an HRprogram. The process is challenging, particularly with soft data,but can be methodically accomplished using one or more of thesestrategies. Because of the importance of this step, Chapter 6 isdevoted to this issue.
Tabulating the Cost of the HR Program. The other part of theequation in a benefit/cost analysis is the HR program cost.Tabulating the cost involves monitoring or developing the costrelated to the program. A fully loaded approach is recommendedin which all direct and indirect costs are tabulated. The followingcost components should be included:
� The cost of initial analysis and assessment, possibly proratedover the expected life of the program
� The cost to develop solutions� The cost to acquire solutions� The cost for application and implementation of the program� The cost of maintaining and monitoring� The cost of evaluating and reporting� The costs of administration and overhead for the program,
allocated in some convenient way
The conservative approach is to include all these costs so thatthe total is fully loaded. Chapter 7 is devoted to this issue.

THE BUSINESS CASE FOR ROI 29
Calculating the Return on Investment. The return on investmentis calculated using benefits and costs. The benefit/cost ratio is thebenefits of the HR program or intervention divided by the costs.In formula form it is:
BCRHR= Program BenefitsHR Program Costs
Sometimes this ratio is stated as a return on investment, althoughthe formula is similar to that of the BCR. The return on investmentuses the net benefits divided by costs. The net benefits are theprogram benefits minus the costs. In formula form, the ROI becomes:
ROINet HR
% = × Program BenefitsHR Program Costs
100
This is the same basic formula used for evaluating otherinvestments in which the ROI is traditionally reported as earningsdivided by investment. Chapter 8 is devoted to ROI calculations.
The BCR and the ROI present the same general informationbut with slightly different perspectives. An example illustrates theuse of these formulas. An HR program produced benefits of$581,000, with a cost of $229,000. Therefore, the benefit/costratio would be:
BCR = =$ ,$ ,
.581 000229 000
2 54 (or 2.5:1)
As this calculation shows, for every $1 invested, $2.50in benefits were returned. In this example, net benefits were$581,000 – $229,000 = $352,000. Thus, the ROI would be:
ROI%$ ,$ ,
%= × =352 000229 000
100 154
This means each $1 invested in the HR program returned$1.50 in net benefits, after costs were covered. The benefits are

30 THE HUMAN RESOURCES SCORECARD
usually expressed as annual benefits for short-term programs,representing the amount saved or gained for a complete year afterthe HR program has been implemented. Although the benefitsmay continue after the first year, the impact usually diminishesand is omitted from calculations in short-term situations. Forlong-term projects, the benefits are spread over several years. Thisconservative approach is used throughout the application of theROI process described in this book.
Identifying Intangible Benefits. In addition to tangible, monetarybenefits, most HR programs will drive intangible, non-monetarybenefits. During data analysis, every attempt is made to convertall data to monetary values. All hard data—such as output,quality, and time—are converted to monetary values. The con-version of soft data is attempted for each data item. However, ifthe process used for conversion is too subjective or inaccurateand the resulting values lose credibility in the process, then thedata are listed as intangible benefits with the appropriate explana-tion. For some interventions, intangible, non-monetary benefitshave extreme value, often commanding as much influence as thehard data items. Intangible benefits include items such as:
� Improved public impact� Increased job satisfaction� Increased organizational commitment� Enhanced technology leadership� Reduced stress� Improved teamwork� Improved customer service� Reduced customer-response time
Chapter 9 is devoted to intangible benefits.
Reporting with an Impact Study. A final operational step of theROI process is to generate an impact study to document theresults achieved by the HR program and communicate them tovarious target audiences. The impact study shows the basic pro-cess used to generate the six measures of data. The methodology,assumptions, key concepts, and guiding principles are all outlinedbefore the actual results are presented. Next, the six categories

THE BUSINESS CASE FOR ROI 31
of data, beginning with reaction and satisfaction and then movingthrough ROI and intangible measures, are presented in a rational,logical process, showing the building blocks to success for thestudy. This becomes the official document that presents thecomplete assessment of the success of the program. Its lengthranges from 20 to 30 pages for a small project to 200 to 300pages for a substantial, long-term HR program impact study.
Because there are a variety of target audiences, different reportsmay need to be generated. All the stakeholders involved will needsome communication regarding the success of the HR initiative,including key clients who are not interested in knowing the fulldetails. A stakeholder report may be appropriate for stakeholderswho are involved but not directly responsible for the project. Stillother reports may be necessary for different target audiences. Thekey issue in this step of the ROI process is to analyze the targetaudiences (detailed in the evaluation planning) and develop theappropriate report to meet their specific needs. Chapter 10 isdevoted to communicating the results of measurement and evalua-tion, including the impact study.
The Operating Standards: Guiding Principles
To ensure that each study takes the same conservative philos-ophy and to increase the likelihood of replication, a set of guidingprinciples has been developed for the ROI process and is usedthroughout this book:
1. When a higher-level evaluation is conducted, data must becollected at lower levels.
2. When an evaluation is planned for a higher level, theprevious level does not have to be comprehensive.
3. When collecting and analyzing data, use only the mostcredible sources.
4. When analyzing data, choose the most conservative approachamong alternatives.
5. At least one method must be used to isolate the effects ofthe program/initiative.
6. If no improvement data are available for a population orfrom a specific source, it is assumed that little or noimprovement occurred.

32 THE HUMAN RESOURCES SCORECARD
7. Estimates of improvement should be adjusted for thepotential error of the estimate.
8. Extreme data items and unsupported claims should not beused in ROI calculations.
9. The first year of benefits (annual) should be used in theROI analysis of short-term projects/initiatives.
10. Costs of a solution, project, or program should be fullyloaded for ROI analysis.
Although the principles may be obvious, each will be exploredand revisited throughout the book. However, they do need someexplanation at this time. The first general principle refers to theneed to report the complete story. Although data at a lower levelmay not impact results at higher levels, they do provide importantinformation that may be helpful in making adjustments for futureexecution of a program.
The second general principle represents a way to conserveimportant resources. Shortcuts can perhaps be taken on lower-levelevaluations, whereas more emphasis is regularly placed on higherlevels. This is important when the client wants to see the businessimpact. In those cases, shortcuts can be taken perhaps at Levels 2and 3 (measuring learning and application/implementation).
The third general principle refers to the credibility of data.The source from which data are collected is vital in maintainingcredibility of the study. This is especially true when using esti-mates to convert data to monetary value and when isolating theimpact of a program or initiative.
The fourth general principle addresses the need to take aconservative approach in analyzing data. Because the ROI of anHR program is often quite high, use of a conservative approachon a consistent basis helps preserve the credibility of the outcome.
Principle five also adds to the credibility of the process. Withoutsome method to isolate the effects of the HR program, the studiesare considered highly inaccurate and overstated in their results.
Principle six addresses missing data from individuals involvedin programs or initiatives. If the participants are no longer onthe job or no longer performing the work, it is assumed that littleor no improvement occurred. This is an ultra-conservative approach.
Principles seven and eight build on the conservative approachto data analysis. Principle nine focuses on the timing of the actual

THE BUSINESS CASE FOR ROI 33
stream of benefits from an HR program. A conservative approachis recommended, usually dictating one year of benefits for short-term assignments but multiple years for a more extensive program.
The last principle focuses on the issue of fully loaded costs,ensuring that all direct and indirect costs of the program areincluded. Collectively, these principles will ensure that the properconservative approach is taken and that the impact study can bereplicated and compared with others.
Implementation of the Process
The best tool, technique, or model will not succeed unless itis properly used and becomes a routine part of the process. As anew process, it will be resisted by both the HR staff and clients,just as with any other significant change. Some of the resistancewill be based on realistic barriers, while some will be based onmisunderstandings and perceived problems that may be mythical.In both cases, specific steps must be taken to overcome theresistance by carefully and methodically implementing the ROIprocess. Implementation involves many issues, including assigningresponsibilities, building the necessary skills, and developingthe plans and goals around the process. It also involves pre-paring the environment, individuals, and support teams for thistype of comprehensive analysis. The firms that have the mostsuccess with this process are those that have devoted adequateresources to implementation and deliberately planned fortransition from their current state to where they desire theorganization to be in terms of accountability. Chapter 12covers the implementation issues.
Case Applications: The Progress
Although a significant number of case applications have beendeveloped, the status of ROI among HR practitioners is difficult,if not impossible, to pinpoint. Senior executives and HR staffmembers are often reluctant to disclose internal practices, andeven in the most progressive organizations, they confess that toolittle progress has been made. It is difficult to find cases in theliterature that show how an organization has attempted to measurethe return on investment in an intervention.

34 THE HUMAN RESOURCES SCORECARD
Recognizing this void, the American Society for Training andDevelopment (ASTD) undertook an ambitious project to developa collection of cases that illustrate real-world examples of measuringthe return on investment in a variety of training and HR programs.To find cases for the initial volume, more than 2,000 individualswere contacted, including practitioners, authors, researchers, con-sultants, and conference presenters. In addition, organizationsperceived to be respected and admired were contacted. The resultwas the publication of In Action: Measuring Return on Investment,Volume 1, published in 1994, and Volume 2, published in 1997 [2].Volume 3 is planned for publication in 2001.
Combinations of books and cases have been published in otherfields. For example, The Consultant’s Scorecard [15] offers casestudies about the ROI process in the consulting field. This bookis the first publication to focus primarily on ROI in HR.
Although examples of the progress of measuring the ROI inHR are available, it has become a critical topic that constantlyhaunts the field. The need is clear. The interest in ROI will persistas long as HR budgets continue to increase and the HR functionholds the promise of helping organizations improve. Much progressmust be made to meet this important need.
BARRIERS TO IMPLEMENTING THE ROI PROCESS
Although progress is being made in the implementation of ROI,barriers can inhibit implementation of the concept. Some of thesebarriers are realistic, while others are actually myths based onfalse perceptions. This section briefly describes each barrier.
Costs and Time
The ROI process will add some additional costs and time tothe HR program, although the added amount should not beexcessive. As will be described throughout this book, a compre-hensive ROI process will probably not add more than 3 to 5percent to the HR program budget. The additional investmentin ROI would perhaps be offset by the additional results achievedfrom these interventions and the elimination or prevention ofunproductive or unprofitable interventions. This barrier alonestops many ROI implementations early in the process.

THE BUSINESS CASE FOR ROI 35
Lack of Skills and Orientation for HR Staff
Many HR staff members do not understand ROI, nor do theyhave the basic skills necessary to apply the process within theirscope of responsibilities. Also, the typical program does not focuson results, but more on qualitative data. Consequently, a tre-mendous barrier to implementation is the change needed for theoverall orientation, attitude, and skills of HR staff members. AsPogo, the cartoon character, once said, “We have met the enemy,and he is us.” This certainly applies to ROI implementationin HR.
Faulty Initial Analysis
Many HR programs do not have an adequate initial analysis andassessment. Some of these programs have been implemented forthe wrong reasons and are based on management requests or onefforts to chase a popular fad or trend in the industry. If aprogram is not needed, the program probably won’t produceenough benefits to overcome the costs. An ROI calculation foran unnecessary HR program will likely yield a negative value.This is a realistic barrier for many programs.
Fear
Some HR staff members do not pursue ROI because of fearof failure or fear of the unknown. Fear of failure appears inmany ways. They may have concerns about the consequencesof a negative ROI. Also, a comprehensive measurement processcan stir up the traditional fear of change. This fear, althoughoften based on unrealistic assumptions and a lack of knowledgeof the process, is so strong that it becomes a real barrier tomany ROI implementations.
Discipline and Planning
A successful ROI implementation requires much planning anda disciplined approach to keep the process on track. Imple-mentation schedules, evaluation targets, ROI analysis plans,measurement and evaluation policies, and follow-up schedules are

36 THE HUMAN RESOURCES SCORECARD
required. The practitioner may not have enough discipline anddetermination to stay on course. This becomes a barrier, par-ticularly when no immediate pressures to measure the returnexist. If the client is not requiring ROI, the HR staff may notallocate time for planning and coordination. Also, other pressuresand priorities often eat into the time necessary for ROI imple-mentation. Only carefully planned implementations will succeed.
False Assumptions
Many consultants have false assumptions about the ROI processthat keep them from attempting ROI. Typical false assumptionsinclude the following:
� ROI can be applied to only a few narrowly focused projects.� Senior managers do not want to see the results of HR
interventions expressed in monetary values.� If the client does not ask for ROI, it should not be pursued.� If the CEO does not ask for ROI, then he or she does not
expect it.
These false assumptions form realistic barriers that impede theprogress of ROI implementation.
BENEFITS OF IMPLEMENTING THE ROI PROCESS
Although the benefits of adopting a comprehensive measure-ment and evaluation process (including ROI) may be obvious,several important benefits can be derived from the routine useof this process. A summary should be helpful.
Show the Contribution of Selected HR Interventions
With the ROI process, the HR staff and the client will knowthe specific contribution of the HR program in terms that werenot previously developed nor in a language understood by theclient group. The ROI will show the actual benefits versusthe cost, elevating the evaluation data to the ultimate level ofanalysis. This process presents indisputable evidence that theprogram succeeded.

THE BUSINESS CASE FOR ROI 37
Earn the Respect of Senior Management
Measuring the ROI of an HR program or intervention is oneof the best ways to earn the respect and support of the seniormanagement team—not only for a particular project but also forother interventions as well. Managers will respect processes thatadd bottom-line value presented in terms they understand. Theresult of this analysis is comprehensive, and when applied con-sistently and comprehensively in several projects, it can convincemanagement that the HR function is an important investment andnot just an expense. Middle-level managers will see that HR ismaking a viable contribution to their immediate objectives. Thisis a critical step toward building an appropriate partnership withthe senior management team.
Gain the Confidence of Clients
The client, who requests and authorizes a project, will nowhave a complete set of data to show the overall success of theprocess. Not hampered by a lack of qualitative or quantitativedata, this data set provides a complete profile from differentsources, at different time frames, and with different types of data.These data reveal the process that has occurred and validate theinitial decision to move forward with the HR program.
Improve the HR Processes
Because a variety of feedback data are collected during the HRprogram, a comprehensive analysis (including ROI) provides datato drive changes in HR processes and make adjustments duringa program. It also provides data that help improve HR inter-ventions in the future when certain processes are revealed asnonproductive while others add value. Thus, the ROI process isan important process-improvement tool.
Develop a Results-Focused Approach
The communication of data at different time frames and withthe detailed planning that is involved with the ROI processfocuses the entire team, including stakeholders, on bottom-line

38 THE HUMAN RESOURCES SCORECARD
results. This focus often enhances the results that can be achievedbecause the ultimate goals are clearly in mind. In essence, theprocess begins with the end in mind. All the processes, activities,and steps are clearly focused on the ultimate outcomes. As theHR program demonstrates success, confidence in using the processgrows, which enhances the results of future programs and initiatives.
Alter or Enhance HR Programs
This benefit is twofold. First, if a program is not workingeffectively, and the results are not materializing, the ROI processwill prompt changes or modifications to move the HR programback on track. On rare occasions, the intervention may have tobe halted if it is not adding the appropriate value. Althoughstopping the HR program will take courage, it will reap importantbenefits with the client if it is clearly evident that it will notproduce results. The other part of this benefit is that if the HRprogram succeeds greatly, perhaps the same type of interventioncan be applied to other areas. It makes a convincing argumentthat if one division has a successful program and another divisionhas the same needs, the program may add the same value andenhance the overall success and replication of all HR initiatives.
FINAL THOUGHTS
The need for a balanced approach to HR accountability is sig-nificant. Most organizations spend less than 1 percent of their directbudgets on accountability processes. This figure only considers thepost-program analysis or comprehensive review process. Imple-menting the ROI process requires an expenditure closer to 5 percent,thus becoming a significant project for larger organizations.
Certain symptoms indicate an organization is ready to imple-ment ROI within its HR function. Many of these symptomsreflect the key drivers discussed earlier in this chapter, causingpressure to pursue ROI.
Figure 1-4 is a checklist to help you determine if your organi-zation is a candidate for ROI implementation.
This chapter provided a brief overview of the ROI process,which is presented in detail in the remainder of the book. Itclearly underscored the urgency of the challenge; now is the time

THE BUSINESS CASE FOR ROI 39
Is Your Organization a Candidate for ROI Implementation?
Read each question and check off the most appropriate level ofagreement (1 = Disagree; 5 = Total Agreement). The higher thetotal score, the better candidate your company is for ROI.
Disagree Agree1 2 3 4 5
1. My organization is considered a � � � � �large organization with a widevariety of HR programs.
2. We have a large HR budget that � � � � �reflects the interest of seniormanagement.
3. Our organization has a culture of � � � � �measurement and is focused onestablishing a variety of measuresincluding HR.
4. My organization is undergoing � � � � �significant change.
5. There is pressure from senior � � � � �management to measure results ofour HR initiatives.
6. My HR function currently has a � � � � �very low investment in measure-ment and evaluation.
7. My organization has suffered more � � � � �than one HR program disaster inthe past.
8. My organization has a new leader � � � � �for HR.
9. My management team would like � � � � �to be the leader in HR processes.
10. The image of our HR function is � � � � �less than satisfactory.
11. My clients are demanding that � � � � �our HR processes show bottom-lineresults.
Figure 1-4

40 THE HUMAN RESOURCES SCORECARD
to develop a comprehensive measurement and evaluation process,including the ROI. It also showed how various forces are creatingthis important need for a comprehensive evaluation process. Thischapter also defined the pieces to the evaluation puzzle: evaluationframework, the process model, operating standards and philosophy,implementation, and case application. When these pieces cometogether, a reliable, credible process is developed that can bereplicated from one project to another. This process is not withoutits concerns and barriers, but many of them can be overcomewith simplified, economical methods. The remainder of the bookprovides details of each step of the ROI process and addressesimplementation issues. Part IV provides case studies describinghow the process has been implemented in various organizations.
REFERENCES
1. Sibbet, David. Harvard Business Review, 75 Years of ManagementIdeas and Practice 1922–1997. Boston: Harvard Business Review,1997.
Figure 1-4. Continued.
12. My HR function competes with � � � � �other functions within ourorganization for resources.
13. My organization has increased its � � � � �focus on linking processes to thestrategic direction of the company.
14. My HR function is a key player � � � � �in change initiatives currentlytaking place in my organization.
15. Our overall HR budget is grow- � � � � �ing, and we are required to provethe bottom-line value of ourHR processes.
Total Score:
Disagree Agree1 2 3 4 5

THE BUSINESS CASE FOR ROI 41
2. Phillips, Jack J. (Ed.) Measuring the Return on Investment, Vol. 1and Vol. 2. In Action Series. Alexandria, Va.: American Society forTraining and Development, 1994 and 1997.
3. Odiorne, G. S. Personnel Administration by Objectives. Homewood,Ill.: Irwin, 1971.
4. Wyner, W. E., and Parente, J. A. “Employee Surveys: What EmployersAre Doing and What Works.” Employment Relations Today, Winter1991–92, pp. 477–484.
5. Invancevich, J. M. Human Resource Management. Chicago: Irwin,1995.
6. Gómez-Mejía, L. R., Balkin, D. B., and Cardy, R. L. ManagingHuman Resources. Englewood Cliffs, N.J.: Prentice Hall, 1995.
7. Merrihue, W. V., and Katzell, R. A. “ERI—Yardstick of EmployeeRelations.” Harvard Business Review, Vol. 33, No. 6, 1955,pp. 91–99.
8. LaPointe, J. R. “Human Resource Performance Indexes.” PersonnelJournal, No. 62, 1983, pp. 545, 553.
9. Phillips, Jack J. The Development of a Human Resources Effec-tiveness Index. Ph.D. dissertation, April 1988.
10. Cascio, W. F. Managing Human Resources: Productivity, Qualityof Work Life, Profits, 4th ed. New York: McGraw-Hill, 1993.
11. Pauly, D. “HR: The New Profit Center.” Human Resource Executive,August 1993.
12. Kromling, L. K. “CalComp Considers HR a Business Unit.” PersonnelJournal, February 1993.
13. Phillips, Jack J. Accountability in Human Resource Management.Houston, Tex.: Gulf Publishing, 1996.
14. Kirkpatrick, Donald L. Evaluating Training Programs: The FourLevels. San Francisco: Berrett-Koehler, 1994.
15. Phillips, Jack J. The Consultant’s Scorecard: Tracking Six KeyMeasures for Consulting Projects. New York: McGraw-Hill, 2000.

42 THE HUMAN RESOURCES SCORECARD
42
Chapter 2
Initial Analysisand Planning
Few things are more important in evaluating an HR programthan the initial analysis and planning, particularly the planningfor accountability processes. When attempting to measure thesuccess of an HR program after the program is implemented, anobvious conclusion is often reached: There should have been moreplanning. The initial analysis and planning have several advantagesand involve several key issues explored in this chapter. The firstissue involves specifying what the evaluation project will involve.Next, and perhaps more importantly, the chapter shows how todetermine the success of the project—in advance, in specificdetail. Then the chapter examines the process of ensuring thatall the key measures or groups of measures are identified toreflect the success of the project, focusing on different levels of

INITIAL ANALYSIS AND PLANNING 43
analysis. Finally, the chapter introduces a variety of planning toolsthat can be helpful in setting up the initial HR program evaluation.
EVALUATION: PROJECT REQUIREMENTS
When it comes to specifying the requirements of an HR programevaluation, there can never be too much detail. Evaluation pro-jects often go astray and fail to reach their full success becauseof misunderstandings and differences in expectations. This sectionshows the key issues that must be addressed before the HRprogram evaluation actually begins. These issues are often out-lined in the project proposal or sometimes in the outline andscope of the project’s documentation. In other cases, it is theplanning or implementation document for the actual evaluationproject. Regardless of when it is developed, or for what purposeit is developed, each of the areas listed below should be identifiedin some way. More importantly, the client and the HR staff needto reach an agreement about these key issues.
Objectives of the Evaluation Project
When it comes to evaluation projects, there are two sets ofobjectives. First, there are the objectives for the evaluation projectitself, indicating specifically what will be accomplished anddelivered through the evaluation process. The other set of objectivesis called the program objectives and focuses on the goals of theactual HR program that will ultimately add value to the organi-zation. The program objectives are discussed later. Here, ourfocus is on the objectives of the evaluation project.
Every evaluation project should have a major project objective,and in most cases there are multiple objectives. The objectives areas specific as possible and focused directly on the assignment.Examples of evaluation project objectives are as follows:
� Determine if the HR program is accomplishing its objectives.� Identify the strengths and weaknesses in the HR program.� Determine the benefit/cost ratio of the HR program.� Determine who should participate in future initiatives.� Identify who benefited the most or the least from the
HR program.

44 THE HUMAN RESOURCES SCORECARD
� Reinforce major points made to the target population.� Gather data to assist in pursuing future initiatives.
As this list illustrates, the objectives are broad in scope,outlining from an overall perspective what is to be accomplished.The details of timing, specifications, and specific deliverablescome later. The broad evaluation project objectives are criticalbecause they bring focus to the project quickly. They define thebasic parameters of the project and are often the beginning pointsof the discussion of the evaluation project.
Scope
The scope of the evaluation project needs to be clearly defined.The scope can pinpoint key parameters addressed by the project.The following list shows typical scoping issues that should bedefined in the project:
� Target group for the evaluation� Location of target group� Time frame for the evaluation� Technology necessary to conduct the evaluation� Access to stakeholders� Functional area for coverage� Product line for coverage� Type of process/activity being evaluated� Constraints on data collection
Perhaps the project is limited to certain employee groups, afunctional area of the business, a specific location, a unique typeof system, or a precise time frame. Sometimes there is a constrainton the type of data collected or access to certain individuals, suchas customers. Whatever the scope involves, it needs to be clearlydefined in this section.
Timing
Timing is critical in showing specifically when activities willoccur. This means not only the timing of the delivery of the finalreport but also the timing of particular steps and events—including

INITIAL ANALYSIS AND PLANNING 45
when data are needed, analyzed, and reported and when presenta-tions are made. The following list shows typical scheduled activities:
� HR solutions developed� Implementation started� Implementation complete� Start of evaluation project� Data collection design complete� Evaluation design complete� Data collection begins� Data collection complete� Specific data collection issues (for example, pilot testing,
executive interviews)� Data analysis complete� Preliminary results available� Report developed� Presentation to management
Deliverables from the Evaluation Project
This section describes exactly what the client will receive whenthe evaluation project is completed in terms of reports, documents,systems, processes, manuals, forms, flowcharts, or rights to newtechnology. Whatever the specific deliverables, they are clearlydefined in this section. Most projects will have a final report, butthey often go much further, delivering process tools and suggestedmethodologies for improving the HR program evaluated.
Methodology
If a specific methodology is to be used for the evaluation project,it should be defined. A reference should be made to the appro-priateness of the methodology, as well as its reliability, its validity,its previous success, and how the methodology will accomplish whatis needed for the evaluation project to be successful.
Steps
The specific steps that will occur should be defined showingkey milestones. This provides a step-by-step understanding and

46 THE HUMAN RESOURCES SCORECARD
tracking of the evaluation project so that at any given time theclient and the HR staff can see not only where progress is madebut where the project is going next.
Resources Required for the Evaluation Project
This section will define the specific resources required toimplement the evaluation. This could include access to individuals,vendors, technology, equipment, facilities, competitors, or customers.All resources that may be needed should be listed along withdetails regarding the timing and circumstances under which theresources will be needed.
Cost
The cost section details the specific costs tied to the differentsteps of the evaluation process. There is often reluctance to detailcosts; however, it is important to understand the different stepsof the process and their relative costs. When calculating the ROIfor an HR program, all costs are considered. This includes notonly development and implementation costs but also the costs ofevaluating the program. Chapter 7 goes into detail about costs.
LEVELS OF OBJECTIVES FOR HR PROGRAMS
Eventually an HR program or intervention should lead to somelevel of impact on the business of the organization. In somesituations, the intervention is aimed at softer issues, such asemployee satisfaction, customer satisfaction, and stress reduction.In other situations, the program is aimed at more tangible issues,such as cost reductions, productivity, and number of accidents.Whatever the case, HR programs and interventions should havemultiple levels of objectives. These levels of objectives, rangingfrom qualitative to quantitative, define precisely what will occuras a particular program is implemented in the organization. Table2-1 shows the different levels of objectives. These objectives areso critical that they need special attention in their developmentand use.

INITIAL ANALYSIS AND PLANNING 47
Satisfaction and Reaction
For any program to succeed, various stakeholders must reactfavorably, or at least not negatively. Ideally, the stakeholdersshould be satisfied with the program because the best solutionsoffer win-win results. The stakeholders are those who are directlyinvolved in implementing or using the program or intervention.These can be the employees involved in implementing the work,or the supervisors or team leaders responsible for the redesigned
Table 2-1Multiple Levels of Objectives
Levels of Objectives Focus of Objectives
Level 1Reaction and Defines a specific level of satisfaction andSatisfaction reaction to the HR program as it is revealed
and communicated to the stakeholders
Level 2Learning Defines specific skills and knowledge
requirements as the stakeholders learn newskills and acquire new knowledge through theHR program
Level 3Application and Defines key issues around the implementationImplementation of the HR program in the workplace
Level 4Business Impact Defines the specific business measures that
will change or improve as a result of theimplementation of the HR program
Level 5ROI Defines the specific return on investment
from the implementation of the HR program,comparing costs with benefits

48 THE HUMAN RESOURCES SCORECARD
or changed process. Stakeholders could also be managers whomust support or assist the process in some way. Finally, thestakeholders could involve the teams and task forces involved inthe intervention.
It is important to routinely obtain this type of information sothat feedback can be used to make adjustments, keep the projecton track, and perhaps even redesign certain parts of the process.One problem with many HR interventions is that specific objec-tives at this level are not developed, and data collection mechanismsare not put in place to ensure appropriate feedback for makingneeded adjustments.
Learning Objectives
Many HR programs and interventions will involve a learningobjective. In some interventions, the learning component is quitesignificant. To ensure that the various stakeholders have learnedwhat they need to learn to make the intervention effective,learning objectives are developed. Learning objectives are criticalto the measurement process because they define the desiredcompetence or performance necessary to make the programsuccessful. Learning objectives provide a focus for participants,clearly indicating what they must learn.
The best learning objectives describe the observable and measur-able behaviors that are necessary for success with the HR pro-gram. They are often outcome-based, clearly worded, and specific.They specify what the particular stakeholder must do as a resultof implementing the HR program. Learning objectives often havethree components:
1. Performance—what the participant or stakeholder will beable to do as the program is implemented
2. Conditions under which the participant or stakeholder willperform the various tasks and processes
3. Criteria—the degree or level of proficiency necessary toperform a new task, process, or procedure that is part ofthe HR solution
The three types of learning objectives are often defined as:

INITIAL ANALYSIS AND PLANNING 49
1. Awareness—familiarity with terms, concepts, and processes2. Knowledge—general understanding of concepts, processes,
or procedures3. Performance—ability to demonstrate skills at least on a
basic level
Application and Implementation Objectives
As a solution is actually implemented in the workplace, theapplication and implementation objectives clearly define what isexpected and often what level of performance is expected. Appli-cation objectives are similar to learning objectives but reflect theactual implementation of a new HR program. They also involveparticular milestones, indicating specifically when intervals of theprocess are implemented. Application objectives are criticalbecause they describe the expected outcomes in the interim—thatis, between the actual learning of new tasks and procedures andthe actual impact that will result. Application or implementationobjectives describe how things should be performed or the stateof the workplace after the solution is implemented. They providea basis for the evaluation of on-the-job changes and performance.The emphasis is on what has occurred on the job as a result ofthe HR program.
The best application objectives identify behaviors that areobservable and measurable or action steps in a process that caneasily be observed or measured. They specify what the variousstakeholders will change or have changed as a result of the HRprogram. As with learning objectives, application or implementa-tion objectives may have three components:
� Performance—describes what the stakeholders have changedor have accomplished in a specific time frame after theimplementation of the HR solution
� Condition—specifies the circumstances under which thestakeholders have performed or are performing the tasks orimplementing the solution
� Criteria—indicates the degree or level of proficiency underwhich the solution is implemented, the task is being per-formed, or the steps are completed

50 THE HUMAN RESOURCES SCORECARD
There are two types of basic application objectives. They areknowledge-based—when the general use of concepts, processes,and procedures is important—and behavior-based, which is whenthe participant is able to demonstrate the actual use of skills,accomplishments of particular tasks, or completion of particularmilestones. Here are some typical key questions regarding applica-tion and implementation objectives:
1. What new or improved knowledge will be applied onthe job?
2. What is the frequency of skill application?3. What specific new task will be performed?4. What new steps will be implemented?5. What action items will be implemented?6. What new procedures will be implemented or changed?7. What new guidelines will be implemented?8. What new processes will be implemented?9. Which meetings need to be held?
10. Which tasks, steps, or procedures will be discontinued?
Application objectives have always been included to somedegree in HR programs but have not been as specific as they needto be. To be effective, they must clearly define the workplaceenvironment when the solution is successfully implemented.
Impact Objectives
Every HR program should result in improving business impact.Business impact represents the key business measures that shouldbe improved as the application or implementation objectives areachieved. The impact objectives are critical to measuring businessperformance because they define the ultimate expected outcomefrom the HR program. They describe business-unit performancethat should be connected to the HR solution. Above all, theyplace emphasis on achieving bottom-line results, which key clientgroups expect and demand.
The best impact objectives contain measures that are linked tothe solution from the HR intervention. They describe measuresthat are easily collected and are well-known to the client group.They are results-based, are clearly worded, and specify what the

INITIAL ANALYSIS AND PLANNING 51
stakeholders have ultimately accomplished in the business unit asa result of the HR program.
Impact objectives include output, quality, cost, and time. Thesefour categories are often considered hard data. The major cate-gories of soft data impact objectives are customer service, workclimate, and work habits.
Return on Investment
A fifth level of objectives for HR programs is the actualexpected return on investment. These objectives define the expectedpayoff from the HR solution and compare the input resources,the cost of the HR program, with the value of the ultimateoutcome—the monetary benefits. This is typically expressed as adesired return on investment percentage that compares the annualmonetary benefits minus the cost, divided by the actual cost, andmultiplied by 100. A zero percent ROI indicates a break-even HRsolution. A 50 percent ROI indicates that the cost of the programis recaptured and an additional 50 percent “earnings” are achieved.
For many HR interventions, the ROI objective is larger thanwhat might be expected from the ROI of other expenditures, suchas the purchase of a new company, a new building, or majorequipment; but the two are related. In many organizations theROI objective is set slightly higher than the ROI expected fromother interventions because of the relative newness of applyingthe ROI concept to HR programs. For example, if the expectedROI from the purchase of a new company is 20 percent, the ROIfrom an HR program might be nearer 25 percent. The importantpoint is that the ROI objective should be established up frontthrough discussions with the client.
Importance of Specific Objectives
Developing specific objectives at different levels for HR inter-ventions provides important benefits. First, objectives providedirection to the HR staff members directly involved in the processto help keep them on track. Objectives define exactly what isexpected at different time frames from different individuals andinvolving different types of data. Also, objectives provide guidanceto the support staff and the client so that they fully understand

52 THE HUMAN RESOURCES SCORECARD
the ultimate goal and impact of the HR program. Further, objec-tives provide important information and motivation for thestakeholders. In most HR initiatives, the stakeholders are activelyinvolved and will influence the results of the solution. Specificobjectives provide goals and motivation for the stakeholders sothat they will clearly see the gains that should be achieved. Moreimportantly, objectives provide important information for thekey client groups to clearly understand what the landscape willlook like when the HR intervention is complete. Finally, froman evaluation perspective, the objectives provide a basis formeasuring success.
LINKING EVALUATION WITH NEEDS
There is a distinct linkage between evaluation objectives andoriginal needs driving an HR intervention. Chapter 1 introducedthe five levels of evaluation and showed how they are critical toproviding an overall assessment of the impact of an HR program.The earlier material in this chapter showed the importance ofsetting objectives around the HR program. The objectives definethe specific improvements sought. In this section, we will make
Figure 2-1.

INITIAL ANALYSIS AND PLANNING 53
a further connection to the original needs assessment. Figure 2-1shows the connection between evaluation and needs assessment.This figure shows the important linkage from the initial problemor opportunity that created the need to the evaluation andmeasurement. Level 5 defines the potential payoff and examinesthe possibility for a return on investment before the project iseven pursued. Level 4 analysis focuses directly on the businessneeds that precipitated an HR intervention. At Level 3, thespecific issues in the workplace focus on job performance indetail. At Level 2, the specific knowledge, skill, or attitudedeficiencies are uncovered as learning needs are identified. Finally,the preferences for the structure of the solution define theLevel 1 needs. This connection is critical and important tounderstanding all the elements that must go into an effectiveHR solution.
An example will help illustrate this linkage. Figure 2-2 showsan example of linking needs assessment with the evaluation of a
Figure 2-2.

54 THE HUMAN RESOURCES SCORECARD
program involving a reduction in absenteeism. As the figureshows, the first step is to see if the problem is great enough atLevel 5. However, this sometimes causes a validation of theproblem using Level 4 data. Four benchmarks are used to gaugethe current absenteeism problem. These are:
� Absenteeism is higher than it used to be.� Absenteeism is higher than at other locations within the
company.� Absenteeism is higher than at other facilities in the local area.� Absenteeism is higher than the general manager desires.
With the confirmation in Level 4 that there is a problem, apotential payoff is estimated. This involves estimating the costof absenteeism and estimating the actual potential reduction thatcan come from the HR intervention. This develops a profile ofpotential payoff to see if the problem is worth solving.
At Level 3, the causes of excessive absenteeism are exploredusing a variety of techniques. One issue that is uncovered is thata positive discipline procedure is not currently available to teamleaders when there is an unexpected absence. A learning com-ponent at Level 2 is also uncovered because the team leaders needto understand how and when to administer the positive disciplineprocedure. Finally, the specific way in which the program shouldbe implemented is explored in terms of preferences at Level 1.In this case, supervisors preferred to attend a half-day meetingto learn the procedure and leave with a job aid that helps themwith the process as they apply it.
These five levels provide an overall profile for determining ifthe problem is worth solving to begin with, as well as aligningproblems with key measures and data necessary to develop theprogram objectives. The HR program objectives for each level areshown in the figure as well, as are the evaluation methods neededto verify that the appropriate changes did occur. This process isimportant to the development and implementation of an HRsolution. Many HR programs are involved in developing theactual solution and implementing the solution, as is the case inthis particular example. When this occurs, the above linkageconnects the needs to actual objectives and then to evaluation.

INITIAL ANALYSIS AND PLANNING 55
The solution to the problem or opportunity is an importantpart of this linkage. Some programs may be involved in uncover-ing needs with the initial analysis to determine the actual causesof the problem and then recommend solutions. It is up to theclient to then implement the solution, or implementation becomespart of another program. In both cases, the solutions are ultimatelydeveloped. If this has not been accomplished, multiple levels ofanalysis may be necessary for the intervention. Although otherreferences exist that focus more specifically on the performanceanalysis to uncover different levels of needs, a brief summary ispresented here.
Payoff Needs
The very first part of the process is to determine if the problemis worth solving or if the opportunity is large enough to warrantserious consideration. In some cases, this is obvious when seriousproblems are affecting the organization’s operations and strategy.Still others may not be so obvious. At Level 5, it is importantnot only to identify needed business improvement measures atLevel 4 but to also convert them into monetary values so theactual improvement can be converted to financial measures.
The second part of the process is to develop an approximate costfor the entire HR program. This could come from a detailedproposal or may be a rough estimate. At this stage it is only anestimate because the projected cost of the project is compared tothe potential benefits to roughly determine if a payoff would resultfrom addressing the issue. This step may be omitted in some situa-tions when the problem must be solved regardless of the cost or ifit becomes obvious that it is a high-payoff activity. Still other projectsmay be initiated when the potential payoff is not expected to bedeveloped. For example, as an organization strives to be a technologyleader, it may be difficult to place a value on that goal.
Business Needs
In conjunction with Level 5, actual business data are examinedto determine which measures need to improve. This includes anexamination of organizational records and involves examining all

56 THE HUMAN RESOURCES SCORECARD
types of hard and soft data. Usually one of the data items andits performance trigger the HR initiative or intervention—forexample, market share may not be as much as it should be, costsmay be excessive, quality may be deteriorating, or productivitymay not be as high as it should be. These are the key issues thatcome directly from the data in the organization and are oftenfound in the operating reports or records.
The supporting data may come not only from the operatingreports but from annual reports, marketing data, industry data,major planning documents, or other important informationsources that clearly indicate operating performance in terms ofoperation or strategy.
Job Performance Needs
The Level 3 analysis involves job performance or workplaceneeds. The task is to determine the cause of the problem asdetermined at Level 4 (that is, what is causing the businessmeasure not to be at the desired level or to be inhibited in someway). Needs can vary considerably and may include, amongothers, the following:
1. Ineffective or inappropriate behavior2. Dysfunctional work climate3. Ineffective systems4. Improper process flow5. Ineffective procedures6. Unsupported culture7. Inappropriate technology8. Unsupportive environment
These and other types of needs will have to be uncovered usinga variety of problem-solving or analysis techniques. This mayinvolve the use of data collection techniques discussed in thisbook such as surveys, questionnaires, focus groups, or interviews.It may involve a variety of problem-solving or analysis techniquessuch as root-cause analysis, fishbone diagrams, and other analysistechniques. Whatever is used, the key is to determine all thecauses of the problem so that solutions can be developed. Often,multiple solutions are appropriate.

INITIAL ANALYSIS AND PLANNING 57
Learning Needs
Most problem analysis from Level 3 uncovers specific learningneeds. It may be that learning inefficiencies, in terms of knowledgeand skills, may contribute to the problem if they are not themajor cause of it. In other situations, the actual solution appliedmay need a particular learning component as participants learnhow to implement a new process, procedure, or system. Theextent of learning required will determine whether formalizedtraining is needed or if more informal, on-the-job methods canbe used to build the necessary skills and knowledge. The learningwould typically involve acquisition of knowledge or the develop-ment of skills necessary to improve the situation. In some cases,perceptions or attitudes may need to be altered or make theprocess successful in the future.
Preferences
The final level is to consider the preference for the solution.This involves determining the way in which those involved in theprocess prefer to have it changed or implemented. It may involveimplementation preferences and/or learning preferences. Learningpreferences may involve decisions such as when learning isexpected and in what amounts, how it is presented, and theoverall time frame. Implementation preferences may involve issuessuch as timing, support, expectation, and other key factors. Theimportant point is to try to determine the specific preferences tothe extent possible so that the complete profile of the solutioncan be adjusted accordingly.
PLANNING FOR MEASUREMENT AND EVALUATION
An important ingredient in the success of the ROI process isto properly plan early in the process. Appropriate up-frontattention will save much time later when data are actually col-lected and analyzed, thus improving accuracy and reducing thecost of the evaluation process. It also avoids any confusionsurrounding what will be accomplished, by whom, and at whattime. Two planning documents are key and should be completedbefore the intervention is designed or developed.

58 THE HUMAN RESOURCES SCORECARD
Data Collection Plan
Table 2-2 shows a completed data collection plan for a sexualharassment prevention program. The program was initiated toreduce sexual harassment complaints and the resulting employeeturnover. An ROI calculation was planned to show the value ofpreventive projects.
This document provides a place for the major elements andissues regarding collecting data for the five evaluation levels. Inthe first column, broad areas for objectives are stated, which areappropriate for planning. Specific, detailed objectives are developedlater, before the HR program is designed. In the second column,the specific measures or data descriptors are indicated when theyare necessary to explain the measures linked to the objectives.In the next column, the specific data collection method is brieflydescribed using standard terminology. Next, the source of thedata is entered. Data sources will vary considerably, but usuallyinclude participants, team leaders, company records, and theclient. In the next column, the time frame for data collection isusually referenced from the beginning of the project. Finally, theresponsibility for data collection is described.
The objectives for reaction and satisfaction usually includepositive reactions to the intervention and suggested improvements.Planned actions may be included in the input. Reaction andsatisfaction data may be collected at different intervals. In thisexample, feedback is taken only at one time, at the end ofimplementation of the solution.
Because Level 2 evaluation focuses on the measures of learning,specific objectives include those areas where participants areexpected to learn new tasks, knowledge, skills, or attitudes. Theevaluation method is the specific way in which learning is assessed,in this case, a test and observation of skill practice by thefacilitator of the meeting. The timing for Level 2 evaluation isat the end of the implementation.
For application and implementation evaluation, the objectivesrepresent broad areas of application, including significant on-the-job activities and implementation steps. In this example, themethods include questionnaires, surveys, and monitoring companyrecords. This information is usually collected a matter of monthsafter the implementation. Because responsibilities are often sharedamong several groups, including the HR staff, it is important to

IN
ITIA
L AN
ALY
SISA
ND
PLA
NN
ING
59Table 2-2
Example of Completed Data Collection Plan

60 THE HUMAN RESOURCES SCORECARD
clarify this issue early in the process. In this example, four groupsshare the responsibilities.
For impact evaluation, objectives focus on business impactmeasures influenced by the intervention. The measures/datacolumn includes the way in which each item is measured. Forexample, if one of the objectives is to improve quality, a specificmeasure would indicate how that quality is actually measured,such as defects per thousand units produced. In the example, twotypes of complaints are defined and are very different. The thirdmeasure, turnover, is also defined. Two sources of data are usedat this level: company records and questionnaires. Although thepreferred data collection method is performance monitoring, othermethods such as questionnaires may be appropriate as in thisexample. The timing depends on how quickly the intervention cangenerate a sustained impact on the three measures. It is usuallya matter of months after the program is completed. In thisexample, data were collected at six-month intervals. A projectevaluator is responsible for data collection at this level. If appro-priate, an ROI objective (Level 5) is included. It was not con-sidered appropriate for this example.
The data collection plan is an important part of the evalua-tion strategy and should be completed prior to moving forwardwith the intervention; the plan is completed before pursuingan ROI evaluation. The plan provides a clear direction of whattypes of data will be collected, how they will be collected, wherethey will be collected, when they will be collected, and who willcollect them.
ROI Analysis Plan
Table 2-3 shows a completed ROI analysis plan for the samesexual harassment prevention program. This planning documentis the continuation of the data collection plan presented in Table2-2 and captures information on several key items that arenecessary to develop the actual ROI calculation. In the firstcolumn, significant data items are listed; these are usually businessimpact measures (Level 4 data items), but in some cases couldinclude Level 3 data. These items will be used in the ROI analysis.The method for isolating the effects of the HR program is listednext to each data item in the second column. For most projects,the method will be the same for each data item, but there could

IN
ITIA
L AN
ALY
SISA
ND
PLA
NN
ING
61
Table 2-3Example of Completed ROI Analysis Plan

62 THE HUMAN RESOURCES SCORECARD
be variations. For example, if no historical data are availablefor one data item, then trendline analysis is not possible forthat item, although it may be appropriate for other items. Inthis example, a control group arrangement was not feasible,but a trendline analysis was. Participant estimates were used asa backup.
The method for converting data to monetary values is includedin the third column. In this example, complaints are convertedto monetary values with two approaches: using costs in thecompany records and collecting expert input from the staffdirectly involved in the process. The cost categories planned forcapture are outlined in the fourth column. Instructions abouthow certain costs should be prorated are noted here. The costcategories will be somewhat consistent from one HR program toanother. However, a specific cost that is unique to this programis also noted. The anticipated intangible benefits expected fromthis program are outlined in the fifth column. This list is gener-ated from discussions about the intervention with sponsors andsubject matter experts.
Communication targets are outlined in the sixth column.Although there could be many groups that should receive theinformation, four target groups are always recommended: seniormanagement, managers of participants, participants, and the HRstaff. Each of these four groups needs to know about the resultsof the ROI analysis. Finally, other issues or events that mightinfluence program implementation are highlighted in the seventhcolumn. Typical items include the capability of participants, thedegree of access to data sources, and unique data analysis issues.
The ROI analysis plan, when combined with the data collectionplan, provides detailed information on calculating the ROI,illustrating how the process will develop from beginning to end.When completed, these two plans should provide the directionnecessary for an ROI evaluation and should integrate with theoverall project plan.
SHORTCUT WAYS TO PLAN FOR THE EVALUATION
This chapter presents a very comprehensive approach to plan-ning the evaluation of HR programs and interventions. Theprocess is thorough, which is the approach often needed in most

INITIAL ANALYSIS AND PLANNING 63
major programs. When a major program involves hundreds ofthousands or even millions of dollars of investment, it is importantto allocate the appropriate time and budgets for developing theactual ROI. For smaller-scale projects, a more simplified processis appropriate. Four key issues should be addressed when takinga shortcut approach to planning for the evaluation.
Define Expectations and Requirements
Even in small-scale, simple projects, it is important to detailthe specific requirements needed for the program to be successfuland to clearly define the expectations. Here, the client should beas specific as possible in terms of the desired conduct and expec-tations from the HR initiative. As much detail that can bedeveloped is recommended. This can be included in the proposalor a very brief working document, but it should highlight the verykey issues that can cause the process to go astray.
Define Workforce Changes
It is important to define the anticipated changes at the worksite—changes that will be driven by the HR program and, morespecifically, the solutions from the program. Thinking through thechanges often will help identify potential barriers and enablersto the process. It will define what the employees and otherstakeholders will experience or be expected to do to make theprogram successful.
Define Expected Outcomes
The various levels of objectives are helpful for the simplestprojects. It is recommended that some consideration be given todeveloping these multiple levels of objectives. More importantly,the ultimate impact expected should be clearly defined in termsof the measures that should change or improve if the programis successful. Along with this definition would be the parametersaround collecting data and methods to isolate the effects of theprogram. The more specifics around these outcomes, the betterthe program will be in terms of its results being focused andhaving a clear understanding of what is necessary for success.

64 THE HUMAN RESOURCES SCORECARD
Develop a Plan
While the two documents presented in Tables 2-2 and 2-3 maybe too much detail for a simple program, there is no substitutefor detailing these issues. Even a program with a $50,000 pricetag is worth the few hours of planning to make sure that thekey issues are covered in some way. Shortcut ways to developsome of those processes are possible and are described later inthe book. The important point here is to develop some type ofsimplified plan, although the document may be less detailed thanthe two formal planning documents presented. Overall, this stepis critical and cannot be ignored because the key issues mustbe addressed.
FINAL THOUGHTS
This chapter presented the initial analysis and planning for theevaluation of an HR program. The rationale for initial analysisand objectives was explored. The linkage of levels of evaluation,objectives, and needs was explored. This connection greatlysimplifies the HR accountability process. Next, evaluation plan-ning tools were introduced. When the ROI process is thoroughlyplanned, taking into consideration all potential strategies andtechniques, it becomes manageable and achievable. The remainingchapters focus on the major elements of the ROI process.
FURTHER READING
Dean., Peter J., and Ripley, David E. (Eds.) “Performance Improve-ment Interventions: Performance Technologies in the Workplace,”in Methods for Organizational Learning. Performance Improve-ment Series, Vol. 3. Washington, D.C.: The InternationalSociety for Performance Improvement, 1998.
Esque, Timm J., and Patterson, Patricia A. (Ed.) Getting Results:Case Studies in Performance Improvement, Vol. 1. Washington,D.C.: HRD Press/International Society for Performance Improve-ment, 1998.
Hiebeler, Robert, Kelly, Thomas B., and Ketteman, Charles. BestPractices: Building Your Business With Customer-FocusedSolutions. New York: Arthur Andersen/Simon & Schuster, 1998.

INITIAL ANALYSIS AND PLANNING 65
Kaufman, Roger, Thiagarajan, Sivasailam, and MacGillis, Paula(Eds.) The Guidebook for Performance Improvement: Workingwith Individuals and Organizations. San Francisco: Pfeiffer, 1997.
Kaufman, Roger. Strategic Thinking: A Guide to Identifying andSolving Problems. Washington, D.C.: American Society forTraining and Development, 1996.
Langley, Gerald J. et al. The Improvement Guide: A PracticalApproach to Enhancing Organizational Performance. SanFrancisco: Jossey-Bass Publishers, 1996.
Swanson, Richard A., and Holton, Elwood F. III. Results: Howto Assess Performance, Learning, and Perceptions in Organiza-tions. San Francisco: Berrett-Koehler Publishers, 1999.


P a r t II
The ROIProcess,
Step-by-Step

68 THE HUMAN RESOURCES SCORECARD
68
Chapter 3
CollectingData DuringHR Program
Implementation
Because of the variety of approaches to collecting data at thefirst four levels (Level 1—reaction and satisfaction, Level 2—learning, Level 3—application and implementation, and Level 4—impact), two chapters are devoted to presenting the techniquesand issues surrounding this major phase of evaluation. Thischapter focuses on collecting data during implementation to

COLLECTING DATA DURING HR PROGRAM IMPLEMENTATION 69
measure participant reaction and satisfaction and learning. Chap-ter 4 covers collecting data after implementation to measureapplication and business impact. Although there is overlap in themethods for data collecting across the levels of evaluation, thetwo chapters are arranged according to the most likely methodfor the specific level.
Collecting data at all four levels is necessary because of thechain of impact that must exist for a program to be successful.Participants in the program should (1) experience a positivereaction to the program and its potential application, (2) acquirenew skills or knowledge to implement the program, (3) changeon-the-job behavior, actions, and tasks that should prompt apositive implementation, and (4) drive changes in business impact.The only way to know if the chain of impact has occurred is tocollect data at all four levels.
MEASURING REACTION AND SATISFACTION
Collecting reaction and satisfaction data during the imple-mentation of the HR program is the first operational phase ofthe ROI process. Client feedback data are powerful for makingadjustments and measuring success. A variety of methods areavailable to capture reaction and satisfaction data at the appro-priate time during implementation. This section outlines the mostcommon approaches for collecting these critical data and exploresseveral key issues about the use of the information.
Why Measure Reaction and Satisfaction?
It would be difficult to imagine an HR program being imple-mented without collecting feedback from those involved in theprogram, or at least from the client. Client feedback is criticalto understanding how well the process is working or to gaugeits success after it has been completed. It is always included inevery HR initiative because of its crucial importance. However,the advantage of collecting this type of data goes beyond just thesatisfaction of the client and includes many other key issues,making it one of the most important data collection efforts.

70 THE HUMAN RESOURCES SCORECARD
Customer Service Is Key. In these days of the customer servicerevolution, it is important to measure customer satisfaction. With-out continuous improvement evidenced by customer satisfactiondata and without sustained, favorable reactions to HR programs,it is difficult for an HR group to function properly. It is importantto consider the different types of customers involved in programs.Three particular types of customers exist for almost every HRprogram. First, there are those directly involved in the program.They are key stakeholders who are directly affected by the HRprogram and often have to change processes and procedures, andmake other job adjustments related to the program. In addition,they often have to learn new skills, tasks, and behaviors to makethe program successful. These participants, as they are sometimescalled, are critical to the success of the program, and theirfeedback is critical to making adjustments and changes in theprogram as it unfolds and is implemented. The second set ofcustomers is those who are on the sidelines; those who are notdirectly involved, but have some interest in the HR initiative. Thesupporters, as they are sometimes called, are concerned about theprogram and are supporting it in some way. Their perception ofthe success of the program or potential success is importantfeedback, as this group will be in a position to influence theprogram in the future. The third set of stakeholders is perhapsthe most important. This is the client group who actually paysfor the program. This individual, or group of individuals, requestsprograms, supports programs, approves budgets, allocates resources,and ultimately must live with the success or failure of the pro-gram. This important group must be completely satisfied with theHR solution. Their level of satisfaction must be deter-mined early, and adjustments must be made. In short, customersatisfaction is key to success and must be obtained in a varietyof different ways to focus on the success.
Early Feedback Is Essential. HR initiatives can go astray quickly,and sometimes a specific program is the wrong (or incomplete)solution for the specified problem. There are times when aprogram can be mismatched from the beginning, so it is essentialto get feedback early in the process so that adjustments can bemade. This helps avoid misunderstandings, miscommunications,and, more importantly, misappropriations, as an improperly

COLLECTING DATA DURING HR PROGRAM IMPLEMENTATION 71
designed program is altered or changed quickly before moreserious problems are created.
Making Adjustments and Changes to the Program. The conceptof continuous process improvement suggests that a program mustbe adjusted and refined throughout its duration. There must bean important linkage between obtaining feedback and makingchanges and reporting changes back to the groups who providethe information. This survey-feedback-action loop is critical forany type of HR program.
Attention Is Appreciated. Many of the individuals involved in anHR program, particularly the affected population or participants,appreciate the opportunity to provide feedback. In too manysituations, their input is ignored and their complaints disregarded.They appreciate the program leader or HR consultant asking forinput and, more importantly, taking action as a result of thatinput. Other stakeholders and even clients appreciate the oppor-tunity to provide feedback, not only early in the process, butthroughout the process.
For Some, These Are the Most Important Data. Because feedbackdata are important to the program’s success, they should begathered in almost every HR initiative. They have become someof the most important data collected. Unfortunately, in somesituations, program success is often measured by the feedback.As this book clearly shows, the feedback data are only one partof the evaluation puzzle and represent only one of the six typesof data, yet their importance cannot be understated.
Comparing with Data from Other Programs. Some organizationscollect reaction and satisfaction data from several sources usingstandard questions, and the data are then compared with datafrom other programs so that norms and standards can be developed.This is particularly helpful at the end of a program rollout asclient satisfaction is gauged. These satisfaction data can be usednot only to compare the success of the program but to relate tooverall program success and even correlate with other successfulmeasures. Data collection must be deliberately pursued in a

72 THE HUMAN RESOURCES SCORECARD
systematic, logical, rational way. This section explores the keyissues involved in collecting and using these important measures.
Sources of Data for Reaction and Satisfaction
When considering the possible data sources that will providefeedback on the success of an HR program, the categories areeasily defined. The major categories of stakeholders are brieflydescribed in this section.
Client/Senior Managers. One of the most useful data sources forROI analysis is the client group, usually a senior managementteam. Whether an individual or a group, the client’s perceptionis critical to program success. Clients can provide input on alltypes of issues and are usually available and willing to offerfeedback. Collecting data from this source is preferred for reactionand satisfaction because the data usually reflect what is necessaryto make adjustments and measure success.
HR Program Participants. The most widely used data source foran ROI analysis is the HR program participants, who are directlyinvolved in or affected by the program. They must use the skillsand knowledge acquired as a result of an HR initiative and applythem on the job. Sometimes they are asked to explain the potentialimpact of those actions. Participants are a rich source of datafor almost every issue or part of the program. They are credible,since they are the individuals who must achieve the performanceresults and are often the most knowledgeable of the processes andother influencing factors. The challenge is to find an effective andefficient way to capture data in a consistent manner.
Team Leaders. Another important source of data is those indi-viduals who directly supervise or lead program participants. Thisgroup will often have a vested interest in evaluation, since theyhave a stake in the process because their employees are directlyinvolved in the program. Also, in many situations, they observethe participants as they attempt to use the knowledge and skillsacquired from the initiative. Consequently, they can report on thesuccesses linked to the initiative as well as the difficulties and

COLLECTING DATA DURING HR PROGRAM IMPLEMENTATION 73
problems associated with it. Although team leader input is usuallybest for reaction and satisfaction data, it can also be useful forother levels of evaluation data.
Team Members. In situations where entire teams are involved oraffected by the HR program, all team members can provideinformation about the perceived changes prompted by the program.Input from team members is appropriate for issues directlyinvolved in their work. Although collecting data from this sourcecan be helpful and instructive, it is sometimes avoided becauseof the potential inaccuracies that can enter the feedback process.Team members must be capable of providing meaningful input.
Internal Customers. The individuals who serve as internal customersof the program participants are another source of data for a fewtypes of HR programs. In these situations, internal customersprovide input on perceived changes linked to the HR program.This source of data is more appropriate when HR programsdirectly affect the internal customers. They report on how theprogram has (or will) influence their work or the service theyreceive. Because of the subjective nature of this process and thelack of opportunity to fully evaluate the application of skills, ofthe participants, this source of data may be somewhat limited.
Program Implementation Leader. In some situations, the HRprogram implementation leader may provide input on the successof the program. The input from these sources may be based onon-the-job observations during the implementation and after ithas been completed. Data from this source have limited usebecause program leaders may have a vested interest in the out-come of evaluation, so their input may lack objectivity.
Areas of Feedback for Reaction and Satisfaction Data
There are many topics that are critical targets for feedbackbecause there are so many issues and processes involved in atypical HR program implementation. Feedback is needed inalmost every major issue, step, or process to make sure thingsare moving forward properly. The following list shows the typicalmajor areas of feedback for most programs:

74 THE HUMAN RESOURCES SCORECARD
� Appropriateness of objectives� Appropriateness of plans� Appropriateness of schedule� Progress made with plans� Relevance of program� Support for program� Resources for program� Integration of program with other systems� Program leadership� Program staffing� Program coordination� Program communication� Motivation of program participants� Cooperation of program participants� Capability of program participants� Likelihood of program success� Barriers to project success� Enablers to program success� Continuing administration of program
This list shows the key success factors in an HR program,beginning with the issues that reflect the initial planning of theprogram. Different stakeholders react to the appropriateness ofthe program planning schedule and objectives and the progressmade with those planning tools. The relevance of the programis critical for the participants because if the program is perceivedas irrelevant, more than likely it will not succeed in the work-place. The support for the program—including resources and howthe program is integrated with other systems—represents importantareas for feedback. Participants must see that the program hasthe necessary commitment. Several issues are important to manage-ment and the organization sponsoring the program, includingprogram leadership, staffing levels, coordination, and communi-cation. Also, it is important to gather feedback on how well theprogram implementation team is working to address such issuesas motivation, cooperation, and capability. A dysfunctional teamcan spell disaster quickly. Finally, the issues that inhibit orenhance success are important, along with input on the likelihoodof success. For a particular program, there can be other issues,and each can have specific parts. Each step, element, task, or part

COLLECTING DATA DURING HR PROGRAM IMPLEMENTATION 75
of the program represents an opportunity for feedback. Thechallenge is to sort out those things that are most important sothe participants can provide valuable input.
Timing of Data Collection for Reactionand Satisfaction Feedback
The timing of data collection revolves around particular eventsconnected with the HR program. Any particular activity, imple-mentation issue, or milestone is an appropriate time to collectdata, beginning with pre-program data collection and progressingto the implementation. Figure 3-1 shows the timing of feedbackin a six-month program. This particular program has pre-programdata collection. This is important to make sure that the environ-ment is proper and supportive of the program. A pre-programassessment can be an eye-opening exercise, as particular inhibitorsand barriers can be identified that will need adjusting or alteringin the program to achieve success. In this particular example,assessment is taken at the beginning of the program as theannouncement is made and the program is fully described. Next,a one-month follow-up is taken, followed by a four-monthfollow-up that is actually three months later. Finally, at the endof the program, the sixth month, an assessment is taken. Usingfive time frames for data collection may be too comprehensivefor some programs, but is appropriate for major programs. Inaddition to these data collection opportunities, a six-monthfollow-up is planned after implementation. Timing will dependon the resources available, the need to obtain feedback directlyfrom participants, and the magnitude of events or activities
Figure 3-1. Timing of feedback in a six-month program.

76 THE HUMAN RESOURCES SCORECARD
scheduled throughout the program. In addition, they need tomake quick adjustments and changes that will also affect thetiming. Finally, the need to gain commitment and to support andmeasure the pulse all the way through the process are importantfactors in determining the actual timing.
Using Questionnaires to MeasureReaction and Satisfaction
The questionnaire is probably the most common method ofdata collection. Questionnaires come in all sizes, ranging fromshort reaction forms to detailed instruments. They can be usedto obtain subjective data about participants’ attitudes, as well asto document data for future use in a projected ROI analysis. Withthis versatility and popularity, it is important that questionnairesbe designed properly to satisfy both purposes.
Types of Questions. Five basic types of questions are available.Depending on the purpose of the evaluation, the questionnairemay contain any or all of the following types of questions:
� Open-ended question—has an unlimited answer. The ques-tion is followed by ample blank space for the response.
� Checklist—a list of items. A participant is asked to checkthose that apply to the situation.
� Two-way question—has alternate responses, a yes/no, orother possibilities. This type of question can also include arange of responses from disagree to agree.
� Multiple choice question—has several choices, and theparticipant is asked to select the most appropriate.
� Ranking scales—requires the participant to rank a listof items.
Figure 3-2 shows examples of each of these types of questions.
Questionnaire Design. Questionnaire design is a simple andlogical process. An improperly designed or worded questionnairewill not collect the desired data and is confusing, frustrating, andpotentially embarrassing. The following steps will help ensure thata valid, reliable, and effective instrument is developed.

COLLECTING DATA DURING HR PROGRAM IMPLEMENTATION 77
Determine the Information Needed. The first step of any instru-ment design is to itemize the topics, issues, and success factorsfor the program. Questions are developed later. It might behelpful to develop this information in outline form so that relatedquestions can be grouped together.
Select the Type(s) of Questions. Determine whether open-endedquestions, checklists, two-way questions, multiple choice ques-tions, or a ranking scale is most appropriate for the purpose ofthe questions. Take into consideration the planned data analysisand variety of data to be collected.
Figure 3-2. Sample questions.

78 THE HUMAN RESOURCES SCORECARD
Develop the Questions. The next step is to develop the questionsbased on the types of questions planned and the information needed.The questions should be simple and straightforward enough to avoidconfusion or leading the participant to a desired response. Termsor expressions unfamiliar to the participant should be avoided.
Test the Questions. After the questions are developed, they shouldbe tested for understanding. Ideally, the questions should be testedon a small sample of participants in the program. If this is notfeasible, the questions should be tested on employees at approxi-mately the same job level as the participants. Collect as much inputand criticism as possible, and revise the questions as necessary.
Prepare a Data Summary. A data summary sheet should bedeveloped so data can be tabulated quickly for summary andinterpretation. This step will help ensure that the data can beanalyzed quickly and presented in a meaningful way.
Develop the Completed Questionnaire. The questions should befinalized in a professional questionnaire with proper instructions.After completing these steps, the questionnaire is ready to beadministered. Because questionnaire administration is a criticalelement in evaluation, several ideas will be presented later inthis chapter.
Determining Questionnaire Content. The content for a particularquestionnaire will vary with the particular issue explored. Thequestions will focus on any of the areas identified the list of areasof feedback, earlier in this chapter. For example, the issue of progressmade with the program is an important topic to always include ona questionnaire. It could be presented as a range of responses, anopen-ended question, or even a multiple choice response category.The content of the actual questions is just as important as the designand must have careful attention to make sure the proper topics areexplored and the appropriate information is examined.
Using Surveys to Measure Reaction and Satisfaction
Attitude surveys represent a specific type of questionnaire withseveral applications for measuring reaction and satisfaction of HR

COLLECTING DATA DURING HR PROGRAM IMPLEMENTATION 79
programs designed to improve work, policies, procedures, theorganization, or even the team. Pre- and post-measurements areimportant to show changes. Sometimes an organization will con-duct a survey to assess the correct solution with one of the areaspreviously listed. Then, based on these results, HR initiatives areundertaken to influence change in areas where improvementsare needed.
Measuring satisfaction and reaction is a complex task in whichattitudes are crucial. It is impossible to measure an attitudeprecisely, since information gathered may not represent a par-ticipant’s true feelings. Also, the behavior, beliefs, and feelings ofan individual will not always correlate. Attitudes tend to changewith time, and several factors can form an individual’s attitude.Recognizing these shortcomings, it is possible to get a reasonableassessment of an individual’s attitude.
Surveys are not the only way to measure attitudes. Interviewsand observations are two other ways to measure attitudes andare discussed later.
Guidelines for Developing Surveys. The principles of surveyconstruction are similar to those of questionnaire design. How-ever, there are a few guidelines unique to the design or purchaseof feedback surveys.
Involve Appropriate Management. The key stakeholders involvedin this process must be committed to taking action based onsurvey results. Involve them early in the process, before the surveyis constructed. Address management concerns, issues, and sug-gestions, and try to win commitment.
Determine Precisely the Reactions that Must Be Measured. Whilethis is obvious, it is easy to stray into areas unrelated to thesubject. “Let’s check on their reaction to this” is a familiar trap.Although it may be interesting information, it should be omittedif it is unrelated.
Keep Survey Statements as Simple as Possible. Participants needto understand the meaning of a statement or question. Thereshould be little room for differing interpretations.

80 THE HUMAN RESOURCES SCORECARD
Ensure that Participant Responses Are Anonymous. If feasible,participants must feel free to respond openly to statements orquestions. The confidentiality of their responses is of the utmostimportance. If data are collected that can identify a respondent,then a neutral third party should collect and process the data.
Communicate the Purpose of the Survey. Participants tend tocooperate in an activity when they understand its purpose. Whena survey is administered, participants should be given an explana-tion of its purpose and told what will be done with the infor-mation. Also, they should be encouraged to give correct andproper statements or answers.
Identify Survey Comparisons. Reactions by themselves are virtuallymeaningless. They need to be compared with expectations, withdata before or after the program, or with another group orprogram. Data may be compared with all employees, a division,a department, or previous programs. For purchased surveys,information may be available on a national scale in similarindustries. In any case, specific comparisons should be plannedbefore administering the survey.
Design for Easy Tabulation. In an attitude survey, yes/no remarksor varying degrees of agreement and disagreement are the usualresponses. Figure 3-3 illustrates these two kinds of responses.
Figure 3-3

COLLECTING DATA DURING HR PROGRAM IMPLEMENTATION 81
Uniform responses make it easier for tabulation and comparisons.On a scale of strongly agree to strongly disagree, numbers areusually assigned to reflect the response. For instance, a 1 mayrepresent strongly disagree, and a 5, strongly agree. An averageresponse of 2.2 on a pre-program survey followed by a post-program average response of 4.3 shows a significant change inattitude. Some argue that a five-point scale merely permits therespondent to select the midpoint and not to be forced to makea choice. If this is a concern, an even-numbered scale shouldbe used.
Using Reaction and Satisfaction Data
Sometimes participant feedback is solicited, tabulated, sum-marized, and then disregarded. The information must be collectedand used for one or more of the purposes of evaluation. Other-wise, the exercise is a waste of the participants’ time. Too often,program implementers or evaluators use the material to feed theiregos and let it quietly disappear into their files, forgetting theoriginal purposes behind its collection. A few of the more commonreasons for gathering reaction and satisfaction data are sum-marized below.
Monitor Customer Satisfaction. Because this input is the principalmeasure taken from the participants, it provides a good indicationof their overall reaction to, and satisfaction with, the program.Thus, program developers and owners will know how wellsatisfied the customers actually are with the product. Data shouldbe reported to clients and others.
Identify Strengths and Weaknesses of the Program. Feedback isextremely helpful in identifying weaknesses as well as strengthsin the program. Participant feedback on weaknesses can oftenlead to adjustments and changes. Identifying strengths can behelpful in future designs so processes can be replicated.
Develop Norms and Standards. Because reaction and satisfactionevaluation data can be automated and can be collected in nearly100 percent of HR initiatives, it becomes relatively easy todevelop norms and standards throughout the organization. Target

82 THE HUMAN RESOURCES SCORECARD
ratings can be set for expectations; particular program results arethen compared with those norms and standards.
Evaluate the HR Staff. Perhaps one of the most commonuses of reaction and satisfaction data is HR staff evaluation. Ifproperly constructed and collected, helpful feedback data can beprovided to HR staff members so that adjustments can be madeto increase effectiveness. Some caution needs to be taken, though,because these evaluations can sometimes be biased, so otherevidence may be necessary to provide an overall assessment ofHR staff performance.
Evaluate Planned Improvements. Feedback data from a question-naire can provide a profile of planned actions and improvements.This can be compared with on-the-job actions as a result of theprogram. This provides a rich source of data in terms of whatparticipants may be changing or implementing because of whatthey have learned.
Link with Follow-up Data. If a follow-up evaluation is planned,it may be helpful to link Level 1 data with follow-up data tosee if planned improvements became reality. In most cases,planned actions are often inhibited in some way through on-the-job barriers.
Marketing Future Programs. For some organizations, participantfeedback data provide helpful marketing information. Participants’quotes and reactions provide information that may be convincingto potential participants or business units considering implementingthe HR program. Program marketing brochures often containquotes and summaries of feedback data.
Shortcut Ways to Measure Reaction and Satisfaction
The key question for some at this point is what are someshortcut ways to measure reaction and satisfaction? Althoughreaction and satisfaction data should always be collected, someshortcuts that can be taken. There are some essential items thatmust be taken care of for very short, low-profile, inexpensiveprograms. Unfortunately, omitting Level 1 is not an option

COLLECTING DATA DURING HR PROGRAM IMPLEMENTATION 83
because of the critical importance of early feedback. Threeparticular issues can be helpful.
Use a Simple Questionnaire. A detailed, comprehensive, 100-itemquestionnaire isn’t necessary for every program. A simple ten- tofifteen-item questionnaire using multiple choice, true/false, or evena scale rating will be sufficient for many small-scale programs.Although interviews, focus groups, surveys, and questionnairesare all presented as options, the questionnaire can suffice formost situations.
Collect Data Early and React Quickly. Taking an early pulse iscritical. Find out if the program is being accepted and if thoseinvolved have concerns. This is very critical, and the action mustbe taken quickly. This will ensure that the process is kept ontrack and that the HR program enjoys success as planned.
Pay Attention to Participants. The key stakeholders, the programparticipants, are critical to the process. They can make or breakany HR initiative, and their feedback is very important. A generalrule is to always listen to this group and react to its concerns,issues, and recommendations. Sometimes it will need filter-ing because of biases. The important thing is to listen and react,when appropriate.
MEASURING SKILL AND KNOWLEDGE CHANGES
It may seem unnecessary to measure learning in an HR programor initiative. After all, when application and implementation aremeasured, the actual progress made in the workplace is measured.And ultimately, when business impact variables are monitored,the success of the initiative becomes quite clear. However, it issometimes critical to understand the extent to which learning hasoccurred, particularly in initiatives where there are a significantamount of job changes, procedure changes, new tools, newprocesses, and new technology. The extent to which the par-ticipants involved in a program actually learn their new jobs andnew processes may be one of the biggest determinants of thesuccess of the HR program. This section focuses on simpletechniques for measuring learning. Many of them have been used

84 THE HUMAN RESOURCES SCORECARD
for years to measure learning in training programs in terms offormal testing and skill practices. Others are less formal instructure and can suffice when time is a concern or when costsneed to be minimized.
Why Measure Learning?
There are three key areas that demonstrate why learning is animportant measure in an HR initiative or program. Each of these,individually, will probably justify the need to measure learning.Collectively, they provide a major thrust for measuring theamount of skills, knowledge, or change during an intervention.
Importance of Knowledge, Expertise, and Competencies. Manyorganizations are focusing more on knowledge, expertise, andcompetencies than previously. Many of the large HR initiativesinvolve developing expertise with employees using tools andtechniques not previously used. Some programs focus directly oncore competencies and building important skills, knowledge, andbehaviors into the organization. With a continuous focus onknowledge management, it is important for knowledge-basedemployees to understand and acquire a vast array of information,assimilate it, and use it in a productive way. This emphasis onemployee knowledge and skills makes measuring learning in anHR program crucial.
The Importance of Learning in an HR Initiative or Program.Although some HR initiatives may involve plenty of new equip-ment, processes, procedures, and new technology, the humanfactor is still critical to the process. Whether there is significantrestructuring or the addition of new systems, employees mustlearn how to work in the new environment and develop newknowledge and skills. Learning is becoming a larger part of HRinitiatives than it previously was because of the variety of tools,techniques, processes, and technology that are being applied insuch initiatives. Gone are the days where the simple tasks andprocedures are built into work or automated within the process.Instead, there are complex environments, complex processes, andcomplicated tools that must be used in an intelligent way to reapthe benefits from the HR initiative or program. Employees mustlearn in a variety of ways, not just in a formal classroom environ-

COLLECTING DATA DURING HR PROGRAM IMPLEMENTATION 85
ment, but through technology-based learning and on-the-jobfacilitation with job aids and other tools. Also, the team leadersand managers often serve to reinforce, coach, or mentor in someinitiatives. In a few cases, learning coaches or on-the-job trainersare used in conjunction with the HR initiative to ensure thatlearning is transferred to the job and is implemented as planned.
Finding Out What Went Wrong When There Is a Problem.When the initial program announcement and rollout do not gosmoothly, the most important issue is to find out what wentwrong. What areas need to be adjusted? What needs to bealtered? When learning is measured, it is easy to see the degreeto which the lack of learning is actually a problem or, in somecases, to eliminate the learning deficiency as a problem. Withoutthe learning measurement, the HR consultant may not know whyemployees are not performing the way they should or whyparticular parts of the HR initiative are not being managed theway they should.
These key issues make learning an important issue in HRinitiatives, requiring appropriate attention to this measure as withthe other five measures in the ROI process.
Measuring Learning with Formal Tests
Testing is important for measuring learning in program evalua-tions. Pre- and post-intervention comparisons using tests are verycommon. An improvement in test scores shows the change inskill, knowledge, or attitude of the participant that is attributedto the HR initiative. By any measure, there was a dramaticincrease in the use of tests in the United States throughout the1990s. The principles of test development are similar to those forthe design and development of questionnaires and attitude surveys.
The types of tests used in HR initiatives can be classified inthree ways. The first is based on the medium used for administer-ing the test. The most common media for tests are written orkeyboard tests; performance tests, using simulated tools or theactual equipment; and computer-based tests, using computers andvideo displays. Knowledge and skills tests are usually written,because performance tests are more costly to develop and administer.Computer-based tests and those using interactive video are gainingpopularity. In these tests, a computer monitor or video screen

86 THE HUMAN RESOURCES SCORECARD
presents the questions or situations, and participants respond bytyping on a keyboard or touching the screen. Interactive videoshave a strong element of realism because the person being testedcan react to images, often moving pictures and video vignettesthat reproduce the real job situation.
The second way to classify tests is by purpose and content. Inthis context, tests can be divided into aptitude tests or achieve-ment tests. Aptitude tests measure basic skills or acquired capacityto learn a job. An achievement test assesses a person’s knowledgeor competence in a particular subject.
A third way to classify tests is by test design. The mostcommon are objective tests, norm-referenced tests, criterion-referenced tests, essay tests, oral examinations, and performancetests. Objective tests have answers that are specific and precise,based on the objectives of a program. Attitudes, feelings, creativity,problem-solving processes, and other intangible skills and abilitiescannot be measured accurately with objective tests. A more usefulform of objective test is the criterion-referenced test. Oral examina-tions and essay tests have limited use in evaluating HR initiatives;they are probably more useful in academic settings. The last twotypes of tests listed above are more common in HR initiatives:criterion-referenced tests and performance testing evaluation. Bothare described in more detail below.
Criterion-Referenced Test. The criterion-referenced test (CRT) isan objective test with a predetermined cutoff score. The CRT isa measure against carefully written objectives for the learningcomponents of the program. In a CRT, the interest lies in whetheror not a participant meets the desired minimum standards, nothow that participant ranks with others. The primary concern isto measure, report, and analyze participant performance as itrelates to the learning objectives.
Table 3-1 examines a reporting format based on criterion-referenced testing. This format helps explain how a CRT isapplied to an evaluation effort. Four participants have completeda learning component with three measurable objectives thatcorrespond to each of the modules. Actual test scores are reported,and the minimum standard is shown. For example, on the firstobjective, Participant 4 received a pass rating for a test that hasno numerical value and that is simply rated pass or fail. The same

CO
LLEC
TIN
G D
AT
A DU
RIN
G H
R P
RO
GR
AM
IM
PLE
MEN
TAT
ION
87
Table 3-1Reporting Format for CRT Test Data
Objective Objective Objective Total1 Raw 2 Raw 3 Objectives Minimum Overall
P/F Score Std P/F Score Std P/F Passed Standard Score
Participant 1 P 4 10 F 87 90 F 1 2 of 3 FailParticipant 2 F 12 10 P 110 90 P 2 2 of 3 PassParticipant 3 P 10 10 P 100 90 P 3 2 of 3 PassParticipant 4 P 14 10 P 88 90 F 2 2 of 3 PassTotals 4 3 Pass 3 Pass 2 Pass 8 Pass 3 Pass
1 Fail 1 Fail 2 Fail 4 Fail 1 Fail

88 THE HUMAN RESOURCES SCORECARD
participant met objective 2 with a score of 14 (10 was listed asthe minimum passing score). The participant scored 88 on objec-tive 3 but failed it because the standard was 90. Overall, par-ticipant 4 satisfactorily completed the learning component. Thecolumn on the far right shows that the minimum passing standardfor the program is at least two of the three objectives. Participant4 achieved two objectives, the required minimum.
Criterion-referenced testing is a popular measurement toolsometimes used in HR initiatives. The approach is helpful whenit is necessary for a group of employees to learn new systems,procedures, or technology as part of an HR initiative. Its use isbecoming widespread. The process is frequently computer-based,making testing more convenient. It has the advantage of beingobjective-based, precise, and relatively easy to administer. Itrequires clearly defined objectives that can be measured by tests.
Performance Testing. Performance testing allows the participantto exhibit a skill (and occasionally knowledge or attitudes) thathas been learned through an HR initiative. The skill can bemanual, verbal, or analytical, or a combination of the three.Performance testing is used frequently in HR programs where theparticipants are allowed to demonstrate what they have learned.Performance testing also comes in the form of skill practices orrole playing. Participants are asked to demonstrate discussion orproblem-solving skills they have acquired. To illustrate the pos-sibilities of performance testing, two examples are presented.
Example 1. Managers are participating in an HR program thatrequires them to analyze the HR processes used in the organi-zation. As part of the program, participants are given the projectassignment to design and test a basic performance appraisalsystem. The HR staff observes participants as they check out theircompleted process and then carefully builds the same process andcompares the results with those of the participants. These com-parisons and the simulated performance of the design provide anevaluation of the project and represent an adequate reflection ofthe skills learned in the program.
Example 2. As part of a reorganization project, team memberslearn new products and sales strategies. Part of the evaluation

COLLECTING DATA DURING HR PROGRAM IMPLEMENTATION 89
requires team members to practice skills in an actual situationinvolving a sales presentation. Then, participants are asked toconduct the skill practice on another member of the group usinga real situation and applying the principles and steps learned inthe project. The skill practice is observed by the HR staff and awritten critique is provided at the end of the practice. Thesecritiques provide part of the evaluation of the HR initiative.
For a performance test to be effective, the following steps arerecommended in the design and administration of the test:
� The test should be a representative sample of the work/taskrelated to the HR initiative. The test should allow theparticipant to demonstrate as many skills taught in theprogram as possible. This increases the validity of the testand makes it more meaningful to the participant.
� The test should be thoroughly planned. Every phase of thetest should be planned—the timing, the preparation of theparticipant, the collection of necessary materials and tools,and the evaluation of results.
� Thorough and consistent instructions are necessary. As withother tests, the quality of the instructions can influence theoutcome of a performance test. All participants should begiven the same instructions. They should be clear, concise,and to the point. Charts, diagrams, blueprints, and othersupporting information should be provided if they arenormally provided in the work setting. If appropriate andfeasible, the test should be demonstrated by an HR staffmember so that participants observe how the skill is practiced.
� Procedures should be developed for objective evaluation,and acceptable standards must be developed for a per-formance test. Standards are sometimes difficult to developbecause varying degrees of speed, skill, and quality areassociated with individual outcomes. Predetermined standardsmust be developed so that employees know in advance whathas to be accomplished to be considered satisfactory andacceptable for test completion.
� Information that may bias participant reasons should notbe included. The learning module is included to develop aparticular skill. Participants should not be led in this directionunless they face the same obstacles in the job environment.

90 THE HUMAN RESOURCES SCORECARD
With these general guidelines, performance tests can be usedas effective tools for evaluations where demonstration of per-formance is a requirement of HR initiatives. Although more costlythan written tests, performance tests are essential in situationswhere a high degree of fidelity is required between work andtest conditions.
Measuring Learning with Simulation
Another technique for measuring learning is job simulation.This method involves the construction and application of aprocedure or task that simulates or models the work involved inthe HR initiative. The simulation is designed to represent, asclosely as possible, the actual job situation. Participants try outtheir performance in the simulated activity and have it evaluatedbased on how well the task is accomplished. Simulations may beused during the intervention, at the end of the implementation,or as part of a follow-up evaluation.
Advantages of Simulations. Simulations offer several advantagesfor the HR staff.
Reproducibility. Simulations permit a job or part of a job to bereproduced in a manner almost identical to the real setting.Through careful planning and design, the simulation can have allof the central characteristics of the real situation. Even complexjobs, such as that of the manager, can be simulated adequately.
Cost Effectiveness. Although sometimes expensive in the initialdevelopment, simulations can be cost effective in the long run.For example, it is cost prohibitive to train airline pilots to flyan airplane by using a $50 million aircraft. Therefore, an aircraftsimulator is used to simulate all of the flying conditions andenable the pilot to learn to fly before boarding the actual aircraft.The cost involved in on-the-job learning becomes prohibitivemaking simulation much more attractive in other situations.
Safety Considerations. Another advantage of using simulations issafety. The safety component of many jobs requires participants

COLLECTING DATA DURING HR PROGRAM IMPLEMENTATION 91
to learn under simulated conditions. For example, emergencymedical technicians risk injury and even life if they do not learnemergency medical techniques prior to encountering a real-lifesituation. Firefighters are trained in simulated conditions priorto being exposed to actual fires. CIA agents are trained insimulated conditions before being exposed to their real-worldenvironment. Safety is an important consideration when decidingon learning methodologies.
Simulation Techniques. There are several simulation techniquesused to evaluate learning that has taken place during an HRinitiative. The most common techniques are briefly described.
Electrical/Mechanical Simulation. This technique uses a combina-tion of electronics and mechanical devices to simulate real-lifesituations. They are used in conjunction with programs to developoperational and diagnostic skills. Expensive examples of thesetypes include simulated patients, or a simulator for a nuclearpower plant operator. Other less-expensive types of simulatorshave been developed to simulate equipment operation.
Task Simulation. Another approach involves a participant’s per-formance in a simulated task as part of an evaluation. Forexample, in an aircraft company, technicians are trained on thesafe removal, handling, and installation of a radioactive sourceused in a nucleonic oil-quantity indicator gauge. These techniciansattend a thorough HR safety program on all of the proceduresnecessary for this important assignment. To become certified toperform this task, technicians are observed in a simulation, wherethey perform all the necessary steps on a checklist. After theyhave demonstrated that they possess the skills necessary for thesafe performance of this assignment, they are certified by theinstructor. This task simulation serves as the evaluation.
Business Games. Business games have grown in popularity inrecent years. They represent simulations of a part or all of abusiness enterprise. Participants change the variables of thebusiness and observe the effects of those changes. The game notonly reflects the real-world situation, but may also represent an

92 THE HUMAN RESOURCES SCORECARD
HR initiative. The participants are provided certain objectives,play the game, and have their output monitored. Their per-formance can usually be documented and measured. Typicalobjectives are to maximize profit, sales, market share, or returnon investment. Those participants who maximize the objectivesare those who usually have the highest performance in the program.
In-Basket. Another simulation technique called the in-basket isparticularly useful in team leader, supervisory, and managementdevelopment initiatives. Portions of a supervisor’s job are simulatedthrough a series of items that normally appear in an in-basket.These items are usually memos, notes, letters, and reports thatcreate realistic conditions facing the supervisor. The participantmust decide what to do with each item while taking into con-sideration the principles learned. The participant’s performancewith the in-basket represents an evaluation of the program. Insome situations, every course of action for each item in the in-basket is rated, and a combination of the chosen alternativesprovides an overall rating on the in-basket. This provides aperformance score representing the participant’s ability to addressthe major issues.
Case Studies. A perhaps less-effective but still-popular techniqueof simulation is a case study. A case study represents a detaileddescription of a problem and usually contains a list of severalquestions posed to the participant. The participant is asked toanalyze the case and determine the best course of action. Theproblem should reflect the conditions in the real-world setting andthe content in an HR program.
The most common categories of case studies include:
� Exercise case studies, which provide an opportunity forparticipants to practice the application of specific procedures
� Situational case studies, which provide participants theopportunity to analyze information and make decisionssurrounding their particular situation
� Complex case studies, which are an extension of the situa-tional case study, where the participant is required to pro-cess a large amount of data and information, some of whichmay be irrelevant

COLLECTING DATA DURING HR PROGRAM IMPLEMENTATION 93
� Decision case studies, which require the participant to goa step further than the previous categories and present plansfor solving a particular problem
� Critical-incident case studies, which provide the participantwith a certain amount of information and withhold otherinformation until it is requested by the participant
� Action-maze case studies, which present a large case in aseries of smaller units. The participant is required to predictat each stage what will happen next
The difficulty in a case study lies in the objectivity of theevaluation of the participant’s performance. Frequently, there canbe many possible courses of action, some equally as effective asothers, making it extremely difficult to obtain an objective,measurable performance rating for the analysis and interpretationof the case.
Role Playing. In role playing, sometimes referred to as skillpractice, participants practice a newly learned skill and areobserved by other individuals. Participants are given their assignedrole with specific instructions, which sometimes include an ulti-mate course of action. The participant then practices the skillwith other individuals to accomplish the desired objectives. Thisis intended to simulate the real-world setting to the greatest extentpossible. Difficulty sometimes arises when other participantsinvolved in the skill practice make the practice unrealistic by notreacting the way individuals would in an actual situation. To helpovercome this obstacle, trained role players (non-participantstrained for the role) may be used in all roles except that ofthe participant. This can possibly provide a more objectiveevaluation. The success of this technique also lies in the judgmentof those observing the role playing. The skill of effective obser-vation is as critical as the skill of the role player. Also, the suc-cess of this method depends on the participants’ willingness toparticipate in and adjust to the planned role. If participantresistance is extremely high, the performance in the skill prac-tice may not reflect the actual performance on the job. Never-theless, these skill practices can be very useful, particularly insupervisory and sales training, to enable participants to practicediscussion skills.

94 THE HUMAN RESOURCES SCORECARD
Assessment Center Method. The final method for measuringlearning with simulation is a formal procedure called the assess-ment center method. The feedback is provided by a group ofspecially trained observers called assessors. For years, the assess-ment center approach has been a very effective tool for employeeselection. It now shows great promise as a tool for evaluatingthe effectiveness of a major learning module in an HR initiative.
Assessment centers are not actually centers, such as a locationor building. The term refers to a procedure for evaluating theperformance of individuals. In a typical assessment center, theindividuals being assessed participate in a variety of exercises thatenable them to demonstrate a particular skill, knowledge, orability, usually called job dimensions. These dimensions areimportant to on-the-job success for individuals involved in theHR initiative. It may take anywhere from four hours to threedays for the participants to complete all the exercises. Theassessors then combine ratings of each exercise for each dimension,removing subjectivity to reach a final rating for each participant.
In the assessment center process, a rating or “assessment” ofthe participants is given prior to the HR initiative. After theinitiative is implemented, the participants are assessed again tosee if there are improvements in their performance within the jobdimensions. The use of a control group in an evaluation designhelps produce evidence of the impact of the initiative.
Although the popularity of this method seems to be growing,it still may not be feasible for many HR initiatives. The use ofan assessment center is quite involved and time consuming forthe participants and the assessors. The assessors have to becarefully trained to be objective and reliable. However, forprograms that represent large expenditures aimed at makingimprovements in the soft-data area, the assessment center approachmay be the most promising way to measure the impact of theprogram. This is particularly true for an organization in which theassessment center process is already in use for selection purposes.
In summary, simulations come in a wide variety of types andstyles. They offer an opportunity for participants to practice whatthey have learned in an HR program and to have their per-formance observed in simulated job conditions. They can provideextremely accurate evaluations if the performance in the simula-tion is objective and can be clearly measured.

COLLECTING DATA DURING HR PROGRAM IMPLEMENTATION 95
Measuring Learning with Less Structured Activities
In many situations, it is sufficient to have an informal checkof learning to provide some assurance that participants haveacquired the skills and knowledge, or perhaps that there havebeen some changes in attitudes. This approach is appropriatewhen other levels of evaluation are pursued. For example, if aLevel 3 application and implementation evaluation is planned, itmight not be so critical to conduct a comprehensive Level 2evaluation. An informal assessment of learning is usually suf-ficient. After all, the resources are scarce, and a comprehensiveevaluation at all levels becomes quite expensive. The followingare some alternative approaches to measuring learning wheninexpensive, low-key, informal assessments are needed.
Exercises/Activities. Many HR initiatives involve activities,exercises, or problems that must be explored, developed, orsolved during the program. Some of these are constructed interms of involvement exercises, while others require individualproblem-solving skills. When these tools are integrated into thelearning activity, there are several specific ways in which tomeasure learning:
� The results of the exercise can be submitted for review andfor possible scoring by the HR staff. This becomes partof the overall score for the course and becomes a measureof learning.
� The results can be discussed in a group, with a comparisonof the various approaches and solutions, and the group canreach an assessment of how much each individual haslearned. This may not be practical in many settings, but canwork in a few narrowly focused applications.
� The solutions to the problem or exercises can be sharedwith the group, and the participant can provide a self-assessment indicating the degree to which the skills and/orknowledge have been obtained from the exercise. This alsoserves as reinforcement in that participants quickly see thecorrect solution.
� The HR staff can review the individual progress of each par-ticipant to determine the relative success. This is appropriate

96 THE HUMAN RESOURCES SCORECARD
for small groups but can be cumbersome and time con-suming in larger groups.
Self-Assessment. In many HR programs, self-assessment may beappropriate. Participants are provided an opportunity to assesstheir acquisition of skills and knowledge. This is particularlyapplicable in cases where higher-level evaluations are planned andit is important to know if actual learning is taking place. A fewtechniques can ensure that the process is effective:
� The self-assessment should be made anonymously so thatparticipants feel free to express realistic and accurate assess-ments of what they have learned.
� The purpose of the self-assessment should be explained,along with the plans for the data. Specifically, if there areimplications for program design or individual re-testing, thisshould be discussed.
� If there has been no improvement or the self-assessment isunsatisfactory, there should be some explanation as to whatthat means and what the implications will be. This will helpensure that accurate and credible information is provided.
HR Staff Assessment. A final technique is for the HR staff and/or facilitators to provide an assessment of the HR programlearning that has taken place. Although this approach is verysubjective, it may be appropriate when a higher-level evaluationis planned. One of the most effective ways to accomplish this isto provide a checklist of the specific skills that need to beacquired in the course. Facilitators can then check off the assess-ment of the skills individually. Also, if there is a particular bodyof knowledge that needs to be acquired, a checklist of the categoriesshould be developed for assuring that the individual has a goodunderstanding of those items. This could create a problem if theparticipants have not had the appropriate time and opportunityto demonstrate skills or knowledge acquisition, and the instructormay have a difficult time in providing appropriate responses.There is also the question of what to do if there is no evidenceof learning. The specific consequences need to be considered andaddressed before the method is used.

COLLECTING DATA DURING HR PROGRAM IMPLEMENTATION 97
Administrative Issues
There are several administrative issues that need to be addressedfor measuring learning. Each is briefly discussed below and shouldbe part of the overall plan for administering a Level 2 measurement.
Consistency. It is extremely important that different tests, exer-cises, or processes for measuring learning are administered con-sistently from one group to another. This includes issues such asthe time required to respond, the actual learning conditions inwhich the participants complete the process, the resources avail-able to them, and the assistance from other members of thegroup. These issues can easily be addressed in the instructions.
Monitoring. In some situations, it is important for participantsto be monitored as they are completing the test or other measure-ment processes. This ensures that each individual is workingindependently and also that someone is there to provide assistanceor answer questions as needed. This may not be an issue in allsituations but needs to be addressed in the overall plan.
Scoring. The scoring instructions need to be developed for themeasurement process so that the person evaluating the responseswill be objective in the process and provide consistent scores.Ideally, the potential bias from the individual scoring the instru-ment should be completely removed through proper scoringinstructions and other information necessary to provide an objec-tive evaluation.
Reporting. A final issue is reporting the results. In some situations,the participants are provided with the results immediately, par-ticularly with self-scoring tests or with group-based scoringmechanisms. In other situations, the actual results may not beknown until later. In these situations, a mechanism for providingscoring data should be built into the evaluation plan unless ithas been predetermined that participants will not know thescores. The worst-case scenario is to promise test scores anddeliver them late or not at all.

98 THE HUMAN RESOURCES SCORECARD
Using Learning Data
Although there can be several uses of learning data, the follow-ing uses are most common:
Providing Individual Feedback to Build Confidence. Learningdata, when provided directly to participants, provides reinforce-ment for correct answers and enhances learning for the program.This reinforces the learning process and provides much-neededfeedback to participants in HR programs.
Ensuring that Learning Has Been Acquired. Sometimes it is essentialto show the extent and scope of learning. Measuring learning,even if informally, will provide input on this issue.
Improving HR Initiatives or Programs. Perhaps the most importantuse of learning data is to improve the HR program. Consistentlylow responses in certain learning measures may indicate thatinadequate facilitation has been provided on that topic. Con-sistently low scores with all participants may indicate that theobjectives and scope of coverage are too ambitious or misdirected.
Evaluating HR Program Staff or Facilitators. Just as reaction andsatisfaction data can be used to evaluate HR program implemen-tation, learning measures provide additional evidence of theirsuccess. The HR staff has a significant responsibility to ensurethat participants have learned the new skills and knowledge andthat testing is a reflection of the degree to which the skills/knowledgehave been acquired and internalized from actual application.
CONCLUSION
This chapter is the first of two chapters about data collectionand presents two of the six measures of data reported in the ROIprocess. Measuring reaction and satisfaction is included in everystudy and is a critical part of the success. Although there aremany uses for the data, two important uses stand out. The firstuse is for making adjustments and changes throughout the imple-mentation of the HR program as problems or barriers are uncovered.The second is for reporting the level of satisfaction with the

COLLECTING DATA DURING HR PROGRAM IMPLEMENTATION 99
program and having it included as one of the six key types ofdata. There are several ways to collect reaction and satisfactiondata, including questionnaires and surveys. By far the question-naire is the most common, and sometimes just a simple, one-pagereaction questionnaire is appropriate. Whatever the method used,the important point is to collect data, react quickly, make adjust-ments, and summarize the data for reporting and for use inpreparing the ROI impact study.
Key issues involved in measuring learning—an important ingre-dient in many HR initiatives—were also presented in this chapter.Even if it is accomplished informally, learning must be assessedto determine the extent to which the participants in an HRprogram are learning new skills, techniques, processes, tools, andprocedures. Without measuring learning, it is impossible to knowwhat may be wrong should there be an implementation problemlater. Also, measuring learning provides an opportunity to makeadjustments quickly so that changes can be made to enhancelearning. The approach does not have to be so formal, exceptfor major programs. A less-formal, less-structured approach—evenif a self-assessment activity—is usually appropriate for mostlearning situations.

100 THE HUMAN RESOURCES SCORECARD
100
Chapter 4
Collecting DataAfter HR Program
Implementation
MEASURING APPLICATION AND IMPLEMENTATION
Measuring the actual application and implementation of skillsand knowledge is critical because these steps play a pivotal rolein the overall success or failure of an HR initiative. If learnedskills and knowledge are not applied effectively, there will beno change in the business function—and no benefit from theHR initiative.

COLLECTING DATA AFTER HR PROGRAM IMPLEMENTATION 101
The first section of this chapter explores some of the key issuesin and the most common data collection methods to evaluateHR programs. The range of possibilities varies including the useof questionnaires, interviews, focus groups, and observation.These include several specific methodologies, such as actionplanning and performance contracting. This section will explorethe issues faced in applying these processes on the job andprovide several examples.
Why Measure Application and Implementation?
In addition to the obvious reasons for measuring applicationand implementation, there are several specific reasons why thisis one of the most important measures to track in the evalua-tion process.
The Value of the Information. As briefly discussed earlier in thisbook, the value of the information increases as progress is madethrough the chain of impact from Level 1 to Level 5. Thus,information concerning application and implementation at Level3 is more valuable to the client than reaction/satisfaction (Level1) and learning (Level 2). This is not meant to discount theimportance of these two levels, but to emphasize that measuringthe extent to which the HR program is implemented often pro-vides critical data about not only the success of the project butalso the factors that can contribute to greater success as the HRprogram is fully integrated within the organization.
A Key Transition Issue. The two previous measures, reaction/satisfaction and learning, occur during the HR initiative wherethere is more attention and focus directly on the HR program.Level 3, measuring application and implementation, occurs afterthe project has been implemented and measures the success ofthe application and implementation. Essentially, this measureexplains the degree to which the project is handed off to thosewho are charged with its ultimate success. This is a key transitionprocess and is the first measure that follows the process after theproject has been fully implemented. This in itself makes it acritical issue, where various measures of success are identified andenhancements to additional success are pinpointed.

102 THE HUMAN RESOURCES SCORECARD
The Key Focus of Many Projects. As many HR projects focusdirectly on application and implementation, the project sponsoroften speaks in these terms and is concerned about these measuresof success. Many major HR projects designed to transform anorganization and build a stronger team and customer focus willhave key issues around Level 3, application and implementation.The sponsor will be interested in knowing the extent to whichall of the key stakeholders are adjusting to and implementing thedesired new behaviors, processes, and procedures. This interestis at the core of application and implementation.
Problems, Obstacles, and Barriers. When an HR project goesastray, the first question is, “What happened?” More importantly,when a project appears not to be adding value, the first questionshould be, “What can we do to change the direction of theproject?” In either scenario, it is critical to have information thatidentifies barriers to success, problems encountered in imple-mentation, and obstacles to the actual application of the process.It is at Level 3, measuring application and implementation, thatthese problems are addressed, identified, and examined for solutions.In many cases, the key stakeholders directly involved in theprocess provide important input into the recommendations formaking changes or for using a different approach in the future.
Enablers and Enhancers. When there is success, the obviousquestion is, “How can we repeat this or even improve on this inthe future?” The answer to this question is also found at Level3. Identifying the factors that contribute directly to the successof the project is critical because those same items can be usedto replicate the process to produce specific results in the futureand to enhance results. When key stakeholders identify thoseissues, it helps make the project successful and provides animportant case history of what is necessary for success.
Rewards Those Who Are Most Effective. Measuring applicationand implementation allows the client and HR staff to rewardthose who are doing the best job of applying the processes andimplementing the HR project. Measures taken at this level pro-vide clear evidence of various efforts and roles, providing anexcellent basis for performance review or special recognition. This

COLLECTING DATA AFTER HR PROGRAM IMPLEMENTATION 103
often has a reinforcing value for keeping the project on track andcommunicating a strong message for future improvements.
Key Issues
When implementing a process to measure application andimplementation of HR solutions, several key issues should beaddressed. These are very similar to the Level 1 (reaction/satisfac-tion) issues. A few issues may differ slightly due to the post-project time frame for this type of data.
Areas of Coverage. To a large degree the areas of coverage forthis process parallel the same areas in measuring reaction andsatisfaction as identified in Chapter 3. However, because of thefollow-up time frame, the other additional issues become oppor-tunities to measure success. In addition, the perspective of thefollow-up is changed to post-program rather than the predictivenature of some of the issues in Level 1. The areas of coverageare fully detailed in the section on using questionnaires to measureapplication and implementation. Here, the detailed issues canserve as a guide for finding the areas of coverage for all typesof data collection methods at this level.
Sources. The sources of data mirror those identified under theheading “Measuring Reaction and Satisfaction,” in Chapter 3.Essentially, all key stakeholders are candidates for sources of data.Perhaps the most important source is those who are actuallyinvolved in the application and implementation. It may involvethe entire team, or team leaders charged with the responsibilityof implementation.
Timing. The timing of data collection can vary significantly.because this is a follow-up, the key issue is determining the besttime for a post-program evaluation. The challenge is to analyzethe nature and scope of the application and implementation anddetermine the earliest time that a trend and pattern will evolve.This occurs when the application of skills becomes routine andthe implementation is making significant progress. This is ajudgment call. The important point is to go in as early as possibleso that potential adjustments can still be made but, at the same

104 THE HUMAN RESOURCES SCORECARD
time, wait until there is significant change in behavior for theimplementation to be observed and measured. In HR projectsspanning a considerable length of time in terms of completeimplementation, several measures may be taken at three- to six-month intervals. This gives successive input in terms of imple-mentation progress and clearly shows the extent of improvement,using effective measures at well-timed intervals, and identifies theissues that are standing in the way of a successful implementation.
Responsibilities. Measuring application and implementation mayinvolve the responsibility and work of others. Because this timeperiod follows the HR initiative’s completion, an important issuemay surface in terms of who is responsible for this follow up.There is a range of possibilities, from HR staff to the client staff,as well as the possibility of an external, independent third party.This matter should be addressed in the planning stage so thatthere is no misunderstanding as to the distribution of responsibilities.More importantly, those who are responsible should fully under-stand the nature and scope of their responsibility and what isnecessary to collect the data. Additional information on responsi-bilities is covered in a later chapter.
Using Questionnaires to MeasureApplication and Implementation
Questionnaires have become a mainstream data collection toolfor measuring application and implementation because of theirflexibility, low cost, and ease of administration. The issuesinvolved in questionnaire design discussed in Chapter 3 applyequally to questionnaire development for measuring follow-upapplication and implementation. This section will be limited tothe specific content issues of follow-up questionnaires.
One of the most difficult tasks is to determine specific issuesthat need to be addressed on a follow-up questionnaire. Althoughthe content items on a follow-up questionnaire can be the sameas questionnaires used in measuring reaction and satisfaction, thefollowing content items are more desirable for capturing applica-tion, implementation, and impact information (Levels 3 and 4data). Figure 4-1 presents a questionnaire used in a follow-upevaluation of an HR initiative on a stress management program.

COLLECTING DATA AFTER HR PROGRAM IMPLEMENTATION 105
The evaluation was designed to capture the ROI, with the primarymethod of data collection being the follow-up questionnaire. Thisexample will be used to illustrate many of the issues involvingpotential content items for a follow-up questionnaire.
National Bank operates in a strong competitive environment.Following the acquisition of many smaller banks, the workloadexpanded, systems and processes had to be consolidated, andmarket share was a continuing strategic issue. Employees at themain branch worked long hours facing tight deadlines and customerdemands; there seemed to be no end in sight. The branch manage-ment initiated a project to help relieve the tension. Managementrecognized that a stressful situation existed and a stress manage-ment program was implemented to help meet the needs of theemployees. Management recognized that the program would notonly help employees to manage stress, but it should also help thebank to achieve strategic goals. All branch employees wereinvolved in the program.
Six months after the program was implemented, an evaluationwas planned. Each branch in the network had a scorecard thattracked performance through several measures such as newaccounts, total deposits, and growth by specific products. Allproduct lines were monitored. All branch employees providedinput on the questionnaire shown in Figure 4-1. Most of the datafrom the questionnaire covered application and implementation,while some involved impact measures. This type of feedback helpsHR staff know which parts of the initiative are most effectiveand useful.
Progress with Objectives. Sometimes it is helpful to assess pro-gress made with the objectives of the project in the follow-upevaluation as illustrated by question one in Figure 4-1. Althoughthis issue is usually assessed during the initiative, it is sometimeshelpful to revisit the objectives after the participants have hadan opportunity to implement the project.
Action-Plan Implementation. If an action plan is required in theinitiative, the questionnaire should reference the plan and deter-mine the extent to which it has been implemented. If the action-plan requirement is very low-key, perhaps only one question on
(text continued on page 115)

106 THE HUMAN RESOURCES SCORECARD
Stress Management for Intact Work TeamsFollow-Up Impact Questionnaire
Check one: � Team Member � Team Leader/Manager
1. Listed below are the objectives of the stress management program.After reflecting on this program, please indicate the degree ofsuccess in meeting the objectives.
Limited Generally CompletelyOBJECTIVES Failed Success Successful Successful
PERSONAL
� Identify sources of stress inwork, personal, and familyworlds
� Apply coping strategies tomanage stressful situations
� Understand to what degreestress is hampering yourhealth and performance
� Take steps to enhancepersonal health and overallperformance
� Access internal and externalresources to help reachpersonal goals
GROUP
� Identify sources of stress forgroup
� Identify sources of distressand satisfaction
� Apply skills to manage andreduce stress in work group
� Develop action plan toimprove work groupeffectiveness
� Improve effectiveness andefficiency measures for workgroup
Figure 4-1.

COLLECTING DATA AFTER HR PROGRAM IMPLEMENTATION 107
2. Did you develop and implement a 21-day action plan?
Yes � No �
If yes, please describe the success of the plan. If not, explain why.
3. Please rate, on a scale of 1-5, the relevance of each of theprogram elements to your job, with (1) indicating no relevance,and (5) indicating very relevant.
StressMap® Instrument Action Planning
Group Discussion Program Content
4. Have you used the reference materials since you participated inthe program?
Yes � No �
Please explain.
5. Please indicate the degree of success in applying the followingskills and behaviors as a result of your participation in the stressmanagement program.
1 2 3 4 5
Very NoNo Little Some Significant Much Opportunity
Success Success Success Success Success to Use Skills
a) Selecting con-tainable behaviorfor change
b) Identifyingmeasures ofbehavior
c) Taking fullresponsibility foryour actions
Figure 4-1. Continued.

108 THE HUMAN RESOURCES SCORECARD
1 2 3 4 5
Very NoNo Little Some Significant Much Opportunity
Success Success Success Success Success to Use Skills
d) Selecting a buddyto help youchange behavior
e) Identifying andremoving barriersto changingbehavior
f) Staying on trackwith the 21-dayaction plan
g) Applying copingstrategies tomanage stressfulsituations
h) Using controleffectively
i) Knowing when tolet go
j) Respondingeffectively toconflict
k) Creating apositive climate
l) Acknowledging acomplaint properly
m) Reframing problems
n) Using stress talkstrategies
Figure 4-1. Continued.

COLLECTING DATA AFTER HR PROGRAM IMPLEMENTATION 109
6. Indicate the types of relationships where you have used the skills.
� Coworkers
� Manager or supervisor
� Company employee in another function
� Spouse
� Child
� Friend
� Other: (list)
PERSONAL CHANGES
7. What has changed about your on-the-job behavior as a result ofthis program? (positive attitude, fewer conflicts, better organized,fewer outbursts of anger, etc.)
8. Recognizing the changes in your own behavior and perceptions,please identify any specific personal accomplishments/improvementsthat you can link to this program (time savings, project comple-tion, fewer mistakes, etc.).
Figure 4-1. Continued.

110 THE HUMAN RESOURCES SCORECARD
9. What specific value in U.S. dollars can be attributed to theabove accomplishments/ improvements? Use first-year valuesonly. Although this is a difficult question, try to think of specificways in which the above improvements can be converted tomonetary units. Use one year of data. Along with the monetaryvalue, please indicate the basis of your calculation. $
Basis.
10. Other factors often influence improvements in performance.Please indicate the percent of the above improvement that isrelated directly to this program. %
11. What level of confidence do you place in the above estimations?(0% = No Confidence, 100% = Certainty) %
Please explain.
GROUP CHANGES
12. What has changed about your work group as a result of yourgroup’s participation in this program? (interactions, cooperation,commitment, problem solving, creativity, etc.)
Figure 4-1. Continued.

COLLECTING DATA AFTER HR PROGRAM IMPLEMENTATION 111
13. Please identify any specific group accomplishments/improvementsthat you can link to the program (project completion, responsetimes, innovative approaches).
14. What specific value in U.S. dollars can be attributed to theabove accomplishments/improvements? Use first-year values only.Although this is a difficult question, try to think of specific waysin which the above improvements can be converted to monetaryunits. Use one year of values. Along with the monetary value,please indicate the basis of your calculation. $
Basis.
15. Other factors often influence improvements in performance.Please indicate the percent of the above improvement that isrelated directly to this program. %
16. What level of confidence do you place on the above estimations?(0% = No Confidence, 100% = Certainty) %
Please explain.
Figure 4-1. Continued.

112 THE HUMAN RESOURCES SCORECARD
17. Do you think this program represented a good investment forthe company?
Yes � No �
Please explain.
18. For each of the areas below, indicate the extent to which you thinkthis program has influenced these measures in your work group.
No Some Moderate Significant Very MuchInfluence Influence Influence Influence Influence
a) Productivity
b) Efficiency
c) Quality
d) Response Time
e) Cost Control
f) Customer Service
g) Customer Satisfaction
h) Employee Turnover
Figure 4-1. Continued.

COLLECTING DATA AFTER HR PROGRAM IMPLEMENTATION 113
i) Absenteeism
j) Employee Satisfaction
k) Healthcare Costs
l) Safety and Health Costs
Please cite specific examples or provide more details.
19. Please rate the success of the HR staff during the implementationand support of this project.Use the following scale:
1. No success2. Limited success3. Moderately successful4. Generally successful5. Very successful
Team Characteristic 1 2 3 4 5
Capability � � � � �
Motivation � � � � �
Cooperation � � � � �
Support for team � � � � �
Training for team � � � � �
Communication � � � � �
Figure 4-1. Continued.

114 THE HUMAN RESOURCES SCORECARD
20. What barriers, if any, have you encountered that have preventedyou from using skills or knowledge gained in this program?Please explain.
21. What has helped this project be successful? Please explain.
22. Which of the following best describes the actions of yourmanager during the stress management program?
� Very little discussion or reference to the program
� Casual mention of program with few specifics
� Discussed details of program in terms of content, issues,concerns, etc.
� Discussed how the program could be applied to work group
� Set goals for changes/improvements
� Provided ongoing feedback on the action plan
� Provided encouragement and support to help change behavior
� Other
(comments) . . .
23. Could other solutions have been effective in meeting this need?
Yes � No �
Please explain.
Figure 4-1. Continued.

COLLECTING DATA AFTER HR PROGRAM IMPLEMENTATION 115
the follow-up questionnaire will be devoted to the action plan,as illustrated in question two in Figure 4-1. If the action plan isquite comprehensive and contains an abundance of Levels 3 and4 data, then the questionnaire takes a secondary role, and mostof the data collection process will focus directly on the status ofthe completed action plan. The action-planning process is describedlater in this chapter.
Relevance of the HR Initiative. Although the relevance of the HRinitiative is often assessed during the project, as Level 1 data, itis sometimes helpful to assess the relevance to various aspects ofthe program after application and implementation. This feedbackhelps program designers know which parts of the program wereactually useful on the job, providing lasting value. Question threein Figure 4-1 shows one approach to this issue.
Use of Job-Related Materials. If participants are provided withjob aids and references to use on the job, then it may be helpfulto determine the extent to which these materials have been used.This is particularly helpful when operation manuals, reference
24. What specific suggestions do you have for improving the stressmanagement program? Please specify.
� Content
� Duration
� Presentation
� Other
25. Other comments:
Figure 4-1. Continued.
(text continued from page 105)

116 THE HUMAN RESOURCES SCORECARD
books, and job aids have been distributed and explained in theHR program and are expected to be used on the job. Questionfour in Figure 4-1 focuses on this issue.
Knowledge/Skill Use. Perhaps one of the most important ques-tions on the follow-up questionnaire focuses on the applicationof skills and knowledge. As shown in question five in Figure 4-1,the specific skills and knowledge areas are listed, with the ques-tion framed around the amount of change since the initiative wasimplemented. This is the recommended approach when there areno pre-program data. If pre-program data have been collected,it is more appropriate to compare post-program assessments withpre-program assessments using the same type of question. A moredetailed variation of this question is to list each skill and indicatethe frequency of use. For many skills, it is important to experi-ence frequent use quickly after the skills are acquired so that theskills become internalized.
Changes with Work. Sometimes it is helpful to determine whatspecific activities or processes have changed about participants’work as a result of the program. Question six establishes aframework to determine which relationships were affected byapplication of the stress management program. Question six isunique to this situation. As question seven in Figure 4-1 illu-strates, the participants explore how their skill applications (listedpreviously) have actually changed their work habits (in this case,the behavior change caused by managing stress is the issue).
Improvements/Accomplishments. Question eight in Figure 4-1begins a series of four impact questions that are appropriate formost follow-up questionnaires. The first question in the seriesseeks specific accomplishments and improvements that are directlylinked to the HR program. This question focuses on specific,measurable successes that can be easily identified by the partici-pants. Because this is an open-ended question, it can be helpfulto provide examples that indicate the nature and range of responsesrequested. However, examples can also limit the responses.
Monetary Impact. Perhaps the most difficult question, numbernine in Figure 4-1, asks participants to provide monetary values

COLLECTING DATA AFTER HR PROGRAM IMPLEMENTATION 117
for the improvements identified in question seven. Although theseare business impact data, it may be helpful to collect them here.Only the first-year improvement is sought. Participants are askedto specify net improvements so that the actual monetary valueswill represent gains from the HR program. An important partof the question is the basis for calculation, where participantsspecify the steps taken to develop the annual net value and theassumptions made in the analysis. It is important for the basisto be completed with enough detail to understand the process.
Improvements Linked with HR Program. The next question inthe series of impact questions, number ten in Figure 4-1, isolatesthe effects of the HR program. Participants indicate the percentageof the improvement that is directly related to the initiative. Asan alternative, the various factors that have influenced the resultsmay be listed. Participants are then asked to allocate a percentageto each factor.
Note that questions twelve through sixteen in Figure 4-1 arethe same as questions seven through eleven, but tailored for agroup setting. Because of the nature of stress, the questionnaireneeded to address both personal and group situations.
Confidence Level. To adjust for the uncertainty of the dataprovided in the impact questions, participants are asked toprovide a level of confidence for each estimation. This confidencefactor is expressed as a percentage with a range of zero to 100percent, as shown in question eleven in Figure 4-1. This inputadjusts the participant estimates to account for their uncertainty.This conservative approach adds credibility to the estimation process.
Investment Perception. The participants’ perception of the valueof the HR initiative is useful information. As illustrated inQuestion 17 in Figure 4-1, participants are asked if they believethe project to be a good investment. An option for this questionis to present the actual cost of the HR initiative so that partici-pants can respond more accurately. Also, the question can bedivided into two parts: one reflecting the investment of moneyby the organization and the other an investment in the partici-pants’ time in the project. The perceived value is an indicatorthat the HR processes are being implemented.

118 THE HUMAN RESOURCES SCORECARD
Linkage with Output Measures. Sometimes it is helpful to deter-mine the degree to which the initiative has influenced certainoutput measures. As shown in Question 18 in Figure 4-1, partici-pants are often asked to indicate the degree to which they thinkcertain measures have been influenced by the initiative. However,when this issue is uncertain, listing potential business performancemeasures known to have been influenced and asking participantsto indicate which measures they believe have been influenced willidentify the measures most influenced by the initiative.
Success of HR Team. Sometimes it is helpful to solicit inputabout the working relationship between the HR staff and theparticipants. Question 19 in Figure 4-1 asks participants toindicate the degree to which the HR staff is successful in imple-menting and supporting the project. This information is helpfulin making adjustments in future projects.
Barriers. Several barriers can influence the successful applicationof an HR project. Question 20 in Figure 4-1 seeks the identifica-tion of these barriers. As an alternative, the perceived barriersare listed and participants check all that apply. Still anothervariation is to list the barriers with a range of responses, indicat-ing the extent to which the barrier inhibited results.
Enablers. Just as important as barriers are the enablers—thoseissues, events, or situations that have enabled the project to besuccessful. The same options are available with this question asin the question on barriers. Question 21 in Figure 4-1 addressesthis issue.
Management Support. Management support is critical to thesuccessful application of newly acquired skills. At least onequestion should be included in the questionnaire on the degreeof management support. Sometimes this question is structured sothat various descriptions of management support are detailed, andparticipants check the one that applies to their situation. Question22 in Figure 4-1 is an example of such a question.
Appropriateness of Solution. A recommended process or programin an HR project is usually only one of many potential solutions

COLLECTING DATA AFTER HR PROGRAM IMPLEMENTATION 119
to a performance problem. If the initial analysis and needsassessment is faulty or if there are alternative approaches tomeeting the desired business need, another solution may achievethe same or greater success. The participant is asked to identifyalternative solutions that could have been effective in obtainingthe same or similar results. Question 23 in Figure 4-1 representsthis type of question. The HR staff can use this information tohelp improve processes and understand the use of alterna-tive approaches.
Suggestions for Improvement. Participants are asked to providesuggestions for improving any part of the initiative or process.As illustrated in Question 24 in Figure 4-1, the open-endedstructure is intended to solicit qualitative responses to be usedto make improvements.
Other Comments. A final step is to seek other comments abouta project. This provides an opportunity to offer additional intangiblebenefits, present concerns, or suggest issues that will need tobe addressed in the future. Question 25 in Figure 4-1 is sucha question.
Improving the Response Ratefor Questionnaires and Surveys
Given the wide range of potential issues to explore in a follow-up questionnaire or survey, asking all of the questions can causethe response rate to be reduced considerably. The challenge,therefore, is to approach questionnaire and survey design andadministration for maximum response rate. This is a critical issuewhen the questionnaire is a key data collection activity and muchof the evaluation hinges on the questionnaire results. The fol-lowing actions can be taken to increase response rate. Althoughthe term questionnaire is used, the same rules apply to surveys.
Provide Advance Communication. If appropriate and feasible,program participants and other stakeholders should receive advancecommunications about the plans for the questionnaire or survey.This minimizes some of the resistance to the process. It providesan opportunity to explain in more detail the circumstances

120 THE HUMAN RESOURCES SCORECARD
surrounding the evaluation, and positions the evaluation as anintegral part of the HR program—not as an add-on activity thatsomeone initiated three months after the implementation.
Communicate the Purpose. Stakeholders should understand thereason for the questionnaire, including who or what initiatedthis specific evaluation. They should know if the evaluation ispart of a systematic process or a special request for this HRprogram only.
Explain Who Will See the Data. It is important for respondentsto know who will see the data and the results of the ques-tionnaire. If the questionnaire is anonymous, it should clearly becommunicated to participants what steps will be taken to ensureanonymity. If senior executives will see the combined results ofthe study, the respondents should know it.
Describe the Data Integration Process. The respondents shouldunderstand how the questionnaire results will be combined withother data, if available. Often the questionnaire is only one ofthe data collection methods used. Participants should know howthe data are weighted and integrated into the entire impact study,as well as interim results.
Keep the Questionnaire as Simple as Possible. A simple question-naire does not always provide the full scope of data necessaryfor a comprehensive analysis. However, the simplified approachshould always be kept in mind when questions are developed andthe total scope of the questionnaire is finalized. Every effortshould be made to keep it as simple and brief as possible.
Simplify the Response Process. To the extent possible, it shouldbe easy to respond to the questionnaire. If appropriate, a self-addressed stamped envelope should be included. Perhaps e-mailcould be used for responses, if it is easier. In still other situations,a response box is provided near the work station.
Use Local Management Support. Management involvement at thelocal level is critical to response-rate success. Managers candistribute the questionnaires themselves, make reference to the

COLLECTING DATA AFTER HR PROGRAM IMPLEMENTATION 121
questionnaire in staff meetings, follow up to see if questionnaireshave been completed, and generally show support for completingthe questionnaire. This direct supervisor support will promptmany participants to respond with usable data.
Let the Participants Know They Are Part of the Sample. For largeHR initiatives, a sampling process may be used. When that is thecase, participants should know they are part of a carefullyselected sample and that their input will be used to make deci-sions regarding a much larger target audience. This action oftenappeals to a sense of responsibility for participants to provideusable, accurate data for the questionnaire.
Consider Incentives. A variety of incentives can be offered, andthey usually fall into three categories. First, an incentive isprovided in exchange for the completed questionnaire. For example,if participants return the questionnaire personally or through themail, they will receive a small gift, such as a T-shirt or mug. Ifidentity is an issue, a neutral third party can provide the incen-tive. In the second category, the incentive is provided to makeparticipants feel guilty about not responding. Examples are adollar bill clipped to the questionnaire or a pen enclosed in theenvelope. Participants are asked to “take the dollar, buy a cupof coffee, and fill out the questionnaire.” A third group ofincentives is designed to obtain a quick response. This approachis based on the assumption that a quick response will ensure agreater response rate. If an individual puts off completing thequestionnaire, the odds of completing it diminish considerably.The initial group of participants may receive a more expensivegift or they may be part of a drawing for an incentive. Forexample, in one program, the first twenty-five returned question-naires were placed in a drawing for a $400 gift certificate. Thenext twenty-five were added to the first twenty-five in the nextdrawing. The longer a participant waits, the lower the oddsof winning.
Have an Executive Sign the Introductory Letter. Participants arealways interested in who sent the letter with the questionnaire.For maximum effectiveness, a senior executive who is responsiblefor a major area where the participants work should sign the

122 THE HUMAN RESOURCES SCORECARD
letter. Employees may be more willing to respond to a seniorexecutive when compared with situations where a member of theHR implementation team signs a letter.
Use Follow-up Reminders. A follow-up reminder should be senta week after the questionnaire is received and another sent twoweeks later. Depending on the questionnaire and the situation,these times can be adjusted. In some situations, a third follow-up is recommended. Sometimes the follow-up is sent in a differentmedia. For example, a questionnaire may be sent through regularmail, whereas the first follow-up reminder is from the immediatesupervisor and a second follow-up is sent via e-mail.
Send a Copy of the Results to the Participants. Even if it is anabbreviated report, participants should see the results of thequestionnaire. More importantly, participants should understandthat they will receive a copy of the impact study when they areasked to provide the data. This promise will often increase theresponse rate, as some individuals want to see the results of theentire group along with their particular input.
Estimate the Length of Time to Complete the Questionnaire.Respondents often have a concern about the time it may take tocomplete the questionnaire. A very lengthy questionnaire mayquickly turn off the participants and cause it to be discarded.Sometimes, lengthy questionnaires can be completed quicklybecause many of them have forced-choice questions or statementsthat make it easy to respond. However, the number of pages mayfrighten the respondent. Therefore, it is helpful to indicate theestimated length of time needed to complete the questionnaire—perhaps in the letter itself or at least noted in the communi-cations. This provides extra information so that respondents candecide if they are willing to invest the required amount of timeinto the process. A word of caution is necessary, though: theamount of time must be realistic. Purposely underestimating itcan do more harm than good.
Show the Timing of the Planned Steps. Sometimes the respon-dents want to know more detail regarding when they can see theresults or when the results will be presented to particular groups.

COLLECTING DATA AFTER HR PROGRAM IMPLEMENTATION 123
It is recommended that a timeline be presented, showing whendifferent phases of the process will be completed (for example,when the data will be analyzed, when the data will be presentedto different groups, and when the results will be returned to theparticipants in a summary report). This timetable provides someassurance that the process is well-organized and professional, andthat the length of time to receive a data summary will not betoo long. Another word of caution: the timetable must be fol-lowed to maintain the confidence and trust of the individuals.
Give Materials a Professional Appearance. While it should notbe an issue in most organizations, unfortunately, there are toomany cases when a questionnaire is not developed properly, doesnot appear professional, or is not easy to follow and understand.The participants must gain respect for the process and for theorganization. To do this, a sense of professionalism must beintegrated throughout data collection, particularly in the appearanceand accuracy of the materials. Sloppy questionnaires will usuallycommand sloppy responses, or no response at all.
Explain the Questionnaire During the Implementation. Sometimesit is helpful to explain to the participants and other key stake-holders that they will be required or asked to provide certaintypes of data. When this is feasible, questionnaires should bereviewed question by question so that the participants understandthe purpose, the issues, and how to respond. This will only taketen to fifteen minutes but can increase the response rate, enhancethe quality and quantity of data, and clarify any confusion thatmay exist on key issues.
Collect Data Anonymously. Participants are more likely to pro-vide frank and candid feedback if their names are not on thequestionnaire, particularly when the program is going astray oris off target. Anonymous input is desired whenever possible andwhenever the groups are large enough to protect anonymity.When this is the case, every effort should be made to protect theanonymous input, and explanations should be provided regardinghow the data are analyzed, minimizing the demographic makeupof respondents so that the individuals cannot be identified inthe analysis.

124 THE HUMAN RESOURCES SCORECARD
Collectively, these items help boost response rates of follow-up questionnaires. Using all of these strategies can result in a 50to 70 percent response rate, even with lengthy questionnaires thatmight take thirty minutes to complete.
Using Interviews to Measure Applicationand Implementation
Another helpful collection method is the interview, althoughit is not used as frequently as questionnaires. Interviews can beconducted by the HR implementation staff, the client staff, or athird party. Interviews can secure data not available in per-formance records or data difficult to obtain through writtenresponses or observations. Also, interviews can uncover successstories that can be useful in communicating evaluation results.Program participants may be reluctant to describe their resultsin a questionnaire but will volunteer the information to a skillfulinterviewer using probing techniques. The interview is versatileand appropriate application data (Level 3) as well as reaction andsatisfaction data. A major disadvantage of the interview is thatit is time consuming. It also requires training or preparinginterviewers to ensure that the process is consistent.
Types of Interviews. Interviews usually fall into two basic types:structured and unstructured. A structured interview is much likea questionnaire. Specific questions are asked with little room todeviate from the desired responses. The primary advantagesof the structured interview over the questionnaire are thatthe interview process can ensure the questionnaire is completedand that the interviewer understands the responses supplied bythe participant.
The unstructured interview permits probing for additionalinformation. This type of interview uses a few general questions,which can lead to more detailed information as important dataare uncovered. The interviewer must be skilled in the probingprocess. Typical probing questions are:
� Can you explain that in more detail?� Can you give me an example of what you are saying?� Can you explain the difficulty that you say you encountered?

COLLECTING DATA AFTER HR PROGRAM IMPLEMENTATION 125
Interview Guidelines. The design steps for interviews are similarto those of the questionnaire. A brief summary of key issues withinterviews is outlined here.
Develop Questions to Be Asked. Once a decision has beenmade about the type of interview, specific questions need to bedeveloped. Questions should be brief, precise, and designed foreasy response.
Test Out the Interview. The interview should be tested on a smallnumber of participants. If possible, the interviews should beconducted as part of the early stages of the program. The responsesshould be analyzed and the interview revised, if necessary.
Train the Interviewers. The interviewer should have appropriateskills, including active listening, the ability to form probingquestions, and the ability to collect and summarize informationinto a meaningful form.
Provide Clear Instructions. The participant should understand thepurpose of the interview and know what will be done with theinformation. Expectations, conditions, and rules of the interviewshould be thoroughly discussed. For example, the participantshould know if statements will be kept confidential. If the par-ticipant is nervous during an interview and develops signs ofanxiety, he or she should be made to feel at ease.
Administer Interviews with a Plan in Mind. As with other evalua-tion instruments, interviews need to be conducted according toa predetermined plan. The timing of the interview, the personwho conducts the interview, and the location of the interview areall issues that become relevant when developing an interviewplan. For a large number of stakeholders, a sampling plan maybe necessary to save time and reduce the evaluation cost.
Using Focus Groups to MeasureApplication and Implementation
An extension of the interview, focus groups are particularlyhelpful when in-depth feedback is needed. The focus group

126 THE HUMAN RESOURCES SCORECARD
involves a small group discussion conducted by an experiencedfacilitator. It is designed to solicit qualitative judgments on aplanned topic or issue. Group members are all required to providetheir input, as individual input builds on group input.
When compared to questionnaires, surveys, or interviews, thefocus group strategy has several advantages. The basic premiseof using focus groups is that when quality judgments are sub-jective, several individual judgments are better than one. Thegroup process, where participants often motivate one another, isan effective method for generating new ideas and hypotheses. Itis inexpensive and can be quickly planned and conducted. Itsflexibility makes it possible to explore an HR initiative’s unex-pected outcomes or applications.
Applications for Evaluation. The focus group is particularlyhelpful when qualitative information is needed about the successof an HR program. For example, the focus group can be usedin the following situations:
� To evaluate reactions to specific procedures, tasks, schedules,or other components of an initiative
� To assess the overall effectiveness of the initiative as perceivedby the participants immediately following the implementation
� To assess the potential impact of the initiative
Essentially, focus groups are helpful when evaluation infor-mation is needed but cannot be collected adequately with simple,quantitative methods.
Guidelines. While there are no set rules on how to use focusgroups for evaluation, the following guidelines should be helpful:
Ensure that Management and the Client Embrace Focus Groups.Because this is a relatively new process for evaluation, it mightbe unknown to some management groups. Managers need to under-stand focus groups and their advantages. This should raise theirlevel of confidence in the information obtained from group sessions.
Plan Topics, Questions, and Strategy Carefully. As with anyevaluation instrument, planning is the key. The specific topics,

COLLECTING DATA AFTER HR PROGRAM IMPLEMENTATION 127
questions, and issues to be discussed must be carefully plannedand sequenced. This enhances the comparison of results from onegroup to another and ensures that the group process is effectiveand stays on track.
Keep the Group Size Small. While there is no magical group size,a range of six to twelve seems appropriate for most focus groupapplications. A group has to be large enough to ensure differentpoints of view but small enough to give every participant achance to talk freely and exchange comments.
Ensure a Representative Sample of the Target Population. It isimportant for groups to be stratified appropriately so that par-ticipants represent the target population. The group should behomogeneous in experience, rank, and influence in the organization.
Insist on Facilitators with Appropriate Expertise. The success ofa focus group rests with the facilitator, who must be skilled inthe focus group process. Facilitators must know how to controlaggressive members of the group and diffuse the input from thosewho want to dominate the group. Also, facilitators must be ableto create an environment in which participants feel comfortableto offer comments freely and openly. Consequently, some organi-zations use external facilitators.
In summary, the focus group is an inexpensive and quick wayto determine the strengths and weaknesses of initiatives. However,for a complete evaluation, focus group information should becombined with data from other instruments.
Observing Participants on the Job to MeasureApplication and Implementation
Another potentially useful data collection method is observingparticipants on the job and recording any changes in behaviorand specific actions taken. This technique is particularly usefulwhen it is important to know precisely how the participants areusing new skills, knowledge, tasks, procedures, or systems. Par-ticipant observation is often used in sales and sales supportprojects. The observer may be a member of the HR staff, theparticipant’s supervisor, a member of a peer group, or an external

128 THE HUMAN RESOURCES SCORECARD
resource. The most common observer, and probably the mostpractical, is a member of the HR staff.
Guidelines for Effective Observation. Observation is often mis-used or misapplied to evaluation situations, forcing some toabandon the process. The effectiveness of observation can beimproved with the following guidelines.
Observers Must Be Fully Prepared. Observers must fully under-stand what information is needed and what skills are covered inthe initiative. They must be prepared for the assignment andprovided a chance to practice observation skills.
The Observations Should Be Systematic. The observation processmust be planned so that it is executed effectively without anysurprises. The individuals observed should know in advance aboutthe observation and why they are being observed, unless theobservation is planned to be invisible. In this case, the individualsare monitored unknowingly. The timing of observations shouldbe a part of the plan. There are right times to observe a par-ticipant, and there are wrong times. If a participant is observedwhen work situations are not normal (for example, in a crisis),the data collected may be useless.
Planning a systematic observation is important. Several stepsare necessary to accomplish a successful observation:
1. Determine what behavior will be observed.2. Prepare the forms for the observer’s use.3. Select the observers.4. Prepare a schedule of observations.5. Prepare observers to observe properly.6. Inform participants of the planned observation, providing
explanations.7. Conduct the observations.8. Summarize the observation data.
The Observers Should Know How to Interpret and Report WhatThey See. Observations involve judgment decisions. The observermust analyze which behaviors are being displayed and whatactions are being taken by the participants. Observers should

COLLECTING DATA AFTER HR PROGRAM IMPLEMENTATION 129
know how to summarize behavior and report results in a mean-ingful manner.
The Observer’s Influence Should Be Minimized. Except for“mystery” or “planted” observers and electronic observations,it is impossible to completely isolate the overall effect of anobserver. Participants will display the behavior they thinkis appropriate, performing at their best. The presence of theobserver must be minimized. To the extent possible, the observershould blend into the work environment.
Select Observers Carefully. Observers are usually independent ofthe participants. They are typically members of the HR staff. Theindependent observer is usually more skilled at recording behaviorand making interpretations of behavior and is usually unbiasedin these interpretations. Using an independent observer reducesthe need for HR staff to prepare observers and relieves theoperating department or division of the responsibility. On theother hand, the independent observer has the appearance of anoutsider, and participants may resent this kind of observer.Sometimes it is more feasible to recruit observers from outsidethe organization. Another advantage this approach has is theability to neutralize the prejudicial feelings entering the decisions.
Observation Methods. Five methods of observation are suggestedand are appropriate depending on the circumstances surround-ing the type of information needed. Each method is brieflydescribed below.
Behavior Checklist and Codes. A behavior checklist is useful forrecording the presence, absence, frequency, or duration of aparticipant’s behavior as it occurs. A checklist does not provideinformation on the quality, intensity, or possible circumstancessurrounding the behavior observed. The checklist is useful, though,because an observer can identify exactly which behaviors shouldor should not occur. Measuring the duration of a behavior maybe more difficult and requires a stopwatch and a place on theform to record time intervals. This factor is usually not asimportant when compared with whether or not a particularbehavior was observed and how often. The number of behaviors

130 THE HUMAN RESOURCES SCORECARD
listed in the checklist should be small and listed in a logicalsequence if they normally occur in a sequence. A variation of thisapproach involves coding behaviors on a form. Although thismethod is useful when there are many behaviors, it is more timeconsuming because a code is entered that identifies a specificbehavior instead of checking an item.
Delayed Report Method. With a delayed report method, theobserver does not use any forms or written materials during theobservation. The information is either recorded after the obser-vation is completed or at particular time intervals during anobservation. The observer tries to reconstruct what has beenwitnessed during the observation period. The advantage of thisapproach is that the observer is not as noticeable, and there areno forms being completed or notes being taken during the obser-vation. The observer becomes more a part of the situation andless of a distraction. An obvious disadvantage is that the informa-tion written may not be as accurate and reliable as the infor-mation collected at the time it occurred. A variation of thisapproach is the 360° feedback process in which surveys arecompleted on other individuals based on observations within aspecific time frame.
Video Recording. A video camera records behavior in everydetail. However, this intrusion may be awkward and cumbersome,and the participants may be unnecessarily nervous or self-consciouswhile they are being videotaped. If the camera is concealed, theprivacy of the participant may be invaded. Because of this, videorecording of on-the-job behavior is not frequently used.
Audio Monitoring. Monitoring conversations of participants whoare using the skills taught in the HR initiative is an effectiveobservation technique. For example, in a large communicationcompany’s telemarketing department, sales representatives wereprepared to sell equipment by telephone. To determine if employeeswere using the skills and procedures properly, telephone con-versations were monitored on a randomly selected basis. Althoughthis approach may stir some controversy, it is an effective wayto determine if skills are being applied consistently and effectively.

COLLECTING DATA AFTER HR PROGRAM IMPLEMENTATION 131
For it to work smoothly, it must be fully explained and the rulesclearly communicated.
Computer Monitoring. For employees who work regularly witha keyboard, computer monitoring is becoming an effective wayto “observe” participants as they perform job tasks. The com-puter monitors times, sequence of steps, use of routines, and otheractivities to determine if the participant is performing the workaccording to the guidelines of the HR program. As technologycontinues to be a significant part of the workplace, computermonitoring holds much promise. This is particularly helpful forapplication and implementation data.
Using Action Plans and Follow-Up Assignmentsto Measure Application and Implementation
In some cases, follow-up assignments can develop implementa-tion and application data. In a typical follow-up assignment, theparticipant is asked to meet a goal or complete a particular taskor project by a set date. A summary of the results of the com-pleted assignments provides further evidence of the success ofthe HR program and actual implementation of new skills andknowledge gained.
The action plan is the most common type of follow-up assign-ment process and is fully described in this section. With thisapproach, participants are required to develop action plans aspart of the HR program. Action plans contain detailed steps toaccomplish specific objectives related to the program. The processis one of the most effective ways to enhance support for an HRproject and build the ownership needed for the successful applica-tion and implementation of the project.
The plan is typically prepared on a printed form, such as theone shown in Figure 4-2. The action plan shows what is to bedone, by whom, and the date by which the objectives should beaccomplished. The action-plan approach is a straightforward,easy-to-use method for determining how participants will changetheir behavior on the job and achieve success with the HRprogram. The approach produces data that answer such ques-tions as:

132T
HE H
UM
AN
RESO
UR
CES S
CO
REC
AR
D
Figure 4-2.

COLLECTING DATA AFTER HR PROGRAM IMPLEMENTATION 133
� What on-the-job improvements have been realized since theprogram was implemented?
� Are the improvements linked to the program?� What may have prevented participants from accomplishing
specific action items?
With this information, HR staff can decide if the project shouldbe modified and in what ways, if it is not too late. Collectively,the HR staff and client can assess the findings to evaluate thesuccess of the program.
Developing the Action Plan. The development of the action planrequires two major tasks: determining the areas for action andwriting the action items. Both tasks should be completed duringthe HR program and, at the same time, be related to on-the-jobactivities. A list of areas for action can be developed with thehelp of HR staff. The list may include an area needing improve-ment or representing an opportunity for increased performance.Examples of typical questions that should be answered beforedetermining the areas for action are listed below:
� How much time will this action take?� Are the skills for accomplishing this action item available?� Who has the authority to implement the action plan?� Will this action have an effect on other individuals?� Are there any organizational constraints for accomplishing
this action item?
Usually, it is more difficult to write specific action items thanit is to identify the action areas. The most important characteristicof an action item is that it is written so that everyone involvedwill know when it occurs. One way to help achieve this goal isto use specific action verbs and set deadlines for completion ofeach action item. Some examples of action items are:
� Implement the new customer contract software by (date).� Identify and secure a new customer account by (date).� Handle every piece of paper only once to improve my
personal time management by (date).� Probe my customers directly about a particular problem
by (date).

134 THE HUMAN RESOURCES SCORECARD
If appropriate, each action item should indicate other indi-viduals or resources necessary for completion of the action item.Planned behavior changes should be observable. It should beobvious to the HR program participant and others when thechange takes place. Action plans, as used in this context, do notrequire the prior approval or input from the participant’s supervisoralthough, as in any case, supervisor support may be helpful.
Using Action Plans Successfully. The action-plan process can bean integral part of the HR program and is not necessarily con-sidered an add-on or optional activity. To gain maximum effec-tiveness from action plans to collect data for evaluation, thefollowing steps should be implemented.
Communicate the Action-Plan Requirement Early. One of themost negative reactions to action plans is the surprise factor ofteninherent in the way the process is introduced. When participantsrealize they must develop a detailed action plan, there is oftenimmediate, built-in resistance. Communicating to participants inadvance, when the process is shown to be an integral part of theHR program, will often minimize resistance. When participantsfully realize the benefits before they attend the first session, theytake the process more seriously and usually perform extra stepsto ensure its success.
Describe the Action Planning Process at the Outset of the Project.At the first meeting, action plan requirements are discussed,including an outline of the purpose of the process, why it isnecessary, and the basic requirements during and after the HRinitiative. Some HR staff members furnish a separate notepad forprogram participants to collect ideas and useful techniques fortheir action plans. This is a productive way to focus moreattention on the process.
Teach the Action Planning Process. An important prerequisitefor action planning success is an understanding of how it worksand how specific action plans are developed. A portion of theHR program time is allocated to teaching participants how todevelop plans. In this session, the requirements are outlined,special forms and procedures are discussed, and a positive example

COLLECTING DATA AFTER HR PROGRAM IMPLEMENTATION 135
is distributed and reviewed. Sometimes an entire half-day moduleis allocated to this process so that participants will fully under-stand and use it. Any available support tools, such as key measures,charts, graphs, suggested topics, and sample calculations, shouldbe used in this session to help facilitate the plan’s development.
Allow Time to Develop the Plan. When action plans are usedto collect data for project evaluation, it is important to allowparticipants to develop plans during the HR program. Sometimesit is helpful to have participants work in teams so they can shareideas as they develop specific plans. In these sessions, HR staffoften monitor the progress of individuals or teams to keep theprocess on track and to answer questions.
Have HR Staff Members Approve Action Plans. It is essentialfor the action plan to be related to HR program objectivesand, at the same time, represent an important accomplishmentfor the organization when it is completed. It is easy for partici-pants to stray from the intent and purpose of action planningand not give it the attention it deserves. Consequently, it ishelpful to have the HR staff member actually sign off on theaction plan, ensuring that the plan reflects all of the require-ments and is appropriate for the HR initiative. In some cases,a space is provided for the HR staff member signature on theaction-plan document.
Ask Participants to Isolate the Effects of the HR Program.Although the action plan is initiated because of the HR program,the actual improvements reported on the action plan may beinfluenced by other factors. Thus, the action planning processshould not take full credit for the improvement. For example, anaction plan to reduce product defects could take only partialcredit for an improvement because of the other variables that willusually affect the defect rate. Although there are several ways toisolate the effects of an HR program, participant estimation isusually more appropriate in the action-planning process. Con-sequently, the participants are asked to estimate the percentageof the improvement actually related to a particular HR program.This question can be asked on the action plan form or on afollow-up questionnaire.

136 THE HUMAN RESOURCES SCORECARD
Require Action Plans to Be Presented to the Group, If Possible.There is no better way to secure commitment and ownership ofthe action-planning process than to have a participant describehis or her action plan in front of fellow participants. Presentingthe action plan helps ensure that the process is thoroughlydeveloped and will be implemented on the job. If the number ofparticipants is too large for individual presentations, perhaps thegroup can be divided into teams, and one participant can beselected from the team. Under these circumstances, the team willusually select the best action plan for presentation to the group.
Explain the Follow-up Mechanism. Participants must have a clearunderstanding of the timing of the action plan, implementation,and follow up. The method in which data will be collected,analyzed, and reported should be openly discussed. Five optionsare common:
1. The group is convened to discuss progress on the plans.2. Participants meet with their immediate managers and discuss
the success of the plan. A copy is forwarded to the HR staff.3. A meeting is held with the evaluator, the participant, and
the participant’s manager to discuss the plan and the infor-mation it contains.
4. Participants send the plan to the evaluator and it is dis-cussed in a conference call.
5. Participants send the plan directly to the HR staff with nomeetings or discussions. This is the most common option.
Although there are other ways to collect the data, it is importantto select a mechanism that fits the culture and constraints ofthe organization.
Collect Action Plans at Predetermined Follow-up Times. Becauseit is critical to have an excellent response rate, several steps maybe necessary to ensure that action plans are completed and thedata are returned to the appropriate individual or group foranalysis. Some organizations use follow-up reminders by mail ore-mail. Others call participants to check progress. Still others offerassistance in developing the final plan. These steps may requireadditional resources, which must be weighed against the impor-

COLLECTING DATA AFTER HR PROGRAM IMPLEMENTATION 137
tance of having more data. When the action-plan process isimplemented as outlined in this chapter, the response rates willnormally be very high—in the 50 to 80 percent range. Usually,participants will see the importance of the process and willdevelop their plans in detail during the HR initiative.
Summarize and Report the Data. If developed properly, eachaction plan should result in improvements. Also, each individualhas indicated the percentage of improvement directly related tothe HR program either on the action plan or the questionnaire.The data must be tabulated, summarized, and reported in a waythat shows success with application and implementation.
Advantages/Disadvantages of Action Plans. Although there are manyadvantages to using action plans, there are at least two concerns:
1. The process relies on direct input from the HR programparticipant, usually with no assurance of anonymity. Assuch, the information can sometimes be biased and unreliable.
2. Action plans can be time consuming for the participant and,if the participant’s manager is not involved in the process,there may be a tendency for the participant not to completethe assignment.
As this section has illustrated, the action-plan approach hasmany inherent advantages. Action plans are simple and easy toadminister; are easily understood by participants; are suitable ina wide variety of HR initiatives; are appropriate for all types ofdata; are able to measure reaction, learning, behavior changes, andresults; and may be used with or without other evaluation methods.
Because of the tremendous flexibility and versatility of theprocess and the conservative adjustments that can be made inanalysis, action plans have become important data collection toolsfor HR program evaluation.
Using Performance Contracts to MeasureApplication and Implementation
The performance contract is essentially a slight variation of theaction-planning process. Based on the principle of mutual goal

138 THE HUMAN RESOURCES SCORECARD
setting, a performance contract is a written agreement betweena participant and the participant’s manager. The participant agreesto improve performance in an area of mutual concern related tothe HR program. The agreement is in the form of a project tobe completed or a goal to be accomplished soon after the HRinitiative is complete. The agreement spells out what is to beaccomplished, at what time, and with what results.
Although the steps can vary according to the specific kind ofcontract and the organization, a common sequence of events follows:
1. The employee (participant) becomes involved in the HRprogram.
2. The participant and manager mutually agree on a subjectfor improvement related to the HR program (“What’s in itfor me?”).
3. Specific, measurable goals are set.4. The participant is involved in the initiative when the contract
is discussed, and plans are developed to accomplish the goals.5. After the HR program, the participant works on the con-
tract against a specific deadline.6. The participant reports the results of the effort to the manager.7. The manager and participant document the results and
forward a copy to the HR staff along with appropriatecomments.
8. The individuals mutually select the subject or action to betaken or performance to be improved prior to the initiative.
The process of selecting the area for improvement is similarto the process used in the action-planning process. The topic cancover one or more of the following areas:
� Routine performance—includes specific improvements inroutine performance measures, such as production, efficiency,and error rates
� Problem solving—focuses on specific problems, such as anunexpected increase in accidents, a decrease in efficiency, ora loss of morale
� Innovative or creative applications—includes initiating changesor improvements in work practices, methods, procedures,techniques, and processes

COLLECTING DATA AFTER HR PROGRAM IMPLEMENTATION 139
� Personal development—involves learning new information oracquiring new skills to increase individual effectiveness
The topic selected should be stated in terms of one or moreobjectives. The objectives should state what is to be accomplishedwhen the contract is complete. The objectives should be:
� written� understandable by all involved� challenging (requiring an unusual effort to achieve)� achievable (something that can be accomplished)� largely under the control of the participant� measurable and dated
The details required to accomplish the contract objectives aredeveloped following the guidelines for action plans presented earlier.Also, the methods for analyzing data and reporting progress areessentially the same, as with the action-planning process.
Shortcut Ways to Measure Applicationand Implementation
Measuring application and implementation is a critical issuefor most HR programs or initiatives. It would be hard to under-stand the success of the project unless there was some indicationas to how well the stakeholders are using the process. Althoughthis section presented a variety of techniques to measure applica-tion and implementation, ranging from questionnaires to observa-tion to action plans, a simplified approach for low-key, inexpen-sive projects is to use a simple questionnaire. The questionnairepresented in Figure 4-1 is very detailed around a complex project.A much more simplified questionnaire addressing five or six keyissues would be sufficient for small-scale projects. The areas thatshould be targeted are actual changes in:
� Work and skills applied� Specific implementation issues� Degree of success of implementation� Problems encountered in implementation� Issues that supported the project

140 THE HUMAN RESOURCES SCORECARD
These are the core issues that must be addressed.Another option is to combine data collected on reaction and
satisfaction with the data on application and implementation.These are related issues, and a questionnaire combining the keyissues on topics presented in this chapter and in Chapter 3 maybe sufficient. The important point is to collect data in the simplestway to see how well the project worked.
CAPTURING BUSINESS IMPACT DATA
This section focuses directly on tracking business performancemeasures. Some HR staff members—and clients—regard businessimpact data as the most important type because of their con-nection to business unit success. Also, less-than-desired results inbusiness measures are what translate into a business need thatultimately initiate the HR programs. This section covers the typesof business impact data and the specific processes needed togenerate the measures within an HR program. Coverage beginswith monitoring the record-keeping systems and moving to actionplans and the use of questionnaires. These three processes accountfor most of the opportunities for collecting these important andcritical data.
Why Measure Business Impact?
Although there are several obvious reasons for measuringimpact, four particular issues support the rationale for collectingbusiness impact data related to an HR program or initiative.
Higher-Level Data. Following the assumption that higher-leveldata create more value for the client, the business impact measuresin a five-level framework offer more valuable data. They are thedata considered to be the consequence of the application andimplementation of an HR program. They often represent thebottom-line measures that are positively influenced when a pro-gram is successful.
A Business Driver for HR Programs. For most HR programs, thebusiness impact data represent the initial drivers for the program.It is the problem of deterioration or less-than-desired performance,

COLLECTING DATA AFTER HR PROGRAM IMPLEMENTATION 141
or the opportunity for improvement of a business measure thatoften leads to an HR initiative. If the business needs defined bybusiness measures are the drivers for a project, then the keymeasure for evaluating the project is the business impact. Theextent to which measures actually have changed is the keydeterminant of the success of the project.
Payoff with Clients. Business impact data often reflect key payoffmeasures from the perspective of the client (internal and/orexternal). These are the measures often desired by the client andthat the client wants to see changed or improved. They oftenrepresent hard, indisputable facts that reflect performance criticalto the business and operating unit level of the organization.
Easy to Measure. One unique feature about business impact datais that they are often very easy to measure. Hard and soft datameasures at this level often reflect key measures that are foundin plentiful numbers throughout an organization. It is not unusualfor an organization to have hundreds or even thousands ofmeasures reflecting specific business impact items. The challengeis to connect the HR program objectives to the appropriatebusiness measures. This is more easily accomplished at the begin-ning of the HR initiative due to the availability and ease withwhich many of the data items can be located.
Types of Data
The fundamental premise for evaluating an HR initiative is tocollect data directly related to the objectives of the project. HRstaff members are sometimes concerned that appropriate data arenot available in the organization. Fortunately, this is not the case.The data needed to evaluate HR programs are already collectedin a vast majority of settings. The confusion sometimes stemsfrom the types of outcomes planned for HR programs. Often, theprogram focuses on skill and behavioral outcomes reflecting whatparticipants will be able to do after the project is completed. Theoutcomes of some HR programs are easy to observe and evaluate.It is easy to measure the speed and quality of a new team-basedassembly line, for instance. However, behavioral outcomes associatedwith change management are not nearly as obvious or measurable.

142 THE HUMAN RESOURCES SCORECARD
Demonstrating that a manager is an effective change agent ismuch more difficult than demonstrating that an assembly lineoperation is maintaining quality and quantity standards.
To help focus on the desired measures, a distinction is madein two general categories of data: hard data and soft data. Harddata are the primary measurements of improvement, presentedthrough rational, undisputed facts that are easily gathered. Theyare the most desirable type of data to collect. The ultimate criteriafor measuring the effectiveness of management rest on harddata items, such as productivity, profitability, cost control, andquality control.
Hard data are:
� easy to measure and quantify� relatively easy to convert to monetary values� objectively based� common measures of organizational performance� credible with management
Because changes in these data may lag behind changes in theorganization by many months, it is highly recommended tosupplement these measures with interim assessments of measuresof soft data, such as attitude, motivation, satisfaction, and skillusage. Although an HR program designed to enhance competenciesor manage change should have an ultimate impact on hard dataitems, it may be more efficiently measured by soft data items.Soft data are more difficult to collect and analyze but are usedwhen hard data are unavailable.
Soft data are:
� sometimes difficult to measure or quantify directly� difficult to convert to monetary values� subjectively based, in many cases� less credible as a performance measurement� usually behaviorally oriented
Hard. Hard data can be grouped into four categories (or sub-divisions) as shown in Figure 4-3. These categories—output,quality, cost, and time—are typical performance measures in

COLLECTING DATA AFTER HR PROGRAM IMPLEMENTATION 143
almost every organization. When they are unavailable, the basicapproach is to convert soft data to one of the four basic categories.
Output. Probably the most visible hard data results achievedfrom HR programs are those involving improvements in theoutput of the work unit. Every organization, regardless of type,has basic measurements of work output, appearing in variousforms as outlined in Table 4-1. Since these factors are monitoredby organizations, changes can be easily measured by comparingbefore- and after-work output.
Quality. One of the most significant hard data results is quality.Every organization is concerned with quality, and processes areusually in place to measure and monitor quality. Many HRprograms are designed to improve quality, and the results canbe easily documented using a variety of quality improvementmeasurements as illustrated in Table 4-1.
Cost. Another significant hard data results area is improvementin costs. Many HR programs that produce a direct cost savings
Figure 4-3.

144T
HE H
UM
AN
RESO
UR
CES S
CO
REC
AR
D
Table 4-1Examples of Hard Data
Output Quality Costs Time
Units produced Scrap Budget variances Cycle timeTons manufactured Waste Unit costs Response time for complaintItems assembled Rejects Cost by account Equipment downtimeItems sold Error rates Variable costs OvertimeSales Rework Fixed costs Average delay timeForms processed Shortages Overhead costs Time to project completionLoans approved Product defects Operating costs Processing timeInventory turnover Deviation from standard Delay costs Supervisory timePatients visited Product failures Penalties/fines Training timeApplications processed Inventory adjustments Project cost savings Meeting timeStudents graduated Percentage of tasks Accident costs Repair timeTasks completed completed properly Program costs Efficiency (time-based)Productivity Number of accidents Sales expense Work stoppagesWork backlog Customer complaints Administrative costs Order response timeIncentive bonus Average cost reduction Late reportingShipments Lost time daysNew accounts generated

COLLECTING DATA AFTER HR PROGRAM IMPLEMENTATION 145
can easily show a bottom-line contribution. A few examples ofthe types of costs are shown in Table 4-1. There can be as manycost items as there are accounts in a cost-accounting system. Inaddition, costs can be combined to develop any number ofcombinations needed for evaluation.
Time. The fourth hard data category area is time. Easy to measureand just as critical as cost and quality, time savings may mean aproject is completed faster than was planned, a new product wasintroduced earlier, or the time to repair equipment was reduced.The savings translate into additional output or lower operatingcosts. Examples of time savings generated by HR programs areshown in Table 4-1.
The distinction between these four groups of hard data issometimes unclear, since there are overlap factors to consider. Forexample, accident costs may be listed under the cost category,the number of accidents listed under quality, and the lost-timedays due to an accident listed under the time category. Therationale? Accidents represent a cost that can easily be deter-mined. Accidents are usually caused by someone making a mis-take and are often a reflection of the quality of employee efforts.Days lost on the job represent time lost to the organization oran incentive bonus may be listed as output, since the amount ofbonus is usually tied directly to the output of an employee orgroup of employees. However, the bonus is usually presented incash, which represents a cost to the organization. The distinctionbetween the different subdivisions is not as important as theawareness of the vast number of measurements in these four areas.
Soft Data. There are times when hard, rational numbers just donot exist. When this is the case, soft data may be meaningful inevaluating HR programs. Table 4-2 shows common types of softdata, categorized or subdivided into six areas: work habits,climate, new skills, development, satisfaction, and initiative. Theremay be other ways to divide soft data into categories. Because ofthe many types of soft data, the possibilities are almost limitless.
Work Habits. Employee work habits are critical to the successof a work group. Dysfunctional work habits can lead to anunproductive and ineffective work group, while productive work

146 THE HUMAN RESOURCES SCORECARD
Table 4-2Examples of Soft Data
Work Habits Customer Service
Absenteeism Customer complaintsTardiness Customer satisfactionVisits to the dispensary Customer dissatisfactionFirst-aid treatments Customer impressionsViolations of safety rules Customer loyaltyNumber of communication Customer retention
breakdowns Customer valueExcessive breaks Lost customers
Work Climate/Satisfaction Employee Development
Number of grievances Number of promotionsNumber of discrimination charges Number of pay increasesEmployee complaints Number of training programsLitigation attendedJob satisfaction Requests for transferOrganizational commitment Performance appraisal ratingsEmployee turnover Increases in job effectiveness
Attitude Shifts Initiative/Innovation
Employee loyalty Implementation of new ideasIncreased confidence Successful completion of projects
Number of suggestionsimplemented
Setting goals and objectivesNew products and services
developedNew patents and copyrights
habits can boost the output and morale of the group. The mostcommon and easily documented unproductive work habits includeabsenteeism and tardiness. These can be tied to cost much easierthan other types of soft data. Some HR programs, such asabsenteeism reduction, are designed to improve the work habitsof employees. In most organizations, measurement systems arein place to record employee work habit problems such as absen-
COLLECTING DATA AFTER HR PROGRAM IMPLEMENTATION 147
teeism, tardiness, and visits to the infirmary. In other situa-tions, the work habits may have to be documented by theemployee’s supervisor.
Work Climate/Satisfaction. The climate of the work group isimportant in team effectiveness. Grievances, discrimination charges,complaints, and job dissatisfaction are often linked to the workclimate. The result: less efficiency, less output, unionization drives,and possibly employee resignations. Many HR programs aredesigned to improve work climate.
HR programs are also frequently designed to improve satisfac-tion with work, environment, or customers. Reactions to thesemeasures provide additional evidence of success of the program.
Customer Service. One of the most important soft data areas isthe customer service category. Measuring the extent of customersatisfaction and dissatisfaction is critical to developing the desiredcustomer loyalty and retention.
Employee Development. Another important type of soft data isemployee development. Promotions, transfers, pay increases, andperformance ratings are typical data that indicate improvementin this area. In the case of managers/supervisors, measures focuson the extent to which they provide developmental opportunitiesfor their employees.
Attitude Shifts. A fifth type of soft data comes in the form ofattitude shifts. Employee loyalty and increased confidence aretypical measures of shifts in attitude.
Initiative and Innovation. The final category of soft data isinitiative. In some HR programs, participants are encouraged totry new ideas and techniques. The extent to which employeesaccomplish their goals is additional evidence of the success of theprogram. Also, the employees’ initiative to generate ideas andsubmit suggestions is further indication that improvement hasoccurred. New product and service developments and new inven-tions, patents and copyrights are important innovation measures.
As with hard data, these subdivisions have some overlap. Someitems listed under one category could appropriately be listed in

148 THE HUMAN RESOURCES SCORECARD
another. For instance, consider employee loyalty. Loyalty is relatedboth to the feelings and attitudes of an employee, as well as hisor her work habits. An employee exhibits loyalty through attitudesand feelings in the following situations:
� balancing the organization’s goals with personal goals� purchasing the company’s products rather than those of
a competitor
On the other hand, loyalty may surface in these work habitsof an employee:
� returns to work promptly after break� studies job information on his or her own time� takes work home when necessary to finish the job
Soft Data Versus Hard Data. The preference of hard data in theevaluation of HR programs does not dilute the value of soft data.Soft data are essential for a complete evaluation of HR programs.A project’s total success may rest on soft data measurements. Forexample, in a project to reduce turnover at a fast-food restaurant,four key measures of success were identified: employee turnover,interview-to-hire ratios, participants’ performance evaluations,and reduced litigation.
Most HR programs use a combination of hard and soft dataitems in the evaluation. A comprehensive evaluation uses severalhard data and soft data measurements. For example, an HRprogram in the maintenance department of one organizationyeilded the following measures of success:
� reduction of costs associated with specific maintenanceactivities
� improvement in production equipment and processes� changes in maintenance responsibilities and procedures� improvement in training of maintenance employees� changes in organization and staffing
These changes included both hard data (production and costs) andsoft data (changes in procedures, and changes in the organization).
Soft data are usually best used when evaluating behavior andskill outcomes. For example, in building core competencies, which

COLLECTING DATA AFTER HR PROGRAM IMPLEMENTATION 149
has proven to be a very effective strategy for many organizations,the evaluation of behavioral and skill outcomes relies almostentirely on soft data.
The important point is that there is a place for both hard- andsoft-data evaluations. A comprehensive HR program will use bothtypes of data. Some initiatives will rely on soft data as primarymeasures, while others will rely on hard data as primary measures.Hard data are preferred because of their distinct advantages andlevel of credibility.
Other Data Categories. In addition to classifying data as hardand soft, it is sometimes helpful to explain other ways to classifyor categorize data. As shown in Figure 4-4, data can be cate-gorized at several different levels. As the figure illustrates, somedata are considered strategic and are linked to the corporate levelof an organization. Other data are more operational at thebusiness unit level. Still others are considered more tactical innature and scope and are used at the operating level.
Examples of data categorized at the strategic level includefinancial, people-oriented, or internal versus external. At thebusiness unit level, classifications such as output, quality, time,cost, job satisfaction, and customer satisfaction are critical cate-gories. At the tactical level, the categories are more plentiful andinclude items such as productivity, efficiency, cost control, quality,time, attitudes, and individual and team performance. The impor-tant point is not the concern about the classification of data butan awareness of the vast array of data available. Regardless ofwhat they are called, these data are a consequence measure ofHR program success. These measures are captured throughout anorganization and used for a variety of purposes. The challenge
Figure 4-4.

150 THE HUMAN RESOURCES SCORECARD
is to find the data items connected directly to the HR program.Ideally, this would be accomplished on the front end of theprocess so that the data are linked with the initial analysis. Ifnot, it would be a process of trying to identify the appropriatemeasures for the output of the HR program.
Monitoring Business Performance Data
Data are available in every organization to measure businessperformance. Monitoring performance data enables managementto measure performance in terms of output, quality, costs, time,job satisfaction, and customer satisfaction. In determining thesource of data in the evaluation, the first consideration shouldbe existing databases and reports. In most organizations, per-formance data suitable for measuring improvement resulting froman HR program are available. If not, additional record-keepingsystems will have to be developed for measurement and analysis.At this point, the question of economics surfaces. Is it economicalto develop the record-keeping systems necessary to evaluate HRprograms? If the costs are greater than the expected return forthe entire program, then it is pointless to develop those systems.
Using Current Measures. If existing performance measures areavailable, specific guidelines are recommended to ensure that themeasurement system is easily developed.
Identify Appropriate Measures. Existing performance measuresshould be thoroughly researched to identify those related to theproposed objectives of the HR program. Frequently, an organi-zation will have several performance measures related to the sameitem. For example, the efficiency of a production unit can bemeasured in several ways, some of which are outlined below:
� the number of units produced per hour� the number of on-schedule production units� the percentage of use of the equipment� the percentage of equipment downtime� the labor cost per unit of production� the overtime required per unit of production� total unit cost

COLLECTING DATA AFTER HR PROGRAM IMPLEMENTATION 151
Each of these, in its own way, measures the efficiency of theproduction unit. All related measures should be reviewed todetermine those most relevant to the HR program.
Convert Current Measures to Usable Ones. Occasionally, existingperformance measures are integrated with other data, and it maybe difficult to keep them isolated from unrelated data. In thissituation, all existing related measures should be extracted andtabulated again to be more appropriate for comparison in theevaluation. At times, conversion factors may be necessary. Forexample, the average number of new sales orders per month maybe presented regularly in the performance measures for the salesdepartment. In addition, the sales costs per sales representativeare also presented. However, in the evaluation of an HR program,the average cost per new sale is needed. The average number ofnew sales orders and the sales lost per sales representative arerequired to develop the data necessary for comparison.
Developing New Measures. In some cases, data are not availablefor the information needed to measure the effectiveness of an HRprogram. The HR staff must work with the client to developrecord-keeping systems, if economically feasible. In one organi-zation, a turnover problem with new professional staff promptedan HR initiative. To help ensure success of the project, severalmeasures were planned, including early turnover defined as thepercentage of employees who left the company in the first sixmonths of employment. Initially this measure was not available.Once the program was implemented, the organization begancollecting early turnover figures for comparison. Several questionsregarding this issue should be addressed:
� Which department will develop the measurement system?� Who will record and monitor the data?� Where will it be recorded?� Will forms be used?
These questions will usually involve other departments or amanagement decision that extends beyond the scope of the HRstaff. Often the administration department, operations, or theinformation technology unit will be instrumental in helping

152 THE HUMAN RESOURCES SCORECARD
determine whether new measures are needed and, if so, how theywill be developed.
Using Action Plans to Develop Business Impact Data
An earlier section showed how action plans can capture Level3 data to measure application and implementation. The actionplan can also be a very useful tool for capturing business impactdata. The basic design principles and the issues involved indeveloping and administering action plans are the same forbusiness impact data as they are for application and imple-mentation. However, a few issues unique to business impact andROI are presented here. The following steps are recommendedwhen an action plan is developed and implemented to capturebusiness impact data and convert the data to monetary values.
Have Each Participant Set Goals and Targets. As shown in Figure4-5, an action plan can be developed with a direct focus onbusiness impact data. The plan presented in this figure requiresparticipants to develop an overall objective for the plan, whichis usually the primary objective of the HR solution. In some cases,there may be more than one objective, which requires additionalaction plans. In addition to the objective, the improvementmeasure and the current levels of performance are identified. Thisinformation requires the participant to anticipate the applicationand implementation of the HR program and set goals for specificperformances that can be realized.
The action plan is completed during the HR program, oftenwith the input, assistance, and facilitation of the HR staff. TheHR staff members actually approve the plan, indicating that itmeets the particular requirements of being very Specific, Measurable,Achievable, Realistic, and Time-based (SMART). The plan canactually be developed in a one- to two-hour time frame and oftenbegins with action steps related to the implementation of the HRsolution. These action steps are actually Level 3 activities thatdetail the application and implementation of the HR solution.All of these steps build support for, and are linked to, businessimpact measures.

CO
LLEC
TIN
G D
AT
A AFT
ER H
R P
RO
GR
AM
IM
PLE
MEN
TAT
ION
153Figure 4-5.

154 THE HUMAN RESOURCES SCORECARD
Define the Unit of Measure. The next important issue is to definethe actual unit of measure. In some cases, more than one measuremay be used and will subsequently be contained in additionalaction plans. The unit of measure is necessary to break theprocess down into the simplest steps so that the ultimate valueof the program can be determined. The unit can be output data,such as an additional unit manufactured or additional hotel roomrented, or it can be sales and marketing data such as additionalsales units, dollars earned, or a one percent increase in marketshare. In terms of quality, the unit can be one reject, error, or defect.Time-based units are usually measured in minutes, hours, days, orweeks. Other units are specific to their particular type of data, suchas one grievance, complaint, or absence. The important point is tobreak them down into the simplest terms possible.
Require Participants to Assign Monetary Values for EachImprovement. During the HR program, participants are asked todetermine, calculate, or estimate the monetary value for eachimprovement outlined in the plan. The unit value is determinedusing standard values, expert input, external databases, or esti-mates. The process used in arriving at the value is described inthe action plan. When the actual improvement occurs, par-ticipants will use these values to capture the annual monetarybenefits of the plan. For this step to be effective, it is helpful tosee examples of common ways in which values can be assignedto the actual data.
Participants Implement the Action Plan. Participants implementthe action plan during the HR program implementation, whichoften lasts for weeks or months following the initiative. Uponcompletion, a major portion if not all of the project is slated forimplementation. The participants implement action-plan steps andthe subsequent results are achieved.
Participants Estimate Improvements. At the end of the specifiedfollow-up period—usually three months, six months, nine months,or one year—the participants indicate the specific improvementsmade, sometimes expressed as a monthly amount. This determinesthe actual amount of change that has been observed, measured,or recorded. It is important for the participants to understand

COLLECTING DATA AFTER HR PROGRAM IMPLEMENTATION 155
the necessity for accuracy as data are recorded. In most cases onlythe changes are recorded, as those amounts are needed to cal-culate the actual value of the program. In other cases, before andafter data may be recorded, allowing the research to calculatethe actual differences.
Ask Participants to Isolate the Effects of the HR Initiative.Although the action plan is initiated because of the HR initiative,the actual improvements reported on the action plan may beinfluenced by other factors. Thus, the action planning processinitiated in the HR program should not take full credit for theimprovement. For example, an action plan to reduce employeeturnover in a division could take only partial credit for animprovement because of the other variables that affect the turn-over rate. While there are several ways to isolate the effects ofan HR initiative, participant estimation is usually most appro-priate in the action-planning process. Consequently, programparticipants are asked to estimate the percentage of the improvementactually related to this particular program. This question can beasked on the action plan form or in a follow-up questionnaire.
Ask Participants to Provide a Confidence Level for Estimates.Because the process to convert data to monetary values may notbe exact and the amount of the improvement actually related tothe program may not be precise, participants are asked to indicatetheir level of confidence in those two values, collectively. On ascale of zero to 100 percent, where zero percent means the valuesare completely false and 100 percent means the estimates repre-sent certainty, this value provides participants a mechanism forexpressing their uneasiness with their ability to be exact withthe process.
Collect Action Plans at Specified Time Intervals. An excellentresponse rate is essential, so several steps may be necessary toensure that the action plans are completed and returned. Usuallyparticipants will see the importance of the process and willdevelop their plans in detail before leaving the program. Someorganizations use follow-up reminders by mail or e-mail. Otherscall HR program participants to check progress. Still others offerassistance in developing the final plan. These steps may require

156 THE HUMAN RESOURCES SCORECARD
additional resources, which must be weighed against the impor-tance of having more data.
Summarize the Data and Calculate the ROI. If developed properly,each action plan should have annualized monetary values asso-ciated with improvements. Also, each individual should haveindicated the percentage of the improvement directly related tothe program. Finally, participants should have provided a con-fidence percentage to reflect their uncertainty with the process andthe subjective nature of some of the data that may be provided.
Because this process involves estimates, it may not appear tobe accurate. Several adjustments during the analysis make theprocess very credible and more accurate. The following adjust-ments are made:
Step 1: For those participants who do not provide data, it isassumed that they had no improvement to report. Thisis a very conservative approach.
Step 2: Each value is checked for realism, usability, and fea-sibility. Extreme values are discarded and omitted fromthe analysis.
Step 3: Because the improvement is annualized, it is assumedthe program had no improvement after the first yearfor short-term projects. Some programs add value inyears two and three.
Step 4: The improvement from Step 3 is then adjusted withthe confidence level, multiplying it by the confidencepercentage. The confidence level is actually an errorpercentage suggested by the participants. For example,a participant indicating 80 percent confidence with theprocess is reflecting a 20 percent error possibility. Ina $10,000 estimate with an 80 percent confidencefactor, the participant is suggesting that the value canbe in the range of $8,000 to $12,000. To be conservative,the lower number is used. Thus, the confidence factoris multiplied times the amount of improvement.
Step 5: The new values are then adjusted by the percentageof the improvement related directly to the programusing straight multiplication. This isolates the effectsof the HR initiative.

COLLECTING DATA AFTER HR PROGRAM IMPLEMENTATION 157
The monetary values determined in these five steps are totaledto arrive at a total program benefit. Because these values arealready annualized, the total of these benefits becomes the annualbenefits for the program. This value is placed in the numeratorof the ROI formula to calculate the ROI.
Case Application. The impact of the action plan process isimpressive. In a medium-sized manufacturing facility, an HRprogram was implemented for an operations division in a metalscompany. Some of the areas addressed were productivity improve-ment, scrap reduction, absenteeism, turnover, grievances, andsafety. These areas were analyzed thoroughly, and supervisorsimplemented improvements in each area. Supervisors wererequired to develop action plans for improvement and report theresults in a follow-up six months after the program. In thissituation, the improvement measures were predetermined by theneeds assessment. The following results were documented froma pilot group:
� The department unit hour was increased from 65 to 75.This is a basic measure of productivity, where a unit hourof 60 is considered to be average and acceptable work.
� Scrap was reduced from 11 percent to 7.4 percent.� Absenteeism was reduced from 7 percent to 3.25 percent.� The annual turnover rate was drastically reduced from 30
percent to 5 percent.� Grievances were reduced by 80 percent.� Lost-time accidents were reduced by 95 percent.
These results were achieved by supervisors applying and imple-menting the HR solutions and reporting the results of actionplans. Although these results are impressive, three additional stepsare needed to develop the ultimate evaluation, the return oninvestment. First, the amount of improvement actually linked tothe program must be determined. In this situation, supervisorsestimated the percentage of the improvement directly linked tothe program. For example, while the absenteeism improvementshowed an overall decrease of 3.75 percent, the supervisorscollectively estimated that only 46 percent of the absenteeismreduction was actually linked to the HR program. Thus, a 3.75

158 THE HUMAN RESOURCES SCORECARD
percent absenteeism reduction actually becomes 1.725 percent.This figure can be adjusted further by factoring in a confidencelevel (provided by supervisors when they supplied the estimate).In this example, supervisors were 84 percent confident in theirallocation of the absenteeism improvement. This adjustmentmeans that 1.725 percent then becomes 1.45 percent when adjustedfor the 84 percent confidence level (1.725 × .84 = 1.45%). Thesetwo adjustments isolate the effects of the HR program on theoutput variable and are fully described in Chapter 5.
The second step to develop the ROI is to convert the data tomonetary values. In the same example, the value for a singleabsence must be determined and used to calculate the annualbenefit of the improvement. There are at least ten ways to placevalues on data, and they are fully described in Chapter 6. In thisexample, supervisors developed an estimated value of one absence,a value that was used previously in several applications in whichthe cost of absenteeism was needed. Thus, the total number ofabsences avoided was calculated and multiplied by the value ofone absence to obtain the program’s annual impact on absen-teeism reduction. This process shows clearly the economic valueof the program on that specific output variable. These two steps,isolating the effects of initiative and converting data to monetaryvalues, are performed for each of the six improvement variables,and the total value represents the annual economic benefit ofthe program.
The third step necessary to move to an ROI is to develop thefully loaded costs of the program. In this step, the costs relatedto the needs assessment and program development are prorated.All direct HR program costs are captured, along with the costof participants’ salaries and benefits while they were actuallyinvolved in the HR initiative. The fully loaded cost for allparticipants reflects the total investment in this program for thegroup. This process is fully explained in Chapter 7. With thesethree additional steps, the ROI can be calculated using formulasdescribed earlier in this book (net benefits divided by costs). Inthis example, total annual benefits directly attributed to theprogram after converting all six improvement items to monetaryunits were $775,000. The fully loaded costs for the HR programwere developed to be $65,000. Thus, the ROI becomes as follows:

COLLECTING DATA AFTER HR PROGRAM IMPLEMENTATION 159
ROI = = − × =Net Program BenefitsProgram Costs
$ , $ ,$ ,
, %775 000 65 000
65 000100 1 092
This impressive ROI has credibility because of the conservativeadjustments made to the data. Without these three additionalsteps, the target audience may be left wondering how much ofthe results were actually linked to the program and if the benefitsexceeded the costs to the degree reflected in the ROI.
The action-planning process is a very useful way to collectbusiness impact data. Use of the process has several inherentadvantages. Most of the data are taken directly from participantsand often have the credibility needed in the analysis. Also, muchof the responsibility for the analysis and evaluation is shifted tothe participants as they tackle three of the most critical parts ofthe process. In effect, they collect data, show improvements,isolate the effects of the HR initiative, and convert data tomonetary values. This enables the evaluation to be conductedwith limited resources and shifts much of the actual involve-ment to those who are actually applying and implementing theHR program.
Using Questionnaires to Collect Business Impact Measures
As described earlier, the questionnaire is one of the mostversatile data collection tools and can be appropriate for Levels1, 2, 3, and 4 data. In the previous section, a questionnaireexample is presented in which not only Level 3 application andimplementation data are collected, but business impact data aredeveloped as well. Some of the issues discussed there applyequally in collecting business impact data. Essentially, the designprinciples and the content issues are the same except that ques-tionnaires developed for a business impact evaluation will containadditional questions to capture those data items.
Key Impact Questions. Figure 4-6 shows a series of key impactquestions that can be added to a questionnaire to capture businessimpact data. Although there are a variety of ways to collect thiscategory of data, these simple questions can be powerful ifparticipants are committed to providing this type of information.

160 THE HUMAN RESOURCES SCORECARD
1. What has changed about you or your work as a result of yourparticipation in this project? (Specific behavior change, actionitems, new projects, etc.)
2. Please identify any specific accomplishments/improvementsthat you can link to the project. (Job performance, projectcompletion, response times, etc.).
3. What specific annualized value in U.S. dollars can be attributedto the above accomplishments/improvements? Use first-yearvalues only. While this is a difficult question, try to think ofspecific ways in which the above improvements can be convertedto monetary units. Along with the monetary value, pleaseindicate the basis of your calculation. $
Basis:
4. Other factors often influence improvements in performance.Please indicate the percentage of the above improvement thatis related directly to this project. %.
Please explain.
Figure 4-6.

COLLECTING DATA AFTER HR PROGRAM IMPLEMENTATION 161
To ensure an appropriate response, the strategies outlined inChapter 3, under the heading “Improving the Response Rate forQuestionnaires and Surveys,” apply equally to follow-up question-naires where business impact data are collected. These questionsmust be thoroughly explained and if possible even reviewed priorto actually achieving the accomplishments outlined in the ques-tionnaire. The first impact question provides participants with theopportunity to detail specifically what has changed about theirwork as a result of the HR program. These are actually applicationdata, but they set the stage for collecting the business impact data.
Question two focuses directly on business impact data but isexpressed in general terms to allow flexibility for participantresponses. If the responses need to follow a narrowly focused setof possibilities, the question can be more narrowly worded.
Question three focuses on the actual monetary values. Althoughthis may only be necessary if an ROI analysis is planned, it issometimes helpful to see the impact of the particular change inbusiness measures expressed in monetary terms. Participants areasked not only to supply the values, but to provide an annualimprovement as well. Most importantly, they are asked to provide
5. Do you think this program represented a good investment forthe company?
Yes � No �
Please explain.
6. What level of confidence do you place on the above estimations?(0% = No Confidence, 100% = Certainty) %
Figure 4-6. Continued.

162 THE HUMAN RESOURCES SCORECARD
an explanation of how they arrived at these values. This bringsadditional credibility to the responses and is important in makingthe decision to use the data.
Question four focuses on isolating the effects of the HR initia-tive on business impact measures. In almost every setting, otherfactors will influence the output measures, so it is important totry to determine how much of the improvement is actually relatedto the HR initiative. This question attempts to do that by askingparticipants to provide a percentage of the improvement relatedto the HR initiative.
Question five simply asks participants their opinion as towhether or not the program was a good investment for thecompany. While this information cannot be used in the analysis,it provides supporting evidence of success—or the lack thereof.
Finally, in question six, the level of confidence is captured usingthe scale of zero to 100 percent. This confidence is spread overall of the questions and can be used to provide additional sup-porting evidence around the data gathered in the previous ques-tion. Also, the confidence value can be used to adjust the data.This will be explored later.
These simple questions can make the data collection instrumentpowerful and can identify significant improvements in the busi-ness impact area.
There are different approaches and different ways to explorethe issues surrounding data collection. The most important issueis that the proper climate be established for participants toprovide the data.
ROI Analysis. Although there are several approaches to dataanalysis, the recommended steps to calculate the ROI are brieflydescribed here. The calculations are based on the responses fromthe series of impact questions. The following five adjustments aremade to the data to ensure that they are credible and accurate:
1. The participants who do not complete the questionnaire orprovide usable data on the impact questions are assumedto have no improvement.
2. Extreme and unrealistic data items are omitted.3. Only annualized values are used, as requested in the responses.

COLLECTING DATA AFTER HR PROGRAM IMPLEMENTATION 163
4. The values are adjusted to reflect the confidence level ofparticipants.
5. The values are adjusted for the amount of the improvementrelated directly to the program.
These five adjustments create a very credible value that isusually considered to be an understatement of the benefits.
SELECTING THE APPROPRIATE
METHOD FOR EACH LEVEL
This chapter and the previous one presented several methodsto capture data. Collectively, they offer a wide range of opportunitiesfor collecting data in a variety of situations. Eight specific issuesshould be considered when deciding which method is appropriatefor a situation. These should be considered when selecting datacollection methods for other evaluation levels as well.
Type of Data. Perhaps one of the most important issues toconsider when selecting the method is the type of data to becollected. Some methods are more appropriate for Level 4, whileothers are best for Level 3. Table 4-3 shows the most appropriatetypes of data for specific methods of Levels 3 and 4 data col-lection. Follow-up surveys, observations, interviews, and focusgroups are best suited for Level 3 data, sometimes exclusively.Performance monitoring, action planning, and questionnaires caneasily capture Level 4 data.
Participants’ Time for Data Input. Another important factor inselecting the data collection method is the amount of time par-ticipants must spend with data collection and evaluation systems.Time requirements should always be minimized, and the methodshould be positioned so that it is a value-added activity (that is,the participants understand that this activity is something valuableso they will not resist). This requirement often means that sampl-ing is used to keep the total participant time to a minimum. Somemethods, such as performance monitoring, require no participanttime, while others, such as interviews and focus groups, requirea significant investment in time.

164 THE HUMAN RESOURCES SCORECARD
Supervisory Time for Data Input. The time that a participant’sdirect supervisor must allocate to data collection is anotherimportant issue in the method selection. This time requirementshould always be minimized. Some methods, such as performancecontracting, may require much involvement from the supervisorbefore and after the program. Other methods, such as question-naires administered directly to participants, may not require anysupervisor time.
Cost of Method. Cost is always a consideration when selectingthe method. Some data collection methods are more expensivethan others. For example, interviews and observations are veryexpensive. Surveys, questionnaires, and performance monitoringare usually inexpensive.
Disruption of Normal Work Activities. Another key issue inselecting the appropriate method—and perhaps the one thatgenerates the most concern with managers—is the amount ofdisruption the data collection will create. Routine work processesshould be disrupted as little as possible. Some data collectiontechniques, such as performance monitoring, require very littletime and distraction from normal activities. Questionnaires generallydo not disrupt the work environment and can often be completedin only a few minutes, or even after normal work hours. On the
Table 4-3Collecting Follow-Up Data
Data-Collection Method Level 3 Level 4
Follow-up surveys ✓
Follow-up questionnaires ✓ ✓
Observation on the job ✓
Interviews with participants ✓
Follow-up focus groups ✓
Action planning ✓ ✓
Performance contracting ✓ ✓
Business performance monitoring ✓

COLLECTING DATA AFTER HR PROGRAM IMPLEMENTATION 165
other extreme, some items such as observations and interviewsmay be too disruptive to the work unit.
Accuracy of Method. The accuracy of the technique is anotherfactor to consider when selecting the method. Some data col-lection methods are more accurate than others. For example,performance monitoring is usually very accurate, whereas ques-tionnaires can be distorted and unreliable. If actual on-the-jobbehavior must be captured, observation is clearly one of the mostaccurate methods.
Utility of an Additional Method. Because there are many differentmethods to collect data, it is tempting to use too many datacollection methods. Multiple data collection methods add to thetime and costs of the evaluation and may result in very littleadditional value. Utility refers to the added value of the use ofan additional data collection method. As more than one methodis used, this question should always be addressed. Does the valueobtained from the additional data warrant the extra time andexpense of the method? If the answer is no, the additional methodshould not be implemented.
Cultural Bias for Data Collection Method. The culture or philoso-phy of the organization can dictate which data collection methodsare used. For example, some organizations are accustomed tousing questionnaires and find the process fits in well with theirculture. Some organizations will not use observation because theirculture does not support the potential invasion of privacy oftenassociated with it.
SHORTCUT WAYS TO CAPTURE BUSINESS IMPACT DATA
While this chapter has explored several different ways tocapture business impact data, there are some ways the processcan be simplified when the projects are small in scope or inexpen-sive to develop and deliver.
Revisit Initial Needs. In the ideal situation, the business needsare the drivers for the project. If possible, the initial needs willbe revisited to see which specific measures need to change as a

166 THE HUMAN RESOURCES SCORECARD
result of the HR initiative. These are the measures that shouldbe examined for changes. This can be an extremely simple processif the project is developed as it should be. If not, other approachesmay be necessary.
Monitor Business Performance Measures. For most HR initiatives,even those small in scope, it is possible to monitor the businessmeasures that are linked or perceived to be linked to the projects.These are usually well known, discussed in conjunction with theproject, and readily available in operating units and business unitsthroughout the organization. Only those measures perceived tobe directly linked to the program should be examined, and somecaution should be taken not to overextend the project by examiningmeasures that may be only casually linked to the HR initiative.
Build It into the Process. As described in one of the examplesin this chapter, it is a relatively easy task to build data collectionand part of the analysis into the project. With this approach, theparticipants provide the data, isolate the effects of the HRinitiative on those data, and covert the data to monetary values.The remaining steps for the ROI process are simply the additionalsteps for capturing the costs, detailing the intangibles, actuallydeveloping the ROI calculations, and, of course, presenting theentire report. By building data collection and some analysis intothe process and gaining the necessary commitments from par-ticipants, it is possible for an HR implementation team to generatethe required business data that are directly connected to theproject with very little cost and effort.
If Questionnaires Are Used, Consider Business Impact Data. Ifa detailed follow-up questionnaire is used to capture data forapplication and implementation, a few additional questions canbe added to capture business impact. The key impact questionscontained in Figure 4-6 are simple questions that can usually beaddressed by many professional employees. They can be includedin the questionnaire with little additional effort, and the analysisis not very time consuming. The results can be eye-opening, far-reaching data that not only show value but also identify severalissues pertinent to the HR initiative. Collectively, these areshortcut ways to ensure that business impact data are collected

COLLECTING DATA AFTER HR PROGRAM IMPLEMENTATION 167
with minimum effort. It is important and almost essential thatbusiness data be collected if they are linked to the HR program.After all, this is the type of data that most clients desire and areexpecting from the project.
CONCLUSION
After describing the types of data that reflect application inthe work setting and business impact, this chapter provides anoverview of several data collection approaches that can be usedto capture application and business data—critical issues in deter-mining the success of the project. These essential measures deter-mine not only the success achieved, but areas where improvementis needed and areas where the success can be replicated in thefuture. A variety of techniques are available, ranging from obser-vation to questionnaires to action plans to performance monitor-ing, but the method chosen must match the scope of the project.Complicated projects require a comprehensive approach thatmeasures all of the issues involved in application and imple-mentation. Simple projects can take a less formal approach andcollect data only from a questionnaire. The credibility of datawill always be an issue when this level of data is collected andanalyzed. Several strategies are offered to enhance the credibilityof data analysis.

168 THE HUMAN RESOURCES SCORECARD
168
Chapter 5
Isolating the Effectsof an HR Program
The following situation is repeated often. A significant increasein performance is noted after a major human resource programor initiative is conducted, and the two events appear to be linked.A key manager asks, “How much of this improvement wascaused by the HR program?” When this potentially embarrassingquestion is asked, it is rarely answered with any degree ofaccuracy and credibility. Although the change in performance maybe linked to the HR program, other factors probably contributedto the improvement as well. This chapter explores ten usefulstrategies to isolate the effects of HR programs and initiatives.These strategies are used in some of the best organizations as theyattempt to measure the return on investment of HR programs.

ISOLATING THE EFFECTS OF AN HR PROGRAM 169
Portions of this chapter were first published in one of the HRfield’s leading publications [1].
PRELIMINARY ISSUES
The cause and effect relationship between the initiation of anHR program and the actual benefits of the implementation canbe confusing and difficult to prove but can be accomplished withan acceptable degree of accuracy. The challenge is to develop oneor more specific strategies to isolate the effects of the programearly in the process, usually as part of an evaluation plan. Up-front attention ensures that appropriate strategies will be usedwith minimum costs and time commitments.
Chain of Impact
Before presenting the strategies, it is helpful to examine thechain of impact implied in the different levels of evaluation. Asan example, suppose a new performance management process isimplemented in an organization. Measurable results achieved fromthe program should be derived from the application of skills/knowledge and attitude on the job for a specified period of timeafter the program has been implemented. This on-the-job applica-tion of the HR program is referred to as Level 3 in the fiveevaluation levels described in Chapter 1 and reported elsewhere[2]. The desired results from those administering the process(supervisors and managers) may differ from the results expectedfrom the rest of the workforce. Supervisors and managers maybe expected to administer the process effectively, to be bettercoaches, and to present a supportive attitude about the process.Others may be expected to perform better because expectationsand performance/development plans are more clearly defined bythe new process. Continuing with this logic, successful applicationof the performance management process on the job should stemfrom supervisors learning new skills and approaches or acquiringnew knowledge in the training program that introduces theprocess, which is measured as a Level 2 evaluation. Therefore,for a business results improvement (Level 4 evaluation), this chainof impact implies that measurable on-the-job applications arerealized (Level 3 evaluation) and new knowledge and skills are

170 THE HUMAN RESOURCES SCORECARD
learned (Level 2 evaluation). Without this preliminary evidence,it is difficult to isolate the effects of the HR program. In otherwords, if there is no learning or application of the process onthe job, it is virtually impossible to conclude that any per-formance improvements were caused by the program. This chainof impact requirement with the different levels of evaluation issupported in the literature [3]. From a practical standpoint, thisissue requires data collection at four levels for an ROI calculation.If data are collected for business results, data should also becollected for other levels of evaluation to ensure that the programhelped produce the business results. Although this requirementis a prerequisite to isolating the effects of implementation of theperformance management process, it does not prove that therewas a direct connection nor does it pinpoint how much of theimprovement was caused by the new process. It merely showsthat without improvements at previous levels, it is difficult tomake a connection between the ultimate outcome and the newperformance management process.
Identifying Other Factors
As a first step in isolating HR’s impact on performance, allthe key factors that may have contributed to the performanceimprovement should be identified. This step communicates tointerested parties that other factors may have influenced theresults, underscoring that the new program implemented by HRis not the sole source of improvement. Consequently, the credit forimprovement is shared with several possible variables and sources,an approach that is likely to gain the respect of management.
Several potential sources identify major influencing variables.If the program is designed on request, the client may be able toidentify factors that will influence the output variable. The clientwill usually be aware of other initiatives or programs that mayimpact the output.
Those who implement or use HR programs are usually awareof other influences that may cause performance improvement.After all, it is the impact of their collective efforts that is beingmonitored and measured. In many situations, they witness pre-vious movements in the performance measures and pinpoint thereasons for changes.

ISOLATING THE EFFECTS OF AN HR PROGRAM 171
HR analysts, developers, and program administrators are anothersource for identifying variables that have an impact on results. Theneeds analysis will usually uncover these influencing variables.
In some situations, participants’ supervisors may be able toidentify variables that influence the performance improvement.This is particularly useful when the affected population is com-posed of non-exempt employees (operatives) who may not befully aware of all the variables that can influence performance.
Finally, middle and top managers may be able to identify otherinfluences based on their experience and knowledge of the situa-tion. Perhaps they have monitored, examined, and analyzed thevariables previously. The authority positions of these individualsoften increase the credibility of the data.
Taking time to focus attention on variables that may haveinfluenced performance brings additional accuracy and credibilityto the process. It moves beyond the scenario in which results arepresented with no mention of other influences, a situation thatoften destroys the credibility of an HR impact report. It alsoprovides a foundation for some of the strategies described in thisbook by identifying the variables that must be isolated to showthe effects of HR programs, processes, and initiatives. A wordof caution is appropriate here. Halting the process after this stepwould leave many unknowns about actual program impact andmight leave a negative impression with management because thisstep may have identified variables that management did notpreviously consider. Therefore, it is recommended that the HRstaff go beyond this initial step and use one or more of the tenstrategies that isolate the impact of the HR initiative.
THE TEN STRATEGIES
The remainder of this chapter describes in detail the tenstrategies to isolate the effects of an HR program. Not allstrategies are appropriate for every program. The final section ofthe chapter discussses the use of the strategies and provides factorsto consider when deciding which strategy is most appropriate.
Use of Control Groups
The most accurate approach to isolate the impact of an HRinitiative is the use of control groups in an experimental design

172 THE HUMAN RESOURCES SCORECARD
process [4]. This approach involves the use of an experimentalgroup that receives the HR program and a control group thatdoes not. The composition of both groups should be as identicalas possible, and if feasible, the selection of participants for eachgroup should be on a random basis. When this is possible andboth groups are subjected to the same environmental influences,the difference in the performance of the two groups can beattributed to the HR program/initiative.
As illustrated in Figure 5-1, the control group and the experi-mental group do not necessarily have pre-program measurements.Measurements are taken after the program implementation, andthe difference in the performance of the two groups shows theamount of improvement that is directly related to the HR program.
Control group arrangements appear in many settings. A reviewcited a Federal Express company’s ROI analysis, which usedcontrol groups, as a good example of the state of the art inmeasuring ROI [5]. The study focused on twenty employees whowent through an intense, redesigned two-week training programsoon after being hired to drive company vans. Their performancewas compared with a control group of twenty other new hireswhose managers were told to do no more or less on-the-jobtraining than they normally would do. Performance was trackedfor the two groups for ninety days in categories such as accidents,injuries, time-card errors, and domestic airbill errors. The tenperformance categories were assigned dollar values by expertsfrom engineering, finance, and other groups. The program demon-strated that the performance of the highly trained employees wassuperior (resulting in a 24 percent return on investment) to thatof the group that did not receive the upgraded training.
Figure 5-1. Post-test only, control group design.

ISOLATING THE EFFECTS OF AN HR PROGRAM 173
One caution to keep in mind is that the use of control groupsmay create an image that the HR staff is creating a laboratorysetting, which can cause a problem for some executives. To avoidthis stigma, some organizations run a pilot program using pilotparticipants as the experimental group and not informing thenon-participating control group. Another example illustrates thisapproach. An international pipe and fittings manufacturing com-pany developed an improved incentive plan for its customerservice engineers who sell directly to the customer [6]. Theincentive program was designed to improve engineers’ performanceand to produce higher levels of sales. Previously, the incentiveplan was not structured well, and engineers and their managershad complained about the plan features and design. The managerof compensation was convinced that the new incentive plan wouldsignificantly increase sales. Senior management was skeptical andwanted proof, a familiar scenario. The program was pilot-testedwith a group of thirty sales engineers in Europe. In anothercountry, another group of thirty sales engineers with similarindividual and market characteristics served as a control groupand were not aware of the new incentive plan. Prior to imple-menting the new plan, performance was measured using averagedaily sales (sales divided by number of days) for ninety days foreach of the two groups. After implementation of the new plan,the average daily sales were recorded for another ninety days. Asignificant difference in the sales of the two groups emerged, andbecause the groups were almost identical and were subjected tothe same environmental influences, it was concluded that the salesdifferences were a result of the new incentive plan and not otherfactors. In this setting, pilot testing allowed the use of a controlgroup without the publicity and potential criticism that is typicalusing control groups.
The control group process does have some inherent problemsthat may make it difficult to apply in practice. The first majorproblem is the selection of the groups. From a practical perspectiveit is virtually impossible to have identical control and experimentalgroups. Dozens of factors can affect employee performance, someof them individual and others contextual. To address the issueon a practical basis, it is best to select two or three variablesthat will have the greatest influence on performance. For example,in an interactive selling skills program in a retail store chain, three

174 THE HUMAN RESOURCES SCORECARD
groups were trained, and their performances were compared withthree similar groups, which were the control groups. The selectionof the particular groups was based on three variables storeexecutives thought would influence performance most from onestore to another: actual market area, store size, and customertraffic. Although other factors could influence performance, thesethree variables were used to make the selection.
Another problem is contamination, which can develop whenpeople participating in the program/initiative actually inform orteach others who are in the control group. Sometimes the reversesituation occurs when members of the control group model thebehavior from the group implementing the change. In either case,the experiment becomes contaminated as the influence is passedon to the control group. This can be minimized by ensuring thatcontrol groups and experimental groups are at different locations,have different shifts, or are on different floors in the same building.When this is not possible, sometimes it is helpful to explain to bothgroups that one group will implement a new program now andanother will implement it at a later date. Also, it may be helpful toappeal to the sense of responsibility of those being informed andask them not to share the information or skills with others.
A third problem occurs when the different groups functionunder different environmental influences. Because they may be indifferent locations, the groups may have different environmentalinfluences. This was a major concern in the implementation ofthe new incentive plan mentioned previously. Sometimes theselection of the groups can help prevent this problem fromoccurring. Also, using more groups than necessary and discardingthose with some environmental differences is another tactic.
A fourth problem with using control groups is that doing somay appear too research-oriented for most business organizations.For example, executives may not want to take the time to experi-ment before proceeding with a program, or they may not wantto withhold a program from any group just to measure theimpact of an experimental program. Because of this concern,some HR practitioners do not entertain the idea of using controlgroups. When the process is used, however, some organizationsconduct it with pilot participants as the experimental group andnon-participants as the control group. Under this arrangement,the control group is not informed of its control group status.

ISOLATING THE EFFECTS OF AN HR PROGRAM 175
Because this is an effective approach for isolating the impactof an initiative, it should be considered as a strategy when amajor ROI impact study is planned. In these situations it isimportant for the program impact to be isolated to a high levelof accuracy; the primary advantage of the control group processis accuracy.
Trendline Analysis
Another useful technique for approximating the impact ofhuman resource programs or initiatives is trendline analysis. Withthis approach, a trendline is drawn, using previous performanceas a base and extending the trend into the future. When an HRprogram is implemented, actual performance is compared withthe trendline. Any improvement of performance beyond what thetrendline predicted can then be reasonably attributed to the HRprogram. Although this is not an exact process, it provides areasonable estimation of the impact of the program.
Figure 5-2 shows an example of this trendline analysis takenfrom a shipping department of a large distribution company. Thepercent reflects the level of actual shipments compared withscheduled shipments. Data are presented before and after an HRprocess improvement program that was conducted in July. As
Figure 5-2. Trendline analysis example.

176 THE HUMAN RESOURCES SCORECARD
shown in the figure, there was an upward trend on the data priorto conducting the HR program. Although the program apparentlyhad a dramatic effect on shipment productivity, the trendlineshows that improvement would have continued anyway, based onthe trend that had been previously established. It is tempting tomeasure the improvement by comparing the average six-monthsshipments prior to the program (87.3 percent) to the average ofsix months after the program (94.4 percent) yielding a 6.9 percentdifference However, a more accurate comparison is the six-monthaverage after the program compared with the trendline (92.3percent). In this example, the difference is 2.1 percent. Using thismore modest measure increases the accuracy and credibility ofthe process to isolate the impact of the program.
A primary disadvantage of this trendline approach is that it isnot always accurate. The use of this approach assumes thatthe events that influenced the performance variable prior to theprogram are still in place after the program, except for theimplementation of the training program (that is, the trends thatwere established prior to training will continue in the samerelative direction). Also, it assumes that no new influences enteredthe situation at the time training was conducted and during thedata collection time period. This may not always be the case.
The primary advantage of this approach is that it is simple andinexpensive. If historical data are available, a trendline canquickly be drawn and differences estimated. Although not exact,it does provide a quick assessment of the impact of HR programs.
Forecasting Methods
A more analytical approach to trendline analysis is forecastingmethods that predict a change in performance variables. Thisapproach represents a mathematical interpretation of the trendlineanalysis discussed above when other variables entered the situa-tion at the time of the human resource program or initiative. Alinear model, in the form of y = ax + b, is appropriate when onlyone other variable influences the output performance, and thatrelationship is characterized by a straight line. Instead of drawingthe straight line, a linear equation is developed, which calculatesa value of the anticipated performance improvement.
An example will help explain the application of this process.A large bank implemented a new screening and selection employ-

ISOLATING THE EFFECTS OF AN HR PROGRAM 177
ment system for recently hired sales associates [7]. The newsystem was designed to enhance the caliber of associates hiredand to match characteristics and traits to the job requirements.The outcome was expected to be an increase in sales volume foreach new sales associate when compared with the average salesof existing salespeople. An important measure of the program’ssuccess was the sales-per-employee calculation six months afterthe selection system implementation compared with the samemeasure prior to the implementation. The average daily sales peremployee prior to implementation, using a one-month average,was $1,100 (rounded to the nearest $100). Six months after theimplementation, the average daily sales per employee was $1,500.Two related questions must be answered: Is the difference in thesetwo values attributable to the implementation of the new screen-ing and selection system? Did other factors influence the actualsales level?
After reviewing potential influencing factors with several storeexecutives, only one factor, the level of advertising, appeared tohave changed significantly during the period under consideration.When reviewing the previous sales data per employee and thelevel of advertising, a direct relationship appeared to exist. Asexpected, when advertising expenditures were increased, the salesper employee increased proportionately.
Using the historical values to develop a simple linear modelyielded the following relationship between advertising and sales:y = 140 + 40x, where y is the daily sales per employee and x isthe level of advertising expenditures per week (divided by 1,000).This equation was developed by the marketing department usingthe method of least squares to derive a mathematical relationshipbetween two variables. This is a routine option on some cal-culators and is included in many software packages.
The level of weekly advertising expenditures in the monthpreceding implementation of the new selection system was $24,000,and the level of expenditures in the sixth month after imple-mentation was $30,000. Assuming that the other factors possiblyinfluencing sales were insignificant, the store executives deter-mined the impact of the advertising by plugging in the newadvertising expenditure amount, 30, for x and calculating thedaily sales, which yields $1,340.
Thus, the new sales level caused by the increase in advertisingwas $1,340, as shown in Figure 5-3. Because the new actual value

178 THE HUMAN RESOURCES SCORECARD
is $1,500, then $160 (i.e., $1,500 – $1,340) must be attributedto the screening and selection system. Figure 5-4 shows graphicallythe effect of both the training and advertising.
A major disadvantage with this approach occurs when manyvariables enter the process. The complexity multiplies, and theuse of sophisticated statistical packages for multiple variableanalysis is necessary. Even then, a good fit of the data to the
Figure 5-3. Forecasting daily sales based on advertising.
Figure 5-4. Isolating the impact of HR programs.

ISOLATING THE EFFECTS OF AN HR PROGRAM 179
model may not be possible. Unfortunately, some organizationshave not developed mathematical relationships for output variablesas a function of one or more inputs. Without them, the forecast-ing method is difficult to use.
The primary advantage of this process is that it can accuratelypredict business performance measures without the implementationof HR initiatives, if appropriate data and models are available.The presentation of specific methods is beyond the scope of thisbook and is contained in other works [8].
Participant Estimates
An easily implemented method to isolate the impact of humanresource programs and initiatives is to obtain information directlyfrom program participants. The effectiveness of this approachrests on the assumption that the affected population is capableof determining or estimating how much of a performance improve-ment is related to the HR program. Because their actions mayhave produced the improvement, employees involved in theinitiative may have very accurate input about the issue. Theyshould know how much of the change was caused by theirparticipation in a program, followed by their application of thenew policy, procedure, process, or skill. Although an estimate,this value will usually have considerable credibility with manage-ment because participants are at the center of the change orimprovement. Participant estimation is obtained by asking thefollowing series of questions after describing the improvement:
Typical Questions to Determine Business Impact
1. What percent of this improvement can be attributedto the application of skills/techniques/knowledgegained in the program?
2. What is the basis for this estimation?3. What confidence do you have in this estimate,
expressed as a percent?4. What other factors contributed to this improvement
in performance?5. What other individuals or groups could estimate
this percentage or determine the amount?

180 THE HUMAN RESOURCES SCORECARD
Table 5-1 illustrates this approach with an example of oneparticipant’s estimations.
Participants who do not provide information about thesequestions are excluded from the analysis. Also, erroneous, incom-plete, and extreme information should be discarded before analysis.To be conservative, the confidence percentage can be factored intothe values. The confidence percentage is actually a reflection ofthe error in the estimate. Thus, an 80 percent confidence levelequates to a potential error range of ± 20 percent. With thisapproach, the level of confidence is multiplied by the estimateusing the lower side of the range. In the example, the participantallocates 50 percent of the improvement to the new HR incentiveplan but is only 70 percent confident about this estimate. Theconfidence percentage is multiplied by the estimate to develop ausable incentive plan factor value of 35 percent. This adjustedpercentage is then multiplied by the actual amount of the improve-ment (post-program minus pre-program value) to isolate theportion attributed to the HR incentive plan. The adjusted improve-ment is now ready for conversion to monetary values and,ultimately, is used in the return on investment.
Perhaps an illustration of this process can reveal its effective-ness and acceptability. In a large global organization, the impactof a leadership development program for new managers was beingassessed. Because the decision to calculate the impact of the
Table 5-1Example of a Participant’s Estimation
Percent ofImprovement Confidence
Factor That Caused By Expressed AsInfluenced Improvement This Factor a Percent
1. Implementation of Incentive Plan 50% 70%2. Change in Procedures 10% 80%3. Adjustment in Standards 10% 50%4. Redesign of Office Space 20% 90%5. Increased Management Attention 10% 50%6. Other % %
Total 100%

ISOLATING THE EFFECTS OF AN HR PROGRAM 181
program was made after the program had been conducted, thecontrol group arrangement was not feasible as a method to isolatethe effects of training. Also, before the program was implemented,no specified Level 4 (business results) data were identified thatwere linked to the program. Consequently, it was difficult to usetrendline analysis. Participants’ estimates proved to be the mostuseful way to estimate the impact. In a detailed follow-upquestionnaire, participants were asked a variety of questionsregarding the job applications of what was learned from theprogram. As part of the program, the individuals were asked todevelop action plans and implement them, although no specificfollow-up plan was needed. The following series of impact ques-tions provided evaluators with estimations of the impact:
Impact Questions
1. How have you and your job changed as the resultof participating in this program? (skills and knowl-edge application)
2. What is the impact of these changes in your workunit? (specific measures)
3. What is the annual value of this change orimprovement in your work unit? (Although thisis difficult, please make every effort to estimatethis value.)
4. What is the basis for the estimate provided above?(Please indicate the assumptions you made and thespecific calculations you performed to arrive atthe value.)
5. What confidence do you place in the estimateabove? (100% = Certainty, 0% = No Confidence)
6. Recognizing that many factors influence outputresults in addition to the HR program in whichyou participated, please estimate the percent ofthe improvement that is directly related to thisprogram. (It may be helpful to first identify allthe other factors and then provide an estimate ofthis factor.)
Although this series of questions is challenging, when set upproperly and presented to participants in an appropriate way, it

182 THE HUMAN RESOURCES SCORECARD
can be very effective for collecting impact data. Table 5-2 showsa sample of the calculations from these questions for this par-ticular program.
Although this is an estimate, this approach does have con-siderable accuracy and credibility. Five adjustments are effectivelyemployed with this approach to reflect a conservative approach:
1. The individuals who do not respond to the questionnaireor provide usable data on the questionnaire are assumed tohave no improvements. This is probably an overstatementbecause some individuals will have improvements but willnot report them on the questionnaire.
2. Extreme data and incomplete, unrealistic, and unsupportedclaims are omitted from the analysis, although they may beincluded in the intangible benefits.
3. Because only annualized values are used, it is assumed thatthere are no benefits from the program after the first yearof implementation. In reality, a leadership developmentprogram should be expected to add value for severalyears after implementation. This may also be true of someHR programs.
4. The confidence level, expressed as a percent, is multipliedby the improvement value to reduce the amount of theimprovement by the potential error.
5. The improvement amount is adjusted by the amount directlyrelated to the HR program, expressed as a percent.
When presented to senior management, the results of thisparticular impact study were perceived to be an understatementof the program’s success. The data and the process were con-sidered credible and accurate.
As an added enhancement to this method, management maybe asked to review and approve the estimates from participants.For example, in an HR program involving the performancemanagement skills program for Yellow Freight Systems, a largetrucking company, participants estimated the amount of savingsthat should be attributed to the program [9]. A sample of theseestimates is shown in Table 5-3. Managers at the next two levelsabove participants reviewed and approved the estimates. Thus,the managers actually confirmed participants’ estimates.

ISO
LAT
ING
TH
E EFFE
CT
SO
FA
N H
R P
RO
GR
AM
183
Table 5-2Sample of Input from Participants in a Leadership Program for New Managers
AnnualImprovement Isolation Adjusted
Participant Value Basis for Value Confidence Factor Value
11 $36,000 Improvement in efficiency of group. 85% 50% $15,300$3,000 month × 12 (Group Estimate)
42 90,000 Turnover reduction. Two turnover 90% 40% 32,400statistics per year.Base salary × 1.5 = 45,000
74 24,000 Improvement in customer response time. 60% 55% 7,920(8 hours to 6 hours).Estimated value: $2,000/month
55 $2,000 5% improvement in my effectiveness 75% 50% 750($40,500 × 5%)
96 $10,000 Absenteeism reduction (50 absences 85% 75% 6,375per year × $200)
117 $8,090 Team project completed 10 days ahead 90% 45% 3,279of schedule. Annual salaries$210,500 = $809 per day × 10 days
118 159,000 Under budget for the year by this 100% 30% 47,700amount

184 THE HUMAN RESOURCES SCORECARD
Table 5-3Sample of Results from Performance Management Skills
Percentage ofImprovement
Terminal Attributed toin Performance Dollar
Division I Improvement Management Skills Value*
A To reduce high cost per 25% $6,928(C)bill caused by poor plan-ning on pickup anddelivery and low sales,manager installed jobmodels and feedbacksystems, coached super-visors and drivers, andpraised all employees forimproved performance.Cost per bill decreasedan average of $1.30.
B In new terminal with cost 10% 27,680(R)per bill running high,manager installed jobmodels and used coachingand rewards for super-visory, administrative, andsales staff. Terminal’sprofits increased from$43,253 to $49,024.
C Terminal had low bill 5% 800(C)count and high cost perbill. Manager installed jobmodels and feedbacksystems, and used inter-personal skills. Cost perbill decreased an averageof $1.79, over sameperiod before the program.
D Terminal had low bill 25% 9,856(C)count, which contributed

ISOLATING THE EFFECTS OF AN HR PROGRAM 185
This process has some disadvantages. It is an estimate, andconsequently, it does not have the accuracy desired by some HRmanagers. Also, the input data may be unreliable because someparticipants are incapable of providing these types of estimates.They might not be aware of exactly which factors contributedto the results.
to a high cost per bill.Manager installed jobmodels and feedbacksystems, and used rewardsand coaching with officestaff, supervisors, andsales representatives. Costper bill decreased anaverage of $0.92; numberof bills increased from7,765 to 9,405 per month.
E Terminal had low bill 50% 56,060(C)count and high cost perbill. Manager installed jobmodels and had his salesmanager and operationsmanager install job models,also. All managers usedrewards, coaching, andinterpersonal skills. Costper bill decreased from$22.49 to $21.00; numberof bills increased from11,716 to 12,974 per month.
F Terminal had rising cost 10% 5,754(C)per bill with a fluctuatingbill count. Manager usedjob models and feedbackreports. Cost per billdecreased from $17.13 to$15.46; number of billsrose from 6,160 to 7,357per month.
*(R) indicates a revenue gain; (C) indicates decreased costs.

186 THE HUMAN RESOURCES SCORECARD
Several advantages make this strategy attractive. It is a simpleprocess, easily understood by most participants and by otherswho review evaluation data. It is inexpensive, takes little timeand analysis, and thus results in an efficient addition to theevaluation process. Estimates originate from a credible source—the individuals who actually produced the improvement.
The advantages seem to offset the disadvantages. Isolating theeffects of human resource programs and initiatives will never beprecise. However, the participants’ estimate may be accurateenough for most clients and management groups. The process isappropriate when the participants are managers, supervisors, teamleaders, sales associates, engineers, and other professional andtechnical employees.
Supervisor Estimates
In lieu of, or in addition to, participant estimates, the par-ticipants’ supervisors may be asked to provide the extent of HR’srole in influencing organization improvement. In some settings,participants’ supervisors may be more familiar with the otherinfluential factors. Consequently, they may be better equipped toprovide estimates of impact. The recommended questions to asksupervisors, after describing the improvement caused by theparticipants, are:
Typical Questions to Ask Supervisors
1. What percent of the improvement in performancemeasures of the participant resulted from the HRprogram?
2. What is the basis for this estimate?3. What is your confidence in this estimate,
expressed as a percentage?4. What other factors could have contributed to
this success?5. Please list the factors with the estimates in the
table provided.6. What other individuals or groups would know
about this improvement and could estimate thispercentage?

ISOLATING THE EFFECTS OF AN HR PROGRAM 187
These questions are essentially the same ones described inthe participant’s questionnaire. Supervisor estimates should beanalyzed in the same manner as participant estimates. To be moreconservative, actual estimates may be adjusted by the confidencepercentage. When participants’ estimates have also been collected,the decision of which estimate to use becomes an issue. If thereis some compelling reason to think one estimate is more crediblethan the other, then the more credible one should be used. Themost conservative approach is to use the lowest value and includean appropriate explanation. Another potential option is to recog-nize that each source has its own unique perspective and that anaverage of the two is appropriate, placing an equal weight oneach input. If feasible, it is recommended that inputs be obtainedfrom both participants and supervisors.
An example will illustrate the process for both participantestimates and supervisor estimates. A restaurant chain imple-mented an HR program on performance management for managertrainees. The program was expected to teach participants howto establish measurable goals for employees, provide performancefeedback, measure progress toward goals, and take action toensure that goals are met. During the program, each managertrainee developed an action plan for improvement, using the skillstaught in the program. As part of the program, managers learnedhow to convert measurable improvements into an economic valuefor the restaurant. The action plan could focus on any improve-ment area as long as it was accompanied by skills acquiredin the program and was converted to either cost savings orrestaurant profits. Some of the improvement areas were inventory,food spoilage, cash shortages, employee turnover, absenteeism,and productivity.
As part of the follow-up evaluation, each action plan wasthoroughly documented showing results in quantitative terms,which were converted to monetary values. Realizing that otherfactors could have influenced the improvement, manager traineeswere asked to estimate the percent of improvement that resultedfrom the application of the skills acquired during the program.Each manager trainee was asked to be conservative with theestimates. The annual monetary value for each improvement foreach participant was calculated. Independently, restaurant managers(immediate supervisors) were asked to estimate, for each manager

188 THE HUMAN RESOURCES SCORECARD
trainee, what percentage of improvement came from the actionplan, which should be attributed to the performance managementprogram. The managers (in this case the restaurant managers,who were closely involved in the action planning process for thisprogram) usually are aware of factors that influence costs andprofits and usually know how much of an improvement is trace-able to the HR program. The results are shown in Table 5-4.
The estimate of HR’s impact can be calculated using theconservative approach of selecting the lower value. As an alter-native, the average value of the two can be used. The conservativeapproach yields an overall improvement of $78,905, whereas theaverage of the two percentages yields a value of $83,721. Par-ticipant 5 did not submit a completed action plan and wasdiscarded from the analysis, although the costs are still includedin the ROI calculation.
Another interesting observation emerges from this type ofanalysis. When the average of the three largest participant improve-ments is compared with the average of the three smallest values,important information is revealed about the potential for returnon investment (in this case, $21,667 compared with $1,947,before adjustments). If all the participants focused on high-impactimprovements, a substantially higher ROI could have been achieved.This can be helpful information for the management group, whosesupport is often critical to the success of programs. Although animpressive ROI is refreshing, a potentially much greater ROIis outstanding.
This approach has the same disadvantages as participant esti-mates. It is subjective and, consequently, may be viewed withskepticism by senior management. Also, supervisors may bereluctant to participate or may be incapable of providing accurateimpact estimates. In some cases they may not know about otherfactors that contributed to the improvement.
The advantages of this approach are similar to the advantagesof participant estimation. It is simple and inexpensive and enjoysan acceptable degree of credibility because it comes directly fromthe supervisors of those individuals involved in the implementa-tion of the HR program. When combined with participant estima-tion, the credibility is enhanced considerably. Also, when factoredby the level of confidence, its value further increases.

ISO
LAT
ING
TH
E EFFE
CT
SO
FA
N H
R P
RO
GR
AM
189
Table 5-4Estimates of Training Impact from Participants and Supervisors
PercentEstimate Percent
from Estimate Average Improvement Manager from Store Conservative Value
Participant (Dollar Value) Basis Trainees Managers Integration Integration
1 $5,500 Labor Savings 60% 50% $2,750 $3,0252 15,000 Turnover 50% 40% 6,000 6,7503 9,300 Absenteeism 65% 75% 6,045 6,5104 2,100 Shortages 90% 80% 1,680 1,7855 0 — — — —6 29,000 Turnover 40% 50% 11,600 13,0507 2,241 Inventory 70% 100% 1,569 1,9058 3,621 Procedures 100% 90% 3,259 3,4409 21,000 Turnover 75% 70% 14,700 15,225
10 1,500 Food Spoilage 100% 100% 1,500 1,50011 15,000 Labor Savings 80% 70% 10,500 11,25012 6,310 Accidents 70% 75% 4,417 4,57513 14,500 Absenteeism 80% 75% 11,600 11,23814 3,650 Productivity 100% 90% 3,285 3,468
Total $128,722 $78,905 $83,721

190 THE HUMAN RESOURCES SCORECARD
Management Estimates
In some cases, upper management may estimate the percent ofimprovement that should be attributed to the HR program. Forexample, in Litton Guidance and Control Systems, the resultsfrom a self-directed team process were adjusted by management[10]. After considering additional factors—such as technology,procedures, and process changes—that could have contributed tothe improvement, management then applied a subjective factor,in this case 60 percent, to represent the portion of the resultsthat should be attributed to the self-directed team process designedby HR. The 60 percent factor was developed in a meeting withtop managers and therefore had the benefit of group ownership.Although this process is very subjective, the input is received fromthe individuals who often provide or approve funding for HRprograms. Sometimes their level of comfort with the process isthe most important consideration.
Customer Input
Another helpful approach in some narrowly focused situationsis to solicit input about the impact of HR initiatives directly fromcustomers. In these situations, customers are asked why theychose a particular product or service, or to explain how theirreaction to the product or service has been influenced by indi-viduals applying skills and abilities influenced by an HR program.This strategy focuses directly on what the improvement programis often designed to improve. For example, after a teller trainingprogram was conducted after a bank merger, market research datashowed that the percentage of customers who were dissatisfiedwith teller knowledge had been reduced by 5 percent whencompared with market survey data before training [11]. Becauseteller knowledge was increased by training, the 5 percent reduc-tion of dissatisfied customers was directly attributable to thetraining program.
In another example, the HR department of a large telecom-munication company developed and implemented a knowledgemanagement program for HR staff members, focusing on internalcustomer engagements. As internal customers used HR’s services,they benefited from the HR staff’s greater knowledge of the core

ISOLATING THE EFFECTS OF AN HR PROGRAM 191
business, understanding of issues, and turnaround time to defineand recommend HR solutions. A follow-up survey administeredby HR revealed significant improvements in the relationshipwith the HR staff and their internal customer. Knowledge aboutthe “core business” and “turnaround time” were ranked veryhigh as reasons for improved service by HR. Customers’ surveyresponses to the HR staff’s level of knowledge and related questionsprovided evidence of the improved service attributed to theknowledge management program.
Expert Estimation
External or internal experts can sometimes estimate the portionof results that can be attributed to human resource programs.When using this strategy, experts must be carefully selected basedon their knowledge of the process, program, and situation. Forexample, an expert in quality in the electric utility industry mightbe able to provide estimates of how much change in a qualitymeasure can be attributed to the HR component of a TQMprogram and how much can be attributed to other factors in theimplementation of a TQM program.
An example will illustrate this process. A well-respected qualitymanager of a large southeastern utility used a control grouparrangement when implementing a TQM initiative. The HRcomponent included team restructuring and training. Six monthsafter the TQM implementation, the control group results deter-mined that the HR component generated a 12 percent increasein quality, caused by less waste and rework. Given this value,implementation should result in a 12 percent improvement inanother electric utility with a similar target audience involvingthe same job functions and type of HR program. Although thesituation can vary considerably, this is an approximate value touse in comparison. If more than 12 percent was achieved, theadditional amount could be caused by a factor other than theHR program. Experts, consultants, or researchers are usuallyavailable for almost any field. They can bring their experiencewith similar situations into the analysis.
This approach does have disadvantages. It can be inaccurateunless the program and setting in which the estimate is made isvery similar to the program in question. Also, this approach may

192 THE HUMAN RESOURCES SCORECARD
lose credibility because the estimates come from external sourcesand may not necessarily involve those who are close to the process.
This process has an advantage in that its credibility oftenreflects the reputation of the expert or independent consultant.It is a quick source of input from a reputable expert or inde-pendent consultant. Sometimes top management will place moreconfidence in external experts than its own internal staff.
Subordinate Input of HR Program Impact
In some situations, the subordinates of managers and super-visors being trained or being asked to support and implement anew policy/procedure will provide input concerning the extent ofimpact. Although they will not usually be able to estimate howmuch of an improvement can be attributed to the HR programor a policy change, they can provide input in terms of what otherfactors might have contributed to the improvement. This approachis appropriate in programs in which leaders, supervisors, andmanagers are implementing work unit changes or in which theyare the conduit for implementation of HR policy and procedures.Improvements are realized through the supervisors’ use of the newskills or actions regarding a policy/procedure. Each supervisor’semployees provide input about changes that have occurred sincethe HR program was implemented or since the HR policy/procedurewas implemented. They help determine the extent to which otherfactors have changed in addition to supervisor behavior.
Subordinate input is usually obtained through surveys orinterviews. When the survey results show significant changes insupervisor behavior after implementation of an HR program orpolicy and no significant change in the general work climate, theimprovement in work performance, therefore, must be attributedto the changes in supervisor behavior because other factorsremained constant.
An example illustrates this process. In a human resourceprogram designed to improve performance of work units throughenhancing supervisory skills, significant results were obtained atCIGNA, a large insurance company [12]. After the HR programwas conducted, action plans were developed, and the supervisorsreported significant improvements in the performance of theirwork units. To isolate the impact of the HR program, pre and

ISOLATING THE EFFECTS OF AN HR PROGRAM 193
post survey data were taken with the employees to determine theextent of changes in supervisor behavior and the general climate.The survey consisted of 36 Likert-type, five-point scale items thatwere used to create seven different indices. Six of these indicesmeasured the supervisor’s behavior, and the seventh measuredgeneral organizational climate for which the supervisor was notnecessarily responsible. The survey results showed significantdifferences in supervisor behavior before and after HR programimplementation. The results did not, however, show a significantchange in the general climate. Therefore, the improvement inwork performance was attributed to the changes in supervisorbehavior because other factors appeared to remain constant.
This approach has some disadvantages. Data from subordinatesare subjective and may be questionable because of the possibilityfor biased input. Also, in some cases the subordinates may havedifficulty determining changes in the work climate. This approachdoes offer a useful way to isolate the impact of the program fromother influences. In some cases, subordinates are aware of thefactors that caused changes in their work units, and they canprovide input about the magnitude or quantity of these changes.When combined with other methods that isolate impact, thisprocess has increased credibility.
Calculating the Impact of Other Factors
Although not appropriate in all cases, in some situations it maybe feasible to calculate the impact of factors (other than HRinitiatives) that influenced the improvement and then concludethat the HR program is credited with the remaining portion. Inthis approach, HR takes credit for improvement that cannot beattributed to other factors.
An example will help explain the approach. In a consumerlending program for a large bank, a significant increase in con-sumer loan volume was generated after an incentive plan wasinstalled for consumer loan officers. Part of the increase involume was attributed to the incentive plan, and the remainingwas caused by the influence of other factors operating during thesame time period. Two other factors were identified by theevaluator: A loan officer’s production improved with time, andfalling interest rates caused an increase in consumer volume.

194 THE HUMAN RESOURCES SCORECARD
In regard to the first factor, as loan officers make loans, theirconfidence improves. They use consumer lending policy manualsand gain knowledge and expertise through trial and error. Theamount of this factor was estimated by using input from severalinternal experts in the marketing department.
For the second factor, industry sources were used to estimatethe relationship between increased consumer loan volume andfalling interest rates. These two estimates together accounted fora certain percent of increased consumer loan volume. The remain-ing improvement was attributed to the HR incentive plan.
This method is appropriate when the other factors are easilyidentified and the appropriate mechanisms are in place to cal-culate their impact on the improvement. In some cases it is justas difficult to estimate the impact of other factors as it is forthe impact of the HR program/initiative, leaving this approachless advantageous. This process can be very credible if the methodused to isolate the impact of other factors is credible.
USING THE STRATEGIES
With ten strategies available that isolate the impact of HRprograms, selecting the most appropriate strategies for the specificprogram can be difficult. Some strategies are simple and inexpen-sive, while others are more time consuming and costly. Whenattempting to make the selection decision, several factors shouldbe considered:
� feasibility of the strategy� accuracy provided with the strategy� credibility of the strategy with the target audience� specific cost to implement the strategy� the amount of disruption in normal work activities as the
strategy is implemented� participant, staff, and management time needed for a par-
ticular strategy to be successful
Multiple strategies or multiple sources for data input shouldbe considered because two sources are usually better than one.When multiple sources are used, a conservative method is recom-mended to combine the inputs. A conservative approach builds

ISOLATING THE EFFECTS OF AN HR PROGRAM 195
acceptance. The target audience should always be provided withexplanations of the process and the various subjective factorsinvolved. Multiple sources allow an organization to experimentwith different strategies and build confidence with a particularstrategy. For example, if management is concerned about theaccuracy of participants’ estimates, a combination of a controlgroup arrangement and participants’ estimates could be attemptedto check the accuracy of the estimation process.
It is not unusual for the ROI of HR initiatives to be extremelylarge. Even when a portion of the improvement is allocated toother factors, the numbers are still impressive in many situations.The audience should understand that, although every effort ismade to isolate the impact, it is still a figure that is not preciseand may contain error. It represents the best estimate of theimpact given the constraints, conditions, and resources available.Chances are it is more accurate than other types of analysesregularly used in other functions within the organization.
CONCLUSION
This chapter presented a variety of strategies that isolate theeffects of HR programs. The strategies represent the most effec-tive approaches to address this issue and are used by some ofthe most progressive organizations. Too often, results are reportedand linked with HR programs without any attempt to isolate theportion of results that can be attributed to HR. If the HRfunction is to continue to improve its professional image as wellas to meet its responsibility for obtaining results, this issue mustbe addressed early in the process.
REFERENCES
1. Phillips, J. J. “Was It the Training?” Training and Development,March 1996, pp. 28–32.
2. Phillips, J. “Return on Investment—Beyond the Four Levels.” Academyof HRD 1995 Conference Proceedings. E. Holton (Ed.), 1995.
3. Alliger, G. M., and Janak, E. A. “Kirkpatrick’s Levels of TrainingCriteria: Thirty Years Later.” Personnel Psychology, Vol. 42, 1989,pp. 331–342.
4. Pine, J., and Tingley, J. C. “ROI of Soft Skills Training.” Training,February 1993, pp. 55–66.

196 THE HUMAN RESOURCES SCORECARD
5. Hassett, J. “Simplifying ROI.” Training, September 1992, p. 54.6. This brief example is taken from a case in which the company
preferred not to be identified.7. This brief example is taken from a very complicated case. Some
of the values have been changed, and the case has been simplifiedto enhance the understanding of this process.
8. For additional information, see: Makridakis, S. Forecasting Methodsfor Management, 5th ed. New York: Wiley, 1989.
9. Zigon, J. “Performance Management Training,” in In Action:Measuring Return on Investment, Vol. 1. Phillips, J. J. (Ed.)Alexandria, Va.: American Society for Training and Development,1994, pp. 253–270.
10. Graham, M., Bishop, K., and Birdsong, R. “Self-Directed WorkTeams,” in In Action: Measuring Return on Investment, Vol. 1.Phillips, J. J. (Ed.) Alexandria, Va.: American Society for Trainingand Development, 1994, pp. 105–122.
11. Rust, R. T., Zahorik, A. J., and Keiningham, T. L. Return onQuality: Measuring the Financial Impact of Your Company’s Questfor Quality. Chicago: Probus Publishers, 1994.
12. Kirkpatrick, D. L. “The Bottom Line: CIGNA Corporation.”Evaluating Training Programs. San Francisco: Berrett-Koehler, 1994,pp. 190–206.

197
Chapter 6
Converting Data toMonetary Value
Traditionally, impact studies concludes with a tabulation ofbusiness results, which is a Level 4 evaluation. In those situations,the program is considered successful if it produced improvementssuch as quality enhancements, reduced absenteeism, or improvedcustomer satisfaction. Although these results are important, it ismore insightful to compare the monetary value of the results withthe cost of the HR program. This evaluation is the ultimate levelin the five-level evaluation framework presented in Chapter 1.This chapter shows how leading organizations are moving beyondtabulating business results to converting data to monetary value,a necessary step to calculate a return on investment (Level 5).

198 THE HUMAN RESOURCES SCORECARD
Chapter 1 presented the process of calculating the ROI, Chap-ter 2 focused on the initial analysis and on planning the evalua-tion, and Chapters 3 and 4 outlined the methods used to collectdata. Chapter 5 described a variety of strategies to isolate theeffects of HR programs from other factors. This chapter presentsa variety of techniques to convert data to monetary benefits.
PRELIMINARY ISSUES
Sorting Hard and Soft Data
After collecting performance data, many organizations find ithelpful to divide data into hard and soft categories as explainedin Chapter 4. Hard data are the traditional measures of organi-zational performance because they are objective, easy to measure,and easy to convert to monetary values. Hard data are often verycommon measures, achieve high credibility with management, andare available in every type of organization.
Hard data represent the output, quality, cost, and time, ofwork-related processes. Almost every department or unit will havehard data performance measures. For example, a governmentoffice approving applications for work visas in a foreign countrywill have these four measures among its overall performancemeasurement: the number of applications processed (output), thetime it takes to process and approve an application (time), costper application processed (cost), and the number of errors madeprocessing applications (quality). Ideally, HR programs for employeesin this office should be linked to one or more hard data measures.
Because many HR programs are designed to influence softvariables, soft data are needed in evaluation. Soft data are usuallysubjective, sometimes difficult to measure, almost always difficultto convert to monetary values, and behaviorally oriented. Whencompared with hard data, soft data usually have less credibilityas a performance measure. Soft data items can be grouped intoseveral categories as illustrated in Chapter 4.
General Steps to Convert Data
Before describing the specific strategies to convert hard and softdata to monetary values, this section summarizes the general steps

CONVERTING DATA TO MONETARY VALUE 199
used to convert data in each strategy. These steps should befollowed for each data conversion.
Focus on a unit of measure. First, identify a unit of improve-ment. For output data, the unit of measure is the item produced,service provided, or sale consummated. Time measures vary andinclude items such as the time to complete a project, cycle time,and customer response time. The unit is usually expressed asminutes, hours, or days. Quality is a common measure, and theunit may be one error, reject, defect, or rework item. Soft datameasures vary, and the unit of improvement may include itemssuch as a grievance, an absence, an employee turnover statistic,or a one-point change in the customer satisfaction index.
Determine a value for each unit. Place a value (V) on the unitidentified in the first step. For measures of production, quality,cost, and time, the process is relatively easy. Most organizationshave records or reports reflecting the value of items such as oneunit of production or the cost of a defect. Soft data are moredifficult to convert to a value because the cost of one absence,one grievance, or a one-point change in the employee attitudesurvey is often difficult to pinpoint. The ten strategies in thischapter provide an array of techniques to make this conversion.When more than one value is available, either the most credibleor the lowest, most conservative value should be used.
Calculate the change in performance data. Calculate the changein output data after the effects of the HR program have beenisolated from other influences. The change (∆P) is the perfor-mance improvement, measured as hard or soft data, that isdirectly attributable to an HR program. The value may representthe performance improvement for an individual, a team, a group,or several groups of participants.
Determine an annual amount for the change. Annualize the ∆Pvalue to develop a total change in the performance data for oneyear. This procedure has become a standard approach with manyorganizations that wish to capture the total benefits of an HRprogram. Although the benefits may not be realized at the samelevel for an entire year, some programs will continue to producebenefits beyond one year. Therefore, using one year of benefitsis considered a conservative approach.
Calculate the total value of the improvement. Develop the totalvalue of improvement by multiplying the annual performance

200 THE HUMAN RESOURCES SCORECARD
change (∆P) by the unit value (V) for the complete group inquestion. For example, if one group of participants for a programis being evaluated, the total value will include total improvementfor all participants in the group. This value for annual programbenefits is then compared with the cost of the program, usuallythrough the return on investment formula presented in Chapter 1.
STRATEGIES FOR CONVERTING DATA
TO MONETARY VALUES
An example taken from a grievance reduction program at amanufacturing plant describes the five-step process of convertingdata to monetary values. This program was developed andimplemented after a needs assessment revealed that a lack ofcooperation between management and labor leadership wascausing an excessive number of grievances. Thus, the actualnumber of grievances resolved at Step 2 in the grievance processwas selected as an output measure. Table 6-1 shows the stepstaken to assign a monetary value to the data for a total programimpact of $546,000.
Ten strategies are available to convert data to monetary values.Some strategies are appropriate for a specific type of data or datacategory, and other strategies can be used with virtually any typeof data. The HR staff’s challenge is to select the particularstrategy that best matches the type of data and situation. Theten strategies are presented next, beginning with the first three,which apply to hard data. The remaining seven are listed begin-ning with the most credible approach to convert soft data.
CONVERTING OUTPUT DATA TO CONTRIBUTION
When an HR program has produced a change in output, the valueof the increased output can usually be determined from the organi-zation’s accounting or operating records. For organizations operatingon a profit basis, this value is usually the marginal profit con-tribution of an additional unit of production or unit of serviceprovided. For example, HR partnered with a production team of amajor appliance manufacturer and was able to boost production ofsmall refrigerators with a series of comprehensive HR programs.The unit of improvement, therefore, was the profit margin ofone refrigerator. In organizations that are performance- rather

CONVERTING DATA TO MONETARY VALUE 201
Table 6-1An Example to Illustrate Steps to Convert
Data to Monetary Values
Setting: Grievance Reduction Programin a Manufacturing Plant
Step 1 Focus on a Unit of Improvement
The unit of improvement chosen was one grievance thatreached Step 2 in the four-step grievance resolution process.
Step 2 Determine a Value of Each Unit
Using internal experts, the labor relations staff, the cost ofan average grievance was estimated to be $6,500 whenconsidering time and direct costs (V = $6,500).
Step 3 Calculate the Change in Performance Data
Six months after the program was completed, totalgrievances reaching Step 2 declined by ten per month.Supervisors determined that seven of the ten grievancereductions related to the program (supervisor estimates usedhere to isolate the effects of the HR program).
Step 4 Determine an Annual Amount for the Change
Using the six-month value (seven per month) yields anannual improvement of eighty-four (∆P = 84).
Step 5 Calculate the Annual Value of the Improvement
Annual Value = ∆P times V= 84 times $6,500= $546,000
than profit-driven, this value is usually reflected in the savingsaccumulated when an additional unit of output is realized for thesame input requirements. For example, a visa section of a govern-ment office processed an additional visa application at no additionalcost. Thus, an increase in output translated into a cost savings equalto the unit cost of processing a visa.
The formulas and calculations used to measure this contri-bution depend on the organization and its records. Most organi-zations have this type of data readily available for performance

202 THE HUMAN RESOURCES SCORECARD
monitoring and goal setting. Managers often use marginal coststatements and sensitivity analyses to pinpoint the value asso-ciated with changes in output. If the data are not available, theHR staff must initiate or coordinate the development of appro-priate values.
In one case involving a commercial bank, a sales seminarconducted for consumer loan officers resulted in additionalconsumer loan volume (output) [1]. To measure the return oninvestment in the program, it was necessary to calculate the value(profit contribution) of one additional consumer loan. This wasa relatively easy item to calculate from the bank’s records. Asshown in Table 6-2, several components went into this calculation.
The first step was to determine the yield, which was availablefrom bank records. Next, the average spread between the costof funds and the yield received on the loan was calculated. Forexample, the bank could obtain funds from depositors at 5.5percent on average, including the cost of operating the branches.The direct costs of making the loan, such as salaries of employeesdirectly involved in consumer lending and advertising costs forconsumer loans, had to be subtracted from this difference. His-torically, these direct costs amounted to 0.82 percent of the loanvalue. To cover overhead costs for other corporate functions, anadditional 1.61 percent was subtracted from the value. Theremaining 1.82 percent of the average loan value represented thebank’s profit margin on a loan.
Table 6-2Loan Profitability Analysis
Profit Component Unit Value
Average loan size $15,500
Average loan yield 9.75%
Average cost of funds (including branch costs) 5.50%
Direct costs for consumer lending 0.82%
Corporate overhead 1.61%
Net Profit Per Loan 1.82%

CONVERTING DATA TO MONETARY VALUE 203
CALCULATING THE COST OF QUALITY
Quality is a critical issue, and its cost is an important measurein most manufacturing and service firms. Because many HRprograms are designed to improve quality, the HR staff mustplace a value on the improvement in certain quality measures.For some quality measures, the task is easy. For example, ifquality is measured with a defect rate, the value of the improve-ment is the cost to repair or replace the product. The mostobvious cost of poor quality is the scrap or waste generated bymistakes. Defective products, spoiled raw materials, and discardedpaperwork all result from poor quality. This scrap and wastetranslates directly into a monetary value. For example, in aproduction environment, the cost of a defective product is thetotal cost incurred to the point when the mistake is identifiedminus the salvage value.
Employee mistakes and errors can cause expensive rework. Themost costly rework occurs when a product is delivered to acustomer and must be returned for correction. The cost of reworkincludes both labor and direct costs [2]. In some organizations,the cost of rework can be as much as 35 percent of operatingcosts. In one example of an HR program involving problemsolving and team building for dispatchers in an oil company, ameasure of rework was the number of pullouts [3]. A pulloutoccurred when a delivery truck could not fill an order for fuelat a service station. The truck returned to the terminal for anadjustment to the order. The average cost of the pullout wasdeveloped by tabulating the cost of a sample of actual pullouts.The cost elements included driver time involved, the cost of thetruck, the cost of terminal use, and an estimate of administra-tive costs.
Perhaps the costliest element of poor quality is customer andclient dissatisfaction. In some cases, serious mistakes can resultin lost business. Customer dissatisfaction is difficult to quantify,and attempts to arrive at a monetary value may be impossibleusing direct methods. Usually the judgment and expertise of sales,marketing, or quality managers are the best sources by which totry to measure the impact of dissatisfaction. A growing numberof quality experts now measure customer and client dissatisfactionwith market surveys [4]. However, other strategies discussed in

204 THE HUMAN RESOURCES SCORECARD
this chapter may be more appropriate to measure the cost ofcustomer dissatisfaction.
CONVERTING EMPLOYEE TIME
Reduction in employee time is a common objective of HRprograms. In a team environment, a program could enable theteam to perform tasks in a shorter time frame or with fewerpeople. On an individual basis, time management workshops aredesigned to help professional, sales, supervisory, and managerialemployees save time in performing daily tasks. The value of thetime saved is an important measure of the program’s success, andthis conversion is a relatively easy process.
The most obvious time savings come from labor reduction costsin performing work. The monetary savings are found by multi-plying the hours saved times the labor cost per hour. For example,after attending a time-management training program called PriorityManager, participants estimated that each participant saves anaverage of seventy-four minutes per day, worth $31.25 per dayor $7,500 per year [5]. This time savings was based on theaverage salary plus benefits for the typical participant.
The average wage with a percent added for employee benefitswill suffice for most calculations. However, employee time maybe worth more. For example, additional costs of maintaining anemployee (office space, furniture, telephone, utilities, computers,secretarial support, and other overhead expenses) could be includedin the average labor cost. Thus, the average wage rate mayquickly escalate to a large number. However, the conservativeapproach is to use the salary plus employee benefits.
In addition to the labor cost per hour, other benefits can resultfrom a time savings. These include improved service, avoidanceof penalties for late projects, and the creation of additionalopportunities for profit. These values can be estimated using othermethods discussed in this chapter.
A word of caution is in order when the time savings aredeveloped. Time savings are only realized when the amount oftime saved translates into a cost reduction or profit contribution.If an HR program results in a savings in manager time, a monetaryvalue is realized only if the manager used the additional time ina productive way. If a team-based program generates a new

CONVERTING DATA TO MONETARY VALUE 205
process that eliminates several hours of work each day, theorganization will realize actual savings only if there is a costsavings from a reduction in employees or a reduction in overtimepay. Therefore, an important preliminary step in developingtime savings is to determine if the organization will realize a“true” savings.
HISTORICAL COSTS
Sometimes historical records contain the value of a measurein and reflect the cost (or value) of a unit of improvement. Thisstrategy involves identifying the appropriate records and tabulat-ing the actual cost components for the item in question. Forexample, a large construction firm implemented a safety awarenessprogram to improve safety performance. The program improvedseveral safety-related performance measures, ranging from OSHAfines to total worker compensation costs. Examining the com-pany’s records using one year of data, the HR staff calculatedthe average cost for each safety measure.
Historical data are usually available for most hard data.Unfortunately, this is generally not true for soft data, and there-fore other strategies, explained in this chapter, must be employedto convert the soft data to monetary values.
INTERNAL AND EXTERNAL EXPERTS’ INPUT
When faced with converting soft data items for which historicalrecords are not available, it might be feasible to consider usinginput from people who are experts in the processes that areinfluenced by the HR solution. With this approach, internalexperts provide the cost (or value) of one unit of improvement.Those individuals who have knowledge of the situation as wellas the respect of the management group often make the bestprospects for expert input. These experts must understand theprocesses and be willing to provide estimates, as well as theassumptions used in arriving at the estimates. When requestinginput from these individuals, it is best to explain the full scopeof what is needed, providing as many specifics as possible. Mostexperts have their own methodology to develop this value. Forexample, when a quality network workshop was conducted to

206 THE HUMAN RESOURCES SCORECARD
analyze ways to reduce downtime for pattern changes in anautomotive engine casting plant, the downtime was reduced fromfourteen minutes to eleven minutes. The HR team conducting theworkshop used the chief financial officer (CFO) as an internalexpert to place a value on downtime. The CFO used his ownmethodology to provide a value of $223.75 for each minute ofdowntime. This can be a very credible number because the valueis probably also used for other reporting situations.
An example will help clarify this approach. In one manu-facturing plant, a team-building program was designed to reducethe number of grievances filed at Step 2. (This is the step inwhich the grievance is recorded in writing and becomes a measur-able soft data item.) Except for the actual cost of settlements anddirect external costs, the company had no records of the totalcosts of grievances (that is, there were no data regarding the timerequired to resolve a grievance). Therefore, an estimate wasneeded from an expert. The manager of labor relations, who hadcredibility with senior management and thorough knowledge ofthe grievance process, provided an estimate of the cost. He basedhis estimate on the average settlement when a grievance was lost;the direct costs related to the grievances (arbitration, legal fees,printing, research); the estimated amount of supervisory, staff, andemployee time associated with the grievance; and a factor forreduced morale. This internal estimate, although not a precisefigure, was appropriate for this analysis and had adequate credibilitywith management.
When internal experts are not available, external experts aresought. External experts must be selected based on their experiencewith the unit of measure. Fortunately, many experts are availablewho work directly with important measures such as employeeattitudes, customer satisfaction, turnover, absenteeism, and griev-ances. They are often willing to provide estimates of the cost (orvalue) of these items. Because the credibility of the value isdirectly related to his or her reputation, the credibility andreputation of the expert are critical.
VALUES FROM EXTERNAL DATABASES
For some soft data items, it may be appropriate to use esti-mates of the cost (or value) of one unit based on the research of

CONVERTING DATA TO MONETARY VALUE 207
others. This strategy taps external databases that contain studiesand research projects focusing on the cost of data items. For-tunately, many databases are available that report cost studies ofa variety of data items related to HR programs. Data are avail-able regarding the cost of turnover, absenteeism, grievances,accidents, and even customer satisfaction. The difficulty lies infinding a database with studies or research efforts for a situationsimilar to the program under evaluation. Ideally, the data wouldcome from a similar setting in the same industry, but that is notalways possible. Sometimes data about all industries or organi-zations would be sufficient, perhaps with an adjustment to fit theindustry under consideration.
An example illustrates the use of this process. An HR programwas designed to reduce turnover of branch managers in a financialservices company [6]. To complete the evaluation and calculatethe ROI, the cost of turnover was needed. To develop the turn-over value internally, several costs would have to be identified,including the cost of recruiting, employment processing, orienta-tion, training new managers, lost productivity while a newmanager is trained, quality problems, scheduling difficulties, andcustomer satisfaction problems. Additional costs include regionalmanager time to work with the turnover issues and, in somecases, exit costs of litigation, severance, and unemployment.Obviously, these costs are significant. HR managers may not havethe time to calculate the cost of turnover, particularly when it isneeded for a one-time event such as evaluating a training program.In this example, turnover cost studies in the same industry placedthe value at about 1 1
2 times the average annual salaries of theemployees. Most turnover cost studies report the cost of turnoveras a multiple of annual base salaries. In this example, managementdecided to be conservative and adjusted the value downward toequal the average annual base salary of branch managers.
PARTICIPANT ESTIMATES
In some situations, program participants estimate the value ofa soft data improvement. This strategy is appropriate whenparticipants can provide estimates of the cost (or value) of theunit of measure improved by implementation of the HR program.When using this approach, participants should receive clear

208 THE HUMAN RESOURCES SCORECARD
instructions, along with examples of the type of informationneeded. The advantage of this approach is that the individualsclosest to the improvement often can provide the most reliableestimates of its value.
An example illustrates this process. An absenteeism reductionprogram including policies and practices was implemented for agroup of supervisors. The program/process was designed to lowerthe absenteeism rate of the employees in their work units. Suc-cessful application of the policies and practices was expected toresult in a reduction in absenteeism. To calculate the ROI for theprogram, it was necessary to determine the average value of oneabsence in the company. As is the case with most organizations,historical records for the cost of absenteeism were not available.Experts were not available, and external studies were sparse forthis particular industry. Consequently, supervisors (programparticipants) were asked to estimate the cost of an absence. In agroup-interview format, each participant was asked to recall thelast time an employee in his or her work group was unexpectedlyabsent and to describe what was necessary to compensate for theabsence. Because the impact of an absence varies considerablyfrom one employee to another within the same work unit, thegroup listened to all explanations. After reflecting on what mustbe done when an employee is absent, each supervisor was askedto provide an estimate of the average cost of an absence in thecompany. During such a process, some supervisors will likely feelreluctant to provide estimates, but with prodding and encourage-ment they will usually provide a value. The values are thenaveraged for the group, and the result is the cost of an absenceto be used in evaluating the HR program in question. Althoughthis cost is an estimate, it is probably more accurate than datafrom external studies, calculations using internal records, orestimates from experts. And because it comes from super-visors who deal with the issue daily, it usually has credibility withsenior management.
SUPERVISOR ESTIMATES
In some situations, participants may be incapable of placing avalue on the improvement. Their work may be so far removedfrom the output of the process that they cannot reliably provide

CONVERTING DATA TO MONETARY VALUE 209
estimates. In these cases, the team leaders, supervisors, or managersof participants may be capable of providing estimates. Conse-quently, they may be asked to provide a value for a unit ofimprovement linked to the program. For example, a trainingprogram for customer service representatives was designed toreduce customer complaints. Application of the skills and knowl-edge learned from the program resulted in a reduction in com-plaints, but the value of a single customer complaint was neededto determine the value of improvement. Although customerservice representatives had knowledge of some issues surroundingcustomer complaints, they were not well versed in the full impact,so their supervisors were asked to provide a value.
In other situations, supervisors are asked to review and approveparticipants’ estimates. For example, an HR program for terminalmanagers at Yellow Freight Systems involved the implementationof both a new performance appraisal process and training [7].After the program was completed, participants estimated the valueof their improvements that were directly related to their partici-pation in the program and the use of the new process. Theirimmediate managers then reviewed the estimates, as well as theprocess the participants used to arrive at the estimates. Super-visors could either confirm, adjust, or discard the values providedby the participants.
SENIOR MANAGER ESTIMATES
In some situations senior management provides estimates ofthe value of data. With this approach, senior managers interestedin the process or program are asked to place a value on theimprovement based on their perception of its worth. This approachis used when calculating the value is very difficult or when othersources of estimation are unavailable or unreliable. An exampleillustrates this strategy. A hospital chain was attempting toimprove customer satisfaction with several HR interventionsincluding internal policy changes related to performance standardsand a customer service training program for all employees. Theprogram was designed to improve customer service and thusimprove the external customer satisfaction index. To determinethe value of the program, a value for a unit of improvement (onepoint on the index) was needed. Because senior managers had

210 THE HUMAN RESOURCES SCORECARD
deep interest in improving the index, they were asked to provideinput regarding the value of one unit. In a regular staff meeting,each senior manager and hospital administrator was asked todescribe what it means for a hospital when the index increases.After some discussion, each individual was asked to provide anestimate of the monetary value gained when the index moves onepoint. Although initially reluctant to provide the information,with some encouragement the managers and administrators fur-nished values, which were then averaged. This resulted in anestimate of the worth of one unit of improvement, which wasused as a basis of calculating the benefit of the program. Althoughthis process is subjective, it does have the benefit of ownershipfrom senior executives, the same executives who approved theprogram budget.
HR STAFF ESTIMATES
The final strategy for converting data to monetary values isto use HR staff estimates. Using all the available information andexperience, the staff members most familiar with the situationprovide estimates of the value. For example, an international oilcompany created a dispatcher attendance program designed toreduce dispatcher absenteeism, along with other performanceproblems. The HR staff estimated the cost of an absence to be$200 [8]. This value was then used in calculating the savings forthe reduction of absenteeism after implementation for the dis-patchers. Although the staff may be capable of providing accurateestimates, this approach may be perceived as biased. It shouldbe used only when other approaches are not available.
SELECTING THE APPROPRIATE STRATEGY
With so many strategies available, the challenge is to select oneor more strategies appropriate for the situation. The followingguidelines can help determine the proper selection.
Use the strategy appropriate for the type of data. Some strategiesare designed specifically for hard data, while others are moreappropriate for soft data. Consequently, the actual type of datawill often dictate the strategy. Hard data, while always preferred,are not always available. Soft data are often required and thusmust be addressed with the strategies appropriate for soft data.

CONVERTING DATA TO MONETARY VALUE 211
Move from most accurate to least accurate strategies. The firstthree strategies in this chapter apply to hard data and should beused with the appropriate measure. The next seven strategiesapply to soft data. The seven strategies beginning with “HistoricalCosts” are presented in order of accuracy and credibility, begin-ning with the most accurate and credible. Working down the list,each of the seven strategies should be considered for its feasibilityin the situation. The strategy with the most accuracy is recom-mended, if it is feasible in the situation.
Consider availability and convenience when selecting strategy.Sometimes the availability of a particular source of data will drivethe selection. In other situations, the convenience of a techniquemay be an important factor in selecting the strategy.
When seeking estimates, use the source who has the broadestperspective on the issue. The person providing an estimate mustbe knowledgeable of the processes and the issues surrounding thevalue of the data.
Use multiple strategies when feasible. Sometimes it helps tohave more than one strategy for obtaining a value for the data.When multiple sources are available, more than one source shouldbe used as a comparison or to provide another perspective. Whenmultiple sources are used, the data must be integrated using aconvenient decision rule such as the lowest value. This is pre-ferred because of the conservative nature of the lowest value.
Minimize the amount of time required to select and implementthe appropriate strategy. As with other processes, it is importantto keep the amount of time invested as low as possible so thatthe total time and effort for the ROI does not become excessive.Some strategies can be implemented with less time than otherscan. Too much time at this step can dampen an otherwise enthu-siastic attitude about the process.
ACCURACY AND CREDIBILITY OF DATA
The Credibility Problem
The strategies presented in this chapter assume that each dataitem collected and linked with HR programs can be convertedto a monetary value. Although estimates can be developed usingone or more strategies, the process of converting data to monetaryvalues may lose credibility with the target audience, who may

212 THE HUMAN RESOURCES SCORECARD
doubt its use in analysis. Very subjective data, such as a changein employee morale or a reduction in the number of employeeconflicts, are difficult to convert to monetary values. The keyquestion for this determination is this: Could these results bepresented to senior management with confidence? If the processdoes not meet this credibility test, the data should not be con-verted to monetary values and instead should be listed as anintangible benefit. Other data, particularly hard data items, couldbe used in the ROI calculation, leaving the very subjective dataas intangible improvements.
The accuracy of data and the credibility of the conversionprocess are important concerns. HR professionals sometimesavoid converting data because of these issues. They feel morecomfortable reporting that an HR program reduced absenteeismfrom 6 percent to 4 percent without attempting to place a valueon the improvement. They assume that each person receiving theinformation will place a value on the absenteeism reduction.Unfortunately, the target audience may know little about the costof absenteeism and will usually underestimate the actual valueof the improvement. Consequently, some attempt should be madeto include this conversion in the ROI analysis.
How the Credibility of Data Is Influenced
When ROI data are presented to selected target audiences,credibility will be an issue. The following factors will influencethe degree to which the target audience believes the data.
Reputation of the source of data. The actual source of the datarepresents the first credibility issue. How credible is the individualor groups providing the data? Do they understand the issues? Arethey knowledgeable of all the processes? The target audienceoften places more credibility on data obtained from people whoare closest to the source of the actual improvement or change.
Reputation of the source of the study. The target audiencescrutinizes the reputation of the individual, group, or organizationpresenting the data. Does this source have a history of providingaccurate reports? Is the source unbiased with its analyses? Is itfair in its presentation of the data? Answers to these and otherquestions will form an impression about the reputation.
Motives of the evaluators. Do the individuals presenting thedata have an ax to grind? Do they have a personal interest in

CONVERTING DATA TO MONETARY VALUE 213
creating a favorable or unfavorable result? These issues will causethe target audience to examine the motives of those who con-ducted the study.
Methodology of the study. The audience will want to knowspecifically how the research was conducted. How were thecalculations made? What steps were followed? What processeswere used? A lack of information about the methodology willcause the audience to become suspicious of the results.
Assumptions made in the analysis. In many ROI studies,assumptions are made, and then calculations and conclusionsare based on these assumptions. What are the assumptions? Arethey standard? How do they compare with other assumptionsin other studies? How do they compare with assumptions madeby other business units or parts of the organization? Whenassumptions are omitted, the audience will substitute their ownoften-unfavorable assumptions.
Realism of the outcome data. Impressive ROI values couldcause problems. When outcomes appear unrealistic, the targetaudience may have difficulty believing them. Huge claims oftenfall on deaf ears, causing reports to be thrown away before theyare reviewed.
Types of data. Members of the target audience usually preferhard data. They are seeking business performance data tied tooutput, quality, costs, and time. These measures are usually easilyunderstood and closely related to organizational performance.Conversely, soft data are sometimes viewed suspiciously from theoutset because many senior executives are concerned about thedata’s soft nature and limitations on the analysis.
Scope of analysis. Is the scope of the analysis narrow? Does itinvolve just one group or all the employees in the organization?Limiting the study to a small group, or series of groups, ofemployees makes the process more accurate.
Collectively, these factors influence the credibility of an ROIimpact study and provide a framework from which to developthe ROI report. Thus, when considering each of the issues, thefollowing key points are suggested for an ROI impact study:
� Use the most credible and reliable source for estimates.� Present the material in an unbiased, objective way.� Fully explain the methodology used throughout the process,
preferably on a step-by-step basis.

214 THE HUMAN RESOURCES SCORECARD
� Define the assumptions made in the analysis, and comparethem with assumptions made in other similar studies.
� Consider factoring or adjusting output values when theyappear unrealistic.
� Use hard data when possible and combine with soft dataif available.
� Keep the scope of the analysis narrow. Conduct the impactwith one or more groups of participants in the program,instead of all participants or all employees.
Making Adjustments
Two potential adjustments should be considered before finaliz-ing the monetary value. In some organizations in which soft dataare used and values are derived with imprecise methods, seniormanagement is sometimes offered the opportunity to review andapprove the data. Because of the subjective nature of this process,management may factor (reduce) the data so that the final resultsare more credible. In one example, senior managers at LittonIndustries adjusted the value for the benefits derived from theimplementation of self-directed teams [9].
The other adjustment concerns the time value of money. Becausean investment in a program is made within one time period andthe return is realized in a later time period, a few organizationsadjust the program benefits to reflect the time value of money,using discounted cash flow techniques. The actual monetarybenefits of the program are adjusted for the time period duringwhich costs are incurred and benefits are realized (the return).The amount of this adjustment, however, is usually small com-pared with the typical benefits realized from HR programs.
CONCLUSION
In conclusion, organizations are attempting to be more aggres-sive when defining the monetary benefits of HR programs andprocesses. Progressive HR managers are no longer satisfied withreporting business performance results from HR interventions.Instead, they are taking additional steps to convert business resultsdata to monetary values and compare those values with the pro-gram’s cost, thereby obtaining an ultimate level of evaluation—the

CONVERTING DATA TO MONETARY VALUE 215
return on investment. This chapter presented ten strategies toconvert business results to monetary values, offering an array oftechniques to fit any situation and program.
REFERENCES
1. Phillips, J. J. “Measuring ROI in an Established Program,” in InAction: Measuring Return on Investment, Vol. 1. J. J. Phillips (Ed.)Alexandria, Va.: American Society for Training and Development,1994, pp. 187–198.
2. Seimke, R. “Cost of Quality: You Can Measure It.” Training, August1990, pp. 62–63.
3. Payne, Rebecca. “Improving Customer Service Skills,” in In Action:Measuring Return on Investment, Vol. 1. J. J. Phillips (Ed.)Alexandria, Va.: American Society for Training and Development,1994, pp. 169–186.
4. Rust, R. T., Zahorik, A. J., and Keiningham, T. L. Return onQuality: Measuring the Financial Impact of Your Company’s Questfor Quality. Chicago: Probus Publishers, 1994.
5. Stamp, D. The Workplace of the 21st Century. Bellevue, Wash.:Priority Management Systems, 1992.
6. Schoeppel, Cynthia. “Turning Down Manager Turnover,” in InAction: Measuring Return on Investment, Vol. 1. J. J. Phillips (Ed.)Alexandria, Va.: American Society for Training and Development,1994, pp. 213–222.
7. Zigon, J. “Performance Management Training,” in In Action: MeasuringReturn on Investment, Vol. 1 J. J. Phillips (Ed.) Alexandria, Va.:American Society for Training and Development, 1994, pp. 253–270.
8. Payne, Rebecca. “Improving Customer Service Skills,” in In Action:Measuring Return on Investment, Vol. 1 J. J. Phillips (Ed.) Alexandria,Va.: American Society for Training and Development, 1994, pp. 169–186.
9. Graham, M., Bishop, K., and Birdsong, R. “Self-Directed WorkTeams,” in In Action: Measuring Return on Investment, Vol. 1.J. J. Phillips (Ed.) Alexandria, Va.: American Society for Trainingand Development, 1994, pp. 105–122.

216 THE HUMAN RESOURCES SCORECARD
216
Chapter 7
Monitoring theCost of Human
Resource Programs
Tabulating program costs is an essential step in developing theROI calculation because this step produces the denominator inthe ROI formula. Paying attention to costs is just as importantas paying attention to benefits. In practice, however, costs areoften more easily captured than benefits. This chapter exploresthe costs accumulation and tabulation steps, outlining the specificcosts that should be captured and some economical ways inwhich they can be developed.

MONITORING THE COST OF HUMAN RESOURCE PROGRAMS 217
COST STRATEGIES
Importance of Costs
Capturing costs presents a challenge because the figures mustbe accurate, reliable, and realistic. Although most organizationsdevelop costs with much more ease than developing the economicvalue of the benefits, the true cost of an HR program often eludeseven some of the best organizations. Although the figure for thetotal HR direct budget usually can be easily developed, thedifficulty comes when attempting to determine the specific costsof a program, including the indirect costs related to it. To developa realistic ROI, costs must be accurate and credible. Otherwise,the painstaking difficulty and attention to the program benefitswill be wasted because of inadequate or inaccurate costs.
Pressure to Disclose All Costs
Today there is more pressure than ever before to report all HRprogram costs, or what are referred to as fully loaded costs. Thistakes the cost profile beyond the direct cost of HR programs andincludes the time participants take part in implementation meet-ings, information meetings, and training, including their benefitsand other overhead. For years, management has realized that HRprograms have many indirect costs. Now management is askingfor an accounting of these costs. Perhaps a situation that recentlydeveloped in state government best illustrates this point. The stateauditor audited the management controls of a large state agency.A portion of the audit focused on HR program costs. The fol-lowing comments come from the auditor’s report:
Costs tracked at the program level focus on direct or “hard”costs and largely ignore the cost of time spent participating inor supporting the HR program. The costs of participant time toprepare for and attend necessary sessions are not tracked. Forone series of programs, including such costs raised the totalprogram cost dramatically. The agency stated that the total two-year costs for the specific program was about $600,000. Thisfigure generally includes only direct costs and, as such, is sub-stantially below the costs of the time spent by staff in preparingfor and attending the program. When accounting for prework and

218 THE HUMAN RESOURCES SCORECARD
attendance, the figure comes to a total of $1.39 million. If thestatewide average of 45.5% for fringe benefits is considered,the total indirect cost of staff time to prepare for and attend theprogram becomes $2 million. Finally, if the agency’s direct costsof $600,000 are added to the $2 million total indirect cost justnoted, the total becomes over $2.6 million. Among other factorsthat would drive actual total costs higher still are:
� cost of travel, meals, and lodging for participants;� allocated salaries and fringes of staff providing admini-
strative and logistic support; and� opportunity costs of productivity lost by staff in doing
prework and attending the program.
Failure to consider all indirect or “soft” costs may expose theagency to non-compliance with the Fair Labor Standards Act(FLSA), particularly as the program expands through the organi-zation. Since FLSA requires that such staff be directly compensatedfor overtime, it is no longer appropriate for the agency to askemployees to complete prework on their own time. Continuingto handle such overtime work this way may also encourage falseovertime reporting, skew overtime data, and/or increase theamount of uncompensated overtime.
Numerous barriers exist to agency efforts at determining “Howmuch does the program cost?”:
� Cost systems tend to hide administrative, support, internal,and other indirect or “soft” costs.
� Costs generally are monitored at the division level ratherthan at the level of individual programs or activities.
� Cost information required by activity-based cost systems isnot being generated.
As this case vividly demonstrates, the cost of the program ismuch more than direct expenditures, and management expects theHR department to include fully loaded costs in their reports.
Fully Loaded Costs
To take the conservative approach to calculating the ROI, itis recommended that HR costs be fully loaded. With this approach,

MONITORING THE COST OF HUMAN RESOURCE PROGRAMS 219
all costs that can be identified and linked to a particular programare included. The philosophy is simple: When in doubt regardingthe denominator, put it in (that is, if it is questionable whethera cost should be included, it is recommended that the cost beincluded, even if the cost guidelines for the organization do notrequire it). When an ROI is calculated and reported to targetaudiences, the process should withstand even the closest scrutinyin terms of its accuracy and credibility. The only way to meetthis test is to ensure that all costs are included. Of course,from a realistic viewpoint, if the controller or chief financialofficer insists on not using certain costs, then it is best to leavethem out.
The Danger of Costs Without Benefits
It is dangerous to communicate the costs of an HR programto management without presenting the resulting benefits. Unfor-tunately, many organizations have fallen into this trap for years.Because they can easily collect costs, they present these costs tomanagement in all types of ingenious ways, such as cost of theprogram, cost per employee, and cost per development hour.Although these may be helpful for efficiency comparisons, pre-senting the costs without benefits may create trouble.
When most executives review HR costs, a logical questioncomes to mind: What benefit did the organization receive fromthe program? This is a typical management reaction, particularlywhen management perceives that costs are very high. For example,in one organization, all the costs associated with its executiveleadership programs were tabulated and reported to the seniormanagers to let them know the total investment in these pro-grams. The total figure exceeded the perceived value, and the topmanagement group immediately requested a summary of benefitsderived from these programs. This reaction initiated a review ofthe programs, with the conclusion that leadership developmentproduced little, if any, economic benefits. Consequently, theprograms were drastically reduced and revised.
Although this may be an extreme example, it shows the dangerof presenting only half the equation. Because of this danger, someorganizations have developed a policy of not communicating HRcost data unless the benefits can be captured and presented alongwith the costs. Even if the benefit data are subjective and intangible,

220 THE HUMAN RESOURCES SCORECARD
they are included with the cost data. This helps to keep balanceregarding these two issues.
Policies and Guidelines
Organizations may find it helpful to detail their philosophy andpolicy on costs by issuing a set of guidelines for the HR staffmembers and others who monitor and report costs. Cost guide-lines detail specifically what costs are included with HR programsand how the data are captured, analyzed, and reported. Costguidelines can range from a 1-page document in small organi-zations to a 100-page manual in a large, complex organization.The simpler approach is better. When fully developed, the financeand accounting staff should review the cost guidelines. The finaldocument serves as the guiding force in collecting, monitoring,and reporting costs. Then, when an ROI is calculated and reported,costs are included in summary form, and the cost guidelines arereferenced in a footnote or attached as an appendix.
Typical Cost Categories
The most important task in defining tasks is to define whichspecific costs should be included in a tabulation of the programcosts. This task involves decisions that will be made by the HRstaff and usually approved by management. If appropriate, thefinance and accounting staff may need to approve the list. Table7-1 shows the recommended cost categories for a fully loaded,conservative approach to estimating costs. Each category isdescribed below.
Prorated vs. Direct Costs
Usually all costs related to a program are captured and expensedto that program. However, three categories are usually proratedover several components of the same program. Needs analysis,design and development, and acquisition are all significant coststhat should be prorated over the life of the program. With aconservative approach, the life of the program should be veryshort. Some organizations will consider one year of operation forthe program; others may consider two or three years. If some ques-

MONITORING THE COST OF HUMAN RESOURCE PROGRAMS 221
Table 7-1Program Cost Categories
Cost Item Prorated Expensed
Analysis Costs ✓Development/Acquisition Costs ✓Implementation Costs ✓
� Salaries/Benefits—Facilitators ✓� Salaries/Benefits—Coordination ✓� Program Materials and Fees ✓� Travel/Lodging/Meals ✓� Facilities for Meetings/Training ✓� Participants’ Salaries/Benefits ✓� Participant Replacement Costs
(if applicable) ✓� Lost Production (explain basis) ✓
Operating Costs ✓� Salaries/Benefits—Participants and
Facilitators ✓� Salaries/Benefits—Program Coordination ✓ ✓� Salaries/Benefits—Program Manager ✓ ✓� Supplies, Materials, Equipment, Facilities ✓� Travel/Lodging/Meals ✓� Outside Services ✓ ✓
Evaluation ✓ ✓General Overhead Allocation ✓
tion exists about the specific time period to be used in the prorationformula, the finance and accounting staff should be consulted.
A brief example will illustrate the proration of developmentcosts. In a large utility company, an employee safety program wasdeveloped and implemented because of a series of accidentsduring the past several months. The program included changesin the procedure to put caution tags on dangerous equipmentduring outages. The program was developed at a cost of $195,000and was expected to have a three-year life cycle before it neededupdating. The revision costs at the end of the three years wereestimated to be about one-half of the original development costs,or $97,500. The program would be conducted with forty-two

222 THE HUMAN RESOURCES SCORECARD
groups in a three-year period, with an ROI calculation plannedfor one specific group. Because the program would have one-halfits residual value at the end of three years, one-half of the costshould be written off for this three-year period. Thus, the $97,500,representing half the development costs, would be spread overthe forty-two groups as a prorated development cost. Thus, anROI for one group would have a development cost of $2,321included in the cost profile.
Benefits Factor
When presenting participant salaries and salaries of staffassociated with programs, the benefits factor should be included.This number is usually well known in the organization and isused in other costing formulas. It represents the cost of allemployee benefits expressed as a percent of base salaries. In someorganizations this value is as high as 50 to 60 percent. In others,it may be as low as 25 to 30 percent. The average in the USA is38 percent [1].
MAJOR COST CATEGORIES
Analysis Costs
One of the most often overlooked cost categories is the costof conducting an analysis of needs. In some programs this costis zero because the program is conducted without an analysis.However, as more organizations focus increased attention onneeds analysis, this item will become a more significant cost inthe future. All costs associated with the analysis should becaptured to the fullest extent possible. These costs include thetime staff members spend conducting the analysis, direct fees andexpenses for external consultants who conduct the analysis, andinternal services and supplies used in the analysis. The total costsare usually prorated over the life of the program. Depending onthe type and nature of the program, the program life should bekept to a reasonable number, in the one- to three-year time frame.Of course the exception would be exceedingly expensive programsthat are not expected to change significantly for several years.

MONITORING THE COST OF HUMAN RESOURCE PROGRAMS 223
Development/Acquisition Costs
One of the more significant cost categories is the cost ofdesigning and developing the program. This cost includes internalHR staff time in both design and development, as well as thepurchase of supplies, videos, CD-ROMs, and other materialsdirectly related to the program. It also includes the use of externalvendors. As with analysis costs, design and development costs areusually prorated, perhaps using the same time frame. One to threeyears is recommended unless the program is not expected tochange for many years and the costs are significant.
In lieu of development costs, many organizations purchaseprograms to use directly or in a modified format. The acquisitioncosts for these programs include the purchase price of the materials,fees to vendors, licensing agreements, and other costs associatedwith the right to implement the program. These acquisition costsshould be prorated using the same rationale above; one to threeyears should be sufficient. If the program needs modification orif some additional development is required, these costs should beincluded as development costs. In practice, many programs haveboth acquisition costs and development costs.
Implementation Costs
Often, the largest segment of costs is associated with delivery.This cost segment includes five major categories.
Salaries of facilitators and coordinators. The salaries of facili-tators or program coordinators should be included. If a coordinatoris involved in more than one program, the appropriate timeshould be allocated to the specific program. If external facilitatorsare used, all charges should be included for the portion of theprogram and time frame being evaluated. The important issue isto capture all the direct time of internal employees or externalconsultants who work directly with the program. The benefitsfactor should be included each time direct labor costs are involved.This factor is a widely accepted value, usually generated by thefinance and accounting staff and in the 30 to 40 percent range.
Program materials and fees. Specific program materials suchas guidelines, job aids, software, notebooks, textbooks, case

224 THE HUMAN RESOURCES SCORECARD
studies, exercises, and participant workbooks should be includedin the delivery costs, along with license fees, user fees, and royaltypayments if any.
Travel, lodging, and meals. Direct travel for participants,facilitators, or coordinators should be included. Lodging andmeals are included for participants during travel, as well asmeals during the meeting or program. Refreshments should alsobe included.
Facilities. The direct cost of the facilities for meetings or learningsessions should be included. For external programs, this is the directcharge from the hotel or conference center. If the program isimplemented in-house, the conference room represents a cost for theorganization, and the cost should be estimated and included even ifit is not the practice to include facilities’ cost in other reports.
Participants’ salaries and benefits. The salaries plus employeebenefits of participants represent an expense that should beincluded. For situations in which the program has already beenimplemented, these costs can be estimated using average ormidpoint values for salaries in typical job classifications. Whena program is targeted for an ROI calculation, participants canprovide their salaries directly and in a confidential manner.
If a replacement employee must substitute for an employee whois attending meetings on HR issues, and if this cost exceeds thevalue of the salary and benefits already captured, then the excesscost must also be calculated. For example, here’s how to calculatethe excess cost if four employees staff a casting operation in apipe manufacturing facility and then one of the four leaves thepremises to attend a meeting related to an HR program or toserve on an HR task force. The pipe manufacturing facility inthis example has determined that the casting operation cancontinue to operate at three-quarters staffing for only one day.So if the one casting employee, who earns $40 per hour, attendsa two-day HR task force meeting, on the second day an employeefrom another shift will need to substitute for the absent employee.If the replacement employee earns overtime wages of $60 perhour, the replacement cost captured should be $20 per hour ($60minus $40) times the eight-hour shift, yielding a replacement costof $160. Because the salary and benefits for the employee attend-ing the meeting have already been captured, it is only necessaryto capture the added cost (the overtime pay) of the replacement

MONITORING THE COST OF HUMAN RESOURCE PROGRAMS 225
employee. The replacement employee is turning out the sameproduct at the same productivity level as the employee who isattending the meeting, so no loss of output occurs.
Using the same example above, if the crew cannot produce 100percent output on the first day because of the three-quartersstaffing level, then the cost of lost production must also beincluded as an HR program cost, with an appropriate explanation.
Operating Costs
Costs to operate and maintain the HR program must be cap-tured on a continuing basis. These include ongoing salaries andbenefits of the program manager/coordinator, as well as the costof office supplies, materials, program expenses, and technologysupport. Other costs are treated similarly to implementation costs.
Also, if long-term ongoing operating costs exist for a program,then these costs may need to be expressed on an annual basis.When appropriate, these costs may be prorated on a per-yearbasis so that they can be used to develop an ROI. For example,if an HR program is being evaluated to determine programbenefits realized from March 1 to August 31, then the annualoperating cost would need to be prorated to capture six monthsof operating costs.
Evaluation Costs
Usually the total evaluation cost is included in the programcosts to compute the fully loaded cost. ROI costs include the costof developing the evaluation strategy, designing instruments,collecting data, analyzing data, and preparing and distributingreports. Cost categories include time, materials, purchased instru-ments, and surveys. A case can be made to prorate the evaluationcosts over several programs instead of charging the total amountas an expense. For example, if twenty-five sessions of an HRprogram are conducted in a three-year period and one group isselected for an ROI calculation, then the ROI costs could logicallybe prorated over the twenty-five sessions. This is because theresults of the ROI analysis should reflect the success of the otherprograms and will perhaps result in changes that will influencethe other programs as well.

226 THE HUMAN RESOURCES SCORECARD
Overhead
A final charge is the cost of overhead, which includes theadditional costs in the HR function not directly related to aparticular program or implementation. The overhead categoryrepresents any HR department cost not considered in the abovecalculations. Typical items include the cost of administrativesupport; departmental office expenses such as utilities, space,telephones, computers, and copy machines; salaries of HR managers;and other fixed costs. Some organizations obtain an estimate forallocation by dividing the total overhead by the number ofprogram implementation days for the year. This becomes astandard value to use in calculations.
COST ACCUMULATION AND ESTIMATION
There are two basic ways to classify HR costs. One is accom-plished by assigning the expenditure a description, such as labor,materials, supplies, travel, and so forth. These are called expenseaccount classifications. The other is accomplished by assigningcategories in the HR process or function, such as programdevelopment, implementation, and evaluation. An effective systemmonitors costs by account categories (shown in Table 7-2) accord-ing to the description of those accounts but also includes amethod for accumulating costs by the HR process/functionalcategory. Many systems stop short of this second step. Althoughthe first grouping sufficiently gives the total program cost, it doesnot allow for a useful comparison with other programs or indicateareas in which costs might be excessive by relative comparisons.
Cost Classification Matrix
Costs are accumulated under both of the above classifications.The two classifications are obviously related, and the relationshipdepends on the organization. For instance, the specific costs thatcompose the analysis part of a program may vary substantiallywith the organization.
An important part of the classification process is to define thekinds of costs, in the account classification system, that normallyapply to the process/functional categories. The matrix shown inTable 7-2 represents the categories for accumulating all HR-related

MO
NIT
OR
ING
TH
E CO
STO
F HU
MA
N R
ESO
UR
CE P
RO
GR
AM
S227
Table 7-2Cost Classification Matrix
Process/Functional Categories
Expense Account Development/Classification Analysis Acquisition Implementation Operating Evaluation
00 Salaries and Benefits—HRStaff X X X X X
01 Salaries and Benefits—OtherStaff Members X X
02 Salaries and Benefits—Participants X X X03 Meals, Travel, and Incidental
Expenses—HR Staff X X X X X04 Meals, Travel, and
Accommodations—Participants X X05 Office Supplies and Expenses X X X X06 Program Materials and Supplies X X X07 Printing X X X X X08 Outside Services X X X X X09 Equipment Expense Allocation X X X X X10 Equipment—Rental X X X11 Equipment—Maintenance X X12 Registration Fees X X13 Facilities Expense Allocation X X14 Facilities Rental X X15 General Overhead Allocation X X X X X16 Other Miscellaneous Expenses X X X X X

228 THE HUMAN RESOURCES SCORECARD
costs in the organization. Those costs that normally are a partof a certain process/functional category have an X beside themin the matrix, indicating that particular category. Each memberof the HR staff should know how to charge expenses properly(for example, expenses for equipment that is rented to use in thedevelopment and implementation of a specific program). In thisexample, should all or part of the cost be charged to develop-ment? Or to implementation? More than likely the cost will beallocated in proportion to the extent the item was used foreach category.
Cost Accumulation
With expense account classifications clearly defined and theprocess/functional categories determined, it is easy to track costsfor individual programs. This is accomplished by using specialaccount numbers and project numbers. The example that followsillustrates the use of these numbers.
A project number is a three-digit number representing a specificHR program. For example:
Employee Concerns Program 112Gainsharing Program 215Statistical Quality Control 418Valuing Diversity 791
Numbers are also assigned to the process/functional categoriesshown in Table 7-2. Using the example presented earlier, thefollowing numbers are assigned:
Analysis 1Development/Acquisition 2Implementation 3Operating 4Evaluation 5
Using the two-digit numbers assigned to account classificationsin Table 7-2, an accounting system is complete. For example, if

MONITORING THE COST OF HUMAN RESOURCE PROGRAMS 229
workbooks are reproduced to give to participants in the valuingdiversity workshop, the appropriate charge number for thatreproduction is 07-3-791. The first two digits denote the accountclassification, the next digit the process/functional category, andthe last three digits the project number. This system enables rapidaccumulation and monitoring of HR costs. Total costs can bepresented by:
� HR program (valuing diversity)� Process/functional categories (implementation)� Expense account classification (printing)
Cost Estimation
The previous sections covered procedures for classifying andmonitoring costs related to HR programs. It is important tomonitor and compare ongoing costs with the budget or withprojected costs. However, a significant reason for tracking costsis to predict the cost of future programs. Usually this goal isaccomplished through a formal cost estimation method uniqueto the organization.
Some organizations use cost estimating worksheets to arrive atthe total cost for a proposed program. Figure 7-1 shows anexample of cost estimating worksheets that are used to calculateanalysis, development, implementation, operating, and evaluationcosts. The worksheets contain a few formulas that make it easierto estimate the cost. In addition to these worksheets, currentcharge rates for services, supplies, and salaries should be availablefor computational purposes. These data become outdated quicklyand are usually prepared periodically as a supplement.
The most appropriate basis for predicting costs is to analyzethe previous costs by tracking the actual costs incurred in allphases of a program, from analysis to evaluation. This way, it ispossible to see how much is being spent on programs and howmuch is being spent in the different categories. Until adequatecost data are available, it is necessary to use the detailed analysisin the worksheets for cost estimation.
(text continued on page 232)

230 THE HUMAN RESOURCES SCORECARD
Analysis Costs Total
Salaries and Employee Benefits—HR Staff(No. of People × Avg. Salary × EmployeeBenefits Factor × No. of Hours on Project)
Meals, Travel, and Incidental ExpensesOffice Supplies and ExpensesPrintingOutside ServicesEquipment ExpensesRegistration FeesGeneral Overhead AllocationOther Miscellaneous Expenses
Total Analysis Cost
Development/Acquisition Costs
Salaries and Employee Benefits (No. of People× Avg. Salary × Employee Benefits Factor× No. of Hours on Project)
Meals, Travel, and Incidental ExpensesOffice Supplies and ExpensesProgram Materials and Supplies
FilmVideotapeAudiotapes35mm SlidesCD-ROMsSoftwareOverhead TransparenciesArtworkManuals and MaterialsOther
PrintingOutside ServicesEquipment ExpenseGeneral Overhead AllocationOther Miscellaneous Expenses
Total Development/Acquisition Costs
Figure 7-1. Cost estimating worksheets.

MONITORING THE COST OF HUMAN RESOURCE PROGRAMS 231
Implementation Costs Total
Participant CostsSalaries and Employee Benefits (No. of
Participants × Avg. Salary × EmployeeBenefits Factor × Hours or Days ofCaptive Time)
Meals, Travel, and Accommodations (No. ofParticipants × Avg. Daily Expenses × Daysof Captive Time)
Program Materials and SuppliesParticipant Replacement Costs (if applicable)Lost Production (if applicable; explain basis)Program Manager/Coordinator/Facilitator Costs
Salaries and BenefitsMeals, Travel, and Incidental ExpensesOutside Services
Facilities Expense AllocationEquipment ExpenseOther Miscellaneous Expenses
Total Delivery Costs
Operating Costs
Participant CostsSalaries and Employee Benefits (No. of
Participants × Avg. Salary × EmployeeBenefits Factor × Hrs. or Days of TimeUtilizing the Program)
Meals, Travel, and Accommodations (No. ofParticipants × Avg. Daily Expenses × Daysof Captive Time)
Program Materials and SuppliesParticipant Replacement Costs (if applicable)Lost Production (if applicable; explain basis)Program Manager/Coordinator Costs
Salaries and BenefitsMeals, Travel, and Incidental ExpensesOutside Services
Facility CostsFacilities Rental
Figure 7-1. Continued.

232 THE HUMAN RESOURCES SCORECARD
(text continued from page 229)
Facilities Expense AllocationEquipment ExpenseOther Miscellaneous Expenses
Total Operating Costs
Evaluation Costs Total
Salaries and Employee Benefits—HR Staff(No. of People × Avg. Salary × EmployeeBenefits Factor × No. of Hours on Project)
Meals, Travel, and Incidental ExpensesParticipant CostsOffice Supplies and ExpensesPrintingOutside ServicesEquipment ExpenseOther Miscellaneous Expenses
Total Evaluation Costs
General Overhead Expense
TOTAL PROGRAM COSTS
Figure 7-1. Continued.
SUMMARY
Costs are important and should be fully loaded in the ROIcalculation. From a practical standpoint, including some of thecosts may be optional—based on the organization’s guidelines andphilosophy. However, because of the scrutiny involved in ROIcalculations, it is recommended that all costs be included, evenif doing so goes beyond the requirements of the company policy.
REFERENCE
1. Annual Employee Benefits Report. Nations Business, January 1996,p. 28.

233
Chapter 8
Calculating theActual Returnon Investment
The monetary values for program benefits, developed inChapter 6, are combined with program cost data, developed inChapter 7, to calculate the return on investment. This chapterexplores several approaches for developing the return on invest-ment, describing the various techniques, processes, and issuesinvolved. Before presenting the formulas for ROI calculation, thechapter describes a few basic issues. An adequate understand-ing of these issues is necessary to complete this major step in theROI process.

234 THE HUMAN RESOURCES SCORECARD
BASIC ISSUES
Definitions
The phrase return on investment in HR is often misused,sometimes intentionally. In some situations, a broad definition forROI includes any benefit from the program. In these situations,ROI is a vague concept in which even subjective data linked toa program are included in the concept of the return. In this book,the return on investment has a more precise meaning and repre-sents an actual value developed by comparing program costs withbenefits. The two most common measures are the benefit/costratio and the ROI formula. Both are presented along with otherapproaches that calculate the return.
For many years, HR practitioners and researchers have soughtto calculate the actual return on the investment for HR programsand initiatives. If HR programs are considered an investment, notan expense, then it is appropriate to place the HR investment inthe same funding mechanism as other investments, such as theinvestment in equipment and facilities. Although these otherinvestments differ quite a bit, management often views them inthe same way. Thus, it is critical to the success of the HR fieldto develop specific values that reflect the return on the investment.
Annualized Values
All the formulas presented in this chapter use annualized valuesso that the first-year impact of the program investment isdeveloped. Using annual values is becoming a generally acceptedpractice for developing the ROI in many organizations. Thisapproach is a conservative way to develop the ROI, because manyshort-term HR programs add value in the second or third year.For long-term HR programs, annualized values are inappropriate,and longer time frames need to be used. For example, in an ROIanalysis of a program to send employees to the USA to obtainMBA degrees, a Singapore-based company used a seven-year timeframe. The program required two years for degree completion andthen a five-year impact, with post-program data used to developthe ROI. However, for most programs that last anywhere fromone day to one month, first-year values are appropriate.

CALCULATING THE ACTUAL RETURN ON INVESTMENT 235
When selecting the approach to measure ROI, it is importantto communicate to the target audience the formula used and theassumptions made to arrive at the decision to use the formula.This action can prevent misunderstandings and confusion sur-rounding how the ROI value was actually developed. Althoughthis chapter describes several approaches, two stand out as thepreferred methods: the benefit/cost ratio and the basic ROIformula. These two approaches are described next, along withbrief coverage of the other approaches.
BENEFIT/COST RATIO
One of the earliest methods for evaluating HR investments isthe benefit/cost ratio (BCR). This method compares the benefitsof the HR program with the program’s costs, in a ratio. Informula form, the ratio is:
BCR =Program BenefitsProgram Costs
In simple terms, the BCR compares the annual economicbenefits of the program with the cost of the program. A BCRvalue of one means that the benefits equal the costs. A BCR oftwo, usually written as 2:1, indicates that each dollar spent onthe program returned two dollars as benefits.
The following example illustrates the use of the benefit/costratio. An electric and gas utility implemented an applied behaviormanagement program designed for managers and supervisors [1].In a follow-up evaluation, action planning and business per-formance monitoring were used to capture benefits. The first-yearpayoff for the program equaled $1,077,750. The total fullyloaded implementation costs were $215,500. Thus, the ratio was:
BCR =$1,077,750$215,500
= 5 1:
Every one dollar invested in this program returned five dollarsin benefits.

236 THE HUMAN RESOURCES SCORECARD
The principal advantage of using this approach is that it avoidstraditional financial measures so that no confusion results whencomparing HR investments with other investments in the com-pany. Investments in plants, equipment, or subsidiaries, forexample, are not usually evaluated with the benefit/cost method.Some HR executives prefer not to use the same method (BCR)to compare the return on HR investments with the return onother investments. Consequently, the ROI for HR stands aloneas a unique type of evaluation.
Unfortunately, no standards exist as to what constitutes anacceptable benefit/cost ratio. A standard should be establishedwithin an organization, perhaps even for a specific type ofprogram. However, a 1:1 ratio is unacceptable for most programs,and some organizations require a 1.25:1 ratio, where 1.25 timesthe cost of the program is the benefit.
ROI FORMULA
Perhaps the most appropriate formula for evaluating HRinvestments is net program benefits divided by cost. The ratio isusually expressed as a percent when the fractional values aremultiplied by 100. In formula form, the ROI becomes:
ROI(%) = ×Net Program BenefitsProgram Costs
100
Net benefits are program benefits minus program costs. TheROI value is related to the BCR by a factor of one. For example,a BCR of 2.45 is the same as an ROI value of 145 percent. Thisformula is essentially the same as ROI in other types of invest-ments. For example, when a firm builds a new plant, the ROI isfound by dividing annual earnings by the investment. The annualearnings are comparable to net benefits (annual benefits minusthe cost). The investment is comparable to program costs, whichrepresent the investment in the program.
An ROI for an HR investment of 50 percent means that thecosts were recovered and an additional 50 percent of the costswere reported as “earnings.” For example, a cost of $100 requiresearnings of $150 in order to bring a 50 percent return.

CALCULATING THE ACTUAL RETURN ON INVESTMENT 237
ROI(%)$ $
$%= − × =150 100
100100 50
An HR investment of 150 percent indicates that the costs wererecovered and an additional 1.5 multiplied by the costs wascaptured as “earnings.” An example illustrates the ROI calcula-tion. Magnavox Electronics Systems Company conducted aneighteen-week literacy program for entry-level electrical andmechanical assemblers [2]. The results of the program wereimpressive. Productivity and quality alone yielded an annual valueof $321,600. The total fully loaded costs for the program were$38,233. Thus, the return on investment became:
ROI(%)$ , $ ,
$ ,%= − × =321 600 38 233
38 233100 741
For each dollar invested, Magnavox received 7.4 dollars in returnafter the cost of the program had been recovered.
Using the ROI formula essentially places HR investments ona level playing field with other investments using the sameformula and similar concepts. Key management and financialexecutives who regularly use ROI with other investments caneasily understand the ROI calculation.
Although no generally accepted standards exist, some organiza-tions establish a minimum requirement or hurdle rate for an ROIin an HR program. Some organizations set an ROI minimum of25 percent. This target value usually exceeds the percentagerequired for other types of investments. The rationale: The ROIprocess for HR is still relatively new and often involves somesubjective input, including estimations. Because of that, a higherstandard is required or suggested, with 25 percent being thedesired figure for these organizations.
BCR/ROI CASE APPLICATION
Background Information
Retail Merchandise Company (RMC)—a large, national storechain located in most major USA markets—attempted to boost

238 THE HUMAN RESOURCES SCORECARD
sales by conducting an interactive selling skills program for salesassociates. The program, developed and delivered by an outsidevendor, represented a response to a clearly defined need toincrease the level of interaction between the sales associate andthe customer. The program consisted of two days of skills trainingfollowed by three weeks of on-the-job application of the skills.The third day of the program was used for follow-up and addi-tional training. Three groups, representing the electronics depart-ments of three stores, initially received the training, as a pilotimplementation. A total of four participated.
ROI Analysis
Post-program data collection was accomplished using threemethods. First, the average weekly sales of each associate wasmonitored (business performance monitoring of output data).Second, a follow-up questionnaire was distributed three monthsafter the associates completed the training to determine Level 3success (actual application of the skills on the job). Third, Level3 data were solicited in a follow-up session, which was conductedon the third day. In this session, participants disclosed theirsuccess (or lack of success) with the application of new skills.They also discussed techniques to overcome the barriers toprogram implementation.
This program used a control group to isolate the effects oftraining. Three additional store locations were identified (controlgroup) and compared with the three groups in the pilot training(experimental group). The variables of store size, store location,and customer traffic levels were used to match the two groupsso that they could be as identical as possible. The method toconvert data to monetary values is a direct profit contributionof the increased output. The actual profit obtained from anadditional one dollar of sales was readily available and used inthe calculation.
BCR and ROI Calculations
Although the program was evaluated at all five levels, thisstudy focused on the Level 5 calculation. Levels 1, 2, and 3 dataeither met or exceeded expectations. Table 8-1 shows the Level

CALCULATING THE ACTUAL RETURN ON INVESTMENT 239
4 data, the average weekly sales of both groups after the training.For convenience and at the request of management, a three-monthfollow-up period was used. Management wanted to implementthe program at other locations if it appeared successful in thisfirst three months of operation. Three months may be prematureto determine the total impact of the program, but it often becomesa convenient time period for evaluation. Sales data for the firstthree weeks after training are shown in Table 8-1, along withdata for the last three weeks of the evaluation period (weeks 13,14, and 15). The data show what appears to be a significantdifference in the two values.
Two steps are required to move from the Level 4 data to Level5. Step 1 calls for Level 4 data to be converted to monetaryvalues. Because sales is the Level 4 data being converted here,in this instance the sales data must be converted to profit con-tribution as noted below. Step 2 requires the cost of the programto be tabulated. Table 8-2 shows the annualized program benefits.The total benefit was $71,760. Of the total forty-eight par-ticipants, forty-six still remained in the same jobs for which theyreceived training at the end of the three months. To be con-servative, the other two participants’ potential improvements wereremoved from the calculation. The profit contribution at the store
Table 8-1Level 4 Data: Average Weekly Post-Training Sales
Weeks AfterTraining Trained Group Control Group
1 $9,723 $9,698
2 9,978 9,720
3 10,424 9,812
13 13,690 11,572
14 11,491 9,683
15 11,044 10,092
Average for Weeks $12,075 $10,44913, 14, and 15

240 THE HUMAN RESOURCES SCORECARD
level, obtained directly from the accounting department, was 2percent. For every one dollar of additional sales attributed to theprogram, only two cents would be considered the added value.At the corporate level, the number was even smaller, about 1.2percent. As in this example, first-year values are usually used toreflect the total impact of the program. Ideally, if new skills areacquired, as indicated in the Level 3 evaluation, some value forthe use of those skills should be added in year two and perhapseven year three. However, for short-term programs, only first-yearvalues are used, requiring the investment to have an acceptablereturn in a one-year time period. This completes Step 1, con-verting benefits to monetary values.
Table 8-3 shows the cost summary for this program. Costs arefully loaded, including data for all forty-eight participants.Because a vendor conducted the program, there are no directdevelopment costs. The facilitation fee actually covers the pro-rated development costs, as well as the delivery costs. The par-ticipants’ salaries plus a 35 percent factor for employee benefitswere included in the costs. Facilities costs were included, althoughthe company does not normally capture the costs when internalfacilities are used, as was the case with this program. The estimatedcost for the coordination and evaluation was also included. Thetotal cost was $32,984. Thus, the benefit/cost ratio became:
BCR = =$ ,$ ,
. :71 76032 984
2 2 1
Table 8-2Annualized Program Benefits
46 of 48 participants remained in same jobs after 3 months
Average Weekly Sales Trained Groups $12,075
Average Weekly Sales Untrained Groups $10,449
Increase $1,626
Profit Contribution 2% $32.50
Total Weekly Improvement (32.50 × 46) $1,495
Total Annual Benefits ($1,495 ××××× 48 Weeks) $71,760

CALCULATING THE ACTUAL RETURN ON INVESTMENT 241
and the return on investment became:
ROI(%)$ , $ ,
$ ,%= − × =71 760 32 984
32 984100 118
Thus, the program had an excellent return on investment in itsinitial trial run after three months of on-the-job application ofthe skills.
OTHER ROI MEASURES
In addition to the traditional ROI formula previously described,several other measures are occasionally used under the generalterm return on investment. These measures are designed primarilyfor evaluating other types of financial measures, but sometimesthey work their way into HR evaluations.
Payback Period
The payback period is a common method for evaluating capitalexpenditures. With this approach, the annual cash proceeds(savings) produced by an investment are equated to the originalcash outlay required by the investment to arrive at some multipleof cash proceeds equal to the original investment. Measurement
Table 8-3Cost Summary
48 participants, spread across 3 sessions
Facilitation Fees: 3 sessions @ $3,750 each $11,250
Program Materials: 48 @ $35/participant 1,680
Meals/Refreshments: 3 days @ $28/participant/day 4,032
Facilities: 9 days @ $120/day 1,080
Participant Salaries Plus Benefits (35%) 12,442
Coordination/Evaluation 2,500
Total Costs $32,984

242 THE HUMAN RESOURCES SCORECARD
is usually in terms of years and months. For example, if the costsavings generated by an HR program remain constant each year,the payback period is determined by dividing the total originalcash investment (development costs, outside program purchases,etc.) by the amount of the expected annual or actual savings. Thesavings represent the net savings after the program expenses aresubtracted. To illustrate this calculation, assume that an initialprogram cost is $100,000 with a three-year useful life. Theannual net savings from the program is expected to be $40,000.Thus, the payback period becomes:
Payback Period =Total InvestmentAnnual Savings
years= =100 00040 000
2 5,,
.
The program will “pay back” the original investment in2.5 years.
The payback period is simple to use but has the limitation ofignoring the time value of money. It has not enjoyed widespreaduse in evaluating HR investments.
Discounted Cash Flow
Discounted cash flow is a method of evaluating investmentopportunities in which certain values are assigned to the timingof the proceeds from the investment. The assumption, based oninterest rates, is that a dollar earned today is more valuable thana dollar earned a year from now.
There are several ways of using the discounted cash flowconcept to evaluate capital expenditures. The most popular oneis probably the net present value of an investment. This approachcompares the savings, year by year, with the outflow of cashrequired by the investment. The expected savings received eachyear is discounted by selected interest rates. The outflow of cashis also discounted by the same interest rate. If the present valueof the savings should exceed the present value of the outlays afterdiscounting at a common interest rate, management usually viewsthe investment as acceptable. The discounted cash flow methodhas the advantage of ranking investments, but it becomes difficultto calculate.

CALCULATING THE ACTUAL RETURN ON INVESTMENT 243
Internal Rate of Return
The internal rate of return (IRR) method determines the interestrate required to make the present value of the cash flow equalzero. It represents the maximum rate of interest that could bepaid if all project funds were borrowed and the organization hadto break even on the projects. The IRR considers the time valueof money and is unaffected by the scale of the project. It can beused to rank alternatives and to make accept/reject decisionswhen a minimum rate of return is specified. A major weaknessof the IRR method is that it assumes all returns are reinvestedat the same internal rate of return. This can make an investmentalternative with a high rate of return look even better than itreally is and a project with a low rate of return look even worse.In practice, the IRR is rarely used to evaluate HR investments.
UTILITY ANALYSIS
Another interesting approach for developing the HR payoff isutility analysis. Utility is a function of the duration of an HRprogram’s effect on employees’ performance, the number ofemployees affected, the validity of the HR program, the value ofthe job for which HR initiative was provided, and the totalprogram cost.
Utility analysis measures the economic contribution of aprogram according to how much effect the program hadin identifying and modifying behavior, hence the future ser-vice contribution of employees. Schmidt, Hunter, and Pearlmanderived the following formula for assessing the dollar value of atraining program [3]:
∆U = T × N × dt × Sdy – N × C
where ∆U = Monetary value of the training programT = Duration in number of years of a training program’s
effect on performanceN = Number of employees traineddt = True difference in job performance between the
average trained and the average untrained employeein units of standard deviation
244 THE HUMAN RESOURCES SCORECARD
Sdy = Standard deviation of job performance of the untrainedgroup in dollars
C = Cost of training per employee
Of all the factors in this formula, the true difference in jobperformance (dt) and the value of the target job (Sdy) are themost difficult to develop. The validity of the HR program isdetermined by noting the performance differences between trainedand untrained employees. The simplest method for obtaining thisinformation is to have supervisors rate the performance of bothgroups. Supervisors and experts estimate the value of the targetjob, Sdy.
Utility analysis is based totally on estimations. Because of thesubjective nature of this approach, it has not achieved widespreadacceptance by HR professionals as a practical tool for evaluatingthe return on HR investments.
CONSEQUENCES OF NOT PROVIDING
AN HR SOLUTION
Another method to determine the return on HR solutions isto withhold the solution and calculate the consequences. For someorganizations, withholding an HR solution produces seriousconsequences. A company’s inability to perform adequately mightmean that it is unable to take on additional business or that itmay lose existing business because of an untrained work forceor an inadequate compensation system. Also, HR programs canhelp avoid serious operational problems (accidents) and non-compliance issues (EEO violations). This particular method ofcalculating the return on HR investments has received recentattention and involves the following steps:
� Establish that a potential problem, loss, or opportunity exists.� Isolate the problems that lack of performance may create,
such as noncompliance issues, loss of business, or theinability to take on additional business.
� Develop an estimate of the potential value of the problem,loss, or opportunity.
� If other factors are involved, determine the impact of eachfactor on the loss of income.

CALCULATING THE ACTUAL RETURN ON INVESTMENT 245
� Estimate the total cost of an HR solution using the tech-niques outlined in Chapter 7.
� Compare benefits with costs.
This approach has some disadvantages. The potential loss ofincome can be highly subjective and difficult to measure. Also,it may be difficult to isolate the factors involved and to determinetheir weight relative to lost income. Because of these concerns,this approach to evaluating the return on HR investmentsis limited.
ROI ISSUES
ROI Complexity
As discussed in Chapter 1, developing the return on investmentin HR is a complex issue. The approach presented in this bookis to take the complex process and simplify it by breaking it intosmall steps so it is understandable and acceptable to a varietyof audiences. Figure 8-1 illustrates the complexity of this process.
This book has presented the ten most common ways to collectpost-program data, ten ways to isolate the effects of HR pro-grams on business performance measures, and ten ways to con-vert data into monetary values. In essence, there are 1,000possible ways to evaluate an HR program, as shown in Figure8-1. This fact alone is often enough to cause some of the mosteager individuals to avoid the ROI process. However, when eachstep is taken separately and issues are addressed for a particulartopic, the decisions are made incrementally all the way throughthe process. This helps to reduce a complex process to a moresimplified and manageable effort. Figure 8-1 underscores animportant advantage of this process. With so many different waysto tackle these three critical issues, the ROI process can beapplied to almost any type of program in any setting.
Cautions When Using ROI
Because of the complexity and sensitivity of the ROI process,caution is needed when developing, calculating, and communi-cating the return on investment. The implementation of the ROI

246 THE HUMAN RESOURCES SCORECARD
process is a critical goal of many HR departments. A few issues,described next, should be addressed to keep the process fromgoing astray.
The ROI process should be developed for programs for whicha needs assessment/analysis has been conducted. Because of theevaluation problems that can develop when there is not a clear needsassessment, the ROI should be conducted only with programs thathave had a comprehensive needs assessment, preferably with Levels3 and 4 data. However, practical considerations and managementrequests may prohibit this suggested requirement.
The ROI analysis should always include one or more strategiesfor isolating the effects of the HR program. Because of theimportance of accounting for the influence of other factors, thisstep in the process must not be ignored. Too often, an excellentstudy, from what appears to be a remarkably successful HReffort, is perceived as worthless because there was no attemptto account for other factors. Omission of this step seriouslydiminishes the credibility of the study.
CollectingData
Isolatingthe Effects
Of HR
ConvertingData to
MonetaryValue
10 Ways × 10 Ways × 10 Ways
= 1,000 Possibilities
Figure 8-1. ROI complexity. The number of possibilities increasethe complexity.

CALCULATING THE ACTUAL RETURN ON INVESTMENT 247
When making estimates, use the most reliable and crediblesources. Because estimates are critical to any type of analysis, theywill usually be an important part of the ROI process. When used,they should be developed properly and obtained from the mostreliable and credible sources, those individuals who best understandthe overall situation and can provide the most accurate estimation.
Take a conservative approach when developing both benefitsand costs. Conservatism in ROI analysis builds accuracy andcredibility. What matters most is how the target audience per-ceives the value of the data. A conservative approach is alwaysrecommended for both the numerator of the ROI formula (benefits)and the denominator (program costs).
Use caution when comparing the ROI in HR with otherfinancial returns. There are many ways to calculate the returnon funds invested or assets employed. The ROI is just one ofthem. Although the calculation for ROI in HR uses the samebasic formula as in other investment evaluations, the target groupmay not fully understand it. Its calculation method and itsmeaning should be clearly communicated. More importantly, itshould be accepted by management as an appropriate measurefor HR program evaluation.
Involve management in developing the return. Managementultimately decides whether an ROI value is acceptable. To theextent possible, management should be involved in setting theparameters for calculations and establishing targets by which HRprograms are considered acceptable within the organization.
Approach sensitive and controversial issues with caution.Occasionally, sensitive and controversial issues will surface whendiscussing an ROI value. It is best to avoid debates about whatis measurable and what is not measurable unless clear evidenceexists regarding the issue in question. Also, some programs areso fundamental to the survival of the organization that anyattempt to measure them is unnecessary. For example, a programdesigned to improve customer service in a customer-focusedcompany may escape the scrutiny of an ROI evaluation becauseof the assumption that if the program is well designed, it willimprove customer service.
Teach others the methods for calculating the return. Each timean ROI is calculated, the HR manager should use the opportunityto educate other managers and colleagues in the organization.Even if such a task does not fall under their areas of responsibility,

248 THE HUMAN RESOURCES SCORECARD
these individuals will see the value of this approach to HR evalua-tion. Also, when possible, each project should serve as a casestudy to educate the HR staff about specific techniques and methods.
Do not boast about a high return. It is not unusual to generatewhat appears to be an extremely high return on investment foran HR program. Several examples in this book have illustratedthe possibilities. An HR manager who boasts about a high rateof return opens the door to potential criticism from others unlessthe calculation is based on indisputable facts.
Do not try to use ROI for every program. Some programs aredifficult to quantify, and an ROI calculation may not be feasiblefor them. Other methods of presenting the benefits may be moreappropriate. HR executives are encouraged to set targets for thepercent of programs in which ROIs are developed. Also, specificcriteria should be established to guide selection of programs forROI analysis.
CONCLUSION
After the HR program benefits are collected and converted tomonetary values and the program costs are developed in a fullyloaded profile, the ROI calculation becomes a simple step. It isjust a matter of plugging the values into the appropriate formula.This chapter has presented the two approaches most often usedfor calculating the return: the ROI formula and the benefit/costratio. Several other alternatives were presented briefly but are notwidely used to determine the return on HR solutions.
REFERENCES
1. Wescott, R. “Applied Behavior Management Training,” in InAction: Measuring Return on Investment, Vol. 1. J. Phillips (Ed.)Alexandria, Va.: American Society for Training and Development,1994, pp. 235–252.
2. Ford, D. “Three Rs in the Workplace,” in In Action: MeasuringReturn on Investment, Vol. 1. J. Phillips (Ed.) Alexandria, Va.:American Society for Training and Development, 1994, pp. 85–104.
3. Schmidt, F. L., Hunter, J. E., and Pearlman, K. “Assessing theEconomic Impact of Personnel Programs on Workforce Productivity.”Personnel Psychology, Vol. 35, 1982, pp. 333–347.

IDENTIFYING INTANGIBLE MEASURES 249
249
Chapter 9
IdentifyingIntangible Measures
Intangible measures are the benefits or detriments, directlylinked to the HR program, that are not converted to monetaryvalues. Although in many cases these programs can be converted,for various reasons it has been decided not to convert them.These measures are often monitored after the HR program hasbeen implemented, and although not converted to monetaryvalues, they are still important in the evaluation process. Althoughthe range of intangible measures has almost no limit, this chapterdescribes the more common variables often linked with HRprograms. Here is a list of typical intangible variables connectedto such programs:

250 THE HUMAN RESOURCES SCORECARD
� Attitude survey data� Organizational commitment� Climate survey data� Employee complaints� Grievances� Discrimination complaints� Stress reduction� Employee turnover� Employee absenteeism� Employee tardiness� Employee transfers� Customer satisfaction survey data� Customer complaints� Customer response time� Teamwork� Cooperation� Conflict� Decisiveness� Communication� Employee satisfaction
KEY ISSUES
Importance of Intangible Measures
Not all measures can or should be converted to monetaryvalues. By design, some are captured and reported as intangiblemeasures. Although intangibles may not be perceived to be asvaluable as the measures converted to monetary values, intangiblemeasures are critical to the overall evaluation process [1]. In someprograms, intangible or nonmonetary benefits can be more importantthan monetary or tangible measures. Consequently, these measuresshould be monitored and reported as part of the overall evaluation.In practice, every HR program, regardless of its nature, scope,and content, will have intangible measures associated with it [2].The challenge is to efficiently identify and report them.
Identification of Measures
Intangible measures can be identified in several ways, at dif-ferent stages in the process. First, they can be uncovered early

IDENTIFYING INTANGIBLE MEASURES 251
in the process, during the needs assessment/analysis. Once identified,the intangible data are planned for collection as part of theoverall data collection strategy. For example, an employee com-plaint resolution program may have several hard data measureslinked to the program. During the needs assessment/analysis, anintangible measure—employee satisfaction—may also be identifiedand then monitored, with no plans to convert it to a monetaryvalue. Thus, from the beginning, the measure of employeesatisfaction is destined to be a nonmonetary benefit reportedalong with the ROI results.
A second way to identify an intangible benefit is to discuss theimpact of the HR program with clients or sponsors. Clients canusually identify intangible measures that they expect the programto influence. For example, a college recruiting program wasimplemented in a large multinational company, and an ROIanalysis was planned. Program designers, recruiters, HR managers,and senior executives identified potential intangible measures thatthey perceived were influenced by the program.
Third, an intangible measure can be identified during anattempt to convert the data to monetary values. If the processused to convert a set of data to monetary values cannot becompleted without compromising credibility, the measure shouldbe reported as an intangible benefit. For example, in an HRquality program, customer satisfaction was identified early in theprocess as one of the measures of success. A conversion tomonetary values was attempted. However, the process of assigninga value to the data lost credibility; therefore, customer satisfactionwas reported as an intangible benefit.
Last, an intangible measure can be identified during a follow-upevaluation. In such a situation, the measure—although not expectedor anticipated in the initial program design—surfaces on a question-naire, in an interview, or during a focus group. Questions are oftenasked about other improvements linked to the HR programs.Several intangible measures are usually provided, and no attemptsare planned to place a value on the actual measure. For example,during the evaluation of a customer-service training program,participants were asked specifically what had improved abouttheir work areas and their relationships with customers, as aresult of applying the skills they acquired in the program. Theparticipants provided more than a dozen intangible measures thatmanagers perceived to be linked directly to the program.

252 THE HUMAN RESOURCES SCORECARD
Analysis
For most intangible data, no specific analysis is planned. Someevaluators report that previous attempts to convert intangible datato monetary units resulted in aborting the entire process; thusno further data analysis was conducted. Some cases may call forattempts to isolate the effects of an HR program by using oneor more of the methods outlined in Chapter 5. This step isnecessary when a need exists to know the specific amount ofchange in the intangible measure that is linked to the program.In many cases, the intangible data reflect improvement. However,neither the precise amount of the improvement nor the amountof improvement related directly to the HR program is clearlyidentified. Because the value of these data is not placed in theROI calculation, intangible measures are not normally used tojustify additional HR initiatives or continuation of existingprograms. Consequently, a detailed analysis is not needed. Intangiblebenefits are viewed as supporting evidence of a program’s successand are presented as qualitative data.
EMPLOYEE SATISFACTION
Employee satisfaction is perhaps one of the most importantintangible measures. Almost any program will improve job satis-faction if the participants, participants’ managers, participants’customers, or peer group members perceive the program to besuccessful. This section describes some of the most influentialemployee satisfaction measures.
Attitude Survey Data
Many organizations conduct attitude surveys, which reflect thedegree to which employees feel satisfied with the organization,their jobs, their supervisors, their coworkers, and a host of otherissues. Employee job satisfaction is closely correlated with absen-teeism and turnover, both of which are linked with some HRprograms. Some attitude survey items focus on issues directlyrelated to HR programs, such as satisfaction with the quality ofleadership of managers and supervisors. Attitude survey data areusually linked to HR program results when specific issues on thesurvey relate to the program. For example, when a new pay plan

IDENTIFYING INTANGIBLE MEASURES 253
was implemented for all employees at a television station, theannual attitude survey contained five questions directly tied toperceptions and attitudes influenced by the new plan.
Because attitude surveys are usually taken annually, the resultsmay not be in sync with the timing of the program implementa-tion. When job satisfaction is one of the program objectives, someorganizations conduct surveys at a prescribed time frame afterthe HR program is implemented and design the survey instrumentaround issues related to the HR program. This approach, how-ever, can be expensive.
Organizational Commitment
Measuring organizational commitment is perhaps a moreimportant method for understanding the motivational state ofemployees. Similar to attitude surveys, organizational commitmentinstruments reflect the degree to which employees align withcompany goals, values, philosophy, and practices. High levels oforganizational commitment often correlate with high levels ofproductivity and performance; therefore, organizational com-mitment is an important intangible measure. Changes in surveydata may reflect the success of the HR program in improvingorganizational commitment. The difficulty with this intangiblemeasure is that it is not routinely measured in organizations.
Climate Survey Data
Some organizations conduct climate surveys, which reflect workclimate changes such as variances in communication, openness,trust, and quality of feedback. Climate surveys are similar toattitude surveys but are more general and often focus on a rangeof workplace issues and environmental enablers and inhibitors.Climate surveys conducted before and after the implementationof an HR program may reflect the extent to which the HRprogram changes these intangible measures.
Employee Complaints
Some organizations record and report specific employee complaints.A reduction of employee complaints sometimes directly relates toHR programs, such as a team-building program. Consequently,

254 THE HUMAN RESOURCES SCORECARD
the level of complaints is used as a measure of the program’ssuccess and is sometimes reported as an intangible measure.
Grievances
In both union and non-union organizations, grievances oftenreflect the level of dissatisfaction or disenchantment with a varietyof factors in the organization. Sometimes, HR programs, such aslabor management cooperation, are designed to reduce an exces-sive number of grievances. An improvement in the grievance levelreflects the success of the HR program. This measure may beconverted to a monetary value; however, it also may be reportedas an intangible measure.
Discrimination Complaints
Employee dissatisfaction shows up in different types of dis-crimination complaints, ranging from informal complaints toexternal charges and even litigation. New HR policies and pro-grams may be designed to prevent complaints or to reduce thecurrent level of complaint activity. The result of the policies andprograms, in terms of complaint reduction, sometimes is notconverted to monetary values because of the various assumptionsand estimations involved in the process. When this is the case,these measures are reported as intangible program benefits.
Stress Reduction
Occasionally, HR programs reduce work-related stress byshowing participants how to improve the way they accomplishtheir jobs, accomplish more in a workday, and relieve tension andanxiety. The subsequent reduction in stress may be directly linkedto the HR program.
EMPLOYEE WITHDRAWAL
When job satisfaction deteriorates to the point at which employeeswithdraw from work or the organization, either permanently ortemporarily, disaster can result. Several employee withdrawalmeasures are monitored and are often linked to performance

IDENTIFYING INTANGIBLE MEASURES 255
improvement programs. Additional information about employeewithdrawal measures outlined in this section can be found inother resources, including Accountability in Human ResourceManagement by Jack J. Phillips [3].
Employee Turnover
Perhaps the most critical employee withdrawal variable isemployee turnover. An extremely costly variable, turnover canhave devastating consequences on organizations when it is exces-sive. Redesign of employee benefits, addition of new benefits, andmany supervisor and team leader programs are designed to reduceemployee turnover. In many situations, turnover is actuallyconverted to monetary values, using one of the methods describedin Chapter 6. However, because of the multitude of costs andassumptions involved in developing the value, some organizationsprefer not to convert turnover to a monetary value. When thisis the case, turnover should be reported as an intangible benefit,reflecting the success of the HR initiatives.
Employee Absenteeism
Absenteeism is another disruptive and costly variable. ManyHR programs are designed to reduce absenteeism, and the impactof HR programs on absenteeism can usually be pinpointed by anevaluation impact study. Although the cost of absenteeism canbe developed, sometimes the conversion process does not holdenough credibility for some audiences, and consequently, absen-teeism changes are reported as intangible benefits.
Employee Tardiness
Many organizations actually monitor tardiness, especially withthe use of electronic and computerized time reporting. Tardiness,an irritating work habit problem, can cause inefficiencies anddelays. A few HR programs are designed to reduce it. Tardinessis very difficult to convert to a monetary value. Consequently,when tardiness is presented as an improvement influenced by anHR program, it is listed as an intangible benefit.

256 THE HUMAN RESOURCES SCORECARD
Employee Transfers
A unique way for employees to withdraw is to request atransfer to another section, department, or division of the organi-zation. Requests for transfers often reflect dissatisfaction with avariety of issues, including management, policies, and practices inthe organization. HR programs are sometimes designed to reduceor remove the unpleasant environmental influences that causedissatisfaction. In these situations, requests for transfers aremonitored and reported as an intangible benefit of an HR program.Usually no attempt is made to assign monetary values to transfers.
CUSTOMER SERVICE
Because of the importance of building and improving customerservice, a variety of measures are often monitored and reportedas a payoff of HR programs. Customer-service programs candirectly influence these measures. Because of the difficulty ofplacing values on them, customer service measures are not usuallyconverted to monetary values and are reported as intangiblebenefits. This section describes several measures.
Customer Satisfaction Survey Data
One of the most important measures is actual survey datashowing the degree to which customers are pleased with theproducts and services. These survey values, reported as absolutedata or as an index, represent important data against which tomeasure the success of customer service programs. Althoughtechniques are available to convert survey data to monetaryvalues in most situations, the conversion is rarely attempted.Consequently, customer service improvements are usually reportedas intangible benefits.
Customer Complaints
Most organizations monitor customer complaints. Each com-plaint is recorded along with the disposition and the time requiredto resolve the complaint, as well as specific costs associated withthe complaint resolution. Organizations sometimes design programs

IDENTIFYING INTANGIBLE MEASURES 257
to reduce the number of customer complaints. Because assigningan accurate monetary value to a customer complaint is difficult,the measure usually becomes a very important intangible benefit.
Customer Response Time
Providing prompt customer service is a critical issue in mostorganizations. Consequently, the time it takes to respond tospecific customer service requests or problems is recorded andmonitored. Response time reduction is sometimes an objective ofHR programs; however, the reduction is not usually convertedto monetary values. Thus, customer response time becomes animportant intangible benefit.
Other Customer Responses
A variety of other types of customer responses can be tracked,such as creativity of customer response, responsiveness to costand pricing issues, customer loyalty, and other important issuescustomers may specify or require. Monitoring these variables canprovide more evidence of the HR program’s results when theprogram influences particular variables. And because of thedifficulty of assigning values to the items, they are usuallyreported as intangible measures.
TEAM EFFECTIVENESS MEASURES
A variety of measures are often monitored to reflect how wellteams work. Although the output of teams and the quality of theirwork are often measured as hard data and converted to monetaryvalues, other interpersonal measures may be monitored andreported separately. This section represents a few of these measures.
Teamwork
Sometimes organizations survey team members before and aftera program to see if the level of teamwork increases as a resultof the program. The monetary value of increased teamwork israrely developed, and consequently, it is reported as an intang-ible benefit.

258 THE HUMAN RESOURCES SCORECARD
Cooperation
The success of a team often depends on the cooperative spiritof team members. Some instruments measure the level of coopera-tion before and after team structures are implemented. Becauseof the difficulty of converting this measure to a monetary value,it is always reported as an intangible benefit.
Conflict
In team environments, the level of conflict is often measured.A reduction in conflict may reflect the success of the introductionof teams into the workplace. In most situations, a monetary valueis not placed on conflict reduction, and it is reported as anintangible benefit.
Decisiveness
Teams make decisions, and the timing of the decision-makingprocess often becomes an issue. Consequently, decisiveness issometimes measured in terms of the speed at which decisions aremade. Survey measures may reflect the team’s perception or, insome cases, may monitor how quickly decisions are made. Someprograms are expected to influence the decision-making process,and improvements are usually reported as intangible benefits.
Communication
A variety of communication instruments reflect the quality andquantity of communication within a team. Changes in com-munication skills, or perceptions of skills, driven by an HRprogram are not usually converted to monetary values and arereported as an intangible benefit.
Other Team Measures
Although the previously listed measures are common, manyother potential measures are available to reflect the performanceand functioning of teams. Table 9-1 shows a report of the intan-gible measures after an organization had undertaken a team-building

ID
EN
TIF
YIN
G I
NT
AN
GIB
LE MEA
SUR
ES
259
Table 9-1A Sample of Intangible Measures of Team Effectiveness
Rank(By
Item # of Responses Point Range Total Points Point Average Average)
Clearly states mission/goals 7 4–6 34 4.9 4Operates creatively 7 3–7 37 5.3 2Focuses on results 7 4–5 31 4.3 6Clarifies roles and responsibilities 7 2–6 34 4.9 4Is well organized 7 4–6 36 5.1 3Builds upon individual strengths 7 5–7 41 5.9 1Supports leadership/each other 7 4–6 37 5.3 2Develops team climate 5 3–5 21 4.2 7Resolves disagreements 6 2–5 20 3.3 9Communicates openly 7 2–4 21 3.0 10Makes objective decisions 7 3–6 33 4.7 5Evaluates its own effectiveness 7 2–4 24 3.4 8
Source: Bader, G. E., Bloom, A. E., and Chang, R. Y. Measuring Team Performance. Irvine, Calif.: Richard Chang Associates,1994.

260 THE HUMAN RESOURCES SCORECARD
program. These measures, obtained as part of a survey process,show the possibilities for reflecting team success.
CONCLUSION
A variety of available intangible measures reflect the successof HR programs. Although they may not be perceived to be asvaluable as specific monetary measures, they are an importantpart of an overall evaluation. Intangible measures should beidentified, explored, examined, and monitored for changes whenthey are linked to the HR program. Collectively, they add aninteresting dimension to the overall program results, becausemost, if not all, programs have unique intangible measuresassociated with them. Although this chapter covered some of themost common intangibles, the coverage was not meant to becomplete. The number of intangible measures has almost no limit.
REFERENCES
1. Denzin, N. K., and Lincoln, Y. S. (Eds.) Handbook of QualitativeResearch. Thousand Oaks, Calif.: Sage Publications, 1994.
2. Gummesson, E. Qualitative Methods and Management Research (rev.ed.). Thousand Oaks, Calif.: Sage Publications, 1991.
3. Phillips, Jack J. Accountability in Human Resource Management.Houston: Gulf Publishing, 1996.
4. Bader, G. E., Bloom, A. E., and Chang, R. Y. Measuring TeamPerformance. Irvine, Calif.: Richard Chang Associates, 1994.

COMMUNICATING RESULTS 261
261
Chapter 10
CommunicatingResults
With data in hand, what’s next? Should the data be used tomodify the program, change the process, show the contribution,justify new programs, gain additional support, or build goodwill?How should the data be presented? The worst course of actionis to do nothing. Communicating results is as important asachieving results. Achieving results without communicating themis like planting seeds and failing to fertilize and cultivate theseedlings—the yield simply won’t be as great. This chapter pro-vides useful information to help present evaluation data to thevarious audiences using both oral and written reporting methods.

262 THE HUMAN RESOURCES SCORECARD
WHY BE CONCERNED ABOUT
COMMUNICATING RESULTS?
Communicating results is a critical issue in HR programs.While it is important to communicate achieved results to interestedstakeholders once the initiative is complete, it is also importantto communicate throughout the process. Constant communicationensures that information is flowing so adjustments can be madeand so that all stakeholders are aware of the success and issuessurrounding the program. There are at least five key reasons forbeing concerned about communication in an HR program.
Measurement and Evaluation MeanNothing Without Communication
As Mark Twain once said, “Collecting data is like collectinggarbage—pretty soon we will have to do something with it.” Ifsuccess is measured and evaluation data are collected, they meannothing unless the findings are communicated promptly to theappropriate audiences so they will be aware of what is occurringand can take action if necessary. Communication allows a fullloop to be made from the program results to necessary actionsbased on those results.
Communication Is Necessary to Make Improvements
Because information is collected at different points during theprocess, the communication or feedback to the various groupsthat will take action is the only way adjustments can be made.Thus, the quality and timeliness of communication become criticalissues for making necessary adjustments or improvements. Evenafter the program is completed, communication is necessary tomake sure the target audience fully understands the resultsachieved and how the results could either be enhanced in futureprograms or in the current program, if it is still operational.Communication is the key to making these important adjustmentsat all phases of the program.

COMMUNICATING RESULTS 263
Communication Is Necessary to Explain Contributions
The contribution of the HR program surrounding the six majortypes of measures is a confusing issue at best. The different targetaudiences will need a thorough explanation of the results. Acommunication strategy including techniques, media, and theoverall process will determine the extent to which they under-stand the contribution. Communicating results, particularly withbusiness impact and ROI, can quickly become confusing for eventhe most sophisticated target audiences. Communication must beplanned and implemented with the goal of making sure theaudiences understand the full contribution.
Communication Is a Sensitive Issue
Communication is one of those important issues that can causemajor problems. Because the results of an initiative can be closelylinked to the political issues in an organization, communicationcan upset some individuals while pleasing others. If certainindividuals do not receive the information or it is deliveredinconsistently from one group to another, problems can quicklysurface. Not only is it an understanding issue, it is also a fairness,quality, and political correctness issue to make sure communica-tion is properly constructed and effectively delivered to all keyindividuals who need the information.
A Variety of Target Audiences Need Different Information
Because there are so many potential target audiences forreceiving communication about the success of an HR initiative,it is important for the communication to be tailored directly totheir needs. A varied audience will command varied needs.Planning and effort are necessary to make sure the audiencereceives all of the information it needs, in the proper format, andat the proper time. A single report for all audiences may not beappropriate. The scope, size, media, and even the actual informa-tion of different types and different levels will vary significantlyfrom one group to another, making the target audience the keyto determining the appropriate communication process.

264 THE HUMAN RESOURCES SCORECARD
Collectively, these reasons make communication a critical issue,although it is often overlooked or underestimated in HR pro-grams. This chapter builds on this important issue and shows avariety of techniques for accomplishing all types of communica-tion for various target audiences.
PRINCIPLES OF COMMUNICATING RESULTS
The skills required to communicate results effectively arealmost as delicate and sophisticated as those needed to obtainresults. The style is as important as the substance. Regardless ofthe message, audience, or medium, a few general principles applyand are explored next.
Communication Must Be Timely
Usually, HR results should be communicated as soon as theyare known. From a practical standpoint, it may be best to delaythe communication until a convenient time, such as the pub-lication of the next client newsletter or the next general managementmeeting. Questions about timing must be answered. Is the audienceready for the results in light of other things that may havehappened? Is it expecting results? When is the best time forhaving the maximum effect on the audience? Are there circum-stances that dictate a change in the timing of the communication?
Communication Should Be Targeted to Specific Audiences
Communication will be more effective if it is designed for aparticular group. The message should be specifically tailored tothe interests, needs, and expectations of the target audience.
The results of an HR program are used in this chapter andreflect outcomes at all levels, including the six types of datadeveloped in this book. Some of the data are developed earlierin the program and communicated during the program. Otherdata are collected after the program’s implementation and com-municated in a follow-up study. Thus, the results, in their broadestsense, may involve early feedback in qualitative terms to ROIvalues in varying quantitative terms.

COMMUNICATING RESULTS 265
Media Should Be Carefully Selected
For particular groups, some media may be more effective thanothers. Face-to-face meetings may be better than special bulletins.A memo distributed exclusively to top management may be moreeffective than the company newsletter. The proper method ofcommunication can help improve the effectiveness of the process.
Communication Should Be Unbiased and Modest
It is important to separate fact from fiction and accuratestatements from opinions. Various audiences may accept com-munication from HR staff members with skepticism, anticipatingbiased opinions. Boastful statements sometimes turn off recipients,and most of the content is lost. Observable, believable facts carryfar more weight than extreme or sensational claims. Althoughsuch claims may get audience attention, they often detract fromthe importance of the results.
Communication Must Be Consistent
The timing and content of the communication should be con-sistent with past practices. A special communication at an unusualtime during the HR initiative may provoke suspicion. Also, if aparticular group, such as top management, regularly receivescommunication on HR outcomes, it should continue receivingcommunication—even if the results are not positive. If someresults are omitted, it might leave the impression that onlypositive results are reported.
Testimonials Are More Effective Comingfrom Individuals the Audience Respects
Opinions are strongly influenced by others, particularly thosewho are respected and trusted. Testimonials about HR results,when solicited from individuals respected by others in the organi-zation, can influence the effectiveness of the message. This respectmay be related to leadership ability, position, special skills, orknowledge. A testimonial from an individual who commands little

266 THE HUMAN RESOURCES SCORECARD
respect and is regarded as a substandard performer can have anegative impact on the message.
The Audience’s Opinion of the HR DepartmentWill Influence the Communication Strategy
Opinions are difficult to change, and a negative opinion of theHR staff members may not change with the mere presentationof facts. However, the presentation of facts alone may strengthenthe opinions held by those who already agree with the HR results.It helps reinforce their position and provides a defense in discus-sions with others. An HR department with a high level of credibilityand respect may have a relatively easy time communicating results.Low credibility can create problems when trying to be persuasive.The reputation of the department’s credibility is an importantconsideration in developing the overall strategy.
These general principles are important to the overall successof the communication effort. They should serve as a checklist forthe HR team when disseminating program results.
A MODEL FOR COMMUNICATING RESULTS
The process of communicating program results must be systematic,timely, and well-planned, as illustrated in the model in Figure 10-1.The model represents seven components of the communicationprocess that should normally occur in the sequence shown.
Figure 10-1.

COMMUNICATING RESULTS 267
The first step is one of the most important and consists of ananalysis of the need to communicate results from an HR program.Possibly, a lack of support for the HR effort was identified, andperhaps the need for making changes to or continuing to fundthe program was uncovered. There may be a need to restoreconfidence or build credibility for the HR program. Regardlessof the triggering events, an important first step is to outline thespecific reasons for communicating the results of the program.
The second step focuses on a plan for communication. Planningis very important and usually involves three types of plans ratherthan an overall plan for communicating results in all types of HRprograms. The first plan includes numerous issues to be addressedin all communication about the program. The second plan coversthe communication around the program, detailing exactly whatwill be communicated, when, and to which groups. The thirdplan covers communicating specific types of data, such as theresults at the end in terms of an impact study.
The third step involves selecting the target audiences forcommunication. Audiences range from top management to pastparticipants, all of which have their own special communicationneeds. All groups should be considered in the communicationstrategy. An artfully crafted, targeted communication may benecessary to win the approval of a specific group.
The fourth step involves developing written material to explainprogram results. This can include a wide variety of possibilities,from a brief summary of the results to a detailed research reporton the evaluation effort. Usually, a complete report is developed,and then selected parts or summaries from the report are usedfor different media.
Selecting the medium is the fifth step. Some groups respondmore favorably to certain methods of communication. A varietyof approaches, both oral and written, are available to theHR professional.
Information is presented in the sixth step. The product isdelivered with the utmost care, confidence, and professionalism.
The last step, but not the least significant, is analyzing reac-tions to the communications. Positive reactions, negative reactions,and a lack of comments are all indicators of how well theinformation was received and understood. An informational but

268 THE HUMAN RESOURCES SCORECARD
unscientific analysis may be appropriate for many situations.Tuning in to the reaction of a specific group may often suffice.For an extensive and more involved communication effort, aformal and structured feedback process may be necessary. Reac-tions could trigger an adjustment to the communication of thesame program results or provide input to make adjustments forfuture program communications.
This communications model is not intended to make the pro-cess complicated. Rather, it is a process to ensure clear, accurateinformation is provided to the appropriate audiences. More thanone audience usually receives the results of an HR initiative, andeach audience has its own unique needs. Each of the componentsin the model should be given consideration, if only informally,before the communications strategy is developed. Otherwise, thefull impact of the effort may be diminished. The various stepsin the model are amplified in the remainder of this chapter.
Analyzing the Need for Communication
Because there may be other reasons for communicating results,a list should be tailored to the organization and adjusted asnecessary. The reasons for communicating HR results depend onthe specific program, the setting, and the unique needs. The mostcommon reasons are:
� To secure approval for the HR program and allocate resourcesof time and money. The initial communication presents aproposal, projected ROI, or other data intended to securethe program approval. This communication may not havemuch data but rather anticipates what is to come.
� To gain support for the initiative and its objectives. It isimportant to have support from a variety of groups. Thiscommunication is intended to build the necessary supportto make the initiative work successfully.
� To secure agreement on the issues, solutions, and resources.As the program begins, it is important for all those directlyinvolved to have some agreement and understanding of theimportant elements and requirements surrounding the program.

COMMUNICATING RESULTS 269
� To build credibility for the HR department, its techniques,and the finished products. It is important early in theprocess to make sure that those involved understand theapproach and reputation of the HR department, and, basedon the approach taken, the commitments made by all parties.
� To reinforce the processes used in the HR initiative. It isimportant for key managers to support the initiative andreinforce the various processes used in the HR program.This communication is designed to enhance those processes.
� To drive action for improvement in the HR program. Thisearly communication is designed as a process improvementtool to effect changes and improvements as the needs areuncovered and suggestions are made by various individuals.
� To prepare participants for the HR program. It is necessaryfor those most directly involved in the program, theparticipants, to be prepared for assignments, roles, andresponsibilities that will be required of them as they bringsuccess to the initiative.
� To enhance results throughout the initiative and the qualityof future feedback. This communication is designed to showthe status of the program and to influence decisions, seeksupport, or communicate events and expectations to the keystakeholders. In addition, it will enhance both the qualityand quantity of information as stakeholders see the feedbackcycle in action.
� To show the complete results of the HR initiative. This isperhaps the most important communication, where all ofthe results involving all six types of measures are communi-cated to the appropriate individuals so they have a fullunderstanding of the success or shortcomings of the program.
� To underscore the importance of measuring results. Someindividuals need to understand the importance of measure-ment and evaluation and see the need for having importantdata on different measures.
� To explain techniques used to measure results. Severalindividuals on the client team and support staff need tounderstand the techniques used in measuring results. Insome cases, these techniques may be transferred internally

270 THE HUMAN RESOURCES SCORECARD
to use with other programs. In short, these individuals needto understand the soundness and theoretical framework ofthe process used.
� To stimulate desire in participants to be involved in theprogram. Ideally, HR participants want to be involved inthe initiative. This communication is designed to pique theirinterest in the program, the assignment, and their importanceto the program.
� To stimulate interest in the HR department’s products. Froman HR department perspective, some communications aredesigned to create interest in all of the products and servicesbased on the results obtained by the current productor process.
� To demonstrate accountability for client expenditures. It isimportant for a broad group to understand the need foraccountability and the approach of the HR department orstaff members. This ensures accountability for expenditureson the program.
� To market future HR initiatives. From an HR departmentperspective, it is important to build a database of successfulprograms to use in convincing others that the HR processcan add value.
Because there may be other reasons for communicating results,the list should be tailored to the individual organization.
Planning the Communication
Any type of successful activity must be carefully planned forit to produce the maximum results. This is a critical part ofcommunicating the results of HR initiatives. The actual planningof the communications is important to ensure that each audiencereceives the proper information at the right time and that appro-priate actions are taken. Three separate issues are important inplanning the communication of results, as presented next.
Communication Policy Issues. In examining the complete HRprocess, policy issues need to be developed around the com-

COMMUNICATING RESULTS 271
munication of results. These range from providing feedbackduring an initiative to communicating the ROI from an impactstudy. Policy issues rest with both the client and the HR depart-ment. Internally, the client group may want to develop the policyaround communication results as part of an overall policy on HRinitiatives. From the HR department standpoint, the policy maybe developed as part of the overall results-based approach to HRinitiatives. Seven different areas will need some attention as thepolicies are developed:
1. What will actually be communicated? It is important todetail the types of information communicated throughoutthe HR program—not only the six types of data from theROI process model but the overall progress with HR maybe a topic of communication as well.
2. When will the data be communicated? With communica-tions, timing is critical. If adjustments in the program needto be made, the information should be communicated quicklyso that swift actions can be taken.
3. How will the information be communicated? This shows thepreferences toward particular types of communication media.For example, some organizations prefer to have writtendocuments sent out as reports, while others prefer face-toface-meetings, and still others want electronic communica-tions used as much as possible.
4. The location for communication. Some prefer that thecommunication take place close to the HR program, othersprefer client offices, and still others prefer the HR depart-ment’s facilities. The location can be an important issue interms of convenience and perception.
5. Who will communicate the information? Will the HR group,an independent person, or an individual involved on theclient team communicate the information? The personcommunicating must have credibility so that the informationis believable.
6. The target audience. Identify specific target audiences thatshould always receive information and others that willreceive information when appropriate.

272 THE HUMAN RESOURCES SCORECARD
7. The specific actions that are required or desired. Wheninformation is presented, in some cases no action is needed;in others, changes are desired and sometimes even required.
Collectively these seven issues frame the policy around com-munication as a whole.
Planning the Communication Around the Entire Program. Whena program is approved, the communication plan is usuallydeveloped. This details how specific information is developedand communicated to various groups and the expected actions.In addition, this plan details how the overall results will becommunicated, the time frames for communication, and theappropriate groups to receive information. The client and HRdepartment need to agree on the extent of detail in the plan.
Communicating an Impact Study. The third issue is a plan aimedat presenting the results of an impact study. This occurs when amajor HR initiative is completed and the overall, detailed resultsare known. One of the major issues is who should receive theresults and in what form. This is more specialized than the planfor the entire program because it involves the final study fromthe program. Table 10-1 shows the communication plan for amajor team-based HR initiative that had a stress-reduction solu-tion. Teams were experiencing high levels of stress and, througha variety of activities and job changes, stress began to diminishamong the teams. The same process was made available to otherteams who were experiencing similar symptoms.
Five different communication pieces were developed for dif-ferent audiences. The complete report was an ROI impact study,a seventy-five-page report that served as the historical documentfor the program. It went to the client, the HR staff and theparticular manager of each of the teams involved in the studies.An executive summary, a much smaller document, went to someof the higher-level executives. A general interest overview andsummary without the ROI calculation went to the participants.A general-interest article was developed for company publications,and a brochure was developed to show the success of the HR

CO
MM
UN
ICAT
ING R
ESU
LTS
273Table 10-1
HR Program Communication Plan
Communication Document Communication Target(s) Distribution Method
Complete Report withAppendices (75 pages)
Executive Summary (8 pages)
General Interest Overview andSummary without the ActualROI Calculation (10 pages)
General Interest Article(1 page)
Brochure HighlightingProgram, Objectives, andSpecific Results
� Client Team
� HR Staff
� Intact Team Manager
� Senior Management in theBusiness Units
� Senior CorporateManagement
� Participants
� All Employees
� Team Leaders with anInterest in the Project
� Other Clients
Distribute and Discuss in aSpecial Meeting
Distribute and Discuss in aRoutine Meeting
Mail with Letter
Publish in CompanyPublication
Include with Other MarketingMaterials

274 THE HUMAN RESOURCES SCORECARD
program. That brochure was used in marketing the same processinternally to other teams and served as additional marketingmaterial for the HR department. This detailed plan may be partof the overall plan for the HR program but may be fine-tunedduring the actual process.
Collectively, these three types of plans underscore the importanceof organizing the communication strategy for a particular HRinitiative or the overall HR process in an organization.
Selecting the Audience for Communications
When approaching a particular audience, the following ques-tions should be asked about each potential group:
� Are they interested in the initiative?� Do they really want to receive the information?� Has someone already made a commitment to them regard-
ing communication?� Is the timing right for this audience?� Are they familiar with the initiative?� How do they prefer to have results communicated?� Do they know the HR staff members?� Are they likely to find the results threatening?� Which medium will be most convincing to this group?
For each target audience, three actions are needed:
1. To the greatest extent possible, the HR staff should knowand understand the target audience.
2. The HR staff should find out what information is neededand why. Each group will have its own needs relative tothe information desired. Some want detailed informationwhile others want brief information. Rely on the input fromothers to determine audience needs.
3. The HR staff should try to understand audience bias. Eachwill have a particular bias or opinion. Some will quicklysupport the results, whereas others may be against them orbe neutral. The staff should be empathetic and try to under-stand differing views. With this understanding, communi-

COMMUNICATING RESULTS 275
cations can be tailored to each group. This is especiallycritical when the potential exists for the audience to reactnegatively to the results.
The potential target audiences to receive information about HRresults are varied in terms of job levels and responsibilities.Determining which groups will receive a particular communica-tion piece deserves careful thought, as problems can arise whena particular group receives inappropriate information or whenanother is omitted altogether. A sound basis for proper audienceselection is to analyze the reason for communication, as discussedin an earlier section. Table 10-2 shows common target audiencesand the basis for selecting the audience.
Perhaps the most important audience is the client or clientteam. This group (or individual) initiates the program, reviewsdata, selects the HR team, and weighs the final assessment of theeffectiveness of the program. Another important target audienceis the top management group. This group is responsible forallocating resources to the HR initiative and needs informa-tion to help justify expenditures and gauge the effectiveness ofthe efforts.
Selected groups of managers (or all managers) are also importanttarget audiences. Management’s support and involvement in theHR process and the department’s credibility are important tosuccess. Effectively communicating program results to manage-ment can increase both support and credibility.
Communicating with the participants’ team leaders or imme-diate managers is essential. In many cases, they must encourageparticipants to implement the program. Also, they often supportand reinforce the objectives of the program. An appropriatereturn on investment improves the commitment to HR inter-ventions and provides credibility for the HR staff.
Occasionally, results are communicated to encourage participa-tion in the program. This is especially true for those programsoffered on a volunteer basis. The potential participants areimportant targets for communicating results.
HR program participants need feedback on the overall successof the effort. Some individuals may not have been as successfulas others in achieving the desired results. Communicating the

276T
HE H
UM
AN
RESO
UR
CES S
CO
REC
AR
D
Table 10-2Common Target Audiences
Reason for Communication Primary Target Audiences
To Secure Approval for the Initiative Client, Top Executives
To Gain Support for the Initiative Immediate Managers, Team Leaders
To Secure Agreement with the Issues Participants, Team Leaders
To Build Credibility for the HR Department Top Executives
To Enhance Reinforcement of the Processes Immediate Managers
To Drive Action for Improvement HR Staff Members
To Prepare Participants for the Program Team Leaders
To Enhance Results and Quality of Future Feedback Participants
To Show the Complete Results of the Initiative Client Team
To Underscore the Importance of Measuring Results Client, HR Staff Members
To Explain Techniques Used to Measure Results Client, Support Staff
To Create Desire for a Participant to Be Involved Team Leaders
To Stimulate Interest in the HR Department’s Products Top Executives
To Demonstrate Accountability for Client Expenditures All Employees
To Market Future HR Programs Prospective Clients

COMMUNICATING RESULTS 277
results adds additional pressure to effectively implement theprogram and improve results for the future. For those achievingexcellent results, the communication will serve as a reinforcementof the HR initiative. Communicating results to program partici-pants is often overlooked, with the assumption that since theprogram is over, they do not need to be informed of its success.
The HR staff must receive information about program results.Whether for small programs where staff members receive aprogram update, or for larger programs where a complete teamis involved, those who design, develop, facilitate, and implementthe program must be given information about its effectiveness.Evaluation information is necessary so adjustments can be madeif the program is not as effective as it could be.
The support staff should receive detailed information about theprocess to measure results. This group provides support servicesto the HR team, usually in the department where the programis conducted.
Company employees and stockholders may be less likely targets.General-interest news stories may increase employee respect. Good-will and positive attitudes toward the organization may also bebyproducts of communicating program results. Stockholders, on theother hand, are more interested in the return on their investment.
While Table 10-2 shows the most common target audiences,there can be others in a particular organization. For instance,management or employees can be subdivided into differentdepartments, divisions, or even subsidiaries of the organization.The number of audiences can be large in a complex organization.At a minimum, four target audiences are always recommended:a senior management group, the participants’ immediate manageror team leader, the program participants, and the HR staff.
Developing the Information: The Impact Study
The type of formal evaluation report depends on the extentof detailed information presented to the various target audiences.Brief summaries of program results with appropriate charts maybe sufficient for some communication efforts. In other situations,particularly with significant HR interventions requiring extensivefunding, the amount of detail in the evaluation report is morecrucial. A complete and comprehensive impact study report may

278 THE HUMAN RESOURCES SCORECARD
be necessary. This report can then be used as the basis of infor-mation for specific audiences and various media. The report maycontain the following sections.
Management/Executive Summary. The management summary isa brief overview of the entire report, explaining the basis for theevaluation and the significant conclusions and recommendations.It is designed for individuals who are too busy to read a detailedreport. It is usually written last but appears first in the reportfor easy access.
Background Information. The background information providesa general description of the program. If applicable, the needsassessment that led to the implementation of the program issummarized. The solution is fully described, including the eventsthat led to the HR initiative. Other specific items necessary toprovide a full description of the program are included. The extentof detailed information depends on the amount of informationthe audience needs.
Objectives. The objectives for both the program and the actualsolutions are outlined. Sometimes they are the same but may beseparate. The report details the particular objectives of the studyitself so that the reader clearly understands desired accomplish-ments for the program or initiative. In addition, if there werespecific HR solutions implemented during this process, they aredetailed here, as these are the issues or objectives from whichthe different types or levels of data will be collected.
Evaluation Strategy/Methodology. The evaluation strategy outlinesall the components that make up the total evaluation process. Severalcomponents of the results-based model and the ROI process pre-sented in this book are discussed in this section of the report. Thespecific purposes of evaluation are outlined, and the evaluationdesign and methodology are explained. The instruments used in datacollection are also described and presented as exhibits. Any unusualissues in the evaluation design are discussed. Finally, other usefulinformation related to the design, timing, and execution of theevaluation is included.

COMMUNICATING RESULTS 279
Data Collection and Analysis. This section explains the methods usedto collect data, as outlined in Chapters 3 and 4. The data collectedare usually presented in the report in summary form. Next, themethods used to analyze data are presented with interpretations.
Program Costs. Program costs are presented in this section. Asummary of the costs by category is included. For example,analysis, development, implementation, and evaluation costs arerecommended categories for cost presentation. The assumptionsmade in developing and classifying costs are discussed in thissection of the report.
Reaction and Satisfaction. This section details the data collectedfrom key stakeholders, particularly the participants involved inthe process, to measure the reaction to the HR program and alevel of satisfaction with various issues and parts of the process.Other input from the client group is also included to show thelevel of satisfaction.
Learning. This section shows a brief summary of the formal andinformal methods for measuring learning. It explains how par-ticipants have learned new processes, skills, tasks, procedures, andpractices from the HR program.
Application and Implementation. This section shows how theprogram was actually implemented and the success with theapplication of new skills and knowledge. Implementation issuesare addressed, including any major success and/or lack of success.
Business Impact. This section shows the actual business impactmeasures representing the business needs that initially drovethe program. This shows the extent to which performance haschanged during the implementation of the HR initiative.
Return on Investment. This section actually shows the ROIcalculation along with the benefits/cost ratio. It compares thevalue with what was expected and provides an interpretation ofthe actual calculation.

280 THE HUMAN RESOURCES SCORECARD
Intangible Measures. This section shows the various intangiblemeasures directly linked to the HR initiative. Intangibles are thosemeasures not converted to monetary values or included in the actualROI calculation.
Barriers and Enablers. The various problems and obstacles affect-ing the success of the program are detailed and presented asbarriers to implementation. Also, those factors or influences thathad a positive effect on the program are included as enablers.Together, they provide tremendous insight into what can hinderor enhance programs in the future.
Conclusions and Recommendations. This section presents con-clusions based on all the results. If appropriate, brief explanationsare presented on how each conclusion was reached. A list ofrecommendations or changes in the program, if appropriate, isprovided with brief explanations for each recommendation. It isimportant that the conclusions and recommendations are con-sistent with one another and with the findings described in theprevious section.
These components make up the major parts of a completeevaluation report.
Developing the Report. Table 10-3 shows the table of contentsfrom a typical evaluation report for an ROI evaluation. Thisspecific study was conducted for a large financial institution andinvolved an ROI analysis on an HR program for commercialbanking. The typical report provides background informa-tion, explains the processes used and, most importantly, presentsthe results.
While this report is an effective, professional way to presentROI data, several cautions need to be followed. Because thisdocument reports the success of an HR initiative involving agroup of employees, complete credit for the success must go tothe participants and their immediate leaders. Their performancegenerated the success. Another important caution is to avoidboasting about results. Although the ROI process may be accurateand credible, it still may have some subjective issues. Huge claimsof success can quickly turn off an audience and interfere withthe delivery of the desired message.

COMMUNICATING RESULTS 281
Table 10-3Format of an Impact Study Report
� General Information• Background• Objectives of Study
� Methodology for Impact Study• Levels of Evaluation• ROI Process• Collecting Data• Isolating the Effects of HR• Converting Data to Monetary Values
� Data Analysis Issues� Costs� Results: General Information
• Response Profile• Success with Objectives
� Results: Reaction and Satisfaction• Data Sources• Data Summary• Key Issues
� Results: Learning• Data Sources• Data Summary• Key Issues
� Results: Application and Implementation• Data Sources• Data Summary• Key Issues
� Results: Business Impact• General Comments• Linkage with Business Measures• Key Issues
� Results: ROI and Its Meaning� Results: Intangible Measures� Barriers and Enablers
• Barriers• Enablers
� Conclusions and Recommendations• Conclusions• Recommendations
� Exhibits

282 THE HUMAN RESOURCES SCORECARD
A final caution concerns the structure of the report. Themethodology should be clearly explained, along with assumptionsmade in the analysis. The reader should readily see how thevalues were developed and how the specific steps were followedto make the process more conservative, credible, and accurate.Detailed statistical analyses should be placed in the appendix.
Selecting the Communication Media
There are many options available to communicate programresults. In addition to the impact study report, the most frequentlyused media are meetings, interim and progress reports, the organi-zation’s publications, and case studies.
Meetings. Meetings are fertile opportunities for communicatingprogram results, if used properly. All organizations have a varietyof meetings and, in each, the proper context and HR resultsare an important part. A few examples illustrate the varietyof meetings.
Staff Meetings. Throughout the chain of command, staff meetingsare held to review progress, discuss current problems, and distri-bute information. These meetings can be an excellent forum fordiscussing the results achieved in an HR initiative when it relatesto the group’s activities. Program results can be sent to executivesfor use in staff meetings, or a member of the HR team can attendthe meeting to make the presentation.
Manager Meetings. Regular meetings with the first-level manage-ment group are quite common. Typically, items are discussed thatwill possibly help their work units. A discussion of an HRprogram and the subsequent results can be integrated into theregular meeting format.
Panel Discussions. Although not common in all organizations,panel discussions can be very helpful in showing how a problemwas solved. A typical panel might include two or more managersor team leaders discussing their approach to a solution of aproblem common to other areas. A successful discussion based

COMMUNICATING RESULTS 283
on the results of a recent program can provide convincing datato other managers.
Best Practices Meetings. Some organizations have best practicesmeetings or video conferences to discuss recent successes and bestpractices. This is an excellent opportunity to learn and sharemethodologies and results.
Business Update Meetings. A few organizations have initiated aperiodic meeting for all members of management, in which theCEO reviews progress and discusses plans for the coming year.A few highlights of HR program results can be integrated intothe CEO’s speech, showing top executive interest, commitment,and support. HR results are mentioned along with operatingprofit, new facilities and equipment, new company acquisitions,and next year’s sales forecast.
Whenever a management group convenes in significant num-bers, evaluate the appropriateness of communicating HR pro-gram results.
Interim and Progress Reports. Although usually limited to large-scale initiatives, a highly visible way to communicate results isthrough interim and routine memos and reports. Published ordisseminated via computer intranet on a periodic basis, theyusually have several purposes:
� To inform management about the status of the program� To communicate the interim results achieved in the
HR initiative� To activate needed changes and improvements
A more subtle reason for the report is to gain additionalsupport and commitment from the management group and tokeep the program intact. This report is produced by the HR staffand distributed to a select group of managers in the organization.Format and scope vary considerably. Common topics are pre-sented here.

284 THE HUMAN RESOURCES SCORECARD
Schedule of Activities. A schedule of planned steps/activitiesshould be an integral part of this report. A brief description shouldbe presented.
Reactions from Program Participants. A brief summary of reac-tion evaluations may be appropriate to report initial success. Also,brief interviews with participants might be included.
Program Results. A key focus of this report is the results achievedfrom the HR program. Significant results that can be documentedshould be presented in an easily understood format. The method(s)of evaluation should be briefly outlined, along with the measure-ment data.
Support Team Member Spotlight. A section that features a keysupport team member can be very useful. Emphasis is placed onthe member’s efforts and involvement in HR activity. Statementsor interview comments may be useful.
Change in Responsibility. Occasionally, people involved in plan-ning, developing, implementing, or evaluating the program arereassigned, transferred, or promoted. It is important to communi-cate how these changes affect responsibilities and the program.
Participant Spotlight. A section that highlights a member of theclient team can focus additional attention on results. This is anopportunity to recognize outstanding participants responsiblefor excellent results with the program and bring attention tounusual achievements.
While the previous list may not be suited for every report, itrepresents topics that should be presented to the managementgroup. When produced in a professional manner, the report canimprove management support and commitment to the effort.
The Organization’s Publications and Standard CommunicationTools. To reach a wide audience, the HR department can use in-house publications. Whether a newsletter, magazine, newspaper,or electronic file, these types of media usually reach all employees.The information can be quite effective if communicated appro-

COMMUNICATING RESULTS 285
priately. The scope should be limited to general interest articles,announcements, and interviews. Following are types of issues thatshould be covered in these publications.
Program Results. Results communicated through these types ofmedia must be significant enough to arouse general interest. Forexample, a story with the headline, “Safety program helps pro-duce one million hours without a lost-time accident,” will catchthe attention of many people because they may have participatedin the program and can appreciate the significance of the results.Reports on the accomplishments of a group of participants maynot create interest unless the audience relates to the accomplishments.
For many HR initiatives, results are achieved weeks or evenmonths after the program is completed. Participants need rein-forcement from many sources. If results are communicated to ageneral audience, including the participant’s subordinates or peers,there is additional pressure to continue the program or similarones in the future.
Building Interest. Stories about participants involved in an HRinitiative and the results they achieve create a favorable image.Employees are made aware that the company is investing timeand money to improve performance and prepare for the future.This type of story provides information about programs thatemployees otherwise may not have known about and sometimescreates a desire to participate if given the opportunity.
Participant Recognition. General audience communication canbring recognition to program participants, particularly thosewho excel in some aspect of the program. When participantsdeliver unusual performance, public recognition can enhancetheir self-esteem.
Human Interest Stories. Many human interest stories can comeout of HR initiatives. A rigorous program with difficult require-ments can provide the basis for an interesting story about partici-pants who implement the program.
In one organization, the editor of the company newsletterparticipated in a demanding HR program and wrote a stimulating

286 THE HUMAN RESOURCES SCORECARD
article about what it was like to be a participant. The article gavethe reader a tour of the entire program and its effectiveness interms of the results achieved. It was an interesting and effectiveway to communicate about a challenging activity.
The benefits are many and the opportunities endless for HRprofessionals to use in-house publications and company-wideintranets to let others know about the success of programs.
E-mail and Electronic Media. Internal and external Web pageson the Internet, company-wide intranets, and e-mail are excellentvehicles for releasing results, promoting ideas, and informingemployees and other target groups of HR results. E-mail,in particular, provides a virtually instantaneous means withwhich to communicate and solicit response from large numbersof people.
Program Brochures and Pamphlets. A brochure might be appro-priate for programs conducted on a continuing basis, whereparticipants have produced excellent results. It should be attrac-tive and present a complete description of the program, with amajor section devoted to results obtained with previous par-ticipants, if available. Measurable results and reactions fromparticipants, or even direct quotes from individuals, could addspice to an otherwise dull brochure.
Case Studies. Case studies represent an effective way to com-municate the results of an HR initiative. Consequently, it isrecommended that a few programs be developed in a case format.A typical case study describes the situation, provides appropriatebackground information (including the events that led to theinitiative), presents the techniques and strategies used to developthe study, and highlights the key issues in the program. Casestudies tell an interesting story of how the evaluation was developedand the problems and concerns identified along the way.
Case studies have many useful applications in an organization.First, they can be used in group discussions, where interestedindividuals can react to the material, offer different perspectives,and draw conclusions about approaches or techniques. Second,the case study can serve as a self-teaching guide for individuals

COMMUNICATING RESULTS 287
trying to understand how evaluations are developed and used inthe organization. Finally, case studies provide appropriate recogni-tion for those involved in the actual case. More importantly, theyrecognize the participants who achieved the results, as well asthe managers who allowed the participants to be involved in theprogram. The case study format has become one of the mosteffective ways to learn about program evaluation.
A Case Example. The various methods for communicating resultscan be creatively combined to fit any situation. Here is an effectiveexample using three approaches: a case study, management meet-ings, and a brochure.
The production division of a manufacturing company hadachieved outstanding results through an HR initiative involvingprocesses and work flow. The results were in the form of keybottom-line measures, such as lost-time accidents, grievances,scrap rate, and unit hour. The unit hour was a basic measure ofindividual productivity.
These results were achieved through the efforts of the super-visors applying and implementing several HR solutions. This factwas discretely mentioned at the beginning of a presentation madeby two of the supervisors. In a panel discussion format with amoderator, the two supervisors outlined the accuracy of theresults. This was presented in a question-and-answer sessionduring a monthly meeting for all supervisors. The supervisorsmentioned that the results were linked to the HR program.
The comments were published in a brochure and distributedto all supervisors through their department managers. The titleof the publication is “Getting Results: A Success Story.” On theinside cover, specific results are detailed, along with additionalinformation on the program. A close-up photograph of eachsupervisor, taken during the panel discussion, is included on thispage. The next two pages present a summary of the techniquesused to secure the results. The brochure was used in staff meet-ings as a discussion guide to cover the points from the paneldiscussion. Top executives were also sent copies. In addition, thediscussion was videotaped and used in subsequent interventionsas a model of application for workplace changes to improveperformance. The brochure also served as a handout.

288 THE HUMAN RESOURCES SCORECARD
The communication effort was a success. All levels of manage-ment had favorable responses and top executives asked the HRdepartment to implement similar programs in other areas.
Communicating the Information
Perhaps the biggest challenge of communication is the actualdelivery of the message. This can be accomplished in a varietyof ways and settings based on the actual target audience and themedia selected for the message. Three particular approachesdeserve additional coverage. The first approach is providinginsight into how to provide feedback throughout the HR programto make sure information flows so changes can be made. Thesecond is presenting an impact study to a senior managementteam. This may be one of the most challenging tasks for the HRdepartment. The third is communicating regularly and routinelywith the executive management group. Each of these threeapproaches is explored in more detail.
Providing Feedback. One of the most important reasons forcollecting reaction, satisfaction, and learning data is to providefeedback so adjustments or changes can be made throughout theHR program. In most HR initiatives, data are routinely collectedand quickly communicated to a variety of groups. Table 10-4 showsa feedback action plan designed to provide information to severalfeedback audiences using a variety of media.
As the plan shows, data are collected during the program atfour specific time intervals and communicated back to at leastfour audiences—and sometimes six. Some of these feedbacksessions result in identifying specific actions that need to be taken.This process becomes comprehensive and needs to be managedin a very proactive way. The following steps are recommendedfor providing feedback and managing the feedback process. Manyof the steps and issues follow the recommendations of Peter Blockin his successful book, Flawless Consulting.
1. Communicate quickly. Whether it is good news or badnews, it is important to let individuals involved in theprogram have the information as soon as possible. The

COMMUNICATING RESULTS 289
recommended time for providing feedback is usually amatter of days and certainly no longer than a week or twoafter the results are known.
2. Simplify the data. Condense data into an understandable,concise presentation. This is not the format for detailedexplanations and analysis.
3. Examine the role of the HR team and the client in thefeedback situation. Sometimes the HR team is the judge, andsometimes the HR team is the jury, prosecutor, defendant,or witness. On the other hand, sometimes the client is thejudge, jury, prosecutor, defendant, or witness. It is importantto examine the respective roles in terms of reactions to thedata and the actions that need to be taken.
4. Use negative data in a constructive way. Some of the datawill show that things are not going so well, and the faultmay rest with the HR department or the client. In either case,the story basically changes from “Let’s look at the successwe’ve made” to “Now we know which areas to change.”
5. Use positive data in a cautious way. Positive data can bemisleading, and if they are communicated too enthusiastically,they may create expectations beyond what may materializelater. Positive data should be presented in a cautious way—almost in a discounting mode.
6. Choose the language of the meeting and communicationvery carefully. Use language that is descriptive, focused,specific, short, and simple. Avoid language that is toojudgmental, macro, stereotypical, lengthy, or complex.
7. Ask the client for reactions to the data. After all, the clientis the No. 1 customer, and the client’s reaction is criticalsince it is most important that the client is pleased withthe program.
8. Ask the client for recommendations. The client may havesome good recommendations of what needs to be changedto keep a program on track or put it back on track ifit derails.
9. Use support and confrontation carefully. These two issuesare not mutually exclusive. There may be times whensupport and confrontation are needed for the same group.The client may need support and yet be confronted for

290T
HE H
UM
AN
RESO
UR
CES S
CO
REC
AR
D
Data Collection Item
1. Pre-project Survey� Climate/
Environment� Issue Identification
2. ImplementationSurvey� Reaction to Plans� Issue Identification
Timing
Beginning ofthe Program
Beginningof ActualImplementation
FeedbackAudience
Client TeamParticipants
Team Leaders
HR Staff
Client TeamParticipants
Team Leaders
HR Staff
Media
Meeting
SurveySummary
SurveySummary
Meeting
Meeting
SurveySummary
SurveySummary
Meeting
Timing ofFeedback
One Week
Two Weeks
Two Weeks
One Week
One Week
Two Weeks
Two Weeks
One Week
Action Required
None
None
Communicate Feedback
Adjust Approach
None
None
Communicate Feedback
Adjust Approach
Comments
Table 10-4Feedback Action Plan

CO
MM
UN
ICAT
ING R
ESU
LTS
2913. Implementation
Reaction Survey/Interviews� Reaction to
Solution� Suggested Changes
4. ImplementationFeedbackQuestionnaire� Reaction
(Satisfaction)� Barriers� Projected Success
One MonthintoImplementation
End ofImplementation
Client Team
Participants
Support Staff
Team Leaders
ImmediateManagers
HR Staff
Client Team
Participants
Support Staff
Team Leaders
ImmediateManagers
HR Staff
Meeting
StudySummary
StudySummary
StudySummary
StudySummary
Meeting
Meeting
StudySummary
StudySummary
StudySummary
StudySummary
Meeting
One Week
Two Weeks
Two Weeks
Two Weeks
Three Weeks
Three Days
One Week
Two Weeks
Two Weeks
Two Weeks
Three Weeks
Three Days
None
None
Support Changes
Support Changes
Adjust Approach
Comments
None
None
Support Changes
Support Changes
Adjust Approach

292 THE HUMAN RESOURCES SCORECARD
lack of improvement or sponsorship. The HR team maybe confronted on the problem areas that are developed butmay need support as well.
10. React and act on the data. Weigh the different alternativesand possibilities to arrive at the adjustments and changesthat will be necessary.
11. Secure agreement from all key stakeholders. This is essentialto make sure everyone is willing to make adjustments andchanges that seem necessary.
12. Keep the feedback process short. Don’t let it becomebogged down in long, drawn-out meetings or lengthydocuments. If this occurs, stakeholders will avoid theprocess instead of being willing to participate in the future.
Following these twelve steps will help move the programforward and provide important feedback, often ensuring thatadjustments are supported and made.
Presenting Impact Study Data to Senior Management. Perhaps oneof the most challenging and stressful communications is pre-senting an impact study to the senior management team, whichalso serves as the client in an HR program. The challenge isconvincing this highly skeptical and critical group that out-standing results have been achieved (assuming they have), in areasonable time frame, addressing the salient points, and makingsure the managers understand the process. Two particular issuescan create challenges. First, if the results are impressive, it maybe difficult to make the managers believe the data. On the otherextreme, if the data are negative, it will be a challenge to makesure managers don’t overreact to the negative results and lookfor someone to blame. Following are guidelines that can helpmake sure this process is planned and executed properly:
� Plan a face-to-face meeting with senior team members forthe first one or two major impact studies. If they areunfamiliar with the complete ROI process, a face-to-facemeeting is necessary to make sure they understand theprocess. The good news is that they will probably attendthe meeting because they have not seen ROI data developed

COMMUNICATING RESULTS 293
for this type of program. The bad news is that it takes alot of time, usually one to two hours for this presentation.
� After a group has had a face-to-face meeting with a coupleof presentations, an executive summary may suffice. At thispoint they understand the process, so a shortened versionmay be appropriate.
� After the target audience is familiar with the process, a briefversion may be necessary, which will involve a one- to two-page summary with charts and graphs showing all six typesof measures.
� In making the initial presentation, the results should not bedistributed beforehand or even during the session but saveduntil the end of the session. This will allow enough timeto present the process and react to it before the targetaudience sees the actual ROI number.
� Present the process step by step, showing how the data werecollected, when they were collected, who provided the data,how the data were isolated from other influences, andhow they were converted to monetary values. The variousassumptions, adjustments, and conservative approaches arepresented along with the total cost of the initiative. Thecosts are fully loaded so that the target audience will beginto buy into the process of developing the actual ROI.
� When the data are actually presented, the results are pre-sented step-by-step, starting with Level 1, moving throughLevel 5, and ending with the intangibles. This allows theaudience to see the reaction and satisfaction, learning,application and implementation, business impact, and ROI.After some discussion about the meaning of the ROI, theintangible measures are presented. Allocate time to eachlevel as appropriate for the audience. This helps overcomethe potentially negative reactions to a very positive ornegative ROI.
� Show the consequences of additional accuracy if it is anissue. The tradeoff for more accuracy and validity oftenmeans more expense. Address this issue whenever necessary,agreeing to add more data if required.
� Collect concerns, reactions, and issues for the process andmake adjustments accordingly for the next presentation.

294 THE HUMAN RESOURCES SCORECARD
Collectively, these steps will help prepare for and present oneof the most critical meetings in the human resources ROI process.
Communicating with Executive Management and Clients. Nogroup is more important than top executives when it comes tocommunicating HR results. In many situations, this group is alsothe client. Improving communications with this group requiresdeveloping an overall strategy, which may include all or part ofthe actions outlined next.
Strengthen the Relationship with Executives. An informal andproductive relationship should be established between the HRgroup responsible for the program and the top executive at thelocation where the program is taking place. Each should feelcomfortable discussing needs and program results. One approachis to establish frequent, informal meetings with the executive toreview problems with current programs and discuss other per-formance problems/opportunities in the organization. Frank andopen discussions can provide the executive with insight notpossible from any other source. Also, it can be very helpful tothe HR group in determining the direction of the initiative.
Show How HR Programs Have Helped Solve Major Problems.While hard results from recent programs are comforting to anexecutive, solutions to immediate problems may be more con-vincing. This is an excellent opportunity to discuss a possiblefuture initiative.
Distribute Memos About Program Results. When an initiative hasachieved significant results, make appropriate top executivesaware of them. This can easily be done with a brief memo orsummary outlining what the program was supposed to accomplish,when it was implemented, who was involved, and the resultsachieved. This should be presented in a for-your-informationformat that consists of facts rather than opinions. A full reportmay be presented later.
All significant communications about HR programs, plans,activities, and results should include the executive group. Frequentinformation from the HR programs, as long as it is not boastful,can reinforce credibility and accomplishments.

COMMUNICATING RESULTS 295
Ask the Executive to Be Involved in the Review. An effective wayto enhance commitment from top executives is to ask them toserve on an HR review committee. A review committee providesinput and advice to the HR staff about a variety of issues,including needs, problems with the present program, and programevaluation issues. This committee can be helpful in letting execu-tives know what the programs are achieving.
Conduct an HR Review. An HR review meeting is an effectiveway to communicate results to top executives. While this reviewcan be conducted more frequently, an annual basis is common.The primary purpose is to show top management what has beenaccomplished with HR and what is planned for the future. It canlast from two hours to two days depending on the scope of themeeting and the amount of HR activity. This meeting is bestsuited for situations in which there are long-term programs, long-term relationships, and/or multiple programs with the same firm.A typical agenda for this review meeting is shown in Table 10-5.
This meeting may be the single most important event on theHR department’s calendar during the year. It must be plannedcarefully, timely, well-executed, and controlled to accomplish itspurpose. This approach has been used in many organizations, andthe reaction has been extremely favorable. Executive managerswant to know what the organization is accomplishing, whatresults have been achieved and, most of all, they want to haveinput on the decisions for new programs.
Analyzing Reactions to Communication
The best indicator of how effectively the results of an HRprogram have been communicated is the level of commitment andsupport from the management group. The allocation of requestedresources and strong commitment from top management aretangible evidence of management’s perception of the results. Inaddition to this macro-level reaction, there are a few techniquesHR professionals can use to measure the effectiveness of theircommunication efforts.
Whenever results are communicated, the reaction of the targetaudiences can be monitored. These reactions may include non-verbal gestures, oral remarks, written comments, or indirect

296 THE HUMAN RESOURCES SCORECARD
actions that reveal how the communication was received. Usually,when results are presented in a meeting, the presenter willhave some indication of how the results were received by thegroup. The interest and attitudes of the audience can usually bequickly evaluated.
During the presentation, questions may be asked or, in somecases, the information is challenged. In addition, a tabulation ofthese challenges and questions can be useful in evaluating the typeof information to include in future communications. Positivecomments about the results are certainly desired and, when theyare made—formally or informally—they should also be notedand tabulated.
Table 10-5Annual HR Review Agenda
Time Annual Review Meeting Topic
8:00 a.m. Review of HR for the past year
8:30 Evaluation strategy for each program and the resultsachieved
9:30 Significant deviations from the expected results (bothpositive and negative)
10:00 Break
10:15 Basis for determining needs for the next year
10:30 Anticipated programs for the coming year (securesupport and approval)
10:45 Proposed evaluation strategy and potential payoffs
11:00 Problem areas in the HR process (lack of support,where management involvement is needed, or otherpotential problems that can be corrected by executivemanagement)
11:30 Concerns of executive management
Noon Adjourn

COMMUNICATING RESULTS 297
HR staff meetings are an excellent arena for discussing thereaction to communicating results. Comments can come frommany sources depending on the particular target audiences. Inputfrom different members of the staff can be summarized to helpjudge the overall effectiveness.
When major program results are communicated, a feedbackquestionnaire may be used for an entire audience or a sample ofthe audience. The purpose of this questionnaire is to determinethe extent to which the audience understood and/or believed theinformation presented. This is practical only when the effective-ness of the communication has a significant impact on the futureactions of the HR department.
Another approach is to survey the management group todetermine its perceptions of the results. Specific questions shouldbe asked about results. What does the management group knowabout the results? How believable are the results? What addi-tional information is desired about the program? This type ofsurvey can help provide guidance in communicating results.
The purpose of analyzing reactions is to make adjustments inthe communication process—if adjustments are necessary. Althoughthe reactions may involve intuitive assessments, a more sophisti-cated analysis will provide more accurate information to makethese adjustments. The net result should be a more effectivecommunication process.
SHORTCUT WAYS TO PROVIDE FEEDBACK
AND COMMUNICATE WITH CLIENTS
Although this chapter has presented a full array of possibilitiesfor all types of programs, a simplified and shortcut approach maybe appropriate for small-scale projects and inexpensiveHR initiatives. The following five issues can be addressed withminimal time.
1. Planning can be very simple and occupy only one block inthe evaluation planning document. It is helpful to reach anagreement as to who will see the data and when they willreceive the data.

298 THE HUMAN RESOURCES SCORECARD
2. Feedback during a program should be simplified using aquestionnaire, followed by a brief meeting to communicatethe results. This is almost informal but should address asmany of the issues outlined in this chapter as possible. Mostimportantly, it should be kept simple and should lead toaction if it is needed.
3. An impact study should be developed showing the actualsuccess of the program, preferably with all six types of data.If certain types of data have been omitted, the impact studyshould be developed with the data that are available, follow-ing the appropriate areas or topics contained in an impactstudy, as outlined in this chapter.
4. The impact study results should be presented in a face-to-face meeting with the clients and perhaps with the executivegroup if they are not the same group. This is usually ameeting that will be easy to schedule and necessary fromthe perspectives of both the client and the HR team. A one-hour meeting can show the results of the program andrespond to various issues. Using suggestions for conductingthis meeting, as outlined in this chapter, would be helpfulin this situation.
5. Keep impact study data for marketing purposes. From theperspective of the HR department, these are excellent market-ing data that can be used in a generic way to convinceothers that the HR program is successful. From the client’sperspective, this is a historical document that leaves apermanent record of success and can be used as a referencein the future. When communicating results from paststudies, client confidentiality and protection of sensitiveinformation should be honored.
FINAL THOUGHTS
This chapter presented the final step in the results-basedapproach to HR accountability, as shown in the ROI model.Communicating results is a crucial step in the overall evaluationprocess. If this step is not taken seriously, the full impact of theresults will not be realized. The chapter began with generalprinciples for communicating program results. A communications

COMMUNICATING RESULTS 299
model was presented, which can serve as a guide for any signif-icant communication effort. The various target audiences werediscussed and, because of its importance, emphasis was placedon the executive group. A suggested format for a detailed evalua-tion report was also provided. Much of the remainder of thechapter included a detailed presentation of the most commonlyused media for communicating program results, including meet-ings, client publications and electronic media. Numerous examplesillustrated these concepts.


P a r t III
Important Issueswith ROI
Implementation
302 THE HUMAN RESOURCES SCORECARD
302
Chapter 11
Forecastingthe ROI
Sometimes it is confusing to know when it is appropriate todevelop the ROI, what types of data to collect, and what levelof evaluation is most appropriate for an ROI calculation. Thetraditional and recommended approach, described in the previouschapters, is to base ROI calculations strictly on business resultsobtained from the HR program or initiative. Business performancemeasures (Level 4 data) are easily converted to monetary values,which is necessary for an ROI calculation. Sometimes thesemeasures are not available, and it appears that an ROI calculationis out of the question. This chapter will illustrate that ROIcalculations are possible at various times, including before theproject is initiated.
WHY FORECAST ROI?
Although calculating ROI based on post-project data is themost accurate way to assess and develop an ROI calculation,sometimes it is important to know the actual forecast before thefinal results are tabulated. Forecasting during the project, or evenbefore the project is pursued in some cases, is an important issuewhen critical reasons drive the need for a forecasted ROI.
To reduce uncertainty. Whenever uncertainty can be reducedin a project, doing so benefits the client. In a perfect world, theclient would like to know the expected payoff from any businessdecision. Realistically, forecasting the exact payoff may not bepossible, and from a practical standpoint, it may not be feasible.Still, there remains the desire to take the uncertainty out of the

FORECASTING THE ROI 303
equation and to act on the best data available. This sometimespushes the project to a forecasted ROI before any resources areexpended. Some managers will simply not budge without a pre-project forecast. They need some measure of expected successbefore allocating any resources to the project.
Because the cost of a project is too expensive without somedata. In some cases even a pilot project is not practical until someanalysis has been conducted to examine the potential ROI. Forexample, if the HR program involves a significant amount ofresources in the design, development, and delivery, a client maynot want to expend the resources even for a pilot group unlessthere is some assurance of a likelihood of success with a positiveROI. Although there may be some tradeoffs with a lower profileand lower-cost pilot program, the pre-program ROI neverthelessbecomes an important issue in these situations, prompting someclients to stand firm until an ROI forecast is produced.
To compare with post data. Whenever there is a plan to collectdata about the success of the HR program regarding application,implementation, impact, and ROI, it helps to compare actualresults with pre-project expectations. In an ideal world, if fore-casted ROI should have a defined relationship with the actualROI, they should be very similar, or at least one should lead tothe other with some adjustments. One of the important reasonsfor forecasting ROI is to see how well the forecast holds up underscrutiny of the post-project analysis.
To save costs. Several cost saving issues prompt the ROIforecast. First, the forecast itself often costs very little because itinvolves estimations and many different assumptions. Second, ifthe forecast itself becomes a reliable predictor of the post-projectanalysis, then the forecasted ROI might substitute for the actualROI—at least with some adjustments. This could save costs onthe post-project analysis. Finally, the forecasted ROI data mightbe used for comparisons in other areas for other types of HRprograms. Thus, the forecasted ROI might have some potentialtransfer benefit to specific projects.
To comply with policy. More and more organizations aredeveloping policy statements and, in the case of governmentagencies, sometimes even passing laws to require a forecasted ROIbefore undertaking major projects. For example, any projectcosting more than $300,000 must have a forecasted ROI before

304 THE HUMAN RESOURCES SCORECARD
the organization can approve it. In a government outside theUnited States, vendors can receive partial payments on a projectif the ROI forecast is positive and likely to enhance the organi-zation. This formal policy is becoming a frequent reason fordeveloping the ROI forecast.
Collectively, these five reasons are causing many organizationsto look at pre-program forecast, or at least a projection duringthe program, so that the client and the HR team will have someestimate of the expected payoff.
THE TRADEOFFS OF FORECASTING
The actual ROI can be developed at different times and atdifferent levels. Unfortunately, the ease, convenience, and low costinvolved in capturing a forecasted ROI has its tradeoff in accuracyand credibility. As Figure 11-1 shows, there are five distinct timeintervals during a project when the ROI can actually be developed.This figure shows the relationship of each level of evaluation withcredibility, accuracy, cost, and difficulty. These levels and timeintervals are as follows:
a. A pre-project forecast can be developed using estimates ofthe impact of the program. This approach lacks accuracy,but it is also the least expensive and least difficult ROI tocalculate. There is value in developing the ROI on a pre-project basis, and the next section discusses this.
b. Reaction and satisfaction data can be developed and extendedto determine an anticipated impact including the ROI. Inthis case, participants actually anticipate and project theimpact as the HR program is applied and implemented andas it influences specific business measures. Although theaccuracy and credibility increase from the pre-project basis,this approach still lacks the credibility and accuracy desiredfor most situations.
c. Learning data in some projects can be used to forecast theactual ROI. This approach applies only when formal testinghas shown a relationship between acquiring certain skills orknowledge and subsequent performance. When this correla-tion is available (it is usually developed to validate the test),test data can be used to forecast subsequent performance.

FO
REC
AST
ING
TH
E RO
I305
Data CollectionTiming (relative Cost to
ROI with: to project) Credibility Accuracy Develop Difficult
Pre-project Forecast Before Project Not Very Not Very Inexpensive Not DifficultCredible Accurate
Reaction and SatisfactionData During Project
Learning Data During Project
Application andImplementation After Project
Business Impact Data After Project Very Very Expensive VeryCredible Accurate Difficult
Figure 11-1. ROI at different times and levels.

306 THE HUMAN RESOURCES SCORECARD
The performance can then be converted to monetary impact,and the ROI can be developed. This has less potential as anevaluation tool because of the lack of situations for whicha predictive validation can be developed.
d. In some situations in which frequency of application andactual use of skills are critical, the application and imple-mentation of these skills can be converted to a value, usingemployee compensation as a basis. This is particularlyhelpful in situations in which competencies are being developedand values are being placed on improving competencies,even when there is no immediate increase in pay.
e. Finally, the ROI can be developed from business impact dataconverted directly to monetary values and compared withthe cost of the program. This post-project evaluation is thebasis for most of the ROI calculations in this book and hasbeen the principal approach used in previous chapters. Itis the preferred approach, but because of the pressuresalready outlined above, it is appropriate to examine ROIcalculations at other times and at levels other than Level 4.This chapter provides a detailed view of pre-project evalu-ation and the ROI calculations based on reaction. To alesser degree, this chapter also addresses the ROI calcula-tions developed from learning and application data.
PRE-PROJECT ROI FORECASTING
Perhaps one of the most useful steps in convincing a client thatan HR initiative is beneficial is to forecast the project. Theprocess closely parallels the post-project analysis except the extentof the impact must be estimated along with the forecasted cost.
Basic model. Figure 11-2 shows the basic model for capturingthe necessary data for a pre-program forecast. This model isbasically a modification of the post-program ROI model exceptthat data and the program’s influence are projected instead ofbeing collected during different time frames. In place of the datacollection is an estimation of the change in impact data expectedto be influenced by the HR initiative. Isolating the effects of theproject becomes a non-issue as the estimate of output takes theisolation factor into consideration. For example, when a personis asked to indicate how much of the particular improvement can

FORECASTING THE ROI 307
be driven by the HR program/initiative, the extent of isolationfactor is already taken into consideration. The HR initiative isthe only factor under consideration. The other factors have beeninherently isolated in the estimation process. The method tocovert data to monetary values is exactly the same because thedata items examined on a pre- and post-program analysis shouldbe the same. Estimating the project’s cost should be an easy stepbecause cost can easily be anticipated based on previous projects,using reasonable assumptions about the current HR initiative. Theanticipated intangibles are merely speculation in forecasting butreliably indicate which measures may be influenced in additionto those included in the ROI calculations. The formula used tocalculate the ROI is the same as in the post analysis. The amountof monetary value from the data conversion, which is based onthe estimate of change, is included as the numerator, while the
Figure 11-2. Pre-PRO ROI forecast model.

308 THE HUMAN RESOURCES SCORECARD
estimated cost of the HR initiative is inserted into the denominator.The projected benefit/cost analysis can be developed along withthe actual ROI. The steps to develop the process are detailed next.
Steps to develop the actual ROI. This section presents thedetailed steps to develop the pre-project ROI forecast in simpli-fied form:
1. Develop the Levels 3 and 4 objectives using as manyspecifics as possible. This should come from the initialneeds analysis and assessment. These objectives detail whatwould actually change in the work setting and identifywhich measures would actually be influenced. If this is notknown, then this places the entire forecasting process injeopardy. There must be some assessment of what measureswill change as a result of the HR initiative, and someonemust be able to estimate the likely extent of this change.
2. Estimate or forecast the monthly improvement in the businessimpact data. This is considered to be the amount of influencedirectly related to the program and is denoted by ∆P.
3. Convert the business impact data to monetary values usingone or more of the methods described in Chapter 6. Theseare the same techniques used in a post-project analysis,and this value is denoted by V.
4. Develop the estimated annual impact for each measure. Inessence, this is the first-year improvement resulting fromthe HR initiative, showing the value contributed for eachmeasure. In formula form this is ∆P × V × 12.
5. Factor additional years into the analysis if a project willhave a significant useful life beyond the first year. Whenthis is the case, these values may need to be factored toreflect a diminished benefit for subsequent years. The clientor owner of the process should give some indication asto the amount of the reduction and the values developedfor years two, three, and so on. It helps to be conservativeby using the smallest number possible.
6. Estimate the fully loaded HR program cost. Using all thecost categories contained in Chapter 7, the fully loadedcost should be estimated and projected for the durationof the HR program impact. If program benefits are includedbeyond year one, be sure to include the costs for these

FORECASTING THE ROI 309
additional years as well. Again, the calculation wouldinclude all direct and indirect costs.
7. Calculate the forecasted ROI using the total projectedbenefits, and calculate the estimated cost using the standardROI formula.
8. Use sensitivity analysis to develop several potential ROIvalues with different levels of improvement (∆P). Whenmore than one measure is changing, the analysis wouldperhaps be performed using a spreadsheet showing dif-ferent possible scenarios for output and the subsequentROI for each.
9. Identify the potential intangible benefits by using inputfrom those most knowledgeable of the situation. Thesepotential intangible benefits are only anticipated and arebased on assumptions from previous experience with thistype of HR initiative.
10. Communicate the ROI projection and anticipated intangibleswith much care and caution. The target audience mustclearly understand that this is based on several assump-tions (clearly defined) and that values are the best possibleestimates. However, there is much room for error.
These ten steps enable an individual or team to forecast the ROI.The most difficult part of the process is the initial estimate ofperformance improvement. Several sources of data are availablefor this purpose, as described next.
Forecasting/estimating performance improvement. Several sourcesof input are available when attempting to estimate the actualperformance improvement that an HR program will influence.These six important considerations should be explored:
1. Experience in the organization gained from previous orsimilar HR programs can form the basis of the estimate.Adapting that breadth of experience can be an importantfactor because comparisons are rarely, if ever, exact.
2. HR project team members may have experience with similarprojects in other organizations or in other situations. Theexperience of the designers, developers, and implementersin the HR project will pay off as they reflect on theirexperiences with other organizations.

310 THE HUMAN RESOURCES SCORECARD
3. External experts who have worked in the field or tackledsimilar projects in other organizations can provide input.These may be other HR professionals, HR suppliers, designers,or others who have earned reputations for knowing aboutthis type of process in this type of situation.
4. Estimates can be obtained from a subject matter expert(SME) in the organization. This individual is well acquaintedwith the internal processes that the HR initiative seeks toalter, modify, or improve. SMEs may also be quite knowl-edgeable about the various factors that influence one ormore of the specific impact measures. Internal SMEs oftenserve in critical functions and sometimes are the mostfavored resource for obtaining estimates.
5. Estimates can be obtained directly from the client orsponsor for the project. This is the individual who makesthe ultimate purchasing decision and provides data or inputabout the anticipated change in a measure that is linked tothe HR program. This influential position makes this personan extremely credible source.
6. Individuals who are directly involved in the HR initiativeand have been targeted as the participants (target popula-tion) are sometimes in a position to know how much aparticular type of HR initiative can change or improve ameasure. These individuals understand the processes, pro-cedures, and particular performance measurements beinginfluenced. Their close proximity to the situation makesthem a very credible source and sometimes the most accuratesource of projecting or estimating the amount of change.
Collectively, these sources provide an appropriate array of pos-sibilities to help estimate the value of an improvement. As theweakest link in the ROI forecasting process, this step deservesthe most attention. The target managers who are interested inforecasted ROI should understand where the estimates came fromand who made them. More importantly, they must see the sourceas credible; otherwise the forecasted ROI has no credibility.
Case example. It is helpful to illustrate how a forecasted ROIcan be developed using some of the processes explained here. Aglobal financial services company was interested in purchasing acustomer contact management software program to enable itssales-relationship managers to keep track of routine correspondence

FORECASTING THE ROI 311
and communication with customers. The needs assessment indi-cated a need for this type of capability. Training was a majorconsideration for the end users, and a training consultant fromHR’s corporate training function was assigned to the project teamalong with members from the sales and information technologyfunctions. An assignment of the designated project team wouldinvolve further detailing the exact needs, selecting the appropriatesoftware package, and implementing the software and trainingalong with appropriate job aids as necessary. However, beforepursuing the project and purchasing software, a forecasted ROIwas developed. By following the steps above, it was determinedthat the implementation of this project would influence fourbusiness impact measures as follows:
1. Increased sales to existing customers2. A reduction in customer complaints regarding missed dead-
lines, late responses, and failure to complete transactions3. A reduction in the response time to customer inquiries and
requests4. Increased customer satisfaction evidenced by composite
survey index scores
With comprehensive customer contact management software, thesales-relationship managers should benefit from quick and effec-tive customer communication and have easy access to customerdatabases. The software should also provide the functionality todevelop calendars and to-do lists. They should further benefitfrom features such as built-in contact management, calendarsharing, and an Internet-ready tool. To determine the extent towhich the four measures would change with appropriate trainingand implementation, input was derived from four sources:
1. Internal software developers who are experts in varioussoftware applications provided input about affected changesin each of the measures.
2. The sales-relationship managers provided input in termsof expected changes in the variables if the software wasused regularly.
3. The client funding the project provided input about whatcould be expected when the capability of software wasproperly used.

312 THE HUMAN RESOURCES SCORECARD
4. Finally, a survey of software developers provided someinput.
All the input represents estimates, and the actual results maydiffer significantly. However, the client was interested in a forecastbased on a very limited analysis but strengthened with the bestexpert opinions available. After some discussion of the availabilityof data and after examining the techniques to convert data tomonetary values, the following conclusions were reached:
1. The increase in sales could easily be converted to monetaryvalues, as the margin for this particular project is applieddirectly.
2. The cost of a customer complaint could be based on adiscounted internal value currently in use, thus providing agenerally accepted cost of a complaint.
3. The actual customer response time is not tracked accuratelynor is the value for this measure readily available. It wasanticipated that this would be an intangible benefit.
4. There is no generally accepted monetary value for increasingcustomer satisfaction, so the impact on customer satisfactionwould be listed as a potential intangible.
After reviewing the possible scenarios, it was determined thatthere could be a range of possibilities for increasing sales andreducing complaints. The sales increase should be in the rangeof 3 to 9 percent. Thus, three scenarios were developed, using 3percent, 6 percent, and 9 percent as the projected increases insales. In terms of the actual number of complaints, the ROIcalculation was developed for a single division of the organi-zation. Complaints were in the range of ten to thirty monthly.Three scenarios were developed for the reduction in the numberof actual complaints, using a reduction of ten, twenty, and thirtyin the ROI calculation.
The increase in sales was easily converted to monetary valuesusing the margin rates. The reduction in customer complaints waseasily converted using the discounted value for a customer com-plaint. The cost for the project could easily be estimated basedon input from those who examined the situation very briefly. Thetotal cost was developed to include software and equipment,development costs, materials, facilitators, facilities for meetings,

FORECASTING THE ROI 313
lost time for learning activities, and coordination and evaluation.This fully loaded projected cost when compared with the benefitsyielded in a range of expected ROI values. Table 11-1 shows thematrix of the nine possible scenarios using payoffs on the twomeasures. The ROI values range from a low of 60 percent ROIto a high of 180 percent. With these projected values, the decisionto move forward was a relatively easy one because all the worst-case scenarios were very positive, and the best case was approxi-mately three times that value. As this example illustrates, theprocess needs to be kept simple, using the best and most crediblesources available to quickly arrive at estimates of the process.Recognizing that these are estimates, the advantages are simplicityand low cost. These factors should be considered when develop-ing the processes.
Forecasting with a pilot program. Although the steps listedabove provide a process for estimating the ROI when a pilotprogram is not conducted, the much more favored approach isto develop a small-scale pilot project and develop the ROI basedon post-program data. This scenario involves the following five steps:
1. As in the previous process, develop Levels 3 and 4 objectives.2. Initiate the project on a very small-scale sample as a pilot
project without all the bells and whistles. Keep the costextremely low, but keep the fundamentals of the project intact.
Table 11-1Expected ROI Values for Different Outputs
Potential CompliantPotential Sales Increase Reduction ExpectedExisting Customers (%) (Monthly Reduction) ROI (%)
3 10 603 20 903 30 1206 10 906 20 1206 30 1509 10 1209 20 1509 30 180

314 THE HUMAN RESOURCES SCORECARD
3. Conduct the program by fully implementing it with one ormore of the typical groups of individuals who can benefitfrom the program.
4. Develop the ROI using the ROI process model for post-program analysis. In essence, this is the model used in theprevious chapters.
5. Finally, make the decision to implement throughout theorganization based on the results of the pilot project.
This provides a much more accurate approach to developing databased on a pilot program, withholding the full implementationuntil results can be concluded from the pilot study. In thisscenario, data can be developed involving all the six types ofmeasures outlined in this book.
FORECASTING ROI WITH REACTION DATA
When a reaction evaluation includes planned applications froman HR initiative, these important data can ultimately be used inROI calculations. With questions concerning how participantsplan to use what they have learned and what results they expectto achieve, higher-level evaluation information can be developed.The questions presented in Table 11-2 illustrate how this typeof data is collected with an end-of-program implementationquestionnaire. Participants are asked to state specifically how theyplan to apply the HR program and the results they expect toachieve. They are asked to convert their accomplishments to anannual monetary value and to show the basis for developing thevalues. Participants can adjust their responses with a level ofconfidence to make the data more credible and to allow them toreflect their uneasiness with the process.
When tabulating data, evaluators multiply the confidence levelby the annual monetary value, which results in a more con-servative estimate for use in the data analysis. For example, if aparticipant estimated that the monetary impact of the HR pro-gram would be $10,000 but was only 50 percent confident, a$5,000 value would be used in the calculations.
To develop a summary of the expected benefits, the evaluatortakes several steps. First, any data that are incomplete, unusable,extreme, or unrealistic are discarded. Next, an adjustment is made

FORECASTING THE ROI 315
Table 11-2Important Questions to Ask on Feedback Questionnaires
Planned Improvements
� As a result of this HR initiative what specific actions will youattempt as you apply what you have learned?
1.
2.
3.
� Please indicate what specific measures, outcomes, or projects willchange as a result of your actions.
1.
2.
3.
� As a result of the anticipated changes in the above, pleaseestimate (in monetary values) the benefits to your organizationover a period of one year.
� What is the basis of this estimate?
� What confidence, expressed as a percentage, can you put in yourestimate? (0% = No Confidence; 100% = Certainty) %
to the estimate for the confidence level, as previously described.Individual data items are then totaled. Finally, as an optional step,the total value is adjusted, again by a factor that reflects thesubjectivity of the process and the possibility that participants willnot achieve the results they anticipate. This adjustment factor canbe determined by the project team. In one organization, thebenefits are divided by two to develop a number to use in the

316 THE HUMAN RESOURCES SCORECARD
equation. Finally, the ROI is calculated using the net benefits fromthe HR program divided by the HR program costs. Thisvalue, in essence, becomes the expected return on investment,after the confidence adjustment for accuracy and the adjustmentfor subjectivity.
This process can be best described using an actual case. M&HEngineering and Construction Company designs and builds largecommercial projects such as plants, paper mills, and municipalwater systems. Safety is always a critical issue at M&H andusually commands much management attention. To improve thecurrent level of safety performance, a safety improvement pro-gram was initiated for project engineers and construction super-intendents. The program focused on safety leadership, safetyplanning, safety inspection, safety meetings, accident investigation,safety policy and procedures, safety standards, and workers’compensation. After completing this project, engineers and super-intendents were expected to improve the safety performance oftheir specific construction projects. A dozen safety performancemeasures used in the company were discussed and analyzedduring the program. At the end of the program roll-out, par-ticipants completed a comprehensive Level 1 reaction feedbackquestionnaire. The questionnaire probed into specific action itemsplanned as a result of this program and asked participants toproject estimated monetary values of their planned improvements.In addition, participants explained the basis for the improvementsand estimates, and placed a confidence level on their estimates.Table 11-3 presents data provided by the first group of par-ticipants. Only eighteen of the twenty-four participants supplieddata, (experience has shown that approximately 50 to 70 percentof participants will provide usable data for this series of ques-tions). The total cost of the HR program, including participants’salaries, was $29,000. Prorated development costs were includedin this cost figure.
The monetary value of the planned improvements is extremelyhigh, reflecting the participants’ optimism and enthusiasm at theend of an effective HR program during which specific actionsare planned. As a first step in the analysis, extreme data itemsare omitted. Data such as millions, unlimited, and $4 million arediscarded, and each remaining value is multiplied by the con-fidence value and totaled. This adjustment is a way of reducing

FO
REC
AST
ING
TH
E RO
I317
Table 11-3Level 1 Data for ROI Calculations
Participant No. Estimated Value Basis Confidence Level
1 $80,000 Reduction in Accidents 90%2 90,000 OSHA Reportable Injuries 80%3 50,000 Accident Reduction 100%4 10,000 First Aid Visits/Visits to Doctor 100%5 50,000 Reduction in Lost Time Injuries 95%6 Millions Total Accident Cost 100%7 75,000 Workers’ Compensation 80%8 7,500 OSHA Citations 75%9 50,000 Reduction in Accidents 100%
10 30,000 Workers’ Compensation 80%11 150,000 Reduction in Total Accident Costs 90%12 20,000 OSHA Fines/Citations 70%13 40,000 Accident Reductions 100%14 4,000,000 Total Cost of Safety 95%15 65,000 Total Workers’ Compensation 50%16 Unlimited Accidents 100%17 45,000 Injuries 90%18 2,000 Visits to Doctor 100%

318 THE HUMAN RESOURCES SCORECARD
very subjective estimates. The resulting tabulations yielded a totalimprovement of $655,125. Because of the subjectivity of theprocess, the values were adjusted again by a factor of two, anarbitrary number suggested by the principal HR safety consultant,and supported by the management group. This “adjusted” valueis $327,563, or $328,000 with rounding. The projected ROI,based on the end-of-program feedback questionnaire given atthe program’s conclusion but before actual job application, isas follows:
ROI = − × =$ , $ ,$ ,
, %328 000 29 000
29 000100 1 031
The HR safety consultant communicated these projected valuesto the CEO but cautioned that the data were very subjective,although they had been twice adjusted downward. The safetyconsultant also emphasized that the forecasted results weregenerated by the participants in the program, who should beaware of what they could accomplish. In addition, she mentionedthat a follow-up was planned to determine the results that wereactually delivered by the group.
A word of caution is in order when using Level 1 ROI data.These calculations are highly subjective and may not reflect theextent to which participants will apply what they have learnedto achieve results. A variety of influences in the work environ-ment can enhance or inhibit the participants’ attainment ofperformance goals. Having high expectations at the end of theHR program roll-out is no guarantee that those expectations willbe met. Disappointments are documented regularly in HR programsthroughout the world and are reported in research findings.
Although this process is subjective and possibly unreliable, itdoes have some usefulness. First, if an evaluation must stop atthis level, this approach provides more insight into the value ofthe program than the data from typical reaction questionnaires.Managers will usually find these data more useful than a reportstating that “40 percent of participants rated the HR programabove average.” Unfortunately, there is evidence that a highpercentage of evaluations stop at this first level of evaluation.Reporting Level 1 ROI data is a more useful indication of the

FORECASTING THE ROI 319
potential impact of the HR program than the alternative, whichis to report attitudes and feelings about the HR program andabout those who designed, administered, or implemented it.
Second, these data can form a basis for comparison of differentprojects of the same type of intervention (for example, safety).If one HR program forecasts an ROI of 300 percent whereasanother projects 30 percent, then it appears the first program maybe more effective than the other. The participants in the firstprogram have more confidence in the planned application of theHR program.
Third, collecting this type of data focuses increased attentionon program outcomes. Participants involved in the interventionwill understand that specific behavior change is expected, and thisinfluences results for the organization. This issue becomes clearto participants as they anticipate results and convert them tomonetary values. Even if this projected improvement is ignored,the exercise is productive because of the important message sentto participants.
Fourth, if a follow-up is planned to pinpoint post-programresults, the data collected in the Level 1 evaluation can be helpfulfor comparison. This data collection helps participants plan theimplementation of what they have learned. Incidentally, when afollow-up is planned, participants are more conservative withthese projected estimates.
The calculation of the ROI at Level 1 is increasing, and someorganizations have based many of their ROI calculations on Level1 data. Although these calculations may be very subjective, theydo add value, particularly if they are included as part of acomprehensive evaluation system.
FORECASTING ROI WITH LEARNING DATA
Testing for changes in skills and knowledge in a program is acommon technique for Level 2 evaluation. In many situations,participants are required to demonstrate their knowledge or skillsat the end of the program, and their performance is expressedas a numerical value. When this type of test is developed, it mustbe reliable and valid. A reliable test is one that is stable overtime and produces consistent results. A valid test is one thatmeasures what it purports to measure. Because a test should

320 THE HUMAN RESOURCES SCORECARD
reflect the content of the HR program, successful mastery ofcontent should be related to improved job performance. Con-sequently, there should be a relationship between test scores andsubsequent on-the-job performance. Figure 11-3 illustrates thepotential relationship between test scores and job performancein a perfect correlation. This relationship, expressed as a cor-relation coefficient, is a measure of validity of the test.
This testing situation provides an excellent opportunity for anROI calculation with Level 2 data using test results. When thereis a statistically significant relationship between test scores andon-the-job performance, and the performance can be convertedto monetary units, then it is possible to use test scores to estimatethe ROI from the program, using the following six steps:
1. Ensure that the program content reflects desired on-the-job performance.
2. Develop an end-of-program test that reflects program content.3. Establish a statistical relationship between test data and
output performance of participants.4. Predict performance levels of each participant with given
test scores.5. Convert performance data to monetary values.6. Compare total predicted value of program with the program
costs.
Figure 11-3. Relationship between test scores and performance.

FORECASTING THE ROI 321
This approach has its best application when significant learningis taking place or when the project or program focuses almostentirely on developing learning solutions. The absence of validatedtests are problematic in this issue because the instruments cannotbe used to project actual performance unless there have beensome steps to ensure the validity.
An example will illustrate this approach. Consumer ProductsMarketing (CPM) is the marketing division of a large consumerproducts company. Sales representatives for CPM make frequentsales calls to large retail food and drug companies with theobjective of increasing sales and market share of CPM products.Sales representatives must ensure that retailers understand theadvantages of CPM products, provide adequate display space forits products, and assist in promotional and advertising efforts.
CPM has developed a strong sales culture and recruits highlycapable individuals for sales representative assignments. A pro-gram was initiated to develop new sales representatives. Newlyrecruited sales representatives rotated through different divisionsof the company in a two-month assignment to learn where andhow the products were made and their features and benefits, aswell as specific product marketing strategies. This initial assign-ment culminated with an intensive, one-week professional market-ing program, which focused on sales techniques, marketingstrategies, and customer service skills. At the end of the one-weekassignment, participants completed a comprehensive exam, whichreflected the knowledge and skills learned in the program. As partof the exam, participants analyzed specific customer service andsales situations and decided on specific actions. Also, the testcovered product features, policies, and marketing practices.
To validate the test, CPM developed a correlation between testscores and actual on-the-job performance measured by salesvolumes, sales growth, and market shares for sales representatives.The correlation was statistically significant with each variable. Asa quick way of calculating the expected ROI for the program,CPM estimated output levels for each item using the test scoresand then converted them to monetary values and calculated the ROI.
As with the previous ROI estimate with end-of-program ques-tionnaires, some cautions are in order. This is a forecast of theROI and not the actual value. Although participants may acquirethe skills and knowledge from a program, there is no guarantee

322 THE HUMAN RESOURCES SCORECARD
that they will apply the techniques and processes successfully andthat the results will be achieved. This process assumes that thecurrent group of participants has the same relationship to outputperformance as previous groups. It ignores a variety of environ-mental influences, which can alter the situation. And finally, theprocess requires calculating the initial correlation coefficient,which may be difficult to develop for many tests.
Although this approach develops an estimate based on historicalrelationships, it can be useful in a comprehensive evaluationstrategy, and it has several advantages. First, if post-programevaluations (Level 4) are not planned, this process will yield moreinformation about the projected value of the program than couldbe obtained from the raw test scores. This process represents anexpected return on investment based on the historical relation-ships involved. Second, by developing individual ROI measure-ments and communicating them to participants, the process hasreinforcement potential. It communicates to participants thatincreased sales and market share are expected through the appli-cations of what was learned in the program. Third, this processcan have considerable credibility with management and canpreclude expensive follow-ups and post-program monitoring. Ifthese relationships are statistically sound, the estimate shouldhave credibility with the target population as well.
FORECASTING ROI WITH APPLICATION
OF SKILLS AND COMPETENCIES
In almost every HR project, participants are expected to changetheir on-the-job behaviors by applying new behavior from the HRinitiative. On-the-job applications are critical to HR programsuccess, particularly with the focus on competencies. Althoughthe use of the skills on the job is no guarantee that results willfollow, it is an underlying assumption for most programs that ifthe knowledge and skills are applied, then results will follow. Afew organizations attempt to take this process a step further andmeasure the value of on-the-job behavior change and calculatethe ROI. In these situations, estimates are taken from individualparticipants, their supervisors, the management group, or expertsin the field. The following steps are used to develop the ROI:

FORECASTING THE ROI 323
� Develop competencies for the target job.� Indicate the percentage of job success that is represented by
the competencies included in the HR program.� Determine the monetary values of competencies, using salaries
and employee benefits of participants.� Compute the worth of pre- and post-program skill levels.� Subtract post-program values from pre-program values.� Compare the total added benefits with the program costs.
An example will help illustrate one technique to measure thevalue of on-the-job applications. With the help of HR professionals,the United States government redesigned its Introduction toSupervision course, a five-day learning solution for newly appointedsupervisors. The HR program focused on eight competencies:
1. Role and responsibilities of the supervisor2. Communication3. Planning, assigning, controlling, and evaluating work4. Ethics5. Leadership6. Analyzing performance problems7. Customer service8. Managing diversity
The immediate managers of the new supervisors indicated thatthese eight competencies accounted for 81 percent of first-levelsupervisors’ jobs. For the target group being evaluated, theaverage annual salary plus benefits for the newly appointedsupervisors was $42,202. Thus, multiplying this figure by theamount of job success accounted for by the competencies (81percent), yielded a dollar value of $34,184 per participant. If aperson was performing successfully in these eight competenciesfor one year, the value to the agency would be $34,184. Ofcourse, this assumed that employees were paid an amount equalto their contribution when they were fully competent.
Using a scale of 0 to 9, managers rated the skills for each ofthe competencies before the program was conducted. The averagelevel of skills required to be successful in the job was determinedto be 6.44. The average skill rating, prior to the program, was

324 THE HUMAN RESOURCES SCORECARD
4.96, which represented 77 percent of the 6.44 (that is, par-ticipants were performing at 77 percent of the level necessary tobe successful in the competencies). After the program, the averageskill rating was 5.59, representing 87 percent of the level neces-sary for success.
Monetary values were assigned based on the participants’salaries. Performance at the required level was worth $34,184.At a 77 percent proficiency level, the new supervisors wereperforming at a contribution value of $26,322. After the applica-tion of the learning, this value reached 87 percent, representinga contribution value of $29,740. The difference in these values,$3,418, represents the gain per participant attributable to theprogram. The program cost was $1,368 per participant. Thus,the ROI is:
ROI = − = × =$ , $ ,$ ,
,,
%3 418 1 368
1 3682 0501 368
100 150
As with other estimates, a word of caution is in order. Theseresults are subjective because the rating systems used are sub-jective and may not necessarily reflect an accurate assessment ofthe value of the program. Also, because an HR program is usuallyimplemented to help the organization achieve its objectives, somemanagers insist on tangible changes in hard data, such as quantity,quality, cost, and time. For them, Level 3 evaluation is not alwaysa good substitute for Level 4 data, if they are available.
Although this process is subjective, it has several usefuladvantages. First, if there are no plans to track the actual impactof the program in terms of specific measurable business results(Level 4), then this approach represents a credible substitute. Inmany HR programs, particularly skill-building programs forsupervisors, it is difficult to identify tangible changes on the job.Therefore, alternate approaches to determine the worth of HRprograms are needed. Second, this approach results in data thatare usually credible with the management group if the groupunderstands how the data are developed and the assumptionsbehind the data. An important point is that the data for thechanges in competence level came from the managers rating theirsupervisors. In this specific project, the numbers were largeenough to make the process statistically significant.

FORECASTING THE ROI 325
ROI AT LEVEL 4: BUSINESS RESULTS
Most HR programs that develop ROI calculations focus on thebusiness results (Level 4 data) that the program has influenced.These output variables are usually expressed in terms of costreduction, productivity increases, improved quality, improvedcustomer service, or reduced response times. It is relatively easyto convert them to monetary values for an ROI calculation.Earlier chapters focused on this type of data for ROI calculations,and additional detail is not needed here.
ROI calculations on business results are very credible andreliable if appropriate processes have been used to isolate theeffects of the HR program and to accurately convert the resultsto monetary units. When ROI data are needed, this level ofevaluation should always be sought if at all possible. ROI withLevel 4 data thus becomes the fifth level of evaluation, theultimate level of accountability.
SHORTCUT WAYS TO FORECAST ROI
This chapter has presented the techniques for forecasting ROIat four different time frames using four different levels of evalua-tion data. Two of these techniques would not be useful for simpleand inexpensive projects. Forecasting using learning data at Level2 and forecasting using application data at Level 3 are rare andshould be reserved for only large-scale projects involving signifi-cant learning events. Validated tests are developed, and otherinstruments are used to build on the accuracy of the process.There are two useful techniques that may be helpful even forshort-term, low-profile, inexpensive projects:
Pre-project/program forecasting. Pre-project forecasting may benecessary and actually desired even if it is not required. BecauseLevel 4 data drive the HR project, business impact measures shouldbe identified up front. Estimating the actual change in these measuresis a recommended and highly useful exercise because it begins toshow the client and HR professionals the perceived value of theproject. This is a fairly simple exercise and was illustrated in a caseexample earlier in this chapter. It should take no more than one ortwo days’ time to develop a forecast of the project, but it can beextremely valuable in communicating to the client and also providingsome clear direction and focus for the program designers and

326 THE HUMAN RESOURCES SCORECARD
coordinators. The process can be kept simple and credible, andthe sources of information can be easy to access.
Forecasting with reaction data. In almost every HR program,reaction data are collected from individuals involved in theprogram. A worthwhile extension of reaction data is to includeseveral questions that allow those individuals to project the actualsuccess of the project. This was discussed as an option in Chap-ter 1. Here, it is recommended as an additional simple tool toforecast the actual ROI. This provides some additional insightinto the potential worth of the project and alerts the HR staffto potential problems or issues that may need attention as theremaining issues are addressed in the HR initiative. As theinformation in this chapter illustrated, these questions are simple,and answers can easily be obtained with fifteen to twenty minutesof participants’ time. For the process to be successful and usable,the participant must be committed to it. It may be helpful tofollow some of the methods of increasing response rate for thevarious instruments described in this book.
FINAL THOUGHTS
This chapter illustrates that ROI calculations can be developedat different times and at different levels of evaluation, althoughmost HR professionals and clients focus only on Levels 3 and 4data for ROI calculations. Although post-program data aredesired, there are situations in which Level 4 data are not avail-able in a post-program time frame, or when evaluations at thatlevel are not attempted or planned. ROI estimates, developed atLevels 1, 2, and 3, can be useful and helpful to management andthe HR staff while at the same time focusing the participants’attention on the economic impact of the HR initiative. Using ROIestimates at Levels 1 and 2 may give a false sense of accuracy.Figure 11-1 shows the relationship of ROI at the different levels.As would be expected, ROI calculations with Level 1 data arethe lowest in terms of credibility and accuracy, but they have theadvantage of being inexpensive and relatively easy to develop.ROI calculations using Level 4 data are rich in credibility andaccuracy but are very expensive and difficult to develop. AlthoughROI calculations at Level 4 data are preferred, ROI developmentat other levels is an important part of a comprehensive andsystematic evaluation process.

IMPLEMENTATION ISSUES 327
327
Chapter 12
ImplementationIssues
The best-designed process model or technique is worthlessunless it is integrated efficiently and effectively in the organi-zation. Although the ROI process presented in this book is a step-by-step, methodical, and simplistic procedure, it will fail even inthe best organizations if it is not integrated into the mainstreamof activity and fully accepted and supported by those who shouldmake it work. This chapter focuses on critical issues involved inimplementing the ROI process in the organization.
PLANNING THE IMPLEMENTATION
Few initiatives are effective without proper planning. The ROIprocess is no exception. As described in Chapter 2, the initialplanning and analysis are synonymous with success. Describedbelow are seven key steps in planning for and positioning the ROIprocess as an essential component of the human resources function.
Identify an ROI Champion
As a first step in the process, one or more individual(s) shouldbe designated as the implementation leader or champion for theprocess. As in most change efforts, someone must take responsibilityfor ensuring that the process is implemented successfully. Thisleader serves as a champion for ROI and is usually the one whounderstands the process best and sees the vast potential for itscontribution. More importantly, this leader must be willing toteach others the process.

328 THE HUMAN RESOURCES SCORECARD
The ROI leader has ROI implementation as a full-time respon-sibility within the HR function. In smaller organizations thiswould be a part-time responsibility. This role could be titled asthe manager of measurement and evaluation, or the responsibilitycould be assigned to a team with the authority to lead the ROIeffort. For example, one company selected five individuals tolead this effort as a team. All five received certification in theROI process.
Develop the ROI Leader
In preparation to serve as the ROI implementation leader,individuals usually obtain special training that builds specificskills and knowledge in the ROI process. The role of the imple-mentation leader is broad and serves a variety of specializedduties. In some organizations, the implementation leader can takeon as many as fourteen roles:
� Technical expert� Cheerleader� Consultant� Communicator� Problem solver� Process monitor� Initiator� Planner� Designer� Analyst� Developer� Interpreter� Coordinator� Teacher
This difficult and challenging assignment needs special trainingand skill building. In the past only a few programs have beenavailable to help build these skills. Now many such programsexist, some quite comprehensive. One program is designed tocertify the individuals who are assuming a leadership role in theimplementation of ROI [1]. This certification is built around tenspecific skill sets:

IMPLEMENTATION ISSUES 329
1. Planning for ROI calculations2. Collecting evaluation data3. Isolating the effects of the HR program or initiative4. Converting data to monetary values5. Monitoring program costs6. Analyzing data, including calculating the ROI7. Presenting evaluation data8. Implementing the ROI process9. Providing internal consulting on ROI
10. Teaching others the ROI process
The certification process is quite comprehensive, but such exten-sive measures may be necessary to build the appropriate skillsto address this challenging assignment.
Assign Responsibilities
Defining specific responsibilities is a critical issue becauseconfusion can arise when individuals do not have a clear pictureof their specific assignments in the ROI process. Responsibilitiesapply to two groups. The first is the measurement and evaluationduty of the entire HR staff. Those involved in initiating andimplementing programs and initiatives must have some respon-sibility for measurement and evaluation. These responsibilitiesinclude providing input about the design of instruments, planninga specific evaluation, analyzing data, and interpreting the results.Typical responsibilities include:
� Ensuring that the needs assessment includes specific businessimpact measures
� Developing specific application objectives (Level 3) and busi-ness impact objectives (Level 4) for each program or initiative
� Focusing the content of the program on performance improve-ment, ensuring that exercises, case studies, and skill practicesrelate to the desired objectives
� Keeping participants focused on application and impactobjectives
� Communicating rationale and reasons for evaluation� Assisting in follow-up activities to capture application and
business impact data

330 THE HUMAN RESOURCES SCORECARD
� Providing technical assistance for data collection, dataanalysis, and reporting
� Designing instruments and plans for data collection andanalysis
� Presenting evaluation data to a variety of groups
Although it may be inappropriate to involve each member of thestaff in all these activities, each individual should have at leastone responsibility as part of his or her routine job duties. Assign-ing responsibilities keeps the ROI process from being disjointedand separate from major HR activities. More importantly, itbrings accountability to the initiation of various HR programs.
The second group is the technical support function. Dependingon the size of the HR staff, it may be helpful to establish a groupof technical experts who provide assistance with the ROI process.When this group is established, it must be clear that the expertsare not there to relieve others of evaluation responsibilities butrather to supplement technical expertise. Some firms have foundthis approach effective. When this type of support is developed,responsibilities revolve around six key areas:
1. Designing data collection instruments2. Providing assistance for developing an evaluation strategy3. Analyzing data, including specialized statistical analyses4. Interpreting results and making specific recommendations5. Developing an evaluation report or case study to com-
municate overall results6. Providing technical support in any phase of the ROI process
Although the HR staff must have specific responsibilities duringan evaluation, it is not unusual to require others in supportfunctions to have responsibility for data collection. These andsimilar responsibilities are defined when a particular evaluationstrategy plan is developed and approved.
Develop Evaluation
Establishing specific targets for evaluation levels is an importantway to make progress with measurement and evaluation. Targetsenable the staff to focus on the improvements needed with

IMPLEMENTATION ISSUES 331
specific evaluation levels. During this process, the percent ofprograms or initiatives planned for evaluation at each level isdeveloped. The first step is to assess the current situation. Thenumber of programs, including repeated segments of a program,is tabulated along with the corresponding level(s) of evaluationcurrently conducted for each program. Next, the percentof programs being measured at Level 1, reaction and plannedaction, is calculated. The process is then repeated for each levelof the evaluation.
After detailing the current situation, the next step is to deter-mine realistic targets to be met within a specific time frame. Manyorganizations set annual targets for changes. This process shouldinvolve the input of the entire HR staff to ensure the targets arerealistic and the staff is committed to the process. If the HR staffdoes not embrace this process as its own, targets will not be met.The improvement targets must be achievable while, at the sametime, challenging and motivating. Table 12-1 shows the targetsestablished for a training function at a manufacturing site for thefive levels [2]. Many of the Level 4 evaluations in this organizationare taken to ROI. In some organizations, half the Level 4 calcula-tions are taken to Level 5, while in others, every one of them istaken. Table 12-2 shows current percentages and targets for fiveyears in a large multinational company. Table 12-2 shows thegradual improvement of increasing evaluation activity at Levels3, 4, and 5. Year 0 is the current status in Table 12-2 [3].
Table 12-1Evaluation Targets for a Training Function
at a Manufacturing Site
Levels Measures Percent
Level 1 Reaction, Satisfaction 100%
Level 2 Learning 70%
Level 3 Application 30%
Level 4 Results 20%
Level 5 ROI 10%

332 THE HUMAN RESOURCES SCORECARD
Target setting is a critical component of implementation. Itshould be completed early in the process with full support of theentire HR staff. Also, if practical and feasible, the targets shouldhave the approval of the key management staff, particularly thesenior management team.
Develop a Project Plan for Implementation
An important part of the planning process is to establishtimetables for the complete implementation process. This docu-ment becomes a master plan for the completion of the differentelements presented in this chapter, beginning with assigningresponsibilities and concluding with meeting the targets previouslydescribed. From a practical basis, this schedule is a project planfor transition from the present situation to a desired futuresituation. The items on the schedule include, but are not limitedto, developing specific ROI projects, building staff skills, develop-ing policy, teaching managers the process, analyzing ROI data,and communicating results. The more detailed the document, themore useful it is. The project plan is a living, long-range documentthat should be reviewed frequently and adjusted as necessary.
Table 12-2Percentages and Targets for Five Years in a Large
Multinational Company
Percent of Courses Evaluatedat Each Level
Year Year Year Year Year Year0 1 2 3 4 5
Reaction and Planned 85% 90% 95% 100% 100% 100%Action
Learning 30% 35% 40% 45% 50% 60%
Job Application 5% 10% 15% 20% 25% 30%
Business Results 2% 4% 5% 9% 12% 15%
ROI 0% 2% 4% 6% 8% 10%

IMPLEMENTATION ISSUES 333
More importantly, it should always be familiar to those who areworking with the ROI process. Figure 12-1 shows an ROI imple-mentation project plan for a large petroleum company [3].
Revise/Develop Policies and Procedures
Another key part of planning is revising (or developing) theorganization’s policy concerning measurement and evaluation forHR programs. The policy statement is designed specifically forthe measurement and evaluation process. It is frequently developed
Figure 12-1. ROI implementation project plan for a largepetroleum company.

334 THE HUMAN RESOURCES SCORECARD
with the input of the HR staff and key managers or clients.Sometimes policy issues are addressed during internal workshopsdesigned to build skills with measurement and evaluation. Thepolicy statement addresses critical issues that will influence theeffectiveness of the measurement and evaluation process. Typicaltopics include adopting the five-level model presented in thisbook, requiring Levels 3 and 4 objectives in some or all programs,and defining responsibilities for human resources staff. Figure 12-2shows a sample of topics included in an HR measurement andevaluation policy.
Policy statements are critical because they provide guidance anddirection for the staff and for others who work closely with theROI process. They keep the process clearly focused and enablethe group to establish goals for evaluation. Policy statements alsoprovide an opportunity to communicate basic requirements andfundamental accountability issues. More than anything else, theyserve as a learning tool to teach others, especially when they aredeveloped in a collaborative and collective way. If policy state-ments are developed in isolation, excluding ownership of the HRstaff and management, they will be ineffective and of little use.
Guidelines for measurement and evaluation are important toshow how to use the tools and techniques, guide the designprocess, provide consistency in the ROI process, ensure thatappropriate methods are used, and place the proper emphasis oneach of the areas. The guidelines are more technical than arepolicy statements and often contain detailed procedures showinghow the process is actually undertaken and developed. They ofteninclude specific forms, instruments, and tools necessary to facili-tate the process. Figure 12-3 shows the table of contents ofevaluation guidelines for a multinational company. As this tableof contents reveals, the guidelines are comprehensive and includesignificant emphasis on ROI and accountability.
Assess the Climate
The final step in planning the implementation is to assess theorganization’s current climate for achieving results. One usefultool, presented in the appendix, is a results-based test [4]. Thistest instrument, or some version of it, can serve as an initialassessment of how the full HR staff, and others whom the staff

IMPLEMENTATION ISSUES 335
1. Purpose
2. Mission
3. Evaluate all programs which will include the following levels:a. Reaction and planned action (100%)b. Learning (80%)c. Application (50%)d. Impact (10%)e. ROI (5%)
4. Evaluation support group (corporate) will provide assistance andadvice in measurement and evaluation, instrument design, dataanalysis, and evaluation strategy.
5. New programs are developed beginning with needs analysis andending with communicating results.
6. Data collection instruments must be valid, reliable, economical, andsubject to audit by the evaluation support group.
7. Responsibility for HR program results rests with the HR staff,participants, and supervisors of participants.
8. An adequate system for collecting and monitoring HR costs mustbe in place. All direct costs should be included.
9. At least annually, the management board will review the status andresults of HR programs and initiatives. The review will include HRplans, strategies, results, costs, priorities, and concerns.
10. Line management shares in the responsibility for HR programevaluation through follow-up, pre-program commitments, andoverall support.
11. External HR consultants must be selected based on previous evalua-tion. All external HR programs of more than one day in durationwill be subjected to evaluation procedures. In addition, the qualityof external programs will be assessed by participants.
12. HR program results must be communicated to the appropriatetarget audience. At a minimum, this includes management (partici-pants’ supervisors), participants, and all HR staff.
13. HR staff should be qualified to conduct effective needs-analysisand evaluation.
14. A central database for program development should exist to preventduplication and should serve as a program resource.
15. Labor union involvement will be included in the total HR plan.
Figure 12-2. Results-based internal HR policy (an example).

336 THE HUMAN RESOURCES SCORECARD
Section 1: Policy
1.1 The Need for Accountability1.2 The Bottom Line: Linking Human Resources with Business Needs1.3 Results-Based Approach1.4 Implications1.5 Communication1.6 Payoff
Section 2: Responsibilities
2.1 Human Resources Group Responsibilities: Overall2.2 Human Resources Group Responsibilities: Specifics for
Selected Groups2.3 The Business Unit Responsibilities2.4 Participant Manager Responsibilities2.5 Participants’ Responsibilities
Section 3: Evaluation Framework
3.1 Purpose of Evaluation3.2 Levels of Evaluation3.3 Process Steps for Human Resources Implementation3.4 Evaluation Model
Section 4: Level 1 Guidelines
4.1 Purpose and Scope4.2 Areas of Coverage—Standard Form4.3 Optional Areas of Coverage4.4 Administrative Issues4.5 How to Use Level 1 Data
Section 5: Level 2 Guidelines
5.1 Purpose and Scope5.2 Learning Measurement Issues5.3 Techniques for Measuring Learning5.4 Administration5.5 Using Level 2 Data
Section 6: Level 3 Guidelines
6.1 Purpose and Scope6.2 Follow-Up Issues6.3 Types of Follow-Up Techniques6.4 Administrative Issues6.5 Using Level 3 Evaluation
Figure 12-3. Evaluation guidelines for a multinational company.

IMPLEMENTATION ISSUES 337
supports, perceive the status of program results. Some organi-zations take annual assessments to measure progress as the ROIprocess is implemented. In other organizations, members of themanagement group answer the questions on the assessment instru-ment to provide feedback about their perceptions of the effective-ness of HR. The use of an assessment instrument or processprovides an excellent understanding of the current status. Thenthe organization can plan for significant changes, pinpointingparticular issues needing support as the ROI process is implemented.
PREPARING THE HR STAFF
One group that often resists the ROI process is the HR staffwho determines which programs to implement. These staff membersoften see evaluation as an unnecessary intrusion into their respon-sibilities. This section outlines some important issues that mustbe addressed when preparing the staff for the implementationof ROI.
Involving the Staff
The staff should be involved in all major decisions and issuesconcerning the process. As policy statements are prepared andevaluation guidelines developed, staff input is absolutely essential.It is difficult for staff members to criticize something they helpeddesign and develop. Using meetings, brainstorming sessions, and
Section 7: Levels 4 and 5 Guidelines
7.1 Purpose and Scope7.2 Business Impact and ROI Issues7.3 Monitoring Performance Data7.4 Extracting Data from Follow-Up Evaluation7.5 Isolating the Effects of the HR Solution7.6 Converting Data to Monetary Values7.7 Developing Costs7.8 Calculating the ROI7.9 Identifying Intangible Benefits7.10 Administrative Issues7.11 Using Business Impact and ROI Data
Figure 12-3. Continued.

338 THE HUMAN RESOURCES SCORECARD
task forces, the staff should be involved in every phase of developingthe framework and the supporting documents for ROI.
Using ROI as a Learning Tool
One reason the HR staff members may resist the ROI processis that the effectiveness of their programs will be fully exposed,putting their reputations on the line. To overcome this fear offailure, the ROI process should clearly be positioned as a toolfor learning and not a tool for evaluating staff performance, atleast during its early years of implementation. HR staff memberswill not be interested in developing a process that will be usedagainst them.
Evaluators can learn as much from failures as successes. If theprogram is not working, it is best to find out quickly andunderstand the issues firsthand—not from others. If a programis ineffective and not producing the desired results, its ineffective-ness will eventually be known to clients and/or the managementgroup, if they are not aware of it already. A lack of results willcause managers to become less supportive of HR programs andinitiatives. If the weaknesses of programs are identified andadjustments are made quickly, not only will effective programsbe developed but the credibility and respect for the function willbe enhanced.
Dispelling Myths
Several obstacles to the implementation of the ROI processexist. Some of these are realistic barriers, while others are merelymyths that are easily dispelled with further explanation. The mostcommon myths are as follows:
� ROI is too complex for most users. While there are a fewhighly complex ROI models out there, many are straight-forward and can be easily learned by HR professionals. Theprocess described in this book, for example, is a basicfinancial formula for accountability that is simple andunderstandable: earnings divided by investments. “Earnings”equate to net benefits from the HR program, and the “invest-ments” equal the actual costs of the program. Straying from

IMPLEMENTATION ISSUES 339
this basic formula can add confusion and create tremendousmisunderstanding.
� ROI is expensive and consumes too many critical resources.The ROI process can become expensive if it is not carefullyorganized and controlled, and properly implemented. Tencost-savings approaches to ROI can help reduce cost whenan organization is on a shoestring budget [2]. Each of theseis discussed throughout this book:1. Plan for evaluation early in the process.2. Build evaluation into the HR process.3. Share the responsibilities for evaluation.4. Require participants to conduct major steps.5. Use shortcut methods for major steps.6. Use sampling to select appropriate programs.7. Use estimates in the data collection and analysis.8. Develop internal capability in implementing ROI
evaluation.9. Streamline the reporting process.
10. Use Web-based technology.� If senior management does not require ROI, there is no
need to pursue it. This idea captures the most innocentbystanders. It is easy to be lulled into providing evaluationand measurement that simply meets the status quo, believingthat no pressure means no requirement. The truth is that ifsenior executives have only seen Level 1 reaction data, theymay not be asking for higher-level data because they believethe process that provides this data has not yet been developed.In some cases, HR leaders have convinced top managementthat programs cannot be evaluated at the ROI level or thatthe specific impact of an HR program cannot be determined.
Senior managers are beginning to request this type ofdata. Changes in corporate leadership sometimes initiateimportant paradigm shifts. New leadership often requiresproof of accountability. The process of integrating ROI intoan organization takes a good deal of time—about twelveto eighteen months for many organizations. It is not a quickfix, and when senior executives suddenly ask the HR func-tion to produce this kind of data, they may expect theresults to be produced quickly. Because of this, HR depart-ments should initiate the ROI measurement process and

340 THE HUMAN RESOURCES SCORECARD
develop ROI impact studies long before senior managementbegins asking for ROI data.
� ROI is a passing fad. Unfortunately, this comment doesapply to many of the processes being introduced to organi-zations today. Accountability for expenditures will alwaysbe present, and the ROI provides the ultimate level ofaccountability. As a tool, ROI has been used for some time.For years, it was used to measure the investment of equip-ment and new plants. Now it is being used in many otherareas. With its rich history, ROI will continue to be usedas an important tool in measurement and evaluation.
� ROI measurement produces only one type of data. This isa common misunderstanding. While the ROI process describedin this book shows the costs versus benefits for the HRinitiative, it actually serves as a scorecard reporting thefollowing six types of data:1. Reaction and planned action, showing the reaction of
participants to programs and their intentions of plans touse their new knowledge or skills
2. Amount of learning in terms of skills and knowledge orchanges in perceptions or behavior
3. Application or implementation of the program or initia-tive on the job
4. Business impact driven by the application of the programor initiative on the job
5. Return on investment, which shows the cost versus benefitsof the initiative
6. Intangible data, representing important data not convertedto monetary value
� ROI is not future oriented; it only reflects past performance.Many evaluation processes are past-oriented and reflect onlywhat has happened with a program. This is the only wayto have an accurate assessment of impact. It is possible,though, to adapt ROI measurement to reflect future returns.The challenge is to estimate the actual impact on the measuresthat will be influenced by a particular program. The restof the process remains the same. Although this is a novelidea and is a routine request, the accuracy of forecastingis limited in any forecasting model. The consequences canbe serious.

IMPLEMENTATION ISSUES 341
� ROI is not a credible process—it is too subjective. Thisnotion has evolved because some ROI studies involvingestimates have been publicized and promoted in literatureand conferences. Many ROI studies can and have beenconducted without the use of estimates. The problem withestimates often surfaces when attempting to isolate theeffects of other factors. Using estimates from the participantsis only one of the many different techniques used to isolatethe effects of a program. Other techniques involve extremelyprecise and analytical approaches, such as use of controlgroups and a trendline analysis.
� ROI measurement is only possible for production and sales.The fact is ROI often works well in many programs. ManyHR programs drive hard data items, such as output, quality,cost, or time. Case after case shows successful applicationof the ROI process to programs, such as outsourcing andstress management. Additional examples of successful ROIapplication can be found in compliance programs such asdiversity, sexual harassment prevention, and policy imple-mentation. Any type of program or process can be evaluatedat the ROI level. Issues occur when ROI is used for programsthat should not be evaluated at this level. The ROI processshould be reserved for programs that are expensive, thataddress operational problems and issues related to strategicobjectives, or that attract the interest of management interms of increased accountability.
� ROI is only for manufacturing and service organizations.Although initial studies appeared in the manufacturingsector, the service sector quickly picked up the ROI processas a useful tool. It then migrated to the nonprofit sector ashospitals and healthcare firms began endorsing and usingthe process. Next, ROI moved through government sectorsaround the world and, now, educational institutions arebeginning to use the process.
� ROI is appropriate only for large organizations. While itis true that large organizations with enormous HR budgetshave the most interest in ROI, smaller organizations canalso use the process, particularly when it is simplified andbuilt into programs. Organizations with as few as 500people have successfully applied the ROI process, using it

342 THE HUMAN RESOURCES SCORECARD
as a tool to bring increased accountability and involvementto the human resources function.
� When measuring ROI it is not possible to isolate the influenceof other factors. This is not true. There are at least ten waysto isolate the influence of other factors, and at least onemethod will work in any given situation. The challenge isto select an appropriate isolation method for the resourcesand accuracy needed in a particular situation. This falseperception probably stems from an unsuccessful attempt atusing a control group arrangement—a classic way of isolat-ing the effect of a process, program, or initiative. In prac-tice, a control group does not work in a majority of situa-tions, causing some to abandon the issue of isolating otherfactors. In reality, there are many other techniques availablefor isolating factors, and these techniques are gaining credi-bility for providing accurate, reliable, and valid methods forisolating the effects.
� Because there’s no control over what happens after anHR intervention, a process based on measuring on-the-jobimprovements should not be used. This idea is fading asorganizations face the reality of implementing HR solutionsand realize the importance of measuring results. Althoughthe HR function does not have direct control of whathappens in the workplace, it does have influence. An HRintervention must be considered within the context of theworkplace—the program does not belong to the HR func-tion; rather, it belongs to the organization. Many individualsand groups are involved in programs and, collectively, theyhave objectives that push expectations beyond the HRorganization. These objectives focus on application andimpact data that can be collected and used in the ROI analysis.
� There are no standards for the ROI process. An importantproblem facing measurement and evaluation is a lack ofstandardization or consistency. These questions are oftenasked: “What is a good ROI?” or, “What should be includedin the cost so I can compare my data with other data?” or,“When should specific data be included in the ROI valueinstead of as an intangible?” While the questions are noteasily answered, some help is on the way. A professional

IMPLEMENTATION ISSUES 343
association called the ROI Network is developing standardsfor the ROI process, using as its base a group of guidingprinciples. Also under development is a database that willshare thousands of studies so that best practices, patterns,trends, and standards are readily available [5].
These and other obstacles can thwart an otherwise successfulimplementation. Each must be removed or reduced to help ensuresuccess with the ROI process.
Teaching the Staff
The HR staff will usually possess inadequate skills in measure-ment and evaluation and thus will need to develop some expertisein the process. Measurement and evaluation does not alwaysconstitute a formal part of the preparation to become an HRspecialist. Consequently, each staff member must be provided withtraining on the ROI process to learn how it works, step-by-step.In addition, staff members must know how to develop an evalua-tion strategy and specific plan, collect and analyze data from theevaluation, and interpret results from data analysis. Sometimesa one- to two-day workshop is needed to build adequate skillsand knowledge to understand the process, appreciate what it cando for the organization, see the necessity for it, and participatein a successful implementation. Perhaps the two most useful ROIdocuments are the data collection plan and ROI analysis plan,discussed in an earlier chapter. These plans show what data willbe collected, at what time, and by whom, and how specificanalyses will be conducted, including isolating the effects of theprogram resources and converting data to monetary values. Eachstaff member should know how to develop, understand, and usethese documents.
INITIATING THE ROI PROCESS
The first tangible evidence of the ROI process may be theinitiation of the first project for which the ROI is calculated. Thissection outlines some of the key issues involved in identifyingprojects and keeping them on track.

344 THE HUMAN RESOURCES SCORECARD
Selecting Initial Programs
Selecting a program for ROI analysis is an important andcritical issue. Only specific types of programs should be selectedfor a comprehensive, detailed analysis. Listed below are typicalcriteria used for identifying programs for analysis. Select pro-grams that—
� Involve large target audiences� Are expected to be viable for a long time� Are linked to operational goals and issues� Are important to overall strategic objectives� Are expensive� Have high visibility� Have a comprehensive needs assessment
Other considerations when selecting programs for ROI anal-ysis include:
� The investment of time to implement the program� The level of interest in the program by executive management
Using these criteria, or similar criteria, the staff must select theappropriate programs to consider for an ROI project. Ideally,management should concur with, or approve, the criteria.
The next major step is to determine how many projects toundertake initially and in which areas. A small number of initialprojects are recommended, perhaps two or three programs.Programs may represent functional areas of HR including com-pensation, benefits, selection, compliance, training, and laborrelations. Programs may also represent initiatives impacting theentire organization, including outsourcing, reengineering, affirma-tive action, and outplacement. Finally, initiatives that support theHR function from a technical standpoint, such as the imple-mentation of a new HRIS system, may be a candidate for initialROI implementation. However, caution must be taken whenconsidering such a potentially high-profile project.
The important thing to remember is to select a manageablenumber of programs to ensure successful implementation ofthe process.

IMPLEMENTATION ISSUES 345
Reporting Progress
As the projects are developed and the ROI implementation isunder way, status meetings should be conducted to report pro-gress and to discuss critical issues with appropriate team members.For example, if a reengineering effort for operations is selectedas one of the ROI projects, all the key staff involved in theprogram should meet regularly to discuss the status of the project.This keeps the project team focused on the critical issues, generatesthe best ideas to address particular issues and barriers, and buildsa knowledge base to implement evaluation in future programs.Sometimes this group is facilitated by an external consultant, anexpert in the ROI process. In other cases, the internal ROI leadermay facilitate the group.
In essence, these meetings serve three major purposes: reportingprogress, learning, and planning. Such a meeting usually beginswith a status report for each ROI project, describing what hasbeen accomplished since the previous meeting. Next, the specificbarriers and problems encountered are discussed. During thediscussions, new issues are interjected in terms of possible tactics,techniques, or tools. Also, the entire group discusses how toremove barriers to success and focuses on suggestions and recom-mendations for next steps, including developing specific plans.Finally, the next steps are determined.
Establishing Discussion Groups
Because the ROI process is considered difficult to understandand apply, it sometimes helps to establish discussion groups orcompetency groups designed to enhance the understanding andapplication of the process. These groups can supplement formalworkshops and other training processes and are often quiteflexible in their format. An external ROI consultant or theinternal ROI leader usually facilitates these groups. In eachsession a new issue is presented and discussed thoroughly. Con-cerns about the ROI process are discussed, including how itapplies to the organization. The process can be flexible andadjusted to different topics as the needs of the group drive theissues. Ideally, participants of the discussion group have anopportunity to apply, explore, or research the issues between

346 THE HUMAN RESOURCES SCORECARD
sessions. Assignments such as reviewing a case analysis or readingan article are also appropriate between sessions to continue thedevelopment of knowledge and skills associated with the process.
MANAGEMENT TEAM
Perhaps no group is more important to the ROI process thanthe management team, which must allocate resources and supportthe human resources programs. In addition, management oftenprovides input and assistance in the ROI process. Specific actionsto train and develop the management team should be carefullyplanned and executed.
A critical issue that must be addressed is the relationshipbetween the staff and key managers. A productive partnership isneeded, which requires each party to understand the concerns,problems, and opportunities of the other. Developing this typeof relationship is a long-term process that must be deliberatelyplanned and initiated by key HR staff members. Sometimes thedecision to commit resources and support for human resourceprograms is based on the effectiveness of this relationship.
Workshop for Managers
One effective approach to preparing managers for the ROIprocess is to conduct a workshop for managers. Varying induration from one-half to two days, a practical workshop shapescritical skills and changes perceptions to enhance the support ofthe ROI process. Managers leave the workshop with an improvedperception of the impact of HR programs and a clearer under-standing of their roles in the process. More importantly, theyoften have a renewed commitment to making HR programs andinitiatives work in their organization.
Because of the critical need for this topic in managementtraining, this workshop should be required for all managers,unless they have previously demonstrated strong support for theHR function. Because of this requirement, it is essential for topexecutives to support this workshop and, in some cases, take anactive role in conducting it. To tailor the program to specificorganizational needs, a brief needs assessment may be necessaryto determine the specific focus and areas of emphasis forthe program.

IMPLEMENTATION ISSUES 347
Target Audiences. Although the target audience for this type ofprogram is usually middle-level managers, the target group mayvary with different organizations. In some organizations, thetarget may be first-level managers, and in others the target maybegin with second-level managers. Three important questions helpdetermine the proper audience:
1. Which group has the most direct influence on the HR function?2. Which management group is causing serious problems by
lack of management support?3. Which group has the need to understand the ROI process
so group members can influence the implementation ofHR programs?
The answer to these questions is often middle-level managers.
Timing. This workshop should be conducted early in the manage-ment development process, before non-supportive habits aredelivered. When this program is implemented throughout theorganization, it is best to start with higher-level managers andwork down the organization. If possible, a version of the pro-gram should be a part of a traditional management trainingprogram provided to supervisors when they are promoted intomanagerial positions.
Selling Top Management. Because convincing top management torequire this program may be difficult, three approaches shouldbe considered:
1. Discuss and illustrate the consequences of inadequatemanagement support for HR programs. For example, thestatistics for wasted time and money are staggering.
2. Show how current support is lacking. An evaluation of anHR program often reveals the barriers to successful imple-mentation. Lack of management support is often the mainreason, which brings the issue close to home.
3. Demonstrate how money can be saved and results can beachieved with the ROI process.
The endorsement of the top management group is crucial. Insome organizations, top managers actually attend the program to

348 THE HUMAN RESOURCES SCORECARD
explore firsthand what is involved and what they must do tomake the process work. At a minimum, top management shouldsupport the program by signing memos that describe the programor by approving policy statements. Top managers should also askprobing questions in their staff meetings from time to time. Thiswill not happen by chance. The HR manager must tactfully coachtop executives.
Workshop Content
The program usually covers the topics outlined next. The timeallotted for each topic and specific focus depends on the organi-zation, the experience of the managers, the needs of the managers,and the preparation of the management group. The program canbe developed in separate modules, creating a situation in whichmanagers can be exempt from certain modules based on theirprevious knowledge or experience with the topic. This moduleconcept is recommended.
The Overall Importance of HR. Managers need to be convincedthat the human resources function is a mainstream responsibilitythat is gaining importance and influence within organizations.They need to understand the results-based approach of today’sprogressive HR organization. After completing this module,managers should perceive HR as a critical component in theirorganization and be able to describe how it contributes to strategicand operational objectives. Data should be presented to show thefull scope of HR within the organization. Tangible evidence oftop management commitment should be presented in a form suchas memos, directives, and policies signed by the CEO or otherappropriate top executive. In some organizations, the invitationto attend the program may come from the CEO, a gesture thatshows strong top management commitment. Also, external datashould be included to illustrate the growth of HR budgets andthe increasing importance of the function. A case study showingthe linkage between HR and strategy will help demonstrate theimportance of key HR initiatives.
The Impact of HR. Too often, managers feel unsure about thesuccess of HR programs. After completing this module, managers

IMPLEMENTATION ISSUES 349
will be able to identify the steps to measure the impact of HRprograms on important output variables. Reports and studiesshould be presented showing the impact of key initiatives, usingmeasures such as productivity, quality, cost, response times, andcustomer satisfaction. Internal evaluation reports, if available,should be presented to managers, showing convincing evidencethat the HR function makes a significant difference in theorganization. If internal reports are not available, success storiesor case studies from other organizations can be used. Part IV inthis book provides several case studies in which the impact ofHR programs is determined. Managers need to be convinced thatHR is a successful, results-based function that exists not only tohelp with change but also to meet critical organizational goalsand objectives.
The HR Process. Managers usually will not support activities orprocesses that they do not fully understand. After completing thismodule, managers should be able to describe how the HR processworks in their organization and should understand each criticalstep, from needs assessment to ROI calculation. Managers needto be aware of the effort that goes into developing an HRprogram and their role in each step of the process. A short case,illustrating all the steps, is helpful in this module. This discus-sion also reveals various areas of the potential impact of theHR program.
Responsibility for HR. Defining who is responsible for humanresources is important to its success. After completing this module,managers should be able to list their specific responsibilities forhuman resources. Managers must see how they can influence HRprograms and the degree of responsibility they must assume inthe future. The idea that multiple people should take responsibilityfor HR should be advocated—this includes managers, participants,participant supervisors, and program leaders/facilitators. Casestudies are appropriate in this module to illustrate the conse-quences when responsibilities are neglected or when managers failto follow up. Some organizations may revise job descriptions toreflect the HR responsibilities. Other organizations may establishmajor job-related goals to highlight management responsibilityfor HR. Overall, this session leaves participants with a clear

350 THE HUMAN RESOURCES SCORECARD
understanding of how their responsibility is linked to the successof HR programs.
Active Involvement. One of the most important ways to enhancemanagers’ support for HR is to actively involve them in theprocess. After completing this module, managers will actuallycommit to one or more ways of active involvement in the future.Table 12-3 shows eleven ways in which managers can be involved,as identified by one company. The information in the table waspresented to managers in the workshop. After fully explainingand discussing the areas of involvement, each manager was askedto select one or more ways to be involved in HR in the future.A commitment to at least one involvement role was required.
If used properly, these commitments can provide a rich sourceof input and assistance from the management group. Workshopparticipants will offer to be involved in many ways, and HR mustfollow through with the offers for this involvement. An immediatefollow-up on all offers is recommended.
MONITORING PROGRESS
AND COMMUNICATING RESULTS
A final part of the implementation process is to monitor overallprogress and communicate the results of specific ROI projects.Although it is an often overlooked part of the process, an effec-tive communication plan can help keep the implementation ontarget and let others know what the ROI process is accomplishingfor the organization. Because of the importance of communica-tion, Chapter 10 is dedicated entirely to this topic.
CONCLUSION
In summary, the implementation of the ROI process is a criticalpart of the process. If not approached in a systematic, logical,and planned way, the ROI process will not become an integralpart of the HR function, and consequently the programs will lackaccountability. This chapter presented the different elements thatmust be considered and issues that must be addressed to ensurethat implementation is smooth and uneventful. The result will bea complete integration of ROI as a mainstream activity in theROI process.

IMPLEMENTATION ISSUES 351
Table 12-3Management Involvement in Human Resources.
The following are areas for present and future involvement in theHR process. Please check your areas of planned involvement.
In Your OutsideArea Your Area
� Attend a program designed for your staff ❑ ❑
� Provide input for an HR needs analysis ❑ ❑
� Serve on an HR advisory committee ❑ ❑
� Provide input for an HR program design ❑ ❑
� Serve as a subject-matter expert ❑ ❑
� Serve on a task force to develop a program ❑ ❑
� Volunteer to evaluate an external HR ❑ ❑program
� Assist in the selection of a vendor- ❑ ❑supplied HR program
� Provide reinforcement to your employees ❑ ❑as they become involved in HR programs
� Coordinate an HR program ❑ ❑
� Assist in program evaluation or follow-up ❑ ❑
REFERENCES
1. Certification Process for Measuring the Return on Investment inTraining and Development Workshop. Brochure. Birmingham, Ala.:Performance Resources Organization, 1996.
2. Phillips, Patricia Pulliam, and Burkett, Holly. ROI on a Shoestring.ASTD Infoline Series. Alexandria, Va.: American Society for Trainingand Development, 2000.
3. Phillips, J. J. Return on Investment in Training and PerformanceImprovement Programs. Houston, Tex.: Gulf Publishing, 1997.
4. Phillips, J. J. Accountability in Human Resource Management.Houston, Tex.: Gulf Publishing, 1996.
5. Phillips, J. J., and Pulliam, Patricia F. “Dispelling the ROI Myths.”Corporate University Review, May/June 1999, pp. 32–36.


P a r t I V
CaseApplications

354 THE HUMAN RESOURCES SCORECARD
354
Chapter 13
Sexual HarassmentPrevention*Healthcare Inc.
By Jack J. Phillips and Dianne Hill
Most organizations have sexual harassment prevention pro-grams, but few are subjected to accountability up to andincluding a return-on-investment (ROI) analysis. In thesetting in this case, a large healthcare chain conducted asexual harassment prevention workshop involving first-levelmanagers and supervisors. Workshops were followed bymeetings with all employees conducted by the same managersand supervisors. In all, seventeen workshops were presented,and the monetary impact was developed. Several uniqueissues are involved in this case, including the techniques toisolate the effects of training and convert data to monetaryvalues. The analysis used a traditional ROI model andyielded significant and impressive results that surprised theevaluation team and senior managers.
*This case study was previously published in In Action: Measuring Return onInvestment, Vol. 2. Jack J. Phillips (Ed.) Alexandria, Va.: American Societyfor Training and Development, 1997, pp. 17–35.

SEXUAL HARASSMENT PREVENTION 355
BACKGROUND
Healthcare Inc. (HI) is a regional provider of a variety ofhealthcare services through a chain of hospitals, HMOs, andclinics. HI has grown steadily in the last few years and has earneda reputation as an aggressive and financially sound company. HIis publicly owned, with an aggressive management team poisedfor additional growth.
The healthcare industry in the USA continues to operate in astate of tremendous transformation and transition. The concernabout healthcare costs, the threat of additional government regu-lation, and the implementation of new technology and healthcaredelivery systems are radically transforming the healthcare field. HIis attempting to take advantage of these challenges and carve out asignificant market share in its regional area of operation.
EVENTS LEADING TO PROGRAM
In the USA, sexual harassment continues to grow as an importantand significant employee relations issue. Sexual harassment claimsthroughout the USA and in the healthcare industry continue to grow,sparked in part by increased public awareness of the issue and thewillingness of the victims to report harassment complaints. HI hasexperienced an increasing number of sexual harassment complaints,with a significant number of them converting to charges and law-suits. The company record was considered excessive by executivesand represented a persistent and irritating problem. In addition, HIwas experiencing an unusually high level of turnover, which mayhave been linked to sexual harassment.
Senior management, concerned about the stigma of continuedsexual harassment complaints and the increasing cost of defend-ing the company against claims, instructed the HR vice presi-dent to take corrective and preventive action to significantlyreduce complaints and ultimately rid the workplace of anysigns of harassment. The HR vice president instructed the HRDstaff to develop a workshop for employees or managers orboth, but only if a lack of understanding and knowledge of theissue existed.

356 THE HUMAN RESOURCES SCORECARD
In response to the request, the HRD staff conducted interviewswith the entire EEO and affirmative action staff in which themagnitude of the problem and the potential causes were explored.Most of the staff indicated that there seemed to be a significantlack of understanding of the company’s policy on sexual harass-ment and what actually constituted inappropriate or illegalbehavior. In addition, the complaints for the last year wereexamined for issues and patterns. Exit interviews of terminatingemployees for the last year were reviewed to see if there was alinkage to sexual harassment. Approximately 11 percent ofterminating employees identified sexual harassment as a factorin their decision to leave HI. Because of the request to proceedwith this program, the HRD staff members did not conduct afull-scale needs assessment. Instead, they augmented the inputfrom the EEO/AA staff with the exit interviews conducted withten randomly selected first-level supervisors to explore the levelof understanding of the policy, inappropriate and illegal behavior,and the perceived causes of the increased complaint activity.
From an analysis of complaints, the typical person accused ofsexual harassment was a supervisor and male. The typical victimof harassment was non-supervisory and female. The analysis alsorevealed that the type of sexual harassment typically experiencedat HI was in the category of hostile environment, defined by theEEOC as “an individual making unwelcome sexual advances orother verbal or physical conduct of a sexual nature with thepurpose of, or that creates the effect of, unreasonably interferingwith an individual’s work performance or creating an intimidat-ing, hostile, or offensive working environment.” This type ofharassment should be minimized by developing a clear under-standing of HI’s policy regarding harassment and by teachingmanagers to identify illegal and inappropriate activity. As partof HI’s policy, supervisors and managers were required to conducta limited investigation of informal complaints and to discussissues as they surfaced.
THE PROGRAM: DESIGN, DEVELOPMENT,AND IMPLEMENTATION
Armed with input from ten interviews and with detailed inputfrom the EEO/AA staff, the major causes of the problem were

SEXUAL HARASSMENT PREVENTION 357
identified. There was an apparent lack of understanding of (1)the company’s sexual harassment policy and (2) what constitutedinappropriate and illegal behavior. In addition, there was anapparent insensitivity to the issue. As a result, a one-day sexualharassment prevention workshop was designed for all first- andsecond-level supervisors and managers. The program had thefollowing objectives. After attending this program, participantsshould be able to:
� Understand and administer the company’s policy on sexualharassment
� Identify inappropriate and illegal behavior related to sexualharassment
� Investigate and discuss sexual harassment issues� Conduct a meeting with all direct reports to discuss policy
and expected behavior� Ensure that the workplace is free from sexual harassment� Reduce the number of sexual harassment complaints
Because of the implications of this issue, it was important forthe information to be discussed with all employees so that therewould not be any misunderstanding about the policy or inappro-priate behavior. Consequently, each supervisor was askedto conduct a meeting with his or her direct reports to discussthis topic.
The program design was typical of HI programs, using acombination of purchased and internally developed materials. Theone-day program was implemented and conducted during a45-day period, with 17 sessions involving 655 managers. HRmanagers and coordinators served as program facilitators.
WHY ROI?
HR/HRD programs usually targeted for an ROI calculation arethose perceived to be adding significant value to the company,closely linked to the organizational goals and strategic objectives.Then, the ROI calculation is pursued to confirm the added value,and based on the results of the ROI analysis, these programs maybe enhanced, redesigned, or eliminated altogether if the ROIis negative. Sexual harassment prevention training is usually

358 THE HUMAN RESOURCES SCORECARD
different; if the ROI analysis yielded a negative value, the pro-gram would not be discontinued. It might be altered for futuresessions but only if the behavior changes were not occurring atLevel 3.
At HI, this program was chosen for an ROI calculation fortwo reasons. First, the HR and HRD departments were interestedin the accountability of all programs, including sexual harassmentprograms. Second, a positive ROI would clearly show manage-ment that these types of programs, which are preventive innature, can significantly impact the bottom line when implementedthroughout the organization and supported by management.
DATA COLLECTION
Exhibit 13-1 shows the completed data collection plan for thesexual harassment training program. A pre/post-test was admini-stered to measure knowledge of HI’s sexual harassment policy andof inappropriate and illegal behavior. The twenty-item question-naire was evenly split on policy and behavior issues.
To measure the success of program application, three datacollection methods were used. First, a meeting record was requiredof each supervisor and manager to document the actual meetingwith employees, recording the time, duration, topics, and par-ticipants. Although, this form did not address the quality of themeeting, it provided evidence that the meeting was conducted.
The second data collection method was a survey of the non-supervisory employees, the typical target group for harassmentactivity. Although the entire team could have been surveyed, itwas felt that it was more important to examine behavior changefrom the perspective of those who were more likely to be victimsof harassment. The survey was planned for administration sixmonths after the program was completed. It provided post-program data only and thus each questionnaire had to be wordedto capture change since the training was conducted. The fifteen-item survey examined specific behavior changes and environ-mental changes related to harassment activity, including actionsthat might be considered inappropriate or offensive. Table 13-1shows some typical questions.
The third data collection method was a self-assessment question-naire completed by supervisors and managers. This questionnaire

SE
XU
AL H
AR
ASSM
EN
T PR
EV
EN
TIO
N359
Exhibit 13-1

360 THE HUMAN RESOURCES SCORECARD
Table 13-1
Strongly StronglyDisagree Disagree Neutral Agree Agree
I have noticed less � � � � �offensive languageat work.
I am certain that the � � � � �company will takeswift action againstthose who are foundguilty of sexualharassment.
captured actions, behavior change, and results linked to theprogram. Although there were a variety of other data collectionpossibilities, including focus groups, interviews, and third partyobservation, it was felt that, given the time and cost considera-tions, these three methods provided sufficient data to capturebehavior change and show that the program had succeeded.
Business results measures included several items. Initially, it wasplanned that internal complaints, lodged formally with the HRdivision, would be monitored along with external charges filedwith various agencies (primarily the EEOC). Because of the lagtime between changes in behavior and a reduction in complaints,data would be collected for one year after the program andcompared with data from one year before the program to deter-mine specific improvements. Also, as alternative information,litigated complaints would be tracked along with the direct costs,including legal fees, settlements, and losses. In addition, becauseof the perceived link between a hostile work environment andturnover, annual employee turnover would be examined for thesame time period.
ROI ANALYSIS
To develop the ROI calculation, several other issues needed tobe addressed to plan for the Level 5 evaluation. The specific

SEXUAL HARASSMENT PREVENTION 361
method(s) to isolate the effects of the program from otherinfluences would have to be selected and implemented. Thevarious ways in which data are converted to monetary valueswould need to be pinpointed. Each specific program cost elementwould have to be identified along with other issues that mightinfluence the reduction in complaints and litigation expenses.Finally, intangible benefits expected from the program needed tobe itemized and the communication targets established.
ROI ANALYSIS PLAN
Exhibit 13-2 shows the completed document for the ROIanalysis plan. Because of the relatively short time frame requiredto implement the program and the desire from top managementto implement it throughout the organization quickly, a controlgroup arrangement was not feasible. However, because historicaldata are available for all complaint measures, a trendline analysiswas initially planned. Complaint activity would be projectedbased on twelve months of data prior to the program. Actualperformance would be compared with the projected value, andthe difference would reflect the actual impact of the program onthat measure. In addition to trendline analysis, participants’estimation was planned to compare with trendline data. In thistype of situation, supervisors and managers (participants) areasked to indicate the extent to which the program influenced thechanges in the number of complaints.
For turnover, trendline analysis could not be used because ofthe other initiatives implemented to reduce turnover. Thus, a typeof forecasting was used in which the percentage of turnoverrelated to sexual harassment is developed for the twelve-monthperiod prior to the program The same percentage is developedfor the post-program period.
In regard to converting the data to monetary values, the costof complaints would be derived both from historical data, whenavailable, and from estimates for other factors, such as the actualtime used for harassment complaints. The estimates would bedeveloped with input from the EEO/AA staff. For turnover,industry data would be used because HI had not calculated theactual cost of turnover for any employee groups. The specific cost

362T
HE H
UM
AN
RESO
UR
CES S
CO
REC
AR
D
Exhibit 13-2

SEXUAL HARASSMENT PREVENTION 363
items, intangible benefits, other influences, and communicationtargets were all identified and are presented in Exhibit 13-2.
REACTION AND LEARNING DATA
A typical end-of-program questionnaire was used to capturereaction data. Overall, the participants reacted very positively tothe program and perceived it to be timely and useful. A compositerating of 4.11 out of a possible 5 was achieved. The vast majorityof the participants (93 percent) provided a list of action itemsplanned as a result of the program.
For a Level 2 evaluation, the pre-program test scores averaged51 and the post-program scores averaged 84, representing adramatic increase of 65 percent. These results were significantand exceeded the expectations of the program developers. Twoimportant points were underscored with the Level 2 measures.First, the low scores on pre-program testing provided evidencethat the program was necessary. The participants did not under-stand the organization’s policy, nor did they recognize whatconstituted inappropriate and illegal behavior. Second, the dramaticimprovement in scores provided assurance that the content of theprogram was appropriate for both key issues, as the participantslearned much about policy and behavior. As part of the Level 2evaluation, participants were involved in skill practices for issuesinvolving administering policy.
ON-THE-JOB APPLICATION
One of the initial actions required of participants was toconduct a meeting with his/her employees to discuss sexualharassment issues, review HI’s policy on sexual harassment, anddiscuss what constitutes inappropriate and illegal behavior. Hand-outs and visual aids were provided to each supervisor andmanager to assist with the meeting. A meeting record form hadto be completed and submitted to the HR department as evidencethat the meeting was conducted. The time of the meeting, theduration, the participants by name, and the specific topics coveredwere noted on the form. Within one month of the program, 82percent of the participants had completed the meeting record.

364 THE HUMAN RESOURCES SCORECARD
Ultimately, 96 percent completed it. Some managers did notconduct meetings because they did not have direct reports.
Six months after the program was conducted, an anonymoussurvey was conducted with a 25 percent sample of non-supervisoryemployees. A total of 1,720 surveys were distributed, and 1,100were returned for a response rate of 64 percent. The surveyyielded an average score of 4.1 on a scale of 1 to 5. The ratingrepresents the extent to which the behavior had changed in thesix months since the program was conducted. Overall, the surveyresults indicated that significant behavior change had occurredand the work environment was largely free of harassment.
A follow-up questionnaire was administered directly to allparticipants six months after the program was conducted. A totalof 571 questionnaires were returned, representing a response rateof 87 percent. The questionnaire probed the extent to whichprogram materials were used and specific behavior changes hadbeen realized. In addition, participants estimated the amount ofimprovement in sexual harassment complaints that was directlyattributable to this program. Although the input from participants(managers and supervisors) may be biased, significant changeswere reported. In regard to actions completed, 92 percent reportedthat some actions were completed while 68 percent reported thatall actions were completed.
BUSINESS IMPACT
Exhibit 13-3 shows the complaint and turnover data for oneyear prior to the program and one year after the program. Inthe six-month follow-up questionnaire, participants were providedthe six-month averages from before and after the program andwere asked to estimate the percent of improvement actuallycaused by this program. The average percentages from all par-ticipants are included in the right column. The results also showthe turnover rate for the non-supervisory employees for the twelvemonths preceding the program and for the twelve months afterthe program.
Exhibit 13-4 shows a plot of the formal internal complaintsof sexual harassment twelve months prior to the program andtwelve months after the program. Prior to the program there wasan upward trend of complaints, and senior managers felt this

SEXUAL HARASSMENT PREVENTION 365
Exhibit 13-3
Exhibit 13-4

366 THE HUMAN RESOURCES SCORECARD
would continue if they took no action to improve the situation.Also, no other initiatives were undertaken to focus attention onsexual harassment. The magnitude of the program, involvingseventeen training sessions with 655 managers and meetings withall employees, focused significant attention on the issue. Thus, itwas felt that the trendline analysis might be an effective tool forisolating the effects of training.
The turnover rate showed a dramatic improvement during thissame time frame. However, because of the serious problem withturnover, other initiatives were undertaken to help reduce thedeparture rate of employees. Recruiting processes were enhanced,entry-level salaries were increased, and more effective selectiontechniques were employed during the same time period. All theseactions were initiated to develop a better match between theemployees and the culture at HI. Thus, the trendline forecast forthe turnover rate would be accurate because of the influence ofthese factors on the turnover rate.
To estimate the percent of turnover reduction directly relatedto this program, a special version of the forecasting process wasconsidered. During the needs assessment, the exit interview fileswere reviewed for evidence of sexual harassment as a factor inthe decision to leave. In these cases, 11 percent of the actualturnovers had mentioned sexual harassment. Employees are oftenreluctant to indicate the presence of sexual harassment althoughthis issue may be the reason for their departure. Thus, it was feltthat this 11 percent figure was a conservative estimate of thenumber of terminations related to a hostile work environment.A twelve-month review of exit interviews, on a post-programbasis, revealed that only 3 percent of the interviewees mentionedsexual harassment or a hostile work environment as a reason fortheir departure. Thus, the percent of employees leaving becauseof sexual harassment dropped from 11 to 3 percent of termina-tions. The target group for the turnover reduction was non-supervisory employees, which represented an average of 6,844 ona post-program basis and 6,651 on a pre-program basis. For thetwelve-month period after the program, the employment levels atHI averaged 7,540, including 655 for the target group for trainingand 41 senior managers who did not participate directly in thetraining program. The average non-supervisory salary for thepost-program period was $27,850, and for the pre-program

SEXUAL HARASSMENT PREVENTION 367
period, it was $26,541. Several industry studies on the cost ofturnover were briefly discussed, which showed ranges from 110percent to 150 percent of annual salaries. The evaluation team feltthat 75 percent of annual salaries would be a conservative estimate.
PROGRAM COSTS
Program costs are fully loaded and include the cost of theneeds assessment ($9,000), design and development ($15,000),and evaluation ($31,000). The needs assessment cost was anestimate based on the direct time and expenses involved in theprocess. The development costs were low because of the availa-bility of materials for purchase. The evaluation costs include anestimate of all internal and external costs associated with thefollow-up evaluation, including the ROI. Participants’ salaries andbenefits were included although it was not HI’s policy to includesalaries and benefits as a training expense for a one-day programfor supervisors and managers.
Exhibit 13-5 shows the salary profile of participating super-visors and managers. The time necessary for program coordinationwas estimated along with the time for facilitator preparation anddelivery. When considering the average salaries plus benefits forthese individuals, a value of $9,600 was estimated. Travel andlodging for coordination and facilitation was a minor factor,estimated at $1,520. Program materials cost $12 per participant,and food and refreshments during the workshop cost $30 per
Exhibit 13-5Salaries and Benefits of Participants
Management Number Participating Salary MidpointLevel in Program Value
7 41 $32,5008 435 43,6009 121 54,300
10 58 66,700
Employee benefits costs as a percent of payroll = 39%.Managers work an average of 47 weeks per year.

368 THE HUMAN RESOURCES SCORECARD
participant. The estimated value of the conference rooms used forthe program was $150 per day.
MONETARY BENEFITS FROM PROGRAM
Exhibit 13-6 shows the calculation for the monetary benefitsfrom the sexual harassment program. For the reduction of com-plaints, the value could be based on reducing internal complaints,external charges, or litigated complaints, but not all three. Thevalue for each measure is shown in the exhibit. The values aredeveloped by taking the total cost of sexual harassment preven-tion, investigation, and defense from Exhibit 13-3 and dividingit by each of these three measures. The total value of the reduc-tion for each measure (indicated in Exhibit 13-3) was developed,leaving the decision of which measure to use. Because of theinterest in tracking internal complaints, the evaluation teamdecided to use it as the unit of improvement in the analysis. Thus,the value of one internal complaint was placed at $24,343. If onecomplaint could be avoided, HI would save that amount. Thelower value is used to be conservative. Another approach is toexamine the total cost of sexual harassment, including prevention,investigation, and defense, and use a value equal to the reductionin cost. However, because there is a lag between measures ofcomplaints and actual losses and legal expenses, the reductionillustrated in Exhibit 13-3 may not reflect the actual cost savings.
Although the total improvement is 20 internal complaints, theimprovement related directly to the program is 74 percent of thatfigure, or 14.8 complaints. The 74 percent is an estimate fromthe supervisors and managers taken directly from the questionnaire,as they were asked to indicate the extent to which the reductionin complaints was related directly to the program. The value ofthe improvement is $360,276. Exhibit 13-6 shows these calculations.
The value for the turnover reduction was developed in a similarmanner. The unit of improvement is one turnover statistic. The24.2 percent turnover rate represents 1,610 employees who,before the program, left voluntarily or were forced to leavebecause of performance. According to the exit interviews, 11percent of those were related to sexual harassment. Thus, 177terminations were related to sexual harassment. On a post-program basis, the 19.9 percent turnover represents 1,362

SEXUAL HARASSMENT PREVENTION 369
employees. Post-program exit interviews revealed that 3 percentwere related to a hostile work environment. Thus, 41 employeesleft because of the hostile environment. The improvement relateddirectly to the program is 136 terminations, a significant num-ber when the cost of turnover is included. Although there was
Exhibit 13-6Monetary Benefits from Program
Complaint Reduction
Pre-Program Post-ProgramAverage Cost of Internal Complaint $30,090 $24,343
Average Cost of External Complaint $68,958 $60,857
Average Cost of Litigated Complaint $165,500 $142,000
Unit of Improvement = One Internal Complaint
Value of One Internal Complaint = $24,343
Total Improvement: 55 – 35 = 20
Improvement Related to Program: 20 × 74% = 14.8
Value of Improvement = 14.8 × $24,343 = $360,276
Turnover Reduction
Unit of Improvement = One Turnover Statistic (Termination)
Turnover Pre-Program = 6,651 × 24.2% = 1,610
Turnover, Pre-Program, Related to Hostile Environment:1,610 × 11% = 177
Turnover, Post-Program: 6,844 × 19.9% = 1,362
Turnover Post-Program Related to Hostile Environment:1,362 × 3% = 41
Improvement Related to Program: 177 – 41 = 136
Cost of One Turnover: 75% of Annual Salary = $27,850 × .75= $20,887
Value of Improvement: 136 × $20,887 = $2,840,632

370 THE HUMAN RESOURCES SCORECARD
sufficient evidence to use the annual salary as a cost of turnover,to be conservative the team used 75 percent of the annual salaries,representing $20,887 as a cost of one turnover statistic. Con-sequently, the 136 yielded a staggering $2,840,632 as the savingsgenerated by the reduction in turnover that was caused bysexual harassment.
Exhibit 13-7 shows the trendline projections for the internalcomplaint data. The trend, established prior to the program, wasprojected for the evaluation period. As the projection shows, theimpact of the program is even more dramatic than illustrated in theabove calculations because of the upward trend of the data. Becausethe impact is more conservative using the participants’ estimates, thisfigure was used in the analysis. Consequently, the actual calcula-tions represent an understatement of actual performance.
PROGRAM COST
Exhibit 13-8 shows the detail of the program cost categories.Most of the cost items were straightforward and taken fromactual cost statements or from estimates given by those closely
Exhibit 13-7Formal Internal Complaints of Sexual Harassment

SEXUAL HARASSMENT PREVENTION 371
involved in the process. Participants’ salaries and benefits weredeveloped using midpoint values for the managers in each clas-sification. The managers’ midpoint salary data were converted toa daily rate by dividing by 235 (the number of days actuallyworked), and this was multiplied by the number of managers atthat grade level attending the program. Participants’ salaries andbenefits greatly overshadow the other cost elements.
ROI CALCULATION
Exhibit 13-9 shows the benefit/cost ratio and ROI calculationsfor these values. Benefits based entirely on complaint reductionand turnover reduction are used in the benefit/cost ratio to yield11.5:1. Thus, for each $1 spent on the program, $11.50 wasreturned. The ROI calculation, which uses net benefits, shows areturn of 1,052 percent, an impressive and staggering amount.
Exhibit 13-8Program Costs
Needs Assessment (Estimated Cost of Time) $9,000
Program Development/Acquisition 15,000
Program Coordination/Facilitation Time 9,600
Travel and Lodging for Facilitation and Coordinators 1,520
Program Materials (655 @ $12) 7,860
Food/Refreshments (655 @ $30) 19,650
Facilities (17 @ $150) 2,550
Participant Salaries and Benefits ($130,797 × 1.39) 181,807
Evaluation 31,000
$277,987

372 THE HUMAN RESOURCES SCORECARD
QUESTIONS FOR DISCUSSION
1. Was the needs assessment appropriate for this situation?Please explain.
2. Should this program be evaluated at Levels 4 and 5? Ifso, what specific measures should be used for Level 4 data?
3. What specific method(s) should be used to isolate theeffects of the program?
4. What are the most appropriate ways to convert the Level4 data to monetary values?
5. Critique the Level 2 and Level 3 results. Was the employeesurvey necessary? Explain.
6. Which Level 4 complaint measure is most appropriate?Why?
7. Project the trendline for internal complaints and estimatethe impact of the program on the number of complaints.Use the average of the last three months for comparison.
8. Is the ROI lower or higher than you expected? Pleasecomment.
9. Do you consider this estimate realistic?10. How could this process be improved?11. How would you present these data to management? To
all employees?
Exhibit 13-9ROI Calculation
BCRBenefitsCosts
= = + = =$ , $ , ,$ ,
$ , ,$ ,
. :360 276 2 840 632
277 9873 200 908277 987
11 5 1
ROI = = − =Net BenefitsCosts
$ , , $ ,$ ,
, %3 200 908 277 987
277 9871 052

Chapter 14
Competency-BasedPay System
National CrushedStone Company
By Patricia Pulliam Phillips
Set in an extremely competitive industry, this case shows theimpact and return on investment of a competency-based paysystem installed in construction aggregate plants. Because theold pay system seemed inefficient and tedious, NationalCrushed Stone decided to try basing compensation onemployees’ skills and competencies instead of on the specificjobs performed by employees, as had been done in the past.This case demonstrates how the indisputable data weredeveloped to show the contribution of a new pay schemeand the effects that it had on operations.
BACKGROUND
The crushed stone industry is a very competitive industry inwhich profit margins are narrow and cost control is everything.Companies in this industry are constantly seeking ways to controlcosts to gain a competitive advantage in the marketplace. National
373

374 THE HUMAN RESOURCES SCORECARD
Crushed Stone Company is one of the leading firms in thecrushed stone industry, with more than 150 locations in severalgeographic areas. Each crushed stone plant offers a narrowlydefined product mix consisting of various sizes of crushed stoneused in construction projects such as roads, bridges, and largebuildings. National Crushed Stone (NCS) takes pride in itsemployee relations programs and usually has a stable workforcealthough turnover is sometimes a problem. A typical plant isstaffed with approximately twenty employees and is organized bya plant manager.
COMPETENCY-BASED PAY
Employees perform a variety of jobs from entry-level laborduties to skilled mechanic positions involving equipment repair.Traditionally, employees were assigned to one of twelve differentjob titles within a plant. Each job had a distinctive pay rate, andemployees usually worked in their specific job classifications allday. If they had to work “out of their classification,” they werepaid at the highest rate. Permanent promotions were rare.
Because the current system seemed too cumbersome and createdinefficiencies, the HR manager and the production managerconsidered the possibility of a skill-based or competency-basedpay. With this system, employee pay is based on skills andcompetencies—not on the particular job the employee is per-forming at the time. Employees are rewarded with promotionsand pay increases for learning new skills required for other jobs.Twelve different pay levels could be replaced with five levels, withlarger differentials between the levels.
In theory, this prospect seems attractive. A simplified base paysystem would have fewer job classifications, greatly simplifyingthe plant manager’s administrative job. This system should pro-vide an incentive for employees to learn a variety of skills andto receive pay raises quickly. This career advancement elementof the system should prevent turnover. In addition, the systemshould pay off with reduced staffing for the plant and/or areduction in overtime. A more qualified workforce would meanthat fewer employees would be needed to cover all the jobs atthe plant. This should reduce in labor costs per ton, if theproductivity remains the same or improves.

COMPETENCY-BASED PAY SYSTEM 375
The attractiveness of the concept would be met with someresistance. Philosophically, plant managers have difficulty with theconcept of paying an employee at a higher rate for performing ajob that was previously defined at a lower rate. Most believe inpaying employees for the jobs they are performing, not for whatthey are capable of performing. Also, this process would increasethe average wage rates in a plant as employees quickly movedto higher job classifications. If the new system was attractive tothe employees, the manager might have more requests for promo-tion than he or she was willing to consider, and requests fortraining might exceed the ability to provide on-the-job trainingto build skills. Also, the system might meet with skepticism fromthe workforce. Although employee relations were good, employeeswere somewhat skeptical of management actions and, in par-ticular, the implementation of new plans and programs. Alteringjob classifications was a sensitive area that would be viewed withmuch skepticism. Employees would have to be convinced that theprogram was a “win” situation for them.
ROI DRIVERS
The HR manager approached the project in the face of concernabout the value of this process. Investments of time would besubstantial, and senior management would want some indicationof the payoff before pursuing full implementation. The payoffmust go beyond the traditional positive feedback from employeesand an occasional report showing reduced staffing. It must besubjected to a comprehensive evaluation, up to and includingmeasuring the return on investment (ROI). This way, the HRmanager reasoned, senior managers would clearly see the newsystem as a value-added process that would help them reach theirmajor goals of increased efficiency and greater profits.
It was anticipated that this program would reduce labor costper ton and reduce employee turnover. In addition, absenteeismwas expected to decline, and job satisfaction to improve. Whilethese benefits have been attributed to this concept in othersettings, proof is necessary in this setting to convince plantmanagers to embrace this concept.
Armed with the determination to show the value of the pro-gram, the HR manager, with the support of the production

376 THE HUMAN RESOURCES SCORECARD
manager, pursued the development and implementation of thecompetency-based system on a pilot basis.
DEVELOPMENT AND IMPLEMENTATION
The new system was planned for implementation in twelvelocations that represented typical plants at NCS. The completeprocess was developed during a four-month period using the part-time assistance of an external consultant and two internal staffmembers. Job descriptions were reviewed and rewritten to reflectthe skill-based process. During the development, several visits toeach location were required as the work was reviewed by plantmanagers. On some occasions, employees were asked for inputas the process was finalized. The new system was completelydocumented in an administrative manual for plant managers andin a handbook for employees.
Current jobs were slotted into new classifications at eachlocation to show employees how they fit into the scheme. Thenew system provided only five levels, but with a greater spreadbetween job classifications. A promotion in the new system wouldbe significant, whereas a promotion in the previous system maynot have added much actual income for an employee.
The new system was announced to employees in carefullyplanned meetings. The system was fully described, and handbookswere distributed to present the new structure. Administrativeprocedures of the system were completely described. Each employeehad a private meeting with the manager to discuss how he orshe would slot into the new system. More importantly, themanager outlined what would be necessary for promotion. Thesemeetings typically spread over a two-week period after theannouncement. A one-day workshop for plant managers of thetwelve sites prepared them for implementation. They were pro-vided guidelines to address issues expected to arise as the newprocess was implemented. The most important challenge for plantmanagers was to provide training opportunities quickly for thosewho wanted to move to higher job classifications. In addition,various checks and balances were included to ensure that theintegrity of the system was maintained and that employeeswere not promoted unless they demonstrated an adequate levelof competency.

COMPETENCY-BASED PAY SYSTEM 377
EVALUATION METHODOLOGY
To ensure that the new system received a comprehensive evalua-tion, a five-level framework for evaluation was undertaken, andthe actual calculation of the return on investment was planned.Data would be collected to obtain the reaction from employees(Level 1) and to measure the extent to which they understoodthe new system (Level 2). In addition, employees’ progress wouldbe monitored on the job to determine how the process was beingused at each plant (Level 3). Also, specific business measures(Level 4) would be monitored at each plant before and after theprogram, and compared with a group of similar plants. Thiscontrol group arrangement involved identifying twelve othercrushed stone plants to compare with the twelve destined forimplementation. This approach should ensure that the resultsachieved were directly related to the new system. The actual costof the system would be compared with the monetary value ofthe benefits to develop an actual ROI (Level 5). One-year benefitswould be obtained and compared with the fully loaded costs.Eventually, second- and third-year benefits would be obtained andanalyzed, although the new system was expected to represent apositive return in the first year.
CONTROL GROUP SELECTION
Selecting specific plants to use in a control group representeda challenging issue. Although as many as thirty variables caninfluence the performance of a crushed stone plant, only a smallgroup of variables can be used, on a practical basis, to select thetwo groups. The area operations managers of the twelve locationswhere the system was planned for implementation were asked toidentify the top four or five influences (variables) that couldimpact plant performance. These five variables were:
1. The size of the plant, in terms of annual production2. The product mix of the plant. Some products required more
time to produce and were more abrasive to the equipment.3. The market, as defined by the construction activity in the
local market area

378 THE HUMAN RESOURCES SCORECARD
4. The age of the equipment. Older equipment sometimescaused inefficiencies in production. The average equipmentage at each plant was a routinely monitored variable.
5. Previous plant productivity.
In addition, two more variables were added. The average wagerate and employee turnover rate of these additional variablesshould be similar because they were closely related to the per-ceived payoff of the program. Therefore, seven variables wereused to select twelve locations to compare with the twelve loca-tions where the plan would be implemented. Table 14-1 showsthe average wage and turnover rate for one year prior to programimplementation for both the pilot group and control group.
EVALUATION PLANNING
Planning the evaluation is a key step in measuring the effective-ness of a successful implementation. Detailed planning includesdetermining the methods for data collection, isolating the effectsof the new system, converting data to monetary values, anddeciding which costs to capture. The two planning documentsused in this analysis are presented as Figures 14-1 and 14-2.Figure 14-1 shows the data collection plan, which includes col-lecting data for Level 1 (reaction to program), Level 2 (under-standing the program), Level 3 (program use), and Level 4(business impact). The figure also shows the specific data collec-tion methods and the timing for data collection. Responsibilitiesare also defined. Figure 14-2 presents the plan for the ROI
Table 14-1Wage and Turnover Data for Both Groups—One
Year Average Before Implementation
Employee Average EmployeeLevel Wage Turnover
Plants with New System 225 $10.28 19%
Plants without New System 231 $10.90 21%

CO
MPET
EN
CY-B
ASE
D P
AY S
YST
EM
379Figure 14-1.

380T
HE H
UM
AN
RESO
UR
CES S
CO
REC
AR
D
Figure 14-2.

COMPETENCY-BASED PAY SYSTEM 381
analysis, which includes detailing how the effects of the systemwill be isolated from other influences and how the data will beconverted to monetary values. In addition, the specific costcategories of the program are detailed, along with other importantissues concerning the overall evaluation plan.
RESULTS: REACTION AND LEARNING
It was considered important for employees to understand theprocess and react favorably to it. Although a positive reactionwas assumed, employee feedback was obtained in a more formalmethod using a two-page questionnaire. This was considerednecessary because of the potential skepticism from managementand the sensitivity of making adjustments to the job classificationsystem. The questionnaire was designed to capture specific reac-tion in five areas:
1. Satisfaction with the new system and the company2. Reaction to administrative procedures3. Specific issues that needed to be addressed4. Concerns about the new system and administrative processes5. Potential payoffs for the new system for employees and the
local plant
In addition, a simple 15-item objective test, using true/false andmultiple choice responses, was administered at the end of theinitial meeting to measure understanding of different elements ofthe plan. A show of hands revealed responses to each question,which were tabulated and then discussed.
For these measures of reaction and learning, the results favorablyexceeded expectations in both categories. Employees reactedpositively, identified several issues to explore, and expressed fewconcerns. Test scores averaged 12.6 out of 15, compared withan acceptable average of 10.
APPLICATION/USE
For this process to be successfully implemented, it had to beused properly and in a timely manner. Delays in allowing employeesto learn new jobs and receive promotions could have resulted in

382 THE HUMAN RESOURCES SCORECARD
adverse reactions and been counterproductive. Four specific areaswere monitored for use:
1. The number and frequency of promotions in the year afterprogram implementation
2. The actual number of employees at each job level duringthe initial implementation. Specific targets were set for eachjob level, and actual results were compared with the targets.
3. The number and duration of on-the-job training sessions asemployees learned new jobs
4. The number of individual development plans (IDPs) thatwere prepared as employees made plans to reach certain joblevels by certain time frames
Table 14-2 presents a summary of the use of the new system.The number of promotions was tracked with a target of 8promotions per year per plant, compared with a 3.2 average oneyear prior to implementation. The actual first year was 11.2. Theaverage job level was 3.6 at the beginning of implementation, andunder the new system, a target of 4.0 was established but itactually reached 4.1. Many employees reached the fifth level ofjob classification. For on-the-job training sessions, the objectivewas to have at least 3 sessions per week, whereas 3.5 wereactually documented. These sessions were defined as a specifictime period in which an employee was being trained in a newskill by another employee or supervisor. The time allocated forOJT was anticipated to be 10 hours per week per plant. Inactuality, plant managers estimated it to be 12.6 hours per plant.The number of individual development plans was estimated tobe 5 per plant. An average of 7.3 was actually generated. Insummary, the use of the new system greatly exceeded expectations.
The implementation, however, did not go as smoothly as theprevious information suggests. The plant managers providedinformation using a follow-up questionnaire and estimated timesand activity regarding on-the-job training. Although they sawsome advantages of the process and the program, they experiencedsome frustration as employees eagerly wanted to pursue addi-tional training so they could be promoted. Employee requestsexceeded the plant managers’ ability to provide training, and themanagers had to accelerate planned training activity to keep

CO
MPET
EN
CY-B
ASE
D P
AY S
YST
EM
383
Table 14-2Utilization of Plan
1 YearPrior to
New At Beginning of Objective ActualSystem Implementation First Year First Year
Number of Promotions Per Plant 3.2 — 8.0 11.2
Average Job Level — 3.6 4.0 4.1
OJT Sessions Per Employee Per Week (estimate) — — 3 3.5
Time for OJT Per Week Per Plant (estimate) — — 10 hours 12.6 hours
Number of IDPs Per Plant — — 5 7.3

384 THE HUMAN RESOURCES SCORECARD
employees from growing restless. This accounted for the increasein on-the-job training sessions and the time devoted to theprocess. The managers felt this additional training time may havecaused some inefficiencies although those were not identified.
BUSINESS IMPACT
The most valuable data concerned the changes in businessmeasures directly related to the new system. Table 14-3 showsbusiness impact data presented in terms of employment levels.Ultimately for this process to work, overall employment levelsshould decrease in a plant where the system has been imple-mented. As Table 14-3 reveals, a significant reduction occurredin the number of employees in the plants where the system wasimplemented. Because all plants were subjected to the sameenvironmental influences—such as pricing, sales practice, produc-tion processes, and administrative procedures—this difference wasconsidered to be directly attributable to the new system.
As planned, four critical measures were monitored for the ROIcalculation: labor cost per ton, employee turnover, absenteeism,and job satisfaction. Table 14-4 shows the experience with thefirst two variables before and after the system was implemented.
A significant labor cost per ton was realized, along with asignificant difference in employee turnover. The values for laborcosts per ton and average wage rates represent the average valuefor the last two months of the year after implementation. Although
Table 14-3Employment Levels
Last TwoMonths of
Two Months EvaluationBefore Period,
Implementation Months 11(average) & 12 (average)
Plants with New System 224 203
Plants without New System 233 232

CO
MPET
EN
CY-B
ASE
D P
AY S
YST
EM
385
Table 14-4Business Impact Measures Before and After Implementation
Labor LaborCosts Per Costs Per Wage Wage
Turnover Turnover Ton 1 Ton 1 Rate 1 Rate 1 Production1 Year 1 Year Year Year Year Year 1 YearPrior After Prior After Prior After After
Plants with New System 19% 11% 76¢ 61¢ $10.28 $12.09 12.5M Tons
Plants without New System 21% 20% 82¢ 84¢ $10.70 $11.05 13.2M Tons

386 THE HUMAN RESOURCES SCORECARD
the average wage rate increased (as shown in Table 14-4), thereduction in the number of employees along with relatively stableproduction levels yielded a significantly lower labor cost per ton.The labor cost differentials per ton are multiplied by annualproduction to yield a one-year benefit for the program. Althoughthis overestimates the impact for the first year, because thedifferentials for the last two months were used, it is very con-servative overall because the benefits in years two, three, andbeyond are omitted from the analysis. Thus, by design, the ROIanalysis must stand alone with the first-year benefits. An alter-native strategy would have been to use the two-year benefits withthe actual values accumulated during the two-year time period.
The same analysis was conducted with turnover. The cost ofturnover had not been calculated internally for NCS although ithad been estimated by using a variety of studies for construction-related jobs. Several studies indicated that the turnover costwould be in the range of 75 percent to 100 percent of the annualpay, depending on the particular job level. The HR managersuggested using, and the production manager agreed to use, 50percent of base pay as a conservative and appropriate cost ofturnover. Using the average wage rate after implementation andassuming forty-eight weeks of actual work yields a value of$11,606 for the cost of a turnover statistic.
The improvement in absenteeism and job satisfaction wereincluded as intangible measures and not used in the ROI analysis.
PROGRAM COSTS
The costs for developing and implementing the new system isbased on the following:
� The total consulting costs for the project were $40,000.� The HR staff devoted 120 hours to the project @ $20
per hour.� The plant managers’ total time equated to 1,290 hours for
the project @ $22 per hour.� The total training cost for plant managers was $2,900.� Employee time for on-the-job training was estimated at
7,862 hours.� Employee time in meetings was estimated at 2,700 hours.

COMPETENCY-BASED PAY SYSTEM 387
� Materials/printing costs were $1,525.� Travel/miscellaneous expenses were $7,540.
Assume a 30 percent average employee benefits factor.
INTANGIBLE BENEFITS
Although measurable and convertible to monetary values insome cases, the intangibles were considered significant but werenot used in the ROI analysis. Several intangible benefits wereidentified, and several quality measures showed improvementalthough the values of their improvement were not included inthe ROI calculation. Other variables influenced quality, andinitially it was perceived that this system might have only a minorinfluence on the variable. Three measures were monitored, andall showed slight improvement:
1. The actual number of customer complaints regarding unac-ceptable or substandard products was reduced.
2. The actual number of loads of stone rejected by the customerwas reduced slightly.
3. The amount of downtime for the plant was reduced slightly.Although this is an efficiency measure, it has impact on thecost and quality of the product.
As anticipated, absenteeism showed slight reduction for the pilotgroup, compared with the control group. This improvementadded value, although it was not included in the ROI analysis.There was no generally accepted value for the cost of an absence.Finally, job satisfaction showed some increase based on both theinput from the plant managers and the annual attitude surveyconducted by corporate human resources. The differences inthe two groups showed improvements in attitude toward thejob, company, and career advancement, which are all con-sidered important.
Table 14-5 summarizes the first-year monetary benefits fromlabor cost savings and turnover reduction. These represent a totalvalue of $2,310,696.
Table 14-6 summarizes the total fully loaded costs—a totalvalue of $255,082.

388 THE HUMAN RESOURCES SCORECARD
Table 14-6Costs of New System
Consulting Costs for Development $40,000
HR Staff 120 @ 20 × 1.30 3,120
Plant Managers’ Total Time 1,290 @ 22 × 1.30 36,894
Employee Time Out 7,862 @ 12.09 × 1.3 123,567
Employee Time in Meetings 2,700 @ 12.09 × 1.3 42,436
Materials/Printing 1,525
Travel/Miscellaneous 7,540
$255,082
Table 14-5Calculation of Monetary Benefits
Monetary Value for Labor Cost Per Ton Savings
Group difference: 84¢ – 61¢ = 23¢
Adjustment for initial 82¢ – 76¢ = 6¢difference:
Amount attributed to 23¢ – 6¢ = 17¢new system:
Annual benefits: 17¢ × 12.5 million tons= $2,125,000
Monetary Value for Turnover Reduction
Group difference: 20% – 11% = 9%
Adjustment for initial 21% – 19% = 2%difference:
Amount attributed to 9% – 2% = 7%new system:
Cost of one turnover: $12.09 × 40 hours × 48 weeks × 50%= $11,606
Turnovers prevented: 203 × 7% = 14 turnovers prevented
Turnover benefits: 16 × $11,606 = $185,696
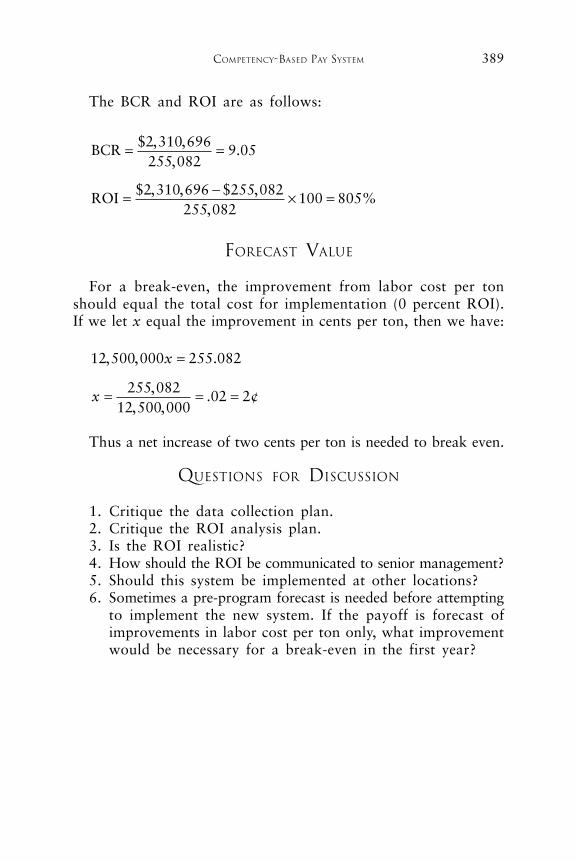
COMPETENCY-BASED PAY SYSTEM 389
The BCR and ROI are as follows:
BCR
ROI
= =
= − × =
$ , ,,
.
$ , , $ ,,
%
2 310 696255 082
9 05
2 310 696 255 082255 082
100 805
FORECAST VALUE
For a break-even, the improvement from labor cost per tonshould equal the total cost for implementation (0 percent ROI).If we let x equal the improvement in cents per ton, then we have:
12 500 000 255 082
255 08212 500 000
02 2
, , .
,, ,
. ¢
x
x
=
= = =
Thus a net increase of two cents per ton is needed to break even.
QUESTIONS FOR DISCUSSION
1. Critique the data collection plan.2. Critique the ROI analysis plan.3. Is the ROI realistic?4. How should the ROI be communicated to senior management?5. Should this system be implemented at other locations?6. Sometimes a pre-program forecast is needed before attempting
to implement the new system. If the payoff is forecast ofimprovements in labor cost per ton only, what improvementwould be necessary for a break-even in the first year?

390 THE HUMAN RESOURCES SCORECARD
390
Chapter 15
AbsenteeismReduction ProgramMetro Transit Authority
By Ron D. Stone
This case illustrates how ineffective human resource policiesand selection processes can cause major problems in businessoperations. The unavailability of bus drivers because ofunscheduled absences caused route schedule delays andbottlenecks, which resulted in dissatisfied customers, a lossof revenue, and increased operating costs. New guidelinesand disciplinary policies for unscheduled absences, as wellas a change in hiring practices, were initiated to correct thesituation. The ability to demonstrate the costs associatedwith the absenteeism problem led to the two solutions beingimplemented. The evaluation team was able to isolate theeffects of each of the two HR initiatives and to calculatethe operational savings to demonstrate an impressive returnon investment.
BACKGROUND
The Metro Transit Authority (MTA) operates a comprehensivetransportation system in a large metropolitan area. More than1,000 buses function regularly, providing essential transportation

ABSENTEEISM REDUCTION PROGRAM 391
to citizens in the metro area. Many passengers depend on the bussystem for their commutes to and from work, as well as for otheressential travel. MTA employs more than 2,900 drivers to operatethe bus system around the clock.
As with many transit systems, Metro was experiencing excessiveabsenteeism with drivers, and the problem was growing. Justthree years before, absenteeism had been 7 percent, comparedwith the most recent three-month period of 8.7 percent—tooexcessive to keep the transit system operating in a consistent manner.
To ensure that buses ran on time, a pool of substitute driverswas employed to fill in during unexpected absences. The numberof drivers in the pool was a function of the absenteeism rate. Atthe time of this study, the pool consisted of 231 substitute drivers.When the drivers in the pool were not needed as substitutes, theyperformed almost no essential work for the Transit Authorityalthough they were required to report to work. When a substitutedriver was used, this usually delayed the bus schedule, makingthe bus late for subsequent stops.
CAUSES OF PROBLEMS AND SOLUTIONS
A needs assessment and analysis was conducted using focusgroups, interviews, and an analysis of HR records. Focus groupsincluded bus drivers and their supervisors. Interviews were con-ducted with supervisors and managers. HR records were examinedfor trends and patterns in absenteeism. The conclusions from theanalysis were as follows:
1. Individuals who were frequently absent had a pattern ofabsenteeism that dated back to the beginning of theiremployment and, in most cases, was present in otheremployment situations.
2. Many of the absences could be avoided. The problem wasprimarily a motivation and discipline issue.
3. The prevailing attitude among employees was to take advan-tage of the system whenever possible, up to the thresholdof being terminated.
As a result of these findings, Metro initiated two processes:

392 THE HUMAN RESOURCES SCORECARD
1. A no-fault disciplinary system was implemented. With thispolicy, an employee who experienced more than six unex-pected (unplanned) incidences in a six-month time framewas terminated—no questions asked. A sickness that extendedmore than one day was considered one incidence. Thus, thepolicy would not unfairly penalize those who were absentfor legitimate sickness or for scheduled surgery and othermedical attention. The no-fault system was implementedafter extensive negotiations with the union. When unionofficials realized the impact of excessive absenteeism, theyagreed with the new policy.
2. The selection process for new drivers was modified. Duringthe initial screening, a list of questions was developed andused to screen out applicants who had a history of absenteeismdating back to their high-school days. The questions, withscoring and interpretation, were added to the current selectionprocess and required approximately thirty minutes of addi-tional time during the initial employment interview.
To bring appropriate attention to the absenteeism issue andto generate results as soon as possible, both initiatives wereimplemented at the same time.
OBJECTIVES OF THE INITIATIVES
The expected outcomes were established early, in the form ofimplementation and impact objectives. The objectives of the twoinitiatives were to:
1. Communicate the no-fault policy, including how the policywould be applied and the rationale for it.
2. Experience little or no adverse reaction from current employeesas the no-fault absenteeism policy was implemented.
3. Maintain employees’ present level of job satisfaction as theabsenteeism initiatives were implemented and applied.
4. Use the new screening process for each selection decisionso that a systematic and consistent selection process wouldbe in place.
5. Implement and enforce the no-fault policy consistentlythroughout all operating units.

ABSENTEEISM REDUCTION PROGRAM 393
6. Reduce driver absenteeism at least 2 percent during the firstyear of implementation of the two processes.
7. Improve customer service and satisfaction by reducingabsenteeism-related schedule delays.
Supervisors were required to conduct meetings with their employeesto explain the need for the policy and how it would be applied.Each supervisor completed a meeting report form after the meet-ing and returned it to the HR department.
The no-fault policy had the potential of influencing employ-ment termination by essentially increasing employee turnover,which could have created problems for some supervisors. Becauseof this, it was important to demonstrate to the management teamthat these programs were effective when administered properly.Also, senior executives were interested in knowing the payoff forthese types of initiatives; they needed to be convinced that thecompany was receiving an adequate return on investment.
DATA COLLECTION
Exhibit 15-1 shows the data collection plan for the absenteeismreduction initiatives at Metro Transit Authority. The objectivesare defined, and the data collection methods selected are typicalfor these types of programs. For Level 4 data, absenteeism ismonitored on a post-program basis and compared with pre-program data. Table 15-1 shows the absenteeism for the yearsprior to and after implementing both the no-fault policy and thenew selection process. A complete year of data was collected toshow the full impact of both initiatives to capture the delayedeffect in influencing the absenteeism measure. In addition,schedule delays of more than five minutes caused by unexpectedabsenteeism were monitored and are reported in Table 15-1.
Also, for Levels 3 and 4 data, a questionnaire was developedand administered to a sample of supervisors to determine theextent to which the programs were implemented and were per-ceived to be operating effectively. Input was sought regardingproblems and issues, as well as success stories and changes injob satisfaction.
For Level 2 data, learning was measured with a simple ten-item true/false test. To ensure that employees understood the

394 THE HUMAN RESOURCES SCORECARD
Exhibit 15-1
policy, the test was developed to be administered by supervisorsin their meetings with employees. The scores were attached tothe record of the meeting, which noted the time, place, andagenda for the meeting along with a list of the attendees. Asample of the test scores revealed an average value above theminimum acceptable level of 70.
For Level 1 data, reaction was measured with a simple ques-tionnaire using an objective format. The Level 1 questionnairewas distributed at the meetings to obtain reaction to the no-fault policy.

ABSENTEEISM REDUCTION PROGRAM 395
Exhibit 15-2 shows the ROI analysis plan for evaluation of theabsenteeism reduction initiatives. Major elements of the plan arediscussed below.
ISOLATING THE EFFECTS OF THE INITIATIVES
Several approaches were considered for the purpose of isolat-ing the effects of the two initiatives. At first, a control grouparrangement was considered, but it was quickly ruled out forthree important reasons:
1. To purposely withhold the policy change for a group ofemployees could create contractual and morale problems forthe individuals in the control group.
Table 15-1Absenteeism and Bus Delays Before and After Implementation
Unscheduled Absenteeism Absenteeism-RelatedPercent of Scheduled Bus Delays
Days Worked Percent of All Delays
PRE POST PRE POST
July 7.2 6.3 23.3 18.3August 7.4 5.6 24.7 18.0September 7.1 5.0 24.9 17.5October 7.8 5.9 26.1 18.2November 8.1 5.3 25.4 16.7December 8.4 5.2 26.3 15.9January 8.7 5.4 27.1 15.4February 8.5 4.8 26.9 14.9March 8.6 4.9 26.8 14.7April 8.5 4.9 27.8 14.4May 8.8 4.0 27.0 13.6June 8.8 4.9 26.4 13.7
Three-Month 8.7% 4.6% 27.1% 13.9%Average

396T
HE H
UM
AN
RESO
UR
CES S
CO
REC
AR
D
Exhibit 15-2

ABSENTEEISM REDUCTION PROGRAM 397
2. Because the new policy would be known to all employees,contamination would occur in the control group. The policywould have the effect of reducing absenteeism in those areaswhere it was not implemented.
3. Because of the operational problems and customer serviceissues associated with absenteeism, it was not desirable towithhold a needed solution just for experimental purposes.
Trendline analysis was initially feasible because only a smallamount of variance was noticeable in the pre-program trend datathat had developed. Because of the possibility of this option, inthe planning stage, trendline analysis was considered as a methodto estimate the impact of both absenteeism initiatives. However,because multiple influences on absenteeism later developed,such as a change in economic conditions, the trendline analysiswas aborted.
Finally, as a backup strategy, estimations were taken directlyfrom supervisors as they completed the follow-up questionnaire.Supervisors were asked to identify various factors that hadinfluenced the absenteeism rate and to allocate percentages toeach of the factors, including the new screening process and no-fault policy.
CONVERTING DATA TO MONETARY VALUES
Because the primary business measure was absenteeism, amonetary value had to be developed for the cost of an unexpectedabsence. The value could subsequently be used to calculate thetotal cost of the absenteeism improvement. Although there wereseveral approaches to determine the cost of absenteeism, theanalysis at Metro was based on the cost of replacementdriver staffing.
Substitute drivers, as well as the regular drivers, were expectedto work an average of 240 days per year, leaving 20 days forvacation, holidays, and sick days. The average wage for substitutedrivers was $33,500 per year, and the employee benefits factorwas 38 percent of payroll. When a regular driver was unex-pectedly absent, he or she could charge the absence either to sickleave or to vacation, thus substituting a planned paid day (vaca-tion) for the unexpected absence.

398 THE HUMAN RESOURCES SCORECARD
The number of substitute drivers was planned as a functionof expected absenteeism. Therefore, the substitute driver staffinglevel did not always meet the exact level needed for a specificday’s unscheduled absences. Because of the service problems thatcould develop as a result of understaffing, for most days, thecompany planned for an excessive number of substitute drivers.To minimize potential delays, all substitute drivers were requiredto report to work each day. Substitute drivers not used in driverseats essentially performed no productive work that could becounted as added value. During the previous year, overstaffinghad occurred about 75 percent of the time for weekdays and non-holidays. This overstaffing represented 4,230 days of wasted time.During the weekends and holidays, which represented 114 days,overstaffing had occurred almost half the time, representing atotal of 570 wasted days.
On some days, there was actually a shortage of substitutedrivers, which caused the buses to run late, and overtime had tobe used to make the adjustment. During the previous year, therehad been 65 instances in which a driver was not available, andit was estimated that in 45 of those situations, a regular driverwas paid double time to fill in the schedule.
A final, and very significant, cost of absenteeism was the costof recruiting, training, maintaining, and supervising the substitutedriver pool, beyond the actual salaries and benefits. These itemsincluded recruiting and employment, training and preparation,office space, administration and coordination, and supervision.This item was estimated at 25 percent of the actual annual pay.Here is how the total direct cost of absenteeism was developedfrom the above information.
Average daily cost of wages and benefits for a substitute driver:
$33,500 × 1.38 ÷ 240 = $192.63
Approximate cost of overstaffing, weekdays:
$192.63 × 4,230 = $814,800
Approximate cost of overstaffing, weekends and holidays:
$192.63 × 570 = $109,800

ABSENTEEISM REDUCTION PROGRAM 399
Approximate cost of understaffing, overtime (only one salaryis used for double-time pay):
$192.63 × 45 = $8,670
Approximate cost of recruiting, training, maintaining, andsupervising pool of drivers:
$33,500 × 231 × 0.25 = $1,934,600
COSTS FOR INITIATIVES
The cost for the new screening process contained four components:
1. Development2. Interviewer preparation3. Administrative time4. Materials
The total development cost, including pilot testing, was $20,000.An additional $5,000 was charged for preparing the interviewersto administer the test. The materials and time were variable costs,depending on the number of drivers employed. Approximately400 drivers were hired each year. For each new driver hired, anaverage of 3 candidates were interviewed. Thus, 1,200 interviewswere conducted each year, with an average time of 30 minuteseach. The average wage for the interviewers was $14.50 per hour.The materials cost $2 per test.
The cost for the no-fault policy included development andimplementation. The development cost was incurred internallyand was estimated to be $11,000, representing the time ofinternal specialists. The material distributed to employeesaccounted for another $3,800. The costs of meetings with allsupervisors and with employees were estimated at $16,500. Thecost for routine administration was not included because thealternative to administering the no-fault policy was to administera progressive discipline process, and the two were judged to takeapproximately the same amount of time.

400 THE HUMAN RESOURCES SCORECARD
RESULTS: REACTION, LEARNING, AND APPLICATION
Employees expressed some concern about the new policy, butthe overall reaction to the change was favorable. They perceivedthe new policy to be fair and equitable. In addition, employeesscored an average of 78 on the true/false test about the no-fault policy. A score of 70 on the end-of-meeting test was con-sidered acceptable.
A follow-up questionnaire, administered anonymously to asample of supervisors, indicated that the policy had been imple-mented in each area and had been applied consistently. Althoughsupervisors reported some initial resistance from the habitualabsenteeism violators, the majority of employees perceived thepolicy to be effective and fair. The supervisors also reported thatthe new policy took less time to administer than the previouslyused progressive discipline approach.
A review of HR records indicated that 95 percent of thesupervisors conducted the meeting with employees and completeda meeting report form. In addition, a review of a sample ofinterviews and selection records indicated that the new screeningprocess was used in every case.
BUSINESS IMPACT
Absenteeism dramatically declined after the implementation ofboth processes, yielding an average absenteeism rate of 4.6percent for the last three months of the evaluation period, com-pared with the pre-program rate of 8.7 percent for the sameperiod one year earlier. In the Metro situation, a reduction inabsenteeism generated a cost savings only if the substitute driverpool was reduced. Because the pool staffing was directly linkedto absenteeism, a significant reduction was realized. Table 15-2shows the cost savings realized, using the calculation-developmentapproach shown earlier in this case.
In addition, on the questionnaires, supervisors estimated andallocated percentages for the contribution of each factor toabsenteeism reduction. Table 15-3 presents the results.
The bus schedule delays caused by absenteeism declined froman average of 27.1 percent for the three months prior to the

ABSENTEEISM REDUCTION PROGRAM 401
initiatives to 13.9 percent for the last three months of the evalua-tion period.
In addition, several intangible measures were identified, includ-ing increased morale, improved customer service, and fewerbottlenecks in the entire system.
MONETARY BENEFITS
Because the total cost of absenteeism for drivers is known ona before-and-after basis (as shown in Table 15-2) the total savingscan be developed as follows:
Table 15-2Cost of Absenteeism Comparisons
1 Year 1 YearCost Item Prior to Initiatives After Initiatives
Cost of overstaffing, weekdays $814,000 $602,400
Cost of overstaffing, weekends $109,800 $51,500and holidays
Cost of understaffing $8,670 $4,340
Cost of recruiting, training, $1,934,600 $1,287,750and maintaining driver pool
Total cost of absenteeism $2,867,070 $1,945,990
Table 15-3Supervisor Estimates to Isolate
the Effects of the Initiatives
Contribution ConfidenceFactor Percentage Percentage
No-Fault Policy 67% 84%Screening 22% 71%Economic Conditions 11% 65%Other 1% 90%

402 THE HUMAN RESOURCES SCORECARD
Pre-program $2,867,070Post-program $1,945,990
Savings $1,921,080
The contribution of the no-fault policy:
$921,080 × 67% × 84% = $518,383 = approximately $518,000
The contribution of the new screening process:
$921,080 × 22% × 71% = $143,873 = approximately $144,000
Total First-Year Benefit = $518,000 + $144,000 = $662,000
COSTS
The total costs for both initiatives (shown in Tables 15-4 and15-5) are as follows:
Table 15-4Cost of Screening Process
Development Cost $20,000
Interviewer Preparation $ 5,000
Administrative Time (1,200 × 12
× $14.50) $ 8,700
Materials (1,200 @ $2) $ 2,400
TOTAL $36,100
Table 15-5Cost of No-Fault Policy
Development Cost $11,000
Materials $ 3,800
Meeting Time $16,500
TOTAL $31,300

ABSENTEEISM REDUCTION PROGRAM 403
Total Costs = $36,100 + $31,300 = $67,400
ROI CALCULATION
The BCR and ROI are calculated as follows:
BCR = =$ ,$ ,
.662 00067 400
9 82
ROI(%)$ , $ ,
$ ,%= − =662 000 67 400
67 400882
QUESTIONS FOR DISCUSSION
1. What are feasible ways to isolate the effects of the program?2. Can the cost of absenteeism be developed for Metro? What
additional information is needed?3. Which cost categories should be developed to determine the
overall cost of initiatives?4. Critique the actual monetary benefits of the reduction in
absenteeism.5. Critique the total cost for the first year of operation of the
two initiatives.6. Could the absenteeism cost be developed in other ways?
Explain.7. Is the ROI value realistic? Explain.8. How should the results be communicated to various groups?

404 THE HUMAN RESOURCES SCORECARD
404
Chapter 16
Stress ManagementMidwest Electric Inc.*
By Patricia Pulliam Phillips
This case study begins by describing how the needs for astress management program were determined and how anorganization development solution was evaluated throughROI. The comprehensive approach includes the use of theStressMap® to measure learning, as well as the use of controlgroups to isolate the effects of the program. A descriptionof how the ROI was measured is included. The specificforms, issues, and processes make this a practical case studyfor organizations interested in a comprehensive, balancedapproach to evaluation.
BACKGROUND
Midwest Electric Inc. (MEI) is a growing electric utility servingseveral midwestern states. Since deregulation of the industry, MEIhas been on a course of diversification and growth. Through aseries of acquisitions, MEI has moved outside its traditionaloperating areas and into several related businesses.
*Portions of this case study have been previously published. Reprinted withpermission of the publisher. From Evaluating Training Programs: The FourLevels, 2nd ed., copyright© 1998 by Donald L. Kirkpatrick, Berrett-KoehlerPublishers, Inc., San Francisco, CA. All rights reserved. 1-800-929-2929.

STRESS MANAGEMENT 405
MEI had been experiencing significant workplace changes asit transformed from a bureaucratic, sluggish organization into alean, competitive force in the marketplace. These changes placedtremendous pressure on employees to develop multiple skills andperform additional work. Employees, working in teams, had toconstantly strive to reduce costs, maintain excellent quality, boostproductivity, and generate new and efficient ways to supplycustomers and improve service.
As with many industries in a deregulated environment, MEIdetected symptoms of employee stress. The safety and healthfunction in the company suggested that employee stress loweredproductivity and reduced employee effectiveness. Stress was alsoconsidered a significant employee health risk. Research had shownthat high levels of stress were commonplace in many work groupsand that organizations were taking steps to help employees andwork groups reduce stress in a variety of ways. The vice presi-dent of human resources at MEI asked the safety and healthdepartment, with the help of the training department, to developa program for work groups to help them alleviate stressfulsituations and deal more productively and effectively with job-induced stress.
Needs Assessment
Because of its size and sophisticated human resource systems,MEI had an extensive database on employee-related measures.MEI prided itself as being one of the leaders in the industry inhuman resources issues. Needs assessments had been routinelyconducted at MEI, and the HR vice president was willing toallow sufficient time for an adequate needs assessment beforeproceeding with the stress management program.
The overall purpose of the needs assessment was to identifythe causes of a perceived problem. The needs assessment would:
� Confirm that a problem did exist and provide an assessmentof the actual impact of this problem.
� Uncover potential causes of the problem within the workunit, company, and environment.
� Provide insight into potential remedies to correct the problem.

406 THE HUMAN RESOURCES SCORECARD
The sources of data for the needs assessment included companyrecords, external research, team members, team leaders, andmanagers. The assessment began with a review of external researchthat identified the factors usually related to high stress and theconsequences of high stress in work groups. The consequencesuncovered specific measures that could be identified at MEI.
This external research led to a review of several key data itemsin company records, including attitude surveys, medical claims,employee assistance plan (EAP) use, safety and health records,and exit interviews. The attitude survey data represented theresults from the previous year and were reviewed for low scoreson the specific questions that could yield stress-related symptoms.Medical claims were analyzed by codes to identify the extent ofthose related to stress-induced illnesses. EAP data were reviewedto determine the extent to which employees were using provisionsand services of the plan perceived to be stress-related. Safetyrecords were reviewed to determine if specific accidents werestress-related or if causes of accidents could be traced to highlevels of stress. In each of the above areas, the data were com-pared with data from the previous year to determine whetherstress-related measures were changing. Also, where available, datawere compared with expected norms from the external research.Finally, exit interviews for the previous six months were analyzedto determine the extent to which the stress-related situations werefactors in an employee’s decision to voluntarily leave MEI.
During MEI’s needs assessment process, a small sample ofemployees (ten team members) was interviewed to discuss theirwork-life situations and to uncover symptoms of stress at work.Also, a small group of managers (five) was interviewed with thesame purpose. To provide more detail about this input, a 10percent sample of employees received a questionnaire to explorethe same issues. MEI had 22,550 employees with 18,220 non-supervisory team members.
Summary of Findings
The needs assessment process uncovered several signifi-cant findings:
� There was evidence of high levels of stress in work groups,caused by MEI’s deregulation, restructuring, and job changes.

STRESS MANAGEMENT 407
In essence, the change in the nature of work induced highlevels of stress in most work groups.
� Stress had led to a deterioration in several performancemeasures, including medical costs, short-term disability,withdrawals (absenteeism, turnover), and job satisfaction.
� Employees were often not fully aware of stress factors andthe effect stress had on them and their work.
� Employees had inadequate skills for coping with stress andadjusting to, managing, and eliminating highly stressfulsituations.
� Managers had more insight into the causes of stress but didnot have the skills or mechanisms to deal with most stress-ful situations.
PROGRAM PLANNING AND DESIGN
Several inherent factors about work groups and data at MEIinfluenced the program and its subsequent evaluation. MEI wasorganized around teams, and groups were not usually identical.However, many teams had similar performance measures. The HRdatabase was rich with a variety of measures and with data aboutemployees and work unit factors. Because of the team environ-ment and the important role of the team leader/manager, theprogram to reduce stress needed to involve the management groupin a proactive way. Any efforts to reduce stress needed to shiftmuch of the responsibility to participants and thus reduce theamount of time off the job. Job pressures in the deregulatedenvironment provided fewer off-the-job opportunities for meetingand development activities.
Program Design
Although several approaches could have feasibly satisfied thisneed, four issues surfaced that influenced program design:
� A skills and knowledge deficiency existed, and some typeof learning event was necessary.
� Several stress management programs were commerciallyavailable, which could prevent developing a new programfrom scratch.

408 THE HUMAN RESOURCES SCORECARD
� Managers needed to be involved in the process to thegreatest extent possible.
� Because of the concerns about time away from the job, theactual classroom/formal meeting activities needed to belimited to one or two days.
With this in mind, the program outlined in Exhibit 16-1 wasdesigned to meet this important need.
Why ROI?
HR programs usually targeted for a Level 5 ROI evaluationare those perceived to be adding significant value to the company,and closely linked to the organizational goals and strategicobjectives. The evaluation is then pursued to confirm the addedvalue. Based on the results of the analysis, these programs maybe enhanced, redesigned, or eliminated if the results are insuf-ficient. Stress management can be different. If the results areinadequate, the program may not be discontinued but may be
Exhibit 16-1Stress Management for Intact Work Teams
Departments or work groups of 10 or more people who arecommitted to improving the satisfaction and effectiveness of theirteams will benefit by this more comprehensive approach to stress.The process uses the StressMap® tool as the starting point.Managers and representative employees will participate in focusgroups to identify work satisfiers and distressors and then willcollaborate on alleviating systemic sources of stress.
What Group Members Will Learn
� How to identify sources of stress and their personal responseto them.
� That individuals have the ability to make a difference intheir lives.
� How to take the first steps to enhance personal health andoverall performance.
� How to access resources, internally and externally, to helpteach personal goals.

STRESS MANAGEMENT 409
What the Group/Manager Will Learn
� Group profile of sources of stress and response patterns.� Additional information about sources of both work distress
and work satisfaction will be obtained through focus groups.Themes will be identified when possible.
� New stress reduction skills specific to the needs of the group.� Development of recommendations for next steps to improve
work satisfaction and productivity.
Highlights
� Through completion of a comprehensive self-assessment toolcalled StressMap®, individuals will be able to immediatelyscore themselves on 21 stress scales dealing with work andhome life, as well as learn about their preferred coping stylesand the thinking and feeling patterns that impact their abilityto manage stress. Anonymous copies of each member’sStressMap® will be compiled to create a group score.
� A 3–4 hour StressMap® debriefing session designed to helpindividuals better interpret their scores will be followed bya 4-hour module suited to the needs of the group (such assituation mastery, changing habits, creating climate foragreement). Total of 1 day.
Precourse Requirements
� Management commitment to the process. Employees tocomplete the StressMap® tool and submit a confidential copy.
Length and Format
� Lead time of 3 to 4 weeks minimum for preparation andcommunication.
� Consultant on-site 1 12 days
� Initial follow-up 1 to 2 weeks later on-site or by phone tosenior management. Subsequent follow-up on impact of theinitiative to occur as negotiated. 3–4 hours of telephonefollow-up included.
Cost
� Approximately $XXXX (plus taxes) US per group of 8 to 25;$XX US per set of materials. Travel and living expenses forconsultant are additional.

410 THE HUMAN RESOURCES SCORECARD
altered for future sessions, particularly if behavior changes arenot identified in the Level 3 evaluation.
At MEI, the stress management program was chosen for anROI evaluation for two reasons. First, the HR department wasinterested in the accountability of all programs, including stressmanagement. Second, positive results would clearly show manage-ment that these types of programs, which are preventive innature, could significantly contribute to the bottom line whenimplemented and supported by management.
Because the program could have been expensive if applied tothe entire company, it was decided to try it on a limited basis todetermine its success and then to either adjust the program,discontinue the program, or expand the program to other areasin MEI. The evaluation methodology provided the best infor-mation to make that decision.
Data Collection Plan
Exhibit 16-2 shows the data collection plan for the stressmanagement program. Broad objectives were established forLevels 1, 2, 3, and 4 data collection. The data collection planwas comprehensive but necessary to meet all of requirementsat each of the four levels of data collection. The timing andresponsibilities were detailed. For measuring learning, three toolswere used. The StressMap® was one measure of learning in theawareness category. Completion of the StressMap® providedinsight into stress factors and stress signals. In addition, built intothe one-day program was an end-of-course self-assessment tomeasure learning. Finally, the facilitator had a brief checklist toindicate the extent of learning for the group.
At Level 3 data collection, the completion of the twenty-one-day plan provided some evidence that the participants had changedbehavior to reduce stress. A conference call was planned with thefacilitator, team manager, and the team twenty-one days after thecourse. This provided a review of issues and addressed anyconcerns or barriers to further implementation. A follow-upsession was planned with the team, co-facilitated by the managerand facilitator, approximately one to two weeks after the one-day program, to discuss changes in behavior and to address

ST
RESS M
AN
AG
EM
EN
T411
Exhibit 16-2

412 THE HUMAN RESOURCES SCORECARD
barriers. To determine the extent to which the participants wereusing internal or external resources to address stress-relatedproblems, records of those requests were scheduled to be reviewedfor approximately six months. Finally, a detailed follow-upquestionnaire was planned for six months after the program tocollect both Levels 3 and 4 data. This questionnaire was intendedto capture sustained behavior changes, indicate barriers to improve-ment, and identify impact measures for both groups and individuals.
Group records were expected to reveal changes in medicalcosts, absenteeism, turnover, and productivity six months afterthe program. In addition, increased job satisfaction was to bedetermined from the follow-up questionnaire, which would beadministered six months after the program (the same question-naire described earlier).
ROI Analysis Plan
Exhibit 16-3 shows the ROI analysis plan. For most dataitems, the method to isolate the effects of the program would beobtained in a control group arrangement in which the per-formance of the group involved in the program would be com-pared with a the performance of a carefully matched companioncontrol group. In addition, for most of the data items, trendlineanalysis was scheduled for use. Historical data were projected ina trend and compared with the actual data to determine theimpact of the program.
The methods of converting data involved a variety of approaches,including tabulating direct costs, using standard values, usingexternal data, and securing estimates from a variety of targetaudiences. The cost categories represented fully loaded costs forthe program. Expected intangible benefits from the program werebased on the experience of other organizations and other stressreduction programs. The communication target audience consistedof six key groups ranging from corporate and business unitmanagers to participants and their immediate supervisors.
Management Involvement
Management involvement was a key issue from the beginningand was integrated throughout the design of the program. The

ST
RESS M
AN
AG
EM
EN
T413
Exhibit 16-3

414 THE HUMAN RESOURCES SCORECARD
manager served as the team leader for the program, although afacilitator provided assistance and conducted a one-day work-shop. Exhibit 16-4 illustrates the tool used for identifying initialproblems as the work group began using the stress managementprogram. With this brief questionnaire, the manager identifiedspecific problem areas and provided appropriate comments anddetails. This exercise allowed program planning to focus on theproblems and provided guidance to the facilitator and the team.
Exhibit 16-4Manager Input: Potential Area for Improvement
Stress Reduction for Intact Work Teams
Before you begin the stress reduction program for your team, it isimportant to capture specific concerns that you have about yourwork group. Some of these concerns may be stress related andconsequently may be used to help structure specific goals andobjectives for your team. For each of the following potential areasof improvement, please check all that apply to your group. Addothers if appropriate. Next to the item, provide specific comments todetail your concerns and indicate if you think this concern may berelated to excessive stress.
� Employee Turnover. Comments:
� Employee Absenteeism. Comments:
� Employee Complaints. Comments:
� Morale/Job Satisfaction. Comments:
� Conflicts with the Team. Comments:

STRESS MANAGEMENT 415
� Productivity. Comments:
� Quality. Comments:
� Customer Satisfaction. Comments:
� Customer Service. Comments:
� Work Backlog. Comments:
� Delays. Comments:
� Other Areas. List and Provide Comments:
Exhibit 16-5 illustrates manager responsibility and involvementfor the process. This handout, provided directly to the managers,details twelve specific areas of responsibility and involvement forthe managers. Collectively, initial planning, program design, anddetailing of responsibilities pushed the manager into a higher-profile position in the program.
Control Group Arrangement
The appropriateness of control groups was reviewed in thissetting. If a stress reduction program was needed, it would beappropriate and ethical to withhold the program for certain

416 THE HUMAN RESOURCES SCORECARD
Exhibit 16-5Manager Responsibility and Involvement
Stress Management for Intact Work Teams
With the team approach, the team manager should:
1. Have a discussion with the facilitator to share reasons forinterest in stress reduction and the desired outcome of theprogram. Gain a greater understanding of the StressMap® andthe OD approach. Discuss recent changes in the work group andidentify any known stressors. This meeting could be held withthe senior manager or the senior management team.
2. Identify any additional work group members for the consultantto call to gather preliminary information.
3. Appoint a project coordinator, preferably an individual withgood organizing and influencing skills who is respected by thework group.
4. Send out a letter with personal endorsement and signature,inviting the group to participate in the program.
5. Allocate 8 hours of work time per employee for completion ofStressMap® and attendance at a StressMap® debriefing andcustomized course.
6. Schedule a focus group after discussing desired group composi-tion with the facilitator. Ideal size is 10 to 22 participants.Manager should not attend.
7. Attend the workshop and ensure that direct reports attend.8. Participate in the follow-up meeting held after the last work-
shop, either in person or by conference call. Other participantsto include are the HR representative for your area, the Safetyand Health representative for your area, and your managementteam. The facilitator will provide you feedback about the groupissues and make recommendations of actions to take to reducework stress or increase work satisfaction
9. Commit to an action plan to reduce workplace distress and/orincrease workplace satisfaction after thoughtfully considering feedback.
10. Communicate the action plan to your work group.11. Schedule and participate in a 21-day follow-up call with the
consultant and your work group.12. Work with your team (managers, HR, safety and health, facilita-
tor) to evaluate the success of the action plan and determinenext steps.

STRESS MANAGEMENT 417
groups while the experiment was being conducted. It was con-cluded that this approach was appropriate because the impact ofthe planned program was in question. Although it was clear thatstress-induced problems existed at MEI, there was no guaranteethat this program would correct them. Six control groups wereplanned. The control group arrangement was diligently pursuedbecause it represented the best approach to isolating the effectsof the program, if the groups could be matched.
Several criteria were available for group selection. Exhibit 16-6shows the data collection instrument used to identify groups fora control group arrangement. At the first cut, only those groupsthat had the same measures were considered (that is, at least 75percent of the measures were common in the group). This actionprovided an opportunity to compare performance in the sixmonths preceding the program.
Next, only groups in the same function code were used. AtMEI, all groups were assigned a code depending on the type ofwork, such as finance and accounting or engineering. Thus, eachexperimental group had to be in the same code as the matchedcontrol group. It was also required that all six groups span atleast three different codes.
Two other variables were used in the matching process: groupsize and tenure. The number of employees in the groups had tobe within a 20 percent spread, and the average tenure had to bewithin a two-year range. At MEI, as with many other utilities,there was a high average tenure rate.
Although other variables could have been used to make thematch, these five were considered the most influential in theoutcome. In summary, the following criteria were used to selectthe two sets of groups:
� Same measures of performance� Similar performance in the previous six months� Same function code� Similar size� Similar tenure
The six pairs of groups represented a total level of employmentof 138 team members for the experimental groups, and 132 teammembers and 6 managers for the control groups.

418 THE HUMAN RESOURCES SCORECARD
Exhibit 16-6Manager Input: Group Measures and Characteristics
Stress Management for Intact Work Teams
To measure the progress of your team, a brief profile of performancemeasures for employees and your work group is needed. This infor-mation will be helpful to determine the feasibility of using yourgroup in a pilot study to measure the impact of the stress manage-ment program. Changes in performance measures will be monitoredfor six months after the program.
Listed below are several categories of measures for your workgroup. Check the appropriate category and please indicate thespecific measure under the description. In addition, indicate if it isa group measure or an individual measure. If other measures areavailable in other categories, please include them under “Other.”
Key Performance Measures Dept.
Performance Description Group IndividualCategory Measure of Measure Measure Measure
Productivity 1. ❑ ❑2. ❑ ❑
Efficiency 3. ❑ ❑4. ❑ ❑
Quality 5. ❑ ❑6. ❑ ❑
Response Time 7. ❑ ❑8. ❑ ❑
Cost Control/ 9. ❑ ❑Budgets 10. ❑ ❑
Customer 11. ❑ ❑Satisfaction 12. ❑ ❑
Absenteeism 13. ❑ ❑
Turnover 14. ❑ ❑

STRESS MANAGEMENT 419
PROGRAM RESULTS
Questionnaire Response
A follow-up questionnaire, Exhibit 16-7, served as the primarydata collection instrument for participants. A similar, slightlymodified instrument was used with the managers. In all, 73 percentof the participants returned the questionnaire. This excellent responserate was caused, in part, by a variety of actions taken to ensure anappropriate response rate. Some of the most important actions were:
� The team manager distributed the questionnaire and encour-aged participants to return it to the external consulting firm.The manager also provided a follow-up reminder.
� A full explanation of how the evaluation data would beused was provided to participants.
� The questionnaire was reviewed during the follow-up session.� Two types of incentives were used.� Participants were promised a copy of the questionnaire results.
Morale/ 15. ❑ ❑Job Satisfaction 16. ❑ ❑
Other 17. ❑ ❑(Please specify) 18. ❑ ❑
19. ❑ ❑20. ❑ ❑
Group Characteristics
Average tenure for group years Group function code
Average job grade for group Average age
Number in group Average educational level
(text continued on page 430)

420T
HE H
UM
AN
RESO
UR
CES S
CO
REC
AR
D
Exhibit 16-7Stress Management for Intact Work Teams
Impact Questionnaire
Check one: � Team Member � Team Leader/Manager
1. Listed below are the objectives of the stress management program. After reflecting on this program,please indicate the degree of success in meeting the objectives.
Limited Generally CompletelyOBJECTIVES Failed Success Successful Successful
PERSONAL
� Identify sources of stress in work, personal, andfamily worlds
� Apply coping strategies to manage stressfulsituations
� Understand to what degree stress is hampering yourhealth and performance
� Take steps to enhance personal health and overallperformance
� Access internal and external resources to help reachpersonal goals

ST
RESS M
AN
AG
EM
EN
T421
GROUP
� Identify sources of stress for group
� Identify sources of distress and satisfaction
� Apply skills to manage and reduce stress in workgroup
� Develop action plan to improve work groupeffectiveness
� Improve effectiveness and efficiency measures forwork group
2. Did you develop and implement a 21-day action plan?
Yes � No �
If yes, please describe the success of the plan. If not, explain why.
3. Please rate, on a scale of 1–5, the relevance of each of the program elements to your job, with (1)indicating no relevance, and (5) indicating very relevant.
StressMap® Instrument Action Planning
Group Discussion Program Content
4. Please indicate the degree of success in applying the following skills and behaviors as a result of yourparticipation in the stress management program.

422T
HE H
UM
AN
RESO
UR
CES S
CO
REC
AR
D
Exhibit 16-7(continued)
1 2 3 4 5
NoVery Opportunity
No Little Some Significant Much to Use Skills
a) Selecting containable behavior forchange
b) Identifying measures of behavior
c) Taking full responsibility for youractions
d) Selecting a buddy to help you changebehavior
e) Identifying and removing barriers tochanging behavior
f) Identifying and using enablers to helpchange behavior
g) Staying on track with the 21-dayaction plan

ST
RESS M
AN
AG
EM
EN
T423
h) Applying coping strategies to managestressful situations
i) Using control effectively
j) Knowing when to let go
k) Responding effectively to conflict
l) Creating a positive climate
m) Acknowledging a complaint properly
n) Reframing problems
o) Using stress talk strategies
5. List (3) behaviors or skills you have used most as a result of the stress management program.
6. When did you first use one of the skills from the program?
During the program
Day(s) after the program (indicate number)
Week(s) after the program (indicate number)

424T
HE H
UM
AN
RESO
UR
CES S
CO
REC
AR
D
Exhibit 16-7(continued)
7. Indicate the types of relationships in which you have used the skills.
� Coworkers� Manager or supervisor� MEI employee in another function� Spouse� Child� Friend� Other: (list)
PERSONAL CHANGES
8. What has changed about your on-the-job behavior as a result of this program? (positive attitude, fewerconflicts, better organized, fewer outbursts of anger, etc.)
9. Recognizing the changes in your own behavior and perceptions, please identify any specific personalaccomplishments/improvements that you can link to this program. (time savings, project completion,fewer mistakes, etc.)

ST
RESS M
AN
AG
EM
EN
T425
10. What specific value in U.S. dollars can be attributed to the above accomplishments/improvements?Although this is a difficult question, try to think of specific ways in which the above improvements canbe converted to monetary units. Use one year of data. Along with the monetary value, please indicate thebasis of your calculation.
$
Basis
11. What level of confidence do you place in the above estimations? (0% = No Confidence, 100% =Certainty) %
12. Other factors often influence improvements in performance. Please indicate the percent of the aboveimprovement that is related directly to this program. %
Please explain.
GROUP CHANGES
13. What has changed about your work group as a result of your group’s participation in this program?(interactions, cooperation, commitment, problem solving, creativity, etc.)

426T
HE H
UM
AN
RESO
UR
CES S
CO
REC
AR
DExhibit 16-7(continued)
14. Please identify any specific group accomplishments/improvements that you can link to the program.(project completion, response times, innovative approaches)
15. What specific value in U.S. dollars can be attributed to the above accomplishments/improvements?Although this is a difficult question, try to think of specific ways in which the above improvements canbe converted to monetary units. Use one year of values. Along with the monetary value, please indicatethe basis of your calculation.
$
Basis
16. What level of confidence do you place in the above estimations? (0% = No Confidence, 100% =Certainty) %
17. Other factors often influence improvements in performance. Please indicate the percent of the aboveimprovement that is related directly to this program. %
Please explain.

ST
RESS M
AN
AG
EM
EN
T427
18. Do you think this program represented a good investment for MEI?
Yes � No �
Please explain.
19. What barriers, if any, have you encountered that have prevented you from using skills or knowledgegained in this program? Check all that apply. Please explain, if possible.
� Not enough time� The work environment doesn’t support it� Management doesn’t support it� The information is not useful (comments)� Other
20. Which of the following best describes the actions of your manager during the stress management program?
� Very little discussion or reference to the program� Casual mention of program with few specifics� Discussed details of program in terms of content, issues, concerns, etc.� Discussed how the program could be applied to work group� Set goals for changes/improvements� Provided ongoing feedback about the action plan� Provided encouragement and support to help change behavior� Other (comments) . . .

428T
HE H
UM
AN
RESO
UR
CES S
CO
REC
AR
D
Exhibit 16-7(continued)
21. For each of the areas below, indicate the extent to which you think this program has influenced thesemeasures in your work group.
No Some Moderate Significant Very MuchInfluence Influence Influence Influence Influence
a) Productivity
b) Efficiency
c) Quality
d) Response Time
e) Cost Control
f) Customer Service
g) Customer Satisfaction
h) Employee Turnover
i) Absenteeism
j) Employee Satisfaction
k) Healthcare Costs
l) Safety and Health Costs

ST
RESS M
AN
AG
EM
EN
T429
Please cite specific examples or provide more details.
22. What specific suggestions do you have for improving the stress management program? Please specify.
� Content
� Duration
� Presentation
� Other
23. Other comments:

430 THE HUMAN RESOURCES SCORECARD
(text continued from page 419)
Application Data
The application of the program was considered an outstandingsuccess with 92 percent of the participants completing theirtwenty-one-day action plan. A conference call at the end of thetwenty-one days showed positive feedback and much enthusiasmfor the progress made. The follow-up session also demonstratedsuccess because most of the participants had indicated changesin behavior.
The most comprehensive application data came from the six-month questionnaire administered to participants and managers.The following skills and behaviors were reported as achievingsignificant success:
� Taking full responsibility for one’s actions� Identifying or removing barriers to change behavior� Applying coping strategies to manage stressful situations� Responding effectively to conflict� Creating a positive climate� Acknowledging a complaint properly
Coworkers were the most frequently cited group in whichrelationships had improved through use of the skills, with 95percent indicating application improvement with this group.
Barriers
Information collected throughout the process, including the twofollow-up questionnaires, indicated few barriers to implementingthe process. The two most frequently listed barriers were:
� There is not enough time.� The work environment does not support the process.
Management Support
Manager support seemed quite effective. The most frequentlylisted behaviors of managers were:

STRESS MANAGEMENT 431
� Managers set goals for change and improvement.� Managers discussed how the program could apply to the
work group.
Impact Data
The program had significant impact with regard to both per-ceptions and actual values. On Exhibit 16-7, the follow-upquestionnaire, 90 percent of the participants perceived this pro-gram as a good investment for MEI. In addition, participantsperceived that this program had a significantly influenced:
� Employee satisfaction� Absenteeism� Turnover� Healthcare cost� Safety and health cost
This assessment appears to support the actual improvementdata, outlined below. For each measure below, only the team datawere collected and presented. Because managers were not thetarget of the program, manager performance data were notincluded. An average of months five and six, instead of the sixthmonth, was used consistently for the post-program data analysisto eliminate the spike effect.
Healthcare Costs. Healthcare costs for employees were categorizedby diagnostic code; thus, it was a simple process to track the costof stress-induced illnesses. Although few differences were shown inthe first three months after the program began, by months five andsix an average difference of $120 per employee per month wasidentified. This was apparently caused by the lack of stress-relatedincidents and the subsequent medical costs resulting from the stress.It was believed that this amount would be an appropriate improve-ment to use. The trendline projection of healthcare costs wasinconclusive because of the variability of the medical care costs priorto the program. A consistent trend could not be identified.
Absenteeism. There was significant difference of absenteeism inthe two groups. The average absenteeism for the control group

432 THE HUMAN RESOURCES SCORECARD
for months five and six was 4.65 percent. The absenteeism ratefor the groups involved in the program was 3.2 percent. Employeesworked an average of 220 days. The trendline analysis appearedto support the absenteeism reduction. Because no other issueswere identified that could have influenced absenteeism during thistime period, the trendline analysis provided an accurate estimateof the impact.
Turnover. Although turnover at MEI was traditionally low, in thepast two years it had increased because of significant changes inthe workplace. A turnover reduction was identified using thedifferences in the control group and experimental group. Thecontrol group had an average annual turnover rate of 19.2percent for months five and six. The experimental group had anaverage of 14.1 percent for the same two months. As withabsenteeism, the trendline analysis supported the turnover reduction.
Productivity. Control group differences showed no significantimprovement in productivity. Of all the measures collected, theproductivity measure was the most difficult to match between thetwo groups, which may account for the inconclusive results. Also,the trendline differences showed some slight improvement but notenough to develop an actual value for productivity changes.
Job Satisfaction. Because of the timing difference in collectingattitude survey data, complete job satisfaction data were notavailable. Participants did provide input about the extent towhich they felt the program actually influenced job satisfaction.The results were quite positive, with a significant influence ratingfor that variable. Because of the subjective nature of job satisfac-tion and the difficulties with measurement, a value was notassigned to job satisfaction.
Monetary Values
The determination of monetary benefits for the program wasdeveloped using the methods outlined in the ROI analysis plan.The medical costs were converted directly. A $120 per monthsavings yielded a $198,720 annual benefit. A standard value hadroutinely been used at MEI to reflect the cost of an absence. This

STRESS MANAGEMENT 433
value was 1.25 times the average daily wage rate. For the experi-mental group, the average wage rate was $123 per day. Thisyielded an annual improvement value of $67,684. For employeeturnover, several turnover cost studies were available, whichrevealed a value of 85 percent of annual base pay. As expected,senior managers felt this cost of turnover was slightly overstatedand preferred to use a value of 70 percent, yielding an annualbenefit of $157,553. No values were used for productivity or jobsatisfaction. The total annual benefit of the stress managementprogram was $423,957. Table 16-1 reflects the total economicbenefits of the program.
The medical costs were converted directly. A $120 per monthsavings yielded a $198,720 annual benefit. Other values areas follows:
Unit Value for an Absence
$123 × 1.25 = $153.75
Unit Value for Turnover
$31,980 × 70% = $22,386
Improvement for Absenteeism
138 employees × 220 workdays × 1.45% × $153.75 = $67,684
Table 16-1Annual Monetary Benefits for 138 Participants
AnnualMonthly Improvement
Difference Unit Value Value
Medical Costs $120 — $198,720Absenteeism 1.45% $153.75 $167,684Turnover 5.1% (annualized) $22,386 $157,553
TOTAL $423,957

434 THE HUMAN RESOURCES SCORECARD
Improvement for Turnover
138 employees × 5.1% × $22,386 = $157,553
No values were used for productivity or job satisfaction.
Intangible Benefits
Several intangible benefits were identified in the study andconfirmed by actual input from participants and questionnaires.The following benefits were pinpointed:
� employee satisfaction� teamwork� improved relationships with family and friends� time savings� improved image in the company� fewer conflicts
No attempt was made to place monetary values on any of theintangibles.
Program Costs
Calculating the costs of the stress management program alsofollowed the categories outlined in the evaluation plan. For needsassessment, all the costs were fully allocated to the six groups.Although the needs assessment was necessary, the total cost ofneeds assessment, $16,500, was included. All program develop-ment costs were estimated at $95 per participant, or $4,800. Theprogram could have possibly been spread through other parts ofthe organization, and then the cost would ultimately have beenprorated across all the sessions. However, the costs were lowbecause the materials were readily available for most of the effort,and the total development cost was used.
The salaries for the team members averaged $31,980, while thesix team managers had average salaries of $49,140. The benefitsfactor for MEI was 37 percent for both groups. Although theprogram took a little more than one day of staff time, one dayof program time was considered sufficient for the cost. The total

STRESS MANAGEMENT 435
salary cost was $24,108. The participants’ travel cost ($38 perparticipant) was very low because the programs were conductedin the area. The facilitator cost, program coordination cost, andtraining and development overhead costs were estimated to be$10,800. The meeting room facilities, food, and refreshmentsaveraged $22 per participant, for a total of $3,968. Evaluationcosts were $22,320. It was decided that all the evaluation costswould be allocated to these six groups. This determination wasextremely conservative because the evaluation costs could beprorated if the program was implemented over other areas.
Table 16-2 details the stress management program costs.These costs were considered fully loaded with no proration
except for needs assessment. Additional time could have beenused for participants’ off-the-job activities. However, it wasconcluded one day should be sufficient (for the one-day program.)
Table 16-2Program Costs
Cost Category Total Cost
Needs Assessment $116,500
Program Development $114,800
Program Materials (144 × $95) $113,680
Participant Salaries/BenefitsBased on 1 day138 × $123 × 1.37 and 6 × 189 × 1.37 $124,108
Travel and Lodging144 × 38 $115,472
Facilitation, Coordination, T&D Overhead $110,800
Meeting Room, Food, and Refreshments144 × 22 $113,168
Evaluation Costs $122,320
TOTAL $100,848
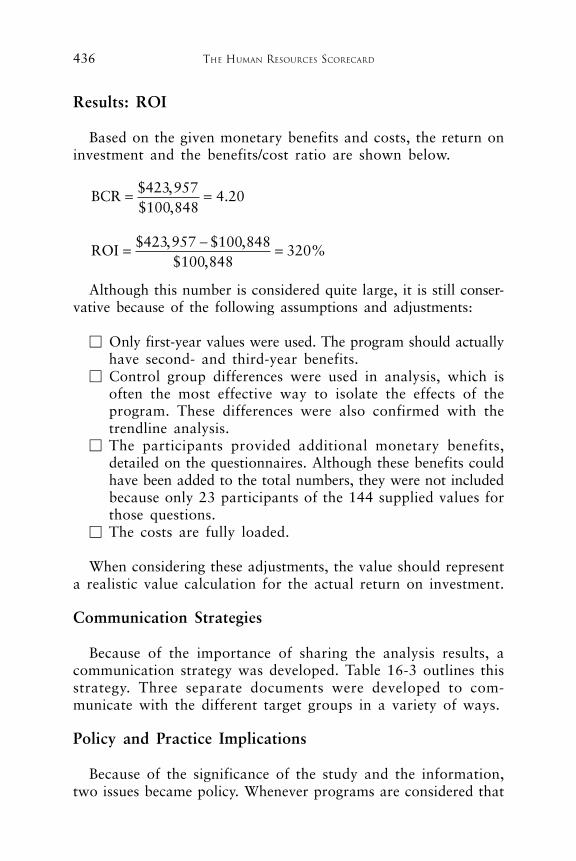
436 THE HUMAN RESOURCES SCORECARD
Results: ROI
Based on the given monetary benefits and costs, the return oninvestment and the benefits/cost ratio are shown below.
BCR = =$ ,$ ,
.423 957100 848
4 20
ROI = − =$ , $ ,$ ,
%423 957 100 848
100 848320
Although this number is considered quite large, it is still conser-vative because of the following assumptions and adjustments:
� Only first-year values were used. The program should actuallyhave second- and third-year benefits.
� Control group differences were used in analysis, which isoften the most effective way to isolate the effects of theprogram. These differences were also confirmed with thetrendline analysis.
� The participants provided additional monetary benefits,detailed on the questionnaires. Although these benefits couldhave been added to the total numbers, they were not includedbecause only 23 participants of the 144 supplied values forthose questions.
� The costs are fully loaded.
When considering these adjustments, the value should representa realistic value calculation for the actual return on investment.
Communication Strategies
Because of the importance of sharing the analysis results, acommunication strategy was developed. Table 16-3 outlines thisstrategy. Three separate documents were developed to com-municate with the different target groups in a variety of ways.
Policy and Practice Implications
Because of the significance of the study and the information,two issues became policy. Whenever programs are considered that

ST
RESS M
AN
AG
EM
EN
T437
Table 16-3Communication Strategies
Communication Document
Complete report with appendices(75 pages)
Executive summary (8 pages)
General interest overview andsummary without the actual ROIcalculation (10 pages)
Brochure highlighting program,objectives, and specific results
Communication Target
� Training and Education Staff� Safety and Health Staff� Intact Team Manager
� Senior Management in theBusiness Units
� Senior Corporate Management
� Program Participants
� Prospective Team Leaders
Distribution
Distributed and discussed in aspecial meeting
Distributed and discussed inroutine meeting
Mailed with letter
Included with other programdescriptions

438 THE HUMAN RESOURCES SCORECARD
involve large groups of employees or a significant investment offunds, a detailed needs assessment should be conducted to ensurethe proper program is developed. Also, an ROI study should beconducted for a small group of programs to measure the impactbefore complete implementation. In essence, this influenced thepolicy and practice on needs assessment, pilot program evalua-tion, and the number of impact studies developed.
QUESTIONS FOR DISCUSSION
1. What is the purpose of the needs assessment?2. What specific sources of data should be used?3. Critique the data collection plan.4. What other methods could be used to isolate the effects of
the program?5. Critique the methods to convert data to monetary values.6. Are the costs fully loaded? Explain.7. Is the ROI value realistic? Explain.8. Critique the communication strategy.

SAFETY INCENTIVE PROGRAM 439
439
Chapter 17
Safety IncentiveProgram
National Steel
By Ron D. Stone
This case addresses measuring the effectiveness of an HRincentive program designed to influence employee behaviorand to reduce accidents in a manufacturing environment.Although top executives were concerned about the safety andwell-being of employees, they also wanted to reduce the costof accidents. The cost of accidents was reaching the pointthat it was an obstacle to the company becoming a low-costprovider of products in a competitive industry. This casedemonstrates that an evaluation of an HR intervention canbe implemented with minimal resources. It also demonstratesthat although some programs may achieve a return oninvestment, it is sometimes best to communicate the ROIresults to a limited audience.
BACKGROUND
National Steel is a large manufacturing operation with divisionsin the southeastern, southwestern, and midwestern United States.Each division has multiple plants. The company also has severalforeign plants in operation and two others in the construction

440 THE HUMAN RESOURCES SCORECARD
phase. The plants produce steel products such as bar stock andplate steel. They also fabricate specialized fasteners used in thecommercial building industry. The nature of National’s manu-facturing business requires that safety always receives a toppriority with management and the work force. The concern foremployee safety is a significant issue. Additionally, domestic andforeign competition is a major factor in National’s strategy tobecome a low-cost producer.
The company had always been always concerned about thehuman element of a safe work environment, but economic issueswere now a significant concern being driven by the cost ofaccidents. The company had long had a group called the CentralSafety Committee in place to continually review safety issues,direct accident investigations, and establish policy and bestpractices. The committee was made up of a senior line officer(who served as the sponsor), one line manager, two foremen, sixmembers of the work force, the corporate manager of safety, andthe VP of HR.
A PERFORMANCE PROBLEM
The committee had recently informed the senior managementof National Steel that the midwestern division of the companywas experiencing unacceptable accident frequency rates, accidentseverity rates, and total accident costs. For a two-year period,these costs had been around the $400,000 to $500,000 rangeannually—much too high for the Central Safety Committee andmanagement to accept.
THE NEEDS ASSESSMENT
The safety manager was directed to meet with managers andemployees in the three plants of the midwestern division to seekcauses of the problem and to work with the division managerto implement the appropriate solutions. A team of HR specialistscompleted the assignment. They also analyzed the cost and typesof accidents. The team of specialists concluded:
� Employees’ safety habits were lax, and they were not focus-ing enough attention on safety.
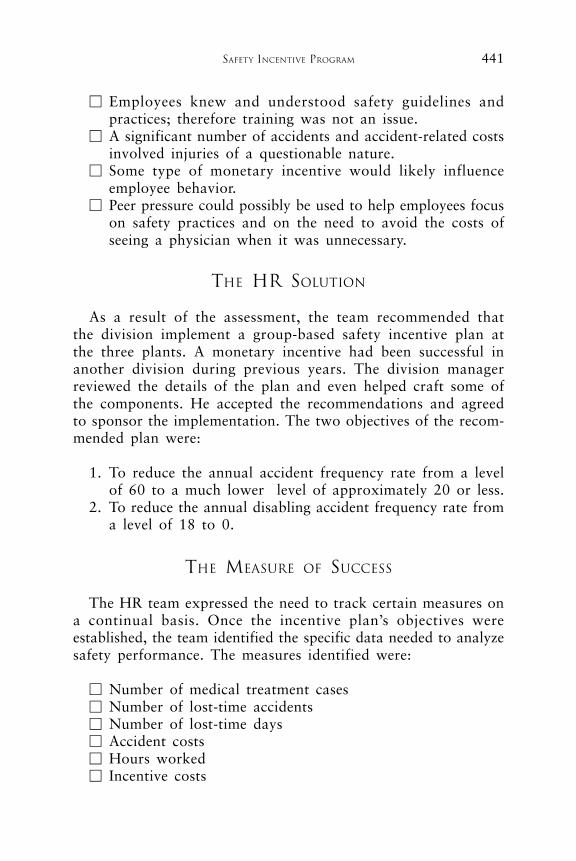
SAFETY INCENTIVE PROGRAM 441
� Employees knew and understood safety guidelines andpractices; therefore training was not an issue.
� A significant number of accidents and accident-related costsinvolved injuries of a questionable nature.
� Some type of monetary incentive would likely influenceemployee behavior.
� Peer pressure could possibly be used to help employees focuson safety practices and on the need to avoid the costs ofseeing a physician when it was unnecessary.
THE HR SOLUTION
As a result of the assessment, the team recommended thatthe division implement a group-based safety incentive plan atthe three plants. A monetary incentive had been successful inanother division during previous years. The division managerreviewed the details of the plan and even helped craft some ofthe components. He accepted the recommendations and agreedto sponsor the implementation. The two objectives of the recom-mended plan were:
1. To reduce the annual accident frequency rate from a levelof 60 to a much lower level of approximately 20 or less.
2. To reduce the annual disabling accident frequency rate froma level of 18 to 0.
THE MEASURE OF SUCCESS
The HR team expressed the need to track certain measures ona continual basis. Once the incentive plan’s objectives wereestablished, the team identified the specific data needed to analyzesafety performance. The measures identified were:
� Number of medical treatment cases� Number of lost-time accidents� Number of lost-time days� Accident costs� Hours worked� Incentive costs

442 THE HUMAN RESOURCES SCORECARD
The team decided that data should be collected monthly. Becausethe data collection system had been in place before the imple-mentation of the safety incentive plan, no additional data col-lection procedures were needed. The same system was also usedby the HR specialists when the Central Safety Committee askedthem to review the problem and make recommendations. Manage-ment was also interested in a payback for the incentive program.Although accident reduction and severity were major concerns,there was also a need to achieve low-cost provider goals. Manage-ment requested to see figures that demonstrated that the benefitsfrom the plan exceeded the costs of implementation. The teammembers concluded that they could use the same tracking systemto determine the return on investment.
THE INCENTIVE PLAN
The incentive plan consisted of a cash award of $75, aftertaxes, to each employee in the plant for every six months theplant worked without a medical treatment case. A medical treat-ment case was defined as an accident that could not be treatedby plant first-aid and, therefore, needed the attention of a physician.Each plant had a work force of about 120 employees. A teameffort at each plant was important because the actions of oneemployee could impact the safety of another. Peer pressure wasnecessary to keep employees focused and to remind them to avoidunnecessary physician costs. Therefore, the award was paid ateach of the three plants independently. An award was not paidunless the entire plant completed a six-month period without amedical treatment case. When a medical treatment case occurred,a new six-month period began.
IMPLEMENTATION OF THE INCENTIVE PLAN
The plant managers implemented the plan at the beginning ofthe new year so results could easily be monitored and comparedwith performance in previous years. Each plant manager announcedthe plan to employees and distributed the guidelines for payout.The managers communicated the details of the plan and answeredquestions during the regular monthly safety meeting at each plant.Thorough communication ensured that each employee clearly

SAFETY INCENTIVE PROGRAM 443
understood how the plan functioned and what the group had toaccomplish to receive an award.
COST MONITORING
Two groups of costs were monitored: the total accident costsand the incentive compensation costs. Total accident costs weremonitored prior to the safety incentive plan as part of collectingroutine safety performance data. The additional costs relateddirectly to incentive compensation were also tabulated. Becausethe $75 cash was provided after taxes, the cost to the divisionwas approximately $97.50 per employee for each six-monthperiod completed without a medical treatment case. Additionaladministration costs were minimal because the data used inanalysis were already collected prior to the new plan and becausethe time required to administer the plan and calculate the awardwas almost negligible. No additional staff was needed, and noovertime for existing staff could be directly attributed to the plan.However, a conservative estimate of $1,600 per year of planadministration costs was used in the tabulation of incentive costs.
DATA COLLECTION AND ANALYSIS
In addition to the two-year data history, data were collectedduring a two-year period after the plan implementation to providean adequate before-and-after comparison. Medical treatmentinjuries, lost-time injuries, accident frequency rates, and accidentcosts were all monitored to show the contribution of the safetyincentive plan. The data shown in Table 17-1 document theaccident costs for the four-year period. The data reveal significantreductions in accident costs for the two-year period after theimplementation of the plan.
When comparing the average of years 3 and 4 (after theincentive plan) with the years 1 and 2 average (before the incen-tive plan), the accident frequency was reduced by 68 percent,while the disabling accident frequency was reduced by 74 percent.The annual cost of accidents (averaging the two years before andthe two years after the incentive plan) dropped from $523,244to $18,701, producing a significant savings of $504,543.

444 THE HUMAN RESOURCES SCORECARD
The objective of the plan to reduce the annual accident fre-quency rate to less than 20 was met with a post-plan average of19. The objective of reducing the annual disabling accidentfrequency rate from 18 to 0 was not achieved. Although theaverage after two years dropped significantly from 18.15 annuallyto 4.75 annually, this was still short of the target. Both cal-culations are shown below.
BEFORE INCENTIVE PLAN AFTER INCENTIVE PLAN
Accident Frequency 61.2 + 58.8 = 120 19.6 + 18.4 = 38
Annual Average (÷ 2) = 60 ANNUALLY = 19 ANNUALLY
Annual Improvmt. 60 – 19 = 41
% Accident Improvmt. 60 → 41 = 68%
BEFORE INCENTIVE PLAN AFTER INCENTIVE PLAN
Disabling Frequency 17.4 + 18.9 = 36.3 5.7 + 3.8 = 9.5
Annual Average (÷ 2) = 18.15 ANNUALLY = 4.75 ANNUALLY
Annual Improvmt. 18.15 – 4.75 = 13.4
% Disabling Improvmt. 18.15 → 13.4 = 74%
Table 17-1Accident Costs and Frequency for All 3 Plants
Year 1 Year 2 Year 3 Year 4Before Before After AfterPlan Plan Plan Plan
Accident Frequency 61.2 58.8 19.6 18.4
Disabling Frequency 17.4 18.9 5.7 3.8
Medical Treatment Injuries 121 111 19 17
Lost-Time Injuries 23 21 6.8 5.2
Actual Cost of Accidents $468,360 $578,128 $18,058 $19,343

SAFETY INCENTIVE PROGRAM 445
These impressive results demonstrated a positive businessimpact. The incentive plan resulted in a safer work environment,fewer accidents, and fewer disabling accidents. Although theseresults improved the overall safety program considerably, the issueof cost savings remained unanswered. Did the incentive plan bringgreater monetary benefits than the cost incurred to implement andadminister it? Thus far, all costs have not been identified. Table17-2 details the additional cost issues. There was also the issueof how much the incentive plan influenced improvement in themeasures when compared with other actions that may haveinfluenced improvements.
The needs assessment cost of $2,400 consisted of capturing thetime and travel expenses for the HR team to conduct twentyinterviews with plant operations and management staff and todevelop recommendations. The cost to administer the incentiveplan was $1,600 annually. The cost of the incentive plan payoutmust be captured and included in the total cost of accident
Table 17-2The Contribution of the Safety Incentive Plan for All 3 Plants
Year 1 Year 2 Year 3 Year 4Before Before After AfterPlan Plan Plan Plan
Needs Assessment Costs — — $ 1,200 $ 1,200(spread)
Plan’s Annual — — $ 1,600 $ 1,600Administration andEvaluation Costs
Safety Incentive Plan — — $58,013 $ 80,730Payout Costs
Actual Cost of $468,360 $578,128 $18,058 $ 19,343Accidents
Total Cost of $468,360 $578,128 $78,871 $102,873Accidents andPrevention
Plan implemented beginning in year 3

446 THE HUMAN RESOURCES SCORECARD
prevention. Payout is determined by calculating the amount ofincentive awards paid to employees in years 3 and 4. Table 17-3provides a breakdown of the payout.
DATA INTERPRETATION AND CONCLUSION
The contribution of the safety incentive plan was determinedby adding the accident and administrative costs for years 3 and4 to the safety incentive plan payout costs and then comparingthis total with the accident costs of years 1 and 2. As Table 17-2 shows, the total costs were reduced significantly. Accident costsfrom years 1 and 2 (see Table 17-2) totaled $1,046,488, for anaverage of $523,244 annually. Accident and prevention costs foryears 3 and 4 totaled $181,744, for an average of $90,872annually. This was an annual improvement of $432,372.
Table 17-3The Safety Incentive Plan Payout
Plant 1 Payout, 115 employees @ $97.50 115 × 1 PAYOUT = $11,213Year 3:
Plant 2 Payout, 122 employees @ $97.50 122 × 2 PAYOUTS = $23,790Year 3:
Plant 3 Payout, 118 employees @ $97.50 118 × 2 PAYOUTS = $23,010Year 3:
Total Payout, Year 3 $58,013
Plant 1 Payout, 115 employees @ $97.50 115 × 2 PAYOUTS = $22,425Year 4:
Plant 2 Payout, 122 employees @ $97.50 122 × 2 PAYOUTS = $23,790Year 4:
Plant 3 Payout, 118 employees @ $97.50 118 × 3 PAYOUTS = $34,515Year 4:
Total Payout, Year 4 $80,730
Total Payout, Years 3 and 4 $138,743

SAFETY INCENTIVE PROGRAM 447
The Central Safety Committee discussed the issue of isolatingthe effects of the safety incentive plan. As a group, committeemembers decided the incentive plan should be credited for mostof the improvement. They felt that it was the incentive plan thatinfluenced a new safety awareness and caused peer pressure towork. After much debate, they accepted an estimate from the in-house expert, the manager of safety. The manager of safetybrought forth data from an industry trade group that presentedconvincing evidence that management’s attention to safe workhabits had been shown to reduce the cost of accidents by 20percent. Before these data were presented, the improvement wasgoing to be attributed entirely to the incentive plan because noother factors that could have influenced safety performanceduring this period had been identified. Also, the safety record atthe other two divisions showed no improvement during the sametime period.
CALCULATING THE RETURN ON INVESTMENT
To determine the return on investment, the costs and monetarybenefits of the incentive plan were needed. The annual cost ofincentive payouts (two-year average of $69,372) added to annualadministration costs ($1,200 plus $1,600) provided a total incen-tive plan cost of $72,172. The benefits were calculated startingwith the annual monetary benefits of $432,372. Because theCentral Safety Committee accepted the suggestion of the managerof safety—that management attention played a role in influencingthe improvement (20 percent)—then an adjustment had to bemade. Thus, 80 percent of $432,372 resulted in an estimatedimpact of $345,898. The ROI became:
ROI = = − = × =Net BenefitsCosts
$ , $ ,$ ,
. %345 898 72 172
72 1723 79 100 379
COMMUNICATION OF RESULTS
The results of the safety incentive plan were communicated toa variety of target audiences to show the contribution of the plan.First, the division president summarized the results in a monthly

448 THE HUMAN RESOURCES SCORECARD
report to the chief executive officer of the corporation. The focalpoint was on the reduction in accident frequency and severity,the reduction in costs, the improvement in safety awareness, andthe return on investment for the incentive plan.
The HR department presented the results in its monthly reportto all middle and upper division management with the same focusthat was presented to the CEO. Return on investment informationwas reserved for the eyes of management because it was felt thatemployees might misunderstand this as being the focus ofplant safety.
The results were presented to all plant staff members throughthe monthly Safety Newsletter. This communication focused onthe reduction in medical treatment injuries, as well as improve-ments in lost-time accidents, disabling accidents, and accidentfrequency. It also commended employees for their accomplish-ments, as did all the communication.
Finally, the results were communicated to all division employeesthrough the division newsletter. This communication focused onthe same issues presented to plant staff members. Communi-cations were positive and increased the awareness of the need forthe continuation of the incentive plan.
QUESTIONS FOR DISCUSSION
1. What questions would you have asked during the needsassessment?
2. What are your thoughts about the way the Central SafetyCommittee decided to isolate the effects of the safety incen-tive plan?
3. What other alternatives could have been explored to isolatethe effects?
4. Would you have sought approval to collect additional datafrom employees during the follow-up evaluation regardingwhat caused the improvements? Why would you wantadditional data? How would you have justified the cost ofthis additional work?
5. Were there additional costs that should have been included?Should the cost of communication be included?
6. How would you have communicated the results differently?7. How credible is this study?

EXECUTIVE LEADERSHIP DEVELOPMENT 449
449
Chapter 18
ExecutiveLeadership
DevelopmentImperial National Bank
By Patricia Pulliam Phillips
This case shows the monetary impact of a leadership develop-ment program using an action learning process. The pro-jected cost of the program was the driving force in thisevaluation and underscores the complexity of measuring theimpact of leadership development. More importantly, thiscase shows how changes in program design can significantlyincrease the actual return on investment.
BACKGROUND
As with many large global organizations in a competitiveindustry, Imperial National Bank (INB)—a large, multi-servicebank operating in fourteen states—recognized that it neededeffective leaders. As a result a comprehensive leadership develop-ment program was developed. The program followed a learning-while-earning model, whereby high-potential leaders workedtogether on selected high-priority business issues with access tojust-in-time coaching, advice from senior executives, and a faculty

450 THE HUMAN RESOURCES SCORECARD
of subject matter experts. The program structure combined classtime and project work.
A process called action reflection learning (ARL) was theprincipal vehicle used in the leadership development program toassist in learning new approaches to behavioral change andperceptions. The process helped participants associate learningwith making things happen in real time. ARL confronted par-ticipants with challenges and risks, had them search for infor-mation, and had them complete tasks that were outside theirregular scope of activities. In essence, ARL took advantage of thefact that when learning is linked to action on real issues, in whichthere are real consequences and risks, adults are more motivatedto learn.
Three critical success factors were identified that needed to befully operational and executed for the program to achieve thedesired success:
� A significant amount of time needed to be invested by themanagement committee, clients, and participants.
� Real projects that were enterprise-wide and strategic neededto be developed.
� Influential participants needed to be selected based onperformance and future potential.
These factors capture the most important issues surroundingthis program.
INITIATION OF THE LEADERSHIP
DEVELOPMENT PROGRAM
Around the globe, there is a need for more accountability andevaluation in leadership development. In accordance with thisneed, the director of INB’s training function initiated an evalua-tion of the leadership program. Performance Resources Organi-zation (PRO), a leading international consulting firm that focuseson measuring the return on investment in human resourcesprograms, was called in as an external consultant to direct theevaluation. PRO was not involved in the design, development,or delivery of this program, thus ensuring an independent evaluation.
The leadership program was deemed an ideal candidate forROI evaluation for several reasons:

EXECUTIVE LEADERSHIP DEVELOPMENT 451
The program was INB’s first attempt to integrate traditionalleadership development with on-the-job, real-life projects, designedto add significant value to the organization.
� The program targeted a critical audience at INB—futureleaders.
� The vision for the program had been developed and refinedat the highest levels of the organization.
� On a per participant basis, the program was perhaps themost expensive program undertaken at INB. It was also themost visible.
� The program was designed to focus on important projectsthat represented real-life situations and involved key opera-tional and strategic issues.
Several issues apparent at the beginning of the study, however,had the potential to influence the ability to develop a specificreturn on investment (ROI):
� Initially, the program was not designed to deliver a measur-able business impact. Consequently, key performance measureswere not linked to the program, and specific objectives werenot developed to improve measurable performance.
� Although the projects were included to add value to INB,the nature of some of the projects made this task difficult.Also, the requirements for developing the projects did notinclude a process for capturing monetary value.
� Data collection systems had not been developed and refinedto link with the leadership development program. Per-formance data were scattered throughout the company and,in some cases, not readily available.
� The intangible benefits from this program were expected tobe significant and long term, providing non-monetary valuesthat might exceed the monetary benefits.
Even with the presence of the above difficulties, there was a desireto measure ROI, using the most credible processes. Through theimplementation of a comprehensive data collection and analysisprocess spanning a time period of September to June, this evalua-tion took place, using the ROI process model described through-out this book.

452 THE HUMAN RESOURCES SCORECARD
DATA COLLECTION PLAN
An effective evaluation must be carefully planned with appro-priate timing established and responsibilities defined. Table 18-1shows the data collection plan for this evaluation. The datacollection plan was initially developed and approved by thesupport team with additional adjustments made during the pro-gram to ensure that appropriate input was obtained from allindividuals. Although the amount of data collected might beconsidered excessive and the multiple methods might provideduplication and overlap, this was considered a necessity becauseof the importance of the program, the cost of the program inboth time and money, and the target audience involved.
Timing of Data Collection
The timing of collection was very critical. End-of-programquestionnaires were collected at the end of each session and atthe end of the program. Reaction data was also collected froma variety of individuals at the program’s completion. Learningdata was collected during the session and during on-the-job observations.
The most critical timing issue to address was data collectionfor application and impact. Although a leadership developmentprogram is designed to have a long-term impact, the specificimprovements from programs are difficult to capture if assessedyears after the program is completed. Although the connectionmay exist, it is difficult for the participants and participants’managers to make the connection between a training program andspecific improvement. In addition, for longer periods of time,additional variables will influence business measures, thuscomplicating the cause and effect relationship between trainingand improvement.
The timing of data collection was complicated because seniormanagement wanted the evaluation completed before making adecision about the implementation of future programs. Ideally,the application and impact data should be captured within sixmonths to one year after a program is completed. Following thisschedule would push the data collection and completion of theevaluation beyond the requested time frame desired to makedecisions about a second program.

EXECUTIVE LEADERSHIP DEVELOPMENT 453
The spacing of the sessions further complicated the timing ofthe study. The first session was held in September and the lastin February. The time needed to apply skills learned in the firstsession would place the evaluation in the spring. For the lastsession, the follow-up would normally be in the fall. Thus, aperiod of sixty to ninety days from the last session was selectedto allow enough time for application.
End-of-Program Feedback
An essential part of any evaluation is the typical feedbackobtained at the end of a training program. A modified versionof the standard questionnaire used by the training departmentcaptured feedback at the end of each session. This feedback wastabulated and provided to the external consultants, as well as thetraining support team. Adjustments were routinely made usingthis feedback data.
Observation
An important part of evaluation was provided by the researchcomponent of the program. An expert in action reflection learningresearch provided observation throughout the program. Althoughmost of the observation occurred during sessions and capturedactual learning, some observation took place in work settings as partof an executive shadow program. The results of these observationswere provided as feedback to program faculty, the training supportteam, and program participants. Although results of this researchare included in this case as part of the total assessment and evalua-tion, it is important to note that this research was not designed toserve as program assessment and evaluation.
Questionnaire from Participants
One of the most important data collection methods was thedetailed follow-up questionnaire completed by participants in thetime frame of sixty to ninety days from the end of the lastsession. During the third session, participants were briefed aboutthe plans for the questionnaire, and the general topics werediscussed. Participants were also reminded about the questionnaire
(text continued on page 456)

454T
HE H
UM
AN
RESO
UR
CES S
CO
REC
AR
DTable 18-1
Data Collection Plan
Level
I Reaction,Satisfaction
II Learning
Broad ProgramObjective(s)
� Favorable reactionfrom participants,teams and observers
� Suggestions forimprovement
� Enhance knowledgeand skills infourteen areas
Data Collection Method
� Questionnaire fromparticipants (1)
� Follow-up questionnairefrom participants (2)
� Interviews withparticipants (5)
� Observation� Interviews with
sponsors (3)� Follow-up questionnaire
from manager (4)
� Observation� Questionnaire from
participants (1)� Values technology
instrument� Executive success
profile� Follow-up
questionnaire fromparticipants (2)
Timing of DataCollection
� End of each sessionand end of program
� 60–90 days after endof program
� 60–90 days after endof program
� Daily� 60–90 days after end
of program� 60–90 days after end
of program
� Daily� End of each session
and end of program� During program
� During program
� 60–90 days after endof program
Responsibilitiesfor Data
Collection
� PRO
� PRO
� PRO
� Manager� PRO
� PRO
� Manager� PRO
� Facilitators
� Facilitators
� PRO

EX
EC
UT
IVE L
EA
DER
SHIP D
EV
ELO
PM
EN
T455
(1) Same questionnaire, (2) Same questionnaire, (3) Same interview, (4) Same questionnaire, (5) Same interview
III Application
IV BusinessImpact
� Use of skills andknowledge
� Frequency of skilluse
� Interaction withmanagement andpolicy committee
� Benefits fromresearch, recom-mendations madeby project teams,and resultingsavings and/orearnings
� Improvement inbusiness impactmeasures as eachparticipant appliesskills in businessunit
� Enhanced quality ofexecutive talent pool
� Observation� Follow-up questionnaire
from participants (2)� Follow-up questionnaire
from manager (4)� Interviews with
participants (5)� Interviews with
sponsors
� Financial performanceindicators from projectpresentations
� Interviews withparticipants (5)
� Follow-up questionnairefrom participants (2)
� Follow-up questionnairefrom manager (4)
� HR records
� During program� 60–90 days after end
of program� 60–90 days after end
of program� 60–90 days after end
of program� 60–90 days after end
of program
� 60–90 days after endof program
� 60–90 days after endof program
� 60–90 days after endof program
� 60–90 days after endof program
� 3 years after end ofprogram
� Managers� PRO
� PRO
� PRO
� PRO
� ProgramDirector
� PRO
� PRO
� PRO
� PRO

456 THE HUMAN RESOURCES SCORECARD
at the last session, and a final reminder was sent approxi-mately one month after the last session. This reminder camedirectly from the training director, encouraging them to takeappropriate notes of details that could be reported in the ques-tionnaires. As of mid-June, the participant response rate was 73percent, representing sixteen of the twenty-two participants. Inaddition, questionnaire responses were very thorough and servedas a valuable data source. The questionnaire focused on applica-tion and impact data (Levels 3 and 4).
Interviews with Participants
To supplement input from questionnaires, interviews wereconducted with each participant. Lasting approximately 1 to 1.5hours, each interview explored individual application and impacttopics. Additional probing was used to uncover business impactapplications and to gain further insight into skill applications,barriers, concerns and important issues surrounding the successof the program. These interviews were conducted within sixty toninety days after the last session.
Questionnaires for Managers
To gain the perspective of participants’ managers, a question-naire was sent directly to them within the timeframe of sixty toninety days from the end of the program. The managers ofparticipants were involved early in the process when participantswere selected. They often had to make adjustments in the businessunits while participants attended sessions and worked on theproject. Manager input was considered important, as their sup-port was necessary for success. As of mid-June, 46 percent ofmanagers had returned the questionnaire.
Interview with Sponsors
Because senior managers’ involvement in this program wassignificant, their interest was high, and consequently, their influencewas critical to its success. Interviews with these project sponsors
(text continued from page 453)

EXECUTIVE LEADERSHIP DEVELOPMENT 457
provided a wealth of candid input about the success of theprogram as well as the concerns from the unique perspective ofthese key executives.
Questionnaire from the Support Team
To provide additional input from other members critical to thesuccess of the program, a customized questionnaire was dis-tributed to the external consultants and the training support team.Their input focused on reaction to the program, assessment ofsuccess, and suggestions for improvement.
Performance Monitoring
Capturing specific data from business impact applications andproject evaluation required collecting data from the businessrecords of the organization. This was a factor only in those areasin which impact was identified or on which the projects had adirect influence.
Project Review
To capture the potential value of the projects, the status of theprojects was explored with each project owner to determine theextent of implementation and the prospects for future imple-mentations. In some cases, the project review went a step furtherby placing an actual value on the projects.
Summary
Collectively, these data collection methods yielded a tremendousamount of data, far exceeding expectations. The different per-spectives and types of data ensured a thorough assessment of theprogram and provided a backdrop for insightful recommendationsfor making improvements.
REACTION AND LEARNING
Table 18-2 shows how the data were integrated for analysisand reporting along the four levels of evaluation as well as the

458T
HE H
UM
AN
RESO
UR
CES S
CO
REC
AR
D
Table 18-2Data Integration
Level 2 Level 3Learning: Skills, Application Level 4
Level 1 Knowledge, Implementation Impact inReaction Changes in and Use on Business
to Program Perceptions the Job Unit Costs
End of Session Feedback X X
Research X X
Interviews with Participants X X X X X
Questionnaires from Participants X X X X
Questionnaires from Managers of X X XParticipants
Interviews with Sponsors X
Questionnaires for Faculty/Support XTeam
Company Records X X
Barriers/Concerns ROI� � � �

EXECUTIVE LEADERSHIP DEVELOPMENT 459
cost of the program. Data on reaction to the program andrelevant learning that took place was obtained through end-of-session feedback, interviews with participants, and questionnairesfrom participants. Questionnaires from managers of participantsand faculty/support teams, as well as interviews with sponsors,provided additional reaction data while research provided addi-tional data on relevant learning.
Reaction
The data collected throughout the first leadership developmentprogram indicated both high and low points during the program.The participant overall mean score indicated a decline in the valueof the sessions. Also, as the participants progressed through theprogram, a number of issues arose. These issues centered on [1]progress of project team work, [2] lack of time, [3] externalpresenters/content (2 of 4), and [4] team dynamics.
The components that contributed the most to the participantlearning using a five-point scale were: [1] project work (4.6), [2]cross-functional team work (4.6), and [3] being involved instrategic issues at INB (4.5). The components that contributedthe least were external resources (2.8) and feedback instru-ments (3.4).
Therefore, the areas that were sources of frustration during theprogram were also the areas that contributed the most to thelearning—the project work and team dynamics.
Learning
Learning was examined in significant detail as part of theresearch component for the program. The major findings fromthe research program are contained in Table 18-3.
APPLICATION
Application of Skills, Knowledge, and Behavior
Although the leadership development program was not designedto develop a number of skills to produce immediate on-the-jobresults, specific areas were addressed that had immediate applica-

460 THE HUMAN RESOURCES SCORECARD
tion potential. The questionnaire response from participantsshowed significant changes in behavior in several important skillareas. Not surprisingly, “reflection and dialogue” showed themost significant change, followed closely by “thinking strategically”and “communicating effectively.” This mirrored, to a certainextent, the results obtained from participant interviews and mana-ger questionnaires. “Using market research and data analysis”showed the least change, principally because it was not developedmuch in the program, although it was part of the original plan.Surprisingly, “planning personal development” did not show theextent of the transfer to the job as anticipated.
Ironically, the manager questionnaire input provided a morepositive assessment of behavior change, particularly with “applyingpower and influence” and “managing small work groups.”
Table 18-3Major Findings from Research Project
Major Findings from Research Project Measures of Learning
Learning:
� Learning was “managed” by the participants through the use ofseveral “filters.”
� Learning was impacted by the existing culture of the organization.� Executive learning included cognitive re-framing, as well as
information transfer and skill development.
Team Skill Development:
� Development was affected by executive role and position.� Skill development was affected by cultural norms and values.� Skill development was affected by project focus.� Development was affected by interaction with learning coaches.
Projects:
� Projects were affected by team and individual sponsorship.� Projects were affected by program schedule and design.� Projects were affected by interaction among teams and by
interaction as whole group.

EXECUTIVE LEADERSHIP DEVELOPMENT 461
Action Reflection Learning Approach
The action reflection learning approach (ARL) was at the coreof the learning process in the sessions. Although the reaction formost of the elements of ARL was positive, there was concernabout the overall success of some of the initiatives. The question-naire responses from participants revealed that the most successfulelements of ARL were the abilities to “engage in cross-functionalwork teams” and “learn from your own experience.” The leastsuccessful appeared to be “associate learning with making thingshappen in real time.”
BUSINESS IMPACT
Linkage with Key Measures
To achieve results, participants needed to realize a connectionor linkage between the application of acquired knowledge andskills and changes in key business measures. According to inputfrom participants and other groups, the strongest linkage occurredwith employee satisfaction and customer satisfaction. Buildingeffective leadership skills often improves employee satisfactionwhile improving the relationship with customers. In addition, theprojects contributed significantly to this connection. The weakestlinkage with key business measures and this program appearedto be with productivity, revenue generation, profits, cost control,and customer response time. These were some of INB’s mostimportant business measures. This assessment was to be expected,unless the program had had mechanisms to provide a connectionto these key business variables.
Specific Impact from Individual Projects
Although the team projects were expected to add significantvalue to INB, it was anticipated that individual participants wouldundertake specific improvements in their work settings. Partici-pants were asked to identify these improvements, where possible.
Usually when this type of improvement data is desired from aleadership development program, individual business action plans

462 THE HUMAN RESOURCES SCORECARD
are developed to guide the application of the new skills andreport the results. This process of capturing values from indi-vidual plans is much more difficult when the action plans havenot been developed, as was the case with the leadership developmentprogram. Because the team projects were developed for theprogram, the program designers were not interested in requir-ing action plans for individual application. Consequently, therewas no formal planning for the use of individual skills and nomechanism in place for capturing specific improvements.
In the follow-up questionnaire, participants were asked toexplore business results with a series of impact questions, whichprovided an opportunity to offer details about specific impact.As anticipated, only a small number of participants were able toplace values on the questionnaire. Four participants providedvalues. Two are reported in Table 18-4, which identifies thespecific impact derived from the program.
In an effort to capture additional input about business impact,the same series of questions was asked of the participants duringthe one-on-one interviews whenever there was an opportunity toexplore business results. This questioning yielded eleven moreinstances in which value may be linked to the program. Theseprojects, without monetary values, are listed in Table 18-5.
Collectively, these values do not appear very reliable at thisstage. However, this attempt to find specific individual projectresults related to the program is essential to the evaluation. Atthe outset, it was concluded that this would be a difficult exerciseand that it would be unlikely to generate a tremendous amountof specific and reliable data. Although several individual projectswere identified, the values were not used in the ROI calculation.
Turnover Prevention/Reduction
Perhaps an unexpected benefit linked to the leadership develop-ment program was staff turnover prevention. The program causedseveral of the participants to examine their careers and gain arenewed respect for INB. Suddenly they realized that the companyvalued them as executives, was interested in their careers, andmore importantly, was interested in developing critical skills foradditional responsibilities. In essence, this program strengthenedthe bond between the employee and the company, increasing

EXECUTIVE LEADERSHIP DEVELOPMENT 463
loyalty and commitment. For example, four individuals indicatedthat this program prevented or probably prevented them fromleaving the company within the next couple of years.
Project Results
The team projects were an integral part of the program fromthe design and delivery perspective and turned out to be the mostsignificant and meaningful part of the process from the participantviewpoint. Without exception, the reaction to the projects wasextremely favorable. Participants saw them as extremely frustrat-ing and stressful but very rewarding. Eighty percent of theparticipants considered the project successful or very successful.
There was, however, some debate and concern about thepurpose of the projects. All stakeholders felt that the projectsserved as excellent learning activities and that even if the recom-mendations were never implemented, they learned much aboutthemselves, their team, the bank, and the particular topic as aresult of the project development and presentation. However,almost all participants indicated that the projects represented realissues that need to be resolved and were concerned that theybe implemented.
An important part of the leadership development programdesign was to use the processes and principles of action reflectionlearning as participants developed their projects and identifiedrecommendations. Participants gave mixed responses about usingARL as an important and successful part of project success. Somefelt ARL was not important to project success.
PROGRAM COSTS
A fully loaded cost profile was used in this study. Table 18-6shows the listing of cost elements considered in this analysis.
All costs for the program were absorbed by the training depart-ment with the exception of some project-related costs incurredby the team members. The fees charged by the consultants andhotels are actual. The rest of the costs are aggregated estimates
(text continued on page 468)

464T
HE H
UM
AN
RESO
UR
CES S
CO
REC
AR
D
Table 18-4Impact of Individual Projects from Questionnaires
Business Impact Examples from Questionnaires
Description of Project
1. This project involvesthe delivery strategy forthe customer-centricenterprise. Combiningboth business andtechnology strategies,the project involvesa combination of:
� Identification, profiling,and delivery of thecustomer to themost appropriateand cost-effectiveresource.
MonetaryImpact
$3,625,000annually
Basis/Time Frame
The utilization of call-by-callintelligent network routingwill provide load balancingand optimization across theentire organization. Theindustry estimates 10%to 15% efficiency in theareas of staffing resourcesand telecommunicationsexpenses. A conservativeestimate of 5% for INBwould provide the followingannual benefit based oncurrent assumptions:
ContributionFactor
25%
Confidenceof Values
75%
Comments
This is anextensiveproject, whichwas initiateddirectly fromthe program.However, dueto other factorsand influencesthat may havebrought thisproject forwardin the future,only 25% of theimprovement iscredited to the

EX
EC
UT
IVE L
EA
DER
SHIP D
EV
ELO
PM
EN
T465
� Enhancement of thecustomer-employeeinteraction througheffective realtime delivery ofmeaningful customerintelligence tothe specialists.
� Collection measurementand reporting on thecustomer experienceand behaviors.
� Agent efficiency based on2,000 agents @ $30Kannual salary with a 5%gain would provide abenefit of $3,000,000annually.
� Telecommunication costsbased on 100,000,000minutes annually at 7.5cents per minute with a5% gain would providea benefit of $375,000annually.
� The use of sharedequipment at thenetwork level and therepo-sitioning of equipmentto provide efficiencies isestimated at a 5% gainon a $5,000,000 annualcapital budget resultingin a benefit of $250,000annually.
program. Amore detaileddocument,including aproposal thatwas presentedto the executivegroup, isavailable.

466T
HE H
UM
AN
RESO
UR
CES S
CO
REC
AR
D
2. This project involvesdesigned strategicdevelopment andimplementation planningto turn INB into amore customer-centricorganization.
This is only oneelement of thecustomer-centricimplementationbut affects allof the bank.This is beingdriven by anindividual whoparticipated inthe program,and theestimates arebased only onone elementof the projectwithin thescope of thatindividual.
When the customer-centricorganization is successfullyimplemented, a 10%impact on customerloyalty, at a minimum,should be realized. A1-point improvement onany of the loyalty measuresis estimated to deliver30¢ per month, percustomer. This produces a$20,000,000 improvement.
The programmoved thisproject aheadby one year.Thus oneyear ofresultscan beattributed tothis program.
N/A
Table 18-4(continued)
Business Impact Examples from Questionnaires
Monetary Contribution ConfidenceDescription of Project Impact Basis/Time Frame Factor of Values Comments
$20,000,000

EXECUTIVE LEADERSHIP DEVELOPMENT 467
Table 18-5Individual Projects from Interviews
Type of Contribution Brief Description of Improvement
1. Department Initiative One participant used the communicationskills and action-reflection learning skills inan off-site meeting to plan improvementsfor the department. In this meeting, 14initiatives were generated from the groupusing skills taken directly from theleadership development program. Thisparticipant estimated that typically in thistype of meeting, only 5 initiatives wouldhave surfaced. However, using a differentapproach with new skills, 14 initiativessurfaced. Thus, 9 initiatives can be creditedwith the leadership development program.
2. New Product Two participants are teaming to develop aproject for small business. This is a web-based product and the value is generatedbecause the bank will actually provide theservice instead of another contractor.Without the leadership developmentprogram connection and collaboration, anexternal resource would have been usedinstead of the bank.
3. New Customers One participant has obtained a newcustomer in the USA as a result of thenetworking from the leadershipdevelopment program. The new customer isproviding a direct benefit to the bank.
4. Partnership One participant is building a partnershipto share resources, referrals and technologyas well as assets with another important andoften competing part of the organization.
5. Tool Application One participant has used the strategicplanning process on a particular project forwhich he/she is responsible. This improvedprocess is adding direct benefits.

468 THE HUMAN RESOURCES SCORECARD
Table 18-6Leadership Development Program Costs
Program Costs
Design/Development
External Consultants $525,330Training Department 28,785Management Committee 26,542
Delivery
Conference Facilities $142,554(Hotel)
Consultants/External $812,110Training Department Salaries & Benefits $15,283
(For Direct Work with the Program)Training Department Travel Expenses $37,500Management Committee (Time) $75,470Project Costs ($25,000 × 4) $100,000Participant Salaries & Benefits (Class Sessions) $84,564
(Average Daily Salary × Benefits Factor × Numberof Program Days)
Participant Salaries and Benefits (Project Work)Travel & Lodging for Participants $117,353Cost of Materials $100,938
(Handouts, Purchased Materials) $6,872
Research and Evaluation
Research $110,750Evaluation $125,875
Total Costs $2,309,926
(text continued from page 463)
(that is, salary and benefits were calculated by number of par-ticipants × average salary × benefit factor × number of hours).
Although there is often some debate as to whether participantsalaries and benefits should be included in the cost of theprogram, in reality the participants were not replaced while theyattended this program; therefore, the company did not experiencea replacement cost. However, employees are compensated forbeing on the job every day, and they are expected to make a

EXECUTIVE LEADERSHIP DEVELOPMENT 469
contribution roughly equal to their compensation. If they areremoved from the job for a week, or four weeks in the case ofthe leadership development program, then the company has losttheir contribution for that period of time. To be fully loaded withcosts and also be conservative, this value was estimated andincluded in the overall cost profile.
The issue of prorating costs was an important consideration.In this case, it was reasonably certain that a second session wouldbe conducted. The design and development expenses of $580,657could therefore be prorated over two sessions. Consequently, inthe actual ROI calculation, half of this number was used to arriveat the total value. This left a total program cost of $2,019,598to include in the analysis. On a participant basis, this was$91,800, or $22,950 for each week of formal sessions. Althoughthis was expensive, it was still close to a rough benchmark ofweekly costs of several senior executive leadership programs.
ROI ANALYSIS
When developing the ROI, two important issues had to beaddressed: (1) isolating the effects of the program and (2) con-verting data to monetary values. The role of the participants wasextremely critical because the participants provided data on actualimprovements, isolated the effects of the program on the improve-ments, and in some cases converted data to actual monetaryvalues. Although there are many other approaches to isolate theeffects of the program and a variety of techniques to convert datato monetary values, several issues prevented the use of a majorityof other approaches and techniques:
� The timing of the decision to measure the ROI eliminatedsome of the possibilities. The decision to measure the impactwas made after the program had begun and it was too lateto influence the design and to use more objective approachesto isolating the effects of the program.
� The nature of leadership development eliminated many othertechniques. The application and ultimate impact is an indi-vidual process and the improvements must come from theparticipants themselves—who may all influence differentperformance improvement measures. This situation makes

470 THE HUMAN RESOURCES SCORECARD
it difficult to link the program to any finite set of per-formance measures.
� The vast number of business units represented and thenature of their issues, challenges, and performance measuresmade the process difficult to link to any small number ofapplications.
Challenges in Developing ROI forthe Leadership Development Program
Several challenges were encountered as the return on invest-ment was developed for the program:
� There was a lack of data tied to specific improvements fromeach individual. Part of this was caused by lack of designinitiatives around the requirement and the focus on achiev-ing results.
� There was concern about the nature and scope of theprojects and the implementability of their recommendations.A different type of project with specific guidelines forcapturing value would have made the ROI values of projectsmuch easier to capture.
� The timing issue hampered the ROI analysis. The need tohave the evaluation study completed soon after the lastsession of the program so a decision could be made toproceed or adjust the program led to an earlier-than-desiredanalysis of the actual impact.
� The nature of this program, in terms of its soft skills andthe focus on learning without the implications of the impactof what was being learned, made the program more difficultto evaluate at this level.
Collectively, these problems represented critical challenges thathad to be overcome to a certain extent to develop values. Theresult was a less-than-optimum value.
ROI Calculations
The ROI calculations had several components, as illustrated inFigure 18-1. For the first component, project value, two approaches

EXECUTIVE LEADERSHIP DEVELOPMENT 471
were considered. The first was to develop the value of a pro-ject based on the equivalent value as if a consulting firm haddeveloped the project. This resulted in a value of $2,050,000 andwas the most credible way of placing a value on the projects atsuch an early time frame. The second approach was to place avalue on a project at the actual value of an implementation. Thisvalue is difficult to develop, but it is estimated to be in thehundreds of millions of dollars. The first approach was used tocalculate a project value.
The second component involved the value of the individualprojects undertaken by the participants, collected anonymouslyusing questionnaires and confidentially in interviews. It was tooearly to develop a precise value at the time of evaluation. Thusindividual project values, estimated to be in the millions, werenot used in the ROI analysis. Finally, the last component was theprevention of turnover. The program conclusively preventedseveral turnover statistics. Although the exact number will neverbe known, it was conservative to forecast that four could beattributed to this program, yielding a value of $1,225,566.
Figure 18-1. Business impact categories.

472 THE HUMAN RESOURCES SCORECARD
The conservative ROI calculation is as follows:
ROI =
= + −
=
Net BenefitsProgram Costs
($ , , $ , , ) $ , ,$ , ,
%
2 050 000 1 225 566 2 019 5982 019 598
62
If the value of the other blocks in Figure 18-1 had been included,the value would have been much larger.
Up-Front Emphasis: A Key to ROI Success
The application of the ROI Process model is much moreeffective when programs are designed to have a specific businessimpact on the organization. Unfortunately for INB’s leadershipdevelopment program, the decision to calculate an ROI was madeafter the program was implemented. The original objectives ofthe programs did not reflect a bottom-line contribution. Con-sequently, the process of calculating the ROI became a muchmore difficult issue.
INTANGIBLE BENEFITS
Perhaps the most important results of the leadership develop-ment program were the intangible benefits, both short and longterm. By definition, these benefits were not converted to monetaryvalue for use in the ROI calculation. They were not measuredprecisely and are subjective but still important. Most leadershipdevelopment programs have been evaluated through perceived oractual intangible benefits. The main intangible benefits reportedwere as follows:
� Without exception, each participant considered networkinga positive and important outcome. The individuals developedclose relationships and, more importantly, they came to

EXECUTIVE LEADERSHIP DEVELOPMENT 473
understand each other’s perspectives, viewpoints, issues,concerns, and problems.
� Participants now take a more enterprise view of their jobs,their decisions, and the challenges facing INB. They have amuch greater appreciation for the other functions and theirrelationship to the whole.
� Participants are reducing, and sometimes removing, silosthat have developed within INB. Participants now seeeach other as contributors who have the bank’s interest atthe forefront.
� Participants reported that their decision-making capabilitywas greatly enhanced through this program. They are usingmany of the communication techniques to build the properrapport with the staff so that they will have free-flowingideas and input into the decision-making process.
� A surprising intangible benefit was increased loyalty to INBas a result of participation in the leadership program.Participation in this program left many participants with thedesire and determination to remain with INB and continueto make a contribution.
� Through the project teams and other team-related exercises,including those involving the larger group of twenty-two,the participants gained a much greater appreciation for theadvantages of teamwork and team building. Many of themare using teams to a greater extent in their own work, andthey are encouraging teams to be used in other aspects ofthe bank.
� Some rated this program as a significant personal develop-ment experience.
� One of the important objectives of this program was thedevelopment of an executive talent pool of capable leaderswho would be available for future key positions. Someparticipants think the program did not help build the talentpool, while others feel they are more capable to take onincreased responsibility. Two things are certain: Participantsunderstand the enterprise view and are better prepared fora potential promotion, and they know the areas that needimprovement to continue to sharpen their skills and enhancetheir ability for future promotions.

474 THE HUMAN RESOURCES SCORECARD
RESULTS
The major objectives of the program were met although notcompletely successful. Participants rated the most success with theobjectives that related to participants taking an enterprise viewand acting on synergies within the INB business areas. The leastsuccess was achieved with the objective characterized as “par-ticipants are prepared to assume senior leadership roles thatbecome vacant or are created based on market needs.”
Two major goals were established for the program, and theprogram was less than successful in meeting these goals. Therewas more success with the goal to increase the capability ofleaders to be high-performing, cross-functional executives. Lesssuccess was realized with helping INB become more competitiveby tackling and resolving major organizational projects.
There was general agreement about the achievement level forthe critical success factors. Less success was attained on the firstfactor (“a significant amount of time must be invested by themanagement committee, clients, and participants”) because par-ticipants did not perceive that, on the whole, the executive andmanagement committee invested significant time in the program.The most success was realized with the second factor, “realprojects must be developed that are enterprise-wide and strategic.”The success achieved in the third factor, “influential participantsmust be selected based on performance and future potential,”however, was mixed. The selection of the participants was anissue of much concern and debate. It was generally assumed thatthe participants were high potential executives with the abilityto move into key senior management positions. In reality, mostparticipants think this did not occur. The selection criteria wasnot followed consistently across both major operational units orwithin those units.
There was general agreement about the success of major out-comes both from the organizational perspective and the individualperspective. There were mixed results in terms of the outcomesof enhancing the quality of executive talent and on the outcomeof research and recommendations for solutions to key strategicissues. There was general agreement that success was realizedwith management committee interaction with high potentialleaders. Generally, the individuals felt that the outcomes related

EXECUTIVE LEADERSHIP DEVELOPMENT 475
directly to them faired much better. There was consistent agree-ment that they were exposed to a broader range of INB busi-nesses and to establishing networks across business lines. Therewas less agreement relative to building skills in systems andstrategic thinking, communication, and building high-performanceteams. There were varied results identified for reaching acceleratedpersonal and leadership development.
Frequently, a program is only as successful as the supportprovided to ensure that it functions efficiently, effectively, andachieves its desired goals. The overall support was rated quitegood, with some specific issues raising concerns. Learning coacheswere rated effective, as was executive support. In the interviews,most indicated that executive support improved during the programand was at its peak toward the end during the presentations.There was a perception of a “wait and see” attitude. The mentorrole was misunderstood and not appreciated and most felt it wasnot very effective. The clients generally received good remarks,although the results were mixed for certain individuals. Theclients were often referred to as sponsors and met with theindividual teams to help develop the projects. The faculty receivedgood ratings; the subject-matter experts, however, did not receivefavorable ratings. Although some were outstanding, others wereconsidered extremely ineffective. The support provided by theprogram director was rated as somewhat effective.
There was expectation that the program would be one of themost significant personal development experiences encountered bythe participants. However, most participants disagreed, and only27 percent rated the experience as very effective. In the interviews,almost every participant indicated that he or she had experienceda more effective leadership and personal development program.
Overall, the success versus the plans was mixed, with severalareas requiring adjustments in the future.
QUESTIONS FOR DISCUSSION
1. Discuss why intangible benefits were perhaps the mostimportant results of the leadership program.
2. How might the background of this organization haveaffected the program?

476 THE HUMAN RESOURCES SCORECARD
3. If you had been in charge of this program, would you havedone anything differently?
4. What is the rule of the supplier in this type of evaluation?5. Critique the data collection plan.6. Critique the method to isolate the program.7. Critique the approach to costing the program.8. How many years should the benefits be monitored? Explain.9. Is the ROI realistic? Explain.
10. What rule could ROI forecasting play in this evaluation?11. Choose another case presented in this book—similar in
some way to this one—and compare and contrast it withthis case. Specifically, decide why the different situationscalled for different approaches.

TECHNOLOGY-BASED LEARNING 477
477
Chapter 19
Technology-BasedLearning
United PetroleumInternational
By Ron D. Stone and J. Patrick Whalen
This case addresses measuring the effectiveness and returnon investment of a technology-assisted learning solution inan international sales environment. This can be especiallychallenging when management wants the program to pay foritself in the first year. This case demonstrates that, with aproper needs assessment and support from the organization,a well-designed training program can influence businessmeasures significantly. The program contribution to sales andother business measures are determined by using one ormore methods to isolate the effects of the program. Isolatingthe effects of each influencing factor can provide convincingevidence of the value of a program. The $500,000 projectedprice tag of the training was a key factor in management’sdecision to support an impact study to determine the returnon investment.

478 THE HUMAN RESOURCES SCORECARD
BACKGROUND
United Petroleum International (UPI) is an international organi-zation headquartered in the southwestern United States. UPIoperates several refineries and engages in the sales and serviceof petroleum products worldwide. UPI has approximately 17,500employees. International sales of petroleum products have plum-meted during the last three quarters, and the outlook shows thistrend will continue.
Increased competition abroad and a diminishing quality of salesrelationships with customers/prospects were determined to be themajor reasons for the lack of performance. The results fromquarterly customer satisfaction surveys revealed specific areas oflow performance. The executive vice president (EVP) of interna-tional sales asked for an assessment of the performance improve-ment needs of the UPI International Sales Organization (ISO).International Sales has 117 sales engineers and 8 sales managers.They are supported by 50 administrative employees who maintainthe customer/prospect database, develop sales quotes for the salesengineers, maintain pricing and inventory lists, and provideHR services.
A senior representative from corporate HR and two of UPI’sinternal consultants teamed with an external consultant fromPerformance Resources Organization (PRO), to implementPRO’s Performance Assessment and Analysis Process™ to identifyproblems, opportunities, and solutions in ISO. The report pro-vided to the EVP identified overall findings, performance gaps,and recommended solutions. At the end of the presentation, theEVP agreed to fund an intense improvement effort, including salestraining and restructuring of the ISO incentive pay plan, whichwas no longer competitive in the changing markets. Funding wasalso made available for using PRO and its ROI Process™ todesign and implement a comprehensive evaluation system todetermine business impact and return on investment. The EVPwas particularly interested in the contribution of the training. Abusiness objective was established to improve three businessmeasures. Measures to be tracked were identified as sales, monthlyclosing ratios, and customer satisfaction. Because measurementis an inherent component of PRO’s process, the methods and

TECHNOLOGY-BASED LEARNING 479
timing were designed and put in place. Baseline data were col-lected from UPI’s performance records.
DESIGNING AND IMPLEMENTING THE SOLUTIONS
The HR department worked with the design team to designand implement a more appropriate and competitive incentiveplan. This new incentive plan was designed after a review ofseveral models and an analysis of application to UPI’s markets.The plan was approved and scheduled for implementation in June.
The second solution, addressing the skill and knowledge needswithin the sales force, was more difficult to design and imple-ment. Client workload, time constraints, and the scattered loca-tions of the sales engineers were impediments to implementingtraditional instructor-led training. Electronic learning methodswere considered a viable alternative. A plus for this deliverymethod at ISO was that all sales engineers had electronic onlineand CD capabilities at their laptop computers. Another plus wasthat the flexibility of the electronic delivery method allowed itto be available at any time of the day. This flexibility is attractiveto participants who are compensated principally through incentivepay and who desire to spend their available time making customercontacts. The decision was made that the 117 sales engineers and8 sales managers would receive an electronically delivered inter-active sales training process to improve their skills and effectivelyachieve the business objectives. During the performance analysis,it was discovered that the corporate HR group had identifiedsales competencies from a previous project and had already begundeveloping a curriculum. Much of this in-work product servedas an important input for the new initiative and greatly assistedthe on-time completion of the project.
The design called for a more focused training effort, payingspecific attention to the sales relationships engaged in by salesengineers and allowing for significant practice of the requiredskills. The training had to present numerous job scenarios andchallenges currently being encountered in the marketplace. TheEVP of International Sales assigned the training project to themanager of sales training, who subsequently established a project

480 THE HUMAN RESOURCES SCORECARD
team to provide the coordination, design, and development ofthis project.
Several modules were developed with the support of corporateprofessionals, including technical writers, learning technologyspecialists, graphic designers, information technology specialists,and consultants. The team consisted of five full-time employeesand four external training consultants. Given a very short timeframe for completion (management allowed a few months todesign and implement the program), work began immediately todevelop focused training based on the desired business impact (thebusiness objectives), job performance competencies, and field salesencounters. Several members of the design team were concernedthat traditional face-to-face learning methods could not bereplaced by an interactive electronic program. The learningtechnology specialists addressed these concerns, and field testingestablished the electronic technology design as a success inachieving learning goals. The electronic training process that wasdeveloped for the sales engineers became known affectionately asthe TLC Program, the Technology Learning Competency Program.After design completion, it was implemented in June and July,shortly after the new incentive plan was implemented.
THE TECHNOLOGY LEARNING COMPETENCY
PROGRAM (TLC)
The TLC Program was an interactive, self-paced learningprocess designed to assess current skill level and needs of the salesengineer. Each module was designed to build on a specific set ofUPI sales skills (that is, client partnerships, product pricing andcontracting, selling more profitable products, uncovering objec-tions, handling objections, defining product features as uniquebenefits for the customer, expanding existing contracts, handlingdissatisfied customers, building community awareness of UPI, andUPI product awareness/knowledge).
The TLC Program was designed to allow the participant torespond to various sales-relationship scenarios and to determinethe appropriate decision to move closer to a sale. Each decisionmade by the engineer activated another scenario, which allowedadditional choices or decisions to be made. The program con-tinued on a predetermined path initiated by the engineer until a

TECHNOLOGY-BASED LEARNING 481
string of choices confirmed the responses as appropriate or untilthe decision was redirected. Video of a subject matter expertprovided analysis of decision choices and helpful suggestions. Thistook maximum advantage of learning opportunities presentedwhen a participant worked through the program. The engineerexperienced real-world issues and situations, had the help ofan expert, and was able to learn from mistakes in a nonthreaten-ing manner.
A pre-test at the beginning of each module was used to deter-mine the skill areas that needed improvement and to load theappropriate learning modules. All the 117 sales engineers werepre-tested to establish a baseline. The program then linkedparticipants to recommended modules that addressed their skillgaps. Each engineer was allowed a two-month window to com-plete the required electronic training, either during or after hoursas his or her schedule allowed. So that they could be moreeffective coaches, the 8 managers completed all modules plus acoaching module.
The TLC Program contained a programmed mechanism thatcaptured the results from the various decision paths chosen bythe participant. After each learning module, an individual reportwas generated, which highlighted the learning achievement andthe decisions made by the engineer. This report was provided toeach participant and his or her manager for discussion in thefollow-up coaching session. This provided additional learningopportunities and a means for recognition and feedback. Salesengineers were asked to schedule the follow-up planning andcoaching meeting with their managers to occur within two weeksof their TLC Program implementation.
MEASUREMENT METHODS AND DATA ANALYSIS
Measures to evaluate the effectiveness of a program can bedesigned and tracked through five distinct levels, as shown inTable 19-1.
In addition to the five levels of data illustrated in this table,intangible benefits are reported for important outcomes thatcannot be converted to monetary values.
The executive vice president of international sales requestedthat the return on investment (Level 5) be calculated for this

482 THE HUMAN RESOURCES SCORECARD
Table 19-1Five Levels of Data
Level and Type of Measure Measurement Focus
Level 1. Reaction/Planned Action Measures participant satisfactionand captures planned actions
Level 2. Learning Measures changes in knowledge,skills, and attitudes
Level 3. Job Application Measures changes in on-the-jobbehavior
Level 4. Business Results Measures changes in businessimpact variables
Level 5. Return on Investment Compares program benefits withthe costs
program because of the high cost and potential business impactof the TLC Program. Therefore, it became necessary to gatherand analyze data at the five levels plus any intangible benefits.
ROI MODEL AND PROCESS
Executive management expressed concern that the process usedto evaluate TLC be a credible process. Figure 19-1 illustrates theprocess PRO used to address this concern. This process has beenapplied in virtually every industry and in numerous internationalsettings to evaluate training programs, HR programs, technologyinitiatives, and performance improvement programs. The processflows sequentially from step to step until the ROI is developed.The impact study captures both Level 3 (application) and Level4 (business impact) data. The ROI (Level 5) is developed fromLevel 4 data. Improvements that cannot be converted to monetaryvalues are reported as intangible benefits. A conservative approachis used by PRO to ensure that only benefits that can be legitimatelyattributed to the program are captured.

TECHNOLOGY-BASED LEARNING 483
THE DATA COLLECTION PLAN
AND ROI ANALYSIS PLAN
After the business measures were determined and the frameworkfor the TLC Training Program was known, the data collectionplan focusing on Level 3 (job application) and Level 4 (businessresults) measures was developed. The Level 3 measures werebehavior changes and frequency of application linked to the TLCProgram objectives. After exploring performance data availabilityin the ISO unit, the quality of the specific data, and the perceivedlinkage to the TLC Program, the Level 4 measures were targetedand included in the data collection plan: The data collection planis presented in Exhibit 19-1.
The Level 4 data items were then transferred to the ROIanalysis plan so that the planning process could be completed.The methods for isolation, data conversion, cost categories, andother items were determined and documented on the ROI analysisplan. The ROI analysis plan is presented in Exhibit 19-2.
Figure 19-1. ROI model.
(text continued on page 486)

484T
HE H
UM
AN
RESO
UR
CES S
CO
REC
AR
D
Exhibit 19-1

TEC
HN
OLO
GY-B
ASE
D L
EA
RN
ING
485
Exhibit 19-2

486 THE HUMAN RESOURCES SCORECARD
LEVELS 1 AND 2 DATA
Level 1 data were captured through an online feedback question-naire that assessed course content, usefulness of the TLC Program,and job applicability. Participants rated questions on a Likert-typescale from 1 to 7. Participant average for the overall coursecontent was 6.6, and overall usefulness of the system was 6.5.Applicability of the course to the job was rated 6.8. Level 1 dataare consolidated in the first three columns of Table 19-2.
Level 2 data were assessed using pre- and post-testing. The pre-and post-testing for TLC was designed based on job performanceexpectations. Subject matter experts (SMEs) determined thetesting components, which were then validated by sales managers.The SMEs, working with the program designers, validated pro-gram content based on competency requirements and skill gapsof the sales organization. They also provided input to design pre-and post-tests. Pre-tests were administered electronically onlineat the beginning of each learning module to determine individualknowledge and skill gaps. The results showed that participantsaveraged a 50 percent knowledge level on the pre-test and averageda 91 percent knowledge level on the post-test. These Level 2 dataare consolidated in the last two columns of Table 19-2.
LEVELS 3 AND 4 DATA
Level 3 (application of skills) included three components toevaluate results (1) follow-up planning and coaching sessionsbetween sales engineers and sales managers, (2) self-assessmentof skill application using a follow-up questionnaire, and (3)managers’ assessment of skill application using a follow-up questionnaire.
Engineers completed follow-up planning and discussion meetingswith their respective managers within two weeks of completingthe TLC Program. A plan including goals and expectations wascreated as a result of each discussion. To allow appropriate timefor evaluation and application of skills, it was imperative formanagers to have these planning and coaching sessions as closeto the end of the training as possible. The sessions occurred
(text continued from page 483)

TECHNOLOGY-BASED LEARNING 487
during July and August and averaged two hours in length. Becauseof the dispersed locations of the engineers and managers, someof these meetings were conducted face-to-face and some bytelephone or video conferencing.
The follow-up questionnaire was developed during the programdesign phase and field-tested with a random sample of salesengineers and sales managers. By advice of the sales managers,the questionnaire was administered four months after the comple-tion of the TLC Program. Four months was deemed an appro-priate time frame to determine the successful application of skills.A series of questions on the follow-up questionnaire also focusedon engineers’ progress with the improvement goals established inthe follow-up discussions between managers and sales engineers.In addition, sales managers each received a follow-up question-naire focusing on the performance of sales engineers and isolatingthe effects of the TLC Program. These performance data wereconsolidated and documented in the final evaluation report.Figure 19-2 presents a summary of the follow-up questions fromthe sales engineers’ questionnaire.
Business impact data (Level 4) were monitored by reviewingthe quarterly customer satisfaction index scores, the monthly salesclosing averages, and the profit margin of monthly sales revenue.These data were readily available within the organization, andall but customer satisfaction were used in the determination ofbusiness impact and return on investment of the TLC Program.Customer satisfaction data were reviewed for progress, but astandard monetary value did not exist for improvements; thusthere was no conversion to a monetary value.
Table 19-2Reaction and Learning Results—1 to 7 Scale
Reaction:Reaction: Overall Reaction: Learning: Learning:Overall Usefulness Job Pre-test Post-testCourse of TLC Applicability Overall Score Overall Score
6.6 6.5 6.8 50% 91%

488 THE HUMAN RESOURCES SCORECARD
1. Did you have a follow-up coaching session with your salesmanager?
2. Did you complete a follow-up plan and set related goals?3. How do you rate the quality of the planning and discussion
session with your manager?4. Based on the discussion and planning session you had with your
manager, what specific improvement goals have you completed?What improvement goals still need to be completed?
5. How have you and your job changed as a result of participatingin TLC?
6. How are you specifically applying what you learned as a resultof participating in TLC?
7. What is the impact of these changes for the customer and theISO organization?
8. Rank (estimate the percentage) the effect each of the followinghad on any improvement in your sales performance. Allocatefrom 0 to 100% to the appropriate factors (the total percentageof all items selected must equal 100%):
TLC Training Program % Executive Management %Influence
Market Influences % New Monetary Sessions %
Manager Coaching % Other %Incentives (specify)
9. What barriers (if any) were a deterrent as you applied what youlearned?
10. List any skills you did not have an opportunity to apply duringthe evaluation time frame?
11. Estimate the total hours you were involved in accessing/completingTLC training during regular company work hours: hours
Figure 19-2. Summary of follow-up questions.
ISOLATING THE EFFECTS
To assess the Levels 4 and 5 data accurately, it was imperativethat the various influences on any improvement in sales per-formance be isolated. To isolate the effects of how each factorinfluenced sales (that is, TLC training, the new incentive plan,

TECHNOLOGY-BASED LEARNING 489
market changes, management influence, etc.), each had to beassessed by a credible source. The influence of each factor wasdetermined by using participant and manager estimates regardingeach factor. The data were gathered from the participants in theLevels 3/4 follow-up questionnaire and from the managers in aseparate follow-up questionnaire. Table 19-3 reports the con-solidated data.
DESIGN AND IMPLEMENTATION COSTS
The development costs of $354,500 for this project includedthe salaries for development time of one project manager, fivefull-time employees, and four contract consultants. The costsassociated with time spent in meetings and interviews withexecutive management, senior sales staff, and subject matterexperts were also included. This included the time of the inter-viewer as well as the people being interviewed. The cost of travel,meals, and lodging during development was also included.
Table 19-3Consolidated Estimates—Isolating the Effects
Sales Engineers Sales ManagersInfluencing Average from 104 Average from 8 CombinedFactor Respondents Respondents Average
New Incentive Plan 35% 37% 36%
TLC Training 38% 36% 37%Program
Executive Manage- 8% 6% 7%ment Influence
Coaching by Sales 16% 18% 17%Manager
Other (market 3% 3% 3%changes, newproducts, pro-duct improve-ments, etc.)

490 THE HUMAN RESOURCES SCORECARD
The material costs of $68,500 included a comprehensive work-book for participants, distribution of tutorial CDs, and someadditional dial-up networking software.
The equipment cost of $91,000 included upgrades (systems,processors, and video/graphics capability) to the specified hardwaresetup. This cost category also included the purchase of severalnew laptops for the sales engineers, digital editing equipment forediting the video and graphics in each module, and two platformservers capable of handling the multioperational usage.
Eight subject matter experts were assigned to the project. Theseeight lead sales engineers were paid their sales average ($150 perday) for the eighteen days each spent on the module designs,video shoots, and other project duties.
The analysis and evaluation costs of $71,000 included all costsassociated with the initial performance analysis and evaluationprocess (for example, employee time during interviews and question-naires). This cost category also included the use of an outsideconsulting firm (Performance Resources Organization) to plan andimplement the performance analysis and evaluation methodologyfor this project.
All the 117 sales engineers reported completing all modulesduring their personal time. Because they were compensated mostlyby commissions, they usually spent their work hours conductingsales planning and call activities. Table 19-4 summarizes the fullyloaded costs for the TLC Program.
Table 19-4Fully Loaded Costs
Development Costs $354,500
Materials/Software $68,500
Equipment $91,000
SME Time (commission paid to expert sales $21,600engineers for lost opportunity) 8 people@ $150/day × 18 days
Analysis and Evaluation Costs $71,000
TOTAL $606,600

TECHNOLOGY-BASED LEARNING 491
Because no sales were occurring for SMEs during the eighteenproject days, the commission payments may represent a cost tothe sales bottom line. The management team felt the lead salesengineers would be able to maintain their average sales through-out the year even with their involvement in this project. There-fore, they did not feel that lost sales should be included as anopportunity cost. Salaries and benefits and opportunity costs forthe “actual training time” are not included in the calculationsbecause none of the 104 sales engineers reported implementingthe TLC training during normal company work hours.
LEVELS 3 AND 4 RESULTS
The results of the initiative were encouraging. Prior year salesrecords revealed that sales engineers’ overall performance showedan average of 14 closes per month at $980 profit margin perclose. Six months after the implementation of TLC, the engineersaveraged 16.65 closes per month at $1,350 profit margin perclose. From the previous year, this was an average increase of2.65 closes per month and an additional $370 profit marginon revenue.
The design team decided to use PRO’s conservative processwhen calculating the ROI based on revenue generated from newor increased closes. This decision helped to enhance the credibilityof the data because participant and manager estimates werethe only methods used to isolate the impact of training. Only theprofit margin portion of the revenue increase attributable to thetraining (TLC) was used as a basis for the ROI calculation.
The Level 5 data were calculated by comparing the cost withthe net benefits attributable to the TLC implementation. Thebenefit attributed to the use of TLC for improvement was con-sidered to be 37 percent based on the combined participant andmanager estimates from Table 19-3.
The benefits, except for improved customer satisfaction, werethen converted to a monetary value, and a return on investmentwas calculated. Customer satisfaction improvements and otherdata that could not be converted to monetary values were cap-tured as intangible benefits. Level 3 and Level 4 performance dataand intangible benefits were documented in the final evaluationreport. The ROI was calculated as follows:

492 THE HUMAN RESOURCES SCORECARD
ROI(%) _____%= × =Benefits – CostsCosts
100
ROI RESULTS
Monitoring the performance records revealed the total increasein sales attributable to all influencing factors was $5,022,810.There was an average of 2.65 additional closes per month (16.65– 14.0). However, based on the participant and manager esti-mates, only 37 percent of this increase in sales was influencedby the TLC Program.
The conservative adjustment of benefits resulting from theTLC training was a factor of 0.98 additional closes per month(2.65 × 0.37). This resulted in an average of $1,323 profit marginper close ($1,350 × 0.98). Multiplied by 12 months and 117engineers to annualize, this produced $1,857,492 in monetarybenefits attributable to TLC.
� 2.65 closes × 0.37 = 0.98 factor for additional closes attri-butable to TLC Program
� 0.98 × $1,350 per close = $1,323� $1,323 × 12 months = $15,876 × 117 sales engineers =
$1,857,492
The total cost of the TLC Training Program was $606,600.After rounding the benefits from the program, the ROI for theTLC Program was calculated as follows:
ROI(%)$ , , $ ,
$ ,%= − × =1 867 000 606 000
606 600100 206
In addition to the impact of the TLC training, participants andmanagers reported the new incentive plan implemented in Junehad influenced an increase in sales by 36 percent, or $1,808,000.
INTANGIBLE BENEFITS
The results from quarterly customer satisfaction surveys wereused to compare the previous year with the current year. Positive

TECHNOLOGY-BASED LEARNING 493
improvements and trends were identified. These data were notconverted to a monetary value because management had nostandard monetary value for an increase in customer satisfaction.It was also difficult to determine how much the skills/behaviorfrom the training actually influenced the improvement in customersatisfaction. Data to isolate and substantiate this would need tocome directly from customers because many factors could influencetheir satisfaction level. When using estimates, only customers arelikely to know the extent of such influences. However, executivemanagement felt the customer satisfaction scores were a goodindicator of how the organization was responding to the market.
The customer satisfaction scores showed an average improve-ment of 23 percent since the previous year. Sales engineers andsales managers reported additional intangible benefits, such asincreased job satisfaction, better understanding of expectations,reduced turnover, and increased recruiting effectiveness of futuresales engineers.
LEARNING ISSUES FROM THE STUDY
This program demonstrated very favorable results. The resultscan be attributed to several things: a comprehensive front-endanalysis process that accurately identified the appropriate gapsand solutions, the support of corporate HR, the support ofexecutive management, and the sales organization providing theresources and clarification of expected outcomes prior to design-ing this initiative.
A major learning issue involved meeting management’s require-ment for a short lead time to design and implement the program.Executive management expected the program to be implementedwithin a few months because the competitive environment andneed for improved skills were having a negative impact on sales.This created little time to conduct a pilot program. Also, therewas not enough time to create all the modules needed for thefull range of competency and skill needs of the sales organization.The most salient competencies were targeted and given develop-ment priority.
The need to more accurately isolate the effects of this initiativewas another learning issue. Several factors influenced the results.Although participant estimates can be effective (participants know

494 THE HUMAN RESOURCES SCORECARD
what influences their performance), additional methods, like acontrol group arrangement or trendline analysis, can often isolatethe impact more convincingly.
REPORTING TO STAKEHOLDER GROUPS
The target population for this initiative included four groups:the sales engineers, the leaders of the sales organization, thesubject matter experts, and the executive management team ofUPI. All played a critical role in the success of the TLC Program.All were provided a final report showing the results from theimpact study.
The primary group was the 117 sales engineers who actuallyparticipated in the TLC Program. They were the most instru-mental of the groups in creating the success enjoyed by TLC.They dedicated the time to the system and took full advantageof the opportunity to improve performance based on what theylearned from the technology-supported training. They also pro-vided tremendous constructive feedback to enhance the system forfuture engineers.
The second group consisted of the leaders of the sales organiza-tion, who were responsible and accountable for the success ofsales at UPI. Ten people—including one executive vice president,one director, and eight sales managers—were key factors in thesuccess. They supported the up-front analysis and the validationof the job skills and gaps that were to be measured. By conduct-ing planning and coaching sessions with sales engineers and bydiscussing expectations, the leaders of the sales organization wereessential factors in the transfer and application of skills on the job.
The third group was the SMEs, who provided timely andaccurate feedback about each module being developed, and thecorporate professionals and consultants, who demonstrated diligenceand expertise. On frequent occasions, they worked beyond normalwork hours to keep the project on track.
The fourth group was the members of the executive manage-ment team of UPI, who funded the project and showed interestin the entire training process. The executive management teamsupported the project by allocating the necessary resources andsetting the expectations for outcomes.

TECHNOLOGY-BASED LEARNING 495
QUESTIONS FOR DISCUSSION
1. Identify the influencing factors that contributed to thesuccess of the TLC Program.
2. How would you convince management that a control grouparrangement would be beneficial to the study?
3. What recommendations would you make to management toconvert customer satisfaction improvements to a monetaryvalue?
4. How credible are the estimates in this evaluation?5. How credible is this study?

496 THE HUMAN RESOURCES SCORECARD
496
Appendix
Self-Test: HowResults-Oriented
Are YourHuman Resources
Programs?
Select the response that best describes the situation in yourorganization and circle the letter preceding the response.
1. Performance measurements have been developed and areused to determine the effectiveness of:A. All human resources (HR) functionsB. Approximately half of the HR functionsC. At least one HR function
2. Major organizational decisions:A. Are usually made with input from the HR functionB. Are usually made without input from the HR functionC. Are always made with input from the HR function
3. The return on investment in HR is measured primarily by:A. Intuition and perception by senior executivesB. Observations by management and reactions from par-
ticipants and usersC. Improvements in productivity, cost savings, quality, etc.
4. The concern for the method of evaluation in the designand implementation of HR programs occurs:

APPENDIX 497
A. Before a program is developedB. After a program is implementedC. After a program is developed but before it’s implemented
5. New HR programming, without some formal method ofmeasurement and evaluation, is:A. Never implementedB. Regularly implementedC. Occasionally implemented
6. The costs of specific HR programs are:A. Estimated when the programs are implementedB. Never calculatedC. Continuously implemented
7. The costs of absenteeism, turnover, and sick leave ofthe organization:A. Are routinely calculated and monitoredB. Have been occasionally calculated to identify problem
areasC. Have not been determined
8. Benefit/cost comparisons of HR programs are:A. Never developedB. Occasionally developedC. Frequently developed
9. In an economic downturn, the HR function will:A. Be retained at the same staffing level, unless the down-
turn is lengthyB. Be the first to have its staff reducedC. Go untouched in staff reductions and possibly be
beefed up
10. The cost of current or proposed employee benefits are:A. Regularly calculated and compared with national,
industry, and local dataB. Occasionally estimated when there is concern about
operating expensesC. Not calculated, except for required quarterly and
annual reports
11. The chief executive officer (CEO) interfaces with the seniorHR officer:

498 THE HUMAN RESOURCES SCORECARD
A. Infrequently; it is a delegated responsibilityB. Occasionally, when there is a pressing needC. Frequently, to know what’s going on and to provide
support
12. On the organizational chart, the top HR manager:A. Reports directly to the CEOB. Is more than two levels removed form the CEOC. Is two levels below the CEO
13. Line management involvement in implementing HR pro-grams is:A. Limited to a few programs in its area of expertiseB. Nil; only HR specialists are involved in implement-
ing programsC. Significant; most of the programs are implemented
through line management
14. The HR staff involvement in measurement and evaluationconsists of:A. No specific responsibilities in measurement and evalua-
tion with no formal training in evaluation methodsB. Partial responsibilities for measurement and evaluation,
with some formal training in evaluation methodsC. Complete responsibilities for measurement and evalua-
tion; even when some are devoted full time to theefforts, all staff members have been trained in evalua-tion methods
15. Human resources development (HRD) efforts consist of:A. Full array of courses designed to meet individual’s needsB. Usually one-shot, seminar-type approachesC. A variety of education and training programs imple-
mented to improve or change the organization
16. When an employee participates in an HR program, his orher supervisor usually:A. Asks questions about the program and encourages the
use of program materialsB. Requires use of the program material and uses positive
rewards when the employee meets program objectivesC. Makes no reference to the program

APPENDIX 499
17. Pay for performance programs (bonuses, incentive plans, etc.):A. Exists for a few key employeesB. Is developed for all line employeesC. Is developed for most employees, line and staff
18. Productivity improvement, cost reduction, or quality ofwork life programs:A. Have not been seriously considered in the organizationB. Are under consideration at the present timeC. Have been implemented with good results
19. The results of HR programs are communicated:A. Occasionally, to members of management onlyB. Routinely, to a variety of selected target audiencesC. As requested, to those who have a need to know
20. With the present HR organization and attitude towardresults, the HR function’s impact on profit:A. Can be estimated but probably at a significant costB. Can be estimated (or is being estimated) with little
additional costC. Can never be assessed
Scoring and Interpretation
Scoring: Assign a numeric value to each of your responses to thequestions based on the following schedule: 5 points for the mostcorrect response, 3 points for the next most correct response and1 point for the least correct response. Total your score and compareit with the analysis that follows.
The following schedule shows the points for each response:
POINTS POINTS POINTS POINTS
1. A - 5 6. A - 3 11. A - 1 16. A - 31. B - 3 6. B - 1 11. B - 3 16. B - 51. C - 1 6. C - 5 11. C - 5 16. C - 12. A - 3 7. A - 5 12. A - 5 17. A - 11. B - 1 6. B - 3 11. B - 1 16. B - 31. C - 5 6. C - 1 11. C - 3 16. C - 53. A - 1 8. A - 1 13. A - 3 18. A - 11. B - 3 6. B - 3 11. B - 1 16. B - 31. C - 5 6. C - 5 11. C - 5 16. C - 5

500 THE HUMAN RESOURCES SCORECARD
4. A - 5 9. A - 3 14. A - 1 19. A - 31. B - 1 6. B - 1 11. B - 3 16. B - 51. C - 3 6. C - 5 11. C - 5 16. C - 15. A - 5 10. A - 5 15. A - 3 20. A - 31. B - 1 6. B - 3 11. B - 1 16. B - 51. C - 3 6. C - 1 11. C - 5 16. C - 1
Rationale: Explanations for responses are given below.
1. Performance measurements should be developed for all HRfunction. When that is not feasible, at least a few keymeasures should be in place in each function; otherwise,a function may be perceived to be unimportant or nota contributor.
2. Major organizational decisions should always involve inputfrom the HR function. HR policy makers should haveinput into key decisions in which human resources arean issue.
3. Whenever possible, the investment in human resourcesshould be measured by improvements in productivity, costsavings, and quality. Although other types of evaluationare important and acceptable, these measures are theultimate proof of results.
4. The concern for the method of evaluation should occurbefore the program is developed. In the early stage, someconsideration should be given to how the data will becollected and how the program will be evaluated. Thisensures that the proper emphasis is placed on evaluation.
5. HR programs should never be implemented without aprovision for at least some type of formal method ofmeasurement and evaluation. Otherwise, the contributionof the program may never be known.
6. The costs of all individual HR programs should be con-tinuously monitored. This provides management with anassessment of the financial impact of these programs at alltimes—not just when the program is implemented.
7. Because these important variables represent a tremendouscost for the organization, the cost of absenteeism, turnover,and sick leave should be routinely calculated and monitored.

APPENDIX 501
8. Benefit/cost comparisons of HR programs should be con-ducted frequently, particularly when a significant invest-ment is involved. Even rough estimates of payoffs ver-sus estimated costs can be helpful in the evaluation ofa program.
9. In an economic downturn, the HR function should gountouched in staff reductions or possibly beefed up. Ideally,the function should enhance the bottom line by improvingproductivity or by reducing costs that can keep the organi-zation competitive in the downturn.
10. Because employee benefits represent a significant portionof operating expenses, they should be routinely monitoredand compared with national data, industry norms, andlocalized data. Projected future costs of benefits shouldalso be periodically reviewed.
11. The CEO should frequently interface with the executiveresponsible for human resources. It is important for theCEO to know the status of the HR function and receiveinput on employee morale. This provides an opportunityfor the CEO to communicate concerns, desires, and expectationsto the HR executive. Frequent meetings are important.
12. The top HR executive should report directly to the CEO.A direct link to the top will help ensure that the HRfunction receives proper attention and commands theinfluence necessary to achieve results.
13. Line management involvement in the implementation ofHR programs should be significant. Line management’sparticipation in the design, development, and implementa-tion of HR programs will help ensure its success. Linemanagement should be considered in a partnership withthe HR staff.
14. The entire HR staff should have some responsibility formeasurement and evaluation. Even when some individualsare devoted full time to the effort, all staff members shouldhave a partial responsibility for measurement and evalua-tion. Staff members should also have training in measure-ment and evaluation methods. This comprehensive focuson evaluation is necessary for successful implementation.
15. Human resources development (HRD) efforts shouldconsist of a variety of education and training programs

502 THE HUMAN RESOURCES SCORECARD
implemented to increase the effectiveness of the organiza-tion. HRD involves more than just courses or short seminars.It should include a variety of instructional methods aimedat improving organizational effectiveness.
16. When an employee completes an HR program, his or hersupervisor should require use of the program material andreward the employee for meeting or exceeding programobjectives. This positive reinforcement will help ensure thatthe appropriate results are achieved.
17. Pay-for-performance programs should be considered formost employees, both line and staff. Although usuallylimited to a few key line employees, these programs canwork for all employees. Through gain sharing plans, bonuses,and incentives, employees can see the results of theirefforts and are rewarded for their achievement. Thisis fundamental to a results-oriented philosophy for theHR function.
18. Productivity improvement, cost reduction, or quality worklike programs should be implemented in many locationsand should achieve positive results. These programs are atthe very heart of bottom-line HR contributions and havebeen proven successful in all types of settings. The HRfunction should take the lead to ensure that these programsare administered efficiently and are successful.
19. The results of HR programs should be routinely com-municated to a variety of selected target audiences. Dif-ferent audiences have different interests and needs, butseveral important audiences should receive information onthe success of HR programs. While some may need onlylimited general information, other audiences need detailed,bottom-line results.
20. The impact of the HR function on the bottom-line con-tribution can be estimated with little additional costs. Ifmeasurement and evaluation is an integral part of theorganization’s philosophy, data collection can be built intothe human resources information system. It adds a littlecost but should generate data necessary to calculate pro-gram results.

APPENDIX 503
Analysis of Scores
Total score should range from 20 to 100. The higher the score, thegreater your organization’s emphasis on achieving results with theHR function.
ScoreRange Analysis of Range
81–100 This organization is truly committed to achieving results withthe HR function. Additional concentrated efforts to improvemeasurement and evaluation for the HR function is notneeded. There is little room for improvement. All HR sub-functions and programs appear to be contributing to organi-zational effectiveness. Management support appears to beexcellent. Top management commitment is strong. This HRdepartment is taking the lead in measurement and evaluationby showing the contribution it can make to the organization’ssuccess. Chances are, it is a vital part of an effective andsuccessful organization.
61–80 This HR department is strong and is contributing to organi-zational success. The organization is usually better thanaverage in regard to measurement and evaluation. Althoughthe attitude toward achieving results is good, and some ofthe approaches to evaluation appear to be working, there isstill room for improvement. Additional emphasis is neededto make this department continue to be effective.
41–60 Improvement is needed in this organization. It ranks belowaverage with other HR departments in measurement andevaluation. The attitude toward results and the approachused in implementing HR programs are less than desirable.Evaluation methods appear to be ineffective and actionis needed to improve management support and alter thephilosophy of the organization. Over the long term, thisdepartment falls far short of making a significant contribu-tion to the organization.
20–40 This organization shows little or no concern for achievingresults from the HR function. The HR department appearsto be ineffective and improvement is needed if the departmentis to survive in its current form and with its current manage-ment. Urgent attention is needed to make this departmentmore effective in contributing to the success of the organization.

504 THE HUMAN RESOURCES SCORECARD
This instrument has been administered to HR managers andspecialists attending local, regional, or national HR conferences.The typical respondent has been the individual responsible forthe HR function. The instrument was administered anonymouslyand the respondents were provided ample time at the beginningof the meeting to complete it. Questions and answers wereallowed during the administration of the instrument. To date,there have been more than 700 usable responses representing anaverage score of 61.4 with a standard deviation of 7.7.
The score can reveal much about the status of human resourcesin an organization and the attitude toward measurement andevaluation. A perfect score of 100 is probably unachievable andrepresents utopia; however, it is the ultimate goal of many HRexecutives and a few other key executives. On the other extreme,a score of 20 reveals an ineffective organization, at least in termsof the contribution of the HR function. The organization willprobably not exist for long in its current form or with the cur-rent staff.
Although the analysis of these scores is simplistic, the messagefrom the exercise should be obvious. Achieving results from theHR function is more than just evaluating a single program orservice. It represents a comprehensive philosophy that must beintegrated into the routine activities of the HR staff and sup-ported and encouraged by top executives.

INDEX 505
505
Index
AAbsenteeism, employee, 255Absenteeism reduction, 53–55,
390–403, 431–432Accident reduction program,
439–448Accountability approaches, 3–15Accuracy of data, 211–214Action plans, 131–137
advantages/disadvantages, 137developing, 133–134forms for making, 132, 153using successfully, 134–137using to develop business
impact data, 152–159Action reflection learning (ARL),
449–476Analysis and planning, initial,
42–65Annualized values, 234–235Application and implementation,
measuring, 100–140improving response rate for
questionnaires andsurveys, 119–124
key issues, 103–104observing participants on the
job to measure, 127–131using action plans and follow-
up assignments tomeasure, 131–137
using focus groups tomeasure, 125–127
using interviews to measure,124–125
using performance contracts tomeasure, 137–139
using questionnaires tomeasure, 104–119
shortcuts, 139–140why measure? 101–103
Application and implementationobjectives (Level 3), 49–50
Assessment center method(simulation), 94
Attitude surveys, 4, 252–253Audio monitoring of behavior,
130–131Auditing, HR, 5
BBenchmarking, competitive, 8Benefit/cost ratio (BCR), 29,
235–236BCR/ROI case application,
237–241Benefits factor, 222Business case for ROI, 2–41Business impact data
capturing, 140–163given by subordinates (strategy
to isolate effects), 192–193

506 THE HUMAN RESOURCES SCORECARD
Business impact data (continued)shortcuts for capturing, 165–167types of, 141–150using action plans to develop,
152–159using questionnaires to collect,
159–163why measure? 140–141
Business impact objectives (Level4), 50–51
Business needs, 55–56Business performance data,
monitoring, 150–152
CCase studies, HR, 4–5
as job simulation, 92–93database of, 17use as communication media,
286–287Climate, assessing for ROI
implementation, 334, 337Climate surveys, 253Commitment, organizational, 253Communication of results, 30–31,
261–299, 350analyzing reactions to, 296–298analyzing the need for, 268audience selection, 274–277communicating the
information, 288–296developing impact study,
277–282examples, 436–437, 447–448,
494model for, 266–297planning for, 270–273policy issues, 270–271principles of, 264–266sample HR program
communication plan, 273selecting communication
media, 282–288
shortcuts to provide feedbackand communicate withclients, 298–299
why be concerned about?262–264
Competency-based pay system,373–389
Competitive benchmarking, 8Complaints, customer, 256–257Complaints, employee
discrimination, 254general, 253–254
Computer monitoring, 131Control groups
arrangement of, 415, 417–418selection, 377–378use in isolating the effects of
HR program, 171–175Converting data to monetary
values. See Data conversionto monetary values.
Cost classification matrix, 226–228Cost estimating worksheets,
230–232Cost of converting data to
monetary value, historical,205
Cost of HR programs,monitoring, 6–7, 216–232
benefits factor, 222cost accumulation and
estimation, 226–232danger of costs without
benefits, 219–220fully loaded costs, 218importance of costs, 217major cost categories, 222–226
analysis costs, 222development/acquisition
costs, 223evaluation costs, 225implementation costs,
223–225

INDEX 507
operating costs, 225overhead, 226
policies and guidelines, 220pressure to disclose all costs,
217–218prorated vs. direct costs,
220–222typical cost categories,
220–221Cost of HR programs,
tabulating, 28in executive leadership case
study, 463, 468–469in sexual harassment case
study, 367–371in stress management case
study, 434–435in technology-based learning
case study, 489–492Credibility of data, 211–214Criterion-referenced test (CRT),
86–88Customer
complaints, 256–257input (strategy for isolating
effects), 190–191response time, 257satisfaction survey data, 256
Customer serviceas intangible measure, 256–257importance of measuring, 70
DData, business impact. See
Business impact data.Data, hard. See Hard data.Data, soft. See Soft data.Data accuracy, 211–214Data collection, 25–26
after HR programimplementation, 100–167
during HR programimplementation, 68–99
in safety incentive case study,443–446
selecting appropriate methodfor each level, 163–165
timing for application andimplementation feedback,103–104
timing for reaction andsatisfaction feedback. SeeReaction and satisfaction.
Data collection plan, 58–60for Healthcare Inc., 358–360for Imperial National Bank,
452–457for Metro Transit Authority,
393–394for Midwest Electric Inc.,
410–412for National Crushed Stone,
378–379for United Petroleum
International, 483–484Data conversion to monetary
values, 27–28, 197–215accuracy and credibility of
data, 211–214calculating cost of quality,
203–204converting employee time,
204–205converting output data to
contribution, 200–202example, 201general steps to convert data,
198historical costs, 205
HR staff estimates, 210in absenteeism reduction case
study, 397–399in stress management case
study, 432–434internal and external experts’
input, 205–206

508 THE HUMAN RESOURCES SCORECARD
HR staff estimates (continued)participant estimates, 207–208selecting the appropriate
strategy, 210–211senior manager estimates,
209–210sorting hard and soft data, 198supervisor estimates, 208–209strategies for converting, 200values from external
databases, 206–207Data credibility, 211–214Direct costs vs. prorated costs,
220–222Discounted cash flow, 242Discrimination complaints, 254Discussion groups, establishing,
345–346
EEffectiveness, team, 257–260Effectiveness index, 9–10E-mail and electronic media, use as
communication vehicle, 286Employee
absenteeism, 53–55, 255,390–403, 431–432
complaints, 253–254satisfaction, 252–254tardiness, 255transfers, 256turnover, 255, 361, 364–367,
388, 432, 462withdrawal, 254–256
Employee attitude surveys, 4,252–253
Employee Relations Index (ERI), 9Employee safety program, 439–448Estimation
cost, 226–232used to convert data to
monetary value, 207–210used to isolate effects of HR
program, 179–192
Evaluationconnection with needs
assessment, 52–57project requirements, 43–46
Evaluation framework, 22–24Evaluation levels, characteristics
of, 23Evaluation planning, 25. See also
Data collection plan andROI analysis plan.
initial analysis and planning,42–65
planning for measurement andevaluation, 57–62
shortcuts, 62–64Executive leadership development
program, 449–476Expert estimation (strategy to
isolate effects), 191–192
FFeedback
areas for reaction andsatisfaction data. SeeReaction and satisfaction.
importance of early, 70–71shortcuts for providing, 298–299use in communicating results,
288–292Focus groups, use in measuring
application andimplementation, 125–127
Forecasting methods, use inisolating the effects of HRprogram, 176–179
Forecasting ROI. See Return oninvestment, forecasting.
Fully loaded costs, 218
GGames, business (simulation),
91–92General Electric, 9Grievances, 254

INDEX 509
HHard data, 142–145
separating from soft data, 198vs. soft data, 148–149
Healthcare Inc. case study, 354–372Human capital measurement, 10Human Resource Performance
Index (HRPX), 9Human resources (HR)
case studies, 4–5programs, levels of objectives
for, 46–52management involvement in, 351reputation of, 7–8staff, preparing for ROI
implementation, 337–343Human resources accounting
(HRA), 10Human Resources Effectiveness
Index (HREI), 9–10
IImpact objectives, 50–51Impact studies, 272. See also
Communication of results.developing, 277–282format, 281
Imperial National Bank casestudy, 449–476
Implementation, 33important issues with, 301–351initiating ROI process, 343–346management team, 346–350monitoring progress and com-
municating results, 350planning, 327–337preparing the HR staff,
337–343Implementation and application,
measuring. See Applicationand implementation,measuring.
Implementation and applicationobjectives, 49–50
In-basket (simulation), 92Index, HR effectiveness, 9–10Intangible benefits/measures,
identifying, 30, 249–260customer service, 256–257employee satisfaction, 252–
254employee withdrawal, 254–256key issues, 250–252team effectiveness measures,
257–260Internal rate of return, 243Interviews, use in measuring
application andimplementation, 124–125
Isolating effects of HR program,26–27, 168–196
in absenteeism reduction casestudy, 395, 397
in sexual harassment casestudy, 354–372
preliminary issues, 169–171the ten strategies for, 171–194
calculating the impact ofother factors, 193–194
customer input, 190–191expert estimation, 191–192forecasting methods, 176–179management estimates, 190participant estimates,
179–186subordinate input of HR
program impact,192–193
supervisor estimates,186–189
trendline analysis, 175–176use of control groups,
171–175using the ten strategies,
194–195
JJob performance needs, 56

510 THE HUMAN RESOURCES SCORECARD
KKey indicators, HR, 6Kirkpatrick, Donald, 22Knowledge changes, measuring. See
Learning, measurement of.
LLeadership development
program, 449–476Learning, measurement of, 83–98
using data, 98why measure? 84–85with formal tests, 85–90with less-structured activities,
95–97with simulation, 90–94
Learning, technology-based,477–495
Learning objectives (Level 2),48–49
Levels of evaluation, 23Levels of objectives, 46–52
MManagement
estimationstrategy to convert data to
monetary value,209–210
strategy to isolate effects, 190involvement, 351, 412, 414–416selling on ROI
implementation, 346–350Management by objectives
(MBO), 4Matrix, cost classification,
226–228MBO, 4Measurement and evaluation,
planning for. See Evaluationplanning.
Meetings, use as communicationmedia, 282–283
Metro Transit Authority, 390–403Midwest Electric Inc. case study,
404–438Models
for communicating results,266–297
for pre-project ROIforecasting, 306–307
for ROI process. See ROIprocess, model.
Monetary values. See Data con-version to monetary values.
Monitoring costs. See Cost ofHR programs, monitoring.
NNational Crushed Stone Company
case study, 373–389National Steel case study, 439–448Needs assessment
connection with evaluation,52–57
in safety incentive case study,440–441
in stress management casestudy, 405–407
OObjectives, levels of, 46–52Observation guidelines and
methods, 127–129Organizational commitment, 253
PParticipant estimation
strategy to convert data tomonetary value, 207–208
strategy to isolate effects,179–186
Pay system, competency-based,373–389
Payback period, 241–242Payoff needs, 55

INDEX 511
Performance contracts, 137–139Performance improvement, fore-
casting/estimating, 309–310Performance needs, 56Performance testing, 88–90Pilot program, forecasting ROI
using, 313–314Planning. See Evaluation planning.Planning and analysis, initial,
42–65Profit center, 10–11Program costs. See Cost of HR
programs, tabulating.Program design
how it can increase ROI,449–476
in stress management casestudy, 407–410
in technology-based learningcase study, 479–481
Programs, HR. See Humanresources programs.
Programs, selection for ROIimplementation, 344.
Prorated costs vs. direct costs,220–222
Publications of organization, useas communication media,285–286
QQuality, calculating cost of,
203–204Questionnaires
design of, 76–78improving response rate,
119–124sample, 106–115use in collecting business impact
measures, 159–163use in executive leadership
development case study,453–457
use in measuring application andimplementation, 104–119
use in measuring reaction andsatisfaction, 76
use in stress management casestudy, 419–429
use in technology-based learningcase study, 487–488
RReaction and satisfaction (Level 1),
47–48data sources, 72–73feedback areas, 73–76measuring, 69–83shortcuts for measuring, 82–83timing of data collection, 75–76using data, 81–82
Reports, interim and progress(use as communicationmedia), 283–285
Reputation of HR, 7–8Response rate, improving, 119–124Response time, customer, 257Results, communicating. See
Communication of results.Return on investment (ROI). See
also ROI process.as a Level 5 objective, 51as an accountability approach,
8–9business case, 2–41calculating, 29–30, 233–248
basic issues, 234–235BCR/ROI case application,
237–241consequences of not
providing an HRsolution, 244–245
for Healthcare Inc. casestudy, 371–372
for Imperial National Bank,469–472

512 THE HUMAN RESOURCES SCORECARD
Return on investment (ROI)(continued)for Metro Transit Authority
case study, 403for Midwest Electric case
study, 436for National Crushed Stone
case study, 389for National Steel case
study, 447for United Petroleum
International, 492using benefit/cost ratio
(BCR), 235–236using other ROI measures,
241–243using ROI formula, 236–237utility analysis, 243–244
cautions when using, 245–248complexity, 245–246forecasting, 302–326
at Level 4 (business results),325
pre-project, 306–314shortcuts, 325–326tradeoffs, 304–306why? 302–304with application of skills
and competencies,322–324
with learning data, 319–322with reaction data, 314–319
formula, 29implementation. See
Implementation.need for in HR, 1–65not a fad, 2–3rationale for developing, 16–18target audiences, 19–20
ROI. See Return on investmentand ROI process.
ROI analysis plan, 60–62for Healthcare Inc., 360–363
for Metro Transit Authority,396
for Midwest Electric, 412–413for National Crushed Stone,
380for United Petroleum
International, 485ROI process, 67–299. See also
Return on investment.barriers to implementing,
34–36benefits of implementing,
36–38credibility of, 18–34criteria, 20–21implementation. See
Implementation.initiating, 343–346model, 24–31operating standards and
guiding principles, 31–33questionnaire to determine if
your organization is acandidate, 39–40
Role playing, 93
SSafety incentive program, 439–448Satisfaction, customer, 256Satisfaction and reaction. See
Reaction and satisfaction(Level 1).
Sexual harassment preventionprogram, 354–372
Simulations, job, 90–94Skill changes, measuring. See
Learning, measurement of.Soft data, 145–148
separating from hard data, 198vs. hard data, 148–149
Stress management program,404–438
Stress reduction, 254

INDEX 513
StressMap“ tool, 404, 408–409,412, 416
Subordinate input of HRprogram impact (strategy toisolate effects), 192–193
Supervisor estimationstrategy to convert data to
monetary value, 208–209strategy to isolate effects,
186–189Surveys
climate surveys, 253customer satisfaction survey
data, 256employee attitude surveys, 4,
252–253guidelines for developing,
79–81improving response rate,
119–124use to measure reaction and
satisfaction, 78–79
TTardiness, employee, 255Target audiences, 19–20
common (table), 276selecting for results
communication, 274–277Team effectiveness measures,
257–260
Technology-based learningprogram, 477–495
Technology Learning CompetencyProgram (TLC), 480–481
Tests, learning, 85–90Time, conversion to monetary
values, 204–205Timing, 43–46Transfers, employee, 256Trendline analysis
example (graph), 175use in isolating effects of HR
program, 175–176Turnover, employee, 255Turnover reduction, 361,
364–367, 388, 432, 462
UUnited Petroleum International
case study, 477–495Utility analysis, 243–244
VVideo recording of behavior, 130
WWithdrawal, employee, 254–256Workplace needs, 56

514 THE HUMAN RESOURCES SCORECARD
514
About the Authors
Jack J. Phillips, Ph.D., is a world-renowned expert on measure-ment and evaluation, who provides consulting services for Fortune500 companies, as well as workshops for major conferenceproviders around the globe. The author or editor of more thantwenty books—eight about measurement and evaluation—andmore than one hundred articles, Dr. Phillips’ expertise in measure-ment and evaluation spans more than twenty-seven years ofcorporate experience in five industries (aerospace, textiles, metals,construction materials, and banking). He has served as trainingand development manager at two Fortune 500 firms, senior HRofficer at two firms, president of a regional federal savings bank,and management professor at a major state university.
Dr. Phillips’ background in training and HR led him to developthe ROI Process™—a revolutionary process that provides bottom-line figures and accountability for all types of training, per-formance improvement, human resources, and technology programs.In 1992, he founded Performance Resources Organization (PRO),an international consulting firm that provides comprehensiveassessment, measurement, and evaluation services for organizations.In 1999, PRO was acquired by the Franklin Covey Company andis now known as the Jack Phillips Center for Research. Todaythe center is an independent, leading provider of measurementand evaluation services to the global business community. Dr.Phillips consults with clients in manufacturing, service, andgovernment organizations in the United States, Canada, Sweden,England, Belgium, Germany, Italy, Holland, South Africa, Mexico,Venezuela, Malaysia, Indonesia, Hong Kong, Australia, NewZealand, and Singapore. He leads the center’s research and

ABOUT THE AUTHORS 515
publishing efforts, which support the knowledge and developmentof assessment, measurement, and evaluation.
Dr. Phillips’ books include The Human Resources Scorecard,Gulf Publishing, Houston, TX, 2000; The Consultant’s Scorecard,McGraw-Hill, New York, NY, 2000; HRD Trends Worldwide:Shared Solutions to Compete in a Global Economy, Gulf PublishingCompany, Houston, TX, 1999; Return on Investment in Trainingand Performance Improvement Programs, Gulf Publishing Company,Houston, TX, 1997; Handbook of Training Evaluation andMeasurement Methods, 3rd edition, Gulf Publishing Company,Houston, TX, 1997; and Accountability in Human ResourceManagement, Gulf Publishing Company, Houston, TX, 1996. Heis series editor for ASTD’s In Action Series and serves as series editorfor Gulf Publishing’s Improving Human Performance Series.
Dr. Phillips has undergraduate degrees in electrical engineering,physics, and mathematics from Southern Polytechnic State Universityand Oglethorpe University, a master’s degree in decision sciencesfrom Georgia State University, and a Ph.D. in human resourcemanagement from the University of Alabama. In 1987 he wonthe Yoder-Heneman Personnel Creative Application Award fromthe Society for Human Resource Management.
Ron D. Stone is director of workshops and consultants for theJack Phillips Center for Research, a division of Franklin Covey.Prior to joining the center, Ron was vice-president and chiefconsulting officer for Performance Resources Organization, wherehe specialized in measurement processes and directed the inter-national consulting practice for four years. He currently conductsreturn on investment (ROI) studies and consults with clients inmanufacturing, service, and government organizations in theUnited States and abroad. He provides consulting services inmeasurement and evaluation, training function management, theestablishment of results-based policies and procedures, perfor-mance management systems, and strategic planning. Ron alsocertifies practitioners in the ROI Process™, conducts a fullrange of public and in-house workshops, and is a certifiedchange consultant.
Mr. Stone has more than thirty years of experience in humanresource management, engineering, and training in the aerospace,

516 THE HUMAN RESOURCES SCORECARD
electric utility, and industrial development industries. He hasconsiderable experience in employment processes, compensationand benefits, performance management, healthcare delivery systemmanagement, budgeting and account classification processes,training curriculum design, safety, organizational development,executive development, and needs assessment and evaluation. Inaddition, he served eighteen years in a managerial capacity whileworking for two subsidiaries of the Southern Company, servedas manager of corporate training for twelve years, was supervisorof skills development, manager of management and executivedevelopment, manager of research and evaluation, and managerof human resources. He also served on the design team to developand implement the Southern Company’s performance managementprocess and incentive pay plan. He also consulted with the pilotproject team to design and implement team structures within theSouthern Company.
As chair of the Edison Electric Institute’s Executive LeadershipProgram for senior officers in the electric utility industry, Mr.Stone led the design, delivery, and evaluation of the industry’spremier executive development program. He served on theAlabama’s Adult Education Advisory Council and the Universityof Alabama Management Development Program Advisory Council,and has designed industry management programs that weredelivered through continuing education functions at the Universityof Alabama, Auburn University, and the University of Georgia.
Mr. Stone currently serves on the steering committee andfaculty for the University of Alabama Human Resource Develop-ment Program. He received the Pioneer Award in 1993 from theAlabama Healthcare Council for his leadership of a three-yearmajor change initiative and his visionary work in influencingimprovement in the quality and efficiency of Alabama’s healthcaredelivery system. He is a member of the Society for HumanResource Management and the American Society for Trainingand Development.
In addition to his made numerous contributions to perfecting theROI Process™, Mr. Stone has contributed several case studies toASTD’s In Action Series, which appear in the casebooks titledMeasuring Return on Investment (1997) and Measuring Learningand Performance (1999). He is a contributing author to theASTD Info-Line Series and the ASTD Tool Kit Series (1999). He is

ABOUT THE AUTHORS 517
co-author of The Human Resources Scorecard, Gulf Publishing Com-pany, and the upcoming book How to Measure Training Success—A Practical Guide to Teaching the Six Key Indicators, McGraw-Hill(2000). Ron received his BBA from Georgia State University.
Patricia Pulliam Phillips is chairwoman and CEO of theChelsea Group, a consulting and publishing company focusedon accountability issues in training, HR, and performanceimprovement. Building on the work of Jack J. Phillips, developerof the ROI Process™, Ms. Phillips offers a practical and cost-savings approach to implementing ROI within organizations. Sheworks closely with the ROI Certification™ process and helpspromote accountability practices through research and publica-tions. Through the Chelsea Group, Ms. Phillips works withpublishers, editors, and authors to develop publications onaccountability, including the American Society for Training andDevelopment’s In Action Series and Gulf Publishing’s ImprovingHuman Performance Series. She also serves on the board ofdirectors for the ROI Network™, a professional organization ofpractitioners of measurement and evaluation.
Formerly, Ms. Phillips served as vice-president of businessdevelopment at Performance Resources Organization. In this role,she was responsible for the development of international anddomestic strategic alliances, client relations, and sales and market-ing initiatives. Prior to her work with Performance ResourcesOrganization, she worked in the electric utility industry for theSouthern Company. Her thirteen-year career there included therole of manager of market planning and research, in which shewas responsible for the development of marketing programs forresidential and commercial customers. She also played an integralpart in the development of Marketing University, a learningenvironment that supported the needs of new sales and market-ing representatives.
As manager in the Corporate Services organization, Ms. Phillipsinitiated and implemented the operation evaluation process. Thisevaluation process included the development and analysis ofsurveys, interviews with line management and employees, andparticipation in line operation activities. The results of thisevaluation process served as a planning tool for establishingpurchasing procedures for line equipment and tools, an internal

518 THE HUMAN RESOURCES SCORECARD
process-planning tool to support line operations, and a model forfuture operation evaluation initiatives.
Ms. Phillips has an MA in public and private managementfrom Birmingham-Southern College, is certified in ROI evaluation,and serves as co-author on the subject in such publications asCorporate University Review (1998), The Journal of Lending andCredit Risk Management (1997), and Evaluating Training Pro-grams, 2nd edition, by Donald L. Kirkpatrick, Berrett-KoehlerPublishers Inc. (1998). She is also contributing author to HRDTrends Worldwide, by Jack J. Phillips, Gulf Publishing (1999),and co-author of the American Society for Training and Develop-ment’s Info-Line Series, Level 5 Evaluation: ROI (1998); ROI ona Shoestring (2000); and The Human Resources Scorecard, GulfPublishing (2000).