The Hongkong and Shanghai Banking Corporation Limited
56
The Hongkong and Shanghai Banking Corporation Limited Banking Disclosure Statement at 31 December 2018 (unaudited)
-
Upload
khangminh22 -
Category
Documents
-
view
1 -
download
0
Transcript of The Hongkong and Shanghai Banking Corporation Limited
The Hongkong and Shanghai Banking Corporation LimitedBanking Disclosure Statement at 31 December 2018 (unaudited)
Banking Disclosure Statement at 31 December 2018
1 The Hongkong and Shanghai Banking Corporation Limited
ContentsPage
Introduction
Purpose
Basis of preparation
The Banking Disclosure Statement
Overview of risk management
Linkage to the Annual Report and Accounts 2018
Basis of consolidation
Balance sheet reconciliation
Capital and RWAs
Regulatory capital disclosures
Countercyclical capital buffer ratio
Leverage ratio
Overview of RWAs and the minimum capital requirements
RWA flow statements
Credit risk
Credit risk management
Credit quality of assets
Credit risk under internal ratings-based approach
Credit risk under standardised approach
Credit risk mitigation
Model performance
Counterparty credit risk exposures
Counterparty credit risk management
Counterparty default risk under internal ratings-based approach
Counterparty default risk under standardised approach
Securitisation
Group securitisation strategy
Group securitisation activity
Monitoring of securitisation positions
Securitisation accounting treatment
Securitisation regulatory treatment
Analysis of securitisation exposures
Market risk
Overview and governance
Market risk measures
Market risk under standardised approach
Market risk capital models
Analysis of VaR, stressed VaR and incremental risk charge measures
Prudent valuation adjustment
Liquidity information
Other disclosures
Interest rate exposures in the banking book
Mainland activities
International claims
Foreign currency positions
Remuneration
Other information
Abbreviations
3
3
3
3
5
7
7
8
12
12
15
16
17
18
19
19
20
23
29
30
33
35
35
37
38
39
39
39
39
39
39
39
41
41
41
42
42
43
45
46
49
49
49
50
50
50
53
53
The Hongkong and Shanghai Banking Corporation Limited 2
Tables
Page
1 KM1 – Key prudential ratios
2 List of subsidiaries outside the regulatory scope of consolidation
3 CC2 – Reconciliation of regulatory capital to balance sheet
4 LI1 – Differences between accounting and regulatory scopes of consolidation and mapping of financial statement categories with regulatory risk categories
5 LI2 – Main sources of differences between regulatory exposure amounts and carrying values in financial statements
6 CC1 – Composition of regulatory capital
7 CCA – Capital instruments
8 CCyB1 – Geographical distribution of credit exposures used in countercyclical capital buffer
9 LR2 – Leverage ratio
10 LR1 – Summary comparison of accounting assets against leverage ratio exposure measure
11 OV1 – Overview of RWAs
12 CR8 – RWA flow statement of credit risk exposures under IRB approach
13 CCR7 – RWA flow statements of default risk exposures under IMM(CCR) approach
14 MR2 – RWA flow statement of market risk exposures under IMM approach
15 CR1 – Credit quality of exposures
16 CR2 – Changes in defaulted loans and debt securities
17 CRB1 – Exposures by geographical location
18 CRB2 – Exposures by industry
19 CRB3 – Exposures by residual maturity
20 CRB4 – Credit-impaired exposures and impairment allowances and write-offs by industry
21 CRB5 – Credit-impaired exposures and impairment allowances and write-offs by geographical location
22 CRB6 – Ageing analysis of accounting past-due unimpaired exposures
23 CRB7 – Breakdown of renegotiated loans between credit impaired and not credit impaired
24 Loans and advances to customers by geographical location
25 Loans and advances to customers by industry
26 Overdue and rescheduled loans and advances to customers
27 Off-balance sheet exposures other than derivative transactions
28 CRE1 – Percentage of total EAD and RWAs covered by IRB approach 24
29 CRE2 – Wholesale IRB credit risk models 25
30 CRE3 – Material retail IRB credit risk models 26
31.1 CR6 – Credit risk exposures by portfolio and PD range – for IRB approach (Wholesale)
31.2 CR6 – Credit risk exposures by portfolio and PD range – for IRB approach (Retail)
31.3 CR6 – Credit risk exposures by portfolio and PD range – for IRB approach (Total)
32 CR10 – Specialised Lending under supervisory slotting criteria approach – Other than HVCRE
33 CR10 – Equity exposures under the simple risk-weight method
34 CR5 – Credit risk exposures by asset classes and by risk weights – for STC approach
Page
35 CR3 – Overview of recognised credit risk mitigation
36 CR7 – Effects on RWAs of recognised credit derivative contracts used as recognised credit risk mitigation – for IRB approach
37 CR4 – Credit risk exposures and effects of recognised credit risk mitigation – for STC approach
38 CR9 – Back-testing of PD per portfolio
39 CCR1 – Analysis of counterparty default risk exposures (other than those to CCPs) by approaches
40 CCR2 – CVA capital charge
41 CCR6 – Credit-related derivatives contracts
42 CCR5 – Composition of collateral for counterparty default riskexposures (including those for contracts or transactions clearedthrough CCPs)
43 CCR8 – Exposures to CCPs
44 CCR4 – Counterparty default risk exposures (other than those to CCPs) by portfolio and PD range – for IRB approach
45 CCR3 – Counterparty default risk exposures (other than those to CCPs) by asset classes and by risk weights – for STC approach
46 SEC1 – Securitisation exposures in banking book
47 SEC2 – Securitisation exposures in trading book
48 SEC4 – Securitisation exposures in banking book and associated capital requirements – where AI acts as investor
49 MR1 – Market risk under STM approach
50 MR3 – IMM approach values for market risk exposures
51 MR4 – Comparison of VaR estimates with gains or losses
52 PV1 – Prudent valuation adjustments
53 LIQA – LCRs and NSFRs on three liquidity reporting bases
54 LIQ1 – Liquidity coverage ratio – for category 1 institution
55 LIQ2 – Net stable funding ratio – for category 1 institution
56 IRRBB – Sensitivity analysis
57 Mainland activities
58 International claims
59 Non-structural foreign currency positions
60 REM1 – Remuneration awarded during financial year
61 REM2 – Special payments
62 REM3 – Deferred remuneration
Prefixes contained in the table names, where applicable, represent the reference codes of the standard disclosure templates and tables for the Revised Pillar 3 Framework issued by the Hong Kong Monetary Authority (‘HKMA’).
4
7
8
10
11
12
15
15
16
16
17
18
18
18
20
20
20
20
20
21
21
21
22
22
22
23
23
27
28
29
29
29
30
31
32
32
33
36
36
36
36
37
37
38
40
40
40
42
43
44
45
46
46
47
49
49
50
50
51
51
52
Banking Disclosure Statement at 31 December 2018
3 The Hongkong and Shanghai Banking Corporation Limited
Introduction
Purpose
The information contained in this document is for The Hongkong and Shanghai Banking Corporation Limited (‘the Bank’) and its subsidiaries (together ‘the group’). It should be read in conjunction with the group's Annual Report and Accounts 2018. The group's Annual Report and Accounts 2018, the Banking Disclosure Statement and the Regulatory Capital Instruments document, taken together, comply with the Banking (Disclosure) Rules (‘BDR’) made under section 60A of the Banking Ordinance.
References to ‘HSBC’, ‘the Group’ or ‘the HSBC Group’ within this document mean HSBC Holdings plc together with its subsidiaries. Within this document the Hong Kong Special Administrative Region of the People’s Republic of China is referred to as ‘Hong Kong’. The abbreviations ‘HK$m’ and ‘HK$bn’ represent millions and billions (thousands of millions) of Hong Kong dollars respectively.
These banking disclosures are governed by the group’s disclosurepolicy, which has been approved by the Board of Directors. Thedisclosure policy sets out the governance, control and assurancerequirements for publication of the document. While the disclosure statement is not required to be externally audited, the document has been subject to independent review in accordance with the group’s policies on disclosure and its financial reporting and governance processes.
Basis of preparation
Except where indicated otherwise, the financial information contained in this Banking Disclosure Statement has been prepared on a consolidated basis. The basis of consolidation for regulatory purposes is different from that for accounting purposes. Information regarding subsidiaries that are not included in the consolidation for regulatory purposes is set out in the ‘Basis of consolidation’ section in this document.
The information in this document is not audited and does not constitute statutory accounts.
Certain financial information in this document is extracted from the statutory accounts for the year ended 31 December 2018 which has been delivered to the Registrar of Companies and the HKMA. The Auditors expressed an unqualified opinion on those statutory accounts in their report dated 19 February 2019. The Auditor's Report did not include a reference to any matters to which the auditor drew any attention by way of emphasis without qualifying their report; and did not contain a statement under sections 406(2), 407(2) or (3) of the Hong Kong Companies Ordinance (Cap.622). The group's Annual Report and Accounts 2018, which include the statutory accounts, can be obtained on request from Communications (Asia), The Hongkong and Shanghai Banking Corporation Limited, 1 Queen's Road Central, Hong Kong, and can be viewed on our website: www.hsbc.com.hk.
The Banking Disclosure Statement
The Hong Kong Monetary Authority (‘HKMA’) has implemented the Basel Committee on Banking Supervision (‘BCBS’) standards on revised Pillar 3 disclosure requirements released in January 2015 (‘January 2015 standard’) since 2017. In June 2018, the HKMA has further amended the BDR to incorporate the BCBS Pillar 3 disclosure requirements – consolidated and enhanced framework finalised in March 2017 (‘March 2017 standard’). The group has implemented the relevant updates and new requirements in accordance with the latest BDR.
According to the BDR, disclosure of comparative information is not required unless otherwise specified in the standard disclosure templates. Prior period disclosures can be found in the Regulatory Disclosure section of our website, www.hsbc.com.hk.
The Banking Disclosure Statement includes the majority of the information required under the BDR. The remainder of the disclosure requirements are covered in the group's Annual Report and Accounts 2018 and Regulatory Capital Instruments 31 December 2018 document which can be found in the Regulatory Disclosure section of our website, www.hsbc.com.hk.
BDR requirements covered in the Regulatory CapitalInstruments document:
• Section 16FE - CCA : Main features of the regulatory capital instruments
BDR requirements covered in the group's Annual Report and Accounts 2018:
References:
• Section 16FJ - LIQA : Liquidity risk management Page 32-33• Section 16J - The group's definition of impaired and
renegotiated and the methods adopted for determining impairments
Note 1.2(i)
• Section 29(5) - Net structural foreign currency exposures Page 36• Section 44 : Assets used as security Note 13• Section 46 - The general disclosure of the major
business activities and product linesPage 8, Note
3 & Note33
• Section 52 - Corporate governance Page 3-7
The Hongkong and Shanghai Banking Corporation Limited 4
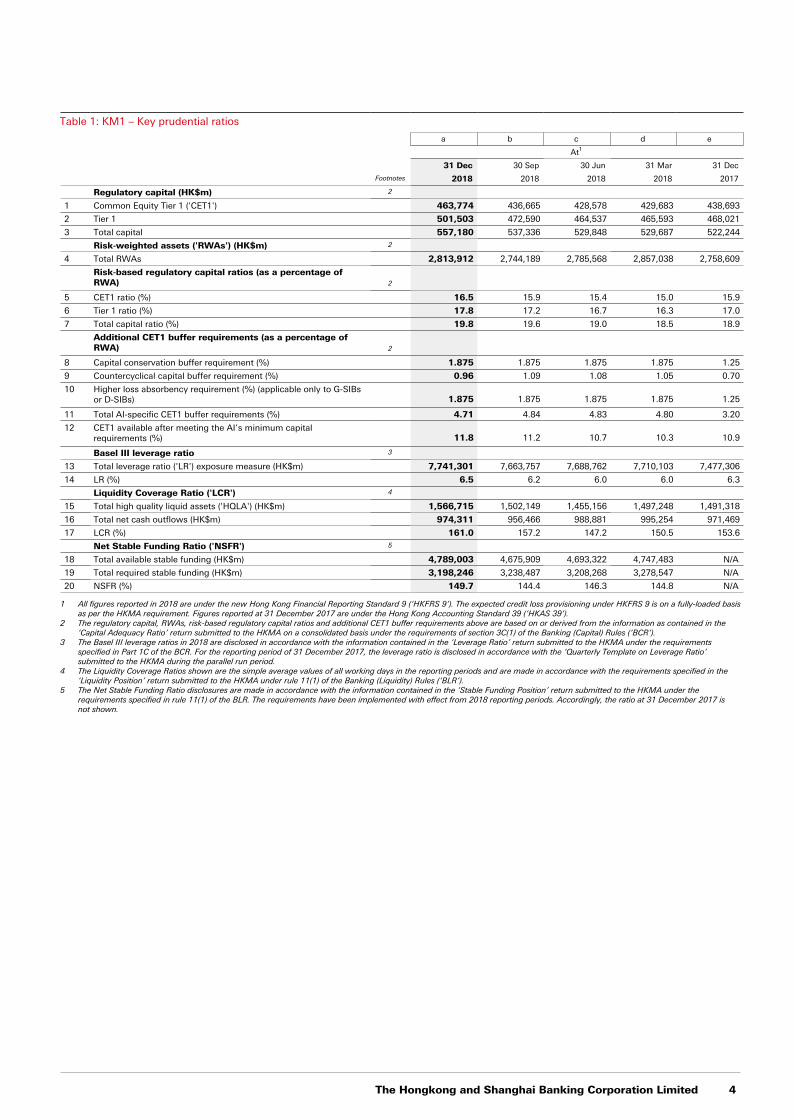
Table 1: KM1 – Key prudential ratios
a b c d e
At1
31 Dec 30 Sep 30 Jun 31 Mar 31 Dec
Footnotes 2018 2018 2018 2018 2017
Regulatory capital (HK$m) 2
1 Common Equity Tier 1 ('CET1') 463,774 436,665 428,578 429,683 438,693
2 Tier 1 501,503 472,590 464,537 465,593 468,021
3 Total capital 557,180 537,336 529,848 529,687 522,244
Risk-weighted assets ('RWAs') (HK$m) 2
4 Total RWAs 2,813,912 2,744,189 2,785,568 2,857,038 2,758,609
Risk-based regulatory capital ratios (as a percentage ofRWA) 2
5 CET1 ratio (%) 16.5 15.9 15.4 15.0 15.9
6 Tier 1 ratio (%) 17.8 17.2 16.7 16.3 17.0
7 Total capital ratio (%) 19.8 19.6 19.0 18.5 18.9
Additional CET1 buffer requirements (as a percentage ofRWA) 2
8 Capital conservation buffer requirement (%) 1.875 1.875 1.875 1.875 1.25
9 Countercyclical capital buffer requirement (%) 0.96 1.09 1.08 1.05 0.70
10 Higher loss absorbency requirement (%) (applicable only to G-SIBsor D-SIBs) 1.875 1.875 1.875 1.875 1.25
11 Total AI-specific CET1 buffer requirements (%) 4.71 4.84 4.83 4.80 3.20
12 CET1 available after meeting the AI’s minimum capitalrequirements (%) 11.8 11.2 10.7 10.3 10.9
Basel III leverage ratio 3
13 Total leverage ratio ('LR') exposure measure (HK$m) 7,741,301 7,663,757 7,688,762 7,710,103 7,477,306
14 LR (%) 6.5 6.2 6.0 6.0 6.3
Liquidity Coverage Ratio ('LCR') 4
15 Total high quality liquid assets ('HQLA') (HK$m) 1,566,715 1,502,149 1,455,156 1,497,248 1,491,318
16 Total net cash outflows (HK$m) 974,311 956,466 988,881 995,254 971,469
17 LCR (%) 161.0 157.2 147.2 150.5 153.6
Net Stable Funding Ratio ('NSFR') 5
18 Total available stable funding (HK$m) 4,789,003 4,675,909 4,693,322 4,747,483 N/A
19 Total required stable funding (HK$m) 3,198,246 3,238,487 3,208,268 3,278,547 N/A
20 NSFR (%) 149.7 144.4 146.3 144.8 N/A
1 All figures reported in 2018 are under the new Hong Kong Financial Reporting Standard 9 (‘HKFRS 9’). The expected credit loss provisioning under HKFRS 9 is on a fully-loaded basis as per the HKMA requirement. Figures reported at 31 December 2017 are under the Hong Kong Accounting Standard 39 (‘HKAS 39’).
2 The regulatory capital, RWAs, risk-based regulatory capital ratios and additional CET1 buffer requirements above are based on or derived from the information as contained in the ‘Capital Adequacy Ratio’ return submitted to the HKMA on a consolidated basis under the requirements of section 3C(1) of the Banking (Capital) Rules (‘BCR’).
3 The Basel III leverage ratios in 2018 are disclosed in accordance with the information contained in the ‘Leverage Ratio’ return submitted to the HKMA under the requirements specified in Part 1C of the BCR. For the reporting period of 31 December 2017, the leverage ratio is disclosed in accordance with the ‘Quarterly Template on Leverage Ratio’ submitted to the HKMA during the parallel run period.
4 The Liquidity Coverage Ratios shown are the simple average values of all working days in the reporting periods and are made in accordance with the requirements specified in the ‘Liquidity Position’ return submitted to the HKMA under rule 11(1) of the Banking (Liquidity) Rules (‘BLR’).
5 The Net Stable Funding Ratio disclosures are made in accordance with the information contained in the ‘Stable Funding Position’ return submitted to the HKMA under the requirements specified in rule 11(1) of the BLR. The requirements have been implemented with effect from 2018 reporting periods. Accordingly, the ratio at 31 December 2017 is not shown.

Banking Disclosure Statement at 31 December 2018
5 The Hongkong and Shanghai Banking Corporation Limited
Overview of risk management
Our risk management frameworkWe use an enterprise risk management framework across the organisation and across all risk types. It is underpinned by our risk culture and is reinforced by the HSBC Values and our Global Standards programme.
The framework fosters continuous monitoring of the risk environment, and promotes risk awareness and sound operationaland strategic decision making. It also ensures we have a consistent approach to monitoring, managing and mitigating the risks we accept and incur in our activities. Further information on our risk management framework is set out on page 12 of the group’s Annual Report and Accounts 2018. The management and mitigation of principal risks facing the group is described in our top and emerging risks on page 16 of the group's Annual Report and Accounts 2018.
Risk cultureHSBC has long recognised the importance of a strong risk culture, the fostering of which is a key responsibility of senior executives. Our risk culture is reinforced by the HSBC Values and our Global Standards programme. It is instrumental in aligning the behaviours of individuals with our attitude to assuming and managing risk, which helps to ensure that our risk profile remains in line with our risk appetite.
Our risk culture is further reinforced by our approach to remuneration. Individual awards, including those for senior executives, are based on compliance with the HSBC Values and the achievement of financial and non-financial objectives that are aligned to our risk appetite and strategy.
Risk governance The Board has ultimate responsibility for the effective management of risk and approves HSBC’s risk appetite. It is advised by the Risk Committee on risk appetite and its alignment with strategy, high-level risk related matters and risk governance.
Executive accountability for the ongoing monitoring, assessment and management of the risk environment and the effectiveness of the risk management framework resides with the group’s Chief Risk Officer, supported by the Risk Management Meeting (‘RMM’).
Day-to-day responsibility for risk management is delegated to senior managers with individual accountability for decision making. All employees have a role to play in risk management. These roles are defined using the Three Lines of Defence model, which takes into account the group’s business and functional structures.
Our executive risk governance structures ensure appropriate oversight and accountability for risk, which facilitates reporting and escalation to the RMM.
Risk appetiteRisk appetite is a key component of our management of risk. It describes the aggregate level and risk types that we are willing to accept in achieving our medium and long-term strategic goals. In HSBC, risk appetite is managed through a global risk appetite framework and articulated in a risk appetite statement (‘RAS’), which is approved biannually by the Board on the advice of the group's Risk Committee.
The group‘s risk appetite informs our strategic and financial planning process, defining the desired forward-looking risk profile of the group. It is also integrated within other risk management tools, such as the top and emerging risks report and stress testing, to ensure consistency in risk management. Information on our risk management tools is set out on page 13 of the group's Annual Report and Accounts 2018. Details on the group’s overarching risk appetite are set out on page 13 of the group's Annual Report and Accounts 2018.
Stress testingHSBC operates a comprehensive stress testing programme that supports our risk management and capital planning. It includes execution of stress tests mandated by our regulators, as well as internal stress tests. Our stress testing is supported by dedicated teams and infrastructure.
Our testing programme assesses our capital strength and enhances our resilience to external shocks. It also helps us understand and mitigate risks, and informs our decisions about capital levels. Stress testing results are reported, where appropriate, to the RMM and the group's Risk Committee.
Global Risk and the group’s Risk functionsWe have a dedicated Global Risk function, headed by the Group Chief Risk Officer, which is responsible for the Group‘s risk management framework. This includes establishing global policy, monitoring risk profiles, and forward-looking risk identification and management. Global Risk is made up of sub-functions covering all risks to our operations. It is independent from the global businesses, including sales and trading functions, helping to ensure balance in risk/return decisions. Similarly, the group’s Risk function, headed by the group’s Chief Risk Officer, is independent from the global businesses and responsible for the group‘s risk management framework.
Risk management and internal control systemsThe Directors are responsible for maintaining and reviewing the effectiveness of risk management and internal control systems, and for determining the aggregate level and risk types they are willing to accept in achieving the group’s business objectives.
On behalf of the Board, the group’s Audit Committee has responsibility for oversight of risk management and internal controls over financial reporting, and the group's Risk Committee has responsibility for oversight of risk management and internal controls other than for financial reporting.
The Directors, through the group’s Risk Committee and the group's Audit Committee, conduct an annual review of the effectiveness of our system of risk management and internal control. The group's Risk Committee and the group’s Audit Committee receive confirmation that executive management has taken or is taking the necessary actions to remedy any failings or weaknesses identified through the operation of our framework of controls.
Risk measurement and reporting systemsOur risk measurement and reporting systems are designed to help ensure that risks are comprehensively captured with all the attributes necessary to support well-founded decisions, that those attributes are accurately assessed, and that information is delivered in a timely manner for those risks to be successfully managed and mitigated.
Risk measurement and reporting systems are also subject to a governance framework designed to ensure that their build and implementation are fit for purpose and functioning appropriately. Risk information systems development is a key responsibility of the Global Risk function, while the development and operation of risk rating and management systems and processes are ultimately subject to the oversight of the Board.
We continue to invest significant resources in IT systems and processes in order to maintain and improve our risk management capabilities. A number of key initiatives and projects to enhance consistent data aggregation, reporting and management, and work towards meeting our Basel Committee data obligations are in progress. Group standards govern the procurement and operation of systems used in our subsidiaries to process risk information within business lines and risk functions.
The Hongkong and Shanghai Banking Corporation Limited 6
Risk measurement and reporting structures deployed at Group level are applied throughout global businesses and major operating subsidiaries through a common operating model for integrated risk management and control. This model sets out the respective responsibilities of Group, global business, region and country level risk functions in respect of such matters as risk governance and oversight, compliance risks, approval authorities and lending guidelines, global and local scorecards, management information and reporting, and relations with third parties, including regulators, rating agencies and auditors.
Risk analytics and model governanceThe Global Risk and the group's Risk functions manage a number of analytics disciplines supporting model development and management, including rating, scoring, economic capital and stress testing models for different risk types and business segments. They formulate technical responses to industry developments and regulatory policy in the field of risk analytics, develop HSBC’s global risk models, and oversee local model development and use around the Group toward our implementation targets for Internal ratings-based (‘IRB’) approaches.
Model governance is under the general oversight of the Global Model Oversight Committee (‘MOC’). Global MOC is supported by specific global functional MOCs for wholesale credit risk, market risk, Retail Banking and Wealth Management (‘RBWM’), Global Private Banking (‘GPB’), Finance, regulatory compliance, operational risk, fraud risk and financial intelligence, pensions risk and financial crime risk, and has functional and/or regional and entity-level counterparts with comparable terms of reference where required.
Models are also subject to an independent model review and validation process led by the Independent Model Review team within Global Risk. The Independent Model Review team provides robust challenge to the modelling approaches used across the Group, and ensures that the performance of those models is transparent and that their limitations are visible to key stakeholders.
The development and use of data and models to meet local requirements are the responsibility of global businesses or functions, as well as regional and/or local entities under the governance of their own management, subject to overall Group policy and oversight.
Banking Disclosure Statement at 31 December 2018
7 The Hongkong and Shanghai Banking Corporation Limited
Linkage to the Annual Reoprt andAccounts 2018
Basis of consolidation
The basis of consolidation for financial accounting purposes is in accordance with Hong Kong Financial Reporting Standards (‘HKFRS’), as described in Note 1 on the financial statements in the group’s Annual Report and Accounts 2018.
The basis of consolidation for regulatory purposes is different from that for accounting purposes. Subsidiaries included in the consolidation for regulatory purposes are specified in a notice from the HKMA in accordance with section 3C(1) of the Banking (Capital) Rules (‘BCR’). Subsidiaries not included in consolidation for regulatory purposes are securities and insurance companies that are authorised and supervised by regulators, and are subject to supervisory arrangements regarding the maintenance of adequate capital to support business activities comparable to those prescribed for authorised institutions under the BCR and the Banking Ordinance. The capital invested by the group in these subsidiaries is deducted from the capital base, subject to certain thresholds, as determined in accordance with Part 3 of the BCR.
For insurance entities, the present value of in-force long-term insurance business asset of HK$48,522m and the related deferred tax liability are only recognised on consolidation in financial reporting and are therefore not included in the asset or equity positions for the stand-alone entities presented in the below table.
There are no subsidiaries that are included within both the accounting scope of consolidation and the regulatory scope of consolidation, but where the method of consolidation differs at 31 December 2018.
There are no subsidiaries that are included within the regulatory scope of consolidation but not included within the accounting scope of consolidation at 31 December 2018.
The group operates subsidiaries in a number of countries and territories where capital is governed by local rules, and there may be restrictions on the transfer of regulatory capital and funds between members of the banking group.
The Bank and its banking subsidiaries maintain regulatory reserves to satisfy the provisions of the Banking Ordinance and local regulatory requirements for prudential supervision purposes. At 31 December 2018, the effect of this requirement is to reduce the amount of reserves which can be distributed to shareholders by HK$26,883m.
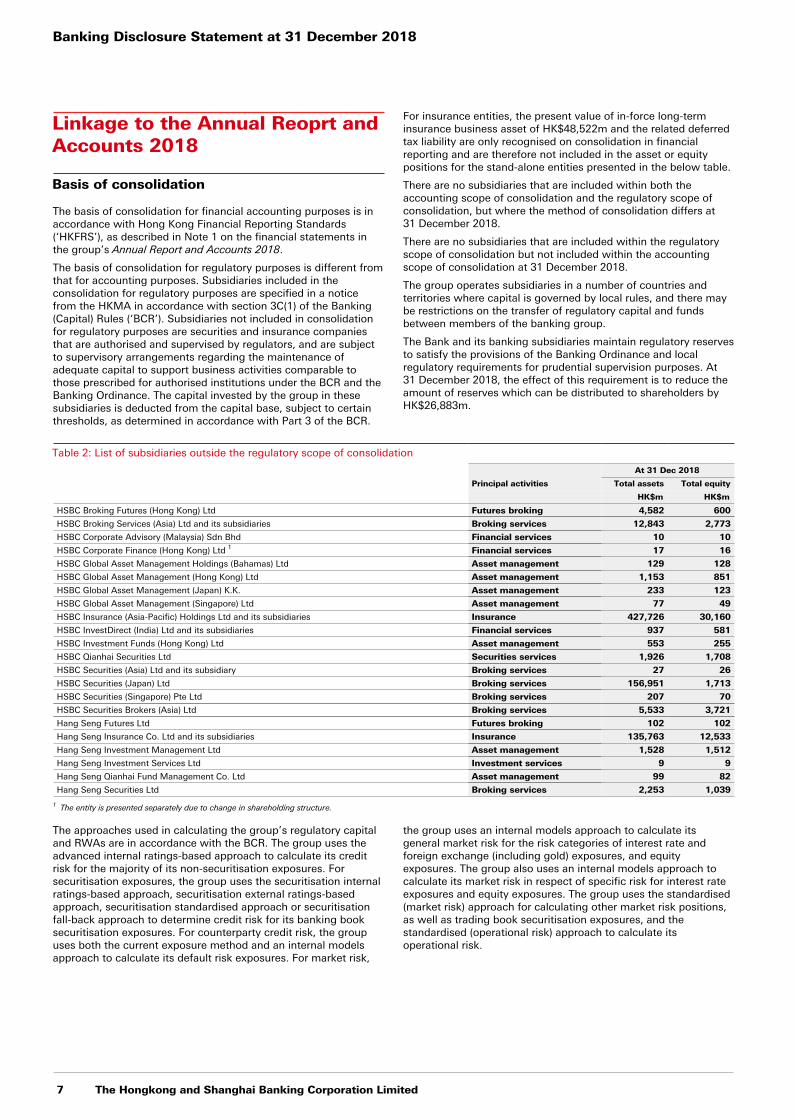
Table 2: List of subsidiaries outside the regulatory scope of consolidation
At 31 Dec 2018
Principal activities Total assets Total equity
HK$m HK$m
HSBC Broking Futures (Hong Kong) Ltd Futures broking 4,582 600
HSBC Broking Services (Asia) Ltd and its subsidiaries Broking services 12,843 2,773
HSBC Corporate Advisory (Malaysia) Sdn Bhd Financial services 10 10
HSBC Corporate Finance (Hong Kong) Ltd 1 Financial services 17 16
HSBC Global Asset Management Holdings (Bahamas) Ltd Asset management 129 128
HSBC Global Asset Management (Hong Kong) Ltd Asset management 1,153 851
HSBC Global Asset Management (Japan) K.K. Asset management 233 123
HSBC Global Asset Management (Singapore) Ltd Asset management 77 49
HSBC Insurance (Asia-Pacific) Holdings Ltd and its subsidiaries Insurance 427,726 30,160
HSBC InvestDirect (India) Ltd and its subsidiaries Financial services 937 581
HSBC Investment Funds (Hong Kong) Ltd Asset management 553 255
HSBC Qianhai Securities Ltd Securities services 1,926 1,708
HSBC Securities (Asia) Ltd and its subsidiary Broking services 27 26
HSBC Securities (Japan) Ltd Broking services 156,951 1,713
HSBC Securities (Singapore) Pte Ltd Broking services 207 70
HSBC Securities Brokers (Asia) Ltd Broking services 5,533 3,721
Hang Seng Futures Ltd Futures broking 102 102
Hang Seng Insurance Co. Ltd and its subsidiaries Insurance 135,763 12,533
Hang Seng Investment Management Ltd Asset management 1,528 1,512
Hang Seng Investment Services Ltd Investment services 9 9
Hang Seng Qianhai Fund Management Co. Ltd Asset management 99 82
Hang Seng Securities Ltd Broking services 2,253 1,039
1 The entity is presented separately due to change in shareholding structure.
The approaches used in calculating the group’s regulatory capital and RWAs are in accordance with the BCR. The group uses the advanced internal ratings-based approach to calculate its credit risk for the majority of its non-securitisation exposures. For securitisation exposures, the group uses the securitisation internal ratings-based approach, securitisation external ratings-based approach, securitisation standardised approach or securitisation fall-back approach to determine credit risk for its banking book securitisation exposures. For counterparty credit risk, the group uses both the current exposure method and an internal models approach to calculate its default risk exposures. For market risk,
the group uses an internal models approach to calculate its general market risk for the risk categories of interest rate and foreign exchange (including gold) exposures, and equity exposures. The group also uses an internal models approach to calculate its market risk in respect of specific risk for interest rate exposures and equity exposures. The group uses the standardised (market risk) approach for calculating other market risk positions, as well as trading book securitisation exposures, and the standardised (operational risk) approach to calculate its operational risk.
The Hongkong and Shanghai Banking Corporation Limited 8
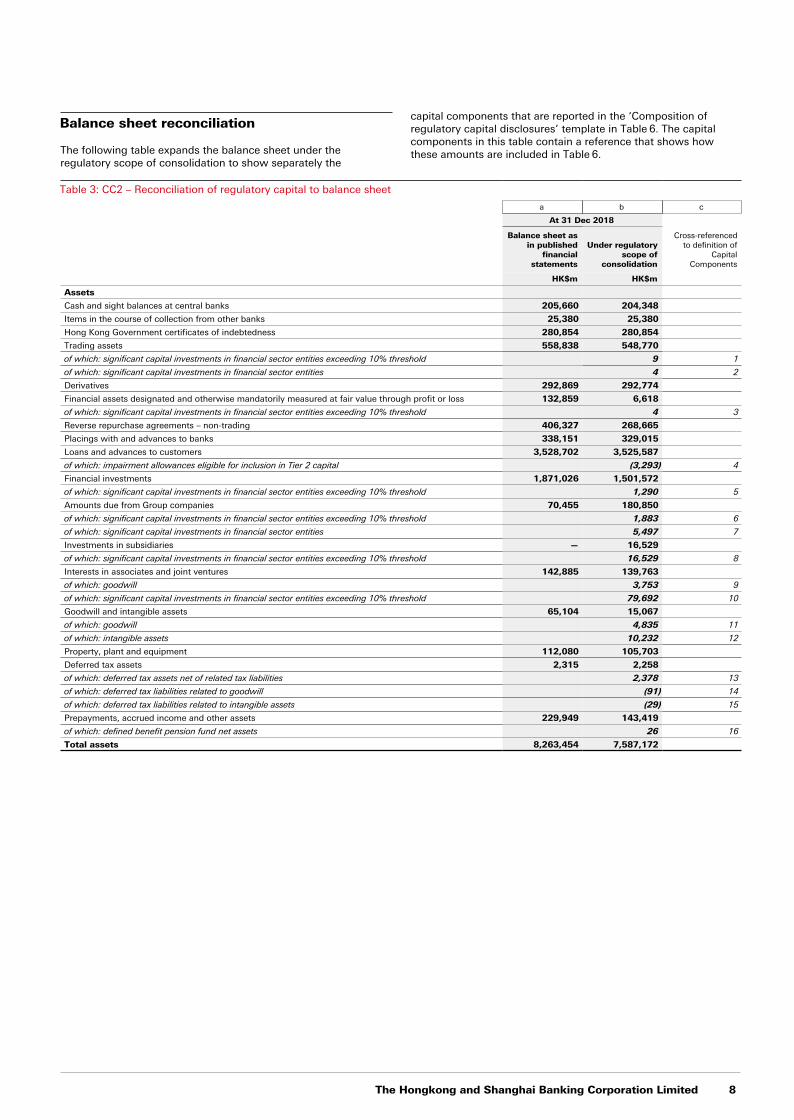
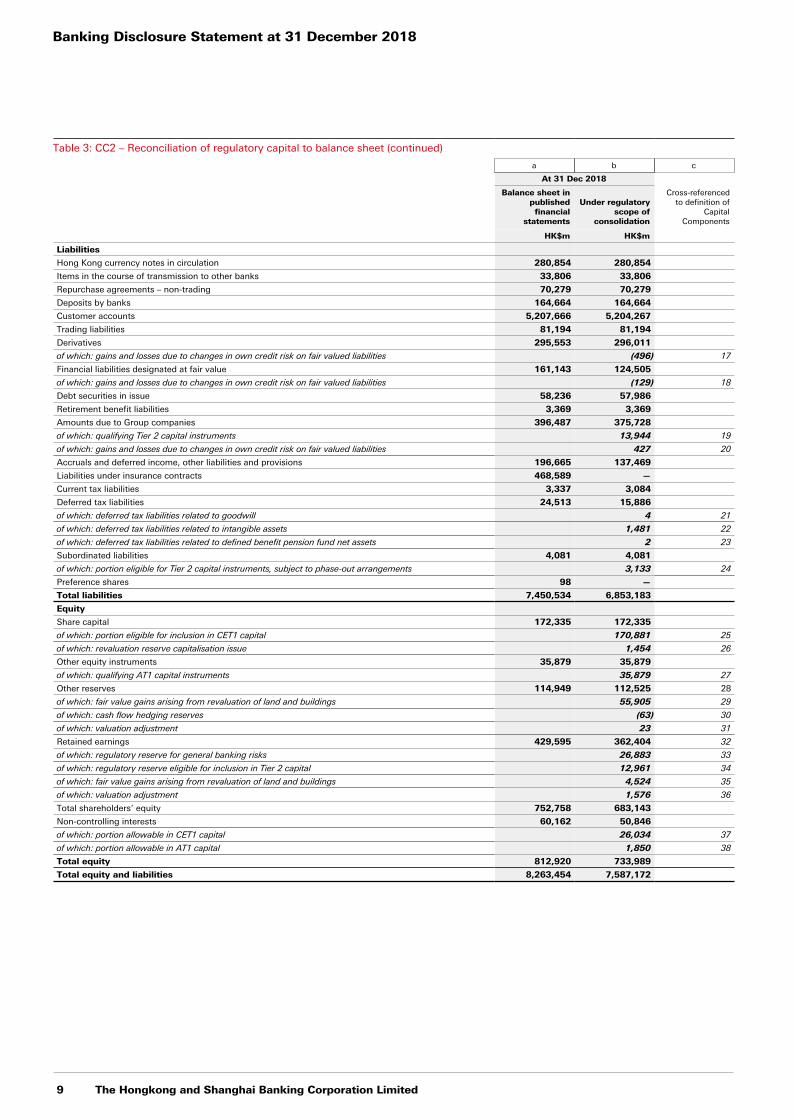
Balance sheet reconciliation
The following table expands the balance sheet under the regulatory scope of consolidation to show separately the
capital components that are reported in the ‘Composition of regulatory capital disclosures’ template in Table 6. The capital components in this table contain a reference that shows how these amounts are included in Table 6.
Table 3: CC2 – Reconciliation of regulatory capital to balance sheet
a b c
At 31 Dec 2018
Balance sheet asin published
financialstatements
Under regulatoryscope of
consolidation
Cross-referencedto definition of
CapitalComponents
HK$m HK$m
Assets
Cash and sight balances at central banks 205,660 204,348
Items in the course of collection from other banks 25,380 25,380
Hong Kong Government certificates of indebtedness 280,854 280,854
Trading assets 558,838 548,770
of which: significant capital investments in financial sector entities exceeding 10% threshold 9 1
of which: significant capital investments in financial sector entities 4 2
Derivatives 292,869 292,774
Financial assets designated and otherwise mandatorily measured at fair value through profit or loss 132,859 6,618
of which: significant capital investments in financial sector entities exceeding 10% threshold 4 3
Reverse repurchase agreements – non-trading 406,327 268,665
Placings with and advances to banks 338,151 329,015
Loans and advances to customers 3,528,702 3,525,587
of which: impairment allowances eligible for inclusion in Tier 2 capital (3,293) 4
Financial investments 1,871,026 1,501,572
of which: significant capital investments in financial sector entities exceeding 10% threshold 1,290 5
Amounts due from Group companies 70,455 180,850
of which: significant capital investments in financial sector entities exceeding 10% threshold 1,883 6
of which: significant capital investments in financial sector entities 5,497 7
Investments in subsidiaries — 16,529
of which: significant capital investments in financial sector entities exceeding 10% threshold 16,529 8
Interests in associates and joint ventures 142,885 139,763
of which: goodwill 3,753 9
of which: significant capital investments in financial sector entities exceeding 10% threshold 79,692 10
Goodwill and intangible assets 65,104 15,067
of which: goodwill 4,835 11
of which: intangible assets 10,232 12
Property, plant and equipment 112,080 105,703
Deferred tax assets 2,315 2,258
of which: deferred tax assets net of related tax liabilities 2,378 13
of which: deferred tax liabilities related to goodwill (91) 14
of which: deferred tax liabilities related to intangible assets (29) 15
Prepayments, accrued income and other assets 229,949 143,419
of which: defined benefit pension fund net assets 26 16
Total assets 8,263,454 7,587,172
Banking Disclosure Statement at 31 December 2018
9 The Hongkong and Shanghai Banking Corporation Limited
Table 3: CC2 – Reconciliation of regulatory capital to balance sheet (continued)
a b c
At 31 Dec 2018
Balance sheet inpublishedfinancial
statements
Under regulatoryscope of
consolidation
Cross-referencedto definition of
CapitalComponents
HK$m HK$m
Liabilities
Hong Kong currency notes in circulation 280,854 280,854
Items in the course of transmission to other banks 33,806 33,806
Repurchase agreements – non-trading 70,279 70,279
Deposits by banks 164,664 164,664
Customer accounts 5,207,666 5,204,267
Trading liabilities 81,194 81,194
Derivatives 295,553 296,011
of which: gains and losses due to changes in own credit risk on fair valued liabilities (496) 17
Financial liabilities designated at fair value 161,143 124,505
of which: gains and losses due to changes in own credit risk on fair valued liabilities (129) 18
Debt securities in issue 58,236 57,986
Retirement benefit liabilities 3,369 3,369
Amounts due to Group companies 396,487 375,728
of which: qualifying Tier 2 capital instruments 13,944 19
of which: gains and losses due to changes in own credit risk on fair valued liabilities 427 20
Accruals and deferred income, other liabilities and provisions 196,665 137,469
Liabilities under insurance contracts 468,589 —
Current tax liabilities 3,337 3,084
Deferred tax liabilities 24,513 15,886
of which: deferred tax liabilities related to goodwill 4 21
of which: deferred tax liabilities related to intangible assets 1,481 22
of which: deferred tax liabilities related to defined benefit pension fund net assets 2 23
Subordinated liabilities 4,081 4,081
of which: portion eligible for Tier 2 capital instruments, subject to phase-out arrangements 3,133 24
Preference shares 98 —
Total liabilities 7,450,534 6,853,183
Equity
Share capital 172,335 172,335
of which: portion eligible for inclusion in CET1 capital 170,881 25
of which: revaluation reserve capitalisation issue 1,454 26
Other equity instruments 35,879 35,879
of which: qualifying AT1 capital instruments 35,879 27
Other reserves 114,949 112,525 28
of which: fair value gains arising from revaluation of land and buildings 55,905 29
of which: cash flow hedging reserves (63) 30
of which: valuation adjustment 23 31
Retained earnings 429,595 362,404 32
of which: regulatory reserve for general banking risks 26,883 33
of which: regulatory reserve eligible for inclusion in Tier 2 capital 12,961 34
of which: fair value gains arising from revaluation of land and buildings 4,524 35
of which: valuation adjustment 1,576 36
Total shareholders’ equity 752,758 683,143
Non-controlling interests 60,162 50,846
of which: portion allowable in CET1 capital 26,034 37
of which: portion allowable in AT1 capital 1,850 38
Total equity 812,920 733,989
Total equity and liabilities 8,263,454 7,587,172
The Hongkong and Shanghai Banking Corporation Limited 10
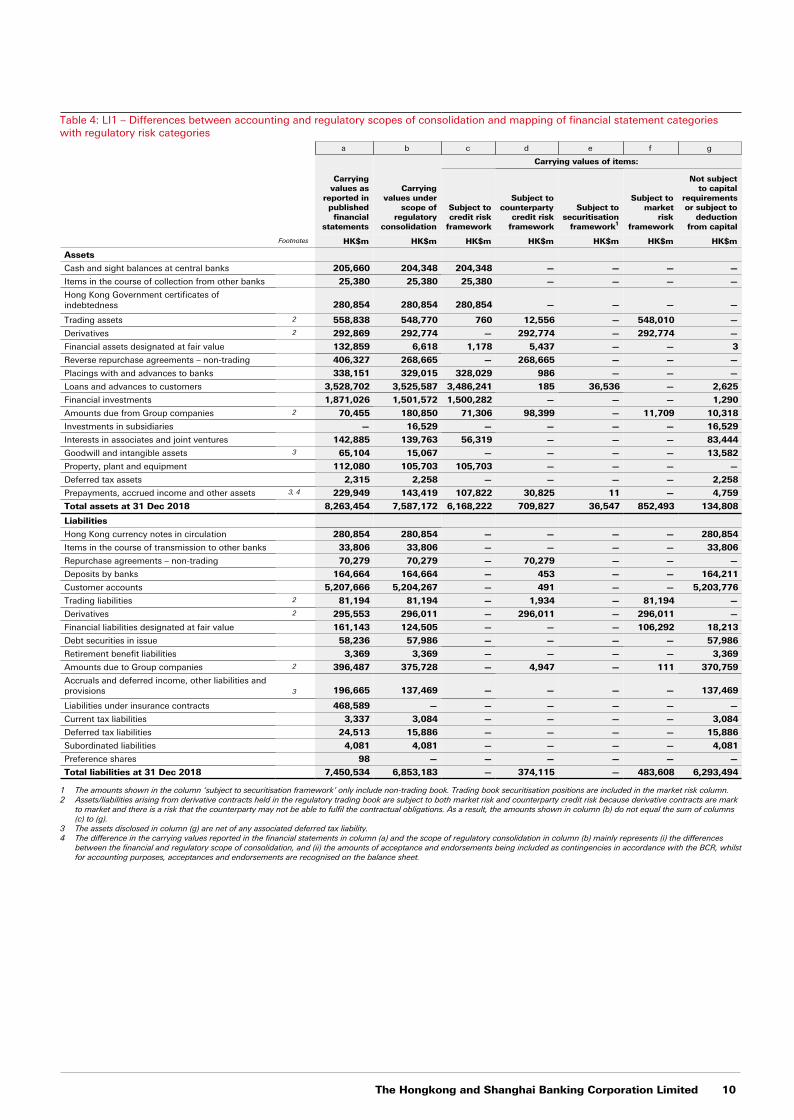
Table 4: LI1 – Differences between accounting and regulatory scopes of consolidation and mapping of financial statement categorieswith regulatory risk categories
a b c d e f g
Carrying values of items:
Carryingvalues as
reported inpublishedfinancial
statements
Carryingvalues under
scope ofregulatory
consolidation
Subject tocredit risk
framework
Subject tocounterparty
credit riskframework
Subject to securitisation
framework1
Subject tomarket
riskframework
Not subjectto capital
requirementsor subject to
deductionfrom capital
Footnotes HK$m HK$m HK$m HK$m HK$m HK$m HK$m
Assets
Cash and sight balances at central banks 205,660 204,348 204,348 — — — —
Items in the course of collection from other banks 25,380 25,380 25,380 — — — —
Hong Kong Government certificates ofindebtedness 280,854 280,854 280,854 — — — —
Trading assets 2 558,838 548,770 760 12,556 — 548,010 —
Derivatives 2 292,869 292,774 — 292,774 — 292,774 —
Financial assets designated at fair value 132,859 6,618 1,178 5,437 — — 3
Reverse repurchase agreements – non-trading 406,327 268,665 — 268,665 — — —
Placings with and advances to banks 338,151 329,015 328,029 986 — — —
Loans and advances to customers 3,528,702 3,525,587 3,486,241 185 36,536 — 2,625
Financial investments 1,871,026 1,501,572 1,500,282 — — — 1,290
Amounts due from Group companies 2 70,455 180,850 71,306 98,399 — 11,709 10,318
Investments in subsidiaries — 16,529 — — — — 16,529
Interests in associates and joint ventures 142,885 139,763 56,319 — — — 83,444
Goodwill and intangible assets 3 65,104 15,067 — — — — 13,582
Property, plant and equipment 112,080 105,703 105,703 — — — —
Deferred tax assets 2,315 2,258 — — — — 2,258
Prepayments, accrued income and other assets 3, 4 229,949 143,419 107,822 30,825 11 — 4,759
Total assets at 31 Dec 2018 8,263,454 7,587,172 6,168,222 709,827 36,547 852,493 134,808
Liabilities
Hong Kong currency notes in circulation 280,854 280,854 — — — — 280,854
Items in the course of transmission to other banks 33,806 33,806 — — — — 33,806
Repurchase agreements – non-trading 70,279 70,279 — 70,279 — — —
Deposits by banks 164,664 164,664 — 453 — — 164,211
Customer accounts 5,207,666 5,204,267 — 491 — — 5,203,776
Trading liabilities 2 81,194 81,194 — 1,934 — 81,194 —
Derivatives 2 295,553 296,011 — 296,011 — 296,011 —
Financial liabilities designated at fair value 161,143 124,505 — — — 106,292 18,213
Debt securities in issue 58,236 57,986 — — — — 57,986
Retirement benefit liabilities 3,369 3,369 — — — — 3,369
Amounts due to Group companies 2 396,487 375,728 — 4,947 — 111 370,759
Accruals and deferred income, other liabilities andprovisions 3 196,665 137,469 — — — — 137,469
Liabilities under insurance contracts 468,589 — — — — — —
Current tax liabilities 3,337 3,084 — — — — 3,084
Deferred tax liabilities 24,513 15,886 — — — — 15,886
Subordinated liabilities 4,081 4,081 — — — — 4,081
Preference shares 98 — — — — — —
Total liabilities at 31 Dec 2018 7,450,534 6,853,183 — 374,115 — 483,608 6,293,494
1 The amounts shown in the column ‘subject to securitisation framework’ only include non-trading book. Trading book securitisation positions are included in the market risk column.2 Assets/liabilities arising from derivative contracts held in the regulatory trading book are subject to both market risk and counterparty credit risk because derivative contracts are mark
to market and there is a risk that the counterparty may not be able to fulfil the contractual obligations. As a result, the amounts shown in column (b) do not equal the sum of columns (c) to (g).
3 The assets disclosed in column (g) are net of any associated deferred tax liability.4 The difference in the carrying values reported in the financial statements in column (a) and the scope of regulatory consolidation in column (b) mainly represents (i) the differences
between the financial and regulatory scope of consolidation, and (ii) the amounts of acceptance and endorsements being included as contingencies in accordance with the BCR, whilst for accounting purposes, acceptances and endorsements are recognised on the balance sheet.
Banking Disclosure Statement at 31 December 2018
11 The Hongkong and Shanghai Banking Corporation Limited
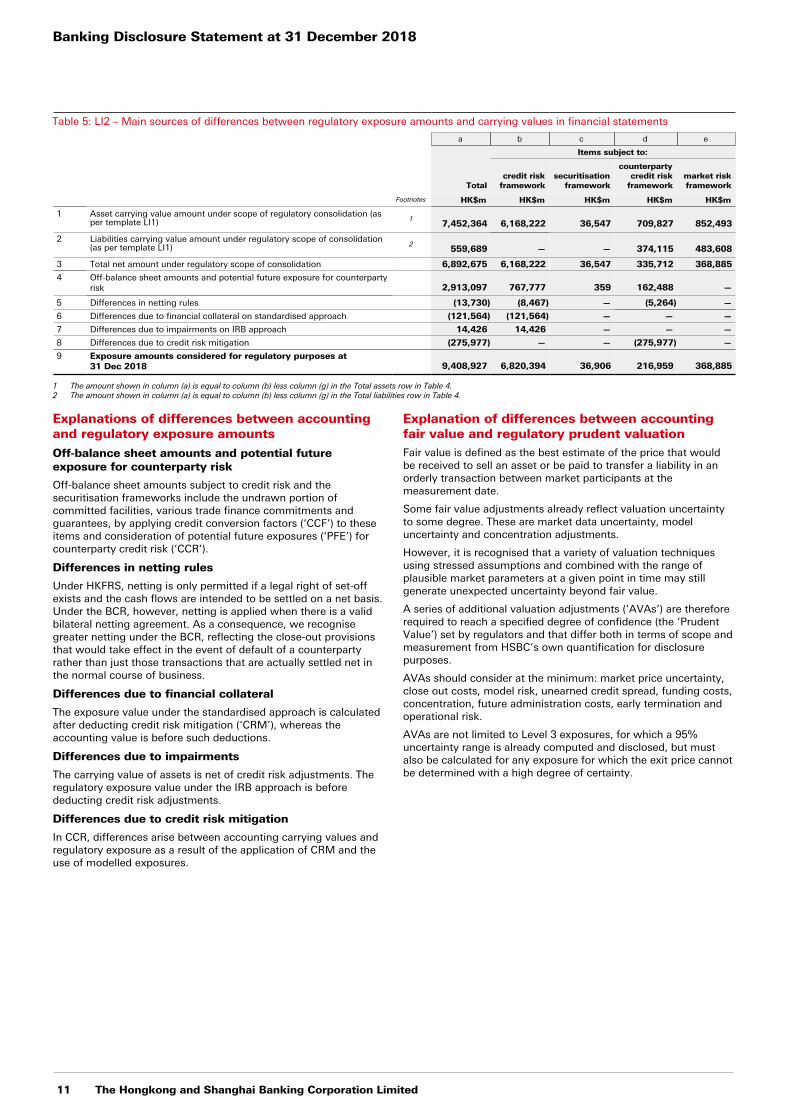
Table 5: LI2 – Main sources of differences between regulatory exposure amounts and carrying values in financial statements
a b c d e
Items subject to:
Totalcredit risk
frameworksecuritisation
framework
counterpartycredit risk
frameworkmarket riskframework
Footnotes HK$m HK$m HK$m HK$m HK$m
1 Asset carrying value amount under scope of regulatory consolidation (as per template LI1) 1
7,452,364 6,168,222 36,547 709,827 852,493
2 Liabilities carrying value amount under regulatory scope of consolidation (as per template LI1) 2
559,689 — — 374,115 483,608
3 Total net amount under regulatory scope of consolidation 6,892,675 6,168,222 36,547 335,712 368,885
4 Off-balance sheet amounts and potential future exposure for counterpartyrisk 2,913,097 767,777 359 162,488 —
5 Differences in netting rules (13,730) (8,467) — (5,264) —
6 Differences due to financial collateral on standardised approach (121,564) (121,564) — — —
7 Differences due to impairments on IRB approach 14,426 14,426 — — —
8 Differences due to credit risk mitigation (275,977) — — (275,977) —
9 Exposure amounts considered for regulatory purposes at31 Dec 2018 9,408,927 6,820,394 36,906 216,959 368,885
1 The amount shown in column (a) is equal to column (b) less column (g) in the Total assets row in Table 4.2 The amount shown in column (a) is equal to column (b) less column (g) in the Total liabilities row in Table 4.
Explanations of differences between accounting and regulatory exposure amountsOff-balance sheet amounts and potential future exposure for counterparty risk
Off-balance sheet amounts subject to credit risk and the securitisation frameworks include the undrawn portion of committed facilities, various trade finance commitments and guarantees, by applying credit conversion factors (‘CCF’) to these items and consideration of potential future exposures (‘PFE’) for counterparty credit risk (‘CCR’).
Differences in netting rules
Under HKFRS, netting is only permitted if a legal right of set-off exists and the cash flows are intended to be settled on a net basis. Under the BCR, however, netting is applied when there is a valid bilateral netting agreement. As a consequence, we recognise greater netting under the BCR, reflecting the close-out provisions that would take effect in the event of default of a counterparty rather than just those transactions that are actually settled net in the normal course of business.
Differences due to financial collateral
The exposure value under the standardised approach is calculated after deducting credit risk mitigation (‘CRM’), whereas the accounting value is before such deductions.
Differences due to impairments
The carrying value of assets is net of credit risk adjustments. The regulatory exposure value under the IRB approach is before deducting credit risk adjustments.
Differences due to credit risk mitigation
In CCR, differences arise between accounting carrying values and regulatory exposure as a result of the application of CRM and the use of modelled exposures.
Explanation of differences between accounting fair value and regulatory prudent valuationFair value is defined as the best estimate of the price that would be received to sell an asset or be paid to transfer a liability in an orderly transaction between market participants at the measurement date.
Some fair value adjustments already reflect valuation uncertainty to some degree. These are market data uncertainty, model uncertainty and concentration adjustments.
However, it is recognised that a variety of valuation techniques using stressed assumptions and combined with the range of plausible market parameters at a given point in time may still generate unexpected uncertainty beyond fair value.
A series of additional valuation adjustments (‘AVAs’) are therefore required to reach a specified degree of confidence (the ‘Prudent Value’) set by regulators and that differ both in terms of scope and measurement from HSBC’s own quantification for disclosure purposes.
AVAs should consider at the minimum: market price uncertainty, close out costs, model risk, unearned credit spread, funding costs, concentration, future administration costs, early termination and operational risk.
AVAs are not limited to Level 3 exposures, for which a 95% uncertainty range is already computed and disclosed, but must also be calculated for any exposure for which the exit price cannot be determined with a high degree of certainty.
The Hongkong and Shanghai Banking Corporation Limited 12
Capital and RWAs
Regulatory capital disclosures
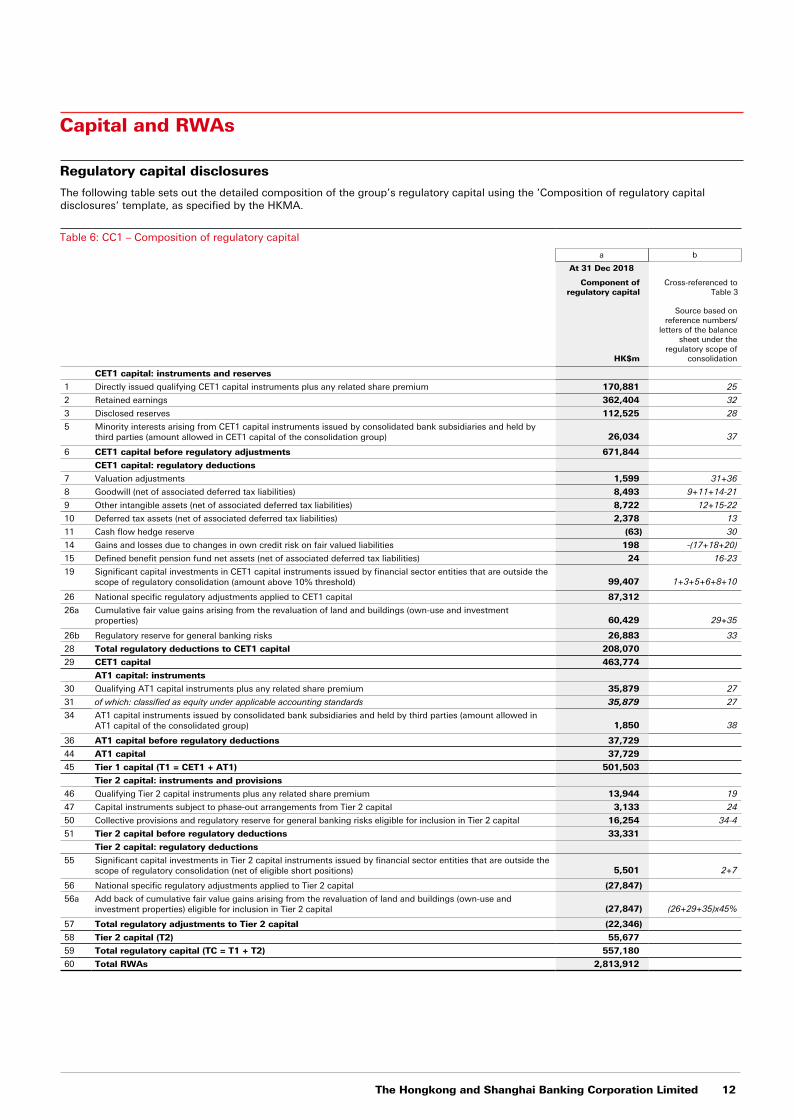
The following table sets out the detailed composition of the group’s regulatory capital using the ‘Composition of regulatory capital disclosures’ template, as specified by the HKMA.
Table 6: CC1 – Composition of regulatory capital
a b
At 31 Dec 2018
Component ofregulatory capital
Cross-referenced toTable 3
HK$m
Source based onreference numbers/
letters of the balancesheet under the
regulatory scope ofconsolidation
CET1 capital: instruments and reserves
1 Directly issued qualifying CET1 capital instruments plus any related share premium 170,881 25
2 Retained earnings 362,404 32
3 Disclosed reserves 112,525 28
5 Minority interests arising from CET1 capital instruments issued by consolidated bank subsidiaries and held by third parties (amount allowed in CET1 capital of the consolidation group) 26,034 37
6 CET1 capital before regulatory adjustments 671,844
CET1 capital: regulatory deductions
7 Valuation adjustments 1,599 31+36
8 Goodwill (net of associated deferred tax liabilities) 8,493 9+11+14-21
9 Other intangible assets (net of associated deferred tax liabilities) 8,722 12+15-22
10 Deferred tax assets (net of associated deferred tax liabilities) 2,378 13
11 Cash flow hedge reserve (63) 30
14 Gains and losses due to changes in own credit risk on fair valued liabilities 198 -(17+18+20)
15 Defined benefit pension fund net assets (net of associated deferred tax liabilities) 24 16-23
19 Significant capital investments in CET1 capital instruments issued by financial sector entities that are outside the scope of regulatory consolidation (amount above 10% threshold) 99,407 1+3+5+6+8+10
26 National specific regulatory adjustments applied to CET1 capital 87,312
26a Cumulative fair value gains arising from the revaluation of land and buildings (own-use and investment properties) 60,429 29+35
26b Regulatory reserve for general banking risks 26,883 33
28 Total regulatory deductions to CET1 capital 208,070
29 CET1 capital 463,774
AT1 capital: instruments
30 Qualifying AT1 capital instruments plus any related share premium 35,879 27
31 of which: classified as equity under applicable accounting standards 35,879 27
34 AT1 capital instruments issued by consolidated bank subsidiaries and held by third parties (amount allowed in AT1 capital of the consolidated group) 1,850 38
36 AT1 capital before regulatory deductions 37,729
44 AT1 capital 37,729
45 Tier 1 capital (T1 = CET1 + AT1) 501,503
Tier 2 capital: instruments and provisions
46 Qualifying Tier 2 capital instruments plus any related share premium 13,944 19
47 Capital instruments subject to phase-out arrangements from Tier 2 capital 3,133 24
50 Collective provisions and regulatory reserve for general banking risks eligible for inclusion in Tier 2 capital 16,254 34-4
51 Tier 2 capital before regulatory deductions 33,331
Tier 2 capital: regulatory deductions
55 Significant capital investments in Tier 2 capital instruments issued by financial sector entities that are outside the scope of regulatory consolidation (net of eligible short positions) 5,501 2+7
56 National specific regulatory adjustments applied to Tier 2 capital (27,847)
56a Add back of cumulative fair value gains arising from the revaluation of land and buildings (own-use and investment properties) eligible for inclusion in Tier 2 capital (27,847) (26+29+35)x45%
57 Total regulatory adjustments to Tier 2 capital (22,346)
58 Tier 2 capital (T2) 55,677
59 Total regulatory capital (TC = T1 + T2) 557,180
60 Total RWAs 2,813,912
Banking Disclosure Statement at 31 December 2018
13 The Hongkong and Shanghai Banking Corporation Limited
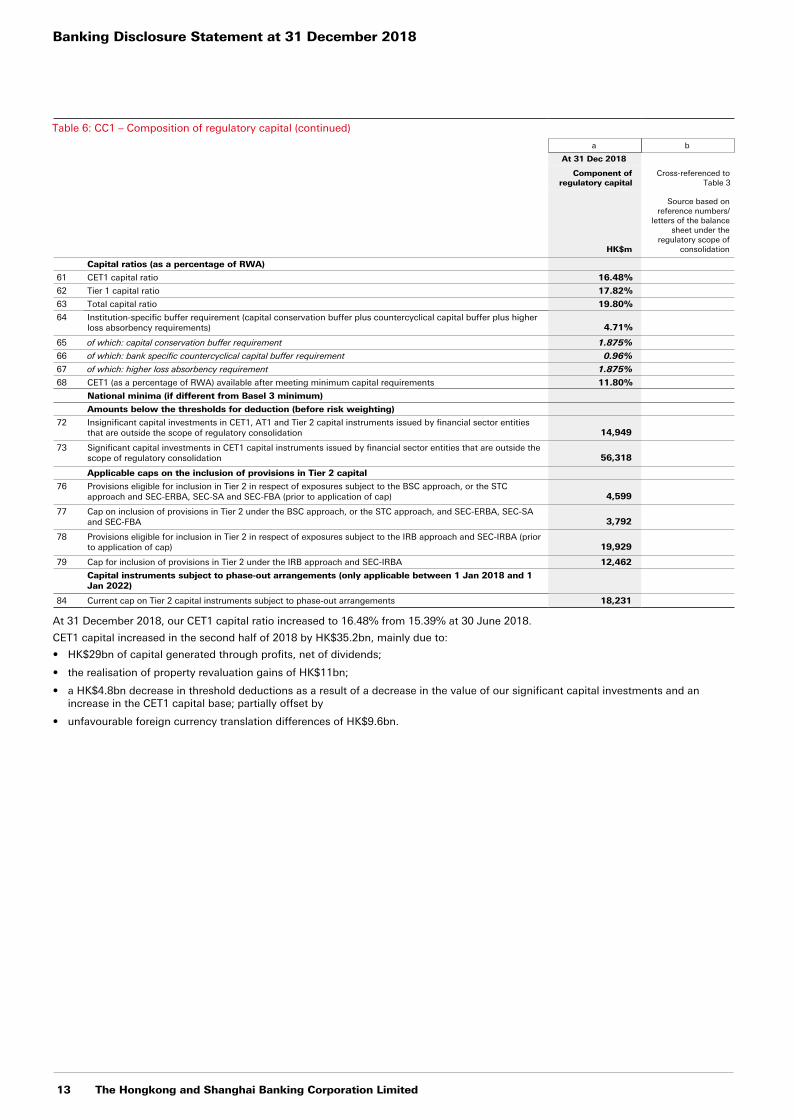
Table 6: CC1 – Composition of regulatory capital (continued)
a b
At 31 Dec 2018
Component ofregulatory capital
Cross-referenced toTable 3
HK$m
Source based onreference numbers/
letters of the balancesheet under the
regulatory scope ofconsolidation
Capital ratios (as a percentage of RWA)
61 CET1 capital ratio 16.48%
62 Tier 1 capital ratio 17.82%
63 Total capital ratio 19.80%
64 Institution-specific buffer requirement (capital conservation buffer plus countercyclical capital buffer plus higher loss absorbency requirements) 4.71%
65 of which: capital conservation buffer requirement 1.875%
66 of which: bank specific countercyclical capital buffer requirement 0.96%
67 of which: higher loss absorbency requirement 1.875%
68 CET1 (as a percentage of RWA) available after meeting minimum capital requirements 11.80%
National minima (if different from Basel 3 minimum)
Amounts below the thresholds for deduction (before risk weighting)
72 Insignificant capital investments in CET1, AT1 and Tier 2 capital instruments issued by financial sector entities that are outside the scope of regulatory consolidation 14,949
73 Significant capital investments in CET1 capital instruments issued by financial sector entities that are outside the scope of regulatory consolidation 56,318
Applicable caps on the inclusion of provisions in Tier 2 capital
76 Provisions eligible for inclusion in Tier 2 in respect of exposures subject to the BSC approach, or the STC approach and SEC-ERBA, SEC-SA and SEC-FBA (prior to application of cap) 4,599
77 Cap on inclusion of provisions in Tier 2 under the BSC approach, or the STC approach, and SEC-ERBA, SEC-SA and SEC-FBA 3,792
78 Provisions eligible for inclusion in Tier 2 in respect of exposures subject to the IRB approach and SEC-IRBA (prior to application of cap) 19,929
79 Cap for inclusion of provisions in Tier 2 under the IRB approach and SEC-IRBA 12,462
Capital instruments subject to phase-out arrangements (only applicable between 1 Jan 2018 and 1Jan 2022)
84 Current cap on Tier 2 capital instruments subject to phase-out arrangements 18,231
At 31 December 2018, our CET1 capital ratio increased to 16.48% from 15.39% at 30 June 2018.
CET1 capital increased in the second half of 2018 by HK$35.2bn, mainly due to:
• HK$29bn of capital generated through profits, net of dividends;
• the realisation of property revaluation gains of HK$11bn;
• a HK$4.8bn decrease in threshold deductions as a result of a decrease in the value of our significant capital investments and an increase in the CET1 capital base; partially offset by
• unfavourable foreign currency translation differences of HK$9.6bn.
The Hongkong and Shanghai Banking Corporation Limited 14
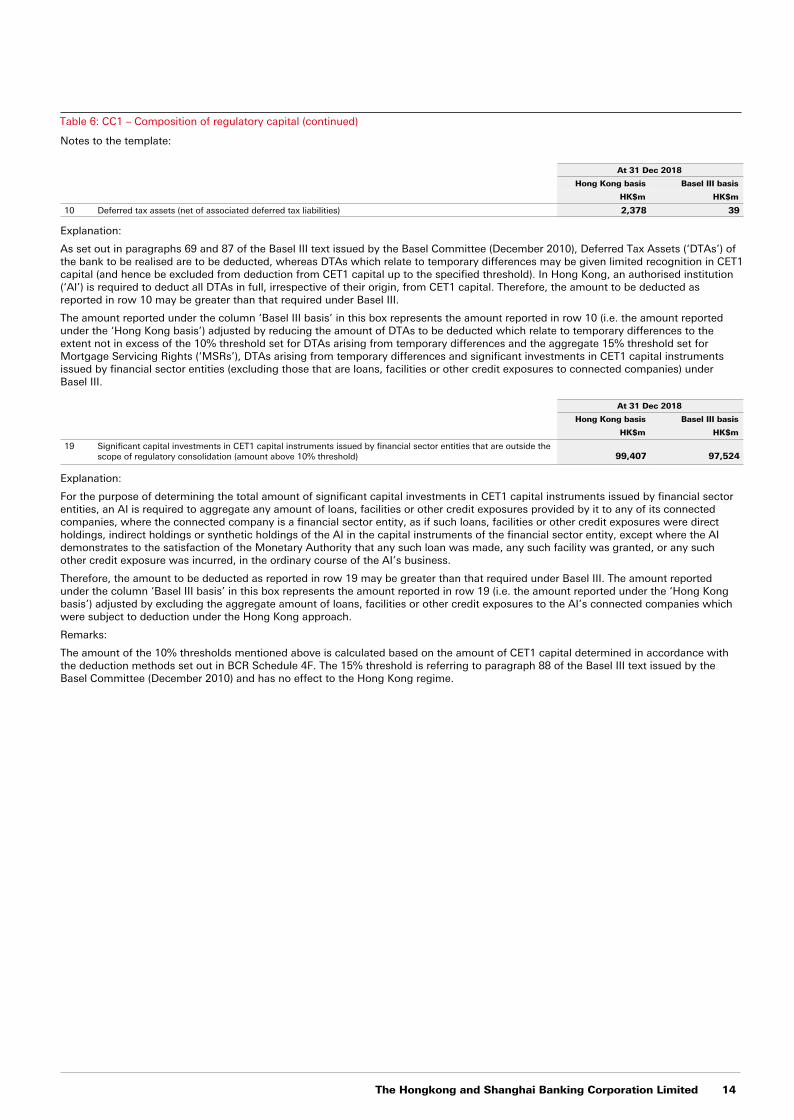
Table 6: CC1 – Composition of regulatory capital (continued)
Notes to the template:
At 31 Dec 2018
Hong Kong basis Basel III basis
HK$m HK$m
10 Deferred tax assets (net of associated deferred tax liabilities) 2,378 39
Explanation:
As set out in paragraphs 69 and 87 of the Basel III text issued by the Basel Committee (December 2010), Deferred Tax Assets (‘DTAs’) of the bank to be realised are to be deducted, whereas DTAs which relate to temporary differences may be given limited recognition in CET1 capital (and hence be excluded from deduction from CET1 capital up to the specified threshold). In Hong Kong, an authorised institution (‘Al’) is required to deduct all DTAs in full, irrespective of their origin, from CET1 capital. Therefore, the amount to be deducted as reported in row 10 may be greater than that required under Basel III.
The amount reported under the column ‘Basel III basis’ in this box represents the amount reported in row 10 (i.e. the amount reported under the ‘Hong Kong basis’) adjusted by reducing the amount of DTAs to be deducted which relate to temporary differences to the extent not in excess of the 10% threshold set for DTAs arising from temporary differences and the aggregate 15% threshold set for Mortgage Servicing Rights (‘MSRs’), DTAs arising from temporary differences and significant investments in CET1 capital instruments issued by financial sector entities (excluding those that are loans, facilities or other credit exposures to connected companies) under Basel III.
At 31 Dec 2018
Hong Kong basis Basel III basis
HK$m HK$m
19 Significant capital investments in CET1 capital instruments issued by financial sector entities that are outside thescope of regulatory consolidation (amount above 10% threshold) 99,407 97,524
Explanation:
For the purpose of determining the total amount of significant capital investments in CET1 capital instruments issued by financial sector entities, an AI is required to aggregate any amount of loans, facilities or other credit exposures provided by it to any of its connected companies, where the connected company is a financial sector entity, as if such loans, facilities or other credit exposures were direct holdings, indirect holdings or synthetic holdings of the AI in the capital instruments of the financial sector entity, except where the AI demonstrates to the satisfaction of the Monetary Authority that any such loan was made, any such facility was granted, or any such other credit exposure was incurred, in the ordinary course of the AI’s business.
Therefore, the amount to be deducted as reported in row 19 may be greater than that required under Basel III. The amount reported under the column ‘Basel III basis’ in this box represents the amount reported in row 19 (i.e. the amount reported under the ‘Hong Kong basis’) adjusted by excluding the aggregate amount of loans, facilities or other credit exposures to the AI’s connected companies which were subject to deduction under the Hong Kong approach.
Remarks:
The amount of the 10% thresholds mentioned above is calculated based on the amount of CET1 capital determined in accordance with the deduction methods set out in BCR Schedule 4F. The 15% threshold is referring to paragraph 88 of the Basel III text issued by the Basel Committee (December 2010) and has no effect to the Hong Kong regime.
Banking Disclosure Statement at 31 December 2018
15 The Hongkong and Shanghai Banking Corporation Limited
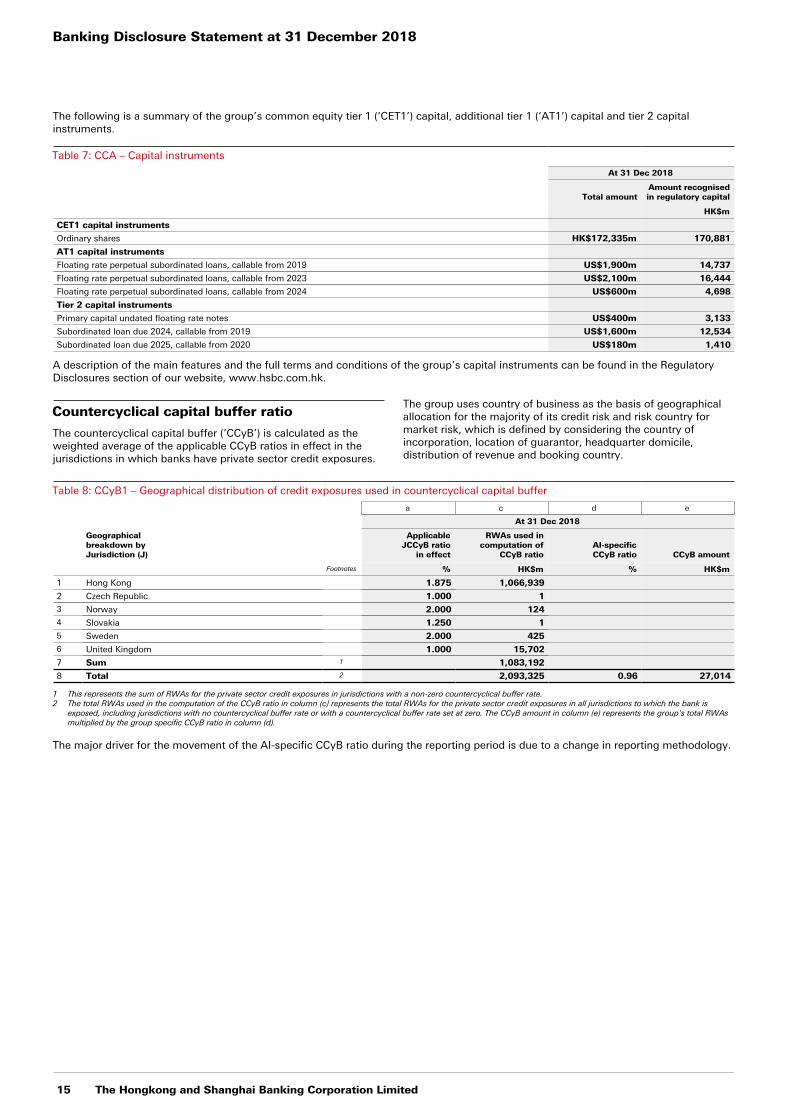
The following is a summary of the group’s common equity tier 1 (‘CET1’) capital, additional tier 1 (‘AT1’) capital and tier 2 capital instruments.
Table 7: CCA – Capital instruments
At 31 Dec 2018
Total amountAmount recognisedin regulatory capital
HK$m
CET1 capital instruments
Ordinary shares HK$172,335m 170,881
AT1 capital instruments
Floating rate perpetual subordinated loans, callable from 2019 US$1,900m 14,737
Floating rate perpetual subordinated loans, callable from 2023 US$2,100m 16,444
Floating rate perpetual subordinated loans, callable from 2024 US$600m 4,698
Tier 2 capital instruments
Primary capital undated floating rate notes US$400m 3,133
Subordinated loan due 2024, callable from 2019 US$1,600m 12,534
Subordinated loan due 2025, callable from 2020 US$180m 1,410
A description of the main features and the full terms and conditions of the group’s capital instruments can be found in the Regulatory Disclosures section of our website, www.hsbc.com.hk.
Countercyclical capital buffer ratio
The countercyclical capital buffer (‘CCyB’) is calculated as the weighted average of the applicable CCyB ratios in effect in the jurisdictions in which banks have private sector credit exposures.
The group uses country of business as the basis of geographical allocation for the majority of its credit risk and risk country for market risk, which is defined by considering the country of incorporation, location of guarantor, headquarter domicile, distribution of revenue and booking country.
Table 8: CCyB1 – Geographical distribution of credit exposures used in countercyclical capital buffer
a c d e
At 31 Dec 2018
Geographical breakdown by Jurisdiction (J)
ApplicableJCCyB ratio
in effect
RWAs used in computation of
CCyB ratioAI-specificCCyB ratio CCyB amount
Footnotes % HK$m % HK$m
1 Hong Kong 1.875 1,066,939
2 Czech Republic 1.000 13 Norway 2.000 1244 Slovakia 1.250 15 Sweden 2.000 4256 United Kingdom 1.000 15,702
7 Sum 1 1,083,192
8 Total 2 2,093,325 0.96 27,014
1 This represents the sum of RWAs for the private sector credit exposures in jurisdictions with a non-zero countercyclical buffer rate.2 The total RWAs used in the computation of the CCyB ratio in column (c) represents the total RWAs for the private sector credit exposures in all jurisdictions to which the bank is
exposed, including jurisdictions with no countercyclical buffer rate or with a countercyclical buffer rate set at zero. The CCyB amount in column (e) represents the group's total RWAs multiplied by the group specific CCyB ratio in column (d).
The major driver for the movement of the AI-specific CCyB ratio during the reporting period is due to a change in reporting methodology.
The Hongkong and Shanghai Banking Corporation Limited 16
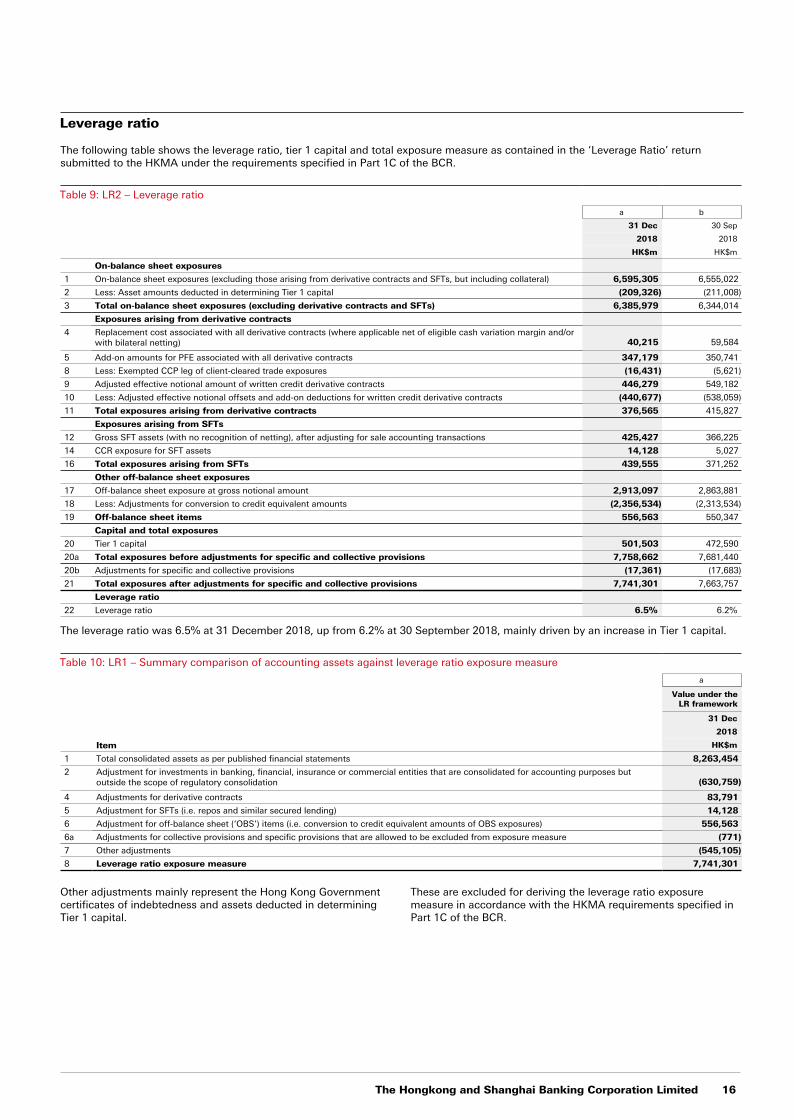
Leverage ratio
The following table shows the leverage ratio, tier 1 capital and total exposure measure as contained in the ‘Leverage Ratio’ return submitted to the HKMA under the requirements specified in Part 1C of the BCR.
Table 9: LR2 – Leverage ratio
a b
31 Dec 30 Sep
2018 2018
HK$m HK$m
On-balance sheet exposures
1 On-balance sheet exposures (excluding those arising from derivative contracts and SFTs, but including collateral) 6,595,305 6,555,022
2 Less: Asset amounts deducted in determining Tier 1 capital (209,326) (211,008)
3 Total on-balance sheet exposures (excluding derivative contracts and SFTs) 6,385,979 6,344,014
Exposures arising from derivative contracts
4 Replacement cost associated with all derivative contracts (where applicable net of eligible cash variation margin and/or with bilateral netting) 40,215 59,584
5 Add-on amounts for PFE associated with all derivative contracts 347,179 350,741
8 Less: Exempted CCP leg of client-cleared trade exposures (16,431) (5,621)
9 Adjusted effective notional amount of written credit derivative contracts 446,279 549,182
10 Less: Adjusted effective notional offsets and add-on deductions for written credit derivative contracts (440,677) (538,059)
11 Total exposures arising from derivative contracts 376,565 415,827
Exposures arising from SFTs
12 Gross SFT assets (with no recognition of netting), after adjusting for sale accounting transactions 425,427 366,225
14 CCR exposure for SFT assets 14,128 5,027
16 Total exposures arising from SFTs 439,555 371,252
Other off-balance sheet exposures
17 Off-balance sheet exposure at gross notional amount 2,913,097 2,863,881
18 Less: Adjustments for conversion to credit equivalent amounts (2,356,534) (2,313,534)
19 Off-balance sheet items 556,563 550,347
Capital and total exposures
20 Tier 1 capital 501,503 472,590
20a Total exposures before adjustments for specific and collective provisions 7,758,662 7,681,440
20b Adjustments for specific and collective provisions (17,361) (17,683)
21 Total exposures after adjustments for specific and collective provisions 7,741,301 7,663,757
Leverage ratio
22 Leverage ratio 6.5% 6.2%
The leverage ratio was 6.5% at 31 December 2018, up from 6.2% at 30 September 2018, mainly driven by an increase in Tier 1 capital.
Table 10: LR1 – Summary comparison of accounting assets against leverage ratio exposure measure
a
Value under theLR framework
31 Dec
2018
Item HK$m
1 Total consolidated assets as per published financial statements 8,263,454
2 Adjustment for investments in banking, financial, insurance or commercial entities that are consolidated for accounting purposes but outside the scope of regulatory consolidation (630,759)
4 Adjustments for derivative contracts 83,791
5 Adjustment for SFTs (i.e. repos and similar secured lending) 14,128
6 Adjustment for off-balance sheet (‘OBS’) items (i.e. conversion to credit equivalent amounts of OBS exposures) 556,563
6a Adjustments for collective provisions and specific provisions that are allowed to be excluded from exposure measure (771)
7 Other adjustments (545,105)
8 Leverage ratio exposure measure 7,741,301
Other adjustments mainly represent the Hong Kong Government certificates of indebtedness and assets deducted in determining Tier 1 capital.
These are excluded for deriving the leverage ratio exposure measure in accordance with the HKMA requirements specified in Part 1C of the BCR.
Banking Disclosure Statement at 31 December 2018
17 The Hongkong and Shanghai Banking Corporation Limited
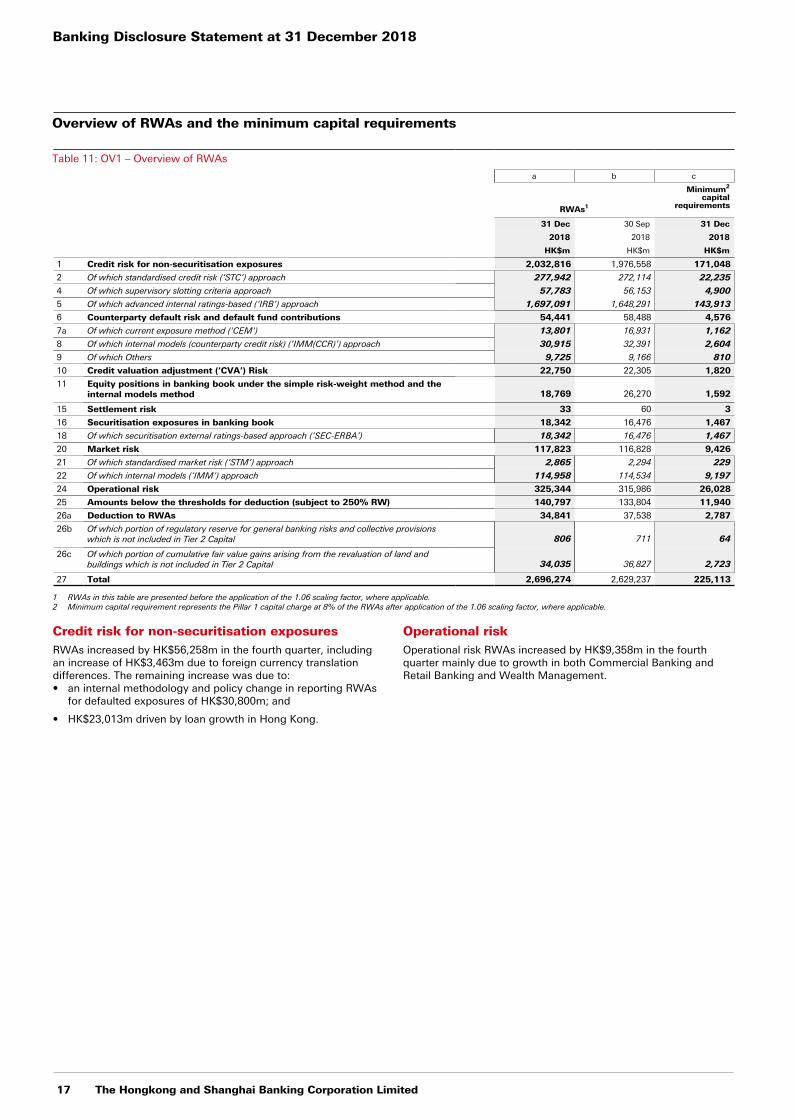
Overview of RWAs and the minimum capital requirements
Table 11: OV1 – Overview of RWAs
a b c
RWAs1
Minimum2
capital requirements
31 Dec 30 Sep 31 Dec
2018 2018 2018
HK$m HK$m HK$m
1 Credit risk for non-securitisation exposures 2,032,816 1,976,558 171,048
2 Of which standardised credit risk (‘STC’) approach 277,942 272,114 22,235
4 Of which supervisory slotting criteria approach 57,783 56,153 4,900
5 Of which advanced internal ratings-based (‘IRB’) approach 1,697,091 1,648,291 143,913
6 Counterparty default risk and default fund contributions 54,441 58,488 4,576
7a Of which current exposure method ('CEM') 13,801 16,931 1,162
8 Of which internal models (counterparty credit risk) (‘IMM(CCR)’) approach 30,915 32,391 2,604
9 Of which Others 9,725 9,166 810
10 Credit valuation adjustment (‘CVA’) Risk 22,750 22,305 1,820
11 Equity positions in banking book under the simple risk-weight method and theinternal models method 18,769 26,270 1,592
15 Settlement risk 33 60 3
16 Securitisation exposures in banking book 18,342 16,476 1,467
18 Of which securitisation external ratings-based approach (‘SEC-ERBA’) 18,342 16,476 1,467
20 Market risk 117,823 116,828 9,426
21 Of which standardised market risk (‘STM’) approach 2,865 2,294 229
22 Of which internal models (‘IMM’) approach 114,958 114,534 9,197
24 Operational risk 325,344 315,986 26,028
25 Amounts below the thresholds for deduction (subject to 250% RW) 140,797 133,804 11,940
26a Deduction to RWAs 34,841 37,538 2,787
26b Of which portion of regulatory reserve for general banking risks and collective provisionswhich is not included in Tier 2 Capital 806 711 64
26c Of which portion of cumulative fair value gains arising from the revaluation of land andbuildings which is not included in Tier 2 Capital 34,035 36,827 2,723
27 Total 2,696,274 2,629,237 225,113
1 RWAs in this table are presented before the application of the 1.06 scaling factor, where applicable.2 Minimum capital requirement represents the Pillar 1 capital charge at 8% of the RWAs after application of the 1.06 scaling factor, where applicable.
Credit risk for non-securitisation exposuresRWAs increased by HK$56,258m in the fourth quarter, including an increase of HK$3,463m due to foreign currency translation differences. The remaining increase was due to:• an internal methodology and policy change in reporting RWAs
for defaulted exposures of HK$30,800m; and
• HK$23,013m driven by loan growth in Hong Kong.
Operational riskOperational risk RWAs increased by HK$9,358m in the fourth quarter mainly due to growth in both Commercial Banking and Retail Banking and Wealth Management.
The Hongkong and Shanghai Banking Corporation Limited 18
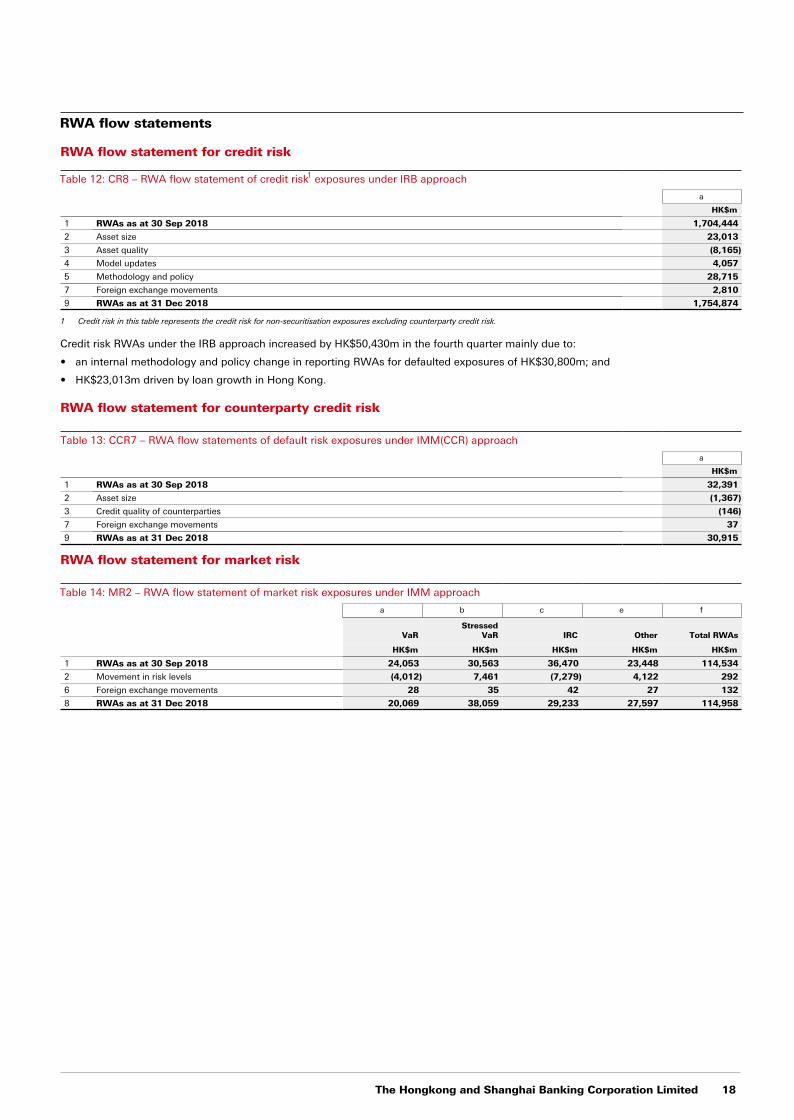
RWA flow statements
RWA flow statement for credit risk
Table 12: CR8 – RWA flow statement of credit risk1 exposures under IRB approach
a
HK$m
1 RWAs as at 30 Sep 2018 1,704,444
2 Asset size 23,013
3 Asset quality (8,165)
4 Model updates 4,057
5 Methodology and policy 28,715
7 Foreign exchange movements 2,810
9 RWAs as at 31 Dec 2018 1,754,874
1 Credit risk in this table represents the credit risk for non-securitisation exposures excluding counterparty credit risk.
Credit risk RWAs under the IRB approach increased by HK$50,430m in the fourth quarter mainly due to:
• an internal methodology and policy change in reporting RWAs for defaulted exposures of HK$30,800m; and
• HK$23,013m driven by loan growth in Hong Kong.
RWA flow statement for counterparty credit risk
Table 13: CCR7 – RWA flow statements of default risk exposures under IMM(CCR) approach
a
HK$m
1 RWAs as at 30 Sep 2018 32,391
2 Asset size (1,367)
3 Credit quality of counterparties (146)
7 Foreign exchange movements 37
9 RWAs as at 31 Dec 2018 30,915
RWA flow statement for market risk
Table 14: MR2 – RWA flow statement of market risk exposures under IMM approach
a b c e f
VaRStressed
VaR IRC Other Total RWAs
HK$m HK$m HK$m HK$m HK$m
1 RWAs as at 30 Sep 2018 24,053 30,563 36,470 23,448 114,534
2 Movement in risk levels (4,012) 7,461 (7,279) 4,122 292
6 Foreign exchange movements 28 35 42 27 132
8 RWAs as at 31 Dec 2018 20,069 38,059 29,233 27,597 114,958
Banking Disclosure Statement at 31 December 2018
19 The Hongkong and Shanghai Banking Corporation Limited
Credit risk
Credit risk management
Credit risk represents our largest regulatory capital requirement. The principal objectives of our credit risk management function are:
• to maintain across HSBC a strong culture of responsible lending and a robust credit risk policy and control framework;
• to both partner and challenge our businesses in defining, implementing and continually re-evaluating our credit risk appetite under actual and stress scenario conditions; and
• to ensure there is independent, expert scrutiny of credit risks, their costs and their mitigation.
The credit risk functions within Wholesale Credit and Market Risk and RBWM are the constituent parts of the group's Risk functions that support the group's Chief Risk Officer in overseeing credit risks. Their major duties comprise undertaking independent review of large and high-risk credit proposals, overseeing large exposure policy and reporting on our wholesale and retail credit risk management disciplines, owning our credit policy and credit system programmes, overseeing portfolio management and reporting on risk matters to senior executive management and to regulators.
These credit risk functions work closely with other parts of the group's Risk function; for example, with Operational Risk on the internal control framework and with Risk Strategy on the risk appetite process. In addition, they work jointly with Risk Strategy and Finance on stress testing.
The credit responsibilities of the group's Risk function are described on page 18 of the group's Annual Report and Accounts 2018.
Within the group, the credit risk functions comprise a network of credit risk management offices reporting within their respective local wholesale and retail credit risk functions, which in turn report to their relevant risk functions at group level. They fulfil an essential role as independent risk control units distinct from business line management in providing objective scrutiny of risk rating assessments, credit proposals for approval and other risk matters.
Credit risk operates through a hierarchy of personal credit limit approval authorities. Operating company chief executives, acting under authorities delegated by their boards and Group standards, are accountable for credit risk and other risks in their business. In turn, chief executives delegate authority to operating company chief risk officers and management teams on an individual basis. Each operating company is responsible for the quality and performance of its credit portfolios in accordance with Group standards. Above these thresholds of delegated personal credit limited approval authorities, approval must be sought from the regional and, as appropriate, global credit risk function.
Credit risk managementOur exposures to credit risk arise from a wide range of customer and product types, and the risk rating systems in place to measure and monitor these risks are correspondingly diverse. Senior management receives a variety of reports on our credit risk exposures including loan impairments, total exposures and RWAs, as well as updates on specific portfolios that are considered to have heightened credit risk.
Credit risk exposures are generally measured and managed in portfolios of either customer types or product categories. Risk rating systems are designed to assess the default propensity of, and loss severity associated with, distinct customers who are typically managed as individual relationships or, in the case of retail business exposures, on a product portfolio basis.
Risk rating systems for retail exposures are generally quantitative in nature, applying techniques such as behavioural analysis across product portfolios comprising large numbers of homogeneous transactions. Rating systems for individually managed relationships typically use customer financial statements and market data analysis, but also qualitative elements and a final subjective overlay to better reflect any idiosyncratic elements of the customer’s risk profile. See ‘Credit risk under internal ratings-based approach' on pages 23 to 26.
A fundamental principle of our policy and approach is that analytical risk rating systems and scorecards are all valuable tools at the disposal of management.
The credit process provides for at least an annual review of facility limits granted. Review may be more frequent, as required by circumstances such as the emergence of adverse risk factors.
We constantly seek to improve the quality of our risk management. IT systems that process credit risk data continue to be enhanced in order to deliver both comprehensive management information in support of business strategy and solutions to evolving regulatory reporting requirements.
Group standards govern the process through which risk rating systems are initially developed, judged fit for purpose, approved and implemented. They also govern the conditions under which analytical risk model outcomes can be overridden by decision-takers and the process of model performance monitoring and reporting. The emphasis is on an effective dialogue between business line and risk management, suitable independence of decision-takers, and a good understanding and robust challenge on the part of senior management.
Like other facets of risk management, analytical risk rating systems are not static; they are subject to review and modification in light of the changing environment, the greater availability and quality of data, and any deficiencies identified through internal and external regulatory review. Structured processes and metrics are in place to capture relevant data and feed this into continuous model improvement. See ‘Model performance’ on page 33.
Credit risk models governanceModel governance is under the general oversight of the group Wholesale Model Oversight Committee (‘WMOC’) and Retail Banking and Wealth Management Risk MOC (‘RMOC’) and is described more fully on page 23.
Credit quality of assetsWe are a universal bank with a conservative approach to credit risk. This is reflected in our credit risk profile being diversified across a number of asset classes and geographies with a credit quality profile mainly concentrated in the higher quality bands.
The Hongkong and Shanghai Banking Corporation Limited 20
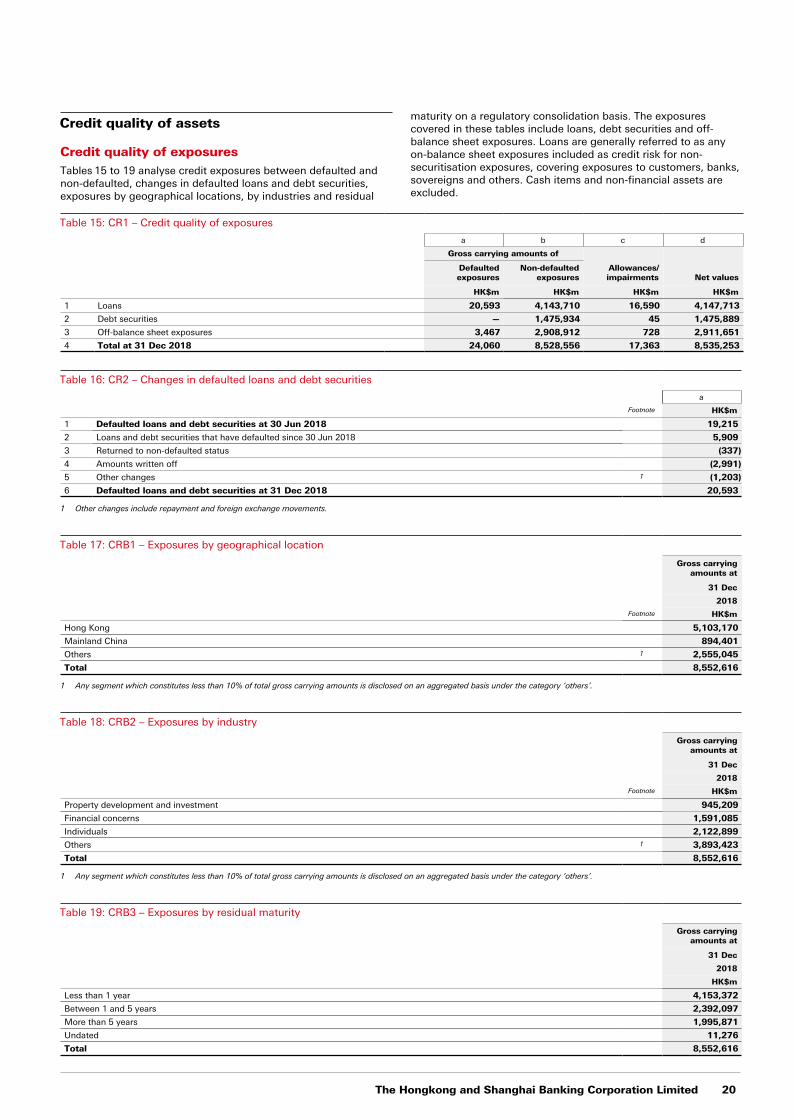
Credit quality of assets
Credit quality of exposuresTables 15 to 19 analyse credit exposures between defaulted and non-defaulted, changes in defaulted loans and debt securities, exposures by geographical locations, by industries and residual
maturity on a regulatory consolidation basis. The exposures covered in these tables include loans, debt securities and off-balance sheet exposures. Loans are generally referred to as any on-balance sheet exposures included as credit risk for non-securitisation exposures, covering exposures to customers, banks, sovereigns and others. Cash items and non-financial assets are excluded.
Table 15: CR1 – Credit quality of exposures
a b c d
Gross carrying amounts of
Allowances/impairments Net values
Defaultedexposures
Non-defaultedexposures
HK$m HK$m HK$m HK$m
1 Loans 20,593 4,143,710 16,590 4,147,713
2 Debt securities — 1,475,934 45 1,475,889
3 Off-balance sheet exposures 3,467 2,908,912 728 2,911,651
4 Total at 31 Dec 2018 24,060 8,528,556 17,363 8,535,253
Table 16: CR2 – Changes in defaulted loans and debt securities
a
Footnote HK$m
1 Defaulted loans and debt securities at 30 Jun 2018 19,215
2 Loans and debt securities that have defaulted since 30 Jun 2018 5,909
3 Returned to non-defaulted status (337)
4 Amounts written off (2,991)
5 Other changes 1 (1,203)
6 Defaulted loans and debt securities at 31 Dec 2018 20,593
1 Other changes include repayment and foreign exchange movements.
Table 17: CRB1 – Exposures by geographical location
Gross carryingamounts at
31 Dec
2018
Footnote HK$m
Hong Kong 5,103,170
Mainland China 894,401
Others 1 2,555,045
Total 8,552,616
1 Any segment which constitutes less than 10% of total gross carrying amounts is disclosed on an aggregated basis under the category ‘others’.
Table 18: CRB2 – Exposures by industry
Gross carryingamounts at
31 Dec
2018
Footnote HK$m
Property development and investment 945,209
Financial concerns 1,591,085
Individuals 2,122,899
Others 1 3,893,423
Total 8,552,616
1 Any segment which constitutes less than 10% of total gross carrying amounts is disclosed on an aggregated basis under the category ‘others’.
Table 19: CRB3 – Exposures by residual maturity
Gross carryingamounts at
31 Dec
2018
HK$m
Less than 1 year 4,153,372
Between 1 and 5 years 2,392,097
More than 5 years 1,995,871
Undated 11,276
Total 8,552,616
Banking Disclosure Statement at 31 December 2018
21 The Hongkong and Shanghai Banking Corporation Limited
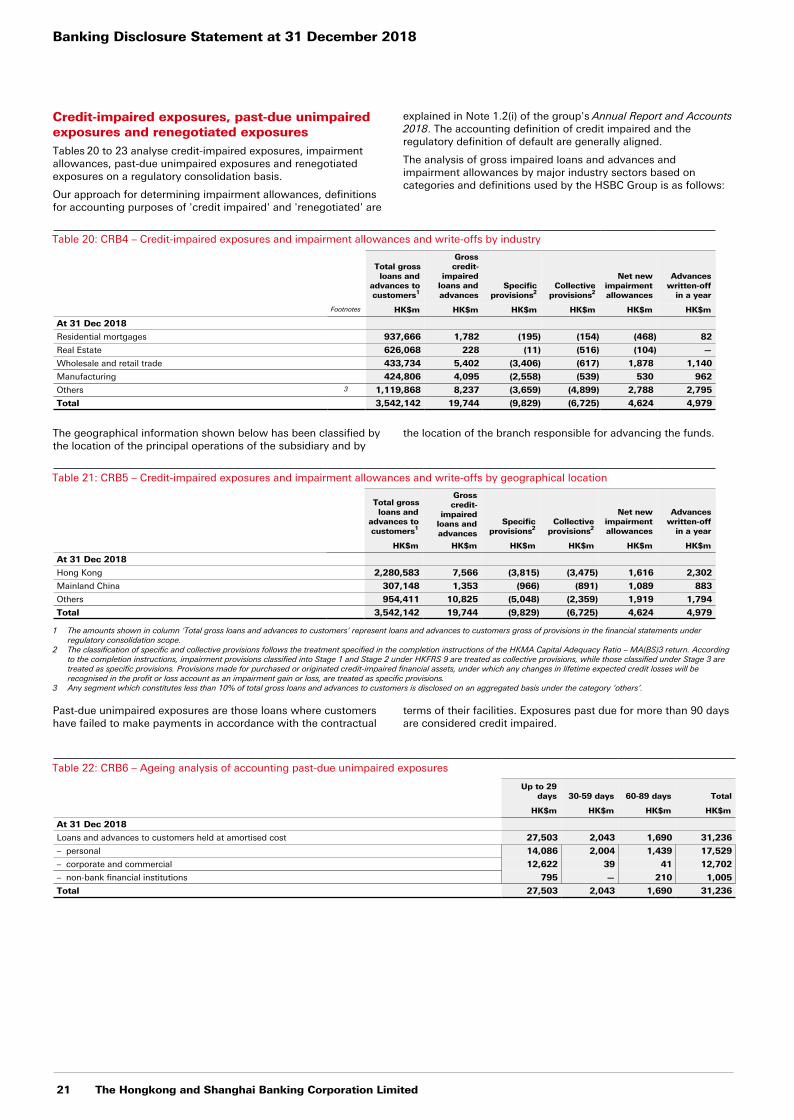
Credit-impaired exposures, past-due unimpaired exposures and renegotiated exposures Tables 20 to 23 analyse credit-impaired exposures, impairment allowances, past-due unimpaired exposures and renegotiated exposures on a regulatory consolidation basis.
Our approach for determining impairment allowances, definitions for accounting purposes of 'credit impaired' and 'renegotiated' are
explained in Note 1.2(i) of the group's Annual Report and Accounts 2018. The accounting definition of credit impaired and the regulatory definition of default are generally aligned.
The analysis of gross impaired loans and advances and impairment allowances by major industry sectors based on categories and definitions used by the HSBC Group is as follows:
Table 20: CRB4 – Credit-impaired exposures and impairment allowances and write-offs by industry
Total gross loans and
advances to customers1
Grosscredit-
impairedloans andadvances
Specific provisions2
Collective provisions2
Net newimpairmentallowances
Advanceswritten-off
in a year
Footnotes HK$m HK$m HK$m HK$m HK$m HK$m
At 31 Dec 2018
Residential mortgages 937,666 1,782 (195) (154) (468) 82
Real Estate 626,068 228 (11) (516) (104) —
Wholesale and retail trade 433,734 5,402 (3,406) (617) 1,878 1,140
Manufacturing 424,806 4,095 (2,558) (539) 530 962
Others 3 1,119,868 8,237 (3,659) (4,899) 2,788 2,795
Total 3,542,142 19,744 (9,829) (6,725) 4,624 4,979
The geographical information shown below has been classified by the location of the principal operations of the subsidiary and by
the location of the branch responsible for advancing the funds.
Table 21: CRB5 – Credit-impaired exposures and impairment allowances and write-offs by geographical location
Total gross loans and
advances to customers1
Grosscredit-
impairedloans andadvances
Specific provisions2
Collective provisions2
Net newimpairmentallowances
Advanceswritten-off
in a year
HK$m HK$m HK$m HK$m HK$m HK$m
At 31 Dec 2018
Hong Kong 2,280,583 7,566 (3,815) (3,475) 1,616 2,302
Mainland China 307,148 1,353 (966) (891) 1,089 883
Others 954,411 10,825 (5,048) (2,359) 1,919 1,794
Total 3,542,142 19,744 (9,829) (6,725) 4,624 4,979
1 The amounts shown in column 'Total gross loans and advances to customers' represent loans and advances to customers gross of provisions in the financial statements under regulatory consolidation scope.
2 The classification of specific and collective provisions follows the treatment specified in the completion instructions of the HKMA Capital Adequacy Ratio – MA(BS)3 return. According to the completion instructions, impairment provisions classified into Stage 1 and Stage 2 under HKFRS 9 are treated as collective provisions, while those classified under Stage 3 are treated as specific provisions. Provisions made for purchased or originated credit-impaired financial assets, under which any changes in lifetime expected credit losses will be recognised in the profit or loss account as an impairment gain or loss, are treated as specific provisions.
3 Any segment which constitutes less than 10% of total gross loans and advances to customers is disclosed on an aggregated basis under the category ‘others’.
Past-due unimpaired exposures are those loans where customers have failed to make payments in accordance with the contractual
terms of their facilities. Exposures past due for more than 90 days are considered credit impaired.
Table 22: CRB6 – Ageing analysis of accounting past-due unimpaired exposures
Up to 29days 30-59 days 60-89 days Total
HK$m HK$m HK$m HK$m
At 31 Dec 2018
Loans and advances to customers held at amortised cost 27,503 2,043 1,690 31,236
– personal 14,086 2,004 1,439 17,529
– corporate and commercial 12,622 39 41 12,702
– non-bank financial institutions 795 — 210 1,005
Total 27,503 2,043 1,690 31,236
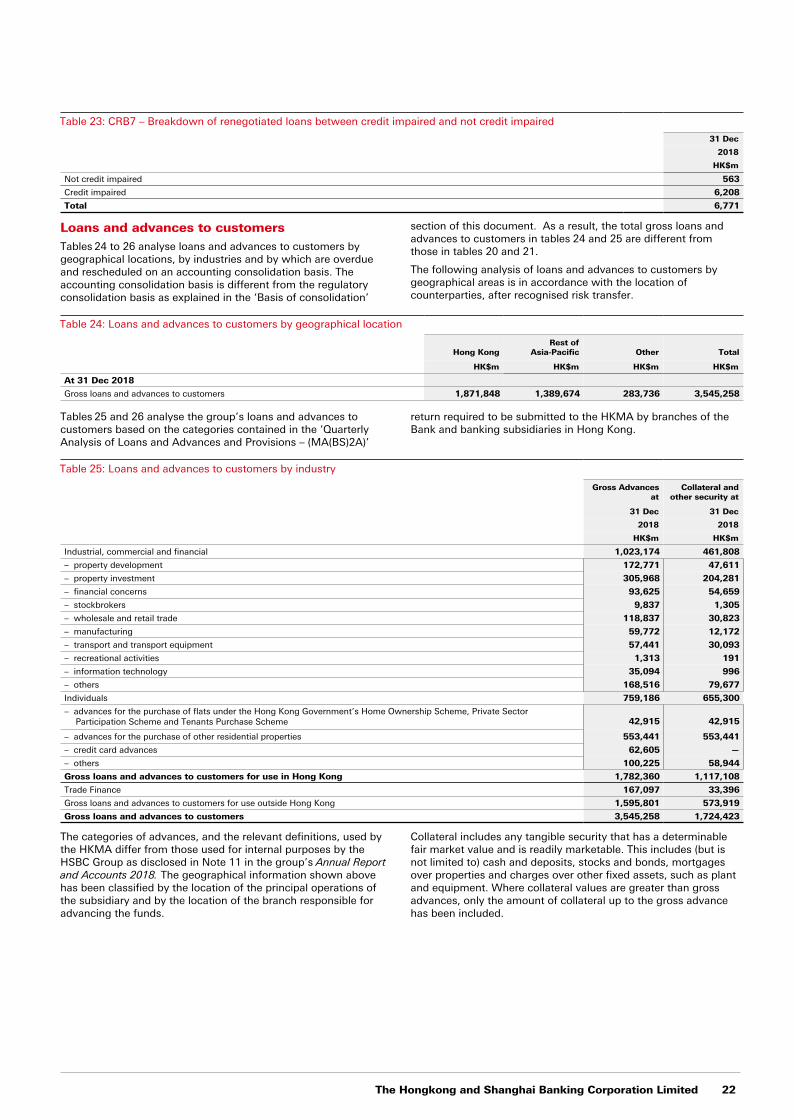
The Hongkong and Shanghai Banking Corporation Limited 22
Table 23: CRB7 – Breakdown of renegotiated loans between credit impaired and not credit impaired
31 Dec
2018
HK$m
Not credit impaired 563
Credit impaired 6,208
Total 6,771
Loans and advances to customersTables 24 to 26 analyse loans and advances to customers by geographical locations, by industries and by which are overdue and rescheduled on an accounting consolidation basis. The accounting consolidation basis is different from the regulatory consolidation basis as explained in the ‘Basis of consolidation’
section of this document. As a result, the total gross loans and advances to customers in tables 24 and 25 are different from those in tables 20 and 21.
The following analysis of loans and advances to customers by geographical areas is in accordance with the location of counterparties, after recognised risk transfer.
Table 24: Loans and advances to customers by geographical location
Hong KongRest of
Asia-Pacific Other Total
HK$m HK$m HK$m HK$m
At 31 Dec 2018
Gross loans and advances to customers 1,871,848 1,389,674 283,736 3,545,258
Tables 25 and 26 analyse the group’s loans and advances to customers based on the categories contained in the ‘Quarterly Analysis of Loans and Advances and Provisions – (MA(BS)2A)’
return required to be submitted to the HKMA by branches of the Bank and banking subsidiaries in Hong Kong.
Table 25: Loans and advances to customers by industry
Gross Advancesat
Collateral andother security at
31 Dec 31 Dec
2018 2018
HK$m HK$m
Industrial, commercial and financial 1,023,174 461,808
– property development 172,771 47,611
– property investment 305,968 204,281
– financial concerns 93,625 54,659
– stockbrokers 9,837 1,305
– wholesale and retail trade 118,837 30,823
– manufacturing 59,772 12,172
– transport and transport equipment 57,441 30,093
– recreational activities 1,313 191
– information technology 35,094 996
– others 168,516 79,677
Individuals 759,186 655,300
– advances for the purchase of flats under the Hong Kong Government’s Home Ownership Scheme, Private SectorParticipation Scheme and Tenants Purchase Scheme 42,915 42,915
– advances for the purchase of other residential properties 553,441 553,441
– credit card advances 62,605 —
– others 100,225 58,944
Gross loans and advances to customers for use in Hong Kong 1,782,360 1,117,108
Trade Finance 167,097 33,396
Gross loans and advances to customers for use outside Hong Kong 1,595,801 573,919
Gross loans and advances to customers 3,545,258 1,724,423
The categories of advances, and the relevant definitions, used by the HKMA differ from those used for internal purposes by the HSBC Group as disclosed in Note 11 in the group’s Annual Report and Accounts 2018. The geographical information shown above has been classified by the location of the principal operations of the subsidiary and by the location of the branch responsible for advancing the funds.
Collateral includes any tangible security that has a determinable fair market value and is readily marketable. This includes (but is not limited to) cash and deposits, stocks and bonds, mortgages over properties and charges over other fixed assets, such as plant and equipment. Where collateral values are greater than gross advances, only the amount of collateral up to the gross advance has been included.
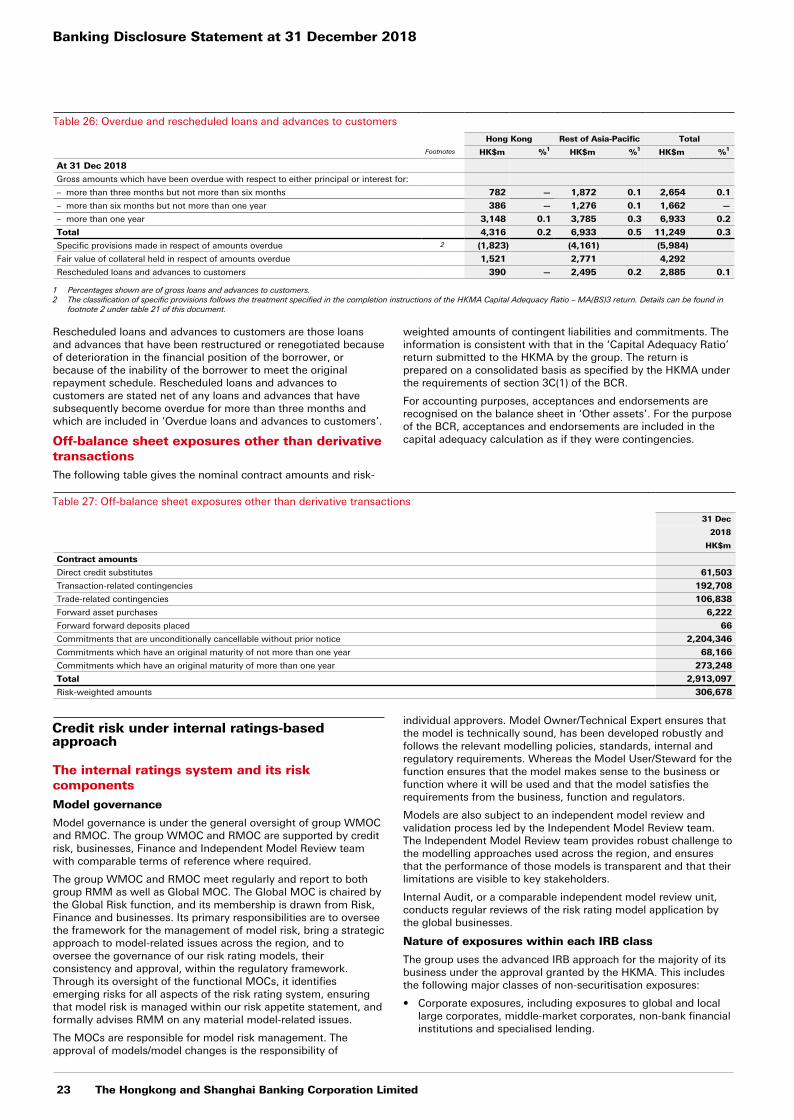
Banking Disclosure Statement at 31 December 2018
23 The Hongkong and Shanghai Banking Corporation Limited
Table 26: Overdue and rescheduled loans and advances to customers
Hong Kong Rest of Asia-Pacific Total
Footnotes HK$m %1 HK$m %1 HK$m %1
At 31 Dec 2018
Gross amounts which have been overdue with respect to either principal or interest for:
– more than three months but not more than six months 782 — 1,872 0.1 2,654 0.1
– more than six months but not more than one year 386 — 1,276 0.1 1,662 —
– more than one year 3,148 0.1 3,785 0.3 6,933 0.2
Total 4,316 0.2 6,933 0.5 11,249 0.3
Specific provisions made in respect of amounts overdue 2 (1,823) (4,161) (5,984)
Fair value of collateral held in respect of amounts overdue 1,521 2,771 4,292
Rescheduled loans and advances to customers 390 — 2,495 0.2 2,885 0.1
1 Percentages shown are of gross loans and advances to customers.2 The classification of specific provisions follows the treatment specified in the completion instructions of the HKMA Capital Adequacy Ratio – MA(BS)3 return. Details can be found in
footnote 2 under table 21 of this document.
Rescheduled loans and advances to customers are those loans and advances that have been restructured or renegotiated because of deterioration in the financial position of the borrower, or because of the inability of the borrower to meet the original repayment schedule. Rescheduled loans and advances to customers are stated net of any loans and advances that have subsequently become overdue for more than three months and which are included in ‘Overdue loans and advances to customers’.
Off-balance sheet exposures other than derivative transactionsThe following table gives the nominal contract amounts and risk-
weighted amounts of contingent liabilities and commitments. The information is consistent with that in the ‘Capital Adequacy Ratio’ return submitted to the HKMA by the group. The return is prepared on a consolidated basis as specified by the HKMA under the requirements of section 3C(1) of the BCR.
For accounting purposes, acceptances and endorsements are recognised on the balance sheet in ‘Other assets’. For the purpose of the BCR, acceptances and endorsements are included in the capital adequacy calculation as if they were contingencies.
Table 27: Off-balance sheet exposures other than derivative transactions
31 Dec
2018
HK$m
Contract amounts
Direct credit substitutes 61,503
Transaction-related contingencies 192,708
Trade-related contingencies 106,838
Forward asset purchases 6,222
Forward forward deposits placed 66
Commitments that are unconditionally cancellable without prior notice 2,204,346
Commitments which have an original maturity of not more than one year 68,166
Commitments which have an original maturity of more than one year 273,248
Total 2,913,097
Risk-weighted amounts 306,678
Credit risk under internal ratings-basedapproach
The internal ratings system and its risk componentsModel governance
Model governance is under the general oversight of group WMOC and RMOC. The group WMOC and RMOC are supported by credit risk, businesses, Finance and Independent Model Review team with comparable terms of reference where required.
The group WMOC and RMOC meet regularly and report to both group RMM as well as Global MOC. The Global MOC is chaired by the Global Risk function, and its membership is drawn from Risk, Finance and businesses. Its primary responsibilities are to oversee the framework for the management of model risk, bring a strategic approach to model-related issues across the region, and to oversee the governance of our risk rating models, their consistency and approval, within the regulatory framework. Through its oversight of the functional MOCs, it identifies emerging risks for all aspects of the risk rating system, ensuring that model risk is managed within our risk appetite statement, and formally advises RMM on any material model-related issues.
The MOCs are responsible for model risk management. The approval of models/model changes is the responsibility of
individual approvers. Model Owner/Technical Expert ensures that the model is technically sound, has been developed robustly and follows the relevant modelling policies, standards, internal and regulatory requirements. Whereas the Model User/Steward for the function ensures that the model makes sense to the business or function where it will be used and that the model satisfies the requirements from the business, function and regulators.
Models are also subject to an independent model review and validation process led by the Independent Model Review team. The Independent Model Review team provides robust challenge to the modelling approaches used across the region, and ensures that the performance of those models is transparent and that their limitations are visible to key stakeholders.
Internal Audit, or a comparable independent model review unit, conducts regular reviews of the risk rating model application by the global businesses.
Nature of exposures within each IRB class
The group uses the advanced IRB approach for the majority of its business under the approval granted by the HKMA. This includes the following major classes of non-securitisation exposures:
• Corporate exposures, including exposures to global and local large corporates, middle-market corporates, non-bank financial institutions and specialised lending.
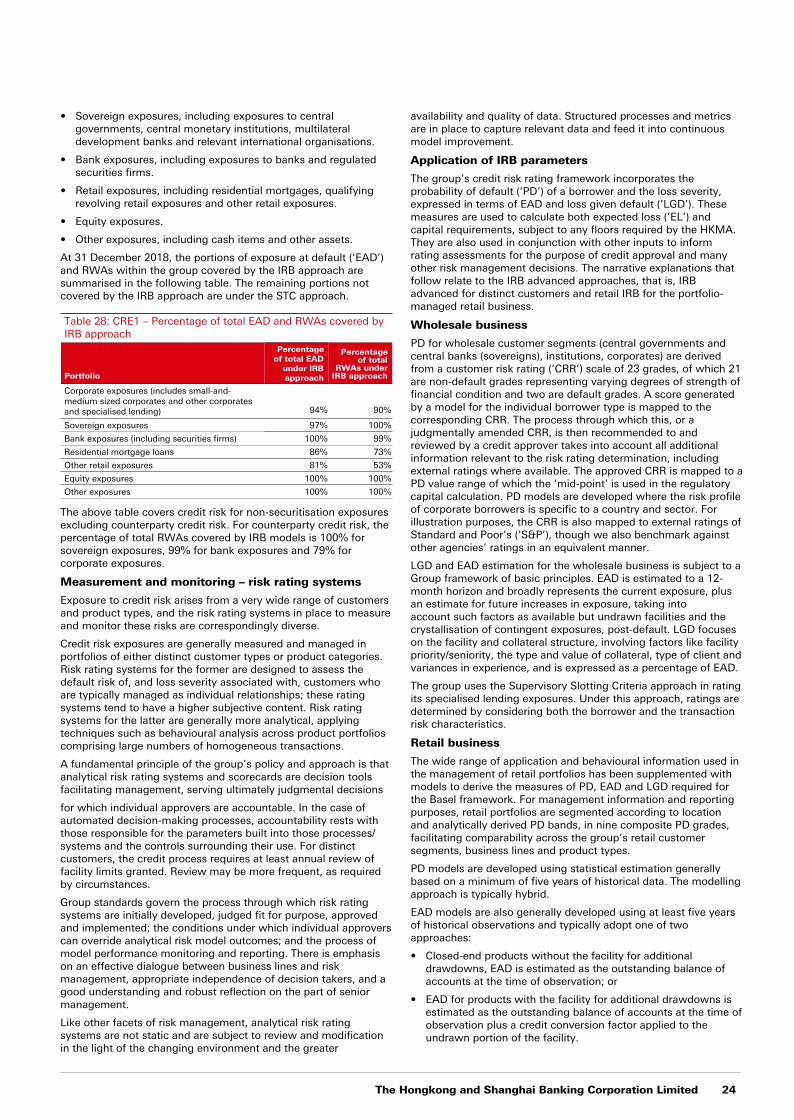
The Hongkong and Shanghai Banking Corporation Limited 24
• Sovereign exposures, including exposures to central governments, central monetary institutions, multilateral development banks and relevant international organisations.
• Bank exposures, including exposures to banks and regulated securities firms.
• Retail exposures, including residential mortgages, qualifying revolving retail exposures and other retail exposures.
• Equity exposures.
• Other exposures, including cash items and other assets.
At 31 December 2018, the portions of exposure at default (‘EAD’) and RWAs within the group covered by the IRB approach are summarised in the following table. The remaining portions not covered by the IRB approach are under the STC approach.
Table 28: CRE1 – Percentage of total EAD and RWAs covered byIRB approach
Portfolio
Percentageof total EAD
under IRBapproach
Percentageof total
RWAs underIRB approach
Corporate exposures (includes small-and-medium sized corporates and other corporatesand specialised lending) 94% 90%
Sovereign exposures 97% 100%
Bank exposures (including securities firms) 100% 99%
Residential mortgage loans 86% 73%
Other retail exposures 81% 53%
Equity exposures 100% 100%
Other exposures 100% 100%
The above table covers credit risk for non-securitisation exposures excluding counterparty credit risk. For counterparty credit risk, the percentage of total RWAs covered by IRB models is 100% for sovereign exposures, 99% for bank exposures and 79% for corporate exposures.
Measurement and monitoring – risk rating systems
Exposure to credit risk arises from a very wide range of customers and product types, and the risk rating systems in place to measure and monitor these risks are correspondingly diverse.
Credit risk exposures are generally measured and managed in portfolios of either distinct customer types or product categories. Risk rating systems for the former are designed to assess the default risk of, and loss severity associated with, customers who are typically managed as individual relationships; these rating systems tend to have a higher subjective content. Risk rating systems for the latter are generally more analytical, applying techniques such as behavioural analysis across product portfolios comprising large numbers of homogeneous transactions.
A fundamental principle of the group’s policy and approach is that analytical risk rating systems and scorecards are decision tools facilitating management, serving ultimately judgmental decisions
for which individual approvers are accountable. In the case of automated decision-making processes, accountability rests with those responsible for the parameters built into those processes/systems and the controls surrounding their use. For distinct customers, the credit process requires at least annual review of facility limits granted. Review may be more frequent, as required by circumstances.
Group standards govern the process through which risk rating systems are initially developed, judged fit for purpose, approved and implemented; the conditions under which individual approvers can override analytical risk model outcomes; and the process of model performance monitoring and reporting. There is emphasis on an effective dialogue between business lines and risk management, appropriate independence of decision takers, and a good understanding and robust reflection on the part of senior management.
Like other facets of risk management, analytical risk rating systems are not static and are subject to review and modification in the light of the changing environment and the greater
availability and quality of data. Structured processes and metrics are in place to capture relevant data and feed it into continuous model improvement.
Application of IRB parameters
The group’s credit risk rating framework incorporates the probability of default (‘PD’) of a borrower and the loss severity, expressed in terms of EAD and loss given default (‘LGD’). These measures are used to calculate both expected loss (‘EL’) and capital requirements, subject to any floors required by the HKMA. They are also used in conjunction with other inputs to inform rating assessments for the purpose of credit approval and many other risk management decisions. The narrative explanations that follow relate to the IRB advanced approaches, that is, IRB advanced for distinct customers and retail IRB for the portfolio-managed retail business.
Wholesale business
PD for wholesale customer segments (central governments and central banks (sovereigns), institutions, corporates) are derived from a customer risk rating (‘CRR’) scale of 23 grades, of which 21 are non-default grades representing varying degrees of strength of financial condition and two are default grades. A score generated by a model for the individual borrower type is mapped to the corresponding CRR. The process through which this, or a judgmentally amended CRR, is then recommended to and reviewed by a credit approver takes into account all additional information relevant to the risk rating determination, including external ratings where available. The approved CRR is mapped to a PD value range of which the ‘mid-point’ is used in the regulatory capital calculation. PD models are developed where the risk profile of corporate borrowers is specific to a country and sector. For illustration purposes, the CRR is also mapped to external ratings of Standard and Poor’s (‘S&P’), though we also benchmark against other agencies’ ratings in an equivalent manner.
LGD and EAD estimation for the wholesale business is subject to a Group framework of basic principles. EAD is estimated to a 12-month horizon and broadly represents the current exposure, plus an estimate for future increases in exposure, taking into account such factors as available but undrawn facilities and the crystallisation of contingent exposures, post-default. LGD focuses on the facility and collateral structure, involving factors like facility priority/seniority, the type and value of collateral, type of client and variances in experience, and is expressed as a percentage of EAD.
The group uses the Supervisory Slotting Criteria approach in rating its specialised lending exposures. Under this approach, ratings are determined by considering both the borrower and the transaction risk characteristics.
Retail business
The wide range of application and behavioural information used in the management of retail portfolios has been supplemented with models to derive the measures of PD, EAD and LGD required for the Basel framework. For management information and reporting purposes, retail portfolios are segmented according to location and analytically derived PD bands, in nine composite PD grades, facilitating comparability across the group’s retail customer segments, business lines and product types.
PD models are developed using statistical estimation generally based on a minimum of five years of historical data. The modelling approach is typically hybrid.
EAD models are also generally developed using at least five years of historical observations and typically adopt one of two approaches:
• Closed-end products without the facility for additional drawdowns, EAD is estimated as the outstanding balance of accounts at the time of observation; or
• EAD for products with the facility for additional drawdowns is estimated as the outstanding balance of accounts at the time of observation plus a credit conversion factor applied to the undrawn portion of the facility.
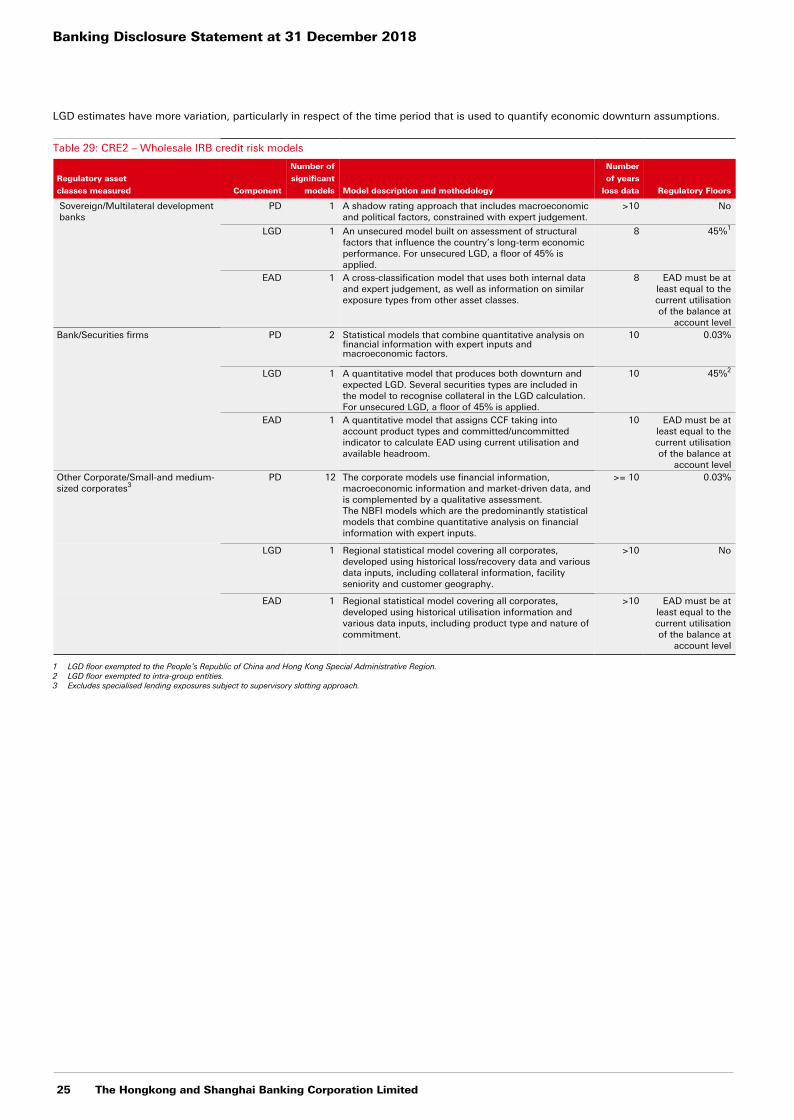
Banking Disclosure Statement at 31 December 2018
25 The Hongkong and Shanghai Banking Corporation Limited
LGD estimates have more variation, particularly in respect of the time period that is used to quantify economic downturn assumptions.
Table 29: CRE2 – Wholesale IRB credit risk models
Regulatory asset
classes measured Component
Number of
significant
models Model description and methodology
Number
of years
loss data Regulatory Floors
Sovereign/Multilateral development banks
PD 1 A shadow rating approach that includes macroeconomicand political factors, constrained with expert judgement.
>10 No
LGD 1 An unsecured model built on assessment of structuralfactors that influence the country’s long-term economicperformance. For unsecured LGD, a floor of 45% isapplied.
8 45%1
EAD 1 A cross-classification model that uses both internal dataand expert judgement, as well as information on similarexposure types from other asset classes.
8 EAD must be atleast equal to thecurrent utilisationof the balance at
account levelBank/Securities firms PD 2 Statistical models that combine quantitative analysis on
financial information with expert inputs andmacroeconomic factors.
10 0.03%
LGD 1 A quantitative model that produces both downturn andexpected LGD. Several securities types are included inthe model to recognise collateral in the LGD calculation.For unsecured LGD, a floor of 45% is applied.
10 45%2
EAD 1 A quantitative model that assigns CCF taking intoaccount product types and committed/uncommittedindicator to calculate EAD using current utilisation andavailable headroom.
10 EAD must be atleast equal to thecurrent utilisationof the balance at
account levelOther Corporate/Small-and medium-sized corporates3
PD 12 The corporate models use financial information, macroeconomic information and market-driven data, and is complemented by a qualitative assessment. The NBFI models which are the predominantly statistical models that combine quantitative analysis on financial information with expert inputs.
>= 10 0.03%
LGD 1 Regional statistical model covering all corporates,developed using historical loss/recovery data and variousdata inputs, including collateral information, facilityseniority and customer geography.
>10 No
EAD 1 Regional statistical model covering all corporates,developed using historical utilisation information andvarious data inputs, including product type and nature ofcommitment.
>10 EAD must be atleast equal to thecurrent utilisationof the balance at
account level
1 LGD floor exempted to the People’s Republic of China and Hong Kong Special Administrative Region.2 LGD floor exempted to intra-group entities.3 Excludes specialised lending exposures subject to supervisory slotting approach.
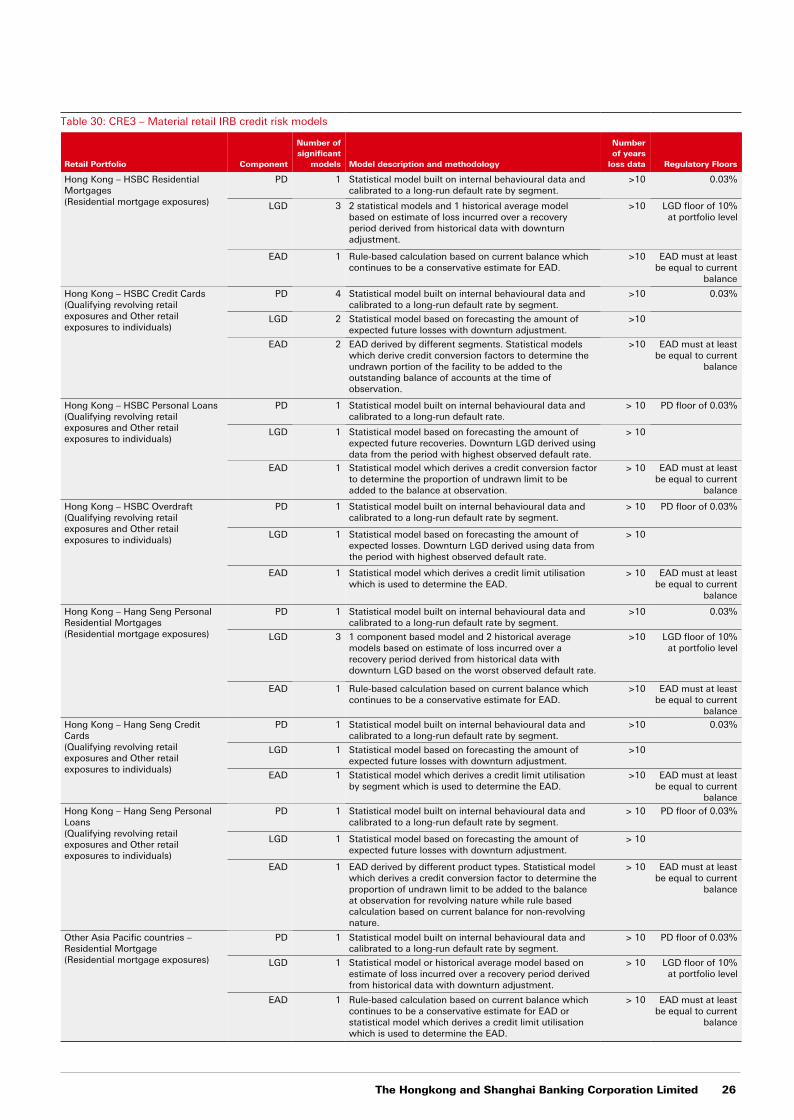
The Hongkong and Shanghai Banking Corporation Limited 26
Table 30: CRE3 – Material retail IRB credit risk models
Retail Portfolio Component
Number ofsignificant
models Model description and methodology
Numberof years
loss data Regulatory Floors
Hong Kong – HSBC Residential Mortgages(Residential mortgage exposures)
PD 1 Statistical model built on internal behavioural data andcalibrated to a long-run default rate by segment.
>10 0.03%
LGD 3 2 statistical models and 1 historical average modelbased on estimate of loss incurred over a recoveryperiod derived from historical data with downturnadjustment.
>10 LGD floor of 10%at portfolio level
EAD 1 Rule-based calculation based on current balance whichcontinues to be a conservative estimate for EAD.
>10 EAD must at leastbe equal to current
balance
Hong Kong – HSBC Credit Cards(Qualifying revolving retail exposures and Other retail exposures to individuals)
PD 4 Statistical model built on internal behavioural data andcalibrated to a long-run default rate by segment.
>10 0.03%
LGD 2 Statistical model based on forecasting the amount ofexpected future losses with downturn adjustment.
>10
EAD 2 EAD derived by different segments. Statistical modelswhich derive credit conversion factors to determine theundrawn portion of the facility to be added to theoutstanding balance of accounts at the time ofobservation.
>10 EAD must at leastbe equal to current
balance
Hong Kong – HSBC Personal Loans(Qualifying revolving retail exposures and Other retail exposures to individuals)
PD 1 Statistical model built on internal behavioural data andcalibrated to a long-run default rate.
> 10 PD floor of 0.03%
LGD 1 Statistical model based on forecasting the amount ofexpected future recoveries. Downturn LGD derived usingdata from the period with highest observed default rate.
> 10
EAD 1 Statistical model which derives a credit conversion factorto determine the proportion of undrawn limit to beadded to the balance at observation.
> 10 EAD must at leastbe equal to current
balance
Hong Kong – HSBC Overdraft(Qualifying revolving retailexposures and Other retailexposures to individuals)
PD 1 Statistical model built on internal behavioural data andcalibrated to a long-run default rate by segment.
> 10 PD floor of 0.03%
LGD 1 Statistical model based on forecasting the amount ofexpected losses. Downturn LGD derived using data fromthe period with highest observed default rate.
> 10
EAD 1 Statistical model which derives a credit limit utilisationwhich is used to determine the EAD.
> 10 EAD must at leastbe equal to current
balance
Hong Kong – Hang Seng Personal Residential Mortgages(Residential mortgage exposures)
PD 1 Statistical model built on internal behavioural data andcalibrated to a long-run default rate by segment.
>10 0.03%
LGD 3 1 component based model and 2 historical average models based on estimate of loss incurred over a recovery period derived from historical data with downturn LGD based on the worst observed default rate.
>10 LGD floor of 10%at portfolio level
EAD 1 Rule-based calculation based on current balance whichcontinues to be a conservative estimate for EAD.
>10 EAD must at leastbe equal to current
balance
Hong Kong – Hang Seng Credit Cards (Qualifying revolving retail exposures and Other retail exposures to individuals)
PD 1 Statistical model built on internal behavioural data andcalibrated to a long-run default rate by segment.
>10 0.03%
LGD 1 Statistical model based on forecasting the amount ofexpected future losses with downturn adjustment.
>10
EAD 1 Statistical model which derives a credit limit utilisationby segment which is used to determine the EAD.
>10 EAD must at leastbe equal to current
balance
Hong Kong – Hang Seng Personal Loans(Qualifying revolving retail exposures and Other retail exposures to individuals)
PD 1 Statistical model built on internal behavioural data andcalibrated to a long-run default rate by segment.
> 10 PD floor of 0.03%
LGD 1 Statistical model based on forecasting the amount ofexpected future losses with downturn adjustment.
> 10
EAD 1 EAD derived by different product types. Statistical modelwhich derives a credit conversion factor to determine theproportion of undrawn limit to be added to the balanceat observation for revolving nature while rule basedcalculation based on current balance for non-revolvingnature.
> 10 EAD must at leastbe equal to current
balance
Other Asia Pacific countries – Residential Mortgage(Residential mortgage exposures)
PD 1 Statistical model built on internal behavioural data andcalibrated to a long-run default rate by segment.
> 10 PD floor of 0.03%
LGD 1 Statistical model or historical average model based onestimate of loss incurred over a recovery period derivedfrom historical data with downturn adjustment.
> 10 LGD floor of 10%at portfolio level
EAD 1 Rule-based calculation based on current balance whichcontinues to be a conservative estimate for EAD orstatistical model which derives a credit limit utilisationwhich is used to determine the EAD.
> 10 EAD must at leastbe equal to current
balance
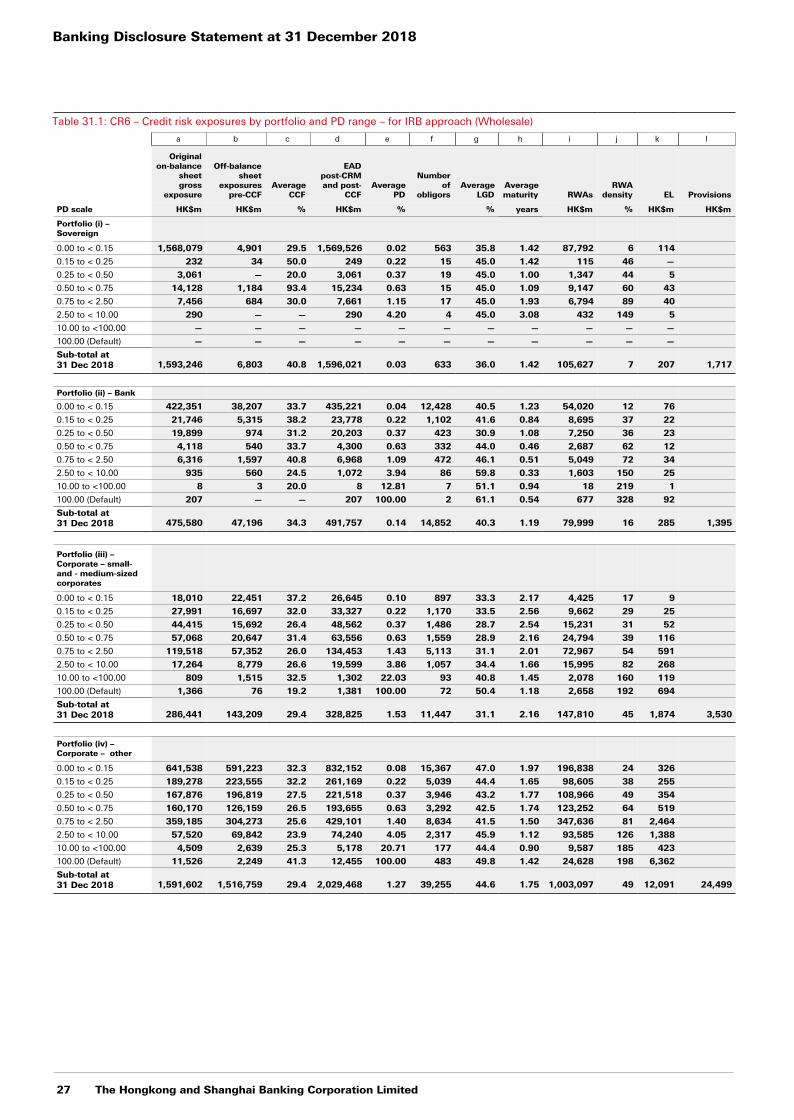
Banking Disclosure Statement at 31 December 2018
27 The Hongkong and Shanghai Banking Corporation Limited
Table 31.1: CR6 – Credit risk exposures by portfolio and PD range – for IRB approach (Wholesale)
a b c d e f g h i j k l
Originalon-balance
sheetgross
exposure
Off-balancesheet
exposurespre-CCF
AverageCCF
EADpost-CRMand post-
CCFAverage
PD
Numberof
obligorsAverage
LGDAveragematurity RWAs
RWAdensity EL Provisions
PD scale HK$m HK$m % HK$m % % years HK$m % HK$m HK$m
Portfolio (i) –Sovereign
0.00 to < 0.15 1,568,079 4,901 29.5 1,569,526 0.02 563 35.8 1.42 87,792 6 114
0.15 to < 0.25 232 34 50.0 249 0.22 15 45.0 1.42 115 46 —
0.25 to < 0.50 3,061 — 20.0 3,061 0.37 19 45.0 1.00 1,347 44 5
0.50 to < 0.75 14,128 1,184 93.4 15,234 0.63 15 45.0 1.09 9,147 60 43
0.75 to < 2.50 7,456 684 30.0 7,661 1.15 17 45.0 1.93 6,794 89 40
2.50 to < 10.00 290 — — 290 4.20 4 45.0 3.08 432 149 5
10.00 to <100.00 — — — — — — — — — — —
100.00 (Default) — — — — — — — — — — —
Sub-total at31 Dec 2018 1,593,246 6,803 40.8 1,596,021 0.03 633 36.0 1.42 105,627 7 207 1,717
Portfolio (ii) – Bank
0.00 to < 0.15 422,351 38,207 33.7 435,221 0.04 12,428 40.5 1.23 54,020 12 76
0.15 to < 0.25 21,746 5,315 38.2 23,778 0.22 1,102 41.6 0.84 8,695 37 22
0.25 to < 0.50 19,899 974 31.2 20,203 0.37 423 30.9 1.08 7,250 36 23
0.50 to < 0.75 4,118 540 33.7 4,300 0.63 332 44.0 0.46 2,687 62 12
0.75 to < 2.50 6,316 1,597 40.8 6,968 1.09 472 46.1 0.51 5,049 72 34
2.50 to < 10.00 935 560 24.5 1,072 3.94 86 59.8 0.33 1,603 150 25
10.00 to <100.00 8 3 20.0 8 12.81 7 51.1 0.94 18 219 1
100.00 (Default) 207 — — 207 100.00 2 61.1 0.54 677 328 92
Sub-total at31 Dec 2018 475,580 47,196 34.3 491,757 0.14 14,852 40.3 1.19 79,999 16 285 1,395
Portfolio (iii) –Corporate – small-and - medium-sizedcorporates
0.00 to < 0.15 18,010 22,451 37.2 26,645 0.10 897 33.3 2.17 4,425 17 9
0.15 to < 0.25 27,991 16,697 32.0 33,327 0.22 1,170 33.5 2.56 9,662 29 25
0.25 to < 0.50 44,415 15,692 26.4 48,562 0.37 1,486 28.7 2.54 15,231 31 52
0.50 to < 0.75 57,068 20,647 31.4 63,556 0.63 1,559 28.9 2.16 24,794 39 116
0.75 to < 2.50 119,518 57,352 26.0 134,453 1.43 5,113 31.1 2.01 72,967 54 591
2.50 to < 10.00 17,264 8,779 26.6 19,599 3.86 1,057 34.4 1.66 15,995 82 268
10.00 to <100.00 809 1,515 32.5 1,302 22.03 93 40.8 1.45 2,078 160 119
100.00 (Default) 1,366 76 19.2 1,381 100.00 72 50.4 1.18 2,658 192 694
Sub-total at31 Dec 2018 286,441 143,209 29.4 328,825 1.53 11,447 31.1 2.16 147,810 45 1,874 3,530
Portfolio (iv) –Corporate – other
0.00 to < 0.15 641,538 591,223 32.3 832,152 0.08 15,367 47.0 1.97 196,838 24 326
0.15 to < 0.25 189,278 223,555 32.2 261,169 0.22 5,039 44.4 1.65 98,605 38 255
0.25 to < 0.50 167,876 196,819 27.5 221,518 0.37 3,946 43.2 1.77 108,966 49 354
0.50 to < 0.75 160,170 126,159 26.5 193,655 0.63 3,292 42.5 1.74 123,252 64 519
0.75 to < 2.50 359,185 304,273 25.6 429,101 1.40 8,634 41.5 1.50 347,636 81 2,464
2.50 to < 10.00 57,520 69,842 23.9 74,240 4.05 2,317 45.9 1.12 93,585 126 1,388
10.00 to <100.00 4,509 2,639 25.3 5,178 20.71 177 44.4 0.90 9,587 185 423
100.00 (Default) 11,526 2,249 41.3 12,455 100.00 483 49.8 1.42 24,628 198 6,362
Sub-total at31 Dec 2018 1,591,602 1,516,759 29.4 2,029,468 1.27 39,255 44.6 1.75 1,003,097 49 12,091 24,499
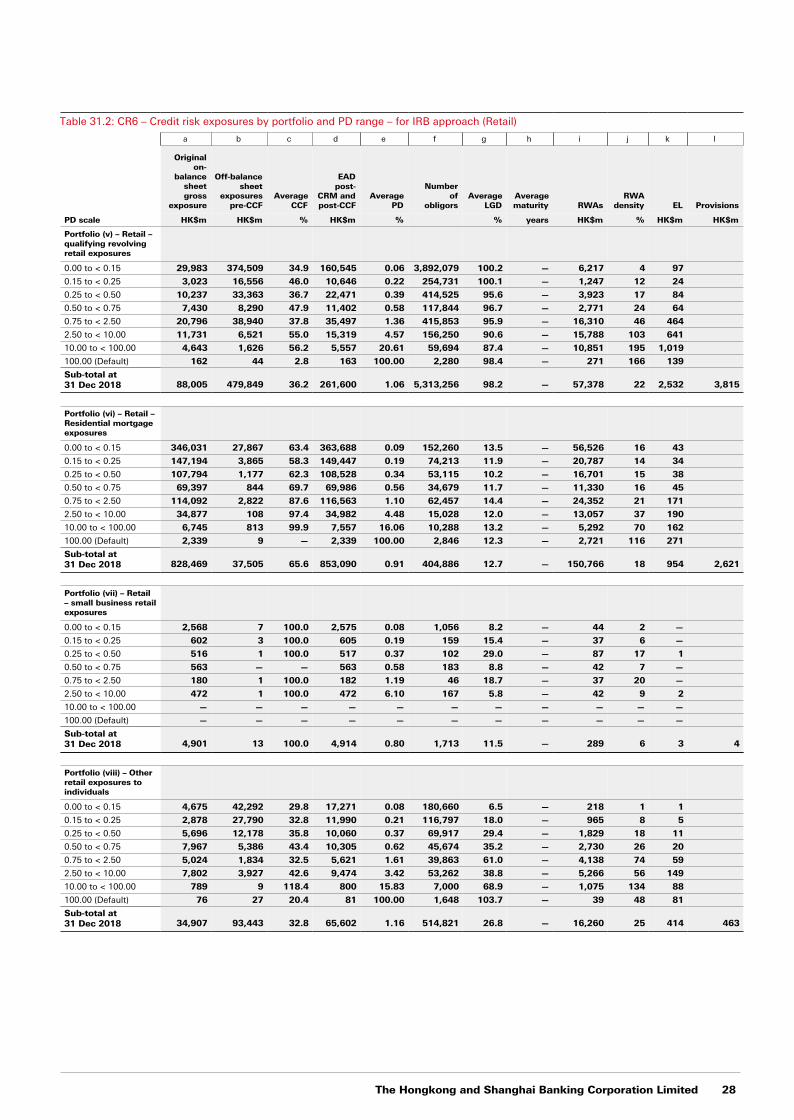
The Hongkong and Shanghai Banking Corporation Limited 28
Table 31.2: CR6 – Credit risk exposures by portfolio and PD range – for IRB approach (Retail)
a b c d e f g h i j k l
Originalon-
balancesheetgross
exposure
Off-balance sheet
exposurespre-CCF
AverageCCF
EADpost-
CRM and post-CCF
AveragePD
Numberof
obligorsAverage
LGDAveragematurity RWAs
RWA density EL Provisions
PD scale HK$m HK$m % HK$m % % years HK$m % HK$m HK$m
Portfolio (v) – Retail –qualifying revolvingretail exposures
0.00 to < 0.15 29,983 374,509 34.9 160,545 0.06 3,892,079 100.2 — 6,217 4 97
0.15 to < 0.25 3,023 16,556 46.0 10,646 0.22 254,731 100.1 — 1,247 12 24
0.25 to < 0.50 10,237 33,363 36.7 22,471 0.39 414,525 95.6 — 3,923 17 84
0.50 to < 0.75 7,430 8,290 47.9 11,402 0.58 117,844 96.7 — 2,771 24 64
0.75 to < 2.50 20,796 38,940 37.8 35,497 1.36 415,853 95.9 — 16,310 46 464
2.50 to < 10.00 11,731 6,521 55.0 15,319 4.57 156,250 90.6 — 15,788 103 641
10.00 to < 100.00 4,643 1,626 56.2 5,557 20.61 59,694 87.4 — 10,851 195 1,019
100.00 (Default) 162 44 2.8 163 100.00 2,280 98.4 — 271 166 139
Sub-total at31 Dec 2018 88,005 479,849 36.2 261,600 1.06 5,313,256 98.2 — 57,378 22 2,532 3,815
Portfolio (vi) – Retail –Residential mortgageexposures
0.00 to < 0.15 346,031 27,867 63.4 363,688 0.09 152,260 13.5 — 56,526 16 43
0.15 to < 0.25 147,194 3,865 58.3 149,447 0.19 74,213 11.9 — 20,787 14 34
0.25 to < 0.50 107,794 1,177 62.3 108,528 0.34 53,115 10.2 — 16,701 15 38
0.50 to < 0.75 69,397 844 69.7 69,986 0.56 34,679 11.7 — 11,330 16 45
0.75 to < 2.50 114,092 2,822 87.6 116,563 1.10 62,457 14.4 — 24,352 21 171
2.50 to < 10.00 34,877 108 97.4 34,982 4.48 15,028 12.0 — 13,057 37 190
10.00 to < 100.00 6,745 813 99.9 7,557 16.06 10,288 13.2 — 5,292 70 162
100.00 (Default) 2,339 9 — 2,339 100.00 2,846 12.3 — 2,721 116 271
Sub-total at31 Dec 2018 828,469 37,505 65.6 853,090 0.91 404,886 12.7 — 150,766 18 954 2,621
Portfolio (vii) – Retail– small business retailexposures
0.00 to < 0.15 2,568 7 100.0 2,575 0.08 1,056 8.2 — 44 2 —
0.15 to < 0.25 602 3 100.0 605 0.19 159 15.4 — 37 6 —
0.25 to < 0.50 516 1 100.0 517 0.37 102 29.0 — 87 17 1
0.50 to < 0.75 563 — — 563 0.58 183 8.8 — 42 7 —
0.75 to < 2.50 180 1 100.0 182 1.19 46 18.7 — 37 20 —
2.50 to < 10.00 472 1 100.0 472 6.10 167 5.8 — 42 9 2
10.00 to < 100.00 — — — — — — — — — — —
100.00 (Default) — — — — — — — — — — —
Sub-total at31 Dec 2018 4,901 13 100.0 4,914 0.80 1,713 11.5 — 289 6 3 4
Portfolio (viii) – Otherretail exposures toindividuals
0.00 to < 0.15 4,675 42,292 29.8 17,271 0.08 180,660 6.5 — 218 1 1
0.15 to < 0.25 2,878 27,790 32.8 11,990 0.21 116,797 18.0 — 965 8 5
0.25 to < 0.50 5,696 12,178 35.8 10,060 0.37 69,917 29.4 — 1,829 18 11
0.50 to < 0.75 7,967 5,386 43.4 10,305 0.62 45,674 35.2 — 2,730 26 20
0.75 to < 2.50 5,024 1,834 32.5 5,621 1.61 39,863 61.0 — 4,138 74 59
2.50 to < 10.00 7,802 3,927 42.6 9,474 3.42 53,262 38.8 — 5,266 56 149
10.00 to < 100.00 789 9 118.4 800 15.83 7,000 68.9 — 1,075 134 88
100.00 (Default) 76 27 20.4 81 100.00 1,648 103.7 — 39 48 81
Sub-total at31 Dec 2018 34,907 93,443 32.8 65,602 1.16 514,821 26.8 — 16,260 25 414 463
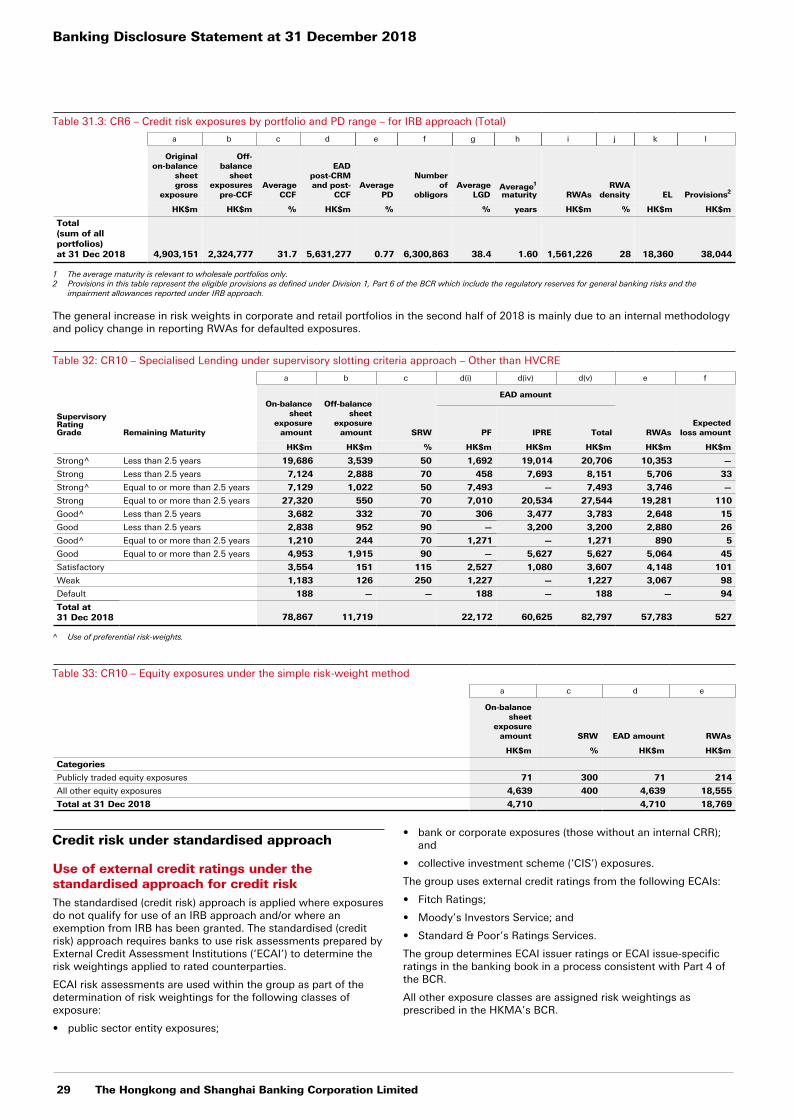
Banking Disclosure Statement at 31 December 2018
29 The Hongkong and Shanghai Banking Corporation Limited
Table 31.3: CR6 – Credit risk exposures by portfolio and PD range – for IRB approach (Total)
a b c d e f g h i j k l
Originalon-balance
sheetgross
exposure
Off-balance
sheetexposures
pre-CCFAverage
CCF
EADpost-CRM and post-
CCFAverage
PD
Numberof
obligorsAverage
LGDAverage1
maturity RWAsRWA
density EL Provisions2
HK$m HK$m % HK$m % % years HK$m % HK$m HK$m
Total(sum of allportfolios)at 31 Dec 2018 4,903,151 2,324,777 31.7 5,631,277 0.77 6,300,863 38.4 1.60 1,561,226 28 18,360 38,044
1 The average maturity is relevant to wholesale portfolios only.2 Provisions in this table represent the eligible provisions as defined under Division 1, Part 6 of the BCR which include the regulatory reserves for general banking risks and the
impairment allowances reported under IRB approach.
The general increase in risk weights in corporate and retail portfolios in the second half of 2018 is mainly due to an internal methodology and policy change in reporting RWAs for defaulted exposures.
Table 32: CR10 – Specialised Lending under supervisory slotting criteria approach – Other than HVCRE
a b c d(i) d(iv) d(v) e f
Supervisory Rating Grade Remaining Maturity
On-balancesheet
exposureamount
Off-balancesheet
exposureamount SRW
EAD amount
RWAsExpected
loss amountPF IPRE Total
HK$m HK$m % HK$m HK$m HK$m HK$m HK$m
Strong^ Less than 2.5 years 19,686 3,539 50 1,692 19,014 20,706 10,353 —
Strong Less than 2.5 years 7,124 2,888 70 458 7,693 8,151 5,706 33
Strong^ Equal to or more than 2.5 years 7,129 1,022 50 7,493 — 7,493 3,746 —
Strong Equal to or more than 2.5 years 27,320 550 70 7,010 20,534 27,544 19,281 110
Good^ Less than 2.5 years 3,682 332 70 306 3,477 3,783 2,648 15
Good Less than 2.5 years 2,838 952 90 — 3,200 3,200 2,880 26
Good^ Equal to or more than 2.5 years 1,210 244 70 1,271 — 1,271 890 5
Good Equal to or more than 2.5 years 4,953 1,915 90 — 5,627 5,627 5,064 45
Satisfactory 3,554 151 115 2,527 1,080 3,607 4,148 101
Weak 1,183 126 250 1,227 — 1,227 3,067 98
Default 188 — — 188 — 188 — 94
Total at31 Dec 2018 78,867 11,719 22,172 60,625 82,797 57,783 527
^ Use of preferential risk-weights.
Table 33: CR10 – Equity exposures under the simple risk-weight method
a c d e
On-balancesheet
exposureamount SRW EAD amount RWAs
HK$m % HK$m HK$m
Categories
Publicly traded equity exposures 71 300 71 214
All other equity exposures 4,639 400 4,639 18,555
Total at 31 Dec 2018 4,710 4,710 18,769
Credit risk under standardised approach
Use of external credit ratings under the standardised approach for credit riskThe standardised (credit risk) approach is applied where exposures do not qualify for use of an IRB approach and/or where an exemption from IRB has been granted. The standardised (credit risk) approach requires banks to use risk assessments prepared by External Credit Assessment Institutions (‘ECAI’) to determine the risk weightings applied to rated counterparties.
ECAI risk assessments are used within the group as part of the determination of risk weightings for the following classes of exposure:
• public sector entity exposures;
• bank or corporate exposures (those without an internal CRR); and
• collective investment scheme (‘CIS’) exposures.
The group uses external credit ratings from the following ECAIs:
• Fitch Ratings;
• Moody’s Investors Service; and
• Standard & Poor’s Ratings Services.
The group determines ECAI issuer ratings or ECAI issue-specific ratings in the banking book in a process consistent with Part 4 of the BCR.
All other exposure classes are assigned risk weightings as prescribed in the HKMA’s BCR.
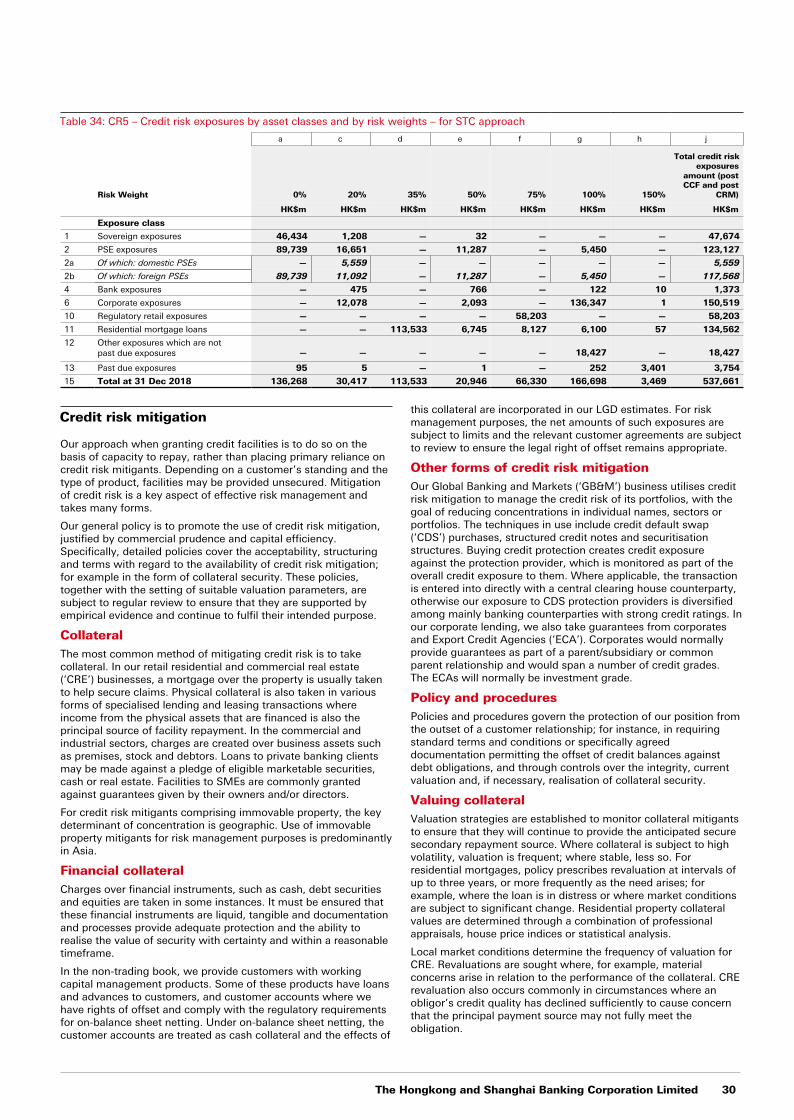
The Hongkong and Shanghai Banking Corporation Limited 30
Table 34: CR5 – Credit risk exposures by asset classes and by risk weights – for STC approach
a c d e f g h j
Risk Weight 0% 20% 35% 50% 75% 100% 150%
Total credit riskexposures
amount (postCCF and post
CRM)
HK$m HK$m HK$m HK$m HK$m HK$m HK$m HK$m
Exposure class
1 Sovereign exposures 46,434 1,208 — 32 — — — 47,674
2 PSE exposures 89,739 16,651 — 11,287 — 5,450 — 123,127
2a Of which: domestic PSEs — 5,559 — — — — — 5,559
2b Of which: foreign PSEs 89,739 11,092 — 11,287 — 5,450 — 117,568
4 Bank exposures — 475 — 766 — 122 10 1,373
6 Corporate exposures — 12,078 — 2,093 — 136,347 1 150,519
10 Regulatory retail exposures — — — — 58,203 — — 58,203
11 Residential mortgage loans — — 113,533 6,745 8,127 6,100 57 134,562
12 Other exposures which are notpast due exposures — — — — — 18,427 — 18,427
13 Past due exposures 95 5 — 1 — 252 3,401 3,754
15 Total at 31 Dec 2018 136,268 30,417 113,533 20,946 66,330 166,698 3,469 537,661
Credit risk mitigation
Our approach when granting credit facilities is to do so on the basis of capacity to repay, rather than placing primary reliance on credit risk mitigants. Depending on a customer’s standing and the type of product, facilities may be provided unsecured. Mitigation of credit risk is a key aspect of effective risk management and takes many forms.
Our general policy is to promote the use of credit risk mitigation, justified by commercial prudence and capital efficiency. Specifically, detailed policies cover the acceptability, structuring and terms with regard to the availability of credit risk mitigation; for example in the form of collateral security. These policies, together with the setting of suitable valuation parameters, are subject to regular review to ensure that they are supported by empirical evidence and continue to fulfil their intended purpose.
CollateralThe most common method of mitigating credit risk is to take collateral. In our retail residential and commercial real estate (‘CRE’) businesses, a mortgage over the property is usually taken to help secure claims. Physical collateral is also taken in various forms of specialised lending and leasing transactions where income from the physical assets that are financed is also the principal source of facility repayment. In the commercial and industrial sectors, charges are created over business assets such as premises, stock and debtors. Loans to private banking clients may be made against a pledge of eligible marketable securities, cash or real estate. Facilities to SMEs are commonly granted against guarantees given by their owners and/or directors.
For credit risk mitigants comprising immovable property, the key determinant of concentration is geographic. Use of immovable property mitigants for risk management purposes is predominantly in Asia.
Financial collateralCharges over financial instruments, such as cash, debt securities and equities are taken in some instances. It must be ensured that these financial instruments are liquid, tangible and documentation and processes provide adequate protection and the ability to realise the value of security with certainty and within a reasonable timeframe.
In the non-trading book, we provide customers with working capital management products. Some of these products have loans and advances to customers, and customer accounts where we have rights of offset and comply with the regulatory requirements for on-balance sheet netting. Under on-balance sheet netting, the customer accounts are treated as cash collateral and the effects of
this collateral are incorporated in our LGD estimates. For risk management purposes, the net amounts of such exposures are subject to limits and the relevant customer agreements are subject to review to ensure the legal right of offset remains appropriate.
Other forms of credit risk mitigationOur Global Banking and Markets (‘GB&M’) business utilises credit risk mitigation to manage the credit risk of its portfolios, with the goal of reducing concentrations in individual names, sectors or portfolios. The techniques in use include credit default swap (‘CDS’) purchases, structured credit notes and securitisation structures. Buying credit protection creates credit exposure against the protection provider, which is monitored as part of the overall credit exposure to them. Where applicable, the transaction is entered into directly with a central clearing house counterparty, otherwise our exposure to CDS protection providers is diversified among mainly banking counterparties with strong credit ratings. In our corporate lending, we also take guarantees from corporates and Export Credit Agencies (‘ECA’). Corporates would normally provide guarantees as part of a parent/subsidiary or common parent relationship and would span a number of credit grades. The ECAs will normally be investment grade.
Policy and proceduresPolicies and procedures govern the protection of our position from the outset of a customer relationship; for instance, in requiring standard terms and conditions or specifically agreed documentation permitting the offset of credit balances against debt obligations, and through controls over the integrity, current valuation and, if necessary, realisation of collateral security.
Valuing collateralValuation strategies are established to monitor collateral mitigants to ensure that they will continue to provide the anticipated secure secondary repayment source. Where collateral is subject to high volatility, valuation is frequent; where stable, less so. For residential mortgages, policy prescribes revaluation at intervals of up to three years, or more frequently as the need arises; for example, where the loan is in distress or where market conditions are subject to significant change. Residential property collateral values are determined through a combination of professional appraisals, house price indices or statistical analysis.
Local market conditions determine the frequency of valuation for CRE. Revaluations are sought where, for example, material concerns arise in relation to the performance of the collateral. CRE revaluation also occurs commonly in circumstances where an obligor’s credit quality has declined sufficiently to cause concern that the principal payment source may not fully meet the obligation.
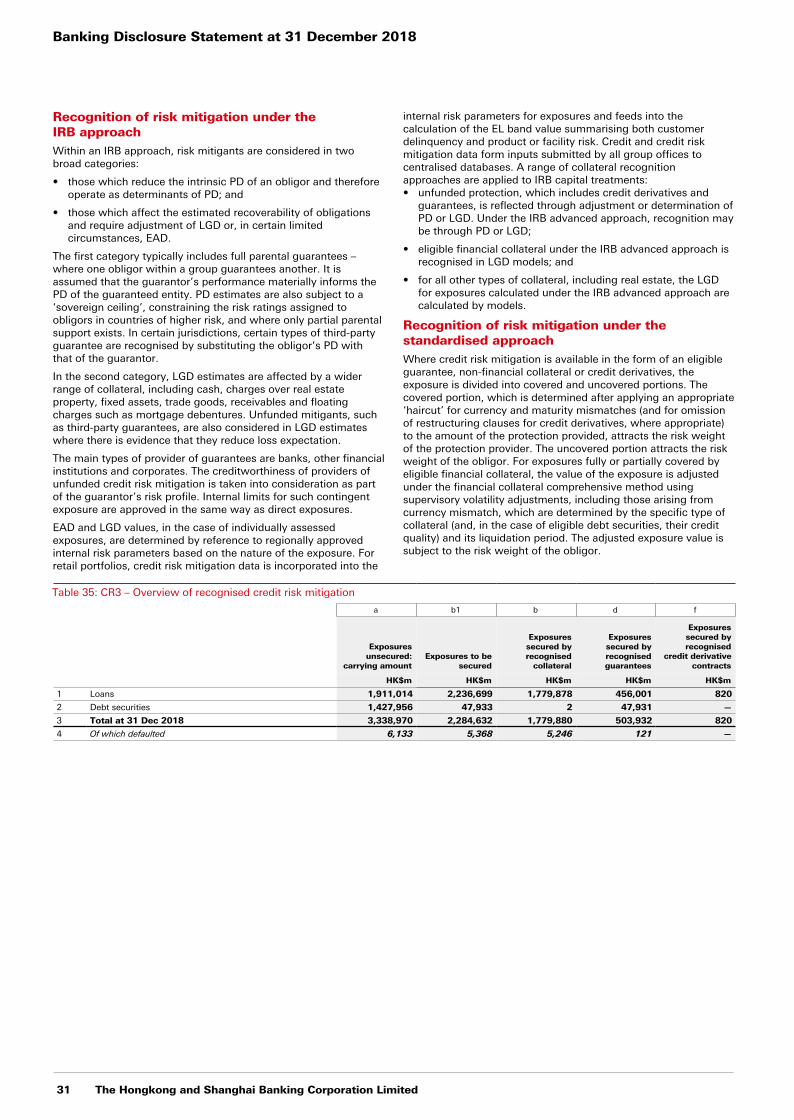
Banking Disclosure Statement at 31 December 2018
31 The Hongkong and Shanghai Banking Corporation Limited
Recognition of risk mitigation under the IRB approachWithin an IRB approach, risk mitigants are considered in two broad categories:
• those which reduce the intrinsic PD of an obligor and therefore operate as determinants of PD; and
• those which affect the estimated recoverability of obligations and require adjustment of LGD or, in certain limited circumstances, EAD.
The first category typically includes full parental guarantees – where one obligor within a group guarantees another. It is assumed that the guarantor’s performance materially informs the PD of the guaranteed entity. PD estimates are also subject to a ‘sovereign ceiling’, constraining the risk ratings assigned to obligors in countries of higher risk, and where only partial parental support exists. In certain jurisdictions, certain types of third-party guarantee are recognised by substituting the obligor’s PD with that of the guarantor.
In the second category, LGD estimates are affected by a wider range of collateral, including cash, charges over real estate property, fixed assets, trade goods, receivables and floating charges such as mortgage debentures. Unfunded mitigants, such as third-party guarantees, are also considered in LGD estimates where there is evidence that they reduce loss expectation.
The main types of provider of guarantees are banks, other financial institutions and corporates. The creditworthiness of providers of unfunded credit risk mitigation is taken into consideration as part of the guarantor’s risk profile. Internal limits for such contingent exposure are approved in the same way as direct exposures.
EAD and LGD values, in the case of individually assessed exposures, are determined by reference to regionally approved internal risk parameters based on the nature of the exposure. For retail portfolios, credit risk mitigation data is incorporated into the
internal risk parameters for exposures and feeds into the calculation of the EL band value summarising both customer delinquency and product or facility risk. Credit and credit risk mitigation data form inputs submitted by all group offices to centralised databases. A range of collateral recognition approaches are applied to IRB capital treatments:• unfunded protection, which includes credit derivatives and
guarantees, is reflected through adjustment or determination of PD or LGD. Under the IRB advanced approach, recognition may be through PD or LGD;
• eligible financial collateral under the IRB advanced approach is recognised in LGD models; and
• for all other types of collateral, including real estate, the LGD for exposures calculated under the IRB advanced approach are calculated by models.
Recognition of risk mitigation under the standardised approachWhere credit risk mitigation is available in the form of an eligible guarantee, non-financial collateral or credit derivatives, the exposure is divided into covered and uncovered portions. The covered portion, which is determined after applying an appropriate ‘haircut’ for currency and maturity mismatches (and for omission of restructuring clauses for credit derivatives, where appropriate) to the amount of the protection provided, attracts the risk weight of the protection provider. The uncovered portion attracts the risk weight of the obligor. For exposures fully or partially covered by eligible financial collateral, the value of the exposure is adjusted under the financial collateral comprehensive method using supervisory volatility adjustments, including those arising from currency mismatch, which are determined by the specific type of collateral (and, in the case of eligible debt securities, their credit quality) and its liquidation period. The adjusted exposure value is subject to the risk weight of the obligor.
Table 35: CR3 – Overview of recognised credit risk mitigation
a b1 b d f
Exposures unsecured:
carrying amountExposures to be
secured
Exposuressecured byrecognised
collateral
Exposuressecured byrecognisedguarantees
Exposuressecured byrecognised
credit derivativecontracts
HK$m HK$m HK$m HK$m HK$m
1 Loans 1,911,014 2,236,699 1,779,878 456,001 820
2 Debt securities 1,427,956 47,933 2 47,931 —
3 Total at 31 Dec 2018 3,338,970 2,284,632 1,779,880 503,932 820
4 Of which defaulted 6,133 5,368 5,246 121 —
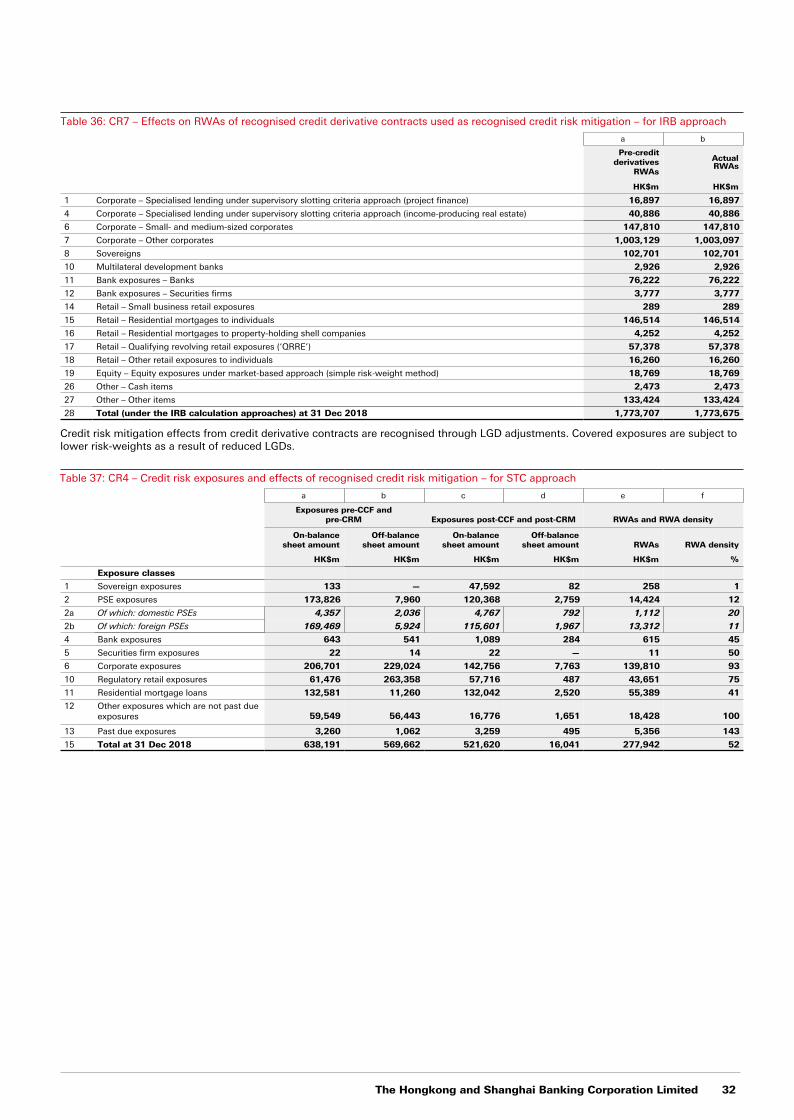
The Hongkong and Shanghai Banking Corporation Limited 32
Table 36: CR7 – Effects on RWAs of recognised credit derivative contracts used as recognised credit risk mitigation – for IRB approach
a b
Pre-creditderivatives
RWAs
ActualRWAs
HK$m HK$m
1 Corporate – Specialised lending under supervisory slotting criteria approach (project finance) 16,897 16,897
4 Corporate – Specialised lending under supervisory slotting criteria approach (income-producing real estate) 40,886 40,886
6 Corporate – Small- and medium-sized corporates 147,810 147,810
7 Corporate – Other corporates 1,003,129 1,003,097
8 Sovereigns 102,701 102,701
10 Multilateral development banks 2,926 2,926
11 Bank exposures – Banks 76,222 76,222
12 Bank exposures – Securities firms 3,777 3,777
14 Retail – Small business retail exposures 289 289
15 Retail – Residential mortgages to individuals 146,514 146,514
16 Retail – Residential mortgages to property-holding shell companies 4,252 4,252
17 Retail – Qualifying revolving retail exposures (‘QRRE’) 57,378 57,378
18 Retail – Other retail exposures to individuals 16,260 16,260
19 Equity – Equity exposures under market-based approach (simple risk-weight method) 18,769 18,769
26 Other – Cash items 2,473 2,473
27 Other – Other items 133,424 133,424
28 Total (under the IRB calculation approaches) at 31 Dec 2018 1,773,707 1,773,675
Credit risk mitigation effects from credit derivative contracts are recognised through LGD adjustments. Covered exposures are subject to lower risk-weights as a result of reduced LGDs.
Table 37: CR4 – Credit risk exposures and effects of recognised credit risk mitigation – for STC approach
a b c d e f
Exposures pre-CCF andpre-CRM Exposures post-CCF and post-CRM RWAs and RWA density
On-balancesheet amount
Off-balancesheet amount
On-balancesheet amount
Off-balancesheet amount RWAs RWA density
HK$m HK$m HK$m HK$m HK$m %
Exposure classes
1 Sovereign exposures 133 — 47,592 82 258 1
2 PSE exposures 173,826 7,960 120,368 2,759 14,424 12
2a Of which: domestic PSEs 4,357 2,036 4,767 792 1,112 20
2b Of which: foreign PSEs 169,469 5,924 115,601 1,967 13,312 11
4 Bank exposures 643 541 1,089 284 615 45
5 Securities firm exposures 22 14 22 — 11 50
6 Corporate exposures 206,701 229,024 142,756 7,763 139,810 93
10 Regulatory retail exposures 61,476 263,358 57,716 487 43,651 75
11 Residential mortgage loans 132,581 11,260 132,042 2,520 55,389 41
12 Other exposures which are not past dueexposures 59,549 56,443 16,776 1,651 18,428 100
13 Past due exposures 3,260 1,062 3,259 495 5,356 143
15 Total at 31 Dec 2018 638,191 569,662 521,620 16,041 277,942 52
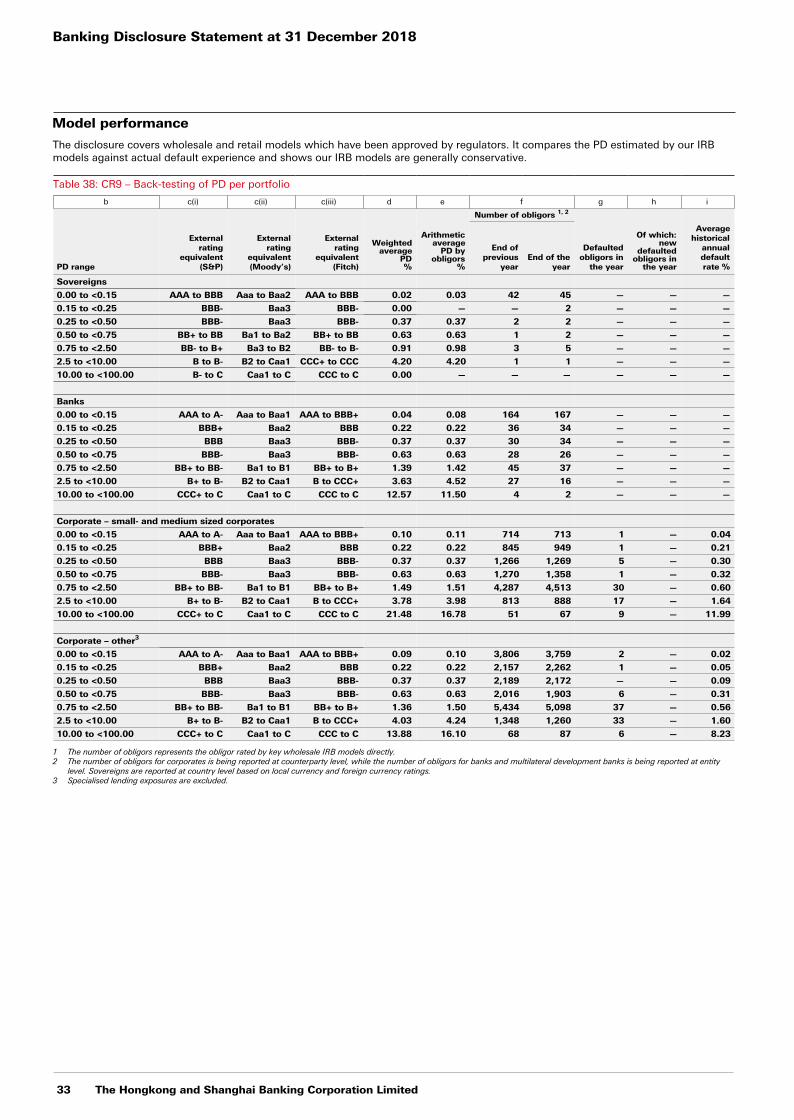
Banking Disclosure Statement at 31 December 2018
33 The Hongkong and Shanghai Banking Corporation Limited
Model performance
The disclosure covers wholesale and retail models which have been approved by regulators. It compares the PD estimated by our IRB models against actual default experience and shows our IRB models are generally conservative.
Table 38: CR9 – Back-testing of PD per portfolio
b c(i) c(ii) c(iii) d e f g h i
PD range
Externalrating
equivalent(S&P)
Externalrating
equivalent(Moody’s)
Externalrating
equivalent(Fitch)
Weighted average
PD %
Arithmetic average
PD by obligors
%
Number of obligors 1, 2
Defaultedobligors in
the year
Of which:new
defaultedobligors in
the year
Averagehistorical
annualdefaultrate %
End ofprevious
yearEnd of the
year
Sovereigns
0.00 to <0.15 AAA to BBB Aaa to Baa2 AAA to BBB 0.02 0.03 42 45 — — —
0.15 to <0.25 BBB- Baa3 BBB- 0.00 — — 2 — — —
0.25 to <0.50 BBB- Baa3 BBB- 0.37 0.37 2 2 — — —
0.50 to <0.75 BB+ to BB Ba1 to Ba2 BB+ to BB 0.63 0.63 1 2 — — —
0.75 to <2.50 BB- to B+ Ba3 to B2 BB- to B- 0.91 0.98 3 5 — — —
2.5 to <10.00 B to B- B2 to Caa1 CCC+ to CCC 4.20 4.20 1 1 — — —
10.00 to <100.00 B- to C Caa1 to C CCC to C 0.00 — — — — — —
Banks
0.00 to <0.15 AAA to A- Aaa to Baa1 AAA to BBB+ 0.04 0.08 164 167 — — —
0.15 to <0.25 BBB+ Baa2 BBB 0.22 0.22 36 34 — — —
0.25 to <0.50 BBB Baa3 BBB- 0.37 0.37 30 34 — — —
0.50 to <0.75 BBB- Baa3 BBB- 0.63 0.63 28 26 — — —
0.75 to <2.50 BB+ to BB- Ba1 to B1 BB+ to B+ 1.39 1.42 45 37 — — —
2.5 to <10.00 B+ to B- B2 to Caa1 B to CCC+ 3.63 4.52 27 16 — — —
10.00 to <100.00 CCC+ to C Caa1 to C CCC to C 12.57 11.50 4 2 — — —
Corporate – small- and medium sized corporates
0.00 to <0.15 AAA to A- Aaa to Baa1 AAA to BBB+ 0.10 0.11 714 713 1 — 0.04
0.15 to <0.25 BBB+ Baa2 BBB 0.22 0.22 845 949 1 — 0.21
0.25 to <0.50 BBB Baa3 BBB- 0.37 0.37 1,266 1,269 5 — 0.30
0.50 to <0.75 BBB- Baa3 BBB- 0.63 0.63 1,270 1,358 1 — 0.32
0.75 to <2.50 BB+ to BB- Ba1 to B1 BB+ to B+ 1.49 1.51 4,287 4,513 30 — 0.60
2.5 to <10.00 B+ to B- B2 to Caa1 B to CCC+ 3.78 3.98 813 888 17 — 1.64
10.00 to <100.00 CCC+ to C Caa1 to C CCC to C 21.48 16.78 51 67 9 — 11.99
Corporate – other3
0.00 to <0.15 AAA to A- Aaa to Baa1 AAA to BBB+ 0.09 0.10 3,806 3,759 2 — 0.02
0.15 to <0.25 BBB+ Baa2 BBB 0.22 0.22 2,157 2,262 1 — 0.05
0.25 to <0.50 BBB Baa3 BBB- 0.37 0.37 2,189 2,172 — — 0.09
0.50 to <0.75 BBB- Baa3 BBB- 0.63 0.63 2,016 1,903 6 — 0.31
0.75 to <2.50 BB+ to BB- Ba1 to B1 BB+ to B+ 1.36 1.50 5,434 5,098 37 — 0.56
2.5 to <10.00 B+ to B- B2 to Caa1 B to CCC+ 4.03 4.24 1,348 1,260 33 — 1.60
10.00 to <100.00 CCC+ to C Caa1 to C CCC to C 13.88 16.10 68 87 6 — 8.23
1 The number of obligors represents the obligor rated by key wholesale IRB models directly.2 The number of obligors for corporates is being reported at counterparty level, while the number of obligors for banks and multilateral development banks is being reported at entity
level. Sovereigns are reported at country level based on local currency and foreign currency ratings.3 Specialised lending exposures are excluded.
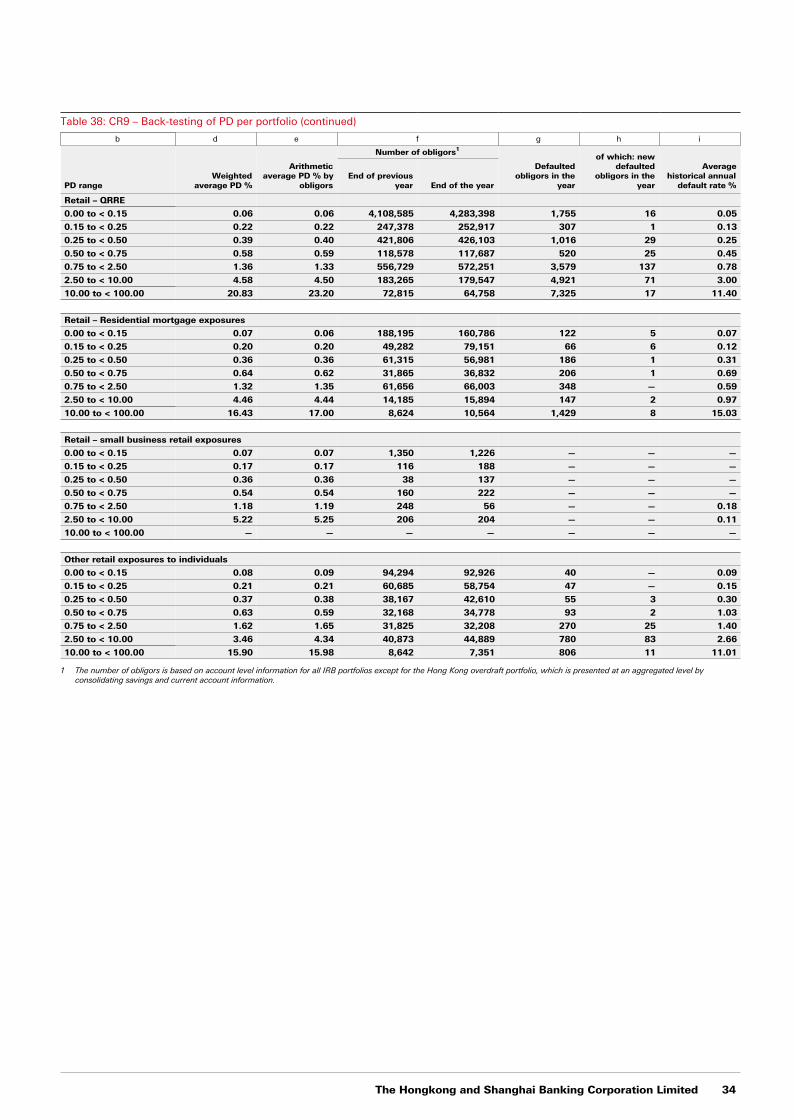
The Hongkong and Shanghai Banking Corporation Limited 34
Table 38: CR9 – Back-testing of PD per portfolio (continued)
b d e f g h i
PD rangeWeighted
average PD %
Arithmeticaverage PD % by
obligors
Number of obligors1
Defaultedobligors in the
year
of which: newdefaulted
obligors in theyear
Averagehistorical annual
default rate %End of previous
year End of the year
Retail – QRRE
0.00 to < 0.15 0.06 0.06 4,108,585 4,283,398 1,755 16 0.05
0.15 to < 0.25 0.22 0.22 247,378 252,917 307 1 0.13
0.25 to < 0.50 0.39 0.40 421,806 426,103 1,016 29 0.25
0.50 to < 0.75 0.58 0.59 118,578 117,687 520 25 0.45
0.75 to < 2.50 1.36 1.33 556,729 572,251 3,579 137 0.78
2.50 to < 10.00 4.58 4.50 183,265 179,547 4,921 71 3.00
10.00 to < 100.00 20.83 23.20 72,815 64,758 7,325 17 11.40
Retail – Residential mortgage exposures
0.00 to < 0.15 0.07 0.06 188,195 160,786 122 5 0.07
0.15 to < 0.25 0.20 0.20 49,282 79,151 66 6 0.12
0.25 to < 0.50 0.36 0.36 61,315 56,981 186 1 0.31
0.50 to < 0.75 0.64 0.62 31,865 36,832 206 1 0.69
0.75 to < 2.50 1.32 1.35 61,656 66,003 348 — 0.59
2.50 to < 10.00 4.46 4.44 14,185 15,894 147 2 0.97
10.00 to < 100.00 16.43 17.00 8,624 10,564 1,429 8 15.03
Retail – small business retail exposures
0.00 to < 0.15 0.07 0.07 1,350 1,226 — — —
0.15 to < 0.25 0.17 0.17 116 188 — — —
0.25 to < 0.50 0.36 0.36 38 137 — — —
0.50 to < 0.75 0.54 0.54 160 222 — — —
0.75 to < 2.50 1.18 1.19 248 56 — — 0.18
2.50 to < 10.00 5.22 5.25 206 204 — — 0.11
10.00 to < 100.00 — — — — — — —
Other retail exposures to individuals
0.00 to < 0.15 0.08 0.09 94,294 92,926 40 — 0.09
0.15 to < 0.25 0.21 0.21 60,685 58,754 47 — 0.15
0.25 to < 0.50 0.37 0.38 38,167 42,610 55 3 0.30
0.50 to < 0.75 0.63 0.59 32,168 34,778 93 2 1.03
0.75 to < 2.50 1.62 1.65 31,825 32,208 270 25 1.40
2.50 to < 10.00 3.46 4.34 40,873 44,889 780 83 2.66
10.00 to < 100.00 15.90 15.98 8,642 7,351 806 11 11.01
1 The number of obligors is based on account level information for all IRB portfolios except for the Hong Kong overdraft portfolio, which is presented at an aggregated level by consolidating savings and current account information.
Banking Disclosure Statement at 31 December 2018
35 The Hongkong and Shanghai Banking Corporation Limited
Counterparty credit riskexposures
Counterparty credit risk management
Counterparty credit risk (‘CCR’) arises for derivatives and securities financing transactions (‘SFTs’). It is calculated in both the trading and non-trading books, and is the risk that a counterparty may default before settlement of the transaction. CCR is generated primarily in our wholesale global businesses.
Two approaches may be used to calculate derivative exposure values for CCR: current exposure method (‘CEM’) or the internal models (counterparty credit risk) approach (‘IMM’). Exposure values calculated under these approaches are used to determine RWAs. Across the group, we use the CEM and IMM approaches.
Under the CEM approach, the EAD is calculated as current exposure plus regulatory add-ons. We use this approach for all products not covered by our IMM permission. Under the IMM approach, EAD is calculated by multiplying the effective expected positive exposure with a multiplier called ‘alpha’.
Alpha (set to a default value of 1.4) accounts for several portfolio features that increase EL above that indicated by effective expected positive exposure in the event of default, such as:
• co-variance of exposures;
• correlation between exposures and default;
• level of volatility/correlation that might coincide with a downturn;
• concentration risk; and
• model risk.
The effective expected exposure is derived from simulation, pricing and aggregation internal models approved by HKMA. The IMM model is subject to ongoing model validation including monthly model performance monitoring.
From a risk management perspective, including daily monitoring of credit limit utilisation, products not covered by IMM are subject to conservative asset class add-ons.
The potential future exposure (‘PFE’) measures used for CCR management are calibrated to the 95th percentile. The measures consider volatility, trade maturity and the counterparty legal documentation covering netting and collateral.
Limits for CCR exposures are assigned within the overall credit process. The credit risk function assigns a limit against each counterparty to cover derivatives exposure which may arise as a result of a counterparty default. The magnitude of this limit will depend on the overall risk appetite and type of derivatives trading undertaken with the counterparty.
The Regional Markets Risk Model Oversight Committee provides oversight on model risk management related matters including models used in the calculation of CCR. Models are subject to ongoing monitoring and validation. Additionally, they are subject to independent review at inception and annually thereafter.
Credit valuation adjustmentCredit valuation adjustment (‘CVA’) risk is the risk of adverse moves in the CVAs taken for expected credit losses on derivative transactions. Where we have both specific risk VaR approval and IMM approval for a product, the CVA VaR approach has been used to calculate the CVA capital charge. Where we do not hold both approvals, the standardised approach has been applied.
Collateral arrangementsOur policy is to revalue all traded transactions and associated collateral positions on a daily basis. An independent collateral management function manages the collateral process, including pledging and receiving collateral and investigating disputes and non-receipts.
Eligible collateral types are controlled under a policy to ensure price transparency, price stability, liquidity, enforceability, independence, reusability and eligibility for regulatory purposes. A valuation ‘haircut’ policy reflects the fact that collateral may fall in value between the date the collateral was called and the date of liquidation or enforcement. Approximately 97% of collateral held as variation margin under CSAs is either cash or liquid government securities.
Further information on gross fair value exposure and the offset due to legally enforceable netting and collateral is set out in Note 32 of the group's Annual Report and Accounts 2018.
Credit rating downgradeA credit rating downgrade clause in a Master Agreement or a credit rating downgrade threshold clause in a credit support annex (‘CSA’) is designed to trigger an action if the credit rating of the affected party falls below a specified level. These actions may include the requirement to pay or increase collateral, the termination of transactions by the non-affected party or the assignment of transactions by the affected party.
At 31 December 2018, the potential value of the additional collateral pertaining to International Swaps and Derivatives Association CSA downgrade thresholds that we would need to post with counterparties in the event of a one-notch downgrade of our rating was HK$117m and for a two-notch downgrade was HK$251m.
Wrong-way riskWrong-way risk occurs when a counterparty’s exposures are adversely correlated with its credit quality.
There are two types of wrong-way risk.
• General wrong-way risk occurs when the probability of counterparty default is positively correlated with general risk factors, for example, where a counterparty is resident and/or incorporated in a higher-risk country and seeks to sell a non-domestic currency in exchange for its home currency.
• Specific wrong-way risk occurs in self-referencing transactions. These are transactions in which exposure is driven by capital or financing instruments issued by the counterparty and occurs where exposure from HSBC’s perspective materially increases as the value of the counterparty’s capital or financing instruments referenced in the contract decreases. It is HSBC policy that specific wrong-way transactions are approved on a case-by-case basis.
We use a range of tools to monitor and control wrong-way risk, including requiring the business to obtain prior approval before undertaking wrong-way risk transactions outside pre-agreed guidelines. The regional Traded Risk functions are responsible for the control and monitoring process within an overarching Group framework and limit framework.
Central counterparties While exchange traded derivatives have been cleared through central counterparties (‘CCPs’) for many years, recent regulatory initiatives designed to reduce systemic risk in the banking system are directing increasing volumes of OTC derivatives to be cleared through CCPs.
A dedicated CCP risk team has been established to manage the interface with CCPs and undertake in-depth due diligence of the unique risks associated with these organisations. This is to address an implication of the regulations that the group’s risk will be transferred from being distributed among individual, bilateral counterparties to a significant level of risk concentration on CCPs. We have developed a risk appetite framework to manage risk accordingly, on an individual CCP and global basis.
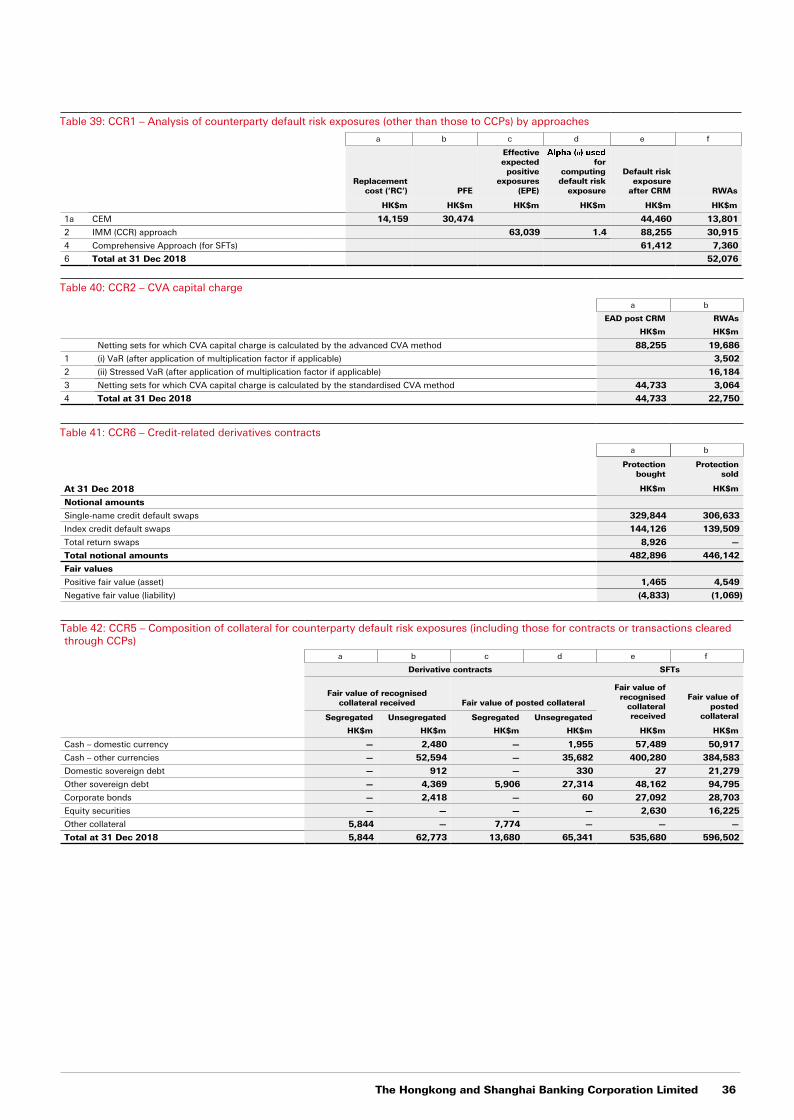
The Hongkong and Shanghai Banking Corporation Limited 36
Table 39: CCR1 – Analysis of counterparty default risk exposures (other than those to CCPs) by approaches
a b c d e f
Replacementcost (‘RC’) PFE
Effectiveexpected
positiveexposures
(EPE)
forcomputingdefault risk
exposure
Default riskexposure
after CRM RWAs
HK$m HK$m HK$m HK$m HK$m HK$m
1a CEM 14,159 30,474 44,460 13,801
2 IMM (CCR) approach 63,039 1.4 88,255 30,915
4 Comprehensive Approach (for SFTs) 61,412 7,360
6 Total at 31 Dec 2018 52,076
Table 40: CCR2 – CVA capital charge
a b
EAD post CRM RWAs
HK$m HK$m
Netting sets for which CVA capital charge is calculated by the advanced CVA method 88,255 19,686
1 (i) VaR (after application of multiplication factor if applicable) 3,502
2 (ii) Stressed VaR (after application of multiplication factor if applicable) 16,184
3 Netting sets for which CVA capital charge is calculated by the standardised CVA method 44,733 3,064
4 Total at 31 Dec 2018 44,733 22,750
Table 41: CCR6 – Credit-related derivatives contracts
a b
Protectionbought
Protectionsold
At 31 Dec 2018 HK$m HK$m
Notional amounts
Single-name credit default swaps 329,844 306,633
Index credit default swaps 144,126 139,509
Total return swaps 8,926 —
Total notional amounts 482,896 446,142
Fair values
Positive fair value (asset) 1,465 4,549
Negative fair value (liability) (4,833) (1,069)
Table 42: CCR5 – Composition of collateral for counterparty default risk exposures (including those for contracts or transactions clearedthrough CCPs)
a b c d e f
Derivative contracts SFTs
Fair value of recognisedcollateral received Fair value of posted collateral
Fair value ofrecognised
collateralreceived
Fair value ofposted
collateralSegregated Unsegregated Segregated Unsegregated
HK$m HK$m HK$m HK$m HK$m HK$m
Cash – domestic currency — 2,480 — 1,955 57,489 50,917
Cash – other currencies — 52,594 — 35,682 400,280 384,583
Domestic sovereign debt — 912 — 330 27 21,279
Other sovereign debt — 4,369 5,906 27,314 48,162 94,795
Corporate bonds — 2,418 — 60 27,092 28,703
Equity securities — — — — 2,630 16,225
Other collateral 5,844 — 7,774 — — —
Total at 31 Dec 2018 5,844 62,773 13,680 65,341 535,680 596,502
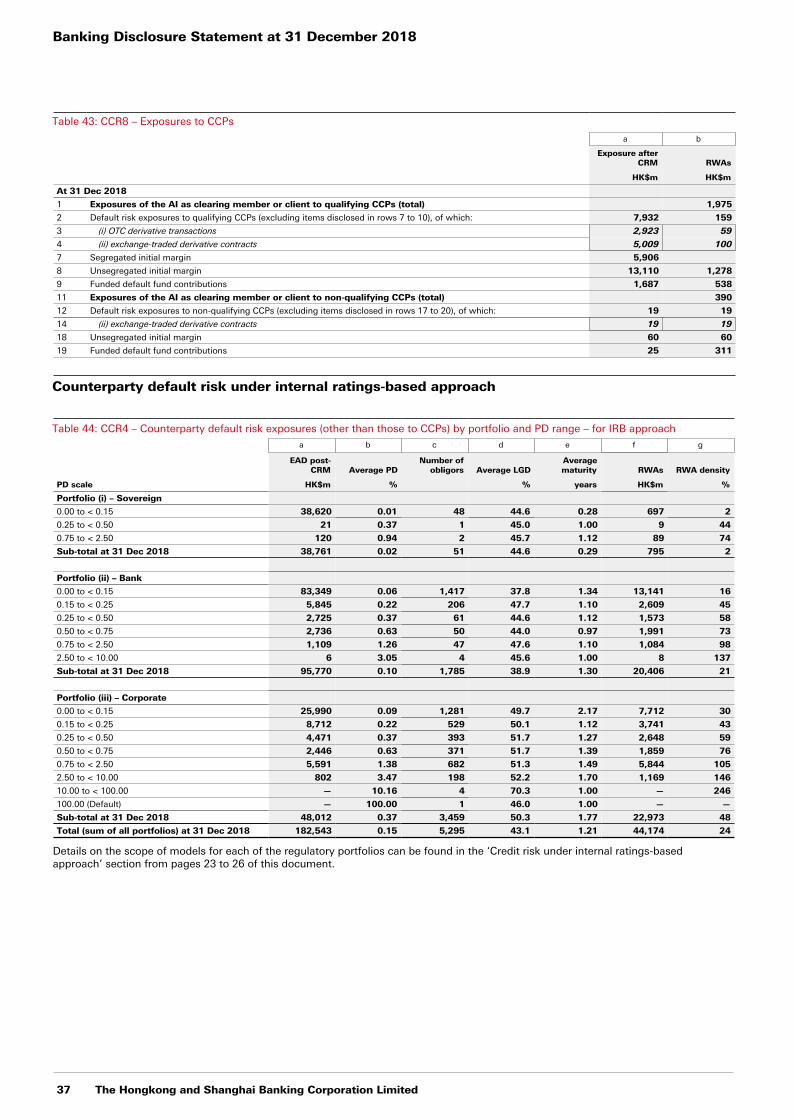
Banking Disclosure Statement at 31 December 2018
37 The Hongkong and Shanghai Banking Corporation Limited
Table 43: CCR8 – Exposures to CCPs
a b
Exposure afterCRM RWAs
HK$m HK$m
At 31 Dec 2018
1 Exposures of the AI as clearing member or client to qualifying CCPs (total) 1,975
2 Default risk exposures to qualifying CCPs (excluding items disclosed in rows 7 to 10), of which: 7,932 159
3 (i) OTC derivative transactions 2,923 59
4 (ii) exchange-traded derivative contracts 5,009 100
7 Segregated initial margin 5,906
8 Unsegregated initial margin 13,110 1,278
9 Funded default fund contributions 1,687 538
11 Exposures of the AI as clearing member or client to non-qualifying CCPs (total) 390
12 Default risk exposures to non-qualifying CCPs (excluding items disclosed in rows 17 to 20), of which: 19 19
14 (ii) exchange-traded derivative contracts 19 19
18 Unsegregated initial margin 60 60
19 Funded default fund contributions 25 311
Counterparty default risk under internal ratings-based approach
Table 44: CCR4 – Counterparty default risk exposures (other than those to CCPs) by portfolio and PD range – for IRB approacha b c d e f g
EAD post-CRM Average PD
Number ofobligors Average LGD
Averagematurity RWAs RWA density
PD scale HK$m % % years HK$m %
Portfolio (i) – Sovereign
0.00 to < 0.15 38,620 0.01 48 44.6 0.28 697 2
0.25 to < 0.50 21 0.37 1 45.0 1.00 9 44
0.75 to < 2.50 120 0.94 2 45.7 1.12 89 74
Sub-total at 31 Dec 2018 38,761 0.02 51 44.6 0.29 795 2
Portfolio (ii) – Bank
0.00 to < 0.15 83,349 0.06 1,417 37.8 1.34 13,141 16
0.15 to < 0.25 5,845 0.22 206 47.7 1.10 2,609 45
0.25 to < 0.50 2,725 0.37 61 44.6 1.12 1,573 58
0.50 to < 0.75 2,736 0.63 50 44.0 0.97 1,991 73
0.75 to < 2.50 1,109 1.26 47 47.6 1.10 1,084 98
2.50 to < 10.00 6 3.05 4 45.6 1.00 8 137
Sub-total at 31 Dec 2018 95,770 0.10 1,785 38.9 1.30 20,406 21
Portfolio (iii) – Corporate
0.00 to < 0.15 25,990 0.09 1,281 49.7 2.17 7,712 30
0.15 to < 0.25 8,712 0.22 529 50.1 1.12 3,741 43
0.25 to < 0.50 4,471 0.37 393 51.7 1.27 2,648 59
0.50 to < 0.75 2,446 0.63 371 51.7 1.39 1,859 76
0.75 to < 2.50 5,591 1.38 682 51.3 1.49 5,844 105
2.50 to < 10.00 802 3.47 198 52.2 1.70 1,169 146
10.00 to < 100.00 — 10.16 4 70.3 1.00 — 246
100.00 (Default) — 100.00 1 46.0 1.00 — —
Sub-total at 31 Dec 2018 48,012 0.37 3,459 50.3 1.77 22,973 48
Total (sum of all portfolios) at 31 Dec 2018 182,543 0.15 5,295 43.1 1.21 44,174 24
Details on the scope of models for each of the regulatory portfolios can be found in the ‘Credit risk under internal ratings-based approach’ section from pages 23 to 26 of this document.
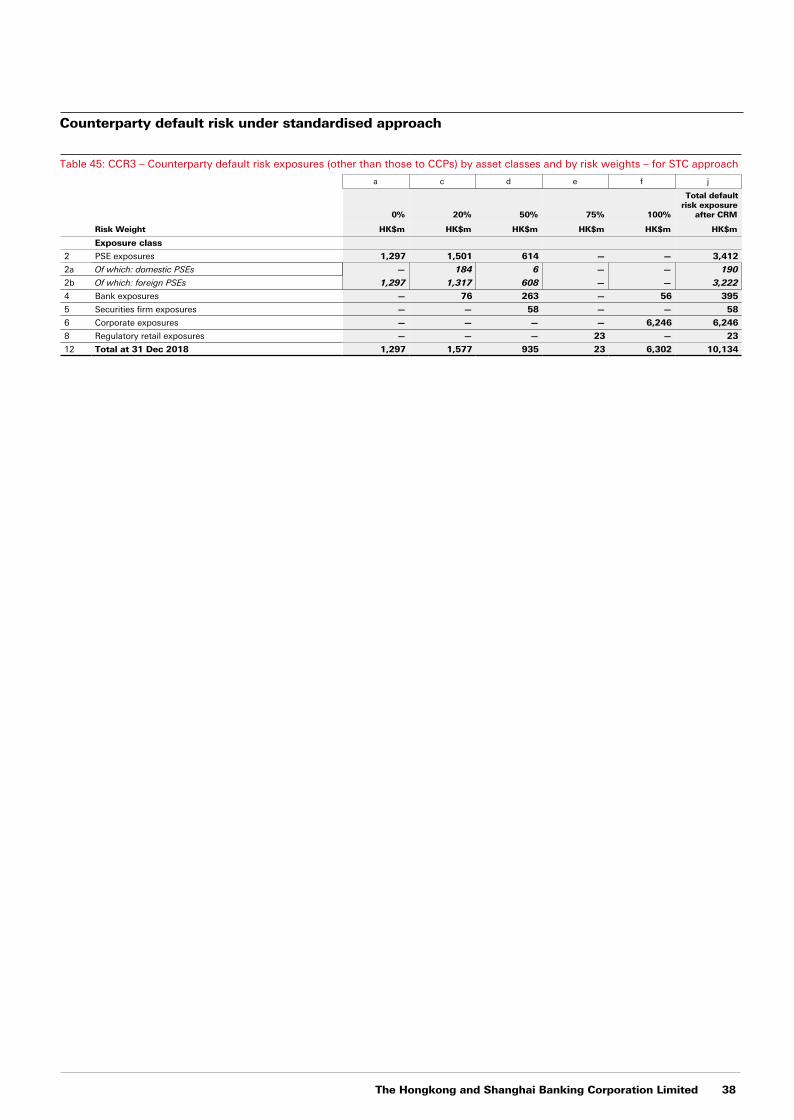
The Hongkong and Shanghai Banking Corporation Limited 38
Counterparty default risk under standardised approach
Table 45: CCR3 – Counterparty default risk exposures (other than those to CCPs) by asset classes and by risk weights – for STC approach
a c d e f j
0% 20% 50% 75% 100%
Total defaultrisk exposure
after CRM
Risk Weight HK$m HK$m HK$m HK$m HK$m HK$m
Exposure class
2 PSE exposures 1,297 1,501 614 — — 3,412
2a Of which: domestic PSEs — 184 6 — — 190
2b Of which: foreign PSEs 1,297 1,317 608 — — 3,222
4 Bank exposures — 76 263 — 56 395
5 Securities firm exposures — — 58 — — 58
6 Corporate exposures — — — — 6,246 6,246
8 Regulatory retail exposures — — — 23 — 23
12 Total at 31 Dec 2018 1,297 1,577 935 23 6,302 10,134
Banking Disclosure Statement at 31 December 2018
39 The Hongkong and Shanghai Banking Corporation Limited
Securitisation
Group securitisation strategy
The group acts as originator, sponsor, liquidity provider and derivative counterparty to our own originated and sponsored securitisations as well as those of third parties. Our strategy is to use securitisation to meet our needs for aggregate funding or capital management, to the extent that market, regulatory treatments and other conditions are suitable, and for customer facilitation. We do not provide support to any of our originated or sponsored securitisations, and it is not our policy to do so.
Group securitisation activity
Our roles in the securitisation process are as follows:
• Originator: where we originate the assets being securitised, either directly or indirectly;
• Sponsor: where we establish and manage a securitisation programme that purchases exposures from third parties; and
• Investor: where we invest in a securitisation transaction directly or provide derivatives or liquidity facilities to a securitisation.
The group as originator We use special purpose entities (‘SPEs’) to securitise customer loans and advances and other debt that we have originated in order to diversify our sources of funding for asset origination and for capital efficiency purposes. In such cases, we transfer the loans and advances to the SPEs for cash, and the SPEs issue debt securities to investors to fund the cash purchases.
In addition, we use SPEs to mitigate the capital absorbed by some of the customer loans and advances we have originated. Credit derivatives are used to transfer the credit risk associated with such customer loans and advances to an SPE, using an approach commonly known as synthetic securitisation by which the SPE writes CDS protection for the group.
The group as sponsor There were no outstanding underlying exposures in securitisation transactions where the group acted as a sponsor.
The group as investor We have exposure to third-party securitisations across a wide range of sectors in the form of investments, liquidity facilities and as a derivative counterparty. These are primarily legacy exposures.
Monitoring of securitisation positions
Securitisation positions are managed by a dedicated team that uses a combination of market standard systems and third-party data providers to monitor performance data and manage market and credit risks.
In the case of re-securitisation positions, similar processes are conducted in respect of the underlying securitisations.
Liquidity risk of securitised assets is consistently managed as part of the group’s liquidity and funding risk management framework and further details are provided on page 32 to 33 of the group's Annual Report and Accounts 2018.
Valuation of securitisation positions The process of valuing our investments in securitisation exposures primarily focuses on quotations from third parties, observed trade levels and calibrated valuations from market standard models.
Our hedging and credit risk mitigation strategy, with regards to retained securitisation and re-securitisation exposures, is to continually review our positions.
Securitisation accounting treatment
For accounting purposes, we consolidate structured entities (including SPEs) when the substance of the relationship indicates that we control them; that is, we are exposed, or have rights, to variable returns from our involvement with the structured entity and have the ability to affect those returns through our power over the entity.
Full details of these assessments and our accounting policy on structured entities may be found in Note 37 on the group's Financial Statements of the Annual Report and Accounts 2018.
We reassess the need to consolidate whenever there is a change in the substance of the relationship between the group and a structured entity.
The group enters into transactions in the normal course of business by which it transfers financial assets to structured entities. Depending on the circumstances, these transfers may either result in these financial assets being fully or partly derecognised, or continuing to be recognised in their entirety.
Full derecognition occurs when we transfer our contractual right to receive cash flows from the financial assets, or assume an obligation to pass on the cash flows from the assets, and transfer substantially all the risks and rewards of ownership. Only in the event that derecognition is achieved are sales and any resultant gains recognised in the financial statements.
Partial derecognition occurs when we sell or otherwise transfer financial assets in such a way that some but not substantially all of the risks and rewards of ownership are transferred and control is retained. These financial assets are recognised on the balance sheet to the extent of our continuing involvement and an associated liability is also recognised. The net carrying amount of the financial asset and associated liability will be based on the measurement basis of the financial asset, either the amortised cost or the fair value of the rights and obligations retained by the entity.
Securitisation regulatory treatment
For regulatory purposes, any reduction in RWAs that would be achieved by our own originated securitisations must satisfy section 229 (1) of the BCR. If achieved, the associated SPEs and underlying assets are not consolidated but exposures to them, including derivatives or liquidity facilities, are risk-weighted as securitisation positions.
For our securitisation banking book positions, we use the securitisation internal ratings-based approach, securitisation external ratings-based approach, securitisation standardised approach or securitisation fall-back approach to calculate the credit risk for our securitisation exposures. Securitisation positions in the trading book are under the standardised (market risk) approach, which calculates the market risk capital charge for specific risk interest rate exposures.
The group uses Standard & Poor’s Rating Services, Moody’s Investors Service and Fitch Ratings as the ECAIs for each and all classes of securitisation exposures.
Analysis of securitisation exposures
The group’s involvement in securitisation activities in the second half of 2018 reflects the following:
• as an investor, the group’s securitisation activities mainly consisted of changes to the existing portfolio mix in the normal course of business;
• as an originator, the group securitised HK$13,139m of additional residential mortgages in the banking book into an existing SPE where we consolidated and transferred HK$482m of loan assets in the banking book to a third-party securitisation.
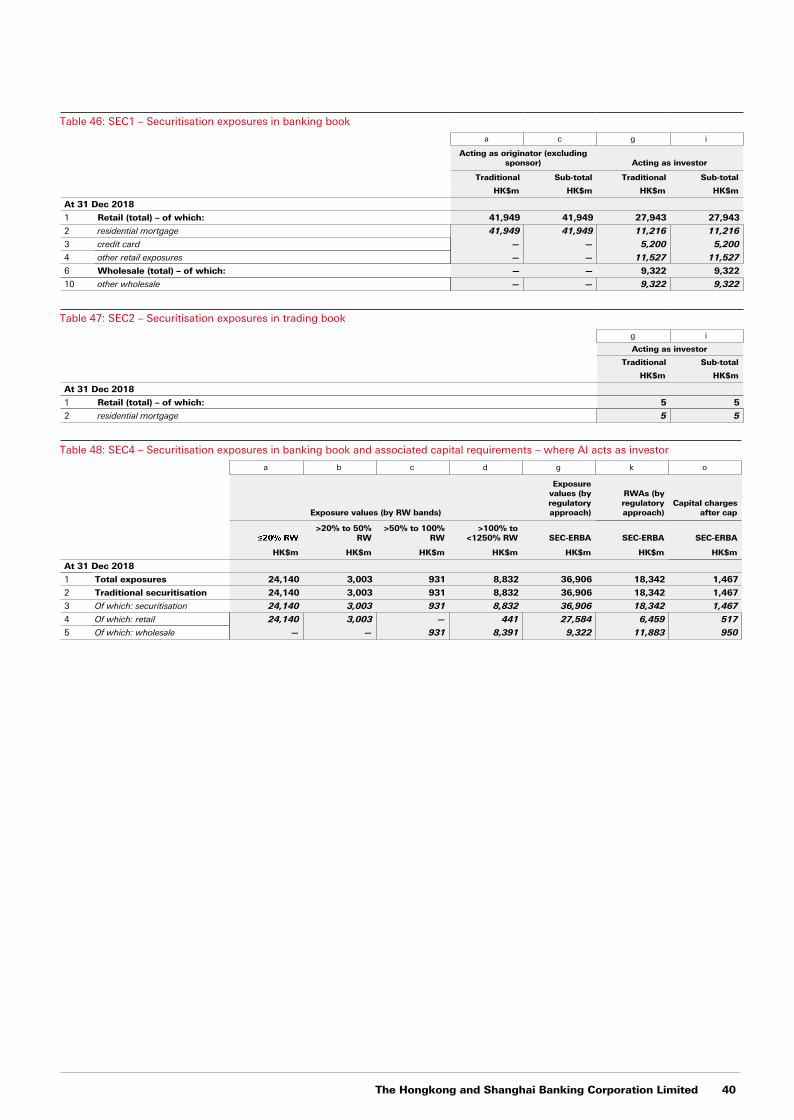
The Hongkong and Shanghai Banking Corporation Limited 40
Table 46: SEC1 – Securitisation exposures in banking book
a c g i
Acting as originator (excludingsponsor) Acting as investor
Traditional Sub-total Traditional Sub-total
HK$m HK$m HK$m HK$m
At 31 Dec 2018
1 Retail (total) – of which: 41,949 41,949 27,943 27,943
2 residential mortgage 41,949 41,949 11,216 11,216
3 credit card — — 5,200 5,200
4 other retail exposures — — 11,527 11,527
6 Wholesale (total) – of which: — — 9,322 9,322
10 other wholesale — — 9,322 9,322
Table 47: SEC2 – Securitisation exposures in trading book
g i
Acting as investor
Traditional Sub-total
HK$m HK$m
At 31 Dec 2018
1 Retail (total) – of which: 5 5
2 residential mortgage 5 5
Table 48: SEC4 – Securitisation exposures in banking book and associated capital requirements – where AI acts as investor
a b c d g k o
Exposure values (by RW bands)
Exposurevalues (byregulatoryapproach)
RWAs (byregulatoryapproach)
Capital chargesafter cap
>20% to 50%RW
>50% to 100%RW
>100% to<1250% RW SEC-ERBA SEC-ERBA SEC-ERBA
HK$m HK$m HK$m HK$m HK$m HK$m HK$m
At 31 Dec 2018
1 Total exposures 24,140 3,003 931 8,832 36,906 18,342 1,467
2 Traditional securitisation 24,140 3,003 931 8,832 36,906 18,342 1,467
3 Of which: securitisation 24,140 3,003 931 8,832 36,906 18,342 1,467
4 Of which: retail 24,140 3,003 — 441 27,584 6,459 517
5 Of which: wholesale — — 931 8,391 9,322 11,883 950
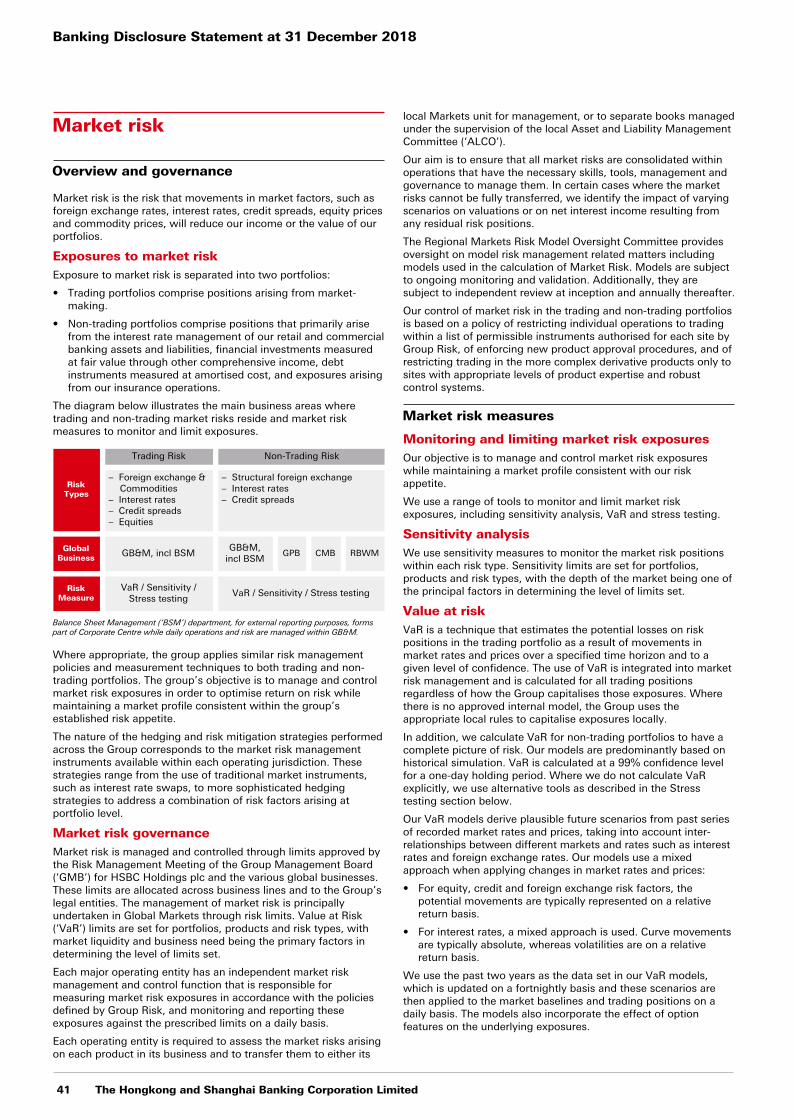
Banking Disclosure Statement at 31 December 2018
41 The Hongkong and Shanghai Banking Corporation Limited
Market risk
Overview and governance
Market risk is the risk that movements in market factors, such as foreign exchange rates, interest rates, credit spreads, equity prices and commodity prices, will reduce our income or the value of our portfolios.
Exposures to market riskExposure to market risk is separated into two portfolios:
• Trading portfolios comprise positions arising from market-making.
• Non-trading portfolios comprise positions that primarily arise from the interest rate management of our retail and commercial banking assets and liabilities, financial investments measured at fair value through other comprehensive income, debt instruments measured at amortised cost, and exposures arising from our insurance operations.
The diagram below illustrates the main business areas where trading and non-trading market risks reside and market risk measures to monitor and limit exposures.
RiskTypes
Trading Risk Non-Trading Risk
– Foreign exchange & Commodities
– Interest rates– Credit spreads– Equities
– Structural foreign exchange– Interest rates– Credit spreads
GlobalBusiness GB&M, incl BSM
GB&M,incl BSM
GPB CMB RBWM
RiskMeasure
VaR / Sensitivity /Stress testing
VaR / Sensitivity / Stress testing
Balance Sheet Management (‘BSM’) department, for external reporting purposes, forms part of Corporate Centre while daily operations and risk are managed within GB&M.
Where appropriate, the group applies similar risk management policies and measurement techniques to both trading and non-trading portfolios. The group’s objective is to manage and control market risk exposures in order to optimise return on risk while maintaining a market profile consistent within the group’s established risk appetite.
The nature of the hedging and risk mitigation strategies performed across the Group corresponds to the market risk management instruments available within each operating jurisdiction. These strategies range from the use of traditional market instruments, such as interest rate swaps, to more sophisticated hedging strategies to address a combination of risk factors arising at portfolio level.
Market risk governanceMarket risk is managed and controlled through limits approved by the Risk Management Meeting of the Group Management Board (‘GMB’) for HSBC Holdings plc and the various global businesses. These limits are allocated across business lines and to the Group’s legal entities. The management of market risk is principally undertaken in Global Markets through risk limits. Value at Risk (‘VaR’) limits are set for portfolios, products and risk types, with market liquidity and business need being the primary factors in determining the level of limits set.
Each major operating entity has an independent market risk management and control function that is responsible for measuring market risk exposures in accordance with the policies defined by Group Risk, and monitoring and reporting these exposures against the prescribed limits on a daily basis.
Each operating entity is required to assess the market risks arising on each product in its business and to transfer them to either its
local Markets unit for management, or to separate books managed under the supervision of the local Asset and Liability Management Committee (‘ALCO’).
Our aim is to ensure that all market risks are consolidated within operations that have the necessary skills, tools, management and governance to manage them. In certain cases where the market risks cannot be fully transferred, we identify the impact of varying scenarios on valuations or on net interest income resulting from any residual risk positions.
The Regional Markets Risk Model Oversight Committee provides oversight on model risk management related matters including models used in the calculation of Market Risk. Models are subject to ongoing monitoring and validation. Additionally, they are subject to independent review at inception and annually thereafter.
Our control of market risk in the trading and non-trading portfolios is based on a policy of restricting individual operations to trading within a list of permissible instruments authorised for each site by Group Risk, of enforcing new product approval procedures, and of restricting trading in the more complex derivative products only to sites with appropriate levels of product expertise and robust control systems.
Market risk measures
Monitoring and limiting market risk exposuresOur objective is to manage and control market risk exposures while maintaining a market profile consistent with our risk appetite.
We use a range of tools to monitor and limit market risk exposures, including sensitivity analysis, VaR and stress testing.
Sensitivity analysisWe use sensitivity measures to monitor the market risk positions within each risk type. Sensitivity limits are set for portfolios, products and risk types, with the depth of the market being one of the principal factors in determining the level of limits set.
Value at riskVaR is a technique that estimates the potential losses on risk positions in the trading portfolio as a result of movements in market rates and prices over a specified time horizon and to a given level of confidence. The use of VaR is integrated into market risk management and is calculated for all trading positions regardless of how the Group capitalises those exposures. Where there is no approved internal model, the Group uses the appropriate local rules to capitalise exposures locally.
In addition, we calculate VaR for non-trading portfolios to have a complete picture of risk. Our models are predominantly based on historical simulation. VaR is calculated at a 99% confidence level for a one-day holding period. Where we do not calculate VaR explicitly, we use alternative tools as described in the Stress testing section below.
Our VaR models derive plausible future scenarios from past series of recorded market rates and prices, taking into account inter-relationships between different markets and rates such as interest rates and foreign exchange rates. Our models use a mixed approach when applying changes in market rates and prices:
• For equity, credit and foreign exchange risk factors, the potential movements are typically represented on a relative return basis.
• For interest rates, a mixed approach is used. Curve movements are typically absolute, whereas volatilities are on a relative return basis.
We use the past two years as the data set in our VaR models, which is updated on a fortnightly basis and these scenarios are then applied to the market baselines and trading positions on a daily basis. The models also incorporate the effect of option features on the underlying exposures.
The Hongkong and Shanghai Banking Corporation Limited 42
The valuation approach used in our models values:
• non-linear instruments using a full revaluation approach; and
• linear instruments, such as bonds and swaps, using a sensitivity based approach.
The nature of the VaR models means that an increase in observed market volatility will lead to an increase in VaR even without any changes in the underlying positions.
VaR model limitationsAlthough a valuable guide to risk, VaR should always be viewed in the context of its limitations. For example:
• the use of historical data as a proxy for estimating future events may not encompass all potential events, particularly those which are extreme in nature;
• the use of a holding period assumes that all positions can be liquidated or the risks offset during that period. This may not fully reflect the market risk arising at times of severe illiquidity, when the holding period may be insufficient to liquidate or hedge all positions fully;
• the use of a 99% confidence level, by definition does not take into account losses that might occur beyond this level of confidence; and
• VaR is calculated on the basis of exposures outstanding at the close of business and therefore does not necessarily reflect intra-day exposures.
Risk not in VaR frameworkThe Risks not in VaR (‘RNIV’) framework captures risks from exposures in the HSBC trading book that are not captured well by the VaR model. Our VaR model is designed to capture significant basis risk, such as CDS versus bond, asset swap spreads and cross-currency basis. Other basis risks which are not completely covered in VaR, such as the London interbank offered rate (‘Libor’) tenor basis, are complemented by our RNIV calculations and are integrated into our capital framework.
Risk factors are reviewed on a regular basis and either incorporated directly in the VaR models, where possible, or quantified through the VaR-based RNIV approach or a stress test approach within the RNIV framework. The outcome of the VaR-based RNIV is included in the VaR calculation and back-testing; a stressed VaR RNIV is also computed for the risk factors considered in the VaR-based RNIV approach. Stress-type RNIVs are also included where appropriate.
Back-testingWe routinely validate the accuracy of our VaR models by back-testing them against both actual, and hypothetical profit and loss against the trading VaR numbers. Hypothetical profit and loss excludes non-modelled items, such as fees, commissions and revenues of intra-day transactions.
The actual number of profits or losses in excess of VaR over this period can therefore be used to gauge how well the models are performing.
We back-test VaR at various levels which reflect a full legal entity scope of the group, including entities that do not have local permission to use VaR for regulatory purposes. Back-testing using the regulatory hierarchy includes entities which have approval to use VaR in the calculation of market risk regulatory capital requirement.
Stress testingStress testing is an important procedure that is integrated into our market risk management tool to evaluate the potential impact on portfolio values of more extreme, although plausible, events or movements in a set of financial variables. In such scenarios, losses can be much greater than those predicted by VaR modelling.
Stress testing is implemented at legal entity, regional and overall Group levels. A set of scenarios is used consistently across all regions within the Group. Scenarios are tailored to capture the relevant events or market movements at each level. The risk appetite around potential stress losses for the region is set and monitored against referral limits.
Market risk reverse stress tests are undertaken based on the premise that there is a fixed loss. The stress testing process identifies which scenarios lead to this loss. The rationale behind the reverse stress test is to understand scenarios that are beyond normal business settings that could have contagion and systemic implications.
Stressed VaR and stress testing, together with reverse stress testing and the management of gap risk, provide management with insights regarding the ‘tail risk’ beyond VaR for which HSBC’s appetite is limited.
The market risk stress testing incorporates the historical and hypothetical events.
Market risk under standardised approach
Table 49: MR1 – Market risk under STM approach
a
RWAs
HK$m
Outright product exposures
1 Interest rate exposures (general and specific risk) 889
2 Equity exposures (general and specific risk) 1,884
4 Commodity exposures 33
8 Securitisation exposures 59
9 Total at 31 Dec 2018 2,865
Market risk capital models
There are a number of measures that HSBC has permission to use in calculating regulatory capital, which are listed below.
For regulatory purposes, the trading book comprises all positions in financial instruments and commodities that are held with trading intent, which are taken with the intention of benefiting from short-term gains or positions where it can be demonstrated that they hedge positions in the trading book.
Trading book positions must either be free of any restrictive covenants on their tradability or be capable of being hedged.
HSBC maintains a Trading Book Policy that defines the minimum requirements for trading book positions and the process for classifying positions as trading or banking book. Positions in the trading book are subject to market risk-based rules, i.e. market risk capital, computed using regulatory approved models. Otherwise, the market risk capital is calculated using the Standardised approach.
Banking Disclosure Statement at 31 December 2018
43 The Hongkong and Shanghai Banking Corporation Limited
If any of the policy criteria are not met, then the position is categorised as a banking book exposure.
VaRVaR used for regulatory purposes differs from VaR used for management purpose with key differences listed below.
VaR Regulatory Management
Scope Regulatory approval Broader population oftrading and banking book
positionsConfidence interval 99% 99%Liquidity horizon 10-day 1-dayData set Past 2 years Past 2 years
The trading books that received approval from the regulator to be covered via an internal model are used to calculate VaR for regulatory purposes. Regulatory VaR levels contribute to the calculation of market risk RWAs.
Stressed VaRStressed VaR (‘SVaR’) is primarily used for regulatory capital purposes and is integrated into the risk management process to ensure prudent capital management. Stressed VaR complements other risk measures by providing the potential losses under stressed market conditions.
Stressed VaR modelling follows the same approach as our VaR risk measure, except for the following:
• potential market movements employed for stressed VaR calculations are based on a continuous one-year period of stress for the trading portfolio;
• it is calculated to a 99% confidence using a 10-day holding period;
• it is based on an actual 10-day holding period, whereas Regulatory VaR is based on a one-day holding period scaled to 10 days.
Incremental Risk ChargeThe IRC measures the default and migration risk of issuers of traded instruments.
IRC risk factors include credit migration, default, product basis, concentration, hedge mismatch, recovery rate and liquidity. The PDs are floored to reflect the lack of historical data on defaults and a period of stress is used to calibrate the spread changes for the relevant ratings. The IRC model is validated quarterly by stressing key model parameters and reviewing the response of the model.
The IRC is a stand-alone charge generating no diversification benefit with other charges. We do not use weighted averages for calculating the liquidity horizon for the IRC measure. IRC relies on a range of liquidity horizons from three months, corresponding to the regulatory floor, to one year. A wide range of criteria can indicate the liquidity of a position. The liquidity horizon for the IRC measure depends on a set of factors, such as issuer features, including rating, sector, geography, and size of positions, including product, maturity and concentration.
The IRC transition matrices are calibrated using transition and default data published by three rating agencies (Standard & Poor’s, Moody’s and Fitch Ratings) as the starting point, in combination with internal rules for flooring. The average of the three matrices is computed for each sector, ignoring zero transition probabilities. The PDs are then floored: sovereign PDs are consistent with IRB, while a 3bp floor is applied to corporates’ and banks’ PDs.
The IRC correlation matrix is derived from historical CDS spreads data, covering the latest two-year VaR period. The returns estimation window is set equal to either three, or 12 months, depending on the liquidity horizon of each obligor. First, each obligor is mapped to six sector/rating categories; then the correlation matrix is obtained by computing the arithmetic mean of correlations for each category.
Analysis of VaR, stressed VaR and incremental risk charge measures
The following table is prepared in accordance with the basis of preparation used to calculate the group’s market risk capital charge under the IMM approach.
Table 50: MR3 – IMM approach values for market risk exposures
a
Footnotes HK$m
At 31 Dec 2018
VaR (10 day — one-tailed 99% confidence interval) 1
1 Maximum Value 713
2 Average Value 541
3 Minimum Value 390
4 Period End 503
Stressed VaR (10 day — one-tailed 99% confidence interval) 1
5 Maximum Value 959
6 Average Value 663
7 Minimum Value 439
8 Period End 872
Incremental risk charge (IRC) (99.9% confidence interval)
9 Maximum Value 4,126
10 Average Value 3,065
11 Minimum Value 1,963
12 Period End 2,339
1 The total VaR excludes VaR RNIV.
The group's trading VaR at 31 December 2018 was lower than 30 June 2018 due to the reduction in the interest rate trading VaR, which was driven by reduced inventory positions.
The group's trading Stressed VaR at 31 December 2018 was higher than 30 June 2018 due to the increase in trading position under the equities business.
Trading IRC at 31 December 2018 was lower than 30 June 2018 due to the reduction in the trading bond inventory.
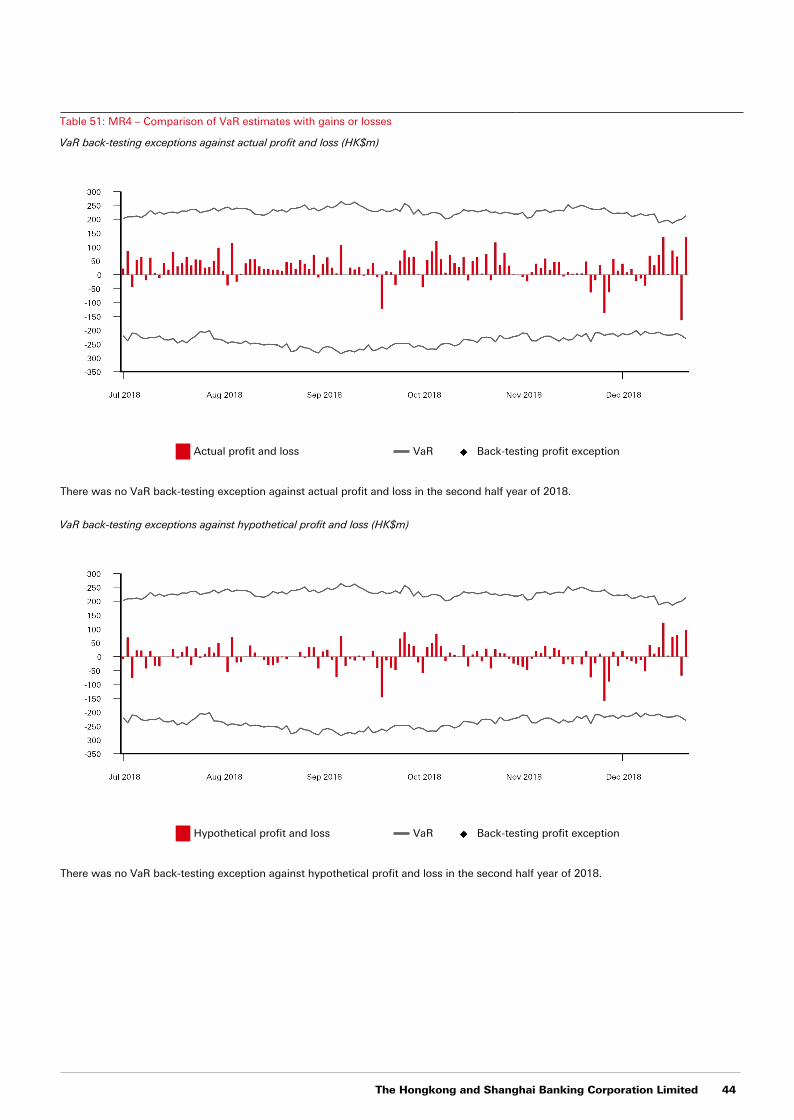
The Hongkong and Shanghai Banking Corporation Limited 44
Table 51: MR4 – Comparison of VaR estimates with gains or losses
VaR back-testing exceptions against actual profit and loss (HK$m)
Actual profit and loss VaR Back-testing profit exception
There was no VaR back-testing exception against actual profit and loss in the second half year of 2018.
VaR back-testing exceptions against hypothetical profit and loss (HK$m)
Hypothetical profit and loss VaR Back-testing profit exception
There was no VaR back-testing exception against hypothetical profit and loss in the second half year of 2018.
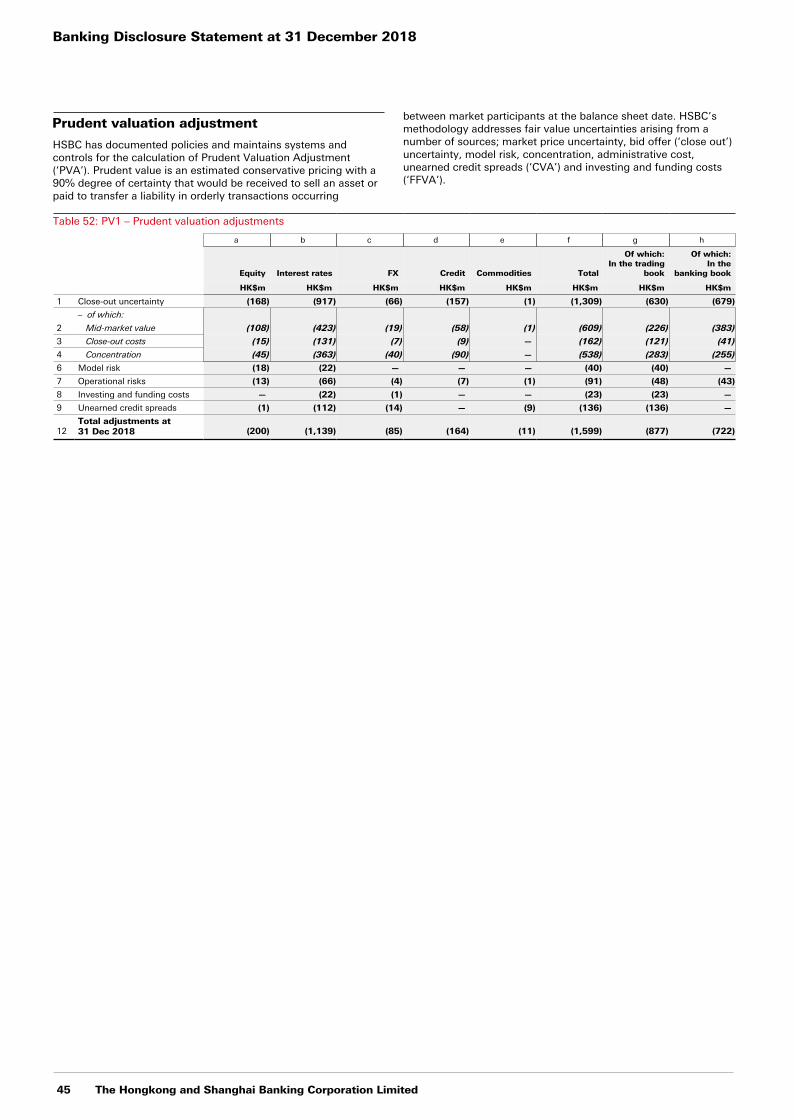
Banking Disclosure Statement at 31 December 2018
45 The Hongkong and Shanghai Banking Corporation Limited
Prudent valuation adjustment
HSBC has documented policies and maintains systems and controls for the calculation of Prudent Valuation Adjustment (‘PVA’). Prudent value is an estimated conservative pricing with a 90% degree of certainty that would be received to sell an asset or paid to transfer a liability in orderly transactions occurring
between market participants at the balance sheet date. HSBC’s methodology addresses fair value uncertainties arising from a number of sources; market price uncertainty, bid offer (‘close out’) uncertainty, model risk, concentration, administrative cost, unearned credit spreads (‘CVA’) and investing and funding costs (‘FFVA’).
Table 52: PV1 – Prudent valuation adjustments
a b c d e f g h
Equity Interest rates FX Credit Commodities Total
Of which: In the trading
book
Of which: In the
banking book
HK$m HK$m HK$m HK$m HK$m HK$m HK$m HK$m
1 Close-out uncertainty (168) (917) (66) (157) (1) (1,309) (630) (679)
– of which:
2 Mid-market value (108) (423) (19) (58) (1) (609) (226) (383)
3 Close-out costs (15) (131) (7) (9) — (162) (121) (41)
4 Concentration (45) (363) (40) (90) — (538) (283) (255)
6 Model risk (18) (22) — — — (40) (40) —
7 Operational risks (13) (66) (4) (7) (1) (91) (48) (43)
8 Investing and funding costs — (22) (1) — — (23) (23) —
9 Unearned credit spreads (1) (112) (14) — (9) (136) (136) —
12Total adjustments at31 Dec 2018 (200) (1,139) (85) (164) (11) (1,599) (877) (722)
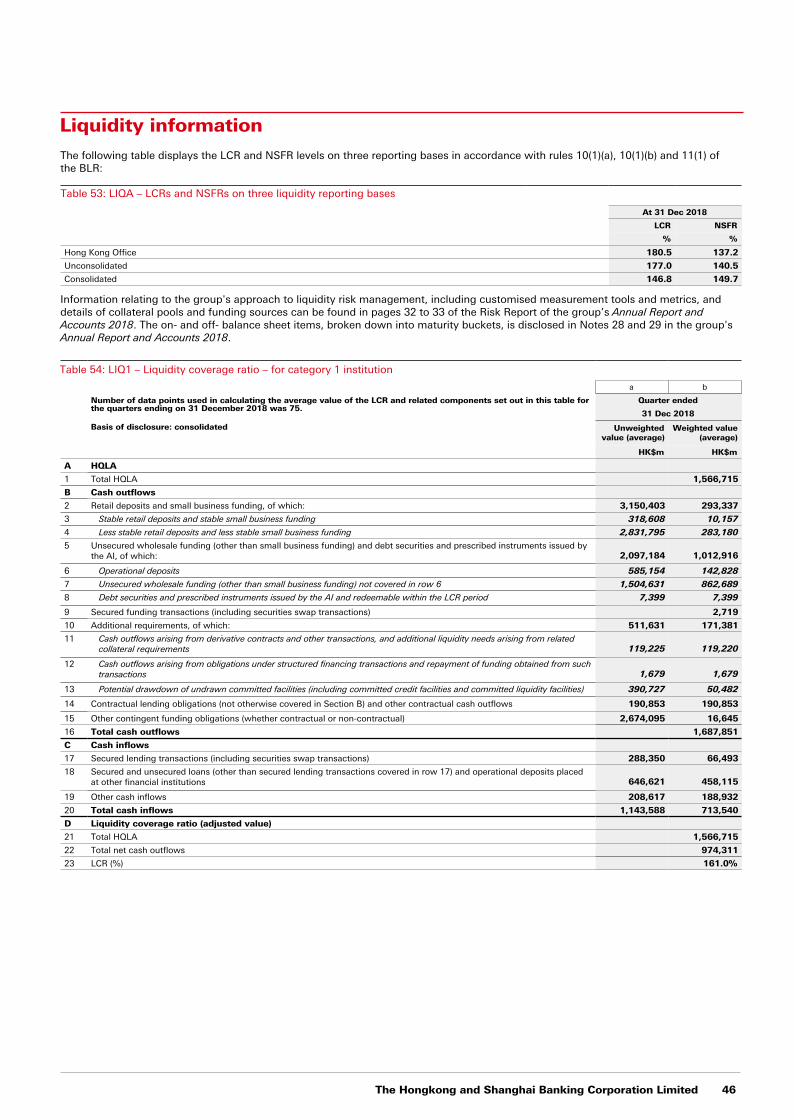
The Hongkong and Shanghai Banking Corporation Limited 46
Liquidity informationThe following table displays the LCR and NSFR levels on three reporting bases in accordance with rules 10(1)(a), 10(1)(b) and 11(1) of the BLR:
Table 53: LIQA – LCRs and NSFRs on three liquidity reporting bases
At 31 Dec 2018
LCR NSFR
% %
Hong Kong Office 180.5 137.2
Unconsolidated 177.0 140.5
Consolidated 146.8 149.7
Information relating to the group's approach to liquidity risk management, including customised measurement tools and metrics, and details of collateral pools and funding sources can be found in pages 32 to 33 of the Risk Report of the group’s Annual Report and Accounts 2018. The on- and off- balance sheet items, broken down into maturity buckets, is disclosed in Notes 28 and 29 in the group's Annual Report and Accounts 2018.
Table 54: LIQ1 – Liquidity coverage ratio – for category 1 institution
a b
Number of data points used in calculating the average value of the LCR and related components set out in this table for the quarters ending on 31 December 2018 was 75.
Quarter ended
31 Dec 2018
Basis of disclosure: consolidated Unweightedvalue (average)
Weighted value(average)
HK$m HK$m
A HQLA
1 Total HQLA 1,566,715
B Cash outflows
2 Retail deposits and small business funding, of which: 3,150,403 293,337
3 Stable retail deposits and stable small business funding 318,608 10,157
4 Less stable retail deposits and less stable small business funding 2,831,795 283,180
5 Unsecured wholesale funding (other than small business funding) and debt securities and prescribed instruments issued bythe AI, of which: 2,097,184 1,012,916
6 Operational deposits 585,154 142,828
7 Unsecured wholesale funding (other than small business funding) not covered in row 6 1,504,631 862,689
8 Debt securities and prescribed instruments issued by the AI and redeemable within the LCR period 7,399 7,399
9 Secured funding transactions (including securities swap transactions) 2,719
10 Additional requirements, of which: 511,631 171,381
11 Cash outflows arising from derivative contracts and other transactions, and additional liquidity needs arising from relatedcollateral requirements 119,225 119,220
12 Cash outflows arising from obligations under structured financing transactions and repayment of funding obtained from suchtransactions 1,679 1,679
13 Potential drawdown of undrawn committed facilities (including committed credit facilities and committed liquidity facilities) 390,727 50,482
14 Contractual lending obligations (not otherwise covered in Section B) and other contractual cash outflows 190,853 190,853
15 Other contingent funding obligations (whether contractual or non-contractual) 2,674,095 16,645
16 Total cash outflows 1,687,851
C Cash inflows
17 Secured lending transactions (including securities swap transactions) 288,350 66,493
18 Secured and unsecured loans (other than secured lending transactions covered in row 17) and operational deposits placedat other financial institutions 646,621 458,115
19 Other cash inflows 208,617 188,932
20 Total cash inflows 1,143,588 713,540
D Liquidity coverage ratio (adjusted value)
21 Total HQLA 1,566,715
22 Total net cash outflows 974,311
23 LCR (%) 161.0%
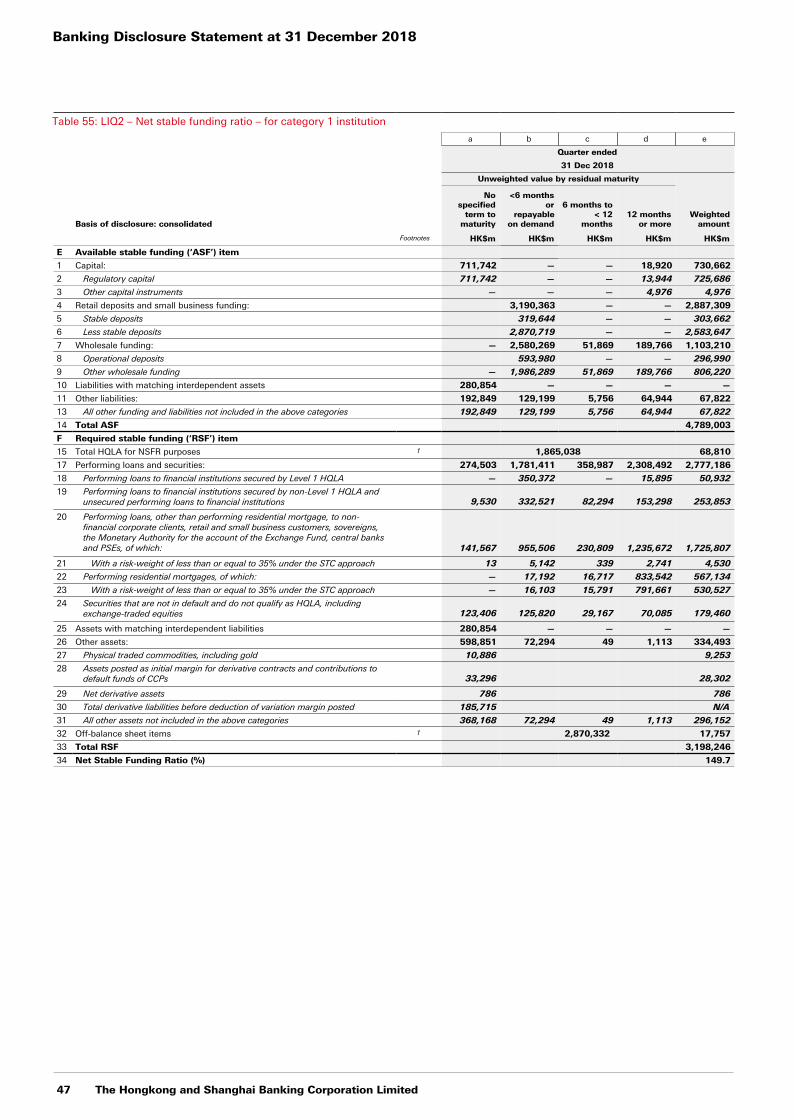
Banking Disclosure Statement at 31 December 2018
47 The Hongkong and Shanghai Banking Corporation Limited
Table 55: LIQ2 – Net stable funding ratio – for category 1 institution
a b c d e
Quarter ended
31 Dec 2018
Unweighted value by residual maturity
WeightedamountBasis of disclosure: consolidated
Nospecified
term tomaturity
<6 monthsor
repayableon demand
6 months to< 12
months12 months
or more
Footnotes HK$m HK$m HK$m HK$m HK$m
E Available stable funding (‘ASF’) item
1 Capital: 711,742 — — 18,920 730,662
2 Regulatory capital 711,742 — — 13,944 725,686
3 Other capital instruments — — — 4,976 4,976
4 Retail deposits and small business funding: 3,190,363 — — 2,887,309
5 Stable deposits 319,644 — — 303,662
6 Less stable deposits 2,870,719 — — 2,583,647
7 Wholesale funding: — 2,580,269 51,869 189,766 1,103,210
8 Operational deposits 593,980 — — 296,990
9 Other wholesale funding — 1,986,289 51,869 189,766 806,220
10 Liabilities with matching interdependent assets 280,854 — — — —
11 Other liabilities: 192,849 129,199 5,756 64,944 67,822
13 All other funding and liabilities not included in the above categories 192,849 129,199 5,756 64,944 67,822
14 Total ASF 4,789,003
F Required stable funding (‘RSF’) item
15 Total HQLA for NSFR purposes 1 1,865,038 68,810
17 Performing loans and securities: 274,503 1,781,411 358,987 2,308,492 2,777,186
18 Performing loans to financial institutions secured by Level 1 HQLA — 350,372 — 15,895 50,932
19 Performing loans to financial institutions secured by non-Level 1 HQLA andunsecured performing loans to financial institutions 9,530 332,521 82,294 153,298 253,853
20 Performing loans, other than performing residential mortgage, to non-financial corporate clients, retail and small business customers, sovereigns,the Monetary Authority for the account of the Exchange Fund, central banksand PSEs, of which: 141,567 955,506 230,809 1,235,672 1,725,807
21 With a risk-weight of less than or equal to 35% under the STC approach 13 5,142 339 2,741 4,530
22 Performing residential mortgages, of which: — 17,192 16,717 833,542 567,134
23 With a risk-weight of less than or equal to 35% under the STC approach — 16,103 15,791 791,661 530,527
24 Securities that are not in default and do not qualify as HQLA, includingexchange-traded equities 123,406 125,820 29,167 70,085 179,460
25 Assets with matching interdependent liabilities 280,854 — — — —
26 Other assets: 598,851 72,294 49 1,113 334,493
27 Physical traded commodities, including gold 10,886 9,253
28 Assets posted as initial margin for derivative contracts and contributions todefault funds of CCPs 33,296 28,302
29 Net derivative assets 786 786
30 Total derivative liabilities before deduction of variation margin posted 185,715 N/A
31 All other assets not included in the above categories 368,168 72,294 49 1,113 296,152
32 Off-balance sheet items 1 2,870,332 17,757
33 Total RSF 3,198,246
34 Net Stable Funding Ratio (%) 149.7
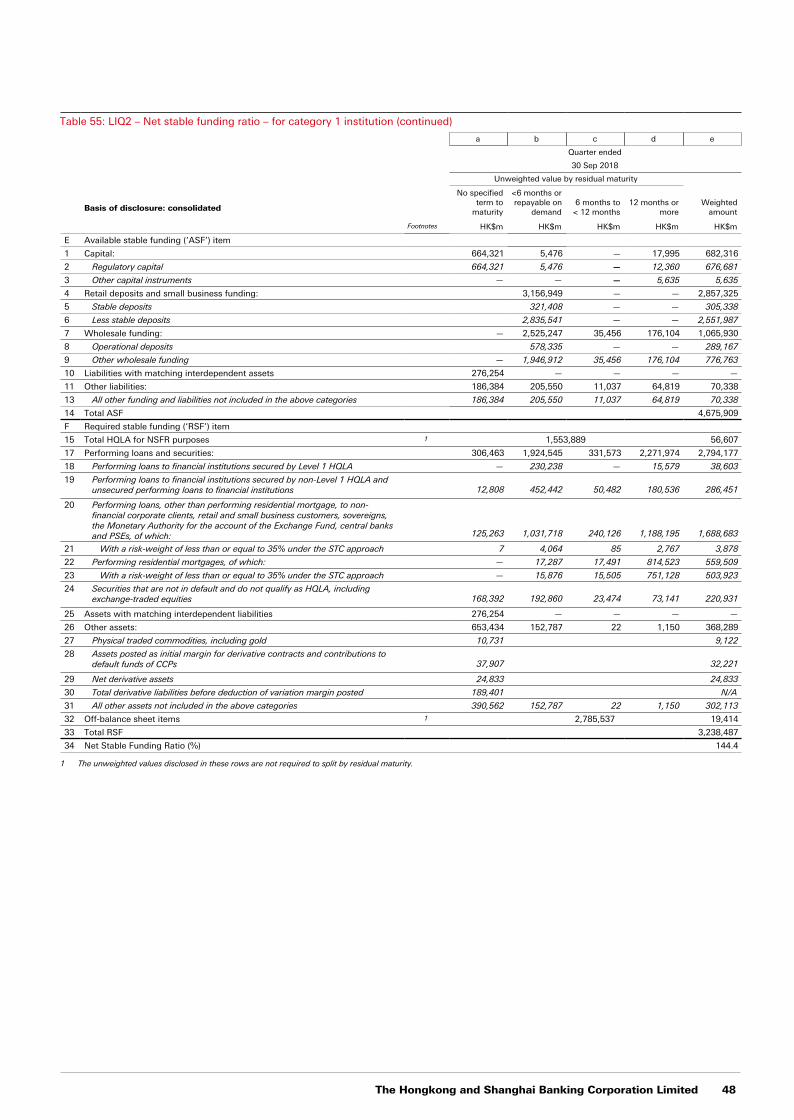
The Hongkong and Shanghai Banking Corporation Limited 48
Table 55: LIQ2 – Net stable funding ratio – for category 1 institution (continued)
a b c d e
Quarter ended
30 Sep 2018
Unweighted value by residual maturity
WeightedamountBasis of disclosure: consolidated
No specifiedterm to
maturity
<6 months orrepayable on
demand6 months to
< 12 months12 months or
more
Footnotes HK$m HK$m HK$m HK$m HK$m
E Available stable funding (‘ASF’) item
1 Capital: 664,321 5,476 — 17,995 682,316
2 Regulatory capital 664,321 5,476 — 12,360 676,681
3 Other capital instruments — — — 5,635 5,635
4 Retail deposits and small business funding: 3,156,949 — — 2,857,325
5 Stable deposits 321,408 — — 305,338
6 Less stable deposits 2,835,541 — — 2,551,987
7 Wholesale funding: — 2,525,247 35,456 176,104 1,065,930
8 Operational deposits 578,335 — — 289,167
9 Other wholesale funding — 1,946,912 35,456 176,104 776,763
10 Liabilities with matching interdependent assets 276,254 — — — —
11 Other liabilities: 186,384 205,550 11,037 64,819 70,338
13 All other funding and liabilities not included in the above categories 186,384 205,550 11,037 64,819 70,338
14 Total ASF 4,675,909
F Required stable funding (‘RSF’) item
15 Total HQLA for NSFR purposes 1 1,553,889 56,607
17 Performing loans and securities: 306,463 1,924,545 331,573 2,271,974 2,794,177
18 Performing loans to financial institutions secured by Level 1 HQLA — 230,238 — 15,579 38,603
19 Performing loans to financial institutions secured by non-Level 1 HQLA andunsecured performing loans to financial institutions 12,808 452,442 50,482 180,536 286,451
20 Performing loans, other than performing residential mortgage, to non-financial corporate clients, retail and small business customers, sovereigns,the Monetary Authority for the account of the Exchange Fund, central banksand PSEs, of which: 125,263 1,031,718 240,126 1,188,195 1,688,683
21 With a risk-weight of less than or equal to 35% under the STC approach 7 4,064 85 2,767 3,878
22 Performing residential mortgages, of which: — 17,287 17,491 814,523 559,509
23 With a risk-weight of less than or equal to 35% under the STC approach — 15,876 15,505 751,128 503,923
24 Securities that are not in default and do not qualify as HQLA, includingexchange-traded equities 168,392 192,860 23,474 73,141 220,931
25 Assets with matching interdependent liabilities 276,254 — — — —
26 Other assets: 653,434 152,787 22 1,150 368,289
27 Physical traded commodities, including gold 10,731 9,122
28 Assets posted as initial margin for derivative contracts and contributions todefault funds of CCPs 37,907 32,221
29 Net derivative assets 24,833 24,833
30 Total derivative liabilities before deduction of variation margin posted 189,401 N/A
31 All other assets not included in the above categories 390,562 152,787 22 1,150 302,113
32 Off-balance sheet items 1 2,785,537 19,414
33 Total RSF 3,238,487
34 Net Stable Funding Ratio (%) 144.4
1 The unweighted values disclosed in these rows are not required to split by residual maturity.
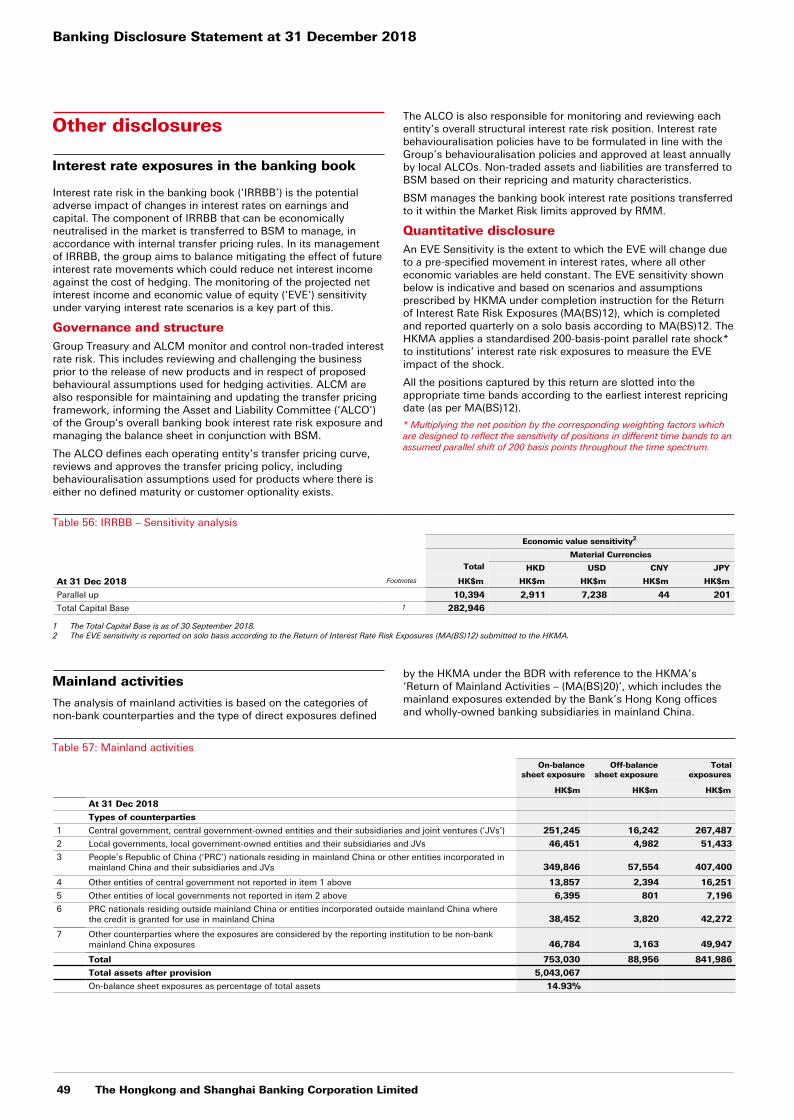
Banking Disclosure Statement at 31 December 2018
49 The Hongkong and Shanghai Banking Corporation Limited
Other disclosures
Interest rate exposures in the banking book
Interest rate risk in the banking book (‘IRRBB’) is the potential adverse impact of changes in interest rates on earnings and capital. The component of IRRBB that can be economically neutralised in the market is transferred to BSM to manage, in accordance with internal transfer pricing rules. In its management of IRRBB, the group aims to balance mitigating the effect of future interest rate movements which could reduce net interest income against the cost of hedging. The monitoring of the projected net interest income and economic value of equity (‘EVE’) sensitivity under varying interest rate scenarios is a key part of this.
Governance and structure Group Treasury and ALCM monitor and control non-traded interest rate risk. This includes reviewing and challenging the business prior to the release of new products and in respect of proposed behavioural assumptions used for hedging activities. ALCM are also responsible for maintaining and updating the transfer pricing framework, informing the Asset and Liability Committee (‘ALCO’) of the Group's overall banking book interest rate risk exposure and managing the balance sheet in conjunction with BSM.
The ALCO defines each operating entity’s transfer pricing curve, reviews and approves the transfer pricing policy, including behaviouralisation assumptions used for products where there is either no defined maturity or customer optionality exists.
The ALCO is also responsible for monitoring and reviewing each entity’s overall structural interest rate risk position. Interest rate behaviouralisation policies have to be formulated in line with the Group’s behaviouralisation policies and approved at least annually by local ALCOs. Non-traded assets and liabilities are transferred to BSM based on their repricing and maturity characteristics.
BSM manages the banking book interest rate positions transferred to it within the Market Risk limits approved by RMM.
Quantitative disclosureAn EVE Sensitivity is the extent to which the EVE will change due to a pre-specified movement in interest rates, where all other economic variables are held constant. The EVE sensitivity shown below is indicative and based on scenarios and assumptions prescribed by HKMA under completion instruction for the Return of Interest Rate Risk Exposures (MA(BS)12), which is completed and reported quarterly on a solo basis according to MA(BS)12. The HKMA applies a standardised 200-basis-point parallel rate shock* to institutions’ interest rate risk exposures to measure the EVE impact of the shock.
All the positions captured by this return are slotted into the appropriate time bands according to the earliest interest repricing date (as per MA(BS)12).
* Multiplying the net position by the corresponding weighting factors which are designed to reflect the sensitivity of positions in different time bands to an assumed parallel shift of 200 basis points throughout the time spectrum.
Table 56: IRRBB – Sensitivity analysis
Economic value sensitivity2
Total
Material Currencies
HKD USD CNY JPY
At 31 Dec 2018 Footnotes HK$m HK$m HK$m HK$m HK$m
Parallel up 10,394 2,911 7,238 44 201
Total Capital Base 1 282,946
1 The Total Capital Base is as of 30 September 2018.2 The EVE sensitivity is reported on solo basis according to the Return of Interest Rate Risk Exposures (MA(BS)12) submitted to the HKMA.
Mainland activities
The analysis of mainland activities is based on the categories of non-bank counterparties and the type of direct exposures defined
by the HKMA under the BDR with reference to the HKMA’s ‘Return of Mainland Activities – (MA(BS)20)’, which includes the mainland exposures extended by the Bank’s Hong Kong offices and wholly-owned banking subsidiaries in mainland China.
Table 57: Mainland activities
On-balancesheet exposure
Off-balancesheet exposure
Totalexposures
HK$m HK$m HK$m
At 31 Dec 2018
Types of counterparties
1 Central government, central government-owned entities and their subsidiaries and joint ventures (‘JVs’) 251,245 16,242 267,487
2 Local governments, local government-owned entities and their subsidiaries and JVs 46,451 4,982 51,433
3 People’s Republic of China (‘PRC’) nationals residing in mainland China or other entities incorporated inmainland China and their subsidiaries and JVs 349,846 57,554 407,400
4 Other entities of central government not reported in item 1 above 13,857 2,394 16,251
5 Other entities of local governments not reported in item 2 above 6,395 801 7,196
6 PRC nationals residing outside mainland China or entities incorporated outside mainland China wherethe credit is granted for use in mainland China 38,452 3,820 42,272
7 Other counterparties where the exposures are considered by the reporting institution to be non-bankmainland China exposures 46,784 3,163 49,947
Total 753,030 88,956 841,986
Total assets after provision 5,043,067
On-balance sheet exposures as percentage of total assets 14.93%
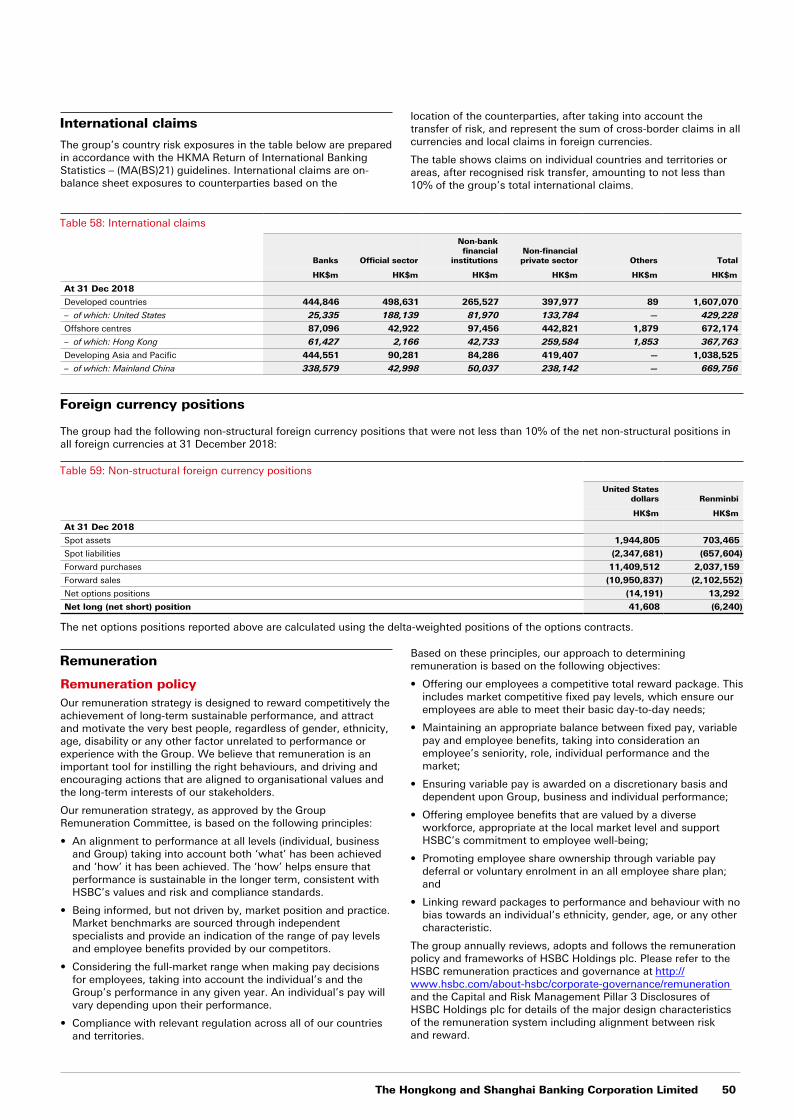
The Hongkong and Shanghai Banking Corporation Limited 50
International claims
The group’s country risk exposures in the table below are prepared in accordance with the HKMA Return of International Banking Statistics – (MA(BS)21) guidelines. International claims are on-balance sheet exposures to counterparties based on the
location of the counterparties, after taking into account the transfer of risk, and represent the sum of cross-border claims in all currencies and local claims in foreign currencies.
The table shows claims on individual countries and territories or areas, after recognised risk transfer, amounting to not less than 10% of the group’s total international claims.
Table 58: International claims
Banks Official sector
Non-bankfinancial
institutionsNon-financialprivate sector Others Total
HK$m HK$m HK$m HK$m HK$m HK$m
At 31 Dec 2018
Developed countries 444,846 498,631 265,527 397,977 89 1,607,070
– of which: United States 25,335 188,139 81,970 133,784 — 429,228
Offshore centres 87,096 42,922 97,456 442,821 1,879 672,174
– of which: Hong Kong 61,427 2,166 42,733 259,584 1,853 367,763
Developing Asia and Pacific 444,551 90,281 84,286 419,407 — 1,038,525
– of which: Mainland China 338,579 42,998 50,037 238,142 — 669,756
Foreign currency positions
The group had the following non-structural foreign currency positions that were not less than 10% of the net non-structural positions in all foreign currencies at 31 December 2018:
Table 59: Non-structural foreign currency positions
United Statesdollars Renminbi
HK$m HK$m
At 31 Dec 2018
Spot assets 1,944,805 703,465
Spot liabilities (2,347,681) (657,604)
Forward purchases 11,409,512 2,037,159
Forward sales (10,950,837) (2,102,552)
Net options positions (14,191) 13,292
Net long (net short) position 41,608 (6,240)
The net options positions reported above are calculated using the delta-weighted positions of the options contracts.
Remuneration
Remuneration policyOur remuneration strategy is designed to reward competitively the achievement of long-term sustainable performance, and attract and motivate the very best people, regardless of gender, ethnicity, age, disability or any other factor unrelated to performance or experience with the Group. We believe that remuneration is an important tool for instilling the right behaviours, and driving and encouraging actions that are aligned to organisational values and the long-term interests of our stakeholders.
Our remuneration strategy, as approved by the Group Remuneration Committee, is based on the following principles:
• An alignment to performance at all levels (individual, business and Group) taking into account both ‘what’ has been achieved and ‘how’ it has been achieved. The ‘how’ helps ensure that performance is sustainable in the longer term, consistent with HSBC’s values and risk and compliance standards.
• Being informed, but not driven by, market position and practice. Market benchmarks are sourced through independent specialists and provide an indication of the range of pay levels and employee benefits provided by our competitors.
• Considering the full-market range when making pay decisions for employees, taking into account the individual’s and the Group’s performance in any given year. An individual’s pay will vary depending upon their performance.
• Compliance with relevant regulation across all of our countries and territories.
Based on these principles, our approach to determining remuneration is based on the following objectives:
• Offering our employees a competitive total reward package. This includes market competitive fixed pay levels, which ensure our employees are able to meet their basic day-to-day needs;
• Maintaining an appropriate balance between fixed pay, variable pay and employee benefits, taking into consideration an employee’s seniority, role, individual performance and the market;
• Ensuring variable pay is awarded on a discretionary basis and dependent upon Group, business and individual performance;
• Offering employee benefits that are valued by a diverse workforce, appropriate at the local market level and support HSBC’s commitment to employee well-being;
• Promoting employee share ownership through variable pay deferral or voluntary enrolment in an all employee share plan; and
• Linking reward packages to performance and behaviour with no bias towards an individual’s ethnicity, gender, age, or any other characteristic.
The group annually reviews, adopts and follows the remuneration policy and frameworks of HSBC Holdings plc. Please refer to the HSBC remuneration practices and governance at http://www.hsbc.com/about-hsbc/corporate-governance/remuneration and the Capital and Risk Management Pillar 3 Disclosures of HSBC Holdings plc for details of the major design characteristics of the remuneration system including alignment between risk and reward.
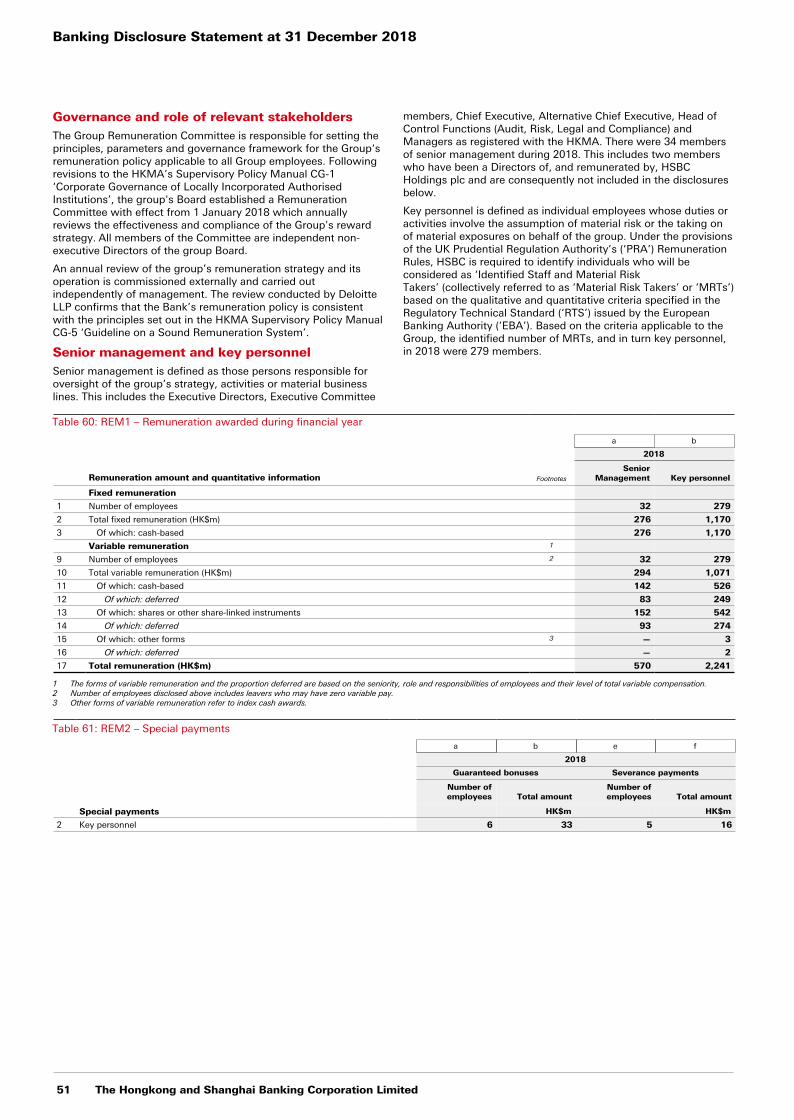
Banking Disclosure Statement at 31 December 2018
51 The Hongkong and Shanghai Banking Corporation Limited
Governance and role of relevant stakeholdersThe Group Remuneration Committee is responsible for setting the principles, parameters and governance framework for the Group‘s remuneration policy applicable to all Group employees. Following revisions to the HKMA’s Supervisory Policy Manual CG-1 ‘Corporate Governance of Locally Incorporated Authorised Institutions’, the group's Board established a Remuneration Committee with effect from 1 January 2018 which annually reviews the effectiveness and compliance of the Group's reward strategy. All members of the Committee are independent non-executive Directors of the group Board.
An annual review of the group’s remuneration strategy and its operation is commissioned externally and carried out independently of management. The review conducted by Deloitte LLP confirms that the Bank’s remuneration policy is consistent with the principles set out in the HKMA Supervisory Policy Manual CG-5 ‘Guideline on a Sound Remuneration System’.
Senior management and key personnelSenior management is defined as those persons responsible for oversight of the group’s strategy, activities or material business lines. This includes the Executive Directors, Executive Committee
members, Chief Executive, Alternative Chief Executive, Head of Control Functions (Audit, Risk, Legal and Compliance) and Managers as registered with the HKMA. There were 34 members of senior management during 2018. This includes two members who have been a Directors of, and remunerated by, HSBC Holdings plc and are consequently not included in the disclosures below.
Key personnel is defined as individual employees whose duties or activities involve the assumption of material risk or the taking on of material exposures on behalf of the group. Under the provisions of the UK Prudential Regulation Authority’s (‘PRA’) Remuneration Rules, HSBC is required to identify individuals who will be considered as ‘Identified Staff and Material Risk Takers’ (collectively referred to as ‘Material Risk Takers’ or ‘MRTs’) based on the qualitative and quantitative criteria specified in the Regulatory Technical Standard (‘RTS’) issued by the European Banking Authority (‘EBA’). Based on the criteria applicable to the Group, the identified number of MRTs, and in turn key personnel, in 2018 were 279 members.
Table 60: REM1 – Remuneration awarded during financial year
a b
2018
Remuneration amount and quantitative information Footnotes
SeniorManagement Key personnel
Fixed remuneration
1 Number of employees 32 279
2 Total fixed remuneration (HK$m) 276 1,170
3 Of which: cash-based 276 1,170
Variable remuneration 1
9 Number of employees 2 32 279
10 Total variable remuneration (HK$m) 294 1,071
11 Of which: cash-based 142 526
12 Of which: deferred 83 249
13 Of which: shares or other share-linked instruments 152 542
14 Of which: deferred 93 274
15 Of which: other forms 3 — 3
16 Of which: deferred — 2
17 Total remuneration (HK$m) 570 2,241
1 The forms of variable remuneration and the proportion deferred are based on the seniority, role and responsibilities of employees and their level of total variable compensation.2 Number of employees disclosed above includes leavers who may have zero variable pay.3 Other forms of variable remuneration refer to index cash awards.
Table 61: REM2 – Special payments
a b e f
2018
Guaranteed bonuses Severance payments
Number ofemployees Total amount
Number ofemployees Total amount
Special payments HK$m HK$m
2 Key personnel 6 33 5 16
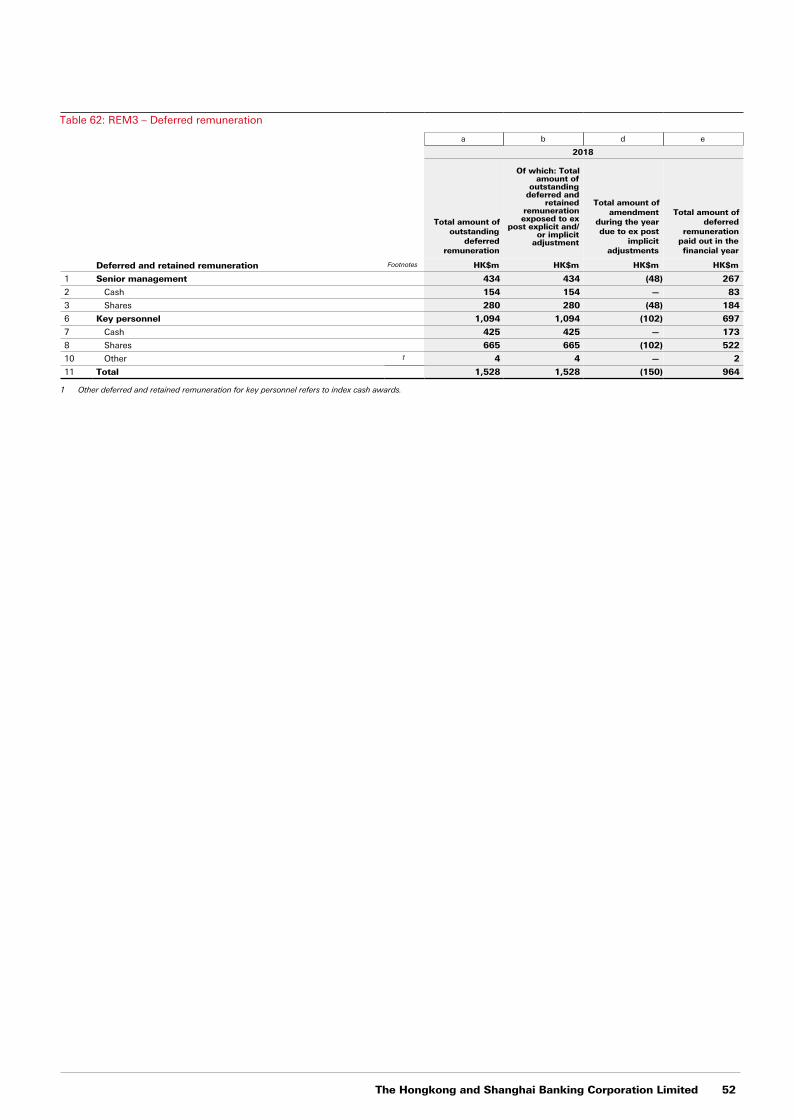
The Hongkong and Shanghai Banking Corporation Limited 52
Table 62: REM3 – Deferred remuneration
a b d e
2018
Total amount ofoutstanding
deferredremuneration
Of which: Total amount of
outstanding deferred and
retained remuneration exposed to ex
post explicit and/or implicit
adjustment
Total amount ofamendment
during the yeardue to ex post
implicitadjustments
Total amount ofdeferred
remunerationpaid out in thefinancial year
Deferred and retained remuneration Footnotes HK$m HK$m HK$m HK$m
1 Senior management 434 434 (48) 267
2 Cash 154 154 — 83
3 Shares 280 280 (48) 184
6 Key personnel 1,094 1,094 (102) 697
7 Cash 425 425 — 173
8 Shares 665 665 (102) 522
10 Other 1 4 4 — 2
11 Total 1,528 1,528 (150) 964
1 Other deferred and retained remuneration for key personnel refers to index cash awards.
Banking Disclosure Statement at 31 December 2018
53 The Hongkong and Shanghai Banking Corporation Limited
Other information
Abbreviations
The following abbreviated terms are used throughout this document.
CurrenciesHK$m Millions of Hong Kong dollars
HK$bn Billions (thousands of millions) of Hong Kong dollars
US$m Millions of United States dollars
A
AFS Available-for-sale
AI Authorised institution
ALCO Asset and Liability Management Committee
ASF Available stable funding
AT1 Additional tier 1
AVA Additional value adjustment
B
BCBS Basel Committee on Banking Supervision
BCR Banking (Capital) Rules
BDR Banking (Disclosure) Rules
BLR Banking (Liquidity) Rules
BSM Balance Sheet Management
C
CCF Credit conversion factor
CCP Central counterparty
CCR1 Counterparty credit risk
CCyB1 Countercyclical capital buffer
CDS1 Credit default swap
CEM Current exposure method
CET11 Common equity tier 1
CF Commodity finance
CIS Collective investment scheme
CMB Commercial Banking, a global business
CRC Comprehensive risk charge
CRE1 Commercial real estate
CRM Credit risk mitigation/mitigant
CRR1 Customer risk rating
CSA Credit Support Annex
CVA Credit valuation adjustment
D
D-SIB Domestic systemically important bank
DTAs Deferred tax assets
E
EAD1 Exposure at default
EBA European Banking Authority
ECA Export Credit Agency
ECAI External Credit Assessment Institution
EL1 Expected loss
EPE Effective expected positive exposures
EVE Economic value of equity
F
FFVA Funding Fair Value Adjustment
GGB&M Global Banking and Markets, a global business
GMB Group Management Board
GPB Global Private Banking, a global business
Group HSBC Holdings together with its subsidiary
group The Hongkong and Shanghai Banking CorporationLimited together with its subsidiary undertakings
G-SIB1 Global systemically important bank
H
HKAS 39 Hong Kong Accounting Standards 39
HKFRS 9 Hong Kong Financial Reporting Standards 9
HKMA Hong Kong Monetary Authority
Hong Kong The Hong Kong Special Administrative Region of thePeople’s Republic of China
HQLA High-quality liquid assets
HSBC HSBC Holdings together with its subsidiary
HVCRE High volatility commercial real estate
I
IMM1 Internal Models Method
IMM(CCR) Internal models (counterparty credit risk)
IPRE Income producing real estate
IRB1 Internal ratings-based approach
IRC Incremental risk charge
ISDA International Swaps and Derivatives Association
J
JCCyB Jurisdictional countercyclical buffer
JVs Joint ventures
L
LCR Liquidity Coverage Ratio
LGD1 Loss given default
Libor London interbank offered rate
LR Leverage ratio
M
MOC Model Oversight Committee
MRTs Identified Staff and Material Risk Takers
MSRs Mortgage servicing rights
N
NSFR Net stable funding ratio
O
OBS Off-balance sheet
OF Object finance
OTC1 Over-the-counter
P
PD1 Probability of default
PF Project finance
PFE Potential future exposure
PRA Prudential Regulation Authority
PRC People’s Republic of China
PSE Public sector entities
PVA Prudent valuation adjustments
Q
QRRE Qualifying revolving retail exposures
R
RC Replacement cost
RAS Risk appetite statement
RBM Ratings Based Method
RBWM Retail Bank and Wealth Management, a global
RMM Risk Management Meeting
RMOC Retail Banking and Wealth Management Risk ModelOversight Committee
RNIV Risks not in VaR
RSF Required stable funding
RTS Regulatory Technical Standard
RW Risk-weight
RWA1 Risk-weighted asset/risk-weighted amount
S
SA-CCR Standardised approach for counterparty credit risk
SEC-ERBA Securitisation external ratings-based approach
SEC-FBA Securitisation fall-back approach
SEC-IRBA Securitisation internal ratings-based approach
SEC-SA Securitisation standardised approach
The Hongkong and Shanghai Banking Corporation Limited 54
SFT1 Securities Financing Transactions
SME small and medium-sized enterprise
SPE1 Special Purpose Entity
SRW Supervisory risk-weight
STC Standardised (credit risk) approach
STC(S) Standardised (securitisation) approach
STM Standardised (market risk) approach
SVaR Stressed Value at risk
S&P Standard and Poor’s rating agency
T
T1 Tier 1
T2 Tier 2
V
VaR1 Value at risk
W
WMOC Wholesale Model Oversight Committee
1 Full definition included in the Glossary published on HSBC website www.hsbc.com

The Hongkong and Shanghai Banking Corporation Limited
HSBC Main Building1 Queen's Road Central, Hong KongTelephone: (852) 2822 1111Facsimile: (852) 2810 1112 www.hsbc.com.hk