
THE HINTERLAI.{D CONCEPT AI{D PORT DEVELOPMENT ...
208
THE HINTERLAI.{D CONCEPT AI{D PORT DEVELOPMENT IN GHAI'{A Benjamin K.B Amoyaw Thesis submitted to the Faculty of Graduate Studies In Partial Fulfillment of the Requirements for the Degree of Master of Arts Dep artment of Geography University of Manitoba Winnipeg, Manitoba August 1999
-
Upload
khangminh22 -
Category
Documents
-
view
0 -
download
0
Transcript of THE HINTERLAI.{D CONCEPT AI{D PORT DEVELOPMENT ...
THE HINTERLAI.{D CONCEPT AI{D PORT
DEVELOPMENT IN GHAI'{A
Benjamin K.B Amoyaw
Thesis submitted to the Faculty of Graduate Studies In
Partial Fulfillment of the Requirements for the Degree of
Master of Arts
Dep artment of Geography
University of Manitoba
Winnipeg, Manitoba
August 1999
l*l trt¡$onat-t-iurav Slt[ilå3å"
nationare
Acquisitions and Acquisitions etBibÍiographicservices servicesbibliographiques
395 Wellington Street 395, rue WellingtonOtlawa ON K1A 0N4 Ottawa ON K1A 0N4
Canada Canada
Our l¡le Notrc ftilércnce
The author has gfanted a non- L'auteur a accordé une licence non
exclusive licence allowing the exclusive permettant à la
National Library of Canada to Bibliothèque nationale du Canada de
reproduce, loan, distribute or sell reprodufe, prêter, distribuer ou
copies of this thesis in microform, vendre des copies de ceffe thèse sous
paper or electronic formats. la forme de microfiche/film, de
reproduction sur papier ou sur formatélectronique.
The author retains ownership of the L'auteur conserve la propriété du
copynght in this thesis. Neither the droit d'auteur qui protège cette thèse.
thesis nor substantial extracts from it Ni la thèse ni des extraits substantiels
may be printed or otherwise de celle-ci ne doivent être imprimésreproduced without the author'spermission.
ou autrement reproduits sans sonautorisation.
0-61245021-X
Canadä

THE I.]NTYERSITY OF MANITOBA
FACULTY OF GRADUATE STI]DIES*rk***
COPYRIGHT PERMISSION PAGE
THE HINTERLAND CONCEPT AND PORT DEVELOPMENT IN GHANA
BY
BENJAMIN K. B. AMOYAW
A Thesis submitted to the Faculty of Graduate Studies of The University
of Manitoba in partial fulfillment of the requirements of the degree
of
MASTER OF ARTS
Benjamin K.B. Amoyaw@1999
Permission has been granted to the Library of The University of Manitoba to lend or sellcopies of this thesis/practicum, to the National Library of Canada to microfiIm this thesis andto lend or sell copies of the film, and to Dissertations Abstracts International to publish anabstract of this thesis/practicum.
The author reserves other publication rights, and neither this thesis/practicum nor extensiveextracts from it may be printed or otherwise reproduced without the author's writtenpermission.

ACKNOWLEDGEMENTS
So many people, directly or indirectly, had a hand in shaping the arguments and
presentation of this thesis, and I cannot adequately thank all of them. Most especially, Iwish to thank my advisor, Prof. Daniel Todd, who guided me th¡ough the design of the
research proposal to the final thesis write-up. His critical comments, analytical prowess
and supervision skills were invaluable resources to me and the writing of the thesis.
I also wish to thank my committee members Prof Jacek L Romanowski and Dr. John
Loxley who despite their busy schedules found time to read the thesis and provided very
critical comments and suggestions.
I am also indebted to Theresa Nchols, C. J Mundy and Georg Dusel for the help they
gave me with the graphics. I also acknowledge with gratitude the words of encouragement
I got from my friends Augustine Owusu-Asiedu, Victoria Aniniagyei, Benjamin Kusi-
Seþere, M¡. and Mrs. Semple, and Komotso Garakwe. A very big and special thanks to
Attah Kwadwo Boame for the help he provided me with respect to the regression analysis.
Special thanks also go to his wife (Alice Boame) who was of immense support to me
during my stay in Winnipeg.
I cannot close without expressing my love to my mother (Mama Julie) and my brothers
and sisters especially Angie, for all the help, financially and morally, they provided me.
ABSTRACT
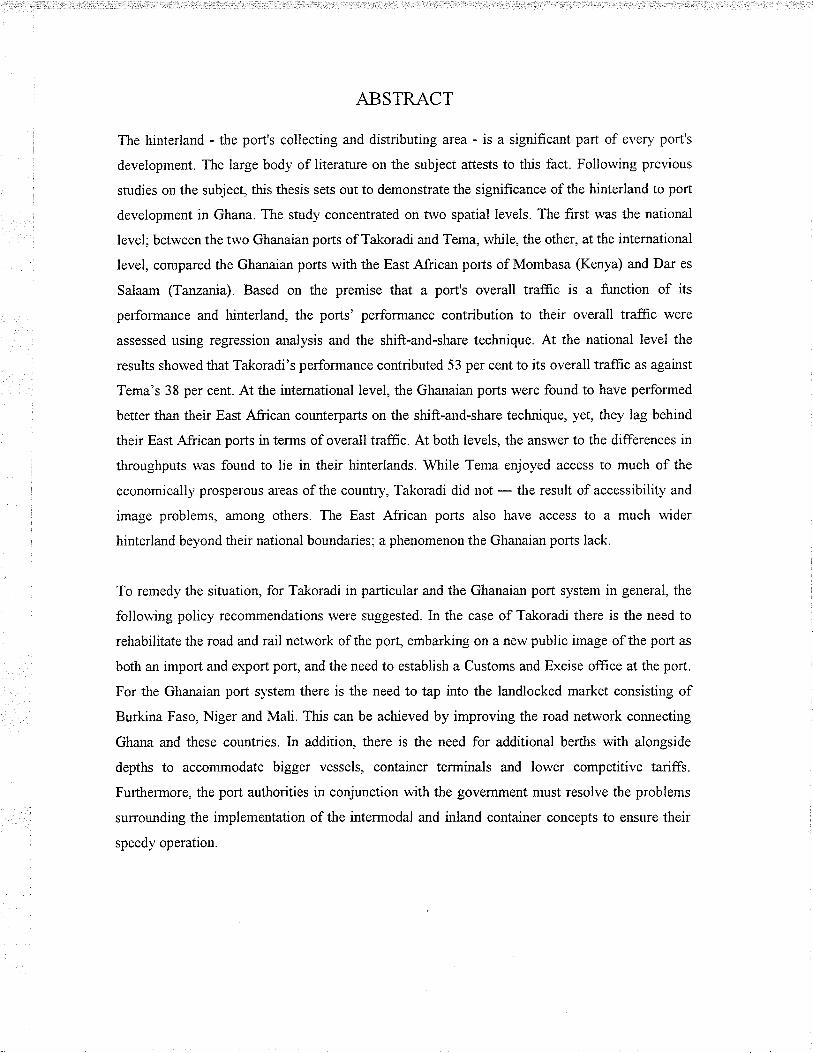
The hinterland - the port's collecting and distributing area - is a significant part of every port's
development. The large body of literatu¡e on the subject attests to this fact. Follorving previous
studies on the subject, this thesis sets out to demonstrate the significance of the hinterland to port
development in Ghana. The study concentrated on two spatial levels. The first was the national
level; between the two Ghanaian ports of Takoradi and Tema, while, the other, at the international
level, compared the Ghanaian ports with the East African ports of Mombasa (Kenya) and Dar es
Salaam (Tanzania). Based on the premise that a port's overall traffic is a function of its
performance and hinterland, the ports' perforrnance contribution to their overall traffic were
assessed using regression analysis and the shift-and-share technique. At the national level the
results showed that Takoradi's performance contributed 53 per cent to its overall traffic as against
Tema's 38 per cent. Atthe international level, the Ghanaim ports were found to have performed
better than their East African counterparts on the shift-and-share technique, yet, tley lag behind
their East African ports in terms of overall trafñc. At both levels, the answer to the differences in
throughputs u'as found to lie in their hinterlands. While Tema enjoyed access to much of the
economicall)¡ prosperous areas of the country, Takoradi did not - the result of accessibility and
image problems, among others. The East African ports also have access to a much wider
hinterland beyond their national boundaries: a phenomenon the Ghanaian ports lack.
To remedy the situation, for Takoradi in particular and the Ghanaian port system in general, the
follorving policy recommendations were suggested. In the case of Takoradi there is the need to
rehabiliøte the road and rail network of the port, embarking on a new public image of the port as
both an import and export port, and the need to establish a Customs and Excise office at the port.
For the Ghanaia¡ port system there is the need to tap into the landlocked market consisting of
Burkina Faso, Niger and Mali. This can be achieved by improving the road network conxecting
Ghana and these countries. In additio4 there is the need for additional berths with alongside
depths to accommodate bigger vessels, contai¡er terminals and lower competitive tarifß.
Furthermore, the port authorities in conjunction rvith the government must resolve the problems
surrounding the implementation of the intermodal and inland container concepts to ensure their
speedy operation.
CO¡{TBNTS
Acknowledgements
Abstract
CHAPTER ONE: Port Infrastructure: Its Economic and Geosraphical
Siqnificance
1.0 Introduction
i.1 Geography and transportation
1.2 Port geography and the analytical approaches addressing it
1.3 Transport infrastructure and development
1.4 Port infrastructure and African development
1.5 Introducing Ghana
1.6 The ports of Ghana
1.6.1 Takoradi port
L6.2 Urbanisation and industrialisation in Sekondi-Takoradi
1.7 Tema port
1.7 .l Facilities
1.7 .1.2 Organisation
1.7 .2 Industrial and urban development of Tema
1.8 Research problem
L9 Research objectives
1.10 Summary
CHAPTER TWO: Hinterland: Classification and Functions
2.0 Introduction
2.1 The hinterland concept
2.2 Nature and extent of hinterlands
2.3 Ports, hinterlands and transport connections
2.4 Hinterland classification and functions
2.5 Intermodal transport and the hinterland concept
Page
I
I
I
6
11
13
2l
23
23
25
30
32
33
33
)t
40
41
42
42
42
43
44
46
49

2.5.1 Containerisation and intermodalism
2.6 Traffic concentration and inland penetration
2.6.1 North American Land Bridge
2.7 The Port of Genoa and its hinterland
2.7.1 Nature and extent of Genoa's hinterland
2.7.2 Hinterland analysis and Genoa's development
2.8 The Port of Mombasa and its hinterland
2.9 The Port of Beira and its hinterland
2.10 Malaya ports and their hinterlands
2.11 Summary
CHAPTER THREE: Port Comparisons: The Indices and Methodolosv
3.0 Introduction
3.1 The indices
3.2 Method of analysis I
3.2.1 Regression analysis
3.3 Definition of terms
3.3.1 Berth occupancy
3.3.2 Ship turnround time
3.3.3 Cargo-handling/Labour productivity
3.3.4 Port performance, costs and traffic volume
3.5 Method of analysis II
3.5.1 The shift-and-share technique
3.6 Data collection
3.7 Summary
s0
51
52
56
57
s9
59
68
75
81
82
82
83
96
96
98
98
99
100
100
105
105
109
109

4.3
4.4
4.5
CHAPTER FOUR: Analvsis of port performance and throushput
4.0 Introduction
4.1 Throughputanalysis
4.2 Variety of traffic
4.2.1 Container traffic
Balance of traffic
Port performance comparison
Cargo tonnage and port performance: a synthesis
4.5.1 Evaluation of the regression results
4.5.l.1Test of unit roots
4.5.1.2 The regression results
4.5.2 Residual tests
4.5.2.1 Normality test
4.5.2.2 ARCHþ) test
4.5.2.3 Reset test
4.5 .2.4 Multicollinearity test
Ghanaian and East African ports: throughputs comparison
Summary
CHAPTER FIVE: The Ports and their Hinterlands
5.0 Introduction
5.1 The Ghanaian hinterland
r10
110
110
rt4115
1r6
125
129
i30
130
131
133
133
133
133
135
136
t39
14r
141
r41
l4t141
143
t44
r57
t66
4.6
4.7
5.2
5.3
5.4
5.5
5.1.1 The distribution and pattem of economic activity
5.1.2 The mineral deposits
Agriculture
The forest zone
Hinterland: Mombasa and Dar es Salaam compared
Summary

CHAPTER SIX: Conclusion and Recommendation
6.0 Introduction
6.1 Thesis summary
6.2 Recommendations
6.2.1 Financial
6.2.2 Operational scope
6.2.3 Organisational
t67
167
r67
171
t73
174
t74
References
Appendix I
Appendix II
Appendix III
Appendix IV
Appendix V
Appendix VI
180
Market shares of overall traffic at Ghanaian ports, 1945-1967 1 89
Overall imports at Ghanaian ports, 1945-1967 (1,000 tons) 190
Overall exports at Ghanaian ports, 1945-1967 (1000 tons) 191
Regression results of overall tonnage (OT) on the independent
variables
Traffic concentration at Takoradi, Tema, Mombasa and
Dar es Salaam, 1983-1993 (tonnes)
Stop undue delays at ports - Abodakpi
192
193
194
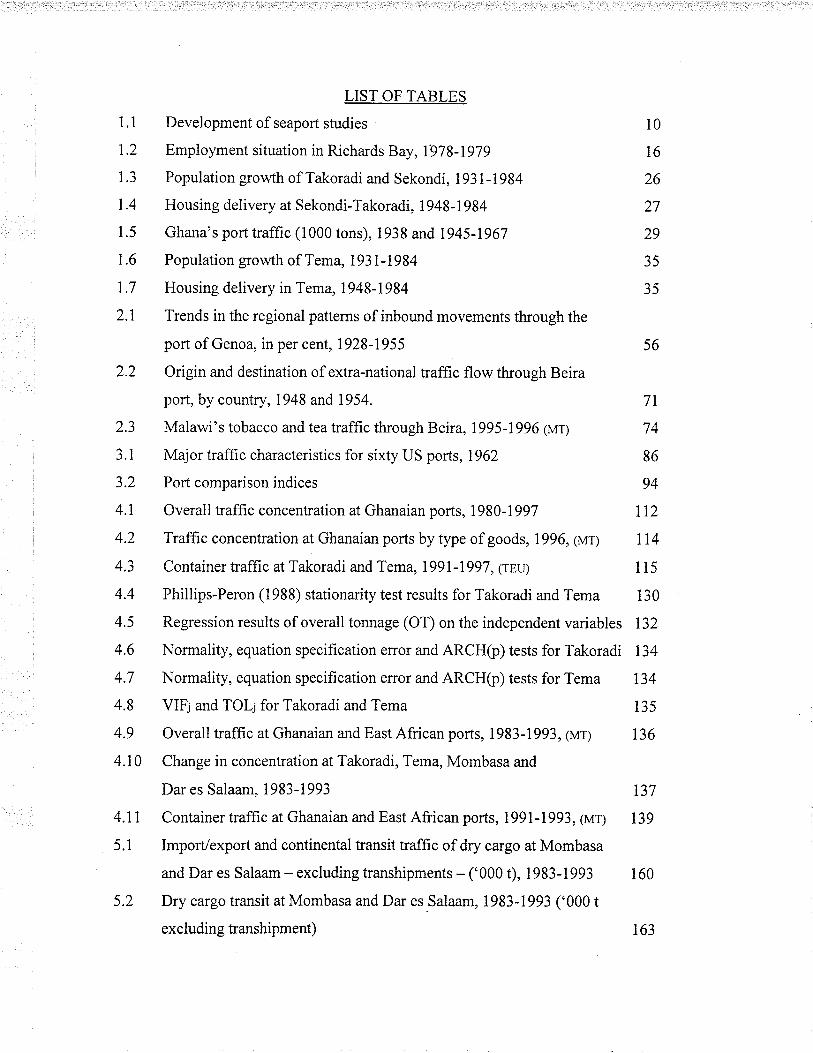
LIST OF TABLES
1.1 Development of seaport studies
1.2 Employment situation in Richards Bay,l'978-1979
1.3 Population growth of Takoradi and Sekondi, l93l-1984
I.4 Housing delivery at Sekondi-Takoradi, 1948-1984
1.5 Ghana's port traffic (1000 tons), 1938 and 1945-1967
1.6 Population growth of Tema, 1931-1984
1.7 Housing delivery in Tema, 1948-1984
2.1 Trends in the regional patterns of inbound movements through the
r0
16
26
27
29
35
35
port of Genoa, in per cent, 1928-1955 56
2.2 Origin and destination of extra-national traffic flow through Beira
port, by country, 1948 and 1954. 71
2.3 Malawi's tobacco and tea traffic through Beira, 1995-1996 0r¡rl 74
3.1 Major traffic characteristics for sixty US ports, 1962 86
3.2 Port comparison indices 94
4.1 Overall traffic concentration at Ghanaian ports, 1980-1997 112
4.2 Traffic concentration at Ghanaian ports by type of goods, 1996, (vr) ll44.3 Container traffic at Takoradi and Tema , lg91-19g7, lreu¡ I 15
4.4 Phillips-Peron (1988) stationarity test results for Takoradi and Tema i30
4.5 Regression results of overall tonnage (OT) on the independent variables 132
4.6 Normality, equation specification enor and ARCH(p) tests for Takoradi 134
4.7 Normality, equation specification error and ARCHþ) tests for Tema 134
4.8 VIF¡ and TOL¡ for Takoradi and Tema 135
4.9 Overall traffic at Ghanaian and East African ports, 1983-1993, gr¡ 136
4.10 Change in concentration at Takoradi, Tema, Mombasa and
Dar es Salaam, 1983-1993 137
4.Il Container traffic at Ghanaian and East African ports, 1991-1993, grar¡ 139
5.1 Imporlexpot and continental transit traffic of dry cargo at Mombasa
and Dar es Salaam - excluding transhipments - ('000 t), 1983-1993 160
5.2 Dry cargo transit at Mombasa and Dar es Salaam, 1983-1993 ('000 t
excluding transhipment) 163
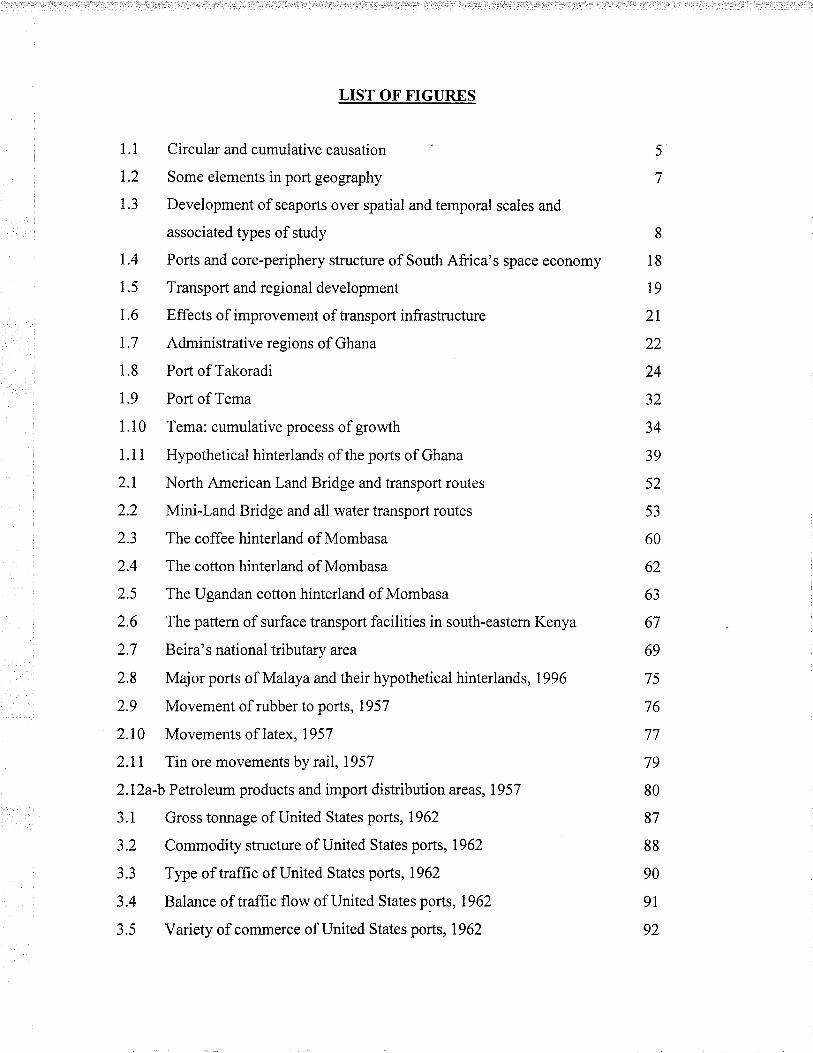
LIST OF FIGURES
1.1 Circular and cumulative causation
I.2 Some elements in port geography
1.3 Development of seaports over spatial and temporal scales and
associated types of study
1.4 Ports and core-periphery structure of South Africa's space economy
1.5 Transport and regional development
1.6 Effects of improvement of transport infrastructure
1.7 Administrative regions of Ghana
1.8 Port of Takoradi
1.9 Port of Tema
1.10 Tema: cumulative process of growth
1 . i i Hypothetical hinterlands of the ports of Ghana
2.I North American Land Bridge and transport routes
2.2 Mini-Land Bridge and all water transport routes
2.3 The coffee hinterland of Mombasa
2.4 The cotton hinterland of Mombasa
2.5 The Ugandan cotton hinterland of Mombasa
2.6 The pattern of surface transport facilities in south-eastern Kenya
2.7 Beira's national tributary area
2.8 Major ports of Malaya and their hypothetical hinterlands,1996
2.9 Movement of rubber to ports, 1957
2.I0 Movements of latex, 1957
2.lI Tin ore movements by rail, 1957
2.12a-b Petroleum products and import distribution areas, 1957
3.1 Gross tonnage of United States ports, 1962
3.2 Commodity structure of United States ports,1962
3.3 Type of traffic of United States ports, 1962
3.4 Balance of traffic flow of United States ports, 1962
3.5 Variety of commerce of United States ports, 1962
I18
r9
2t
22
24
32
34
39
52
53
60
62
63
67
69
75
76
77
79
80
87
88
90
9t
92
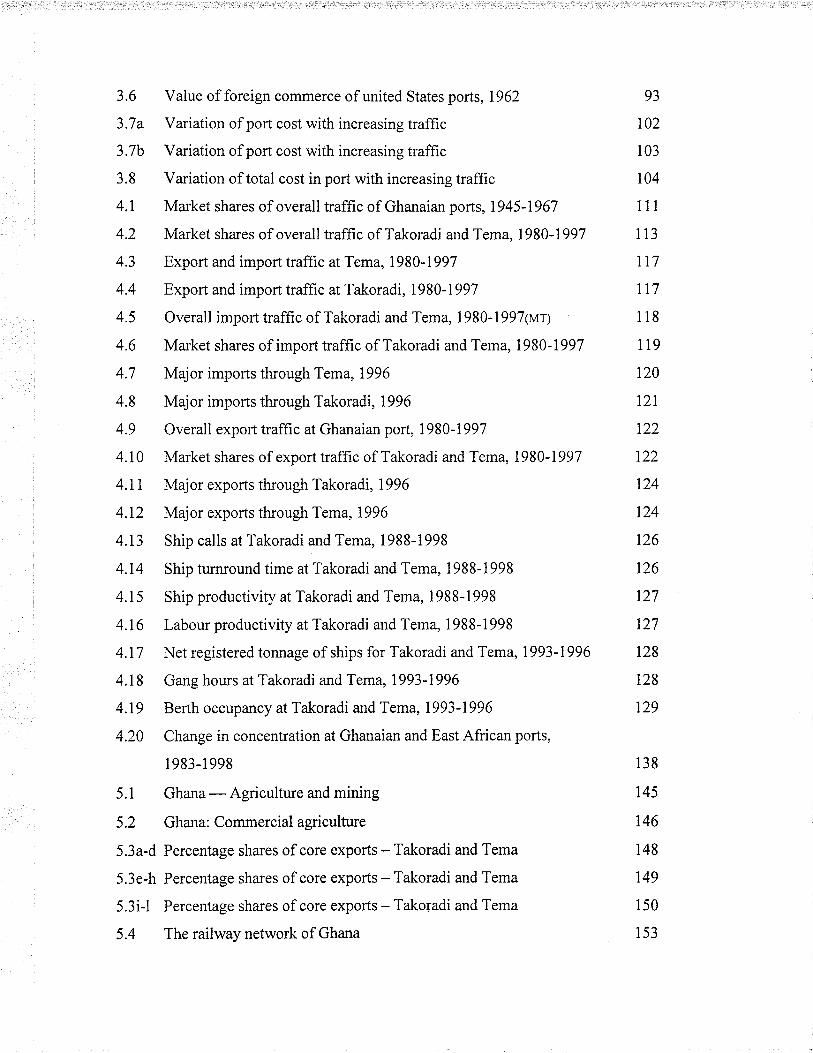
3.6 Value of foreign cornmerce of united States ports,1962
3.7a Variation of port cost with increasing traffic
3.7b Variation of port cost with increasing traffrc
3.8 Variation of total cost in port with increasing traffic
4.1 Market shares of overall traffic of Ghanaian ports, 1945-1967
4.2 Market shares of overall traffic of Takoradi and Tema,1980-1997
4.3 Export and import traffic at Tema, 1980-1997
4.4 Export and import traffic at Takoradi,1980-1997
4.5 Overall import traffic of Takoradi and Tema, 1980-1997(vrl
4.6 Market shares of import traffic of Takoradi and Tema , 1980-1997
4.7 Major imports through Tema, 1996
4.8 Major imports through Takoradi, 1996
4.9 Overall export traffic at Ghanaian port, 1980-1997
4.10 Market shares of export traffic of Takoradi and Tema , 1980-1997
4.1 1 Major exports through Takoradi, 1996
4.I2 Major exports through Tema, i996
4.13 Ship calls at Takoradi and Tema, 1988-1998
4.14 Ship tumround time at Takoradi and Tema, 1988-1998
4.15 Ship productivity at Takoradi and Tema, 1988-1998
4.16 Labour productivity at Takoradi and Tema, 1988-1998
4.17 Net registered tonnage of ships for Takoradi and Tema, 1993-1996
4.l8 Gang hours at Takoradi and Tema, 1993-1996
4.19 Berth occupancy at Takoradi and Tema,1993-1996
4.20 Change in concentration at Ghanaian and East African ports,
1 983-1 998
5.1 Ghana-Agriculture and mining
5.2 Ghana: Commercial agriculture
5.3a-d Percentage shares of core exports - Takoradi and Tema
5.3e-h Percentage shares of core exports - Takoradi and Tema
5.3i-l Percentage shares of core exports - Takoradi and Tema
5.4 The railway network of Ghana
93
102
103
104
111
ll3r17
117
118
119
120
t2l122
122
r24
124
r26
126
127
127
128
128
r29
138
145
146
148
149
150
153
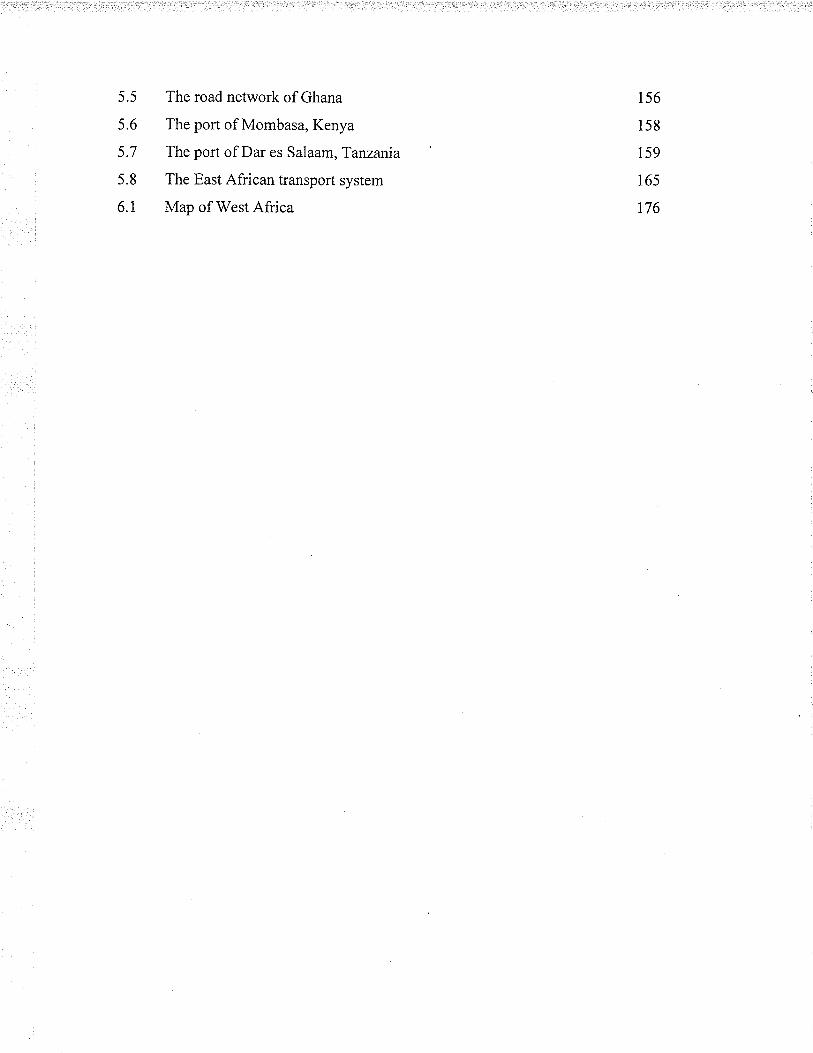
5.5
s.6
5.7
s.8
6.1
The road network of Ghana
The port of Mombasa, Kenya
The port of Dar es Salaam, Tanzania
The East African transport system
Map of West Africa
156
158
ts9
r65
176

CHAPTER ONE
PORT INFRASTRUCTURE: ITS ECONOMIC
AND GEOGRAPHICAL SIGNIFICANCE
1.0 Introduction
The importance as well as policy implications to port growth and development of
analysis both of port perlormance and hinterlands cannot be over-emphasised. The works
of Boerman (1951), Weigend (1956,i958), Hance and Van Dongen (1957), Rodgers
(1958), Carter (1962), Rimmer (1964,7966a,1966b), Ward (1966), Hoyle (1967,1981),
Hoyle and Charlier (1995), Schulze (1970), and Hayuth (1981) amply demonstrate this.
The raison d'être of this thesis is to emphasise the importance of hinterland to port
development. To illustrate this theme - the twin pillars of the Ghana port system
(Hilling, 1977) - Tema and Takoradi are the subjects of detailed enquiry. The many
geographical contributions of the study include an updated map of the ports' hinterland
structure as well as the nature and state of condition of the transport network linking the
ports and their hinterlands. Policy recommendations for the pofts' development will
follow naturally from this work. This study falls within the broad field of transport
geography, a nebulous field in need of refrnement. At its essence is the question: what is
the connection, if any, between geography and transportation in general and ports in
particular? The next section attempts to be forthcoming with answers.
1.1 Geography and Transportation
Traditionally, transportation has been part of geographical studies. The geographical
aspect of transportation has usually been concerned with "the provision of transport
systems, the use of those systems for the movement of people and commodities, and the
relationships between transport and other geographical phenomena (Hay, 1991.641-642).
In the nineteenth century, for example, Friedrich Ratzel and Alfred Hettner emphasised
the role oftransport in shaping the landscape and as an agent ofgeographical change. At
the dawn of the twentieth century, the French school led by P. Vidal de la Blache and J.
Brunhes also developed transport geography as an integral part of what they called the
'geography of circulation', which studied the' per;nanent landscape features and the
a.
transient movement of goods and people. Subsequently, through to the 1950s when
interest in the individual modes of transport gathered momentum, transportation
geography progressed slowly. The i960s saw the use of quantitative models in
transportation geography by North American geographers led by E. L {lllman, W. L
Garrison, E. J. Taaffe and others, a development which not only led to a rapid expansion
in transport geography studies but which brought transport geography close to urban
planning. However, the use of such quantitative techniques began to be criticised in the
1970s as it was considered an impediment to a critical study of transport systems. All in
all, transportation and geography meet at th¡ee main points. The first is geography's
concern with the transport sector itself. This is defined as follows:
Network Analysis - This is concern with the geographical pattern of transport
networks (roads, railways, air, and canals). The dominant descriptive technique for
network analysis is graph theory. In terms of explanation, emphasis is placed on the
spatial association between network forms or structure and other geographical
phenomena.
Provision of Scheduled Services - Geographical studies of scheduled services have
focused on accessibility provided by these services using the same network analysis
technique. Much emphasis has been on frequency in time and density in space;
however, recent studies have focused on the impact of deregulation policies on
scheduled services.
Movement of People - Early studies in this area were mainly descriptive but recent
studies have been more explanatory. In much of the explanatory studies the effort is
directed at accounting for:
o the number of trips originating and terminating within an area
o the flows between these areas and
r the allocation of this traffic between competing modes.
Aggregate models like those of gravity and intervening opportunity are the most
frequently used tech¡iques in this area. There is, however, now a shift towards
disaggregated travel demand models where the trip-making behaviour of individuals
is related to the perceived utility of alternative destinations.
b.
c.
d. Movement of Commodities - Geographers have also been involved in commodity
flow analysis using techniques such as transaction flow analysis and factor analysis.
In terms of explanation, Ullman'sl triad ha3 often been used. The main operational
models have been linear programming, input-output analysis, and the gravity model.
Modal split is another dimension of commodity studies. Recently, the role of firms as
initiators and agents of commodity flow has become a major concern in this area of
study.
Terminal Analysis - Attention on terminal analysis is focused on the development of
the terminal facilities over time, their morphology as well as inter- and intra-facility
competition. Ports and airports have dominated most studies of terminal facilities.
Secondly, geography and transportation are related to the extent that transport serves as
an agent of geographical change. This connection arises from the correlation that has
existed between geographical patterns of transport networks and urban growth and the
geography of manufacturing and service industry. It is this relationship that has led to the
conclusion that transport investment leads to geographical change. However, the search
for evidence to support such a conclusion often runs into two problems, viz.:
I Ullman's triad is a concept developed by Edrvard L lllhnan to explain the differential linkages a¡d flowsbetrveen centres. Tluee mai¡ concepts; namely, complementarity, transferabilitv and inteweningopporfunities underlie the triad. Complementarity, or specific complementarit)' as it is referred to by Loweald Moryadas (1975), postulates that movement or trade between two places rvill only occur if there is aneed for a particular product in one region for which the other region has the capacity to produce ardsupply. Lowe and Moryadas (19'15) cite the relation betrveen urban industrial and ru¡al agriculnral regionsand the industrialised and non-industrialised nations specialising in agriculnrat production and mineralresource exlraction as exarnples of complementarity. Complementarity, therefore, emphasises theimportance of need and abilily to supply to movement rather tha¡ mere spatial differentiation betweenplaces. However, it is possible for complemenørity to exist between two places without ary movement ortrade occurring between them. This can happen as a result of the existence of a¡ alternative, closer andmore accessible source of supply between trvo complementary regions. This alternative source of supply isknovrn as intervening oppornrnity. The existence of i¡tenening opportunib,serves to restrict or preventmovement between two complementary regions. Because of this some uriters consider the conceptnegative. In additio4 it can encourage suboptimisaúon, including thei¡ ability to encourage people tochoose inferior but yet adequate alternative rather than the fafher but best location. Transferability, on theother lund, revolves around the cost of movement and the existence of a transportation facility. Forexample. complementarity ma_y exist between tu'o places, yet no movement or trade will take placebetrveen them as a result of lack of a transportation facility linking the trvo places. Transferability,measured by the real cost of transfer, is dependent on the.commodity in question. For example, sand a¡dgravel are said to have low transferability compared with diamond because of the low value per u¡ut ofrveight of the former.

a. The effects generated by transport investment are diffrcult to separate from the
effects generated by other causes.
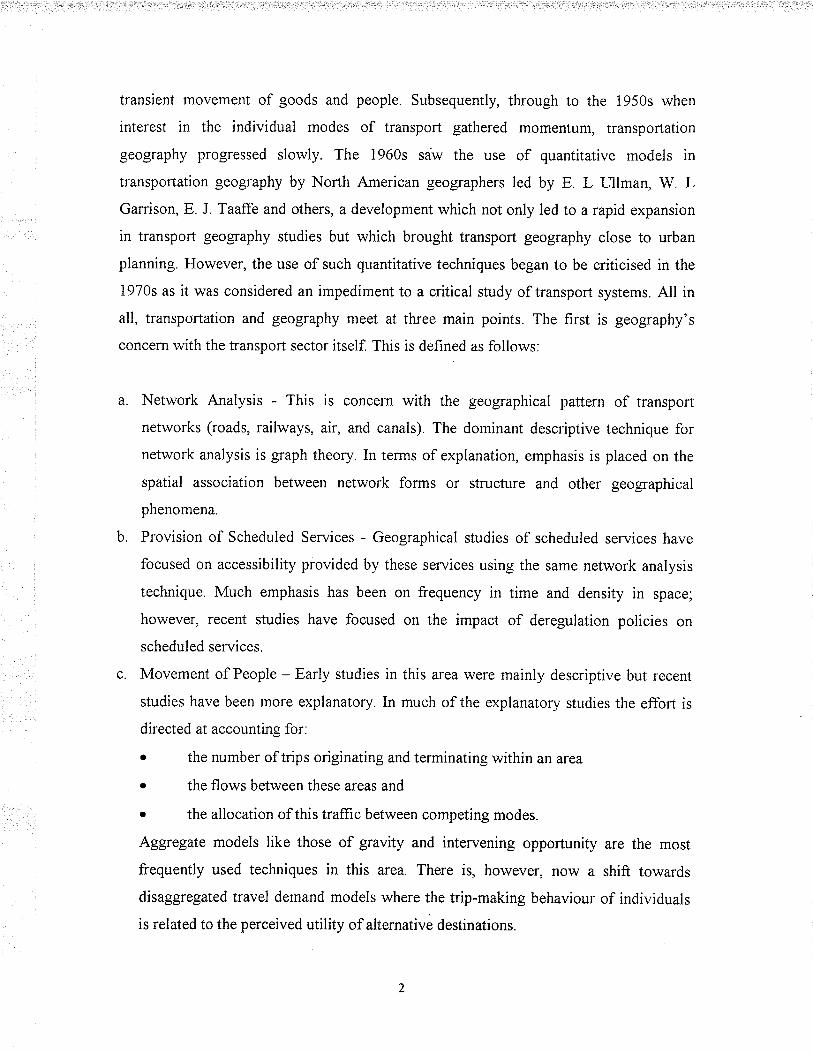
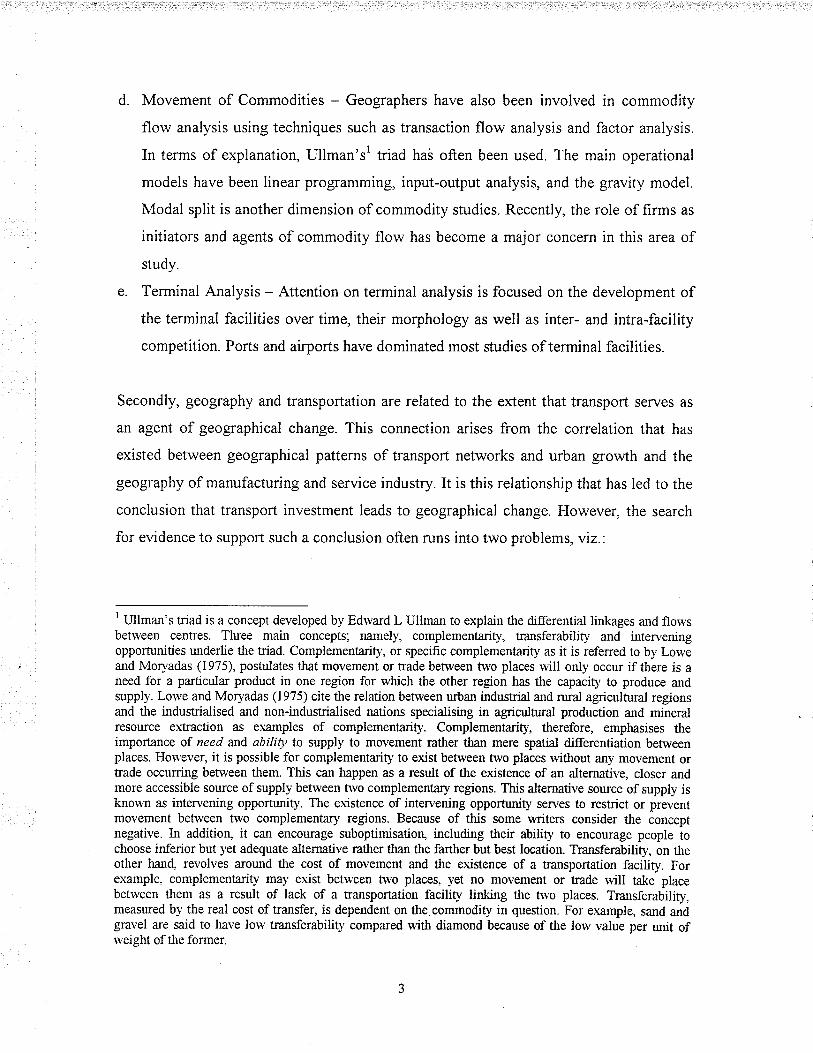
b. Although transport investment may lêad to urban growth, urban growth itself
may be the cause of transport expansion. This flux of interdependency is what
Myrdal refers to as circular and cumulative causation. Pred has applied
Myrdal's circular and cumulative causation idea to urban and industrial
growth (Figure 1.1), which indirectly bears on transport investment.
The establishment of each new firm in the city adds to the initial multiplier effect,
permitting the city to reach a new set of th¡esholds and expand its local and regional
markets. This has the tendency of attracting other new firms to the city. The process is
reinforced bythe effects of the intensified information on the probability of invention or
innovation (Taaffe and Gauthier, 1973.46). So, while there is a spatial correlation
between geographical pattern and the transport network, the causal link between the two
is nonetheless complex.
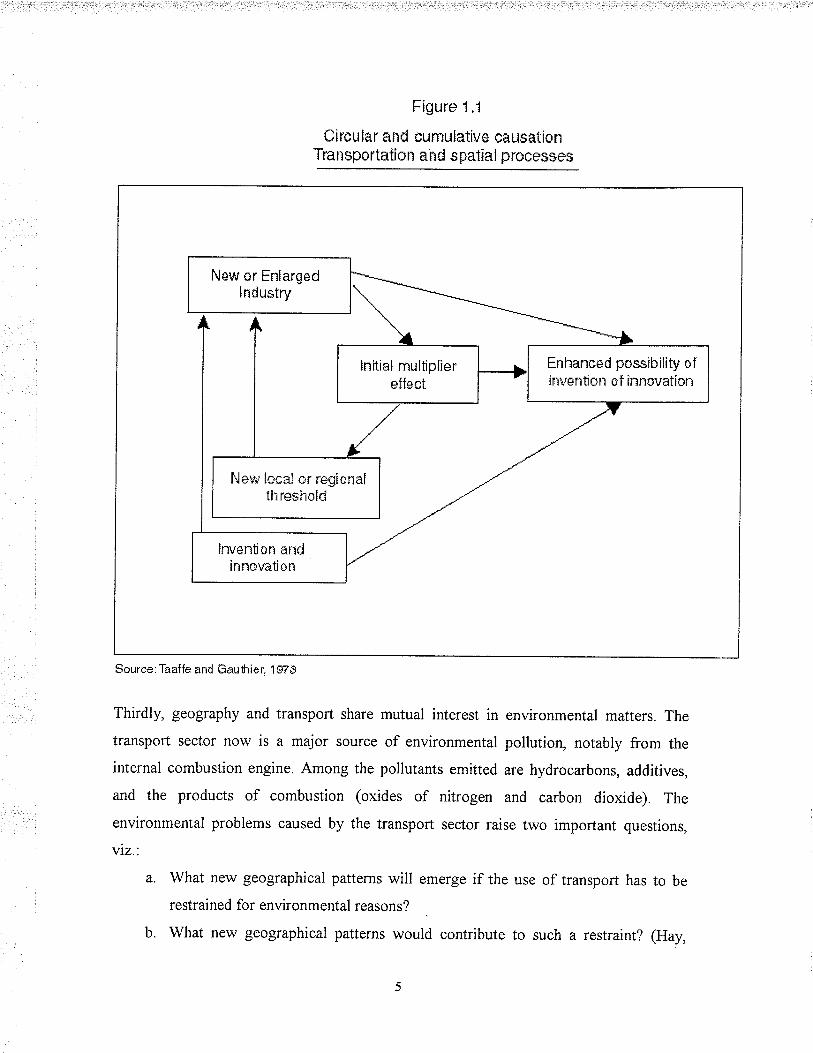
Figure 1.1
Circur far and cumulative causationTransportation ahd spatlaÌ prcesses
Scurce:Taaffe and Gauhier. 157ã
Thirdly, geography and transport share mutual interest in environmental matters. The
transport sector now is a major source of environmental pollution, notably from the
internal combustion engine. Among the pollutants emitted are hydrocarbons, additives,
and the products of combustion (oxides of nitrogen and carbon dioxide) The
environmental problems caused by the transport sector raise two important questions,
viz.'.
a. What new geographical patterns will emerge if the use of transport has to be
restrained for environmental reasons?
b. What new geographical patterns would contribute to such a restraint? (Hay,
fiiew or Enlargedlndu*+lry
Errhanced passibility ofinvention of innovathn
Ney¡ [*ca[ nr re¡iona[tli reghold
[r:v+l-rtÍon ar¡dinnouation
Scurce: Taaffe and Gaufi ier.
r9e1.64t-643).
The above clearly demonstrates the con¡ection between geography and transportation. It
is this connection which has been referred to as transportation geography or geography of
transpoftation. Having explained the nature of transportation, I am no\¡/ in a position to
specify to which aspect of transportation geography the present study belongs. It is
obvious from the discussion hitherto that the present study is concerned with points (d)
and (e). Specifîcally, the emphasis is on port terminals and the movement of
commodities. This is part of the sub-discipline of transportation geography referred to as
poft geography. In the following section I shall discuss port geography and the various
approaches to its analysis.
1.2 Port geography and the analytical approaches addressing it
According to Hilling and Hoyle (1984:1), port geography is primarily concerned with
"what happens at the waterfront, across the frontier between land and maritime space,
wherever trade is regularly carried out, whether that interface is set in a technologically
primitive context or in the context of advanced transport systems". Other concerns of port
geography beyond the land/maritime interface are depicted in Figure 1.2. The port here is
considered as a node located at the interface of the landlmaritime dimensions and,
together with other ports, experiences differential growth and development. Ports also
differ in size and in the extent to which they are associated with urban development.
Locational characteristics of various kinds, notably the conditions of land and water site
and the characteristics of hinterland transport systems, are some of the main factors that
affect inter-port competition.
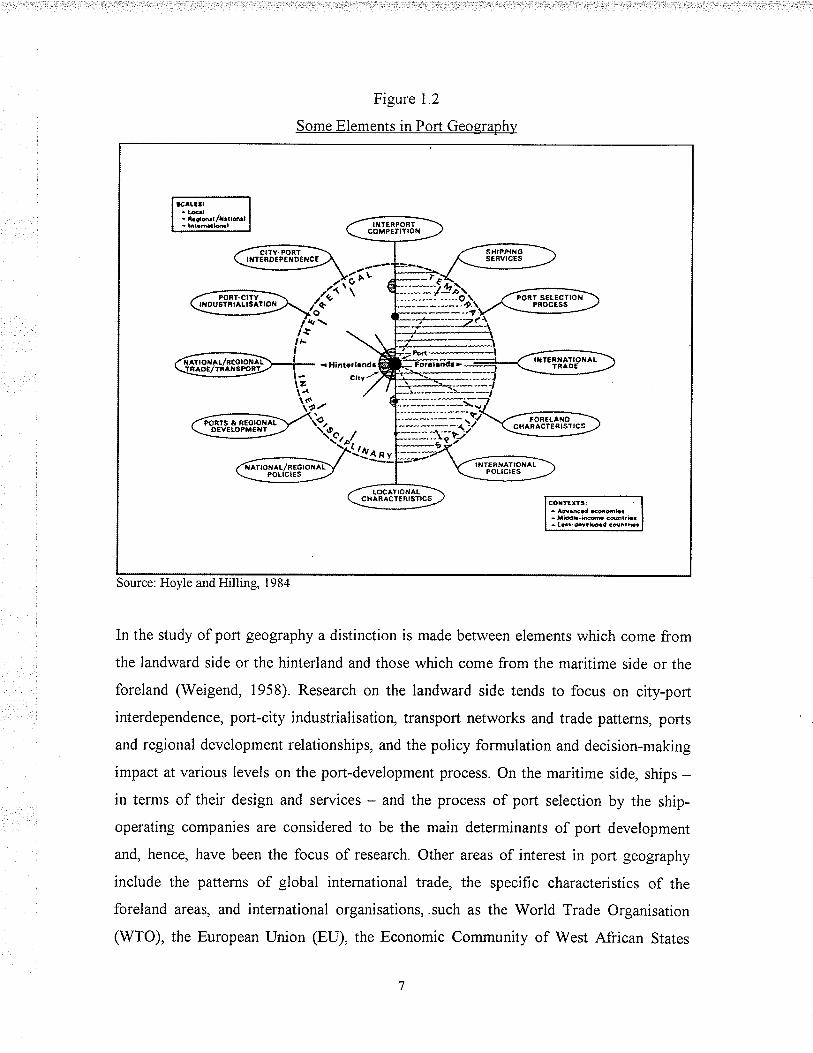
Figure 1.2
Some Elements in Port Geograph)¡
In the study of port geography a distinction is made between elements which come from
the landward side or the hinterland and those which come from the maritime side or the
foreland (Weigend, 1958). Research on the landward side tends to focus on city-port
interdependence, port-city industrialisation, transport networks and trade patterns, ports
and regional development relationships, and the policy formulation and decision-making
impact at various levels on the port-development process. On the maritime side, ships -in terms of their design and services - and the process of port selection by the ship-
operating companies are considered to be the main determinants of port development
and, hence, have been the focus of research. Other areas of interest in poft geography
include the patterns of global international trade, the specifrc characteristics of the
foreland areas, and international organisations, .such as the World Trade Organisation
(WTO), the European Union (EU), the Economic Community of West African States
Source: Hoyle and Hilling, 1984

(ECOWAS), the North American Free Trade Agreement CNAFTA) and the Latin
American Free Trade Agreement (LAFTA) (Hilling and Hoyle, 1984).
Figure1.3
Development of Seapofts over Spatial and Temporal
Scales and Associated Types of Study
The numbers in square boxes refer to the study types classified in Table 1.1 '2 Decisionrefers to problems of when to invest in port expansion, usually in a downstream orseaward direction; whereas '2 I-l' refers to port-linked industrial development, againusually in a seaward direction, and symbolised here diagrammatically by the port areaextending beyond the coastline.
ir----l*---g
râr(Y ld ctcfirì.r< f ioartt, J¡tFtàêànl ttl1,dy i'.rE l¡fn¡tù{t7ÐrÐç frf ç¡â:ãtèëf
ShlpÞ¡ncra¡rr¡irrfJ *lrt}¡ {¡pr)crJ¡llt¡;tflûrì( tx¡n<. ca?rt¡irror.
ro'-r¿t i
Sou¡ce: Bird. 1994
Bird (1984) also offers an account of the development of port studies since 1950 (Figure
1.3. He notes that early studies of seaports emphasised past-to-present causality,
explaining how present functions had been sha¡ied by past decisions. The general thrust
of later port studies, he notes, has emphasised the development of ports from the spatial
perspective. Table 1 shows examples of port studies. The categories are not discrete. The
placing of certain studies in some categories, according to Bird, is due to the thrust of
their study. Having justified the sub-discipline of port geography I now turn my attention
to the issue of transport and the development process, emphasising specially the port
infrastructure.
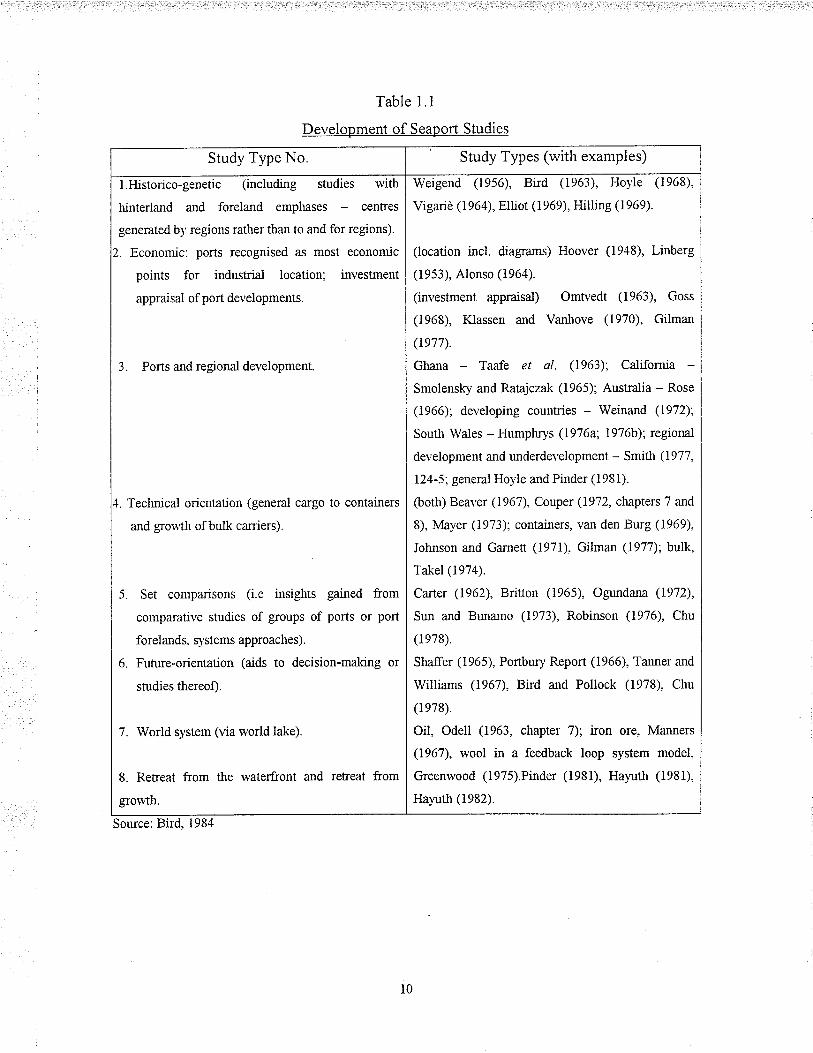
Table 1.1
Development of Seaport Studies
Study Type No. Study Types (with examples)
l.Historico-genetic (including sn¡dies with
hinterland and foreland emphases - centres
generated b¡' regions rather than to a¡d for regions).
. Economic: ports recognised as most economic
points for industriai location; investment
appraisal of port developments.
Ports and regional development.
. Teclurical orientatjon (general cargo to containers
ard grou'th of bulk carriers).
Set comparisons (i.e insiglrts gained from
comparative studies of groups of ports or port
forela¡lds. systems approaches).
Future-orientation (aids to decision-rnaking or
studies tlereof).
World system (via world lake).
6.
7
8. Retreat from the waterfront and
grouth.
from
Weigend (1956), Bird (i963), Hoyle (1968),
Vigariè (1964), Elliot (1969), Hilling (1969).
(location incl. diagrams) Hoover (1918), Linberg
(19s3), Alonso (1964).
(investment appraisal) Omtvedt (1963), Goss
(1968), Klassen and Va¡hove (1970), Gilman
(1e77).
Ghana Taafe et al. (1963); California
Smolensþ and Ratajczak (1965); Australia - Rose
(1966); developing countries - Weina¡d (19'12);
South Wales - Humpl4,s (1916a', 19'76b); regional
development and underdevelopment - Smitlt (I977,
124-5; generù Hoyle and Pinder (t981).
@otlr) Beaver (196'7), Couper (1972, chaprers 7 and
8), Mayer (1973); containers, va¡ den Bu¡g (1969).
Johnson and Garneu (i971). Gilmar (1977); bulk,
Takel (1914).
Carter (1962), Britton (1965), Ogundana (1972),
Su¡ and Bunarno (1973), Robinson (1976), Chu
(1e78).
Shaffer (1965), Portbury Report (1966), Tan¡rer and
Williams (1967), Bird and Pollock (1978), Chu
(1e78).
Oil, Odell (1963, chapter 7); iron ore, Marurers
(1967), wool in a feedback loop system model,
Greenwood (1975).Pinder (1981), Hayuth (t981),
Hal'uth (1982).
Sou¡ce: Bird, 1981
t0

1.3 Transport infrastructure and development
There is a close relation between volumes of transport and levels of economic activity
(Barber, i970, Best, 7966, Chinitz, 1960, Gaúthier, 1970, Leinbach, 1979, Rowstow,
1960, Scarperlanda, 1966, Todd and Hseuh,1990, Todd, 1993). This close correlation is
attributed to the fact that most economic activities take place only if transport is available
to permit them to do so. Hence governments all over the world devote a fairly uniform
proportion of total investment to transport, irrespective of economic conditions (Owen,
1959). As a matter of fact there is no fundamental disagreement concerning the
importance of transport in the development process. This consensus, however, is lost
when it comes to the question of the precise role of transport in fostering greaTer
economic and social development. To some, transport investment is a sine qua non to
development and must therefore be given utmost attention in the development process.
Others are of the opinion that transport's role in economic development is passive, while
yet others also think that transport's role in the economy is rather negative. In the ensuing
paragraphs I discuss these strands of the transport-development debate, focusing on
eventually port infrastructure and African development.
The thrust of the positive school of thought is that transport is the formative power of
economic growth and that a lack of transport facilities can considerably retard
exploitation of natural resources, industrialisation, expansion of trade and, in some cases,
national unity - in a nutshell economic growth - (Hoyle and Hilling 1970b:1). Lord
Lugard (seø O'Connor 1965), for example, believed that Africa's material development
could be summed up in the one word - transport. Others like Baxter (see Button
1982.245) also claim that the railway has been the most power:fuI agent in the progress of
commerce, in improving the conditions of the working classes, and in developing the
agricultural and mineral resources of the United Kingdom. Perhaps the most powerful
comment to come from this school was that of Rostow (1960). In his thesis the stages ofeconontic growth, Rostow wrote, "the introduction of railroads has historically been the
most power:fuI single indicator of take-off It was decisive in the United States, France,
Germany, Canada and Russia". Good transport, according to Button (1982), offers low
shipping costs, which permit u'ider markets to be served and the exploitation of large-
11

scale production in an extensive range of activities. He cites Hunter (1965), who argues
that there is a causative link between inexpensive or low-cost transport and economic
growth and that the industrial revolution owéd its success to a prior revolution in
transport technology. From the same perspective Owen (1964 in Addo, 1979) also argued
that a widening of the domestic market through improved transport services is a
prerequisite for national economic development.
The benign view of transport suffered a blow to its credibility as a result of the work of
economic historians like Fogel. This group assigned a'lag' rather than a 'lead' role to
transportation. They argued that transport facilities tend to expand to meet needs, and will
not in themselves generate new economic growth, thus, casting doubt on the role of the
railroad in sparking the economic development of the United States. They held the view
that similar growth could have been achieved if water transportation had remained
dominant. Out of their analysis emerged a new view of transport; that is, good transport
does not cause but rather permits economic development (see Taaffe, 1973, Button
1982). Transportation can become the catalyst for economic growth only where there are
resources to be developed and people capable of developing them. In short, easy
predictions of outcomes are ruled out because so many variables are involved in the
development equation. Transport plays its part by permitting the natural resources and
talents of a country to be exploited. Transport can help release working capital from one
area, which can be used more productively elsewhere, although a necessary prior
condition is the existence of suitable productive opportunities in potential markets.
Transport, therefore, is not anecessary but rather a sfficient condition for development.
The third school of thought argues that an excessive amount of scarce resources tends to
be devoted to transport investment to the detriment of other sectors of the economy. As
with other scarce inputs, this school believes that it is possible to determine an optimal
threshold or provision of transport investment needed to generate economic development
such that resources are not wasted on transport. Its adherents believe that, due to political
and other reasons, transport tends to receive more investment than can be justified
economically. According to Hirschman (1958), the transport sector is the object of over-
t2

investment because it is difficult to prove mistakes economically even after major
projects have been completed. Wilson also comments that it is diffrcult to point out the
cost and benefrts of transport investments owing'to the large sums of capital involved, its
longevity, and associated externalities. Though they accept that an adequate basic level of
transport investment is needed for economic development these scholars question
whether the opportunity costs involved in further improving transport are necessarily
justified (see Button 1982).
1.4 Port infrastructure and African development
Ports have contributed signif,rcantly to the development of their host countries. Many
writers have noted this observation. Hilling, for example, has emphasised the close
relationship that has emerged between seaports and the development process in Africa.
He writes, "the provision of port facilities has been a necessary pre-condition of modern
economic growth in Africa", and that, "the stage of development reached in a given part
of Africa is in a considerable measure a function of the capacity and degree of
sophistication of the port facilities available" (Hilling, l970b.127,I{il1ing, 1990). Button
(1982.245-246) also adds, "most undeveloped countries are, for a variety of geographical,
economic and historic reasons dependent upon international trade and an expansion of
this trade is an essential prerequisite for growth. In these circumstances the provision of
efficient port facilities will positively assist development".
It must be mentioned that there is an alternative view which considers ports as an
infrastructural tool used by the colonialists to exploit Africa's resources (Schulze, 1970).
This writer adopts the view of ports as development tools. In this vein the role of the
seaport in Africa that comes to mind fìrst is the development of the mineral and forest
resources. Schulze (1970) cites Liberia as a case in point. In 1934 a rich magnetite
deposit was discovered in the Bomi Hills but W H. Mueller's Company, due to the lack
of suitable port facilities, could not exploit the deposit. It was only in 1946 when the
construction of the Free port of Monrovia was well advanced that the Liberia Mining
Company was established, leading to the first shipment of iron ore in 1951. Iron ore is
nowthe chief foreign exchange earner of Liberia. Hoyle and Charlier (1995) also cite the
13
cases of coal and iron ore at Richards Bay and Saldanha Bay (South Africa), iron ore at
Nouadhibou (Mauritania), phosphate al Lome and Kpemè (Togo), and the treatment of
timber at San Pedro (Ivory Coast).
Besides this role, ports have also been instrumental in industrial and urban growth in
many African countries. Couper (1971) and Scarperlanda (1966) have both observed this
function. Scarperlanda (1966.206) wrote, "seaports and external trade are now vital
factors in the emergence and growth of the money economy of developing countries, in
the expansion of their urban populations, and in the growth of their market systems,
increased trade has also assisted in creating conditions conducive to the development of
modern agricultural systems and to the establishment and expansion of modern industry".
The dense concentration of population in port cities and their burgeoning economic
environment have made them all the more attractive for further investments, spawning
Myrdal's circular and cumulative causation mentioned earlier.
In lvory Coast, San Pedro is part of a development programme for the south-western part
of the country (Hoyle and Charlier, 1995). So is Richards Bay and Saldanha Bay in South
Africa (Wiese 1984) and Tema in Ghana. Even in industrialised countries the regional
implications of ports are signifÏcant. Holocher (1990:63) notes this: "in many countries
the ports are not very important compared with other trades or industries. On a regional
or local scale [however] a seaport might be seen quite differently". He cites the case of
Bremen, Germany, where in 1983 about 27 per cent of all jobs (93,000 jobs) were
directly or indirectly dependent on the port and/or on the access to deep-water channels
for ocean-going ships. What is more, an annual amount of about i50 million Deutsche
Marks (DM) is paid by port-related jobs in the form of tax to the Bremen city. When
taxes arising from jobs not directly related to the port are added, Bremen is estimated to
get back more than its total expenditure on the port.
t4

In Africa, South Africa (Figure 1.4) is often cited as the quintessential case of the
significance of ports in regional development. Durban, for example, as a result of its port
activities has become the leading industrial, service and financial city of Natal. Its 1970s
growth rate of employment and per capita Gross Domestic Product (GDP) were above
the national average. The Durban metropolitan area now boasts South Africa's second-
largest concentration of industries, population and buying po\¡/er.
Richards Bay is another port success-story in South Africa. In 7970 Richards Bay was a
small fishing village of about 60 inhabitants. By mtd 1979 it had developed into one of
South Africa's major deep-water export ports with a population of about 7,300 people
plus a satellite town of about 20,000 people. Richards Bay is now the world's largest coal
export port with about 60 million tons per year. Port-related and unrelated industries
include an aluminium plant (ALUSAF), the Triomf Fertiliser - with production capacity
of 198,200 tons per day - milling companies, cable and wire companies and fencing
material factories, to mention just a few. About 15 small service industries such as
electrical and mechanical engineering have also been opened in factory buildings
provided by the Industrial development centre (DC) in the Alton industrial area and
these serve the local and regional markets. These port-related activities have provided
employment for many people in the region (Table 1.2) There are now plans by the
TRANSNET, the Department of Planning, the Richards Bay Town Board, the IDC, and
the Natal Provincial Administration to turn Richards Bay into an urban metropolitan
complex to house a population of about 100, 000 by the year 2000. In the words of 'Wiese
(1984), Richards Bay has become a clear case of the intertwining of shipping, port and
regional development policy in a socio-economic development exercise.
l5

Tablel.2
Emplo)¡ment situation in Richards Bay. 1978-79
Company Whites Blacks Coloureds Asiatics Total
ALUSAF 404 931 I 335
TRIOMF 148 495 643
Richards Bay Milüng 25 281 9 3i5
Richa¡ds Bay Minerals 245 50'7 752
Small lndustries 280 581 T4 28 903
Total Indusfy I 102 2',7'75 t4 -tt 4 681
Construction 12t I 519 138 50 I 828
SAR &H 334 300 634
Richa¡ds Bay Coal Termi¡ral t20 350 470
Empargeni Transport 31 293
Government and Province t46 t70
Torvn Board t64 s10
Shops and Offices 167 t29 8
Private 214 190 t2 t4
Domestic 718 2
Tot¿-l Senices 1 1',76 2 660 t4 22
Agriculture r29 2 920 t49
Total 2 528 9 894 t66 2s8
Source: Wiese. I984
These success-stories are not limited to Durban and Richards Bay. Saldanha Bay is
another case in point. A deep-water iron ore export port, Saldanha Bay has become a
nucleus for growth in its region, especially for the Western Cape area, even though the
government had not offrcially declared it such. The port, which is accessible for bulk
carriers up to 250 000 tonnes and has an annual throughput of about 15 million tonnes
(1978) of ore shipped mainly to Japan and north-western Europe, now ranks third
amongst South Africa's ports. The developmental impact of the port and its shipping
services is reflected in the Bay's industrial and population development growth. From a
town of about 4,900 people, Saldanha Bay together with its regional administrative
centre, Vredenburg, jointly grew to a population of about 27,000 people in 1979. With
l6

respect to industrial development linked directly to the port a 3 million tonne per annum-
capacity steelworks was envisaged by ISCOR in 1970.
As a node for industrial and urban development Saldanha Bay has the advantage of being
the port for import of coal and coke from Transvaal by way of Richards Bay and for
export of products. Since bulk carriers of over 150 000 tonnes and tankers of up to 500
000 tonnes use the sea-route and the Cape, and given the great distance between existing
repair facilities for the largest vessels in Bahrain and Lisbon, it has been suggested that
large-capacity dry docks be built at Saldanha, and, promoting strong links with the steel
industry. There are plans to construct a second bulk export terminal and related facilities,
double the handling capacity, construct the steelworks, and develop the harbour-related
urban-industrial metropolitan complex to attain a maximum of one million inhabitants.
These would benefìt from large-scale job opportunities in the port, on the railways, in
heavy industries, related light industries, the Central Business District (CBD) and public
services. As Wiese (1984:a30) puts it, "it is easy to imagine the impact of these
developments on employment, infrastructure, urbanisation in the Western Cape and, in
particular, in the Greater Saldanha-Vredenberg aÍea".
1'Ì
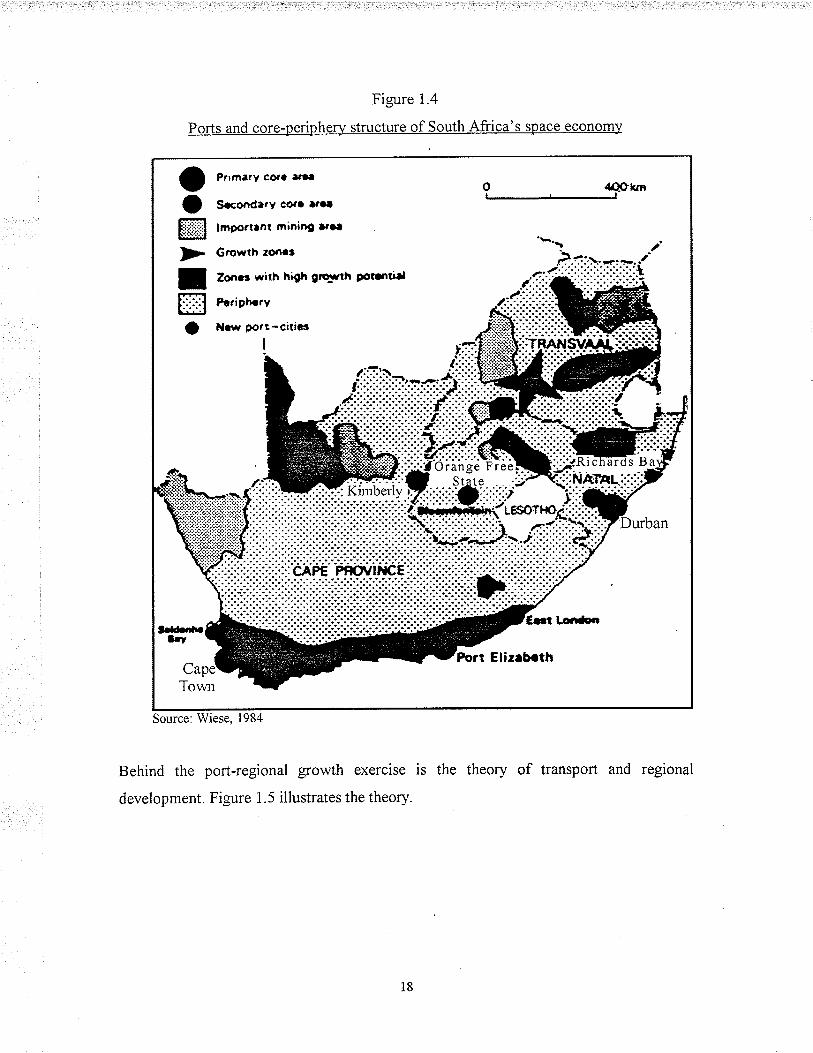
Figure 1.4
Ports and core-periphery structure of South Africa's space econom)¡
Source: Wiese, 1984
Behind the port-regional growth exercise is the theory of transport and regional
development. Figure 1.5 illustrates the theory.
18
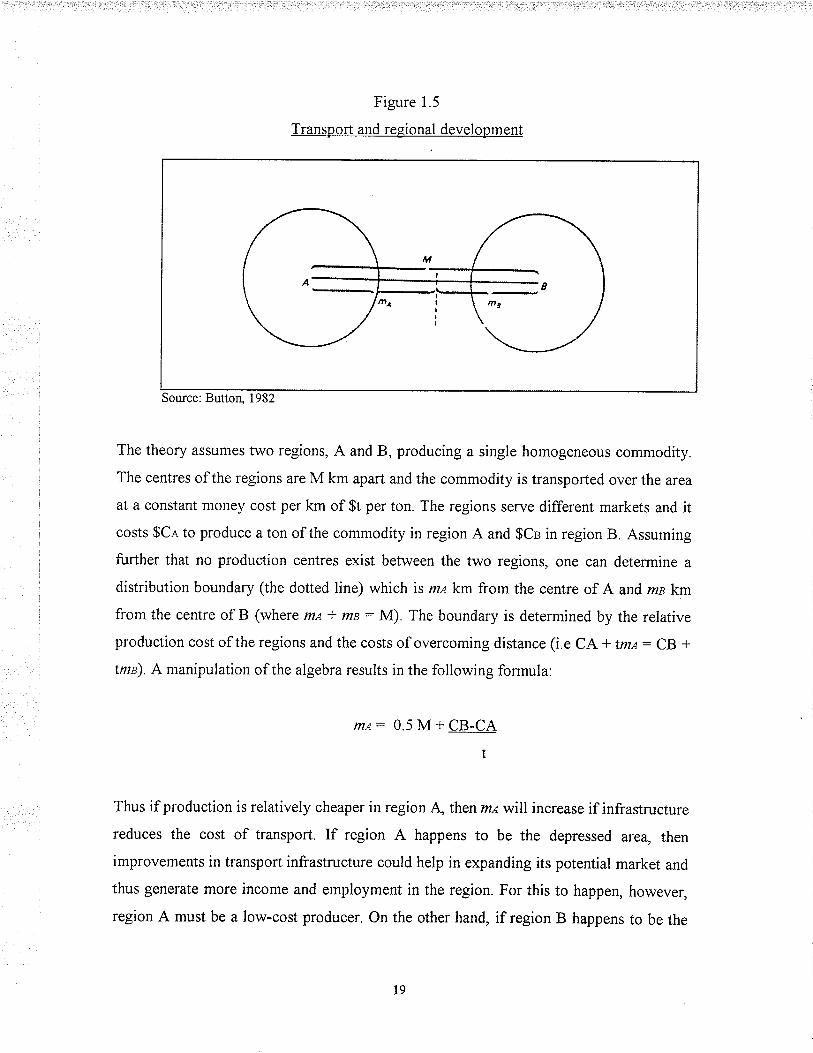
Figure 1.5
Transport and regional development
Source: Butto4 1982
The theory assumes two regions, A and B, producing a single homogeneous commodity.
The centres of the regions are M km apart and the commodity is transported over the area
at a constant money cost per km of $t per ton. The regions serve different markets and it
costs $Ca to produce a ton of the commodity in region A and $Cs in region B. Assuming
further that no production centres exist between the two regions, one can determine a
distribution boundary (the dotted line) which is m¿ km from the centre of A and ms km
from the centre of B (where m.s. t mn : M). The boundary is determined by the relative
production cost of the regions and the costs of overcoming distance (i.e CA -t tm.t: CB +
tma). A manipulation of the algebra results in the following formula:
mt:0.5M+CB-CA
t
Thus if production is relatively cheaper in region.\ then mewill increase if infrastructure
reduces the cost of transport. If region A happens to be the depressed area, then
improvements in transport infrastructure could help in expanding its potential market and
thus generate more income and employment in the region. For this to happen, however,
region A must be a low-cost producer. On the other hand, if region B happens to be the
19

depressed area, then clearly its regional problems will worsen due to the loss or
contraction of its market area. In the scenario where {CB-CA} > Mt, region B may be
forced from the market altogether, driven outbythe expansion of region A's market area.
Taaffe and Gauthier (1973:36) corroborated this view when they wrote that "for trade to
take place between any two points, i and j, the transport costs, Cy must be less than or
equal to production cost or price differential between i and j, ie Cij -< (Pi - Pl). If
transport costs are less than price differentials between any two points, trade may take
place and regional specialisation can begin". The model, however, assumes a single
commodity market, which is hardly the case with comprehensive economies.
Regions prefer not to specialise in single commodities but rather in a range of
commodities. With improvement in transportation, therefore, regions begin to specialise
in several commodities in which they have competitive advantage rather than in just a
single commodity. In this case, specialisation may be detrimental to some activities; it
will nonetheless strengthen others. The overall effect of improved transport on the
regional economy will thus, according to Button (1982.260), "depend upon relative
production costs between the regions and the importance of transport vis-à-vis production
costs in the overall cost functions for the various commodities". Rietveld and Nijkamp
(1993) provide a diagrammatic presentation, showing the developmental effects of
transport in a region in the scenario of multiple trade (Figure 1.6).
20
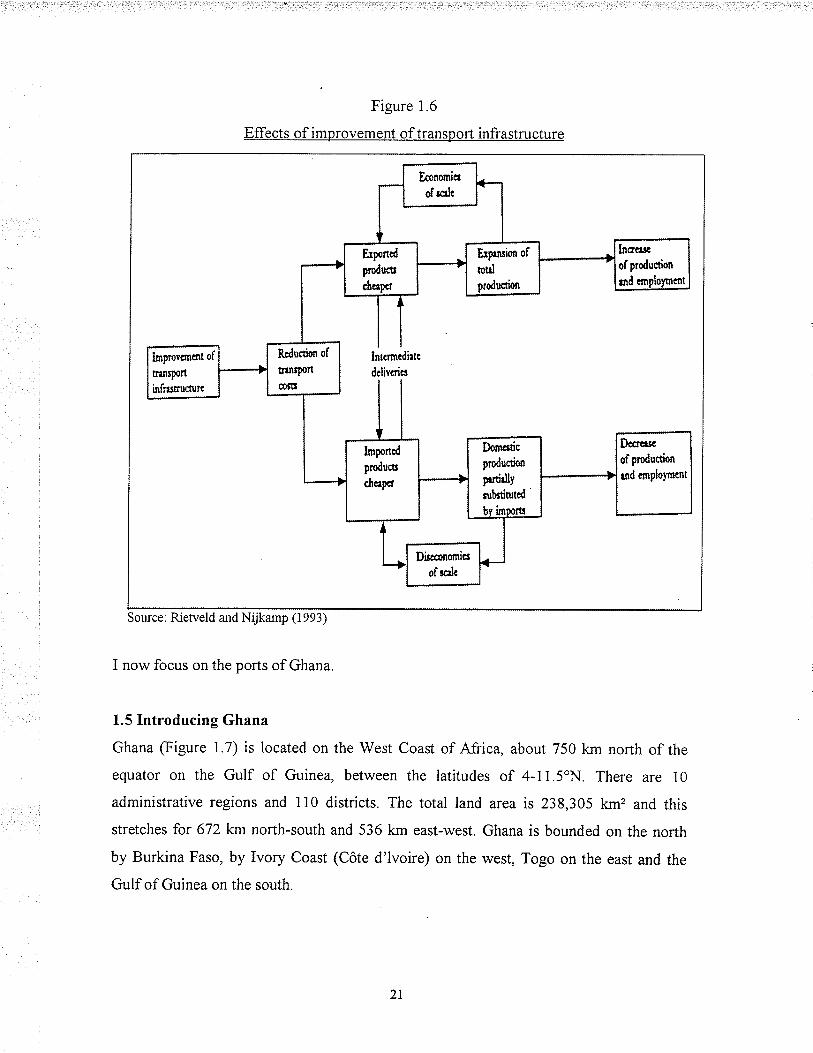
Figure 1.6
Effects of improvement of transpoft infrastructu¡e
Improvcmot of
ñr¡¡trñinfr¡sructun
Sou¡ce: Rietveld and Nrjkamp (t 993)
I now focus on the ports of Ghana.
l.5Introducing Ghana
Ghana (Figure 1 7) is located on the West Coast of Africa, about 750 km north of the
equator on the Gulf of Guinea, between the latitudes of 4-11.5oN. There are 10
administrative regions and i10 districts. The total land area is 238,305 km2 and this
stretches for 672 km north-south and 536 km east-west. Ghana is bounded on the north
by Burkina Faso, by Ivory Coast (Côte d'lvoire) on the west, Togo on the east and the
Gulf of Guinea on the south.
21

Figure 1.7
Administrative regions of Ghana
'-'-'t'"'
t / EAST .8olgat¿ngð ,,i UPPER wEsT r. n|ôio* .-. _--_-1...t.^ FEGION ì ,t:-"" '\..ì
) lt"*.' "t\.t! .*, .) l,f-¡)i,l) ------'*' II-"- \(-'ì , Tamåte Þ"''t'.| ''ott'¿te !
t NORTHERN REGION ,rrt'rt1.J'ï'r ,--lsr-. ,/-*a.!\, ,t" ,' t \l..i(-,-r\i \' :> \ ("'---.--""-J /..) \ -¿'
I \,t- -"- !..t' r, ..
VOLTA !Ií BRoNG aHAFo RÊGroN \..ro,o*r!I -.r. \ ¡'i Suny.n, .--,. (- \-, /'----:--\. t - \.i -- '; t
_ - \_-..; t--- '..| -., ì
i ) .t"t-'4, !..' ASANTE ¡-" í t
,/'-.. í Rectorv ,' .,' i
). i-r. ! r(umas'¡ !'easreRru i tù.,
\ -\-l¿_
,." REGtoN ì t..-.
\ -'¡r .) Koto,,dua (. \.*\, '.iJ.r j "" ";'"' , _. ./\ *rrrr*N..:ì\.-._,-j. .,.-.,-)__,,!t *to,o* t., t'----,"ti-'/ tCt-.- nEGlON ) '----,'-'.,
\ ,...' CENTRAL I. G RÊATER
i ì.. "Jä,ãi -{acc,a
'âr.f,äil\ì
sr*ond, Æo"rt 0..*r--90*t
Source: Bemeh and Dickson, 1984
Until its independence from British colonial rule on 6 March 1957, Ghana was called the
Gold Coast, a name given it by early Portuguese explorers who first set foot on the shores
of the country in the fÌfteenth century. The name aptly describes the country's wealth in
gold and natural resources, which include to the present day:
o rich mineral resources such as gold, diamonds, manganese, bauxite, iron ore and
various clay and salt deposits,
22

extensive, rich forests with a wide range of fine tropical hardwoods,
a wide variety of agricultural products and rich fishing resources;
unique tourist attractions, including beautiful landscapes, inviting sunshine,
golden beaches, wildlife parks, the country-side with its rich cultural heritage, and
the proverbial warmth and hospitality of the people.
Ghana has a population of I8.3 million (1990 estimate) people. With an annual growth
rate of 3.2 per cent, this figure is expected to increase to over 19 million by the year
2000. On average the population density is about 52 persons per square kilometre. Most
of the population is concentrated in the southern part of the country, with the highest
densities occurring in urban areas and cocoa-producing areas. The largest regions in
terms of population are Ashanti (about 2 million), Eastern (about 1.7 million) and Greater
Accra (about 1.5 million). The capital city is Accra. In terms of vegetation the country is
divided into six regions; namely, moist-semi deciduous forest, Sudan savannah, Guinea
savannah, the Rain forest, the Coastal scrub and grassland and the Strand and Mangrove
zone (http://$'$."rÀ,. ghana-embassr,.orglprofi leô.
1.6 The ports of Ghana2
1.6.1 Takoradi port
Takoradi port was constructed ìn 1928 by Sir Gordon Guggisberg, the then British
Governor, in response to the difficulties encountered by the surf ports in handling the
expanding external trade of the country, especially mineral shipments. There were
problems with imports, too, as various kinds of goods stood outto sea for weeks on end.
This congestion problem constitutes the basis of Takoradi's emergence. The construction
of the port was central in the Ten-Year Development Plan of Guggisberg. Arguing before
the Gold Coast Legislative Council, Guggisberg emphasised the importance of the port
and its associated railway to the external trade of the country. He also noted the
importance of an increased external trade on the recurrent cost of a better educational
system that was to be implemented. Guggisberg's conviction of the significance of a
modern port to the socio-economic development of the country was so strong that even
t Figure l.l4 sholvs the locaúon of the ports.
23

the economic slump in the early 7920s could not restrain him. It is said, "He was
convinced that the proper reaction to an economic slump was to build for the future,
when prosperity should have revived, and not to sit supinely under adversity" (see Addo
1994:55). Construction work on the port (Figure 1.8) started after the First World War.
Port operations started on 3 December 1928.
Figure 1.8
Port of Takoradi
il8llÊlÞlcleoq Co r's
Forl Hitl Boy(site of) Tokorodi
F
c G eñ ero,
t
II
coroô
IIÈr1
II
oer ¡Ài-
tItooríng s
IIIu
11,l
1
Bouxlle conveyor.# RoilwOys
-J¿- Moín rood
O 1kmt---J-------J
A Bouxlle dumP E Timber whorfB Bouxile berth F Clinker whorfC Mongonese berth G Tonker berthD Cocoo sheds H Cement foclorY
Source: Addo. 1984
24
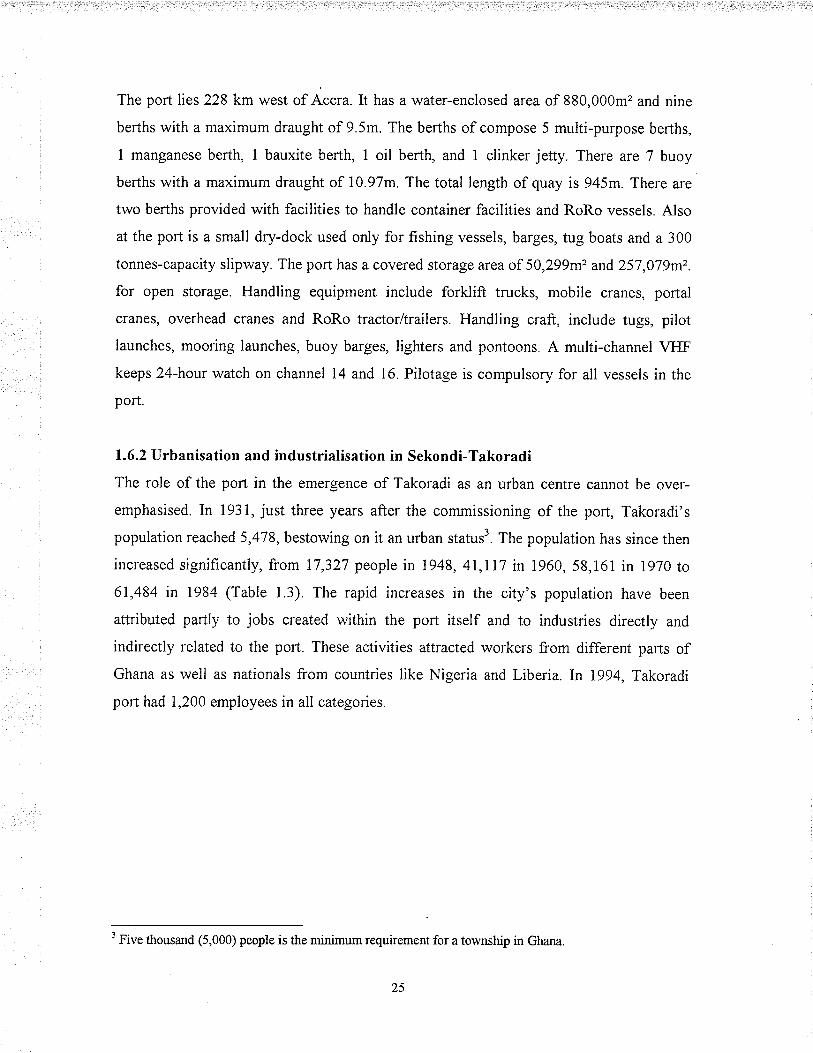
The port lies 228 km west of Accra. It has a water-enclosed area of 880,000m2 and nine
berths with a maximum draught of 9.5m. The berths of compose 5 multi-purpose berths,
I manganese berth, I bauxite berth, I oil berth, and 1 clinker jeuy. There are 7 buoy
berths with a maximum draught of 10.97m. The total length of quay is 945m. There are
two berths provided with facilities to handle container facilities and RoRo vessels. A-lso
at the port is a small dry-dock used only for fishing vessels, barges, tug boats and a 300
tonnes-capacity slipway. The port has a covered storage area of 50,299m2 and 257,079m2.
for open storage. Handling equipment include forklift trucks, mobile cranes, portal
cranes, overhead cranes and RoRo tractorltrailers. Handling craft, include tugs, pilot
launches, mooring launches, buoy barges, lighters and pontoons. A multi-channel VIIF
keeps Z4-hour watch on channel 14 and 16. Pilotage is compulsory for all vessels in the
port.
1.6.2 U rban isation and industrialisation in Sekondi-Takoradi
The role of the port in the emergence of Takoradi as an urban centre cannot be over-
emphasised. In 1931, just three years after the commissioning of the port, Takoradi's
population reached 5,478, bestowing on it an urban status3. The population has since then
increased significantly, from 17,327 people in 1948, 4l,ll7 in 1960, 58,161 in 1970 to
67,484 in 1984 (Table 1.3). The rapid increases in the city's population have been
attributed paftly to jobs created within the port itself and to industries directly and
indirectly related to the port. These activities attracted workers from different parts of
Ghana as well as nationals from countries like Nigeria and Liberia. ln 7994, Takoradi
port had 1,200 employees in all categories.
3 Five thousand (5,000) people is the minimum requirement for a tow¡rslúp in Ghana.
25
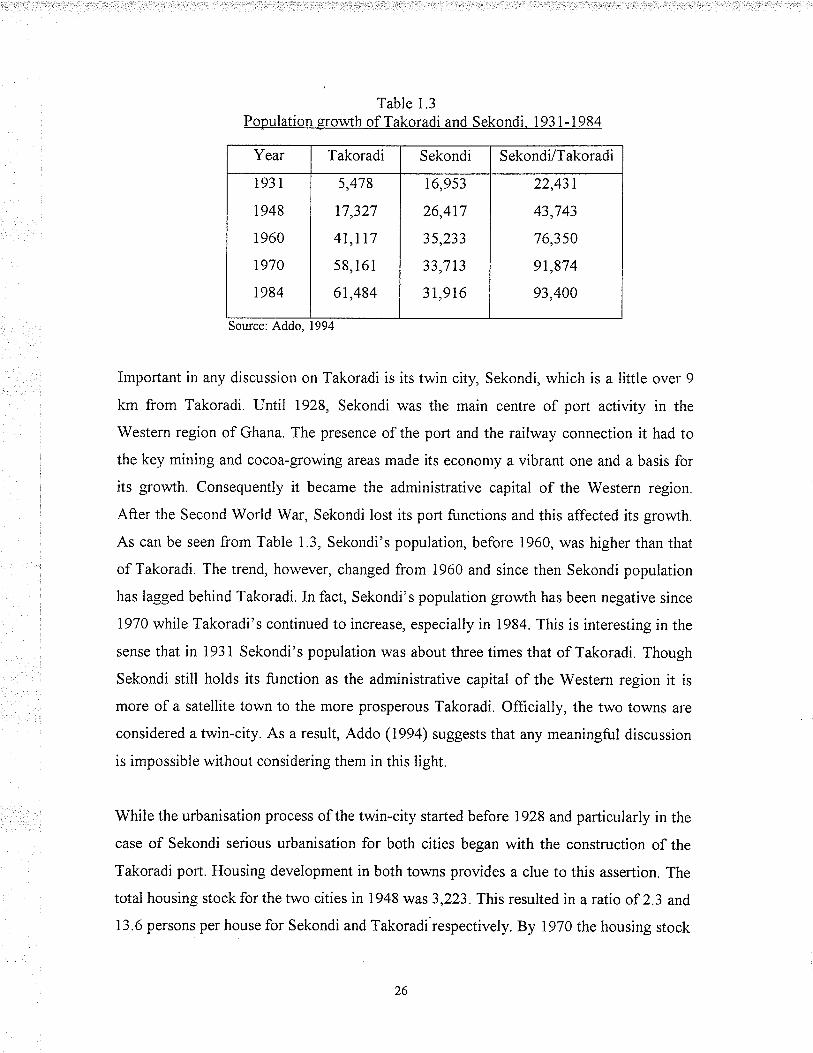
Table 1.3
Population growth of Takoradi and Sekondi. 1931-1984
Year Takoradi Sekondi Sekondi/Takoradi
193 I
1 948
1960
1970
1984
5,478
17,327
4I,IT7
58,i61
6r,484
r6,953
26,477
35,233
33,7L3
3r,916
22,431
43,743
76,350
91,874
93,400
Sou¡ce: Addo, 1994
Important in any discussion on Takoradi is its twin city, Sekondi, which is a little over 9
km from Takoradi. Until 1928, Sekondi was the main centre of port activity in the
Western region of Ghana. The presence of the port and the railway connection it had to
the key mining and cocoa-growing areas made its economy a vibrant one and a basis for
its growh. Consequently it became the administrative capital of the Western region.
After the Second World War, Sekondi lost its port functions and this affected its growh.
As can be seen from Table 1.3, Sekondi's population, before 1960, was higher than that
of Takoradi. The trend, however, changed from 1960 and since then Sekondi population
has lagged behind Takoradi. In fact, Sekondi's population growth has been negative since
1970 while Takoradi's continued to increase, especially in 1984. This is interesting in the
sense that in 1931 Sekondi's population was about three times that of Takoradi. Though
Sekondi still holds its function as the administrative capital of the Western region it ismore of a satellite town to the more prosperous Takoradi. Oflicially, the two towns are
considered a twin-city. As a result, Addo (1994) suggests that any meaningful discussion
is impossible without considering them in this light.
While the urbanisation process of the twin-city started before 7928 and particularly in the
case of Sekondi serious urbanisation for both cities began with the construction of the
Takoradi port. Housing development in both towns provides a clue to this assertion. The
total housing stockforthetwo cities in 1948 was3,223. This resulted in a ratio of 2.3 and
13.6 persons per house for Sekondi and Takoradi'respectively. By 1g7O the housing stock
26

in Sekondi had declined from I,894 in 1948 to 1,797 . On the other hand, on account of its
vibrant and growing economy Takoradi recorded an increase of 7,525 units (Table 1.4).
The decline in the housing stock in Sekondiwas associated with the city's loss of its port
functions which served as a growth pole and the abandonment of old houses, as well as
with the lack of desire to build new houses as a result of lack of demand. Together,
however, the two cities had 4,65 I housing units in 197 0 against that year's population of
9L,874. Thus, there were roughly about 20 persons per house. This compares with
approximately 7 persons per house in 1948.
Table 1.4
Housing delivery at Sekondi-Takoradi. 1948-84
City l 948 I 960 1970 t984
Sekondi
Takoradi
Sekondi/Takoradi
1,894
1,329
3,223
r,965
) )4)
4,207
1,797
2,854
4,651
1,831
3,525
5,356
Source: Addo, 1994
This declining housing occupancy ratio marked the beginning of the problem of
overcrowding which \ilas a result of influx of migrants to Takoradi in search ofjobs. jobs
which were highly port-inspired. In 1984 the housing stock in Takoradi rose by 23.5 per
cent as compared with only 1.9 per cent in Sekondi. For the twin-city in that year
persons-per-house ratio was 77, implying improvement in the 1970 figure. The
improvement, however, was attributed more to a low population growth rate than to any
significant performance in housing delivery. From 1960 to 1984, for example, Sekondi
recorded a negative population growth rate of 9.5 per cent.
With respect to industrialisation, two main industries have benefited signifïcantly from
the building of Takoradi port. These industries are those that deal in bulky raw materials
and those that derive their raw materials from processed items. In the category of bulky
raw materials are the mining companies and in the second category are the cocoa-
processing factory, the numerous wood-processing factories, and units of the tobacco,
27
leather, chemical and rubber and plastic industries. In 1984 the manufacturing sector in
the twin-city employed about 12,903 people and this constituted 74 per cent of the total
population of the twin-city. This figure represented an 850 per cent increase over the
i948 workforce in the manufacturing sector (Addo, 1994).
These achievements notwithstanding, Takoradi began to experience capacity problems
during the post-war economic boom experienced by the country. Ghana's external trade
increased dramatically immediately after the war due to the insatiable demand for tropical
raw materials and the need to reconstruct and develop the country's infrastructure. There
was, for example, a jump in the country's import from 7.6 million (British) pounds in
193 8 to 45.4 million pounds in 1949. Food imports, for instance, increased in value from
1 million pounds to 6 million pounds while tobacco, drinks and textiles increased four,
seven and ten times respectively. Cement imports doubled in the same period. After 1949
the ports' ability to handle the country's external trade became an issue of great concern,
since its overall growth rate slackened even though world trade continued to boom.
"Shipping was frequently delayed and there were cases of ships waiting for as long as 17
days before getting alongside to unload" (Hilling, 1970a'. 112). Evidence of this can be
seen from the ports' traffrc in Table 1.5.
28

Table 1.5
Ghana's port traffic. 1938 and 1945-1967 (1.000 tons)
Source:Hilling, 1970bImp = Import, Exp = Export, o/oL = %o change
Despite fluctuations, the ports'traffic increased by 685,197 tons between 1938 and 1945,
but by only 397,764 tons from 1949 to 1953. The 1950 figures were affected by a general
strike, which disrupted port operations and accounted for the higher figures for the
following year. This was especially the case at Takoradi, for the surf ports closed during
the war had to be re-opened. The consequences of the limited port capacity were
recurrent shortages of consumer goods and delays in delivery of important development
Year
TAKORAD]
lmp Exp
ACCRA
Imp Exp
TEMA
Imp Exp
OTHER
Imp Exp
COUNTRY
Lnports Exports Totai
Tons %A Tons YoL Tons %A
r 938 299 477 92 129 40 54 431 653 1084
1945 282 1135 62 99 344 -20.2 1234 88.9 1578 45.6
t946 320 1206 93 9l I 4 4r4 20.3 1301 5.4 l7l5 8.'7
t947 355 986 156 58,7
15 518 25.1 1059 ,18.6 1577 -8.4
I 948 444 1179 184 56 18 l4 646 24.7 1249 17.4 1895 20.2
t949 55ó 1319 273 65 35 25 864 18.9 1409 8.7 22'73 20.10
I 950 583 1280 245 66 51 27 881 1.9 1373 -2.6 2254 -0.84
l95 t 675 1378 320 6l 53 z5 t 048 18.9 1464 6.6 2512 14.4
1952 711 1317 312 55 33 27 1056 0.76 1399 4.4 2455 -2.3
r 953 717 1403 390 69 51 31 l 1 58 9.7 1503 7 .4 2661 8.4
t954 719 115'7 387 60 54 28 I r 60 0.17 1245 -17 .2 2405 -9 .6
l 955 854 1272 512 69 60 30 t426 22.9 1371 10.1 2797 16.3
l 956 799 1529 529 '78 56 28 1384 -2.9 1635 19.3 3019 7.9
t957 874 1679 543 80 55 35 1472 6.4 1794 9.7 3266 8.2
I 958 764 1525 583 65 50 27 139'7 -5. r 1617 -9.9 3014 -'7.'7
r959 815 1720 6'75 8t )) 29 1545 10.6 1830 13.2 3375 12.0
r 960 1007 I 895 791 89 45 51 t 843 19 .2 2035 11 .2 3878 14.9
I96t I 107 I 558 877 155 172 35 57 38 2213 20.1 1786 -12.2 3999 3.1
1962 736 1562 206 622 206 17 7 1581 -28.6 1'7'15 -0.6 3356 -16.1
r 963 717 1504 1010 291 t727 9.2 1795 1.1 3522 4.9
r964 448 1513 r699 578 2141 24.3 2091 16.5 4238 20..¡
I 965 382 1643 1537 658 t9l9 -10.6 2301 10.0 4220 -0.4
I 966 4t7 1597 1357 584 1774 -7.6 2t85 -s.2 3955 -6.3
1967 242 1436 1sr0 558 1152 -r.2 1994 -8.7 3746 -5.2
29
materials. With this increase in p"rronul consumption and the requirements of rapid
development the country's physical capacity was stretched, causing inflation. Seers and
Ross (in Hilling, i970b) write, "to say which is the most serious of these strains would be
hard, but a strong case can be made out for treating port capacity as the main bottleneck".
These events ushered in plans for the construction of the port of Tema, to which I turn my
attention in the following section.
1.7 Port of Tema
The development of Tema port occurred in association with an interlocking process of
change initiated through the implementation of a major government policy. The other
components of these processes of change include the establishment of the aluminium
smelter and the construction of a dam across the Volta River at Akosombo. Discussions
on the project to harness the Volta River for hydro-electric power to be used by the
aluminium smelter started in 1949. One of the duties of the consulting firms employed
was to report on the transport problems associated with the scheme and, most especially,
on the provision of port facilities. The Committee's report (1951) concluded that "the
provision of a new deep-water port is, in our view, essential to the future development of
the colony, irrespective of whether the power scheme is carried out or not" (Hilling,
7970a:113). The choice of Tema as the site for the new port stems from two main
considerations. The first was the requirements of the general economic development of
the country while the second was the specific requirements of the Volta River Project.
There were obvious advantages of siting the new port near the capital to serve the densely
populated eastern part of the country and more especially as Accra was already linked by
rail to the interior. What is more, the original idea of building the dam at Ajena with the
smelter at Kpong (Figure 1.14) served equally to prove the locational advantage of
having the port in the south-east of the country. The later decision to site the dam at
Akosombo, a few kilometres downstream of Ajena, and ship bauxite from Kibi, about 75
km inland and close to the Accra-Kumasi railway, also confirmed a port location close to
Accra.
30
The original intention of the aluminium company was to have the port sited at Ada, at the
mouth of the Volta River, as they planned to bring the bauxite ore from Aya-Yenahin,
west of Kumasi, by way of the Volta Lake and River artery (Figure 1.14). The Ada area,
however, is low-lying and badly drained. ln addition, the cost of construction would have
increased as a result of dredging and river control. Again Ada had no rail connections
with Accra and was also not centrally located to serve the Eastern region. Locating the
port at Accra itself was a non-issue as the coastline in the immediate neighbourhood is
subject to silting and the already developed urban landscape adjacent to the existing port
made further development of facilities at the capital impossible. From the outset,
therefore, economic considerations supported the location of the port near Accra for
linkage with the existing rail system and ease of access to the rest of the Eastern region
and the proposed Volta River Project development schemes. With the coastline of Ghana
deficient in natural port sites the ultimate decision to locate the port at Tema, a fishing
village 18 km east of Accra was based on the following unusual physical characteristics
of the site.
1. The existence of deep water close to the shore.
2. The existence of a rocþ headland which provided a 'root' for the main
breakwater.
3. The steep rocþ sea bed which minimised the effect of littoral drift and
considerably reduced dredging.
4. The existence of extensive areas of land in the neighbourhood for industrial
and urban development.
5. The availability of suitable rock at the Shai Hills, 30 km north of Tema, for
constructional purposes (Addo, 1994, 1995, Hilling, I970a).
The port was started in June 1951 and completed in 1962 (Figurel.9).
3l
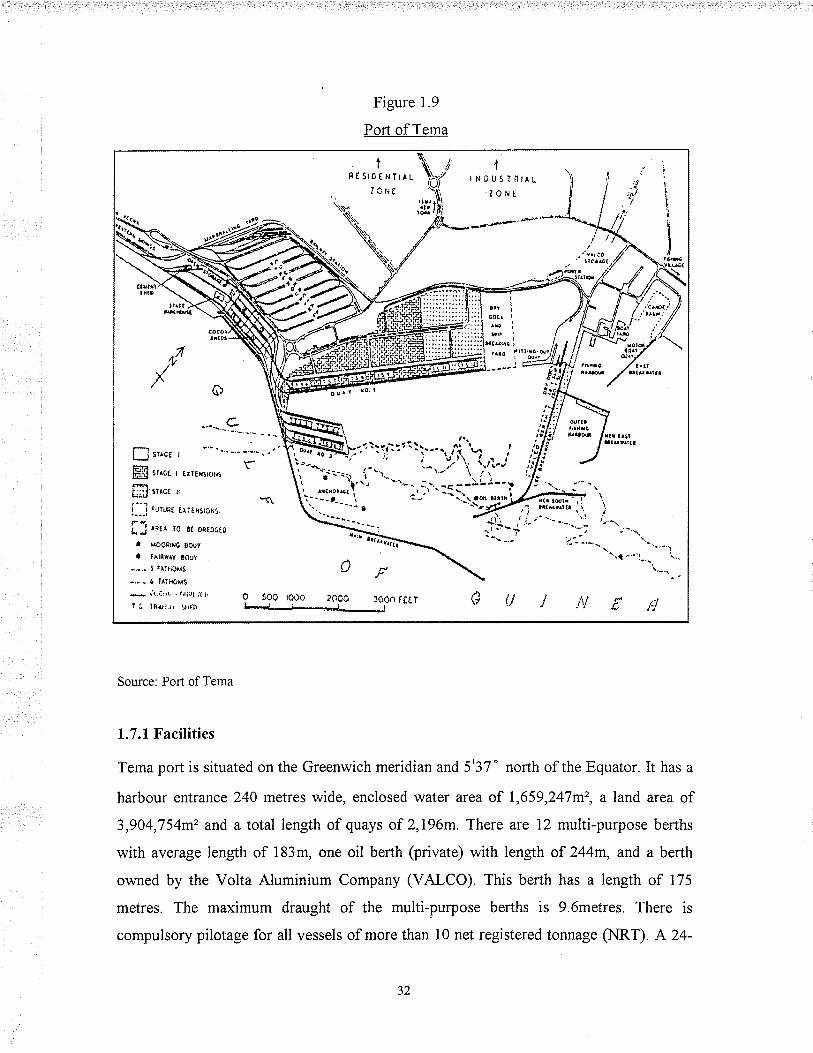
Figure 1.9
Port of Tema
Source: Port of Tema
1.7.1 Facilities
Tema port is situated on the Greenwich meridian and 5'37 " north of the Equator. It has a
harbour entrance 240 metres wide, enclosed water area of I,659,247m2, a land area of
3,904,754m2 and a total length of quays of 2,196m. There are 12 multi-purpose berths
with average length of 183m, one oil berth (private) with length of 244m, and a berth
owned by the Volta Aluminium Company (VAICO). This berth has a lengh of 175
metres. The maximum draught of the multi-purpose berths is 9.6metres. There is
compulsory pilotage for all vessels of more than 10 net registered tonnage (ltIRT) A24-
32

hour watch on VHF channels 14 and 16 is also in place. Equipment at the port includes
multi-purpose and mobile cranes, portal and overhead cranes, forklift trucks, top lifters,
RoRo tractors and cocoa conveyors. Harbour craft include tugboats, pilot launches and
mooring launches. There is aRoRo marshalling area of 19,200m2 to meet the increasing
RoRo traffic. Two hundred and ninety (290) reefer points are available to serve
containerised frozen cargo. The container stacking area is 200,000m2, capable of
accommodating 8,000 TEUs.
1.7.1.2 Organisation
Management of the ports is by the Ghana Ports and Harbours Authority (GPHA). The
GPHA established in 1986 as a statutory public corporation, is the sole planner, builder,
developer, manager and controller of the ports in Ghana. The Authority is run by a 9-
member Board of Directors who are responsible to the Minister of Transport. These
include the Director-General of the GPHA and the directors of the two ports. Daily
administration of the ports revolves round the Director-General who is assisted by the
directors at Tema and Takoradi, the Chief of Personnel and Administration, and the
departmental heads. Nine main deparlments constitute the Authority; namely,
Management, Port operations, Marine engineering, Civil engineering, Electrical
engineering, Mechanical engineering, Accounts, Stores and Internal audit.
l.7.2Industrial and urban development of Tema
As already remarked, construction of Tema port was part of an interlocking processes
(Figure i. l0) of change initiated through government policy. The Volta River Project was
to be power base, with the aluminium company (VALCO)4 consuming about 50 per cent
of the power to be generated. The agreement signed between the Ghana government and
VALCO allowed the latter to use between 200,000 and 300,000 kw of electrical power
from the dam over a thirty-year period. This agreement has since been revised. The
combined effect of the activities of the three projects has given great impetus for
urbanisation and industrialisation in the town. Tema is now home to most of the
country's industries.
o VALCO is owned by the Kaiser Atuminium Corporation and Reynolds Metals Company.
JJ
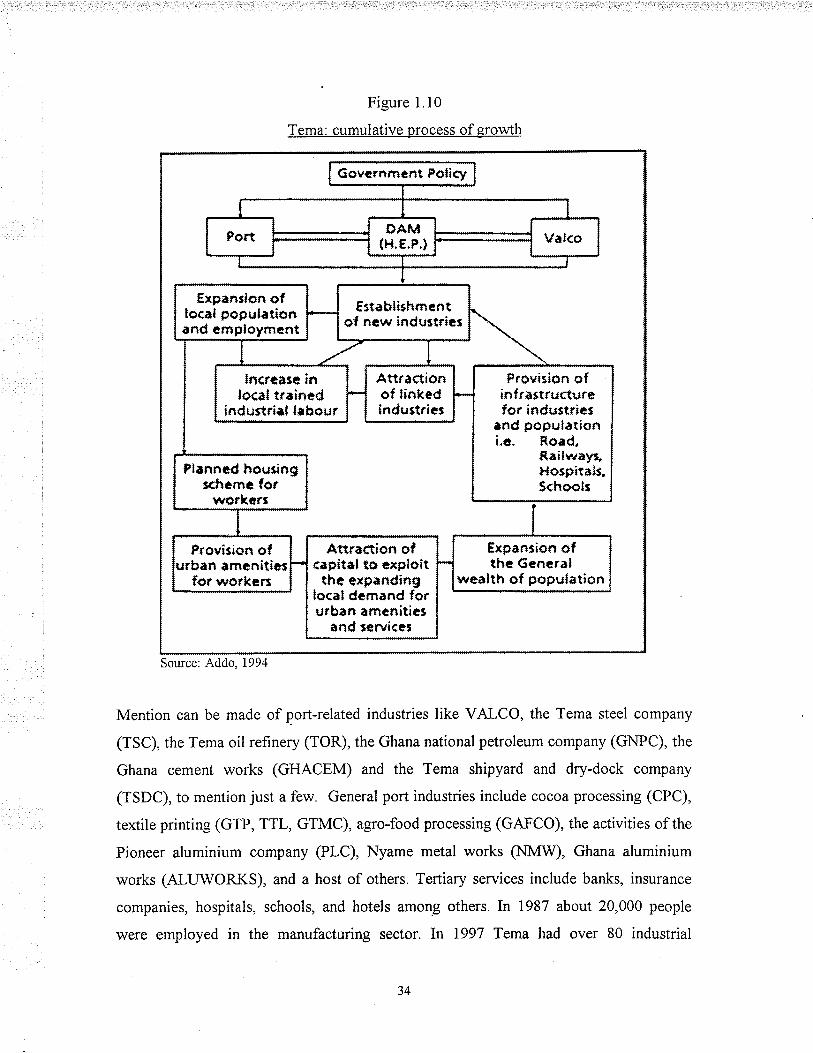
Figure 1.10
Tema: cumulative process of growth
Govcrnrnânt Fol¡çy
Expansion ofloçal popul¡tionand cmployment
€stabli¡hmcntof ntw inductri¿¡
lncæa¡e inlo<¡ltrainrd
indurtri¡l l¡bour
Provision ofinf r¡¡trusturefor indu¡lric¡
rnd Êopulationi.c. Road,
Railwayr,Hospitals,5<hool¡
AttraCtíortof linkedindustrit¡
Pl¡nntd houring¡chcmc for
workar¡
Artraction of<apital to exploittht expanding
local dcmand forurban amenitic¡
¡nd ¡ervicc¡
Expanrion ofthc Gencr¿l
we¡lth of pogr¡lation
Provisian ofrban ¿mcnitir¡for worken
Source: Addo, I994
Mention can be made of port-related industries like VALCO, the Tema steel company
(TSC), the Tema oil refinery (TOR), the Ghana national petroleum company (GNPC), the
Ghana cement works (GHACEM) and the Tema shipyard and dry-dock company
(TSDC), to mention just a few. General port industries include cocoa processing (CPC),
textile printing (GTP, TTL, GTMC), agro-food processing (GAFCO), the activities of the
Pioneer aluminium company (PLC), Nyame metal works (NN[W), Ghana aluminium
works (ALUWORKS), and a host of others. Tertiary services include banks, insurance
companies, hospitals, schools, and hotels among others. In 1987 about 20,000 people
were employed in the manufacturing sector. In 1997 Tema had over 80 industrial
34
establishments and an estimated work-force of about 50,000 people (Asafo-Adjei et. al,
1993). The effect of such vibrant industrial activity has been rapid urbanisation expressed
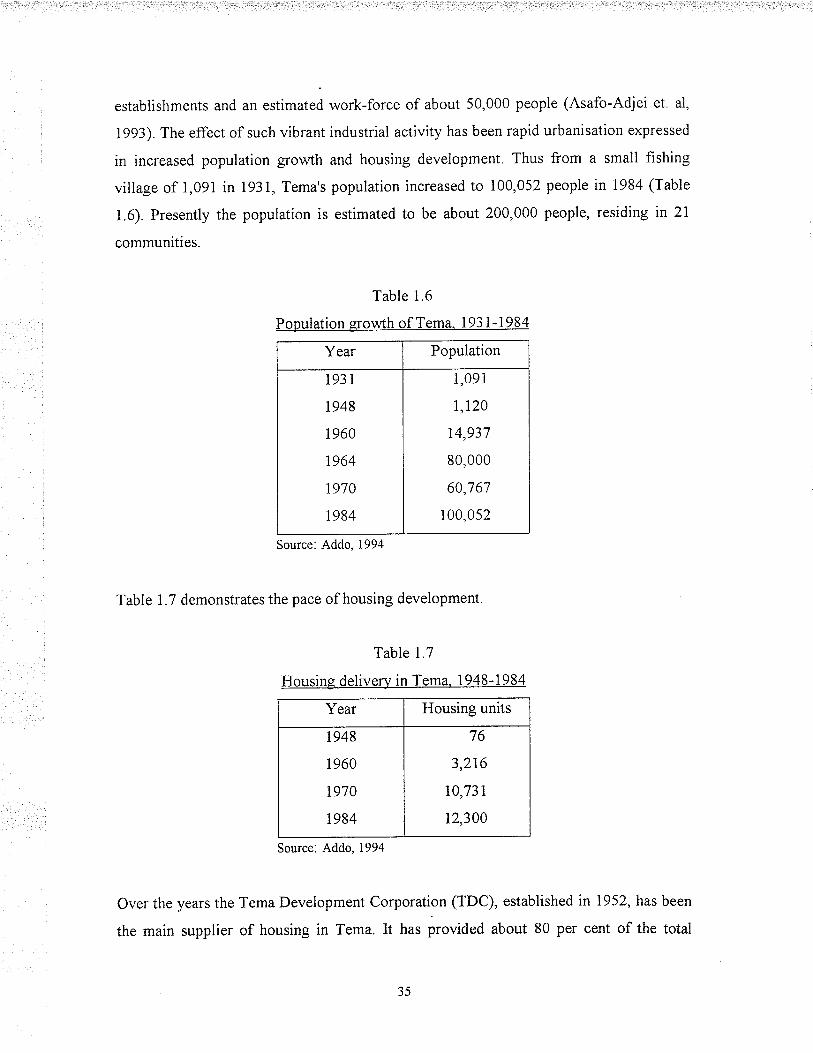
in increased population growth and housing development. Thus from a small fishing
village of i,091 in 1931, Tema's population increased to 100,052 people in 1984 (Table
1.6). Presently the population is estimated to be about 200,000 people, residing in 21
communities.
Table 1.6
Population erowth of Tema. 193 1- 1 984+
Year Population
193 1
1948
I 960
1964
1970
1 984
1,091
1,120
74,937
80,000
60,767
I00,052
Source: Addo, 1994
Table 1.7 demonstrates the pace of housing development.
Table 1.7
Housine deliverv in T
Year Housing units
1 948
1960
1970
I 984
76
3,2L6
10,131
12,300
Source: Addo, 1994
Over the years the Tema Development Corporation (TDC), established in 1952, has been
the main supplier of housing in Tema. It has provided about 80 per cent of the total
35
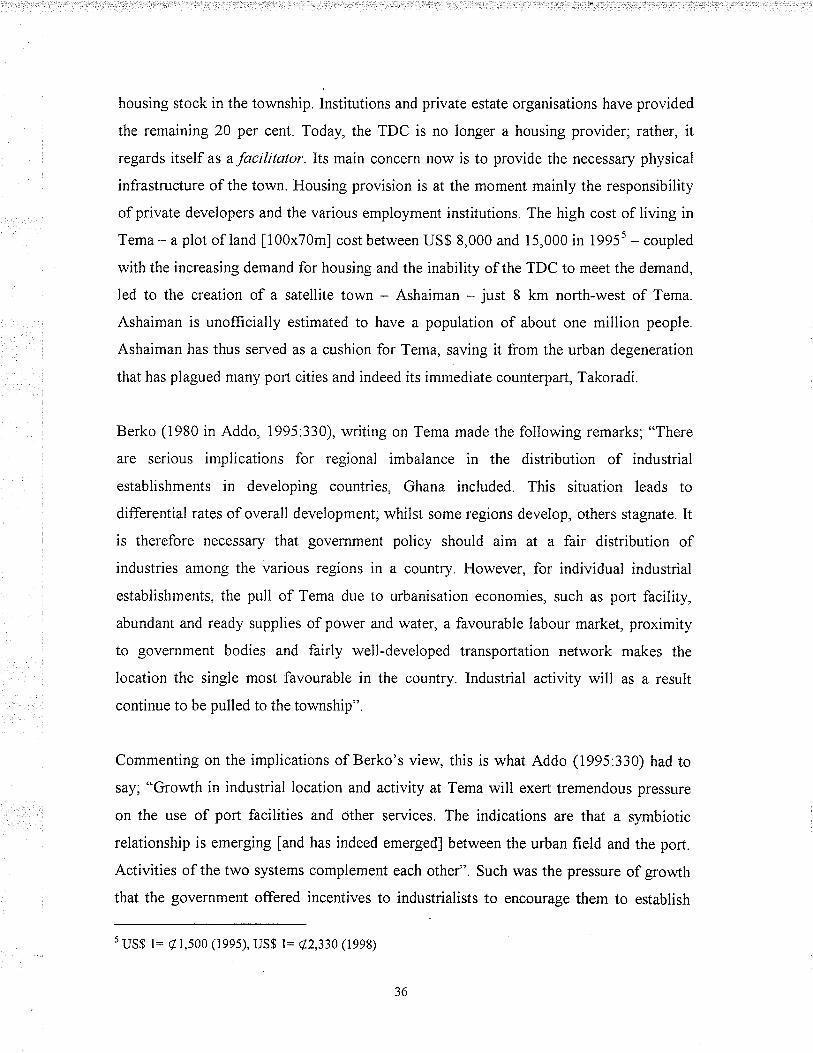
housing stock in the township. Institutions and private estate organisations have provided
the remaining 20 per cent. Today, the TDC is no longer a housing provider, rather, it
regards itself as a facilitator. Its main concern now is to provide the necessary physical
infrastructure of the town. Housing provision is at the moment mainly the responsibility
of private developers and the various employment institutions. The high cost of living in
Tema - a plot of land [100x70m] cost between US$ 8,000 and 15,000 in 19955 - coupled
with the increasing demand for housing and the inability of the TDC to meet the demand,
led to the creation of a satellite town - Ashaiman - just I km north-west of Tema.
Ashaiman is unofficially estimated to have a population of about one million people.
Ashaiman has thus served as a cushion for Tema, saving it from the urban degeneration
that has plagued many pon cities and indeed its immediate counterpart, Takoradi.
Berko (1980 in Addo, 1995:330), writing on Tema made the following remarks; "There
are serious implications for regional imbalance in the distribution of industrial
establishments in developing countries, Ghana included. This situation leads to
differential rates of overall development; whilst some regions develop, others stagnate. It
is therefore necessary that government policy should aim at a fair distribution of
industries among the various regions in a country. However, for individual industrial
establishments, the pull of Tema due to urbanisation economies, such as port facility,
abundant and ready supplies of power and water, a favourable labour market, proximity
to government bodies and fairly well-developed transportation network makes the
location the single most favourable in the country. Industrial activity will as a result
continue to be pulled to the township".
Commenting on the implications of Berko's view, this is what Addo (1995:330) had to
say; "Growth in industrial location and activity at Tema will exert tremendous pressure
on the use of port facilities and other services. The indications are that a symbiotic
relationship is emerging fand has indeed emerged] between the urban field and the port.
Activities of the two systems complement each other". Such was the pressure of growth
that the government offered incentives to industrialists to encourage them to establish
s uS$ t= ø1,500 (1995), US$ l= e2,330 (1998)
36

away from the zone! In this sense Tema has become a true industrial complex, an
outcome inconceivable without the port (Hilling 1970a'. 192-193).
This is the regional context within which the ports occur. Beyond this regional context is
the wider national economic space, the context constituting the hinterland for both ports.
Sharing a single economic space implies some form of competition between the ports.
Which of these two ports occupies a greate.;' portion of this economic space, and to what
extent port perforrnance contributes to this feat is the problem under investigation.
Section 1.8 is an expanded form ofthis problem.
1.8 Research problem
Ports and hinterlands are closely linked in terms of their development, functions, and
problems. Their fortunes, it is said, reflect the changing circumstances of their hinterlands
and forelands. At the same time, the socio-economic and political systems exhibited by a
hinterland also reflect and are reflected by the character of ports or port systems. This
establishes an interdependent relationship between ports and their hinterlands. Thus,
according to Hoyle and Charlier (1995.87) "the port function, wherever it has been
developed, has normally been related to some aspects of inland growth, and economic
development has in turn required port facilities .... On the basis of this relationship
the following working statement/hypothesis is proposed for the study.
A port's oterall traffic is a function of its performance (port facilitlies) and
hinterland (inland growth). However, for being the catchntenl area of the port,
the hinterland, is considered fundomenlal lo port growth and development, and
thus, inaccessibility to them, by whalever reesons, can retard port (port rystem)
grow th and deve lopment.
This working statement is in tandem with Hoyle and Charlier's (1995) observation of the
important, dynamic and varied relationship that exists between ports and the regions they
serve. They note further that the interface between a port and the regions, on various
scales, within which it is located and those which it serves introduce different sets of
37
relationships. These relationships are, however, less well-defined than in the case of the
port/city interface, for example, although they may reflect a similar variety of contexts -environmental, economic, political, technological, etc - and a similar range of issues such
as transport, employment and planning. There is, however, a significant difference "in
terms of the spatial scales involved; for whereas the port/city interface is largely confined
within the relatively discrete context of the built up area, the port/hinterland interfaces are
not only far more extensive geographically, but also involve in other dimensions a variety
of different concepts, scales and levels of interaction (Hoyle and Charlier, 1995:87-88).
Among these dimensions inter-port competition is considered particularly significant.
There is evidence of such inter-port competition at the port-hinterland interface in Ghana,
as hinted earlier. Actually, Hilling (1970a) has documented this. Using a geometrical
locus of equal distance between Takoradi and Tema, Hilling identified four hinterland
regions, which he believed corresponded to the areas which the ports served (Figure
1.14). The following are his demarcations.
Region 1. This is the uncontested hinterland of Takoradi, within which the present
bauxite and manganese mines are found and from which much timber is obtained.
Region 2.Tema serves this area. The area is relatively poor in forest products and is the
area most affected by cocoa-tree disease. The Kibi bauxite deposit, which is an important
resource base for the Volta Aluminium Company in Tema, is found here.
Region 3. A region from which the trade is channelled through Kumasi which is nearer
Takoradi by rail and Tema by road. The choice of port depends on the type of goods and
the port traffrc conditions. Thus, all timber goes to Takoradi but there is competition for
cocoa and general imports. Here, Hilling asserts that the new straight road from Nsawam
to Kumasi will favour Tema.
Region 4. Trade from this region passes through Kumasi and is comparable to Region 3.
Hilling's predictions were that it will come under the hinterland of Tema upon the
completion of the Volta Lake and more particularly as the rail link from Tema to the Shai
Hills was to be extended (and electrified) to Akosombo and the lake was also to be
provided with a series of ports.
38

Figure l.1l
Hypothetical hinterlands of the ports of Ghana
Source: Hilling, 1970a
39

Much development has taken place within the Ghanaian economy since Hilling's study
was completed twenty-eight years ago. The Volta Lake has been constructed and the
Nsawam-Kumasi road is also in place. The ports themselves, in 1986, underwent a
rehabilitation exercise costing 100 million dollars. A programme, it is claimed, has
brought the pofs' facilities and equipment up to date, resulting in very high margins in
their operational performance (Port News:undated). Thus, with time and development
introducing a dynamic element, the hinterlands of the ports are expected to change,
ceteris paribus, disproportionately. To help investigate this problem are the research
objectives outlined below.
1.9 Research objectives
1. The initial objective is to study and compare the status of the two ports over time. The
rationale of this objective is to provide a basis for assessing and interpreting the ports'
performance (Rimmer, I966a).
2. The second objective is to attempt a delimitation of the hinterlands of the two ports.
The purpose for this objective is twofold. The first is to compare the new hinterlands
with Hilling's to see the changes that might have occurred over the period and
secondly, to comply with Rodgers' (1958) point that "the delimitation of a port's
hinterland and an examination of its nature and extent are basic steps in an evaluation
of the prospects for further development in that port".
3. Thirdly, the aim is to examine the transportation network linking the ports and their
hinterlands. As Boerman (1951 :348) remarks, "it is the hinterlands combined with the
transport links, that gives the key to port growth".
4. Finally to bring the thesis to a close, policy recommendations would be offered for
consideration by the port authorities and the Ghana government.
40

1.10 Summary
Th¡ee main themes have been discussed in this chapter. The first was concemed with
justifying the sub-disciplines transport and port geography and thus the feasibility of
conducting the study within the borders of geography. The second theme was about port
infrastructure and development. Emphasis here was on the port infrastructure and African
development with special emphasis on Ghana. The final theme was on the research
problem and objectives. At the core of the research problem is the interdependent
relationship between the port and the hinterland. V/hat is more, there are the many
dimensions of the port-hinterland interface. One significant dimension of this interface is
inter-port competition. With port competition also comes port comparison, as competition
requires assessment. But, on what basis and by what methodologies can ports'
performance be assessed and compared? These are the issues I discuss in Chapters Two
and Three. I begin with the hinterland concept in Chapter Two.
41
CHAPTER TWO
HINTERLAND:CLASSIFICATION AND FUNCTIONS
2.0 Introduction
In the concluding remarks in Chapter One, we noted the interdependent relationship
between the port and the hinterland and the centrality of the two phenomena to the
research problem. In this chapter I shall concentrate on the hinterland and tackle the
methodology in Chapter Th¡ee. What follows is a review of the salient literature on the
hinterland concept and its significance for port planning and development.
2.1 The hinterland concept
There is no agreed definition of the term hinterland by geographers. Van Cleef (1941)
categorised hinterlands into two: the continuous hinterland and the discontinuous
hinterland. The former he defrned as the "the area adjacent to a trade centre - extending to
and including its satellites - within which economic and some cultural activities are
focused largely on the primary centre", while the latter "takes into consideration the fact
that some regions are economically closely associated with a primary centre but that the
intervening territory has no particular interest for the centre". A related concept, umland,
he defined as "the area contiguous to a trade centre - extending to and including its
suburbs or'urblets' - whose total economic and cultural activities are essentially one with
those of the primary centre" (Van Cleef, 1941). This view of hinterland, informative as it
is, does not capture the port-hinterland relationship. Naturally, the question arises as to
the precise meaning of hinterland in the context of port studies. This is where the
contribution of Weigend and other port geographers cannot be overlooked.
Weigend (1958:192-193) defines the hinterland as an "organised and developed space
which is connected with a port by means of transport lines and which receives or ships
goods through the port". To Hoyle (1967.76) the hinterland is "the land area behind the
port which is served by it fthe port]". Bird provides a more comprehensive definition. By
his reckoning, (in Hayuth, 1982.13), the hinterland is "a tributary area the, 'backyard' of
a port, and a functional region in which different internal points are linked to a port".
42

Morgan cautions against the temptation of considering the hinterland as a mere piece ofland behind the port. He writes, "the concept of the hinterland of ports as a simple
parceling out of the country behind them, with areas of overlap where ports compete, and
with certain peculiar courses where a mountain range or a frontier affects the flow of
trade, is hardly adequate" (Morgan 1967.76). The essence of his comment is appreciated
in the foregoing.
2.2 Nature and extent of hinterlands
A hinterland may belong exclusively to a single port or several ports. Many ports in
Africa, for example, have exclusive rights to their hinterlands on account of the factthat
they have few or no competitors (Hoyle, 1967) On the other hand, ports on the
Mediterranean and on the North Sea coasts have competed vigorously for hinterlands.
Trieste, for instance, no longer enjoys the exclusive right to Vienna's traffic as a result ofcompetition from ports on the North Sea of Germany, especially Hamburg. Despite being
more than twice as far f¡om Vienna as Trieste, Hamburg has been able to out-compete
Trieste for Vienna's trafäc. Traflic from Vienna took only six days to reach Hamburg
compared with the five days it took to reach Trieste. In addition, Hamburg had better and
more frequent maritime connections with all parts of the world and port fees were half
those of Trieste. The German policy of preferential railway rates also helped to divert
traffic a\ilay from Trieste and other Mediterranean ports. Furthermore, the
decentralisation of industries in Austria brought about rapid urbanisation in western
Austria as more industries moved there. V/ith better transport connections northwards
than to Trieste, more of Austria's overseas cargoes shifted towards the North Sea.
St. John, New Brunswick, presents a different dimension of the nature of hinterlands.
During winter St. John competes with other Atlantic coast ports for the hinterland of most
of the populated areas of Canada, from the Atlantic to the Pacific and certain areas of the
United States north of the Ohio and Missouri rivers. In summer, however, St. John loses
its interior hinterland to the St. Lawrence and Great Lakes ports and is thus left with the
traffic of the Maritime Provinces, which is economi cally far less important.
43
The port of Lobito in Angola also presents a different story. Until 1956 Lobito could not
attractthe copper exports from Northern RhodesialZambia], though the ocean route from
Lobito to the main markets was 5,000 km shorter than that from Beira and Lourenco
Marques (Maputo), Mozambiques's sea outlets on the east coast. Lobito's inaccessibility
to the Copperbelt hinterland in Northern Rhodesia was due to the contract the copper
companies signed with the then Rhodesia Railways. Under the terms of the agreement,
the companies shipped all copper by way of Rhodesia Railways to the east coast and, in
return, gained low freight rates for taking copper out and for bringing coal in (Weigend,
1 958: 1 94).
Thus far we see that the hinterland cannot be considered simply as some land behind the
port. It is far more than that, as Morgan (1967) cautioned. A port's hinterland may lie
outside its national boundaries. In addition, a port's hinterland may fluctuate with
weather patterns, politics and policies of succeeding governments, and economic
condition prevailing in a country. Hinterlands are therefore not static but rather dynamic
and functional. Exceptions to this, of course, are the mineral ports like Nouadhibou in
Mauritania where the ports have exclusive rights to their hinterlands. The nature and
extent of Nouadhibou's hinterland, for example, has remained almost the same since its
inception.
2.3 Ports, hinterlands and transport connections
As already established, hinterland analysis involves consideration of the transport
network serving the port and the hinterland. The port of Rotterdam, for example, offers
an efücient door-to-door service via a sophisticated combination of different modes of
transport. Everywhere in Europe is readily accessible from Rotterdam. A choice can be
made between transport by truck, train, barge, coaster and - for liquid bulk - pipeline. The
ideal mode of transport is available in the port for every type and volume of cargo,
required speed and price. The port also has rail links with all-important industrial centres
plus two dedìcated Rail Chemical Centres for the transportation of chemical products. A
large part of Europe is accessible by train within 24-48 hours. The trains leave every hour
of the day, including weekends. In addition, the port has a perfect link with the extensive
44
road network of Europe. The truck services from the port offer tailor-made transport for
every type of cargo. Every day in the port of Rotterdam, thousands of trucks travel to and
from destinations in the heart of Europe.
Barge service is also available. The geographical location of the Rhine and Maas (Meuse)
rivers gives Rotterdam an ideal starting point for European transport by water for every
type and volume of cargo. Goods are carried into the heart of Europe by barge. For
centuries inland shipping has formed the most important means of transporting all kinds
of bulk cargo from Rotterdam, such as coal, iron ore and grain. Tankers and parcel ships
also provide safe, environment-friendly transport of chemicals. Inland shipping now also
plays a leading role in the transportation of containers. Approximately 22 per cent of
containers handled in Rotterdam travel by inland waterways. Inland shipping shuttles
operate liner services to inland terminals in Germany, Switzerland, France and Belgium.
Just -in -time is also an important aspect of inland shipping. As a result of the opening ofthe Rhine-Main-Danube canal, inland shipping can now penetrate even deeper into
Europe.
A large number of feeder and short-sea services leave Rotterdam every day. In
addition to the tIK, Ireland and Scandinavia, Rotterdam operates regular services to
many countries, including Spain, Greece, Italy, the Baltic States and ports in North
Africa. Short-sea and feeder services form an excellent alternative to - or addition to -
transport overland deep into the heart ofEurope and beyond. Feeder services link up
with intercontinental container transport in large ships between Rotterdam and
destinations in the USA the Far East, South America and Africa. Short-sea shipping
concentrates on European ports and ports in neighbouring continents. Both as liner
service and charter, short-sea shipping offers numerous sailings daily from Rotterdam
for every type of cargo. Also linking up with intercontinental transport, specialised
ships guarantee customised transport. Ro-Ro ships offer an extra dimension for fast
trailer transport. Within just a short space of time, Rotterdam has developed into
Austria's second port because of the excellent transport network from the port.
45
Hungary and Romania zre also opening up as parf of the port's hinterland
(http : //www. port. rotterdam. nllhinterland/GB/).
2.4 Hinterland classification and functions
Different types of hinterlands can be identified, depending upon the criteria adopted. For
example, there is the export or import hinterland, bulk or break-oÊbulk hinterland,
commodity hinterland and primary or secondary hinterland, to mention a few. A further
classification can also be made based on the type of inland transport used. A classic work
on hinterland classification is that of Morgan (1951). Morgan classified hinterlands into
th¡ee main categories based on three main factors viz.:
1. The nature of commodities - whether bulk cargo or general cargo is more important, or
a combination of the two.
2. The mechanism of sea transport - types of ships, number of lines, frequency of calls,
and nature of port equipment available.
3. The influence of policies such as those concerning the control and use of inland
waterways, and the rate structures of inland waterways and railways.
From the interplay of these three factors Morgan identified three main categories ofhinterlands.
1. Primitive hinterlands - These are exclusive hinterlands belonging to particular
ports. Owing to the lack of other sea outlets or any transport connections to other
sea outlets, they become incontestably the 'property' of a single port.
2. Raw material hinterlands - These hinterlands generally involve bulk cargo and
frequently tramp shipping or specially designed ships such as ore carriers or
tankers. Ports of these hinterlands are located so as to cut land transport of bulk
commodities to minimum distances.
3. Liner port hinterlands - These are the largest in extent and most complicated in
structure. They involve a combination of several cargoes - bulk and general -which requires diverse services. Two types of this hinterland can be identified.
primary and secondary hinterlands. Primary hinterland refers to the area where the
46

port is well established; there is, however, competition between ports in the
secondary hinterland.
Weigend (1956) has criticised the basis of Morgan's (i951) classifications as too limited
to warrant any validity. According to Weigend, Morgan underestimates such other vital
factors as inland transpott, agricultural, industrial, and urban development in the interior
or in overseas areas, though he acknowledges that Morgan gives prominence to these
factors later in his discussion of each hinterland. In addition, the primitive hinterlands are
larger than raw material hinterlands and as complex as liner port hinterlands, though
Morgan presumes to have evolved a hierarchy of hinterlands by their structure and areal
extent. He writes, "Morgan attempted to delimit the extent of the hinterland by imposing
a limit for hinterland areas which received from and sent to the port in question a total of50,000 tons of goods in each direction, but such a limitation is admittedly arbitrary; it isonly likely to obscure the true traffrc picture".
Mikolajski (1964'.227) also adds that Morgan's classification lacks a "uniform criterion
because the primitive hinterland is a spatial concept, a raw material hinterland
is a concept referring to a commodity, having more in common with the organisation ofmaritime trade as a link with the foreland of ports". Mikolajski (196a:226) then went on
to identify several types of hinterlands: natural, marginal, incontestable, contestable,
basic, geographical, political with tariff walls, economic, kilometric, real, theoretical,
empirical, regional, extra-regional, national concerning a communication area, interior,
exterior, facultative, import, export, exclusive, provincial, local, within political frontiers,
international, foreign, primary, secondary, primitive raw material, liner port, physical and
static.
Bird (1971:125) has modified Morgan's classification. The following is his classification:
1. Immediate hinterland - This refers to the port area itself and the port city.
2.Pnmary hinterland or umland - This includes the immediate hinterland and the
area where port and city assume a commanding role in the life of the area.
47
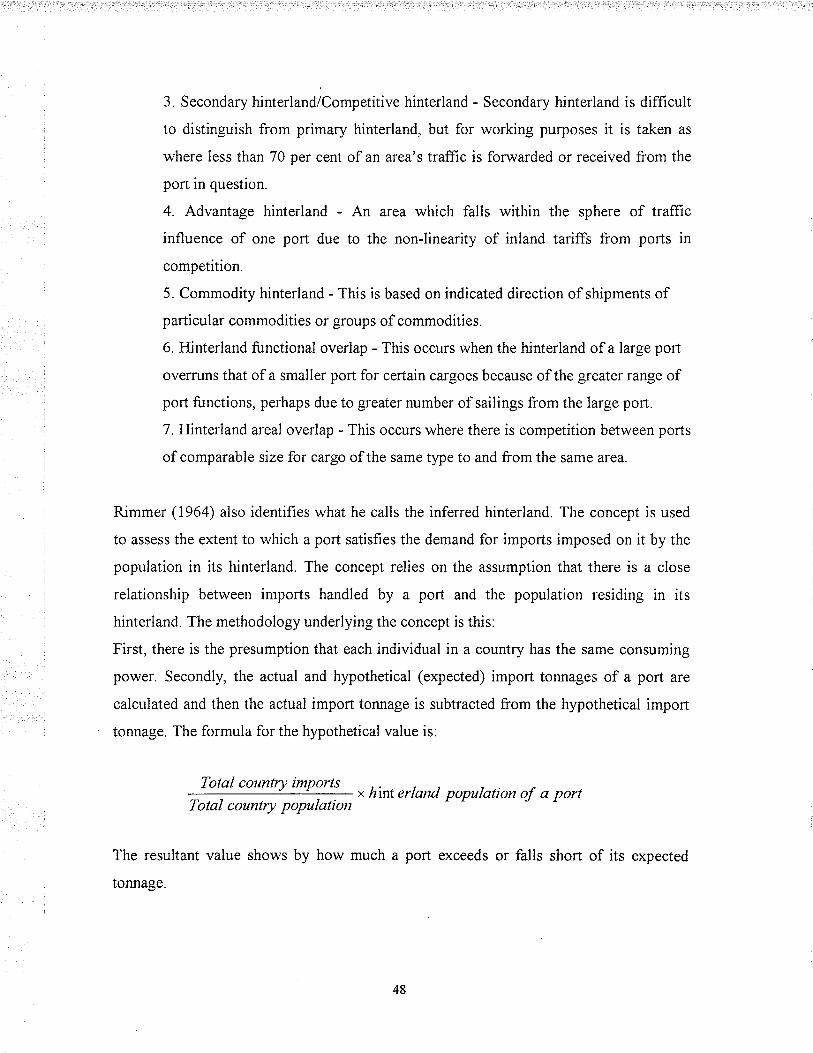
3. Secondary hinterland/Competitive hinterland - Secondary hinterland is diffìcult
to distinguish from primary hinterland, but for working purposes it is taken as
where less than 70 per cent of an area's traffic is forwarded or received from the
port in question.
4. Advantage hinterland - An area which falls within the sphere of traffrc
influence of one port due to the non-linearity of inland tariffs from ports in
competition.
5. Commodity hinterland - This is based on indicated direction of shipments of
particular commodities or groups of commodities.
6. Hinterland functional overlap - This occurs when the hinterland of a large port
overruns that of a smaller port for certain cargoes because of the greater range of
port functions, perhaps due to greater number of sailings from the large port.
7. Hinterland areal overlap - This occurs where there is competition between ports
of comparable size for cargo of the same type to and from the same area.
Rimmer (1964) also identifies what he calls the inferred hinterland. The concept is used
to assess the extent to which a port satisfies the demand for imports imposed on it by the
population in its hinterland. The concept relies on the assumption that there is a close
relationship between imports handled by a port and the population residing in itshinterland. The methodology underlying the concept is this:
First, there is the presumption that each individual in a country has the same consuming
power. Secondly, the actual and hypothetical (expected) import tonnages of a port are
calculated and then the actual import tonnage is subtracted from the hypothetical import
tonnage. The formula for the hypothetical value is:
Total country intportsx hint erland population of a port
Total country population
The resultant value shows by how much a port exceeds or falls short of its expected
tonnage.
48

The French have come up with their own classification. They identify two main types of
hinterland, namely, regional and supra-regional. Regional hinterland is defined as the
'natural' hinterland and the area of functional development. By 'natural or physical' they
refer to a 'geographic' region and is of necessity 'static'; while the area of 'functional' or
'dynamic' development is the area \ryon over from other ports. The stage of the supra-
regional port is entered into when a port extends beyond the area of 'natural' hinterland.
For supra-regional ports the maritime outlook is the pre-occupation. As Weigend
(1956:3) puts it, 'maritime determinism' is advocated as opposed to 'land determinism'.
This traditional view of hinterland described above has been challenged as a result of the
introduction of new maritime technologies like intermodal and container transport. In the
next section I discuss how these new technologies have affected the structuring of ports'
hinterlands, thereby giving the traditional hinterland a new meaning.
2.5 fntermodal transport and the hinterland concept
Hayuth (1982) claims that factors such as centralised governments' control of port
operations, government policy supporting one port against the other, natural hazards and
exogenous economic factors affect particular ports and at certain times only and therefore
do not have a worldwide effect or impact. On the other hand, technological change in
ocean transport is capable of effecting worldwide change in the port-hinterland
relationship. Containerisation and intermodal transport are two examples of this type ofchange that have profoundly altered the basic hinterland patterns established by the
operations of conventional break-bulk cargo. The establishment of trade offices by ports
such as Charleston, Seattle and New Orleans in Chicago, for instance, goes to prove the
point about the changes taking place in ports' hinterlands by containerisation and
intermodalism. Now "large container ports compete in an expanded arena, in which their
nearest neighbour may not be its most serious rival. The once rather well-defined
tributary areas of a series of neighbouring ports have been heavily invaded by the major
container ports, whose vast hinterlands can encompass entire countries or even
continents" (Hayuth, 1982:13). At this point, I would like to explain the words
containerisation and intermodalism.
49
2.5.1 Containerisation and intermodalism
Containerisation has been defrned as a "method of cargo handling whereby small parcels
can be unitised by use of standard containers, normally 20 or 40 feet (6 or 12 m) long,
which can move from origin to destination through different modes of transportation and
using sophisticated loading and unloading techniques" while intermodalism is "the
arrangement for through transportation, from shipper to consignee, over the lines of two
or more transportation modes - and under through-liability, through billing, and a single
through-rate" (Hayuth 1982'.14). The 'door-to-door', shipper-to-consignee cargo service
which intermodal transport offers makes use of different transport modes like truck, ship,
rail, barge and airline, thus taking advantage of a different mode on each segment of the
trip. Containerisation facilitates and also makes the intermodal process more economical
for both shipper and carrier as it avoids the need fo¡ breaking of bulk at the port, thus
saving total transit time, reducing damage and pilferage, and cutting total transit costs. It
also helps to reduce labour cost and, improve turnaround time of ships in port.
The intermodal-container is an integrated system whose activity depends on co-operation
and co-ordination between transport modes, warehousing, and freight forwarding. Prior
to the advent of the system the responsibility of the ocean carrier was restricted to cargo
loading, vessel steaming, and cargo discharging. In the intermodal-container system,
however, both the inland carrier and ocean carrier share the same corporate roof or in
most cases work closely. More often than not, the ocean carrier takes on the inland
transport task too, thus making the entire delivery the responsibility of a single carrier.
Shippers are therefore relieved of the problem of storage and handling. The port in this
case becomes a point, smoothly passed, on the way to a final destination. Despite
jurisdictional and regulatory obstacles, such as the lack of agreement between the
Interstate Commerce Commission and the Federal Maritime Commission in the United
States on new definitions of jurisdiction over 'door-to-door' freight transport, thereby
restricting the further development of the intermodal system, the "impact of intermodal
movements of containerised cargo on inland distribution, nevertheless, has been
significant" (Hayuth, 1982:14).
50

2.6 Traffic concentration and inland penetration
Container transport encourages traffic concentration and the establishment of 'load
centres'. SeaLand ShippingLines, for example, concentrated about 95 per cent of all its
overland trade between the Far East and destinations west of the Rocky Mountains on the
Port of Seattle. In 1977 New York/l{ew Jersey, Los Angeles/Long Beach, Oakland,
Seattle, Baltimore and Hampton Roads dominated container trafTìc in the United States.
Together, these ports handled 70 per cent of the container traffic in that country.
Concentration of containers in particular ports also helps carriers to take advantage ofthose ports with superior access to major inland transport networks in order to penetrate
the interior as quickly as possible. The high expense and thus the uncompetitiveness ofinland transport, for example, limited the effectiveness of the conventional hinterland.
This forced ships to call at several small ports. With containerisation and signifrcant
improvements in land transport the competitive position of overland carriers has
improved relative to ocean carriers. In the United States the development of the national
highway system, the adaptation of long-distance truck haulage to the container system
and all-container trainloads have combined to lower the unit costs of overland transport
(Hayuth, 1982, Slack, 1990).
What is more, the capital costs of overland transport improvements are either borne by
the government or have been comparatively small in other instances. On the other hand,
the higher purchase costs of container vessels make their daily operating costs higher
than conventional general cargo vessels. Together, these have served to encourage the
development of inland distribution concepts in which overland movements of trucks and
trains can compete successfully with the high daily operating cost vessels, on short as
well as on long long-distance routes. The Land and Mini-land Bridge are two new
concepts of inland distribution that developed from the intermodal-container system.
Examples of this system include the so-called Trans-Siberian Land Bridge, the Negev
Continental Bridge and the North American Land Bridge. Its essence is explained below,
using the North American Land Bridge as illustration.
5l
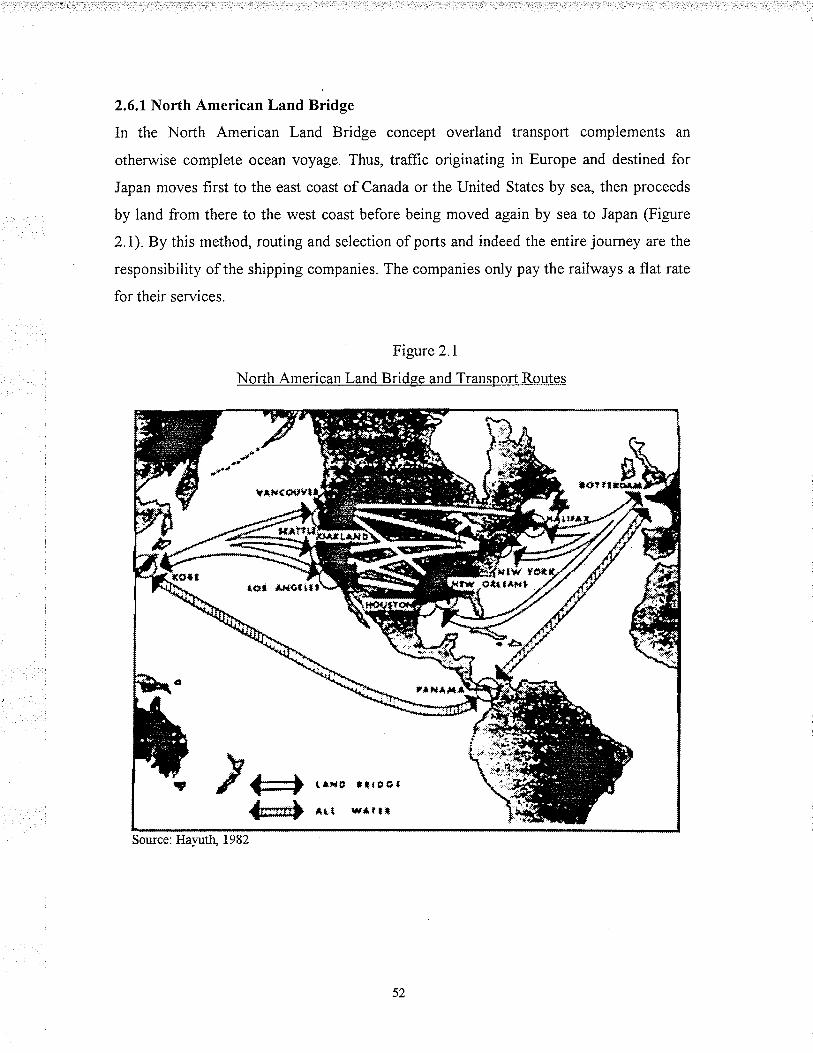
2.6.1 North American Land Bridge
In the North American Land Bridge concept overland transport complements an
otherwise complete ocean voyage. Thus, traffic originating in Europe and destined for
Japan moves frrst to the east coast of Canada or the United States by sea, then proceeds
by land from there to the west coast before being moved again by sea to Japan (Figure
2.I).By this method, routing and selection of ports and indeed the entire journey are the
responsibility of the shipping companies. The companies only pay the railways a flat rate
for their services.
Figure 2.I
North American Land Bridee and Transport Routes
tlr{g s}tøçl
lf,ß t¡'¡rlal
tor tr{61rll
t¡xAt.r
Source:HayutlL f 982
52

With the Mini-Land Bridge or'mini-land'(Figure 2.2) as it is popularly called, there is
the "movement of containers under a single ocean bill of lading6 from one country via a
vessel to a port in another country, thence by rail mini bridge to a second port city
terminating at the rail carrier's terminal" (Gibney in Hayuth, 1982:15). For example, a
cargo from Japan will move by ship to a west Coast port in the United States and from
there move overland to a frnal destination at the east coast port.
Figure2.2
Mini-Land Bridge and all Water Transport Routes
it e! lta
¡¡r* rtËI
f¡.r*ñnåH
ilI
fq
i+trrHåfl1
t F*-*---*:- L-\
ttíF{i !¡E ltlDç¡t!¡.t-Èl{itì"(:gt $llfl
u Bill of lading - Tlús is receipt for goods shipped on board a ship signed b¡' the person (or his agent) who
+=++sffil
$ trfirr*{11,. [ 1
Sou¡ce: Haluth. 1982
53

The difference between the mini-land and the usual land bridge is that the mini-land does
not involve sea-land-sea movement of cargo but only sea-land movement. In 1979 the
Federal Maritime Commission estimated that about 50 per cent of the United States-Far
East containerised trade was carried via the mini bridge route and the rest via the Panama
Canal, emphasising the growing importance of the mini bridge concept now and in the
future (A,merican Shipper in Hayuth, 1982). The mini bridge has costs comparable to
those of the Panama Canal route and the added advantage of saving time over the all-
water Panama Canal route. For example, the distance from Yokohama to New York via
Seattle and the mini-land bridge is 3331 km shorter than via the Panama Canal route. It
must be stated, however, that time saving depends more on the carrier chosen than the
mode.
Furthermore, more container trade is expected to divert to the land bridge system when
the Panamanian government assumes control of the canal and enforces higher canal
charges. Again there is the issue of increase in containership size above the length, beam
and draft limitations of the CanalT as well as rising operating costs. In addition, the mini-
land method also has the advantage of having tariffs which are generally applicable to all
ports within one coastal range. For example, the freight rate from Japan to Houston is the
same whether the inland movement transits Seattle or Los Angeles. This is not the case in
the conventional system since the more distant port must absorb higher tariffs.
Also affected are traditional transport itineraries. Let us take the case of aluminium coils
produced in Washington State as an example. Though the coils could easily be shipped to
Europe through the port of Seattle and the Panama Canal, they are containerised and sent
by rail to Houston from where they are then shipped to Rotterdam, reaching their
destinations five days faster. Thus the mini bridge concept has the tendency and potential
of shifting traffic from one coast/seaboard to another. The result of the mini bridge
system has been the concentration of the trans-Atlantic and trans-Pacific traffrc at few
ports, which has enabled these ports to extend their hinterland penetration further inland,
contracts to carry thenu and stâting the terms on which the goods are ca¡ried.Tlock dimensions of 297-metres long, 32.3-meúes wide and 12.2-met¡es draught limit the Panama Canal.Posþanamæi vessels (6,000 TEÐ have been in service since the mid 1990s.
54
creating large hinterlands for them. Port authorities, especially those on the East and Gulf
Coasts, fearing loss of traffic due to the mini bridge method, insist that "each port has a
vested right to all the traffic generated in its area; in their words, to 'naturally tributary'
cargo" (Hayuth, I 982: 1 8) Their claim is not supported by the facts, for, undoubtedly, the
container system changes the dimensions of hinterlands and the traditional tributary areas
of ports.
Clearly intermodalism, containerisation and the land bridge concept have considerably
changed the conventional hinterland concept. Hayuth (1982.20) writes, "containerisation,
port concentration and intermodalism, having reached a higher operational and
technological stage, have brought a significant change in hinterland relations. The
tributary areas of ports can be vastly extended to stretch over entire countries and
continents. New concepts of inland distribution, such as the land bridges, have altered
conventional patterns of cargo routing between trade areas. The complexity of the recent
hinterland structure fo a gleat extent makes meaningless the traditional hinterland
boundaries both in spatial and dynamic terms". While Hayuth's conclusions, discussing
the validity of the traditional hinterland, may ring true for containerised liner services,
they do not apply to non-containerised cargoes, especially bulk commodities.
Nevertheless, the hinterland, whether in the traditional sense or in the contemporary
fashion, is critical to port development. As Rodgers (1958) notes, the delimitation of a
port's hinterland and an examination of its nature and extent are basic steps in an
evaluation of the prospects for further development in that port. It is therefore not
surprising that port administrators continue to delimit their ports' catchment area.
Rimmer's (1964) assertion that "the stature of an individual port reflects closely the
nature, direction and rate of economic development in the area it serves" can thus be
hardly challenged. The succeeding sections present case studies of port hinterlands,
outlining their impact on port planning and development.
55
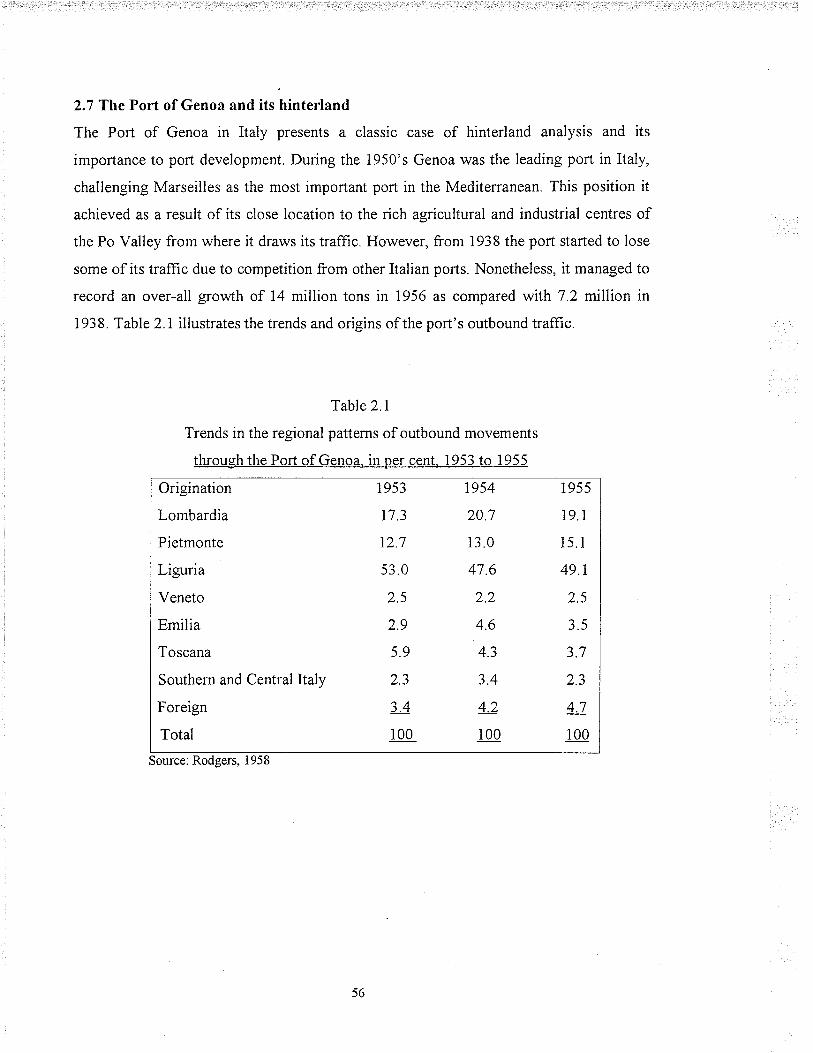
2.7 The Port of Genoa and its hinterland
The Port of Genoa in Italy presents a classic case of hinterland analysis and its
importance to port development. During the 1950's Genoa was the leading port in ltaly,
challenging Marseilles as the most important port in the Mediterranean. This position it
achieved as a result of its close location to the rich agricultural and industrial centres of
the Po Valley from where it draws its traffrc. However, from 1938 the port started to lose
some of its traffic due to competition from other Italian ports. Nonetheless, it managed to
record an over-all growh of 14 million tons in 1956 as compared with7.2 million in
193 8. Table 2. I illustrates the trends and origins of the port's outbound traffìc.
Table2.I
Trends in the regional patterns of outbound movements
th¡ough the Port of Genoa. in per cent. 1953 to 1955
Origination
Lombardia
Pietmonte
Liguria
Veneto
Emilia
Toscana
Southern and Central Italy
Foreign
Total
t953
17.3
12.7
53.0
2.5
2.9
5.9
¿.5
J.+
100
1954
20.7
13.0
47.6
)1
4.6
4.3
3.4
4.2
100
1955
19.1
15.1
49 1
2.5
3.5
3.7
2.3
4.7
100
Source: Rodgers, 1958
56

2.7.1 Nature and extent of Genoa's hinterland
The main hinterland of Genoa is what Rodgers (1958) refers to as the nodal hinterland
This region is defined as the:
Provinces that absorbed at least I per cent of Genoa's inbound traffic in 1954.
Provinces that provided at least 1 per cent of Genoa's outbound traffic in
1954.
3. Provinces in which Genoa's share of the traffìc was established to be
predominant (50 per cent or more) in 1956.
The bulk of Genoa's traflic, about four-fifths, came from the nodal hinterland. Genoa's
nodal hinterland is the most important economic area in Italy and thus provides the port
with its primary source of traffrc. Despite being one-eighth of Italy in terms of size the
region contains one-fifth of the country's population, three of its large urban centres and
over 44 per cent of ltaly's manufacturing employment. In addition, the region more than
any other region in Italy depends on trade with other countries for its economic survival.
\ryithin the nodal hinterland of Genoa is also the core hinterland. The core hinterland is
that part of the hinterland that is most closely tied to the port. The extent of the core
hinterland corresponds roughly to the Genoa industrial area. Two-fifths of Genoa's trafltc
comes from this sub-region, with nine-tenths moving through the port. Being one of the
most industrialised areas of the country, it had a population of 700,000 people in 1957
and over 75,000 workers. The industrial development of the area is, to a large extent,
considered a function of the movement of commodities through the port (Rodgers, 1958).
The Milan province, whose overseas trade is predominantly tied to the port, also supplies
one-fifth of Genoa's traffìc.
The port's ties with the rest of the country are, however, weak. Even then the port attracts
traffrc from the central and southern regions of the country. Goods sent from these two
regions to the port consist of high-value manufactured items of which transport cost
forms an insignificant part of the total cost structure. Superior handling facilities
(physical and commercial) and the existing corporate relationships between shipping
1.
2.
5',7
firms and manufacturing companies have also gone a long way to altract goods from
these parts ofthe country to the port.
The extent of Genoa's hinterland at the time was a reflection of the transport costs which
prevailed between the region and competing ports. During the 1950's these costs were
mainly a function of distance, though the relationship was not perfect. Another important
facto¡ were the connections between the hinterland and alternative ports. In this case
rapidity of connections and ease played an important role in both road and rail transport.
In the competition between Venice and Genoa for the eastern Mediterranean trafÏic,
Genoa stood disadvantaged due to pressure imposed on its rail facilities by industrial
traffic. In the case concerning Genoa and Turin, involving a distance which is longer than
from Genoa to Savona, the bulk of Turin's traffrc moved through the former port because
of the relative ease and rapidity of rail connections. With respect to truck transport,
Genoa's position on a superhighway over the Ligurian Appennines helped it attract more
traffic.
Furthermore, Italian government policy of granting preferential rates to the port of Trieste
and a number of ports in the south of Italy also affected the nature and extent of the
hinterland pattern of Genoa, albeit in a very limited way. What is more, the inadequacy of
facilities and frequency of services at Genoa, Italian tariff policy, French railway policy
in relation to movements between Marseilles and Switzerland, and the impact of Rhine
River movements on the direction of Switzerland's overseas flows also helped to shape
the hinterland structure of Genoa. As mentioned, hinterland analysis is useful for port
planning and development. This being so, the logical question we need to ask at this
juncture is. what was the signifìcance of hinterland analysis to the planning of the port?
58
2.7 .2 Hinterland analysis and Genoa's development
Genoa's import trafftc after the wa¡ underwent a massive shift from coal to petroleum,
leading to change in volume and direction of traffrc flow. This affected the structure ofthe port's facilities, which had to be redesigned for discharging, storage, and transmission
of petroleum. Consequently, an analysis and forecast of future trends in petroleum in the
nodal hinterland became of great interest to the port authority. The construction of the
Cornigliano steel mill also played a contributing factor to the gro\Ã/th in bulk traffrc
imports through the port. Unlike the petroleum traffrc, the steel mill's trafiìc impact on
the port's facilities, receipts, and labour-force requirements was relatively modest. The
plant's export trafltc was also not encouraging. Nonetheless, analysis of the plant's raw
material requirements, its market structure, forecast of its future development and
requirements was of vital importance to the port's traffic and facility planning. This
required the port authority to keep abreast of developments of the plant in order not to be
caught unprepared.
2.8 The Port of Mombasa and its hinterland
To corroborate the evidence from Genoa are the Kenyan cases of Mombasa and the
proposed Manda Bay port. Like other African ports, the exports of Mombasa originate
largely from specific areas that are to a large extent mutually exclusive, while a
representative proportion of their imports is distributed to almost all their hinterlands, the
proportion depending on the purchasing power and density of population in each region.
The throughput of Mombasa comprises export commodities such as coffee, cotton, sisal,
tea, soda ash, cement products and cashew nut, with oil and oil products like kerosene,
gas and diesel oils constituting the major imports. Mombasa's coffee hinterland extends
beyond the boundaries of Kenya to include northern Tanzania and Uganda. Figure 2.3
shows the coffee hinterland of Mombasa and the tonnages of coffee railed to Mombasa in
1963.
59
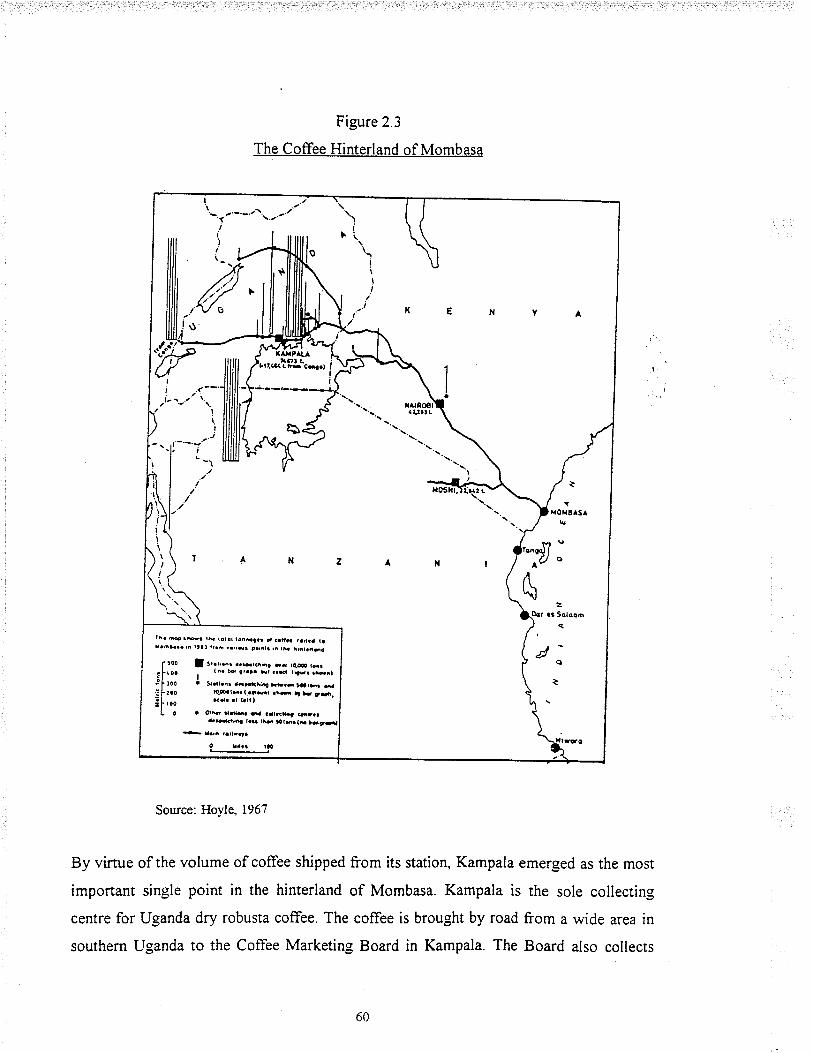
l./\'-.r.- -'-.'\.-.-.- /'-
IÞ\ii!t
lili
I)
.(. o
-rã' KENYA\)
I
a ,<'-ìt.I
-.i
| '-rl)l¡'lt'It
\l-,il
\. tauPæl' .,... alJrt L
II
IA
1à. ,e¡b r& rot.¡ ro¡ælar d øh .ad.a t.¡eñ¡... rñ lta¡ tr.i r..r¡r t.¡ntl .n tÞ ñútd6a
I S,.,;-. ..sr6hc -r rqæ rq¡. (ô. F 0'.r¡ Þt..d t¡.e. Þ.1Ia Sld¡.n. affiñiæ tr.6 f t6. s
rc,qt...(...st ¡ñã 1b 99.ßd. at Llt,
a orv ilahl d Gdtr8{ 6r.a&ffiq rü tb It6(-
-
tr. ralrta
O ¡r.¡ tæ
Figure 2.3
The Coffee Hinterland of Mombasa
Sou¡ce: Hovle. 1967
By virtue of the volume of coffee shipped from its statiorL Kampala emerged as the most
important single point in the hinterland of Mombasa. Kampala is the sole collecting
centre for Uganda dry robusta coffee. The coffee is brought by road from a wide area in
southern Uganda to the Coffee Marketing Board in Kampala. The Board also collects
i
60
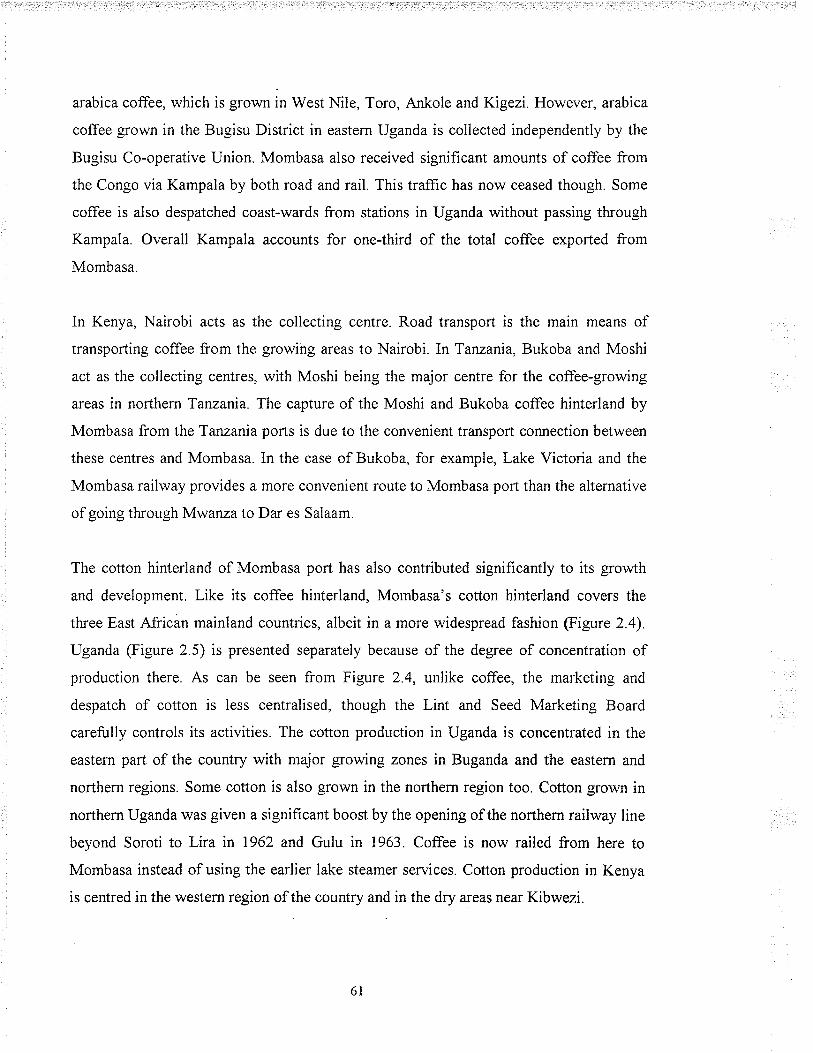
arabica coffee, which is grown in West Nile, Toro, Ankole and Kigezi. However, arabica
coffee grown in the Bugisu District in eastern Uganda is collected independently by the
Bugisu Co-operative Union. Mombasa also received signifrcant amounts of coffee from
the Congo via Kampala by both road and rail. This traffrc has now ceased though. Some
coffee is also despatched coast-wards from stations in Uganda without passing through
Kampala. Overall Kampala accounts for one-third of the total coffee exported from
Mombasa.
In Kenya, Nairobi acts as the collecting centre. Road transport is the main means of
transporting coffee from the growing areas to Nairobi. In Tanzania, Bukoba and Moshi
act as the collecting centres, with Moshi being the major centre for the coffee-growing
areas in northern Taruania. The capture of the Moshi and Bukoba coffee hinterland by
Mombasa from the Tanzania ports is due to the convenient transport connection between
these centres and Mombasa. In the case of Bukoba, for example, Lake Victoria and the
Mombasa railway provides a more convenient route to Mombasa port than the alternative
of going through Mwanza to Dar es Salaam.
The cotton hinterland of Mombasa port has also contributed significantly to its growth
and development. Like its coffee hinterland, Mombasa's cotton hinterland covers the
th¡ee East African mainland countries, albeit in a more widespread fashion (Figure 2.4)
Uganda (Figure 2 5) is presented separately because of the degree of concentration of
production there. As can be seen from Figure 2.4, unlike coffee, the marketing and
despatch of cotton is less centralised, though the Lint and Seed Marketing Board
carefully controls its activities. The cotton production in Uganda is concentrated in the
eastern part of the country with major growing zones in Buganda and the eastern and
northern regions. Some cotton is also grown in the northern region too. Cotton grown in
northern Uganda was given a significant boost by the opening of the northern railway line
beyond Soroti to Lira in 1962 and Gulu in 1963. Coffee is now railed from here to
Mombasa instead of using the earlier lake steamer services. Cotton production in Kenya
is centred in the western region of the country and in the dry areas near Kibwezi.
61
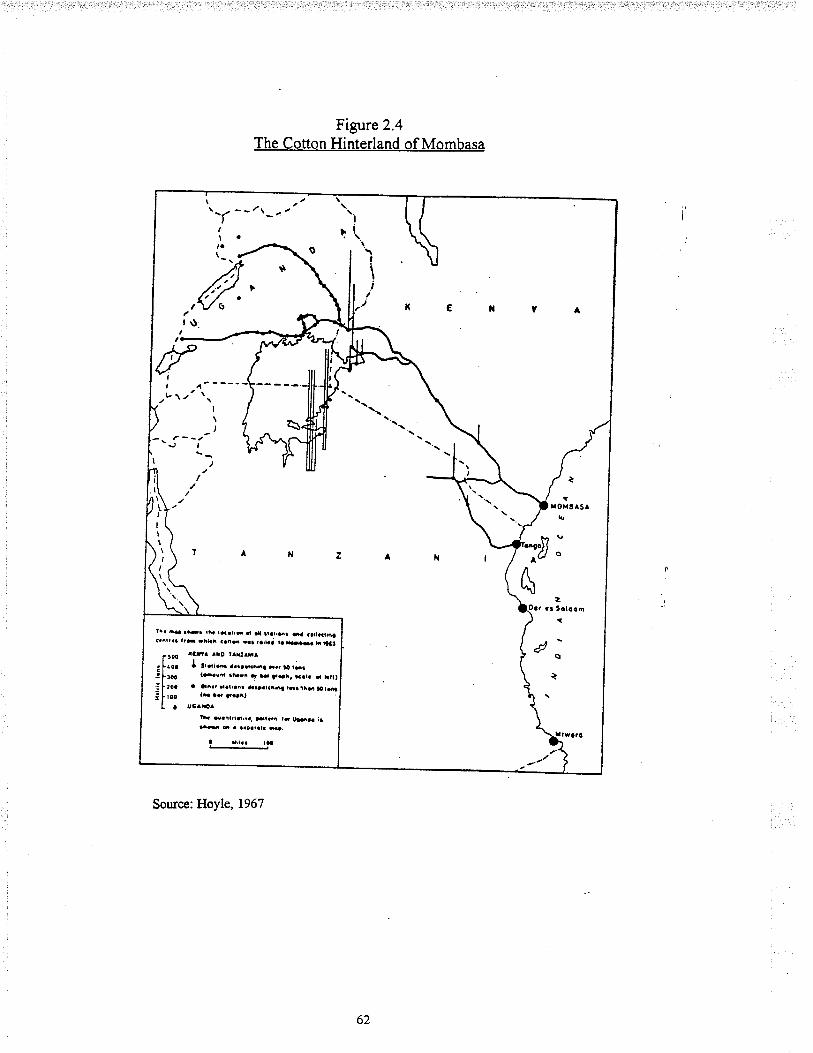
Figure 2.4The Cotton Hinterland of Mombasa
\-.2 --lt--ut
l.
I
ì\tìt\lt ,
\ o
.,d., *
l\)fl
I
I
I
'-l t
t¡. ry aÞ| rh t-at,ñ at d ¡rat¡ts| q aaidhl<..rr.. lrts -;i¡ ..ñÉ úa ra,k¿ ta bú h rl.t
,!æ r6t ¡r0 t^¡¡H¡. f .oa I t,.,,.- rorrø¡ ra to rrrr: I læ l-.ud ¡bi t F l¡i, k.t. d htr,-= f lor a qà.r r.t,.ñi -¡xr.¡q 16¡rà- s16i I tæ að.d t.rà,L r !3^ú^
?E e¡¡rrro,r¡ Fid t, (¡e-aa iakã.a.&ratfãa.
Source: Hoyle,1967
62
Figure 2.5
The Ugandan Cotton Hinterland of Mombasa
Sou¡ce: Hoyle, 1967
In Tanzania the despatch is from the Moshi a¡ea and the southeastern shores of Lake
Victoria. Mombasa also enjoys large sisal traffic, which is indeed one of the principal
cash-crop exports through the port. Unlike coffee and cotton sisal production is more
significant in Kenya than in Uganda. Production centres are found in several parts of the
country, especially the drier parts of Nyarza Province and the Thika area north of
Nairobi. Limited amounts also originate in the Moshi-Arusha area in Tatuarua. The other
major export crop channeled th¡ough Mombasa is tea. The Kericho area in western
Kenya is the most important single source within the tea hinterland of Mombasa. Tea in
the Kericho area is produced on an estate basis and this has been aided extensively by the
lÞ -D
hU tÞ tatat q^Çaa .ails ..¡aa ta h¡- hßl tF r*r ,-itt a
sôo I f t¡t'on¡ -a cdr..r!
-o I ..nr,.. t¡6.l
r. X t6l (FMr.FO rò-^tErF
ICO ra.¡. d t.(1.
raO, a 3tat;á¡ q cdt..t,,aaâtlaa aat-taE c
' mæ,-(-rj.
O9
63
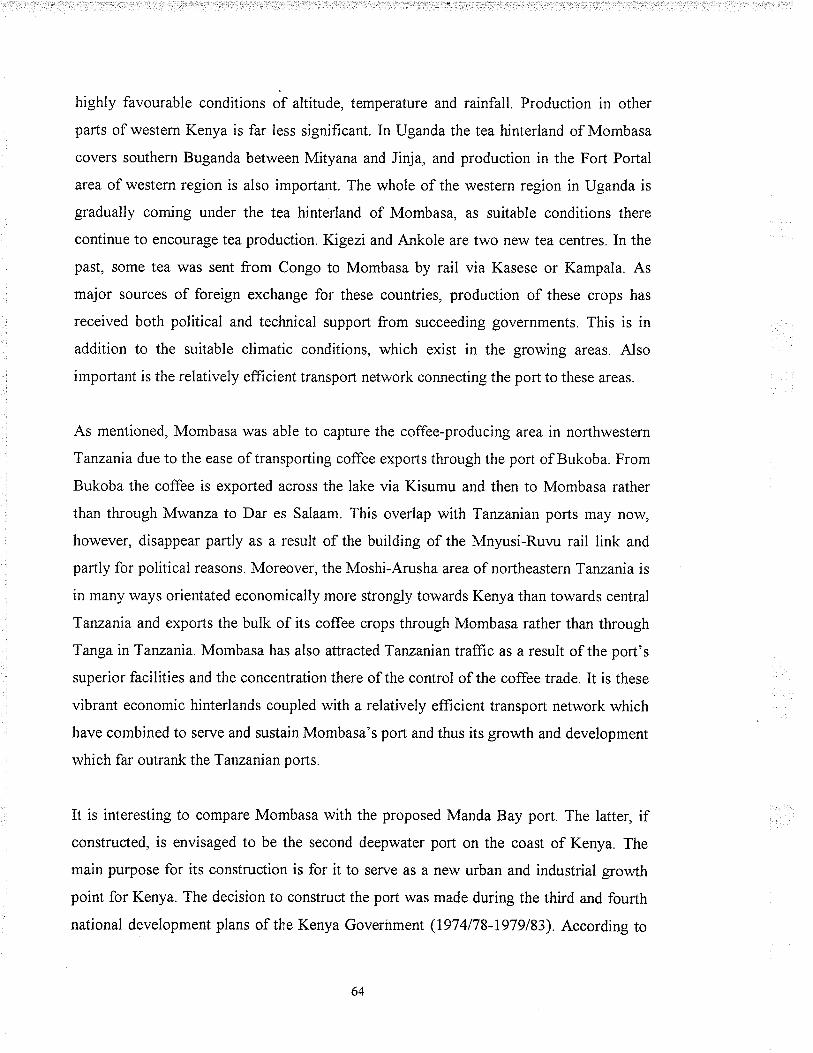
highly favourable conditions of altitude, temperature and rainfall. Production in other
parts of western Kenya is far less significant. In Uganda the tea hinterland of Mombasa
covers southern Buganda between Mityana and Jinja, and production in the Fort Portal
area of western region is also important. The whole of the western region in Uganda is
gradually coming under the tea hinterland of Mombasa, as suitable conditions there
continue to encourage tea production. Kigezi and Ankole are two new tea centres. In the
past, some tea was sent from Congo to Mombasa by rail via Kasese or Kampala. As
major sources of foreign exchange for these countries, production of these crops has
received both political and technical support from succeeding governments. This is in
addition to the suitable climatic conditions, which exist in the growing areas. Also
important is the relatively efficient transport network connecting the port to these areas.
As mentioned, Mombasa was able to capture the coffee-producing area in northwestern
Tanzania due to the ease of transporting coffee exports through the port of Bukoba. From
Bukoba the coffee is exported across the lake via Kisumu and then to Mombasa rather
than through Mwanza to Dar es Salaam. This overlap with Tanzanian ports may now,
however, disappear partly as a result of the building of the Mnyusi-Ruvu rail link and
partly for political reasons. Moreover, the Moshi-Arusha area of northeastern Tanzania is
in many ways orientated economically more strongly towards Kenya than towards central
Tanzania and exports the bulk of its coffee crops through Mombasa rather than through
Tanga in Tanzania. Mombasa has also attractedTaruanian traffic as a result of the port's
superior facilities and the concentration there of the control of the coffee trade. It is these
vibrant economic hinterlands coupled with a relatively efïìcient transport network which
have combined to serve and sustain Mombasa's port and thus its growth and development
which far outrank theTanzanian ports.
It is interesting to compare Mombasa with the proposed Manda Bay port. The latter, ifconstructed, is envisaged to be the second deepwater port on the coast of Kenya. The
main purpose for its construction is for it to serve as a new urban and industrial growth
point for Kenya. The decision to construct the port was made during the third and fourth
national development plans of the Kenya Goverhment (1974178-1979/83). According to
64

the Government Report, Manda Bay was chosen over Kilifi Creek and Malindi due to its
favourable conditions of land and water, the likely impact on the development of the
hinterland, and the relationships with local and national transport systems.
Included in the plan was the idea of linking Manda Bay with rail and road routes through
Galole, Kitui and Machakos to Nairobi (5lOkm) Road links with Somalia and Ethiopia
were also envisaged. The immediate task of the port authority would be to improve the
communication link between the Bay and the Tana River valley to bring the lower Tana
valley within the hinterland of the port, forthe Tana river valley possesses the economic
potential to generate traffic for the port. Existing road communications are poor, and
there is no railway. Thus, right from the outset Manda Bay's hinterland was expected to
go beyond the local hinterland boundary to interior Kenya and beyond the boundaries ofKenya.
The agricultural and livestock potential in the area is considerable. Cotton production and
the cultivation of mangoes and citrus fruits are also well established and could be
expanded considerably for export. The Tana River Development Authority has
established numerous irrigation schemes, but there is water scarcity and the demands ofirrigation and hydroelectric power production would need careful planning. A fishing
industry, livestock ranching and industrial projects like meat canning and fertiliser
production all present possibilities yet to be tapped. Export throughput is envisaged to
consist of cotton, livestock products and fruit, with imports comprising mainly
construction materials, fertilisers and machinery. Though there are plans of extending
Manda Bay's hinterland to include the Kenyan economic core zone centred upon Nairobi,
the high cost involved in such a long-distance communication does not make the project
feasible in the immediate future. The improvement of the road links between Garsen and
Nairobi (via Galole, Garissa and Kangodi, [Figure 2.6]) was included in the lg74-78
development plan, but this route is much longer than that between Nairobi and Mombasa.
65
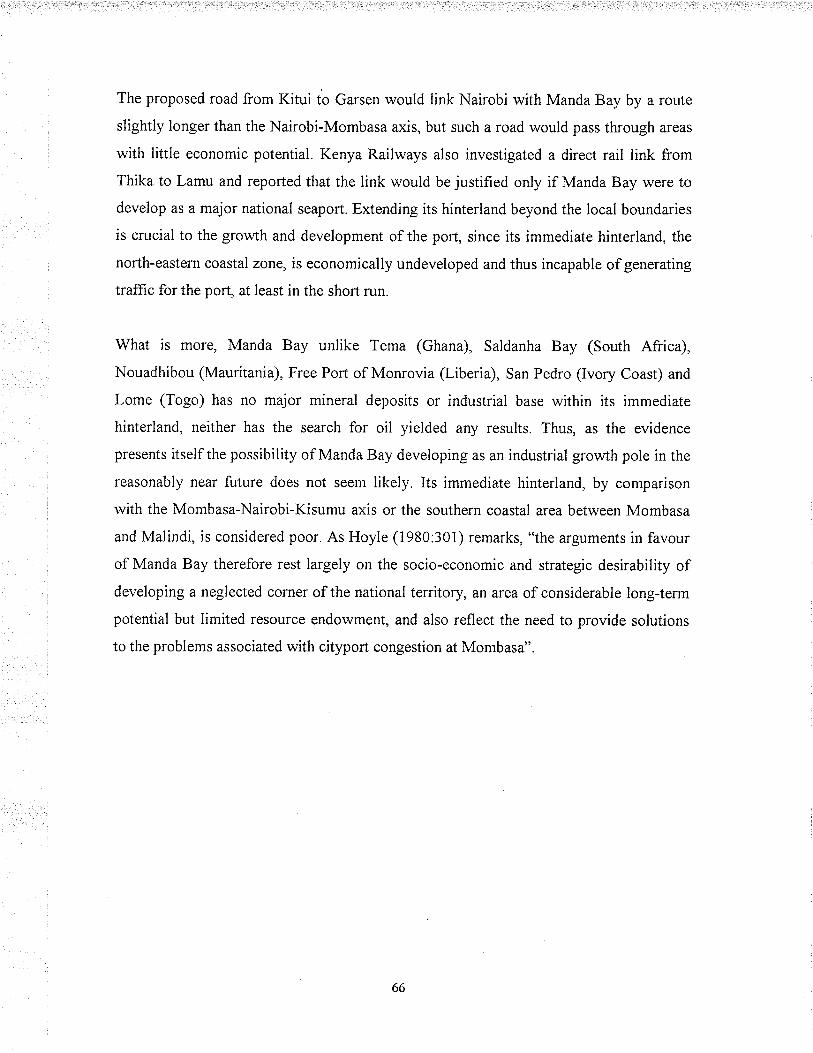
The proposed road from Kitui to Garsen would link Nairobi with Manda Bay by a route
slightly longer than the Nairobi-Mombasa axis, but such a road would pass through areas
with little economic potential, Kenya Railways also investigated a direct rail link from
Thika to Lamu and reported that the link would be justifred only if Manda Bay were to
develop as a major national seaport. Extending its hinterland beyond the local boundaries
is crucial to the growth and development of the port, since its immediate hinterland, the
north-eastern coastal zone, is economically undeveloped and thus incapable of generating
traffic for the port, at least in the short run.
What is more, Manda Bay unlike Tema (Ghana), Saldanha Bay (South Africa),
Nouadhibou (Mauritania), Free Port of Monrovia (Liberia), San Pedro (Ivory Coast) and
Lome (Togo) has no major mineral deposits or industrial base within its immediate
hinterland, neither has the search for oil yielded any results. Thus, as the evidence
presents itself the possibility of Manda Bay developing as an industrial growth pole in the
reasonably near future does not seem likely. Its immediate hinterland, by comparison
with the Mombasa-Nairobi-Kisumu axis or the southern coastal area between Mombasa
and Malindi, is considered poor. As Hoyle (1980:301) remarks, "the arguments in favour
of Manda Bay therefore rest largely on the socio-economic and strategic desirability ofdeveloping a neglected corner of the national territory, an area of considerable long-term
potential but limited resource endowment, and also reflect the need to provide solutions
to the problems associated with cityport congestion at Mombasa".
66
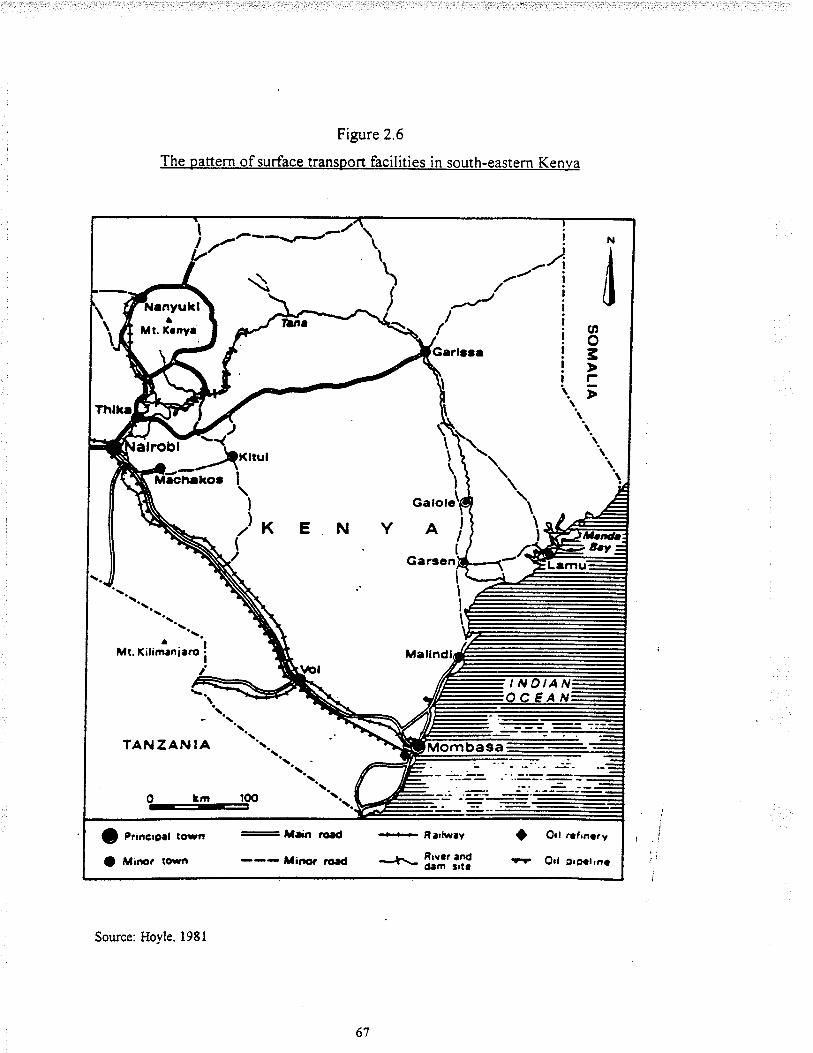
Figure 2.6
The panern of surface transport facilities in south-eastern Kenya
-\ '\.\TANZAN¡A 't-
INDIAN
Q Princrgrl torn
O M¡rær ¡o*n
::3 H¡an rcad
[i¡ror ro¡d
-+-r+ R¡rlwty
--rr- ã¡H'i,?Í
o?F
Orl raftôarV
Orl OrCfat'ne
Source: Hoyle. l98I
67
2.9 The Port of Beira and its hinterland
Like Mombasa, the Port of Beira in Mozambique presents a similar case of the
importance of a vibrant economic hinterland to port gfowth and development. Beira's
hinterland stretches beyond the borders of the country containing it. Its extra-national
hinterland covers the Rhodesias, Nyasaland, and the Upper Katanga region in the Belgian
Iuongo .
The national hinterland consists of the reorganised Manica and Sofala, and Tete districts,
covering about three-tenths of Mozambique. Figure 2.7 shows the approximate
boundaries of Beira's national hinterland. Major products found in Beira's national
hinterland aÍemaize, oilseeds and oil cake, fruit, potato, beans, sisal, and some quantities
of rice and wheat. There is also cotton from the Gorongoza and Chimoio areas for
shipment to Portuguese textile industries. Timber from the sawmills along the Beira rail
line has also been an important source of traffic for Bei¡a. Beira's import traffrc to the
interior region includes petroleum products, cement, and sugar. Unfortunately,
manufactured imports bound for the interior are limited due to the low purchasing power
of the farmers living there. Though mining had the ability of providing a better
livelihood, its activities were restricted to only small diggings of gold, copper, tin, and
mica. There were no major cities in Beira's national hinterland during the 1950's. The
only two relatively big cities in addition to Beira are Dondo and Vila Pery. Dondo had
the potential of developing into an industrial satellite due to its favourable location for
assembly of raw materials and distribution of manufacturing products. It was also a rail
junction. In addition, it had a cement factory, a milling industry and a fibrous cement
plant, which used local cement and asbestos from Southern Rhodesia. Vila Pery, a small
agricultural processing centre, could boast of only the first textile plant in the province.
8 The Rhodesias were divided into Northern and Southern, Northem Rhodesia is present Zarnbia. Southern
Rhodesia is nolv Zimbabrve. Nyasaland is now Malawi while Belgian Congo is now the Democratic
Republic of Congo, formerlY Zure.
68

Fieure 2 7
Beira's National Tributarv Area
Source: Hance a:rd Val Dongen. l9-57
6t)
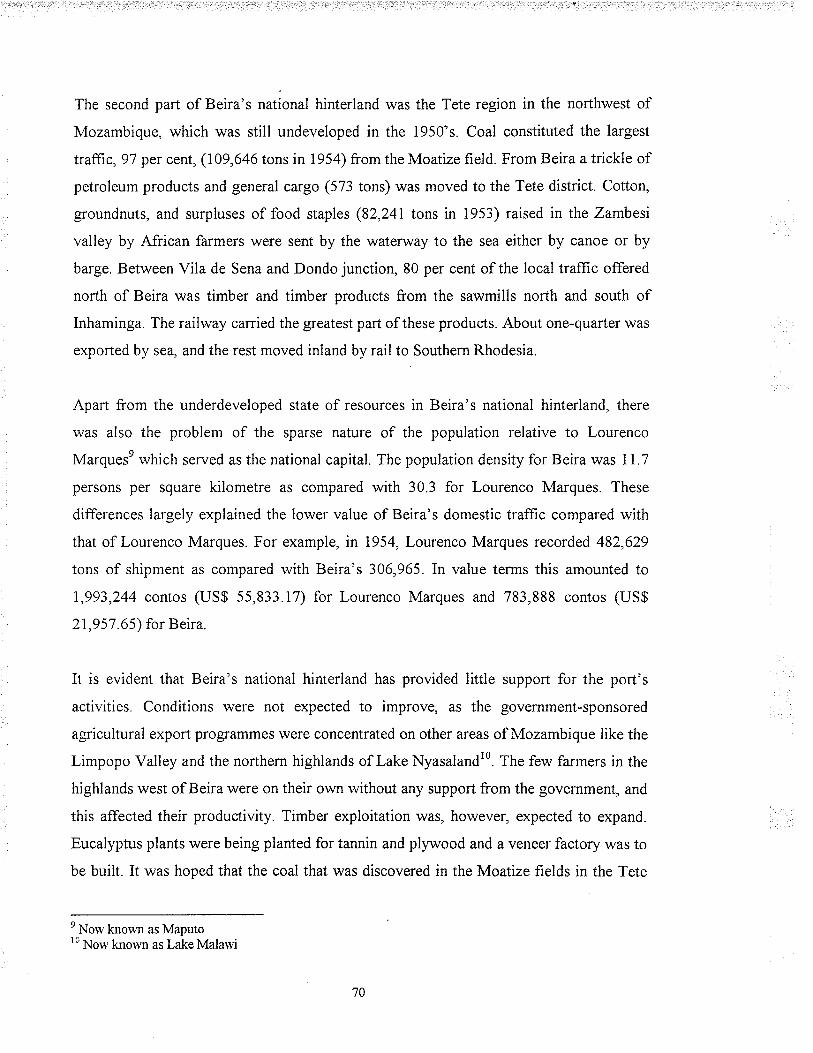
The second part of Beira's national hinterland was the Tete region in the northwest of
Mozambique, which was still undeveloped in the 1950's Coal constituted the largest
traffic, 97 per cent, (109,646 tons in 1954) from the Moatize field. From Beira a trickle of
petroleum products and general cargo (573 tons) was moved to the Tete district. Cotton,
groundnuts, and surpluses of food staples (82,247 tons in 1953) raised in the Zambesi
valley by African farmers were sent by the \¡/aterway to the sea either by canoe or by
barge. Between Vila de Sena and Dondo junction, 80 per cent of the local traffic offered
north of Beira was timber and timber products from the sawmills north and south of
Inhaminga. The railway canied the greatest part of these products. About one-quarter was
exported by sea, and the rest moved inland by rail to Southern Rhodesia.
Apart from the underdeveloped state of resources in Beira's national hinterland, there
was also the problem of the sparse nature of the population relative to Lourenco
Marquese which served as the national capital. The population density for Beira was 11.7
persons per square kilometre as compared with 30.3 for Lourenco Marques. These
differences largely explained the lower value of Beira's domestic trafltc compared with
that of Lourenco Marques. For example, in 1954, Lourenco Marques recorded 482,629
tons of shipment as compared with Beira's 306,965.In value terms this amounted to
7,993,244 contos (US$ 55,833.17) for Lourenco Marques and 783,888 contos (US$
2I,957.65) for Beira.
It is evident that Beira's national hinterland has provided little support for the port's
activities. Conditions were not expected to improve, as the government-sponsored
agricultural export programmes \¡/ere concentrated on other areas of Mozambique like the
Limpopo Valley and the northern highlands of Lake Nyasalandto. The few farmers in the
highlands west of Beira were on their own without any support from the government, and
this affected their productivity. Timber exploitation was, however, expected to expand.
Eucalyptus plants were being planted for tannin and plywood and a veneer factory was to
be built. It was hoped that the coal that was discovered in the Moatize frelds in the Tete
e Norv knog'n as Maputoto Norv knou'n as Lake Malau,i
70
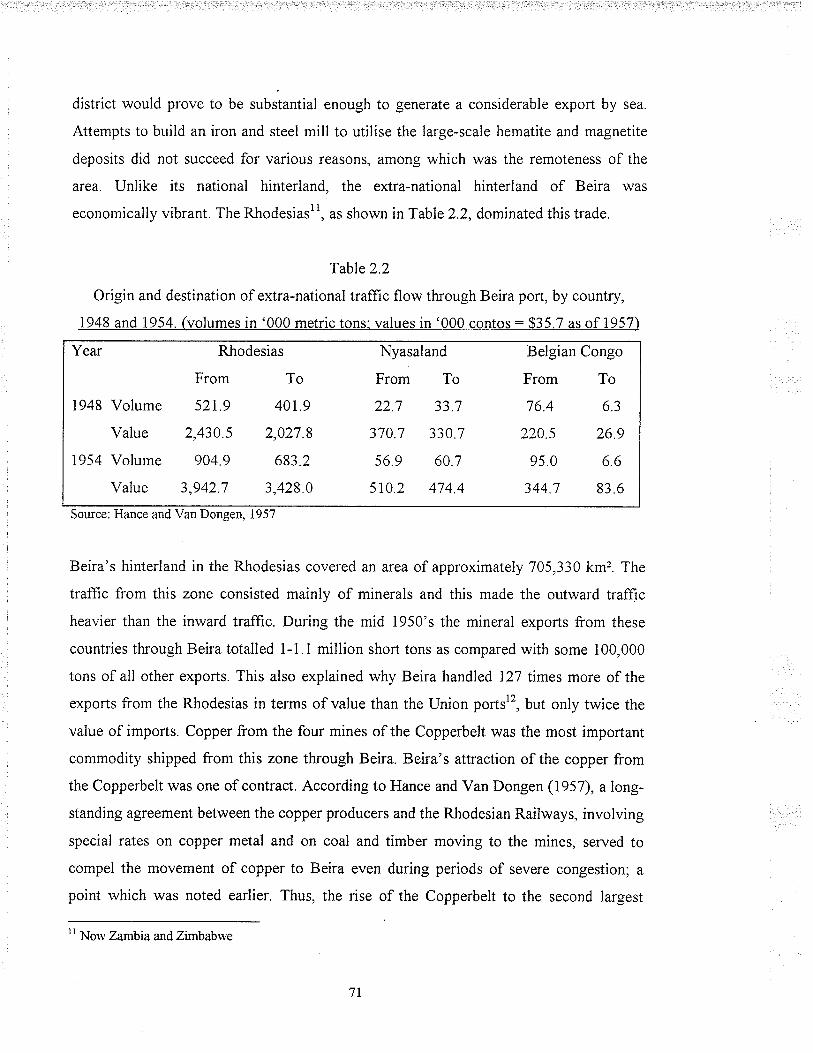
district would prove to be substantial enough to generate a considerable export by sea.
Attempts to build an iron and steel mill to utilise the large-scale hematite and magnetite
deposits did not succeed for various reasons, among which was the remoteness of the
aÍea. Unlike its national hinterland, the extra-national hinterland of Beira was
economically vibrant. The Rhodesiastt, as shown in Table 2.2, dominated this trade.
Table2.2
Origin and destination of extra-national traffic flow through Beira port, by country,
1948 and 1954. (volumes in '000 metric tons: values in '000 contos: $35.7 as of 1957)
Source: Hance a¡d Va¡ Dongen, 1957
Beira's hinterland in the Rhodesias covered an aÍea of approximately 705,330 kmz. The
traffic from this zone consisted mainly of minerals and this made the outward traffrc
heavier than the inward traffic. During the mid 1950's the mineral exports from these
countries through Beira totalled 1-1.1 million short tons as compared with some 100,000
tons of all other exports. This also explained why Beira handled 127 times more of the
exports from the Rhodesias in terms of value than the Union portsl2, but only twice the
value of imports. Copper from the four mines of the Copperbelt was the most important
commodity shipped from this zone through Beira. Beira's attraction of the copper from
the Copperbelt was one of contract. According to Hance and Van Dongen (1957), a long-
standing agreement between the copper producers and the Rhodesian Railways, involving
special rates on copper metal and on coal and timber moving to the mines, served to
compel the movement of copper to Beira even during periods of severe congestion; a
point which was noted earlier. Thus, the rise of the Copperbelt to the second largest
Year
1948 Volume
Value
1954 Volume
Value
Rhodesias Nyasaland
From To
22.7 33.7
370.7 330.7
56.9 60.7
510.2 474.4
Belgian Congo
From ToFrom
521.9
2,430.5
904.9
3,942.7
To
40r.9
2,027.8
683.2
3,428 0
76.4
220 5
95.0
6.3
26.9
6.6
344 7 83.6
" Norn' Zambia andZrmbabwe
'n
world producer of copper concentrates and metal after World War II has been of
considerable importance to Beira. Production of blister copper, for example, reached
230,000 shorttons, of electrolytic copper 194,000 tons, and of cobalt 1,800tons in 1954.
Afr.er 1952 all cobalt metal from the Copperbelt was moved to Beira.
Following copper in importance is ch¡ome ore from the mines in the Lomagundi and
Selukwe areas of the Southern Rhodesia High Veld. The construction of the 36.87km
Selukwe-Gwelo branch and the 38.47km Umvukwes sub-branch were purposely meant to
bring local chrome ore to the main line. A major problem, which faced ch¡ome
producers, was the shortage of freight cars. This resulted in large stockpiles in the mining
areas, the inability to meet export requirements and the cancellation of orders. Other bulk
minerals exported through Beira from Southern Rhodesia were asbestos and petalite (a
source of lithium). At a production rate of 10,000 tons per month, petalite became the
most rapidly growing mineral export to come from Southern Rhodesia. The asbestos was
mined at Shabani and Mashaba. Gold, lead, zinc, and vanadium were also sent from these
areas to Beira. Agricultural products included manufactured tobacco leaf, maize,
vegetable oil and oilseeds, and timber. It is apparent that Beira's export hinterland outside
its national boundaries was economically more prosperous than its national hinterland.
Growth in the export traffic was envisaged to continue into the future. Even agriculture,
which did not have strong foundation in these areas, was expected to improve, especially
for tobacco, tea, citrus fruit and animal products.
Imports from Beira to its extra-national hinterlands consisted of petroleum products,
construction materials, softwood lumber, grain (mainly wheat), and fer¡ilisers, salt and
paper. Gasoline comprised 62.5 per cent of the petroleum products. These shipments to
Beira's extra-national hinterland were expected to increase as the standard of living of the
population increased. The character of the import traffic, however, was expected to
change as local industries diversified.
't The Union is the present South Africa.
72

However, the ability of the port to offer this extensive service depended on the efficiency
of the port's equipment and the transport service between the port and the hinterlands.
The Rhodesia rail network, for example, witnessed severe congestion during the post-war
economic boom in Central Africa as owners of the network were not prepared for the
sudden boom and had no concrete plans for its expansion. The network was later
nationalised and its capacity raised, though this was still inadequate in relation to the
amount of traffic being hauled. In 1954 the total tonnage hauled increased to 8.6 million
from 5.1 million in 1949, while net ton-kilometres increased in the same period from
2,300 to 3,400 million.
The importance and function of the extra-national hinterland to Beira cannot be
overstated, either in terms of supplying the port with trafïic or in determining the nature
of port planning. This explained the attempts that were made to improve and maintain the
infrastructure, which served the port and its extra-national hinterland. Various parties
interested in Beira's extra-national hinterland traffic committed large investments in
order to alleviate some of the transport difficulties occurring between the port and the
hinterland. ln 1949, for example, the ECA supplied road-making equipment. A further
ECA loan of $950,000 and 4,250,000 Dutch florins in counterpart funds financed the
bulk mineral wharf at Beira. In 1951 another ECA loan of $14 million to the Rhodesia
Railways was made available for general improvements. Some $289,000 was given to
cover the reconstruction of the Great North Road from Broken Hill to Tunduma in
Northern Rhodesia.
It was obvious that Beira's extra-national hinterland would continue to send as well as
receive traffic to and from the port. Current figures throw more light on the functions of
Beira's extra-national hinterlands. The total volume of cargo through Beira in 1996 rose
by 5 per cent over 1995 to 2.6 million tonnes, according to the Beira Corridor Group.
Excluding petroleum products, the total was 1.5 million tonnes, an ll per cent increase
over the previous year. Transit cargo of 1.24 million tonnes accounted for almost all of
the traffic, with Zimbabwe (Southern Rhodesia) accounting for 964,000 tonnes, an
increase of 29 per cent. Most of the increased trafüc to and f¡om Zimbabwe consisted of
73

agricultural commodities such as maize, fertiliser and wheat. Exports from Malawi
Qrlyasaland) and Zambia Qt{orthern Rhodesia) also picked up, showing a considerable
increase for the first half of 1996 in comparison with 7995. Zambia's increase, however,
came mainly from bulk exports of copper. Copper exports from Zambia totalled 24,700
tons for the first six months compared with 12,700 tons for the first half of 1995.
Announcing their half-year figures, Mozambique Railways (CFM) said that the increase
from Malawi was mostly with containerised cargoes of tobacco, tea and cotton.
Comparative figures for the frrst six months (in TEUs) are shown in Table 2.3.
Table 2.3
Malawi's tobacco and tea trafüc through Beira,
Source: Prepared from the internet sites:
(http : / / r apidttp. cornl car so / ftw / 9 7 / 9 7 f el 4 s.ltrf ü, ) - I 9 9 8
(http : //cargoinfo . co.zal ftr / 9 6oc04 q. htrnl) - I 9 9 8
Comparing Table 2.3 with Table 2.2 we see a sharp increase in Beira's traffic from its
extra-national hinterland. For example, while traffic volumes in the i950's were in
thousands the comparable values for the 1990's traffic are in millions. In 1954 exports
from the Rhodesias (Zimbabwe and Zambia) combined totalled 905,000 tonnes; exports
from Zimbabwe alone totalled 964,000 tonnes in 1996. In the case of Malawi tea and
tobacco exports alone totalled 2,637 tonnes in 1996 compared rvith 1954 total exports of
about 57 tonnes.
As a result of the increase in traffic, a R 40 million-grain silo project for Beira has been
proposed, to be owned by the National Railways of Zimbabwe, CFM of Mozambique and
other private investors. The silo is expected to greatly improve handling and effrciency at
the port, largely using mechanical equipment instead of manual labour. Among the
1995-96 (rsu)
Item 1 995 t996 Increase (%)
Tobacco
Tea
Total
463
753
1,216
r620
1017
2,637
250
35
285
74
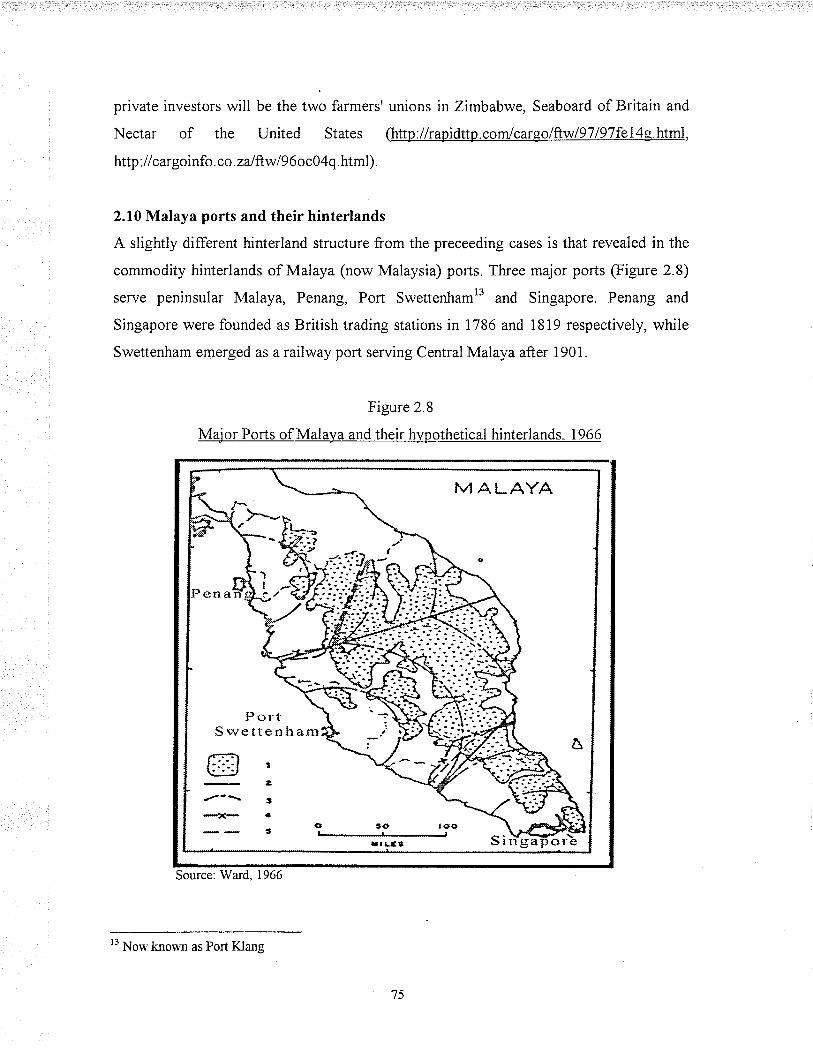
private investors will be the two farmers' unions in Zimbabwe, Seaboard of Britain and
Nectar of the United States (.http.l/rapidttp.com/cargolftwl97l97fel4g.html,
http . I I car goinfo . co . zal ftw I 9 6 o c0 4 q. html ).
2.10 Malaya ports and their hinterlands
A slightly different hinterland structure from the preceeding cases is that revealed in the
commodity hinterlands of Malaya (now Malaysia) ports. Th¡ee major ports (Figure 2.8)
serve peninsular Malaya, Penang, Port Swettenhaml3 and Singapore. Penang and
Singapore were founded as British trading stations in 1786 and l8l9 respectively, while
Swettenham emerged as a railway port serving Central Malaya after 1901.
Figure 2.8
Major Ports of Mala)¡a and their h)¡pothetical hinterlands. 1966
Source: Wa¡d. 1966
t'Now knonn as Port Klang
'75
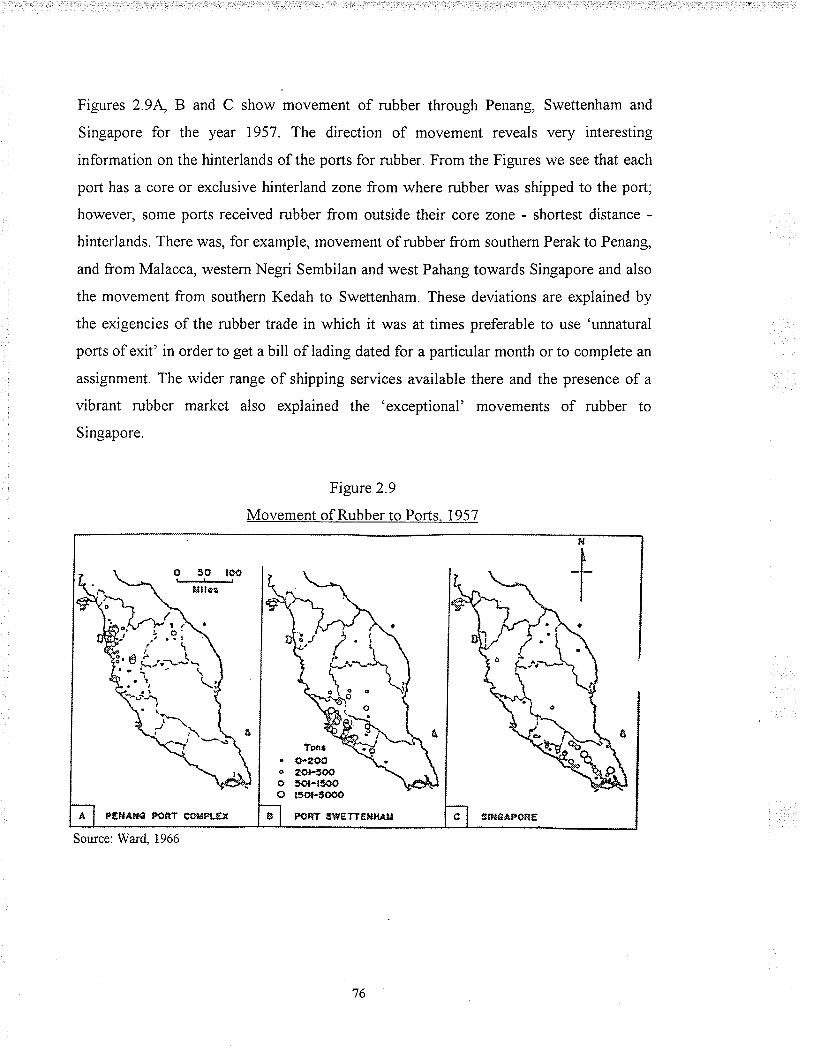
Figures 29L B and C show movement of rubber through Penang, Swettenham and
Singapore for the year 1957. The direction of movement reveals very interesting
information on the hinterlands of the ports for rubber. From the Figures we see that each
port has a core or exclusive hinterland zone from where rubber was shipped to the port;
however, some ports received rubber from outside their core zone - shortest distance -
hinterlands. There was, for example, movement of rubber from southern Perak to Penang,
and from Malacca, western Negri Sembilan and west Pahang towards Singapore and also
the movement from southern Kedah to Swettenham. These deviations are explained by
the exigencies of the rubber trade in which it was at times preferable to use 'unnatural
ports of exit' in order to get a bill of lading dated for a particular month or to complete an
assignment. The wider range of shipping services available there and the presence of a
vibrant rubber market also explained the 'exceptional' movements of rubber to
Singapore.
Figure 2.9
Movement of Rubber to Ports. 1957
PSHAH€ FONÎ COIdFL.EÍ PCRT SHETTE¡'}ìÁ!¿ 3tfð8åpoRE
iâ
+
Tsa3
û-uooeoHoo50r-lsoo
i',€ d;,;uJ-*
Sou¡ce: Wa¡d, 1966
t6

The next major export is latex. Liquid latex export from Malaya is considered a mid-
1950's phenomenon. The latex factories form the organisational point of the latex export
business. From these factories, freshly gathered latex was prepared for shipment in bulk
or drums to overseas destinations. In order to prevent coagulation the latex was treated
with ammonia immediately after extraction from the tree. Consequently, the factories
tended to be located in the centre of large areas of estate rubber, and usually belonged to
large estate groups. Each factory served areas within a radius of 32 kilometres. Figure
2.10 shows movement of latex to some of the collecting centres, including the three
major ports. The port of export is indicated for the output of inland centres. The total
quantities mapped in Figure 2.10 represent approximately all the liquid latex shipped in
1957 th¡ough Penang, about 64 per cent of that shipped through Swettenham, and about
55 per cent ofthat shipped through Singapore.
Figure 2.10
Movements of Latex. 1 957
MOVEMENTS OF LATEX rssT i , "1..J;-l c 2ill-(ô
ìÊå Yi-\Vtí.", \:;q+:ù¡,",0¿*olg.:- /t-,, \ 'i:</''r
;"=qffi\.\E¡niiøÊorü
Source: Wa¡{ 1966
77
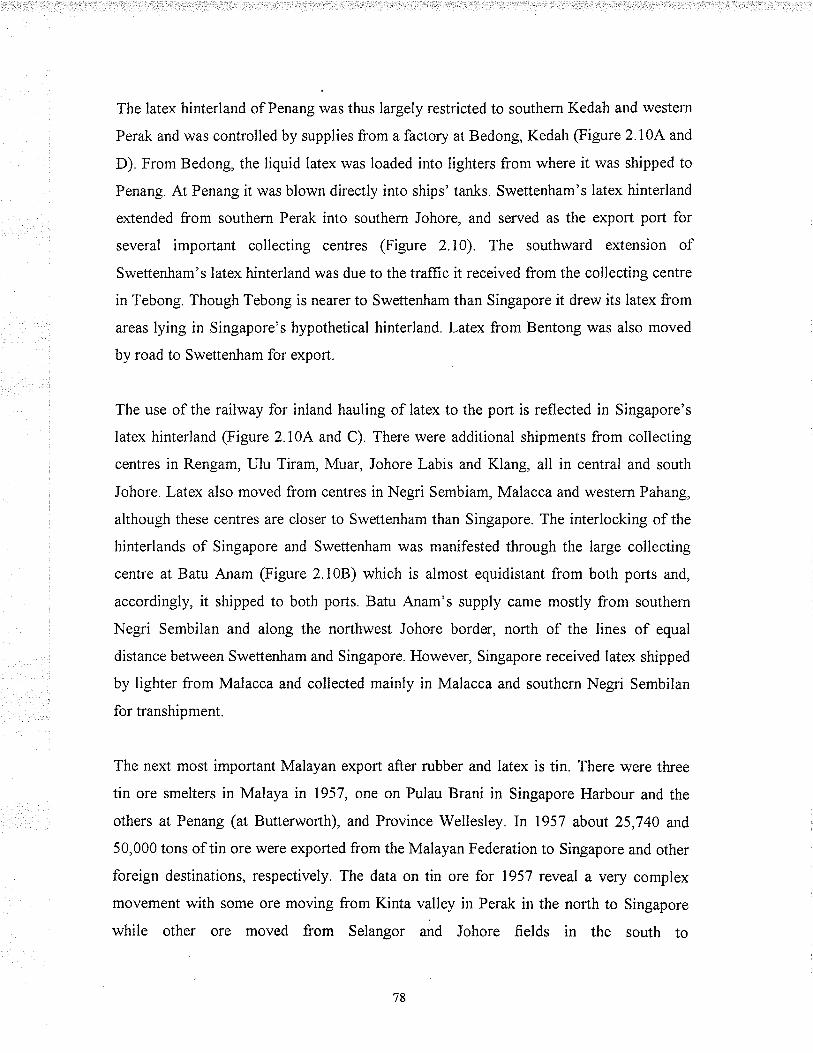
The latex hinterland of Penang was thus largely restricted to southern Kedah and western
Perak and was controlled by supplies from a factory at Bedong, Kedah (Figure 2.104 and
D). From Bedong, the liquid latex was loaded into lighters from where it was shipped to
Penang. At Penang it was blown directly into ships' tanks. Swettenham's latex hinterland
extended from southern Perak into southern Johore, and served as the export port for
several important collecting centres (Figure 2.10). The southviard extension of
Swettenham's latex hinterland was due to the traffic it received from the collecting centre
in Tebong. Though Tebong is nearer to Swettenham than Singapore it drew its latex from
areas lying in Singapore's hypothetical hinterland. Latex from Bentong was also moved
by road to Swettenham for export.
The use of the railway for inland hauling of latex to the port is reflected in Singapore's
latex hinterland (Figure 2.70A and C). There were additional shipments from collecting
centres in Rengam, Ulu Tiram, Muar, Johore Labis and Klang, all in central and south
Johore. Latex also moved from centres in Negri Sembiam, Malacca and western Pahang,
although these centres are closer to Swettenham than Singapore. The interlocking of the
hinterlands of Singapore and Swettenham was manifested through the large collecting
centre at Batu Anam (Figure 2.108) which is almost equidistant from both ports and,
accordingly, it shipped to both ports. Batu Anam's supply came mostly from southern
Negri Sembilan and along the northwest Johore border, north of the lines of equal
distance between Swettenham and Singapore. However, Singapore received latex shipped
by lighter from Malacca and collected mainly in Malacca and southern Negri Sembilan
for transhipment.
The next most important Malayan export after rubber and latex is tin. There were three
tin ore smelters in Malaya in 1957, one on Pulau Brani in Singapore Harbour and the
others at Penang (at Butterworth), and Province Wellesley. In 1957 about 25,740 and
50,000 tons of tin ore were exported from the Malayan Federation to Singapore and other
foreign destinations, respectively. The data on tin ore for 1957 reveal a very complex
movement with some ore moving from Kinta valley in Perak in the north to Singapore
while other ore moved from Selangor and Johore .fields in the south to
'78

Penang/Butterworth in the north. The ore from the east coast, mainly from the Sungei
Lembing lode mine, was shipped to Singapore in coastal steamer via Kuantan. Figure
2.1 I shows a more detailed picture of the amount and destination of tin ore moved by rail
in 1957. As the Figure reveals, ore moved by rail from the Kinta valley, most of the
northern mines (e.g. KakiBukit, Perlis, andLahat-Taiping, Perak) and from some of the
Selangor mining areas like Batu Village to the PenangÆutterworthÆrai area. Some ore
was sent to Swettenham from the Selangor frelds for shipment to PenangÆutterworth and
Singapore. Telok Anson, a minor port in southern Perak, shipped quite substantial
amounts of tin ore f¡om the Kinta valley and southern Perak to either PenangÆutterworth
orto Singapore.
Figure 2.1 1
Tin Ore Movements by Rail. 1957
Slr Rail, 195?
ffiru_T.,
=; YFt* .Q[J+
{þ**'T.{ tfmlors ¡-¡
Í\:It
ttttÍIIt
\þ
t
Trt¡tt?M
Sou¡ce: Wa¡d. 1966
79

With respect to imports their analysis is considered more tenuous due to dearth of data.
Figures 2.12a-b present the distribution of petroleum and three other important imports.
Imports amounting to about $MaI.400, 000,000 ($US 133,000,000) were brought into the
Malayan Federation and Singapore in 1957. The aro\¡/s depict the relative importance of
the major and minor ports of entry in 1957. The distribution areas are confined to only
the th¡ee major ports and two other minor import ports. A relatively high use was made
of the minor ports, because of the cost advantages associated with water transport of bulk
shipment of petroleum products.
Figures 2.12a-b
Petroleum Products Distribution Areas and Import Distribution Areas. 1957
M A LAYAPetroleum ProductsDistribution Areas
1951
MALAYADistributìon Areas forSome Imports, 1957
Sou¡ce: Wa¡d" 1966
The minor ports received their supply from barges or coastal steamer either from
Singapore (to Batu Pahat, Kuantan and Kuala Trenggan) or Swettenham (to Port
Dickson), directly from Sumatran refineries by barge (e.g Telok Anson, Malacca), or
from ocean-going tankers (e.g Penang, Swettenham and Singapore). Consequently, the
hinterlands of Telok A¡son and Malacca overlap. greater parts of the petroleum products'
hinterlands of the major ports in western Malaya. Apart from Kelantan, the east coast was
80
supplied from Singapore by sea, with the minor ports of Kuantan and Kuala Trengganu
as second-order distribution centres.
In the case of toothpaste about 44 per cent of the total supply came th¡ough Singapore. Of
this figure, 95 per cent \¡/as distributed in Singapore itself. Distribution areas centred on
Penang and Kuala Lumpur accounted for about 19 per cent and 18 per cent of sales
respectively, while Ipoh accounted for 14 per cent of the sales. I|;4alacca, Kuala
Trengganu, Muar and Kota Bahru accounted for the remaining 5 per cent. The
concentration of toothpaste distribution in the major cities and towns was attributed to a
number of urban factors such as higher incomes, better-developed selling facilities and
greater European element in the urban population.
2.11 Summary
Port hinterland, the porl's collecting and distributing area [P.C.D.A], is an important
facet of geographical analysis of ports. Hinterlands can be classifred variously, depending
on the criteria adopted; for example, import or export hinterlands, commodity hinterlands
or national or extra-national hinterlands. Classic classifications of hinterlands are found
in the works of Morgan (i951) and Bird (197I). Morgan identified what he called the
primitive, raw material and liner hinterlands. Bird's classification is grouped into
immediate, primary, secondary, advantage, commodity, and functional and overlap
hinterlands. Hayuth (1982), on the other hand, demonstrates that this view of hinterland,
popularly referred to as the traditional hinterland concept, is made complex by the
introduction of new maritime technologies like the interrnodal-container system. With the
intermodal-container and the land bridge systems, large container ports have been able to
penetrate far beyond their immediate hinterlands to capture vast hinterlands in other
nations and indeed continents. Hinterland analysis, it was noted, also requires a
consideration of the transport network between the port and the hinterland. Relevant to
both cases is the example of Rotterdam. Having explained the hinterland concept I now
proceed to describe the methodology for assessing and comparing ports.
8l
CHAPTER THREE
PORT COMPARISONS:THE INDICES AND METHODOLOGY
3.0 Introduction
As mentioned in Chapter One, inter-port competition is an important facet of the port-
hinterland interface. A corollary of port competition is port comparison. Port
comparisons, however, have generated some reservations about appropriateness of
various indices and methodologies. Yet, before the question of suitable tools for analysis
can be settled, satisfactory resolution of a more basic issue must first be achieved. That
issue concerns the datathemselves, the format and validity of the numerical information
compiled as port statistics. Bird (1963), fo. example, argues fhat great care must be
exercised in the handling of port statistics if they are to give meaningful comparisons of
the status of ports or size of their activities. Port statistics are numerous, not to say
frequently confusing. Svendsen (1951) groups them into three main categories:
1. Statistics concerning the structure of the harbour - These statistics comprise the
technical equipment of the harbour; for example, length of the quays, number of
cranes and area ofthe sheds.
2. Statistics concerning traffrc - These comprise the entrances and clearances of vessels
with cargo or in ballast, number of ships and tonnages, nationality of ships and
trading areas.
3. Transport statistics- These furnish information on goods loaded and unloaded, gross
weight volume and value, commodity groups and direction of the traffic.
Any of these statistics can be used as benchmark indicators in a comparative study of
ports. The purpose of this chapter is to describe how some of these statistics have been
used in port comparison studies, and the methodological issues which arise as a result.
The upshot of the chapter provides the grounds for preferring some over others; that is to
say, it justifies my selection of indicators for this study.
82
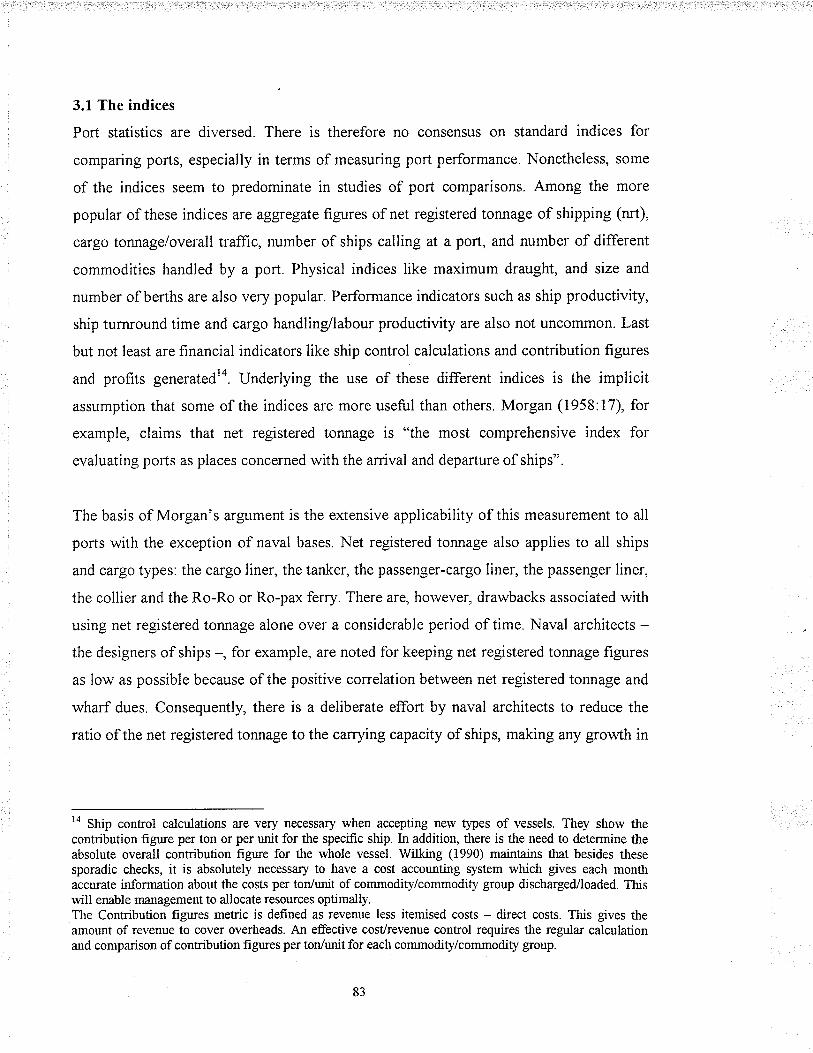
3.1 The indices
Port statistics are diversed. There is therefore no consensus on standard indices for
comparing ports, especially in terms of measuring port performance. Nonetheless, some
of the indices seem to predominate in studies of port comparisons. Among the more
popular of these indices are aggregate figures of net registered tonnage of shipping (nrt),
cargo tonnage/overall traffic, number of ships calling at a poft, and number of different
commodities handled by a port. Physical indices like maximum draught, and size and
number of berths are also very popular. Performance indicators such as ship productivity,
ship turnround time and cargo handling/labour productivity are also not uncommon. Last
but not least are financial indicators like ship control calculations and contribution figures
and profits generatedra. Underlying the use of these different indices is the implicit
assumption that some of the indices are more useful than others. Morgan (1958:17), for
example, claims that net registered tonnage is "the most comprehensive index for
evaluating ports as places concerned with the arrival and departure of ships".
The basis of Morgan's argument is the extensive applicability of this measurement to all
ports with the exception of naval bases. Net registered tonnage also applies to all ships
and cargo types: the cargo liner, the tanker, the passenger-cargo liner, the passenger liner,
the collier and the Ro-Ro or Ro-pax ferry. There are, however, drawbacks associated with
using net registered tonnage alone over a considerable period of time. Naval architects -the designers of ships -, for example, are noted for keeping net registered tonnage figures
as low as possible because of the positive correlation between net registered tonnage and
wharf dues. Consequently, there is a deliberate effort by naval architects to reduce the
ratio of the net registered tonnage to the carrying capacity of ships, making any growth in
'o Ship control calculations are very necessar)' when accepting new types of vessels. They show thecontribution figure per ton or per unit for the specific ship. In addition, there is the need to determine theabsolute overall contribution figure for the whole vessel. Wilking (1990) maintains that besides thesesporadic checks, it is absolutely necessary to have a cost accountilg system which gives each monthaccurate information about the costs per ton/unit of commodity/commodity group discharged/loaded. Thiswill enable månagement to allocate resources optimally.The Contribution figures metric is defined as revenue less iternised costs - direct costs. This gives theamoì.mt of revenue to cover overheads. An effective cost/revenue control requires the regular calculationand comparison of contribution figures per tor/mit for each commodity/commodity group.
83
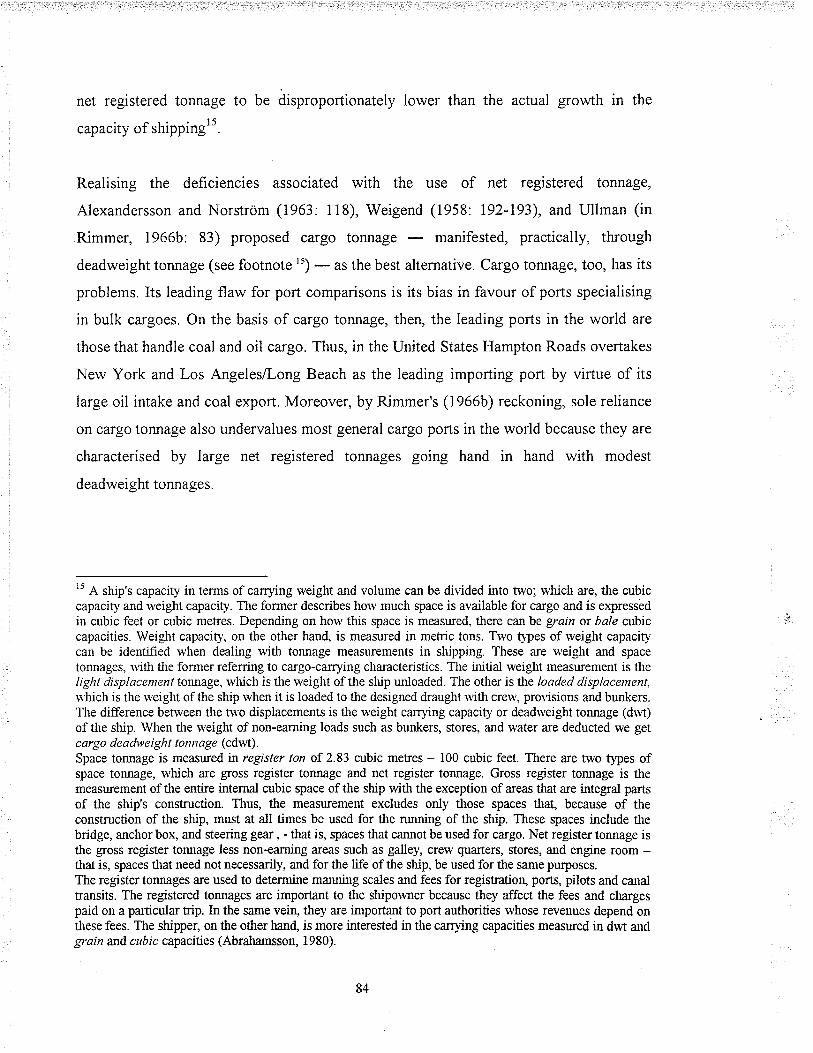
net registered tonnage to be disproportionately lower than the actual growth in the
capacîty of shipp i ng t 5.
Realising the defrciencies associated with the use of net registered tonnage,
Alexandersson and Norström (1963: 118), Weigend (1958: 192-193), and Ullman (in
Rimmer, 1966b. 83) proposed cargo tonnage - manifested, practically, through
deadweight tonnage (see footnote't) - as the best alternative. Cargo tonnage, too, has its
problems. Its leading flaw for port comparisons is its bias in favour of ports specialising
in bulk cargoes. On the basis of cargo tonnage, then, the leading ports in the world are
those that handle coal and oil cargo. Thus, in the United States Hampton Roads overtakes
New York and Los Angeles/Long Beach as the leading importing port by virtue of its
large oil intake and coal export. Moreover, byRimmer's (1966b) reckoning, sole reliance
on cargo tonnage also undervalues most general cargo ports in the world because they are
characterised by large net registered tonnages going hand in hand with modest
deadweight tonnages.
15 A ship's capacity in terms of carrying weight and volume can be dii,ided into two; which are, the cubiccapacity and rveight capacity. The former describes hou' much space is available for cargo and is expressedin cubic feet or cubic metres. Dependrng on how this space is measu¡ed, there can be grain or bale clbiccapacities. Weight capacit-v, on tle other han{ is measu¡ed in metric tons. Two types of weight capacitycan be identified when deali¡g rvittr tonnage measurements in shipping. These are weight and space
tonnages, u'ith the fomrer referring to cargo-carrying characteristics. The initìal weight measu¡ernent is tlelight displacement totlr.agq ri,hich is the weight of the slúp unloaded. The other is the loaded displacentent,u'hich is the u,eight of the ship when it is loaded to the designed draught with crerv, provisions and bunkers.Tl e difference between the tvro displacements is the weight carrf ing capacity or deadrveight tonnage (dn't)of the ship. When the weight of non-earning loads such as bunkers, stores, and water are deducted we getcargo deadweight tonnage (cdwt).Space tonnage is measu¡ed rn register ton of 2.83 cubic metres - 100 cubic feet. There are two types ofspace toffxage, which are gross register toffIage a¡rd net register torutage. Gross register tonnage is themeasurement of the enti¡e internal cubic space of the ship with the exception of a¡eas th,at a¡e integral partsof the ship's construction. Thus, the measu¡ement excludes only those spaces that, because of theconstruction of the ship, must at all times be used for the running of the ship. These spaces include thebridge, anchor box, and steering gear, - that is, spaces that cannot be used for cargo. Net register torurage isthe gross register tonnage less non-earning areas such as galley, crew quarters, stores, and engine room -that is, spaces that need not necessariJy, and for the life of the ship, be used for the same purposes.The register toruuìges are used to determixe marning scales and fees for registratiorq ports, pilots and canaltransits. The registered tonnages are important to the slúpowner because they affect the fees and chargespaid on a particulff trip. In the same vein, they are important to port authorities whose revenues depend onflrese fees. The shipper, on the other hand, is more interested in the carr¡'ing capacities measured in dwt andgr a i n and cu b i c capacifres (Abralnrnsson, I 9 80).
84

The use of indices such as number of ships, value of cargo, maximum draught, numbers
and size ofberths alone has also been rejected. Currency fluctuations and exchange rate
problems, for example, make the use of value of cargo problematic. The varying size of
ships also makes the use of number of ships alone unappealing. Using berth size has also
been criticised. Within the Port of Otago, New Zealand, for example, Port Chalmers is
placed ahead of Dunedin, although Dunedin receives and dispatches more shipping and
cargo than the former (Rimmer, 1966b). In a nutshell, the use of a single measurement for
comparing ports' performances is inappropriate, for a single criterion is subject to so
many anomalies. Fortunately, attempts to remedy this problem have been forthcoming.
The section that follows discusses some of these attempts.
Bird (1963), a prominent writer on the subject, combined two criteria - net registered
tonnage and value of cargo - to compare and classify the major seaports of the United
Kingdom (LIK) Usually, high-valued cargoes like jewellery, bullion and objets d'art
occupy little space and thus ports specialising in these type of cargo stand disadvantaged
when net registered tonnage of shipping is used. On the other hand, bulk cargoes with
their high net registered tonnage have very low value. Thus, the disadvantage of having
ships not fully loaded and therefore having a low net registered tonnage is countered by
adding the value of cargoes and vice versa. Taken separately, this compounding effect
would be lost. Consequently, Bird argued for, and adopted the use of these two criteria as
the best indices for inter-port comparisons. His recommendation, however, overlooked
other useful aspects of port statistics.
Carter (1962), by contrast, argued for a multi-criteria approach as the best way to
compare ports. Much more ambitious than Bird, he combined six different criteria;
namely, gross cargo tonnage, major commodity types, type of traffic, balance of traffìc
flow and variety of commerce. Variety of commerce is distinguishable into two
components: variety of cargo and value of foreign commodity. Table 2.1is a summary of
Carter's traffic characteristics as they applied to American ports in the 1960's.
85

Table 3.1
New York... . ..Chicago........Hamgton Roads.Duluth Supcrior.Pl¡iladelphia. . . .
Houton........Baltimore...,..New Orleans... .
San Fra¡ciæo...Toledo.........Pittsburgh.... . .
Detroit.........Los Angeles L.B,Beaumont. , ... .
Port Aurthur.. .
Bufialo.,.......lloston. . . . . , . . .
tsaton Rouge....Cleveland..... . .
Ifobile.........[.ake Charles.. . .
Two Harbors...Calcite.........Portiand, M.. .. .
Corpus Christi . .
Texas Cíty.....P<¡nland, O... . .
Scattle..........\shtahula..-...l{untington.. . . .
Tanrpa.... ... -.
Tosnagê(ooo.oool
Valuc olforefun
coñrnact¡anþl
I
¡(,
t;
Varictyof
coñrn¿f t¿-
I'ery High.{bove ÅvcrageVery HighBelorv..\verageVery HighVery HighVery Higl¡Very HighVery High.{bove .lverageBelow Average..\bove .{,verageVery High.{bove AverageBelow AverageAbove .{verageVery High.{bove ÂvengeAbove AvemgeVery High.\tnvq .{,ysrag¿Very LowVery LowBelow .{verage.\bove.{verage.\bove ÅverageVery Higlrl'er:, HighBqltrrv .{verage\ter¡r [-orv
'\bove Åverage\:cry LowVery Lorv
t5.t.772.67t.659. +55. 7
52.25r.550. 73ó.935.9JO. 727.t26.625 .72{.822.t20.9ts.9t7.ót7 .5t7.0I ó.0r5.9r5.8t5.5¡.1. 7lJ.7t.t.6l.l . It.¿. {¡ Lr)t r.09.O8.ó8..18.J8.2s.27.ît- .67.16.9ó.8ó.5ó.{ó.5.5.5.5.
I
ti4
5(,
.l27
Leadíngcommditt
Pe¡roleum Prod.Iron OreCoalI¡on OreCrude PetroleumPet¡oleum Prod.f ron OreCrude PetroleumPetroleum Prod.CølCoalCoalPetroleum Prod.Petroleum Prod.Petroleum Prod.Iron OrePetroleum Prod.Petroleum Prod.Iron Ore.{,luminum OrePetroleum Prod.Iron OreLimestoneCrude PetroleumPetroleum Prod.Petroleum Prod.Petroleum Prod,Petroleum Prod.Iron OreCoalPetroleum Prod,Iron OreCrude PetroleumCoalCoalCoalPetroleum Prod.Petroleum Prod.Iron OrePetroleum Prod.Petroleum Prod.SulphurSand & Gr¿velPetroleum Prod.CoalCrude PetroleumIron OrePetroleum Prod.\vood & Prod.Petroleum Prod.Petroleum Prod.Petroleum Prod.LimestoncIron OreIron OreLimestonePetroleum Prod.Petroleum Prod.Petrolcum Prod.
Petroleum Prod.
badin¿ttþ¿of
lrafia
CoastwiseLakewiscForeignLakewiseForeignCoastwiseForeignInternalCoastwíse[.akewiseInternalLakewis€CoastwiseCoastwiseCoastwiseLakewiseCoastwiseI nternalI-akewiseForeignCoastwiseI-akewiseLakewiseForeignCoastwiseCoastwiseCoastwiseCoastwiseLakewiseI n ternalCoastwiseLakervise
Balant¿of
iatr
Irnports æ-8O7oI¡nporrs æ-sOVoExports Over \O/eE¡pons Over 3O/¿Imporrs CÐ-$OVyExports Over \O/sImports (fr-aÙfloBalancedBalancedErpons Over *O/slnrports Qver 8O/¿Imports Over 80/¿BalancedE ports Over 8O/¿E ports Over 8O/qlmporrs Over BO/sImpons Over 8O/¿Erports @-\OVoIrnÞorrs Over 8O/sImports 60-8070Erports cfr-BOVoExports Over 8O/¿Erports Over 8O/¿Imports Over 8O/sExports Over SOVoExporrs Over BOToI mports 6O-80l¿I ¡npor(s (tO-\O/oImports Over SOVoErports Over SQleBalanccd
I20
It
5.05.04.9.1. J,1. J{. t4.t{.IJ.3
Below.:tverage\rery LorvBelow.{verageÅbove -\verageEelow -{vqr¿gsVery LowBçlorv.lverageBelorv.{verage.\bove ..\veraße\'ery Lorv-\bove .{verageVery LorvVery Lorv[ery LorrBelow -{vcrage-\bove --\verageBelow .{verageBelow .ì,vemgeBelow.\verage\:ery Lorv\¡ery LarvVery LowVery Lo*-.\brrve .\vcragc.\bove ÅveÉgeBelow .\vcmge
Below .{r'erage
CoastwiseLakewiseLakewiseInternalCoastwiseCoascwiseLakewiseCoastwiseInternalForeignCoastwiseCoastwiseLakewiseCoastwiseLakewiseInternalInternalCoastwiseInternalI nternalLakewiseLakeçise[.a&ewise[-aker¡ríseCoastwiseCoastwiseCoastwísc
Imports Ovcr SO/sExports Over 3O/6Intp.Jrts Over SOl¿Exports Over 8O7oImports Over BO/sImports Over 8O/sImports Over SO/slmporrs @-gOVoIrnporrs 60-g070BalancedExports Over g¡/sExports 60-8070Imports Over BOToBalancedExports Over SOVoE.rports Over 8O7oE:rpons æ-8070Balancedlnrports 6O-gOVoEalancedImDorts Over SOVoExports Over SOVoE*ports Over 8O/¿Expons Over SOVoErports Over 8O/¿lmports @-EOVIlmports æ-EO/oI¡nports Over 8O7o
tnrp<rrts Over EQ/o
Source: Carter. 1962
.1. ó
86
I n terna I
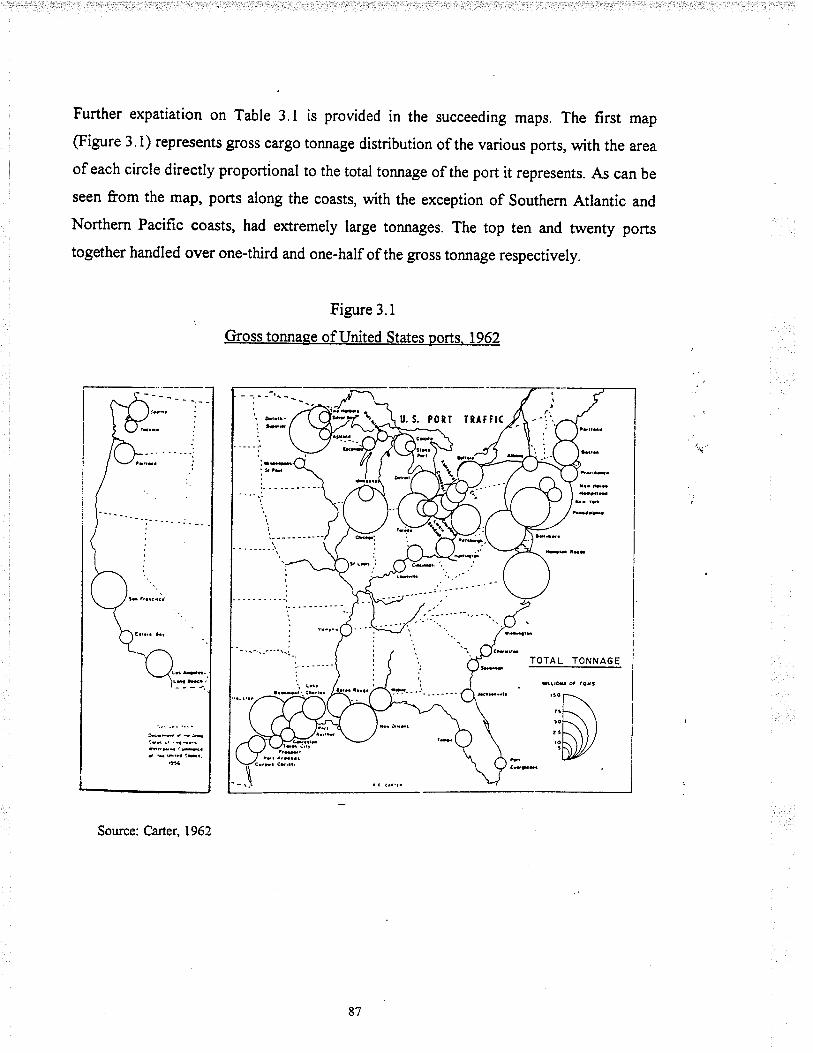
[É:
Further expatiation on Table 3.1 is provided in the succeeding maps. The first map
(Figure 3.1) represents gross cargo tonnage distribution of the various ports, with the area
of each circle directly proportional to the total tonnage of the port it represents. As can be
seen from the map, ports along the coasts, with the exception of Southern Atlantic and
Northern Pacific coasts, had extremely large tonnages. The top ten and twenty ports
together handled over one-third and one-half of the gross tonnage respectively.
Figure 3.1
Gross tonnase of United States ports. 1962
Source: Ca¡ter,1962
\,
P0tI ltrÍ ¡rc
*+?-år
6.'r{ 4-.J r- Gr.a a-r
8',7
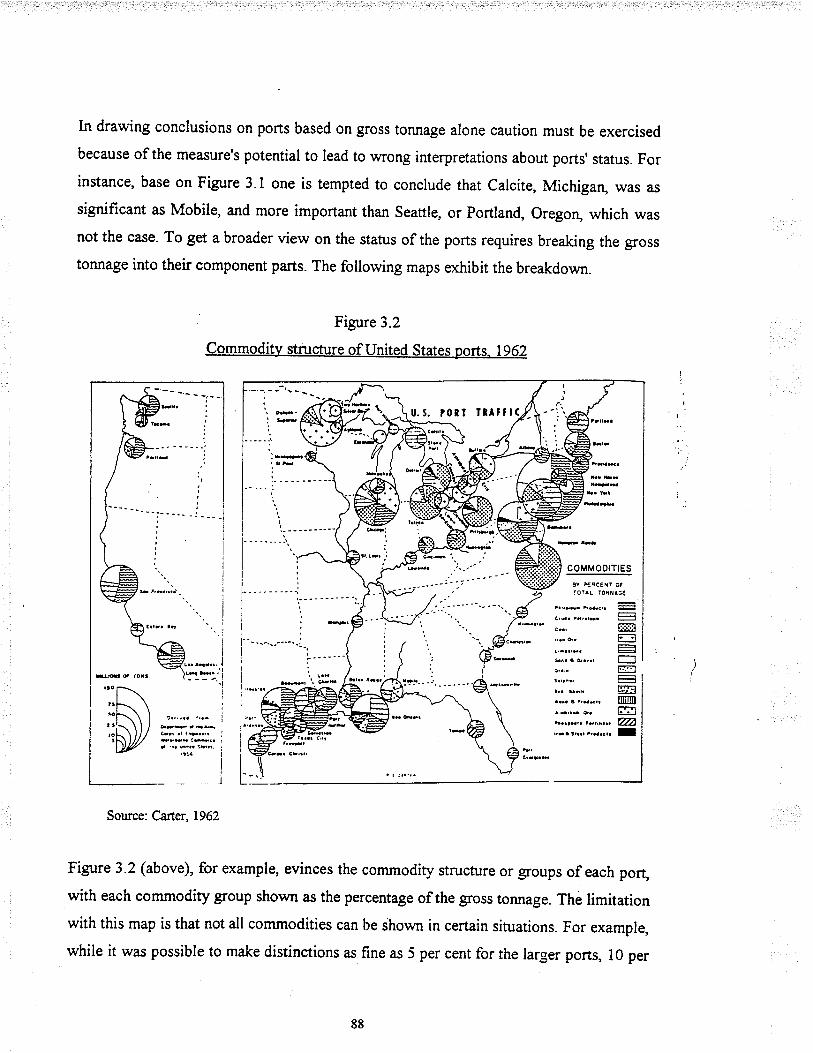
In drawing conclusions on ports based on gross tonnage alone caution must be exercised
because of the measure's potential to lead to wrong interpretations about ports'status. For
instance, base on Figure 3.1 one is tempted to conclude that Calcite, Michigan, was as
significant as Mobile, and more important than Seattle, or Portland, Oregorq which was
not the case. To get a broader view on the status ofthe ports requires breaking the gross
tonnage into their component parts. The following maps exhibit the breakdown.
Figure 3.2
Commodity structure ofUnited States ports. 1962
cævr-rì
e-È- aÊ..
Sou¡ce: Carter,l962
Figure 3.2 (above), for example, evinces the commodity structure or groups of each porg
with each commodþ group shown as the percentage of the gross tonnage. The limitation
with this map is that not all commodities can be ihown in certain situations. For example,
while it was possible to make distinctions as fine as 5 per cent for the larger ports, l0 per
88
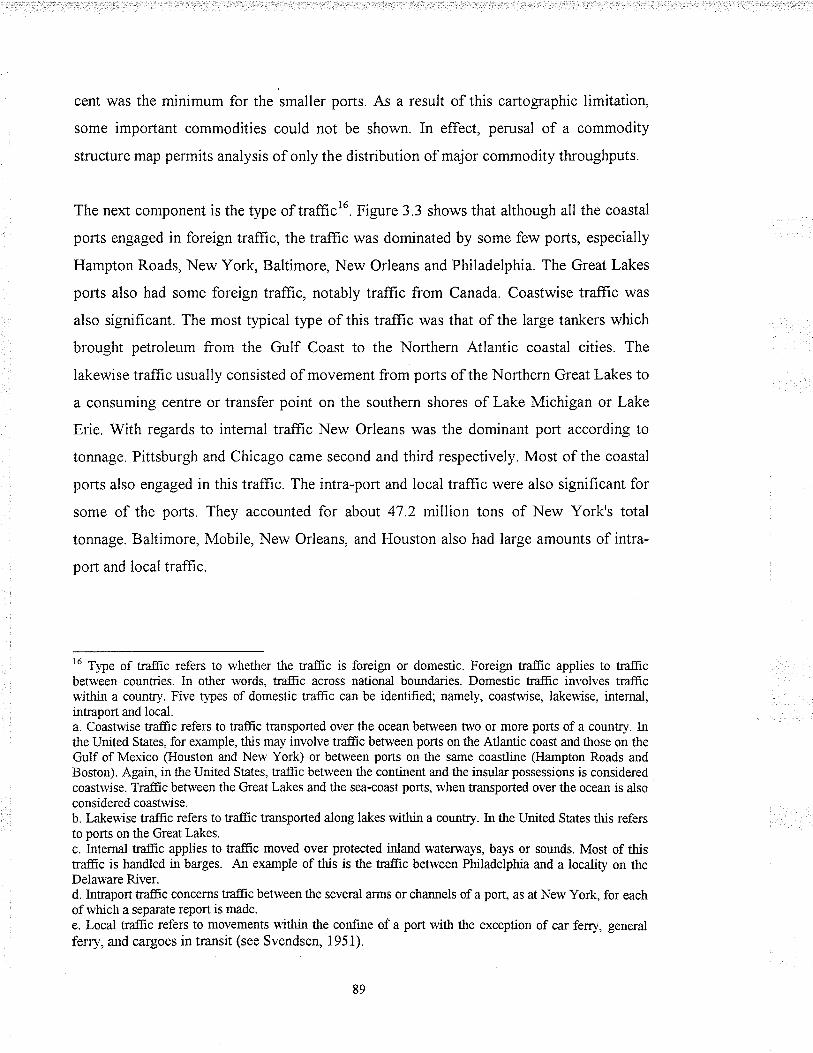
cent was the minimum for the smaller ports. As a result of this carrographic limitation,
some important commodities could not be shown. In effect, perusal of a commodity
structure map permits analysis of only the distribution of major commodity throughputs.
The next component is the type of traffrcr6. Figure 3.3 shows that although all the coastal
ports engaged in foreign traffrc, the traffrc was dominated by some few ports, especially
Hampton Roads, New York, Baltimore, New Orleans and Philadelphia. The Great Lakes
ports also had some foreign traffrc, notably traffrc from Canada. Coastwise traffrc was
also significant. The most typical type of this traffic was that of the large tankers which
brought petroleum from the Gulf Coast to the Northern Atlantic coastal cities. The
Iakewise traffrc usually consisted of movement from ports of the Northern Great Lakes to
a consuming centre or transfer point on the southern shores of Lake Michigan or Lake
Erie. With regards to internal traffic New Orleans was the dominant porl according to
tonnage. Pittsburgh and Chicago came second and third respectively. Most of the coastal
ports also engaged in this trafTic. The intra-port and local traffrc were also significant for
some of the pofts. They accounted for about 47.2 million tons of New York's total
tonnage. Baltimore, Mobile, New Orleans, and Houston also had large amounts of intra-
port and local traffic.
tu TW. of traf[rc refers to whether the traffc is foreign or domestic. Foreigrr traffic applies to traffcbetu'een countries. ln other rvords, traffrc across national boundaries. Domestic traffic involves trafficvyithin a country. Five qpes of domestic trafic can be identified; namely, coastwise, lakeu'ise, internal,intraport and local.a. Coastwise tra-ffic refers to traffc transported over the ocea¡ between hvo or more ports of a country. Inthe United States, for example, this may involve traffc betrveen ports on the Atlantjc coast and those on theGulf of Mexico (Houston and New York) or between ports on the same coastline (Harnpton Roads andBoston). Agar4 in the United States, traffic between the continent and the insula¡ possessions is consideredcoastrvise. Traffic between the Great Lakes and the sea-coast ports, rvhen f¿ursported over the ocean is alsoconsidered coastu'ise.b. Lakewise traffic refers to lraffc transported along lakes within a counbry. In the United States this ¡efersto ports on the Great Lakes.c. Internal traffic applies to ûaffic moved over protected inlald watenÀ,ays, bays or sounds. Most of thistraffic is handled in barges. An example of this is the traffic between Philadelphia and a locality on theDelawa¡e River.d. lntraport f¡ffic concerns traffic betrveen the several alms or charnels of a port, as at New York, for eachofrvhich a separate report is made.
e. Local tra.ffic refers to movements u"ithi¡ the confine of a port with the exception of car ferry, general
ferry', and cargoes in transit (see Svendsen, 1951).
89

Figure 3.3
Type of traffrc of United States ports. 1962
Sourcel Carter,1962
Another component of gross tonnage is the balance of traffic flow. This index relates to
traffic coming into a port and that moving out of the port. Desirably, a relative balance is
expected between a port's inbound and outbound traffrc so that judicious use would be
made of the port's facilities. However, this has not been the case at most ports. Figure 3.4
shows that about 35 of the 60 ports had over 80 per cent of their trafüc moving in one
di¡ection. Of these 35 ports, 20 were imports dominated and l5 exports dominated. Only
8 had a relatively balanced trafüc. Ports along the major raw material resource areas,
notably those of the Upper Crreat Lakes and the Texas Gulf Coast, are export-oriented as
against the import-oriented ports of the heavily manufacturing consuming centres of the
Lower Great Lakes and the Atlantic Coast.
ù-)ñþãÊr-<CÉ..d È ry.. tþr.r.
90

Figure 3.4
Balance of traffrc flow of United States ports. 1962
EALAHCE OF FLOW¡-- f
'trCl¡t Ct
ÎOÎ^L lOr¡¡C¿¡llqEat
'- '*t -tt -t@r¡Þ.rr æ --@
,-'- s4¡¡ rw @wortt@*, *-a@
Sou¡ce: Canq,1962
The cargo tonnage components discussed so far are traffic characteristics which reflect
bulk commodities. The next two components to be discussed, on the other hand, focused
on general cargo. Because general cargo cannot be compared fairly with bulk cargo interms of weight, two ty?es of measures were used for this traffic in an attempt tocounteract the bias associated with using weight; namely, the variety of commerce and
value of foreign co¡nmerce. In Figure 3.5, the ports have been divided into four
commodity classes or categories ranging from "very low" (less than25), "below average"
(25 to 100), "above average" (101 to 175) to "very high" (over 175) according to their
standard deviation Êom the mean. As the distribution shows, only the coastal ports fall
tua-qÞæa ùH-
il
9l
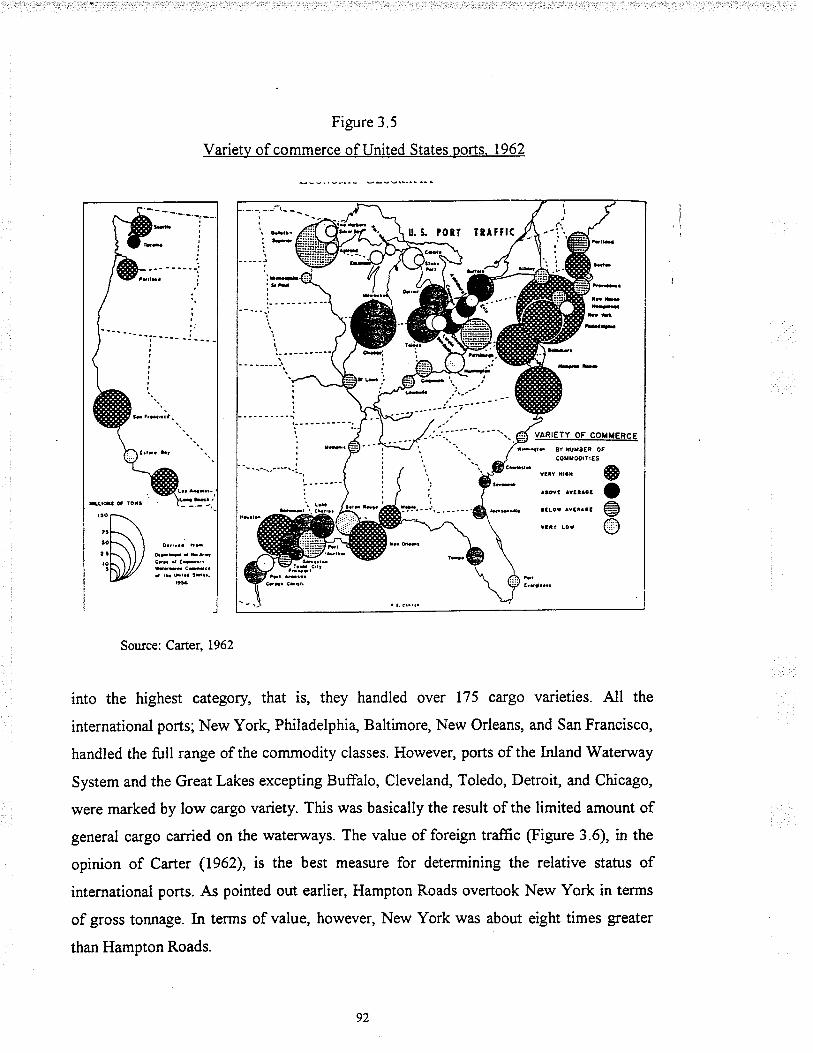
Figure 3.5
Variety of commerce of United States ports. 1962
ü. t ?0tÌ IIAÍil(
'. 13... þ'-'-'
VARIEIY OF COHMERCE
r-lr- 8Y rurÐE¡ otcoc¡orrEs
"*t- r.., ",.r @h-. ^r-. .ra.^". !
H¡ø,û. .a.ot ^"..^.a Svt¡r lor O
ùr- J -lìErãC-..d r¡. Èr.a t5.¡.
Source: Carter, 1962
into the highest category, that is, they handled over 175 caryo varieties. All the
international ports;New York, Philadelphi4 Baltimore, New Orleans, and San Francisco,
handled the full range of the commodity classes. However, ports of the Inland V/aterway
System and the Great Lakes excepting Buffalo, Cleveland, Toledo, Detroit, and Chicago,
were marked by low cargo variety. This was basically the result of the limited amount of
general cargo carried on the waterways. The value of foreign traffic (Figure 3.6), in the
opinion of Carter (1962), is the best measure for determining the relative status of
international ports. As pointed out earlier, Hampton Roads overtook New York in terms
of gross tonnage. In terms of value, however, New York was about eight times greater
than Hampton Roads.
92
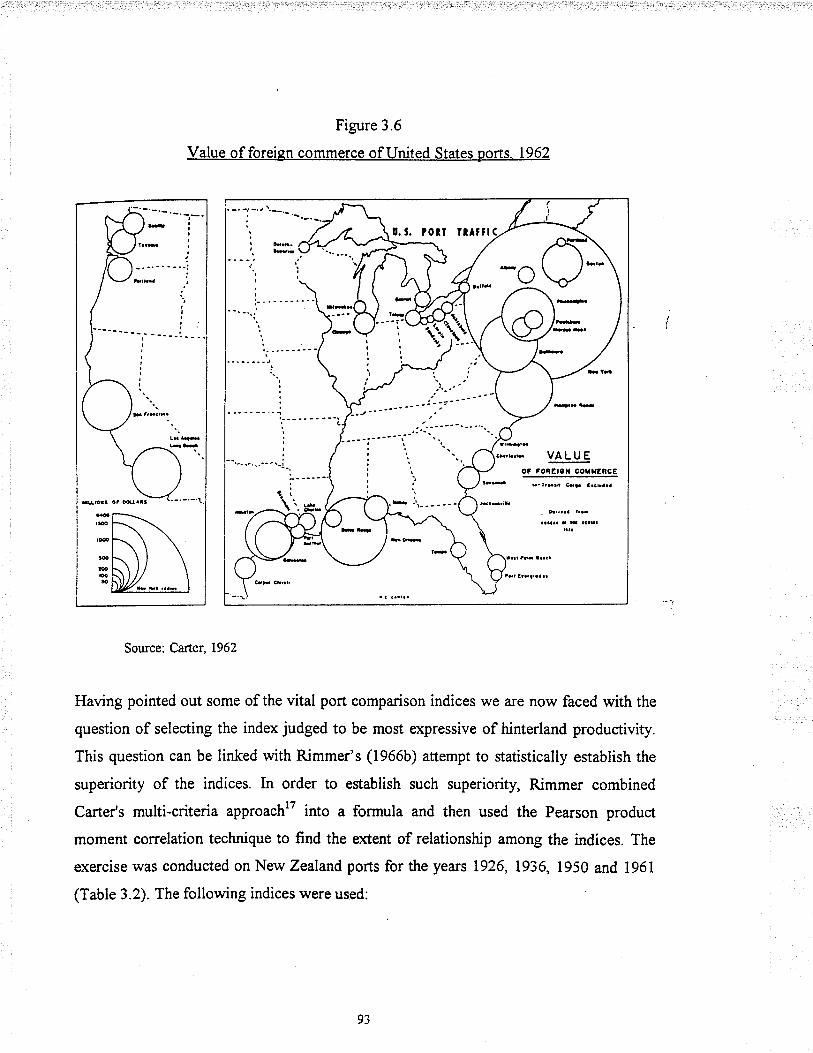
Figure 3.6
Value of foreign commerce of United States ports. 1962
rg
sÞ$
Sou¡ce: Caner, L962
Having pointed out some of the vital port comparison indices we are now faced with the
question of selecting the index judged to be most expressive of hinterland productivity.
This question can be linked with Rimmer's (1966b) attempt to statistically establish the
superiority of the indices. In order to establish such superiority, Rimmer combined
Carte/s multi-criteria approachrT into a formula and then used the Pearson product
moment correlation technique to find the extent of relationship among the indices. The
exercise was conducted on New Zealand ports for the years 1926. 1936, 1950 and 1961
(Table 3.2). The following indices were used:
ú.J. ?0rr rrlftl
YAS¿E
93
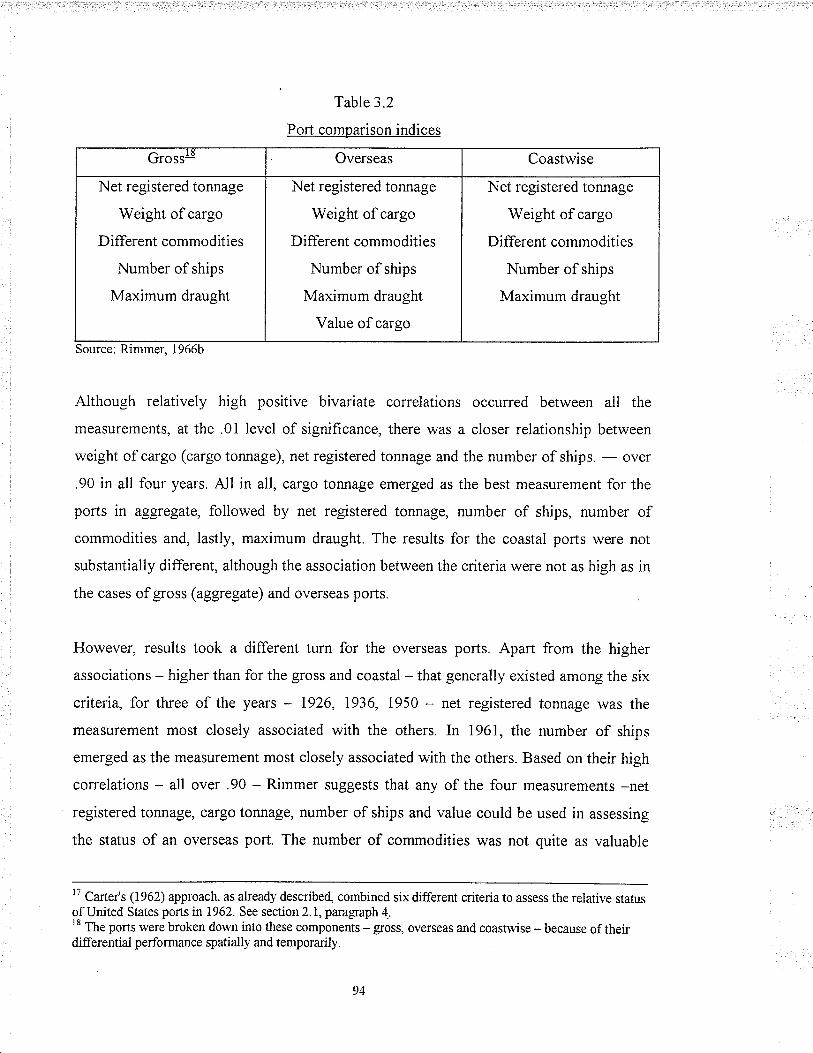
Table 3.2
Port comparison indices
Source: Rimmer, 1966b
Although relatively high positive bivariate correlations occurred between all the
measurements, at the .01 level of significance, there was a closer relationship between
weight of cargo (cargo tonnage), net registered torurage and the number of ships. - over
.90 in all four years. All in all, cargo tonnage emerged as the best measurement for the
ports in aggregate, followed by net registered tomage, number of ships, number of
commodities and, lastly, maximum draught. The results for the coastal ports were not
substantially different, although the association between the criteria were not as high as in
the cases ofgross (aggregate) and overseas ports.
However, results took a different turn for the overseas ports. Apart from the higher
associations - higher than for the gross and coastal - that generally existed among the six
criteria, for th¡ee of the years - 1926, 1936, 1950 - net registered tonnage was the
measurement most closely associated with the others. In 1961, the number of ships
emerged as the measurement most closely associated with the others. Based on their high
correlations - all over .90 - Rimmer suggests that any of the four measurements -netregistered tonnage, cargo tonnage, number of ships and value could be used in assessing
the status of an overseas port. The number of commodities \ilas not quite as valuable
r? Carter's (1962) approact¡ as already described, combined six different criteria to assess the relative stahrsof United Stâtes pofts tn 1962. See section 2.l,paragnph 4..rB The ports were broken doum into these components - gross, overseas and coastwise - because of theirdrfferential performance spatialll' and temporarily.
Grosss Overseas Coastwise
Net registered tonnage
Weight of cargo
Different commodities
Number of ships
Maximum draught
Net registered tonnage
Weight of cargo
Different commodities
Number of ships
Maximum draught
Value of cargo
Net registered tonnage
Weight of cargo
Different commodities
Number of ships
Maximum draught
94
(coeffìcient ranged between .80 - .90), while maximum draught was the least valuable
(coeffrcients ranged between .65 - .85). From the literature, however, it is evident that
cargo tonnage has been the most widely used index despite its deficiencies (see Rimmer,
7966a, Hoyle and Charlier, 1994).In the present study, for example, cargo tonnage has
the drawback of exaggerating Takoradi, which specialises in bulky cargoes. But as
Rimmer (1966a) points out, "tonnage is most expressive of the primary function of a port,
which is to transfer cargo between ships and the land, and vice versa". In conformity with
the weight of established practice, cargo tonnage is adopted as the most expressive
measure of hinterland in this study. Referring to Carter's (1962) approach, however, we
know that cargo (overall) tonnage can be broken down into different components, which
include the following:
a. Overall traffic
b. Variety of traffic
c. Container trafftc
d. Balance of traffrc
e. Leading commodity
Other indices to be analysed are the following port performance indicators:
a. Net registered tonnage of shipping Q.{T)
b. Ship calls - number of ships visiting each port (1.{S)
c. Ship turnround time (ST)
d. Labour productivitylCargo handling productivity (LP)
e. Berth occupancy ratio @O)
f Gang hours (GH)
g Ship produøivity (SP)
In effect, I adopt the multi-criteria approach suggested by Carter and Rimmer in this
study.
95

3.2 Method of analysis IAnalysis of these indices would be performed with the help of tables, graphs, maps
(cartographic techniques) and ordinary least square (OLS) regression. From these tables,
maps, and the regression analysis comparisons and relations between and among the
different variables would be madele. Further comment is needed on the regression
technique.
3.2.1 Regression analysis
The OLS regression is specified as:
OT,= ã-* a.tST, + a,LP,+ arBO,* aoNS,* arNT,-l auSP,+ drGH,*,,
where,
OTt = Overall tonnage
SZr: Ship turnround
LPt : Labour productivity
BOt: Berth occupancy
NSr: Number of ship calls
NTt: Net registered tonnage
SPr: Ship productivity
GH¡: Average gang hours
do: Constant
dt-dz: Parameters or coeffrcients
ut : F;norl disturbance term
t: 1.................T (number of years)
'n This fust part of the analysis is restricted to the two ports of Tema and Takoradi because of the absenceof required data on otlter African ports.
96
Before the regression is run, we will check for stationarity of the data because of the
time-series nature of the data. Removing trends or seasonality from the series can be done
using parametric or non-parametric techniques. In using the non-parametric technique the
first step involved is to perform a time plot; that is to say, plotting the observations
against time. This will often show up the most important properties of the series. If any
features such as trend, seasonality, or discontinuities, are present, the series would have
tobe differenced to remove these features.
Regarding the parametric technique the Phillips-Peron test (PP-test) (see Enders, 1995) is
used. The test is specified briefly as:
y,= a; + aiy,., + u,
_t \yr= a o+ cttl, - t* a,ll-%)+ *
where,
Z: number of observations and the disturbance term ¡rr is such that
Ew : 0, but there is no requirement that the disturbance term is serially
uncorrelated or homogeneous. The PP-test allows the disturbances to be weakly
dependent and homogeneously distributed.
The PP-test proceeds to characterise the distributions and derive test statistics that can be
used to test hypotheses about the coefficients a¡ and a¡ under the null hypothesis that the
data are generated by
and
))r=lr.r* w
Various statistical time-series software packages
statistics, and the SHAZAM version has been
effectiveness of the resultant regression analysis will
are available for deriving PP-test
made use of in this thesis. The
be inferred from the following:
97
a. Residual tests for autocorrelation, heteroscedasticity and normality
b. Multicollinearity test
c. Specification bias test
d. Hypothesis/inference testing using t-lesl, and F-lest.
3.3 Definition of terms
3.3. 1 Berth occupancy'o
Berth occupancy refers to the time period during which a vessel actually occupies a berth.
This period starts from actual arrival of a vessel at the berth to its actual departure from
the berth. The indicator reflects the utilisation of the berth capacity and therefore is useful
for governing decisions taken about investments in new berths, which, along with
dredging, is considered the highest financial burden for any port authority. To some
writers, "the output of the port is the output of its several berths" (Oram and Baker,
l97I.16) The berth occupancy ratio is calculated as follows.
Numberof hours of occupancy x 100
24 hoursx numberof berths
Illustration:
L The case ofconventional general cargo vessel.
Number of hours: 140 hours
Number of berths: l0 berths
Berth occupancy would be:
140 x 100= 58o/o
24x10
to Todd (1993:3) has described the primar¡'funcLion of a seaport as ensuring "the smooth üansfer ofcargoes from and to the sea (export and outgoilg coastal trades) or vice versa.........". "The berth is thepoint at which this ûznsfer takes place" (Oram and Baker, 1971).
Another variant of the berth indicator is berth throughput. This indicator is concemed with the achraltonnage loaded and discharged for a bertl¡ expressed per metre of available berthage and unit of time. Theberth throughput can be measu¡ed in terms of length of quay in metes or berth area (m2). Like berthoccupancy, additional information like commodities discharged and loaded is needed in order to a¡rive atthe correct interpretation of this index. WitI respect to container terminals the berth tluoughput is measuredin twenty-foot equivaleut u¡rits (IEÐ per metre and time.
98

2. The case of cellular container ship2r:
Number of hours of occupancy: 8
Number of berths:4
Berth occupancy would be:
8x100=t /%24x4
The interpretation of berth occupancy figures requires some caution. One limitation with
the berth occupancy ratio is that it cannot be defined for a port as a whole. Secondly,
berth occupancy figures are affected by a wide range of factors such as special berths and
related handling facilities and different kinds of commodities (bulk, break-bulk,
containers etc). What is more, average occupancy ratio for a whole period, say a week,
masks peak and low times of occupancy within the period. Attention should also be given
to whether the right vessel is served at the right berth, as a high rate of occupancy reduces
considerably this flexibility. The berth occupancy ratio described above, therefore, refers
to the gross rate. A break-down of the gross rate into the different components gives the
net berth occupancy rate. This is the real time of operation of a ship at the berth.
3.3.2 Ship turnround time
The ship turnround time consists of three components:
L Net working time of a ship. This is the actual time the ship is in operation.
2. Waiting time of a ship in a port: This time includes periods of non-operation on a ship
as a result of equipment breakdown, non-availability of cargo andlor labour, shift-
breaks, opening and closing of hatches, storms and rains, to mention a few.
3. Manoeuvring and clearance time: These are periods prior to and after operation, such
as to\¡/age, mooring, customs clearance and immigration.
Distinguishing and calculating these different components is very important during
negotiations between port operators and port users when discussing port performance.
t'Typicall¡r, a port revolving round a contai¡er terminal boasts a smaller number of berths than a port
catering largely to break-bulk cargoes.
99

3.3.3 Cargo-handling or labour productivity
Cargo-handling productivity is defined as tonnage handled - loadedidischarged - per
man/hour. When defined in terms of ganglhour, this indicator could be useful for a port's
operations department, especially in determining labour and equipment requirements for
incoming vessels. Cargo-handling productivity could also be calculated separately for
commodities and the different operational units.
3.4 Port performance, costs and traflic volume22
There is a close relationship between all the four indicators described above, the upshot
of problems associated with berthing capacity. The problem of berthing capacity emerges
as a result of the irregularities connected with the arrival and departure times of ships.
Three scenarios can be proposed as a solution to this problem. The first is ensuring a
hundred per cent berth occupancy at the expense ofcontinuous and very long queuing of
ships. The second would be to guarantee ships no more queues to get onto a berth, but
this would be achieved at the expense of very low berth occupancy rates. The third option
is to strike a balance between the first two options as the best way of reducing port costs.
There are two components of port cost; namely, fixed and variable cost. The frxed
component consists of capital costs incident to the installing and upkeep of quays, sheds
and cranes. This cost is independent of tonnage throughput. The variable cost, on the
other hand, is dependent on tonnage throughput and comprises costs such as labour and
staff, fuel, and maintenance. Fixed costs, when expressed as a cost per ton, have an
inverse relation with tonnage increase. That is to say, fixed costs per ton decrease with
increase in tonnage throughput. On the other hand, variable costs, when expressed as cost
per ton, normally remain fairly stable until the berth comes under intense pressure to
accept high tonnage throughputs, at which point the variable cost per ton begins to rise as
a result of working overtime and the introduction of more costly handling equipment and
methods (Figure 3.7a) As Figure 3.7a shows, the port cost curve (PC) - sum of frxed and
22 The emphasis on these indicators derives from their impact on port performarce and thus ultimately on aporl's hhterland. Tlese indicators, if not managed optimally, will increase port costs which are ultimatelyt¡ansfened to port users. However, increased port charges have the tendency of driving away port users,leading to loss of hi¡terland.
100
variable costs - reaches a minimum value when the rate of reduction in the fixed cost per
ton equals the rate of increase in the variable cost per ton, point A.
Next in consideration is cost of ship's time in port. Two aspects of this time is considered;
viz.,the time the ship spends at the berth - including time needed to proceed to and leave
the berth - and the time the ship spends waiting for a berth to become vacant. When
traffic through the port increases and port authorities come under pressure to increase the
berth's throughput, two options become available. The first is either to reduce the ship's
turnround time by improving cargo-handling rate by working overtime or improving
handling equipment and methods. This, of course, as noted, would be achieved at the
expense of ship waiting time for berth (Figure 3.7b).
101
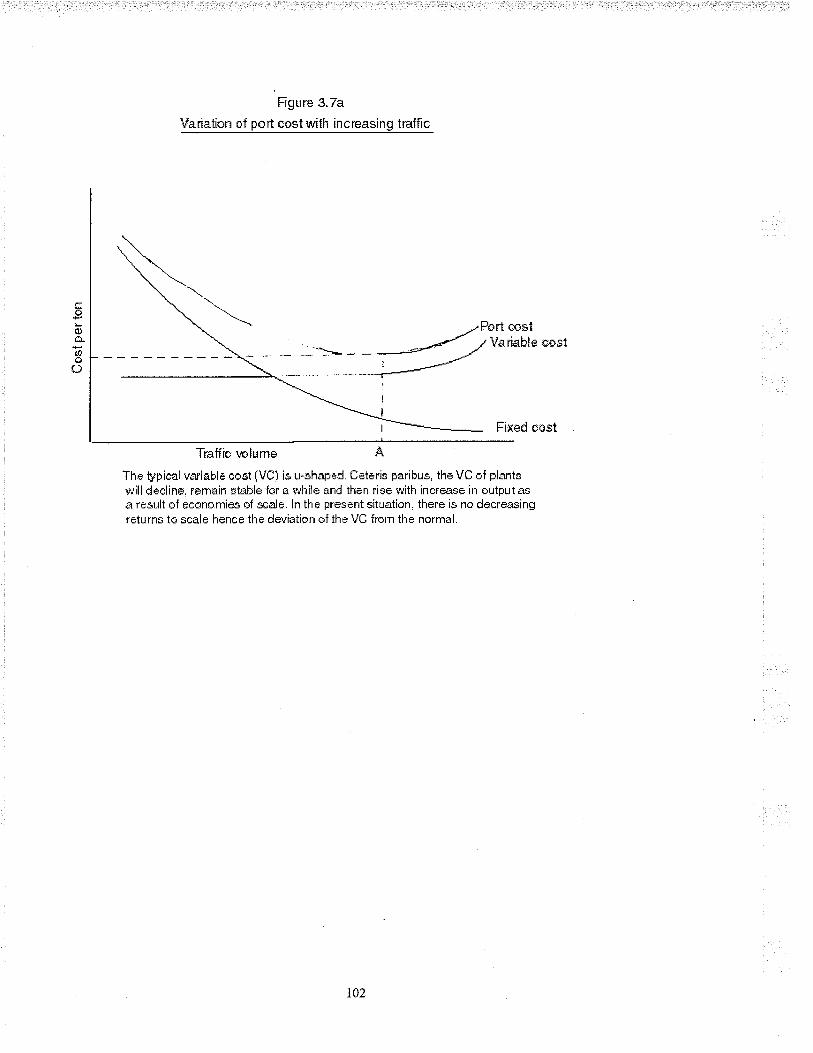
tro
t¡lÕ-
ano{)
Figure 3.7a
Vanation af port sost rr¡rth increasing trafäc
Psrt ÈostVanahle uest
Fixed eost
Traffic'¿olume A
Th¿ typiËal '.,ariabl¿ cust {Nú) is u-shap*d. teteris parihus, the Vü vf plantsr",'illdeclin¡. rerrrain stable f<'r a r,.'liile and then rise *,ith inerease irr outputr**a r¿sult of çconsmies qf scajç. ln the Fresent situatir¡n, lh*re i* no decreasing¡'eturns to scale lrçnce the deviatiçri ef th¿ VC fr,rm the nnrn¡al.
t02
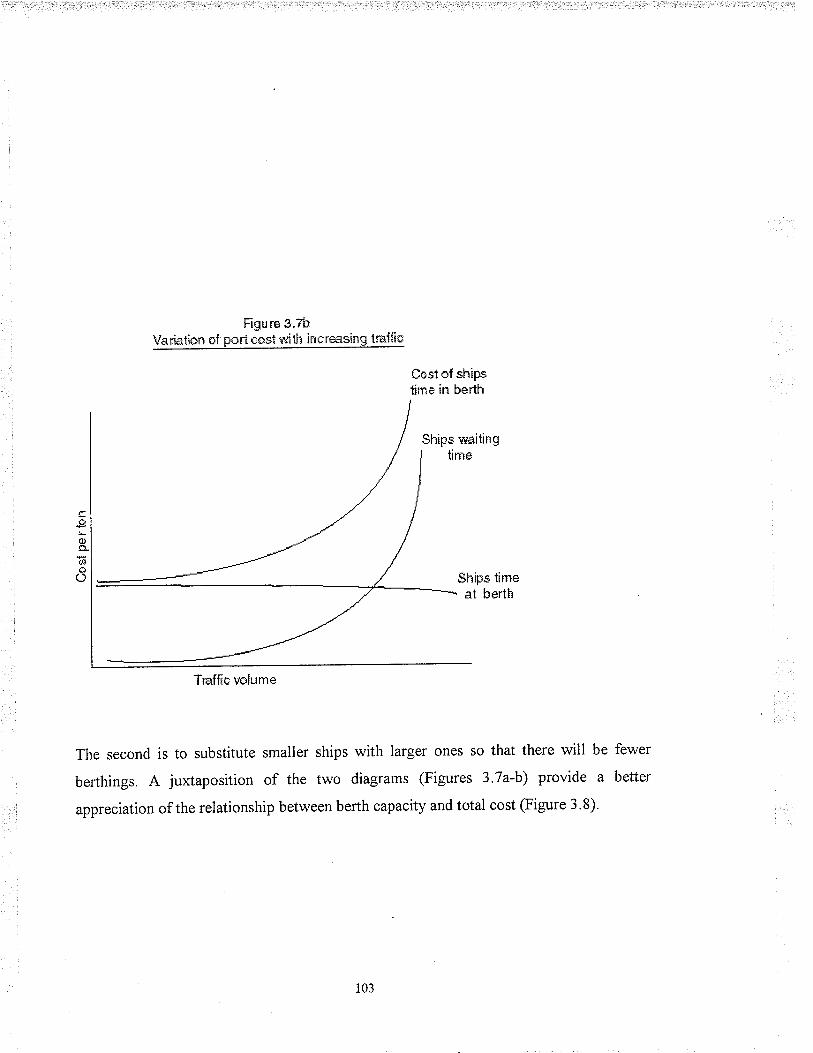
Fìgu re 3.7b\rar:iation c,f Fort cost r¡¡itl'l incressíng tråffic
Cùst Õf shifefime [n berth
Ships tínreal berth
The second is to substitute smaller ships with larger ones so that there will be fewer
berthings. A juxtaposition of the two diagrams (Figures 3.7a-b) provide a better
appreciation of the relationship between berth capacity and total cost (Figure 3.8).
Shlps vraiting
Traffic r'u[ume
103

tro
ü¡s.¿Ð
Õ(J
Figure 3.8
1./ariatic,n of total carrt [n pott urith increasing traffiu.
Total cc,-qf
in port
Cost of shipstínre in porl
Fort cost
Traffic çr¡lunre
Figure 3.8 reveals that total cost perton in port has a minimum point at B. However, this
minimum point - including the cost of ship's time - is achieved at a much lower
throughput than that leading to the minimum port cost (A). Thus in the attempt to reduce
port costs at the expense of shipowners, port authorities may risk increasing ship queues
and this outcome has the possibility of increasing port surcharge which is detrimental
both to the port and the wider national economy (l'{orwegian Shipping News, 1974).
104

3.5 Method of analysis If23
The second part of the analysis concerns the relative growth in the ports' traffic from
1983 to Igg324. The methodology to be used here is the shift-and-share technique.
3.5.1 The shift-and-share technique
In analysing the relative growth in the hinterlands of the ports using cargo tonnage as a
proxy the shift-and-share analysis lends itself to use as the most appropriate
methodology. The shift-and-share procedure is a technique for assessing differential
growth rates between two or more phenomena within a country or any refe¡ence area.
Employment has been the most widely used variable for monitoring change. Formally,
shift-and-share has been defined as "a technique for assessing the relative importance of
different components in regional employment growth or decline" (Hepple, 1990:554).
Two main components constitute the model; the regional 'share' and the total 'shift' .
The regional share is defined as the amount by which total employment in a region would
have grown or declined during the period under study if the region had grown or declined
at the same rate as the national rate. Algebraically, the regional share is written as;
RSj = (ZI'Bif /ZtE'j')] - tErj' (1)
tjtjiwhere,
{IE¡'i
RSj: share of region j ( =
tElj' : employment in all
i
7,2 ... ... ...n);
industries in regionT in period I (initial time period);
ZIE¡' : employment in all industries in all regions in period 1;
ü
t'Tfie application oftle shifr-and-share technique to the present study does not resort to all the variationsof the methodology; hence only the ñmdamentals of tlte'mainsûeam'methodologl,are explained.2a This section of tire analysis u"ill i¡clude other major ports i¡ Africa. Emphasisis on the period 1983-1993because this is the period for which data are available for all the ports.
105
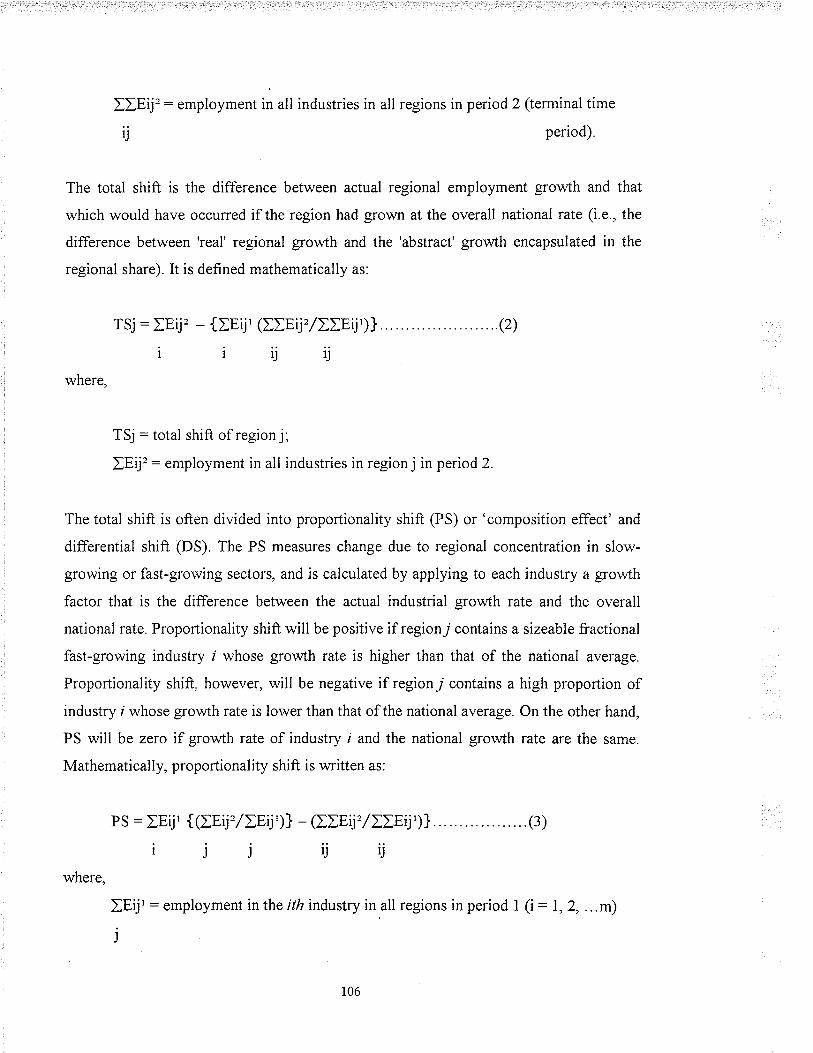
IIe¡': employment in all industries in all regions in period 2 (terminal time
period).
The total shift is the difference between actual regional employment growth and that
which would have occurred if the region had grown at the overall national rate (i.e., the
difference between 'real' regional growth and the 'abstract' growth encapsulated in the
regional share). It is defined mathematically as:
TSj : total shift of region j;
IErjt : employment in all industries in region j in period 2.
The total shift is often divided into proportionality shift (PS) or 'composition effect' and
differential shift (DS). The PS measures change due to regional concentration in slow-
growing or fast-growing sectors, and is calculated by applying to each industry a growth
factor that is the difference between the actual industrial growth rate and the overall
national rate. Proportionality shift will be positive if regionT contains a sizeable fractional
fast-growing industry I whose growth rate is higher than that of the national average.
Proportionality shift, however, will be negative if regionT contains a high proportion of
industry i whose growth rate is lower than that of the national average. On the other hand,
PS will be zero if growth rate of industry i and the national growth rate are the same.
Mathematically, proportionality shift is written as:
PS : IEü' {(Znt¡=¡2E'j')} - (I,I,YiylIIEij')} (3)
ijjtj'jwhere,
IErj' : employment in the ith industry in all regions in period I (i : 1, 2, ...m)
j
TSj : IEtj'i
106
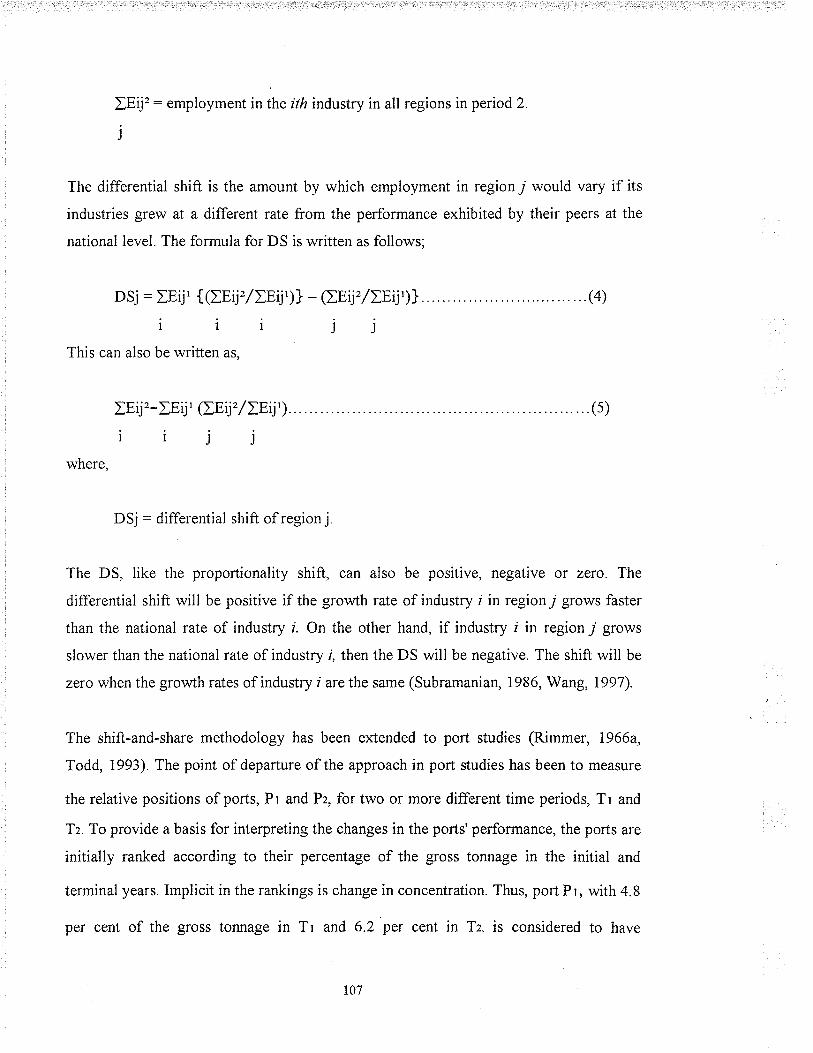
IEtjt : employment in the irh industry in all regions in period 2.
j
The differential shift is the amount by which employment in region 7 would vary if its
industries grew at a different ¡ate from the performance exhibited by their peers at the
national level. The formula for DS is written as follows;
DSj : IE'j' {øeij'/ZB1Ð]- - ã,Etf /ÐEij')} (4)
iiijjThis can also be wriffen as,
IEij'-tEij'(Zr¡'¡2E'j') . . (5)
iijjwhere,
DSj : differential shift of region j.
The DS, like the proportionality shift, can also be positive, negative or zero. The
differential shift will be positive if the growh rate of industry I in regionjr grows faster
than the national rate of industry l. On the other hand, if industry i in region j grows
slower than the national rate of industry l, then the DS will be negative. The shift will be
zero when the growth rates of industry i are the same (Subramanian, 1986, Wang, 1997).
The shift-and-share methodology has been extended to port studies (Rimmer, 1966a,
Todd, 1993) The point of departure of the approach in port studies has been to measure
the relative positions of ports, Pr and Pz, fortwo or more different time periods, Tr and
Tz. To provide a basis for interpreting the changes in the ports' performance, the ports are
initially ranked according to their percentage of the gross tonnage in the initial and
terminal years. Implicit in the rankings is change in concentration. Thus, port Pr, with 4.8
per cent of the gross tonnage in Tr and 6.2 per cent in Tz, is considered to have
t07

experienced an increase in concentration of 2.1 per cent. To make these changes in
concentration explicit, they are translated into absolute terms by calculating the
difference between the actual tomage of port Pr in time Tr and the hypothetical frgures
showing what the tonnage would have been if the port had grown at the national rate
between Tr and Tz. Ports which grew more than the national rate àÍe said to have 'gained',
while ports which grew less are said to have 'lost'. However, since this 'gain' or 'loss' is
measured against the national average it conceals the absolute gains or losses made by
ports. In other words, it is possible for a port to record a comparative gain when
compared with the national average and yet lose in absolute terrns and vice versa. The
difference between the actual and hypothetical tonnage is calculated as follows:
[1] Hp : Xp Ytt + Xtt
or,
[2] Hp - Xp Jt, / T)
[3] Yp - Hp : Comparative gain or loss
where,
Hp : Hypothetical tonnage of port
Xp : Tonnage of port in initial year
Yp : Tonnage of port in terminal year
Xrrr : Tonnage of national ports in initial year
Yru : Tonnage of national ports in terminal year
Tonnage of national ports in terminal year
Tonnage of national ports in initial year
Tn=
T_
108
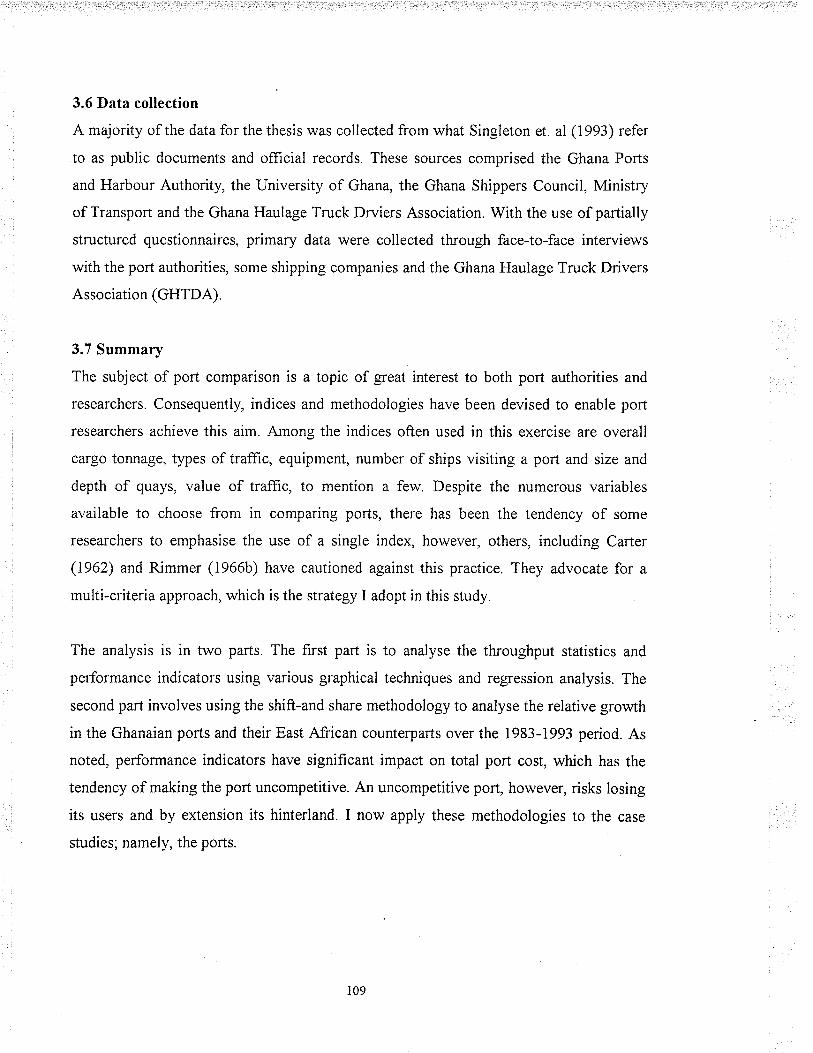
3.6 Data collection
A majority of the data forthethesis was collected from what Singleton et. al (1993) refer
to as public documents and offìcial records. These sources comprised the Ghana Ports
and Harbour Authority, the University of Ghana, the Ghana Shippers Council, Ministry
of Transport and the Ghana Haulage Truck Drviers Association With the use of partially
structured questionnaires, primary data were collected through face-to-face interviews
with the port authorities, some shipping companies and the Ghana Haulage Truck Drivers
Association (GHTDA)
3.7 Summary
The subject of port comparison is a topic of great interest to both port authorities and
researchers. Consequently, indices and methodologies have been devised to enable port
researchers achieve this aim. Among the indices often used in this exercise are overall
cargo tonnage, types of trafftc, equipment, number of ships visiting a port and size and
depth of quays, value of traffic, to mention a few. Despite the numerous variables
available to choose from in comparing ports, there has been the tendency of some
researchers to emphasise the use of a single index, however, others, including Carter
(1962) and Rimmer (1966b) have cautioned against this practice. They advocate for a
multi-criteria approach, which is the strategy I adopt in this study.
The analysis is in two parts. The first part is to analyse the throughput statistics and
performance indicators using various graphical techniques and regression analysis. The
second part involves using the shift-and share methodology to analyse the relative growth
in the Ghanaian ports and their East African counterparts over the 1983-1993 period. As
noted, performance indicators have significant impact on total port cost, which has the
tendency of making the port uncompetitive. An uncompetitive port, however, risks losing
its users and by extension its hinterland. I now apply these methodologies to the case
studies; namely, the ports.
109
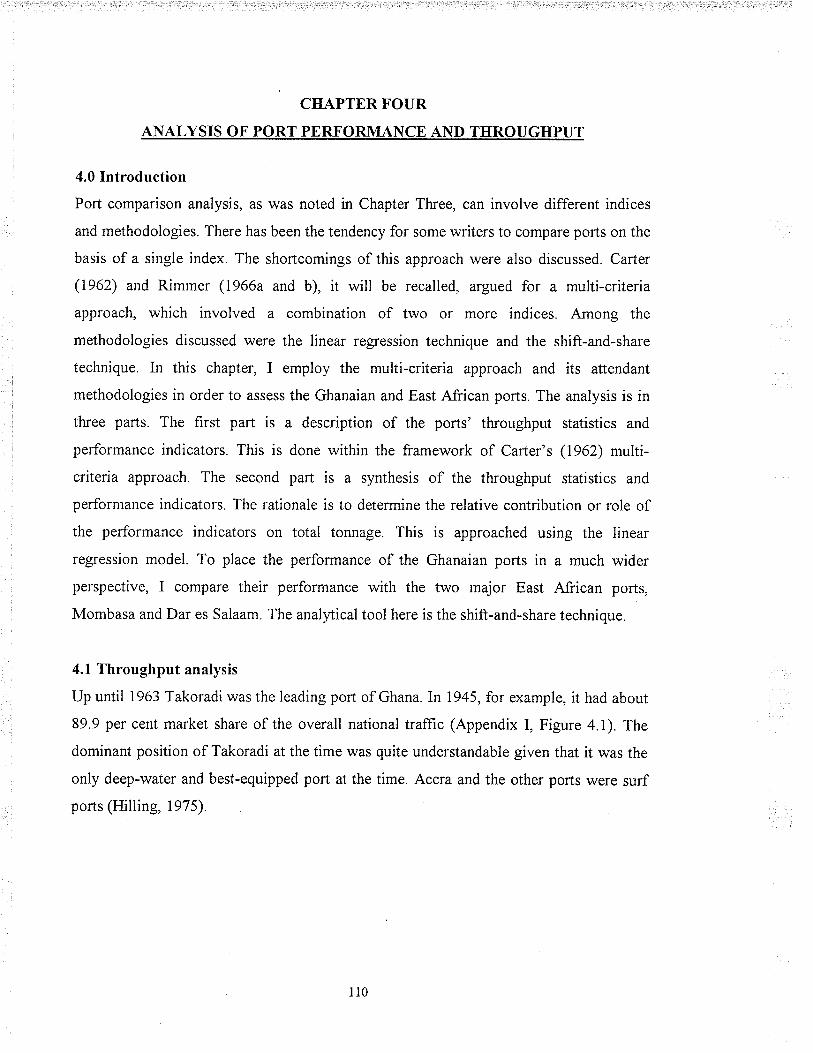
CHAPTER FOUR
ANALYSIS OF PORT PERFORMANCE AND THROUGHPUT
4.0 Introduction
Port comparison analysis, as was noted in Chapter Three, can involve different indices
and methodologies. There has been the tendency for some writers to compare ports on the
basis of a single index. The shortcomings of this approach were also discussed. Carter
(1962) and Rimmer (1966a and b), it will be recalled, argued for a multi-criteria
approach, which involved a combination of two or more indices. Among the
methodologies discussed were the linear regression technique and the shift-and-share
technique. In this chapter, I employ the multi-criteria approach and its attendant
methodologies in order to assess the Ghanaian and East African ports. The analysis is in
three parts. The first part is a description of the ports' throughput statistics and
performance indicators. This is done within the framework of Carter's (1962) multi-
criteria approach. The second part is a synthesis of the throughput statistics and
performance indicators. The rationale is to determine the relative contribution or role of
the performance indicators on total tonnage. This is approached using the linear
regression model. To place the performance of the Ghanaian ports in a much wider
perspective, I compare their performance with the two major East African ports,
Mombasa and Dar es Salaam. The analytical tool here is the shift-and-share technique.
4.1 Throughput analysis
Up until 1963 Takoradi was the leading port of Ghana. In 1945, for example, it had about
89.9 per cent market share of the overall national traflic (Appendix I, Figure 4.1). The
dominant position of Takoradi at the time was quite understandable given that it was the
only deep-water and best-equipped port at the time. Accra and the other ports were surf
ports (Hilling,1975).
ll0

Figure 4.1
Market shares of overall traffic of Ghanaian ports,1945-1967
1945 1948 1951 1954 1957 1960 1963 1966-Takoradl
.TemaAccraOtherYear
A closer examination of the statistics (Appendix I and Figure 4.1) reveals that Takoradi's
share of the market dwindled through the years, though it continued to have the largest
market share until 1964. Takoradi's lost portion seemed to have gone to Accra, which
increased its market share from 70.2 per cent in 1945 to 22.7 in 1960. The other ports
also increased their market shares but their gains were not as significant as Accra's,
making Accra the overall winner within the period of 1945-1960 The biggest blow to
Takoradi's operation occurred with the emergence of Tema. The other dramatic impact
Tema had on the Ghanaian port system was that it eliminated Accra and the other surf
ports, leaving the Ghanaian port system to consist of the two deep-water ports - Takoradi
and Tema (see Hilling, 1977). Beginning in 7964, just two years after coming into
operation, Tema took over the overall traffjc lead from Takoradi. In 1965, for example,
Takoradi had only 34.3 per cent market share of the overall traffìc as against Tema's 65.7
per cent (Appendix I).
8o60o)ñc840Lc)o-
Source: Prepared ûom Hilting. 1970b
111

Let us now examine what Hilling (1977) has referred to as the consolidation period, that
is, the period within which Takoradi and Tema consolidated their positions and became
the only t\¡/o ports of the country. Though the consolidation period dates back to 1963
our analysis focuses on the 1980-1997 period, as this is the period for which data is
available for both ports. Table 4.1 shows Tema's overwhelming market share of the
overall trafftc from 1980-1997.\n 1982 Tema had as much as 82 per cent of the market
share while Takoradi had only 18 per cent. Tema's lowest share was 63.9 per cent and
this was in 1994. Tema's leading position notwithstanding, its market share continued to
dwindle vis-à-vis that of Takoradi, especially during the 1983-1994 period.Figure 4.2
provides a quick appreciation of Table 4. t
Table 4.1
Overall traffic concentration at Ghanaian ports. 1980-1997
Sou¡ce: Calculated from Appendi"r II
Year
Market shares (o%)
Tema Takoradi
r980 '7',7.1 22.9
1981 81.0 19.0
1982 82.0 i8.0
r 983 77.7 22.3
I 984 73.2 26.8
I 985 72.5 27.5
1986 80.7 19.3
t98',7 69.5 30.5
l 988 6',7.9 32.1
1989 68.9 31.1
1990 69.0 31.0
199 t 69.0 31.0
1992 68.4 31.6
1993 66.0 34.0
r994 63.9 36.1
1995 71.3 28.7
t996 73.t 26.9
1997 '70.6 29.4
tt2

Figure 4.2
Market shares of overall traffic of Takoradi and Tema,
1980-1997
\oo\
()b0Ë0.)()¡<o
100
90
80
70
60
50
40
30
20
t0
n
1980 1982 1984 1986 1988 1990 1992 1994 1996
Year
Takoradi
Tema
t ..'t tr a \.ì t:?t¡ri
Source: Prepared from Appendix III
From Figure 4.2 we notice a wide gap between the two ports from 1980 - 1983, after
which there was a gradual convergence - with the exception of 1986 - until 1994 Tema,
however, started picking up again from 1995, as the open end of the figure shows. As
already mentioned, gross tonnage figures conceal a lot of information and therefore do
not provide a full appreciation of a port. For a broader and a more meaningful analysis ofthe ports we ought to break down the gross tonnage statistics into their respective
components. One such component is the variety or type of traffîc.
ll3

4.2 Yariety of traffic
The various types of goods passing through Takoradi and Tema differ significantly.
Table 4.2 shows the throughput of the ports by type of goods in 1996.
Source: Compiled fro¡n GPHA-Cargo Throughput Dan
A:Percentage of national share (tt"affic), B:percentage of port,s share (traff¡d
Table 4.2 reveals the traffic handling specialisation of both Takoradi and Tema. WhilstTema handled all the aluminium and iron/steel, Takoradi handled 99.9 per cent of the
national forest products traffic, which mainly comprised exports. For Tema thisrepresented 0.04 per cent of its total traffic and for Takoradi 8.2 per cent. In terms ofbagged and general cargo Tema's share of the national traffrc was about 84.2 and g21
per cent as opposed to Takoradi's 15.8 and 77.3 per cent. At the individual port level
bagged and general cargo represented 18.4 and 5.5 per cent of Tema's overall trafficwhilst they made up 5.3 and 3.1 per cent of Takoradi's overall trafTic. With respect tobulk cargo Tema handled about 70.7 per cent of the national traffic, which represented 3lper cent of its overall trafftc. Takoradi's share of the national bulk cargo was 29.3 per
cent; however, this represented about 41.4 per cent of its total traffic. Furthermore, Tema
seems to handle the lion's share (88.40/") of the national liquid bulk traffic with Takoradi
handling the residual Dry bulk constitutes Takoradi's second major traffic after forest
Table 4.2an I
Type ofgood
BABA
Percentage sharesTema Takoradi
Bulk cargo:Liquid bulkDry bulk
General cargoContainersBagged cargo
Iron/SteelA-luminiumForest products
70.7 31.0 29.3 41.488 4 32.3 11.6 11.553.0 29 7 47.0 7T.4
82.7 5.5 17 .3 3.182.6 10.5 t7.4 10.584.2 18.4 15.8 5.3
i00.0 1.4 0 0100.0 2.3 0 0
0.1 0.04 99.9 8.2
l14

products. It had 47 per cent of the national dry bulk traffic but this constituted 77.4 per
cent of its total traffic. This reveals the importance of the dry bulk -
which consists
mainly of manganese and bauxite -
to Takoradi's traflic. While Tema's share of the
national dry bulk traffic was 53 per cent, this represented2g.T per cent of the port's total
traffrc. In terms of containerisation, Tema is ahead of Takoradi, enjoying 82.6 per cent of
the market share against Takoradi's 77.4. However, it is interesting to note that for both
ports containerisation represented just 10.5 per cent of their respective total traffrc, an
indication that both ports are way behind in the container revolution.
4.2.1 Container traffic
Table 4.3 shows the container traffic for Takoradi and Tema from 1991 to 1997 -
Table 4.3Container traffic at Takoradi and Tema rrsul. 1991-1997
Year
Takoradi Tema
Imports Exports Import Export
Market shares
Takoradi Tema
1991
1992
1993
1994
1 995
1996
r997
20,670 46,782 397,663 103,904
24,408 38,315 447,87I 152,625
26,279 48,938 446,969 183,548
3I,921 86,512 405,640 199,033
33,525 133,972 514,900 221,744
37,076 751,759 625,353 272,797
68,786 776,074 707,945 292,592
I 1.8 88.2
9.5 90.s
11.4 88.6
t6.6 83.4
18.5 81.5
t7.4 82.6
19.8 80.2
Source: MIS. Tema
Table 4.3 reveals Tema's dominating position of the container trafflc in the Ghanaian
port system. Its market shares of the 1991 and 1997 container traflic were 88.2 and 80.2
per cent as against Takoradi's 11.8 and 19.8 per cent. When it comes to rate of growth,
on the other hand, Takoradi is in the lead, for its container traffrc grew by 8 per cent
while Tema's decreased by 8 per cent between 1991-1997. Tema's lead in the container
traffic is bolstered by the use of the port for transhipment of containers to other West
African countries. In 1996, for exampl e, 145 TEUs comprising 5 I x 20-foot and 47 x 40-
1t5

foot containers weretranshipped via Tema. Ln7997, this traffic increased to 1,145 TEUs,
and consisted of 781 x 2O-foot and 317 x 4O-foot containers. Major items involved were
general merchandise, used clothing and vehicles. Major destinations v/ere Lagos in
Nigeria, Lome in Togo and Douala in Cameroon. What is more, Tema's export traffrc is
relatively more diversified than that of Takoradi. Whilst Takoradi export base consists
mainly of traditional bulky products like minerals and logs, Tema's exports are shifting
more towards non-traditional lightweight products like fruits, cassava chips and fish,
which are not only container friendly" but also container necessary. In other words,
Tema has more need for reefer containers than Takoradi. In 1997, Tema's reefer
container traffic was by 40 per cent higher than its 1996 performance. The 4O-foot
container dominates this trafÏic. The leading commodities involved here were frozen fìsh
(55%), pineapples (25%) and bananas Qa%).
4.3 Balance of traflic
Like most other ports in the region, the traffic flow of the Ghanaian ports is characterised
by extreme imbalance between imports and exports. Both ports, since their inception,
have concentrated on one aspect of traffrc, with Takoradi concentrating on exports and
Tema on imports. The exporl traffic of Takoradi constitutes about 57.7 per cent of its
overall traffrc. In the case of Tema this amounts to only 12.2 per cent of its overall traffrc.
Thus, in a sense, Takoradi is relatively more balanced in its trade than Tema. Let us
concentrate on import traffic alone for now. Appendix III evinces the overall import
traffic of the ports from 1945 to 1967. The statistics show the dominant position ofTakoradi in the import trade from 1945 until i963 when Tema took over. It ought to be
pointed out, however, that before Tema's take-over, Takoradi had begun losing ground to
the surf ports. Accra, for example, was making respectable strides until its demise was
caused by the emergence of Tema. Tema began to make great strides from 1963. From a
modest market share of 7.8 per cent in 1961 it increased its share of the importtraffic to
80 and 86.1 per cent in 1965 and 1967 respectively. The gap between Takoradi and
Tema, however, became pronounced during the consolidation period (Figure 4.3).
2s By container friendly I am referring to cargoes that lend themselves easily to container use like cocoa,ba¡a¡ns and pineapples. Container necessary I refer to cargoes whose shipment in containers can beconsidered mandatorl, due to tlei¡ rahre. for example, fruits and vegetables.
ll6
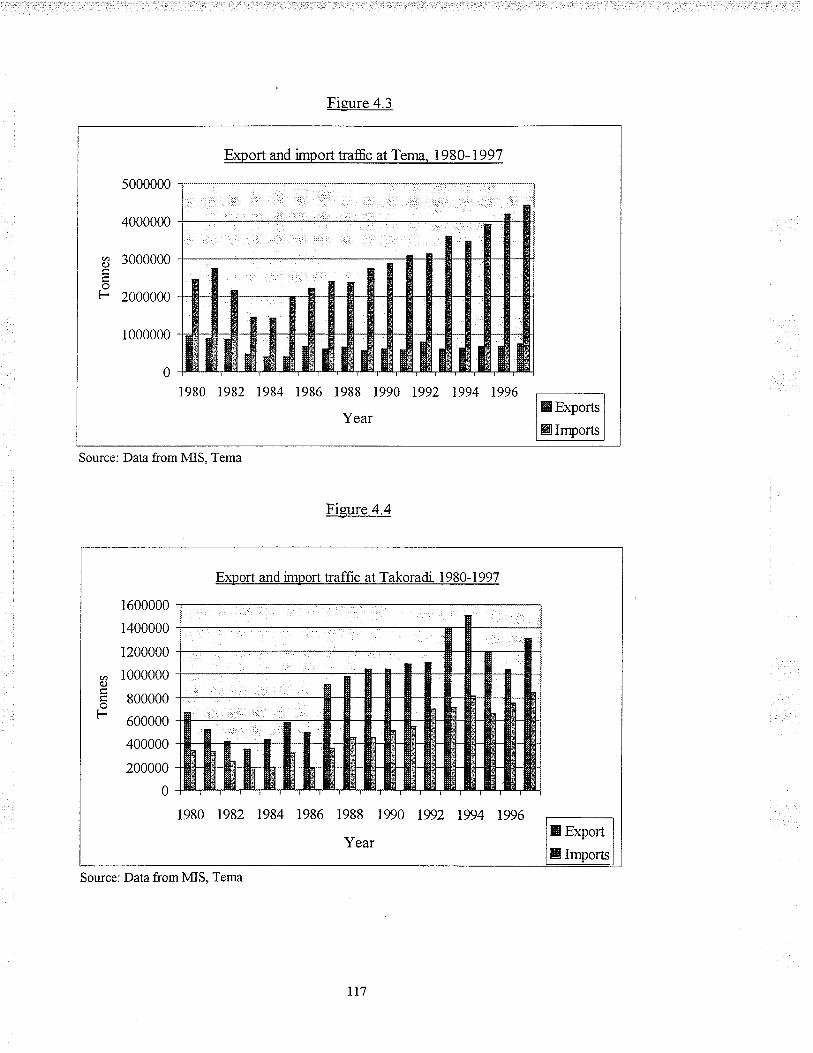
Figure 4.3
Fig'tre 4.4
Export æd importtraffc at Tema, 1980-1997
Ø0)
F
5000000
4000000
3000000
2000000
r000000
0
1980 1982 1984 1986 1988 1990 1992 t994 1996
Year
Source: Data frorn MIS, Tema
Export and import traffic at Takoradl 1980-1997
(nc)
F
1600000
1400000
1200000
1000000
800000
600000
400000
200000
0
1980 1982 t984 1986 1988 1990 t992 1994 1996
YearE Export
E Imports
Source: Data from MIS, Tema
t17

Figure 4.5
Overall import traffic of Takoradi and Tema,
U)q)L
ot-
5000000
4500000
4000000
3500000
3000000
2500000
2000000
1 500000
1 000000
500000
0
1979 1981 1983 1985 1987 1989 1991 1993 1995 1997
Year
1980-1997(Mr)
-TakoradiSource: Data from MIS, Tema
Figure 4.5 shows the widening gap between Takoradi's import trade and that of Tema
especially from 1985. Looking at the gross volumes alone without further analysis is
rather deceptive, however, as it conceals the modest gains Takoradi made over Tema in
this trade. For example, when we subtract their market shares of 1980 from that of 1997,
'\¡/e see that Takoradi improved its import trade by 3.625 per cent whilst Tema's
decreased by the same margin. However simplistic the methodology may look, it still
gives an indication of which of the ports perfbrmed better within the period with regards
to import trade. Figure 4.6 shows the market shares for Takoradi and Tema from 1980-
1997.
118

Figure 4.6
Market shares of import traffic of Takoradi and Tema,1 980-1 997
soC')ocooLo
o_
100
90
80
70
60
50
40
30
20
10
0
1980 1982 t984 1986 1988 1990 1992 1994 1996
Years-Takoradi
Tema
Source: Data from MIS. Tema
Now lets look at the import structure of the two ports. The five top imports through Tema
are clinker (23 4%) for the cement factory, crude oil (22.5 Yo) for the Tema Oil Refinery,
containerised -general
cargo - (14.9 %o), petroleum products (10.2 o/o) and alumina (6. 1
%o) for Valco, (see Figure 4.7). Together, these few items - out of a total of 32 -constitute 77.1 per cent of the overall import traffic through Tema.
ll9
Maior imports through Tema, 1996
Alumina60/o
General cargo15%
Clinker23%
Source: Prepared from Ghana Shippers Council, 1996
Figure 4.7
In the case of Takoradi the top five imports - out of a total of 16 commodities - consist
of clinker (69.8 per cent), wheat (5.5 per cent), container -general cargo (4.9 per cent)
and chemicals (3.9 per cent). Togetherthese constitute 92.8 per cent of the overall import
traffic of Takoradi (Figure 4 8). Comparing the leading imports of the ports - Takoradi
(69.8 per cent) and Tema (23.4 per cent) - gives us a glimpse of the specialisation level
of Takoradi.
r20

Fieure 4.8
With respect to exports Takoradi's position is outstanding. In 1959, for example, it had
almost 94 per cent of the entire export trade (Appendix IV). Tema, however, has been
challenging this dominance; a challenge which vüas most telling in the 1980's (Figure
4.9). Between 1980-1983, for example, Tema's market share of the export market traffrc
of 59, 63 and 57 per cent surpassed that of Takoradi (Figure 4.10). Takoradi resumed its
Ieadership from 1987. Figure 4.10 shows the market shares of the export traffic of the
two ports.
Maior imports through Takoradi, 1996
General chemicars
Sou¡ce: Prepared from Gha¡n Slúppers Council, 1996
T2T
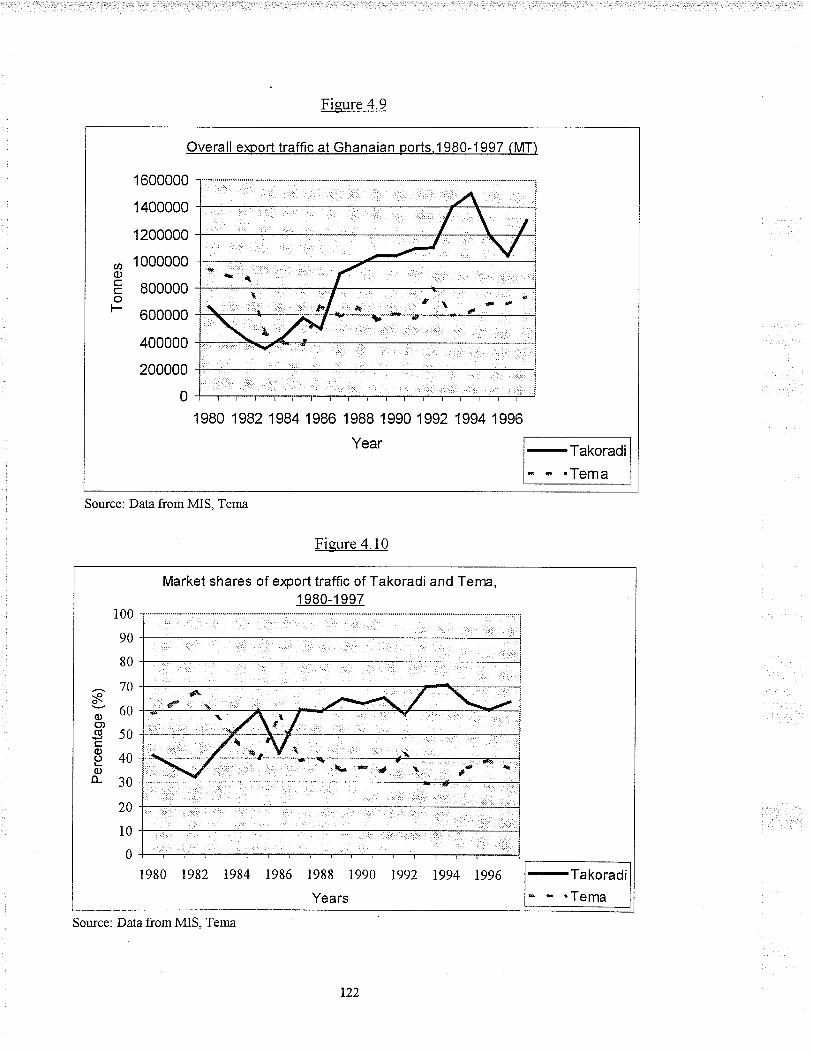
Figure 4.9
Source: Data from MIS, Terna
Figure 4. l0
Overall e>oort traffic at Ghanaian ports.1 980-1 997 (MT)
ØocLoF
1600000
1400000
1200000
1 000000
800000
600000
400000
200000
0
Year
-Takoradi"Tema
1980 1982 1984 1986 1988 1990 1992 1994 1996
1 980-1 997Market shares of erport traffic of Takoradi and Terna,
sq)o,oq)(JLoo-
100
90
80
70
60
50
40
30
20
t0
0
1980 1982 1984 1986 1988 1990 1992 1994 t996
Years -Takoradi.Tema
Sou¡ce: Data from MIS, Tema
122
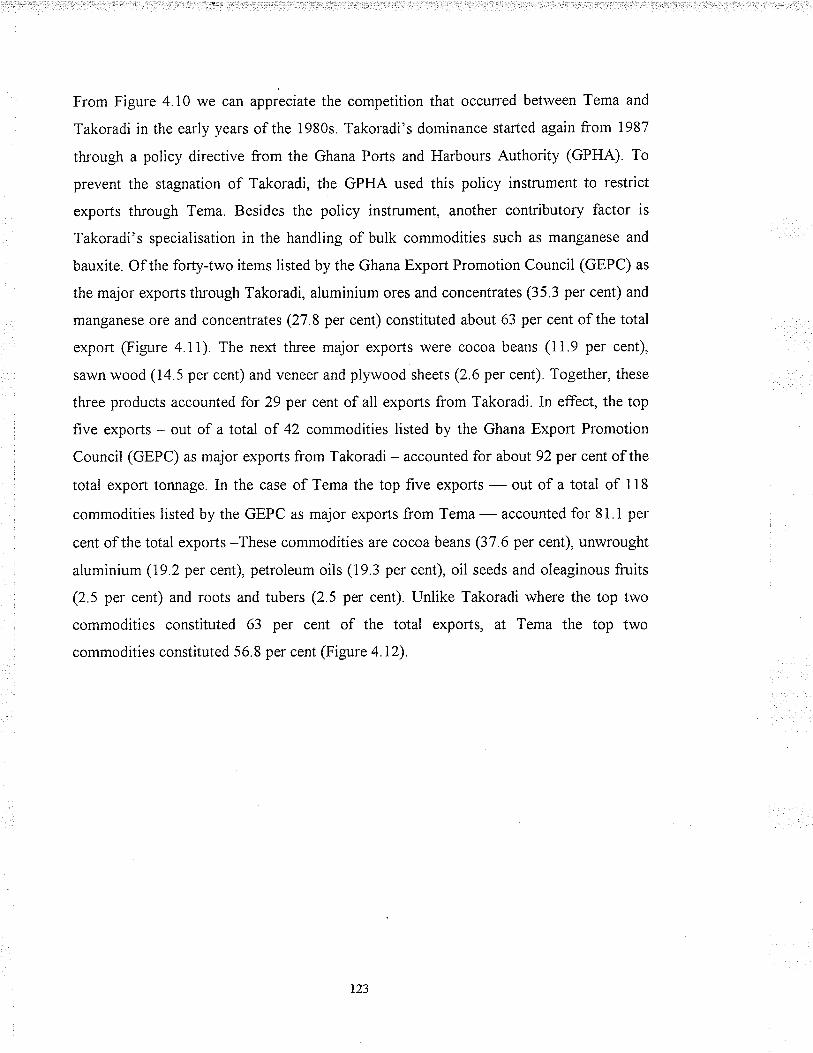
From Figure 4.10 we can appreciate the competition that occurred between Tema and
Takoradi in the early years of the 1980s. Takoradi's dominance started again from 1987
through a policy directive from the Ghana Ports and Harbours Authority (GPIIA). To
prevent the stagnation of Takoradi, the GPHA used this policy instrument to restrict
exports through Tema. Besides the policy instrument, another contributory factor is
Takoradi's specialisation in the handling of bulk commodities such as manganese and
bauxite. Of the forty-two items listed by the Ghana Export Promotion Council (GEPC) as
the major exports through Takoradi, aluminium ores and concentrates (35.3 per cent) and
manganese ore and concentrates (27.5 per cent) constituted about 63 per cent of the total
export (Figure 4.ll). The next three major exports were cocoa beans (i1.9 per cent),
sawn wood (14.5 per cent) and veneer and plywood sheets (2.6 per cent). Together, these
three products accounted for 29 per cent of all exports from Takoradi. In effect, the top
five exports - out of a total of 42 commodities listed by the Ghana Export Promotion
Council (GEPC) as major exports from Takoradi - accounted for about 92 per cent of the
total export tonnage. In the case of Tema the top five exports -
out of a total of I 18
commodities listed by the GEPC as major exports from Tema-accounted for 81.1 per
cent of the total exports -These commodities are cocoa beans (37 6 per cent), unwrought
aluminium (I9.2per cent), petroleum oils (19.3 per cent), oil seeds and oleaginous fruits
(2.5 per cent) and roots and tubers (2.5 per cent). Unlike Takoradi where the top two
commodities constituted 63 per cent of the total exports, at Tema the top two
commodities constituted 56.8 per cent (Figure 4.12).
123
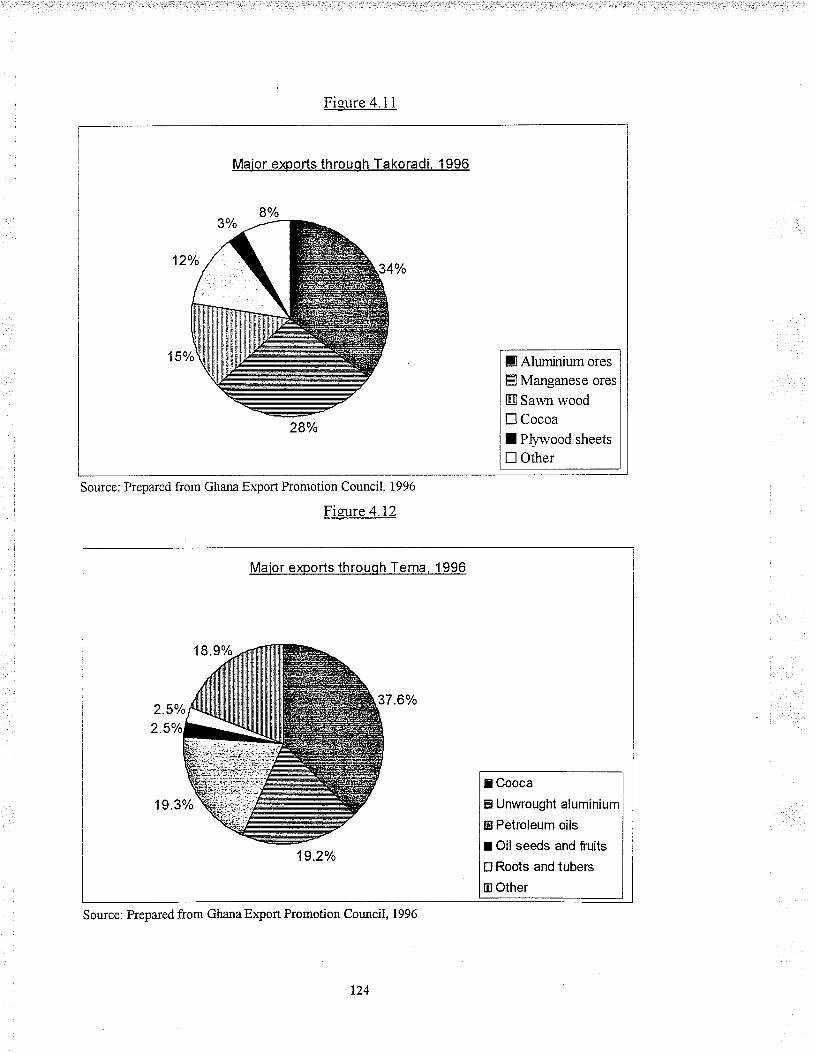
Figure 4.1 I
J Aluminium ores
Ë Manganese ores
W Sawn wood! Cocoa
I Pll'r'vood sheets
n Other
Source: Prepared from Ghala Export Promotion Council. 1996
Fizure 4.12
Maior e>oorts throuqh Tema, 1996
I Cooca
E Unwrought aluminium
ElPetroleum oils
I Oil seeds and fruits
tr Roots and tubers
M Other
19.2%
Source: Prepared from Ghana Export Promotion Council, 1996
124
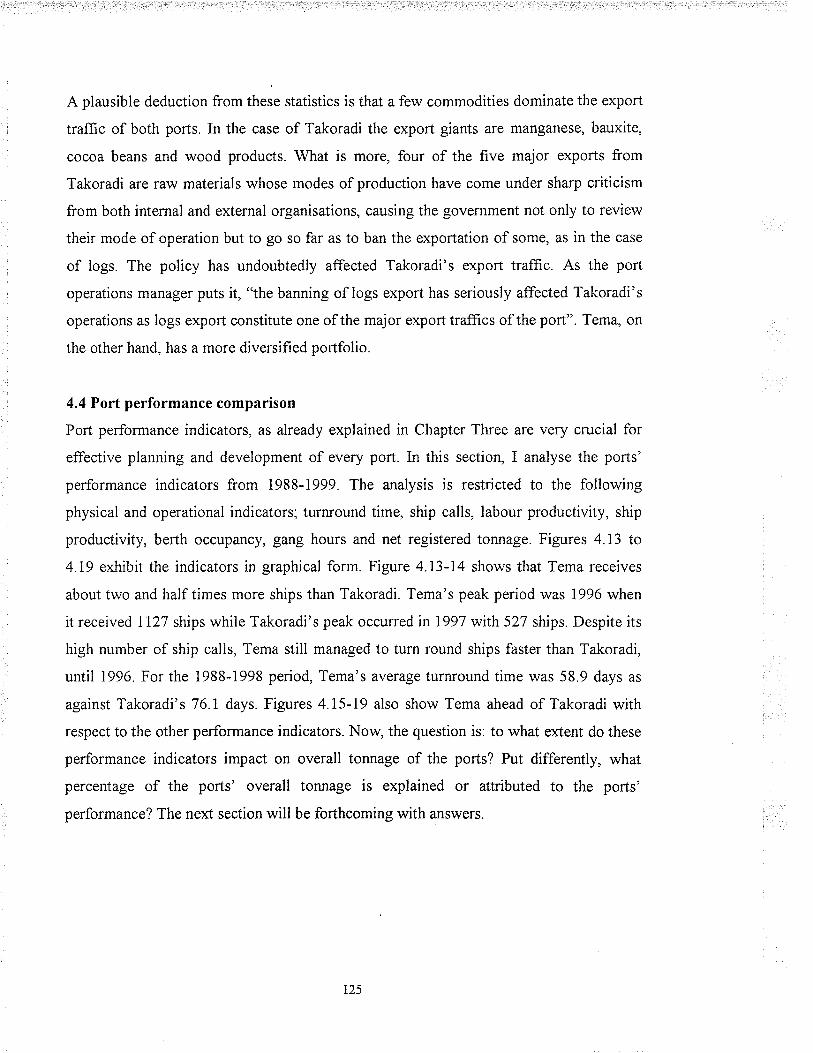
A plausible deduction from these statistics is that a few commodities dominate the export
traffrc of both ports. In the case of Takoradi the export giants are manganese, bauxite,
cocoa beans and wood products. What is more, four of the five major exports from
Takoradi are raw materials whose modes of production have come under sharp criticism
from both internal and external organisations, causing the government not only to review
their mode of operation but to go so far as to ban the exportation of some, as in the case
of logs. The policy has undoubtedly affected Takoradi's export traffic. As the port
operations manager puts it, "the banning of logs export has seriously affected Takoradi's
operations as logs export constitute one of the major export traffrcs of the port". Tema, on
the other hand, has a more diversified portfolio.
4.4 Port performance comparison
Port performance indicators, as already explained in Chapter Th¡ee are very crucial for
effective planning and development of every port. In this section, I analyse the ports'
performance indicators from 1988-1999. The analysis is restricted to the following
physical and operational indicators; turn¡ound time, ship calls, labour productivity, ship
productivity, berth occupancy, gang hours and net registered tonnage. Figures 4.I3 to
4.19 exhibit the indicators in graphical form. Figure 4.13-14 shows that Tema receives
about two and half times more ships than Takoradi. Tema's peak period was 1996 when
itreceived 1127 shipswhile Takoradi's peak occurred in 1997 with 527 ships. Despite its
high number of ship calls, Tema still managed to turn round ships faster than Takoradi,
until 1996. For the 1988-1998 period, Tema's average turnround time was 58.9 days as
against Takoradi's 76.1 days. Figures 415-19 also show Tema ahead of Takoradi with
respect to the other perfornance indicators. Now, the question is: to what extent do these
performance indicators impact on overall tonnage of the ports? Put differently, what
percentage of the ports' overall tonnage is explained or attributed to the ports'
performance? The next section will be forthcoming with answers.
t25
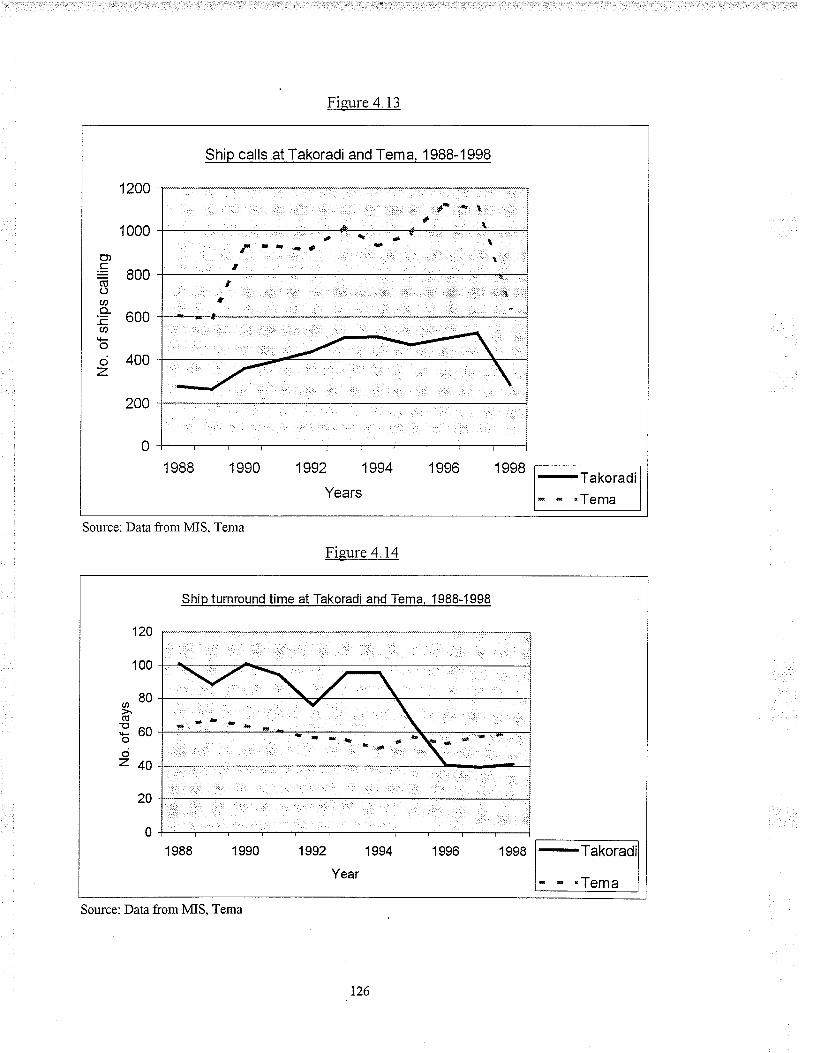
Fizure 4.13
Ship calls at Takoradi and Tema, 1988-1998I
Ii 1200I
II 1000
ct,c= 800(UoU)
--t 600Ø
oo 400z
200
0
-Takoradi'Tema
Sou¡ce: Data from MIS- Tema
Fieure 4.14
Ship turnround time at Takoradi and Tema, 1988-1998
120
100
,80oEooooz40
20
0
1 988 1 990 1 994 1 996
-Takora.TemaYear
\{\ /\
\-.--**_rt\*-
1992 1 998
Source: Data ûom MS, Tema
t26
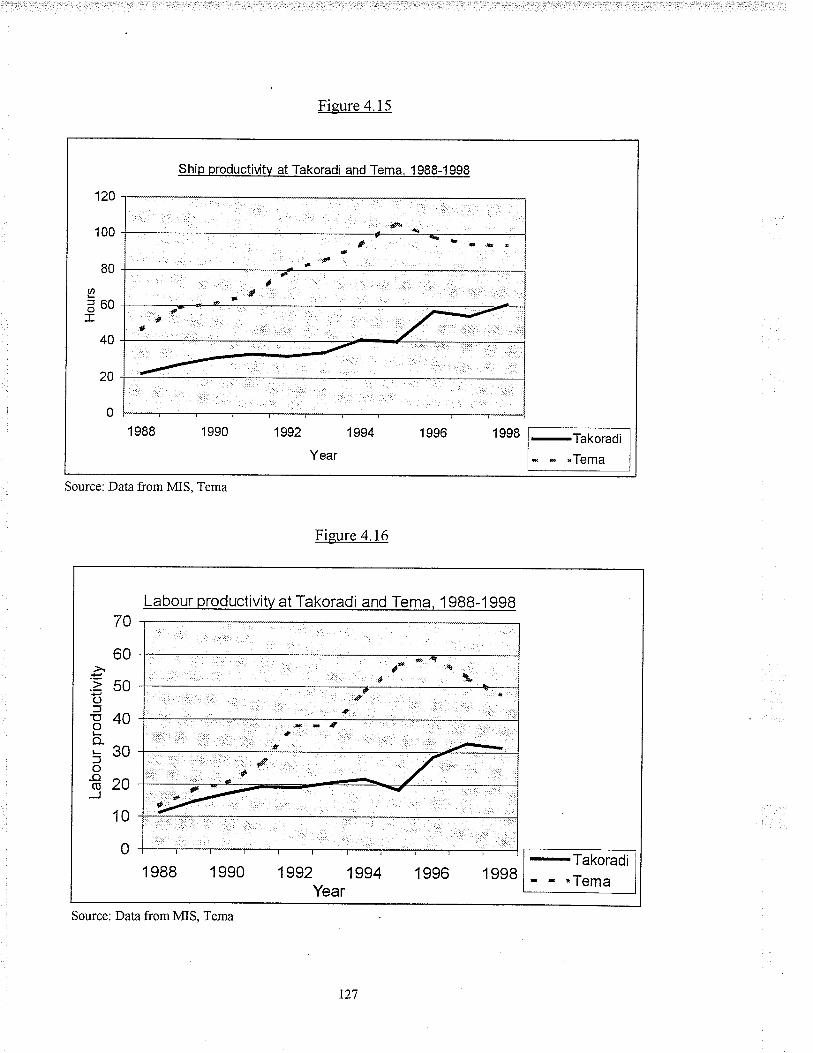
Ship productivitv at Takoradi and Tema, 1988-1998
120
100
80
L360I
40
20
0
1 988 1990 1992 1 994 1 996 I 998
-f¿[s¡¿di.TemaYear
Source: Data ûom MIS, Tema
Figure 4.15
Figure 4.16
Labour productivitv at Takoradi and Tema, 1988-1gg8
ênt* ¡à
v ¡gt
sÉ
'^,rf :. Ã ,r/-
70
60à:> 50(J:J
840Lo-530o€zoJ
10
0
-ïakoradiñ Ë "Tema
1 988 1 990 1994Year
1992 1996 1998
Source: Data from MIS, Tema
t27

Figure 4.17
Net registered tonnage (NRT) of ships forra korad i and Igln_e,l!_9_3:l_9_9Q
^ 6000ØCIOF +ooo
F-É.z
2000
1 993 1994 1 995 '1996
-Takoradi'TemaYear
Source: Data f¡om MIS, Tema
Fieure 4.18
Gang hours at Takoradi and Tema, 1993-1996
aLJo-
8000
6000
4000
2000
0
-Takoradi'Tema
Sou¡ce: Datafrom MIS, Tema
t28

Fi-eure 4. 19
Berth occupancv at Takoradi and Tema, 1993-1996
s0)(úÉ.
80
70
60
50
40
30
20
10
0
1994 1995
Year -Takoradi"Tema
Sou¡ce: Data from MIS. Tema
4. 5 Cargo tonnage and port performance: a synthesis
Having described the tkoughput statistics and the various port performance indicators,
our task now is to attempt to establish a relationship between overall cargo torurage and
port performance. The statistical technique used here is the regression analysis The
analysis covers the 1993-1996 period (disaggregated on a monthly basis), the time for
which dataare available for all the required variables.
r29

4.5.1 Evaluation of the regression results
4.5.1.1 Test of unit roots
A major precondition when dealing with time-series data is that they must be stationaryz6.
A stationarity test was therefore performed using the Phillips-Perron (1988) test (PP-test)
with a specification, which includes a constant, and atrend variable. The decision rule is
that the data is stationary ifthe t - and z -statistics are greater than the critical values at
the chosen level of significance, which is 10 per cent in this case. The results are
presented in Table 4.4 below.
Table 4.4
Phillips-Perron (PP-test) stationarit]¡ test results for Takoradi and Tema
Variable
t -statistic *
Takoradi Tema
z -statistic .
Takoradi Tema Conclusion
Overalltonnage - 6 8363 -7.2066 - 44.828 - 51.750 Stationary
Net registered tonnage -9.6457 -6.5818 - 57.398 - 42.276 Stationary
Number of ship calls - 5.8647 - 4.9165 - 41.349 - 32.022 Stationary
Ship turnround - 4.8455 - 6.2619 - 32. 135 - 44.314 Stationary
Labour productivity -62815 -57010 - 44. 654 - 39.658 Stationary
Berth occupancy -51927 -39859 - 34.885 -25.375 Stationary
Average gang hours - 4.3890 - 5.8827 - 25.608 - 41.705 Stationary
Ship productivity - 6.7519 - 6.3262 - 48 408 - 44.967 Stationary
* The asyrnptotic critjcal value at
¡ The aÐ'rnptotic critical value at
10 % ofthe t-test is -3.13.
l0 % of the z-test is -18.2.
26 Regression(s) based on non-staûonary data tend to give spurious results. Consequently, inferences andconclusions derived from such regressions also tend to be erroneous and faulty. *A time series is said to bestationarf if there is no systematic change in mean (no trend), if there is no systematic change in va¡iance,and if strictly periodic va¡iations have been removed. Most of the probability theory of time series isconcerned witl stationary time series. and for this reason time-series analysis often requires one to tün anon-stationa4' series into a stalionary one so as to use this theory" (Chatfield, I975:14).
130

The results presented in Table 4.4 indicate that all the variables are stationary, since the tand z-statistics are all greater than the asymptotic critical values at 10o/o, which are -3. 13
and -18.2. Consequently, \¡ie may reject the unit root hypothesis and use the levels of the
variables in the analysis.
4.5.1.2 The regression results
The results of the regression of overall tonnage (OT) on the independent variables which
have been corrected for autocorrelationz7 is presented in Table 4.5. A perusal of the P-
values in Table 4.5 shows that only two of the variables -
ship calls and ship turnround
statistically signifrcant at the 1 per cent level of signifìcance. When the level of
signiflrcance is raised to 10 per cent, gang hours become significant. Together, the three
variables account for about 53 per cent of Takoradi's overall traffic. The remaining
variables -
net registered tonnage, labour productivity, berth occupancy and ship
productivit are statistically insignificant and thus have little or no impact on the
port's traffic flow (cargo tonnage). In the case of Tema only labour productivity and gang
hours are statistically signifrcanl at the 1 per cent significant level. The two variables
account for about 38 per cent of Tema's overall traffic. The rest of the variables, as can
be elicited from the Table 4.5, are statistically insignificant. The F-statistics indicate the
simultaneous signifìcance of all the variables at the 1 per cent level of significance.
Takoradi has an F-statistic of 293.33 while Tema's is 387.67. Since the R2 values are not
very high, this may be taken to indicate the absence of a high degree of multicollinearity.
27 The test for autocorrelation was done using the Du¡bin-Watson @W) d test. Durbin-Watson value mustbe 2 or close to 2. The decision rule for the DW test is
du<d<4-duwhere d: the DW test statistic from regression
du = upper limit of the DW d statistic critical value (from DW d test øble)Going by the decision mle, we find tlnt both regressions are affected by autocorrelation This is shown asfollows:ForTakoradi'. d= I.8494, hence du < d < 4- dz= 1.885 >I.8494<2.115
It can be seen that the left hand side of the inequality does not hold which indicates the presence ofautocorrelation.
ForTema: d =2.5284, hence dr < d < 4-d¡¡= 1.885 <2.5284> L.4716In the case of Tema. the right ha¡d side of the inequality does not hold, which again indicates r¡epresence of autocorrelation. See Appendix V for uncorrected reglession results. Having correctedfor autocorrelation the DW value is no more relevant, fherefore, the DW values in Table 4.5 canbe overlooked.
131
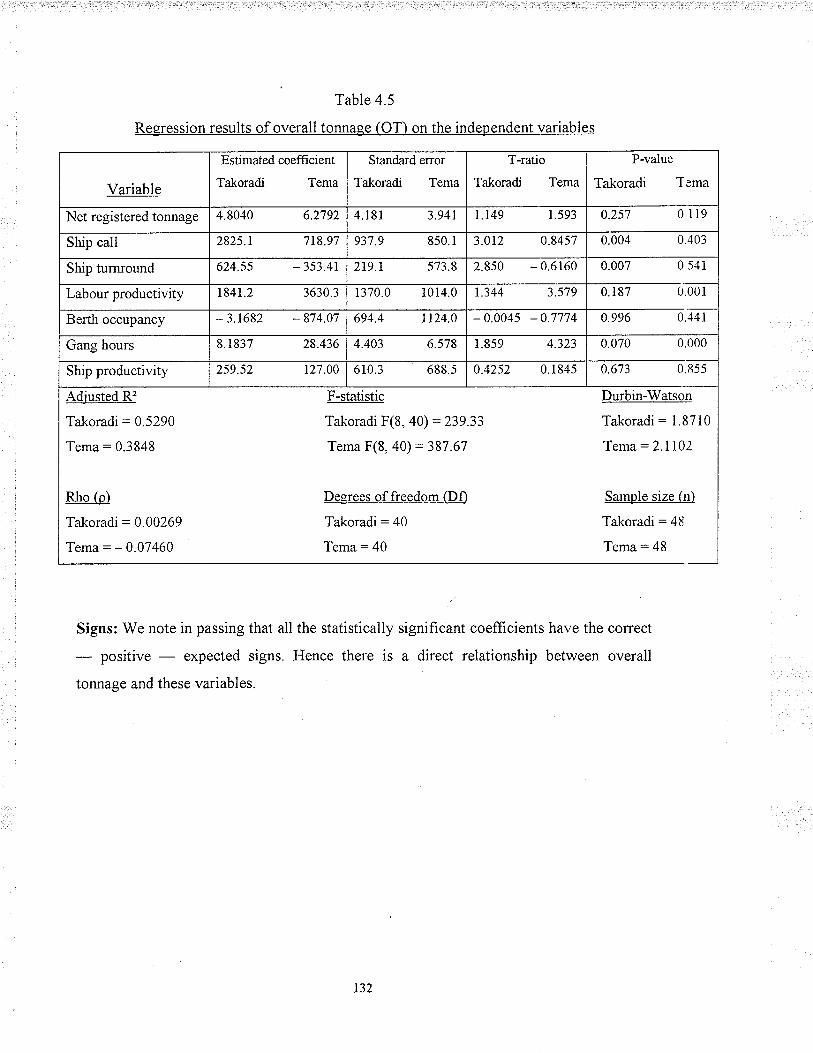
Table 4.5
Reeression results of overall tonnage (OT) on the independent variables
Signs: We note in passing that all the statistically significant coefficients have the correct
- positive - expected signs. Hence there is a direct relationship between overall
tonnage and these variables.
Variable
Estirnated coefficient
Takoradi Tema
Standa¡d error
Takoradi Tema
T-ratio
Takoradi Tema
P-value
Takoradi Tema
Net registered tonnage 4.8040 6.2'792 4.181 3.941 t.r49 1.593 0.257 0 I 19
Ship call 2825.r ',718.91 937 .9 850.1 3.0t2 0.8457 0.004 0.403
Ship turnround 624.55 - 353.41 279.1 573.8 2.850 - 0.6160 0.007 0 54i
Labour productivity t841.2 3630.3 1370.0 1014.0 t.344 3.5',79 0.187 0.001
Berth occupancy - 3.1682 - 874.0',7 694.4 1124.0 - 0.0045 -0.7774 0.996 0.441
Gang hours 8.1837 28.436 4.403 6.5'18 r.859 4.323 0.070 0.000
Ship productivity 259 52 tZ7 00 610 3 688 5 0 4252 0.1845 0.6't3 0.855
Adjusted R'
Takoradi :05290
Tema: 0.3848
Rho (p)
Takoradi = 0.00269
Tema: - 0.07460
F-statistic
Takoradi F(8, 40) :239.33
Tema F(8, 40) = 397 .U',
Degrees of freedom (Df)
Takoradi = 40
Tema = 40
Durbin-Watson
Takoradi = L8710
Tema: 2.1102
Sample size (n)
Takoradi = 48
Tema:48
132

4.5.2 Residual tests
Tables 4.6 and 4.7 summarises the results of the residuals tests Q.Jormality, Equation
specification error (RESET) and ARCH(P)) for both Takoradi and Tema.
4.5.2.1 Normality test28:
One of the assumptions underlying the classical linear regression model is that the error
terms or residuals are normally distributed. Using the Jacque-Bera (IB) test, the test-
statistic of 1.7479 with 2 degrees of freedom has a P-value of approximately 0.4500,
which indicates that the residuals are approximately normally distributed. Tema's test-
statistic of 2.0884 with2 degrees of freedom has a P-value of approximately 0.4100. The
residuals for Tema are also approximately normally distributed.
4.5.2.2 ARCH (p) testWith time-series data, it is pertinent to test for the twin problems of autocorrelation and
heteroscedacity. The ARCH (p) model2e is used for this purpose. The results indicate that
the error variance is not affected by autoregressive conditional heteroscedasticity.
4.5.2.3 Reset testThis is a test for mis-specifrcation of the regression equation, which is judged by the F-
test statistic and the F-critical values. Tables 4.6 and 4.7 show these values for both ports.
As is evident from the Tables, all the F-test statistics are less than the F-critical values at
the 1 per cent significance level. Consequently we conclude that the model may not be
affected by mis-specification bias or equation error.
28 In the normality test a higher P-value - closer to 1.0 - is needed to reject the nr¡ll hlpothesis of non-normal residuals.t' The ARCH (p) model has the test statistic nR2 - /p .where n = number of observations and .R, =coefficient of determirntion from ile auriliary regression of tlte square residuals on its different lags(Boame, 1998).
133

Table 4.6
Normalit)¡. equation specification error and ARCH (p) tests for Takoradi
Table 4.7
Normaliti¡. equation specification error and ARCH (p) tests for Tema
Tlpe of test Test-statistic
Degree of
freedom P-value
Critical
value (l%) Conclusion
NORMALITY
JACQLIE-BERA t.7479 2 = 0.4500
Approximately
normalll' distributed
RAMSEY RESET
RESEr (2)
RESET (3)
RESET (4)
2.1926
1 5981
I 0403
F (1,39)
F (2,38)
F (3,37)
t.53
5.Zt
4.36
No mis-specification
No mis-specification
No mis-specification
ARCH (p)
ARCH (1)
ARCH (2)
ARCH (3)
0.176
0.3936
0.7584
= 0.695
= 0.850
=0895
No autoregressive
conditional
heteroscedasticity
Type of test Test-statistic
Degree of
freedom P-value
Critical
value (l%) Conclusion
NORMALITY
JACQTIE-BERA 2.0884 2 = 0 4100
Approximately
normally distributed
RAMSEY RESET
RESEr (2)
RESEr (3)
RESET (4)
- 2.9524
- 1.2225
- 0.69308
F (1,39)
F (2,38)
F (3.37)
7.33
5.21
4.36
No equation error
No equation error
No equation error
ARCH (p)
ARCH (1)
ARCH (2)
ARCH (3)
0.494
0.7824
L008
= 0.500
= 0.695
= 0.800
No autoregressive
conditional
heteroscedasticity
134

4.5.2.4 Multicollinearity test
Multicollinearity is checked by using
Factor (WFiftests from the auxiliary
for both ports. The decision rule is that
0<TOL¡<1.
the Tolerance (TOL¡) and the Variance Inflation
regressions. Below are the WF¡ and TOL¡ values
WF¡ < 10 and TOL¡ approximately I but not 0, i.e
Table 4.8
VIFi and TOLifor Takoradi and Tema
Table 4.8 afÏirms that the WF¡values for Takoradi -
falling between 4.3177 and 1.3477
- are all less than 10, and the TOLjvalues
- falling between 0.7453 and 0.2316
-are also not very close to zero. Tema's WF¡ values fall between 6.3898 and 1.0134 while
its TOL, values lie between 0.2488 and 0.9868. We thus conclude that the specification is
not seriously affected by multicollinearity. Since even with near collinearity the OLS
estimators are still BLUE and the problem of multicollinearity is a question of degree
rather than the absence of it, we may accept the specification for our purpose.
30 Tlre WF¡ is defined as, WF¡ 0 1/(l - N), where R72, is the.Rr'in the (arxiliary) regression ofXT on theremaining ft - 2) regressors; Tolerance is defined as TOLj : l/WFi (See Boame, 1998).
Variable
vIFj
Takoradi Tema
TOLj
Takoradi Tema
Net registered tonnage t.34r7 L0134 0.74s3 0.9868
Ship calls 1.8079 1.5858 0.5531 0.6306
Ship turnround 2.4820 1.3984 0.4029 0.7151
Labou¡ productivity 3.9184 6.3 898 0.2552 0.1565
Berth occupancy 4.0144 r.6072 0.2491 0.6222
Gang hours 4.3177 4.0193 0.2316 0.2488
Ship productivity 4.0016 2.4808 0.2499 0.4031
135

4.6 Ghanaian and East African ports: throughputs comparison
Having described the Ghanaian ports vis-à-vis each other, we now place the two ports in
a much wider context. In other words, I compare Takoradi and Tema with the East
African ports of Mombasa and Dar es Salaam. Because of data problems the ports are
compared on just three criteria; namely, overall traffrc, container traflic and rate of
growth. Using the shift-and-share methodology, we will assess which pofts are growing
faster and by extension, performing better. Table 4.9 shows throughput statistics for
Takoradi, Tema, Mombasa and Dar es Salaam.
Table 4.9
Overall traffic at Ghanaian and East African ports. 1983-1993 o,rri
Year Takoradi Tema Mombasa Dar es salaam
I 983 546352 1905974 6494000 3 1 55000
t984 663000 I 8 10000 6548000 3466000
1 985 898000 2365000 6339000 3158000
I 986 687000 2874000 6930000 3476000
r987 1271674 2898496 691 8000 3601000
1988 1427577 3026125 6172000 3944000
1989 1497503 33 10820 7238000 4000000
1990 1560709 3476687 7525000 3741000
T99l 1639468 3647010 7144000 3 857000
r992 I 802690 3909661 7992000 4602000
1993 2123099 4130204 7989000 4485000
Source: MIS, Tema and Hoyle and Cha¡lier, 1993
We see from Table 4.9 that in terms of overall traffrc Takoradi and Tema are easily
overshadowed by their counterparts in East Africa. If we consider the two regions as
consisting of a single port system, Takoradi and Tema possessed just 4.5 and 15.8 per
cent of the market share, respectively. Together, therefore, they had20.3 per cent of the
market share in 1983. The remaining 79.7 per cent was shared between Mombasa and
Dar es Salaam, with Mombasa alone having as much as 53.7 per oent and Dar es Salaam
t36
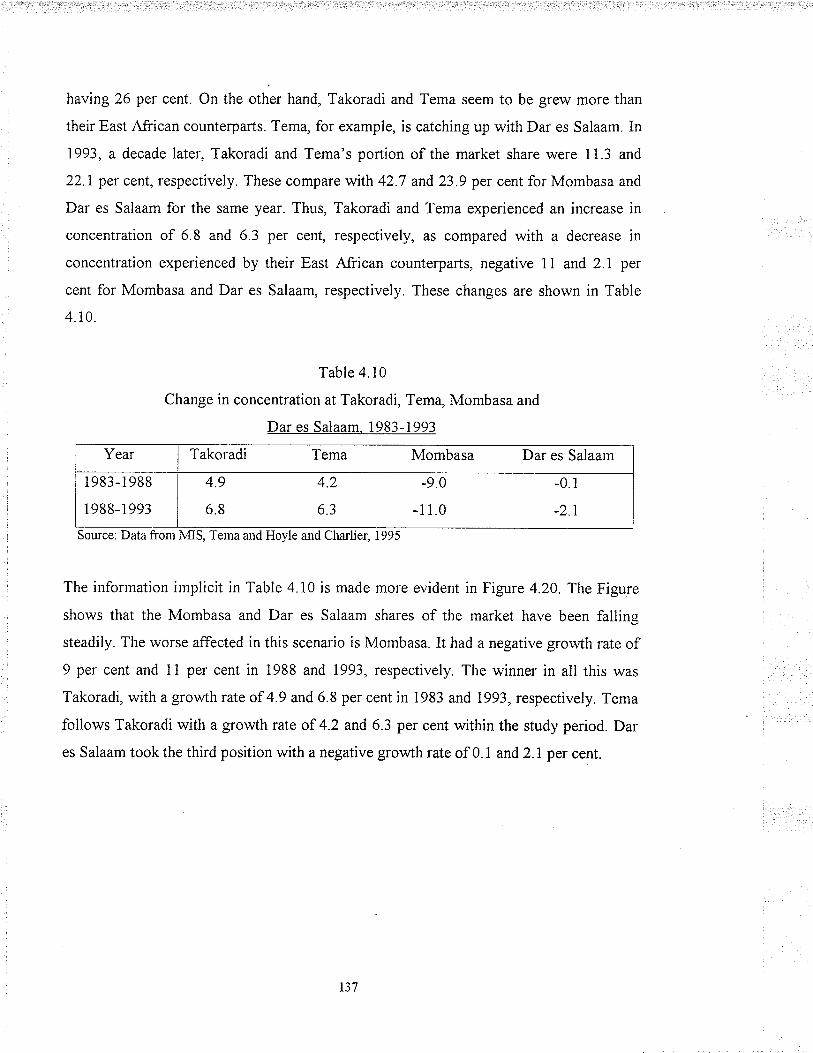
having 26 per cent. On the other hand, Takoradi and Tema seem to be grew more than
their East African counterparts. Tema, for example, is catching up with Dar es Salaam. In
1993, a decade later, Takoradi and Tema's portion of the market share were 11.3 and
22.1 per cent, respectively. These compare with 42.7 and 23.9 per cent for Mombasa and
Dar es Salaam for the same year. Thus, Takoradi and Tema experienced an increase in
concentration of 6.8 and 6.3 per cent, respectively, as compared with a decrease in
concentration experienced by their East Af¡ican counterparts, negative 11 and 2.7 per
cent for Mombasa and Dar es Salaam, respectively. These changes are shown in Table
4.10.
Table 4.10
Change in concentration at Takoradi, Tema, Mombasa and
1983-1 988
1988-1 993
The information implicit in Table 4.10 is made more evident in Figure 4.20.The Figure
shows that the Mombasa and Dar es Salaam shares of the market have been falling
steadily. The worse affected in this scenario is Mombasa. It had a negative growth rate of9 per cent and 11 per cent in 1988 and 1993, respectively. The winner in all this was
Takoradi, with a growth rate of 4.9 and 6.8 per cent in 1983 and 1993, respectively. Tema
follows Takoradi with a growth rate of 4.2 and 6.3 per cent within the study period. Dar
es Salaam took the third position with a negative growth rate of 0. 7 and 2.1 per cent.
Dar es Salaam. 1983-1993
Sou¡ce: Data from MIS, Tema and Hoyle and Cha¡lier, 1995
Takoradi Tema Mombasa Dar es Salaam
4.9
6.8
-9.0
-11.0
-0.1
-21
137

Fieure 4.20
These changes in concentration can be made explicit by translating them into absolute
terms using the shift-and-share technique discussed in the previous chapter. Stated
differently, this procedure attempts to calculate the difference between the actual tonnage
of a port in i993 and the hypothetical figure showing what the tonnage would have been
if the port had grown atthe system's31 rate between 1983-1993. The result32 shows that ifTakoradi had grown atthe system's rate its tonnage in 1993 would have been 845,460.56
tons (hypothetical growth) instead of 2,123,309 tons. This means Takoradi had a
comparative gain of 7,227,638 tons. Tema's hypothetical growth was 2,949,573.675 tons.
Tema thus had a comparative gain of 1,180,630.325 tons. Dar es Salaam, on the other
hand, had a hypothetical growth of 4,882,493.I22 tons, which makes its comparative loss
to be -397,493.12 tons. Mombasa also registered a comparative loss of -2,060,733.9
tons, having had a hypothetical growth tonnage of 70,049,733.86 tons.
't The system here is defined as consisting of the Ghanaian port system plus the E¿st African port system.32
See Appendix V for detailed computations.
138

The impressive growth rate of Takoradi and Tema notwithstanding, the fact still remains
that Mombasa and Dar es Salaam enjoy throughputs larger than their Ghanaian
counterparts, as evidenced in Table 4.10, though Tema seems to be rubbing shoulders
with Dar es Salaam, especially after 1990. Takoradi's overall throughput, however, is
about half that of Dar es Salaam and one-third that of Mombasa.
With respect to container trade, Takoradi and Tema are still minor players compared with
Mombasa and Dar es Salaam. Table 4.11 shows the container trafftc for Mombasa, Dar
es Salaam, Takoradi and Tema.
Table 4.11
Container traffic at Ghanaian and East Africa ports. 1991-1993 fMI)
Year Takoradi Tema Mombasa Dar es Salaam
1991 66792 50r567 I 390000 840000
1992 62723 604496 1420000 858000
1993 75217 6305 1 6 r 567000 I 091 000
Source: MS, Tema and Hoyle and Cha¡lier, 1993
As Table 4.1 I reveals, the Ghanaian ports, most notably Takoradi lag behind their
counterparts in East Africa. In 1993, for example, while the two East African ports
recorded container traffrc of over a million tonnes - Mombasa (1567000), and Dar es
Salaam (1091000) - Tema recorded 630516 while Takoradi managed just75217.
4.7 Summary
This chapter has described the throughput and performance indicators of the two
Ghanaian ports of Takoradi and Tema. Analysis of the throughput statistics shows Tema
ahead of Takoradi in almost all the criteria with the exception of exports. Even this is a
little misleading; Takoradi's leadership in exports, as we noted, is owed to a government
policy which restricted exports through Tema. What is more, Takoradi's exports are
bulky products - bauxite, manganese and timber - which have the tendency to
exaggerale its total tonnage. With respect to perforrnance, Tema was again ahead of
139
Takoradi in all the indicators. It must be pointed out, however, that from 1996 Takoradi
began turning round ships faster than Tema.
The results of the regression analysis, which was performed to investigate the impact of
the performance indicators on total tonnage, revealed that Takoradi's performance
explained 53 per cent of its tonnage as against Tema's 38 per cent though Tema's
performance were comparatively better than Takoradi's. Now, the question that begs to
be answered is this: Why does Tema enjoy a higher overall traffic than Takoradi when its
performance indicators accounts for only 38 per cent of its output? Again, why do the
East African ports continue to have much larger throughputs than thei¡ Ghanaian
counterparts when the Ghanaian ports are performing better than them on the shift-and-
share analysis. As we noted in the first chapter, a port's overall tonnage (OT) is a
function of its performance (P) and hinterland (H), which can be rendered mathematically
as OT : P * H, which can be re-arranged as H: OT - P. Thus, the answer to the question
posed above seems to lie in their hinterlands This being the case we now turn our
attention to the hinterlands of the ports, the subject of Chapter Five.
140
CHAPTER FTVE
THE PORTS AND THEIR HINTERLAND
5.0 Introduction
In Chapter Four we discussed the throughput statistics and the performance indicators of
the ports as well as the impact of performance on overall tonnage. Results of the
regression analysis of performance on overall tonnage indicated that Tema's performance
contributed only 38 per cent to its overall tonnage compared with Takoradi which
performance accounted for 53 per cent per cent to its overall tonnage. 'We also noted,
with respect to rate of growth, that Takoradi and Tema performed better than Mombasa
and Dar es Salaam. However, the proviso needs stressing: the volumes of the Ghanaian
ports fell short of those handled by the East African ports. The hinterlands of the ports
provide likely reasons accounting for these tonnage differences. In this chapter, therefore,
I discuss the hinterland of the ports, paying particular attention to the distribution and
pattern of economic activity and the transport network connecting the ports to their
hinterlands. Takoradi and Tema are considered first.
5.1 The Ghanaian hinterland
5.1.1 The distribution and pattern of economic activity
The specialisation of the ports in their trafäc handling has been described as a logical
conclusion of the hinterland links and the distribution of economic activity in the country
(Hilling, 1975) Naturally, therefore, the issue arises, as to the distribution and pattern of
economic activity in Ghana and, by extension, the mode and means whereby this activity
is linked to the ports. I now discuss the distribution and pattern of economic activity of
Ghana.
5.1.2 The mineral deposits
Four principal minerals are exported from Ghana; namely, gold, diamond, manganese
and bauxite. The bauxite deposits occur in most hill tops in the country. The earlier
largest discovered deposits were those on top of Mountain Ejuanoma at Nkawkaw and
Kibi in the Eastern region, Yenahin in the Ashanti region and Awaso in the Western
region. Despite their early discovery 0921), development of the deposits did not start
until 1941 when, as a result of the German inva'sion of France, Britain's main source of
141
supply was cut off In addition, the mechanisation - the introduction of excavators, aerial
ropeways, diesel dumpers, crushing and washing machines - of the mining process and
the completion of the railway line from Dunkwa-on-Ofin to Takoradi in 1944 are
considered as further catalysts to bauxite development in the country. The largest of the
bauxite deposits occurs at Awaso.
The manganese deposits occur in Birrimian rocks. The largest and richest deposits of the
mineral are at Nsuta in the Western region, where they are found in two parallel ridges.
The Nsuta deposit is the largest deposit and the only one being mined at the moment.
Other deposits exist between Takoradi and Axim, but these are not mined at the moment.
At Nsuta, manganese occur mainly as a carbonate, the top layers of which have
weathered into oxides, of which some 27 million tomes have so far been produced. In
1956 production reached 750 000 tonnes but this fell steadily to 300 000 tonnes in 1984.
Production was 340 000 tonnes in 1997 . With the exhaustion of the oxides, attention is
now being turned to the carbonates which are, by a new process, being converted into
oxides. Mining is very simple. The top soils of the ridge in which they occur are removed
from the ridges in which the deposits occur and the exposed mineral-bearing rock broken
up with dynamite. With the use of mechanical shovels the debris are collected and
dumped into small railway trucks, washed and then sent to Takoradi by rail for export.
Principal gold bearing areas include the Ankobra and Ofin river areas around Prestea,
Tarkwa, Obuasi, and Konongo. V/ith the exception of the Ankobra and Ofin deposits,
which are dredged, mining is by the open-cast and underground methods. In the case of
diamonds, they occur in many parts of the country but the principal deposits are found at
Birim fìeld, the Bonsa field, the Dunkwa-Jimi field and the Nyamfoman fìeld. Production
in the Dunkwa-Jimi field stopped in 1978.
142
5.2 Agriculture
Among the many crops grown and exported from Ghana are cocoa, oil palm, sheanut,
coffee, pineapple, kola nut, tobacco, yams, cassava and rubber, to mention just a few.
Cocoa is the most important of all the cash crops. It accounts for about two-thirds of the
country's foreign exchange. Cocoa is grown almost everywhere in the forest region, but
the maximum cocoa growing areas are found within a belt that extends from Sunyani in
the Brong-Ahafo region to Swedru in the Central region. This belt covers the following
growing centres.
1. The Ahafo district with Bechem, Hwidiem, Goaso, Kukuom and Tepa as
buying centres;
The central districts of Ashanti Region;
The roughly triangular piece of land lying across the Eastern and Central
Regions and with Asamankese, Akim Oda and Agona Swedru at the corners.
The cocoa hinterland is shared between the two ports even though Takoradi could have
dominated this hinterland with ease had the authorities thought it fit to provide good
direct transport links between it and the cocoa-producing areas. For this reason, cocoa
from the highly productive areas in the west-central part of the country is moved to the
collecting centre in Kumasi from where it can be moved with equal facility to either
Takoradi or Kumasi, depending on availability of port space" (Hilling, 1975).
Coffee is the second major cash crop after cocoa. The exportation of coffee started in the
i850s. The main producing areas are western Brong-Ahafo Region, Sefwi in the Western
Region, southern Ashanti region, the Hohoe area in the Volta Region and the Nkawkaw
area in the Eastern Region. The rubber industry has not been as successful as the cocoa
and coffee industry. The main rubber growing areas are found around Dompin, Manso,
Amenfi, and Enchi, all in the Western Region. The State Farms Corporation (SFC) also
own rubber plantations in Avrebo, Nsuaem and other places in the Western Region. Palm
oil has also gained prominence as an export crop of late. The export of palm oil and palm
kernels especìally from southern Ghana, gathered momentum during the first half of the
" Interyierv with officials at tïe cocoa shed, port of Tema.
)
J.
r43

nineteenth century as a replacement for the slave trade. The main oil palm belt extends
from Asesewa in the Eastern Region to Aiyìnase in the Western Region.
5.3 The forest areas
The timber industry has been a major source of foreign exchange since the nineteenth
century. Initial exports of timber were small, beginning with about 84,950 cubic metres in
1888, butthis increased gradually. From 1973, however, therewas a drop from over one
million tons to about 90, 000 tons in 1984. The Western Region is the oldest and still the
largest producer of timber in the country. During the surf ports days the logs were floated
down the A¡kobra, Tano, and Ofin-Pra Rivers to Axim, Half Assini and Shama for
shipment. Takoradi is now the main port for timber export.
The remaining forest areas did not witness any appreciable development in the timber
industry due to the absence of adequate land transport and of large swift rivers on which
the logs could be floated down to the coast. The Eastern and Central Regions, for
example, began to produce timber on an appreciable scale only when the Accra-Kumasi
and the Huni Valley-Kade railway lines were cornpleted. With these new transport
networks timber could be transported easily to Takoradi and Accra. The timber industry
is managed by private companies, which export not more than a dozen of the large
number of species of trees in the forest. The principal timbers, arranged in descending
order of importance, arewøwa or obeche, sapele, møhogany, utile, kol+rodua and mqkore.
The method of operation is fairly simple. The trees are felled by hand saw and axe, cut up
into logs in situ and with the help of caterpillar tractors dragged to a prepared clearing
site and then transported to the port for final shipment @ickson and Benneh, 1984).
Figures 5.1 and 5.2 show the distribution of agriculture and mining areas of Ghana.
144
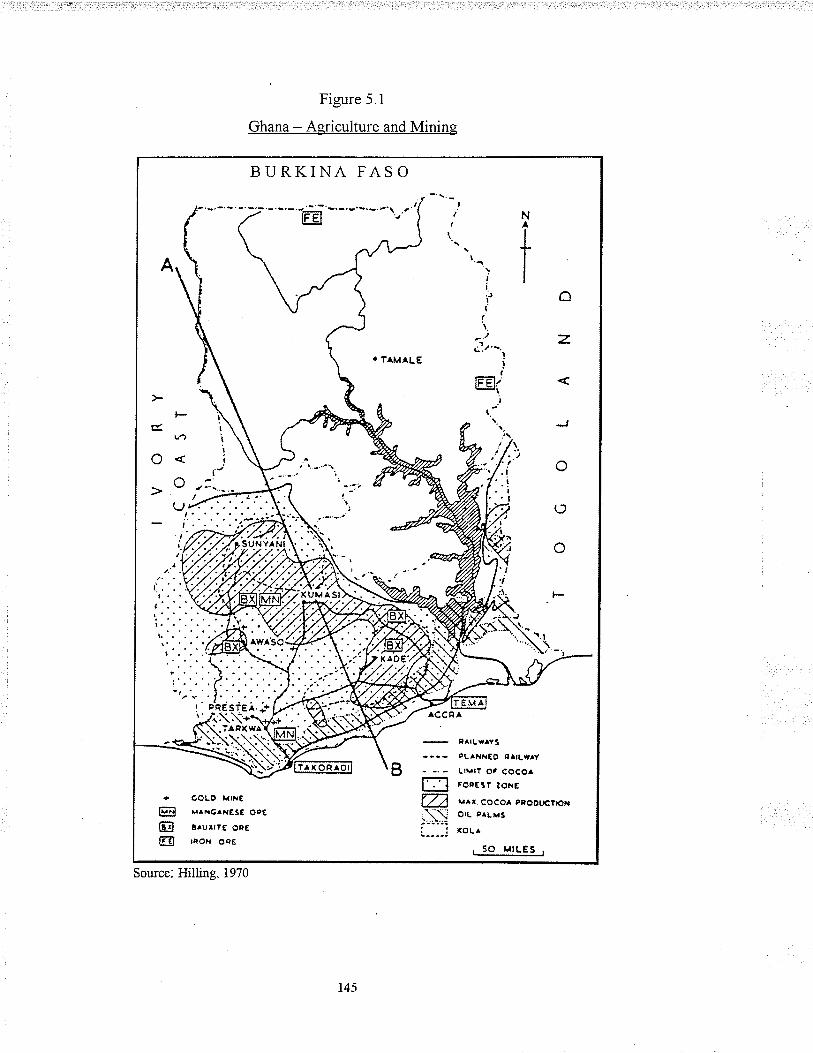
Figure 5.1
Ghana - Agriculture and Mining
Sou¡ce: Hilling, 1970
14s
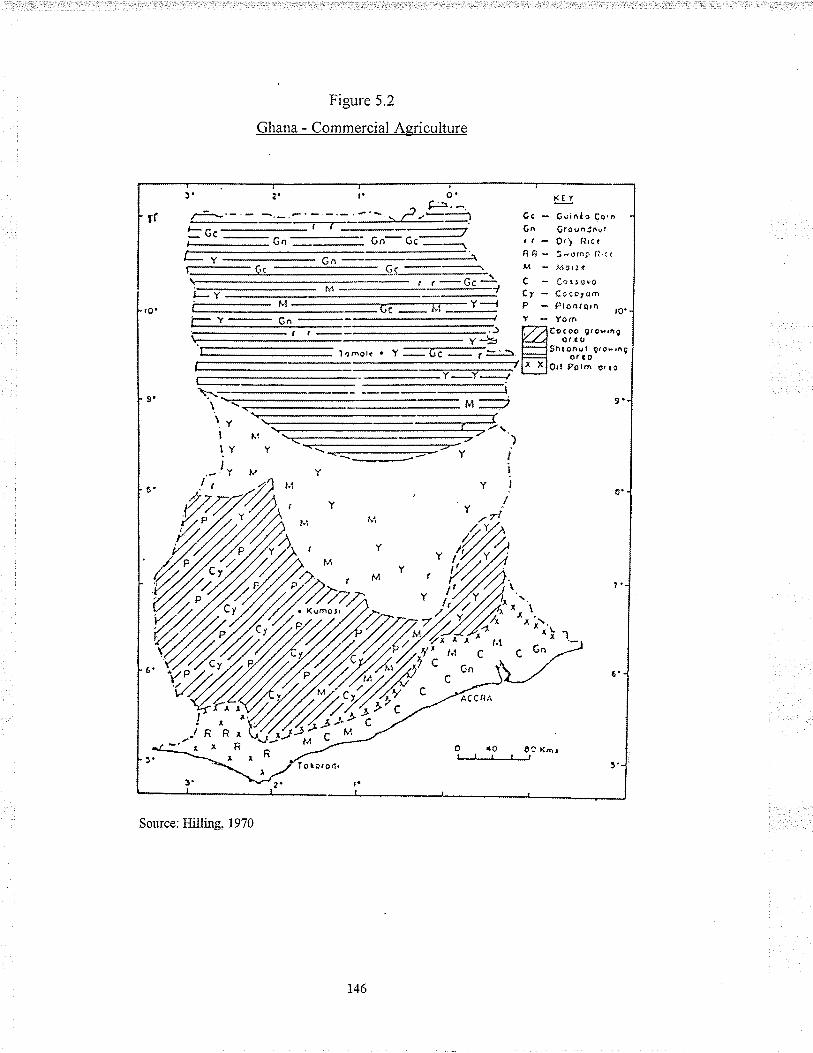
Figure 5.2
Ghana - Commercial A-ericulture
o'
Y--l p - f)tontorn
xttÇs - 6uiñ{o CÞ,ôÇn GrovniÂq?¡ ¡ - Qri flrcrfì8- 3'ornÊlì,r.(¡{ - ,6Jt¿e
C _ Ca¡¡,¡rOC7 - Ca;c¡om
^ iì.! -,
6n
I-Y Gn-r:::- ç'( Gc
---..-.-...-..1r-Gc-
--ti- rlt
-bC -
lvl
\-\.\.\lvIIY
-J Y
\_-
tl-
ACCfljr
.lt
ffi7'12t/,/,//,
Cy x ,
!II
Èr
I
¡R¡
R¡
O .O 0î Xn¡tlltt
forÞ.odr
Source:Hilling, 1970
r46
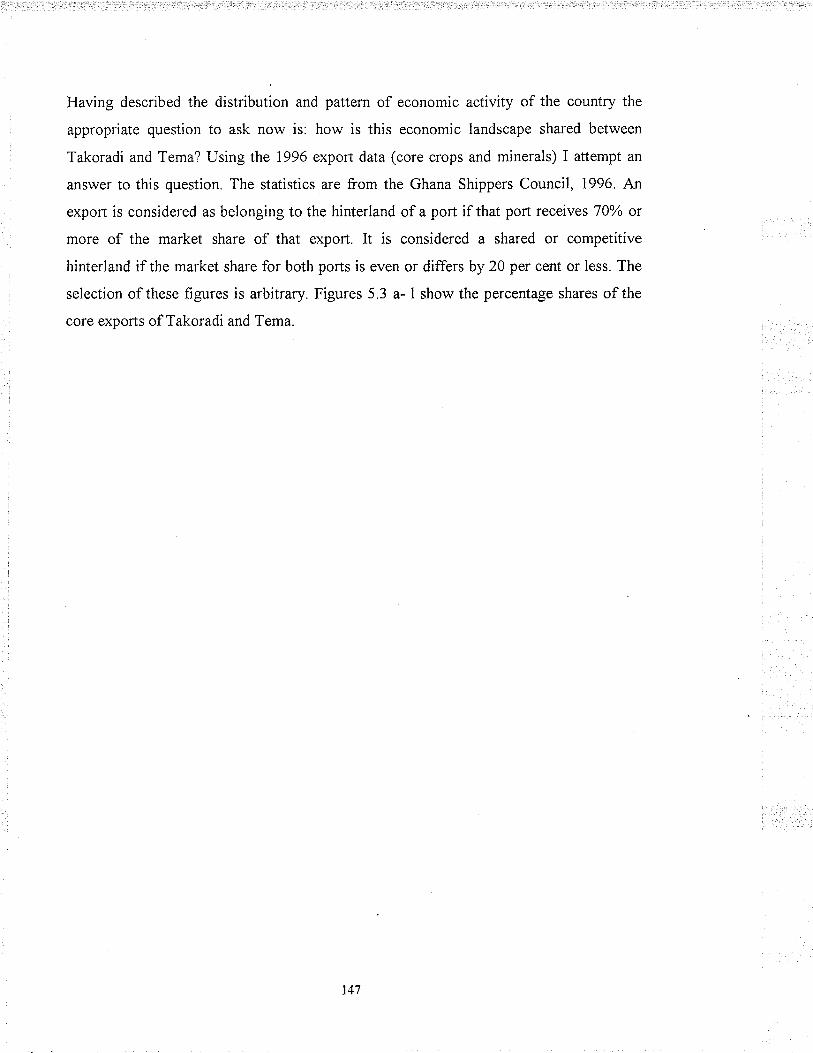
Having described the distribution and pattern of economic activity of the country the
appropriate question to ask now is: how is this economic landscape shared between
Takoradi and Tema? Using the 1996 export data (core crops and minerals) I attempt an
answer to this question. The statistics are from the Ghana Shippers Council, 1996 An
export is considered as belonging to the hinterland of a port if that port receivesT)Yo or
more of the market share of that export. It is considered a shared or competitive
hinterland if the market share for both ports is even or differs by 20 per cent or less. The
selection of these figures is arbitrary. Figures 5.3 a- I show the percentage shares of the
core exports of Takoradi and Tema.
147
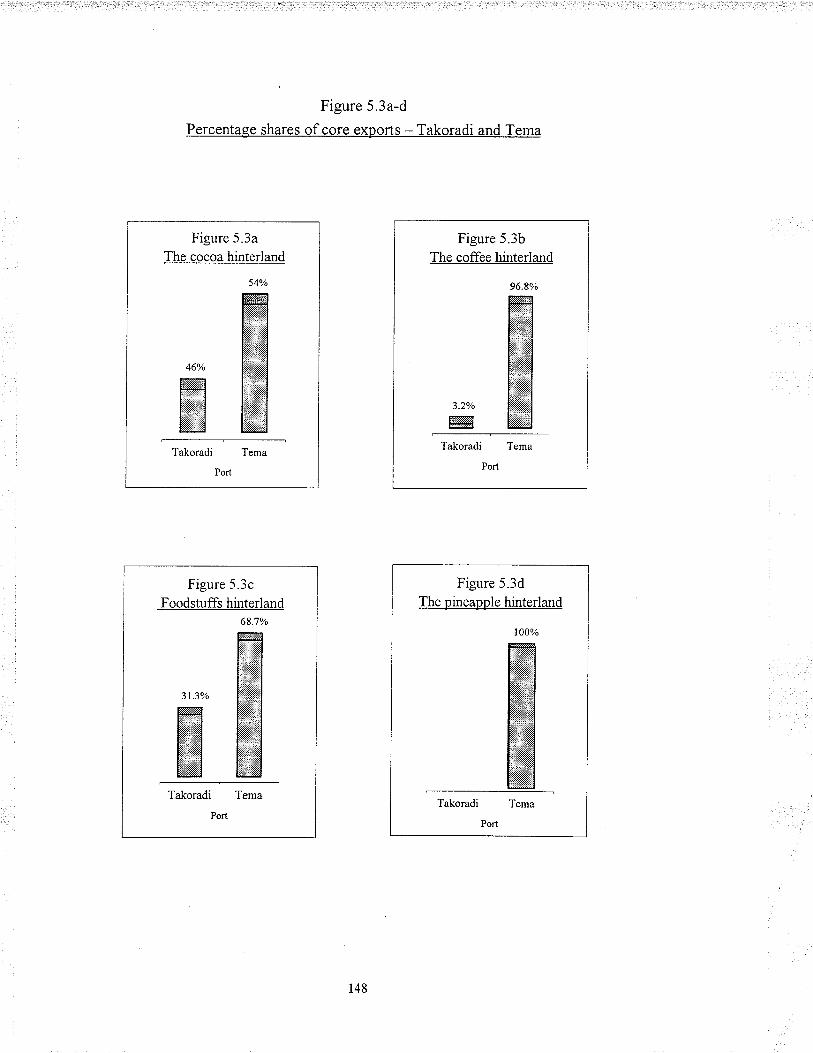
Figure 5.3a-d
Percentage shares of core exports - Takoradi and Tema
Figure 5.3c
Foodstuffs hinterland68.7o/o
Takoradi Tema
Port
Figure 5.3b
The coffee hinterland
Figure 5.3d
The nineapple hinterland
Figure 5.3a
The cocoa hinterland
Tema
< ^o/
T#BÍIre.IiiNì\Nl,ii¡êr!:ili¡
l-\is¡t itl.ìlliiïr!ili¡Kr:ili:l:ìll¡
460/o I-\ñ\ìñffi lìi$sl$llsËËÈl läiilìrì.ìiiltiiilìtÈ$ l.\'ììì,irlFritÌ¡rji:iil l{ììì{!irìi¡
Ê$ÌìÌsill [irtr\lr$,if\\ì\ìirù h\tr{Nì\\ìN ¡.N
148
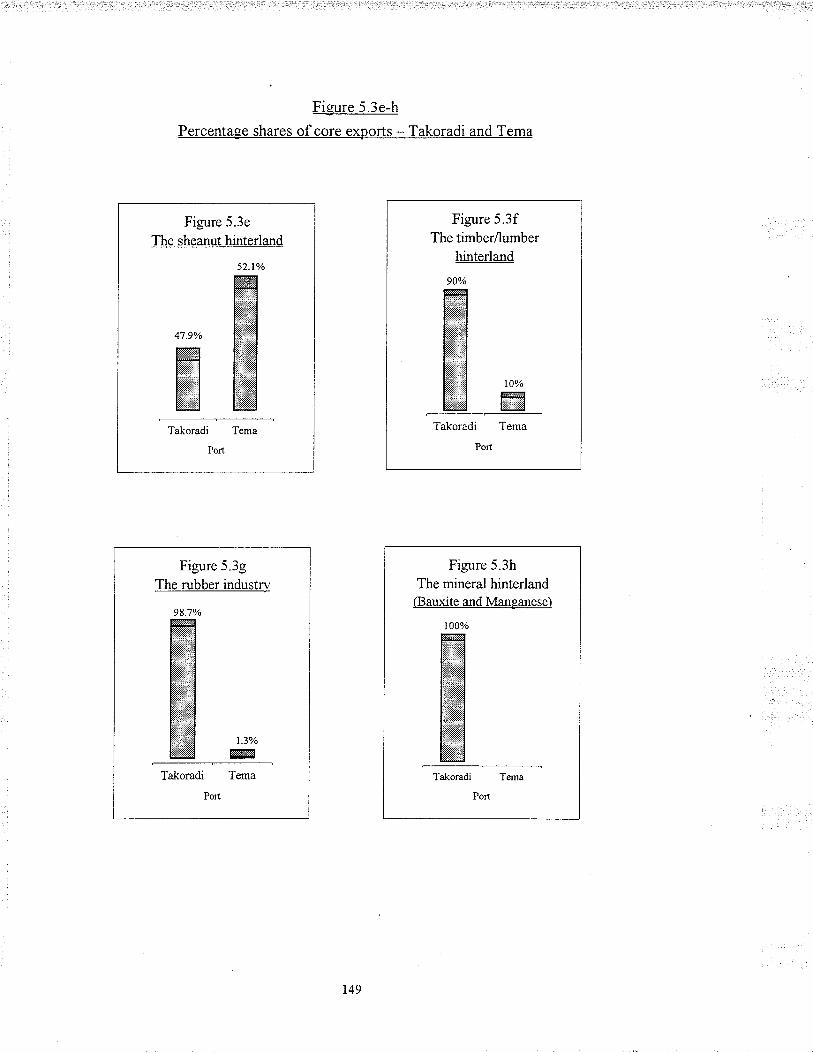
Figure 5.3e-h
Percentage shares of core exports - Takoradi and Tema
Figure 5.3e
The sheanut hinterland
4',7.90Â
N
52.1o/o
N
NTakoradi Tema
Port
Figure 5.3fThe timber/lumber
hinterland
ß%ñlììììììiiil
Takoradi Tema
Port
Figure 5.3g
The rubber industn'
13%
@@
Port
Figure 5.3h
The mineral hinterland(Bauxite a¡d Maneanese)
Tema
Port
149
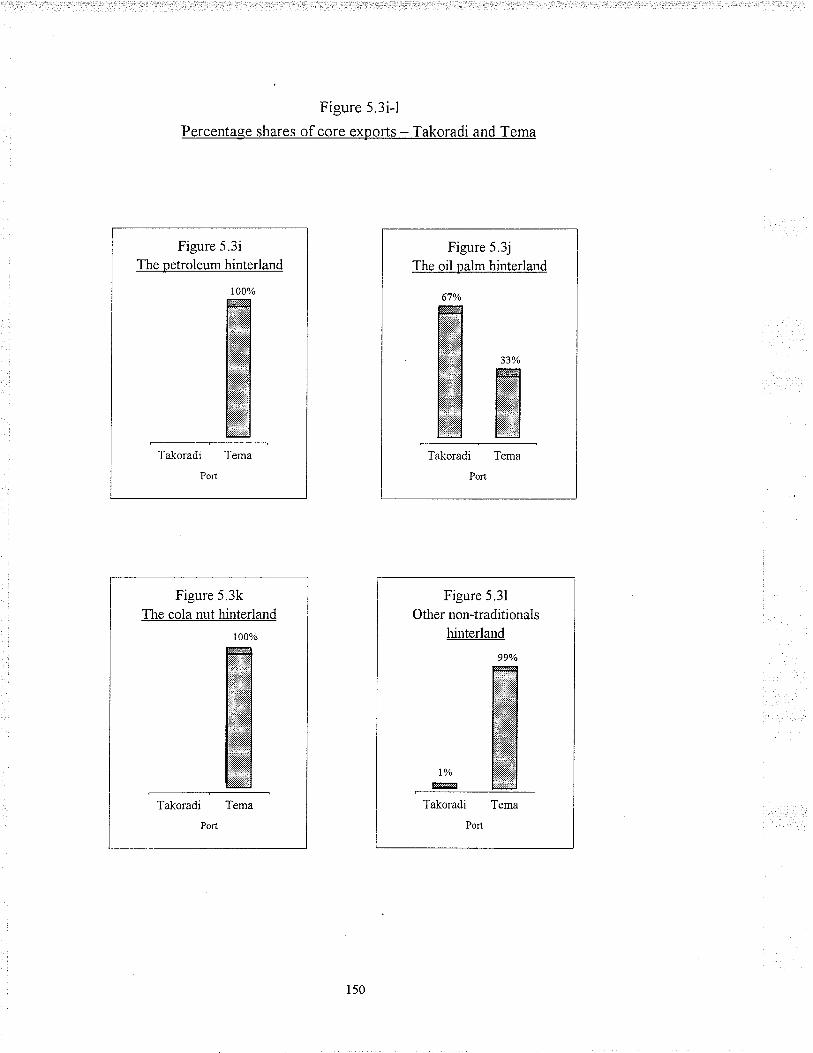
Figure 5 3i-l
Percentage shares of core exports - Takoradi and Tema
Figure 5.3iThe petroleum hinterland
t00%M
NNIh\\ììl-ì$l
$,r,\äiÈl
NTalioradi Tema
Port
Figure 5.3kThe cola nut hinterla¡d
Ta]çoradi Tema
Figure 5.3j
The oil palm hinterland
67o/o
MII\\.\\\Y
N 33o/o
H\\ì\N ffi¡I$i\\Nì h\\iNI¡..i\ì..ri\ìl R\'ìi\\l
ti.NììJ Nì\_iììltliììiì,ì.\J Nliììiilï
INN¡ NNTakoradi Tema
Pon
Figure 5.31
Other non-traditionals
hinterland
lVo
ry
99%
t\\iù\iìl
tN\\\l¡\\\\\\l:tllììll\\\Þ.\\$\Nl
NNì\\'$
N"_-.-\l
Takoradi
Port
ls0

From the Figures 5.3a-l we can draw the following conclusions. First, each of the two
ports still controls its natural hinterland, which is region 1 for Takoradi and region 2
(Hilling, 1970) for Tema. This is due to the monopoly both ports have on those traffics
found in their natural hinterlands, monopoly reinforced by their handling equipment.
Thus, Takoradi is specially equipped with facilities for handling dry bulks such as
minerals and timber while Tema is equipped with facilities for handling wet bulk such as
petroleum products. Apart from the competitive hinterlands of cocoa and shea nuts, Tema
dominates the rest of the hinterland - cola nut, pineapple, coffee, local foodstufß and
other non-traditional crops - which mostly lie in regions 3 and 4 (Hilling, 1970). Even
for the competitive hinterlands of cocoa and shea nuts, Tema has a larger share - 54 and
52.1 per cent as against 46 and 47.9 per cent for Takoradi. Evidently, then, without any
shadow of imagination, it can be concluded that Tema now controls the regions 3 and 4, a
factor contributing to its leading stand in the market share of the overall tonnage.
Nonetheless, we must recognise that like all hinterland demarcations the result is
necessarily subjective, but reasonably accurate, based on the writer's knowledge of
Ghana gained from reading and as a native of the country (Hoyle, 1967).
Let us now examine some problems and factors that have contributed to the current
hinterland structure of the ports. One of the contributing factors to the current hinterland
structure is the transport network linking the ports and the interior. Takoradi is
predominantly a railway port while Tema is a road port. Takoradi's reliance on the
railway is borne out by the port's handling of bulþ cargo like bauxite and manganese. In
1983, about 80 per cent and 40 per cent of Takoradi's cocoa and timber was also carried
by the railway (Mensa, 1993). The railway network centres on 3 principal lines in the
pattern of a rough letter'A' ortriangle. The apex of the system is in Kumasi, the capital
of the Ashanti region, and the bases end in Takoradi (Western Line - WL) and
Accra/Tema (Eastern Line - EL). The WL, which is the oldest begun in 1898 from
Sekondi, reached Tarkwa in 190i, Obuasi in 1902 and Kumasi in 1903. The Tarkwa-
Prestea branch line was completed in 1911. The EL, which was started in 1909 and
completed in T923, runs from Accra to Kumasi. The Central Line, which was completed
in 1927, forms the bar of the triangle and runs from Huni Valley on the WL to Kotoku
Junction on the Eastern Line.
151
There are also three major branch lines, of which two connect the WL; the first, from
Dunkwa to the bauxite mine at Awaso (about 75 km) and the second from Tarkwa to the
gold mine at Prestea (about 30 km). The third branch line to Kade (about 40 km) is
comected to Achiasi Junction on the Central Line. The networh which has a total length
of about 947 krn, is of single-track metric gauge (1067 mm) with the exception of about
30 km of double track between Takoradi and Manso, which is justified by the relatively
high traffìc density between the two towns. The network is shown in Figure 5.4 below. A
combination of factors has plagued the railways, causing Takoradi to lose a significant
portion of its hinterland. These factors are discussed below.
One main problem besetting the railways is the old and meandering nature of the
network. As most of the railways were built during the colonial era, they follow river
courses - which was the cheapest technology at the time - making the railways
winding and dangerous to travel on. At the moment 40 per cent of the WL is on curves
and many have a radius as low as 150 metres. The steepest gradients are I.25 per cent on
the main line and 2.5 per cent on the branch line. What is more, poor design and
inadequate drainage have made most of the lines subject to flooding during the rainy
season as they lie in valleys. In addition, in some of the stations, the length of the
crossing loops do not exceed 400 metres, limiting operations to trains exceeding 30
commercial wagons. The entire rolling stock fleet uses a vacuum brake system, another
factor that limits the train's length. Ghana railways have not yet adopted dynamic
braking. On the WL there are about 1440 sleepers per kilometre, with most of the
sleepers being made of timber rather than steel. The absence of the culture ofmaintenance has also meant the rapid decay of the sleepers with the upshot of derailments
of trains (DanRail Consult AS Consortium, 1996). Because of these problems, speed
limits of as low as 8 kilometres per hou¡ are in force over large segments of the track.
This speed limitations notwithstanding, poor track conditions accounted for 55
derailments in 1994. An additional seven collisions arose as a result of human error in the
train control system (Intermodal Transport Study, Vol. 1, 1996).
152

ja
it,)I.lbr..
Itíi
J;-¿-.(jjb\lL ...
t Yt**.r)'
¡J4'""'ièç*ù (!
\o / \J=l i)Såreai'¿,2( !rX) L \.
vt/\
\¡/ 1..
&{'Àkoscmbo
J-'-'-'-'-'-'-!!
1!Ii'f
, Yaoei
r-orj Tomala Porri *"'"4
-)l,5 I/'l!l!lt¿li à Sunyani tit.r'/ I(J
í -umas'Ív
\ 4*"ro lj \\1\\l\ Vornrln,o! j / Achrasyr-\ or*rqffi
-.--\ Yi**"zt-'
(.
-/<>!-o
ACCRA
0 80km
akorad¡
@ Part
3 Aerod¡ome # Reilways
t lnt"rnot,onol Airpon
Figure 5.4
The railway network of Ghana
Source: Berneh and Dicksorl 1984
153
Besides the physical and technological problems, the railway also is faced with an
economic problem, which comes in the form of competition from road hauliers,
especially in the carrying of cocoa and timber. The inability of the railway to compete
with the road hauliers has been due to their high rates in comparison with those of the
road hauliers. The road hauliers can afford to charge lower fares as they have the
advantage of taking cargo on their way back from Takoradi. The trains, on the other
hand, have to return with empty wagons, hence the umcompetitivenes of the railways.
Moreover, most of the sawmillers have acquired their own transports and thus do not use
the railways3a
Furthermore, the railway corporation is plagued with managerial and administrative
problems. For example, the accounting systems of the Ghana Railway Corporation
(GRC) is deemed too elementary to provide any useful information for meaningful
corporate and business planning. Unsurprisingly, the GRC's operating losses continue to
mount. The corporation's operating loss increased from ø1,009 million in 1990 to
ø10,810 million in 1993 and to about Ø14 million in 199435. Foreign debt service made
up 600/o of GRC's expenses and the biggest contributor to its operating losses. This was
followed by staff costs (25o/o) and fuel costs (I0%). As a result of these problems
plaguing the railways, and it being the major transport network feeding the port, Takoradi
has been cut off f¡om a large portion of its real and potential catchment areas, thus
seriously affecting its output levels.
Takoradi could not find consolation in its road network either, since roads in the Western
Region, Takoradi's tributary, are among the poorest in the country (Ghana Haulage Truck
Drivers Association (GHTDA))'6. Though the drivers acknowledge recent improvements
in the road sector as a result of the rehabilitation exercise undertaken by the government,
they are quick to add that the exercise concentrated on the main trunk roads, leaving the
feeder roads untouched. Thus there are still connectivity problems between the inland
production centres and the buying centres. Consequently, only ten-ton trucks are used to
carry the products from the production centres to the buying centres, from where the
heavy-duty articulated trucks can then transport them to the ports. This problem,
according to the drivers, is very discouraging and has caused loss of interest on the part
of drivers to go to the port. In large part, therefore, Takoradi's low tonnage problem can
'o Conversation with the railu'ay deputy traffrc manager operations - Mr. Sankah
" $us 1.oo = ø15oo.oo (1994)36Information based on discussion with the GHTDA.
r54
be seen as a reflection of its con¡rectivity problems with its hinterland. Indeed, the
distance between Kumasi and Takoradi is shorter than between Kumasi and Tema; yet
port users prefer to use Tema rather than Takoradi3t This finding is supported by Mensa
(1993). He noted thatthe cost of transportingalog from Kumasi to Takoradi was three
times as much as it was to transport the same log to Tema. Compounding matters was the
inconvenience of the drivers having to go to Takoradi via Accra because of the poor
condition of the shorter links to Takoradi. In fact, such was the near atrophy of Takoradi
- losing its export hinterland - that the GPF{A had to intervene with a policy in 1987 to
restrict exports through Tema. Thus, the deterioration of Takoradi's transport network
has been a significant contributing factor to the port's low throughput figures.
Tema, on the other hand, has been insulated from the railway problem, as it is completely
road dependent. Tema is linked to its hinterlands by relatively better roads than those
serving Takoradi. Tema's trade was further boosted by the construction of the Kumasi-
Nsawam road and the construction of small river ports on Lake Volta. Some sheanuts,
cashew and cotton seeds now move from the Northern and Upper East and Upper West
regions through the Buipe river port to Akosombo from where they are transported via
trucks to Tema. A-lternatively, they can be transported via the Kumasi-Nsawam road to
Tema.
With Kumasi as a major collecting centre for coco4 and the existence of a relatively
better road network between Kumasi and Tema, much of the cocoa traffic now goes to
Tema. Cassava chips also come from the Volta region to Tema via the primary road that
connects Tema to the north and lies along the country's eastern border. Yams also come
from the Northern, Upper East and Upper West regions through either the lake or Kumasi
to Tema. Tema also receives yams from as far as Sunyani and Techiman in the Brong-
Ahafo region. Timber is also delivered from Mim in the Western Region, and Kumasi,
Sunyani, Kete Krachi and Hohoe in the Volta Region. Other traf[rc such as coconuts,
cocoyam, bamboo, tiger nuts, palm kernel, coffee, and maize move from the Western,
Central and Brong-Ahafo Regions to Tema. The irony is that about 99 per cent of the
traffic from the Western, Central and Brong-Ahafo regions could have gone to Takoradi
were the transport network, especially the railway, efftcient, for these regions are closer
to Takoradi than to Tema38. Figure 5.5 (insertion) shows the road network of Ghana.
3? Information based on an interview with the acting port operations numâger at Takoradi.38 Interview with GHTDA and officials at the export shed, Tema.
155
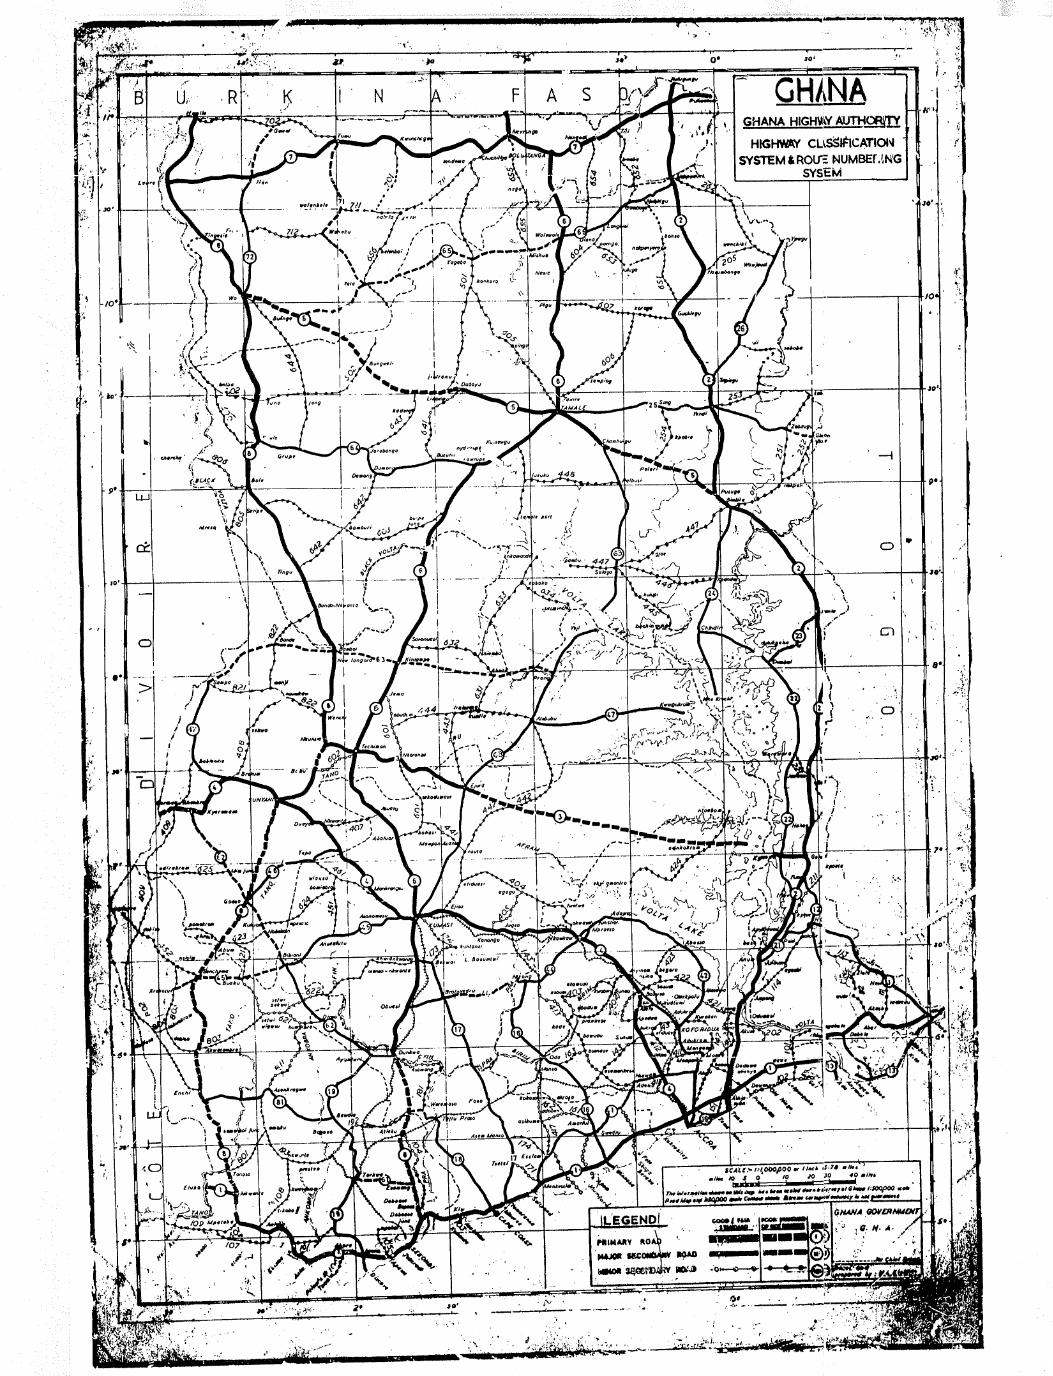
,t;
"..-,.à
-^-/'-l .-
':------i- [-
tJ1
L¡-
tI
A
I

Figure 5.5
The road network of Ghana
Source: Ghana Highway Authority
156
Takoradi's other problems are to do with the public's perception of the port, the ban on
log export, bureaucratic custom arrangements, the spectre of privatisation, and the
adequacy of storage and container stacking areas. There is the perception among the
public that Takoradi is an export port catering for only bulky mineral cargo.
Consequently, a majority of the public is unaware of Takoradi's ability to cater for
imports and non-bulk exports as well. What is more, there is no customs, excise and
preventive service (CEPS) unit in Takoradi, forcing users of Takoradi to process their
customs duties at Tema. The inconvenience of shuttling between Takoradi and Tema has
led to the use of the latter so as to avoid this problem. The spectre of privatisation
hanging over Takoradi has also created a reluctance to invest in the port by the
government. To this end, Takoradi faces continuous deterioration of its equipment and
other port infrastructure.
Furthermore, though both Takoradi and Tema have problems with congestion resulting
from limited storage areas, Takoradi's problem is more acute than that of Tema. Its open
storage and container stacking areas are woefully inadequate compared with Tema's.
Indeed, all these problems have combined to work against Takoradi, causing the port to
lose a significant part of its hinterland to Tema. It was not surprising, therefore, that the
GPHA intervened in the 1980's to restrict exports through Tema to save Takoradi from
precipitate decline.
Differences in hinterland also underlie the differential port tonnages occurring between
the Ghanaian ports and their East African counterparts between Mombasa and Dar es
Salaam. We examine the case between Mombasa and Dar es Salaam frrst.
5. 4 Hinterland: Mombasa and I)ar es Salaam compared
A major contributing factor responsible for the throughput difference between Mombasa
(Figure 5.6) and Dar es Salaam (Figure 5.7) is the difference in their respective national
hinterlands, which is a reflection of their uneven development, with Kenya having a
relatively better economy thanTanzania. In addition, the two por[s also have access to the
extra-national hinterlands of Malawi, Rwanda, Zaire and Burundi.
157
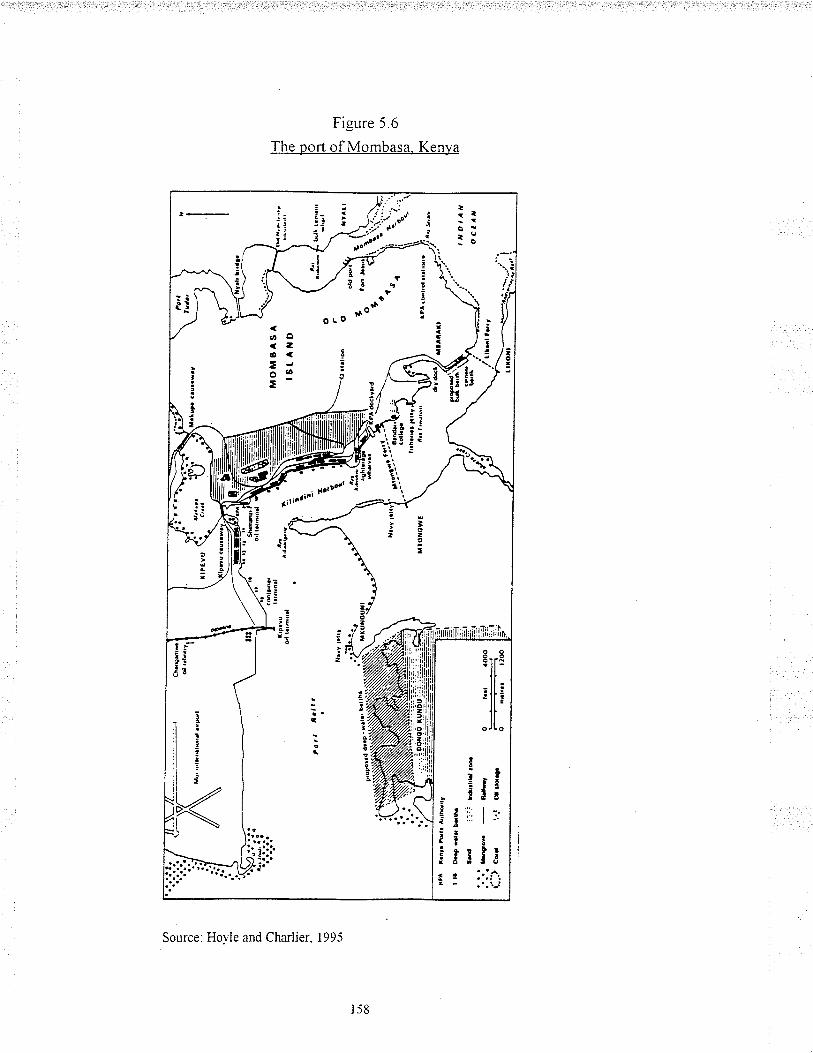
Figure 5.6
The port of Mombasa. Kenya
oo
_Jl,!Jl;
"li"
I;lÉ i:- f I¡
lr:: l-.ã¡:::¡"'i¡ zå¡¡l¡< a t.t,^,
r - ...V
;lal
::
,zl'i
3:
É
¿¡õ<zo<EJ
T-
t
I
T
i?¡
il
ll
,l
Source: Hovle and Charlier. 1995
158
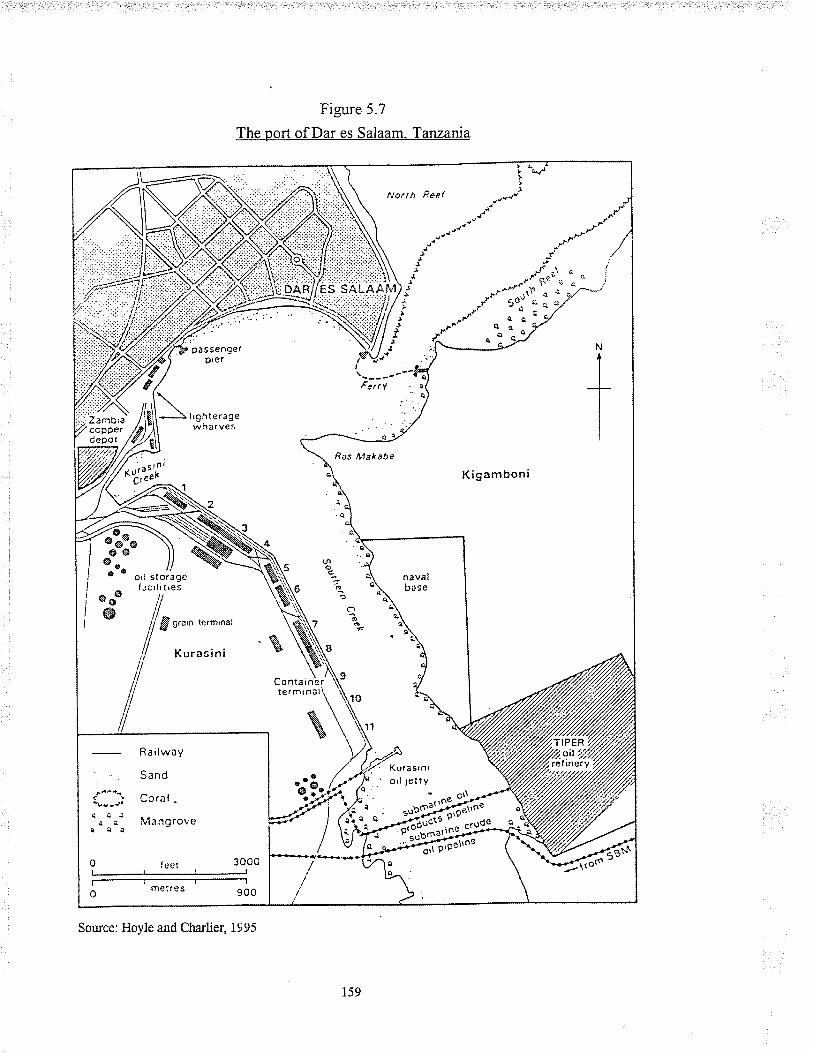
Figure 5.7
The port of Dar es Salaam. Tanzania
!:
u.
tt>))
-¿.'¡'_t*
-É^\ *u' -'1¿ C
-f \r.' i ..
*r-l',aÏ. " t
"7t' 50: e^ r^-/'" a ^/ctyâ-cr'
o o'^!
Kigamboni
¡
Nor t h f?eal
à
t ^z':24 Kurasníorl le¡1y
' .- or\^. rîÈsub${
Ras Makabe
11
.e
c1
a
.a
tñÕ
f
írii
¡
7
6
5
v':-:
pas señ9efptel
lrgh I eragewharves
'xu"1;¡i'c,""r
l,:::::,2;^s:r: Zamtirð
copperdepot
Conlarner \termrnal\ \rog\\*\)
4
ð;t")*w, ø6
facrlrlres
@ ll@ o'''^ ie'minar
ll Kurasini
tl
IRailway
Sand
t -l Lorâl -
ôûJ¡ a fulenoroveâ¡¡
melres
'"ffi#
159
Soruce: Hoyle and Cha¡lier, 1995
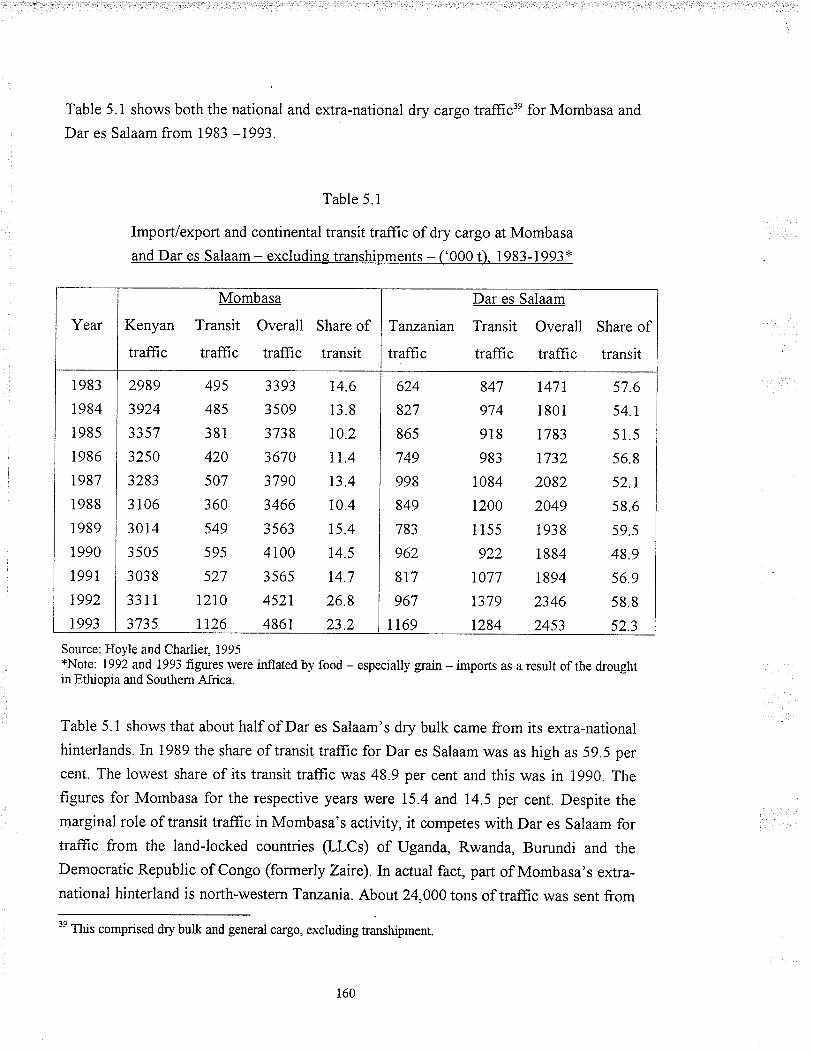
Table 5.1 shows both the national and extra-national dry cargo traffic'e for Mombasa and
Dar es Salaam from 1983 -1993.
Table 5.1
Import/export and continental transit traffrc of dry cargo at Mombasa
and Dar es Salaam - excluding transhipments - ('000 t). 1983-1993 *
Source: Hoyle and Cha¡lier, 1995*Note: 1992 and 1993 figures were inflated by food - especially grain - imports as a result of the droughtin Ethiopia a¡d Soutlem Africa.
Table 5.1 shows that about half of Dar es Salaam's dry bulk came from its extra-national
hinterlands. In 1989 the share of transit traffrc for Dar es Salaam was as high as 59.5 per
cent. The lowest share of its transit trafüc was 48.9 per cent and this was in 1990. The
figures for Mombasa for the respective years were 15.4 and 14.5 per cent. Despite the
marginal role of transit trafüc in Mombasa's activity, it competes with Dar es Salaam fortrafiìc from the land-locked countries (LLCs) of Uganda, Rwanda, Burundi and the
Democratic Republic of Congo (formerly Zaire).In actual fact, part of Mombasa's extra-
national hinterland is north-western Tanzania. About 24,000 tons of traffrc was sent from
3e This comprised dry bulk and general cargo, exclud.ing transhipment.
Year
Mombasa
Kenyan Transit Overall Share of
traffic traffic traffic transit
Dar es Salaam
Tanzanian Transit Overall Share of
traffic traffic traffic transit
1983
1984
1 985
1 986
r987
I 988
1989
1990
1991
1992
1993
2989 495 3393 14.6
3924 485 3509 13 8
3357 3 81 3738 10.2
3250 420 3670 11.4
3283 507 3790 13.4
3106 360 3466 10.4
3014 549 3563 15.4
3505 595 4100 14.5
303 8 s27 356s 14.7
3311 I2I0 4521 26.8
3735 tL26 486t 23.2
624 847 r47r 57.6
827 974 1801 54 1
865 9i8 1783 51 5
749 983 1732 56.8
998 1084 2082 52.1
849 1200 2049 58.6
783 1155 1938 59.5
962 922 1884 48.9
817 1077 t894 56.9
967 T379 2346 58.8
tr69 1284 2453 52.3
160
this part of Tanzania through Mombasa in 1993. The actual competition between the two
ports, however, is the battle for traffic from the LLCs - the extra-national hinterlandsoo.
The LLCs have the choice of using either Mombasa or Dar es Salaam, and their policy
has been one of diversification in orderto avoid over-reliance on a particular port, as they
used to do in the past, when Mombasa served Uganda and Rwanda and Dar es Salaam
served only Burundi. There is a relatively efficient transport network between these ports
and their extra-national hinterlands. There is the northern corridor which links Mombasa
and Kigali (Rwanda) through Nairobi, Tororo, Kampala and Kasese (Van Dongen, 1963,
Tandon, 1973 in Hoyle and Charli er, 1993), with the central corridor linking Dar es
Salaam and Bujumbura through Tabora and Kigoma (ÍIance and Van Dongen, 1958 in
Hoyle and Charlier, 1993). Though both are railway-routes, an optional link by train and
ferry exists via Lake Victoria between Kisumu and Jinja or Port Bell in the frrst leg, and a
final leg between Kigoma and Bujumbura (Burundi). These traffrc routes tolfrom
Mombasa and Dar es Salaam constitute the main activity on these lakes, whose capacity
for international exchanges is said to be greatly under-utilised (Hoyle and Charlier,
ree4).
A diversification has been introduced into the transport network by road-vehicle
operators who have managed to capture a significant proportion of the most lucrative
traffic along these two routes. They have achieved this despite higher cost coupled with
the numerous problems they face when crossing Kenya or Tanzania - a series of controls
and high transit fees plus poor road conditions. The civil war in Rwanda in 1994 gave
rise to a new route to Rwanda and Burundi via Rusomo Falls, thus the trucks linking
Mombasa with the two countries no more go through Uganda but circle around the
southern part of Lake Victoria to rejoin those coming from or going to Dar es Salaam.
There has been another route diversion favouring trafüc from Uganda and Rwanda to Dar
es Salaam. Traffrc from Uganda now can be hauled over Lake Victoria between Port Bell
and Mwanza, and then use the Mwanza branch of the Tanzanian central railway. On this
same branch line there is now the option of traffrc from Rwanda to use the Isaka rail-road
transfer facility, which opened in January 1994. The Isaka rail-road facility is also used to
serve Burundi. On the whole, Mombasa is Uganda's chief port for dry cargo - about
oo The competition discussed here excludes traffic ftom eastern DR Congo (formerly Zure), as trafftc
to/from the Krw Province can for practical purposes be only routed via Mombasa (about 78 000 tons in
1993) and rhat to/from Shaba Province also through Dar es Salaam (about 136 000 tons in f993).
161
475000 tons in 1993 against 17000 tons through Dar es Salaam - but most of Uganda's
oil imports now pass through Dar es Salaam. Dar es Salaam continues to handle the bulk
of Burundi's traffrc, with about 163000 tons in 1993 as against 22000 tons through
Mombasa. In 1993 Dar es Salaam became Rwanda's main transit port with about 158000
tons compared with about 124000 tons through Mombasa.
Besides the important role the transport network has played in extending the hinterlands
of these two East African ports beyond their national boundaries, the introduction of the
intermodal concept in their operations -
especially the idea of inlqnd container depot
(ICD) -
has also been a significant factor in reaching these far hinterlands. Mombasa, in
particular, has gained from this innovation. The Isaka rail-road transfer facility mentioned
above is just one of the ICDs. In Kenya there is the ICD in Kisumu which was opened in
1994. The Kisumu ICD is connected with Mombasa by container block trains and serves
both local and international traffic, namely Uganda and Rwanda. The Kisumu ICD is
considered a miniature of the Embakasi ICD in Nairobi, the capital city, constructed in
1984 with a direct raihainer service from Mombasa. Having realised that the battle for
intermodal traffic cannot only be won at sea and in the ports but also in the inland
domain, the Kenya Ports Authority is doing everything within its power to buttress its
position. For example, it is planning to establish another ICD in Eldoret, to which point
the Mombasa-Nairobi oil pipeline has been extended, with a branch to Kisumu, again
with an eye on transit trafÏïc, by rail from Eldoret or by tanker barges from Kisumu.
The Tanzania Harbours Authority (THA), on the other hand, has yet to adopt the ICD
strategy. The TH,\ for example, is not involved in either the new Isaka rail-road transfer
facility or the Mbeya dry port on the Tatuania-Zambia Railway (TAZARA) In
conjunction with a Malawi cargo centre in Dar es Salaam, the Mbeya facility is used for
Malawi's transit cargoes, which are a welcome addition to the TAZARA traffrc. Unlike
in Kenya, there has not been any plan in Tanzania to establish an ICD in the capital
Dodoma or anywhere in the interior, except perhaps in the Moshi/Arusha area where such
afacility could be served by rail from Dar es Salaam as well as from Mombasa. Table 5.2
shows the dry cargo transit traffrc to Mombasa and Dar es Salaam from 1983-1993. The
statistics show both ports aggessively fighting for trafüc from the landJocked countries.
162
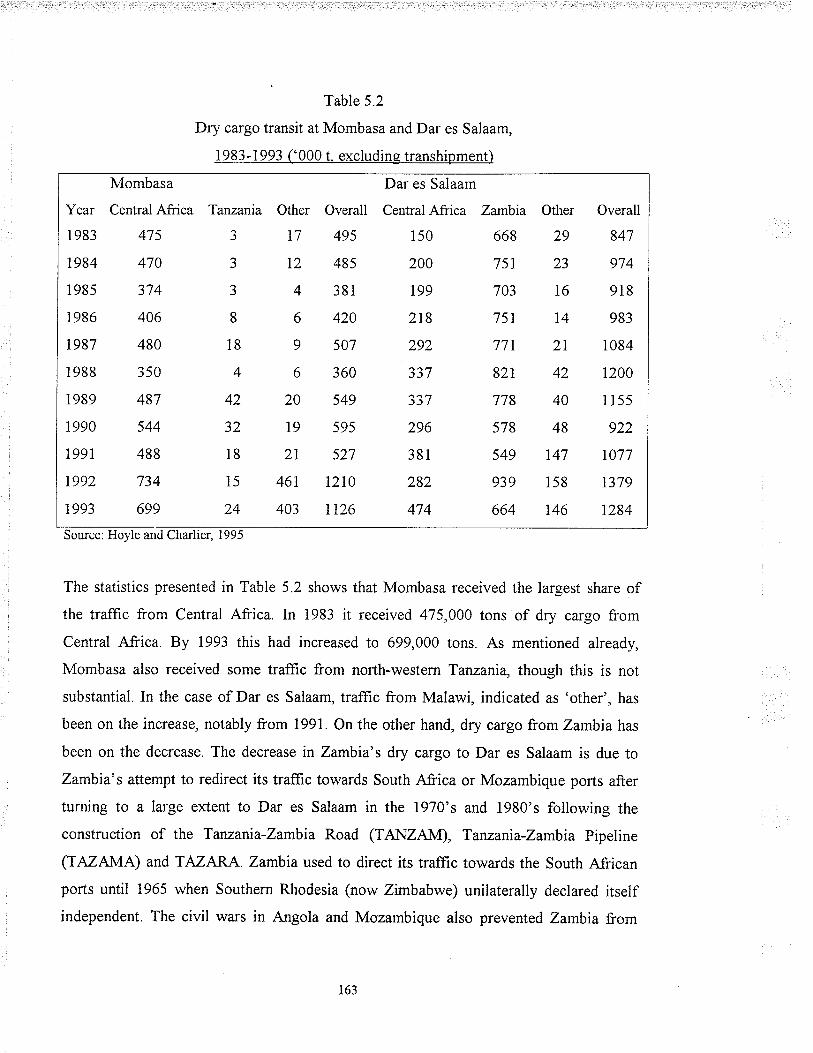
Table 5.2
Dry cargo transit at Mombasa and Dar es Salaam,
1983-1993 ('000 t. excluding transhipment)
The statistics presented in Table 5.2 shows that Mombasa received the largest share of
the traflic from Central Africa. In 1983 it received 475,000 tons of dry cargo from
Central Africa. By 1993 this had increased to 699,000 tons. As mentioned already,
Mombasa also received some traffrc from north-western Tar:zania, though this is not
substantial. In the case of Dar es Salaam, traffrc from Malawi, indicated as'other', has
been on the increase, notably from 1991. On the other hand, dry cargo from Zambia has
been on the decrease. The decrease in Zambia' s dry cargo to Dar es Salaam is due to
Zambia's attempt to redirect its traffic towards South Africa or Mozambique ports after
turning to a large extent to Dar es Salaam in the 1970's and 1980's following the
construction of the Tanzania-Zambia Road (TANZAM), Tanzania-Zambia Pipeline
(TAZAMA) and TAZARA. Zambia used to direct its traflic towards the South African
ports until 1965 when Southern Rhodesia (now Zimbabwe) unilaterally declared itself
independent. The civil wars in Angola and Mozambique also prevented Zambia from
Mombasa
Year Central Africa
1983 475
1984 470
1985 374
1986 406
1987 480
1988 350
1989 487
1990 544
199t 488
1992 734
1993 699
Taruania
J
3
J
8
18
4
42
32
18
15
24
Other Overall
17 495
12 485
4 381
6 420
9 507
6 360
20 549
19 595
2t 527
461 1210
403 tI26
Dar es Salaam
Central Africa Zarnbia Other Overall
150 668 29 847
200 751 23 974
r99 703 t6 918
218 751 t4 983
292 771 21 1084
337 821 42 1200
337 778 40 1 155
296 578 48 922
381 549 147 1077
282 939 158 1379
474 664 t46 1284
Source: Hoyle and Charlier, 1995
163
using their ports, thus leavingZambia with little option than to use Dar es Salaam. Thus
far we see that, apart from their own national traffic, the extra-national hinterland of the
two ports have contributed immensely to their overall throughput, especially for Dar es
Salaam where transit trafTic represented about half of the port's dry cargo traffrc in 1993.
In the case of Mombasa this was about 28 per cent. Undoubtedly, the extra-national
hinterlands of Mombasa and Dar es Salaam act as major contributory factors in the ports'
growth and development. Figure 5.8 displays the East African port system, its attendant
transport network, and associated internal and external hinterlands.
164
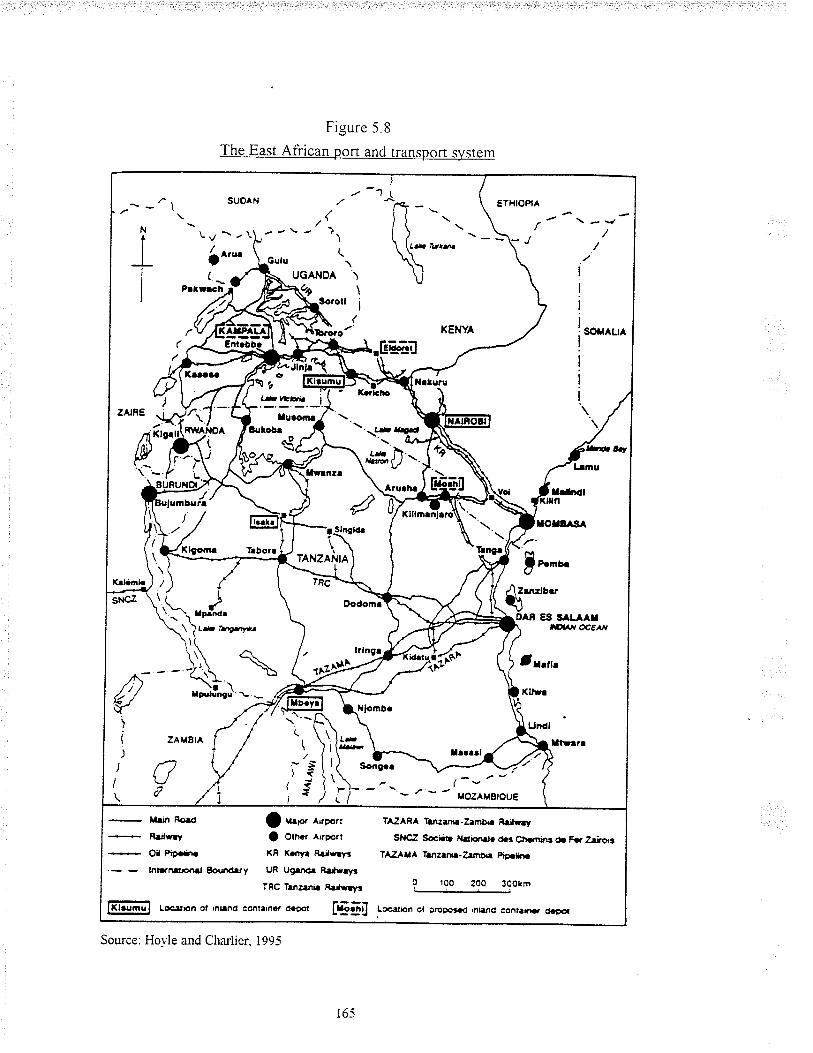
Figure 5.8
The East Afiican port and transport sl¿stem
Lùl|'rn
L-vtu i
ffiÐ-
o^n E3 !¡l¡./ral\ ra.¡, oc6¡x
Iü¡ntaI
)
-?{\Xlgorî¡ Ëbor¡
\.\ .. ("'-il--
\'-l--roz¡vgrou€
(.
)(
\l\
\
t-
-
ll¡,n flo.d f rr.,o, ^nport
ïAZARA T¡nr.n¡-Z¡mò¡ R.¡r¡y* fLú¡rrt I otna lirgorr sficz Sæira t{¡ixr¡lr ctc¡ Ctrrn¡n¡ o Fot Zz?ott
-
O¡ Pip.*ì. XR K.ûy. Beitrryr Îr¿Ay,A Tanz.ñ¡_Z¡rnÞ.¡ piF.litInl.rñãÞ.ral Eoun<tery Uß Wl'x¡ R¿¡ar¡y¡
TRc r¡n¿¡n¡ R¡dûyr 0i t90.--10 390'-
lffil Loc¡rþn ot ,nl¡nd conlarn.r d.pot tE¡,] Locãþn ot 9roÞo¡¿<t rn¡¡¡no conr¡rñ¡r dcpot
Sou¡ce. Ho¡'le and Cha¡lier. 1995
t65

5.5 Summary
This chapter has discussed the significance of hinterlands in the development of
Ghanaian ports and has gone on to draw comparisons with the two major East African
ports of Mombasa and Dar es Salaam. In all the cases, ports with high throughputs were
found to have access to productive hinterlands complete with a relatively efficient
transport network between the ports and their hinterland. This was clearly demonstrated
in the case studies of Tema over Takoradi, Mombasa over Dar es Salaam and Mombasa
and Dar es Salaam over Takoradi and Tema. With respect to the case of the East African
ports versus the Ghanaian ports, the difference we realised lies in the extra-national
hinterlands. The East African ports have access to rich hinterlands beyond their national
boundaries, a phenomenon, which their Ghanaian counterparts lack. From all these
revelations, it becomes obvious that no port authority can take its hinterland for granted.
Indeed, all efforts must be made by port authorities to frght for new hinterlands and
redouble their efforts to secure what they already possess. This being so, policy measures
needed to acquire new hinterlands and revamp old ones should become core constituents
of the corporate goals of every port authority. In Chapter Six I present some policy
recommendations of value to Ghana's government and ports authority.
r66
CHAPTER SD(
CONCLUSION AND RECOMMENDATION
6.0 Introduction
Hinterlands, as has been demonstrated, are the lifeblood of ports and therefore deserve
maximum attention from port authorities. In this chapter I advance some
recommendations for consideration by the Ghana government and Ghana Ports and
Harbours Authority, recommendations suggesting how to approach the hinterland
problems of Takoradi in particular and the two Ghanaian ports in general. The chapter is
divided into two sections. The frrst section is a summary of the thesis while the second
section deals with policy recommendations. To begin with, a thesis summary is helpful.
6.1 Thesis summary
Chapter One revolved round th¡ee main themes. The frrst theme provided a vindication ofthe sub-disciplines of transportation and port geography. Establishing the existence ofthese disciplines was necessary to justify the writing of the thesis within the confines ofgeography. Geography, we noted, shares at least th¡ee concerns with transportation. The
frrst meeting point is the geographer's concern with the transport sector itself. Within the
transport sector the geographer is interested in the network of the various modes oftransport, popularly referred to as network analysis. The dominant technique of analysis
here has been the graph theory. Secondly, the geographer is interested in the provision ofscheduled services. Here, emphasis is on frequency in time and space and the impact ofderegulation policies on scheduled services. The third geographical interest in transport is
on the movement of people with special emphasis on the number of trips originating and
terminating from one point to the other, the flows between these points and the allocation
of traffic between competing modes. Fourthly, is the geographer's involvement incommodity flow analysis, using techniques such as flow and factor analysis. The last but
not the least interest is in the field of terminal analysis. Terminal analysis has been
particularly focused on the temporal and spatial development of the terminal facilities,
their morphology as well as inter- and intra-facility competition.
t67

The second relation between geography and transportation results from the role transport
plays as an agent of geographical change. The notion of transport investment spurring
development is considered axiomatic, although the search for evidence to buttress the
claim often runs into problems. Lastly, geography and transportation intersect on
environmental issues. Geographers are concerned with the new geographical patterns that
will arise should transport use be restrained and the new geographical patterns that would
contribute to such a restraint (Hay, 1991).
It became obvious from the discussion that the present study fell within the terminal and
commodity movement studies, which, together, could also be conveniently studied under
what has been termed as port geography. Port geography, with its many different facets,
is concerned with "what happens at the waterfront, across the frontier between land and
maritime space, wherever trade is carried out, whether that interface is set in a
technologically primitive context or in the context of advanced transport systems"
(Hilling and Hoyle,1984'.1). The preoccupation of this thesis, which is the hinterland,
falls under the historico-genetic facet of port study (Bird, 1984).
The second theme in Chapter One explored the relationship between transport
infrastructure and development. Three views on this theme were recognised; namely, the
positive, passive and negative schools of thought. In line with the positive school of
thought, the impact of port infrastructure on African development was considered, with
special emphasis being directed to its role in urbanisation and industrialisation in Ghana.
Tied to the port-development debate was a discussion of the research problem - the
relationship between port performance, hinterland and overall traffic, - from which the
working statement/hypothesis and research objectives were developed. The working
statement/hypothesis was that hinterlands are fundamental to port development and that
inaccessibility to them by whatever reasons can lead to low throughput. The thrust of the
research objectives was therefore to demonstrate the imporlance of hinterlands to the
development of the Ghanaian ports.
168

As a sequel and due to the centrality of hinterland to the study, Chapter Two was devoted
to the hinterland concept, it proceeded by exploring the theoretical, classification and
functional ramifications of hinterlands. Case studies from Mombasa and Dar es Salaam in
East Africa, Beira in Mozambique, Genoa in Italy and ports in Malaysia were provided to
corroborate the hitherto theoretical discussions. The importance of hinterlands to port
growth and development was confrrmed in all instances. Following the hinterland
concern was a discussion on the methodology to be used in the study. This was the focus
of Chapter Th¡ee. A combination of methodologies was employed. The first was Carter
(1962) and Rimmer's (1966a and b) multi-criteria approach. In short, the approach
stressed the need to adopt a multiplicity of criteria in assessing and comparing ports. The
second technique used was regression analysis. Based on the working
statement/hypothesis that overall traffrc (OT) is a function of performance (P) and
hinterland (Ð - IOT: P + H] -, I used the regression analysis to fìnd what percentage
of a port's overall tonnage was due to performance. Thus, knowing what percentage was
due to performance, we could, by simple manipulation of the equation know what
percentage was due to hinterland effects. The shift-and-share technique was the third
methodology used. The technique \¡/as employed to evaluate the rate of growh among the
Ghanaian ports and the East African ports of Mombasa and Dar es Salaam. These
chapters were by way of introduction as well as providing a background to the empirical
study, which comprised Chapters Four and Five.
In Chapter Four the multi-criteria approach was applied in comparing the ports ofTakoradi and Tema. The throughput statistics selected \¡/ere overall tonnage, variety of
traffic, balance of traffic, container traffrc and leading trafücs. With respect to variety oftrafüc the two ports seem to be specialised in different cargoes. For instance, in 1996
Tema handled all the aluminium and iron/steel while Takoradi handled about 99.9 per
cent of the forest products. What is more, Takoradi's liquid bulk cargo comprised 11 per
cent of the national share and 11.5 per cent of its own overall traffic while these were
88.4 per cent and 32.3 per cent for Tema. While dry bulk cargo does not contribute
unduly to Tema's traffic (29.7 per cent) it formed 71 per cent of Takoradi's overall
traffic. In ¿rddition, Tema had about 83 per cent of the market share of the general,
r69
bagged and container cargo with Takoradi having the remaining 77 per cent- When it
comes to balance of traffic, Tema was found to be more import-oriented while Takoradi
concentrates on exports. However, we found that Tema challenged Takoradi's dominance
of the exporttrafüc and indeed overtook Takoradi in the early 1980's but was restrained
by a directive from the Ghana Ports and Harbours Authority. In 1980 and 1997
Takoradi's market share of the export trafüc was 41 .2 per cent and 63.7 pet cent while
Tema's share was 58.8 per cent and 36.3 per cent, respectively. It must be noted that the
7997 figxe is a little deceptive due to the export restrictions imposed on Tema by the
Ghana Ports and Harbours Authority. Market shares for the import traffic for 1980 and
1997 wereI2.4per cent and 16.0 per cent for Takoradi and87.6 per cent and 84.0 per
cent for Tema, respectively.
Major imports through Takoradi in 1996 were clinker (69 per cent), chemicals (4 per
cent), wheat (6 per cent), general cargo (5 per cent), and other cargo (16 per cent). For
Tema, the major imports were clinker (23 per cent), crude orl (23 per cent), general cargo
(15 per cent), petroleum products (10 per cent), alumna (6 per cent) and other cargo (23
per cent). Takoradi's major exports were aluminium ores and concentrates (35.3 per
cent), manganese ore and concentrates (27 .8 per cent), cocoa beans (1 1.9 per cent), sawn
wood (14.5 per cent) and veneer and plywood (2.6 per cent). Major exports routed
through Tema \¡/ere cocoa beans (37 .6 per cent), aluminium (19.2 per cent), petroleum
oils (19.3 per cent), oil seeds and oleaginous fruits (2.5 per cent) and roots and tubers (2.5
per cent). Overall, Tema's traffic exceeds that of Takoradi. In 1980 and 1997, for
example, Tema's market share of the overall tonnage were 77.1 and 70.6 per cent as
against 22.9 and29.4 per cent for Takoradi.
Results of the regression analysis which related overall tonnage to selected performance
indicators showed Takoradi's performance contributing more (53 per cent) to its overall
tonnage than that of Tema (38 per cent), though Tema's overall torutage far exceeds that
of Takoradi. Findings of the study, as evidenced in Chapter Five, revealed the hinterland
as the main explanatory variable responsible for the tonnage difference between the
Ghanaian ports ano their East African counterparts. The nature and condition of the
170

hinterlands of the ports were consequently examined in detail. With the importance of the
hinterland to port development established, it is now opportune to present a number of
recommendations.
6.2 Recommendations
Takoradi has a serious problem with perception. The port is regarded erroneously by the
public as an export and mineral (bulky) port. Consequently, traffrc originating in
Takoradi's natural hinterland and which could be easily exported/imported through it is
diverted to Tema. With the adoption of a market economy by the government, Takoradi
must realise that the protection it is enjoying will soon end. In fact, there is the
uncertainty of impending privatisation hanging over Takoradi at the momental
(Intermodal Transport Study, Vol. 1). The chief of corporate planning at Tema also
underscored this perception problem facing Takoradi. There is, therefore, the need for the
port authority to market and sell to both the local and international markets its services,
strengths, capabilities and abilities. This can be achieved in large measure through
advertisements in both local and international media.
The internet is another means the porl authority can use to advertise the port. There is no
offìcial website maintained by the port authority and the present internet sites of the port
are nothing but a sham. What exist are just one-page statements about the port by
benevolent people or organisations. Perhaps the Takoradi port authority should take a cue
from the ports in South Africa which maintain impressive internet sites
(http://www.portnet.co.za). This marketing strategy would enable Takoradi to extend its
hinterland and thus help diversify its trafÍtc base. In 1996, for example, Takoradi's major
traffic was still the port's traditional trade of manganese, bauxite, timber/lumber and
cocoa beans. These four products made up 53.7 per cent of Takoradi's overall tonnage.
This shows that Takoradi's traffrc has seen little variety or change, at least in terms of
tonnage. There is therefore the need for the port to diversify its traffrc base, especially as
the government is putting more emphasis on non-traditional exports following the decline
in the prices of the traditional exports on the world market. One reason underlying
ot Interview with Takoradi's port operations marnger.
t71

Tema's success is its relatively wide traffrc base. In 1996 the GEPC listed 118 export
items transferred through Tema but only 42 through Takoradi. Of the 42 export items
through Takoradi just eight exceeded 40000 tonnes whilst the figure for Tema was
eighteen. Clearly this is a policy Takoradi authorities have to consider with all
seriousness.
But as Kirk (1976) has noted, in making sure a product is right for the market, the
marketing function must be a major contributor to both pricing decisions and product
design. He notes fi¡rther that "product design in the case of port services includes items
such as berth specificatio4 speed of turnround, assistance with document procedures,
storage facilities, damage-free transit, ....." (Kirh 1976:205). By extension, Takoradi
needs to improve these products before selling them, especially in the areas of
documentation assistance, storage facilities, containerisation and equipment. At the
moment open storage areas and sheds are woefully inadequate, so a¡e the container
stacking areas. The port's container technology is obsolete, to say nothing ofthe fact that
the port lacks the necessary equipment and is plagued by the shallow depths of the berths.
In the light of the ongoing privatisation and free market philosophy being pursued by the
government, not to mention the continual whining about lack of money, and the port's
authority inability to frnance these projects, it is recommended that certain aspects of the
port's operations be privatised. Some of these areas could include the stevedoring,
container services and the storage areas. In essence, opporfunity should be given to
private individuals who have the means and are interested to build and operate these
facilities. Takoradi can, in fact, capture a greater portion of the cocoa hinterland if itcould build more sheds and storage facilities. At the moment one of the main deciding
factors regarding which port receives cocoa traffrc is the availability of sheds. It will
therefore be in Takoradi's interest to have more sheds to enable it capture a greater
portion of the cocoa hinterland, for it al¡eady has the advantage of proximity to the cocoa
growing areaso'. Another reason why Takoradi needs to develop its container trade is to
do with the rapid containerisation of timber, sawn logs and cocoa taking place. Refusal to
o2 Interview with officials at the Tema cocoa shed and the Gha¡a llaulage Truck Drivers Association(GHTDA).
172

adopt an extensive container technology could see the complete diversion of this trafYtc
from Takoradi to Tema.
With respect to documentation processing Takoradi has a major hurdle to jump -
as
already pointed out. There is no Customs Excise and Preventive Service (CEPS) office at
Takoradi. To save time port users prefer using Tema where they can receive both
customs and port services at the same place. Therefore, decentralising and devolving
some authority to a CEPS unit in Takoradi is highly recommended. This would enable
Takoradi to attract more traflìc and thus widen its hinterland base.
As noted in the previous chapter, the transport network, notably the railway, linking
Takoradi with the rest of the country is very poor, and requires urgent attention. As
Hilling (I975.16) aptly cautioned, "no port can be more efücient than its hinterland links
permit". Against this backdrop it is suggested that a massive rehabilitation of the railway
network - repairing and replacing old and outdated tracks and wagons, modernising the
railway system with state-oÊthe-art technology - serving Takoradi be undertaken by the
port authority and the government. This of course is a huge investment, far beyond the
capabilities of the Takoradi port authority. The government would therefore have to
shoulder this responsibility. In this light, the government is urged to act on the
recommendations prepared by the Thorburn Colquhoun International and partnership
(1996). A summary of their recommendations, drafted on the belief that the railway can
again provide economically and frnancially viable transport services, is reproduced
below.
6.2.1 Financial
L The government should assume the railway's long-term debt.
2. The necessary funds should be provided for completion of the ongoing rehabilitation
projects and for one-time expenditures on restructuring.
3. The railway be fully responsible for financing its operations, maintenance, and
investment without government subsidy.
t'|3
4. The railway be free to set its cost and tariff structure to its own advantage for
products that can be transported by road. For products such as minerals where the
railway has a natural monopoly, tariffs would be set according to formulas agreed
with the government. An exception will be social services mandated by the
government and which are not financially profìtable.
6.2.2 Operational scope
1. The railway should focus on developing its most productive element - the WL - to be
fully competitive with road transport, and to recapture its lost traffîc, especially in
cocoa. It should also aim to transport a significant number of containers, both for
import and export.
2. The railway corporation should actively participate with the government and private
sector in developing the concept for the inland container depot at Fumoase, near
Kumasi.
6.2.3 Organisational
The Ghana Railway Corporation should assign all its management resources to pursuit ofits core business: the operation of a modern transportation service of which railway
operations would form the most important component. All things being equal, the railway
should be able to compete with the road haulers after its rehabilitation. This should
enable Takoradi to recapture some part, if not all, of its lost hinterland.
With regards to roads, attention needs to be directed at the feeder roads which connect the
production centres in the interior with the primary and secondary roads, which link the
collection centres. There is the need to upgrade the feeder roads to an all-weather road
status to enable their use all year round.
Now let us consider the two ports as a whole, that is, the Ghanaian port system. One ofthe main factors, which underlie the differences in tonnage between the Ghanaian ports
and their East African counterparts, is the hinterland. The East African ports have access
to extra-national hinterlands, which their Ghanaian counterparts do not have. This has
174

been made possible by the relatively efficient transport network linking the ports to these
external hinterlands. There is a vast international hinterland beyond the boundaries of
Ghana, especially in relation to the landlocked countries of Burkina Faso, Niger, and
Mali (Figure 6.1) that the Ghanaian ports can aspire to access. At the moment only a
small amount of trafüc from these external hinterlands makes its way through the
Ghanaian corridor, although the Ghanaian ports are capable of handling tons of traffic
from these landlocked countries. A trial import of 7000 tonnes of rice through Tema from
Burkina Faso in 1998, for example, took only four days to unload. This compared with
the usual eight days it took the importer to unload the same amount of cargo through
Abidjan in Côte d'Ivoire (Ivory Coast). Consequently a whole shed has therefore been
reserved for Burkina Faso at Tema. Although the GPHA is making the effort to enter this
international hinterland it faces the problem of poor transport connections from Ghana
into these countries. A major help here is needed from the government. The government
must create the enabling environment by improving the transport network linking Ghana
to these external hinterlands.
The following roads will need special attention in this regard: the Kumasi-Kitampo,
Techiman-Kitampo, Techiman-Hamle, Wa-Tumu-Navarongo and the Techiman-Bamboi-
Hamle-Wa. These roads link Ghana to its northern neighbouring countries. The
Techiman-Kitampo road, for example, which is only 54km, takes drivers about five hours
to travel at the moment. The Bamboi-Hamle road is untarred. It is described as a driver's
nightmare, as it causes frequent tyre deflation which compels drivers to refuse to carry
traffrc on this roado3. With a good transport network and efficient marketing, Takoradi, it
is envisaged, could easily enter the Niger and Burkina Faso hinterlandaa. Tied to this is
the need for the GPHA and the government to actively pursue and adopt the intermodal
and inland container depot (ICD) concept, a concept fully adopted by Mombasa.
o' Intervierv with GHTDA.oo Interview lyith Chief of Corporate Planning. GPHA, Tema
t75

, Figure 6.1
Map ofWestAfrica
176
The operation of an ICD, for instance, can help alleviate the congestion problems facing
the ports, since cargo meant for the interior can be directly sent via the intermodal system
and thus avoid storage and its attendant congestion problems. In the 1980's, for example,
Tema lost traffìc to Lome, Togo, as a result of congestion problems. The ICD will also
help in reducing container transit time at the ports. The long proposed ICD at Fumoase,
near Kumasi, should therefore be given the needed push to become a reality. Despite the
advantages of ICDs and intermodalism the government has still not sanctioned them for
security reasonsot (Amoyaw, 1991, Hillin g, 1976).
A discussion with an official of one of the major shipping lines revealed the problems
involved in operating intermodalism in the country. The ofücial recounted of the delays
involved in getting permission from the government including the number of government
security personnel who have to follow and inspect the containers at their destinations.
Thus in the end, the purpose and goal of the intermodal concept ends up defeated. A
roundtable discussion by GPHA with the government on the importance of these
concepts to the development of the ports would therefore be in order (Intermodal
Transport Study, Vol. 1, 1996)46.
While on this, it will also be appropriate for the GPI{A and the government to reduce the
customs formalities involved at the ports. Today's shipping business is operated on speed
so any port where shipping procedures take too much of the shipper's time is surely at the
loosing end. There are estimated 26 steps in 5 stages required of shippers at Ghanaian
ports (see Appendix 'VI). Presently, the average dwelling time for a container at the port
is 25 days. This compares with one day in European and North American ports. Even
Israel with all its security problems has a container dwelling time of one day. It is
estimated that ship-owners and the Ghanaian economy as a whole could save as much as
295 US dollars per container if the dwell time were reduced to seven days. On this note,
it is recommended that the customs procedures be reduced to minimum by reducing the
as The major security reason is the fear of people smuggling arms into the country to overth¡ow thegoverrunent. (Interviewee's idenûty caînot be disclosed)ou Name and company of the ofhcial spoken rvith in corulection with the intermodal problems in thecountry cafllot be dilulged.
t'77
amount of cargo examined, reducing the number of documents examined and there must
be a better co-ordination between customs and port authorities and port users. There is
also the need to expedite the efficient use of the Automated Systems Customs Data
(ASYCUDA) documentation process, which was implemented some years back.
Furthermore, to be able to enter the international hinterland, the Ghanaian ports will have
to be competitive in terms of their tariff At the moment the Ghanaian ports are the most
expensive along the West A-frican coast, with the exception of discharging import
containers where Lagos charges US$ 181.53 for a 2}-foot container as against US$
168. 1 1 charged by Tema/Takoradi. Abidjan has the lowest charge of US$ 82.43. Douala,
Lome and Cotonou charge US$ 82.43, US$ 101.79, and US$ 102.62 respectively for the
same 2O-foot container. Again, the US$ 10045 charged for handling empty containers at
the Ghanaian ports is uncompetitive compared with the US$ 36.66 and US$ 42.83
charged by Lagos and Abidjan. At the moment Abidjan controls a greater portion of the
hinterland of the landlocked countries. They already enjoy the 'French fraternity' with
the landlocked countries plus their cheaper tarifß. For the Ghanaian ports to capture these
Iandlocked hinterlands, therefore, would require a restructuring of their tariffs to a more
competitive level.
There is also the need for the GPFIA to set up a French department at both ports
considering the fact that all the landlocked countries are francophone nations. To this end
the GPIIA must begin to employ French-speaking personnel to smoothen documentation
process and its customer relations with their potential customers.
There are some operational issues that need to be tackled as well if the Ghanaian ports are
to expand their hinterlands to include the landlocked countries. With ships increasingly
becoming larger with their attendant reduced cost of sea freightaT; the current draft at the
ports constitutes a major limitation to the ports' operations. Besides the draft problem,
there is the need for more operational berths. Currently only two berths @erth 1 and 2)
a? The cost per TEU kilometre (mile) of a vintage 1200 TEU vessel is $.03 US dolla¡s while for a modern3000 TEU vessel it is $.018 US dolla¡s.
178
are in operation at Tema with depths of 9.6 metres. The remaining ten are too shallow to
be used. Discussion with two major shipping companies entailed tales of complaints and
dissatisfaction of the services provided by the GPFIA. The consensus \¡/as that there
should at least be two berths for each container terminal with deep depths to
accommodate much larger ships. Equipment is also a big problem. Most of the equipment
are broken down whilst there is the complete lack of needed and modern equipment such
as gantry cranes.
Also the ports, especially Tema need dedicated container terminals. Tema, for example,
receives about 165000 container boxes annually. It is recommended that more berths be
dredged and expanded to accommodate modern ships. The decision by the port authority
to pull down sheds 1 and 2 to make more room for container terminals is a good idea and
the¡efore should be taken up with all urgency. AIso, stock should be taken to assess
which equipment need to be acquired, replaced or repaired. Indeed this will require
frnancial investments GPHA cannot meet alone. It is estimated that about US$ 50-60
million will be needed to undertake a project as recommended above. In this light, it is
suggested the government use its good offices to secure a loan from the international
community like the World Bank and other international financial institutions to help
finance the project, especially the aspect to do with dredging since private investors
would not likely be able to bear such a cost. In addition, the stevedoring aspect could be
privatised to interested investors. It is believed that when these recommendations are
given due attention by all the parties involved the Ghanaian ports will be able to expand
their hinterlands both within and without and can thus become a force to reckon with in
the region in the dynamic and competitive port and shipping business.
t19
REFERENCES
Abrahamsson, B. J. (1980), International Ocean Shipping: Current Concepts and
Principle s (Westview, Colorado).
Addo, S.T. (1979),"The role of transport in the socio-economic development of
developing countries: a Ghanaian example" The Journal of Tropicøl Geography
Vol. 48, p.I-7.
Addo, S. T. (1994), 'Port cities and the international trade of Ghana' African Urban
Quarterly Vol. 9 Nos. 1&2. p.53-68
Addo, S. T. (1995), 'Impacl of Tema port on urban development'Paper presented at the
Fifth International Conference of Cities and Ports, Dakar, Senegal. 22-25
November.
A-lexandersson, G. and Norström, G. (1963), World Shipping (John Wiley, New York).
Alonso, W. (1964), 'Location theory', in Regional Development and Planning (eds
J. Friedman and W. Alonso), GWT Press, Cambridge, Mass.), p 78-106.
Amoyaw, B. (1991), Tema Port and the Inlernational trade of Ghqna: A Study in
Transportation Geography, 1970-1990, Unpublished B.A dissertation.
Department of Geography, University of Ghana.
Amoyaw, B. (1997), Housing Provision in Urban West Africa: A Contparative Study ofFormal Housing Delivering Schemes itt Tema, Ghana. Unpublished MPhil
Thesis. University of Bergen, Norway.
Barber, C. L. (1970), 'Opening remarks' in Transportation and Regional Developntent:
proceedings of a conference pp.1-3 TyrchniewiczE. w and Tangri o. p (eds)
Center for Transportation Studies. University of Manitoba.
Beaver, s. H. (1967), 'Ships and shipping: the geographical consequences oftechnological progress' , GeographyYol. 52, p.1333-156.
Best, A. G. G. (1966), The Swaziland Railway: A Study in Politico-Economic Geography
(Michigan State University, Michigan).
Boame, A. K. (1998), 'Primary-export-led growth: the evidence of Ghana' Journal ofEcononti c Developntent Y ol. 23, No. 1 p.17 5-194
Bird, J. H. (1963), Ihe Major Seaports of the Uniied Kingdon (London, Hutchinson).
180

Bird, J. H. (1980), 'seaports as a subset of gateways for regions: a research survey',
Progress in Humam Geography Vol. 4, p 360-370.
Bird, J. H. (1981), 'Land/sea interface', lilorld Shipping in the 1990s, Greenwich Forum
VI, records of a conference at the Royal Naval College, Greenwich,23-25 Apnl
1 980 (Guildford, Westbury), p.21 1 -21 5.
Bird, J. H. (1982), 'Transport decision-makers speak: the seaport development in the
European Communities Research Project', Maritime Policy and Management
Vol. 9, p.1-22 83-102.
Bird, J. H. (1983), 'Gateways. slow recognition but irresistible rise', TijdschrÌft voor
Economishe en Sociale Geografie Yol. 74, p.196-202.
Bird, J. H. and Pollock, E. E (1978), 'The future of seaports in the European
Communities' , Geographical Journal Yol. 744, p.23-48.
Boerman, W. E. (1951), "The Need For Special Examination of Particular Aspects of
Port Geography" Tijdschrifr voor Econontische en Sociale Geogrøfie Yol.42,
p.347-349.
Britton, J. N. H. (1965), "The External Relations of Seaports. Some New Considerations"
Tijdschrift voor Econontische en Sociale Geografie Vol.56, p.109-1L2.
Button, K. J. (1982), Transport Economics (Heinemann, London).
Carter, R. E. (1962),'A comparative analysis of the United States ports and their traffic
characteristics' , Economic Geography Yol. 3 8, p. 162-17 5.
Chatfield, C (1975), Ihe Analysis of Time Series: Theory and Practice (Chapman and
Hall, London).
Chinitz, B. (1960), 'The effect of transportation forms on regional economic growth'
Traffic Quarterly Vol. 14 p.129-142.
Chu, K. Y. (1978), The Growth and Decline of the Major British Seaports: an analysis ofthe Pattern of Non-fuel Cargo Traffic 1965-1974, University of London,
Unpublished PhD thesis.
Couper, A. (1972), The Geography of Sea Transport (London, Hutchinson).
Dickson, K. B. and Benneh, G. (1990) A New Geography of Ghana Longman. Essex.
Elliot, N. R. (1969) 'Hinterland and foreland as illustrated by the port of the Tyne'
Tijdschrtft voor Economishe en Sociale Geografie Vol. 60, p.249-263.
l8t
Enders, W. (1995), Applied Ecotnometric Tinte Series(Wiley, New York).
Frankel, E. G. (1987), Port Planning and Detelopntent (IohnWiley, New York).
Gauthie¡, H. L. (1970), 'Geography, transport and regional development' Economic
Geogt'aphy, Vol. 46 p.612-619.
Ghana Export Promotion Council (1996), Ghana Export Bulletin (Annual Report).
Ghana Ports and Harbours Authority (MIS, Tema), Statistical Information 1993-1996.
Ghana Railway Corporation (1996), Railway Policy Reþrm and Restructuring Study
Final Report (Vol. II Annexes) October, DanRail Consult As.
Ghana Shippers Council (1995-1996), Maritime Trade Statistics Ghana, VoL I, No. I.
Gilman, S. (1977), 'The economics of port location in through transport systems'
Intentational Journal of Transport Economics, Vol. 4, p.257-270.
Goss, R. O. (1968), Studies in Mqritime Economics, (Cambridge University Press,
Cambridge).
Greenwood, R. H. (1975), 'The changing supply patterns of raw materials and fuels
brought to the United Kingdom by sea, 1946-1970', Paper read to the Institute of
British Geographers Transport Study Group, Annual Conference, Birmingham.
Hance, W. A. and Van Dongen, I. S. (i957), 'Beira, Mozambique's gateway to Central
Africa', Annals of the Association of American Geographers, Yo1.47 p.307-335.
Hay, A. (1990), The Dictionary of Human Geography (eds Gregory, D and Smith, D)
(Blackwell, Oxford).
Hayuth, Y. (1982), 'The port-urban interface: an area in transition', AreaYol.74,p.219-
224.
Hayuth, Y. (1982), 'Intermodal Transportation and the Hinterland Concept' Tijdschrift
voor Economische en Sociale Geografie Y ol. 73 , p.l3-2I .
Hepple, L. (1994), The Dictionary of Human Geography (eds Gregory, D and Smith, D)
(Blackwell, Oxford).
Hilling, D (1969),'The evolution of the major ports of West Africa', Geographical
Journal Vol. 135, p.365-378.
Hilling, D. (1970a),'Tema: thegeographyof anewport' Geography Vol.51, p.lll-125.
t82

Hilling, D. (1970b),'Port development and economic growth: the case of Ghana' in
Seaports and development in tropical , frica, p.127-145. (eds) Hilling, D and
Hoyle, B.S @raeger, New York).
Hilling, D. (1975), 'Port sepcialisation and efüciency - the case of Ghana' Maritime
Studies and Management Y ol. 3. p. I 3-20.
Hilling, D. (1976), 'Port congestion, the West African experience' The Dock and
Harbour Authority Vol. 57 No. 673 p.278-281
Hilling, D. (1977), 'The evolution of a poft system - the case of Ghana' GeographyYol.
62,Part l, No. 274 p.97-105.
Hilling, D. (1990), 'A-frican development and the maritime sector' Ihe Dock and
Harbour Authority Vol. 817 No. 671 p.205-206.
Hirschmann, A. O. (1958), Ihe Strateg,, of Econonric Development (Yale University
Press, New Haven).
Holocher, K. H. (1990) 'Organisational structure of seaports: the micro aspect' in Port
Management Textbook (ed. Stuchtey, R. W). Institute of Shipping Economics and
Logistics, Bremen.
Holt, J. (1981),'Energy, economics and technology', llorld Shipping in the 1990s,
Greenwich Forum VI, records of a conference at the Royal Naval College,
Greenwich,23-25 April 1980 (Guildford, Westbury), p 183-9i.
Hoover, E. M. (1948), The Location of Econontic Activi? (New York, McGraw-Hill).
Hoyle, B. S. (1967), Seaports of Easr Africa: A Geogt'aphical Study (East African
Publishing House, Nairobi).
Hoyle, B. S. (1968), 'East African seaports: an application of the concept of "Anyport" ',
Transactions of the Institute of British Geographers Vol. 44, p.163-183.
Hoyle, B. S. (1981), 'Cityport industrialisation and Regional Development Strategies in
Less-developed Countries: The Tropical African Experience' in Cityport
Industrialisation and Regional Development. spatial Analysis and Planning
Strategies, (Eds.) Hoyle, B. S and Pinder, D. A. (Pergamon Press, Oxford).
Hoyle, B. S. and Pinder, D. A. (1981), (eds) Cityport Industrialisation and Regional
Development: Spatial Analysis snd Planning Snarcgies (Pergamon Press,
Oxford).
183

Hoyle, B. and Charlìer, J. (1995), 'Inter-port competition in developing countries: an East
African case study' Journal of Transport GeogrøphyYol.3 No. 2p.87-103.
Humphrys, G. (I976a} 'Industrial change: lessons for South Wales' Geography Vol. 61,
p.246-254.
Humphrys, G. (1976b), 'A simple regional evolution model illustrated by a case study of
South Wales', in Regional DevelopmenÍ and Planning: Britìsh and Hungarian
Case Studies @udapest, Akadèmai Kiado), p.759-770.
Republic of Ghana (1996), Ministry of Transport and Communications, (Intermodal
Transportation Study -Thorburn Colquhoun International and Partners, (Vol. 1)).
Janelle, D. G. (1968),'Central place development in a time-space framework', The
Professional Geographer Y ol. 20, p.246-254.
Johnson, K. M. and Garnett, H. C. (I971),Ihe Economics of Containerisatlon (AJlen and
Unwin, London).
Kirk, H. R. B. (1976), 'Marketing of port services: an alternative view' Ihe Dock and
Harbour Authority Vol. 57 No. 671 p.205-206.
Klaasen, L. H. and Vanhove, N. (1970), Macro-economic Evaluation of Ports with
Regard lo Regiornl Implications Paper delivered at Semaine de Bruges, April
(Bruges, College of Europe).
Kumedzro, R. U. (1993), PorÍ Re-organisation and Management: the Ghanaian
Experience, Paper prepared for the Third Inter-Governmental UNCTAD Meeting
ofPortExperts. Geneva, 25-29 October 1993.
Leinbach, T. R. (1979), 'Urban core regions and transport development: the case of
Peninsular Malaysia' Ihe Journal of Tropical Geography Yol. 49 p.34-40.
Lindberg, O. (1953), 'An economic-geographical study of the localisation of the Swedish
paper indu stry', G e ografi ska Annaler Vol. 3 5, p.28-40.
Lowe, J. c and Moryadas, s (1975), The Geography of Movement (Houghton Milton,
Atlanta).
Manners, G. (1967), 'Transport costs, freight rates, and the changing economic
geography of iron ore' GeographyYol. 52, p.260-279.
Mayer, H. M. (1973), 'Some geographic aspects of technological change in maritime
transportation', Economic GeographyYol. 49, p 145-155.
184

Mikolajski , J. (1964),'Polish Seaports, their Hinterlands and Forelandf Geografia
Polonica Vol. 2 p.221-229.
Morgan, F. W. (1951), 'Observations on the Study of Hinterlands in Europe' Tijdschrift
voor Economische en Sociale Geografie Yol. 42, p.366-373.
Morgan, F. W. (1952), Ports and Harbours (Hutchinson's lJniversity Library, London).
Norcliffe, G. B (1981) 'Industrial change in old port areas: the case of the port of
Toronto', Cahiers de Gèographie du Quèbec Yol. 25, p.237-254.
Nargoski, B. (1976) 'Port congestion: the cause and cure' The Dock and Harbour
Authority Vol. 57, No. 672 p.237-240.
North, D. C. (1955), 'Location theory and regional economic growth' Journal of Political
Economy Vol. 63, p.243-256.
O'Connor, A. M. (1965), 'New railway construction and the pattern of economic
development in East Africa' Transactions of the Institure of British Geographers,
Vol.36 p.2l-29.
Odell, P. R. (1963), An Economic Geography of Oi1 (Bell, London).
Ogundana, B. (1972),'Oscillating seaport location in Nigeria', Annals of the Association
of American Geograph¿rs Vol. 62, p.l10-121
Omtvedt, P. C. (1963), Report on the Profitability of Port Investntents (Oslo, mimeo).
Oram, R. B. (1965), Cargo Handling and the Modern Port (Pergamon Press, Oxford).
oram, R. B and Baker, C. c. R (197r), The Efficient Port (Pergamon Press, oxford).
Pinder, D. A. (1981), 'Community attitude as a limiting factor in port g¡owth: the case of
Rotterdam', in Cityport Industrialisation and Regional Development (eds Hoyle,
B. S and Pinder, D. A) (Pergamon Press, Oxford), p.l8l-199.
Portbury Report (1966), Portbury: Reasons for the Minister's Decision not to Authorise
the Construction of a New Dock at Portbury, Bristol (London, HMSO).
Port Rehabilitation Project (1994), Master Plan Study - Phase II - (Final Master Plan
Report), Port Consult et. al.
Rimmer, P. J. (1964), "Inferred Hinterlands: The Example of New Zealand Seaports"
Geography Vol. 52, p.384-392.
Rimmer, P. J. (I966a), 'The problem of comparing and classifying seaports' The
pr ofe s si on al G e o g' apher Y ol. XVIII, No.'2 p. 83 -9 1 .
185

Rimmer, P. J. (1966b), 'The status of ports; a method of comparative evaluation' The
Dock and Harbour Authority YoL. 47, p.Z-7 .
Rietveld, P. and Nijkamp, P. (1993), 'Transport and regional development' in European
Transport Economics p.130-151 (eds) Polak, J and Heertje, A. (Blackwell,
Oxford).
Robinson, R. (1966),'Modelling the port as an operational system: a perspective for
research', Economic Geography Y o1. 52, p.7 I-86.
Rose, A. J. (1966), 'Dissent from down under: metropolitan primacy as the normal state',
Pacific Viewpoint Vol. 7, p.1-27.
Rodgers, A. L. (1958), 'The Port of Genova: External and Internal Relations' Annals ofthe A ssoci ati on of AmerÌ can Geographers, Y o1.48, p. 3 I 9-3 5 1 .
Rostow, W. W (1960) The stages of econontic growth: a non-contmunist manifesto
(Cambridge Univ. Press, Cambridge)
Scarperlanda, A. (1966), 'The role of transportation in the economic integration ofunderdeveloped areas' Journal of Lønd Economics Yol. 42 p.205-209.
Schulze, W. (1970), The Ports of Liberia: Economic Significance and Development
Problems in Seaports and Development in Tropical Africa (eds) Hoyle, B. S and
Hilling, D (Praeger, New York).
Shaffer, N. M. (1965), 'The competitive position of the port of Durban', Northwestern
Studies in Geography Yol.8, (Northwestern University Press, Evanston, Ill).
Smith, D M. (1977), Huntan Geography: A welfare Approach (Arnold, London).
Smolensky, E. and Ratajczak, D (1965), 'The conception of cities' Explorations in
Entrepreneurial History Yol. 2, 2no series, p.90-13 l.
Subramanian, R. (1986), Variations in Canadiatt Regional Economic Perþrmance: AShift-and-Share Analysrs, Unpublished MA Thesis. University of Manitoba,
Winnipeg.
Sun, N. and Bunamo, M. C. (1973), 'Competition for handling US foreign cargoes: the
port of New York's experience' Economic Geography Vol. 49, p 156-162.
Swayne, Sir Ronald (1982),'shipping: some political and economic consequences ofchanges in technology and ownership' , Journal of the Royal Society of Arts yol.
130, p.686-703.
186

Svendsen, A. S. (1951),'A note on port statistics' Tijdschrifr voor Economische en
Sociale Geografi e Y ol. 42 p.3 54-3 59
Taaffe, E. J., Morrill, R. L. and Gould, P. R. (1963), 'Transport expansion in
underdeveloped countries', Geographical Review Vol. 53, p.502-529.
Taaffe E J. et. al. (1973), Geography of Transpoftation (Prentice-Hall).
Takel, R. E. (1974),Industriøl Port Development (Scientechnica, Bristol).
Tanner, M. F. and Williams, A. F. (1967), 'Port development and national planning
strategy', Journal of Trønsport Economics and policy Vol. I, p.3I5-324.
Todd, D. and Hseuh, Y. (1990), 'New port developments and balanced regional growth: a
Taiwan example' Geoþrum Vol. 21 p.421-433.
Todd, D. (1993), 'The interplay of trade, regional and technical factors in the evolution of
a port system: the case of Taiwan' Geografiska Annaler Vol. 75B(1) p.3-18.
Unanimous (1974), 'Berth throughput, berth occupancy and ship turnround time'
Norwegian Shipping News No. 19D p.25-31.
Van Cleef, E. (1941), 'Hinterland and Umlan d' Geog'aphical Review Vol. 31, p.308-3 1 iVan den Burg, G. (1969), Containerisation: A Modern Transport System (Hutchinson,
London).
Yigarié, A. (1964), Les Grands ports de Commerce de la Seine au Rhin: leur Évolution
dev ant I' Indu stri ali sati on de s Arri er e -pay s ( S abri, Paris).
Yigarié, A. (1979), Ports de Commerce et Vie Littorale (Hachette, Paris).
Walker, J. (1830), 'Report of Walker and Burges, civil engineers, on the best means of
improving the harbour of Belfast, July 10, 1830', History of the Harbours of the
United Kingdom: Belfast (Admiralty, Harbour Department (published 1852)),
appendix I 1.
Wang, F. (1997), 'Regional Disparities in China: The Agricultural Aspect, Unpublished
MA Thesis. University of Manitoba, Winnipeg.
Ward, M. W. (1966), 'Major Port Hinterlands in Malaya' Tijdschrift voor Economische
en Sociale Geografe YoL 57, p.242-250
Weigend, G. G. (1956), 'The Problem of Hinterland and Foreland as Illustrated by the
Port of Hamburg' Economic GeographyYol.32, p.1-16.
187
Weigend, G. G. (1958), 'Some Elements in the Study of Port Geography' Geographical
Review Vol. 48, p.185-200.
Weinand, H. C. (1972),'A spatio-temporal model of economic development' , Australian
Geographical Studies Vol. i0, p.95-100.
Wiese, B, (1984), 'The role of seaports in the industrial decentralisation process: the case
of South Africa' in Seaport systems and spatial change, p.415-434 Hoyle, B. S
and Hilling, D (eds). (Wiley, Chichester)
Wilking, D. (i990), 'Port perforrnance indicators: an important management tool' in Porl
Managemenl Textbook (ed. Stuchtey, R W) Institute of Shipping Economics and
Logistics, Bremen.
188

APPENDICES
Appendix I
Market shares of overall traffrc at Ghanaian ports. 1945-1967 (0/o)
Year Takoradi Tema Accra Other1945 89.8 10.2 01946 89 10.7 0.31947 85 13.6 1.41948 85.6 12.7 1.71949 82.5 14.9 2.61 950 82.7 '13.8 3.51 951 81.7 15.2 3.1
1952 82.6 14.9 2.41 953 79.7 17.2 3.'1
1954 78 18.6 3.41 955 76 20.8 3.21 956 77.1 20.1 2.81957 78.2 19.1 2.81 958 75.9 21.5 2.61 959 75.1 22.4 2.51 960 74.8 22.7 2.51 961 66.6 5.2 25.8 2.41962 68.5 24.7 5.2 0.61 963 63.1 36.91 964 46.3 53.71 965 34.3 65.71 966 51.2 48.81967 44.794 55.206
Source. Calculated from Hilling, 1970b
189
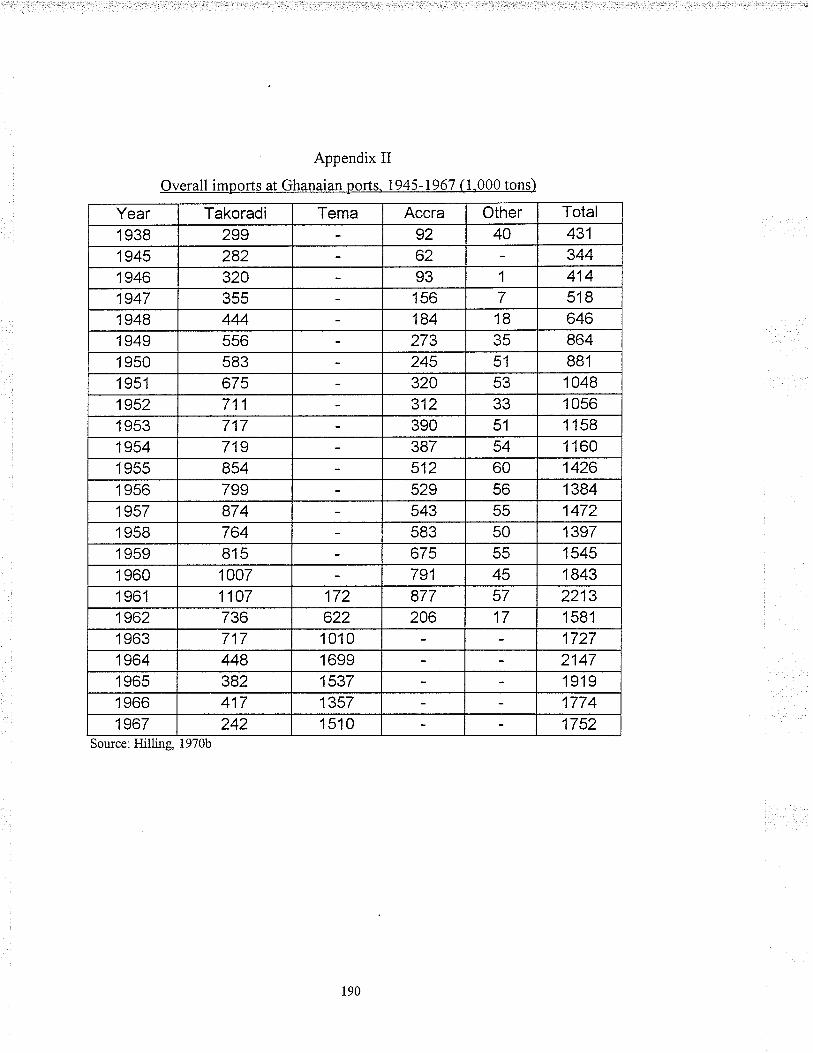
Appendix II
Overall imports at Ghanaian ports. 1945-1967 (1.000 tons)
Year Takoradi Tema Accra Other Total
1 938 299 92 40 431
1945 282 62 3441946 320 93 1 414
1947 355 156 7 518
1948 444 184 18 646
1 949 556 273 35 8641 950 583 245 51 881
1 951 675 320 53 1 048
1952 711 312 55 1 0561 953 717 390 51 1 158
1954 719 387 54 1 160
1 955 854 512 60 1426
1 956 799 529 56 13841957 874 543 trtr 1472
1 958 764 583 50 1397
1 959 815 675 55 15451 960 1007 791 45 18431 961 1107 172 877 57 22131962 736 622 206 17 1 581
1 963 717 1010 1727
1964 448 1 699 21471 965 382 1537 1919'1966 417 1357 17741967 242 1510 1752
Sou¡ce:HilLing, 1970b
190
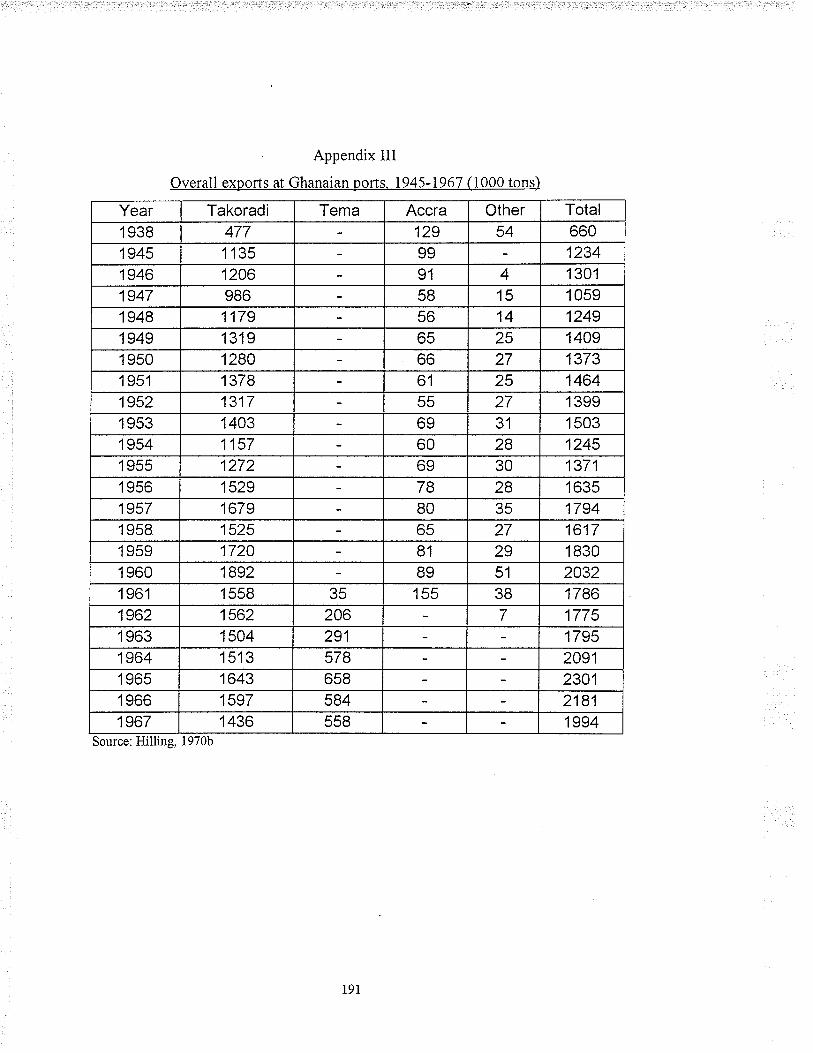
Appendix III
Overall exports at Ghanaian ports. 1945-1967 (1000 tons)
Year Takoradi Tema Accra Other Total
1 938 477 129 54 6601945 1 135 99 12341946 1206 91 4 1 301
1947 986 58 15 1 059I 948 1179 56 14 12491949 1319 65 25 1409
1 950 1280 66 27 13731951 1378 61 25 14641952 1317 55 27 1 3991 953 1403 69 31 1 5031954 1157 60 28 1245I 955 1272 69 30 13711 956 1529 78 28 1 6351957 1679 80 35 17941 958 1525 65 27 16171 959 1720 81 29 1 8301 960 1892 89 51 20321 961 1 558 35 155 38 17861962 1562 206 7 177 5
1 963 1504 291 17951964 1513 578 20911 965 1643 658 2301'1966 1597 584 21811967 1436 558 1994
Source:Hilling, 1970b
191

Appendix IV
Variable
Estimated coefficient
Takoradi Tema
Standa¡d error
Takoradi Tema
T-ratio
Takoradi Tema
P-value
Takoradi Tema
Net registered tonnage 4.5958 8.3835 4.202 4.552 r.094 0 073 0.281 0.280
Ship call 2774.2 4t5.66 939 3 l02l 0 2.9s4 0.686 0.005 0.064
Ship turnround 62t.43 115 95 2t8.9 601.3 2.839 0.850 0.007 0 030
Labour productivity
Berth ""*,pr*y
G*g ho,r*
Sl"p pr"d*t"rtty
1888.2 3269:7
2t20t -t5t5l
8-1607 2li066
2æA1 -N 34
1365.0 12s9.0
4A05 7.s66
607.7 8l5A
1.343 0.013
0J304r 0268
1.852 0.001
04663 030r
0.187 0.380
c.976 4',15
}fir c 118
0ß44 .{ 040
Adjusted R'z
Takoradi = 0.5288
Tema = 0.2978
Rho (p)
Takoradi :0.0161
Tema = - 0.29562
F-statistic
Takoradi F(8, 40) :239.233
Tema F(8, 40):33r.On
Degrees of freedom (Dfl
Takoradi = 40
Tema:40
Durbin-Watsou
Takoradi:1.8494
Tema = 2.5284
Sample size (n)
Takoradi:48
Tema:48
192
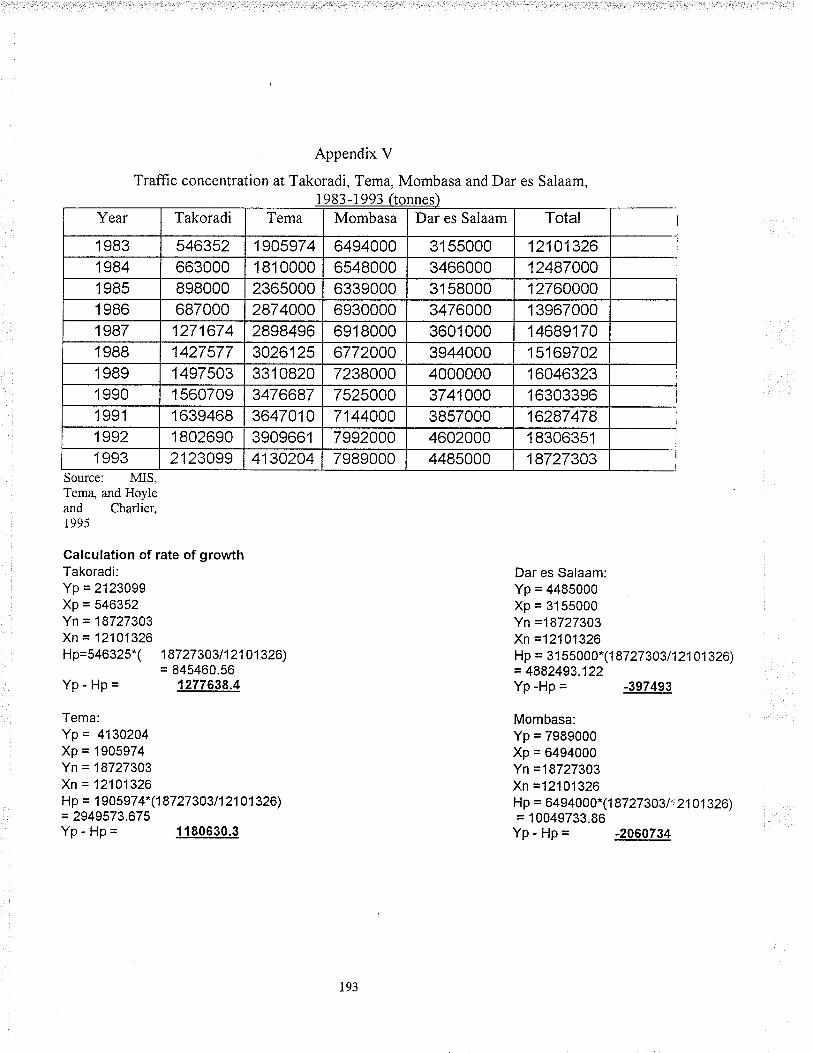
Appendix V
Trafiic concentration at Takoradi, Tema, Mombasa and Dar es Salaam,
Year Takoradi Tema Mombasa Dar es Salaam Total
'f 983 546352 1905974 6494000 31 55000 121013261984 663000 1 81 0000 6548000 3466000 124870001 985 898000 2365000 6339000 31 58000 127600001 986 687000 2874000 6930000 3476000 '13967000
1987 1271674 2898496 691 8000 3601 000 146891701 988 1427577 3026125 6772000 3944000 151697021 989 1497503 331 0820 7238000 4000000 160463231 990 1 560709 3476687 7525000 3741000 163033961 991 1 639468 3647010 7144000 3857000 162874781s92 1 802690 3909661 7992000 4602000 1 83063511 993 2123099 4130204 7989000 4485000 18727303
Source: MIS,Tern4 and Hoyleand Cha¡lier,I 995
Calculation of rate of growthTakoradi:Yp = 2123099Xp = s40352Yn = 1 8727303Xn = 12101326Hp=546325*( 18727303/12101326)
Yp-Hp=
Tema:Yp= 4130204Xp = 1905974Yn = 1 8727303Xn = 12101326
= 845460.561277638.4
Hp = 1 90597 4" (1 87 27 3O3l 12101 326)= 2949573.675YP - Hp = 1180630.3
Dar es Salaam:Yp = +4g5oooXp = 3155000Yn =18727303Xn --12101326Hp = 3155000.(1 8727303/12101326)= 4882493.122YP -HP = -397493
Mombasa:Yp = 7989000Xp = 6494000Yn =18727303Xn =12101 326Hp = 0494000* (1 87 27 303/': 21 01 326)= 10049733.86Yp-Hp= -2060734
r93
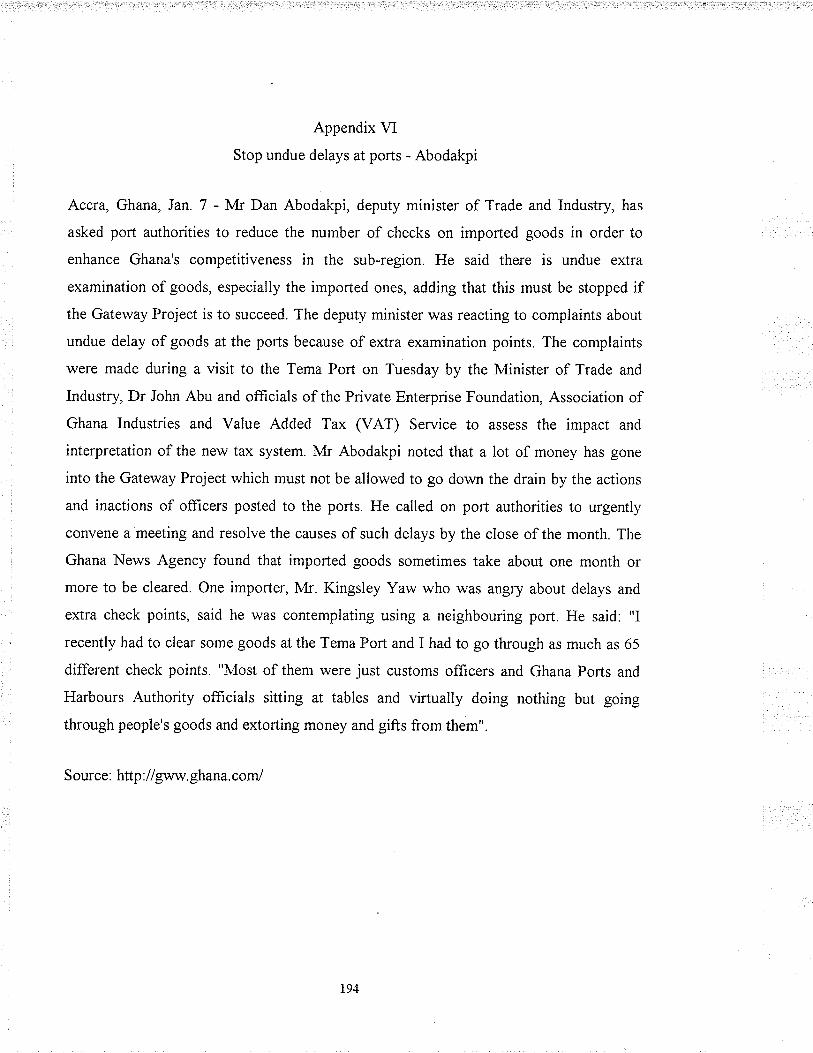
Appendix VI
Stop undue delays at ports - Abodakpi
Accra, Ghana, Jan. 7 - M¡ Dan Abodakpi, deputy minister of Trade and Industry, has
asked port authorities to reduce the number of checks on imported goods in order to
enhance Ghana's competitiveness in the sub-region. He said there is undue extra
examination of goods, especially the imported ones, adding that this must be stopped ifthe Gateway Project is to succeed. The deputy minister was reacting to complaints about
undue delay of goods at the ports because of extra examination points. The complaints
were made during a visit to the Tema Port on Tuesday by the Minister of Trade and
Industry, Dr John Abu and officials of the Private Enterprise Foundation, Association of
Ghana Industries and Value Added Tax (VAT) Service to assess the impact and
interpretation of the new tax system. M¡ Abodakpi noted that a lot of money has gone
into the Gateway Project which must not be allowed to go down the drain by the actions
and inactions of officers posted to the ports. He called on port authorities to urgently
convene a meeting and resolve the causes of such delays by the close of the month. The
Ghana News Agency found that imported goods sometimes take about one month or
more to be cleared. One importer, Mr. Kingsley Yaw who \¡ias angry about delays and
extra check points, said he was contemplating using a neighbouring port. He said: "I
recently had to clear some goods at the Tema Poft and I had to go through as much as 65
different check points. "Most of them were just customs offrcers and Ghana Ports and
Harbours Authority officials sitting at tables and virtually doing nothing but going
through people's goods and extorting money and gifts from them".
Source: http. I I gww.ghana.com/
t94