Child Health Programme - Ministry of Health and Family Welfare
DOCUMENT RESUME
ED 379 062 PS 022 603
AUTHOR Anandalakshmy, S., Comp.TITLE The Girl Child and the Family: An Action Research
Study.INSTITUTION India Univ., New Delhi.SPONS AGENCY Ministry of Human Resources Development, New Delhi
(India) .
PUB DATE 94NOTE 312p.; Separately published 44-page "Summary Report"
is appended.PUB TYPE Reports Research/Technical (143)
EDRS PRICE MFO1 /PC13 Plus Postage.DESCRIPTORS *Child Health; Child Labor; *Children; Child Welfare;
Elementary Secondary Education; Equal Education;Family Characteristics; *Females; Foreign Countries;Housing; Immunization Programs; Menstruation; *ParentAttitudes; Parent Child Relationship; *Sex Bias; *SexRole; Socialization
IDENTIFIERS *India
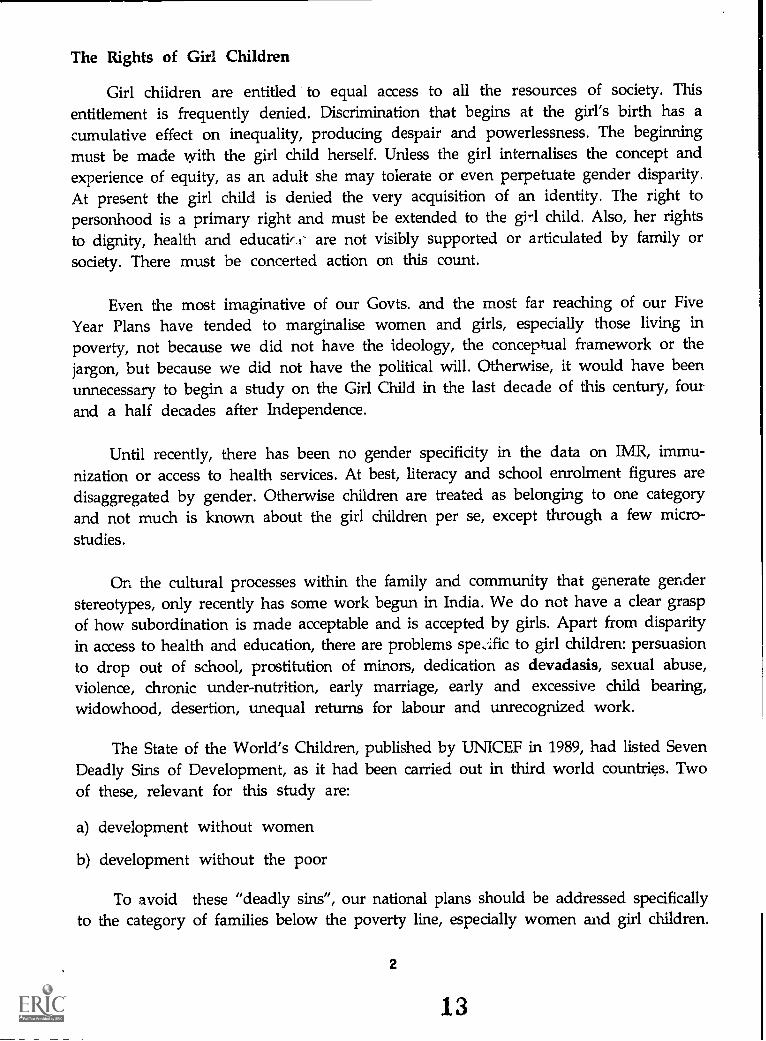
ABSTRACTThis report describes a nationwide study of female
children and the family in rural India. The objectives of the studywere to generate data on the situation of female children; toidentify the major problems related to their status; to start aseries of programs to help remedy those shortcomings; and to assistcommunities, and women in particular. Demographic data, includingfamily migration, occupation, economic status, government programsreceived, housing, family structure, education, and occupation, wereobtained. Chapter 1 describes the study's rationale, methodology, andconceptual framework. Chapter 2 provides a profile of households.Chapter 3 reports vast gender bias inherent in the socialization ofchildren, including gender expectations, parent-daughter activities,and behavioral restrictions related to gender are reported. Chapter 4presents data on school attendance, participation in extra-curricularactivities, school facilities, dropouts, reasons for not attendingschool, parental levels of education, birth order and schoolattendance, and the view of female children's ideal level ofeducation. Chapter 5 includes data on mother's health, immunization,nutrition, health treatment, appearance, and environmental factors.In chapter 6, survey results on menstruation knowledge, pubertyrites, taboos, and restrictions are reported. Chapter 7 reports thepercentage of female children performing economic activity. Chapter 8includes six case studies and five brief case profiles. Chapter 9presents the profiles of the geographical areas involved in thisstudy. Chapter 10 summarizes findings, state policy and programs, anddirections for action. (WP)
***********************************************************************
Reproductions supplied by EDRS are the best that can be madefrom the original document.
***********************************************************************

THE GIRL CHILD. AND THE FAMILYAn Action Research. Study
ea;
U S DEPARTMENT OF EDUCATIONOffice at Educational Research and Improvement
EDUCATIONAL RESOURCES INFORMATIONCENTER (ERIC)
vi This document has beet eproduced asreceived from the person or organizationoriginating it
Minor changes have been made toimprove reproduction quality.
cip)
c.401
Compiled and Edited by
S. ANANDALAKSHIVIY
a
Points of view or opinions stated in thisdocument do not necessarily representofficial 0E111 position or policy
"PERMISSION TO REPRODUCE THISMATERIAL HAS BEEN GRANTED BY
A \ ck cs\nrm,
TO THE EDUCATIONAL RESOURCESINFORMATION CENTER (ERIC)
Sponsored by the Dept. of Women and Child Development, HRD Ministry, Govt. of India, New Delhi.
1994
2I BEST COPY AVAILABLE

THE GIRL CHILD AND THE FAMILYAn Action Research Study
Compiled and Edited by
S. ANANDALAKSHMY
Sponsored by
The Department of Women & Child DevelopmentMinistry of Human Resources Development,
Government of India.
Executed by
The UGC Centres for Women's Development Studiesin the University System in India.
1994
3

Dept. of Women and Child Development, Ministry ofHuman Resources Development
Secretary
Joint Secretary
Joint Director
Meera SethLata Singh
Uma PillaiS. K. Guha
T, K. Sarojini
Upto 19931993 onwards
Upto 19921993 onwards
Chief Advisor on Data Management
N. K. Nijhawan,Executive Director,
Indian Council of Social Science Research
Research Methodology Advice and Assistance
Shankar Bose,Indian Council of Social Science Research
K. N. Jehangir,Indian Council of Social Science Research
J. C. Sharma,Tata Institute of Social Sciences
Co-ordination Committee
S. Anandalakshmy (Convenor)
Susheela Kaushik
Maithreyi Krishnaraj
Vina Mazumdar
Vasantha Rarnkumar
4

PROJECT DIRECTORS COLLABORATING CENTRES
Dr. S. A. T. Adilakshmi
Prof. Jasodhara Bagchi &Prof. Jaba Guha
Dr. V. Bhavani
Dr. Bibekanand Das
Prof. Amita Verma &Dr. Parul Dave
Dr. Rekha Pandey &Dr. Kameshwari Jandhyala
Dr. Surinder Jetley
Dr. Usha Kanhere
Prof. Susheela Kaushik
Prof. Maithreyi Krishnaraj &Dr. Divya Pande
Dr. Lakshmi Lingam
Centre for Women's Devt. Studies,S. P. Mahila Visvavidyalayam,Tirupati - A.P.
School of Women's Studies,Jadavpur University,Calcutta - West Bengal.
Women's Studies Centre,Nagarjuna University,Guntur A.P.
Women's Studies Research Centre,Berhampore University.Berhampore Orissa
Women's Studies Centre,M. S. University,Baroda - Gujarat.
Centre for Women's Studies,University of HyderabadHyderabad - A.P.
Centre for Women's Studies and Development,Faculty of Social Science,Banaras Hindu University,Varanasi U.P.
Women's Studies Cell,School of Social Science,Gujarat University,Ahmedabad - Gujarat
Women's Studies Centre,University of DelhiDelhi.
Research Centre for Women's Studies,SNDT Women's University,Bombay.
Women's Studies Unit,Tata Institute of Social Sciences,Bombay.
5

PROJECT DIRECTORS COLLABORATING CENTRES
Dr. Prabha Mahale
Dr. Umed Raj Nahar
Dr. Ujwala Patil (Hiremath)
Dr. V. S. Pramila
Dr. Pam Rajput
Prof. A. Ramanamma
Dr. Vasantha Ramkumar
Dr. B. Regina Papa
Dr. Niroj Sinha
Dr. Rameshwari Varma
Dr. H. P. Verma
Research Centre for Women's Studies,Karnatak University,Dharwad
Women's Studies Cell,Jodhpur University,Jodhpur - Rajasthan
Centre for Women's Studies,Gulbarga University,Gulbarga - Karnataka.
Centre for Women's Studies,Andhra University,Visakhapatnam A.P.
Centre for Women's Studies,Punjab University,Chandigarh.
Centre for Women's Studies,University of PoonaPune - Maharashtra.
Centre for Women's Studies,University of Kerala,Tiruvananthapuram Kerala.
Centre for Women's Studies,Alagappa University,Karaikudi - T.N.
Centre for Women's Devt. Studies,Patna University,Patna - Bihar.
Centre for Women's Studies,Institute of Devt. Studies,University of Mysore,Mysore.
Women's Devt. Studies and Research CentresRani Durgavati Vishwavidyalaya,Jabalpur - M.P.

ACKNOWLEDGEMENTS
The energy and strength of the collective activity of women engaged in Women'sStudies has characterised this project from its inception to its conclusion. This acknowl-edgement is really an Editor's note to record, with humility and gratitude, the variouscontributions of the several women scholars, activists, teachers, administrators andresearch workers who have made this effort possible.
The Indian Association for Women's Studies had at its Biennial Conference inWaltair passed a resolution to take up a country-wide collaborative study on identifiedrelevant issues. Madhuri Shah, Chairperson, University Grants Commission who hadthe vision and the will to put Women's Studies on the academic map of India, sensedthe importance of such a decision. The SNDT Women's University unit on Researchin Women's Studies established by her was the premier institution of its type. It wasideally suited for the brainstorming session that was organised there as a sequel tothe Biennial Conference of the Indian Association for Women's Studies. The decisionto undertake research studies that would be jointly done by several individuals, backedby their academic institutions had been taken and this was now planned out as aproject.
The South Asian region, with the countries having cultural and historicalcommonalities recognised the need for a congenial environment for the growth anddevelopment of children. The second SAARC summit held at Bangalore in 1986 stressedthe important of enhancing public consciousness on the rights of children and the needfor member nations to adopt the UN Convention on the Rights of the Child. It wasat the SAARC Summit of 1988 that the issue of children, particularly girl children, washighlighted. The girl child in South Asia was considered symbolic of the neglectedaspects in our policies. With this as background, it was proposed that 1990 be declaredas the year of the Girl Child in the SAARC region.
The possibility of linking different regions of the country through using thenetwork of the newly set up Women's Studies Units in the Universities, under the aegisof the University Grants Commission is an inspiration to be credited to Vina Mazumdar.Vina Mazumdar, the architect and the moving force behind "Towards Equality' thereport on the Status of Women in India, in the mid-seventies, had the insight andimagination to arrange a meeting point between institutions committed to the samecause: Directors of Women's Studies Centres set up at different Universities and theGovernment of India's Dept. of Women and Child Development who had declared 1990as the Year of the Girl Child.
This linking up of different institutions across the wide span of the country enabledthe study to be as representative as possible.
7

Maithreyi Krishnaraj, Director, Research Centre from Women's Studies (SNDT)conducted the initial sessions. Two meetings were held, one in Sept. 1989 andthe other in Dec. 1989, with some Directors of the Women's Studies Centres and invitedexperts. Following this, the first planning workshop for the study was organised atUniversity of Kerala by Vasantha Ramkumar. At this meeting the thrust areas for astudy of the Girl Child were agreed upon. All the deliberations were conducteddemocratically with every participant having a voice in the design of the study.
Uma Pillai, Joint Secretary, Dept. of Women and Child Development joined inthe informal consultative meetings held in Delhi in the next two months. She was fullysupported by Secretary Shulda, who gave the go-ahead to the project. An importantdecision made at that time was to have activity and intervention built into the researchdesign itself. It was not merely a study of the status quo, but one which would identifyprogrammes for the girl child as entry points and devise interventions which wouldbegin to ameliorate conditions even while they were in the process of being surveyed.The terming of the project as "action research" met with the enthusiastic approval ofMeera Seth, Secretary, Dept. of Women and Child Development who had just takenover as Secretary. She put the weight of her authority behind the study on the GirlChild and the Family.
The other details of how we proceeded are included in the opening pages ofthe first chapter. There were many persons who participated in the design and executionof the study: those who served as Project Directors, Advisors, Officers of the Dept.of Women and Child Development, Ministry of HRD and members of the CoordinationCommittee.
Particular mention must be made of Susheela Kaushik of Delhi University, whobrought her relentless drive and energy to the project, N.K. Nijhawan of the ICSSRwho gave of his best, in terms of time and ideas, in hundreds of details, because hewas convinced of the importance of such a study, and T.K. Sarojini, Joint Director inthe Dept. of Women and Child Development who was the nodal person in the Ministryand let her office serve as a clearing house for information on the project.
There are many institutions that have given their strength and support to thisstudy. Among them are the Indian Council for Social Science Research, Tata Instituteof Social Sciences, Lady Irwin College, University of Delhi, National Institute for PublicCooperation and Child Development (NIPCCD) and all the other Universities involvedin this study. Their institutional support is gratefully acknowledged.
Also on record is my thanks to all the person hosting the planning sessions, thetraining Workshops and the Coding Workshops, among whom are Maithreyi Krishnaraj,Vasantha Ramkumar, Susheela Kaushik, M.M.A. Faridi, Ujwala Patil Hiremath, RameshwariVarma and N.K. Nijhawan. Gratitu6,-; to the Project Directors, Research Associates andInvestigators of all the 22 team is hereby recorded.

A large number of persons, including those appointed to help with maintainingthe Convenor's office and with data analysis and documentation must be acknowledged.Apart from those on the Cooriination Committee and the Advisory Panel, whose namesare mentioned separately, I would like to thank the following: Deepa Das for herenthusiastic participation at the early stages of developing the questionnaire; Anil Kumarof the ICSSR, Data Archives, who was a pillar of support in the management of data;Alpana Sharma and Rekha Nautiyal who joined him later to assist with data coding;Devika Rani and later Malathi Venkataraman who helped in the early months withmaintenance of files and accounts of the Convenor's office at Madras and particularlyN. Lakshmi, whose consistent motivation and efficiency has helped to sustain the projectoffice for over two years.
I am grateful also to Indira Seetharam who worked systematically at decodingthe data and setting up the tables. I would like to record the help of Usha Sureshand Sujatha Rani in extracting the relevant data from the field reports. In the final phase,I was ably assisted by Malin: Sood. Yeshwanti Balagopal, with competence, confidenceand meticulousness also helped in the last phase, bringing the report to its final form.
Most of all, thanks to the girl child who spoke frankly about herself, trusting usto take action, so that she could be enabled to function in the future as a first classcitizen in an egalitarian society.
- Amanda/04s limy
9

Preface
It is with some satisfaction that I introduce this report of the nation-wide studyon the Girl Child and the Family to policy makers, activists and academics. The studyis an excellent example of cooperative endeavour, among the Dept. of Women andChild Development, Women's Studies Centres in the institutions of higher learning andthe Indian Council of Social Science Research.
We are now well into the SAARC Decade of the Girl Child (1991-2000). Thefindings of this study will serve as a reminder of our unfinished tasks and as a sourceof ideas for programmes to be undertaken in the immediate future.
It was ambitious to undertake such a massive study, with 22 University Centresfor Women's Studies collaborating . There were logistic problems and hurdles tosmoothly coordinated work, in all its detail. The Centres where the research wasconducted were far flung. Each University had its own rules, including a great dealof red tape in some cases. Nevertheless, the tenacity and motivation of the researchteams helped to see it through, if only with some understandable delay.
Each resech team sought to bring in local colour and idiom, making the reporta tangible one, about real people, not just a collection of quantitative data.
For all the participants, the motivating force was their anger at the deprivationof rights and privileges suffered by the girl child and their conviction that the truthmust be told now, loud and clear. This bold and committed approach has made thestudy reveal the many deplorable facets of the life of the girl child in India.
I trust that activists and scholars in the field will treat this study as the first stepin a series of action plans to be undertaken for the girl child. It is hoped that thefeedback from this study for national policy will also be treated with the seriousnessit deserves. And most of all, it is expected that the girl child's future will be brighterand her life chances more equitable than in the past.
ConvenorCoordination Committee
10

GIRL CHILD AND THE FAMILY
Contents Page No.
* Rationale, Methodology and Conceptual Framework 1
* Profile of Households 11
* Socialization 56
* Education 100
* Health 138
* Menstruation 164
* Ci Labour 173
* Case Studies and Case Profiles 181
* Intervention Programmes 202
* Area Profiles 212
* Conclusion and Implications for Policy 225
11

Chapter I
RATIONALE, METHODOLOGY AND CONCEPTUALFRAMEWORK
Genesis of the National Study
This study on the girl child was planned by the Centres for Women's Studiesin different Universities in India as a collaborative research-cum-action project in 1990,the Year of the Girl Child. The project was set up to generate comparative data onthe girl child by adopting a common research design. Feasible points of interventionand appropriate action were expected to be the outcome.
From the sixties at the international level and from the seventies at the nationallevel, gender disparity emerged as a major concern. In India, poverty, class and castecompound the problem of gender inequality and gender injustice. The girl child is mostvulnerable to the insults of poverty and deprivation. Therefore the plans and strategiesfor women should be linked to the head-on attack on poverty and injustice and tothe developmental goals society as a whole development of human potential,equality and justice. Whii there have been rapid social changes in the last few decades,these changes have not always included the rights of women and girl children as specificcomponents. The girl child is discriminated against from the moment of conception:subservience to the male is her continuing destiny.
Development is by definition a future-oriented term. Its connotation has variedover time; the current critique of the term has led to its very rejection. Real development,it is now felt, should consider people rather than GNP or per capita income and notjust humanity, as a global category, but human beings: men and women, boys andgirls. Given our future orientation and modifiable levels of neglect, the focus shouldbe on children. UNICEF in 1989 identified three broad areas of 'concern for thepreservation, protection and development of the lives of children so as to ensure forthem a life of dignity.
These were :
a) the creation of a suitable environment (material and social);
b) the reaching out of knowledge, information and skills for effective, sustained actionfor all children; and
c) the initiation of programmes for reducing social and economic disparities.
These priority areas are applicable to both girls and boys but as we know, girlchildren in our country need a special focus.
1
12
The Rights of Girl Children
Girl children are entitled to equal access to all the resources of society. Thisentitlement is frequently denied. Discrimination that begins at the girl's birth has acumulative effect on inequality, producing despair and powerlessness. The beginningmust be made with the girl child herself. Unless the girl internalises the concept andexperience of equity, as an adult she may tolerate or even perpetuate gender disparity.At present the girl child is denied the very acquisition of an identity. The right topersonhood is a primary right and must be extended to the gi-1 child. Also, her rightsto dignity, health and educatif,i- are not visibly supported or articulated by family orsociety. There must be concerted action on this count.
Even the most imaginative of our Govts. and the most far reaching of our FiveYear Plans have tended to marginalise women and girls, especially those living inpoverty, not because we did not have the ideology, the conceptual framework or thejargon, but because we did not have the political will. Otherwise, it would have been
unnecessary to begin a study on the Girl Child in the last decade of this century, fourand a half decades after Independence.
Until recently, there has been no gender specificity in the data on IMR, immu-nization or access to health services. At best, literacy and school enrolment figures aredisaggregated by gender. Otherwise children are treated as belonging to one categoryand not much is known about the girl children per se, except through a few micro-studies.
On the cultural processes within the family and community that generate genderstereotypes, only recently has some work begun in India. We do not have a clear graspof how subordination is made acceptable and is accepted by girls. Apart from disparityin access to health and education, there are problems spe.fic to girl children: persuasionto drop out of school, prostitution of minors, dedication as devadasis, sexual abuse,violence, chronic under-nutrition, early marriage, early and excessive child bearing,widowhood, desertion, unequal returns for labour and unrecognized work.
The State of the World's Children, published by UNICEF in 1989, had listed SevenDeadly Sins of Development, as it had been carried out in third world countries. Twoof these, relevant for this study are:
a) development without women
b) development without the poor
To avoid these "deadly sins", our national plans should be addressed specificallyto the category of families below the poverty line, especially women and girl children.
2
13

Strategies
The identification of causes and antecedents must be the first step. 5econdly theremust be an appreciation of the inherent capacity of communities to solve their ownproblems. The establishment and maintenance of a network of services, sustained bycommunity support, is the third step. To establish the value of a girl child as a humanperson of vast potential needs an integrated approach. The categorical imperatives area gender-balanced socialization at home and at school, the growth of appropriategovernment machinery for health and education infrastructure as well as mobilisationof the people as actors in the development process, not just as recepients, combinedwith the provision of water, access to fuel and enhanced employment opportunities foradults.
Role of the Universities
A data-base to bridge macro-policies with micro-level representation of reality wasneeded. The setting up of Women's Studies Centres by the U.G.C. all over the countryoffered an excellent opportunity for higher education to make itself relevant to the socialissues of the day, foremost among which is that of gender equality and gender justice.In this context, it was considered that research could become a tool for social change.
Universities were expected to play a role to :
a) bring about awareness among students and teachers and the community on the plightof the girl child;
b) participate in the active seeking of solutions; and
c) assist in effective implementation through evaluation/monitoring programmes/schemes.
Universities can bring to bear a certain measure of objectivity while sustainingcommitment to a better society. On this major principle, our study was founded.
The Origin of the Project
At a meeting of the UGC-supported Centres of Women's Studies organised bythe Research Centre for Women's Studies, SNDT Women's University, at Bombay in1989, it was unanimously decided to take up a collaborative research-cum-action projecton the girl child.
Subsequently, the Research Centre for Women's Studies, SNDT and the Centresfor Women's Studies, University of Delhi and University of Trivandrum convened ameeting at SNDT on Dec. 4, 1989 to draw up a preliminary research design with theassistance of experts. A Planning Workshop at Trivandrum was also mooted so thatthe academics could do the following :
3
14

a) finalise and adopt the research design, methodology and tot-b) finalise the list of institutions that would participate in the p.,,jectc) decide on the choice of region/areas where the surveys will be done, andd) draw up the time frame and budget.
This planning workshop was held from March 3 to 7, 1990 at Trivandrum. Atthat workshop the following areas were suggested as thrust areas for investigation:education and literacy; socialization; age at marriage; child labour; health/nutrition; childabuse, female foeticide and female infanticide; widowhood; desertion. It was decidedthat any other problem specific to a particular region may also be taken up. ACoordination Committee was nominated and set up.
Several formal and informal consultative meetings were held in Delhi in the nexttwo months, as a result of which action and intervention in the problem areas relatedto the girl child were included as an integral part of the study. Twenty-two UniversityCentres volunteered from among those who attended the workshop and shared theresearch interests. The States in which they are situated and the number of Centresin each state are as follows, alphabetically: Andhra Pradesh (4) Bihar (1) Delhi (1) Gujarat (2)Karnataka (3) Kerala (1) Madhya Pradesh (1) Maharastra (3) Orissa (1) Punjab(Chandigarh) (1) Rajasthan (1) Tamil Nadu (1) Uitar Pradesh (1) West Bengal (1).
Objectives of the Study
1) To generate data of comparable nature on some common parameters that will givean understanding of the situation of the girl child.
2) To identify the major problems relating to the status of the girl child and suggestalternate courses of action.
3) To start a series of programmes to help to remedy the shortcomings.4) To assist the community and women in particular to pursue desirable alternatives
by organising themselves.5) To test the feminist methodology of participant Action Research in an empricial study.
6) To assess the status of girl children within the family in order to predict the positionof women in the 21st Century.
7) To provide ways and means of ameliorating the conditions pertaining to the low,status and subordination of girls, in order to provide equality and justice as enshrinedin the Constitution.
It was decided that each centre would provide the texture of that region byexamining folk songs and folk stories, proverbs and local beliefs, as well as undertakea small survey of contemporary popular literature in that language and region. Thiswas planned so that the individual characteristics of each region or sub-culture wouldbe included in the national study.
4
15

Training Workshops
A training workshop was considered necessary to orient the participating insti-tutions to arrive at conceptual clarity and a shared understanding of the focus of thestudy, the parameters chosen, the methodology involved, the administration of the toolsand the interpretation of data. The institutions concerned had varying levels of expe-rience and competence and many were new to Women's Studies. The fear that a routine,conventional, unimaginative survey may not provide the insights into the problemsresearched was expressed and clearly articulated. Guidelines were therefore deemednecessary. Strategies were also to be devised for how families and communities couldbe taken into confidence. A fairly uniform format for presentation of data, it was felt,wc 0. be an added advantage.
It was decided to have two workshops for Directors of Women's Studies Centres:one workshop for the West and South to be conducted by the P.2.search Centre forWomen's Studies at SNDT, Bombay and the other workshop at Delhi University forthe North and East, to be conducted by the Women's Studies Centre at Delhi Universitywere planned.
Approximately 10 Centres were to be involved in each training workshop pooledon the basis of region. The participants of the workshop -would include the Directorsof the Centre and Research Associate/Field Supervisor. Five or six resource personswere invited to assist in the training at each of the centres. These workshops wereattended by all members of the Coordination Committee.
Each participating centre was expected to identify specific thrusts (health/educa-tion/vocational training). Possibilities of collaboration with voluntary organisations wereto be kept in mind, especially for mobilising women, organising women's camps,organising adolescent girls' camps, skill training programmes, creative activities and soon.
Thus each of the research teams would bring energy, originality and inviduality .
to their specific work, while contributing to the large picture and to the emergenceof national data.
Sampling Procedure and Sample Size
Experts in Statistics and Research Methods from both the Indian Council for SocialScience Research and Tata Institute of Social Sciences shared their expertise in thismatter. The sample was planned as follows
The sampling design followed for this study was multistage stratified randomsampling. The State in which the collaborating team was located automatically deter-mined the area from which the sub-samples were taken. Since in this sense the States
5
16

were self-selected, they were not technically a formal constituent of the random samplingdesign, although the hope that this would constitute a true national sample was retained.Since the qualifying factor was identifying a Women's Studies Centre (funded by theUGC). all the States wer, not covered and some regions were over-represented. Thefirst stage of the sampling was the district and the second, the ward or village.
The research teams were advised to consult the Economic Index (1985) preparedby the Centre for Monitoring the Indian Economy. Bombay, in which the districts ineach State were _rank-ordered according to the criterion of level of development. Thesample selected here was to consist of one district from the first quartile (25% at thebottom) and one district from the fourth quartile (25% at the top) of the districts asprovided in the CMIE (1985).
Urban Middle SES (17.60%)
Urban Low SES (15.80%)
Rural Underdeveloped (32.80)
Rural Developed (33.80%)
PROPORTION OF TYPES OF AREAIn the Sample
Literacy level is a datum now available for each and every village and urban ward.This was therefore treated as a variable for the final level of sampling. The level ofliteracy was selected as the independent variable fa: the sub-sample. Two villages, one
with high literacy and one with low literacy were selected from each of the districts."High" and "Low" did not indicate absolute levels of literacy with reference to any norm
but were high or low within that specific district.
6
17
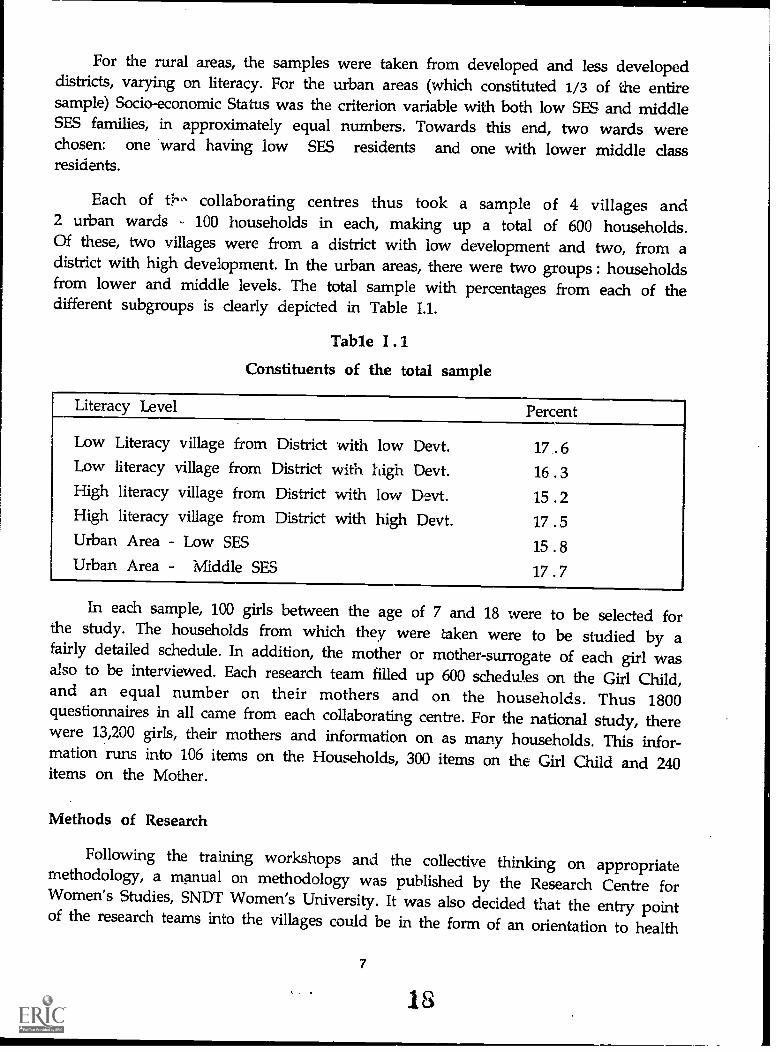
For the rural areas, the samples were taken from developed and less developeddistricts, varying on literacy. For the urban areas (which constituted 1/3 of the entiresample) Socio-economic Status was the criterion variable with both low SES and middleSES families, in approximately equal numbers. Towards this end, two wards werechosen: one ward having low SES residents and one with lower middle classresidents.
Each of t:!-- collaborating centres thus took a sample of 4 villages and2 urban wards 100 households in each, making up a total of 600 households.Of these, two villages were from a district with low development and two, from adistrict with high development. In the urban areas, there were two groups : householdsfrom lower and middle levels. The total sample with percentages from each of thedifferent subgroups is clearly depicted in Table I.1.
Table I.1Constituents of the total sample
Literacy Level Percent
Low Literacy village from District with low Devt. 17.6Low literacy village from District with high Devt. 16 .3High literacy village from District with low Davt. 15.2High literacy village from District with high Devt. 17.5Urban Area - Low SES 15.8Urban Area - Middle SES 17.7
In each sample, 100 girls between the age of 7 and 18 were to be selected forthe study. The households from which they were taken were to be studied by afairly detailed schedule. In addition, the mother or mother-surrogate of each girl wasalso to be interviewed. Each research team filled up 600 schedules on the Girl Child,and an equal number on their mothers and on the households. Thus 1800questionnaires in all came from each collaborating centre. For the national study, therewere 13,200 girls, their mothers and information on as many households. This infor-mation runs into 106 items on the Households, 300 items on the Girl Child and 240items on the Mother.
Methods of Research
Following the training workshops and the collective thinking on appropriatemethodology, a manual on methodology was published by the Research Centre forWomen's Studies, SNDT Women's University. It was also decided that the entry pointof the research teams into the villages could be in the form of an orientation to health
7

(camps for immunisation, family planning, health check up) or literacy (numeracy,
literacy, legal literacy, skill development).
It was further decided that the girl and her mother would be interviewed sepa-
rately. The objective fact of the girl's subordination in the family (or otherwise) and
the subjective experience of her powerlessness (or control) were both to be studied.
Raising the le- -el of awareness of girls and women about the existing governmental
schemes and programmes for their amelioration was one major objective. Empowering
the girl to have some control over her own choices, especially those concerning her
education and self-expression, was another important objective.
The questionnaires (Household Schedule, Girl Child Schedule and Mother Schedule)
finalised by a centrally constituted team of experts, were sent to all the participating
centres for translation and use. When the Indian Association for Women's Studies met
for the Biennial Conference at Jadavpur University in Feb. 1991, many of the Project
Directors and research staff attended it. Full use was made of their presence at the
Conference and anotF er workshop on methodology was organised in Calcutta. Those
few Project Directors who could not attend (from four centres) were informed of all
procedures through detailed correspondence.
Coding
A number of questions in these schedules were open-ended. It is to take note
of the open ended questions and varied response to them that a Coding System has
been devised. The actual coding system can be developed only when the collection of
some data has been completed. The responses from a section of the sample are taken
as true indicators of the responses of the entire sample. For some kinds of questions
(castes, languages, districts) the coding system has a code for each name mentioned.
For most of the other questions, the thrust of the exercise was to develop a classification
system for the open ended responses.
Two Coding Training Workshops were held, one in Mysore in April '91 and the
other in Gulbarga in May '91. Half of the total number of project staff attended each
of the Workshops. For the three teams who were not able to attend either Workshop,
a third one was organised in New Delhi in July '91. Thus all twenty two research
teams participated in the Coding Workshops and were equipped to prepare the data
for computer analysis.
The Coordinating Committee had the task of monitoring the study at all the
Centres, visiting any centre which had a problem, and generally keeping
the communication system active. The Coordinating Committee also met several
times to develop plans for Data Analysis and to monitor the progress of the
collaborating teams.
8
19
Data Management
The management of data in this project has been a major responsibility of theIndian Council for Social Science Research. From the early phase of development ofquestionnaires and deciding upon the sampling frame, to the stage of data analysis(with the development of codes and code books, data entry, data cleaning and con-sistency checks as intermediate stages) we have had the advice and guidance of theICSSR.
Substantive Issues
Apart from a detailed Household Schedule, which solicits a vast quantum ofinformation on several relevant variables, the questionnaire intended for the Girl Childseeks information on major aspects of her existence schooling, level or class attended,reasons for discontinuation, facilities at the school and those availed by her, her health,history or illness, kind of treatment and medical attention, reasons for the same,immunisations, food patterns and special diet, whether food taken to school and soon; myriad facts on socialization which can be carefully constructed as a map of thegirl child's experience. And on every aspect, whether there was discrimination on thebasis of gender formed an integral query. The work and labour status of the girl, alongwith conditions of work and wages and the economic contribution made by her is aconstituent part of the study. We thus expect to have a clear picture of a day in thelife of the girl child from more than a hundred situations, virtually mini-ethnographiesof several sub-cultures.
Not only are the facts noted, but the reason behind every practice, includingmenarche rituals and menstruation taboos, are elicited. And what is more the proximalsetting of the particular household, as well as the eco-niche in which the householdis situated, provide the space against which the life of the girl can be studied andassessed. The open ended questions have been anchored by an exhaustive coding system,so that no information gathered is lost. In fact, the coverage of detail is rather ambitiousand there will be a great deal of secondary data for other researchers in gender issuesin future years.
This project is unique in the following features :
1) It is a collaborative endeavour between the Dept. of Women & Child Development,Govt. of India and the higher educational system.
2) It utilises the UGC infrastructure of Women's Studies Centres to assemble a teamof collaborating researchers around the country. Thus a large study has been com-pleted cost-effectively.
3) It is more than a status report on the Girl Child. Action and Intervention programmestuned to the needs of each situation are included.
9 20

4) Using research methods and instruments developed by the entire team of partici-pating academics, this study combines the advantages of micro-research and macro-research for each team, the study is detailed, but when summed up over 22teams, there is a large sample.
5) It demonstrates the catalytic role of the educational institutions in community work,particularly in the issues regarding girl children. There is a vast potential for utilizingthe institutional framework of the Universities for outreach of development programmes.
These five aspects make the project an exceptional instance of cooperation inresearch and the genesis of national policy in the cause of the girl child.
10 21

Chapter II
PROFILE OF THE HOUSEHOLD
LIST OF TABLES
Table No. Particulars Page No.
1 Religious Affiliation 14
2 Caste Distribution I 15
3 Caste Distribution II 1S
4 Mother Tongues 16
5 Languages Spoken at Home 16
6 Source of Migration 17
7 When the Families Migrated 18
8 Family Members Migrating 18
9 Main Household Occupation 19
10 Subsidiary Household Occupation 20
11 Ownership of House and Non-Agricultural land 21
12 Ownership of Agricultural land 21
13 Ownership of Cattle and Other Animals/Birds 22
14 Ownership of Agricultural and other Implements 22
15 Ownership of Conveyance 23
16 Ownership of Audio-visual Gadgets 24
17 Ownership of Household Appliances/Utensils 24
18 Indebtedness position of the Household 25
19 Households Benefitted by Govt. Programmes 25
20 Benefit from Employment/Income Oriented Programmes 26
21 Health Oriented Programmes 26
22 Benefit from Children-Oriented Programmes 27
23 Benefit from Education Programmes 27
24 Benefit from Housing Programmes 28
25 Benefit from Welfare Programmes 28
26 Impact of Development Schemes on Income 29
27 Impact of Development Schemes on Health 29
28 Impact of Development Schemes on Education 30
29 Adverse Impact of Development Schemes 30
30 Frequency of Family Outings 31
31 Girls included in Outings 31
11 22

Table No. Particulars Page No.
32 Type of House 32
33 Rent Paid for House 33
34 Number of Rooms in Dwelling 33
35 Sources of Drinking Water within House 34
36 Source of Drinking Water outside the House 35
37 Distance of Drinking Water outside the House 35
38 Persons in the Family Collecting Water 36
39 Extent of Electricity in the House 36
40 Nature of Toilet Facilities 37
41 Type of Cooking and Fuel used 38
42 Head of the Household: Relationship to Girl Child 38
43 Type of Family 39
44 Total Number of Members in the Household 39
45 Number of Adult Females in the Family 40
46 Gender and Family Size 41
47 Parents' Chronological Age 42
48 Parents' Education 43
49 Father's Occupation 45
50 Mother's Occupation 45
51 Organised/Unorganised Sector 46
52 How Mothers are Employed 46
53 Father's Income 47
54 Mother's Income 48
55 Paid in Cash or Kind 49
56 Adult Male Earners - Female Earners 49
57 Child Earners - Girls - Boys 50
58 Total Household Income (monthly) 50
59 Female Earners Income 51
60 Income of Girl Earners 52
61 Income of Boy Earners 52
62 Education of Eldest Male 53
63 Eldest Male Occupation 53
64 Eldest Female Occupation 54
65 Education of the Eldest Female 54
66 Relationship of the Informant to the Girl Child 55
12
23

LIST OF DIAGRAMS
Chart Number Particulars Page Number
1 Parents' Level of Education 43
2 Father's Income 47
3 Father's Income 48
13

Chapter II
PROFILE OF THE HOUSEHOLD
Demographic Profile
The demographic profile of the household in which the girl child is located canbe drawn from several kinds of data about the families : religion, socio-economic status,caste, migration and so on.
Religious Affiliation
.."le first question was about the religious affiliation of the family.
Table II.1
Religious Affiliation of Families in the Sample
Religion Percent Religion Percent
Hindu 85.5 Buddhist 1 .2
Muslim 7 .3 Jain 0 . 2 `
Christian 2 . 5 Others 0 . 6
Sikh 2 . 6
The religious affiliation of the sample with the percentage in each group is givenin Table II. 1. The large majority were Hindus (85 . 5%) and Muslims constituted thelargest minority with 7 . 3%.
Caste Distribution
The selection criterion was to have adequate representation of those lowest inprivilege and status.
In India, the SC comprise about 15% and ST about 7 . 5% of the populationas a whole. A particular effort was made in this study to include at least thesame proportion of the two groups in the sample. It is well known that evennow, in spite of reverse discrimination for four decades, persons who belongto the SC /ST families, are on the lowest rung of the hierarchy. Girl childrenfrom these families, it was anticipated would have least access to privileges.Table 11.2 gives us a clear picture of the proportion of families from the ScheduledCastes and Tribes.
14

Table 11.2
Caste Distribution in the Sample ( I )
Castes Percent Castes Percent
Scheduled Castes 20.3 Other Hindu Castes 62.1Scheduled Tribes 5 . 7 Other Religious Groups 11 .8
The research teams did in fact succeed in getting sufficient numbers of SC families.However, the ST representation is a little short and one can hazard a guess about the socio-geographical reasons for the same (i.e. in the selected rural districts or urban wards, therepresentation of Scheduled Tribes was relatively lower than in the whole population).
The categorization of the total sample by caste is as follows. (Table 11.3)
Table 113
Caste Distribution in the Sample ( II )
Castes Percent Castes Percent
Brahmin 7 . 6 Scheduled Castes 20.3Other Forward Castes 27.8 Scheduled Tribes 5 . 7
Backward Castes 31 .9 Others 6 . 6
Brahmin and other Forward Castes together comprise one third of the sample,Backward Castes a little less than 1/3 and Scheduled Castes 20%. Those in the 'other'category were from religious faiths r Cher than Hindu.
Language Distribution
Mother Tongue
The distribution of the mother tongue of the girl children in the sample revealsa wide range of 12 official languages and 6 dialects, as presented in Table 11.4
There were no sub-samples from the North-East or from Kashmir and henceAssamese, Kashmiri or Urdu were not found to be mother tongues in the sample. Theunevenness of the representation from different Indian States (which in turn constitutelinguistic regions) can be seen. There were three sub-samples from Andhra Pradesh andthree from Maharashtra, which accounts for the relatively higher proportions of Teluguand Marathi speaking families. Hindi would have been used in some urban parts allover the country and in U.P., Delhi and M.P. In addition to the official languages(formally recognised), we have people identifying their mother tongue as Bhojpuri,
15

Marwadi, Magahi or Tulu. It is apparent that the languages spoken by Indians far exceedthe number of official languages. The non-official languages include thosespoken by the indigenous tribes as well as dialects of the official languages andlanguages which have not been given official status because they do not have aseparate script.
Table 11.4
Mother Tongue of the Girl Child
Languages Percentage of Sample Languages Percentage of Sample
Bengali 4 .5 Sindhi 4 . 3
English 0 .1 Tamil 4 . 7
Gujarati 5 .3 Telugu 15 .9
Hindi 11 .6 Bhojpuri 2 .8
Kannada 9 .5 Marwadi 3 .5
Malayalam 4 .7 Rajasthani 0 .1
Marathi 13 .3 Magahi 3 . 0
Oriya 3 .9 Tulu 1 . 1
Punjabi 3 .8 Garhwali 1 .7
Languages spoken at home
Most non-Indians encountering Indians for the first time comment on thetendency for Indians to be at least bilingual. However, bilingualism is found morecommonly in urban areas and among migrants. Here two-thirds of the total samplewas rural and most families were at the lower SES levels; monolingualism was thereforedominant.
Table 11.5
Languages spoken at home
Languages spoken Percent
Mother tongue only 87.6Mother tongue and one other language 11.0
In the sample, 87 . 6% speak only their mother tongue at home. In this sample,which was drawn largely from rural areas or deprived urban wards, 11% of the familieswere bilingual at home (Table II . 5).
16

Migration of the Family/Members of the Family
Migration is often the choiceless route to a livelihood for low skill povertygroups and an option for highly qualified persons (migration being a
phenomenon with two distinct types of persons, responding to whatsociologists refer to as the push and the pull factors respectively). Given thatour sample is largely from the rural areas (two thirds of the entire sample),
it is understandable that almost 80% are stable in their place of origin, while 20%have come from elsewhere (Table 11.6). Most of the migrants in the sample wereurban residents.
Table 11.6
Source of Migration
Migration Percent
From village 12.1
From town 4.3From city 3 . 0
Inapplicable - (not migrated) 79 .8
Where does one belong? This an easy question to ask and a difficult oneto answer. There is great deal of movement from one part of the country toanother especially from rural to urban areas. Except for farm-owning cultivators
who are sedentary because of owning and cultivating land, others move foreconomic reasons. Generally migration per se in not an indication of socialstatus, since both pull and push factors operate i.e.. one moves for a
better job and amenities or one is pushed out by poverty or drought.
Migration tends to take a rural-to-urban or urban-to-urban direction. Thereis also a tendency for migration from small towns to large cities. In this sample,there are 12% migrants from rural areas, compared to 7 . 3% from urban areas(possibly to other urban areas), almost all in search of employment.
Of the 20% of the sample who have migrated from elsewhere, the largest numberhad done so more than 20 years earlier (Table 11.7).
The rest came more or less in an even flow over a 20 year period - reflectinga gradual movement of people rather than an upheaval or exodus.
It was considered important to study the pattern of migration i.e. whether theymoved singly or in families and so on.
17

Table 11.7
When the Families Migrated
Period Percent
1-5 years ago 3.35-10 Years ago 3 . 6
10-15 years ago 3.315-20 year ago 2 . 9
More than 20 years ago 6 . 2
Inapplicable - not migrated 79.9
Quite often whole families move together in search of livelihood especially to thecities and towns and 6 . 5% of our sample fell into that category. About the same numberhave the male head of the family moving first and the rest of the family followinglater on (Table II.8).
Table 11.8
Family Members Migrating First
Family members Percent
Grandfather 2 . 2
Father 6 .6
Both parents 2 . 8
Entire family 6.5Inapplicable 79 .9
For many of the families selected, migration probably meant the possibility ofbeing on the margin of subsistence. For them there was no question oflarge savings or supporting others in the family they left behind. Whenquestioned, it was found that sending money to the family is a practice ofonly 1 .7% of the sample.
In 92% of the families, no member was working out of his village/town.The small number of out-migrants (7 . 2%) were probably from the ruralfamilies in the sample, following the demographic trends associated withurban development. The question that had been formulated was "Who are thefamily members working elsewhere?" and since it specifically concernedthose working, children who had gone for studies .did not enter thiscategory.
18
29

Main Household Occupation
The response to the question about main household occupation revealed someinteresting facts. Almost 31% of the sample of 12,000 families had no specific householdoccupation. They would have constituted the people in non-traditional occupations,which includes services and professions. Agriculture constituted the largest main oc-cupation in the sample - totalling small land owners (29%) and agricultural labourers(8 . 5%). The non-agricultural manual wage workers made up 7% of the group. TableII.9 shows the details.
Table 11.9
Main Household Occupation
4.
Household Occupation Percent
Piece-rate worker 2 . 8
Business 5 . 9
Petty Business 5 . 3
Agriculture 29.2Artisan/Craftman 3 . 6
Agricultural labour 8 . 5
Manual wage worker (non-agricultural) 7 . 1
No specific household occupation 30.8Sweeper/Barber 1 .6Any other 3 . 8
It was decided to ascertain the main household occupation i.e. the traditionaloccupation of the family which was to be differentiated from salaried jobs in the publicor private sector or defence. The question was intended to tap traditional familyoccupations, characteristic of most rural families. It was also recognized that unskilledlabour would move to any available work and hence would not qualify in the categoryof main household occupation. The proportion of manual wage workers (7 . 1%), artisans(3 . 6%) agricultural labour (8 . 5%) and no specific household occupation (30 . 8%) conveysthe information that the sample is drawn from the bottom of the status hierarchy andtherefore is representative of the families in poverty or subsistence levels identified inthe objectives of the study.
Subsidiary Occupations
Since agricultural activities are bound to the seasons, they have peaks and troughsin the involvement level of the family round the year. During the lean season, families
19
30

might be expected to have a subsidiary occupation. It is the access to a subsidiaryoccupation that often helps families engaged in agriculture to sustain themselves through
difficult times.
Table IL10
Subsidiary Household Occupation
Household Occupation Percent
Piece-rate worker 2 . 4
Business 2 . 2
Petty Business 3 . 6
Agricultural 5 . 5
Animal Husbandry 3 . 0
Artisan/Craftsman 1 .0
Agricultural labour 5 . 3
Manual wage worker (non-agricultural) 3 . 4
No subsidiary occupation 69.9
Any other 2 . 7
The question of subsidiary household occupation was responded to negatively byalmost 70% of the total number of households. Agriculture is mentioned as subsidiaryhousehold occupation by almost 11% of the households involved in food preservation,food processing and post-harvest conservation tasks. At marginal and subsistence levels,petty business, craft work and agricultural labour may become overlapping categories;here the question asked was about the most important subsidiary occupation taken upby the household (Table II.10).
Economic Status: Ownership of Assets
Assessment of economic status cannot always be done by asking for an incomestatement; many persons are unwilling to state it openly, or unable to clearly assesstheir income, when much of it may not be in c sh.
Field work experience has shown that income as a response variable, can beunreliable. It was decided therefore to study the assets : house, land, cattle and movableassets in addition to income.
Ownership of House and Non-agricultural Land
The first of these - house and non-agricultural land revealed that only 7 . 8% didnot have their own houses. The rest owned their own dwellings, however modest. About
20
3
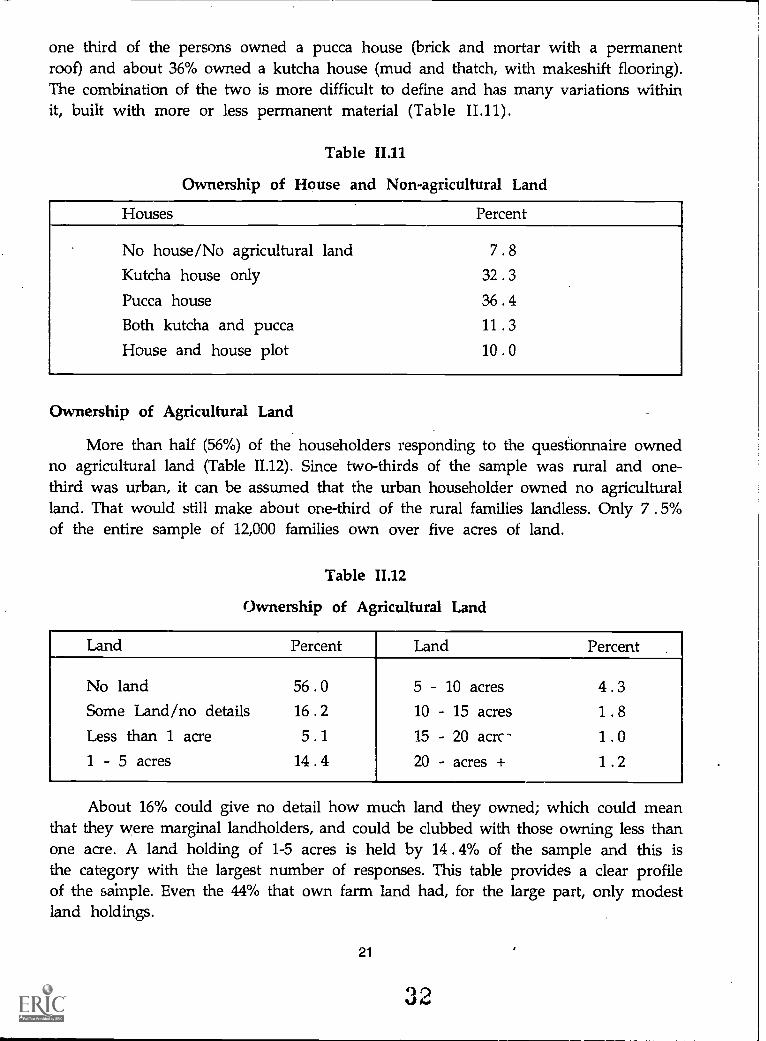
one third of the persons owned a pucca house (brick and mortar with a permanentroof) and about 36% owned a kutcha house (mud and thatch, with makeshift flooring).The combination of the two is more difficult to define and has many variations withinit, built with more or less permanent material (Table II.11).
Table 11.11
Ownership of House and Non-agricultural Land
PercentHouses
No house/No agricultural landKutcha house onlyPucca houseBoth kutcha and puccaHouse and house plot
7 . 8
32.336.411.310 .0
Ownership of Agricultural Land
More than half (56%) of the householders responding to the questionnaire ownedno agricultural land (Table 11.12). Since two-thirds of the sample was rural and one-third was urban, it can be assumed that the urban householder owned no agriculturalland. That would still make about one-third of the rural families landless. Only 7 . 5%of the entire sample of 12,000 families own over five acres of land.
Table 11.12
Ownership of Agricultural Land
Land Percent Land Percent
No land 56.0 5 - 10 acres 4 . 3
Some Land/no details 16.2 10 - 15 acres 1 . 8
Less than 1 acre 5 .1 15 - 20 acrc 1 .0
1 - 5 acres 14.4 20 - acres + 1 .2
About 16% could give no detail how much land they owned; which could meanthat they were marginal landholders, and could be clubbed with those owning less thanone acre. A land holding of 1-5 acres is held by 14 . 4% of the sample and this isthe category with the largest number of responses. This table provides a clear profileof the sample. Even the 44% that own farm land had, for the large part, only modestland holdings.
21
32

Ownership of Livestock, Poultry or Fish
Cattle and other farm animals are assets, generally held by farmers, as land andlivestock have a symbiotic relationship.
Table 11.13
Ownership of Cattle and Other Animals/Birds
Animals Percent
No cattle/animals/poultry/fish 63.0Milch cattle 24.3Non-milch cattle/camels 2 . 5
Milch cattle and non-milch cattle/camels 6.4Pigs/sheep/goats/poultry/fish 1.. 7
Milch/non-milch cattle and other animals/poultry/fish 2.0
Table II.13 shows that a clear 63% of the families own no animals, which areknown to be assets that could add to economic and health status. Twenty four percentof the householders own only milch cattle and 6 . 4% own mulch cattle and bulls.Other animals are owned only by a relatively small percentage of families in this sample.
Ownership of Agricultural or other Implements
Table 14 follows closely on the previous one. Being largely owners of very smallplots of agricultural land or being landless, almost 75% own no implements.
Table 11.14
Ownership of Agricultural and other Implements
Implements Percent
No implements at all 74.3Some implements/no details 7 . 3
Traditional implements alone 11 . 0
Low technical implements(excluding tractor or pump set) 3 . 8
Low technical implements and traditional implements 1 . 7
Tractor/pump set alone 1 . 0
22
33
Only 1% own tractor/pumpset and 5 . 5% own low technical implements. Thecategory of "some implements, no details" could probably be clubbed with traditionalimplements. Thus, treating agricultural and other implements as assets, these dataprovide an authentic picture of the sample, which is of people living on the marginof subsistence.
Ownership of Conveyance
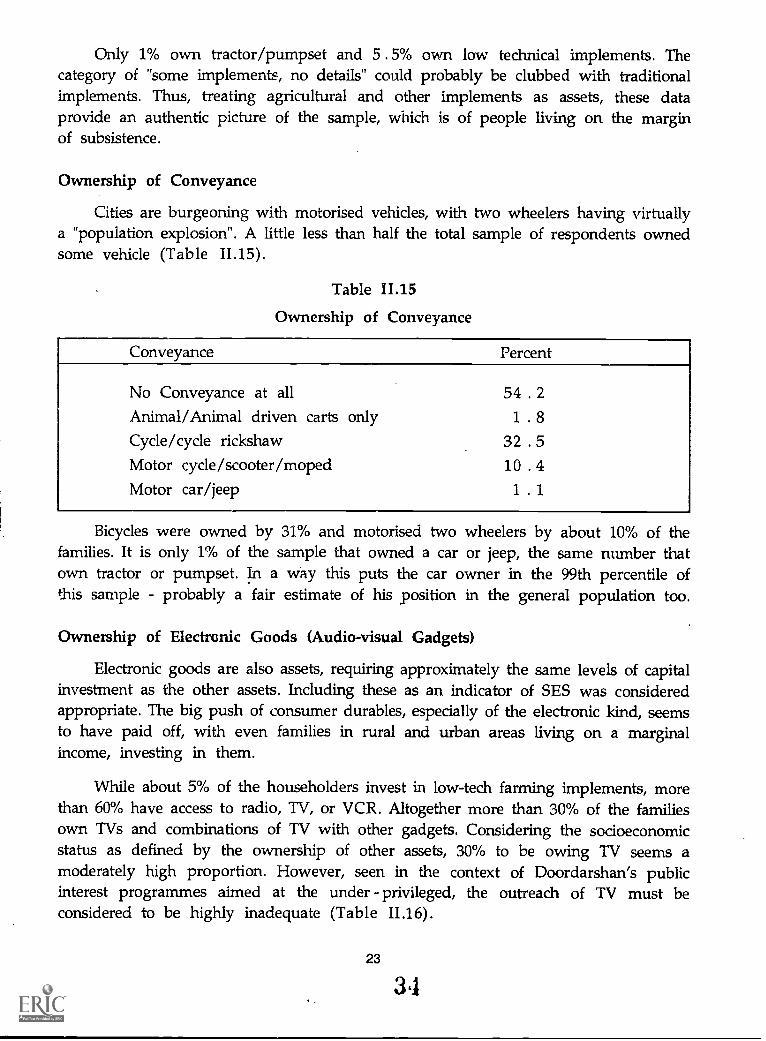
Cities are burgeoning with motorised vehicles, with two wheelers having virtuallya "population explosion". A little less than half the total sample of respondents ownedsome vehicle (Table 11.15).
Table 11.15
Ownership of Conveyance
Conveyance Percent
No Conveyance at all 54 . 2
Animal/Animal driven carts only 1 . 8
Cycle/cycle rickshaw 32 . 5
Motor cycle/scooter/moped 10 . 4
Motor car/jeep 1 . 1
Bicycles were owned by 31% and motorised two wheelers by about 10% of thefamilies. It is only 1% of the sample that owned a car or jeep, the same number thatown tractor or pumpset. In a way this puts the car owner in the 99th percentile ofthis sample - probably a fair estimate of his position in the general population too.
Ownership of Electronic Goods (Audio-visual Gadgets)
Electronic goods are also assets, requiring approximately the same levels of capitalinvestment as the other assets. Including these as an indicator of SES was consideredappropriate. The big push of consumer durables, especially of the electronic kind, seemsto have paid off, with even families in rural and urban areas living on a marginalincome, investing in them.
While about 5% of the householders invest in low-tech farming implements, morethan 60% have access to radio, TV, or VCR. Altogether more than 30% of the familiesown TVs and combinations of TV with other gadgets. Considering the socioeconomicstatus as defined by the ownership of other assets, 30% to be owing TV seems amoderately high proportion. However, seen in the context of Doordarshan's publicinterest programmes aimed at the under - privileged, the outreach of TV must beconsidered to be highly inadequate (Table 11.16).
23
3

Table 11.16
Ownership of Audio-visual Gadgets
Gadgets Percent
No gadgets 37.3
Radio/Transistor only 27.0
Tape recorder / two-in-one / record player only 5 . 2
T.V. with or without radio/transistor 16.2
T.V. and tape recorder/two-in-one with or without transistor/radio 12.2
V.C.P. /V.C.R. and T.V. with or without other gadgets 2 . 2
Ownership of Household Appliances!Utensils
Another asset of the family is the quantum of the household gadgetsowned. This category is important for several reasons, including their beingconsidered as necessary for inclusion in the daughter's dowry. Also being capitalgoods which are moveable, they may be pawned or sold when there is need ofcash and in that sense, they are liquid assets. More than half the householderscould name no household gadgets that they owned (Table 11.17).
Table 11.17
Ownership of Household Appliances/Utensils
Household Appliances/Utensils percent
No appliances at all 51 .1
Sewing machine only 1 .7
Fan only 9 . 1
Both fan and sewing machine 2 . 8
Refrigerator & Mixer-grinder with or without sewing machine/fan 3 . 6
Brass/Copper vessels only 9 . 0
Silver vessels with or without copper vessels 4 . 5
Brass/Copper vessels with any other gadget 2 . 2
Silver vessels (stainless steel) with any other gadgets 3 . 8
N.A. 4 . 4
Brass and copper vessels were mentioned by 9%. "Silver" here refers to stainless steel,often referred to as "ever silver". About 9% had a fan, another 2 .8% had a fan andsewing machine. Altogether the picture is of somewhat sparsely equipped households.
24

Household Debt
If people are not willing to state their income, as they are generally not, it wasfelt that asking them about their indebtedness would be another way of getting ateconomic status. However, the fact that almost two-thirds of the householders mention"no debt", made one feel that the hesitation concerning talking about one's income couldapply to indebtedness too.
Table 11.18
Indebtedness Position of the Household
Indebtedness Percent Indebtedness Percent
No debt 64.6 Rs . 5001 -10000 6 . 8
Upto 500 3 . 5 Rs .10001- 25000 4 . 0
Rs . 501 1000 3 . 3 More than Rs . 25000 2 . 1
Rs . 1001 3000 7 . 4 N.A. 1 .7
Rs . 3001 5000 6 . 6
But assuming that we have a true picture, we find that an amount of indebtednessranging from Rs.1000 to Rs.10000/- is mentioned by 21% of the sample. About 6% havea debt of less than Rs.1000 and about 6% more than Rs.10000/- (Table 11.18).
Government Programmes : Outreach and Benefit
One of the purposes of this study was to find out if the Government Programmesintended for the needy reached them and if those who benefitted saw themselves asbeneficiaries. In this context, it must be noticed that one-third of the households statedthat they had no benefit (Table 11.19).
Table 11.19
Households benefitted by Govt. Programmes
Benefit to members of family Percent
None benefitted 33.5All benefitted 46.2Only men benefitted 1 . 8
Only girls benefitted 2.4Both boys/girls benefitted 7 . 3
Women/children benefitted 5 . 7
25

About 46% say that some benefit reached all categories, men and women, boysand girls. Doubtless the programmes for boys and girls (which 7% claim reaches them)must be local Govt. run schools and the programme for women and children may havebeen the ICDS, MCH or DWCRA.
Employment or Income Generation Programmes
The official statements on income generation and poverty alleviation programmes
may lead one to believe that they have a far greater outreach than these figures tell.(Table 11.20)
Table 11.20
Benefit from Employment /Income Oriented Programmes(IRDP, NREP, TRYSEM, BGS, DWCRA, JRY)
Programmes (Benefit) Percent
Not benefitted from any such programme 60.5
Benefitted from such programmes 17.2
Inapplicable - no such programme in this area 19.6
D.K. 1 . 1
N.A. 1 . 6
More than 60% of respondents were categorical in the statement that they hadnot benefitted from any such programme; and about 20% said that their area had nosuch programme. Thus a clear 80% of the population is beyond the pale of employmentand income generation schemes, or is at least unaware that such schemes are available.
Health - Oriented Programmes
About 35% of the people report that they are aware of the Health-Orientedprogrammes and consider themselves as beneficiaries of these (Table 11.21).
Table 11.21
Health Oriented Programmes (Malaria, Leprosy eradication,Family Planning, Pre-natal/Post-natal care, etc.).
Health Oriented Programmes Percent
Not benefitted from any programmes 49.9
Benefitted from such programmes 35.2Inapplicable - no such programmes 14.8
26
3'7

Half of the entire sample say that they have received no benefit from any healthprogramme, and about 12% say that no such programme was available. Since thiscategory of programmes includes family planning as well as prenatal and post-natalcare, this table alone stands as a comment on the inadequate extent and outreach ofhealth programmes.
Children-Oriented Programmes
Children-oriented programmes (ICDS, Balwadi, Immunisation etc.) rate very simi-larly to health-oriented programmes in terms of the proportions of positive and negativeresponse (Table 11.22).
Table II. 22
Benefit from Children-Oriented Programmes (ICDS, Balwadi,Mid-day Meal, Vaccinations/Immunisation etc).
Benefit (children oriented programmes) Percent
Not benefitted from any such programmes 48.7Benefitted from such programmes 36.2Inapplicable 14.9
Even the coverage seems non-existent in 15% of the sampled areas. A serious effortat mapping the services for children must be made soon so that distant pockets donot remain unreached.
Educational Programmes
When examining the next table (Table 11.23) on Educational Programmes, we find37% claiming not to have benefitted at all. This is a surprisingly large numberconsidering the high enrolment figures for Primary School usually found in officialdocuments.
Table 11.23
Benefit from Educational Programmes (NFE, Adult Education,School, School-oriented)
Educational Programmes Percent
Not benefitted from any programmes 37.3Benefitted from programmes 47.9Inapplicable 12.3
27
38

However when we consider the number of girl children in this sample who havenever attended school and the number who have dropped out, this figure's authenticityis supported.
Housing Programmes
Regarding housing, almost 90% do not benefit from Government programmes.Either housing programmes are not available or they are not able to avail of existingprogrammes because of conditions attached to the scheme and the constraints.
Table 11.24
Benefit from Housing Programmes (Indira Awas Yojana,Low-Income Housing, Housing Plots)
Housing Programmes Percent
Not benefitted from any such programme 69.9
Benefitted 8 . 7
Inapplicable 18 .7
One can hazard a guess that the 8 . 7% householders who say that they did benefithad got either a loan or a plot allotted, and only rarely, housing itself (Table 11.24).
Other Welfare Programmes
When one clubs the residual welfare schemes (after health, education, incomegeneration and housing have been considered separately) it does make something ofan assortment (Table II . 25).
Table 11.25
Benefit from Welfare Programmes (Drainage, Hand-pumps,Old Age pensions, Public Toilets, Smokeless Chulahs, Bio-gas)
Welfare Programmes Percent
Not benefitted 35 .9
Benefitted 49 .5
Inapplicable 11 .5
Nevertheless, the purpose was to see if even one programme undertaken by theGovt. for the well-being of the people had reached every family. Almost 36% give the"not benefited" response. Not done, or not seen to be done? This needs further study,
28
39

not only for welfare programmes but for all the earlier ones discussed here.. The contrastbetween the definition of benefit with the definition of "right" might well explain thefinding that a miniscule proportion of the poor "benefit". They might consider schoolinga right and not an educational programme intended for their "benefit".
Impact of Development Schemes on Income
The schemes that offer support of some kind ( loans, technical advice,infrastructure ) should ideally increase the productivity of the workers and ultimatelytheir income.
Table II. 26
Impact of Development Schemes on Income
Impact on Income Percent of Workers
No impact 59.9Improved to some extent 17.8Improved to a great extent 3 . 3
This question was intended to check out the people's perceptions. Those whofind a great deal of improvement in income, thanks to developmental programmesconstitute only 3% of the sample and those who improve "to some extent" were about18%. About 60% state that there was no impact on their income of any developmentalscheme (Table 11.26).
Impact of Development Schemes on Health
Health-oriented programmes should normally affect health directly; indirectly healthwill be positively affected by any scheme that improves income, access to resourcesand a sense of well being.
Table II. 27
Impact of Development Schemes on Health
Impact on Health Percent
No impact 41.0Improved to some extent 38.6Improved to a great extent 2 . 8
When one has to assess whether the programmes on health had any impact onone's health, one hesitates to give a straight answer. This question is not an easy oneto answer and may be seen as approximate rather than exact.
29 40

Impact of Development Schemes on Education
People may not perceive attendance in the locally run Govt. school as "impacton education". They might well assess impact on the basis of whether the children haveacquired literacy, numeracy and other abilities and skills.
Table II. 2S
Impact of Development Schemes on Education
Impact on Education Percent
No impact 33.4Improved to some extent 45.5Improved to a great extent 3.5
Nevertheless since about 46% mention improvement to some extent - they musthave considered the school system for their children as a corollary of the developmentschemes and the fact of their children attending school as benefits of the developmentscheme in education (Table 11.28).
Adverse Impact of Development Schemes
'Development' has in current usage become a word loaded with the burden and
fallout of development programmes. Distancing, mystification, bureaucraticcontrol and the new power of expertise goes with the development package. So, itwas decided to ask people if there was in their view, an adverse impact of GovernmentSchemes.
Table II. 29
Adverse Impact of Development Schemes
Impact of Devt. Schemes Percent
Problems with implementation/functioning 15.6
Corrupt practices 5 . 1
Cumbersome procedures 2 . 1
Inapplicable 52.6Don't know/Can't say 10.3
N.A. 11 .5
30
41

Almost 75% could not respond to this query, while 15 . 6% felt that theimplementation of Schemes had problems, 5% mentioned the corruption of officialsand 2% complained about the cumbersome procedures in getting grants sanctionedetc (Table II . 29). e
Family Activities
We move now to some of the family activities that may be components of thequality of life for its members.
Table II. 30
Frequency of Family Outings
Family Outings Percent Family Outings Percent
No - never 10 .9 Once a fortnight 1 .1
Yes only occasionally 47.3 Once a month 8 . 6
Frequently 9 . 4 Once in six months 9 . 2
Once a week 5 . 2 Once a year 8 . 0
One of the common observations made when one visits a village is that thereis not that much to do outside the home : no place to go to, for most children, andno one to visit except one's cousins or friends in the neighbourhood. In this context,even visiting relatives or going on an outing with the family becomes a rare event.There are 10 . 9% families who never go for an outing and 5 . 2% who do so oncea week. For almost half the families, an outing is an occasional event (Table 11.30).
Some girls are "grown in seclusion" like greenhouse plants (14% or so) in thissample! (Table 11.31). Outings generally seem to exclude the girls or "only occasionally",to include them.
Table II. 31
Girls included in Outings
Girls in outings Percent Girls in outings Percent
No - never 13.8 Once a fortnight 8 . 3
Yes - only occasionally 46.8 Once in six months 9.9Frequently 8.3 Once a year 8.1Once a week 3 . 3 N.A . 1 .3
31
42

A village mela, a temple festival or a family wedding which whole families andtheir girl children celebrate or participate in may not happen more than two or three
times a year for most families.
Housing
1. Type of Housing
A fairly reliable indicator of socio-economic status is the kind of housing the familyenjoys. In most parts of the country, the Kutcha-Pucca dichotomy helps (Ku teha madeof mud and thatch and Pucca built with fairly permanent materials). However, differentparts of the same house could be stable or temporary and therefore a combinationof the two is also an alternative.
Table II . 32
Type of House (in terms of Construction)
Type of House Percent
Kutcha 32 .0
Pucca (brick, cement etc) 46 .3
Combination 16.9
Mop ri /hut 4 .7
N.A. 0 . 1
The label 'combination' does not give an idea of how much of it is "Pucca" or "Kutcha".
The families in this sample, who live in housing that has to be constantly renewed andoften cannot withstand storm or wind, constitute about one third of the total. About5% have huts which are shacks, improvised out of waste materials (Table 11.32).
The kind of house most people have is so minimal that it is owned rather thanrented. More than 80% own their homes while about 16% live in rented accommodation.The latter are likely to be families in the urban areas.
2. Rent Paid
The next table presents a clear indicator of the socio-economic status of the entiresample.
The fact that more than 80% of the people own their homes (be they small hutsor hovels) has already been established. Of the rest, 4 . 3% are paying over Rs.1000p.m. as rent. Surely, they must be from the urban samples, specifically the subsectionof the middle class About 10% (half of all the rent payers) pay less than Rs.200/-
32
43

p.m. Given the much higher rent that the average middle class urban resident islikely to be paying, the delineation of the socio-economic standard of this sample isunambiguous (Table II. 33).
Table 11.33
Rent paid for House (p.m.)
Rent in Rupees Percent families
Inapplicable 80 .2Less than 50 3 . 7
51 100 3 . 1
101 200 3 . 5
201 500 0 .7501 - 1000 0 . 8
1001 and above 4 . 3
3. Size of the Home
Since most families own their own homes, the size of the home specifically thenumber of rooms was considered a salient variable for socio-economic status.
Our findings reveal that less than 10% of the sample have more than five rooms inthe house, and 11% of the total number of households have four rooms (Table II. 34).
Table 11.34
Number of Rooms in Dwelling
Number of Rooms Percent families
One 26.0Two 33 .9
Three 18.9Four 11 .2
Five 4 .5Six + 5 . 0
Families which have three rooms constitute about 19%. One third of the totalsample live in a two-room house and 26% in only one room. Poverty conditions areagain reflected in the majority of the homes mentioned here. It must be remembered
33
44

that even the term "room" may be seen to be defining a relatively small space(64 or 80 sq.ft.) though this is bound to vary.
4. Amenities
Is there a separate space for cooking? Do they have some open space aroundthe house? How is the system functioning? These were some of the questions we asked.
We found that about 2/3 of all houses have a separate space for cooking and someopen space attached to the house. About 35% have waste water stagnating near the
house, while about 44% have a drainage system. 'Minimal' would be an apt term todescribe their amenities at home.
5. Availability of Drinking Water
Despite a mission established at the national level for drinking water some years
ago, the availability of water is still a problem.
Table 11.35
Source of Drinking Water within House
Drinking Water within House Percent
Tap 24.5
Handpump 4 . 7
Tubewell 4 . 8
Inapplicable (no source within house) 64.5
Drinking water is a scarcity; access to drinking water in or near the house is a"privilege" that at best, only one third of the sample has. Those that have tap waterconstitute only a quarter of the whole. Wells, hand pumps and tube wells are available
to about 10%.
Later in this analysis, the same data will be seen to reflect on the way the girlchild spends her time. Invariably in all families, it is the women and girls of the familywho fetch drinking water. Thus a large majority of girls in the sample occupy a partof their Lime every day in fetching drinking water.
In examining the source of drinking water, we find that the most common sourceof drinking water outside the home is a tap. The question does not cover the durationin hours of this facility and given the country-wide water scarcity or the ratherunplanned water management, the tap water facility must be available only for a few
hours per day.
34
45

However, 18% of the families use a hand pump and 16% use water from thewell for drinking purposes.
How far does one have to go for water?
Table II. 36
Source of Drinking Water outside the House.
Outside the House Percent
Tap 29 .6
Hand pump 18.1
Well 15.9Tube well 3 . 0
Pond/Spring 1 .0
Inapplicable (water-source inside the home) 30.1Water tanker 0 . 5
For about a third of the households, the drinking water source is in the house.It is the remaining 65% to whom this question was specifically addressed. For almosthalf of all the families, water is available just outside the house (21%) or in theneighbourhood for 25% (Table IL 36).
Table II. 37
Distance of Drinking Water outside the House.
Distance Percent
Just outside the houseIn the neighbourhoodWithin village
Outside village (within 2 kms)Inapplicable (source within house)
21.225.316 .3
2 . 1
34.5
Almost all families can find drinking water within their own villages, although2 . 1% have to go outside the village for a distance of about 2 kms.
Slaking the family's thirst is both the birthright and the duty of the women andgirls. It is common knowledge that collecting water is one of the gender-related tasks.
We see in Table II. 38 that girls and women as a category of persons collectingwater constitute 30% (in addition girls only constitute 4 . 2% and women only, 9 . 3%).
35
46

There are other combinations of course, including men and boys (1 . 2%). Boys are also
roped in to help with domestic tasks (including fetching water), but the provision oflife sustaining water is dependent almost wholly upon the labour of the female members
of the family.
Table 11.38
Person in the Family Collecting Water
Persons in the Family Percent
Girls only 4 . 2
Women only 9 . 3
Girls and women 30.1
Girls and boys 1 . 8
Girls, boys, and women 6 . 9
Men and boys 1 . 2
Any or all members 11 .4
Inapplicable - (source within house) 33.6
6. Electricity
The availability of electricity in the village or slum area indicates the level ofdevelopment of the area and its availability in the home, a definite input into the qualityof life of the family. In this sample, 94 . 5% of the families stated that their villageor locality had electricity.
Table 11.39
Extent of Electricity in the House
Electricity Percent of Families
NoYes - only 1 pointYes - less than 5 pointsYes - more than 5 pointsInapplicable
29.010.833.720.6
6 . 0
However, as can be seen in the table, 29% of the households did not have electricityin their homes. Of those who do, there was quite a variation in the number of points.As socio-economic status goes up, the number of electrical points in the house also
36
47

increase. While 10% of households had just one electric point, about 34% had morethan one and less than 5 electrical points. Statistically speaking, this range (1-5) wasthe mode. Only about 20% of the families, had more than five electric points in thehouse (Table II. 39).
7. Toilet Facilities
It never ceases to surprise one that people are willing to do with less than minimalamenities (or unwillingly tolerate the lack of amenities).
Table II. 40
Nature of Toilet Facilities
Type of Toilet Percent
No toilet facility 54.1Pit latrine 7 . 3
Flush latrine 24.8Dry type latrine 7 . 6
Sulabh shauchalaya 3 . 4
Any other 2 . 7
Another telling indicator of the socio-economic status of the group and the levelof environmental hygiene is that 54% of the households have no toilet facilities, whichmeans that open fields or woods or beaches are used for defecation. One quarter ofall the households have a flush latrine, while all the other kinds of water closets togetherconstitute 21% (Table II . 40).
8. Cooking Fuel
The question of cooking fuel is important not only to nail down another indicatorof socio-economic status, but to yield yet another datum regarding women's drudgeryand the time spent on gathering fuel.
The 'conventional' category here covers wood and dung (generally collected ratherthan purchased ) as well as coal and kerosene, which are available in the market. Gasand electricity have been clubbed here as "modem" since their use makes cookingless time-intensive. Even taking into account that both kinds are combined, less than20% families use fuel that saves time. The impact of this fact on the life of thy; girlchild will have to be assessed. If the cooking pot needs her labour, the obvious sacrificemay be her schooling (Table II . 41).
37
48

Table II. 41
Type of Cooking and Fuel used
Type of cooking fuel Percent
Conventional (wood, dung, coal, kerosene) 77.9
Modern (gas, electricity) 9 . 1
Non-conventional (bio-gas, gobar gas) 0 . 6
Modern and conventional combined 7 . 4
N.A . 4 . 4
Head of the Household
When we planned the questionnaire, it was decided that we would find out whowas considered head of the family, and how that person was related to the girl childwho was included in the sample of this study.
Table 11.42
Head of the Household: Relationship to Girl Child
Head of the Family Percent
Father . 83.8
Mother 5 . 2
Grandfather 6 . 5
Grandmother 2 .0
Father-in-law 0 .5
Mother-in-law 0 . 3
Conventionally, the eldest male is considered the head of the family. In the sample,in about 84% of the families, the father is seen as the head of the household, whilethe mother is considered the head in 5 . 2% of the families. In a few families (6 . 5%)
the grandfather is seen as the head. In this sample, the female headed householdsconstitute about 7% (in actual number, 864 families). Since a small number of girls inthe sample were married, they consider their father or mother-in-law to be the headof the household (Table II. 42).
Family Structure
The category system of nuclear, supplemented nuclear, joint and extended is afairly standard one for the contemporary Indian scene. It has long been observed by
38
49

field workers that joint and extended families seen as "typically Indian" characterisefamilies that are land-owning or affluent.
Table 11.43
Type of Family
Type of family Percent
Nuclear family (husband, wife and unmarried children) 72.4Supplemented nuclear family (nuclear family withdependent parent)joint familyExtended family
10.713.33 . 6
By and large, poverty groups remain "nuclear" in their family structure (TableII . 43). While a nuclear structure may provide opportunities for the child to developautonomy and to take an active part in family decisions, it reduces the number ofpotential child caregivers within the family. In turn, the burden falls upon the younggirl child. In that context, this table has important implications for the quality of lifefor the girl child. Being "little mother" may give the girl child management skills fairlyearly in life; it is also likely to take away her childhood and thrust adult responsibilitieson her long before she is ready physically or psychologically.
Table 11.44
Total Number of Members in the Household
Members in the household Percent Members in the household Percent
3 members 3 . 7 8 members 8 . 1
4 members 15.2 9 members 4 . 6
5 members 23.7 10 members 2 . 76 members 21 .5 11 members 1 .87 members 14.4 12 members 1 .2
The old fashioned family portraits with 35 or 40 members around an old patriarchfound in turn of the century photographs may have only historical relevance. Familysize in India, like the joint family, has developed many myths around itself, includingthat of its ubiquity.
However there are 19% families with less than four members and most familieshave either five or six members. In this sample 45% of all families fall into the category
39
50

of having 5 or 6 members. About 14% have seven members. Only 10% of the householdsare really large, having 9 -12 members (Table II. 44).
Number of Adult Females
Who helps whom with work in the house?
Among how many is the drudgery of housekeeping (collecting water, gatheringwood fuel, child care) shared? The presence of adult females, other than the motherin the household, is a highly relevant variable for the life of the woman and for thegirl child in the family.
Table 11.45
Number of Adult Females in the Family
Adult females in the Family Percent
One 68.0
Two 21 .2
Three 6 . 9
Four 2 . 2
More than two thirds of the households (68%) have only the mother and 21%have one other adult female in the household. A nuclear family with one or twodependent relatives, or an extended family with the bride of the brother included mustbe examples of families with more than one adult female (Table II . 45).
Gender and Family Size
When one takes up the question of family size, the number of children is a majoraspect. Our interest was to see whether the girl child was under-represented, in astatistical sense. If only chance were operating there would be equal numbers of sonsand daughters on the whole.
An important datum for this study is the number of daughters in the family. Weexamined this variable from the perspectives of families with one, two or three sonsand one, two or three daughters. There is a bias for the male child that becomes evidentin this kind of head count.
Families with only one daughter constitute more than 43% of the total numberof households, while those with two daughters are 32% of the whole. This means thatthree quarters of all families have either one daughter or two daughters. Families that
40
51

have one son only constitute 38 .5% and those with two sons 27 . 3%. About two-thirdsof all families have one or two sons (Table II . 46).
Table 11.46
Gender and Family Size
Families and gender of children Percent of families
One daughter
Two daughters
Three daughters
One son
Two sons
Three sons
43.4
32 .1
14.9
38.5
27.3
9 . 0
This table can be seen to make a social statement. One may hazard that the genderbreakup of the children now living may reflect the judicious neglect of girls. This isonly an inference not a stated fact in any of the interviews.
Almost 89% of the households had intact families i.e. where the women hadnot been widowed or deserted. The women we were considering here were boththe mothers of the girl children and other adult female members. About 10% ofthe families had women who had gone through divorce, separation, desertion orwidowhood.
Only 0 . 5% of girls under 18 (60 in absolute number) fell into the category ofdivorced/separated/widowed.
Age of Parents
The question regarding the age of parents was mainly of demographicinterest.
Taking a look at Table 11.47 we may observe that in both cases there is a clusteringof the chronological age in approximately every five year period - 30, 35, 40, 45 and50 in the case of the father and 25, 30, 35, 40 and 45 in the case of the mother. Thisis a good example of how age is treated; not exactly, but as an approximation. Peopletend to be thirty for a few years, thirty-five for a few years and so on. Social scientistsin India have always found that even demographic data (like age and income) areexpressed as approximations, since people do not generally seem to place much valueon precision and exactness.
41
52

Table II. 47
Parents' Chronological Age
Father's Age Percent Mother's Age Percent
Inapplicable (not alive) 7 . 0 20 Years 0 . 1
28 Years 1 . 0 21 Years 0 . 1
29 Years 0 . 4 22 Years 0 . 4
30 Years 5 . 0 23 Years 5 . 0
31 Years 0 . 5 24 Years 0 . 9
32 Years 2 . 7 25 Years 3 . 0
33 Years 1 . 0 26 Years 2 . 5
34 Years 1 . 0 27 Years 2 . 3
35 Years 11.0 28 Years 4 . 7
36 Years 2 . 1 29 Years 2 . 3
37 Years 1 . 6 30 Years 10.0
38 Years 4 . 1 31 Years 2 . 5
39 Years 1 . 3 32 Years 5 . 7
40 Years 15.0 33 Years 3 . 3
41 Years 1 . 2 34 Years 2 . 8
42 Years 4.0 35 Years 11 . 7
43 Years 1 . 5 36 Years 3 . 9
44 Years 1 . 0 37 Years 2 . 9
45 Years 11 .4 38 Years 4 . 7
46 Years 1 . 4 39 Years 2 . 2
47 Years 1 . 3 40 Years 9 .8
48 Years 2 . 3 41 Years 1 . 8
49 Years 0 . 8 42 Years 2 . 9
50 Years 7 . 8 43 Years 1 . 6
52 Years 1 .4 44 Years 1 . 1
55 Years 3 . 4 45 Years 5 . 2
60 Years 2 . 4
42
53

Parents' Education
The education of the parents becomes a good indicator of socio-economic status.
Table 11. 48
Parents' Education
Level of Education Fathers Mothers
Inapplicable (not living) 7 . 2
Non-literate 31 .0 57 .3Primary 16.5 15 .5Middle 13 .2 11 . 7
High/Higher Secondary 18.9 10.0Graduate 8 . 3 2 . 1
Postgraduate 2 . 1 0 .6Technical/Professional/Diploma/Degree 2 . 3 0 . 9
Post Graduate
Tech./Professional/Diploma
Graduate
Higher Secondary
Middle School
Primary School
Non-Literate
0% 10%
V;17";Vg:MUMMEMIILEMMI
, -4-
20% 30% 40% 50% 60%
III Father Mother I
PARENTS' LEVEL OF EDUCATION
43

In the case of the fathers, about 31% of them were non-literate and the rest were
spread somewhat evenly over Primary (16 . 5%), Middle (13 . 2%) and Higher Secondary
(18 . 9%). A little over 8% of the fathers had a College degree and another 4% had
Post-graduate or professional qualifications.
Data collected on the mothers' level of eduction reveals that 57% of them are
non-literate. As in the case of the fathers' education , the rest of the sample was spread
out rather evenly over Primary (15 . 5%), Middle (11 .7) and Higher Secondary (10 . 0%).
About 2% of the mothers had College degrees and 1 . 5% had Post-graduate orprofessional qualifications (Table II . 48).
Fathers' Occupation
The details on the nature of the parents' occupation help to delineate the socio-
economic status of the families from which the girl children have been selected.
The table (Table II . 49) is self explanatory. Unskilled workers (10 . 3%) and
agricultural labour (10 . 1%) constitute the largest categories. Petty business, marginal
farming, piece rate work and unspecified service jobs together make up about aquarter of the entire sample. Occupational status. tallies with the educational qualifi-
cations of the fathers, with about 14% holding white collar jobs, including professional
ones.
Mother's Occupation
The mother's occupation has been viewed in three categories ie. nature ofemployment, sector in which mother is employed and how she is employed.
The first category is the nature of the mother's employment.
From Table II .50 we can see that 'most 60% of the mothers come in the categoryof 'Not working/N.A./D.K.' Of the 40% mothers who do work, 19 . 3% are employed
as agricultural labourers or as workers in agro-related activities. Home-based industry/
piece rate workers and crafts employ 6 . 7% of the working mothers. The rest of the
sample is distributed in very small percentages over construction labourers (1 . 2%),
Factory (0 . 5%), Service (3 . 3%) and so on.
44
JOJO

Table 11.49
Father s Occupation
Occupation Percent
Senior Professional 3 . 2
Junior Professional and middle level official 5 . 0
Other white collar jobs 5 . 7
Service-unspecified 7 . 8
Skilled worker 9 . 1
Unskilled worker 10.3Big farmer (more than 10 acres) 2 . 7
Medium farmer (5-10 acres) 3 . 7
Marginal farmer (1-5 acres) 8 . 2
Farmer (land unspecified) 5 . 6
Agricultural labourer 10 .1
Large and medium business 4 . 6
Petty business 6 . 0
Washerman/barber/cobbler 2 . 5
Piece rate workers 2 . 4
Any other occupation 3 . 3
No specific occupation (unemployed) 1 .3Inapplicable (fathers not living) 6 . 7
Table 11.50Mother's Occupation
Employment Percent
Industrial/factory worker 0 . 5
Agricultural labourer and related activities 19.3Construction labourer 1 . 2
Semi-skilled labourer 1 .0
Home-based industry/piece rate worker/Crafts 6 . 7
Service (clerical, teaching, para-medical e t c . ) 3 . 3
Business/Self employed 2 . 7
Others 5.0N.A./D.K./Not working 60.5
4556

The next table shows the distribution of the mothers working in the organizedand unorganized sector.
Table 11.51
Organised or Unorganised Sector
Sector Percent
Organized sector 4 . 5
Unorganized sector 35 .8
Inapplicable not working 58.7D.K. & N.A. 1 . 1
Of the 40% of mothers who are working, the large majority (35 . 8%) work inthe unorganized sector and only 4 . 5% in the organized sector. (Table II . 51)
The next Table (II . 52) shows how the mother is employed.
It is seen that 12 . 2% of the mothers are employed for wages, while 9 . 3% ofthem are self-employed. A small number (5 . 8%) work in home-based production, while6 . 5% work jointly with the family in agriculture or related tasks.
Table 11.52
How Mothers are Employed
Employed Percent
Self-employed 9 . 3
Employed for wages 12.2
Working with family (shared piece wages) 6 . 5
Working in home-based production 5 . 8
Any other 6 . 9
Inapplicable not working 58.5N.A. 0 . 9
Parents' Income
Extracting the information about the income of a person is a difficult task. However,our trained field personnel were persistent and succeeded in getting relevant informationon the subject. The occupational status defined in the previous table gets texture aswe study the income data.
46
45 7
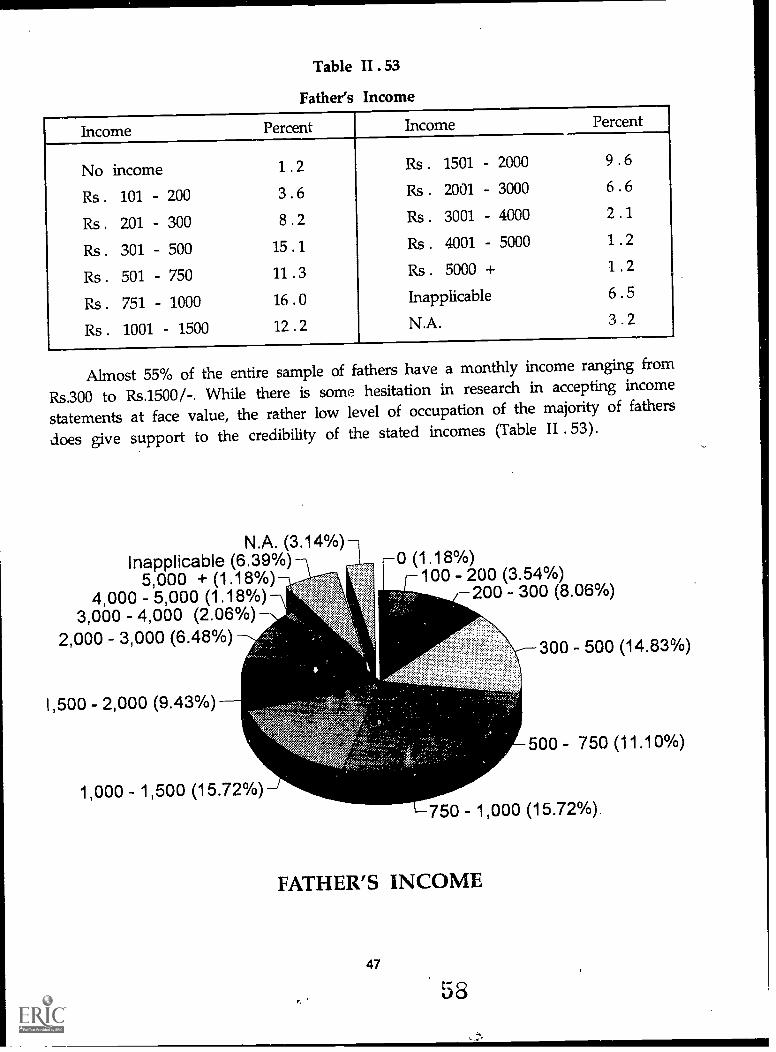
Table II . 53
Father's Income
Income Percent Income Percent
No income 1 .2 Rs . 1501 - 2000 9 . 6
Rs . 101 - 200 3 . 6 Rs . 2001 - 3000 6 . 6
Rs . 201 - 300 8 . 2 Rs . 3001 - 4000 2 . 1
Rs . 301 - 500 15.1 Rs . 4001 - 5000 1 .2
Rs . 501 - 750 11 .3 Rs . 5000 + 1 . 2
Rs . 751 - 1000 16.0 Inapplicable 6 . 5
Rs . 1001 - 1500 12.2 N.A. 3 . 2
Almost 55% of the entire sample of fathers have a monthly income ranging from
Rs.300 to Rs.1500/-. While there is some hesitation in research in accepting income
statements at face value, the rather low level of occupation of the majority of fathers
does give support to the credibility of the stated incomes (Table II . 53).
N.A. (3.14%)7Inapplicable (6.39%)
5,000 + (1.18%) '4,000 - 5,000 (1.18%)
3,000 - 4,000 (2.06%)2,000 3,000 (6.48%)
1,500 - 2,000 (9.43%)
0 (1.18 %)100 - 200 (3.54%)
7-200 - 300 (8.06%)
1,000 - 1,500 (15.72%)
300 - 500 (14.83%)
500 - 750 (11.10%)
750 - 1,000 (15.72 %).
FATHER'S INCOME
47
58

16%
14%
12%
10%
8%
6%
4%
2%
0%
600900 1250
17502500 3500
45006000
FATHER'S INCOME
Table 11.54
Monthly Income of Mother (Cash only)
Income Percent
Inapplicable - not working/no separatepayment/no payment 65 .8
Less than Rs . 50/- 1 .1Rs . 51 - 100 3 . 4
Rs. 101 - 200 9.1Rs. 201 - 300 8 . 3
Rs. 301 - 50Q 5 . 2
Rs. 501 - 1000 2 . 6
More than 1000 2 . 4
D.K. 0 . 3
N.A. 1 . 8
48
59

Mother's Income
The mother's income has been divided into two tables. One shows the income(in cash) per month and the other table depicts the method of payment of the mother'smonthly income.
Here, 65 .8% of the mothers in the sample came in the category of "Not working/no separate payment/no payment". Other than that, about 17 . 4% earned betweenRs. 100-300 a month, 5 .2% earned between Rs. 300-500/- and only about 2 . 4% earnedabove Rs. 1000/- p.m. (Table 11.54).
Table 11.55
Paid in Cash or Kind
Cash /kind Percent
Cash 29.4Kind 0 . 8
Partly in cash, partly in kind 2 . 9
No fixed mode of payment 0 . 4
Working - but no separate paymentto her/no payment 6 . 9
Inapplicable - not working 58.5N.A. 1 . 1
It is seen that only 29 .4% are paid in cash, while 0 .8% are paid in kind and2 . 9% are paid partly in cash and partly in kind (Table 11.55).
Table 11.56
Adult Male Earners Adult Female Earners
Number of MaleEarners in theFamily
Proportion offamilies(percent)
Number of FemaleEarners in theFamily
Proportion offamilies(percent)
One 4 . 2 One 39 .0
Two 72.3 Two 4 . 4
Three 15.5 Three 1 . 0
Four 5 . 5 Four -
Five 1 . 7 Five -
None 0 . 0 None 55.4
49
60

Proportion of Family Earners
Almost all families had at least one adult male earner, and most of them (72 %)
had two. About 55% of the women were not earning, while in 39% of the families,the adult female did bring in an income. In only 4 . 4% of families were there twoadult female earners (Table II . 56).
Table 11.57
Child Earners - Girls Child Earners - Boys
No. of girlearners in thefamily
Prop. offamilies(percent)
No. of boyearners in thefamily
Prop. offamilies(percent)
One 10 .5 One 7 . 6
Two 1 . 9 Two 1 .3
Three Three
Four - Four
Five Five
None 87.4 None 90 .8
Twelve percent of the girls and 9% of the boys work for a wage outside thehome, or in recognised economic activity within the home (Table II . 58).
Table 11.58
Total Household Income (Monthly)
Household
Income
Percent ofhouseholds
Household
Income
Percent ofhouseholds
Rs. 101 - 200 1 .7 Rs . 1501 - 2000 12 .2
Rs . 201 - 300 3 .6 Rs . 2001 - 3000 10 .6
Rs . 301 500 9 .4 Rs . 3001 4000 4 . 2
Rs. 501 - 750 12.9 Rs. 4001 - 5000 2 . 3
Rs . 751 - 1000 17 .7 Rs . 5000 + 3 . 3
Rs . 1001 - 1500 17 .6 N.A. 3 .8
50
Gi

Total Monthly Household Income
When asked about household income, the figure one gets must be treated onlyas an approximation. The household income must be considered along with father'sincome and the number of earners in the family. The largest majority (70%) of allfamilies have a household income ranging between Rs.500 and Rs.3000/- (Table 11.58).With the average family size being 5 or 6, the per capita income is found to rangefrom Rs. 100/- to Rs. 600/- p.m.
The sample was drawn to reach the population at the lower ranges of theSES scale and both occupation and income data provide the quantitative supportto the objective. The abjectly poor seem to enter this data only in an occasionalsample.
Income of Female Earners
What do the female workers earn? Not much, if one look at the figures (Table 11.59).
Perhaps the category we should consider most important in this is the secondlast one. "Inapplicable part of household income" - since women's work is invisible,their earnings rightly have no existence. That finding is supported. The row above thatstates "No individual income" and this could also be explained in several ways. Themajority of women earners fall in the three income categories from Rs. 101 to 200,Rs. 201 to 300 and Rs. 301 to 500.
Table 11.59
Female Earners' Income
Income Percent
Less than Rs. 100/ 2 . 3
Rs . 101 - 200 9 . 4
Rs. 201 300 8 . 2
Rs. 301 500 5 . 6
Rs. 501 - 750 2 . 1
Rs. 751 - 1000 1 . 7
Rs. 1001 1500 1 . 0
No individual income
Inapplicable - part of household incomeN.A.
10.5
56.51 . 0
51
62

Girl Earners
A somewhat similar pattern emerges with the girl earners.
Table 11.60
Girl Earners' Income
Income Percent Income Percent
Less than Rs. 100/- 1 .3 No individual income 4 . 7
Rs . 101 - 200 2 . 3 Inapplicable 87.9
Rs . 201 - 300 2 . 0 N.A. 0 . 3
Rs . 301 500 1 . 1
To begin with only 12% of the girls are working for a wage. Out of these, 5%earn amounts under Rs. 300/- p.m. Approximately another 5% contribute to family work
but do not have an individual income (Table II. 60).
Boy Earners
Boys earn even less than girls and there are marginally fewer earners among theboys in the family, probably because more of them are in school than are the girls.
Table 11.61
Boy Earners' Income
Income Percent
Rs. 101 - 200 1 .3
Rs. 201 - 300 1 . 2
Rs. 301 - 500 1 . 2
No individual income 3 . 2
Inapplicable /- no boy earner 91 .3
N.A. 0 . 1
Education of Eldest Male
The education of the eldest male (not the father) was a matter of enquiry. Theeldest male was especially considered because it was felt that apart from the parents,the significant others in the family could be a source of inspiration for the girl child's
52
63

education. However, in this sample it can be seen that the pattern of education of theother adult male approximates that of the male head of household.
Table 11.62
Education of Eldest Male (not the father)
Level of Education Percent Level of Education Percent
Inapplicable 18.4 High/Higher Secondary 16.4
Non-literate 22.3 College - no degree 3 . 5
Primary 20 . 1 Postgraduate 2 .5
Middle 14.5 Technical/Professional/Diploma 1 . 2
Since in 69% of the cases, the eldest male was the brother of the girl child, theredoes not seem to be such a dramatic difference between generations (father and son),
only a marginal one.
Occupation of Eldest Male
Similarly, the occupational status of the eldest male was investigated. In manycases, the eldest male may have been the brother of the girl child, still a student or
waiting to be employed.
Table 11.63
Eldest Male Occupation
Occupation Percent
No specific occupation (unemployed) 53.6
White collar job 1 . 2
Service (unspecified) 2 . 4
Skilled worker 3 . 4
Unskilled worker 3 . 7
Medium farmer (5-10 acres) 1 . 2
Marginal farmer (1-5 acres) 2 . 2
Farmers (land-unspecified) 1 . 7
Agricultural labourer 4 . 1
Petty business 1 .6
Inapplicable 17.9
53
64

The consonance between the data in this table and that of father's occupation (TableII. 49) establishes that on the whole, the occupations of the men in the family wereat approximately the same level.
Eldest Female Relation
This table sheds light directly on who the eldest female relation (other than themother) was in the household.
Table 11.64
Eldest Female Relation
Female Relation Percent Female Relation Percent
Grandmother 12.7 Sister 40 .7
Mother-in-law 0 . 6 Sister-in-law 6 . 1
Aunt 2 . 0 Inapplicable 37.1
Many supplemented nuclear families tend to have one parent living With them,and we find that 12 .7% children have a grandmother. Since over 40% mention "sister",it is evident that the family structure in these cases was nuclear.
Education of the Eldest Female
The Table (II . 65) shows the educational status of the eldest female (not themother). The 'inapplicable' category takes away more than 31% of the responses.
Completed Primary (13 . 5%) and Middle (7 . 7%) constitute the largest class ofeducational qualifications into which the eldest female falls.
Table 11.65
Education of the Eldest Female
Education Percent Education Percent
Inapplicable 37.5 Middle 7 . 7
Non-literate 30.5 High/Higher Secondary 1 .5Primary 13 .5 Graduate 1 .1
The close parallel in levels of education between mothers and others (grandmother,aunt or sister) can be seen here.
54
65

Informant
Who responded to the household questionaire? In the majority of studies, aquestionaire administered within the house is more likely to be answered by womenthan men. That observation was supported in this study as well (Table H. 66).
Table 11.66
Relationship of the Informant to the Girl Child
Relationship Percent Relationship Percent
Grandfather 1 .6 Brother 1.. 9
Grandmother 1 . 7 Sister 1 . 4
Father 32.1 Self 4 . 6
Mother 54.6
In most cases (54 . 6%) the mothers were the respondents to the questionnaire, withfathers constituting 32%. The other categories are of minor importance, size-wise, except'self'. One assumes that the 4 . 6% mentioned here as 'self' indicates that the girl childherself, came from the older age group within the sample, since she was able to answerthe large number of questions on a variety of matters.
55
GB

Chapter III
SOCIALIZATION AND GENDER
LIST OF TABLES
Table No. Particulars Page No.
1 Father's Education and Gender Expectation of Unborn Child 61
2 Economic Status and Celebration of the Birth of the Infant 62
3 Reactions to the Birth of the Girl Child 63
4 Activities that Girl Children share with their Parents 65
5 Girl Children sharing Play Activities :Selected Samples 67
6 Gender of Companions and Time Spent by Girl Children 68
7 Size of House and Time Spent on Activities ofGirl Children 70
8 Father's Level of Education and Play Activities ofGirl Children 73
9 Play Activities of Girl Children :Selected Samples 73
10 Pianislunent for Disapproved Behaviour Boys and Girls 74
11 Punishment for Disapproved Behaviour - Boys and GirlsSelected Samples 76
12 Rewards for Approved Behaviour - Boys and Girls 77
13 Rewards for Approved Behaviour - Boys and Girls- Selected Samples 78
14 Availability of Television/Radio to Girl Children 79
15 Persons Escorting the Girl for Different Purposes 81
16 Parents' Education and Accessibility of Cinemafor the Girl Child 84
17 Parents' Education and Restrictions on the Girl ChildGoing Out 85
18 Parents' Level of Education and Restrictions on theGirl Child Talking to Boys 86
19 Summary Table of "Never" Statements 87
56
6?
.

Table No. Particulars Page No.
20 Restrictions on Specific Behaviours of Girls and Boys 89
21 Restriction on Specific Behaviours of Girls and BoysSelected Samples 90
22 Qualities Expected of a Girl, Wife and Daughter-in-law 91
23 Expectation of Approved Behaviour in Boys and Girls- Selected Samples 92
24 Ideal Age of Marriage for Boys and Girls :
Mother's Perspective 93
25 Girl's View on Skills Expected of Boys and Girls 94
26 Girl's View on Literacy Skills of Boys and GirlsSelected Samples 94
27 Gender Differences in Cooking Skills Selected Samples 95
28 Skills of the Girl Child 96
29 From whom skills learnt - Selected Samples 96
30 Gender Division of Domestic Tasks 97
4.
57
MP ie..
Yi
68BEST COPY AVAILABLE

LIST OF DIAGRAMS
Chart No. Particulars Page No.
1
2
Expectation of Girl or Boy Related toFather's Level of Education
Gender Expectation of Unborn Child Related toFather's Level of Education 61
3 Activities the Girl shares with both Parents 64
4 Activities the Girl shares with her Mother 65
5 Number of Rooms in the House 69
6 Activities of the Girl related to the Roomsin the House 71
7 The Girl's Activities related to theNumber of Rooms 71
8 Preferred play of Children related to Father'sLevel of Education 72
9 Who Escorts the Girl to School 79
10 Who Escorts the Girl to Marriages 80
11 Who Escorts the Girl for Medical Treatment 80
12 Who Escorts the Girl for Different Activities 82
13 Who Escorts the Girl for Different Activitites 82
14 Parents escorting the Girl for Different Activities 83
15 Restrictions on talking to Boys related toParent's Educational Level 86
16 Girls who never left the Village for VariousPurposes 87
17 Restrictions on Behaviour Related to Gender 88
18 Gender Division of Domestic Tasks 97
19 Gender Division of Domestic Tasks 99
58
69

Chapter III
SOCIALIZATION AND GENDER
Socialization is the cradle of the values of a family. What parents teach the nextgeneration reflects what they consider most important. Thus, when we find out aboutwhat is said by parents, (and what is left unsaid), what is rewarded, what is punished- what the expectations are of a girl's behaviour (as different from a boy's), howparental aspirations for their children are communicated, forced or reinforced, we areresearching salient issues. All these are questions we ask both of the girl child herselfand of the mother or other significant agent of socialization. And from their responses,a composite picture is built up, which gives an indication of the growth and upbringingof the girl child in India.
Most conventional theories in Psychology and Sociology have tended to treatthe family as the safe haven for the child, as the cushion against the vicissitudesof life in the "outside world". There is a counterpoint in sociological thought whichpropounds that the family itself is the risk factor from 'which children needprotection. That is to say, the family may be as much the source of the problemas it is generally considered to be the source of a solution for the problemsencountered in society.
When we planned the study, both perspectives on the family prevailed in ourdiscussions. There were some who pointed out that in the face of harsh societalgender discrimination and general poverty conditions, the family was the only refugefor the girl child. The counterpoint was that the family was the main agent forgender socialization, beginning the operation of gender bias even before the birthof the infant. Statistical data from several well documented studies on amniocentesisleading to large scale female foeticide illustrate the existence of the enemy withinthe family.
Several major aspects of socialization have been included in the questions thatwere formulated to arrive at a picture of the gender attitudes integrated into thefamily's customs and mores. Some of ti tem were direct and perhaps obvious in theirpurpose to the respondents. Others were indirect, necessitating on the part of theresearchers an interpretation of the responses given. There was a judicious mixture ofseveral types of questions and different sources of information were identified inorder to throw light on the quality of life of the girl child in the family.
With the impact of the family welfare propaganda on the consciously articulatedstatements, as well as on the collective unconscious of the Indian people, some trace
5970

of the value for smaller family size has become part of an accepted norm. However,where "small family" is articulated as a value the gender break up tends to be apreference for one boy/one girl in about 50% of the cases and two boys and one girlin the other 50%. This means that even when the small family norm is internalised,the bias in favour of the male will persist, with demographic consequences, which aredisastrous in a different way, from that of over population.
Gender Expectation of the Unborn Child
The mother's expectation (hope) about the sex of the child during the first
pregnancy was ascertained. Almost two thirds of all mothers (64 .5% to be exact) said
that they left it to God and did not expect either sex particularly.
Thirty one percent of all mothers said they expected a boy and only twopercent expected a girl. Here 'expected' should be taken as another expression
for 'desired'. There is no gainsaying the fact that for the vast majority of families,the birth of a girl is the "error factor" in the expectation, rejected at the confidence
level of .025! The father's level of education is treated as an indicator of socio-economic status for the analysis that follows.
Post GraduateTech./Professional/Diploma
GraduateCollege, no DegreeHigher Secondary
Middle SchoolPrimary School
Non-Literate
61.111111111111111ValMtWo
111111MINIIMMIIIIill1111.1111111=11110111111111111111
66111.111111111111101111121
0 10 20 30
LIM Expected Boy rs Expected Girl]
Si. GENDER EXPECTATION OF GIRL OR BOYRelated to Father's Level of Education
40 50
60

Table III. 1
Father's Education and Gender Expectation of Unborn ChildFather's Education No specific Expected Expected
gender expected a boy a girlNon-literate 66.9 29.2 2.0Primary School 62.7 33.7 2.2Middle School 61.9 34.8 2.3Higher Secondary 64.4 32.4 2.2College, no Degree 68.3 27.9 3.5Graduate 65.2 30.7 3.1Technical/Professional Diploma 65.6 28.2 5:5Post Graduate 74.7 22 .6 2.3(All numbers are in percentages)
While one may hope that formal education will have a positive effect on the genderbias, one finds that there is no relationship between the father's level of education andthe expectation of the gender of the unborn (Table LIM). Female gender devaluation
Post Graduate 10_ch./Professional/Diploma I
Graduate ;College, no DegreeHigher Secondary
Middle SchoolPrimary School MP
Non-Literate 10.0
2040
60
11
80
I No Specific Gender E Expected Boy Expected Girl
S2. GENDER EXPECTATION OF UNBORN CHILDRelated to Father's Level of Education
6172

is seen across all education levels. Not wanting a girl to be born is an attitude that
becomes a great leveller; neither education nor income has any effect on the attitudes
to the girl child's birth.
When we look at the relationship between father's income and gender expectation,
about a third of the entire sample (there is a range between 25 4% and 36 . 0% across
income levels) expected or wanted a son. Only about 2% expected a daughter and this
was across the income spectrum from Rs.200/- p.m. to Rs.5000 /- p.m. Again, this is
a finding that clearly reveals **that it is not poverty that forces parents to reject the
female, but a stronger cultural thread that runs through all economic levels and
geographic regions.
Celebrations on the Arrival of an Infant
There are several socio-economic status variables that were felt would be relevant
in the study of the situation of the girl child. In our study, we have data on father's
education, occupation and income as well as household income and the family's level
of indebtedness. In social science research of this kind, to check out information from
one variable, it is not uncommon to use parallel data from a related variable for a
kind of internal validity.
We wished to identify a variable of economic status that would be sufficiently
discriminating, apart from that of income per se. More than 80% of the families owned
their own homes; so owning or renting accommodation would not have given us a
well distributed variable. The size of house was therefore selected as the independent
variable for the study of celebrations on the birth of a child.
Table 111.2
Economic Status and Celebration of the Birth of the Infant
No. of roomsin the house
Special Celebrationfor bcys
Same Celebration forh ,Ts and girls
No Celebration foreither
One 8 . 8 2 . 0 23.6
Two 11.1 1 . 6 20.6
Three 12.6 1 . 8 21.0
Four 12.5 1 . 3 19.5
Five 15'.2 1 . 7 21.2
Six + 16.7 0 . 3 19 .8
The number of rooms in the house appeared to be a neatly quantifiable economic
indicator and so we analysed some of the data in relationship to this variable.
62
73

There were no special celebrations for the birth of a girl in any of the familiesin this sample and such a column for which a code had been assigned was thereforeomitted from this table. Between 8 and 17% of the families specially celebrate the arrivalof a son (or admit to doing so). With increasing prosperity, as indicated by the numberof rooms in the house, the arrival of a son is more noticeably welcomed. While therewere no celebrations at all for either sex in approximately one-fifth of the entire sample,having the some celebration for boys and girls was mentioned only by 1 to 2% ofthe sample. In households with six rooms, only 0.3% of the total number of familiescelebrated the birth of a son and daughter equally. It becomes clear that genderinequality in such matters is an internalised norm, one not related to socio-economicstatus; in fact, the data suggests that gender equality tends to be adversely affectedby increasing affluence.
Given the parental expectations as analysed above, it is clear the arrival of thegirl child was considered a not-too-happy event by most members especially if it wasthe second girl child. We therefore wanted to probe a little to find out what proportionof the next of kin said that they had been unhappy in the case of a daughter's arrivaland what proportion said that they had been happy. These are statements based onthe perceptions of the mother of the girl child. She recalled other people's reactionsto the birth of her daughter. There is the possibility of recall error, of course; howevera pattern seems to have emerged.
Preference for a son is clearly related to patriarchy, to lineage being continuedby male progeny, in addition to several other well-known factors. In this context,it would be instructive to study the table of "Reactions to the Birth of a Girl Child"(Table III . 3), a table which has been developed from the interview of the mother andher perceptions.
Table III. 3
Reactions to the Birth of a Girl Child
Relationship to Girl Child Happy Unhappy
Mother
Father
Maternal grandmother
Maternal grandfather
Paternal grandmother
Paternal grandfather
73.171 .6
63.2
14.715.613.9
62.7 13.458.7 18.057.6 15.4
(All numbers are in percentages)
63

It is interesting that the unhappiness over the birth of a daughter is a little higher
in the case of paternal grandparents, compared to maternal grandparents. This could
also be related to the erroneously held belief that the sex of the child is determined
by the mother. The tendency to be disappointed and unhappy that the grandchild is
a girl is further compounded by the implied "blame" on the mother, which is likely
to be higher from the perspective of her parents-in-law.
Activities Daughters Share with Parents
The stereotype that Indian families are closely knit, intimate units has been
-hallenged by a great deal of research data in the last three decades. Being physically
together in a small area may make for an unavoidable closeness, but proximity cannot
be confused with intimacy. Playfulness, sharing interests, having family jokes, these
seem to be exceptional in the average Indian family. There is a level of earnestness
and "let us get on with the task of living" that absorbs all the time and energy of
most of the family, most of the time. The element of playfulness in the relationship
between parents and children is not commonly observed. In addition, play activities
beyond the age of 7 or 8 were not encouraged in the case of girls. In our total
sample, 23 . 6% of the girls said that there were no play activities and the question
was not relevant. The graphic illustration that follows provides the full picture.
-Occupational (4.30%)[-Folk Music (1.16%)
School Work (10.34%)4e29.7
ry
/a)
44KI
Eating (63.65%)
Playing (4.65%)Skill Training (3.02%)
,44
410 Household Work (12.8
S3. ACTIVITIES THE GIRL SHARESWith Both Her Parents
64
75

Table 111.4
Activities that Girl Children Share with their Parents
Eating Housework
SkillTraining
Play-ing
Schoolwork
FolkMusic
Occu-pational
Share withmother 33.8 77.5 28.3 3 . 2 7 . 6 12.7 7 . 7
Share withfather 2 . 5 0 . 5 0 . 4 0 . 8 7 . 6 0 . 2 0 . 7Share withboth parents 5 4 8 11 . 1 2 . 6 4 . 0 8 . 9 1 . 0 3 . 7
Share withsiblings, andfriends 7 . 8 5 . 6 25.7 66.4 49.1 36.9 23.6
(All numbers are in percentages)
With the mother, 3.2% girls share their play and with the father, less than 1% (0,8%)do so. With both jointly, 4% girls mention sharing play; but two-thirds of all girls playwith friends, siblings and other memi- ,rs of the family (Table III . 4). Parents are a generation
r-- Occupational (4.51%)Eating (19.79%) ,,,,,,r,,,,;=2j, Folk Music (7.44%)
ow ,V: School Work (4.46%)>egN..; -' ,..' , -St" Playing (1.87%)44,...:,,,,*, n
Skill Training (16.67%)
Household Work (45.37%)
S4. ACTIVITIES THE GIRL SHARESWith Her Mother
65

apart and not considered the right company for such "trivialities" as play with their children.
Fun, fantasy, playfulness, laughter the very essence of tne development process in childrenis denied to girls (and to boys as well) or at least, reduced to nearly nothing.
Very predictably, 77.5% of the girls share household work with the mother only(S4) (compared to 0.5% with the father only). In home-based occupations, there is agenerational transfer of skills, but it appears to be from mother to daughter, ratherthan from both parents. This finding is also supported in other research where skilledcrafts and semi-skilled activities like beedi rolling take place in the women's courtyard.
Craft tasks also tend to be gender-based and passed on from mother to daughter and
father to son
In about a third of the sample, the girl child eats with her mother only. Whentaken together with the data on who eats first and who eats last, it becomes clearthat the girls have to share with their mothers the food remaining after the men andthe boys have eaten. It may be noted that in our sample, states where 65 - 72% ofthe girls eat with the mother only are Bihar, U.P. and Orissa.
In a little over half of all the families in our sample, the family eats together.For the girl child, it is one of the few times she gets with the father, since in mostof her other activities he has no role at all. His help with the daughter's school homework
is an activity seen as appropriate in about 8% of the families, but that is all.
The role of the father in sharing activities with his daughter is so marginal, thatit reflects one of the great tragedies of Indian family life. It is our observation in thefield ( and supported by earlier findings from several studies on socialization available
as theses and dissertations) that the Indian father has abrogated his responsibility of
parenting. The tasks of providing for food, education and marriage are in a sense theeconomic duties of the father, but beyond what is the basic minimum - the father stepsout of the scene, surrendering his socialization role and losing the opportunity todevelop emotional closeness with his children.
This can now be seen in the context of some of the disaggregated data from thefield (Table HI . 5). It is interesting to note that only in one or two samples is therea low percentage of the report "No play". Here examples of the Kerala, Pune, Bombay
and Berhampur responses may be noted. These are also the places where schoolattendance is much higher and the opportunities for girls and boys tend to be moreequitous. Mothers, more than fathers, are seen as persons for the girls to play with,but even the girls citing mothers constitute a relatively small percentage.
The relationship of the response of 'No play' to poverty, household drudgery and
the strain of eking out a living cannot be denied. Nevertheless, even at levels beyondsubsistence, playing is considered trivial and unimportant. The psychological cost of this
deprivation has never been calculated and will 'definitely add to the debit column in
our accounting for the quality of childhood.
66
77

How does a girl spend her time? How much time is spent in householdwork? Does she have any free time? We know that work and leisure are seldomseparated and one activity moves into another. Most of the activities are relatedto maintenance and survival i.e.. fetching of water, food or fodder, cooking, serving,
Table III. 5
Girl ChildrenSharing Play Activities
(Selected Samples)
LocationofCentre
WithMother
only
WithFatheronly
WithBoth
parents
WithSiblings
& friends
NoPlay/N.A.
Total Sample 3 . 2 0 . 8 4 . 0 66.4 23.6Andhra Pradesh 11.0 1 . 2 13.0 48.2 26.6
Coastal
West Bengal 4 . 5 0 . 7 5 . 2 73.2 16.5Calcutta
Bihar 0 . 5 2 . 5 1 . 8 77.7 17.5Delhi & (U.P.) 2 . 0 0 . 3 0 . 7 81 .0 16.0Gujarat 5 . 9 0 . 7 11.6 50.5 31.3
Baroda
Karnataka 4 . 3 1 . 0 5 . 0 73.7 16.0Mysore
Kerala 2 . 8 0 . 8 4 . 7 90.8 1 . 2Trivandrum
Maharashtra *
Bombay (2) 3 . 2 1 . 3 6 . 8 82.0 6 . 7Pune 8 . 7 3 . 8 17.0 68.4 1 . 9
Orissa
Berhampur 3 . 0 1 . 3 1 . 3 86.0 9 . 0Uttar Pradesh
Varanasi 4 . 3 0 . 6 1 . 6 63.0 30.3
* Since there were two teams from Bombay, the samples have been referred to in all tables asBombay 1 (TISS) and Bombay 2 (SNDT).
67
73

cleaning, washing clothes and vesselsand keeping the house clean. By thetime all the tasks are completed, day
has turned into night and women andchildren collapse in exhaustion. When
young women with University degrees(which in our social science index, readswomen from upper middle class) are inthe field asking questions of lessprivileged persons, it is not always easyfor them to rephrase a question in amore familiar idiom. It also requires vs,
insight and experience to know whenthe response is authentic. "How do youspend your free time?" is such a
question. It is also a difficult question totranslate into most Indian languages,which explains why 31% of the totalsample of girl children answered thatthey do household work and cooking in
their free time, 16% girls respondedsaying they do their homework and 4%that they work in the fields. In writing this summary, one does not have the
confidence to say that the question has been understood by all. In this set ofresponses, 31% do say they do nothing in particular. The rest treat free time as
time that is available for their routine activities.
And with whom is that girl child's elusive free time spent? With friends(67.3%), with female members of the family (37.8%) and with female cousins (18.2%).
The gender preference (and control) on this is very clear (Table III. 6).
Table III. 6
Gender of Companions and Time spent by Girl Children
Persons Female Male Both Male & Female
Family members 37.8 0 . 8 55.8
Cousins 18.2 1 .0 22.0
Friends 67.3 0 . 3 12.3
(Figures reflect percentage of time spent)
68
79

No better comment can be made on the value for the girl's reputation (and hersafety) than the statistic which reveals here that girl children spend only 1% or 2%of the time with male family members. The proportion of girl children spending timewith male friends is reported as 0.3% while the number who report time spentwith female friends (67.3%) has already been noted. The category of 'both male andfemale" does indicate the bridging of the gender gulf. Also, as in many traditionalcultures, there is a tendency to trust kinsfolk more than unrelated persons(Table III . 6).
Like charity, segregation begins at home. Part of the reason for the high valueplaced by mothers on ensuring that girls are only in the company of their own sexis the fear of incest and intra-familial violence, especially when the adult males arealso imbibers of alcohol. This finding did not emerge directly from this study, but isextrapolated from other studies and observations to serve here as a plausibleexplanation.
It is also self evident that poverty forces the girl to drudgery and householdchores. As in earlier analyses, we looked at the number of rooms in the house (S5)as an independent variable and considered all the activities done by the girl. In thiscategorization we were able to put household work and school homework in theirown separate categories, and not under "free time" (Table III . 7).
Six Rooms (5.58%)Five Rooms (5.02%)
Four Rooms (12.50%)-
Three Rooms (21.09%)
One Room (29.02%)
-Two Rooms (26.79%)
S5. NUMBER OF ROOMS IN THE HOUSE
69
80

Table III. 7
Size of House (No. of Rooms) and Time spent on Activities by Girl Children
Percent of Time spent on ActivitiesActivities One Two Three Four Five Six
room room room room room room Meanhouse house house house house house
(26) (24)
Householdwork/cooking 34.3 31.8Knitting/stitching 3 . 8 4 . 8
School work(Homework) 9 . 5 15.2
Householdoccupation 4 . 6 4 . 8
Listening toRadio/TV 3 . 1 3 . 7
Playing withFriends 35.1 32.3Doing nothing 3.5 2 . 6
(18 . 9) (11 . 2) (4 . 5) (5 . 0)
29.8 29.2 26.0 24.6 31.1
6 . 9 7 . 2 9 . 8 10.4 5 . 8
18.8 21 .9 26.0 26.3 16.2
3 . 4 3 . 1 1 . 9 2 . 0 4 . 0
4 . 5 5 . 7 4 . 5 6 . 9 4 . 1
29.8 26.3 24.3 23.6 31.0
2 . 9 1 . 9 1 .9 2 . 3 2 . 8
(All figures are in percentages).
Irrespective of economic status, the female child's role in household work andcooking is a constant: one quarter to one third of her time is given to it. There isan inverse relationship : the number claiming to be engaged in housework decreasesas the size of the house increases - but this is only a range of 10% (from 34% to24%). Spending time on knitting/stitching also goes up with economic status, as mightbe expected. The number of girls involved in the activity has a clear linear relationshipto number of rooms in the house (which serves here as an operational definition ofsocio-economic status) - ranging from 3 .8% to 10 . 4%. (Table III . 7).
There is also a marginal relationship of economic status to time spent in enter-tainment (Radio, TV) but much lower than might have been expected. The numberof girls who report playing with friends as an activity decreases as they go up theeconomic scale. As the family's status goes up, more time of the girls is spent in schoolwork / homework. The socio-economic difference is most visible in the category oftime spent in homework, varying from 9 .5% to 26.3% as the size of the residenceincreases (S6 and 57).
70
81

Six Rooms
Five Rooms
Four Rooms
Three Rooms
Two Rooms
One Room
0% 10% 20% 30% 40% 50% 60% 70% 80% 90% 100%
Doing Nothing Ea Radio / TVHousehold Occ., Stitching al School Work
III Household Work, Cooking al Playing with Friends
S6. ACTIVITIES OF THE GIRLRelated to the Rooms in the House
35%
30%
co
3) 25%
4740
2 0 % S-chool Work
X15%
Household WorlirCookmg I----------
Playing with Friends
a.cn0E 10%
i=1R-alfionv I
5 To
40.%
Tfousehr-61-d-Occ7Stitaiiig 1
0°/02 3 5
Number of Rooms in the House
S7. THE GIRUS ACTIVITIESRelated to the Number of Rooms
71
6
8 2

"Doing nothing", a frequent response to questions, is not treated by us as anunimportant category. It - may represent the only leisure and unaccounted time that agirl has a time to stand and stare, to dream. It is interesing that there is not muchvariation across socio-economic groups on this variable.
Girl Children's Play
The proportion of families in which girl children report "No play at all" is inverselyrelated to the father's level of education. There is also a moderate direct relationshipwith father's level of education and the outdoor play of daughters (S8).
Post GraduateTech./Professional/Diploma
GraduateCollege, no DegreeHigher Secondary
Middle SchoolPrimary School
Non - LiterateInapplicable- Father not alive
imowimor211111.111111111011111111--ilassousimmr*Irualm
_41h1111111111111111.1111111.11.11.111
dmiisimm
0% 20% 40% 30% 80% 100%
----- No Play M Indoor Play Outdoor Play I
S8, PREFERRED PLAY OF CHILDRENRelated to Fathers' Level of Education
The proportion of girls reporting that they spend time on indoor play is aconstant across educational levels. The variable of time available from householdwork and the Triable of safe spaces for outdoor play are invisible in this table,but are probably powerful antecedents in explaining the relationships. (Fable III. 8)
Table III . 9 depicts selected data from five sub-samples, showing the categoryof girls reporting no play at all, as varying from 23- to 54%. The proportions ofindoor and outdoor play do not seem to fall into any pattern, being as much afunction of the ecological setting, as of cultural rules.
72

Table III. 8
Preferred Play of Girl Children
Father's Education No Play at all Indoor Play Outdoor Play
Inapplicable -Father not alive 31.4 31.0 34.8
Non-literate 36.4 38.1 32.5Primary 19.4 33.4 43.6
Middle 18.1 31.0 47 .6
High/ Higher Secondary 16.0 31.0 50.2College, no degree 11 .9 32.9 50.2
Graduate 10.2 32.9 51.2Post-graduate 12.5 35.9 46.2
Technical/Professional 9 .9 36.7 49.8
(All figures are in percentages)
When we designed the questionnaire, we were keen to separate the games playedby the girls that were gender-stereotypic, from those that were not. However, sincealmost all the girl children's play activities were gender-specific (doll play, skipping,
Table III. 9
Preferred Play - Selected Samples
Location ofCentre
Do not playat all
Indoorgames
Outdoorgames
Andhra PradeshTelengana 54 . 1 5 .3 40.6
Bihar 29 .5 59 .0 11 .5
Delhi (8r U.P.) 23.1 13.0 63.7
GujaratBaroda 30.9 25.9 43.2
KeralaTrivandrum 39 .0 27.6 33.3
(All figures are in percentages)
73
84

playing house), the category in the coding system was not very clearly understood evenby the research staff that did the coding. Hence the category of "gender-stereotypedactivity:" was dropped, and only indoor and outdoor games were clearly differentiatedin the tables and in the discussion.
Boys and girls seldom played together and this was an observation in both urbanand rural areas. If they played together at all, it was in the early years of childhoodupto eight years or so. The girl children were asked if they played with their brothersand 50% of them said "Never" and in about 10% it was inapplicable, as they did not
ye brothers. Some of them (28%) answered that they did play with brothers sometimesand only 9% reported this joint activity as being quite frequent.
Many of the girls who said they never played with brothers, had brothers olderto them; and as noted in the West Bengal study, the girls who reported that they playedwith brothers were interpreting sibling care as playing with their brothers. Since theyhad to keep the child out of the mother's way, they entertained them and "playedwith them".
Thus the category of "playing with brothers" could easily be seen as the maskedversion of being occupied in sibling care.
Punishments Given
There is a marginal, non-significant difference in the punishments meted out togirls and boys. Girls and boys receive about the same type of punishment from theirparents, but girls are treated more strictly with impunity. However, it must be remem-.bered that ,hese were reported by the girls and reflect their perceptions of what happens.There is a high probability of its being an accurate reflection of the real situation, butit would have been better had we checked it out with a similar question to the boysin the same families (Table III. 10).
Table
Punishment for Disapproved Behaviour
Type of Punishment Percentage of Girls Percentage of Boys
No Punishment
Scolding
Severe Beating
Scolding and Beating
Denial of Food
6 . 0
58.5
2 . 3
29.3
2 . 2
7 . 7
50.3
2 . 3
25.5
1 . 8
7'
8 I.

When punishment (broken up by gender and type) was considered in a sampleof the individual centres collaborating in the study (Table III.1 1) we found that girlsreceive more punishment than boys, even though it is only marginally higher. Theexception is the punishment of severe beating, which seems to be generally similarfor both genders, except in the case of the Berhampur sample. In that sample, girlsreceive more scolding and boys receive more thrashing. Deprivation of food as apunishment is resorted to only by a small number of families, except in the Varanasisample, where it is 61% for girls and 71% for boys.
In the "No punishment" column, the proportion of boys tends to be marginallyhigher. This implies that boys can get away with acts for which girls will bepunished.
Rewards Given
There is no real difference in the rewards or the punishments given togirls and boys - but if there is an edge, it is in the category of "No Rewards",which has a slightly higher percentage of girls (Table 111.12). These responseswere given by the girls and may reflect how they perceived their own condition.Caution must be exercised in their interpretation. While acknowledging that thegirl child's perceptions are important in determining whether she has a sense ofbeing treated fairly, the counterpoint of checking these data by observation cannotbe neglected.
It is important to note that "No reward" is mentioned by 43% of the girls but"No punishment" only by 6%, leaving one in no doubt that punishment is morefrequently used than reward. The child's own understanding of normative behaviourhas often to be inferred by her from the acts which are punished, since there arevery few which are rewarded.
This point of view is supported in our study of Table 111.13 on rewards forboys and girls from data collected at different centres collaborating in this study.The number of girls reporting 'No Rewards' is 86% in Tamil Nadu, 76% in Bihar,72% in U.P. (Varanasi) and 70% in Orissa and these are the highest. It is possible toinfer that these sub-cultures are harsher on the girls and less likely to be rewardingthem for approved behaviour.
The findings regarding reward and punishment are supported in several studieson socialization. It is an unambiguous statement on the Indian Lulture (derived fromseveral studies on socialization in Indian subcultures) that children receive punishmentfor wrongdoing, delay or insolence, but not equivalent reward for right action,promptness or courtesy. While bad behaviour is strongly negatively reinforced, goodbehaviour is not often rewarded.
75
86

`,1 C)
Tab
le I
II.1
1
Puni
shm
ent -
Boy
s an
d G
irls
- S
elec
ted
Sam
ples
Loc
atio
n of
Cen
tre
No
Puni
shm
ent
Scol
ding
Seve
re
Bea
ting
Scol
ding
&B
eatin
g
Den
ial o
ffo
od
Gir
lsB
oys
Gir
lsB
oys
Gir
lsB
oyS
Gir
lsB
oys
Gir
lsB
oys
Wes
t Ben
gal
Cal
cutta
7 .3
12.8
44.0
28.5
1.?
1 .5
40.7
36.5
3.8
2 .8
Biii
ar1
.7
3.5
75.3
64.5
10.5
11.7
7.3
7.
15
.0
5.0
Del
hi &
U,P
.8
.015
.558
.749
.30
_5
0 .5
32.0
29 .7
Ker
ala
Tri
vand
rum
1.0
3.3
71.7
59.0
4.7
3.5
22.5
18.7
Mah
aras
htra
Bom
bay
(2)
6.7
7.5
14.3
9.0
3.0
2.2
74.2
65.0
0.3
0.5
Pune
9.7
'13
.041
.336
.31
.0
0.8
47.6
44.5
Tam
il N
adu
Kar
aiku
di12
.012
.355
.046
.00.
50
.327
.524
.15
.0
4.4
Ori
ssa
Ber
ham
pur
10.4
2.2
70 .5
17.6
12.3
63.6
3.5
15.9
3.3
0.7
Utta
r Pr
ades
h(
Eas
tern
)V
aran
asi
38.9
17.0
61.0
71.6
All
figu
res
are
in P
erce
ntag
es

Table III.12
Rewards for Approved Behaviour
Type of Rewards Girls Boys(percent) (percent)
No Rewards 43.0 38.0Appreciation /Praise 34.3 30.8Cash rewards 4 . 1 3 . 8
Special food/sweets 6 . 0 5 . 6
Taken for outing (cinema) 5 . 9 4 . 1
A distinct observation concerning Indian child-rearing coming out of cross-culturalstudies is the near-absence of the use of praise in socializing children. Analysis andinterpretation of this observation can be found elsewhere, but briefly it is as follows:Praise is avoided for two types of reasons; one is to keep the child from being anobject of envy, and to ward off the "evil eye" ("nazar" in Hindi, "kann" in Tamil) whichwill be cast upon the high-achieving or beautiful child by anyone around. The secondmajor reason is the fear of self-pride, and egoism (ahankar) on the part of the child.There is an internalised fear of "thinking too much of oneself" that operates acrossregions and social classes in India. Hence praise is used sparingly by the parents.
There are no real gender differences in the kind or frequency of reward, exceptperhaps in the sample from Bihar (Table 13).
Availability of Television/Radio to Girl Children
Perhaps a comment of the times is that radio and television are available almostequally. Two decades ago, TV was a different kind of facility, available only to theprivileged and wealthy in India. In those days, the transistor radio and the bicycle weregenerally among the first modern possessions of the peasant or industrial worker andthe radio was ubiquitous. Although television came on the scene much later than theradio, it now seems to have an outreach similar to the radio. It must be noted thatthe question here was only whether TV/Radio was available or accessible to the girl,not whether the family owned a set.
The non-availability of TV is mentioned by only 39% compared to the 30% ofthe girl children who say that the radio is not accessible to them. Nevertheless, about40% of the girl children have no access or have never had access to TV and radio,while about one-third of all of them say they use both radio and TV regularly fortheir entertainment. Those who are unreached or only rarely reached still constituteabout 45% of the total (Table III .14).
77
8'1

c;i
Tab
le I
II. 1
3
Rew
ards
- B
oys
and
Gir
ls -
Sel
ecte
d Sa
mpl
es
Loc
atio
n of
No
App
reci
atio
n/C
entr
eR
ewar
dsPr
aise
Rew
ard
in C
ash
smal
l gif
ts/s
wee
tsC
ombi
natio
nof
Rew
ards
Gir
lsB
oys
Gir
lsB
oys
Gir
lsB
oys
Gir
lsB
oys
Wes
t Ben
gal
Cal
cutta
47.3
44.0
9.7
7.5
25.7
18.3
10.7
8.5
Bih
ar76
.141
.71
.5
1.5
20.6
18.7
1.7
8.2
Del
hi &
(U
.P
. )22
.726
.055
.849
.718
.517
.62
.0
2.0
Ker
ala
Tri
vand
rum
44.3
36.8
17.5
17.7
36.8
25.0
0.7
0.3
Mah
aras
htra
Bom
bay
(2)
27.8
25.0
26.5
23.3
44.0
35.9
Pune
13.7
13.5
36.2
33.0
15.3
18.1
33.0
31.2
Ori
ssa
Ber
ham
pur
70.3
65.8
18.0
18.3
8.7
7.4
3.0
2.5
Tam
il N
adu
Kar
aiku
di85
.775
.810
.59
.3
3.5
2.5
0.2
0.2
Utta
r Pr
ades
h(E
aste
rn)
Var
anas
i71
.865
.013
.. 0
15.6
10.5
14.6
All
figu
res
are
in p
erce
ntag
es
510
3

Table III.14
Availability of Television / Radio to Girl Children
Availability Television RadioRegularly 36.2 36.4Sometimes 16.6 20.9Rarely 2 . 8 4 . 8Never 4 . 8 9 . 0Not available 39.0 30 .
Persons Escorting the Girl Child
For any visits outside the village, the girl child is not generally permitted to go byherself. The only places she can go to unaccompanied are school (10%) and the market(around 7%). The majority of the girls do not have to go outside the village locality forschooling or for marketing. A trip outside the village for a pilgrimage, holiday or picnicis not possible for over 75% of the girls (Table III . 15).
Coming to the question of the escorts that accompany the girl child, the father hasa very limited role. In 13% of the cases, the father takes the daughter for medical treatment;in 35% of the cases this is done by the mother. Both parents together accompany thegirl child to marriages, for family visits and festivals (Table III . 15).
Father, Male Relatives (0.60%)-1Mother, Female Relatives (1.00%)
Both Parents (1.00%)--\ i iBrothers, Sisters, Husband (2.81%)
Schoolmates, Friends (28.16%)----
Herself alone (10 22%)
S9. WHO ESCORTS THE GIRLTo School
Never been outside Village (56.21%
79
V2

Father, Male Relatives (1.20%).;; Never been outside Village (18.72%)
Mother, Female Relatives (23.12%)
7 Herself alone (1.30%)Schoolmates, Friends (2.20%)Brothers, Sisters, Husband (2.
Both Parents Together (51.35%)
S10. WHO ESCORTS THE GIRLTo Marriages
Father, Male Relatives (12.71%)
Mother, Female Relatives (35.14%)
Never been outside Village (25.83%)
Herself alone (2.20%)Schoolmates, Friends (0.40%)Brothers, Sisters, Husband (3.0
--Both Parents (20.72%)
S11. WHO ESCORTS THE GIRLFor Medical Treatment
80
93

Tab
le
Pers
ons
Esc
ortin
g th
e G
irl f
or D
iffe
rent
Pur
pose
s
Mem
bers
in th
e
Fam
ily
Scho
olM
arri
age
Wor
kM
arke
ting
Med
..
Tre
atm
ent
Fest
ival
Vis
itsPi
l
-gri
mag
es
Picn
ic
Fath
er &
oth
erM
ale
rela
tives
0.6
1 .2
0.5
2.9
12.7
2.1
1 .8
0.5
0.
1
Mot
her
and
othe
rfe
mal
e re
lativ
es1
.0
23.1
6.
116
.535
.118
.427
.05
.4
0.
1
Bot
h Pa
rent
s/Fa
mily
toge
ther
1 .0
51 .3
4.2
11 .0
20.7
40.4
49.3
15.4
3.3
Bro
ther
s/Si
ster
s/H
usba
nd2
.8
2.
10
.8
2.8
3.0
3.4
4.0
0.6
0.2
Scho
ol m
ates
,N
eigh
bour
s/Fr
iend
s28
.12
.2
2.5
3.4
0.4
6.2
0.7
0.5
16.0
Her
self
/Not
with
any
part
icul
ar p
erso
ns10
.21
.32
.4
6.6
2.2
1.2
2.3
0.8
0.6
N.A
./H
as N
ever
been
out
side
vill
age
56.1
18.7
83.5
56.9
25.8
28.1
14.8
76.8
78.9
pc!
05

Father, Male Relatives
Mother, Female Relatives
Both Parents
Brothers, Sisters, Husband
Schoclmates, Friends, N'bours
Herself alone
Never been outside Village
0% 20% 40% 60% 80% 100%
ral School Work III Marketing]
512. WHO ESCORTS THE GIRLFor Different Activities
Father, Male Relatives
Mother, Female Relatives
Both Parents
Brothers, Sisters, Husband
Schoolmates, Friends, N'bours
Herself alone
Never been outside Village
0% 20% 40% 60% 80% 100%
[El Pilgrimages Visits Rd Picnics
S13. WHO ESCORTS THE GIRLFor Different Activities
82
96
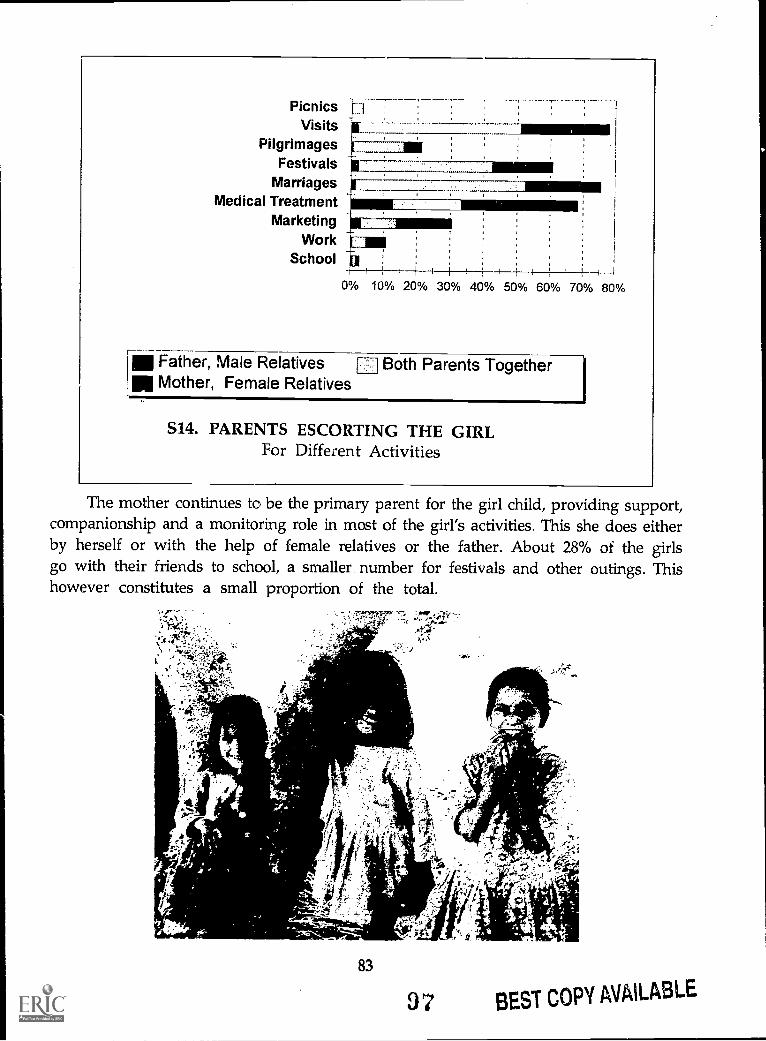
PicnicsVisits
PilgrimagesFestivals
MarriagesMedical Treatment
MarketingWork
School
1111111114
! -i-0% 10% 20% 30%
I r
40% 50% 60% 70% 80%
Father, Male Relatives Both Parents TogetherMother, Female Relatives
514. PARENTS ESCORTING THE GIRLFor Different Activities
The mother continues to be the primary parent for the girl child, providing support,companionship and a monitoring role in most of the girl's activities. This she does eitherby herself or with the help of female relatives or the father. About 28% of the girlsgo with their friends to school, a smaller number for festivals and other outings. Thishowever constitutes a small proportion of the total.
83
J7 BEST COPY AVAILABLE

Considering the number who have never been outside their village or locality for
the different purposes enumerated, the sparsity of recreation, entertainment and travel
in the life of a girl child becomes obvious.
Girl Child's Recreation Activities
One of the major gender differences that becomes apparent to girls as they grow
up is the restriction on their freedom to move out of the house, especially for
entertainment, visiting friends, seeing films and other recreational activities. Conservatism
in parental dictate is confounded by poverty, which is in turn correlated with other
socio-economic variables. One such factor is the level of the parents' education.
An elaboration of this relationship is seen in the table below (HI . 16). Mother's
level of education is seen to have an inverse relationship with the daughter's access
to cinema. A parallel r lationship to father's education can also be seen.
The level of education attained by mothers and fathers does have a relationship with
the girl child's recreational activities, of which attending popular cinema is one. (I trust
the reader realises that "cinema" here is symbolic of any visit for pleasure or fun and not
to be considered as the research team's promotion of a value for popular film!).
Table III.16
Parents' Education and Accessibility of Cinema for Daughters
Mother Father
Level of Proportion Percentage Proportion Percentage
Education of total at of girls of total at of girls
educ. level restricted educ. level restricted
Non-literate 57.3 59.8 31.0 61.1
Primary 15.5 50.1 16.5 56.9
Middle 11.7 44.2 13.2 53.5
Higher Secondary 10.0 35.4 18.9 49.1
College and above 4 . 9 34.8 12.7 36.4
When the mother is educated, her level of educa Jri has more impact than fi.e father's,
but only marginally so. When the mother goes past the secondary level in education, her
attitudes tend to become less conservative. Non-literate mothers are also likely to be poorer,
and therefore are in need of their daughter's labour for household work and for sustenance
and maintenance of the family. Even when mothers are educated upto higher secondary
level or beyond, about a third of them do not permit their daughters to go to th,. cinema.
This is a correlation, not a predictive relationship and must be understood in the context
of the opporiunities and life chances of each generation.
84

The circumscription of the Indian girl's movements outside the home have beenwell documented in a variety of studies. The inside/outside dichotomy is discussed evenin the recent study on "Gender and Poverty" (World Bank 1992) in the context ofgender. One should be surprised if restrictions on girls were not found. In general,the less educated the parents, the more likely it is that their daughter is treated asmore vulnerable and therefore forbidden from moving out by herself. With the levelof the father's education going up, the percentage of girls who feel restricted aboutgoing out, decreases. The relationship is linear.
Even the most educated fathers impose restrictions; even when they are educatedup to college level, 37% of the girls are restricted (Table HI . 17). Only about 5% ofthe mothers have anything like a College education or above and the proportion ofgirls restricted is 28% in their case. At the non-literate or even primary level, thereis no effective difference between mothers and fathers in their rules for the daughters.
But when mothers reach the secondary level, they are at least 10% less strict thantheir husbands at the corresponding level of education. The fact of parental educationalso being correlated with other status variables cannot be ignored here as in otherrelationships that emerge.
Table III. 17
Parents' Education and Restrictions on Going out for Daughters
Father Mother
Level ofEducation
Prop. oftotal at
educ. level
Percentageof girls
restricted
Prop. oftotal at
educ. level
Percentageof girls
restricted
Non-literate 31.0 58.3 57.3 59.0Primary 16.5 58.1 15.5 53.3Middle 13 .2 52.9 11 .7 48.0Higher Secondary 18.9 49.9 10.0 37.8College and above 12.7 37.4 4 . 9 28.4
When a girl is seen talking to a male who is not a member of her family, andwith whom she has no legitimate work, she is considers: to be exceeding her brief.
When the question was asked about restrictions on going out, 23% of the girlchildren reported that there were no such restrictions. Clearly these rules are gender-linked and 53% of the girls said that the parental restrictions on going out were forgirls, not boys.
85

Father III Mother]
The correlate of "going out" is obviously meeting and talking to persons of the
opposite sex. This is forbidden to girls, and 45% of the sample say that this restriction
is only on girls and not boys.
Table III. 18
Parents' level of Education and Restrictions on Girls Talking to Boys
Father Mother
Level ofEducation
Prop. oftotal at
educ. level
Percentageof girlsrestricted
Prop. oftotal at
educ. level
Percentageof girls
'restricted
Non-literate
Primary
Middle
Higher Secondary
College and above
31.0
16.5
13.2
18.9
12.7
49.5
52.7
44.2
39.9
31 .5
57.3
15.5
11 .7
10.0
4 . 9
49.3
47.4
40.6
33.9
22.5
College & Above
Higher Secondary
Middle School
Primary School
Non-Literate
1111111111111111111111111111=11111111111111111111111111111111111111M1111M1111111111111111
ommummimmommussmommommu
111111111111111111111111111 1111111M11111MM1111111111111111111111111111111111M11111111111111111111111111111M111111111111111111111 111111111

In order to keep her "reputation", the girl is forbidden from talking to boys andmen. The proportion of girls reporting being restricted or feeling restrained decreasesas parental level of education increases (S15). Only a fifth of all the mothers whohave a college education or above appear to restrict their girl children from talkingwith persons of the opposite sex (Table III . 18).
The table (111 . 19) presented below is extracted from several tables. We' asked thegirl children how frequently they went outside the village for a marriage or a fair ora pilgrimage. (S16)
Table 111.19
Summary Table of "Never" Statements
Participation Percentage
Never visited relatives outside village 14.8Never attended marriage outside village 18.7Never visited fairs/festivals elsewhere 28.1Never been on a pilgrimage 76.8Never been part of picnic/outing for recreation 78.9
To Visit Relatives
To Go To Marriages
For Fairs/Festivals
On Pilgrimages
For Picnics/Outings
_....."'"-11111111110111111
4.8%
min
numinumi
8.7%
'N111111111111111111111111111
8.1%
11111111111111111111111111i11111M1111111111111111i111111111111111111111111111111111111111111111111
0% 10% 2°% 3°70 ,10% 60% 60% 70% geok 90%
Percentage of "Never Statements
S16. GIRLS WHO NEVER LEFT THE VILLAGEFor Various Purposes
6.8%
8.9%
--
87 10i

This table reveals that legitimate travelling is only for family weddings or otherfamily functions. Fairs and festivals are occasionally a part of their activity but evenhere 28% of the girls have never been outside the village to attend one. When itcomes to pilgrimages, the proportion of "never" responses shoots up, till finally 79%of the girls have never been for picnics or outings.
Going out of the home is for the Indian girl the uncommon luxury, the unex-pected challenge." So many of her activities are literally and metaphorically circum-scribed; literally within a radius of five metres and metaphorically within the controlof family codes, usually male-devised.
Restrictions on Specific Behaviours
The reasons for framing these questions must be apparent to those familiar withthe socialization of girls in India. It is a piquant observation in India that girls arenot allowed to laugh and boys are not allowed to cry. In other words, boys are broughtup to be brave and "manly" and girls to be modest and not laugh out (not to betoo attracive to the opposite sex!). In our total sample we found 41 .5% reporting norestrictions on their laughing, while 36 . 7% said that there were restrictions only ongirls and not on boys on laughing in public (Table 111.20).
Laughing
Going Out
Talking to Opp. Sex
Clothes
i I i 1 iA
0% 20% 40% 60% 80% 100%
On Both Girls and BoysNo RestrictionsOnly on Girls
S17. RESTRICTIONS ON BEHAVIOURRelated to Gender
88
102

Table 111.20
Restrictions on Specific Behaviours of Girls and Boys
Restrictions Laughing Going out Talking to Clothesopp. sex
Restrictions onlyon girls not onboys 36.7 53.2 45.0 38.7Restrictions onboth boys andgirls
No Restrictions
5 . 0 4 . 8 9 . 1 7 . 9
41 .5 23 .0 23 . 7 34 . 2
On going out, 53% of the girls report that the restrictions are on them,but not on the boys. About 23% say that there are no restrictions. On theother variables, wearing non-traditional clothes or talking to the opposite sex,there is no doubt about gender differences and the bias against the socialfreedom permitted to girls.
However, the most unambiguous picture is derived from the differences inthe restrictions on boys and girls that can be seen in this table (III.21).The restriction on boys (for the same acts) is generally felt by 1% or less.It is a telling comment on society that talking to the opposite sex is forbiddenfor 40 to 80% of the girls, while for boys the range is from 0 . 2% to 4 . 6%.Some questions were not asked directly or at least not recorded for the purposesof coding and quantification, but it seems highly possible that if a girl and boyare caught going out together or talking to each other, the repercussions for thegirl would be harsher. She would probably receive severe punishment orostracism for the "crime"!
There is no specific pattern emerging from the disaggregated data that wasnot already evident from the total sample. It is not clear what the reasons arefor the way the groups differ. For instance, in the example picked here, thegroup of girls in Gujarat seems to feel most restricted on going out, wearingnon-traditional clothes and talking to boys (Table 111.21). The samples from Puneand Berhampore fall next in restrictions on the same domains These observations,however, would not warrant any hasty conclusions on sub-cultural or inter-regionaldifferences.
89 103

co 0
104
Tab
le 1
11.2
1
Res
tric
tion
on S
peci
fic
Beh
avio
urs
of G
irls
and
Boy
s -
Sele
cted
Sam
ples
Loc
atio
n of
Cen
tre
Lau
ghin
gE
xpre
ssin
gE
mot
ions
Goi
ng o
utT
alki
ng to
Opp
. Sex
.C
loth
ing
Mar
ketin
g an
dgo
ing
out
to c
inem
a
Gir
lsB
oys
Gir
lsB
oys
Gir
lsB
oys
Gir
lsB
oys
Gir
lsB
oys
Gir
lsB
oys
And
hra
Prad
esh
Gun
tur
36.8
0.2
14.0
0.5
45.1
-40
.80
.5
35.3
-19
.10
.5
Wes
t Ben
gal
Cal
cutta
40.0
0.2
13.4
0.3
55.3
0.3
37.0
0.2
13.5
-28
.00
.3
Del
hi &
U.P
55.1
1 .0
17.6
0.5
52.0
0.6
37.1
0 .6
48.8
0.8
14.1
1 .0
Guj
arat
Ahm
edab
ad15
.0
1.0
68.7
3.
785
.52
.0
83.3
4.6
82.5
-37
.81
.3
Mah
aras
htra
Pune
--
46.5
0.
866
.61
.7
49.2
0.5
62.2
1.0
51.0
0.7
Ori
ssa
Ber
ham
pur
47.0
0.
125
.20
.2
61.0
-50
.30
.4
48.8
0.
144
.00
.1 10
5

Table III. 22
Qualities of a Good Girl, Wife and Daughter-in-lawI= ...-111,
Quality Girl Wife Daughter-in-law
Educationally Accomplished 21 .9 2 . 4
Good Job/Earning well 0.9' 0 . 7 2 . 7
Good looking/smart well-dressed 4 . 7 1 .9 3 . 8
Well-mannered/well-behaved 18 .2 12.8 15.9
Respectful, obedient, modest 18.5 8 . 8 15.9
Sharing responsibility 3.4 8 . 8 9 . 6
Adjustable/sociable 1 . 6 6 . 5 6 . 3
Good household work/cooking 11 .2 15.1 13.9
Don't know/Can't say 8 . 7 23.9 18.6
Healthy 0 . 3
Intelligent 2 . 4
Wealthy/good family 0 . 6
Affectionate/loving spouse 9 . 5 2 . 1
Admired Qualities
Questions concerning the qualities of a good girl, a good wife and a gooddaughter-in-law were asked to all the girl children. Despite the inherent problemsin questionnaire data of this type, quantified on the basis of the coding developedfor open ended categories, the method appears to have drawn out the genuineresponses of the girl children. Just one look at the category "educationallyaccomplished" which is mentioned by 22% of the girls and is the most frequentlyreported trait of a "good girl", is mentioned by 2.4% as the quality for a goodwife and it drops out entirely in the qualities mentioned of a good daughter-in-law (Table HI . 22).
The qualities admired in a girl may have no value when she becomes a wifeand a daughter-in-law. It follows that the traits a girl wishes to have when she isin school and unmarried, may become irrelevant in her marital state. To be astudent and to be educationally accomplished evokes the admiration of one's .peers;but when the girl's role changes to that of wife and daughter-in-law, education isno longer seen to be relevant.
91

Table III. 23
Expectation of Approved behaviour in Boys and Girls : Selected Samples
Location of CentreModest, Helpful and Cooperative Behaviour
Girls Boys
Andhra PradeshTeiengana 46.5 41 .7Guntur 37.3 32.3
West BengalCalcutta 40.0 31.7
Delhi & (U.P. ) 48.8 36.8
KeralaTrivandrum 65 .9 69.6
MaharashtraBombay (1) 77.1 47.0Pune 54 .4 42.2
OrissaBerhampur 51 .3 39 . 4
Uttar Pradesh (Eastern)Varanasi 62.8 44.2
For most of the other traits, the differences are not so dramatic: it is apparentthat some girl children are shy or hesistant to mention the qualities of a good wifewith the "Don't know/Can't say" category getting 24%. In the case of mentioning thetraits of a good daughter-in-law, 18.6% girls were unwilling to commit themselves, orperhaps unable to mention specific traits (III . 22).
Being respectful and modest is a relevant trait for all categories but is morefrequently mentioned for the girl child than for a wife or daughter-in-law; and conversely,sharing responsibility is more clearly seen as a trait valued after marriage.
Behaviour which is helpful, cooperative and modest receives social approval atmost levels. However, it is clearly expected that girls will develop this cluster oftraits. For the boys, the expectation is lower in all the samples, except in Kerala.Even the traits that are most valuable for all human relationships get subtly linkedwith gender and become feminine attributes (Table HI . 23).
92
107

Since helpfulness and modesty are included in the traits admired in women, theproportion of girls is higher than the proportion of boys for each corresponding trait.It also appears that these traits cut across development levels and regions,as there is no specific relationship between proportion of girls in school or any othervariable that can be considered a correlate for the value for cooperative behaviour. Thefact that there is no relationship between this value and any developmental aspect canbe seen from the table which has data from nine collaborating centres (Table III . 23).
Ideal Age of Marriage for Boys and Girls : Mother's Perspective
The mothers were asked their opinion on the ideal age of marriage for boys and girls.
Table III. 24
Ideal Age of Marriage for Boys and Girls : Mother's Perspective
Age of Marriage Girls Boys
Whenever they want 0 . 3 1 . 6Before the age of 8 years 0 . 3 0 . 2Between 8-12 years 3 . 7 0 . 2Between 12-15 years 12.7 1 . 2Between 15-18 years 33.1 6 . 9Between 18-22 years 37.0 32.3Between 22-25 years 30.7Above 22 years 7 . 6Above 25 years 22.5D . K . /No idea/Never thought of it/When the proposal comes 2 . 6 2 . 1
N . A . 2 . 7 2 . 4
From the above table (III . 24) we can see that in the case of the girls, about 50% of themothers felt that the girl should be married by the age of 18 years. Of this, 33 . 1% felt theideal age was between 15 - 18 years of age and it becomes clear that for at least half the familiesin the sample, the official age for the girls marriage at 18 + is later than they want. And 37%felt that 18 - 22 years constituted the ideal age.
In the case of the boys, 63% of the mothers felt that the ideal age for a boy to marrywas between the ages of 18 and 25 years. About 22 .5% felt that boys should marry afterthe age of 25 years.
Gender Differences
From the perspective of the girls, literacy and family occupationare important for boys,but only 10% say that literacy is for boys only and about 30% that family occupation is forboys only. About 70% of the girls feel that literacy is important for both boys and girls and18.5% put family occupation in this category. Skills which are stereotypically consideredfeminine have predictably less than 5% responses in the category of "Both boys and girls".
93 103

Where there seems to be almost no doubt is in the response that cooking is a skill that girlsmust acquire (87%) and about 48% put sewing in this category. About two-thirds to three-fourths of the girls are not sure about the importance of music and dance probably becauseopportunities to acquire skill in these areas are simply non-existent. As for family occupation,many do not have a traditional family occupation, and hence almost half the sample of girlsadmit to not being sure of the expectation of acquiring skills in it (Table III . 25).
Table 111.25
Girls' Report on Skills Expected to be Acq .aired
Skills
Boysonly
Girlsonly
Both Boysand Girls
Not Sure /Don't kno
Literacy 10.0 6 . 5 70.5 12.0Cooking 0 . 2 87.3 5 . 3 6 . 3
Music 1 . 1 19.1 68.6Dance 0 . 8 18.7 3 . 9 74.2Sewing 0 . 6 47.8 4 . 3 45.4Family Occupation 29.7 3 . 8 18.5 45.1
There is a clear relationship (Table III . 26) between the proportion of girls attendingschool and the proportion of girls who say that both boys and girls need to acquireliteracy. The importance for equal literacy is the highest in Kerala and Maharashtra
Table III. 26
Girls' Report on Literacy Skills expected to be Acquired - Selected Samples
Location of Centre Both Boys and Girls
Andhra PradeshCoastal
BiharDelhi & (U . P.)
KeralaTrivandrum
MaharashtraBombay (2)Pune
OrissaBerhampur
Uttar PradeshVaranasi
63.367.374.8
96.7
87.786.2
59.6
64.2
94
109
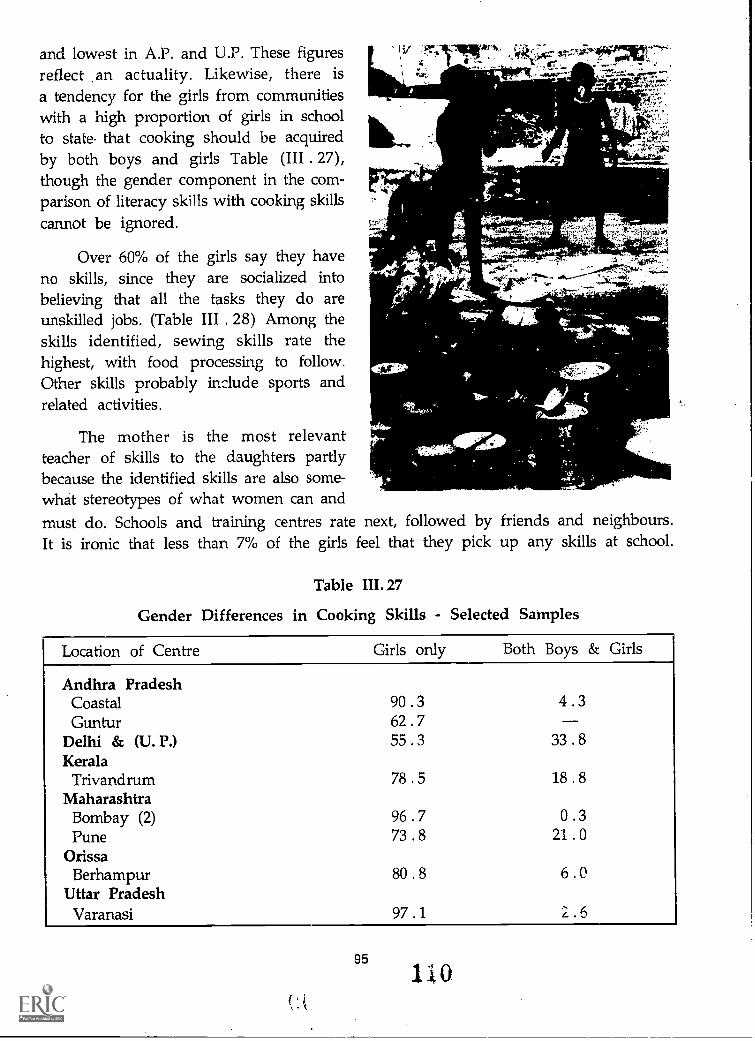
and lowest in A.P. and U.P. These figuresreflect .an actuality. Likewise, there is
a tendency for the girls from communitieswith a high proportion of girls in schoolto state. that cooking should be acquiredby both boys and girls Table (III . 27),though the gender component in the com-parison of literacy skills with cooking skillscannot be ignored.
Over 60% of the girls say they haveno skills, since they are socialized intobelieving that all the tasks they do areunskilled jobs. (Table III . 28) Among theskills identified, sewing skills rate thehighest, with food processing to follow.Other skills probably include sports andrelated activities.
The mother is the most relevantteacher of skills to the daughters partlybecause the identified skills are also some-what stereotypes of what women can andmust do. Schools and training centres rate next, followed by friends and neighbours.It is ironic that less than 7% of the girls feel that they pick up any skills at school.
Table III. 27
Gender Differences in Cooking Skills - Selected Samples
Location of Centre Girls only Both Boys & Girls
Andhra PradeshCoastal 90.3 4 . 3
Guntur 62.7Delhi & (U. P.) 55.3 33 .8Kerala
Trivandrum 78 .5 18 .8Maharashtra
Bombay (2) 96.7 0 . 3
Pune 73 .8 21 .0Orissa
Berhampur 80 .8 6 . 0
Uttar PradeshVaranasi 97 .1 L .6
95

Table III. 28
Skills of the Girl Child
Skills Percent
No Skill 61.3Stitching / Embroidery / Knitting 16.8Cooking / Food Processing 7 . 7Household occupation 2 . 8Fine arts 3 . 1
Other skills (sports, etc . ) 8 . 4
Judging by the data in Table III .29 the term "skill" has been interpreted in manyways. While 94.5% of the girls in Kerala say they have no skill, only 25.3% in Pune saythe same. If would be instructive for the methodologist to examine the term or terms whichare the translations of "skill" in the different languages represented in this sample. Thisis apart from taking into account the investigator-variable, i,e. that some researchers areable to get better data than others. Having allowed for both semantic and trainingdifferentials, there are some points to note. Fathers have almost no role in teaching anyskill to their daughters, but the mother's role is a major one in this context. Friends andneighbours are just as important as family members (another indicator that the "extendedfamily" may include other than kinsfolk).
Table 111. 29
From whom Skills Learnt - Selected Samples
Location ofCentre
NoSkill
Father Mother Familymembers
Friends,neigh-bours
School,Coaching
Centre
Selftaught
Total Sample 61 .5 1 .1 18.5 3 . 7 5 . 5 6 . 5 3 . 1
Delhi & U . P 56.5 1 . 0 16.6 8 . 6 14 .3 3 . 7
KeralaTrivandrum 94.5 0 . 2 1 . 0 0 . 2 2 . 0 2 . 1
OrissaBerhampur 80.5 0 . 4 7 . 7 1 . 7 3 . 4 3 . 8 2 . 5
MaharashtraPune 25.3 2 . 0 29.8 0 . 8 7 . 8 19.0 14.8
EasternUttar PradeshVaranasi 0 . 6 56.9 6 . 9 12.9 5 . 6 16.2
96
111

Getting Fuel
Child Care
Cleaning
Getting Water
Cooking
Sweeping
1111MM
N1111111111111111
/11111111111111111111
11 11
1 11110% 10% 20% 30% 40% 50% 60% 70% 80%
Only GirlsM Girls = Boys
1111111111Girls > BoysGirls Spend No Time
S18. GENDER DIVISION OF DOMESTIC TASKS
Table 111. 30Gender Division of Domestic Tasks
Domestic Tasks Only girlsspend timenot boys
Girls spendmore timethan boys
Girls spendno time
at all
Girls and boysspend equal
time
Fuel 12.2 6 . 1 9 . 6 5 . 9Fodder 4 . 9 3 . 0 7 . 4 3 . 2Water 42.5 10.3 2 . 8 10.6Cattle 6 . 8 3 . 3 6 . 3 4 . 1Cooking 64.8 5 . 2 2 . 9 1 . 0Child Care 33.2 7 . 2 2 . 1 2 . 0Sweeping 72 . 3 5 . 2 1 .6 2 . 3Errands 11.0 2 . 9 14.1 14.6Marketing 8 . 0 1 .2 22.7 8 . 3Floor Care 25.9 1 .7 4 . 6 2 . 4Garden 5 . 0 0 . 9 2 . 7 1 . 5Grazing 2 . 1 0 . 7 8 . 0 1 . 8Home Industry 1 . 9 0 . 3 2 . 3 0 . 6Agriculture 2 . 9 0 . 4 7 . 1 3 . 4Selling 0 . 9 0 . 1 7 . 2 0 . 5Cleaning 42.3 9 .0 2 . 4 1 . 8Churning Butter 9 . 4 0 . 4 2 . 5 0 . 1
97
112
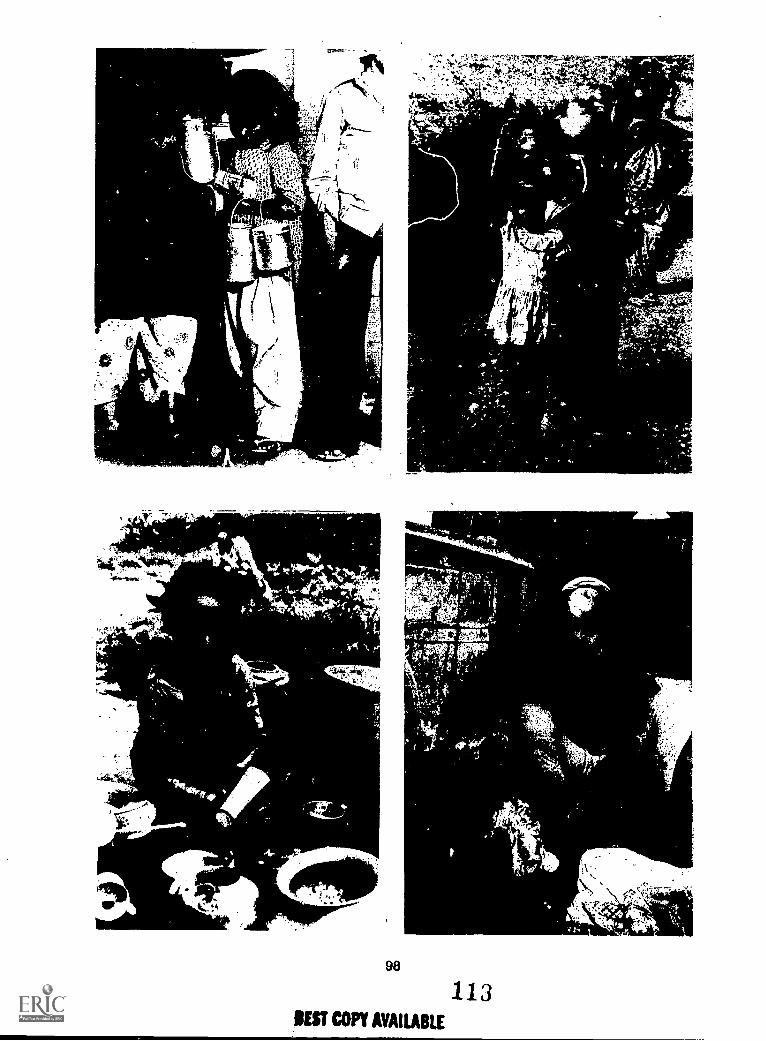
pa
a1_
0
98
SECT COPY AVAILABLE
113
1
NMI

INN
Only GirlsGirls > Boys
Girls = BoysGirls Spend No Time
SweepingCleaning
Cookingsi Child Care
Getting WaterGetting Fuel
519. GENDER DIVISION OF DOMESTIC TASKS
A look at the domestic tasks and the proportion of girls involved in them revealsthe nature of the gender orientation of the various tasks (S18, S19). For instance, whenone considers child care/sibling care, 33% say that only girls spend time, 7% that girlsspend more time than boys and 2% each that girls spend no time at all and boysand girls spend equal time. These figures constitute a diffused picture of the girl's rolein sibling care. If only 2% spend no time at all, it stands to reason that almost allthe others who have young siblings will have something to do with their care. Butas we know from some field notes, some sibling care is labelled as "playing withbrothers" or keeping younger brothers amused (Table III . 30).
If one runs down the column "only girls spend time" (not boys), we notice thatsweeping is the gender stereotypic domestic task that rates the highest proportion, withcooking as the second. Fetching water and cleaning the house rate third in proportionof responses from the sample. This column must be studied in parallel with Col.4 (bothboys and girls spend equal time) and we see that 2% spend time sweeping, 1% cooking,and 10 . 6% fetching water. These present another angle on the same data.
What women activists and scholars have been saying for years is that genderattitudes and gender divisions of work are overarchingly dominant, cutting across socialclass, caste and region. The data support this point of view entirely.
99
114

Chapter IV
EDUCATION
LIST OF TABLES
Table No. Particulars Page No.
1 School Attendance of Girls 105
2 School Attendance of Girls in Rural/Urban Areas 105
3 School Attendance of Girls in District/Area 106
4 School Attendance of Girls and Literacy level of Area 107.
5 Relationship of Caste to Non-attendance of School 107
6 School Attendance of Girls and Religion 108
7 School Attendance of Girls and Type of School 109
8 School Attendance of Girls in Co-educational andGirls Schools : Selected Samples 109
9 School Attendance of Girls and Location of School 110
10 School Attendance of Girls and Location of School :Selected Samples 111
11 The Medium of Instruction in School 112
12 The Medium of Instruction in School : Selected Samples 112
13 Participation of Girl Children in Extra CurricularActivities in School 113
14 School Facilities available to Gil.. Children 114
15 School Facilities available to Girl Children :Selected Samples 115
16 School Facilities utilized by Girl Children 115
17 Mother's Views on Education level forGirls and Boys 117
18 Mother's Views on why Girl Children did notattend school 117
19 Mother's Views on why Girl Children discontinuedstudies 118
20 Age Girl Children Dropped out of School 118
100
115

Table No. Particulars Page No.
21 Class in which Girl Children Dropped out of School 119
22 Stage at which Girl Children Dropped out- Selected Samples 119
23 Reasons for Dropping out stated by Girl Children 120
24 Caste/Socio-cultural Factors and Non-Attendance of School 121
25 School Attendance of Girls and the Mother's levelof Education 122
26 School Attendance of Girls and Father's levelof Education 123
27 School Attendance of Girls and Parents' Levelof Education 124
28 School Attendance of Girls and Father's Occupation 125
29 School Attendance of Girls and Household Income 126
30 School Attendance of Girls and Birth Order amongLiving Girl Children 126
31 Girl Children's Reasons for I iking School 127
32 Girl Children's Reasons for Disliking School 128
33 Persons providing help in Education to Girl Children 128
34 School Attendance of Girls and Future Aspirations 129
35 School Attendance of Girls and Future Aspirations :
Selected Samples 130
36 Mother's Views on Girl Children going to School andSchool Attendance 131
37 Person Deciding on Schooling and School Attendanceof Girl Children 132
38 Ideal Level of Education for Girls :
Mother's view 132
39 Ideal Level of Education for Girls and Boys :
Girl Child's View 133
40 Ideal level of Education Desired by the Girl Child :
Selected Samples 134
41 Advantages of Education : Girl Child's View 137
101116

LIST OF DIAGRAMS
Chart No. Particulars Page No.
1 Proportion of types of Area- In the Sample 104
2 School Attendance of Girls- Related to type of Area 106
3 Mother's level of Education 121
4 Father's level of Education 122
5 Girls attending School- Related to Father's level of Education 123
102
11BEST COPY AVAILABLE 7

Chapter IV
EDUCATION
Introduction
ryone is familiar with the global slogan "Education for all by the year 2000".Implementing this is a mandate for the Government; the rapid increase of primaryschool facilities and their extension to the remotest village and hamlet is a categoricalimperative.
Education is an umbrella term to convey many things - literacy, numeracy, schoolattendance, peer relationships in a formal setting and so on. When children attendschool for a few years, they are considered "educated", even though it is widely knownthat just being in school does not automatically ensure that children receive a realeducation. Recent evaluations of the education at the primary level have uncoveredgross deficiencies that have a sobering effect on one's optimism. Nevertheless, theconviction persists that it is better for children to attend primary school than not,and that schooling, however inadequate, has some positive effects on child development.These effects are even more perceptible in the case of girls.
Schools generally reflect the characteristics of society. They have partial segregationwithin the classrooms on the basis of gender, a curriculum reflecting patriarchal valuesand a male-dominated teachers' team. However, even these factors do not whollysuppress the value of the school experience for girls.
School is still a place where good behaviour, attentiveness, responding toquestions alertly, being helpful, and developing subject matter competence arepositively reinforced. On all these aspects, girls tend to be equal to, if not ahead of,boys. Hence, they get immediate rewards. A reward may be no more than a nodof approval from the teacher. Children are able to convert these trace elementsof courtesy into the components of self-esteem and self-confidence. Any positivereinforcement from the teacher thus adds to the girl child's scarce opportunitiesfor a sense of achievement.
This preamble is to emphasize the concept that, for the purposes of this study,school attendance in itself is relevant. Therefore a number of aspects of the life ofthe girl child are studied through the lens of schooling.
In the planning of the study a number of demographic details have also beenselected which are related to the issue of girls' education. These details have beenconsidered here in this section.
103118

Urban Middle SES
Urban Low SES
Rural Underdeveloped
Rural Developed
El. PROPORTION OF TYPES OF AREAIn the Sample
The development index was intrinsic to the sampling, design. The districts selectedwere to be from two ends of the distribution, from the first and fourth quartiles tobe exact. In other words, the rural areas were stratified according to level ofdevelopment. A district with a high development index (top 25% according to theCMIE) and a district with a low development index (bottom quartile according tothe CMIE) were identified. From each of these, two villages were selected; one withhigh literacy and the other with low literacy.
Two levels of rural development were thus built into the sampling design, ashas already been described in detail in the chapter on Household Profile. Two-thirdsof the entire sample was rural. Two levels of urban families, lower SES and lowermiddle SES were selected for the urban sample.
Information from 20 of the participating research teams constitute the quantifieddata presented here. Two of the teams were late with their data, but their descriptionsand qualitative data have been included.
The first area of inquiry concerned school attendance of girl children (Table IV.1).
104
115

Table IV.1
School Attendance of Girls (7-18 Years) N = 12000
School Attendance Number of girlchildren
Proportion of thetotal
Attending School 7373 61 .4Dropped out 2082 17 .4Never Attended School 2541 21 . 2
The percentage of girls attending is 61%. A little more than 20% of all the girlsnever went to school, while those who have attended school and dropped out constitute17% of the sample of 12000 girls.
When the total sample is broken up into Rural and Urban, the following distribution(Table IV . 2) can be seen in the school attendance figures of the girls.
As one would have predicted from available data, there is a clear urban-ruraldivide in the proportion of girl children attending school and in the proportion of thosewho never attended. The urban sample has 18% more girls in school than the rural;conversely, the rural sample has 13% more girls who never attended school.
Table IV.2
Girls' School Attendance in Rural and Urban Areas
Sample Now attending Dropped out Never attended
Total Sample(N=12000) 61 . 4 17 . 4 21 . 2
Rural Sample
(N=8000) 55 . 7 18 . 7 25 . 6
Urban Sample(N=4000) 73 . 9 14 . 6 12 . 4
A predictable linear relationship can be seen, with the rural sample having asmaller proportion in school and a larger proportion out of school in comparison tothe urban. Further, the rural developed district had data that showed a slight improvementin the quantum of girls getting an education. The low SES urban area has 62% girlchildren in school and 21% who never attended, closely approximating the mean ofthe total sample. The urban middle SES, which constituted 17.6% of the total sample(with the cities including Bombay, Calcutta, Delhi, Hyderabad, Ahmedabad, Pune,Chandigarh and Mysore among others) had 82.5% of the girl children in school andonly 4.4% who never attended (Table IV . 3).
105120

Table IV3
School Attendance of Girls according to Type of District/Area
District/Area
Proportionof the
total sample
PercentageAttending
School
PercentageDropped
out
PercentageNever
Attended School
Rural low levelof development 32 .8 54 .2 16 .2 29 .6
Rural high levelof development 33 .8 57 . 1 21 .2 21 . 7
Urban low SES 15 . 8 62 . 1 16 . 4 21 . 4
I Trban middle SES 17 . 6 82 . 5 13 . 1 4 . 4
The reasons for the rural-urban difference are known ones : differential access to
school, varying value for schooling and the situational imperative of engaging the girl
child in household chores, like fetching water and fuel, as well as for sibling care. These
aspects become clear as the study progresses and this preliminary discussion must be
seen as merely setting the stage.
Urban Middle SES pIIIIIIIIIIIIIIIIIIIIIIIIIIIIIFthuf:LA-
Urban Low SES
Rural Developed
Rural Underdeveloped
0% 20% 40% 60% 80%
Lral Attend School ms Dropped Out Never Attended
E2. SCHOOL ATTENDANCE OF GIRLSRELATED TO TYPE OF AREA
100%
106
P

The level of literacy of the area would certainly be an important antecedent ofthe education of girls. If parents themselves are even minimally educated, they are morelikely to get their children educated in the formal system. Even non-literate parentsappear to recognize the value of education for their girl children as the data indicate,but parental attendance of school does make a clear difference to their educating theirchildren. The table that follows elaborates the quantitative relationship between literacylevel of the area and girl children in school (Table IV . 4).
Table IV.4
Literacy Level of the Area and School Attendance of Girls
Literacy Levels Now Attending Dropped out Never attended
LowHigl,
55.367.8
18.716.0
26.016.2
Next, we study the caste break-up of the sample and then the percentage of girlsin each caste not attending school. Here we see that there is an unambiguous relationshipbetween the caste hierarchy and the percentage of girls who never attended school(Table IV . 5).
Table IV.5
Relationship of Caste to Girls' Non-Attendance of School
Caste Number ofgirls
Percentage ofcaste groups in
the entire sample
Percentage ofgirls never
attended school
Brahmin 914 7 . 6 4
Forward 3332 27 . 8 15
Backward 3825 31.9 28SC 2430 20.3 34
ST 683 5 . 7 41
Others 792 6 . 6 23
Starting with 4% among the Brahmins and 15% in the Forward Castes, it graduallyincreases as we go to Backward Caste and Scheduled Castes, to 41% in Scheduled Tribes.In the last row, 'others' refers to those outside this specific category system, includingpersons from other religions, not falling under a caste system. Interpretation of thisfinding must take into account the sociological fact that caste does not operate inisolation, but as part of a complex cluster of socio-economic variables.
The next category to consider as a case of not attending school is that of religiousgroup affiliation.
107 122

Sikh and Christian families appear to be ensuring the school attendance oftheir daughters more thoroughly than Hindus and Muslims. The flip side of thecoin is tr 1. proportion of girls from each group who were never in school. Thisparticular statistic does seem to support the thesis that the socio-cultural factorsinherent to being a member of a religious group do serve as salient antecedentsto the family's behaviour (Table IV . 6).
Table IV.6
Religion and Girls' School Attendance
Religion Proportion ofthe totalsample
Percentageenteringschool
Percentagenever inschool
Hindu 85.5 75.2 24 . 8
Muslim 7 . 3 71.5 28 . 5
Christian 2. 5 93 . 4 6. 6
Sikh 2 . 6 96 . 8 3 . 2
Other religions 2 . 1 78 .9 21 . 1
The sample consisted of girls between 7 and 18 years and they were in classes
ranging from Nursery to College. We know, of course, that sometimes children aresent to school only when they are able to go out on their own, and not necessarilyat age 5. Some children are therefore in Nursery or Standard I at seven years of age.From Standard 2 to 10 there is an approximately even number in each class level.The sample covered the entire age range of 7-18 years and the range of classes
from I to XII rather uniformly.
The next variable was the type of school: co-educational or single sex (Table IV . 7).Only 18% of the total sample attended single-sex schools; out of this lot, aboutone-fifth dropped out. Out of the 60% entering co-educational schools, a little morethan one-fifth dropped out. The difference in the type of school is only marginal, yetit could be an important factor for girls who are above the age of puberty. One factto be remembered is that most villages generally have only one school and boys andgirls attend this. The opportunity of attending a girls' school is probably enjoyed bygirl children in the urban areas.
It is most likely that the girls' schools in this survey were from the urban areas,where large schools operate separate shifts for boys and girls, or where fee-paying girls'schools are available and are sought by parents as a channel for upward mobility fortheir children.
108
123

Table I V.7
Type of School and Attendance
Type of Total percentage Percentage PercentageSchool entering school now attending dropped out
Co-educational 60.3 76.6 23.2
Girl's School 18.3 82.8 17.1
One of the conclusions to be drawn from this set of data is that there is no directrelationship between number of girl children in school and availability of girls' schools.
Table IV.8
Percentage of Girls Attending Co-educational and Girls' Schools :Selected Samples
Location of Centreand percentage of girls inschool
Percentage of Studentsin Co-educational
Schools
Percentage ofStudents in
Girls' Schools
Andhra PradeshTelangana (63 . 3) 75.0 23 . 6
Guntur (60 . 5) 99 . 1 0 . 8
West BengalCalcutta (65 . 1) 67.9 31 . 1
Delhi (& UP) (60 . 5) 69 . 9 30.1
GujaratBaroda (69 . 5) 83 . 2 16 . 8
KarnatakaMysore (67 . 5) 87.9 12.1
KeralaTrivandrum (85 . 7) 70 . 8 28 . 7
MaharashtraBombay (2) (85 . 8) 94.0 6 . 0Pune (65 . 5) 82 . 4 17 . 6
Tamil NaduKaraikudi (67 . 3) 83 . 5 16 . 5
Uttar Pradesh(Eastern)Varanasi (50 . 2) 79.2 20.8
109 144

We see here (Table IV.8) that in Trivandrum, Calcutta and Delhi, a fairly noticeableproportion (29 - 31%) of girl children were attending girls' schools, but the total per-centage attending school does not seem to have been influenced by this factor.
It is too simple to treat attending a girls' school as a status variable. On studyingthe break-up of Co-education vs. Single Sex Schools in selected locations, it becomesclear that school attendance per se is not influenced by the availability of a girls' school.In Bombay where 6% attend girls' schools and in Kerala where 28% attend girls' schoolsthe school attendance is 85% (the highest proportion in our sub-samples).
For at least half of all the girl children, the school was within reach, in thesame locality (Table IV.9).
A
Table IV.9
Location of School and School Attendance
Proportion of the Percentage Percentage
Locality total entering attending droppedschool school out
In Village/locality 50 . 6 76 . 0 23.9Within 2 km. 21 .1 81 .5 18.3
From 2 - 5 km. 6 . 9 82.7 17.2
110

Of these, almost a quarter dropped out. Of the 21% girls who had a schoolwithin 2 km, 81% attended school and 18% dropped out. Approximately the sameproportion can be seen among the girls whose school was 2-5 kms. away.
A large majority of the sample (71%) said that there was no problem in walkingto school (out of them 78% attended school and 22% were dropouts). Altogether only7% of the girls mentioned problems of bad weather, their own ill health or a feelingof insecurity. However, even these girls did continue to attend school in approximatelythe same proportions. A look into a few specific examples from the sub-samples givesthe textural details that characterize this study (Table IV . 10).
One can conclude that a reasonable distance from school is not in itself a factorin the number who attend. Children who walk a little further to attend school mayinvest more effort and hence have more value for school education. In any case, thereis no direct relationship between distance of school from home and girls' attendance.Distance being a factor in children never attending school may be treated as likelybut that specific aspect was not investigated in this study. As with all the other variables,poverty and economic marginality tend to be strong as determinants in all majoroutcomes.
radie IV. 19
Distance of School from Home : Selected Samples
Location Percentageof cf totalCentre attending School
WithinVillage/Locality
Under2
kms.2-5
kms.
Morethan
5 Kms.
Andhra PradeshTelangana 63.3 60 .9 26.7 9 . 9 2 . 8
West BengalCalcutta 65.1 54.9 31 .0 8 . 3 5 . 2
Delhi & (U.P) 60.5 46.1 41 .1 12.1Gujarat
Baroda 69.5 63.5 19 .3 16.0 1 .2KeralaTrivandrum 85.7 53.3 26.2 19.8 0 . 3
MaharashtraBombay (1) 65.5 54.8 31 .3 5 . 3 10.3Bombay (2) 85.8 75.0 14.6 8 . 3 2 . 7Pune 65.5 65.7 23.0 9 . 1 0 . 2
Uttar Pradesh (Eastern)Varanasi 50.2 32.4 34 .0 7 .8 5 . 8
111
i4

One indicator of the strong desire to educate girls may be the willingness offamilies to allow the girl child to stay in a hostel or with friends of the family, inorder to be close to a school. It was found that less than 20% of the total samplestay with relatives or friends or in a hostel. Almost all the children who attend schoolstay in their own homes.
Table IV. 11
Medium of Instruction of the Girl Children
Medium of Instruction Percentage of the total
Mother tongue only 56 . 2
Regional language (not mother tongue) 13 . 1
Mother tongue and one other language 1 .8
English 6 .8
Since about one-third of the total sample is from urban areas including themetropolitan areas of Bombay, Delhi and Calcutta, the question of medium of instructionoffers more variety than would be expected in monocultural areas (Table IV.11).
Table IV. 12
Medium of Instruction in SchoolSelected Samples
LocationofCentre
PercentageAttending
School
Mothertongue
only
Regionallanguage
(Not girl child'smother tongue)
English
Andhra PradeshCoastal 50.0 85.0 4 . 3 9 . 8
West BengalCalcutta 65 . 1 78 . 5 4 . 7 14 . 5
Delhi ( & U.P.) 60 .5 53 .5 44 .5 1 . 7
KeralaTrivandrum 85.7 80.8 0 . 3 17.8
MaharashtraBombay (2) 85 .8 87.7 3 .0 6. 1Pune 65.5 81.4 4 . 4 11.9
OrissaBerhampur 54 . 0 73 . 9 16 . 7 3 . 2
Tamil NaduKaraikudi 67.3 82.8 -- 11.6
112
121

The use of English as medium by almost 7% is definitely evidence of an upwardlymobile lower class in both rural and urban areas (Table IV . 11).
Selected instances from the studies undertaken as part of this project arepresented in Table IV .12 : the proportion of English medium schools inthe different locations of our sample is quite revealing. Trivandrum has thehighest number of girls in English medium schools followed by Calcutta.
While .he language in which children are schooled has implicationsfor their future academic and professional careers, and while English maybe perceived as the key to advancement, this study has not goneinto the details of the reasons for the choice of type of school. Ourinterpretations in this regard, may be considered no more thanintelligent guesses.
Most extra-curricular activities are beyond the reach of the girl child, or shedoes not participate. We should consider the access to school amenities in the contextof their scarce availability.
Continuing the description of the schooling experience for our sample of girlchildren from around the country, we consider the question of the girls taking partin the extra curricular activities available in the schools. Very few girls take part inanything other than games (which 50% of the girls say they participate in). Not morethan 20% take part in music and dance and the other activities are negligible.The resounding "No" from a large majority of the girls for such questions tells itsown story (Table IV .13).
Table IV. 13
Participation of Girls in Extra-curricular Activities ,
Activities Yes No
Games 49.3 29 . 3
Dramatics/Debates 13 . 4 65 . 0
Dance/Songs/Arts 21 . 8 56 . 7
Sewing/Cooking 12 . 1 66 . 2
Scouting-NSS/NCC 4 . 7 .72 . 7
As is known from official documents, research reports and observations, schoolsin rural areas and urban slums are sparsely equipped. Most facilities that we wouldconsider basic to a school are scarce (Table IV .14).
113
r12&

.\ IMIra '"
Table IV. 14
Facilities Available in Schools
4
Facility Percentage of Girl Childrenin Schools with these facilities
Playground 90
Library 42
Scouting 19
Science Lab 15
While in about 90% of the schools there is some playing space (called"playground") only 42% had a Library in their school while 15% had a Science Laband 19% offer Scouting (Girl Guides). If the children in school are expected to developthe reading habit and to have a wide range of subjects with which they are familiarand if in addition they are expected to develop a scientific temper, then suchexpectations are unrealistic.
114
123

Selected examples from seven of the collaborating centres gives the reader a pictureof the variations in the facilities provided in the schools (Table IV .15).
Table IV. 15
School Facilities in Selected Samples
Locationof Centre
Playground Library Scout/Girl Guide
ScienceLab
Andhra PradeshCoastal 60.0 19.6 7 . 3 9 . 1
GujaratBaroda 75 .6 35.6 3 . 6 4 . 7
KeralaTrivandrum 98.8 77.5 55.3 31 .3
MaharashtraBombay (1) 71 .8 26.3 20.9 26.7Bombay (2) 97.4 67.8 43.3 0 . 8
OrissaBerhampur 81 .0 42.0 22.0 42.0
Uttar Pradesh (Eastern)Varanasi 55 .1 16.1 9 . 3 10.8
What fee-paying and elite schools offer in the form of basic facilities may remainin the realm of fantasy for the average school girl in this country.
The availability of a specific facility tells only a part of the story. Its use tellsthe other part. The table that follows makes the dismal scene positively tragic.
Table IV. 16
Use of School Facilities
Frequency
Facility
Playground Library Scouting Science Lab
Often 24.0 4 . 4 2 . 1 2 . 6
Sometimes 23.6 14.7 2 . 9 2 .2
Regularly 15 .1 3 . 5 2 . 1 1 . 3
Never 9 .5 13.7 10.2 6 . 9
115
130

The Library, for instance (available on the whole in 42% of the cases) is usedfrequently by 4 . 4% of the girls. A Science Lab, available only in 15% of the schoolsin the entire sample is reportedly used often in 2 . 6% cases and regularly in 1.3%.Even the playground, which 90% of the girls state is available in their schools, is usedregularly by only 15% and frequently by 24% of the girls (Table IV . 16).
To these sparsely equipped schools, girls still go with hope. However their mothersmay have reasons for not sending them. Why are girls not sent to school? There areseveral reasons, and usually a combination of them. Nevertheless, an attempt was made
to find out if the reasons were mainly economic, familial-cultural or personal.
Whether a girl child does receive education will depend on many factors, not theleast of them the parental value for education. When the mothers were asked aboutthe levels of education appropriate for girls and boys, some gender differences wereseen. Those who said education was not necessary for girls (7. 8%) or for boys (2 . 7%)
were a small number. The gender difference persists in the expected direction as thelevels go up (Table IV . 17). The other category where the gender difference becomesapparent is when mothers say that children should study "as far as they want" - itis 29% in the case of girls and 45% in the case of boys. This means that boys willhave more choice - and a little more leeway than girls to make choices in the fieldof education. These views do reflect a difference but the reality will find a larger
116
1 3 1

gap - i.e. when talking about it, mothers are aware that they are mentioning differentlevels for boys and girls - and there will be a tendency to even out the differencesin talking about them.
Table IV. 17
Mother's Views on Education Level for Girls and Boys
Education Level Girls Boys
Education not necessary 7 . 8 2 . 7
Upto Primary /Read or write 7 . 5 1. 7Upto Middle 10.8 3 . 6
Upto Matric /High School/Higher Secondary 24.7 16.2Upto Graduation 10.5 16.3Upto Post-Graduation/Professional Degree 3 . 4 5 . 7
Diploma technical/Vocational 0 . 9 1 . 7
As far as they can/want 29.3 45.0D.K. 1 . 4 1 . 9
N.A. 3 . 9 5 . 1
Table IV . 18
Mother's Views on why Girl Children did not Attend School
Reasons girl Children not attending School Percentage
Inapplicable attending attended school 77.2Too poor to provide education 7 . 4
Worked in the field /agricultural work 1 .0
Family did not value girls education 2 . 3
No use educating girls/education makes marriage difficult 1 .2
Girls had no motivation for studies 1 .9
No good schooling facility/no transport facility 0 . 6
Had to attend to household/domestic work 2 . 0
Had to look after younger siblings 1 .1
N.A./Mother not respondent 2 . 6
117132
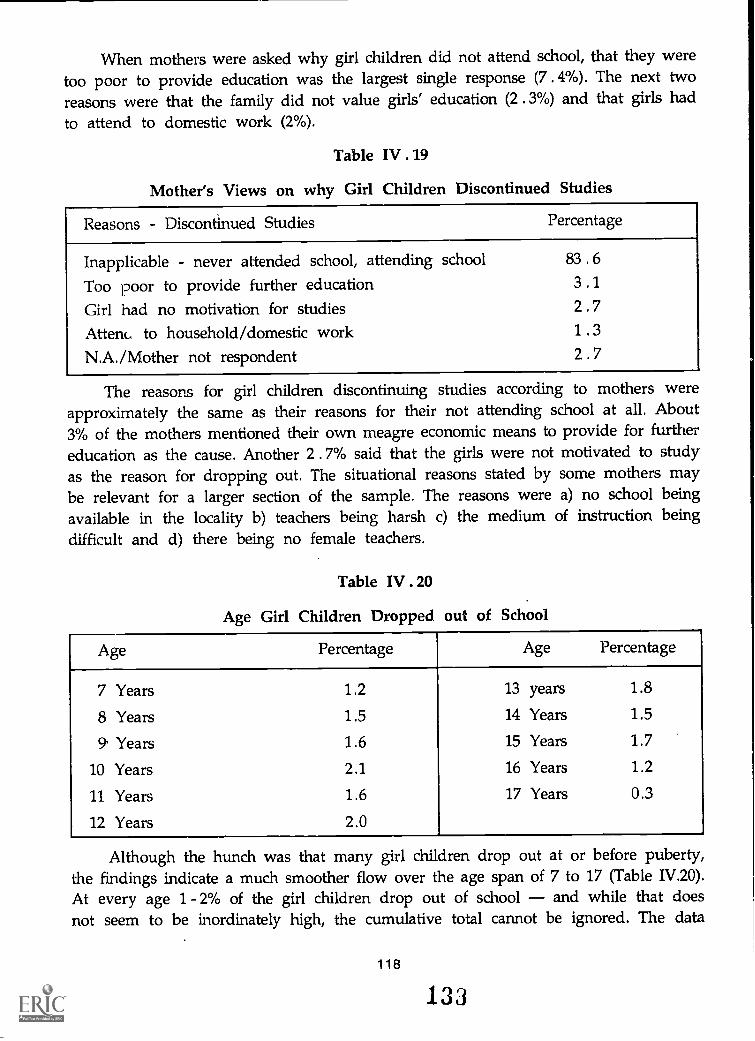
When mothers were asked why girl children did not attend school, that they weretoo poor to provide education was the largest single response (7 . 4%). The next tworeasons were that the family did not value girls' education (2 . 3%) and that girls hadto attend to domestic work (2%).
Table IV .19
Mother's Views on why Girl Children Discontinued Studies
Reasons - Discontinued Studies Percentage
Inapplicable - never attended school, attending school 83.6Too poor to provide further education 3 . 1
Girl had no motivation for studies 2 . 7
Attenc. to household/domestic work 1 . 3
N.A./Mother not respondent 2 . 7
The reasons for girl children discontinuing studies according to mothers wereapproximately the same as their reasons for their not attending school at all. About3% of the mothers mentioned their own meagre economic means to provide for furthereducation as the cause. Another 2 . 7% said that the girls were not motivated to studyas the reason for dropping out. The situational reasons stated by some mothers maybe relevant for a larger section of the sample. The reasons were a) no school beingavailable in the locality b) teachers being harsh c) the medium of instruction beingdifficult and d) there being no female teachers.
Table IV . 20
Age Girl Children Dropped out of School
Age Percentage Age Percentage
7 Years 1.2 13 years 1.8
8 Years 1.5 14 Years 1.5
9' Years 1.6 15 Years 1.7
10 Years 2.1 16 Years 1.2
11 Years 1.6 17 Years 0.3
12 Years 2.0
Although the hunch was that many girl children drop out at or before puberty,the findings indicate a much smoother flow over the age span of 7 to 17 (Table B/.20).At every age 1- 2% of the girl children drop out of school and while that doesnot seem to be inordinately high, the cumulative total cannot be ignored. The data
118
133

Table IV . 21
Class in which Girl Children Dropped out of School
Class Percentage Class Percentage
Standard 1 1 . 5 Standard 8 1 3Standard 2 1 .8 Standard 9 0 . 6
Standard 3 1 . 7 Standard 10 2 . 5
Standard 4 1 . 6 Standard 11 0 . 1
Standard 5 2 . 7 Standard 12 0 . 2Standard 6 1 . 4 Inapplicable/Standard 7 2 . 0 - attending School/never
attended School 82.4
in this table came as a surprise to the research teams, who expected to see a somewhatmore clear picture of peaks and troughs related to the age and developmental stages inthe life of the girl child and discontinuation of studies.
Table IV . 22
Stage at which Girl Children Dropped out - Selected Samples
Location ofCentre
Totalpercentageof Dropouts
Primary MiddleHighSchool
Vocational/Profess-ional
N.A.
Andhra PradeshCoastal 25.5 52.0 45.0 3 . 2 - -
West BengalCalcutta 16.5 60.7 35.3 - - 4 . 0
Delhi (St U.P.) 15.3 38.0 60.9 1 . 0 - -GujaratBaroda 11.1 48.5 28.1 15.4 2 . 8 4 . 9
KarnatakaMysore 22.2 19.2 77.4 3 . 2 -
KeralaTrivandrum 14.0 15.3 72.7 9 . 7 - 2 . 0
MaharashtraBombay (2) 12 .. 8 25.0 72.6 23.0 - -Pune 24.3 46.0 53.2 0 . 2 - -
OrissaBerhampur 22.7 45.9 - 52.9 1 . 2 -
119

The next table (IV . 21) which should be studied parallelly has a somewhat clearer
pattern : the largest number drop out from Standard 5, Standard 10 and Standard 7in that order. The ending of the stage of school (related to availability of school) isquite important. Class V indicates the end of the Primary School and Class X the endof the Secondary School, while Class VII is probably when the girl children are closest
to puberty.
When the same categories are studied in the data from the selected samples(Table IV . 22) some variations emerge. In Mysore, Trivandrum, Bombay and Delhi,the largest number of girl children drop out in the Middle School stage. In someregions (eg. Coastal A.P., Pune), the proportion of dropouts from the Primary andMiddle school stages are approximately equal. However, no clear relationshipemerges between total percentage of dropouts in an area, and the stage in which they
discontinued.
Table IV . 23
Reasons for Dropping out stated by Girl Children
Reasons Percentage
Economic Reasons 5 . 5
Socio-cultural reasons 3 . 9
Personal reasons 6 . 4
Situational reasons 2 . 8
It is interesting that personal reasons constitute the most important reason (6 .4%)for dropping out given by the girls (Table IV.23). Those include bad health, dislikeof teachers, fear of exams or lack of interest. Only 5 .5% of the girls say that economic
reasons were responsible for their leaving school. The situational reasons include lack
of access to school, or no school being available in the locality. Only 1 .8% (215 girls)of the total sample reported that they had no school in the locality. We must accept,of course, that "locality" has different definitions and we gather from other datain this study, that under 2 kms is a kind of distance that is viewed as "local"; beyondthat distance is out of one's "locality".
The next table (IV.24) on the relationship between caste membership and socio-
cultural reasons for not attending school reveals some interesting figures. Only 4 . 4%
of the entire sample stated that the family did not value girls' education, and 1 . 6%that society did not approve of it.
Of those who stated "the family does not value education", 1 .3% were Brahmingirls, 15 .6% were from the Forward Castes and 39 .7% from the Backward Castes.Thirteen percent belonged to the Scheduled Castes.
120
135

Table IV.24
Caste and Socio- cultural Reasons for not Attending School
Socio-cultural Percent of total Proportions in which they gave this reasonreasons sample giving (percentage)
this reasonBrahmin F.C. B.C. S.C. S.T.
Family does notvalue girlseducation
Society doesnot like it
4 . 4 1 . 3 15.6 39.7 13.3 9 . 9
1 . 6 3 . 8 9 . 7 35 .7 12.7 10 .8
The perception that "Society" does not approve of girls attending school has asimilar pattern, with 35.7% of those giving this reason belonging to the Backward Castes.This table has been presented mainly to provide a counterpoint for treating Indian"Society" as a monolithic entity. Clearly it is perceived differently by different members
and refers to the smaller social unit to which they belong.
College & Above (4.93%)Higher Secondary (10.06%)
Middle School (11.77%)
Primary School (15.69%)
Non-Literate (57.65 %)
E3. MOTHER'S LEVEL OF EDUCATION
121
13G

College & Above (13.76%)--\
Higher Secondary (20.47%)
Middle School (14.32%)
Non-Literate (33.58%)
Primary School (17.87%)
E4. FATHER'S LEVEL OF EDUCATION
We see from Table IV. 25 that only 44.4% of girls whose mothers are not literate
attend school. In families where the mothers have studied upto Primary level, 75.5%of the daughters go to school. Among mothers who have passed Middle school, 86.6%have daughters attending school. When mothers have Higher Secondary level education,93.3% send their girl children to school. For College educated mothers, the figure ofdaughters attending school moves up to 97% (Table IV . 25).
Table IV.25
Mother's Level of Education and School Attendance of the Girl Child
Mother's Education Proportion of theTotal
Girls AttendingSchool
Non-literate 57 . 3 44 . 4
Primary 15.5 75 . 5
Middle 11.7 86 . 6
Higher Secondary 10 . 0 93 . 3
College, Graduate, PG, Diploma 4. 9 97 . 1
122
137

Thus there is a strong linear relationship between mother's level of education anddaughter's school attendance. (This factor is not to be considered in isolation. One mustbe aware of the clustering of other variables around that of the level of formal educationof women). Nevertheless, it appears that a predictable antecedent of girls' educationis their mothers' experience of it.
Table IV .26
Father's Level of Education and Proportion of Girl Children Attending School
Father's level ofEducation
Proportion ofTotal
Girl ChildrenAttending School
Inapplicable - Father not alive 7 . 3 45 .9
Non-literate 31 .0 35 .2
Primary 16.5 58.8
Middle 13.2 71.2
Higher Secondary 18.9 84.1
Graduate and above 12.7 94.7
Graduate & Above
Higher Secondary
Middle School
Primary School
Non-Literate
0% 20% 40% 60% 80% 100%
E5. GIRLS ATTENDING SCHOOLRelated to Father's Level of Education
123 133
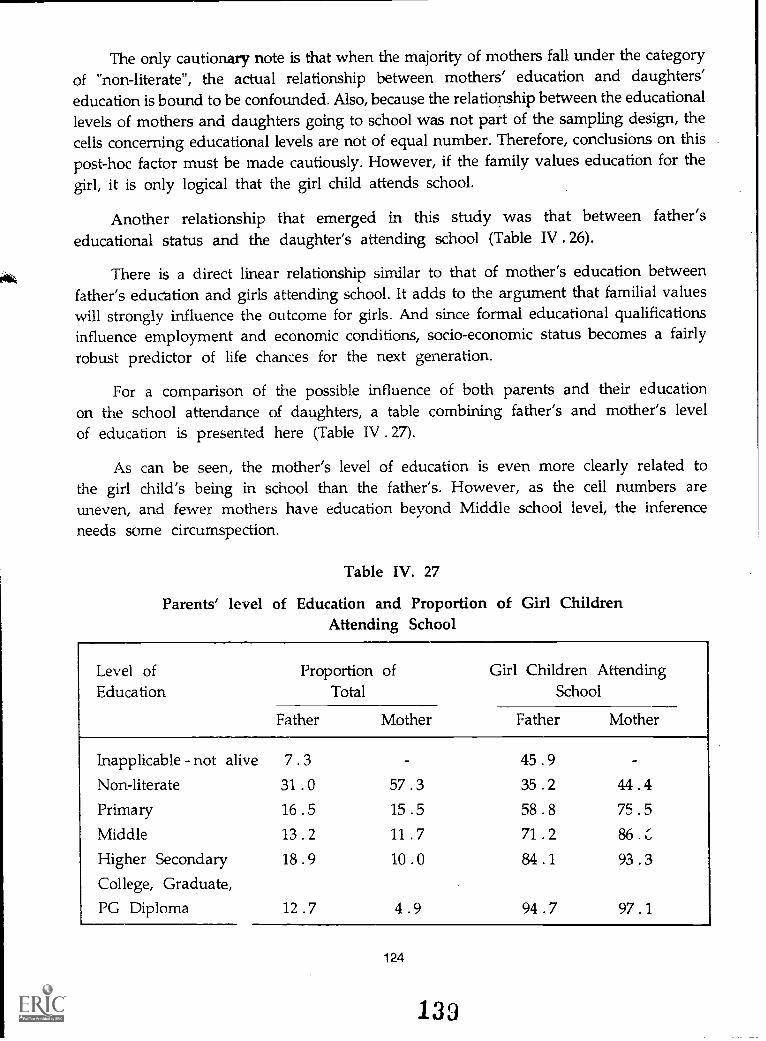
The only cautionary note is that when the majority of mothers fall under the categoryof "non-literate", the actual relationship between mothers' education and daughters'education is bound to be confounded. Also, because the relationship between theeducationallevels of mothers and daughters going to school was not part of the sampling design, thecells concerning educational levels are not of equal number. Therefore, conclusions on this
post-hoc factor must be made cautiously. However, if the family values education for thegirl, it is only logical that the girl child attends school.
Another relationship that emerged in this study was that between father'seducational status and the daughter's attending school (Table IV . 26).
There is a direct linear relationship similar to that of mother's education betweenfather's education and girls attending school. It adds to the argument that familial valueswill strongly influence the outcome for girls. And since formal educational qualificationsinfluence employment and economic conditions, socio-economic status becomes a fairlyrobust predictor of life chances for the next generation.
For a comparison of the possible influence of both parents and their educationon the school attendance of daughters, a table combining father's and mother's levelof education is presented here (Table IV . 27).
As can be seen, the mother's level of education is even more clearly related tothe girl child's being in school than the father's. However, as the cell numbers areuneven, and fewer mothers have education beyond Middle school level, the inferenceneeds some circumspection.
Table IV. 27
Parents' level of Education and Proportion of Girl ChildrenAttending School
Level ofEducation
Proportion ofTotal
Girl Children AttendingSchool
Father Mother Father Mother
Inapplicable not alive 7 . 3 45 .9
Non-literate 31 .0 57 .3 35 .2 44.4Primary 16 .5 15 .5 58.8 75 .5
Middle 13 .2 11 . 7 71 .2 86 .
Higher Secondary 18.9 10 .0 84.1 93.3College, Graduate,PG Diploma 12.7 4 . 9 94.7 97.1
124
133

The higher the occupational level of the father, the larger the percentage of daughtersattending school. For instance, 95.5% of the daughters of professionals are in school, whileonly 38.4% of the daughters of agricultural labourers attend school (Table IV . 28).
This is an unequivocal instance of socio-economic status outweighing all othersin the opportunity structure for children.
The tables depicting the relationship between father's occupation and percentageof girls in school (Table IV . 28) and between household income and percentage of girlsattending school (Table IV . 29) are a self-evident commentary on the socio-economicstatus variables that are antecedent to sending a girl to school. It is a direct linearrelationship and leaves one in no doubt about the clustering of factors that contributesto the holding back of girl children from even the first beginnings of euucation.
Table IV. 28
Father's Occupation and Proportion of Girls in School
OccupationProportion of
Total inPercentage
Girls AttendingSchool
No specific occupation 1 . 3 55 .4
Senior Professionals 3 . 2 95 .5
Junior Professionals 5 . 0 89.2Other White Collar 5 . 7 86.7Service-unspecified 7 . 8 82.8Skilled workers 9 . 1 65.0Unskilled workers 10.3 50.7Big farmers 2 . 7 58.6Medium size farmers 3 . 7 61 .0Marginal farmers 8 . 2 43 .6Farmers (land size unspecified) 5 . 6 53.6Domestic workers 1 .4 49.7Agricultural labourers 10.1 38 .4Large and medium size business 4 . 6 84.1Petty business 6 . 0 58.5Other similar occupations 2 . 5 46.7Home-based activity 2 . 4 71 .3
Any other 3 . 3 69.2
125 1,10

The traditional triad of socio-economic status: income, education and occupation
are once again seen to cluster predictably. This is well supported by observation. Itmust be noted that this study covers empirical data based on families from differentparts of the country. Thus the quantitative data have relevance for the country as awhole and should serve as baseline data for policy interventions.
Table I V.29
Household Income and School Attendance of Girls
Household Income Proportion ofTotal
Percent Girls AttendingSchool
Less than Rs. 300 6 . 0 60
Rs. 300-500 9 . 4 52
Rs. 500-750 12.9 48
Rs. 750-1000 17.7 55
Rs. 1000-1500 17.6 60
Rs. 1500-3000 22.8 70
Rs. 3000-5000 9 . 9 85
Family structure and school attendance (or non-attendance or dropping out) donot appear to be related. Of the families in our study, 72.4% are nuclear in structure.Only in the case of the joint family do the figures of school attendance dip a littleand the numbers "never in school" increase slightly. But since the numbers of nuclearand joint families are vastly different, any conclusion on this basis would have to bedrawn very carefully. That there is no relationship between the family's nuclear or jointstructure and the girl child's going to school is the more acceptable inference.
We know that family size (number of children and other dependents) is intrinsicto socio-economic status. We also know that people living on the margin of subsistencetend to increase the labour power within the family by having more children.
Table IV . 30
Birth Order of the Girl Child among living Girl Childrenand School Attendance
Birth Order Proportion Attending School
First 65 .4 63 .7
Second 20.4 58.6Third 8 . 1 55 .1
Fourth 3 .3 51 .7
126
141

Does birth order make a difference to the access to school and continuity ofschooling? In this sample, there was a total of 65 . 4% first born girls. Of these, 63 .7%are in school. Of second born girls, the sample has 20 . 2% and among these 58 . 6%are in school. Among the 8 . 1% third bores, 55% are attending school (Table IV . 30).
Birth order is naturally related to family size. In a small family with two children,where there are no third-borns, both children are likely to get some schooling. Birthorder among girls does make a slight difference to the girl child's school attendance.
Clearly all other things being equal, the first born daughter has an edge over girlsborn later, in access to schooling. Birth order data of this kind lend support to theargument that poverty compounds the gender discrimination in the family.
It is well known that one of the major deterrents to a girl child continuing her. schooling, is her involvement with and responsibility for household fasks. A study ofall the household tasks that girls have to do in order of priority, in terms of timespent by the girls, reveals the following order:
a) Cooking b) Cattle Care c) Child Care d) Cleaning e) Fetching water f) FetchingFodder g) Marketing.
These tasks are not mutually exclusive but overlapping categories. Of the 8.6%who have fetching water as a duty, 80% are in school. Of the 13.4% whose dutiesinclude tending to cattle, 74% are in school. Of those looking after young children,only 61 .4% are in school. Child care thus seems to be a pervasive demand on thegirl children's time and therefore of their access to education.
Different reasons were mentioned by the girl children for liking school (Table IV . 31).
Table IV. 31
Reasons for Liking School
Reasons for Liking School Percentage
Improves knowledge/skill ability' 25.3Sociability and friendship 16.6Employment prospects 8 . 5
Good Teachers/good environment 5 . 6
Did not like school 4 . 5
Inapplicable/reason not given 26.6
A quarter of the entire sample (25 . 3%) stated that schooling improved knowledgeand skill, while 16 . 5% of the respondents stated that they liked school, because itpromotes sociability and friendship. The improvement of 'mployment prospects wasmentioned by 8 .5% of the entire sample, as the reason for wishing to be in school.
127 142

It was unfamiliar to the girls to be asked why they disliked school even the
girls who had discontinued would not answer the question. So the large majority of93% of girls fell into the category of "inapplicable".
Table IV. 32
Dislike of School by Girl Children
Reasons for Disliking School Percentage
Inapplicable - like school,never went to schoolTeacher related factors - Harsh orstrict, discipline
Personal factors - Ill health, Lowself - image
No specific reason/D.K.
92.8
1 . 2
1 .0
1 . 2
Only 1 . 2% of the girls complained that they disliked school because of harshteachers and strict discipline. Personal factors like ill health and low self image werementioned by 1 .0% of the girls (Table IV . 32).
In 14 . 2% of the total, a tutor is available to help the girl with her school studiesand homework and in 27% of the cases, parents and other relatives assist. (Table IV . 33).
Sometimes a neighbour or friend helps (5 . 2%). But the girl is left to do the homeworkby herself in about 30% of the cases. The mothers' statements are closely parallel and
are introduced here to illustrate the consonance in views across generations.
Table IV. 33
Help in Studies for the Girl Child
Help in Studies Mothers' view Girls' view
Studies on her own 26.2 29 .8
Tutor 13.9 14.2
Father 9 . 0 9 .4
Mother 4 . 8 3.5
Both Parents 3 . 9 4 . 5
Brother 10.1
Others (Friends and Neighbours) 13. 6 5 . 2
128
143

How are future aspirations linked to school attendance? About 25% of girls arenot decided. Of them, 48% attend school. Wanting only to be good housewives ismentioned by 15% of whom 25% attend school. Among those who wish to becometeachers or take up other jobs 86% and 74% respectively are in school (Table IV . 34).
Table IV. 34
Future Aspirations and School Attendance
Future Aspiration % of response Attending Dropout Never in School
Doctor 8.2 95.4 3.2 1.4Teacher / Lecturer 19.9 86.1 9.9 3.9Officer 4.0 94.8 4.4 0.8Some service 9.6 73.5 16.0 10.5Skilled job 2.6 31.3 22.5 46.2Self employed 2.6 31.3 22.5 46.2Be well educated 4.1 73.7 16.3 10.1Good Housewife 14.9 24.7 31.5 43.8Any other 2.9 71.0 19.7 9.3Not yet decided 25.7 48.1 18.2 33.6N.A. 3.4 49.8 16.5 33.7
When girls mention their future aspirations it frequently turns out to be what theywish they could be, rather than what they can aspire to actually. For instance 13%of girls in school say they want to be a doctor. Given all the other variables, it seemsfairly unlikely that such a proportion of the girls have the school setting, academicachievement or support structures in the family to qualify for admission to a medicalcourse. The reason given for such ambition was a) wanting to serve society/the nationand b) for personal fulfilment and satisfaction.
Being a teacher was the stated aspiration of 28% of the girls attending school.Personal satisfaction was the most important reason for wanting to be a teacher whilebeing self-reliant was next in order of importance; and "service", meaning any kindof job, was the aspiration of about 11% of the girls in school. Self-reliance was thusthe most important factor. There is also a certain element of social acceptability in theanswers. For instance, being a teacher is so clearly a socially accepted aspiration, thateven 11% of the dropouts say they aspire to be teachers.
There is no very clear pattern in the occupational aspirations of girls from differentareas. However, it is impossible to overlook the fact that 71 .5% of the girls in Varanasiwish to be good housewives, while only 3 . 3% of the girls in Kerala state this as an ambition.
129
144

Table IV. 35
Aspirations of the Girl Child : Selected Samples
Location ofCentre
Doctor/Nurse
Teacher/Service
Good House-Wife
Anyother
No responseUnsure
West BengalCalcutta 27.8 18.0 14.2 25.5 14.5
KarnatakaMysore 8 . 3 42.2 25.9 3 . 8 19.4
KeralaTrivandrum 9 . 6 42.4 3 . 3 5 . 1 39.4
MaharashtraBombay (1) 15.0 25.3 30.2 16.4 13.1Pune 20.1 43.4 16.7 13.0 6 . 4
Uttar PradeshEasternVaranasi 6 . 2 5 . 1 71.5 3 . 5 13.5
What do mothers aspire for their daughters to become? To be housewives! Theresponse, "Nothing other than marriage" is given by 36 . 4% of the mothers. "Any kindof job" is stated by 22% of those mothers whose daughters are in school. About halfthe group of mothers who wish nothing more than marriage for their daughters' future,send their girls to school.
Looking through these responses it becomes apparent that some mothers were alsoresponding to what would ideally be their daughter's future. In other words, theiraspirations for their daughters did not always tally with whether the children were inschool, had dropped out, or never attended. There is a general value for education andschooling is recognized as helping to acquire basic literacy and numeracy.
Parents who consider the marriage of their daughter as the main goal of her lifeare less likely to send her to school for the entire period of secondary schooling. Forinstance, mothers who say that the ideal age of marriage is 15 years (and about 16 . 7%of mothers do so) do not consider the girl's education important; half of them havedaughters who have never been to school and only one-third of these mothers sendtheir girls to school.
What is most appreciated in a girl? What are the traits in the mother's view ofa "good girl", a girl to be admired and emulated? About 16% of all mothers thinkthat the girl must have an education. The large majority puts more emphasis on goodnature, good behaviour and being good in household skills. Modesty, obedience,
130

industriousness and sharing family responsibility are the most frequently mentionedcharacteristics of a good girl. Of the mothers who value the girls' education, 80% seemto have ensured that she attends school. In the families of 82% mothers who valuegood nature and quiet behaviour. 59% of the girls are attending school. It appears thatsome mothers feel that school attendance is not conducive to the development ofsubmissive "feminine" behaviour.
Table IV. 36
Mother's Views on Girl Children going to School and School Attendance
Mother's Views % ofresponse
School AttendanceAttending Dropped out Never Attended
For mental growthdevelopment 38.5 77.9 12.9 9 . 1
Only if absolutelynecessary 32 . 8 52.4 19.0 28.5Should not go out/not safe/socialrestrictions 23.1 49.3 20 .8 29.9Important to earn/be self-sufficient 3 . 3 55.4 23.8 20.3
In tracing the antecedents of girl children attending school, one naturally soughtthe view of the mothers. They were asked what they felt if the child had to goout for education or employment. When mothers said that it was for the girl's mentalgrowth and development (which 38 . 5% of the mothers did), about 80% of theirdaughters attended school (Table IV.36). In this category, there were only 9% whohad never attended school and about 12% who dropped out. When mothers saidthat girls should go out of the house only when absolutely necessary (and about33% said so), only 52% of their daughters attended school and 28 . 5% had neverattended. Those mothers who worried about the safety of their girls or about socialapproval had a very similar pattern of daughters' school attendance. That it isimportant to earn money and be self sufficient was the view of mothers whosedaughters would take up jobs, but the proportion of the total was only 3 . 3%.Clearly, mothers tend to be consistent in how they feel and what they do vis-a-vistheir girl children's education. However one must not overlook the point that evenwhen the mothers were least keen about their daughters' education, about half ofthe daughters managed to go to school. Therefore the mother's views are importantbut do not become a sufficient condition.
131
146

Table IV. 37
Person deciding on Schooling and School Attendance of Girl Children
Mother's Views `)/0 of
response
School Attendance
Attending Dropped out Never Attended
Mother
Father
Both ParentsGirl Child (Self)Others
9 . 7
33.139.7
0 . 4
11.7
58.2 22.5 19.2
58 .3 19 .3 22 .4
71 .5 14.8 13.7
63.3 16.3 20.459.1 15.5 25.4
Table IV. 38Mother's view on Girl's level of Education
Ideal level of Educationfor the Girl : Percentageof mothers
Attending Dropout Never Attended
No use educating girls(7 . 8) 16.0 14.6 69.5
Primary(7 . 5) 29.3 20.5 50.2
Middle(10 . 8) 42.1 24.7 33.2
High School(24 . 7) 62.7 23.3 14.0
Graduation(10 . 5) 85.6 10.3 4 . 1
P.G /Diploma(4 .3) 86.9 9 . 0 4 . 1
As far as they want(29 . 3) 78.5 13.1 8 . 4
When both parents are convinced about the importance of the girl child's education,there is a much better chance of the girl child being sent to school, than if only one parentdecided (Table IV. 37). The figures of dropouts and children never attending reflect the same
132
14 1

finding. A miniscule proportion of girls (0 . 4%) say that they themselves decided - andthe lack of their autonomy is obvious. This table is made out from the perception ofmothers and must be seen in that context.
Upto which class should a daughter attend school? When mothers say that thereis no use educating a daughter, which they do in 7 . 8% (940 girls) of the total sample,their lack of confidence in education is reflected in their behaviour (Table IV . 38).
Almost 70% of the daughters of this lot never attended school. Some mothers(29 .3% of the whole) say that their daughters should study "as far as they want"and 78% of their daughters are in school. For the rest, there is a linear relationshipbetween the level aimed for and the proportion in school - moving up from 29% to86% as the aspired education level goes up. The converse can also be seen, with thosenever attending and those dropping out (Table IV . 38).
How does one get at genuine motivation, while filling up a fairly factual ques-tionnaire? Fortunately, it is possible as there are some questions which will revealmotivational aspects as well. For instance, the mothers were asked whether they spentsome time with their children, when they were doing school homework. About 62 . 5%of the mothers said that they spent no time helping with either their son's or theirdaughter's homework. About 10 . 9% mothers said they helped both. Considering thatthe large proportion of mothers in this sample were either not literate or barely literate,their spending time with the child's educational tasks was probably only of marginalconsequence. Nevertheless emotional support is implied in the act and the keennessof mothers that their children should do well in school comes through.
When asked upto what level boys and girls should receive education - the girl'sanswers show that they make no gender difference on the whole. The difference ismarginal with a slight edge for boys (Table IV . 39).
Table IV. 39
Ideal level of Education for Girls and Boys : View of the Girl Child
Level of Education For Girls For Boys
High School 26.7 21 .4Graduation 31 .4 35 .3
PG or Professional 21.0 24.0Not specific/as far as they can go 11 .4 12.3
This table seen in conjunction with the class in which girl children have droppedout seems to enhance the sense of dismay. Ideally, says the girl child, a girl should
133
146

14J
Tab
le I
V. 4
0
Idea
l Lev
el o
f E
duca
tion
desi
red
by th
e G
irl C
hild
:Se
lect
ed S
ampl
es
Loc
atio
nof
Cen
tre
Prim
ary
Mid
dle
Hig
hSc
hool
Inte
rM
atri
cula
tion
Gra
duat
ion
Post
Gra
duat
ePr
ofes
sion
al
Dip
lom
a/V
ocat
iona
lA
s fa
r as
they
can
/w
ant
Not
sur
e/do
nt k
now
And
hra
Prad
esh
Coa
stal
16 .3
48.1
35.5
Wes
t Ben
gal
Cal
cutta
2.8
6.8
19.6
25.6
16 .8
2.3
18.8
7.3
Del
hi &
(U
.P)
1 .4
10.7
38 .0
15.4
13. 8
20.1
Guj
arat
Ahm
edab
ad19
.021
.022
.317
.720
.0B
arod
a6
.2
9.4
25.1
21.8
10 .2
0.4
10.9
16.0
Kar
nata
ka
Mys
ore
26.1
50.3
23 .5
Ker
ala
Tri
vand
rum
0.2
0.5
25.0
31.5
22.7
3.2
16.8
Mah
aras
htra
Bom
bay
(1)
16.3
49.0
23.3
11.4
Bom
bay
(2)
5.7
30 .0
32.5
18.3
13.5
Pune
4.0
36.1
24.6
10.2
18 .3
6.5
Ori
ssa
Ber
ham
pur
0.5
3.0
20.8
16.0
10.2
2.0
13.0
34.5

have at least a high school education (26 .7% of the girls). And 31 .4% of the girlssay that graduation with a College or University . degree is ideal. The girls feel thatlloys should have a slightly higher level of education, but this is only a marginaldifference.
Between the ideal and the actual lies the shadow. And this shadow is long anddense. In other words, the girl children in our study are very far from realising theirideal level of education. Many of them in poverty groups will become the unpaidbonded labour of the family to be transferred to another family at the time of marriage,with some &munition in status, if at all there is a change.
When one asks the girl child how far she wishes to study or whatlevel of education she desires, the responses may reflect a) wishful thinkingb) realistic ambition or c) social stereotype. Therefore the level mentioned by the girlcannot be in itself an indication of her real status. For instance, in the Coastal A.P.sample, 48% of the girls mention graduation as tie goal, while another 35% saythat the girl should have a professional or post-graduate degree. However, inactuality 50% of the sample were not attending school, and 25% had dropped out.It does seem unrealistic for 83% of them to desire University education. The all Indiadropout rate for girls from Class I - V is 49 .7 and from Class I - VIII is 68 . 3%. Thatsays it all.
Some groups rave reported responses with a greater degree of realism as in theWest Bengal sample. However, in almost all the samples the ideal level of educationwas far higher than any they could hoFe to achieve. In that sense, the difference canbe taken as an indication of how the girls themselves realise that their life chancesare far from ideal. The "not sure - don't know" category also operates as an escapehatch for those unwilling to commit themselves to any statement, or for those whosedecisions are not in their own control (Table IV. 40).
If there is no clear pattern emerging (no relationship between ideal and actuallevel or between ideal level and adult literacy level) it is probably because the responseto an "ideal" was not considered necessary to be anchored to reality.
Gender Differences
Seventy one percent of all the girls say that boys and girls should have equaleducation. Of these 70% are in school.
Out of the 7 . 6% who say boys need more education as they look after the family,45.6% are in school. Clearly girls' attitudes of gender equality also result in using theeducational system to their own advantage. Conversely, girls who attend school alsobegin to see education as a right for all children. They seem less likely to voice astereotype and more likely to speak for their rights.
135
15i

."` ., I ,
A1 1
11114''
1/411s ...,.,_
*3:
Y-7i
fey...1%4
rt
e
111-k.
136 BEST COPY AVAILABLE152

Table IV. 41
Advantages of Education
Advantage Percent
No advantage at all 3.2
Helps in personal development /self confidence/better communication/ability /good manners 49.9Improves skills /competence 12 .7
Improves chances of getting employment/career advancement 18. 4
Improves social status /recognition 4 . 1
Better marriage prospects 0 . 7
Reduction in dowry 0 . 3
Plays educative role (in health, child care etc.) 2 . 0
Any other 3 . 4
N.A. 5 . 2
When asked about the advantage of education, a majority (50%) of the girls saythat education gives self-confidence and better communication ability. About 19% feelthat education would give them a better chance to get employment. Another 4% saythat education improves social status and recognition while only 2% feel that educationhelps for daily living (health, child care etc.) (Table IV . 41).
What are the disadvantages of illiteracy? We asked the girls and found a smallpercentage (3 . 6%) saying that there was no disadvantage. Of these, 66% had neverbeen to school and only 19% were attending school. The largest response category(50 . 6%) was that illiteracy results in a low self-image. Another 12 . 6% said that itleads to lower social status and 11 .7% that it would yield fewer job opportunities.
The question about whether anyone benefited from educational programmes wasmisunderstood because even of the 35% who said they did not benefit, 42% wereattending school. Similarly, in the urban sample, 42% said they did not benefit but66% of them were in school. It is obvious that parents and children who have accessto a Government school in the locality feel it is a right to have education and donot treat it particularly as a benefit. "Benefit" they would define as something special.
137
153

Chapter V
HEALTH
LIST OF TABLES
Table Number Particulars Page No.
1 Mothers and Number of Living Children 141
2 Birth Order of the Girl Child among Living Girl Children 142
3 Mother's Age at First Pregnancy 143
4 Mother's Health Checks during Pregnancy 145
5 Anti-Tetanus Serum (A'IsS) taken by Mother 145
6 Children's Immunization 146
7 Place of Immunization 147
8 Girl Child's Knowledge of Immunization 147
9 Level of Father's Education and Immunization of Girl Child 148
10 Duration of Breastfeeding of Girl Child 149
11 Age at which Milk Supplement was Given 150
12 Age at which Cereals were Given 150
13 Food at Main Meals 151
14 Food in-between Meals 152
15 Main Meals taken by Boys and Girls 152
16 Food in-between Meals taken by Boys and Girls 153
17 Frequency / Inadequacy 153
18 Gender Difference in Food Items 154
19 Reasons Girls denied Food Items 154
20 Lunch served at School / Work 155
21 Carrying Lunch to School / Place of Work 155
22 Gender Difference : Food kept 156
23 Who eats First in the Family :Girl Child's and Mother's Perspectives 156
24 Who eats Last in the Family :Girl Child's and Mother's Perspectives 157
25 Place Boys and Girls are Treated 158
26 Method of Medical Treatment - Boys and Girls 159
138
154

Table Number Particulars Page Number
27 General Appearance : Type of skin 160
28 Lice in Hair 160
29 Hair Colour 160
30 Hair Condition 161
31 Condition Hands, Nails, Feet 161
32 Glow in Eyes 162
33 Activity 162
34 Cheerfulness 162
139

LIST OF DIAGRAMS
Chart Number Particulars Page Number
1 Mothers and Number of Living Children 142
2 Birth Order of the Girl Child among Living Girl Children 143
3 Mother's Age at First Pregnancy 144
4 Level of Father's Education and Types of Immunization 148
140
156

Chapter V
HEALTH
Introduction
The problem of health is a continuing one for the girl child. The lack of adequatefood and nutrition in infancy, the neglect of immunization of children at the stipulatedtime and intervals and the unavailability of timely medical treatment have been widelyobserved and documented in India. Many women have depletion due to frequentpregnancies, ailments which result from under-nutrition and overwork. Girls are seen tohave low weight, stunted growth and delayed physical development. Aside fromaffecting the general health status of the female child, this also leads to a high femalemortality rate during pregnancy and childbirth, and to the newborn child being at risk.
The table below presents mothers in this sample and the number of living childrenthat they have.
Table V .1
Mothers and Number of Living Children
No. of Living Children Percentage of Mothers
One 3 . 3
Two 16.0Three 26.8Four 23.1Five 14.4Six 7 . 4
Seven 3 . 7
Eight 1 .9
N.A. 3 . 4
From the above table V . I we see that almost 50% of the mothers have between3 and 4 children. About 20% have fewer than two children, 14 . 4% have five childrenand about 13% have six or more children. It is thus obvious that the highlypublicised two child norm has not been adopted by the average family and that thehope of achieving zero population growth in the overall population of India isstill distant.
141
157

HL1. MOTHERS AND NUMBER OF LIVING CHILDREN
The table V . 2 below shows that two-thirds of the girls in the sample werefirst born and one-fifth were second born. The percentages of third andfourth born are considerably smaller. That more than 85% of the entire samplefell in the first two birth orders is a statistic of some importance, open tointerpretation.
Table V . 2
Birth Order of the Girl Child among Living Girl Children
Birth Order Percentage
First 65.4
Second 20 .4
Third 8 . 1
Fourth 3 . 3
N.A. 2 . 8
142
158

10%
First Born Second Born Third Born Fourth Born
Birth Order
HL2. BIRTH ORDER OF THE GIRL CHILD AMONG LIVING GIRL CHILDREN
Table V . 3
Mother's Age at First Pregnancy
Mother's Age at
First Pregnancy
Percentage Mother's Age at
First Pregnancy
Percentage
12 years 0 . 2 22 years 5 . 1
13 years 0 . 8 23 years 3 . 7
14 years 3 . 0 24 years 2 . 7
15 years 7 . 5 25 years 2 . 5
16 years 10.7 26 years 1 .4
17 years 13.1 27 years 0 . 9
18 years 14.1 28 years 0 . 6
19 years 9 . 6 29 years 0 . 3
20 years 13.3 30 years 0 . 4
21 years 7 . 1 N.A. 3 . 0
143
159

As. per the definition of an adult as one who is above the age of eighteen,it is evident that nearly 35% of the mothers were pregnant with their firstchild before reaching adult status. Early child bearing tends to have an adverse effecton the health and general well being of the mothers. Further, the immaturity ofthe mother can also result in the birth of an at-risk infant. Thus the mother's ageat the first pregnancy is a predictor of the health of the child. However in thesefamilies, the mother's age at the birth of the girl child under question was notspecifically ascertained.
Pregnant women from deprived or under-privileged families do not receiveadequate nutritional supplements and the result is poor health for themothers with the consequence of having infants who are low in birthweight, physically underdeveloped and particularly prone to infections. Simplepreventive interventions like the administration of Anti Tetanus Vaccine (ATS)to the pregnant mother are lacking in many cases. Though it is widely knov, thatmothers who do not receive any antenatal care incur a significantly higher risk forthe infant than those who receive such care, this message has not reached people atthe grass roots.
I4111F
"74:11111". I -r r -r i i :11-11111111114-r-49-,47gggIggrninigrnIE, , , , , .- - - Lo - - " - a ,,,... q n gi. A 4 4 ir,i R
Mothers Age at first Pregnancy
144
160

Status of Mothers during Pregnancy
A number of factors related to the health of the mother during pregnancy wereinvestigated. Whether they reported for regular health checks or not constituted animportant question.
Table V . 4
Mother's Health Checks during Pregnancy
Health Check up Percentage
Regular check up for all pregnanciesRegular check up for some pregnanciesCheck ups taken whenever necessaryNo health checks takenN . A./Mothers did not respond
31.23 . 4
11.62 . 2
51.6
A significant portion of the sample (51 . 6%) fell into the category 'did not respond/NA.' However, about 31% of the expecting mothers did go for a regular check up andabout 15% were a little. more casual, getting attended to occasionally or only when necessary.
Table V . 5 reveals that about 54% of the mothers had never taken an ATS while34 . 6% had taken all the required doses for all pregnancies. This is a reflection ofmaternal health facilities available to ordinary citizens in the last two decades, and alsoperhaps of their confidence in the health, care system.
Table V . 5
Anti - Tetanus Serum (ATS) taken by Mother
ATS Taken by Mother Percentage
All doses for all pregnanciesSometimes for some pregnancies
_ -
ATS never takenN.A. Mothers did not respond
34.69 . 0
54.22 . 2
Immunization : Mother's View
Immunization of children against preventable diseases has become acceptaole to alarge majority of families. However, on finding out that almost 70% of the mothers hadgiven some immunization to their girl children in infancy, some probing was done for moredetails.
145 ICI.

Mothers were not too clear on the several immunization shots to be givenand about their own role in the prevention of specific diseases. There weresome women who had a general idea that immunization shots preventdisease, but anything more specific was known only in rare cases.For many mothers, the process of inoculation seemed to mean a singlepoint of intervention. For instance, if the child had been given the BCG vaccine,the mothers were often unaware that he/she also needed to be given othervaccines for eg. against measles. Many of the mothers had no knowledge ofbooster doses either.
The table illustrates the number of mothers who had immunized their children,
availing themselves of the standard immunizations against tuberculosis,diphtheria-pertussis-tetanus, polio and measles. There was no gender discrimination in
immunization.
Table V . 6
Children's Immunizations
Number of Children BCG DPT/Polio Measles
All children 51 .1 50.1 43 .4
None 30.8 31 .0 39.3
Some boys and some girls 15.9 16.6 15.0
N.A. 2 . 2 2.3 2.3
As can be seen in the above table (V . 6) a little over 50% of thechildren had been immunized against tuberculosis with BCG and against DPT andPolio, while 43% had been immunized against measles. The number of children whohad not been given BCG immunization or DPT/Polio were a little over 30% and 39%of the children had not received immunization against measles.
The mothers were also asked where they took their children to beimmunized. The proportions of mothers using different centres are presented inthe table that follows (V . 7).
It can be seen that the hospital was where 33 .7% of the mothers had their childrenimmunized, followed by the Primary Health Centre where 13 . 7% had gone, while
10 . 2% of them went to private clinics and doctors.
146
162

Table V . 7
Place of Immunization
Place of Immunization Percentage
Dispensary
HospitalPrivate Clinic/Doctor
PHC
Not immunized/N.A.
5.833.710.213.736 .6
Table V . 8
Girl Child's Knowledge of Immunization
Immunization Percentage
Yes 68.9No 30.6N.A. 0.5
There was no apparent discrimination between girls and boys on thepart of mothers for getting them immunized. Some mothers in the samplewere aware of the benefits of immunization. A majority knew that it wouldprevent some illness or disease. Some considered immunization to be importantbut were unaware of the reason. Not only lack of awareness, but the lack ofnecessary facilities is also a major constraint to the full immunization coverageof children. Even the mothers of girl children who had been immunized werefound to be unaware of the need for specific immunizations, the dosages andtime schedules. For many mothers, the process of inoculation was notalways clear and to most, the rationale for a variety of protective shotswas not apparent. The mothers of girl children who were not immunizedcould give no rea,-,on for their negligence or oversight. There were manyfamilies who were not even aware of the importance of immunization in the healthof their children.
The girl children were asked whether they knew about immunizationand 68 .9% of them did have some knowledge while 30 . 6% did not knowabout immunization (V . 8). From their responses, it also became clear that both boysand girls were immunized (or neglected) and that gender had no relationship toimmunization.
147
1G3

Immunization: Relationship to Father's Education
Table V . 9
Level of Father's Education and Immunization of Girl Child
Father's Education Proportion of Sample Percentage Immunized
Non-literate
Primary
Middle
Higher Secondary
College No Degree
Graduate
Post Graduate
Tech./Professional
N.A.
31
17
13
19
3
6
2
7
48
57
64
75
81
85
84
89
50
HL4. LEVEL OF FATHER'S EDUCATION AND TYPES OF IMMUNIZATION
148
164

A direct correlation was found between the level of the father's education andthe number of girls who had been immunized. It was found that as the level of thefat''er's education increased, so did the proportion of girl children immunized in theirrespective families.
From 48% immunization among the daughters of non-literate fathers, theproportion went up to 89% of fathers who were professional or had technicalqualifications. When fathers had received higher secondary education, 75%of their daughters were immunized. This linear relationship is at once acomment on parental attitudes to preventable diseases and their access toimmunization facilities.
Nutrition and Health Treatment of the Girl Child
Nutrition in the early years is a crucial input for the general health and well beingfor a lifetime. The tables below depict the patterns of breast-feeding and the introductionof cereal food in the infant's diet.
It can be seen from the Table V . 10 that about 27% of the mothers breastfeedtheir girl children for less than a year while nearly 49% do it for more than a yearand about 20% breastfeed them for more than two years.
Some reasons that are stated by mothers for stopping breast feeding are as follows:- Did not have enough milk- Another pregnancy started- Death of the infant.
Table V .10
Duration of Breast Feeding of Girl Child
Duration of Breast feeding Percentage
Less than 1 month 0.8Less than 3 months 2 . 0Less than 6 months 4 . 2Less than 1 year 20 .6Less than 11/2 years (18 months) 26 .1Less than 2 years 22.8tvfore than 2 years 19 .6Do not remember 0.3No Feeding 1.3N.A.
2 . 3
149165

The reasons given by mothers for continuing to breastfeed their children for anextended period of time were as follows:
- It was economicalIt was the purest form of nutrition available
- There was no other milk/food available- Child could not be weaned from breast milk and so it was continued
- An emotional bond is formed with the child while breastfeeding.
Information about the child's age when milk supplements were givenwas also collected. Almost 24% of the sample mothers introduced milk supplementbefore the first year of the child, while about 45% of them did so after the first year.About 29% said that they never supplemented breast milk (Table V . 11).
Table V .11
Age at which Milk Supplement was given
Age at which Milk Supplement was given Percentage
After 3 monthsAfter 6 monthsAfter 10 monthsAfter 1 yearAfter 18 monthsNever supplemented with other milkN.A.
3.84.4
15.524.819.528.33.7
From Table V . 12 which follows we can see that the pattern of giving cereal food
to the infant was parallel to the milk supplement. About 45% of the mothers introducedcereals before the child was a year old and 27 . 5% did so after the first year. About24% of the mothers introduced cereals after the child was 18 months old
Table V .12
Age at which Cereals were Given
Age at which Cereals were Given Percentage
After 3 months 4 . 5
After 6 months 31 .6
After 10 months 9 . 2
After 1 year 27.5
After 18 months 24.0
N.A. 3 . 2
150
1G6

The project teams tried to find out if there were any differential trendsin the health and nutritional status of the males and females in the family. Theproblem of nutrition is essentially linked to poverty, but for women theproblem is further compounded by gender discrimination. Paradoxically, womenare the chief nutritionists, being responsible- for all the food cooked at home;yet they take a lower share for themselves and their daughters. Frequentlythey are the last to eat, which means doing with what is left over. The earlierchapter on Socialization covers some of this in detail. In the tables below,both the mother and the girl child were asked about the eating patterns followed intheir households.
Cereals and pulses appear to be the staple foods in the diets of the girlsin this study. Only 6% of the girls said that their main meals consisted ofcereals only, without any vegetables or pulses. Of the rest, the majority(around 49%) said their meals consisted of cereals, vegetables and pulses.About 14% ate only cereals and pulses. Around 10% had milk or eggs (V . 13).It is likely that girls in these latter two categories were from the urban areas,or the middle SES. Only a very small percentage (around 4%) had access tofruit and sweets in addition to the staples. The data appear to be normallydistributed, and a true reflection of the various socio-economic categories inthis sample.
Tables V . 13
Food at Main Meals
Main Meals Percentage
Only cereals (rice, chapati etc.) without anyvegetables or pulses 5 . 9
Cereals and pulses 13.7Cereals, Vegetables and pulses 48.8Cereals, Vegetables, pulses and milk/egg 9 . 7
Cereals, Vegetables, pulses and meat/fish 14.2Cereals, Vegetables, pulses and meat/fish and milk 3 . 0
Cereals, Vegetables, pulses and fruit, sweets 1 .1
Cereals, Vegetables, pulses and fruit, meat/fish sweets 3 . 3
N.A. 0 . 3
151
167

Table V .14
Food In-Between Meals
In-Between Meals Percentage
Nothing 14 .4
Only/tea/Coffee/Milk 18 .3
Only snacks /sweets 7 . 2
Tea/coffee with some snacks/sweets 21 .7
Milk with some snacks/sweets 3.4
Roasted nuts/cereals/pulses/other locally available items 18.1
Jaggery/candy/ice-cream 0.4
Any other 6.9
No fixed item in particular 8 . 3
N.A. 1 .3
Around 18% of the girls said they had only tea, coffee or milk between meals.An equal number stated that they ate roasted nuts, cereals or pulses, and about 22%
said that in addition to tea or coffee they had access to snacks or sweets. These
respondents however may well have been referring to the occasional availability of such
treats as sweets or roasted nuts, rather than the consumption of these items on a regular
basis (Table V . 14).
Only about 14% of the girls said they did not eat anything between meals. Perhaps
this figure is a little low in the context of the data on who eats first and who eats
Table V .15
Main Meals taken by Boys and Girls
Main Meals Percentage
One meal by boys and girls 0 . 2
Two meals by boys and girls 43.9
Three meals by boys and girls 52.8
One meal by girls and more by boys 0 . 3
Two meals by girls and three by boys 0 . 8
No fixed number of meals (boys and girls) 1 . 7
N.A. 0 . 3
152
1G

last in the family, which shows that when it comes to the apportioning of food, girlsarelowest on the priority list.
The information on the number of meals consumed by boys and girls follows.More than half the sample (53%) say that boys or girls, or both, have three mealsa day; but only 0 . 8% say that while boys have three meals, girls have only two. Nearly44% said that boys and girls consume two meals a day.
Table V .16
Food in-between Meals taken by Boys and Girls
In-Between Meals Percentage
Quite often by boys and girls 23.0Sometimes by boys and girls or both 35 .5
More often by boys than by girls 4 . 1
More often by girls than by boys 0 . 2
Never by either boys and girls 16 .3
No fixed pattern either by boys or girls 16.2N.A. 4 . 7
Food was "quite often" eaten between meals by 23% of boys and girls. Food was"sometimes" consumed or consumed in "no fixed pattern" by around 35 .5% of boysand girls. While 4% of respondents said food was consumed in-between meals moreoften by boys than by girls, about 16% said neither boys nor girls ever ate betweenmeals (V . 16).
These data support and explain the data given in (Table V . 14).
Table V .17
Frequency / Inadequacy
Percentage
Quite often 2 . 1
Sometimes 9 .0Rarely 11 . 2
Never 77.5N.A. 0 . 2
1531G9

When queried about the frequency or inadequacy of the food they received, anoverwhelming 77 . 5% of the girls said they had never felt that they had not had enoughto eat. Only around 2% said they felt this quite often; a further 9% said they sometimesfelt their food was inadequate, and around 11% said they rarely felt this way. Againthese data do not support the general belief on the subject that the majority of girlsin the family go hungry. Similarly, 90% of girls in the sample said that they werenever denied any particular food item and were not discriminated against when it cameto food (Table V .18).
Table V .18
Gender Difference Food Items
Food Items Percentage
Girls are denied /given less/not giventhe best of meat/fish/eggsGirls are denied /given less milk/milkproducts/sweetsGirls are denied /given less fruitsGirls are denied /given less butter/gheeGirls are denied /given less all the above itemsDenied nothing/not discriminatedN.A.
1 . 6
3 . 4
0.40 . 5
1 . 7
89.92 . 5
Table V .19
Reasons - Girls denied Food Items
Reasons Percentage
No specific reason 0 . 3
Considered harinful for girls 0 . 9
Boys are expected to do hard/more work 4 . I
Traditionally it has been like this I .8Will spoil looks/will make marriage difficult 0 . 2
Any other 0 . 7
Inapplicable - no discrimination/no boy in the family 91 .4
D.K. 0 .3
N.A. 0 .3
154
170

A large majority of girl children (89 . 9%) said that there was no gender discrimi-nation in food. Of the 9% or so of respondents, who stated that there was somediscrimination and that girls were denied some foods, nearly half (4 . 1%) felt that thereason for this was that boys worked harder, or did more work and therefore neededmore nutrition (Table V . 19). Nearly 2% gave "tradition" or custom as the reason forthis differentiation.
The girls in the study were asked whether they were served lunch at school orin their place of work. Nearly 28% of girls did not go to work or school, and sodid not come under this category (Table V. 20).
Around 65% said lunch was not provided, while 5% were given lunch at workor in school.
Table V . 20
Lunch Served at School / work
Lunch served Percentage
Yes - no further information 1 .9Yes - at school 5 . 1
Yes - at place of work 0 . 2
No 64.7Inapplicable do not go school/place of work 27.6N.A. 0 . 5
Table V . 21
Carrying Lunch to School / Place of Work
Carried Lunch Girls Boys
Yes 30.8 24.8No, lunch served at sichool/place of work 5 . 4 5 . 4No, come back home for lunch 18.4 20 .8No, do not carry lunch eventhough not served at school/place of work 9 . 7 9 . 6
No, no. further information 7 . 2 6 . 0
Inapplicable, Do not go school/work 28.6 33 .4
155 171

As shown in Table V. 21, 30 . 8% of the girls who were not served lunch carriedlunch with them; around 25% of boys did so. It is possible that both boys and girlseat their meals at home when they return from school or work, or that children workingin fields have their noon meal taken out to them. There is no apparent genderdiscrimination in this matter.
Respondents were asked whether there were any gender differences with regardto food kept at home for school children (V. 22). For around 34% the questions wereirrelevant because they either did not go to school or work, or ate lunch at school /work. Nearly half (45%) said that food was kept for both boys and girls. While around5% said that food was kept for boys only, around 10% said that food was kept for
girls only. These figures appear not to tally with data reported elsewhere in this study,since they appear to show a bias for the girl child.
Table V . 22
Gender Difference in Food Kept
Food Kept Percentage
For both boys and girls 44 .7
For boys only 4.6For girls only 9.4Neither for boys nor for girls 4.9Inapplicable - carry lunch or lunch served atschool/work place or do not go to school/work 34.2
N.A. 2 . 2
It must be remembered that since the sampling was purposive, and only the familywith a girl between seven and eighteen was included in the study, there is a problemregarding gender comparisons. In the case of the girl children in the sample, ti
proportion of boys to girls in these families was 9:10 i.e. there was a slightly smallernumber of male siblings, with whom some of the comparisons were made.
Table V . 23
Who Eats First in the Family : Girl Child's and Mother's Perspectives
Who Eats FirstPercentage
Girl Child Mother
Family eats togetherMale members/father/husband/childrenNo specific order/as situation demands
33.229.936.9
34.823 .941.3
156
172

From Table V. 23, we see the responses to the question "Who eats first?".About 1/3 of both girl children and their mothers say that the family eatstogether. About 30% of the girls and 24% of the mothers say that the men in thefamily eat first. The rest fall in the category of no specific order, or as thesituation demands.
Table V .24
Who Eats Last in the Family : Girl Child's and Mother's Perspectives
Who Eats LastPercentage
Girl Child Mother
Family eats together 23.8 36.7Girl child and other female members 36.7 33.9No specific order/as situation demands 39.5 29.4
The other side of the coin is found when the question of who eats last isasked. Table V. 24 depicts the responses. Here only about 24% of the girlchildren say that the family eats together while 36 . 7% of the mothers say so.It is clear that the girl child perceives the females in the family including herselfto be eating last in 36 . 7%. of the cases. The mother's responses to thatquestion is marginally lower. The order of eating is seen as morediscriminatory by girl children than by their mothers. From the two tables,it is unambiguous that males were never the last to eat and female membersnever the first.
Sex Differences in Health Treatment
Generally, ordinary ailments like coughs, colds, stomach disorders, allergies, bodypain and so on are treated at home. The team tried to analyze where the cases ofserious ailments such as cholera, typhoid, infection, TB etc. were treated and alsowhether there were any differential patterns of treatment for boys and girls.
In the case of 40% boys and 45% girls (Table V. 25) their parents took themto private practitioners. Fewer children used the local dispensary: 13 . 5% of the boysand 14 . 9% of the girls were taken to the dispensary for treatment. About 36% ofthe boys and 39% of the girls were taken to the hospitals for treatment. Thus wefind that the girls and boys are given the same treatment as far as their healthproblems are concerned.
157 173

Table V . 25
Place Boys and Girls are Treated
Where Treated PercentageBoys Girls
Home 1 .0 1 .2
Dispensary 13 .5 14.9Hospital 36.2 38.7Private clinic 39.9 44.5Any other 0 . 3 0 . 3
N.A. 8 . 7 0 . 1
The reasons for preference of the places of treatment (such as home,dispensary, hospitals, private clinics) mentioned by mothers in an informal dialogue wereas follows:
- No other facilities available
- Proximity
Least expensive/other facilities more expensive
- Other facilities overcrowded/ dirty / unhygienic
- Having faith in the treatment
- Self/family members working in that place/entitled to the facility
When the team tried to study the kind of treatment provided to boys and girls,it was found that a large number of mothers preferred allopathic medicines. Very few(2 . 4%) chose Ayurvedic/Unani/Homeo-pathic treatment for boys and girls. A negligiblepercentage went to the local healers (Ojha/Tantric). About 10% of them tried more thanone kind of treatment or did not take any specific treatment. There was no differencein the system of medical treatment chosen for girls and boys (Table V . 26).
In the course of their study, the Pune team for instance, found some infor-mation that is contrary to what the above tables portray. In Pune, when the teamasked the mothers of the sample about the methods of medication used for girlsand boys, the majority of cases claimed that they went to private practitioners forboth. However, detailed inquiries revealed that girls were not usually taken toprivate clinics.
At first they reported the parents would adopt the 'wait and see' policy. If thegirl suffered for an extended period, then she was treated with home remedies andlater taken to the local healers. Only if her illness still persisted, was she taken
1581 74

to a private practitioner as a last resort. When asked, the mothers denied thatthey neglected the girl child and claimed that medical help for their daughterswas sought immediately. However, the girls contradicted their mother's claims bysaying that they were never taken to the doctor. They said that they weretaken to temples where ritual articles were offered to the deity and after that theywere taken to the local healer. The discrepancy in the statements of the mother anddaughter illustrates the possible neglect of the health of the girl child.
Table V .26
Method of Medical Treatment - Boys and Girls
MethodPercentage
Boys Girls
Traditional/home remedies 1 . 7 2 . 1
Allopathic 76.0 83.6Ayurvedic/Unani/Homeopathic 2.4 2 . 4
Ojha/Magic Healer /Tantric 0 . 9 1 . 0
Acupuncture 0 . 1 0 . 1
No specific treatment/more than one treatment 9.7 10 .4
N.A./D.K. 8 . 9 0 . 5
One of the research teams took a look at the number of girls and boys who werebrought to the Out Patient Dept. of the local Hospital and found that the ratio of girlsto boys was 1:2. Empirical verification of this kind is useful, as a counterpoint toreported statements, but we do not have such internal checks from every team.
General Appearance of Girl Child
The project teams attempted to judge the health of the girl child by an informalstudy of her general appearance. This observation did not require any special trainingon the part of the observer. Different aspects of the girl such as skin, hair, nails andso on were noticed and are discussed below. The following tables are based entirelyon the observations of the participating team. As the team members were not speciallytrained in clinical diagnosis or to get this kind of information, many have tended touse the 'N.A.' category.
It was found (Table V. 27) that only 18 .6% of the sample had normal skin, whilethe rest in the other categories varied in condition. It is also apparent that the researchersfelt that the categories developed did not cover all possibilities, and thus we have thepercentage of "any other" at 67 . 8%.
159 r r-

Table V .27
Skin
Skin Type Percentage
Normal/smooth 18.6Dry 2 . 7
Pigmented 2 . 7
Pale 1 .3
Scratches 1 .0
Blisters/Boils/Infections 1 .2
Any other 67.8N.A. 4 . 7
Table V . 28
Lice in Hair
Lice Percentage
No
Yes
Probably
N.A.
52.615.124.18.2
Hair hygiene is related to both attitude to cleanliness and the opportunity to keepclean. Parasites in the scalp seem to affect about 40% in the sample of girls.
From the above table (V. 28) we can see that a little over 50% of the girls didnot have lice in their hair but almost 40% came in the "yes" and "probably" categories.
Tlble . 29
Colour
Colour Percentage
Normal/Healthy 50.4Black/Brittle 6 . 3
Dry/Brownish 38.7Grey 1 .5
Any other 0 . 1
N.A. 3 . 0
160
176

The appearance of hair can be a good indicator of a person's vigour and tone.In this sample, about half of the girls were reported to have healthy hair(Table V. 29).
And how was the hair maintained? Again, this would be an indicator of generalhealth and sense of well being, as well as of course, access to the resources of waterand time.
Table V . 30
Hair Condition
Condition Percentage
Well groomed 67.4
Unkempt/dirty 25.4
N.A. 3 . 8
Table V.30 shows that about 67% of the girls had neat and well-groomed hair,while 25 . 4% had unkempt/dirty hair.
Assessment of the cleanliness and appearance of hands, nails and feet were also
done informally by the research team.
Table V . 31
Condition - Hands, Nails, Feet
Condition Hands Nails Feet
(Percent) (Percent) (Percent)
Healthy 71 .2 65.1 62.2
Dry or dirty 24.9 31 .0 37.7
N.A. 4 . 0
It was found that a little over 70% of the girls had dean and healthy lookinghands while 25% had dry and dirty hands. From the table above (V. 31) we can seethat 65% of the girls had healthy/clean nails, while 31% had dry or dirty nails.
It was observed that 62 % of the girls had clean/healthy feet while about 38%had dry and dirty feet.
While planning the instruments for the assessment of the health of the girlchildren we realised that an intelligent appraisal of the general appearance,the activity level and cheerfulness and friendliness of the girl child could be
161
177

combined. To assess these, one would not need any specialised training.Even accepting that reliability of such assessment would tend to be moderate tolow, it was decided to consider "the sparkle in the eye" as a measure of thesense of wellbeing.
Table V . 32
Glow in Eyes
Glow in Eyes Percentage
Yes 78 .0
No 17.0N.A . 5 . 0
It was found that 78% of the girls were reported to have a sparkle in their eyewhile 17% were reported as not so describable (V. 32).
Table V .33
Activity
Activity Percentage
Normal active 86.8Not active 8 . 0
N.A. 5 . 2
Almost 87% of the girls seemed to be normally active, while 8% seemed less active( Table V. 33 ).
Table' V .34
Cheerfulness
Cheerfulness Percentage
Smile 89 .6No smile 5 . 8
N.A. 4 . 6
Almost 90% of the girls seemed cheerful while 5 . 8% did not. The researcherswere generally greeted with a ready, friendly smile by the girl child.
162
176

Taking these three simple field assessments, the large majority of girls do appearto be bright, active and cheerful.
Environmental Factors: Hygiene and Sanitation
Environmental factors play a very important role in the maintaining of good health.In both the urban slum and the rural areas, the amenities are not evenly available to all,with some households being placed in a more advantageous locale. Certain areas are cleanerthan others with houses that have more rooms, separate kitchens etc. This may have aneffect on general health, with better location and more space, making families less proneto frequent infections and chronic diseases. Stagnant water and the lack of proper toiletfacilities are invariably characteristic of the poorer homes (about 50% of the entire sample).It is well known that these factors may result in serious health hazards. Apart from thesurroundings of the house, the amenities of the house such as clean drinking water -areequally important. The chapter on Area Profiles gives the reader a first hand descriptionof some of the environments in which girl children live.
163
179

Chapter VI
MENSTRUATION
LIST OF TABLES
Table Number Particulars Page Number
1 Age at Menarche 1652 Prior Knowledge of Menarche 166
3 Source of Knowledge 166
4 How Menarche was Handled 167
5 Persons Helping the Girl Child 167
6 Feelings at Menarche 168
7 Problems Faced during Periods 168
8 Remedial Measures Adopted 168
9 Rules Observed by the Girl Child after Puberty 169
10 Puberty Rituals Celebrated in Community 170
11 Reaction to Rituals 170
12 Restriction on Food after Puberty 171
13 Taboos Observed during Menses 171
164
160
O

Chapter VI
MENSTRUATION
Gender differences that are culturally produced have often been interpreted asbeing rooted in biological factors. A clearly biological event, the onset of puberty, notonly introduces dramatic physical changes but brings on several social changes too inthe of a girl. In many Indian languages, menstruation is equated with 'flowering'or blossoming (and privately, it is often referred to as a curse).
Age at Menarche
In our sample, it was found that nearly 40% of the girls had reached puberty.
Table VI. 1
Age at Menarche
Age at Menarche Percentage
Less than .10 years 0 .2
Between 10-11 years 1 .4Between 11-12 years 5 . 5
Between 12-13 years 12.8Betwe1/4.n 13-14 years 11 .9
Between 14-15 years 5 . 9
Between 15-18 years 2 . 2
Not yet menstruated 60.1
In this analysis, the specific questions aimed at menarche and puberty rituals wereasked of only those girls who had attained menarche which was approximately 40%in this sample - 4800 in number. Thus all the statistics in this section refer only tothose 4800 girls and are not based on the entire sample.
The age of attaining menarche does reflect health and nutritional status. As is wellknown, in developed countries, the age is being constantly moved forward. In India,there are norms of the ICMR which put the mean age of menarche in India at 13 . 5.
In this datum (as in others like longevity) there are bound to be secular trends i.e..change in trends over the years. In our sample, about one-third of the girls attainingpuberty were 1.7 years old, awl another third of them, 13 years old; and the distributionwas near-normal.
165
131

Prior knowledge of Menarche and Source of 'Information
The following tables present data regarding any prior knowledge the girls mayhave had about the onset of menarche and the source of that information.
About 37% of the girls state that they did have prior knowledge of menarche,while 63% of the girls say that they did not have any prior information about it. Themajority of the 1-,rls seem not to have even informal education about the functioningof their own bodies.
Table VI. 2
Prior Knowledge of Menarche
Prior knowledge of Menarche Percentage
Yes
No
37.362.7
However, one cannot fully rule out the possibility that the girls were being a littleshy or modest in answering the questions. If they had said that they did have priorinformation, some probing questions would be bound to follow. There is a possibilitythat some of the respondents considered that to act innocent, or ignorant, was a wisecourse of action.
Table VI. 3
Source of Knowledge
Source of Knowledge Percentage
Friends/Neighbours 18 .5
Mother 14.0Other female relative 10.3Mass media 1 .0
Teachers 0 . 8
No prior knowledge 55.4
In Table VI .3 we see that friends/neighbours (18 . 5%) were often the source ofinformation on menarche and related aspects for the girl child. The mother was thenext most common source (14%) followed by the girl's sister or other female relative(10 . 3%). The observation that there is a lack of intimacy and articulation of sharedissues in the family is supported here. The mother's role is surprisingly law -key insuch a crucial aspect of the girl child's health and well-being.
166
182

How Menarche was Handled
The girls who had attained menarche were also questioned on how they handledthe onset of menarche.
Of the 40% girls questioned, nearly 63% went tc, someone for help. A further27 . 6% said that they took care to protect themselves and 10% said that they had beenmentally prepared for the event. The latter two categories can be added to arrive atthe number of girls who had prior information on what to expect and w at to doas is confirmed in Table VI. 2.
Table VI. 4
How Menarche was Handled
How Menarche was Handled Percentage
Informed othersTook care to protect myselfWas mentally prepared
62.427.610.0
Table VI. 5
Persons Helping the Girl Child
Persons Helping Percentage
Mother 71 .2
Sister/Sister-in-law 12.5Friend 5 . 5
Other female relative 3 . 8
Others (neighbour, teacher, doctor) 2 . 5
None 4 . 5
When the girl child attained L,-...,narche, the mother (71 . 2%) was found to be theprimary helper in the majority of cases. The next largest category was the sister/sister-in-law (12 . 5%) followed by friends (5 . 5%) and other female relatives (3 . 8%). Althoughthe mother has some hesitation in preparing her girl child for menarche, its onset setsher in action and she does the needful.
Feelings and Problems of the Girl Child at Menarche
The girl children, on being asked how they felt at menarche, provided a numberof responses, including that they felt scared or shy. Some disclaimed any feeling.
167 133

The most common feeling experienced by the girl children was that of feelingfrightened (24%). This was followed by 23% of the girls feeling shy; 34 .5% of the girlsfelt nothing, or were not sure how they felt. Other feelings experienced were mentionedas dirty (6 . 8%) and uncomfortable (7%).
Table VI. 6
Feelings at Menarche
Feelings at Menarche Percentage
Frightened 23 .8
Shy 23.1
Dirty 6 . 8
Uncomfortable 7 . 0
Grown up 4 . 8
Nothing/not sure 34.5
As far as menstrual problemssaid that they did not have any
were concerned the majority of the girls questionedproblems during their periods.
Table VI. 7
Problems Faced during Periods
Problems Faced Percentage
No
Yes
75 .2
24.8
About 75% of the girls said that they did not have any serious problems during theirperiods while about 25% said that they had some problems. The implication of this is that25% of post-menarchal girls would need medical or paramedical treatment and counselling.
Table VI. 8
Remedial Measures Adopted
Remedial Steps Percentage
Took rest at homeTook pain killers/medicinesTook home-made remedies/used hot water bottlesAvoided baths/avoided specific foodsDid nothing
23.427.011.7
3 . 6
34.3
168
184
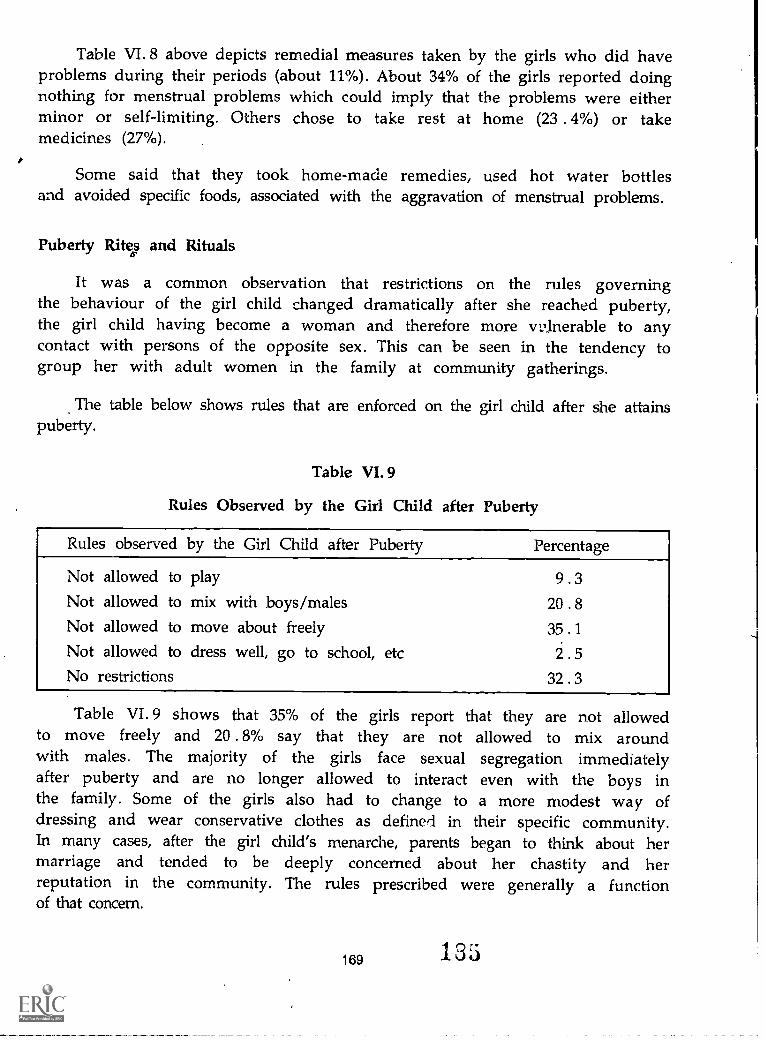
Table VI. 8 above depicts remedial measures taken by the girls who did haveproblems during their periods (about 11%). About 34% of the girls reported doingnothing for menstrual problems which could imply that the problems were eitherminor or self-limiting. Others chose to take rest at home (23 . 4%) or takemedicines (27%).
Some said that they took home-made remedies, used hot water bottlesand avoided specific foods, associated with the aggravation of menstrual problems.
Puberty Rites and Rituals
It was a common observation that restrictions on the rules governingthe behaviour of the girl child changed dramatically after she reached puberty,the girl child having become a woman and therefore more vulnerable to anycontact with persons of the opposite sex. This can be seen in the tendency togroup her with adult women in the family at community gatherings.
The table below shows rules that are enforced on the girl child after she attainspuberty.
Table VI. 9
Rules Observed by the Girl Child after Puberty
Rules observed by the Girl Child after Puberty Percentage
Not allowed to playNot allowed to mix with boys/malesNot allowed to move about freelyNot allowed to dress well, go to school, etcNo restrictions
9 . 3
20.835.1
2 . 5
32.3
Table VI. 9 shows that 35% of the girls report that they are not allowedto move freely and 20 . 8% say that they are not allowed to mix aroundwith males. The majority of the girls face sexual segregation immediatelyafter puberty and are no longer allowed to interact even with the boys inthe family. Some of the girls also had to change to a more modest way ofdressing and wear conservative clothes as defined in their specific community.In many cases, after the girl child's menarche, parents began to think about hermarriage and tended to be deeply concerned about her chastity and herreputation in the community. The rules prescribed were generally a functionof that concern.
169 135

In several states in India, puberty rites and rituals are common. It was found thatnearly one-third of the girls in the total sample who had reached menarche, did havesuch rituals
Table VI.10
Puberty Rituals Celebrated in Community
Puberty Rituals Celebrated in Community Percentage
Yes 32.8No 40.9Don't Know 9.0N.A. 17.3
From the above table, we see that 33% of the girls said that there were pubertyrituals in their communities while 41% said that there were no such rituals. Thesesummary data do not in themselves indicate the variance. It must be noted thereis a great deal of variation from one region or subculture to another within thecountry. There is no 'Indian' pattern.
The girls were then questioned on how they felt about such celebrations takingplace.
Table VI.11
Reaction to Rituals
Reaction to Rituals Percentage
Felt shy 12 .8
Felt like a heroine 11 .0Traumatic 1 .0
Disliked them 6.5Felt grownup 0 . 8
Felt nothing 7 . 8
No celebration 60 .1
We see that 12 . 8% of the girls said that they felt shy at the puberty ritualsthat were conducted while 6 . 5% disliked them and 7 . 8% felt nothing. Sometimesa girl would say that she felt like a heroine at this celebration (and about 11%of the girls fall in this category). These pubertal celebrations serve the functionof a eite of passage in many communities in India and the rituals that go alongwith this event result in its not being treated as a 'dreaded' phenomenon by the
170
18G

girl child. The girl child enjoys this event as this is one of the few timcs in herlife when she is the uncontest&I star of the show. She is frequently the onlybeneficiary of the celebrations and is often showered with attention and gifts. Itis only after the ritual celebrations are over that the girl realises that the eventproduces uncomfortable discontinuity - that the door has suddenly closed on thechildhood she has left behind.
Taboos and Restrictions
In several communities, various taboos are enforced during menstruation. Women/girls who are menstruating are considered to be polluting and are not allowed to cook,draw water from the wells, appear before male members of the family or join inworship. Restriction on food is depicted in the table below.
Table VI.12
Restriction on Food after Puberty
Restriction of Food after Puberty Percentage
Restricted diet (no non-veg)Other types of restricted dietsSpecial dietNo change
4 . 8
14.011.369.9
It can be seen that almost 70% of the girls did not have any change in theirdiet after attaining puberty while about 20% of the girls did have to follow somerestrictions in their diet.
Table VI.13
Taboos Observed during Menses
Taboos Observed during Mensus Percentage
Food restrictions 29.8Isolation 35 .3Play 48--.
Worship/religious rites 78.4Bath 6 . 8
Cook 23 .6Touch others 5 . 8
Go out/school 3 . 0
171
137

A substantial percentage, more than three-fourths of the girls who had attainedmenarche, were not allowed to join in religious worship/rites during their menses. Othertaboos enforced pertained to their play activities (almost 50%), food restrictions (almost30%), isolation (35%) and some restrictions on cooking (24%), bathing (7%), interactingwith others (6%) and going out/going to school (3%).
India being so culturally diverse, no singular common pattern in the rituals, taboosand treatment of the experience of menarche can be identified. There are variationsby region, by caste group and by level of modernization. Families in every communityfollow their own traditions with some celebrating the onset of menarche with muchado and others not doing anything at all.
172
188

Chapter VII
CHILD LABOUR
LIST OF TABLES
Table No. Particulars Page No.
1 Nature of Employment 175
2 How Girl Child Employed 175
3 Type of Employer 176
4 Time Spent at Work 177
5 Distance of Work-place from Home 177
6 Time taken to reach Work Place 178
7 Cash earned by Girl Child in a Month 178
8 Period of Payment 179
vat,"1:4"
Illlill (iitiormimmitiIli! 'twill If INNIIII IIVV
)
1731 39

Chapter VII
CHILD LABOUR
Introduction
Child labour is a widespread practice in India. According to available statistics43% of India's population are children, out of which 18% are involved in child labour.The ages of these children range between 5 and 14 years. Child labour, accordin toofficial statistics contributes 30% of the family earnings.
Child labour is cheaper than adult labour and some companies and individualsmake huge profits by employing children and exploiting child labour. Employees seemto prefer child workers as they are productive, cheap and obedient. Also child labouris not organised into unions and children are less prone to giving the managementany trouble.
Many of the jobs are gender-specific with different ramifications for girls and boys.While boys work more in the hotels and tea stalls, girls constitute 70% of child workersin the Weaving industry, and 63% in the Match industry. Other major areas wheregirls outnumber boys are in agriculture, bidi-making and rag-picking. It is a commonobservation that girls are more likely to be paid less than boys, for the same kindof work.
In the total sample in this study, it was found that 87 . 2% of the girls said thatthey were not involved in any economic activity towards supplementing the familyincome. This however, did not take into account girls who were involved in householdwork which contributed to the household occupation or to the parent's job. It also didnot take into account those girls who stayed at home to tend to home-based craft workwithout any monetary" compensation for their work. Their work is considered as theirduty to the family, and it is expected to be done without any articulation of thecontribution made by such work.
Thus 12 . 8% of the total sample did contribute towards the family income.The large majority of this 12 . 8% (12 . 0% to be exact) worked in the unorganisedsector.
A major part of the girl child's earnings were spent on the family. In many cases,she did not get to keep any of the money she had earned. An in-depth analysis ofthe girl child and her work place was carried out.
All the percentages given below pertain to those cases which were applicableto the questions asked. In almost every category about 00`)/0 of the cases were not
174
1iO

applicable. These percentages are based on the 12 . 8% of the girl children who dowork.
From the table (VII . 1) we see that 51 .6% of the girls are engaged in agriculturallabour and other related activities while 17 . 2% are in home-based establishment / familybusiness. A further 7 . 8% are involved in domestic / personal services. Agricultureabsorbs the largest quantum of girl children's labour. Since twd-thirds of the sampleis rural, it is only to be expected that cultivation of crops, care of cattle and relatedactivities constitute the major occupations for which girl children receive some payment.
Table VII. 1
Nature of Employment
.Nature of Employment Percentage
Industrial worker / Factory worker 3.1Agricultural labourer / related activities 51 .6
Construction labourer 2 . 3
Semi-skilled labourer 2 . 3
Home-based establishment / family business 17.2Piece-rate workers / crafts 9 .4Service 1 . 6
Domestic / Personal Services 7 . 8
Self-employed / others 4 . 7
How the Girl Child is EmployedThe table (VII . 2) shows us that 30 .5% of the girls were involved in productive
activity in the home / assisting the family in their work (no separate pay-
How employed
Table WI. 2
How Girl Child Employed
Percentage
Self-employed 11 .7
Employed on a salary 17.2Working with family (piece wages) 14.8Productive activity in the home / assisting family 30 .5Casual labour 25 .8
175
1 al

ment) and 25 .8% were engaged in casual labour. About 11 .7% were self-employed
and 17 . 2% were employed on a monthly salary. The commonly accepteddefinitiors of child labour will have to be re-examined in the context of self-employment
and home-based work.
Type of Employer
It was found that 39% of the girls were working with Businessmen / Contractors /Landlords while 12 .5% were employed by Individuals / Households and 0 . 8%
were employed by the Government / Public sector and the same numberby Private Institutions / NGO's. Clearly, the non-formal sector, businessman,
contractor etc., also the sector likely to be exploitative, employs the largestnumber of girl children. Their employment in these cases would be withoutpermanence and without the benefits of service in the public sector. Wefind only a miniscule proportion (0 . 8%) of the girls engaged ingovernment jobs. The 12 .5% girls working for individuals and households maybe marginally better than the first group, but they are also at the mercy of anunpredictable employment set up.
Table VII. 3
Type of Employment
Type of Employment Percentage
Businessman / Contractor / Landlord 39 .0
Individuals / Households 12 .5
Government /Public Sector 0.8Private Industry/Factory 3.9Private Institutions/NGO's 0.8Others 14 .1
Self - employed /Working with family 28 .9
Time Spent at work
Approximately 34% wo,.. for 6 -8 hours a day while about 17 .2% of
them work 8-10 hours a day and 22% have no fixed hours. The majority of girlchildren (34 .4%) who are employed work for 6 to 8 hours - a full working dayand about 22% say that there are no fixed hours. These refer to jobs where an accuratesense of time is not a necessary parameter for the task. In such situations, work hours arelikely to be expanded and the emoluments not specified ahead. That these are antecedents
of exploitaion need no emphasis.
176
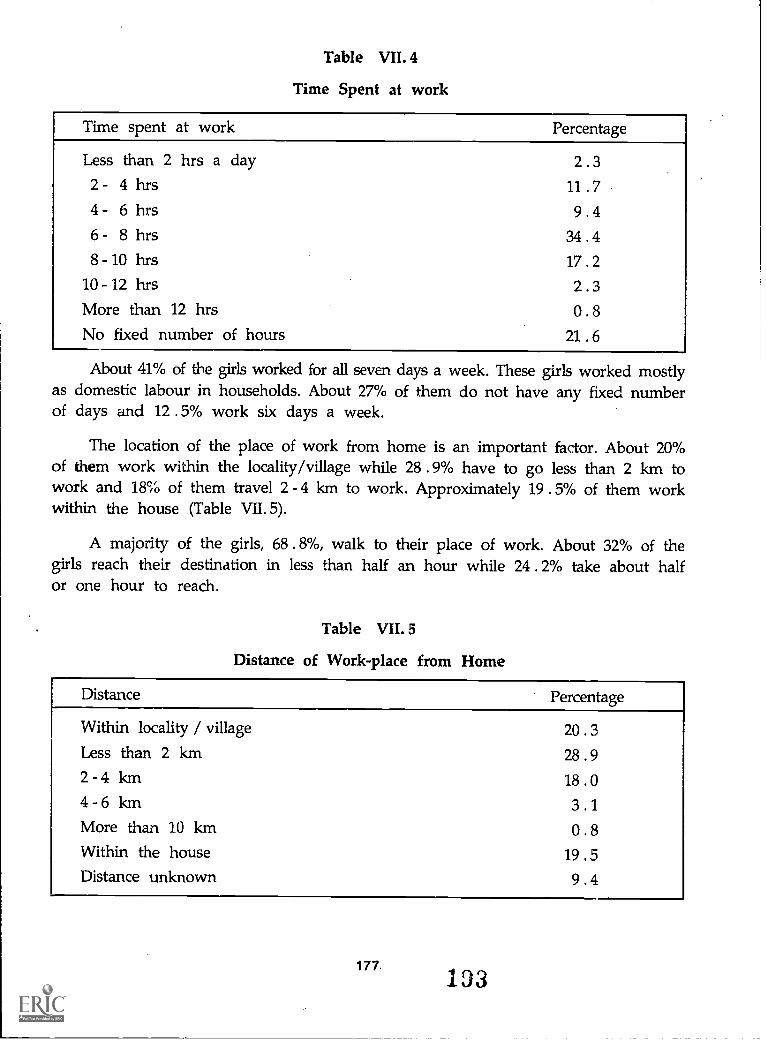
Table VII. 4
Time Spent at work
Time spent at work Percentage
Less than 2 hrs a day 2 . 3
2- 4 hrs 11 .74 - 6 hrs 9 . 4
6 - 8 hrs 34.48 -10 hrs 17.2
10 -12 Firs 2 . 3
More than 12 hrs 0 . 8
No fixed number of hours 21 .6
About 41% of the girls worked for all seven days a week. These girls worked mostlyas domestic labour in households. About 27% of them do not have any fixed numberof days and 12 . 5% work six days a week.
The location of the place of work from home is an important factor. About 20%of them work within the locality/village while 28 .9% have to go less than 2 km towork and 18% of them travel 2 - 4 km to work. Approximately 19 .5% of them workwithin the house (Table VII. 5).
A majority of the girls, 68 . 8%, walk to their place of work. About 32% of thegirls reach their destination in less than half an hour while 24 . 2% take about halfor one hour to reach.
Table WI. 5
Distance of Work-place from Home
Distance Percentage
Within locality / village 20.3Less than 2 km 28.92 4 km 18.04 - 6 km 3 . 1
More than 10 km 0.8Within the house 19 .5Distance unknown 9 . 4
177193

Table VII. 6
Time taken to reach Work Place
Time taken to reach work place Percentage
Less than half an hourHalf to one hour1- 2 hours2-3 hoursNo fixed time/Don't know
32 .0
24.210.20.8
32.8
Amenities
The amenities pro- Ided at the place of work were assessed and it was foundthat there was enough light and ventilation as most of the girls were workingeither as maid servants or in agricultural activities. Private toilet facilitieswhich are essential for girls are not provided in many cases. About 30% ofthe girls, probably the ones working, in construction or agriculture did not have access
to such facilities.
As for rest pauses provided during the working day, it was foundthat only 41% of them had some time to take rest. The facilities lackingfor all were paid holidays, medical benefits, maternity leave, skill-based training,education and bonus.
Earnings
Table VII. 7
Cashed earned by Girl Child in a Month
Cash earned in a month Percentage
Less than Rs.50 4.7Rs. 51 -100 12.5
Rs.101 -200 21 .1
Rs.201 -300 15.6
Rs301 -500 8.6Rs.501 -1000 0.8More than 1000' 36.7
It was found (Table VII .7) that 21 . 1% earned about Rs.101 -200 per month while15 .6% earned between Rs. 201 - 300 and 12 . 5% earned about Rs. 51 - 100 a month.
178
1 94

About 56% were paid in cash and 21 .9% do not get a separate payment, but thefamily gets paid as a whole, in cash or kind.
Table VII. 8
Period of Payment
Periodicity of Payment Percentage
Daily 24.2Weekly 18.8Monthly 10.9Not fixed / on completion of job / No payment 46.1
The period of payment (Table VII . 8) varied. About 24% were paid daily, while19% were paid weekly and 11% monthly. The payment in 37 . 5% of the cases wasreceived by the girl herself and in 16 . 4% of the cases by the mother. In about 46%of the cases, the parents / parents-in-law decided on how the income would bespent. About 4 . 7% of the girls made this decision by themselves. The major partof these earnings, almost 60%, were spent on the family. Only 3% was saved or spentby the girl herself.
Work Satisfaction
About 54 .7% of the girls were satisfied with their work. Around 17 . 2% said thatthey were not satisfied; 19 . 5% liked working because it made them economicallyindependent and 11% disliked the drudgery and the long hours of work.
When asked about their future plans, 27 . 4% said that they wanted to pursue aneducation and further qualify themselves.
We know that the question of child labour is a vexed one, since any decisionmade affects entire families. One thrust has been to make primary education compulsoryand available; another has been to ban child labour. Neither proposal has beenimplemented, for several practical reasons.
On the punt of the families, a commitment to educate girl children is still noturiversal. Part of the reason for this could be that education does not seem functionalfor them as it does not provide the skills for employment and the assurance of a betterfuture.
The other explanation is known: that families in poverty find that to sustainthemselves on the margin of survival, they have to use all the labour power they have,including that of children. This continues to be an overhanging fog on the developmenthorizon of India.
179 1D5

or-
Ike -41164
180
196

Chapter VIII
CASE STUDIES AND CASE PROFILES
CASE STUDIES Page Number
Pinky 18 Years 183
Vidhya 12 Years 185
laurga 15 Years 187
Vanita 17 Years 190
Janaki 16 Years 192
Sangita 15 Years 194
CASE PROFILES
Anasuya 10 Years 196
Renu Kumari 11 Years 197
Lakshmi 15 Years 198
Hulligamma 13 Years 199
Razia 15 Years 199
181
197

Chapter VIII
CASE STUDIES AND CASE PROFILES
This section consists of six case studies and five brief case profiles. They havEbeen chosen from the reports of different participating centres and are intended togive an intimate idea of the life and situation of the girl child.
The girls in these vignettes range in age from ten to eighteen years. Only twoof the girls whose case studies are presented here are in school. Most of the othershave been forced to leave school for a variety of reasons (early marriage, helping withhousehold chores) or have never attended school. Taken together, the stories of thesegirls paint a grim picture of economic deprivation and a society with gross stereotypesof gender roles. Girls' aspirations for themselves are suppressed or ignored in the causeof social mores or of the collective 'needs of the family.
The six case studies presented here are reasonably detailed descriptions of thedaily routine, lifestyle and opportunities of the girls concerned. The five case profilesare succinct summaries that provide an overview of the lives of some of the girlsincluded in the study.
The section provides the qualitative aspect of the lives of girl children, to beused as a supplement to the quantitative data. As can be seen, the two aspects aremutually reflecting, each confirming the issues focussed by the other. These case studiesalso take us into the girl children's hopes and dreams, contrapunting their harsh reality.
182
138

CASE STUDY - 1 ( jadavpur )
NameAgeCityAreaState
Pinky18
CalcuttaUrbanWest Bengal
Pinky is an eighteen year old Hindu girl from Calcutta. She lives with her familyin one of the colonies which houses resettled refugees from East Bengal (now Bangla-desh). Pinky's family had migrated from Dhaka to Calcutta over forty years ago. Herfamily consists of her parents and two younger brothers. Pinky's father used to workat a factory, but is currently unemployed as the factory had declared a lock-out. Itis hard for him to get another job as he has studied only upto Class 8 and has noother skills. Pinky's mother, however has studied upto Class 10 and is using her sewingskills to support the family. With the help of the father, Pinky's mother gets ordersto sew aprons and overalls for various factories. This earns her about Rs.1000/- permonth which is just about enough for the family's minimal needs.
Pinky's mother is extremely upset about this role reversal. She had always believedthat it was a man's prerogative to be the bread winner of the family and the woman'sprerogative to be at home as a housewife. She had not imagined that she would haveto be the sole support of three children and her husband. These circumstances haveleft her quite bitter. She feels that if one has an able bodied man for a husband,he should be able to support the family; no woman should have to work after marriage.Her ideas about male and female roles are fixed. She extends these views to the kindof life she would want her daughters to lead.
As far as education is concerned, the mother's views are a little more open. Shefeels that girls should have higher education (at least a B.A. degree) so that they willbe acceptable in today's society. However, though she professes to have an interestin her daughter's education, it seems as if she does not really pay that much attentionto it. Pinky at the age of eighteen, is still in Class 10 while other girls her age arein College. Her brother who is fifteen years old is already in Class 9 and her thirteenyear old brother is in Class 8. Although the siblings seem to be of equal intelligence,Pinky is lagging behind in her education. This gap can be attributed to her havingto stay home on many occasions to help her mother out with household chores orwith sewing orders. Pinky is well versed with all forms of sewing and knitting. Thishowever, cuts down on the amount of time she can spend with her books.
It seems quite evident that Pinky's mother is more fond of her sons than sheis of Pinky. She makes no bones about the fact that if she needed help at home,she would ask Pinky to stay back and not the boys. She wants nothing to interferewith their educational process which would ensure them job security. She feels sure
183
199
that her sons will be the source of her support in the later years. When asked whyPinky couldn't do the same, she answers by saying that there is no need for a girlto get a job. She feels that girls must be married by the age of 20-22 years or elsethey will lose the freshness of youth. A girl should get married and live happilywith her husband and not have to support her family. That is the man's job. Pinky'smother does want her daughter to be married and happy, but has decided not tospend anything on dowry. She does not object to it on principle, but says that shecannot afford it, and would rather have her daughter remain unmarried than paydowry.
Even though Pinky's mother has stereotyped views on gender roles, she cannotput them into practice in her own home. Due to their circumstances, she encouragesPinky to earn money to supplement the household income. In their family, earningthe income for survival is the task of the women.
Personal Profile of Pinky
Pinky wants to have a job when she is older. She is already helping her motherout and also coaching young children at home. She says she enjoys teaching and seespossibilities in making a career out of it later on. This is one of the reasons she wantsto do well in school. She feels that an education helps one to qualify oneself betterfor a job in the future. It also enables one to know the world better, and have theopportunity to meet new people and make friends.
Even though Pinky wants to work outside the' home when she is older, she doesnot want to do so at the cost of her family life. She says that when she gets marriedshe will pay equal attention to both, so that neither one gets neglected. She knows
that a paid job helps to supplement the family's income and that is why it is importantfor her to have a job. Pinky seems to have adopted the modern day image of a workinggirl. She likes school, she likes teaching and knows exactly what she wants to dowhen she grows up. She has had a taste of an independent income and the identityof a bread winner as well. Along with this, she also wants to get married and havea family. When asked about her perceptions of gender roles, she answers that a good
girl should stay at home, be obedient and do well in school. A good wife shouldlook after her family. A good boy should be just like a good girl and a good husbandshould treat his wife well. The contradictions in her thinking did not seem apparentto her. Anyway the future is a faraway place, from her current perspective.
184
200

CASE STUDY - 2 ( Bombay - 2)
Name : VidhyaAge : 12
City . UmeleArea . RuralState Maharashtra
Vidhya is a 12 year old girl living in Umele, which is near Naigon in Maharashtra.Her family consists of her parents, two brothers and a sister and a grandmother.Vidhya's family is very poor and has great difficulty in making ends meet. Vidhya'sfather is currently working in a rubber factory, earning Rs.200/- per month. A fewyears ago he had a much better job in a mill and was earning quite well. At thatpoint, Vidhya's brother was being sent to an English medium 'school. However, hardtimes befell the family, the mill where he was working closed down and he lost hisjob. He couldn't get a good job as he had studied only upto Class 9. These circumstanceswere humiliating and he would often vent this frustration on his wife and daughtersby scolding or beating them.
Vidhya's mother keeps poor health. She suffers from high blood pressure anda tumour in the stomach. As a result, she is unable to contribute significantly to thefamily earnings. Whenever she feels well, she makes cloth quilts which fetch her aboutRs.100/- a month. Vidhya and her sister work as part-time domestic servants. Herbrothers are both studying and do not work on a regular basis.
Personal profile on Vidhya
Vidhya is studying in Class 6. Along with her schooling she works part-timeas a domestic help in other people's homes. Her job includes washing clothes, utensils,sweeping and swabbing. She goes to work early in the morning and completes herchores. She then goes to school and during the recess, she goes back to the samehouse to wash the utensils. After school is over, she is back to work, from 3 to 4 p.m.Vidhya earns about Rs.50/- a month which she gives to her mother. She is givenRs.2/- out of her wages to keep for herself. Apart from school work and her job,Vidhya also has to perform household duties. Her mother does not keep very welland often the entire burden of housework falls on Vidhya's shoulders. Despite this,Vidhya manages to study for about two hours everyday. Their house does not haveelectricity, so she uses a kerosene lamp to study at night. Her study time is ofteninterrupted by the demands of the household but Vidhya is persistent. She says sheenjoys studying and intends to pursue her studies till Class 10. After thatshe plans to join a vocational training course which would allow her to get a goodjob. Vidhya dreams of becoming a teacher. She does not like being a housemaid. Shesays that though her employees treat her well, the work is rather dull and tedious.
185
201

She says that her employers give her food, clothes and so on. Vidhya shares all shegets from them with her siblings.
Vidhya is not very happy with the family situation. She says that her grand-mother causes a lot of problems in the house. Vidhya's mother is the victim of constantharassment and abuses from both her mother-in-law and husband. Vidhya's grand-mother is always telling her son to throw Vidhya's mother out of the house as sheis an accursed person. She says so as Vidhya's mother had three still born babiesearly in her marriage. A possible reason for this was her poor health, but everyonein the family was convinced that it was a curse. She was taken to a Witch Doctorbut her condition did not improve. Thus, she is constantly berated and beaten by herhusband and mother-in-law. Her children however, stand up for her and fight withtheir father and grandmother to protect their mother. They take their mother out formovies and walks to try and keep her happy.
As for Vidhya's siblings, she says that she and her sister work hard so that theirbrothers can study. The brothers do not work on a regular basis. They sometimesmake money by selling articles or papers. Vidhya's elder brother is in Class 9 andwill get a regular job after he has finished Class 10. The brothers do help Vidhyaout a little at home with cleaning the utensils, making chappatis and so on. She feels
close to her siblings.
Vidhya's home is essentially run by her grandmother. As a result of this, herbrothers are given preferential treatment as far as food and clothes are concerned.Vidhya's grandmother feels that men need strength as they are the ones who willlook after the family. Thus they must be given the best. Vidhya does not protest,but feels that her grandmother is probably right. Her younger sister, Kalpana, however,feels that her grandmother is wrong. She feels that both men and women are equaland should be treated equally.
Vidhya says she has a lot of friends in the neighbourhood. During her holidaysshe spends her free time with them playing games, watching TV in a neighbour'shouse and chatting. She has never had the opportunity to travel but says that shewould like to one day. Marriage for girls in their caste is usually at the age of 21.Right now, says Vidhya, she is working towards fulfilling her ambition to be a teacher.
186
02

CASE STUDY - 3 ( Jadavpur)
NameAgeAreaState
Durga15
RuralWest Bengal
Durga is a fifteen year old girl from a scheduled caste family. She is the thirdof six children. Durga has one elder brother, one elder sister, two younger sisters andone younger brother. Her elder sister was married some years ago and now thereare seven members left in the family. There is a thirteen-year gap between the oldestand youngest sons. There were five daughters born in between, of whom threesurvived. Durga's mother openly admitted that she would not have had so manychildren if the two sons had been born in the beginning. She felt that a woman neededat least two sons. It was only 'in the hope of having a second son that she boreso many children. Durga comes from a reasonably affluent family in her village. Herfather owns a substantial amount of land (about 25 bighas) and several heads of cattle.They also run a small business where they make puffed rice (muri). The responsibilityfor the puffed rice production has been given to the women of the family. The menstay out in the fields all day. Durga, her mother and her sisters have to boil thepaddy, steam and dry it, and then puff it by deep-frying it. This process involvesa lot of time and labour. Apart from this, the women work in the fields as well.The womenfolk help out in all the areas of work in the field except ploughing. Inaddition, the domestic chores (cooking, cleaning, care of the young and the elderly,water, fuel and fodder) are totally the responsibility of the women of the household.
Due to these circumstances, none of the daughters of the house has been ableto get an education. Their duty as girls is to look after the home and to lighten themother's load of work. School is considered a luxury which they cannot afford. Thesituation however, is quite different for the boy child. The boys have to be qualifiedenough to get a good job. Durga's mother said that her sons would be encouragedto study for as long as they could. Even though they will inherit some land, it isimportant that they should be able to get a job. A good job would provide a steadyincome, security and a better status in society. Working in the fields was not onlyvery hard work but was also dependent on unpredictable factors such as weather.Durga's mother feels that the boys are not yet ready to do such hard work and thefields would be looked after by their father. They should put their time and effortinto their education, she said.
The older son is currently in Class 9. He has been enrolled in a good schooland lives in the school hostel which is away from the village. The family spends aboutRs. 300/- per month on his education. When asked about her four daughters whoare all unschooi,.xl, Durga's mother says, "What good is an education to a girl in a
187 2 0 3

farmer's house? The only problem is that these days it is very difficult to marry offan illiterate girl. One has to pay a lot of dowry". She now wonders if she shouldhave sent them to school for a short period of time at least. Even if they had studiedupto Class 4 or 5, they would not have to pay a big dowry. Though Durga's motherrealizes that education for a girl may be a good thing, she feels that there is toomuch work at home to allow for such luxuries. Her criteria for a good daughter-in-law are being good at cooking, being hard working and having a fair complexion."Of what use is an educated girl in households such as ours? The women of thishouse have never been to school!" She gave herself as an example of an illiterate womanand felt that it had never hampered her life in any way and so illiteracy would notbe a problem in her daughters' lives too. They would grow up to be dutiful wivesand mothers like her. That, she felt was good enough for any girl.
In the case of Durga's family, educational discrimination is more visible but there
is also a noticeable difference in the food that is given to boys and girls. The morenutritious food and the delicacies are invariably kept aside for the sons.
Personal Profile of Durga
Durga appears to be in reasonably good health. She has not suffered any seriousillness so far, but is a little underweight for her height and age. Durga is about 135on. in height and weighs only 35 kg. She carries an expression of tiredness and
resignation on her face. However, she gives the impression of being a sturdy andhard working young girl. Durga is very unhappy about the fact that her parents neversent her to school. She says that when she was young, she made many attempts toconvince her parents to educate her, but was unsuccessful. She realises that her illiteracy
will make it hard for her to get a good husband. She expects her in-laws to constantlybelittle her and pass snide comments. To this she says, "But what can one do? Ifone's own parents do not want their child to study, then how does one overcomethe handicap? After all it was not as if they could not afford it. Now I will neverbe able to teach my own children to read. And will they ever respect a mother whois illiterate?" She feels that she is too old to start studying. She and her sisters areexpected to help out at home, in the fields and the business till such time that theirparents decide to get them married. They seem to have accepted their condition.
Durga is different from her mother in that she is aware and angry at the genderdiscrimination in education. She realises that an education could have helped changeher life considerably. She is vaguely aware of the possibilities that are within the reachof an educated person and feels that being illiterate is a severe handicap. However,when it comes to gender bias in other areas, she feels that it is natural for boys tohave a better deal in life. She does not seem to have any objection to the fact thather brothers are better fed than she and her sisters are. In fact, she feels that boysneed better treatment. After all they have to study hard and get a job to look after
188
204

the family. She does not see anything wrong in women in the family eating afterthe men have eaten, or in her brother's mistakes going unnoticed while hers arepunished. She believes that girls must be quiet, obedient and accommodating. The onequality she hopes for in her husband is kindness - "so that he will forgive my faultsand not scold me all the time".
An average day in Durga's life begins at five in the morning and ends aftersundown. She begins by sweeping the three rooms of their house and goes on tofeed the cattle and clean their stalls before they are taken out tr the fields. She thenhelps her mother with the cookir t* After this is done, she smears the floors and wallsof the house with a paste of cowdung and water. Durga also has to work in thefields. She helps with all the seasonal agricultural tasks (harvesting, threshing etc.) andwith producing puffed rice.
After the morning chores, she goes out to fetch water for the house. The nearestwater source is a kilometre away. She has to fetch water three times a day. It takesher about an hour to go back and forth. When she comes home she supervises hersiblings' bath and meals. After everyone has eaten, her mother starts preparing theday's lot of puffed rice. After that Durga has to fetch fodder for the cattle and drinkingwater once again. By the time she is home, the sun has set. Her evenings are spentlooking after her brother and sisters. It is only after the rest of the family has .eatenthat Durga and her mother have their dinner and go to bed.
Epilogue
A year after the survey, a follow up was done. It was found that Durga's lifehad not changed in any way. Her mother did say that she would enrol Durga inliteracy classes (a district wide literacy drive was on at that time) but Durga wassceptical about it. She was concerned about who would take over her household chores.In any case, she felt that she was too old to study and she would be getting marriedsoon, so there really was no use pursuing it.
189 205,

CASE STUDY - 4 ( Bombay - 2)
Name VanitaAge . 17City . BombayArea . Urban SlumState . Maharashtra
Vanita is a 17 year old girl, living with her family in the Vadarpada slum inBombay. She belongs to the Dubla community. Her native tongue is Gujarati. Vanita'sfamily consists of her parents, a younger brother and a sister. She has been educatedtill Class 7 but had to discontinue her studies to work. Her father was working inan aluminium factory but lost his job when the company shut down. He had beenearning Rs.800/- a month. Vanita's mother worked in two households as a maid servantand earned Rs.300 /- a month. As a result of her father losing his job, Vanita hadto give up her schooling to help supplement the family's income.
Personal Profile of Vanita
When Vanita first started work she would go along with her mother and doodd jobs. She began by earning Rs.150/- per month per job, as well as one meala day. Even though her mother and she worked very hard they found it difficultto make ends meet and sometimes had to go forgo meals in order to be able to feedthe rest of the family. As time passed, Vanita managed to get other jobs and make aboutRs.750/- a month. This made it possible for the family to have enough to eat.
Vanita is currently working as a domestic servant in five houses. Her job includescleaning utensils, washing clothes and swabbing. She goes to work at around 1 p.m.everyday and comes back at 3 p.m. Then she goes back at 8 p.m. and returns around11 p.m. She gets leftover food at all the five households. She eats at two houses andbrings the rest of the food home to share with her siblings. Vanita gives all herearnings to her mother except for Rs.50/- which she deposits in the bank every monthfor herself. Her parents have no objection to this. In fact, they feel that it is goodsecurity for her future. Vanita is happy with her work situation. The people she worksfor, she says, treat her very well and she has managed to make a lot of friends inthe neighbourhood. Whenever she gets some free time she meets them. Vanita alsohelps her mother with all the household chores.
Two of Vanita's friends are going to school. When she sees them go to schoolshe feels that she has been deprived of the right to education. She says that givena chance she would still go back to school. Vanita is aware of the fact that thereare some schools in which girls are entitled to fr education, books and so on butshe realises that she does not have the time to go back to school and it would notmeet with her parents' approval.
190
206

Vanita's younger siblings - a brother and a sister, are both st_-:ying in school.She and her brother tend to have a lot of fights. Her mother aim s protects herbrother by saying that he is younger than Vanita. When Vanita comes home in theafternoon from work, there is no food kept aside for her. It is always assumed thatshe has eaten at her place of work. If one of her siblings goes out and buys somethingto eat, they never offer any to Vanita. This neglect and indifference hurts Vanita alot but she does not mention it to her family. Sometimes if she comes home tiredfrom work and refuses to help with the housework, she gets a beating from her mother.Vanita feels that nobody in her family (except for her father) supports her. Her fathertreats her well and tries to protect her as much as he can, and she is closer to herfather than she is to her mother.
Vanita does not remember when her menstrual periods began. She suffers frompain in the legs and stomach cramps when she has her periods. During periods certainrestrictions are observed such as sitting apart, not touching certain things and so on.Vanita does not like these customs but is unable to do anything about them. In heremployers' houses however, she does not follow any such custom as they do not appearto believe in them.
In Vanita's caste, girls get married by the age of 21 years. If a good proposalcomes along, the girls are married off any time after the age of eleven. Vanita wantsto get married soon and has already met a boy she would like to settle down with.He is a distant relative of hers living in the village. Her mother is against the marriageas she feels that the boy smokes, drinks and is unemployed. Vanita, however, hasfound out that this is not so. The boy intends to come to Bombay to meet her parents.Vanita does not plan to continue working as a maid after marriage. She would liketo get a job in a factory packing pins, clips and so on. Though the wages are notas rewarding, she believes that her husband will earn well and she would only workto supplement their income.
Vanita is sad about the fact that she is not treated well at home. She feels thateveryone tends to take her for granted. Whenever she sees her siblings carefree andplaying happily, she regrets the kind of life experiences she has had.
191

CASE STUDY - 5 ( Nagarjuna, Guntur)
Name . JanakiAge : 16
Village . NagarjunaArea : RuralState : Andhra Pradesh
Sixteen year old Janaki is living with her parents and siblings in Nagarjuna. Sheis the eldest of three children. Janaki's family belongs to a Forward Caste. Janaki wasmarried at the age of six to her maternal uncle who was fifteen years older thanher. She was sent to her in-law's house, after she attained puberty at the age of fifteen.After three months of marriage, she left her husband's house and came back home.She says that she was treated very badly by her husband. She says that he eventhreatened to kill her. The only person who was good to her was her mother-in-law(who was also her grandmother). However, Janaki's sister-in-law treated her veryshabbily. Her husband was said to have been having an affair with another woman.Janaki said that she would rather commit suicide than go back to her husband's house.
Janaki's family is Hindu and they belong to a socially forward caste. However,they are very poor and find it hard to make a reasonable living. They live in a kutchahouse which has electricity supply. Janaki's father is a tractor driver. Her motheroccasionally works as agricultural labour to help supplement the family's income.
Personal Profile of Janaki
Janaki has studied upto Class 5 in the local village school. Now that she is backat home she wants to continue her education. She had just appeared for her Class7 examinations privately. Janaki's father is very much against her continuing her studies.Janaki explains why. She says that as she is married, it is not socially proper forher to go into the village often which she would have to do to get her books, writeexaminations and so on, if she did pursue her studies. Also, if she gets through Class10, then her educational qualifications will be higher than her husband's, which wouldbe unacceptable to him. However, Janaki feels that education is very important andsays people who are educated can stand on their own feet, develop good friendshipsand increase their world awareness. She wants to study further and become a teacher.She also expressed a strong desire to be trained in a skill that would allow her toearn some money.
A day in Janaki's life begins with her waking up at six in the morning. Shethen fetches water from the nearby well, cleans the house, washes the utensils, washesthe clothes and helps out in other domestic chores. In her free time, she reads booksand occasionally listens to radio programmes. In the afternoons she chats with herneighbours for some time and then takes a nap. In the evenings, she attends to the
192
208

household chores again. When the family members come home, she spends time withthem and attends to them and then goes to sleep by 9 p.m.
janald's mother is very unhappy about what Janaki has had to go thiough. Shesays that the ideal age for a girl to get married is 18 but they had to get Janakimarried early because of family compulsions. She says that she wants her seconddaughter to be educated and employed before she gets married. Janaki's father insiststhat Janald must go back to her husband's house. Her mother is scared to send Janakiback but feels that she cannot take a stand against her husband's wishes.
When asked what qualities a 'good' girl should have, Janaki says that a goodgirl should do her household duties well and mind her own business. She shouldnot go out much or be visible to the critical eyes in the community. She feels thatobedience to parents is what is most important for both girls and boys. When Janakiwas in school she used to play a lot but all that has stopped now. Girls in her familyare not supposed to laugh loudly or go out alone to visit friends or relatives. Herbrother however is allowed to do as he pleases. Janaki says that an ideal husbandis one who does not drink, cheat on his wife or beat her.
193
. 209

CASE STUDY - 6 ( Gujarat)
Name . SangitaAge . 15
Village . AhmedabadArea . Urban SlumState . Gujarat
Sangita Kantibai Dantani is 15 years old and living with a family of nine membersin the Zoppadpatti slum in Ahmedabad. Her family consists of her parents, fiveyounger sisters and one younger brother. The parents are still hoping for another son.The last time her mother was pregnant, she found out that the unborn child wouldbe a girl and had an abortion. Sangita's uncles, grandparents and others live in thesame neighbourhood. Her family lives in a one-room pucca house. It has a verandai,with a small open space in front. The house has electricity and water supply but nobathroom or drainage. A mobile sulabh toilet comes to the slum during the morninghours; the residents also defecate in the open land.
Members of Sangita's family earn their livelihood by selling flowers and variousflower items. All the members of the family work in the family trade. They makedifferent kinds of garlands, gajaras, venis, kalagis and so on. The family earns aboutRs.1000 to Rs.1500 per month. They own both a television set and a radio.
Personal Profile
Sangita is five feet tall and weighs 38 kg. She has never been to school. Hercommunity firmly believes that there is no necessity for a girl to be educated. Allthey need is to be married to boys who can read and write. Most people in Sangita'sfamily are illiterate. Only her brother goes to school. Her parents know that educatedgirls are not appreciated in the marriage market. It is believed that educated girlswill not be submissive, obedient or hard working and would go 'astray'. A commonlyheld view is that girls should be uneducated and be well versed in domestic workand household economic activity.
Sangita spends her whole day in household chores. She wakes up at 6 a.m. andfetches water, cleans the utensils and prepares tea for her family. Then they all gooff to work and Sangita stays at home to look after the siblings, clean and cook. Atnoon she makes flower garlands, and gajaras for the family trade. In her free timeshe chats with her neighbours. In the evening, she cleans and cooks. Sometimes shewatches television for a little while.
When Sangita is given money to spend, she buys bangles and ribbons for herself.She enjoys going to fairs and festivals with other women. During the marriage seasonSangita accompanies her parents to their selling place to help them out.
194

Sangita had her menarche at the age of 13. Her family was pleased and celebratedthe event by feeding her with 'Halwa' as she had entered the 'Streedharma'. After'growing up' she is not allowed to talk to boys, stay out late or go out alone.
Sangita feels that all girls should be educated. She feels she is too old to studynow but hopes that she will have some opportunity to learn to read and write. Herparents want her to be married soon. The custom of bride price is practised in theircommunity. They get a small payment from the groom's side for their daughter. Sangitawould like to marry the boy that her parents choose for her. She expects him to bewell versed in the trade, earn well and not drink, gamble or beat his wife. Her parentswant her to marry into a respectable family in their community so that their ownfamily name will be enhanced.
195 21.1

CASE PROFILES
CASE PROFILE - 1 (Telengana/Hyderabad)
Name . AnasuyaAge : 10
Village . TaglepalliArea . RuralState . Andhra Pradesh
Ten year old Anasuya who is four feet tall and weighs about 30 kg, lives withher family in Taglepalli village which is in the Nizambad District. Her family consistsof her mother (45 years), her father and two brothers. They belong to the ScheduledCaste. Anasuya's parents have been living in Taglepalli for the past twenty two yearsand are both agricultural labourers who work for daily wages. Her mother was marriedat the age of ten and started having children soon after attaining puberty.
Anasuya's parents believe in the value of education and emphasize the importanceof it in their children's lives. They attribute their financial hardships in life to thefact that they are not educated and thus have made their children's education a priority.They have even incurred some financial debts to put their children through schooland college. The eldest son is completing his B.Com., the other one is in Intermediateand Anasuya is in Class 5. No school in Taglepalli has classes beyond the 3rd standardand thus Anasuya studies in a school at Varni which is about 5 km away fromTaglepalli. She stays at a hostel in Kotaiya Camp.
Anasuya's parents have given her a bicycle which she uses while coming homeon weekends and holidays. Anasuya's commuting on the bicycle is the subject of alot of ridicule from the neighbourhood boys. This however, does not affect Anasuyawho sees the practicality in her using a bicycle. While she is home on weekends andholidays, Anasuya helps her mother out with all the household chores. She regardsthese chores to be a woman's duty to her family and home.
Anasuya prices herself on being educated and talks about the importance of it.She feels that with an education she will not end up working in the fields as herparents do. Ar 1.suya's parents want her to be educated upto Class 10 but also planon looking out for a suitable groom for her as soon as she attains puberty. Whenasked why they want Anasuya to be married that early, their reply was ambivalent.They felt it would be very difficult to find a suitable boy after a certain age andtheir society does not approve of late marriages.
Anasuya's case profile shows a family trying to be progressive in their way oflife by encouraging the girl to stay in a hostel, to ride a bicycle and to aim at
196
212
completing high school. At the same time, they were an intrinsic part of a moreconservative community. Early marriage of daughters is one aspect of their culturethat they were not willing to change.
CASE PROFILE - 2 (Patna, Bihar)
NameAgeVillageAreaState
Renu Kumari11
HathiakanRuralBihar
Renu lives with her family of seven in Hathiakan village, Bihar. Shebelongs to one of the backward castes. Her native tongue is 'Magahi' adialect of Hindi. Renu's father is a landholder and they live in their ownhouse built of bricks and mud. They do not have any electrical or toiletfacilities. Water is fetched from a well and food is cooked on fires of wood, orcowdung cakes.
Renu is the eldest child. She is 4' 11" tall and weighs 25 kgs. She had someearly education at a Government school where the medium of instruction was Hindi.While at school she did not participate in any of the school activities. She was reportedto have been very keen on her education, but was st7red from going to school afterthree years of schooling as she had to help her mother with household chores. NowRenu spends her day engrossed in the daily routine of a household. She cooks, cleansand looks after her younger brother. Occasionally she even helps her father in thefields.
Renu does not seem very satisfied with her state of life. She has a perpetualgloomy expression on her face as her mother treats her very harshly. She seems afraidof her parents and would only talk freely when she was interviewed in private. Renuspoke about the strong tendency of her parents to discriminate between the boy childand the girl child. Her parents felt that the son would have to be strong to earnand look after the family, and thus justified their bias. Renu said that her brotherwas fed with milk, curds and butter while she and her sisters would get leftoversto eat. There was a similar discrimination with regard to health and educationalfacilities. The son was always given priority over the daughters. The parehts believedin giving the son the best of what they could afford.
Renu does not have time to rest or spend in any form of recreation. Notsurprisingly, she does not seem to be optimistic about her future.
197

CASE PROFILE - 3 ( Karaikudi)
NameAgeCityAreaState
Lakshmi15
KulanthiranpattuRuralTamil Nadu
akshmi lives in a village in Tamil Nadu in a family of landless labourers,belonging to one of the Scheduled Castes. She is fifteen years old and works as acasual agricultural labourer. Her parents and two urothers also work as agriculturallabour and the family finds it hard to make both ends meet. Lakshmi is the youngestof six children. Two of her elder brothers are married but are reported to be offeringno support to the family. Lakshmi's sister got married at the age of 16 but is currentlyliving with her parents as she had a quarrel with her husband and has left him.This sister has two daughters and a son under six years of age. Her children spendmost of their day playing on the streets.
Lakshmi's family lives in a mud but which does not have electricalfacilities. Cooking is done outside the house. Lakshmi does not have any kind offormal educational background. She has never been to school and attributes it tobeing scared of getting beaten by the teachers in school. The youngest of hErbrothers studied upto the fifth standard and then dropped out saying that he wasscared of the teachers.
At present, Lakshmi's father is unemployed and her mother is too sick to work.Thus Lakshmi is one of the few bread winners of the family. She leaves home at6 a.m. and comes back at dusk. She often walks back in darkness, as there are nostreet lights.
Lakshmi is paid in kind which is a common practice in the villages. Her jobfetches her 34 measures of grain per sack she collects. Men are paid 5-6 measuresof grain per sack but she cannot protest the discrimination. Lakshmi also does otherchores for the house such as fetching water from a distance of 1/4 km away.
Lakshmi's health is not too good. She looks very anaemic and has irregularperiods. She often suffers from severe stomach pains and claims that going to a doctorhas only made it worse. She uses herbal remedies to relieve the pain.
Cheerful and frank by nature, Lakshmi loves to wear nice clothes (polyester) whenshe goes to work. She realises that she is the support of her whole family and hasto carry a heavy responsibility at the age of fifteen.
198
x:14

CASE PROFILE - 4 ( Gulbarga )
Name . HulligammaAge . 13
City . KrishnanagarArea . RuralState . Karnataka
Hulligamma is a 13 year old girl child living in Krishnanagar. Her family isfrom a community that participated in the practice of the Devadasi system. TheDevadasi system is a practice where a young girl is dedicated to the local temple.She is expected to have certain ritual roles in the temple festivals. She is at the mercyof the priests and the affluent men in the area, who treat her as a sex object andshe is not allowed to pursue the normal life of a householder. In the larger taxonomy,Devadasis come under the category of Scheduled Castes.
Hulligamma was the second of two daughters. The older daughter, Hulligamma'selder sister had already been married off. The parents wanted a male child, sincemale progeny is considered indispensable for the continuity of the family name.
Her parents decided to offer Hulligamma as a Devadasi a sacrifice to the goddessYellamma with the prayer so that they would be blessed with a male child.
Hulligamma had no choice in the fate that was forced on her. Though she hadnot been deflowered, she was very articulate in expressing her extreme disgust at theidea of her body being used by many men. She felt trapped in a humiliating situation.
The Devadasi practice receives a three-fold sanction : religious, familial andsocietal. All of it could be ignored if the families were not also in conditions of abjectpoverty and at the lowest level of socio-economic status and privilege.
CASE PROFILE - 5 ( Mysore )
Name . RaziaAge . 15
City MysoreArea UrbanState Karnataka
Razia is a 15 year old girl from a Muslim family. She is the fifth of six children.She has three elder brothers and one elder sister, all of whom are married, and oneyounger sister. The household consists of Razia, her parents, her third brother andhis wife. The youngest girl lives with her second brother, some distance away. Razia'sfather is now retired and gets a pension. The brother who lives with them earns about
199

Rs.200/- a week His wife, who is 15 years old, has studied upto Class 8 and helpswith the housework. Razia has studied upto Class 5 in an Urdu medium school, andsays that she could not continue further because of her father's frequent transfers fromone place to another.
Razia was married at the age of 12 into what was supposed to be a 'good family'.However, in Razia's words, she was too naive and innocent at that time. After marriage,it took her all of three days to discover that her husband was hearing-impaired andcould not speak. Apparently this was not the bridegroom who had been selected byher father. Because of the custom c: covering the groom's face with a curtain of flowersduring the wedding, the change in identity was not discovered at the time. Thisdiscovery was a shock for Razia. She was also ill-treated by her mother-in-law whoberated her for minor errors. Razia did not know how to cook and her mother-in-law often abused her verbally or physically on this account. She also harassed Raziaby not giving her enough food to eat. When her mother-in-law tried to douse herin kerosene and set her on fire, Razia ran away from the house to her maternalaunt who lived nearby. Her family was then informed of the atrocities that Razia hadundergone. They were horrified and took her back immediately. She has been lookedafter by her own family ever since and says that she feels relieved.
While at home Razia learnt to roll 'beedies' and now earns about Rs.70/- a week.She spends most of her time working at this job and she also helps mother withthe household chores. Razia's average day goes like this. wakes up at6.00 a.m. and makes tea, washes the utensils, fetches water and help., the cooking.She then works at rolling beedies till late at night. As and when there are demandson her for household chores, she suspends her work with beedies and helps out. Raziasays that she would like to study and find a job that would give her a regular income,but her father does not approve. She would need to have several years of educationto be equipped for a salaried job.
Razia's community, according to her, does not approve of young girls going outon their own. They are supposed to go out only in the company of family members.Girls have to be in 'purdah' outside the house. She reports that males and femalesin the house are treated equally with respect to food, clothes and health. Razia's familyalso appears to be unusual in that, although Razia gives her entire earnings to herfather, he saves it for her in a 'chit fund' rather than spending it on the household.He also reiterates that she is free to spend her money as she pleases. He considersher happiness to be the most important thing. Razia is keen on saving money forher younger sister's wedding.
Razia's family would like her to get married again, perhaps in a few years' time,but she does not want to think about marriage just yet. Her priorities in life she saysare to get her sister married to a 'good person' and to help improve her family'seconomic condition.
200
216

Conclusion
The trials and tribulations of the girls suffering from harassment for dowry,physical violence and alcoholism of the men in the family make difficult reading. Wesee examples of girls married off to handicapped or chronically ill men, or desertedby the husband after the arrival of two or three children. The chilling horror of itall is that this is the dull everyday reality for many girls. The low level of opportunityfor self-expression and the absence of what might be considered leisure or recreationmakes life a stark and harsh experience for girls.
0Y0
4iai;ar_
201
217

Chapter IX
INTERVENTION PROGRAMMES
A number of intervention programmes were incorporated into the research design
and were implemented in the study sites for the project on the Girl Child and theFamily. These intervention programmes were initiated by conducting in-depth interviews
with the girls and the women of the village in order to identify major problems.Following this, programmes that would help ameliorate the situations were introduced.
The four basic areas covered by these intervention schemes were :
a) Literacy and Education
b) Gender Awareness
c) Health
d) Environment and Sanitation.
Literacy and Non-Formal Education
Several of the collaborating centres took up action programmes in the area ofliteracy and non-formal education, in response to the needs of the community. Specific
cases are discussed below.
The action programme in Telengana region, A.P. was organized in collaborationwith voluntary agencies. Nizamaba(4, like other districts of Telengana region, continues
to be a district where the social beliefs and practices support and reinforce the
subordination of women. The practice of identifying and dedicating Jogins is a
degradation. A prepubescent girl, usually from among the poorest families in the village
is dedicated to become a Jogin and then has to become a prostitute to the communityand undertake ritual tasks that are degrading and humiliating in several ways. Thevoluntary agency in the area holds a bi-weekly gathering of women for raising theirawareness of their condition. Literacy classes for w.Nmen, especially for Jogins, are heldregularly giving them access to the written word. The women's acquisition of information,
knowledge and literacy skills empowers them to perceive their subordination and to
resist their condition.
Most women of this region were very keen that their children should have aneducation. There was a lot of interest in having a school which would give both formaland vocational education. A consensus that a school be set up in that neighbourhoodwas reached. Subsequently, the buildings were nearing completion and the school was
expected to start functioning soon. The National Institute of Social Action, Hyderabad
202
216

and a voluntary agency in the area were engaged in planning programmes that couldbenefit women and girls. The research team of the Women's Studies Centre alsoparticipated in these neighbourhood activities.
Gopanpally village in Rangareddy District, A.P. is about 25 kms away fromHyderabad city and within walking distance of major educational, research and in-dustrial institutions. Nevertheless, it is rather underdeveloped. The team decided tohold a recreational workshop for children, consisting of games, story-telling, kite-makingand nature walks around the village. The Councillor and the Youth Club membershelped the proceedings by organising some food for the children. The studentvolunteers went to the primary school and engaged the children in singing, story tellingand story reading. The older children had suitable games and craft activities organisedfor them. There was much dancing and singing of film and folk music.
Other action programmes in this area included a local voluntary organisation'scultural troupe, which arrived announcing itself with drums and songs. The troupetaught everyone songs about the importance of literacy for women and girls. Therewere discussions with won-ten on education, marriage and size of family. All the womenwho participated in the activities expressed a desire to learn to read and write. Aspart of the National Literacy Mission, an instructor was appointed in the village. Thishas led to Gopanpally being adopted by the NSS unit of the University of Hyderabad.A full fledged literacy centre runs there now and there are plans to build a libraryand community centre.
In Tirupathi, a socio-economic survey was carried out by the research team in the village"Sri Venkatapathi Nagar". Based on the survey, courses in sericulture, basket weaving,tailoring and embroidery were taught to the women of the village. These vocationaltraining programmes were organised by the Mahila Mandal. Literacy activities werealso initiated at the university extension centres. Lectures and films that create awarenesson issues such as legal rights, family planning, health and sanitation were arranged.
In Bihar, the research team noticed that there was no ICDS (Anganwadi) Pro-gramme operating in the village. The team put in a request to the concerned officialsto start the programme. They found that the women of the village were eager to learncrafts which would give them a vocational skill. Girls and women who were aspirantsfor the training course were identified. The team met the Director of the District RuralDevelopment Agency, Patna and applied for the induction of training courses in sikkiwork, tailoring, embroidery and candle-making for the girls and women in the village.Other Government Departments were being contacted for training programmes ininstalling smokeless Chulahs and hand pumps. Thus the presence of the researchteam acted as a catalyst for energising the entire system.
In Ahmedabad, Gujarat, some of the girl children of the village, Zaloda, pressedthe team to teach them reading and writing, which the team did using their adult
203
219

education kits. Later, this task of continuing the girls' education was handed over tothe Anganwadi workers.
In Gulbarga, Karnataka, the Centre for Women's Studies, the NSS units ofwomen's colleges and other colleges under Gulbarga University, took up the respon-sibility of eradicating illiteracy in one village. A festival for the girl child was organisedin a slum in Mysore City. Children took part in art activities and presented songs,dances and skits. About 400 children participated.
In Maharashtra (Rajgarh), efforts were made to check the reason for girls droppingout from school. As a support to their school activities, the girls were mobilised tostart a library in their village.
In Orissa, in an under-developed section of Berhampur town, it was found thatmost of the women had never attended school and that girls in the age group ofseven to eighteen tended to discontinue their studies in order to work. The teamorganised meetings in collaboration with the school teachers and parents for generatingawareness about the importance of education for girls.
In Tamil Nadu, the team organised a skill training course throughout the KaraikudiMunicipality, for girls who had dropped out of school. In collaboration with twovoluntary organisations, the team selected prospective trainees and trained them forthree months in carpentry and screen printing. An exhibition was arranged at Pudukottaiin collaboration with a voluntary organisation. Topics such as female foeticide, femaleinfanticide, child marriage, employment opportunities, law and policies for women werehighlighted using posters, audio-visual aids and slogans.
Gender Awareness
The core of the problem of the subordinate status of the female is that it is
internalised by men and women in the culture. Gender awareness programmes musttherefore make a strong thrust if the intervention is to have any effect. A variety ofmethods were used by the research teams.
In Maharashtra, there is a traditional festival generally attended only by marriedwomen. The Pune research team arranged such a programme for all categories of womenincluding widows. The idea of doing so was to make them all feel welcome and toattack the concept of a "stigma" attached to widowhood. Gradually, the women openedup and started talking about their problems. Several meetings were organised later todiscuss the issues raised by them. One of these was the genetic basis for the sex ofthe infant. The XY chromosome factor was explained and the women were surprisedto hear that the sex of the child is determined by the father's genes. The practice ofchastising the mother for producing a girl child was discussed in that context. The equalityof sons and daughters was stressed as an ideal that could be practised.
204

In Telengana (A.P.) the team organised a workshop where the women discussedseveral issues including marriage, size of family and girl's education. A local voluntarygroup organised two street plays, one on the problems of early marriage, and theother on the significance of literacy and education for women, getting a lively response.
An awareness camp was organised for mothers and girls under the auspices ofthe local Mahila Mandal. The Mahila Mandal members were cooperative and publicisedthe news about the meeting well in advance. At the meeting many issues werediscussed openly. Problems of dowry and harassment by in-laws, the status of thegirl child, gender discrimination at school and in work and wages were also discussed.
An exercise in making women's lives visible was carried out by the team. Equippedwith a tape recorder and camera they went around the houses in the village takingphotographs and recording their conversations with women and girls. That most womenwere contributing productively and that they wanted to acquire more skills and be relievedof the drudgery of their daily chores became apparent to the community.
In the Telengana region, girl children were actively involved in a children'sworkshop which was organised in Gopanpally village. Women who assembled hada discussion on marriage, size of the family and other pertinent topics.
The Delhi team organised several activities in which raising awareness of genderinequality was the major agenda. Meetings, discussions, poster-exhibitions, filmshows all these methods were used to make the girls focus on the subjective aspectsof their low status in the family.
Health
A large number of interventions by the research teams centred on the improvementof the health status of women and children. Some examples from the participatingteams follow :
In the villages in Pune, the team organised meetings for women where theyexplained to them about the sex of the child being determined by the chromosomesof the father. The team also arranged a health camp at Pimpri with the help of avoluntary organisation working for community health. They put up poster exhibitionson nutritional diets, health and hygiene, family planning and immunization.
The team also organised functions at Parbhani with the local youth group andpresented a slide show on nutrition. They showed documentaries on alcoholism, earlymarriage and so on. Discussions based on the visuals were held with the girls of thecommunity.
In the village Chinapalakaluru, A.P., a health camp was held. Posters aboutimmunization and family planning were put up, medical checks were done and appropriate
205
221

treatment was given. In another health programme, a panel discussion on poverty, marriageand population control was held, with a doctor and a geneticist participating.
In Tirupati, lectures by experts on health and sanitation were organised and filmson family planning were also shown.
In West Bengal, in village Phulrnalanc_ha, a health and immunization camp wasorganised with the help of the Panchayat Pradhan. Issues on women's health, family planning
and birth control methods were discussed in a meeting of farmers and their families.
In Bihar, at village Danapur, an immunization camp was organised by the team.In collaboration with the Patna Family Welfare project, a baseline survey was madeof girls and young women regarding their awareness of the importance of familyplanning and its impact on the health of the mother and child. It was found thatofficial concern for health was related to a woman's reproductive functions and notto her sense of well being. Even then, gynaecological complaints are sometimesneglected or ignored, out of shyness or lack of confidence. The girls thus get lessthan adequate medical attention.
The team from Delhi made health interventions in many of their research areas.They took the help of a voluntary organisation and the Primary Health Centre toorganise health camps for the community in U.P. The health programmes consistedmainly of lectures and illustrated talks which dealt with topics such as child marriage,child motherhood and immunization, with an effort to mobilise the women to gainmore control over their own lives. In addition, a medical team was present to personallyattend to individual complaints. A day-long immunization camp also run by the healthpersonnel of the sub-centre, with the initiative provided by the research team.
The health camps and individual counselling revealed that women were generallysuffering from anaemia and hypotension (low blood pressure) which may have beendue to under-nutrition, overwork or frequent pregnancy.
In Baroda, as part of the health care and immunization programme, illustrated
talks were held for children. One-to-one talks and group discussions were held withpaediatricians and community workers, on the issues of health care for children.
In Karnataka, in Mandya district, a traditional feast for women and girls wasarranged with the help of Mandal Pradhan and the Assistant Director of Women andChild Development. Since the idiom of the function was familiar, women and girlsassembled with eagerness. After the feast, women's problems were analysed and ahealth check up was conducted.
In Karaikudi, Tamil Nadu, an exhibition on female foeticide, and female infanticidewas arranged at Pudukottai in collaboration with a voluntary organisation. This waswell attended and stimulated discussions in the community.
206
222

Environment and Sanitation
One of the major areas where the people have some control is that of sanitation.The immediate environment and its hygiene can be maintained by a well organisedcommunity without any extra investment.
In order to create awareness among rural children and women, the Women's.Studies Centre at Tirupati had arranged lectures and discussions on health and sani-tation. Films on environmental pollution were also shown.
The Bihar research team's visit had a salutary effect on one of the villages. Inthe village of Danapur Bhusaula in Bihar, sanitation facilities were found to be minimal.Hand pumps were not in working order, and water was generally fetched from alarge tank in the village, which had not been cleaned for a long time. The majorityof women were poor, especially those who worked as agricultural labourers. Due tothe efforts of the research team, two dry latrines were constructed for the women,new hand pumps were installed and three new wells were dug to ensure clean watersupply. Two old wells were also cleaned and renovated and the bottom of the village
tank was cleaned and fenced. This demonstration of self help made a great impacton the . community.
Issues pertaining to health and hygiene were discussed at women's meetingsand health camps by the Delhi University research team. In Bawai, the team met thewomen of two neighbouring villages in a public meeting. The preliminary meetingwas attended only by eight to ten women, who were mainly the office bearers ofthe Mahila Mandal. However, the final meeting was attended by over fifty women,children and men. The topics discussed varied from protection of forests andagricultural produce, to women's rights, marriage and health of women. The discussionswere lively and the audience participated freely. There was also a display of postersand pictures.
In Ahmedabad, Gujarat, the team demonstrated the construction of a smokelesschulah and created interest in the same among the families in the village. InBaroda, voluntary agencies, field staff, paediatricians, community workers andUniversity teachers acted as resource persons for programmes on hygiene andsanitation.
In Gulbarga, the University team served as a liaison between the people andthe Govt. They focussed on the need for health services for the people.
In Maharashtra, in a slum area of Jaikalwadi, discussions were held on severalproblems of the women. The steps to be taken to prevent scabies and diarrhoea intheir children were also explained.
207
223

In a village adjoining Berhampur, Orissa the location of the cowsheds wasdiscussed by the research team in the context of the environmental cleanliness and
a decision was made to relocate them.
In a neighbouring village, the research team took the help of the Sarpanch andalong with the village youth club, cleared some mosquito-breeding stagnant pools andthe people were made to feel more responsible for maintaining the level of hygienein their own village.
In the village of Katingia where dysentry and gastroenteritis were commonailments, discussions on their causes and remedies were held. The research team talkedto parents about the importance of safe drinking water, proper sanitation and cleansurroundings. Rehydration therapy was also a part of the instruction. The team advisedthe mothers on procedures which would help to purify the drinking water. Thus .every
opportunity was used to convey information on environmental sanitation and to givethe community the confidence to deal with its own problems.
Conclusion
A number of intervention programmes were initiated in the villages that wereused as study sites for the project on the Girl Child and the Family. The task wasa difficult one as the project team consisted of educated people from urbanized areasgoing into rural sites and interacting with the people there. People from cities arenot always welcome in the rural areas as their lifestyles usually differ. One of themembers of the project team described what they .did to overcome this. "Whileconducting our interviews, we stayed in the village for two weeks at a stretch. This
was done about three times in three months. This helped us to establish rapport withthe residents. Many informal sessions with the women of the village helped usunderstand the specific problems of women". This enabled the University team to plan
appropriate intervention schemes.
The way that the planning and execution of these intervention programmes wascarried out was described thus by of one of the members : "While conducting ourindepth interviews with the girls of the village we started identifying the issues for
which programmes would be most effective". They then ..-oceeded to initiate pro-grammes that would help ameliorate the situation.
The four basic areas covered by these intervention schemes were Gender Awareness,Health, Literacy and Education and Environment and Sanitation. The project teamrealised that the village women did not just want a mention of these broad topicsbut wanted in-depth discussions on them and related issues too. As one of the teammembers reported - "It was clear that the women did not just want inputs on healthfrom us". Their major interest was in the issues faced by the girl children of thevillage i.e. neglect of the girl child, sex-determination tests, teenage pregnancies,
208
224

child marriage, superstitions, branding of the girl child on different parts of the body,dowry-harassment, sexual molestation and the high rate of school drop-out among thegirl children.
The methods used in educating the rural families were interactive lectures anddiscussions, films, poster exhibitions and so on. One of the most effective methodswas using cultural programmes to highlight the problems (and their solutions) of thegirl child. This included the use of folk-lore, folk songs and drama.
The four basic areas of intervention will be discussed in separate sections below :
Gender Awareness
Efforts made to improve gender awareness included the organisation of a numberof recreational workshop and lectures where women were free to discuss their problems.Some of the topics discussed in an open forum were problems faced by women whohad to live with the "stigma" of widowhood, discrimination between males and females,dowry harassment and so on. Awareness camps were organised to educate the com-munity about the genetic basis of the sex of the child. They were informed that itwas the male's Y Chromosome that determined the sex of the child and thus the motherwas not responsible for it.
Apart from these discussions and lectures, there were street plays enacted whichfocussed on the theme of early marriage and the significance of literacy and education.It was found that drama served as an excellent medium for presenting these issues.As one of the team members stated, " The animators were excellent! Their style ofpresentation interspersed with role-play, songs and stories was appreciated a great deal.They did not give a boring speech on the girl child. Instead, they utilized folklorefor their purposes of bringing the theme to the foreground. They used satire, humourand word play to make their point clear. This encouraged a lot of women to openup and relate their problems to us".
Health
There were several intervention programmes which centred on the improvementof the status of health of the women and children in the villages. In conjunction withlocal voluntary agencies, poster exhibitions, films and slide shows were organised whichconcentrated on issues of health, hygiene, immunisation, nutritional diets, family plan-ning and so on. Along with the exhibitions, films and slide shows, there were alsoillustrated talks and open discussions on the above issues.
A number of health camps were held in many of the villages where doctors werebrought in to give free health checks and health advice to the villagers. The project team alsocarried out a survey to see how many of the girls and young women were aware of the
209225

importance of family planning and birth control. They were also asked if they knew about
the impact of the mother's health and nutrition on the baby's well being. These health camps
were sometimes extended to children in the schools. Illustrated talks and demonstrations
created an awareness in children on topics such as child marriage, early motherhood,immunisation and so on. There were also health camps for children.
In most cases, the major health problems pertaining to women were identifiedas anemia, low blood pressure, malnutrition, fatigue due to overwork and frequentpregnancies. Often, women and girl children tend to ignore their ailments and healthproblems due to shyness or lack of confidence. Thus, they generally get inadequate
medical attention.
Education and Literacy
Many efforts were made to improve the status of education in the villages. One
such effort was to eradicate social beliefs that lead to the subordination of women.One of the team members reported, "The first thing we talked about was the differentroles played by various family members. We tried to get information from the groupabout the different kinds of unrecognised work that the woman does in the house.Through this they realised that the girl child and woman do more than their malecounterparts. Then through songs we tried to explain that roles can be changed and
why it is important that they be changed".
In one of the centres, it was found that the mothers were very keen that theirchildren should get a good education. There was a lot of interest in opening a schoolwhich would give their children both formal and vocational education. This request
was agreed upon, the research team was able to convince the local government and
it was decided that the school would be opened soon.
Many recreational workshops were organised for the children. Activities in theseworkshops included art and crafts, games, story-telling, drama, kite-making, naturewalks and so on. The animators played a big role in involving the children in theongoing activities. "They told stories of girls working in fields, a princess who saveda king, a peasant who gave his land to both daugthers and sons, a girl who struggled
hard to become a doctor and so on". While narrating these stories the animators soughtthe children's involvement by asking them questions and stimulating them to completeportions of the stories. They also taught the children songs on gender justice. Thesemethods kept the children enthralled in the activities ; at the same time they werelearning about the injustices that the female child suffers and to protest against them.
In some cases, they were asked to write essays on the topics relating to the girl child,
which was followed by spirited discussions.
There were also a number of workshops, lectures and poster demonstrations heldto illustrate themes such as female foeticide, female infanticide, child marriage, child
210
L2G

labour and so on. Laws and policies for women were highlighted by the teams. Therewere plans for building community centres, libraries and vocational training centresat some of the villages. In one of the villages, bi-weekly meetings and literacy classeswere organised for the women of the village in collaboration with local voluntaryorganisations. Some of the topics discussed were marriage, size of the family, women'seducation and so on. It was interesting that the women who participated actively inthese discussions expressed a desire to become literate.
Environment and Sanitation
In order to create an awareness amongst the rural women and children on issuesof environment and sanitation, a number of lectures were organised. The topicsdiscussed in these lectures were home management, health and sanitation. Films wereshown on environmental pollution and other relevant themes.
The project team made a physical effort to improve the conditions of sanitationin the villages. In one of the villages the team helped construct two dry latrines forthe women. The research team provided the initiative and installed new hand pumps,dug new wells, and cleaned out old wells and stagnant pools around the village.
The research teams discussed health and hygiene, rehydration thereapy, protectionof forests, clean environment and women's rights and also served as a liaison between
the government and the people.
Overall, the intervention programmes went off successfully, although the projectteams did have their difficulties. One of the members related the frustrations that hadto be faced in some villages. "As none of the officials were available in the village,it was difficult even to get their permission to use the village noticeboard to announceour meeting. When we wished to examine the village census records c fr the population,
we faced virtual non-cooperation. The Gram Panchayat Office was always closed. Ifit had not been for the help we received from an Anganwadi worker, we would nothave been able to organise the programmes".
Some of these interventions were just beginnings. However, taken as a whole,
they do give an indication of what is possible if educational institutions and voluntaryorganisations get involved in poor rural and urban communities with a programmefocus on the girl child.
2112

Chapter X
AREA PROFILES
Topics Page No.
Rural Underdeveloped Areas
Dhakwa - Varanasi, U. P. 213
Gopanpally Telengana, A. P. 215
Keshwar - Gulbarga, Karnataka 216
Hathiakan - Patna, Bihar 217
Rural Developed Areas
Umele - Maharashtra 218
Anei Varanasi - U. P. 220
Gunar - West Bengal 221
Urban Areas
Karaikudi - Tamil Nadu 222
Gulbarga - Karnataka 223
Calcutta West Bengal 223
212
228

Chapter X
AREA PROFILES
This study has attempted to look at the current situation of the girl child:opportunities, privileges, disadvantages, discrimination. However, it is meaningless toabstract the girl child from her environment. The society and community in which shelives, and the family environment in which she is raised, all play major roles in shapingher life. Moreover, the geographical area from which she comes also determines, toa large extent, how she spends her time and what activities fill her day.
Given the wide cross-section of geographical areas from which the girl childrenin this study are drawn, it was thought prudent to summarise a few area profiles soas to give an idea of the setting of their lives. The statistical tables elsewhere in thestudy give an overall idea of the situation of the girl child in India. The area profilesin this chapter, profiles of selected areas in Northern, Southern, Eastern and Westernparts of the country, help provide the reader with a picture of the actual area in whichtheir daily life is embedded and the various environmental conditions that may beresponsible for the opportunities in the life of the girl child.
The area profiles are presented under the following headings:a) Rural underdeveloped area b) Rural developed area and c) Urban area.
RURAL UNDERDEVELOPED AREAS
Dhakwa - Varanasi, U.P.
Dhakwa was chosen as a low female literacy village from an underdevelopeddistrict.
The nearest city is 5 kms away. The village comprises seven hamlets, which arewidely dispersed. Only a few are served by roads; the others are approachable onlyby narrow and uneven paths. The total area of the village is 28,855 acres, and itcomprises 271 households. The total population of the village is 1623: 830 male and793 female.
The literacy rate of this village is 24%, which is lower than the State level (41 . 71%).The female literacy rate is 10 . 71%, far lower than the State (26 . 02%) female literacylevel. There is only one primary school in the village, with 135 students. Children haveto go to neighbouring towns or cities for further education, and while boys aresometimes sent to schools outside the village, girls are seldom given this opportunity.
213
c)(104,4o

The nearest hospital and clinic facilities are available one km. away fromthe village. Immunization, maternity and child care facilities are available 1 .5 kmsaway, and a government hospital as well as traditional medical facilities areavailable in Sultanpur, 5 kms away.
Handpumps and wells are the main source of drinking water. Only two of thehamlets of the village have handpumps installed by the Government.
The main occupation of the people of the village is agriculture. Some own land,but other are landless and work as agricultural or non-agricultural labourers. Mostwomen and girls are involved in household activities or on family farms. Wages arepaid either in cash or in kind. People in one of the hamlets are engaged in the brewingof illicit liquor. Men, women and children work together in this activity. The children,therefore, do not attend school.
,:ly,14.*t,
1'
<
,
,I er
-
ar- 447;
4ort
-
'7" ...N.*t ;
. - tlar,u-, .
Many crimes in the village go unreported, especially those against women.
Wheat and rice are the staple foods of the village. The village is situated in aflood-prone area. Two of the hamlets, situated on the banks of the river Gomti, areflooded almost every year during the monsoons.
Tubewells in the village promote the irrigation and farming of agricultural land.Both state and private tubewells are operational in the village.
214
2O

Several developmsintal projects are being carried out in the village, such asthe Indo-Dutch Tubewell Project, the Indo-Canadian Fertilizer Project and thePlant Protection unit. The Government provides a subsidy for toilets, smokelesschulahs and bio-gas facilities, but not many people seem to be aware of theexistence of these amenities. The village has a functioning Gram Panchayat, butfemale participation is negligible. Due to inadequate educational facilities and the needfor girls to help on farms or in the household, girl children, by and large, do notattend school.
Gopanpally - Telengana, A.P.
Gopanpally village is about 10 km away from the national highway and is nestledbehind the vast expanse of the University of Hyderabad. The village is about 20 kmsaway from Hyderabad City.
Gopanpally village has about 200 households. The principal occupation of thevillage is agriculture, aside from which some inhabitants also work as stone crushersand construction workers.
The village has electricity but faces severe water shortages. There is a Fair Priceshop and a Post Office located in the village while the nearest Police Station, TelegraphOffice, Bank and Railway Station are all 5 kms away at the Mandal Headquarters inLingampally.
The approach road to the village is pucca. Gopanpally has a bus service connectingit both to the Mandal Headquarters as well as to Hyderabad City.
There is no Primary Health Centre or sub-centre in the village. All medicaltreatment is attended to at Lingampally where a private doctor runs a clinic for a fewhours every morning.
Gopanpally village has a Govt. Primary School upto Class 3. There is also aLiteracy Centre there which is a part of the National Literacy Mission. A SecondarySchool as well as an ITI and a Junior college also function in Lingampally.
Though the Gopanpally village is situated behind the University of Hyderabadand several men of the village work as daily wage labourers on the Campus, theproximity of the University has had no significant impact on the village, not eveneducationally. The Navodaya School which is located on the University site and about1000 yards away from the villages, is remote and inaccessible to the children of thevillage. Ironically, Gopanpally village is part of Serilingampally Mandal which has over34% literacy and ranks as one of the most developed Mandals in Ranga Reddy district.Within this Mandal's compound there are several educational research and Central
215
231

Government undertakings. However, these seem to make little difference to the devel-opment of Gopanpally.
Keshwar Guibarga - Karnataka
Keshwar is a small village in Yadgir taluka of Gulbarga diStrict. It is about 50km away from Yadgir, and 8 km away from the nearest town, Gurmitkal. Keshwaris a dusty little village covering 508.64 hectares of land. Its population is about 1608,with an equal number of men and women. Most of the houses in the village are madeof mud and stone. There is one big tank in Keshwar which serves as the main sourceof water for the residents. Summers are very severe in Keshwar and the tank oftendries up. During the rainy season, it floods over. Nevertheless, this tank is the onlyspot of beauty in the entire village.
Keshwar does not offer many amenities to its inhabitants. People often haveto go to the nearby. village Gurmitkal in search of necessities such as medicalhelp. Keshwar has no Primary Health Centre and the Auxiliary Nurse Midwife is 4kms away in a village called Chanderki. In Keshwar there are no doctors and theANM is not always traceable. The Government hospital is 8 kms away andthere is no easy way of getting to it in the neighbouring village. Pregnancy andchildbirth are often unattended, and an emergency delivery of a baby is obviously agreat risk.
Transport in and out of the village is a problem. There are crowded KSRTC buseswhich pass through the village every now and again, but are not reliable. Sometimesthey are overcrowded and at other times they do not stop at the village at all. Mostof the villagers own cattle and make their daily earnings by selling milk. In order tosell milk they need to go to Gurmitkal for which they have to depend on public transport.They wait at the bus stop from 4.45 a.m. to catch the 6.15 a.m. bus. Most often, thesebuses do not stop at the village and people have to walk a distance of 8 km to Gurmitkaljust to sell their milk. Many a time, the milk gets spoilt because of the heat and isnot suitable for consumption. This is financially devastating to the milk sellers.
Keshwar has fifteen wells. Six are meant to have electric pumps fitted to them.In reality, the electrification of the wells does not work and this poses a great problemto the families. Lampposts and tanks have also been installed in the village. However,the lampposts give no light and the tanks give no water. The tanks have yet to befitted with taps. There is one community toilet which has not been used, as a goathad died there when it had just been built. People continue to defecate in open spaces,not far from their living quarters.
Keshwar has an Anganwadi and a Primary School which are both housed in thesame two-room school building. Teaching goes on simultaneously for all the classes
216

in the same two rooms. Two, sometimes three different classes are held in the sameroom and the only way the teacher can get heard is by shouting louder than the other
teacher in class. This results in a great deal of noise, wh;ch poses a real challengeto knowledge acquisition. A high number of girl children drop out at the Primary level.
Approximately 121 males and 74 females attend middle school at Gurmitkal, but not
a single girl in Keshwar has completed Secondary education.
The overall literacy level of Keshwar is 8 . 84%. Female literacy is as low as 0 . 66%.
The primary reason for this very low level of female literacy is that 80% of the girlchildren are married off by the age off ten. "Cradle marriages" are also very common.
The people of Keshwar follow the custom of 'bride-price'. The extent of poverty inKeshwar results in the parents coveting the. money of bride-price and giving away theirdaughters in marriage while they are very young.
Keshwar ha:, no provisions for a community centre or for any entertainment.
Hathiakan - Bihar
The village of Hathiakan is in the district of Patna. The total area of the villageis about 60 acres of residential land and 2015 acres of wasteland. About 5 acres areused for grazing purposes and there is a village pond.
Hathiakan has a population of 5267 people out of which 2767 are males and 2500
are females. There are 610 households in the village and the density of the population
is 460 per acre. The village population has a majority of Hindus with a minority ofother religious groups.
The village is rich in horticulture of which the main products are vegetables,especially potatoes and onions. The village does not grow any kinds of cereals at all.The residents usually sell potatoes and onions to buy wheat and rice for everydayneeds. Although the main occupation of the residents of Hathiakan village is growingvegetables, some people work in nearby towns in the service sector. Some are alsoemployed in the Railways, Hospitals and other Governmental and non-Governmentalorganisations. A number of them work as casual labour on a daily wage.
Hathiakan consists of seven 'tolas' or habitats scattered in the middle of farm land.Some tolas are approachable by a pucca road while others only have mud roads leading
to them. The nearest post office is about 1/2 km away. Other important facilities suchas Telegraph, Police Post and so on are in the nearby village of Danapur. There are
branch offices of Punjab National Bank and the State Bank of India, which are about3 kms away, and a Fair Price Shop about one km. away.
There is a Government Canal near the village, but it is mostly dry. It has wateronly during the rainy season. Drinking water comes from wells and hand pumps. About
217
'33

half the number of hand pumps are privately owned. There are about 25 private and25 government hand pumps and about 50 wells in the village. Toilet facilities areavailable in very few houses.
There is no hospital in Hathiakan and people have to travel to Danapur to availof medical facilities. Both in the Railway Hospital and the Military Hospital sophis-ticated medical facilities are available. The village has a Primary Health Centre andthere are also Veterinary services available.
About 1787 people in the village are literate, while 1380 females and 980 menare non-literate. There are five schools at Primary and Middle levels. There is noprovision for pre-school education in the village and the ICDS seems not to havereached there. There are High Schools in Danapur, Khagul, Sarai and Nargada whichare nearby villages.
RURAL DEVELOPED AREAS
Umele - Maharashtra
Umele, a wetland area located in Vasai taluka is in the Thane district. The totalpopulation of this village is about 5233 people, comprising 613 households. Thepopulation is composed of families from a variety of religions: Hindu, Muslim, Christianan.2 others. They co-exist together, peacefully. The total agricultural land of Umele is:round 370 acres. The major occupations of the people are agriculture, animal hus-
2t8
4"40 3'1

bandry, small scale industry and working in the service sector. Those who own farmswork on them with the help of their families and others either work in the fields asagricultural labourers, or move on to other jobs outside the village. It was noted that3493 of the village residents were literate.
In terms of infrastructural facilities, Umele has electricity, but only nine connectionsare available. The village has a main road which leads to Naigaon and Vasai. It hasa few small-scale industries. There is a Post-office, a Telegraph office, a Fair price shopand a Bank. For other facilities, the people go to the neighbouring village Papadi, orto the town Vasai, which is about 7 kms. away. Water is available from nine publictaps and five private taps. There are seven wells in Umele and one handpump. Bothprivate and public sanitation facilities are available, some with and some without water.The village also has a pucca approach road which leads to the village and ends atthe village square.
Umele has no Government hospitals and not even a Primary Health Centre. Theseare available only in Vasai. However, according to reports 100% immunisation has beenachieved in this village. School teachers and Gramsevikas help run the family planningcampaign and take the adults to Vasai or Naigaon for treatment.
Educational facilities in Umele consist of an Anganwadi, a primary school anda middle school. High schools and colleges are all in Papadi, Vasai and Naigaon.There are many voluntary organisations and institutions that operate in the village.Some of these are Shramik Mahila Mandal, Sevadal and Gram Yuvak Mandal. Thewomen of Umele seem quite educated; a number of them go for higher studiesto Bombay. Quite a few of them work in Bombay or in the periphery of the city.The general population seems to be quite influenced by the proximity of a bigcity. They encourage both their male and female children to pursue higher edu-cation. There are also many marriages of personal choice in the community, whichappear to be quite easily accepted.
At present, the in-migration in the periphery of the village is increasing. The tribalpeople of Thane district constitute the main chunk of the migrant population. Thissection of the village is characterised by poverty, lack of sanitation and inadequatepublic facilities.
While Umele would be considered a developed village, given the statisticsas a whole, there are still wide differences in the access to resources. A girl childfrom the migrant tribal group would find herself at a disadvantage on manycounts.
The possibility of some families in a developed area being at the low end ofprivilege and with no control over natural resources cannot be ruled out. The exampleof the tribal families in I Jrnele bears this out.
219

Anei - Varanasi, U.P.
Anei, a village in Varanasi district, was selected as a high female literacy villagefrom a developed district for this survey.
According to the 1981 census, the village covers an area of around 13,500 acres,with a total population of 1668 persons living in 262 households; this survey 12 yearslater listed 350 households.
Anei is well-connected; a tar road cuts through the village and connects it toJaunpur. There is a frequent bus service connecting the village to other areas and mostof the village streets are pucca. Post Office, Bank and Telephone Services are available.A circular road that will encircle the entire village is under construe' ion. Anei has aGram Panchayat, a Nav Panchayat and a Co-operative Society.
The village has both Hindu and Muslim households, and several Hindu castesare represented. Agriculture, service, business, petty business and labour are the mainoccupations. Girls and women are most often involved in household work, while someengage in spinning and others run bangle shops and tea shops.
The village has access to medical facilities within a radius of 10 kms. For moreserious problems people go to Varanasi, 36 kms. away.
The village has had a primary school for girls since 1904, and this has beensubsequently upgraded to the eighth standard. The school was set up by a child widow,who appointed teachers from the village to staff it. This has encouraged many families
to send girls to school. Besides this, there are several private schools, a "madrasa" (aschool for religious instruction in Islam) and an Intermediate College. The percentageof female literates is 40%. This is higher than the district level (31 . 85%) and the Statelevel (26 . 02%).
The irrigation needs of the village were served by a canal till 1950, when tubewellsstarted supplementing it. The village was electrified in 1960 and almost all houses haveelectricity. A drinking water tank was built in the village in 1930. Wells and handpumpsare the main sources of drinking water. Recently, water pipes and taps have been fittedand it is expected that water will soon be supplied through these.
Several Government programmes have beDn implemented for the betterment ofthe people. Thirty-three one room houses were constructed for members of the Sched-uled Castes. Apartment blocks and roads have been constructed under the jawaharRojgar Yojana. The Gandhi Ashram in the village introduced a scheme to train womento spin. There is a scheme for handicapped children but no one is making use ofit. Some widows receive pensions. According to the police station at Baragaon, thereare no reported crimes against women from this village.
2203 (

All these factors point to one thing: that Anei is a well developed village andprovides a stable and favourable environment for the growth and development of thegirl child. Girls in this village appear to have more opportunity for education thanmost.
Gunar - West Bengal
The village Gunar was chosen for this survey as a high female literacy villagefrom a developed district. The village covers about 425 acres of land, of which about400 acres are cultivated. The residential area covers around 15 acres.
The village is built on a slightly elevated land mass, sloping down towards themain road about half a kilometre away. All the roads within the village are extremelynarrow, and permit travel by foot or bicycle only. This is a flood-prone area, and aheavy shower is enough to make the roads so slushy and muddy as to render themalmost unusable.
Houses are clustered largely according to caste, and most of the houses are kutchaor made of mud, thatch and improvised material. The village is electrified, though thevoltage at all times is low and there are frequent power-cuts.
Only 13 acres of the 400 acres of cultivated land are irrigated. The main sourcesof water for irrigation are ponds, water tanks and shallow tubewells. Of tenexisting tubewells, three have been disconnected by the Government. TheGovernment Canal and electrified deep tubewell are non-functional, and theriver next to the village is dry for most of the year. Drinking water comesfrom seventy-six handpumps, of which six have been built by theGovernment and the rest are privately owned. Water for all other purposescomes from the fifteen ponds in the village, only four of which are usedfor irrigation.
The closest Primary Health Centre is situated in a village 5 kms away, and thenearest Government hospital is at Raina II, also about 5 kms away. There is a PrimaryHealth Centre, in a neighbouring village about half a km away.
There is an Anganwadi (ICDS Centre) within the village as well as a co-educationalprimary school. The nearest high school is half a kilometre away and the distance tothe nearest college is 7 kms.
The total population of the village is around 1229 (according to the 1981 Census) ofwhich 656 are male and 573 female, residing in 212 households. The settlement is predomi-nantly Hindu, with about 33 households of Scheduled Castes and 30 households ofScheduled Tribes. Most people work in cultivation (as owner-farmers, share croppers oragricultural labourers) although there are also a few businessmen and men in salaried jobs.
221
237

The village Panchayat is very active and has implemented the following pro-grammes: a) IRDP & RLEGP, b) afforestation c) advancement of irrigation d) productionof High Yielding Varieties and e) relief operations. Almost all the children are enrolledin school, and attend either the village primary school or the high school in theneighbouring village, although there are a few who have dropped out. Adult literacyclasses are now being held under the National Literacy Programme and have receivedwidespread support.
Gunar is a fairly affluent village. It is well connected by road and rail to manytowns in the region, as well as to Calcutta. Schools and colleges are withineasy reach and can thus be availed of by both boys and girls, since economicconditions are not a constraint in most cases. All these are likely to bepositive influences on the condition of the girl child. One major problem appears tobe the flood-prone nature of the area. During the rains, the village roads arepractically unusable, making schools inaccessible and increasing the school dropout rateamong girls substantially.
URBAN AREAS
Karaikudi - Tamil Nadu
Karaikudi is the most populous town in the Pasumpon Muthuramalinga ThevarDistrict situated in the southern region of Tamil Nadu. It is an urban area with highfemale literacy. The population of this area is about 3505 people: 1707 males and 1798females. The majority of the ,population is Hindu with a few Muslim and Christianfamilies. The predominant community here is that of the Chettiars, whose ancestralvillages are spread in and around Karaikudi. Most of the people residing in this areaare professional or in the service sector. There are some businessmen and self-employedpersons as well.
The total geographic area is about 80 acres. The soil in Karaikudi has hard redlaterite and is not suitable for agriculture.
The town of Karaikudi is about 1/2 km away from a main metalled road. Withinthe area there are both kutcha and pucca roads. The main mode of transport for theresidents is the town bus and service to and from the bus stop to other areas isprovided by autorickshaw and cycle rickshaw.
Most of the houses in Karaikudi are pucca. Some houses are both kutcha andpucca and there are a few huts too. There is a primary school with a Balwadi in thetown and a co-educational Higher Secondary School and a Girls' Higher SecondarySchool at a distance of 1 km. There are also five high schools, a Co-educationalGovernment College, a State University, a Polytechnic Institute, and Engineering Collegeand a Central Electro-Chemical Research Institute.
222
11;38

There is a Municipal Maternity Centre which functions in this area. The GovernmentHospital is about 1/2 km away and there is a Siddha Medicine Centre (Indian Medicine)attached to the hospital. There is also a community health worker in the area. Apart fromthis, there are three private clinics and a number of private doctors running clinics in their
. own houses. Most of these are about a kilometre away from the centre of Karaikudi.
There are many water connections inside the residential houses. Karaikudi hastwo wells and one public water tank which are used for household purposes only.The town has 6. public municipal water taps, 262 tap points for domestic purposesand 8 points for non-domestic purposes.
The town of Karaikudi has electricity, but not all homes have access to its use.There are only 379 domestic connections, 99 street light connections and two industrialconnections. Facilities such as Post Office, Telephone and Telegraph Offices, Fair PriceShop and Banks are all within the radius of a kilometre. A market open everydayis also about 1/2 km. away. There are also 6 cinema halls, 2 playgrounds, 6 privatecommunity halls and a public library.
Gulbarga - Karnataka
Gulbarga city, a survey said, has the highest number of slums. The district ofGulbarga is considered to be one of the most backward districts in Karnataka. Mostof the slum dwellers of this area are employed as domestic servants, constructionworkers, factory workers, rickshaw pullers and auto-rickshaw drivers. These slums lackthe basic amenities in spite of being in a city with access to urban facilities such ashospitals, schools, health centres, social welfare offices, voluntary organisations and soon. They have little idea of the Government schemes which are meant for their benefit.They do have an idea that banks may give them loans for certain things but no onehas the time to tell them what those .things are.
Even though the slum dwellers are entitled to certain benefits, they are notrecipients of it. They say that schools charge them fees and that Government hospitalsdo not give them free medicines. They are treated with indifference everywhere. Theyhave no source of entertainment in their area. There are no community halls, sportsfacilities, cinema or television.
Many of the people live in one-room huts and the size of their families rangesfrom three to ten. There are no facilities for drainage, water or electricity. The toiletsare a breeding ground for disease. Malaria and elephantiasis are not uncommon, eventhough there is a Health Office in Gulbarga for the eradication of Malaria.
Calcutta - West Bengal
Calcutta was chosen for the survey as the urban area with low female literacy.There were 100 households in the sample, 50 of which were from slum areas and the
223
239

other 50 from non-slum middle class areas. The ward covers about 3.2 sq. kms. andhas about 10 kms. of paved roads.
The slum chosen for the survey has a mixed population of Hindus, Muslims,Christians, Sikhs and Buddhists. The houses are built extremely close to one another.Some are kutcha and some pucca, but most are a combination of the two. Generallythey have just one room, which is used for everything including cooking and bathing.There is an acute shortage of drinking water in the area - handpumps or corporationtaps are few and far between. The entire ward has only about 120 public taps, eachserving about 30 households. (Each of the houses in the non-slum areas has individualtap points provided by the Government). Public toilets are also very few in number,and each serves 50-60 slum households.
The non-slum area has wide, paved roads and the residents live in large puccahouses or apartments. There are three primary schools, six middle schools and eighthigh schools in the ward. Enrolment in schou varies sharply according to whetherchildren come from slum or non-slum areas.
There are no Primary Health Centres or Government Hospitals within the ward.There is however a private nursing home as well as a hospital which serves the Portemployees. There are several private practitioners and accessible clinics in the neigh-bouring wards. In addition a mobile medical service is operated by the CalcuttaMetropolitan Development Authority.
The total population of the ward is 46,244 (according to the 1981 census) of which29,936 are male and 16,308 are female, residing in 12,209 households. Most of theresidents of the non-slum areas are in service or business. Residents of the slum areaare involved in several types of occupations petty business, trading, daily labour,carpentry etc.
The ward is under the jurisdiction of the Calcutta Municipal Corporation and isrepresented by one elected Councillor. Some employment generating schemes have beenbegun by Government authorities but the system does not function very efficiently.
A sharp contrast is evident between the slum and non-slum areas of the ward.In the non-slum middle class areas, the development of the girl child is not beinghindered in any obvious manner. She generally comes from a well-to-do family, ishealthy, well-looked after, enrolled in a privately-run school and has the opportunityto participate in extra-curricular activities. At the other end of the scale, the girl childfrom the slum areas is undernourished and overworked at home, as she takes on theburden of both housework and sibling care. She lives in the most unhygienic ofsurroundings. Obviously, school attendance suffers; only about 60% of the girls are everenrolled in school, and most of them drop out after the primary or middle level.
224
0

Chapter XI
CONCLUSIONS AND POLICY IMPLICATIONS
The chapter is presented in three parts :
Part I Findings of the StudyPart II State Policy and Programmes : An Overview
Part III Directions for Action
PART I - FINDINGS OF THE STUDY
The Household
Some of the major data regarding the demographic profile of the families canbe summed up as follows :
More than 85% of the families claimed Hinduism as their religion, while 7%claimed Islam and the rest were from other groups. Out of the sample, 26% werefrom Scheduled Castes and Tribes. About 29% of the families had agriculture as themain household occupation, while agricultural labour and other manual labour togetherconstituted about 16% of the sample. Most of the families (about 70%) had no subsidiaryhousehold occupation, while the rest were in business, piece rate work or crafts.
More than 80% of the families owned their homes, however modest. In the total sampleabout 56% owned no land; about 7% owned more than five acres while the rest hadmarginal holdings of agricultural land. Likewise, 63% of the families owned no livestock,while 24% owned mulch cattle. Almost 75% of the families owned no agriculturalimplements and only about 1% of them owned tractor, pumpset etc. Among the families54% owned no conveyance, while 33% had bicycles and 10% had scooter or moped.Regarding audiovisual equipment, about 37% of the families owned nothing, while 27%had a transistor radio and about 30% owned a television set. About half the entire lotof families had no household appliances, except the minimal cooking pots.
Regarding the benefit received or seen to be received from Government programmes,about half the number of families seem to have been reached as a whole. About a thirdof the families felt that there was no benefit from Government schemes. This proportionof non-beneficiaries (or such perception) went up to 60% when it came to income-generatingschemes. Again, about half of all families claimed no benefit from health or children-oriented programmes. More than a third of the total sample said that there was no benefitfrom any educational programme, and this proportion of non-beneficiaries went up for
225
0 -4

Housing programmes. About half of all the families had been reached by at least oneWelfare scheme. However, the positive impact of development schemes on income wasreported by about 21%, while about 60% said that there was no impact. The same questionregarding impact on health had a response of no impact from 41% and another 42%accepting that there was some impact. About the same proportion of families acceptedthat development schemes has some impact on education. Altogether about half the familiesseem to be out of the range of development programmes of the Government, while about21% of the families say that development programmes had an adverse impact due toproblems in implementation and to corrupt practices.
Regarding socio-economic status of families, several variables were assessed. While80% of the families owned their own homes, the range of rent paid was from Rs.50 toRs.200/- with only about 4% of the entire sample paying more than Rs.1000/- p.m. Thenumber of rooms in dwelling varied from one room (26%) or two (34%) to three (19%).About two-thirds of all families had no source of drinking water within the house, whileabout 25% had a tap. For all the families, drinking water was available in the village,or within a distance of 2 km. Fetching the water is shared by members of the household,but continues to be a female prerogative for about half of all the families.
While electricity was available in 95% of the areas, about 30% of the familiesdid not have it in their homes. For about 25% of the families, a flush latrine wasavailable in the home while 54% of the people had no toilet facilities at all. Almost80% of all families used wood, coal, dung or kerosene as fuel for cooking and onlyabout 17% had access to more modern fuels.
About 72% of the families were nuclear in structure and another 11% had oneor two dependent members staying with the nuclear family. Only about 17% of allfamilies were either joint or extended. Most families have 5 or 6 members and theaverage number of children that mothers in the sample have is 3.4. About 89% of
the households had intact families, while 10% of the adult women had gone throughdivorce, desertion or widowhood. Only 0.5% of the girl children fell into the categoryof being divorced or widowed.
The age of the fathers in the families ranged from 30 to 55 years, while themothers ranged from 25 to 45 years.
The literacy status of the families was as follows :
While 31% of the fathers were not literate, 57% of the mothers fell into thatcategory. The large majority of fathers and mothers did not go much beyond the HigherSecondary stage; while about 13% of the fathers had educational qualifications beyondthat level, only about 3.5% of the mothers did.
On the question of father's occupation, 10.3% were unskilled labour in diverseareas and 10% were agricultural labour. Other categories were skilled workers, marginal
226
1

farmers and those working in regular jobs. Among the mothers, about 20% wereagricultural labour and about 7% were in home-based crafts, while a majority (morethan 60%) were not working for a wage. Most of the work is in the unorganisedsector with its attendant traits of low job security and marginal wages.
About 55% of the fathers (of the girl children) have an income ranging fromRs.300 to Rs.1500/- p.m. About 65% of the mothers do not work or do not have an income,while those that do work earn generally between Rs.100/- to Rs.300/- p.m. About 30%of the mothers (three-fourths of the number that work for a wage) are paid in cash.
Most families (72%) have two male earners, while about 39% have one femaleearner. About 12% of the families have a girl child earning and about 10% of thefamilies have a boy child earning. Total household incomes range from Rs.500 toRs.3000/- with the per capita income ranging from Rs.100 to Rs.600/- pm.
About two-thirds of all the families had no debts, while a little over 20% ofthe families owed between Rs.1000 and Rs.10,000/-.
This bird's eye view of the demographic data locates our average family clearlyin the lower rungs of the SES ladder.
Socialization
Talking about children as a category leads to confusion, since boys and girls havequite different life experiences. It should now become a truism, as the findings ofthis study are analysed.
The birth of a girl child is desired and celebrated only by 2% of the familiesand the proportion is constant across socio-economic and educational levels. If thereis one cultural trait that cuts across barriers of religion, region and caste, it is thisdevaluation of the girl child.
A description of the daily activities of the girl child reveals that about 55% ofthe families eat together, but about 34% of the girls eat only with their mothers.Housework is an activity that about 78% of the girls share with their mothers. About28% girls get skill training from mothers and about 8% share time with mothers inoccupational tasks. The same proportion of girls (8%) spend home-work time with theirmothers and fathers, but that is all. Recreation, fun and play are not activities sharedby girls with their parents. The father withdraws from most interactions and opts outof being a relevant parent.
There is a great deal of gender segregation within the family with householdtasks like sweeping and cooking being unambiguously female tasks. Socio-economicstatus does make some difference to the time girl children spend on their studies,but the time spent by girls on housework and cooking varies only very slightly witheconomic status. Boys and girls in the same family seldom play together.
227
243
On gender differences in rewards and punishments, there was nothing verynoticeable; nevertheless certain sub-samples did reveal that girl children got rewardedsignificantly fewer times.
The girl child's life is physically and metaphorically circumscribed. If she hasto go out at 411 she has to be accompanied by a family member or go in a group.Regular trips to school, market or clinic have to be made but it is seldom that thegirl child is permitted to go idone anywhere. There is a little relaxation of social rulesrelated to parental levels of education. A higher level of occupation or education (withinthe span selected in the study) reduces the percentage of girls feeling restricted, butit does not do away with "rules". The boys enjoy more freedom in every sphere,including paradoxically in making friends with the opposite sex !
The girls feel that the value for their education will disappear once they are married,as being educationally accomplished is not an admired attribute for a daughter-in-law!The girl child knows that with marriage her choices get even more restricted.
The girl child does a multitude of tasks, but in characteristic self-depreciationconsiders them to. be "unskilled" jobs. Nevertheless, where skills are learnt, they arelearnt from the mother or from friends or occasionally from school.
The household tasks which only girls do (and not boys) are in order of time spent,sweeping (72%) cooking (65%) fetching water (43%) cleaning (42%) and child care (33%).Given the time involvement of girl children in the sustenance and maintenance tasks, itis not surprising that their schooling and acquisition of occupational skills suffer.
Education
School attendance of girls is influenced by the socio-economic status of the familyas well as the level of development of the village/district/urban area. On the whole61% of the girl children were attending school while about 17% had dropped outand 21% had never attended. The rural-urban split of this was quite clear with 56%of rural girl children in school compared to 74% of urban girl children. The levelof development of the district as well as the literacy level influenced girls' schoolattendance. The proportion of girl children in school also went up with the caste hierarchy.
About 60% of the girls entered co-education schools and about 18% entered girls'schools. As a variable, the kind of school did not become a strong predictor forretention, although girls schools had an edge. About half of all the girls entering schoolhad the school in the village or locality; for about 21% school was within a distanceof 2 km and for about 7% of the girls it was within 5 km. Distance from schooldid not influence the rate at which children dropped out.
Most of the children in school had instruction in their mother tongue (56%) andabout 7% were given education in the medium of English. Most schools are not
228
244

endowed to provide extra-curricular activities to all the children. Except for games,in which about half of all girls participated, and some music and dance - there washardly any activity. Even when a facility like a library existed, it was used regularlyonly by some children.
Parental attitudes on the educational levels to be ideally attained by boysand girls were ascertained. The gender difference in the expected directionpersisted.
When asked why girl children did not attend school at all, only about 7.4% ofthe mothers' responses were that the family was too poor to provide an education.For dropping out of school, mothers cited both poverty and the lack of motivationof the girl child as reasons.
When examining the rate of dropping out at different ages, no clear patternemerged, but when the class in which the child dropped out was taken into -:on-sideration, it became clear that Class V, Class VII and Class X were the end-pointsfor discontinuing education. Parental levels of education had a linear relationship togirls' attendance of school and as the mother's level of education went up theproportion of girl children in school rose dramatically. Predictably, the same kind ofrelationship of girl children attending school could be seen with father's occupationand income.
The girl child seemed to have a better chance of being in school if she wasfirst born. However, since the girls in our sample were first born in 65% and secondborn in 20% of the cases, smaller family size does become a positive input into thegirl child's school attendance.
When the girl child was asked why she liked school, about 25% mentioned thechance for improvement of knowledge and skill and 17% mentioned the opportunityto make friends. It is apparent that however inadequate the school, the girl childrenon the whole enjoyed the experience of attending it.
For studies, most of the children had some help from the father and a little helpfrom the mother and other relations, but about 30% of the girls studied on their ownand about 14% had a tutor to help theM. Their occupational aspirations are conventional(28% wanting to be teachers) but many were not decided. The mother's attitude tothe girl's future also affects her school attendance. When both parents are convincedabout the importance of educating the girl child, she has a much better chance ofbeing in school.
The girl children are quite realistic in assessing the advantages of education andthe disadvantages of illiteracy. About 50% of them say that education helps in personaldevelopment and self-confidence and about 50% say that illiteracy results in a lowself image.
2294; 1

Health
Data on the health of the mothers was included in this sector. The mean numberof children per family was 3.4 and about 50% of the mothers had three or four children.Almost 50% had their first pregnancy before the age of 18. Only about a third ofall the mothers had regular health checks and inoculation of ATS.
The same proportion (about 50%) of mothers got their children immunized againstBCG, DPT and Polio. There was a direct relationship between the father's educationand the percentage of girl children immunized.
Regarding the girl child's nutritional aspects, the very beginning of nutritionbreast milk - was studied. The duration of breast-feeding of 90% of the total sample
of mothers is distributed almost evenly in four periods : 1 year, 18 months, 2 yearsand over 2 years. It appears that mothers did understand the value of feeding breastmilk to their infants. Milk and cereal supplements were generally started after oneyear though the pattern varied.
For the large majority of children the main meal consisted of cereals, pulses andvegetables, and they had two or three meals a day. Some light snacksbetween meals were not uncommon. There was no marked gender discriminationin the kind of food or its frequency. Children who go to school carry theirlunch or come back home for it. Only about 5% of the children reported having aschool lunch.
While all the members of the family eat together in about a third of all families,generally there is no specific order and the situation governs it. However, when probed,it became apparent that women and girls were never the first to eat, and men andboys never the last to eat.
The preferred school of health treatment is what is currently mainstream medicine.Hospitals and clinics which follow the .z1lopathic system are used by the majority offamilies. There is no apparent difference between boys and girls in attention to health
problems.
About two-thirds of the entire sample of girl children had good skin and haircondition, as well as acceptable condition of hands, nails and feet. The hygiene andappearance of the other one-third reflects poverty and lack of access to water. Onthe whole, the girl children seemed bright, cheerful and active.
Menstruation
About 40% of the girls children in the sample had attained puberty, the large majoritybetween the ages of 12 and 13. About two-thirds of the girls had no prior knowledgeof menarche, but were helped by the mother, sister or other female relatives to deal with
230

menarche. Most of them did not have any major health problems. There were somerestrictions on the girl's movements after puberty and less than one third of them reportedthat there were no restrictions. Many of the communities studied did have some pubertyrituals, the reactions to which varied. While some feeling of shyness was expressed, afew girls reported enjoying the rituals where they were treated as special.
The domain of th - life in which the taboos were prominent was that of religiousrites and visits to shrines. It extended to food handling in many cases. While somegirls were discouraged from playing games, a small number also had to be isolatedfrom the family during their periods.
There were regional differences in puberty rituals and the post-pubertal rules, withthe Southern states tending to have more traditional practices in this matter.
Child Labour
Only about 13% of the girl children in our sample were part of the labour force.They worked in the unorganised sector, mainly in agriculture and related activities.The gill child helped in the productive activities at home, and also worked as casuallabour for a wage, or as part of a family team.
Building and road construction as well as agricultural absorbed them. The workinghours varied but the majority worked for 6-8 hours a day. Their earnings also varied,but the largest category was of those earning Rs.100 Rs.200/- p.m. being paid dailyor weekly. The work place was usually within a 2 km. radius, which could be reachedby walking for half to one hour.
The amenities at the work place were minimal, yet having known nothing better,most of the girls said they were satisfied with them. In many cases, the girl child'swork was with family members and her wage merged with the payments made tothem. Whatever the girl child earned went to the family and only occasionally didshe have a savings account or buy herself anything.
Lack of right over natural resources and non-availability of permanentemployment are two factors which are ci lrly antecedent to poverty. When familiesare very poor they cannot and do not plan r a distant future. Sustaining themselvesat a survival level takes up all their energy. The labour of girl children is to be seenin this context.
The Case Studies and Case Profiles as well as the Area Profiles provide the fleshand bones to the skeleton of statistical description of the sample. They take us intothe homes and tell us how girl children think and feel. The interventions that havebeen tried out indicate what is possible when the higher education system serves asa catalyst for development.
231
4rk

PART II - STATE POLICY AND PROGRAMMES : AN OVERVIEW
One cannot write a conclusion to the report without taking a look at theGovernmental efforts that aim to make the developmental process more effective, byensuring its linkage to the grass roots and by being gender sensitive. The paradigmsof development have changed over the last few decades: We now see the terms"people's participation", "women's empowerment" and "growth with equity" used widelyin policy statements.
The Indian Constitution has empowered the State to adopt measures of positivediscrimination for neutralising the cumulative disadvantage suffered by any group.Women fall in such a category and Article 15(A) (e) makes it the fundamental dutyof every citizen to uphold the dignity of women, by condemning any practice de-rogatory to them.
Some of the recent legislative measures specific to the girl child are as follows:
a) The Immoral Traffi.c (Prevention) Act of 1986 (which makes sexual exploitation ofwomen and girls, a cognizable offence)
b) Dowry Prohibition Act of 1961, amended 1986 (which makes dowry - related crueltyto girls and women a cognizable offence)
c) The Child Marriage Restraint Act of 1976 (which raises the girl's minimum ageat marriage to 18).
The National Plan of Action for the Girl child 1991 - 2000 integrates several sectors.Its major thrusts include survival, and protection and development of girl children,with gender sensitivity built in at all levels.
The recent establishment (1990) of the National Commission for women is alsolikely to have positive long term effects on the wellbeing of girl children.
Through the Five Year Plans from 1951 1997 we see changes in the majorconcepts concerning gender. In the First Five Year Plan, the concept of the welfareof women dominated. In the next five years, local organization was an emphasisand under the plan, Mahila Mandals were organised at the village level. Even upto1974, the priority was for education of women and for provision of maternal andchild health services.
In the Fifth Five Year Plan, there was a conceptual shift from welfare todevelopment, thus doing away with the benefactor model of government. By the timethe Sixth Five Year Plan was launched, the Status of Women Report had been publishedand one impact was the formal recognition of the area. Hence women's developmentwas included as a separate sector, with emphasis on health, education and employment.The next plan continued the special focus on women, while the Eighth Plan (1992 -97), currently in operation, calls for a more vigilant monitoring of programmes so
232
246

that women can function as equal partners in the development process. The conceptualshift now is from development to empowerment of women.
The setting up of the Department of Women and Child Development under theMinistry of Human Resource Development is symbolic of the revitalisation of theGovernment machinery. It serves as a nodal department to guide, coordinate and reviewefforts for the development and implementation of the programmes for women andgirl children. The Central Social Welfare Board provides the umbrella for the networkof thousands of voluntary organisations working for women and children around thecountry. The National Institute of Public Cooperation and Child Development assiststhe Department in the areas of research and training. At all levels the important roleof voluntary organizations in the cause of girl children has been acknowledged bythe Government.
There are several schemes and programmes with the objective of making womenself - reliant. Most of these interventions also have an effect on the life of the GirlChild. A few . selected schemes are mentioned below:
:Development of Women and Children in Rural Areas (DWCRA) This offerstraining and financial assistance to women in rural areas, as well as child care andeducation.
Support to Training and Employment Projects (STEP) is aimed at upgradingthe skills of assetless women and providing them with employment intraditional sectors. (This is for adult women, but as is known when women haveregular employment, child labour will be rendered unnecessary for the survivalof the family).
Training - cum - Employment Scheme in non traditional trades like Electronics,Electrical work, Manufacture, Fashion Technology, Office Management etc. includesadolescent girls in the programme.
Condensed courses of Education and Vocational Training, originally intended foradult women, also includes girls who may have dropped out of school.
The scheme of Creches for Working/Ailing Mothers' Children is now almost twodecades oid. There is provision for play and recreation, health care, nutrition andimmunization of children from birth to five years of age. (These services help workingmothers as well as school going girl children enabling them to leave the young childin safe hands).
Integrated Child Development Services Scheme {ICDS) Comprehensive, holisticand covering over 16 million children, from birth to 5 years of age, it serves deprivedand under-served communities in villages, tribal areas and urban slums, providingpreschool education, immunization health care, nutritional supplement, referrals and
233
x;.13.1

parent education. The largest and most comprehensive programme of its kind, itsproblem continues to be getting quality care to the under-privileged.
Scheme for Adolescent Girls: This uses the ICDS infrastructure and focuses ongirls of 11 - 18 years who have dropped out of school. They are educated, trainedand equipped to be social animators in their own neighbourhood, with communication,literacy and numeracy skills.
Early Childhood Education (ECE) Located in educationally backward states,children's centres designed to improve children's communication and cognitive skillsare running under this scheme. They influence the continuation of girl children inprimary school, stemming the dropout rate.
Programmes for women like Rashtriya Mahila Kosh (a national credit fund forwomen) and Mahila Samriddhi Yojana (a scheme to promote savings among poorwomen) as well as the scheme reserving 30% seats in Panchayats for women are allbound to have an indirect favourable impact on the girl child.
The mothers with better access to capital, equipment and other resources as wellas those with a stronger voice in self-government are definitely likely to be warriorson behalf of their girl children.
PART III - DIRECTIONS FOR ACTION
Advocacy and Social Mobilization
Given the findings and taking existing policy into account, a full throated advocacyis essential. Changing social attitudes and initiating a process of social mobilizationbecomes imperative. The media can be used effectively for this purpose. Radio,television and the printed word are all potent carriers of the messages of genderequality and the value of the girl child. The mass media, however, do not reach allsections of the population. Therefore in addition to media representation, more tra-ditional forms of communication should be used. Street plays, for example, are ex-tremely popular, and prove to be a simple way of gaining people's support. Suchmethods which are the very life blood of voluntary organizations, will facilitate theoutreach to the poor and the non-literate.
Special efforts must be made to develop a positive image of the girl child.Policy makers, planners and administrators must be sensitized to gender issues.These should then be incorporated into policy and implemented unerringly.Issues concerning the girl child should also be included in all public informationefforts. Non-government agencies can and do contribute to awareness generation ina large way.
234

The needs and problems of adolescent girls constitute a category large enoughto warrant special attention. Although the legal age of marriage for girls is 18, manygirls (mostly in rural areas) are married before they reach this age. They often havechildren before they are physically mature, leading to high rates of maternal as wellas infant mortality. Child development programmes should have a section specificallygeared to the needs of adolescent girls. Girls in this age-group should also be provideda variety of opportunities for non-formal education and vocational training and forupgradation of skills.
Central and State Governments need to protect the interests of the girl child byformulating both policies and the mechanisms for their implementation. Constitutionalmandates can be reinforced through strengthening the legal system and by speedingup its processes.
It is not enough, however, that the government intervenes merely by enactingnew laws. There should be action for enforcing the existing legal provisions and forworking at the prevention of legal violations. While governmental or voluntary agenciescan work on specific aspects of social mobilisation, most important is that the familyand community should be convinced of the need to allow the girl child to evolveto her full potential. The process of social mobilization set in motion must make thegirl child everyone's concern. The girl must be empowered to enter the mainstreamof social and economic activity, and encouraged to believe in herself as a valuableand contributing member of society.
Health
References to the inadequacy of health facilities and their access have been madethroughout the study. In the majority of rural areas there was no functional PrimaryHealth Centre. If families who can afford it, prefer to go to private practitioners ortake their children to the distant hospital, it is because local health centre or dispensaryservices are not available. Imperative, therefore, is the proper functioning of the PHCand the regular visits of doctors and auxiliary nurse midwives. These must be monitoredby representatives of the community. As it stands, the health infrastructure is entirelyunsatisfactory.
The response of the rural families to the Health Camps undertaken by theresearch teams is a clear indicator of the scarcity of well-informed face-to-facemedical help being available in that area. It is hoped that the recent Panchayatelections around the country will put more power in the hands of the people andthat their elected members will be made responsible to monitor the functioningof the health services. The women members of the Panchayat must take up, amongother tasks, that of monitoring the delivery of health services.
235
25i

Among other specific suggestions is the full coverage of all the children in anyvillage or slum for immunization. In our study, even the most advanced or developedvillage could not report a 1000/0 immunization cover to the children. The schedule ofrequired immunization is complicated and the ordinary unschooled mother is not goingto be able to remember it. Calendars, posters, T. V. spots and the like should carrythe information about the immunization schedule so that it is "over-learnt" and becomespart of the everyday vocabulary.
Raising the awareness for the need of immunization without providing the properinfrastructure may lead to frustration on a large scale. For instance, the cold chainmust be maintained if the polio prevention shots are to be effective. There must bea doctor, nurse or para-professional to follow up the cases, as a single complicationthat is unattended results in loss of confidence that will take years to rebuild. Thuswe see that if any scheme or programme is to be effective, it must have the combinationof infrastructural facility and the right (educated) attitudes.
Most of the girl children in our sample had no exposure to the factsof life, for example, the relationship between menstruation and pregnancy wasnot explained to them. There was hardly any well - informed friendly person inthe neighbourhood who could be a support to the growing girl child. Manymothers felt that there was no need to prepare the girl child for the experienceof menarche. When menarche came, the girl child would be given hints onpractical management of her menstrual periods. Generally there was no attempt tolink up the event with the girl child's reproductive system or to give her any sexeducation at that point.
A review of the school books in the primary school reveals that they vary agreat deal in different regions and states, but they have one thing in common. Noneof them includes the child's perspective : the curriculum tends to be adult - centred andthe approach, one of talking down to children. In this context, we find the formalcurriculum inadequate in providing the right kind of information or attitudes to theadolescent.
Educating girl children about their -own physiology and anatomy is a priorityitem on the health agenda. Once the concept of menstruation being Nature's way ofassuring continuity of the species is explained, the .relationship between menstruationand pregnancy follows. The scientific explanation of how the sex of the infant isdetermined by the contribution of the father's genes needs to be linked up here.Although this is an abstract concept and likely to be uncomprehended in the beginning,its repeated telling becomes important in the face of the "blame" placed on womenfor producing daughters. Tracing the origin of the newborn's sex to the father willserve for sex education as well as for a scientific understanding of how the sex ofthe unborn .child is determined.
236

In the process, the unique and indispensible function of the female in reproductionand nurturance of the next generation and therefore of the continuity of the humanspecies itself should be made clear. Instead of being told only about the unwisdomof having too many children and other such cliches of family planning propaganda,the girl child should be given all the information she needs for choice in and controlover her own life.
Education
We have observed that girl children are sent to school for shorter periods ornot sent at all and the reasons for such parental behaviour tend to be complex.Parents weigh the benefits of schooling against the expense of schooling, the need forthe girl's labour for household tasks and child care, as well as the anticipatedoccupational openings for them. The direct costs, the hidden costs and the opportunitycosts of a girl's education are calculated and when parents feel that these add upsubstantially, overwhelming the positive values for schooling, they do not send theirdaughters to school. Convincing parents of the value of primary education will requireeducation to be valued by everyone including the teachers and educational administrators.
Not only do we need to locate schools closer to communities and to increasethe number of schools, especially single - sex schools where required, we need toprovide the school with the basic amenities of drinking water and separate toilets forgirls.
One of the most dismal findings of the study concerns the quality of the Libraryand the Laboratory in the schools available to the girl children. Upgrading thesefacilities should be the priority of the Primary School systems around the country.We hear frequent references to the "scientific temper" but not even the most elementaryequipment is available to the ordinary school child let alone the opportunity toexplore and experiment. Laboratories must be provided in every Primary School. Thesame recommendation goes for the Library. A small well selected Library must beset up in every school and the children must have easy access. Expecting childrento be more than merely literate is unrealistic in the presently functioning parcheddeserts that pass for schools. Children need to be able to handle books before theycan become well - informed.
Even though there is no clearly established causal relationship between the numberof female teachers in school and the enrolment of girl children, there is a positivecorrelation. The problem in India, especially in some regions, is the unavailability offemale teachers. They often find it difficult to be mobile and to commute from longdistances. Offering housing or transport assistance would help a little, but urbanteachers are generally unwilling to settle in rural areas. If the school system is willingto settle for a lower educational qualification for the teacher and provide in-service
237
4 0 3

training as in the Shiksha Karmi Programme in Rajasthan, for example, it would be
a feasible strategy. Whatever is done will have to be worked out in the context oflocal conditions. For instance, any rural area will have some resource people whosecontributions to the school system can be used and acknowledged. In every instancemore locally available persons can be indentified, trained, employed, retrained and
sustained, with the active involvement of voluntary organizations in that area.
Even parents without a formal education are capable of a cost - benefit analysisof educating girl children. It is a fact that the benefits are frequently invisible andset in the future, structured on a number of hypotheses, while the costs are immediate,
real and tangible. Advocacy should take these factors into consideration; concurrentlythere must be the kind of social action by which the harvest of benefits can be reaped.In other words, persuading girls to attend school is desirable; but for the benefits ofeducation to accrue, schools should be improved and the labour market opened upto provide employment to the educated.
Energising the Community and Empowering Women
We should be able to see that the infrastructure exists for every woman andgirl child to save money and to have it in safe custody. Towards this end, a women'sbank should be organised (in the model of SEWA Rural Bank for instance). All ofthese suggestions will become effective when a Mahila Mandal (local Women's group)starts functioning in every village.
Every effort must be made to help women in slum, village or hamlet to havetheir own organization. Again in this matter, the work of NGO's is central. A MahilaMandal should not be an implant, but be organic to the community with its rootsin the local reality, growing gradually and becoming the banyan tree providing thecommon meeting place and shelter that women and girl children need.
Since the setting up of this study about four years ago, some significant achieve-
ments have been made in the identification of culturally relevant and gender-orientedprogrammes. The advocacy of voluntary organizations and the women's collectives has
resulted in the beginnings of a change in the attitudes of administrators and planners.However there is bound to be a time lag between the launching of a new idea andits full implementation. Advocacy should be aimed at reducing this time lag, byorganizations serving a monitoring function.
This study has revealed That the involvement of women students of College andUniversity in the problems of families living in poverty can be mutually enriching.Supported by the recent observations made of the Total Literacy Movement is a factthat cannot be overlooked: when more privileged members of the society play an activerole in a development task, handling it with enthusiasm, energy and empathy, thechemistry of success is created. We need a sense of neighbourhood and a fellow feeling;
238

we must base in that our conviction that sisterhood is strong; and with that we mustput our weight on the side of the girl child. The girl is in a category without aspokesman in society and we must raise our voices on her behalf.
To summarise, the study confirmed many of the hunches and hypotheseswith which it was begun i.e. that the birth of the girl child tends to begreeted with anaemic joy, if not grief, and that she continues to be treatedwithin the family and outside as a second class citizen. The devaluation of thegirl child has been deeply internalised at several levels of socio-economic status.Parental education and improvement of employment and income are naturallyrelated to the girl's life chances. The clustering of the variables of disadvantageresulting in the downward spiral of poverty pushes the girl child to the nadirof subservience.
The self-image and self-esteem of the girl child must be enhanced and strength-ened by activities and exercises with her as well as by changing the perspectives ofthe persons in her immediate environment. This may be achieved by a variety ofmethods, induding intervention through the school's extra-curricular activities, theatreand puppet formats, displays and discussions.
The area profiles reveal drab and dusty neighbourhoods, frequentlycharacterised by the phrase "nothing ever happens here". A CommunityCentre is essential - and for some hours of the day, it should be reservedfor all the girl children in the community. Here non- formal education on health, thefunctioning of the woman's body and counselling for problems should be madeavailable.
The chance for the girl child to pick up a skill that can be used for economicbetterment has to be provided in the village or urban neighbourhood. The girl childrenwish that they could use their education to support themselves and supplement familyincome.
Economic activity is necessary for the girls to feel independent and capable ofearning for their own needs. Focus on the employment of girls and women will haveto become a priority with local planning.
It is not only changing attitudes and values that is necessary. A number ofstructural changes must be implemented, in order to free the girl from her presentchain of household tasks.
- Poverty alleviation programmes, a more equitable public distribution system andminimum wages to adults will make it unnecessary to employ child labour.
- Creche and other child care facilities must be set up in school, factory andplantation, in order to enable the girl child to attend to her own needs.
239
4 30
- Attention must be paid to provision of clean drinking water within easy reachof households and revival of traditional water conservation methods and rain harvestingby the community.
Re-introducing the concept of the commons in the village to which all haveaccess, and afforestation activities monitored by the community would be eco-friendlyand reduce the drudgery of the girl child.
Energising existing systems - the Primary and Secondary schools as well asthe Primary Health Centre to function effectively and to be accountable to the people.
In all these, a working partnership is necessary between the Government,Voluntary Organizations and the Community.
240
'1;001-1

PHOTOGRAPHS
Courtesy UNICEF S3, S5, S6, S7, S8, E10, Ell,E12, E13, E15, CL18, CS19.
Courtesy S. Anandalakshmy Cover Page, S2, S4, S9, E14,H16, CL17, CS20, AP21, AP22.
GRAPHICS
Courtesy S. Balasubrahrnanyarn
P.5 r 7-14, J

SUMMARY REPORT
THE GIRL CHILD. AND THE FAMILYAn Action Research Study
rsx
a
i.,,2N7,:titl
" -Or
L
t4,4
s.");'-' S4-3
"Y
Compiled and Edited by
S. ANANDALAKSHMY
Sponsored by the Dept. of Women and Child Development, HRD Ministry, Govt. of India, New Delhi.
1994
1'4
258

THE GIRL CHILD AND THE FAMILYAn Action Research Study
Compiled and Edited by
S. ANANDALAKSHMY
Sponsored by
The Department of Women & Child DevelopmentMinistry of Human Resources Development,
Government of India.
Executed by
The TJGC Centres for Women's Development Studiesin the University System in India.
1994
259

Dept. of Women and Child Development, Ministry ofHuman Resources Development
Secretary Meera SethLata Singh
Joint Secretary Uma PillaiS. K. Guha
Joint Director T. K. Sarojini
Upto 19931993 onwards
Upto 19921993 onwards
Chief Advisor on Data Management
N. K. Nijhawan,Executive Director,
Indian Council of Social Science Research
Research Methodology Advice and Assistance
Shankar Bose,Indian Council of Social Science Research
K. N. Jehangir,Indian Council of Social Science Research
J. C. Sharma,Tata Institute of Social Sciences
Co-ordination Committee
S. Anandalakshmy (Convenor)
Susheela Kaushik
Maithreyi Krishnaraj
Vina Ma zumdar
Vasantha Ramkumar
260

PROJECT DIRECTORS COLLABORATING CENTRES
Dr. S. A. T. Adilakshmi
Prof. Jasodhara Bagchi &Prof. Jaba Guha
Dr. V. Bhavani
Dr. Bibekanand Das
Prof. Amita Verma &Dr. Parul Dave
Dr. Rekha Pandey &Dr. Kameshwari Jandhyala
Dr. Surinder Jetley
Dr. Usha Kanhere
Prof. Susheela Kaushik
Prof. Maithreyi Krishnaraj &Dr. Divya Pande
Dr. Lakshmi Lingam
Centre for Women's Devt. Studies,S. P. Mahila Visvavidyalayam,Tirupati A.P.
School of Women's Studies,Jadavpur University,Calcutta - West Bengal.
Women's Studies Centre,Nagarjuna University,Guntur A.P.
Women's Studies Research Centre,Berhampore University.Berhampore Orissa
Women's Studies Centre,M. S. University,Baroda Gujarat.
Centre for Women's Studies,University of HyderabadHyderabad A.P.
Centre for Women's Studies and Development,Faculty of Social Science,Banaras Hindu University,Varanasi U.P.
Women's Studies Cell,School of Social Science,Gujarat University,Ahmedabad - Gujarat
Women's Studies Centre,University of DelhiDelhi.
Research Centre for Women's Studies,SNDT Women's University,Bombay.
Women's Studies Unit,Tata Institute of Social Sciences,Bombay.
r401

PROJECT DIRECTORS COLLABORATING CENTRES
Dr. Prabha Mahale
Dr. Umed Raj Nahar
Dr. Ujwala Patil (Hiremath)
Dr. V. S. Pramila
Dr. Pam Rajput
Prof. A. Ramanamma
Dr. Vasantha Ramkumar
Dr. B. Regina Papa
Dr. Niroj Sinha
Dr. Rameshwari Varma
Dr. H. P. Verma
Research Centre for Women's Studies,Karnatak University,Dharwad
Women's Studies Cell,Jodhpur University,Jodhpur Rajasthan
Centre for Women's Studies,Gulbarga University,Gulbarga Karnataka.
Centre for Women's Studies,Andhra University,Visakhapatnam A.P.
Centre for Women's Studies,Punjab University,Chandigarh.
Centre for Women's Studies,University of PoonaPune Maharashtra.
Centre for Women's Studies,University of Kerala,Tiruvananthapuram Kerala.
Centre for Women's Studies,Alagappa University,Karaikudi T.N.
Centre for Women's Devt. Studies,Patna University,Patna Bihar.
Centre. or Women's Studies,Institute of Devt. Studies,University of Mysore,Mysore.
Women's Devt. Studies and Research CentresRani Durgavati Vishwavidyalaya,Jabalpur - M.P.

ACKNOWLEDGEMENTS
The energy and strength of the collective activity of women engaged in Women'sStudies has characterised this project from its inception to its conclusion. This acknowl-edgement is really an Editor's note to record, with humility and gratitude, the variouscontributions of the several women scholars, activists, teachers, administrators andresearch workers who have made this effort possible.
The Indian Association for Women's Studies had at its Biennial Conference inWaltair passed a resolution to take up a country-wide collaborative study on identifiedrelevant issues. Madhuri Shah, Chairperson, University Grants Commission who hadthe vision and the will to put Women's Studies on the academic map of India, sensedthe importance of such a decision. The SNDT Women's University unit on Researchin Women's Studies established by her was the premier institution of its type. It wasideally suited for the brainstorming session that was organised there as a sequel tothe Biennial Conference of the Indian Association for Women's Studies. The decisionto undertake research studies that would be jointly done by several individuals, backedby their academic institutions had been taken and this was now planned out as aproject.
The South Asian region, with the countries having cultural and historicalcommonalities recognised the need for a congenial environment for the growth anddevelopment of children. The second SAARC summit held at Bangalore in 1986 stressedthe important of enhancing public consciousness on the rights of children and the needfor member nations to adopt the UN Convention on the Rights of the Child. It wasat the SAARC Summit of 1988 that the issue of children, particularly girl children, washighlighted. The girl child in South Asia was considered symbolic of the neglectedaspects in our policies. With this as background, it was proposed that 1990 be declaredas the year of the Girl Child in the SAARC region.
The possibility of linking different regions of the country through using thenetwork of the newly set up Women's Studies Units in the Universities, under the aegisof the University Grants Commission is an inspiration to be credited to Vina Mazumdar.Vina Mazumdar, the architect and the moving force behind "Towards Equality" thereport on the Status of Women in India, in the mid-seventies, had the insight andimagination to arrange a meeting point between institutions committed to the samecause: Directors of Women's Studies Centres set up at different Universities and theGovernment of India's Dept. of Women and Child Development who had declared 1990as the Year of the Girl Child.
This linking up of different institutions across the wide span of the country enabledthe study to be as representative as possible.
Cad

Maithreyi Krishnaraj, Director, Research Centre from Women's Studies (SNDT)conducted the initial sessions. Two meetings were held, one in Sept. 1989 andthe other in Dec. 1989, with some Directors of the Women's Studies Centres and invitedexperts. Following this, the first planning workshop for the study was organised atUniversity of Kerala by Vasantha Ramkumar. At this meeting the thrust areas for astudy of the Girl Child were agreed upon. All the deliberations were conducteddemocratically with every participant having a voice in the design of the study.
Uma Pillai, Joint Secretary, Dept. of Women and Child Development joined inthe informal consultative meetings held in Delhi in the next two months. She was fullysupported by Secretary Shukla, who gave the go-ahead to the project. An importantdecision made at that time was to have activity and intervention built into the researchdesign itself. It was not merely a study of the status quo, but one which would identifyprogrammes for the girl child as entry points and devise interventions which wouldbegin to ameliorate conditions even while they were in the process of being surveyed.The terming of the project as "action research" met with the enthusiastic approval ofMeera Seth, Secretary, Dept. of Women and Child Development who had just takenover as Secretary. She put the weight of her authority behind the study on the GirlChild and the Family.
The other details of how we proceeded are included in the opening pages ofthe first chapter. There were many persons who participated in the design and executionof the study: those who served as Project Directors, Advisors, Officers of the Dept.of Women and Child Development, Ministry of HRD and members of the CoordinationCommittee.
Particular mention must be made of Susheela Kaushik of Delhi University, whobrought her relentless drive and energy to the project, N.K. Nijhawan of the ICSSRwho gave of his best, in terms of time and ideas, in hundreds of details, because hewas convinced of the importance of such a study, and T.K. Sarojini, Joint Director inthe Dept. of Women and Child Development who was the nodal person in the Ministryand let her office serve as a clearing house for information on the project.
There are many institutions that have given their strength and support to thisstudy. Among them are the Indian Council for Social Science Research, Tata Instituteof Social Sciences, Lady Irwin College, University of Delhi, National Institute for PublicCooperation and Child Development (NIPCCD) and all the other Universities involvedin this study. Their institutional support is gratefully acknowledged.
Also on record is my thanks to all the person hosting the planning sessions, thetraining Workshops and the Coding Workshops, among whom are Maithreyi Krishnaraj,Vasantha Ramkumar, Susheela Kaushik, M.M.A. Faridi, Ujwala Patil Hiremath, RameshwariVarma and N.K. Nijhawan. Gratitude to the Project Directors, Research Associates andInvestigators of all the 22 team is hereby recorded.
'1

A large number of persons, including those appointed to help with maintainingthe Convenor's office and with data analysis and documentation must be acknowledged.Apart from those on the Coordination Committee and the Advisory Panel, whose namesare mentioned separately, I would like to thank the following: Deepa Das for herenthusiastic participation at the early stages of developing the questionnaire; Anil Kumarof the ICSSR, Data Archives, who was a pillar of support in the management of data;Alpana Sharma and Rekha Nautiyal who joined him later to assist with data coding;Devika Rani and later Malathi Venkataraman who helped in the early months withmaintenance of files and accounts of the Convenor's office at Madras and particularlyN. Lakshmi, whose consistent motivation and efficiency has helped to sustain the projectoffice for over two years.
I am grateful also to Indira Seetharam who worked systematically at decodingthe data and setting up the tables. I would like to record the help of Usha Sureshand Sujatha Rani in extracting the relevant data from the field reports. In the final phase,I was ably assisted by Malini Sood. Yeshwanti Balagopal, with competence, confidenceand meticulousness also helped in the last phase, bringing the report to its final form.
Most of all, thanks to the girl child who spoke frankly about herself, trusting usto take action, so that she could be enabled to function in the future as a first classcitizen in an egalitarian society.
- S. .74iiandalakslieny

Preface
It is with some satisfaction that I introduce this report of the nation-wide studyon the Girl Child and the Family to policy makers, activists and academics. The studyis an excellent example of cooperative endeavour, among the Dept. of Women andChild Development, Women's Studies Centres in the institutions of higher learning andthe Indian Council of Social Science Research.
We are now well into the SAARC Decade of the Girl Child (1991-2000). Thefindings of this study will serve as a reminder of our unfinished tasks and as a sourceof ideas for programmes to be undertaken in the immediate future.
It was ambitious to undertake such a massive study, with 22 University Centresfor Women's Studies collaborating . There were logistic problems and hurdles tosmoothly coordinated work, in all its detail. The Centres where the research wasconducted were far flung. Each University had its own rules, including a great dealof red tape in some cases. Nevertheless, the tenacity and motivation of the researchteams helped to see it through, if only with some understandable delay.
Each research team sought to bring in local colour and idiom, making the reporta tangible one, about real people, not just a collection of quantitative data.
For all the participants, the motivating force was their anger at the deprivationof rights and privileges suffered by the girl child and their conviction that the truthmust be told now, loud and clear. This bold and committed approach has made thestudy reveal the many deplorable facets of the life of the girl child in India.
I trust that activists and scholars in the field will treat this study as the first stepin a series of action plans to be undertaken for the girl child. It is hoped that thefeedback from this study for national policy will also be treated with the seriousnessit deserves. And most of all, it is expected that the girl child's future will be brighterand her life chances more equitable than in the past.
ConvenorCoordination Committee
236

SUMMARY REPORT
GIRL CHILD AND THE FAMILY
Contents
* Rationale, Methodology and Conceptual Framework
* Profile of Households
* Socialization
* Education
* Health
* Menstruation
* Child Labour
* Case Studies
* Area Profiles
* Intervention Programmes
* Conclusion and Implications for Policy
4.17 04-17

RATIONALE, METHODOLOGY ANDCONCEPTUAL FRAMEWORK
Preamble
Gender equality is still a distant dream. Despite the specific schemes and pro-grammes of the Govt., despite the enthusiasm and activities of voluntary agencies, thebenefits of development have not yet reached women and girl children.
The young girl is most vulnerable to the insults of poverty and deprivation. Asan infant, she is likely to be breastfed for a shorter time than her brother, and beneglected when she falls ill. As she grows up, she becomes the victim of discriminationin access to education, skill development and recreation. Her entire socialization tendsto make marriage the ultimate goal of her existence, and subservience to the malesin the household, her initial and final destiny.
The Network Develops
Given the shared culture of th-, South Asian region, the SAARC decided upon1990 as the year of the Girl Child. Subsequently this has become the Decade of theGirl Child. The heightened awareness of policy makers to their responsibility towardsthe Girl Child resulted in a few policy changes.
But the need for empirical evidence to substantiate the theoretical perspectiveswas being felt strongly.
Initial Stages
The concept of a collaborative, country-wide study was first mooted in a workshopat the SNDT University in 1989. In March 1990, the first planning workshop for thestudy was organised at Kerala University. Directors of the. Women's Studies Centresand other scholars in the area discussed and agreed upon the thrust areas for study.Several formal and informal consultative meetings were held in Delhi in the next twomonths, as a result of which action and intervention in the problem areas related tothe Girl Child, were decided upon as an integral past of the study. Twenty - twoUniversity Centres volunteered from among those who attended the workshop andshared the research interests. The States in which they are situated and the numberof Centres in each state are as follows, alphabetically: Andhra Pradesh (4)Bihar (1) Delhi (1) Gujarat (2) Karnataka (3) Kerala (1) Madhya Pradesh (1)Maharashtra (3) Orissa (1) Punjab (Chandigarh) (1) Rajasthan (1) Tamil Nadu (1)Uttar Pradesh (1) West Bengal (1).
1

Objectives of the study
To generate data of comparable nature on some common parameters that will givean understanding of the situation of the girl child.
To identify the major problems relating to the status of the girl child and suggestalternate courses of action.
To start a series of programmes to help to remedy the shortcomings.
To assist the community and women in particular to pursue desirable alternativesby organising themselves.
To test the feminist methodology of participant Action Research in an empiricalstudy.
To assess the status of girl children within the family in order to predict the likelyposition of women in the 21st Century.
To provide ways and means of ameliorating the conditions pertaining to the lowstatus and subordination of girls in order to provide equality and justice asenshrined in the Constitution.
It was decided that each centre would provide the texture of that region byexamining folk songs and folk stories, proverbs and local beliefs, as well as undertakea small survey of contemporary popular literature in that language and region. Thiswas planned so that the individual characteristics of each sub-culture would be includedin the national study.
Towards this goal, a Coordinating Committee comprising individuals with expe-rience and expertise in women's studies was formed. Some members of the CoordinatingCommittee felt that the study could be undertaken at the Women's Studies Centresset up under the UGC Scheme and were quick to suggest the linking of the Dept.of Women and Child Development's plan of research on the Girl Child with theUniversity system. There was a heartening dialogue among the partners in this projectbefore it was launched.
Training Workshops
In the month of June 1990, two workshops of 4-day duration, were held in SNDTUniversity, Bombay and Delhi University. This was to train the research teams in themethods of sampling, interviewing and collection of data. Experts in these areas providedthe collaborating teams with explanations and demonstrations. The design of the studywhich had been evolved through the participatory exercise was finalised at theseworkshops.
2

32.8
, I II
I 1111111,
-=.11111111
17.6
Urban Middle SES
Urban Low SES
Rural Underdeveloped
Rural Developed
Proportion of Types of Area in The Sample
Sampling Procedure and Sample Size
Experts in Statistics and Research Methods from the Indian Council for SocialScience Research and Tata Institute of Social Sciences shared their expertise in thismatter. The sample was planned as follows: Each team was to take two urban wardsand four villages. The level of economic development and female literacy would bethe basis for differentiating the districts in the rural sample. In the urban case, onesample was to be from the poorest community and the other from a middle SES level,in the city. In each sample 100 girls between the ages of 7 to 18 were to be selectedfor the study. The households from which they were taken were to be studied bya fairly detailed schedule. In addition, the mother or mother-surrogate of each girl wasalso to be interviewed. Thus, each research team filled up 600 schedules on the GirlChild, an equal number on their mothers and on the household and thus a total of1800 questionnaires came from each of the collaborating centres. For the national study,there were 13200 girls, and their mothers, and information on as many households.This information runs into 300 items on the girl child, 240 items on the mother and106 items on the household.
3
2 70

Methods of Research
Following the training workshops and the collective thinking on appropriate meth-odology, a manual on methodology was published by the Research Centre for Women'sStudies, SNDT Women's University. It was also decided that the entry point of theresearch teams into the villages could be in the form of an orientation to health (campsfor immunisation, family planning, health check up) or literacy (numeracy, literacy, legalliteracy, skill development).
It was further decided that the girl and her mother would be interviewed sepa-rately. The objective fact of the girl's subordination in the family and the subjectiveexperience of her powerlessness were both to be studied. Raising the level of awarenessof girls and women about the existing governmental schemes and programmes for theamelioration of their problems was one major objective. Empowering the girl to havesome control over her own choices, especially those concerning her education and self-expression was another important objective.
The questionnaires (Household Schedule, Girl Child Schedule and Mother Sched-ule) were finalised by a centrally constituted team of experts, and were sent to allthe participating centres for translation and use. The Indian Association for Women'sStudies met for the biennial Conference at Jadavpur University in Feb. 1991, and manyof the Project Directors and Research Staff attended it. Full use was made of theirpresence at the Conference. Another workshop on methodology was organised inCalcutta. The few Project Directors who could not attend (from 4 centres) were informedof all procedures through detailed correspondence.
Coding
A number of questions in these schedules were open-ended. It is to take noteof the open-ended questions and varied responses to them that a Coding System hasbeen devised. The actual coding system was developed only when some data had beencollected. The responses from a section of the sample were taken as true indicatorsof the responses of the entire sample. For some kinds of questions (castes, languages,districts) the coding system has a code for each name mentioned. For most of the otherquestions, the thrust of the exercise was to develop a classification system for theresponses to each question.
Two Coding Training Workshops were held one in Mysore in April '91 andthe other in Gulbarga in May '91. Half of the total number of project staff attendedeach of the Workshops. For the three teams who were not able to attend eitherWorkshop, a third one was organised in New Delhi in July '91. Thus all twenty tworesearch teams participated in the Coding Workshops and were equipped to preparethe data for computer analysis.
4
2 Pit

The Coordinating Committee had the task of monitoring the study at all thecentres, visiting any centre which had a problem, and generally keeping the commu-nication system active. The Coordinating Committee also met several times to developplans for Data Analysis and to monitor the progress of the collaborating teams.
Data Management
The management of data in this project is the major responsibility of the IndianCouncil for Social Science Research. From the early phase of development of question-naires and deciding upon the sampling frame, to the stage of data analysis (with thedevelopment of codes and code books, data entry, data cleaning and consistency checksat intermediate stages) we have had the advice and guidance of the ICSSR.
Substantive Issues
Apart from a detailed Household Schedule, which solicits a vast quantum ofinformation on all kinds of relevant variables, the questionnaire intended for the GirlChild seeks information on major aspects of her existence - schooling, level attended,reasons for discontinuation, facilities at the school and those availed by her, her health,history of illness, kind of treatment and medical attention, reasons for the same,immunisations, food patterns and special diet, whether food taken to school and soon; myriad facts on socialization which can be carefully constructed as a map of lifeexperience. And on every aspect, whether there was discrimination on the basis ofgender was an inevitable query. The work and labour status of the girl, along withconditions of work and wages, and the economic contribution made by her is aconstituent part of the study. We thus expect to have a clear picture of a day in thelife of the Girl Child, virtually mini- ethnographies of over two dozen sub-cultures.
Not only are the facts noted, but the reasons behind every practice includingmenarche rituals and menstruation taboos, are elicited. And what is more, the proximalsetting of the particular household, as well as the eco-niche in which the householdis situated, provide the space against which the life of the girl can be studied andassessed. The open-ended questions have been anchored by an exhausting codingsystem, so that no information gathered is lost. In fact, the coverage of detail is ratherambitious and there will be a great deal of secondary data for other researchers ingender issues in future years.
5
272

This project is unique in the following features :
1. It is a collaborative endeavour between the Dept. of Women & Child Development,Govt. of India and the higher educational system.
2. It utilises the UGC infrastructure of Women's Studies Centres to assemble a teamof collaborating researchers around the country. Thus a large study has beencompleted cost-effectively.
3. It is more than a status report on the Girl Child. Action and Intervention pro-grammes tuned to the needs of each situation are included.
4. Using research methods and instruments developed by the entire team of par-ticipating academics, this study combines the advantages of micro-research andmacro-research - i.e. for each team, the study is detailed, but when summed upover 22 teams, there is a large sample.
5. It demonstrates the catalytic role of the educational institutions in community work,particularly in the issues regarding Girl Children. There is a vast potential forutilising the institutional framework of the Universities for outreach.
These five aspects make the project an exceptional instance of cooperation inresearch and the genesis of national policy in the cause of the Girl Child.

PROFILE OF THE HOUSEHOLD
As per the research design, based on the demographic patterns of India, themajority of the sample surveyed was rural. About a third was urban. Several religiousdenominations were included. Hindus comprised 85% of respondents, Muslims 7% andChristians 2 . 5%. Sikhs, Buddhists and JaMs, among others, were also part of the sample.Approximately 20% were from the Scheduled Castes (SC) and 5 .4% from the ScheduledTribes (ST).
Several linguistic areas around the country were represented, but due to the studybeing conducted in available Women's Studies Centres at various Universities, therewas some unevenness of representation. A larger proportion of Hindi, Marathi andTelugu speaking girls were included in the sample (see location of collaborating centres).Only 11% of families were found to speak more than one language at home.
Migration
Nearly 80% of the families surveyed were found to be stable in their place oforigin. Of the 20% who had migrated to other villages, towns or cities, most had doneso more than 20 years earlier.
Occupation
The largest main household occupation in the sample appeared to be agriculture(38%), comprising small land owners (29%) and agricultural labourers (8 . 5%). A fairlylarge proportion of respondents (31%) claimed that they had no main householdoccupation, indicating that they were in services, business or professions. Almost 70%of households had no subsidiary occupations.
Economic Status
More than half (55%) of fathers (also heads of households) earn betweenRs.300/- p.m. and Rs.1500/- p.m. Most families (72 . 3%) had two adult male earners.Only 4 . 2% had only one adult male member generating income. In the case offemales, vastly different data are found. More than a third (39%) of families haveonly one adult female earner, and 4 . 4% have two female earners. While no familieshave adult males who are not earning an income outside the house, as many as 55%of families have female members who are not earning. About (12%) of the girls and(9%) of the boys earn an income. More than 70% of the families surveyed have anincome between Rs.500/- and Rs.3000/- p.m.
7
2

The majority of women (56 . 5%) have no income of their own. Of those who do,most earn Rs.100 to Rs.500/- per month. A similar pattern of low to moderate earningsexists for both girls and boys who work outside the home.
Since assessment of economic status through incomes alone is at best difficult andunreliable, ownership of assets was examined. Only 8% of the sample owned nothing- neither house nor non-agricultural land. All the rest owned their own houses, whether'kutcha' or `pucca', small or large. When ownership of agricultural land was surveyed,it was found that 56% owned no agricultural land, and 63% owned no livestock, poultryor fish. Nearly 75% owned no agricultural implements.
16.0
14.0
e 12.0
r10.0
e8.0
a 6.0
ge 4.0
2.0
0.00 150 250 400 625 875 1250 1750 250C 3500 4500 6000
Rupees per Mensem
Father's Income
A little less than half the heads of the household owned some form of conveyance,the majority (32 . 5%) having cycles or cyclerickshaws and a fairly large number owningmotor cycles or mopeds (10 . 4%).
More than 605 of the families owned Radios, TV's or VCR's, but only about 50%owned appliances like fans, sewing machines, refrigerators and blenders, or brass,copper and stainless steel utensils.
More than 64% of the households claimed they had no debts while 21% owedbetween Rs.1000- and 10,000 /-.
8
25

Government Programmes
It was found that Government Programmes for those in need did not reach outas far as is often claimed. On the whole 1/3 of all households say that they havehad no benefit at all, from any Govt. Programmes. Between 36% and 70% stated thatthey had received no benefit from programmes aimed at bettering employment, health,children's welfare, education, housing and other welfare programmes.
Only about 21% of respondents found an improvement in income as a result ofdevelopment schemes. A little over 41% claimed that health had improved and 49%said that education had improved. About 23% felt that development schemeswere riddled with problems, ranging from corruption of officials to implementationaldifficulties.
Housing
Of the families surveyed, 46% lived in 'pucca' 'houses and 49% in 'kutcha' housesor combinations of 'kutcha' and 'pucca' houses. More than 80% own their homes,however modest. Of the remaining 20%, 1O% pay rents of less than Rs.200/- per month,and 4 . 3% (mostly middle class city dwellers) pay over Rs.1000/- per month. Familieswho live in one or two room houses comprise 60% of the sample, and only 9 . 5%have houses with more than five rooms. The number of rooms in the house seemsto be a salient indicator of socio-economic status.
Most households have minimal amenities within the home. Water is a basicnecessity; yet 64 .5% have no source of drinking water within the house. Of this number,less than half have access to a tap outside the home. The rest make use of hand pumpsand wells, while there is a very small percentage that relies on ponds or water tankers.Around 2% of families have to go outside the village for water; for most of the others,water is available either just outside the house or within the neighbourhood. In nearly44% of families, it is the duty of the female members to co.lect the water for dailyuse.
Although 94 .5% of families stated that their ..iiage or area had electricity, 29%had no electricity in their homes. The majority (44 . 5%) had between one and fiveelectrical points in the house.
Sanitation was a scarce amenity for most of the sample. A large number ofhouseholds (54%) had no toilet facilities whatsoever. Of the rest, the largest number(25%) had a flush latrine.
Nearly 78% of households use conventional cooking fuels - wood, dung, coal orkerosene. Only about 17% use gas or electricity or combinations of conventional andnon-conventional fuels that save time and energy.

Family Structure
In 84% of families, the father is considered the head of the household. The majorityof families (72%) are nuclear in structure. Nearly half (45%) of households had 5 or6 members. Only 10% have between 9 and 12 members in the family. In 68% of families,the mother is the only adult female in the household. While 43 .4% of families haveonly one daughter, only around 21% have only one son. More families have two sons(38 : 5%) than two daughters (32%) and again there are more families with three sons(27 . 3%) than with three daughters (only 15%).
Education
The education of the parents is a good indicator of the socio-economic status ofthe sample. Almost a third (31%) of fathers and 57% of the mothers are non-literate.However about 49% fathers have been educated to primary, middle or higher secondarylevel and a further 13% to graduate or post-graduate level and technical or professionaldiplomas. Only 3 . 6% mothers have anything beyond higher secondary education.These figures for literacy and education levels approximate those for the country inthe 1991 census.
Father's Level of Education
1007. rAd

Graduate 2.1Middle 11.7
Primary 15.5
Tech/Prof 0.9
Secondary 10
Post Graduate 0.6
Non Literate 57.3
Mother's Level of EducationOccupation
Approximately a third (30%) of fathers were involved in agriculture as big/smallfarmers or agricultural labourers. About 10% were unskilled workers. These are thelargest categories. Service/Professional/White-collar jobs together constitute about 20%of the sample and large, medium or petty businesses and piece rate workers makeup 13%.
The pattern of education of the eldest __ale member of the family other than thefather was similar to that of the male head of the household. More than half (58%)were educated at least to primary level, and 7% of those to college level. Howevernearly 54% were unemployed. Of those who worked, the types of occupations theyhad, as well as the proportions in which these occupations were represented, approxi-mated the figures obtained for 'the fathers.
The eldest female in the house other than the mother was most often the sister(40. 7%). In 37 .5% of families, there was no other (elder) female. In 30 . 5% of house-holds the eldest female was non-literate.
The informant in most cases (54 . 6%) was the mother of the child, supporting theobservation of previous studies, that women are more likely than men to ai-so.rer aquestionnaire administered in the home. The proportion of questionnaires respondedto by the fathers was 32%.
11
278

SOCIALIZATION
The responses of the girl child revealed the vast gender bias inherent in the severalsub-cultures included in the study. There is no ambiguity in the demarcation of genderin the socialization of children; clearly the girl child is the child of a lesser god.
Gender Expectation of the Unborn Child
Post Grad.
Tech/Prof.
Graduate
College
Higher Sec
Middle
Primary
Non - Literate
0%
RZ:%Z:gtatt.XAMMISIMSV.I'.&N%lliWA:1
..,?. .
\%am ms.,7.0:::*,:,.0.K4o::::ws.a:,.:::*::.tvx:wirs.....;;;:wwww.A.ww,pmm:::::wFin
Issmovraraws.G.v..sa &raw
NIBMIlianliCAMKNINSWEIX IRIMANAVSMISSWVASSE
X SVIOICIMIXONAMIC20% 40% 60% 80%
Expected Boy Expected Girl No Specific Gender
100%
Gender Expectation of Unborn ChildRelated to Father's Level of Education
The term "expected" can be taken to be another expression for "desired". While64 .5% of mothers said that they did not expect one sex in preference to the other,as many as 31% said they expected a boy. However, only 2% expected a girl. Thefather's level of education did not have any effect on gender preference. Economic statusalso did not seem to :.'eve any impact. About a third of the fathers (a range between25 .4% and 36 . 0%) across all income categories expected a son, and only about 2%expected a daughter.
Celebrations on the Arrival of a Baby and Reactions to the Birth
Between 8% and 17% of families held a special celebration on the occasion ofthe birth of a male child. The percentage increases as prosperity (indicated by the
12
7;)

number of rooms in the house) increases. Special celebrations for the birth of a girlwere reported by 0 . 3% to 2% of families. Approximately a fifth of the sample heldno celebration at the birth of an infant.
Preference for a son is clearly related to patriarchy, and it was found thatunhappiness over the birth of a daughter was slightly higher in both father and paternalgrandparents, as compared to mother and maternal grandparents.
Activities Daughters share with Parents
Very few girls share their play-time with father (0.8%) or mother (4%), the majority(66 . 4%) sharing play with siblings or friends. However 23 .6% of girls said that theyhad no time for play activities. Predictably 77 . 5% of girls share household work withthe mother only, as compared to 0 .5% with the father only.
About a third (33 . 8%) of girl children surveyed, eat with their mothers only.However, about 55% of the girls stated that this was an activity shared with bothparents. Schoolwork is shared more often with siblings or peers (49%) than with eitheror both parents (a range of 7 . 6 to 8 . 9%). Skill training is, by and large, the domainof the mother (28%) rather than the father (0 . 4%)
How the Girl spends her free time
About a third (31%) of girls said theyspent their free time with friends and 4%said they do nothing in particular. Most ofthe others considered "free time" to betime available for a task that needs to becompleted. When asked about free time31% said they did household work, 16%that they did homework, and 4% said thatthey worked in the fields.
The girl child spends most of hertime with friends (67%), female membersof the family (38%) and female cousins(18%). Only around 1% of her time is spentin the company of male relatives, and evenless than that with male friends (0 . 3%).
The number of rooms in the housewas considered to be an indicator of eco-nomic status. As economic status improves,the time spent by the girl child both on
13
2'60

housework (a range of 10%) and play (a range of 12%) decreases. However time spenton activities like knitting or stitching (3 .8% to 10 . 4%), school work (9 . 5% to 26 . 3%)and entertainment (radio or television: 3 .1% to 6 . 9%) increases.
The proportion of girls reporting that they do not play at all is inversely relatedto father's level of education (9 .9% to 31 . 4%). There is a direct relationship betweenlevel of father's education and outdoor play of the girl child (a range of 15%).
PunicIdnent and Reward
Girls tend to be punished by being scolded more often than boys (58 .5% ascompared to 50 .3% for males) and by being scolded and beaten (29 .3% as comparedto 25 . 5% for males). Severe beating appears to be of the same magnitude for both sexes.
Girls are more likely (43%) not to receive any rewards for good behaviour thanboys (38%).
Availability of Television/Radio
More than a third of the girl children have regular access to television (36%) orradio (34 . 4%). However about 40% of girls do not have or have never had accessto either TV or radio, and upto 45% are only rarely reached by these media.
Persons Escorting the Girl Child
More than 75% of the girls have never been out of the village on work, pilgrimagesor picnics. For most other activities marriages, festivals, visits or medical treatment,the girl is most often accompanied by her mother and other female relatives or byboth parents together. Girls generally (28%) go with friends to school.
Recreation and Restrictions on the Girl Child
Parents' level of education is seen to have an inverse relationship to thedaughter's access to the cinema (taken as symbolic of any visit for pleasure or fun).The less educated the mother, the more likely she is to restrict her daughter'saccess to films (a range of 34 . 8% to 59 . 8%). The same holds true for the fathers(36 . 4% to 51 . 1%).
As parents' level of education increases, restrictions on girls going out decrease.An interesting finding is that mothers who have reached the secondary level of educationare 10% less strict than fathers at each corresponding level of education. Meeting andtalking to boys is forbidden to 24% of girls. Again restrictions decrease as parentallevel of education increases by 18% in the case of fathers and nearly 27% in the caseof mothers.
14
23

Restrictions on Behaviour related to Gender
Travel is mostly undertaken to visit relatives or to attend weddings. A largemajority of the girls have never been on a pilgrimage (77%) or on a picnic orouting (79%).
The girls in the sample report more restrictions on their laughing (36 . 7%), goingout (53%) and wearing non-traditional clothes (38 . 7%) than on their brothers.
Admired Qualities
Many girls (22%) stated that to be educationally accomplished is an admirabletrait in a "good girl". Yet this figure drops to 2 . 4% with regard to the qualities ofa "good wife" and drops out entirely in the qualities of a "good daughter-in-law".For most of the other traits, the differences are not so dramatic.
Modest, helpful and co-operative behaviour is expected more from girls than fromboys across all development levels and regions.
Gender Differences
About 77% of girls feel that literacy is important for both boys and girls, and30% that the family occupation is relevant for boys only. Certain skills eg. cooking(87%) and sewing (48%) are very definitely delineated as female domains, and masteryof them is expected of the girl child.
15
232

Skills of the Girl Child
More than 60% of the girls say they have no skills, a result of the belief thatall the tasks they carry out are unskilled jobs. Of the skills identified, the highest aresewing skills (17%) and cooking skills (8%).
The majority of girls say they learn their skills from their mothers (18 . 5%), while
only 6 . 5% say they pick up their skills in school.
Gender Division of Domestic Tasks
Sweeping appears to be the gender stereotypic task that is performed by the largestnumber of girls (72%), followed by cooking (65%). Fetching water and cleaning the houserank third (both around 42%). When looking at the cases where boys and girls spentequal amounts of time on the same chores, it was seen that only in 1% of the casesdid the boys and girls spend equal time on cooking, while 10.6% spent equal timefetching .water and 5 .9% gathering fuel.
80
70I
!I
60
50
40
20
10
0
7,z,
i[7:1
Only Girls
Girls = Boys
Girls > Boys4
Girls Spend No Time
_,,.I30
. . 11 1 g a - IGetting Ft cl Child Care Cleaning i.e. ting W. t.A. Cooking SI,eepiing
Gender Division of Domestic Tasks
16


EDUCATION
A sizeable quantum of this entire research endeavour was focussed on the girlchild's school attendance and the reasons for her dropping out. The reasons for thegirl children never going to school were also investigated. The relationship of schoolattendance to the demographic variables pertaining to the community and family werealso examined. The facilities available and used in the schools, the distance traversedby the girl child to attend school and the amount of time spent in school work werestudied. Some idea of the girl's future aspirations was also gleaned.
School Attendance of Girls
The percentage of girls attending school is 61% of the total sample. Those whodropped out comprise a little over 17%, while the figure for those who never attendedschool stands at 21%.
Urban Middle SES
Urban Low SES
Rural Developed
Rural Underdeveloped \\.0% 20% 40% 60% 80% 100%
L Attend School mi Dropped Out Never Attended
School Attendance of Girls Related to Type of Area
When the sample is broken up into rural and urban, it is found that the urban samplehas 18% more girls in school, while the rural sample has 13% more girls who never attendedschool. When data is further disaggregated according to the type of district or area, thepercentage of girls attending school ranges from a low 54 . 2% in the rural under-developedareas to a high 82 . % among the urban middle SES. Similarly girls who never attended
18
235

school total 29 . 6% in the rural under-devel-oped areas, and it drops to 4 .4% in theurban middle SES. Only 55% of girls fromlow literacy areas are in school, as comparedto nearly 68% from high literacy areas
A relationship was found betweencaste hierarchy and percentage of girls whonever attended school. Starting with 4%among Brahmins and 15% among ForwardCastes, the percentage of girls never inschool increases as we go down the castehierarchy to 41% among Scheduled Tribes.
As far as religion is concerned, thepercentage of girls never in school wasfound to be much lower for Sikhs (3 . 2%)
and Christians (6 . 6%) than for Muslims(28 . 5%) or Hindus (24 . 8%).
The type of school was considered asa possible variable influencing schoolattendance of the girl child. A marginal difference was found, with 23% dropouts fromco-educational schools as compared to only 17% from girls' schools.
For 50 . 6% of the girls, the school was within the village or locality. Of these, 75%attended school while 25% dropped out. Twenty-one percent of girls had aschool within 2 kms and of these 81% attended school while 18% dropped out. Similarfigures are reported for girls whose school was 2-5 krns away. Less than 20% of the sampleof girls stay with relatives or friends or in a hostel so as to facilitate school attendance.
Medium of Instruction in School
More than half (56%) of the sample attended schools in which the medium ofinstruction is their mother tongue, and for 13% of the girls, the medium of instructionis the regional language (not the mother tongue). Nearly 7% attend schools in whichthe curriculum is taught in English.
Participation in extra-curricular activities
About half (49 . 2%) of girls said they took part in games. This was the largestcategory. Only a fifth (22%) of the girls in the sample took part in music and dance,while participation in other activities is negligible.
19
23G
Facilities available in Schools and Use of these Facilities
While around 90% of the schools had a playground or some playing space, only42% had a library and 15% a science lab. The proportion of girls whose schools offeredscouting was 19%.
The library is used frequently by only 4 . 4% of the girls, and even less (2 . 6%)use the science lab frequently. Scouting is least popular, with ony 2 . 1% of girlsparticipating regularly. Although 90 °/h of girls have playgrounds in their schools, theyare used by only 39% of the girls.
Reasons for not Attending School
Mothers of the 21% of girls who never attended schools were asked why they neversent their daughters to school. Economic reasons were quoted by 8 . 6% of the mothers.A further 4% said that the family did not value education. Around 3% said that girls wererequired at home to look after younger siblings or to do household work.
Dropouts
Of a total of 2082 girls in the sample who had dropped out, the largest number(45%) had dropped out in the age range 7 to 11 years, i.e., in the first three or fouryears of schooling. At around 12-13 years, the age of menarche, a further 22% droppedout. The class in which they dropped out provides parallel data.
More than a third (37 . 4%) of the girls drop out in the first four years of school(Stds. I to IV) and 26 . 8% do so in the 6th to 8th Standard.
The number of 0,-irls attending school decreases as the age level goes up. Of the14-15 year olds, 18 . 6% were attending school but only 9% of 16-18 year olds were still inschool.
Only 4 . 5% of the girls (and a corresponding 3 . 7% of mothers) stated economicreasons for dropping out, and 1 .1% said they had to work for wages. About 1 .5%of mothers said the girls dropped out because the family did not value education and3 . 2% of the girls gave the same reason. Less than 2% (1 . 8) of the total sample ofgirls reported they had no school in the locality.
Caste and Socio-cultural Reasons for not Attending School
Only 4 . 4% of the entire sample stated that the family did not value girls'education and this was why girls did not attend school. An even smaller percentage(1 . 6%) quoted social disapproval as a reason.
When these figures were broken down according to caste, it was found that, ofthose stating "The family does not value education", 1 . 3% were Brahmins, 15 . 6%were from the Forward Castes, 13 . 3% from the Scheduled Castes and as many as
20

39 . 7% from the Backward Castes. The perception that "Society" does not approve ofgirls attending school has a similar pattern : 35 . 7% of girls giving this reason belongedto the Backward Castes.
Mother's level of Education and Girl's School Attendance
It was found that only 44 .4% of the girls whose mothers were not literateattend school. In families where the mothers hove studied upto Primary level, 75 . 5%of daughters attend school and of mothers who have reached Middle school, 86 . 6%
of their daughters are in school.
It was found that 93% of the mothers who have reached the Higher Secondarylevel of education send their daughters to school and this figure rises to 97% forcollege educated mothers. There is thus a strong linear relationship between level ofmother's education and the girl child's school attendance.
Father's level of Education and Girl's School Attendance
Again, a direct linear relationship is seen between father's level of education anddaughter's school attendance. Only 35 . 2% of girls whose fathers are non-literate arein school; this figure rises to 71 . 2% for the fathers who have been educated uptoMiddle school level and is nearly 95% when they have been college-educated.
Father's Occupation and Proportion of Girls in School
The higher the occupational level, the larger the percentage of girls attendingschool. In families where the father is a senior professional, 95 . 5% of girls are in school,but only 38 . 4% of the daughters of agricultural labourers attend school.
A similar relationship was found between household income and the girl's schoolattendance. Fewer girls (52%) attend school when the income is about Rs.300 500/than when the income is between Rs.1500 - 3000/- (70%) or Rs.3000/- to 5000/where 85% are in school.
Family structure and school attendance were not found to be related.
Birth Order and School Attendance
A total of 65 . 4% of the girls in the sample were the first born among livinggirl children. Of these 63 . 7% are in school. Twenty percent of the sample weresecond born girls and 58 .6% of them arr, in school. Of the 8 . 1% third-borns, 55% attendschool.
Household Tasks and School Attendance
Household tasks often interfere with schooling. Of the 8 . 6 % of girls who have tofetch water for the household, 80% are in school, but out of girls looking after youngerchildren, only 61 .4% are in school.

Reasons for liking/disliking School
A fourth of all the girls surveyedstated that schooling improved knowledgeand skill, while nearly 17% enjoyed schoolfor the friendship and social interaction itprovided. The prospect of employment(8 .5%) was the third reason mentioned forwishing to remain in school. Only 1 . 2%of the girls claimed to dislike schoolwhich they attributed to harsh teachersand strict discipline. Personal factors suchas ill health or low self-image werementioned by 1%.
Help in Studies
In 30% of the total, the girl childstudies on her own. In 27% of the casesshe is assisted by parents and other rela-tives, and in 14% of the cases by a tutor.Sometimes (5 . 2%) a neighbour or friendhelps with studies.
rC
Future Aspirations and School Attendance
Of the 25% of girls who are undecided as to future aspirations, nearly half (48%)are in school. Of the 15% who want only to be good housewives, 25% attend school.Among those who wish to Le teachers or take up other jobs, 86% and 74% respectivelyare in school.
More than a fourth (28%) of the girls attending school wished to become teachers,and 13% to become doctors.
The majority of mothers (36 . 4%) wish their daughters to become housewives,although half of these send the girls to school. About a fifth (22%) of mothers whosedaughters are in school wish their girls to have "any kind of job". About 17% of mothersfeel a girl should be married by the age of 15, and half of these have never sent theirdaughters to school. Only one-third these mothers have daughters currently in school.
Mother's Attitudes towards Education
Mothers were questioned about what they thought were desirable qualities ingirl children. Only about 16% thought education was important. Of these, around80% ensure that the girl attends school. The majority (82%) of mothers put more
22
28JBEST COPY AVAILABLE

emphasis on modesty, obedience, industriousness and sharing family responsibility.Only 59% of their daughters are in school.
When the attitude of the mothers to girls moving out of the house for educationor employment is that it is for their own growth and development, then around80% of their daughters are sent to school. Where mothers feel that girls should notgo out unless absolutely necessary, only around half send their girls to school.
In 10% of the families, whether or not the girl attends school is solely themother's decision, and in 33% of the cases it is solely the father's decision. For about40% of families this is a joint parental decision.
When mothers (7 . 8%) felt that there was no use educating a daughter, nearly70% of the girls never attended school. Twenty-nine percent of mothers said that theirdaughters should study "as far as they want", and 78% of their daughters were inschool. For the rest, thL,'e is a linear relationship between the level of educationaimed for and the proportion of girls in school. Figures increase from 29% to 86% asthe aspired education level goes up. At the same time, the number of those whonever attended drops from nearly 70% to around 4%.
Around 63 .5% of mothers said they spent no time helping with either son's ordaughter's homework, while about 11% said they helped both.
Ideal level of Education: the View of the Girl Child
The girls' answers to the question of ideal level of education for both boysand girls show that they make no gender differentiation on the whole. More thana fourth (26 . 7%) of the girls felt that they should have at least a high schooleducation, and 31 . 4% said that graduation from College/University with a degreewas ideal.
Gender Differences
Seventy one percent of the girls said that both boys and girls should haveequal education, and of these 70% of the girls are in school. Of the 7 . 6% of girlswho felt boys should have more education, around 46's, are in school.
Advantages of Education
Around 50% of girls felt that education helped in personality development, 20%that it improved employment prospects and 16% that it improved skills.
A small percentage of girls (3 . 6%) said there was no disadvantage in beingilliterate. Of these, only 19% were in school; and 66% had never attended school. Morethan half the girls (50 . 6%) felt that illiteracy results in a low self-image, 12 . u.1/43 that
it led to lower social status and 11 . 7% that it resulted in fewer job opportunities.
23
2

HEALTH
The problem of health is a continuing one for the girl child. Girls are seen tohave low weight, stunted growth and delayed physical development. Aside fromaffecting the general health status of the female child this also leads to a high femalemortality rate during pregnancy and childbirth and to the newborn child being at risk.
Mother's Health
The health of the mother, as antecedent to the health of the daughter is examinedhere, under salient heads.
Number of Living Children
It was found out that almost 50% of the mothers have between 3 and 4 children.About 20% have fewer than two children, 14 . 4% have five children and about 13%have six or more children.
Birth Order of the Girl Child among Living Girl Children
Almost 65% of the girls in the sample were first born and 20 .4% were secondborn. The percentages of third and fourth borns were about 8% and 3 .3% respectively.
Mother's Age at First Pregnancy
Nearly a third (35%) of the mothers were pregnant with their first child beforereaching adult status (18 years).
Mother's Health Checks during Pregnancy
It was found that a significant portion of the sample (61 . 7%) falls into the 'didnot respond/N.A'. category. However, about 31% of the expecting mothers did go fora regular check up and about 15% went on an irregular basis.
Anti Tetanus Serum (ATS) taken by Mother
It was seen that almost 55% of the mothers had never taken an ATS whileonly 34 . 6% had taken all the required doses for all pregnancies.
24

Immunisation
We found that a little over 50% of the children had been immunized for BCGand Polio and 43% had been immunized for Measles. The number of children whohad not been given any kind of immunization was a little over 30% for BCG andDPT/Polio and 39% for Measles.
It was found that the hospital was where 33 .7% of the mothers chose to havetheir children immunised, followed by the PHC where 13 . 7% went while 10 .2% wentto private clinics and doctors.
Immunization : Girl Child's View
Percentage immunized
Girls were asked whether they knew about immunization and 68 . 9% of themdid have some knowledge about it, while 30 . 6% did not know about the importance ofimmunization. They were also asked if their siblings had been immunized to which 26 . 6%
reported that none of them had been immunized while 56 . 6% reported the both boysand girls had been immunized. About 9% of the girls did not comment on the matter.
NA.
Tech /Prof.
Post Grad.
Graduate
College
Higher Sec
Middle
Primary
Non - Literate
0
r5 10 15 20 25 30 35 40 45 50
Percentage Not - Immunized
Immunization of the Girl ChildRelated to Father's Level of Education
25
202

Immunization : Relationship to Father's Education
A direct correlation was found between the level of the father's education andthe number of girls who had been immunized. Almost all the fathers preferred to havetheir children immunized at a hospital with this preference increasing with the levelof education. This percentage ranges from 22% of the non-literate fathers to 54% ofthe Tech/Professional fathers. The PHC and private clinics seem to be the next placepreferred for immunization.
A direct relationship between the father's education and the percentage of girlsimmunized was found. The percentage ranges from 46% of the non-literate fathershaving not immunized their child to 6% of the fathers in the Tech/Professional category.It was found that 39 %(BCG), 37%(DPT/Polio) and 33%(Measles) of the girl children ofthe non-literate fathers had received these immunizations, while these percentages weremore than doubled for the fathers who had Tech/Professional qualifications - 81% (BCG),80% (DPT/Polio) and 66% (Measles).
Nutrition
Nutrition is important for the general health and well being of the girl child, andis a critical input in the early years.
Duration of Breast Milk
About 27% of the mothers breastfeed their children for less than a year whilenearly 26% do it for more than a year and about 20% breastfeed their children formore than two years.
Age at which Milk Supplemerr: was Given
Almost half (48 . 5%) of the sample mothers introduced a milk supplement beforethe first year of the child, while nearly 20% of them did so after the first year. Almost29% said that they never supplemented breast milk.
Age at which Cereals were Given
The pattern of giving cereal food to the infant was parallel to the milk supple-ment. About 45% of the mothers introduced cereals before the child was a year oldand 27 . 5% did so after the first year. About 24% of the mothers introduced cerealsafter a year and a half.
The project team tried to find out if there were any differential trends in thehealth and nutritional status of the male and female children in the family. Both themother and the girl child were asked about the eating patterns followed in theirhouseholds. 26
en-1,1a 4)

Order in which Meals are Taken
It was found that one-third of the families ate together and one-third in no specificorder. However the data show us that in one-third of the families, the female memberswere the last to eat and the males of the family were the first to eat. The femalemembers were never the first to eat.
Health Treatment
The team tried to analyze where the cases of more serious ailments such as cholera,typhoid, blood infection, small pox, TB etc. were treated and also whether there wasany differential patterns of treatment for boys and girls.
Place Boys and Girls are Treated
The team found that 39 . 9%(boys) and 44 . 5%(girls) according to their parents weretaken to private practitioners. The same proportion, 13 . 55% of the boys and 14 . 9%of the girls were taken to the dispensary for treatment. About 36% of the boys and38 . 7% of the girls were taken to the hospitals for treatment.
When the team tried to study the kind of treatment provided to boys and girls,it was found that a large number of mothers (76 . 0%) for boys and (83 . 6%) for girls,preferred allopathic medicines. Very few (2 . 4%) preferred Ayurvedic/Unani/Homeo-pathic treatment for boys and girls. A negligible percentage went to Ojha/Tantric/Magichealers. Nearly 10% of them tried more than one kind of treatment or did not takeany specific treatment.
Appearance
The research teams attempted to judge the health of the girl child by an informalstudy of her general appearance. This observation did not require any special trainingon the part of the observer. Different aspects of the girl such as skin, hair, nails andso on were noticed and are discussed below.
Skin
It was found that 18 . 6% of the sample had normal skin while 67 . 8% came inthe 'any other' category.
Hair
A little over 50% of the girls did not have lice in their hair but almost 40% camein the yes/probably' category. 50 .4% of the girls had normal healthy hair while 38 .7%of the girls had dry brownish hair, and 1 .5% had grey hair. About 67% of the girlshad neat and well groomed hair while 25 .4% had unkempt/dirty hair.
27
2J4
Hands
It was found that a little over 70% of the girls had clean and healthy lookinghands while 24 .9% had dry and dirty hands. The condition of their nails was as follows- 65% of the girls had healthy/clean nails while 31% had dry and dirty nails.
Feet
It was found that 62 . 2% of the girls had clean/healthy feet while almost 38%had dry and dirty feet.
Glow in Eyes
It was found that 78% of the girls seemed to have a sparkle in their eyes while17% did not.
Activity
Almost 87% of the girls seemed to be normally active while 8% seemed less active.
Cheerfulness
Almost 90% of the girls seemed cheerful while 5 . 8% did not.
Environmental Factors : Hygiene and Sanitation
Environmental factors play a very important role in health. In both the urban slumand the village, the amenities are not evenly available to all, with some householdsbeing placed in a more advantageous locale. A detailed description of some localesare presented in the section on Area Profiles.
28
Af/ ij at-

MENSTRUATION
Menstruation, a biological event, introduces dramatic, physical and social changesin the life of a girl child.
It was found that nearly 40% of the girls in our sample had reached puberty.Almost 25% of the girls did so between the ages of 12-14 years. In this analysis, thespecific question aimed at menarche and puberty rituals were asked of only those girlswho had attained menarche. Thus the statistics in this section refer only to those 40%of the girls.
Prior knowledge of Menarche and Source of Information
About 15% did have prior knowledge of menarche and 25% did not. It was foundthat 7 . 4% of the girls found out about menarche from their friends/neighbours while5 . 6% found out from their mother and 3 .6% from their sister/sister-in-law.
How Menarche was Handled
Nearly 24% of the girls went to someone for help during their first menstruationwhile 10 . 6% took measures to protect themselves, and only 4% were mentally preparedfor the event.
It was found that in about 28% of the cases the mother helped the girl duringher menses while in 5% of the cases, the sister/sister-in-law and in 2 . 2% of the cases,friends helped out.
F'elings and Problems of the Girls Child at Menarche
The most common experience of the girl child was that of feeling frightened(9 . 5%) followed by feeling shy (9 . 2%) and feeling nothing (9 . 2%). About 2 . 7% feltdirty and 2 . 8% felt uncomfortable.
A majority of the girls did not report any problems during their periods. About9 . 7% said that they did have problems and the remedial measures adopted by themincluded taking rest (7 . 6%), taking pain killers (3%) and doing nothing (3 . P0).
Puberty Rites and Rituals
About 32 . 8% of the girls said that their communities did celebrate the onset ofmenarche with rites and ritaals while 41% said there were no such rituals.
29
2 a6

Reaction to such rituals included the girl feeling shy (5 . 1%) feeling like a heroine(4 . 4%) disliking it (2 . 6%) and feeling nothing (3 . 1%).
Taboos and Restrictions
In several communities, various taboos and restrictions were observed.
About 27% of the girls did not have to change their diet after attaining pubertywhile about 5% did. The rest were not sure.
Taboos observed included restrictions on food (11 . 9%) on social contact (14 . 1%)on play (19 . 2%) on worship/religious rituals (31 . 3%) on baths (2 . 7%), on cooking(9 . 4%) on touching others (2 . 3%) and on going out/school (1 . 2%). Clearly, a differentset of rules pertain to the girl child after she has attained puberty.
30

CHILD LABOUR
While a great deal of the time ofchildren living in poverty is spent onworking on the several tasks of maintainingand sustaining the household, child workis differentiated from child labour. On asmall farm, all the members work together,the children interspersing agriculture-relatedtasks with going to school and with doingschool work at home. Similarly, fetchingwater or fuel for the house is consideredto be household work and is almost alwaystaken on by women and girl children.
When there is a contractual elementto tile jobs done, with an understandingabout the payment to be made it is referredto as Child Labour. So when questionswere asked about child labour, it is ap-parent that only paid work outside thehome was treated by the respondents aslabour.
In the total sample, it was found that87.3% of the girls did not perform any economic activity towards supplementing thefamily income. This percentage however, did not take into account girls who hadundertaken work which contributed to the household occupation. This sort of workwas considered to be part of their duty and was not seen as economic activity.
In the total sample, 12 . 7% of the girls did contribute towards the family income.A major part of the earnings was spent on the family and the girl herself kept virtuallyiiothing out of her income. An in-depth analysis of the girl child and her work placewas carried out.
All the percentages given below pertain to those cases which were applicable tothe questions asked. From the survey it was found that, of the girls who were earning,about 4 . 7% (out of 12 . 7%) earned between Rs.100/- and Rs.300/- per month. Theirperiod of payment varied: about 3 . 1% were paid daily and 2 . 4% paid weekly.
The payment in 4 . 8% of the cases was received by the girl herself and in2 . 1% of the cases by the mother. Only 0 . 4% was saved for the girl or spent by her.
31

In about 5 . 9% of the cases, the parents/parents-in-law decided on how the incomewould be spent.
The sample also included questions about work satisfaction. About 7 . 0% weresatisfied with their jobs. Some (2 . 5%) liked working because it made them economicallyindependent and 1 .4% disliked the drudgery and long hours of work.
When asked about their future plans many said that they wanted to pursue aneducation and become qualified.
32
CASE STUDIES
This section consists of six case studies and five brief case profiles. They havebeen chosen from several different participating centres and are intended to give a broadidea of the life and situation of the girl child.
The girls in these vignettes range in age from ten to eighteen years. Only twoof the girls whose case studies are presented are in school. Most of the others havebeen forced to leave school for a variety of reasons (marriage, helping with householdchores) or have never attended school. Taken together, the stories of these girls painta picture of economic deprivation and a society with gross stereotypes of gender roles.Girls' aspirations for themselves are suppressed or ignored in the cause of social moresor the collective needs of the family.
The six case studies presented here are reasonably detailed descriptions of thedaily routine, lifestyle and opportunities of the girls concerned. The profiles are succinctsummaries that provide an overview of the lives of some of the girls included in thestudy.
The section provides the qualitativeaspects of the lives of girl children, to beused as supplement to the quantitative data.As can be seen, the two aspects aremutually reflecting, each confirming theissues focussed by the other. These casestudies also take us into the girl children'shopes and dreams, contrapunting theirharsh reality.
33
300
to

AREA PROFILES
This study has attempted to look at the current situation of the girl child;
opportunities, privileges, disadvantages, discrimination. However, it is meaningless toabstract the girl child from her environment. The society and community in which shelives, and the family environment in which she is raised, all play major roles in shapingher life. Moreover, the geographical area from which she cc rues also determines, toa large extent, how she spec rs her time and what activities fill her day.
Given the wide cross - section of geographical areas that the children in 's studycome from, it was thought prudent to summarise a few area profiles so as to givean idea of their lives in actuality. The statistical tables elsewhere in the study givean overall idea of the situation of the girl child in India. The area profiles in thischapter, profiles of selected areas in northern, southern, eastern and western parts of
the country, help provide the reader with a picture of the settings in which all thisactivity takes place, and various environmental conditions that may be responsible forthe chances, or lack of them in the life of the girl child.
Each of the collaborating teams sent in six area profiles (four rural and two urban)
as part of the report. These were graphic descriptions of the settings from which theunit of hundred girl children was sampled. A few selected profiles are included.
111110 1111111110 11110010 000001 11111111111 Oil " 1 11111111 1111111111i III
34
i

INTERVENTION PROGRAMMES
A number of intervention programmes were incorporated into the research designand were implemented in the study sites for the project on the Girl Child and theFamily. These intervention programmes were initiated by conducting in-depth interviewswith the girls and the women of the village in order to identify major problems.Following this, programmes that would help ameliorate the situations were introduced.
The four basic areas covered by these intervention schemes were
a. Gender Awarenessb. Healthc. Literacy and Educationd. Environment and Sanitation
Gender Awareness
A number of recreational workshops where women were free to discuss theirproblems and other issues were organised. The topics discussed included widowhood,the genetic basis of the sex of a child, early marriage, the subservient status of thegirl and so on.
Health
Several intervention programmes which centered on the improvement of the healthof women and children were organised. In conjunction with local voluntary agencies,lectures and exhibitions on issues of health, hygiene, immunization, nutritional dietsand family planning were also planned.
Education and Literacy
Many recreational and other workshops on topics of education and literacy wereorganised for adults and children of the villages. Novel methods, such as using theatre,arts, crafts, folk songs and dance, were used to focus on female foeticide/infanticide,child marriage, women's employment, literacy and so on.
Environment and Sanitation
Issues on environment and sanitation were also part of these intervention pro-grammes. Many lectures and demonstrations on this were organised. The project teamsometimes helped construct dry latrines for women and helped to clean the villagewater tank. They also stressed on subjects such as protection of forests, maintainingclean environment, community health and other related issues.
35
302

CONCLUSIONS AND POLICY IMPIA:;ATIONS
State Policy and Programmes: An Overview
One cannot write a conclusion to the report without taking a look at theGovernmental efforts that aim to make the developmental process more effective, byensuring its linkage to the grass roots and by being gender-sensitive. The paradigmsof development have changed over the last few decades: We now see the terms"people's participation", "women's empowerment" and "growth with equity" used widelyin policy statements.
The Indian Constitution has empowered the State to adopt measures of positivediscrimination for neutralising the cumulative disadvantage suffered by any group.Women fall in such a category and Article 15(A) (e) makes it the fundamental dutyof every citizen to uphold the dignity of women, by condemning any practice derogatoryto them.
Some of the recent legislative measures specific to the girl child are as follows:
a) The Immoral Traffic (Prevention) Act of 1986 (which makes sexual exploitation ofwomen and girls a cognizable offence)
b) Dowry Prohibition Act of 1961, amended 1986 (which makes dowry related crueltyto girls and women a cognizable offence)
c) The Child Marriage Restraint Act of 1976 (which raises the girl's minimum age atmarriage to 18).
The National Plan of Action for the Girl Child 1991 2000 integrates several sectors.Its major thrusts include survival, and protection and development of girl children, withgender-sensitivity built in at all levels.
The recent establishment (1990) of the National Co:nmission for women is alsolikely to have positive long term effects on the wellbeing of girl children.
Through the Five year Plans from 1951 - 1997 we see changes in the major conceptsconcerning gender. In the First Five Year Plan, the concept of the welfare of womendominated. In the next five years, local organization was an emphasis and under theplan, Mahila Mandals were organised at the village level. Even upto 1974, the prioritywar, for education of women and for provision of maternal and child health services.
In the Fifth Five Year Plan, there was a conceptual shift from welfare to devel-opment, thus doing away with the benefactor model of government. By the time theSixth Five Year Plan was launched, the Status of Women Report had been publishedand one impact was the formal recognition of the area. Hence women's development
36

was included as a separate sector, with emphasis on health, education and employment.The next plan continued the special focus on women, while the Eighth Plan (1992 -97), currently in operation, calls for a more vigilant monitoring of programmes so thatwomen can function as equal partners in the development process. The conceptual shiftnow is from development to empowerment of women.
The setting up of the Department of Women and Child Development under theMinistry of Human Resource Development is symbolic of the revitalisation of theGovernment machinery. It serves as a nodal dept. to guide, coordinate and review effortsfor the development and implementation of the programmes for women and girlchildren. The Central Social Welfare Board provides the umbrella for the network ofthousands of voluntary organisations working for women and children around thecountry. The National Institute of Public Cooperation and Child Development assiststhe Department in the areas of research and training. At all levels the important roleof voluntary organizations in the cause of girl children has been acknowledged by theGovernment.
There are several schemes and programmes with the objective of making womenself-reliant. Most of these interventions also have an effect on the life of the Girl Child.A few selected schemes are mentioned below:
Support to Training and Employment Projects (STEP) is aimed at upgrading theskills of assetless women and providing them with employment in traditional sectors.(This is for adult women, but as is known when women have regular employment,child labour will be rendered unnecessary, for the survival of the family).
Training - cum - Employment Scheme in non - traditional trades like Electronics,Electrical work, Manufacture, Fashion Technology, Office Management etc. includesadolescent girls in the programme.
Condensed courses of Education and Vocational Training, originally intended foradult women, also includes girls who may have dropped out of school.
The scheme of Creches for Working/Ailing Mothers' Children is now almost twodecades old. There is provision for play and recreation, health care, nutrition andimmunization of children from birth to five years of age. (These services help workingmothers as well as school-going girl children, enabling them to leave the young childin safe hands).
Integrated Child Development Services Scheme (ICDS) Comprehensive, holisticand covering over 16 million children, from birth to 5 years of age it serves deprivedand under - served communities in villages, tribal areas and urban slums, providingpreschool education, immunization, health care, nutritional supplement, referrals andparent education. The largest and most comprehensive programme of its kind, itsproblem continues to he getting quality care to the under-privileged.
37
304

Scheme for Adolescent Girls: This uses the ICDS infrastructure and focuses ongirls of 11 - 18 years who have dropped out of school. They are educated, trained andequipped to be social animators in their own neighbourhood, with communication,literacy and numeracy skills.
Early Childhood Education (ECE) Located in educationally backward states,children's centres designed to improve children's communication and cognitive skillsare running under this scheme. They influence the continuation of girl children inprimary school, stemming the dropout rate.
Programmes for women like Rashtriya Mahila Kosh (a national credit fund forwomen) and Mahila Samriddhi Yojana (a scheme to promote savings among poorwomen) as well as the scheme reserving 30% seats in Panchayats for women are allbound to have an indirect favourable impact on the girl child.
The mothers with better access to capital, equipment and other resources as wellas those with a stronger voice in self-government are definitely likely to be warriorson behalf of their girl children.
The analysis of the data reveals that despite the coverage of these and otherschemes, there are several thrust areas that need immediate focus and attention. Theyare described be...1w in simple terms.
Advocacy and Social MobilizationThe Situation in a capsule
The girl child in India is discriminated against even before birth. Studies onamniocentesis have shown that female foeticide is widespread. Figures on femaleinfanticide are also high in several states. Even after the girl is born, she has to copewith deep rooted gender stereotypes and prejudices. The birth of a girl is not celebrated.Girls usually stay home to help with household chores or look after younger siblings,while the boys are sent to school. At mealtimes, the girl waits till the men of thefamily have eaten before sitting down, with her mother and sisters, to her portion ofthe leftovers. At puberty, the girl finds her movements highly restricted; no longer isshe allowed to move about freely. Marriage is now considered a priority. Once sheis married, the girl is often harassed for bringing an inadequate dowry or forproducing a girl child. The whole cycle is reinforced and perpetuated.
Given this background, a full throated advocacy is essential. Changing socialattitudes and initiating a process of social mobilization becomes imperative. The mediacan be used effectively for this purpose. Radio, television and the printed word areall potent carriers of the messages of gender equality and the value of the girl child.The mass media, however, do not reach all sections of the population. Therefore inaddition to media representation, more traditional forms of communication should be
38

used. Street plays, for example, are extremely popular, and prove to be a simple wayof gaining people's support. Such methods which are the very life blood of voluntaryorganizations, will facilitate the outreach to the poor and the non-literate.
Special efforts must be made to develop a positive image of the girl child. Policymakers, planners and administrators must be sensitized to gender issues. These shouldthen be incorporated into policy and implemented unerringly. Issues concerning thegirl child should also be included in all public information efforts. Non governmentagencies can and do contribute to awareness generation in a large way.
The needs and problems of adolescent girls constitute a category large enoughto warrant special attention. Although the legal age of marriage for girls is 18, manygirls (mostly in rural areas) are married before they reach this age. They often havechildren before they are physically mature, leading to high rates of maternal as wellas infant mortality. Child development programmes should have a section specificallygeared to the needs of adolescent girls. Girls in this age group should also be provideda variety of opportunities for non formal education and vocational training and forupgradation of skills.
Both Central and State Governments need to protect the interests of the girl childby formulating both policies and the mechanisms for their implementation. Constitu-tional mandates can be reinforced through strengthening the legal system and byspeeding up its processes.
It is not enough, however, that the government intervenes merely by enacting newlaws. There should be action for enforcing the existing legal provisions and for workingat the prevention of legal violations. While governmental or voluntary agencies canwork on specific aspects of social mobilisation, most important is that the family andcommunity should be convinced of the need to allow the girl child to evolve to herfull potential. The process of social mobilization set in motion must make the girl childeveryone's concern. The girl must be empowered to enter the mainstream of social andeconomic activity, and encouraged to believe in herself as a valuable and contributingmember of society.
HealthInfrastructure
References to the inadequacy of health facilities and their access have been madethroughout the study. In the majority of rural areas there was no functional PrimaryHealth Centre. If families who can afford it, prefer to go to private practitioners ortake their children to the distant hospital, it is because local health centre or dispensaryservices are not available. Imperative, therefore, is the proper functioning of the PHCand the regular visits of doctors and auxiliary nurse midwives. These must be monitored
39
306

by representatives of the community. As it stands, the health infrastructure is entirelyunsatisfactory.
The response of the rural families to the Health Camps undertaken by the researchteams is a clear indicator of the scarcity of well-informed face-to-face medical helpbeing available in that area. It is hoped that the recent Panchayat elections around thecountry will put more power in the hands of the people and that their elected memberswill be made responsible to monitor the funu.ioning of the health services. The womenmembers of the Panchayat must take up among other tasks, that of monitoring thedelivery of health services.
Among other specific suggestions is the full coverage of all the children in anyvillage or slum for immunization. In our study, even the most advanced or developedvillage could not report a 100% immunization cover to the children. The schedule ofrequired immunization is complicated and the ordinary unschooled mother is not goingto be able to remember it. Calendars, posters, T. V. spots and the like should carrythe information about the immunization schedule so that it is "over-learnt" and becomespart of the everyda) vocabulary.
Raising the awareness for the need of immunization without providing the properinfrastructure may lead to frustration on a large scale. For instance, the cold chain mustbe maintained if the polio prevention shots are to be effective. Therg must be a doctor,nurse or para - professional to follow up the cases, as a single complication that isunattended results in loss of confidence that will take years to rebuild. Thus we seethat if any scheme or programme is to be effective, it must have the combination ofinfrastructural facility and the right (educated) attitudes.
Most of the girl children in our sample had no exposure to the facts of life, forexample, the relationship between menstruation and pregnancy was not explained tothem. There was hardly any well informed friendly person in the neighbourhood whocould be a support to the growing girl child. Many mothers felt that there was noneed to prepare the girl child for the experience of menarche. When menarche came,the girl child would be given hints on practical management of her menstrual periods.Generally there was no attempt to link up the event with the girl child's reproductivesystem or to give her any sex education at that point.
A review of the school books in the primary school reveals that they vary a greatdeal in different regions and states, but they have one thing in common. None of themincludes the child's perspective : the curriculum tends to be adult - centred and theapproach, one of talking down to children. In this context, we find the formal curriculuminadequate in providing the right kind of information or attitudes to the adolescent.
Educating girl children about their own physiology and anatomy is a priority itemon the health agenda. Once the concept of menstruation being Nature's way of assuring
40
307

continuity of the species is explained, the relationship between menstruation and pregnancyfollows. The scientific explanation of how the sex of the infant is determined by thecontribution of the father's genes needs to be linked up here. Although this is an abstractconcept and likely to be uncomprehended in the beginning, its repeated telling becomesimportant in the face of the "blame" placed on women for producing daughters. Tracingthe origin of the newborn's sex to the father will serve for sex education as well asfor a scientific understanding of how the sex of the unborn child is determined.
In the process, the unique and indispensible function of the female in reproductionand nurturance of the next generation - and therefore of the continuity of the humanspecies itself should be made clear. Instead of being told only about the unwisdomof having too many children and other such cliches of family planning propaganda,the girl child should be given all the information she needs for choice in and controlover her own life.
Education
We have observed that girl children are sent to school for shorter periods or notsent at all and the reasons for such parental behaviour tend to be complex. Parentsweigh the benefits of schooling against the expense of schooling, the need for the girl'slabour for household tasks and child care, as well as the anticipated occupationalopenings for them. The direct costs, the hidden costs and the opportunity costs of girl'seducation are calculated and when parents feel that these add up substantially, over-whelming the positive values for schooling, they do not send their daughters to school.Convincing parents of the value of primary education will require education to bevalued by everyone including the teachers and educational administrators.
Not only do we need to locate schools closer to communities and to increasethe number of schools, especially single sex schools where required, we need toprovide the school with the basic amenities of drinking water and separate toilets forgirls.
One of the most dismal findings of the study concerns the quality of the Libraryand the Laboratory in the schools available to the girl children. Upgrading these facilitiesshould be the priority of the Primary School systems around the country. We hearfrequent references to the "scientific temper" but not even the most elementary equip-ment is available to the ordinary school child let alone the opportunity to exploreand experiment. Laboratories must be provided in every Primary School. The samerecommendation goes for the Library. A small well selected Library must be set upin every school and the children must have easy access. Expecting children to be morethan merely literate is unrealistic in the presently functioning parched deserts that passfor schools. Children need to be able to handle books before they can becomewell - informed.
41
ulucl011r)

Even though there is no clearly established causal relationship between the numberof female teachers in school and the enrolment of girl children, there is a positivecorrelation. The probl, m in India, especially in some regions, is the unavailability offemale teachers. They often find it difficult to be mobile and to commute from longdistances. Offering housing or transport assistance would help a little, but urban teachers
are generally unwilling to settle in rural areas. If the school system is willing to settle
for a lower educational qualification for the teacher and provide in - service training
as in the Shiksha Karmi Programme in Rajasthan, for example, it would be a feasible
strategy. Whatever is done will have to be worked out in the context of local conditions.For instance, any rural area will have some resource people whose contributions tothe school system can be used and acknowledged. In every instance more locallyavailable persons can be indentified, trained, employed, retrained and sustained, withthe active involvement of voluntary organizations in that area.
Even parents without a formal education are capable of a cost benefit analysisof educating girl children. It is a fact that the benefits are frequently invisible and setin the future, structured on a number of hypotheses, while the costs are immediate,real and tangible. Advocacy should take these factors into consideration; concurrentlythere must be the kind of social action by which the harvest of benefits can be reaped.In other words, persuading girls to attend school is desirable; but for the benefits ofeducation to accrue, schools should be improved and the labour market opened upto provide employment to the educated.
We should be able to see that the int' a,cructure exists for every woman and girlchild to save money and to have it in safe custody. Towards this end, a women'sbank should be organised (in the model of SEWA Rural Bank for instance). All ofthese suggestions will become effective when a Mahila Mandal (local Women's group)
starts functioning in every village.
In poor communities which have the practice of giving a "bride price" at the timeof marriage, girls tend to be married off very early. Parents out of need, greed oravarice give away their young daughters in marriage in order to get the cash. Thegirl child thus becomes a commodity. The cash received from the transaction couldbe used to repair a house, repay a gambling debt or start a small business. A boychild's labour is also bartered away in similar ways, but the experience of being acommodity is worse for the girl child, as her sexual services may be in demand, inaddition to her unpaid labour.
Every effort must be made to help women in slum, village or hamlet to havetheir own organization. Again in this matter, the work of NGO's is central. A MahilaMandal should not be an implant, but be organic to the community with its rootsin the local reality growing gradually and become the banyan tree providing thecommon meeting place and shelter that women and girl children need.
42
3J9

Since the setting up of this study about four years ago, some significant achieve-ments have been made in the identification of culturally relevant and gender-orientedprogrammes. The advocacy of voluntary organizations and the women's collectives hasresulted in the beginnings of a change in the attitudes of administrators and planners.However there is bound to be a time lag between the launching of a new idea andits full implementation. Advocacy should be aimed at reducing this time lag, byorganizations serving a monitoring function.
his study has revealed that the involvement of women students of College andUniversity in the problems of families living in poverty can be mutually enriching.Supported by the recent observations made of the Total Literacy Movement is a factthat cannot be overlooked: when more privileged members of the society play an activerole in a development task, handling it with enthusiasm, energy and empathy, thechemistry of success is created. We need a sense of neighbourhood and a fellow feeling;we must base in that, our conviction that sisterhood is strong; and with that we mustput our weight on the side of the girl child. The girl is in a category without aspokesman in society and we must raise our voices on her behalf. Let us do so inunison.
To summarise, the study confirmed many of the hunches and hypotheses withwhich it was begun i.e. that the birth of the girl child tends to be greeted with anaemicjoy, if not grief, and that she continues to be treated within the family and outsideas a second class citizen. The devaluation of the girl child has been deeply internalisedat several levels of socio-economic status. Parental education and improvement ofemployment and income are naturally related to the girl's life chances. The clusteringof the variables of disadvantage resulting in the downward spiral of poverty pushesthe girl child to the nadir of subservience.
The self-image and self-esteem of the girl child must be enhanced and strengthenedby activities and exercises with her as well as by changing the perspectives of thepersons in her immediate environment. This may be achieved by a variety of methods,including intervention through the school's extra-curricular activities, theatre and puppetformats, displays and discussions.
The chance for the girl child to pick up a skill that can be used for economicbetterment has to be provided in the village or urban neighbourhood. The girl childrenwish that they could use their education to support themselves and supplement familyincome.
The area profiles reveal drab and dusty neighbourhoods, frequently characterisedby the phrase "nothing ever happens here". A Community Centre is essential - andfor some hours of the day, it should be reserved for all the girl children in thecommunity. Here non-formal education on health, the functioning of the woman's bodyand counselling for problems should be made available.
43
310
Economic activity is necessary for the girls to feel independent and capable ofearning for their own. needs. Focus on the employment of girls and women will haveto become a priority with local planning.
It is not only changing attitudes and values that is necessary. A number ofstructural changes must be implemented, in order to free the girl from her presentchain of household tasks.
Poverty alleviation programmes, a more equitable public distribution system andminimum wages to adults will make it unnecessary to employ child labour.
- Creche and other child care facilities must be set up in school, factory andplantation, in order to enable the girl child to attend to her own needs.
- Attention must be paid to provision of clean drinking water within easy reachof households and revival of traditional water conservation methods and rain harvestingby the community. This is a categorical imperative as the girl child spends much timeon fetching water.
Re-introducing the concept of the commons to which all have access, andafforestation activities monitored by the community would be eco-friendly and reducethe drudgery of the girl child.
- Energising existing systems the Primary and Secondary schools as well as thePrimary Healt'- Centre to function effectively and to be accountable to the people.
In all these, a working partnership is necessary between the Government, VoluntaryOrganizations and the community of women and children.
44
31i

Photographs
Courtesy UNICEF p.13, p.17, p.19, p.22, p.32.Courtesy S. Anandalakshmy Cover Page p.34, P.35.
312
Copyright © 2022 FDOKUMEN