Depressive Symptoms and Change in Abdominal Obesity in Older Persons
Upload
independentCategory
view
0download
0
626 Twin Research Volume 7 Number 6 pp. 626–636
The aim of the present study was to examine thecontribution of genetic and environmental factors
to depressive symptoms among older women. Theparticipants were 102 monozygotic and 115 dizygoticfemale twin pairs aged 64 to 76 years. Depressivesymptoms were assessed by the Center for theEpidemiologic Studies Depression Scale. The contri-bution of genetic and environmental effects wasestimated for the constructed depressiveness factorand for the subscales which were depressed mood,psychomotor retardation, lack of wellbeing and inter-personal difficulties. Of the variance indepressiveness, shared environmental influencesaccounted for 39% and nonshared environmentalinfluences 61%. For the subscales, 24% to 62% ofthe variance was explained by individual, and 13% to23% by shared, environmental factors. Lack of well-being had its own moderate additive genetic effectexplaining 30% of the variance. This study showedthat in older women predominantly environmentalfactors underlay individual differences in depressive-ness; however, the factors varied to some extentbetween dimensions measured by the subscales.
Depressive symptoms are relatively common in olderpopulations (Haynie et al., 2001), especially amongwomen (Piccinelli & Wilkinson, 2000; Sonnenberg etal., 2000; Takkinen et al., 2004). Compared to majordepression based on clinical assessment, depressivesymptoms often assessed by self-ratings represent themilder end of the continuum of depression (Kendler &Gardner, 1998). Studying the origin of individual dif-ferences in depressive symptoms is important, becausethe subclinical symptoms have received less attention,even though their prevalence is considerably higherthan the prevalence of major depression. Studies com-paring depressive symptoms and major depression
suggest common genetic and environmental vulnerabil-ity factors and neurobiological substrates (Foley et al.,2001; van der Berg et al., 2001, 1999). Depressivesymptom scores that lie even below a clinical cut-offcan predict various psychiatric diagnoses (Zondermanet al., 1993). Depressive symptoms can decrease sub-jective wellbeing, increase the risk of suicidal ideationand attempts, and illnesses, and increase the use of hos-pital and outpatient medical services (see for a reviewBlazer, 2003). Given the multiple negative correlates ofdepressiveness, an interesting question which arises isthe etiology of depressive symptoms, in particular asdepressive symptoms may not be a homogeneous phe-nomenon but a representation of a multivariate factorwith varied genetic and environmental sources underly-ing its dimensions.
A number of self-rating scales have been devel-oped to assess depressive symptoms (McDowell &Newell, 1996). These scales usually include subscalesto tap the different dimensions of depressiveness. Inthe present study, we use the Center for theEpidemiologic Studies Depression Scale (CES-D). TheCES-D was designed to measure depressive symptomsin population surveys (Radloff, 1977). Though thescale is not designed for clinical diagnosis, it is basedon symptoms of depression as seen in clinical cases.The scale is commonly used in studies among olderpopulations. The emphasis in the scale is on the affec-tive component of depressed mood. The CES-D hasusually captured four factors which are depressedaffect, positive affect, psychomotor retardation andinterpersonal difficulties. According to Radloff
The Genetic and Environmental Effects on Depressive Symptoms Among OlderFemale Twins
Sanna Takkinen,1 Asko Tolvanen,2 Jaakko Kaprio,3,4 Stig Berg,1,5 Markku Koskenvuo,6 and Taina Rantanen7,8
1Institute of Gerontology, School of Health Sciences, Jönköping, Sweden2Department of Psychology, University of Jyväskylä, Finland3Department of Public Health, University of Helsinki, Finland4Department of Mental Health, National Public Health Institute, Finland5Center for Developmental and Health Genetics,The Pennsylvania State University, University Park, United States of America6Department of Public Health, University of Turku, Finland7Department of Health Sciences, University of Jyväskylä, Finland8The Finnish Centre for Interdisciplinary Gerontology, University of Jyväskylä, Finland
Received 28 June, 2004; accepted 25 August, 2004.
Address for correspondence: Sanna Takkinen, Institute ofGerontology, School of Health Sciences, PO Box 1026, 55111Jönköping, Sweden. E-mail: [email protected]

627Twin Research December 2004
Genetic and Environmental Effects on Depressive Symptoms
(1977), the positive items form a separate dimensionin the scale and are not merely the inverse of the nega-tive items. Some studies have indicated that amongolder people lack of wellbeing rather than negativesymptoms is a more salient feature of depression (Gatzet al., 1992). Moreover, in old age the lack of wellbe-ing factor and negative symptoms are suggested tohave separate sets of predictors (Haynie et al., 2001).
Twin and family studies on depressive symptomshave generally shown rather low genetic impact andconsiderable environmental impact explaining individ-ual differences in adulthood and old age (Clifford etal., 1984; Gatz et al. 1992; Jansson et al., 2004;Jardine et al., 1984; Kendler et al. 1994b; MacKinnon,et al., 1990; McGue & Christensen, 1997). Only a fewstudies have focused on the sources of individual varia-tion in the subscales of depressive symptoms. Gatz etal. (1992) used CES-D total scale and subscales among29- to 87-year-old twins. In the CES-D total scale,16% of the variance was explained by genetic effects,27% was accounted for by shared environmentaleffects and 55% by effects that were unique for anindividual. Age had a very small effect in the models.For the subscales, environmental effects explained mostof the variation except for psychomotor retardation,which had a slight genetic effect, the genetic effectbeing more evident among older twins.
Jang et al. (2004) recently reported the heritabilityin the subscales of CES-D and other depression scalesamong young adults. The results indicated geneticeffect (between 18% and 35%) on the subscales thatreflect physiologic functions, such as loss of appetite,loss of pleasure, and cognitions such as feelings ofguilt, hopelessness and positive affect. Other symptomsthat were associated with major depression, such asnegative affect, nausea, headaches and tearfulness,were not heritable. In another study among young andmiddle-aged twins (Silberg et al.,1990), additive geneticeffects explained 29% of the variance in depressivesymptoms, shared environmental effects accounted for13% and unique environmental effects the remaining58% of variability in the total CES-D score. For thesubscale scores of depressed mood and psychosomaticretardation only environmental effects were observed,while the subscales for interpersonal difficulties andlack of wellbeing had genetic effects accounting for55% and 33% of variability, respectively. These find-ings indicate that there may be differences in themagnitude of genetic and environmental effects on dif-ferent dimensions of depressive symptoms.
The aim of the present study was to examine thecontribution of genetic and environmental factors todepressive symptoms among older women. We espe-cially wanted to study in more detail the architecture ofgenetic and environmental effects underlying the differ-ent dimensions of depressiveness. We used structuralequation modeling to analyze the common and specificgenetic and environmental effects in the factor struc-ture. This procedure allows for investigation of the
proportions of genetic and environmental effects in thesubscales of depressive symptoms within the factorstructure of the whole scale and comparison of thealternative models.
MethodSample
The study is part of the Finnish Twin Study on Aging(FITSA), a research program on the genetic and envi-ronmental effects on the disablement process in olderwomen. The sample was drawn from a larger twinstudy, the Finnish Twin Cohort Study with 13,888adult twin pairs at the baseline in 1975 (Kaprio &Koskenvuo, 2002; Kaprio et al., 1978). The zygosity ofthe twins was determined at the baseline by a validatedquestionnaire (Sarna et al., 1978). The twins were clas-sified as monozygotic (MZ), dizygotic (DZ) or ofuncertain zygosity (XZ). The method classified 92.7%of the pairs as MZ and DZ with 1.7% probability ofmisclassification.
The Finnish Twin Cohort Study included 1260respondent female twin pairs born during the period1924 to 1937 and first studied in 1975. Of this group,an invitation to take part in the present study was sentto 178 MZ, 212 DZ and 24 XZ twin pairs selected onthe basis of age and zygosity. The inclusion criteriawere willingness of both sisters of a twin pair to partic-ipate and self-reported ability to walk two kilometersand to travel independently to the laboratory. Thereasons for nonparticipation were that one or bothsisters were unwilling to participate (50 MZ, 51 DZand 5 XZ pairs), had poor health (28 MZ, 52 DZ and5 XZ pairs), or had died (2 MZ, 3 DZ and 1 XZpairs). A total of 98 MZ, 106 DZ and 13 XZ twinpairs participated in the laboratory examination. Thezygosity of XZ twins was determined by a battery of10 highly polymorphic gene markers using DNAextracted from a venous blood sample. According tothe results, 4 XZ pairs were classified as MZ and 9 asDZ.
Measures
Depressive symptoms were assessed by the Center forthe Epidemiologic Studies Depression Scale (CES-D;Radloff, 1977). The total scale has 20 items. Four posi-tively worded items were reverse-coded and theyformed the subscale for lack of wellbeing. The sub-scales of depressed mood and psychomotor retardationincluded seven items each. The subscale of interper-sonal difficulties had two items. Three participants hadone item missing and one participant four itemsmissing in the scale. The missing items were imputedusing the mean of the individual’s scale. Because of thedifferent number of items in the scales, the mean scoresfor the total scale and four subscales were calculated.The scale has shown good reliability and validity alsoamong older people (see Beekman et al., 1997; Gatz etal., 1993; Lewinsohn et al., 1997; Scott & Melin,1998). The internal consistency of the total scale and

628 Twin Research December 2004
Sanna Takkinen, Asko Tolvanen, Jaakko Kaprio, Stig Berg, Markku Koskenvuo, and Taina Rantanen
the subscales was adequate in the present study(Cronbach’s alpha, α = .88 for total scale, α = .84 fordepressed mood, α = .75 for psychomotor retardation,α = .79 for lack of wellbeing, and α = .52 for interper-sonal difficulties).
Because co-twins may have considerable socialinteraction, and this may cause bias in twin correla-tions and means, frequency of social contacts wasstudied. Social contact with the co-twin was deter-mined by a single self-reported item: How often do youand your twin sister see or phone each other? (0 =never, 1 = less than once in a half year, 2 = about oncea half year, 3 = about once a month, 4 = about once aweek, 5 = daily or almost daily). About 90% of themembers of a twin pair fully agreed on the frequencyof social contact. The disagreeing pairs (10%) differedfrom each one point, except one pair that had twopoints difference. Because of the high agreementbetween the co-twins, a mean of the social contact wascalculated within a twin pair. The distribution of thefrequency of social contact was very skewed: 44% ofthe pairs contacted each other daily or almost daily.Therefore, the variable was dichotomized in the furtheranalyses (1 = contacts once a week or less, 2 = contactsdaily or almost daily).
Statistical Methods
The distributions of the subscales for depressed mood,psychomotor retardation and interpersonal difficultieswere skewed. Logarithmic transformation was carriedout for these scales and after this the distributions wereadequate for the analysis. Means, intraclass correla-tions and correlations in the total and subscales ofCES-D were calculated. The effects of the social con-tacts with the co-twin on depressive symptoms werestudied by partial correlations and t tests.
After these preliminary analyses, a measurementmodel was constructed using the multisample methodof LISREL software (Jöreskog et al., 1999). The meanscores of the subscales were used as observed variables.The use of four means instead of 20 items in the modelwas more practical given the present sample size. In themodel, factor loadings, variances of the factors andresidual variances were set equal for both twin sistersacross the MZ and DZ groups. This was done to keepthe structure of the measurement model similar in theMZ and DZ groups. In addition, covariances betweencorresponding components of twins were estimatedfreely in both the MZ and DZ group. The constructedmodel was fitted to the observed covariance matrixusing Maximum Likelihood method. The fit of themodel was evaluated using χ2 test. Root mean squareerror of approximation (RMSEA; Steiger, 1990), com-parative fit index (CFI; Hu & Bentler, 1995), andnonnormed fit index (NNFI; Bentler & Bonnet, 1980)were also used according to the rules suggested by Huand Bentler (1999; RMSEA < 0.06, CFI > 0.95 andNNFI > 0.95). The means of the CES-D subscales wereincluded in the measurement model to test that there
were no mean differences between the MZ and DZtwins. The effect of age was also checked in the mea-surement model.
To determine the relative contribution of geneticand environmental effects to the estimated variance ofthe latent factors in the measurement model, structuralequation modeling was used. Estimation of geneticeffects is based on the comparison of the similarity ofMZ pairs, who share all their genes in common bydescent, with DZ pairs, who share on average 50% oftheir segregating genes. Further, MZ and DZ twins areexpected to be equally susceptible to environmentalinfluences relevant to depressive symptoms and thatmating is random with respect to the trait under study(Posthuma et al., 2003). The total phenotype variance(V) is decomposed to three sources of variances: addi-tive genetic (A), shared environmental (C), andnonshared environmental (E) effects. The ACE modelwas fitted to the latent factors of the measurementmodel. A and/or C component were dropped from themodel and the nested models were compared by thedifference in the χ2 value (Bentler & Bonnet, 1980) andAkaike’s Information Criterion (AIC; Akaike, 1987). Asignificant chi-square difference indicates that thereduction in the model significantly reduces the fit ofthe model to the data. In the AIC value comparison, asmaller value indicates better fit. The model compari-son aimed to detect the most parsimonious model thatfitted the data well and was theoretically interpretable.
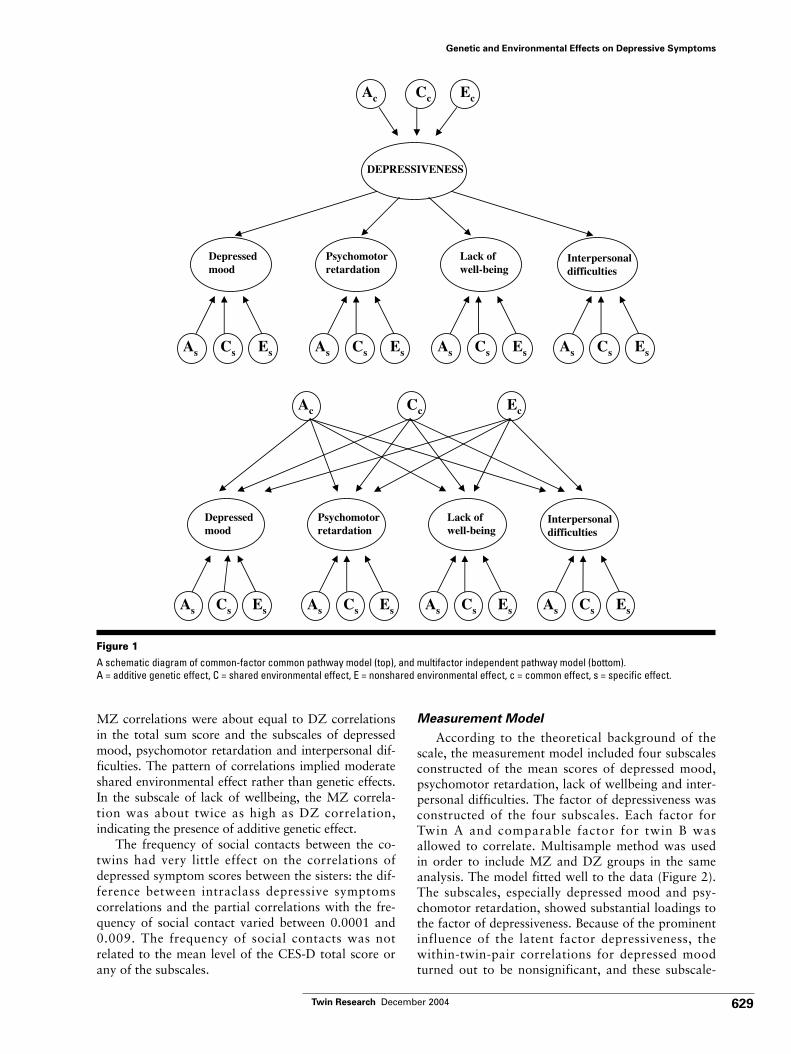
To study the genetic and environmental effects onthe latent factor and the four subscales simultaneously,the common-factor common pathway model was used(Rijsdijk & Sham, 2002). In this model the covariationbetween subscales is attributed to a single underlying‘phenotypic’ latent variable called depressiveness in thisstudy. The observed variance of the latent variable isdecomposed into genetic and environmental compo-nents of variance called common A, common C andcommon E. In addition there are variable-specificgenetic and environmental sources of variance calledspecific A, specific C and specific E. An alternativemodel, multifactor independent model, was also tested.In this model, the variance of the four subscales isdecomposed into common A, common C and commonE. The model also includes the variable-specific geneticand environmental sources (specific A, specific C andspecific E). The schematic diagrams of these twomodels are shown in Figure 1.
ResultsDescriptive Statistics of Depressive Symptoms
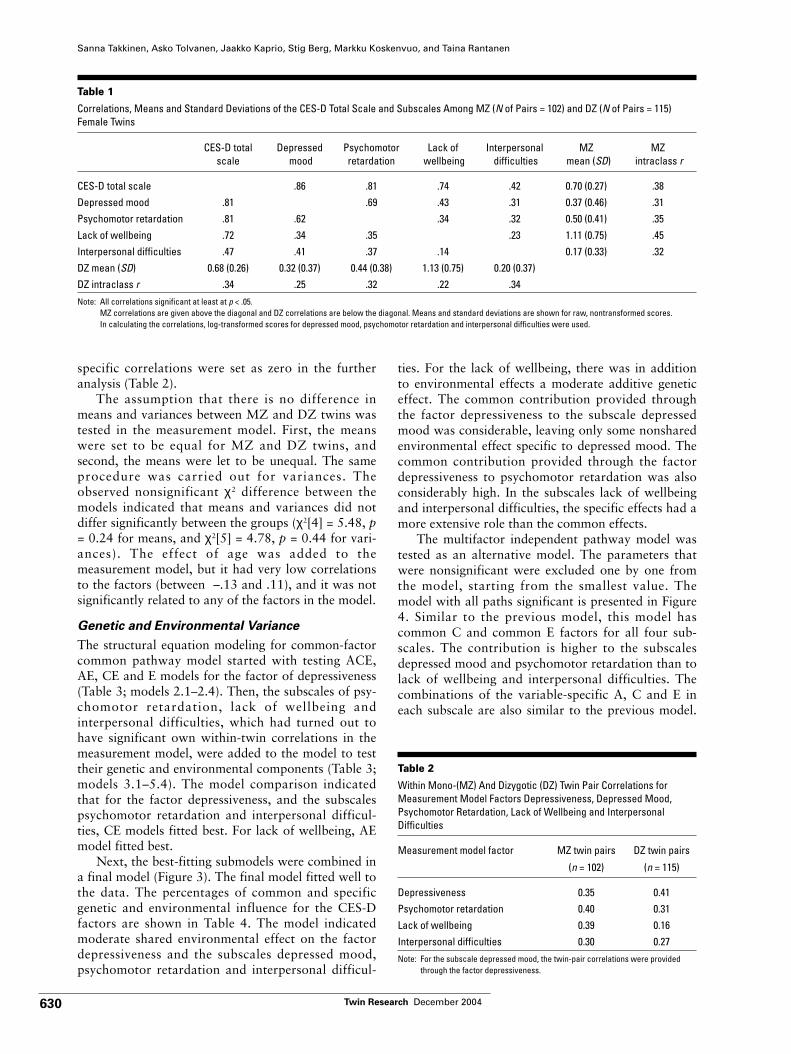
The means, standard deviations and correlations forMZ and DZ twins in depressive symptoms are shownin Table 1. The sum score in the total CES-D scale was14. About a third of the participants scored 16 or morein the scale. Correlations between the subscales werehigh and indicated adequate factor loadings for thestructural equation modeling. Twin pairs showed sig-nificant intraclass correlations in depressive symptoms.
629Twin Research December 2004
Genetic and Environmental Effects on Depressive Symptoms
MZ correlations were about equal to DZ correlationsin the total sum score and the subscales of depressedmood, psychomotor retardation and interpersonal dif-ficulties. The pattern of correlations implied moderateshared environmental effect rather than genetic effects.In the subscale of lack of wellbeing, the MZ correla-tion was about twice as high as DZ correlation,indicating the presence of additive genetic effect.
The frequency of social contacts between the co-twins had very little effect on the correlations ofdepressed symptom scores between the sisters: the dif-ference between intraclass depressive symptomscorrelations and the partial correlations with the fre-quency of social contact varied between 0.0001 and0.009. The frequency of social contacts was notrelated to the mean level of the CES-D total score orany of the subscales.
Measurement Model
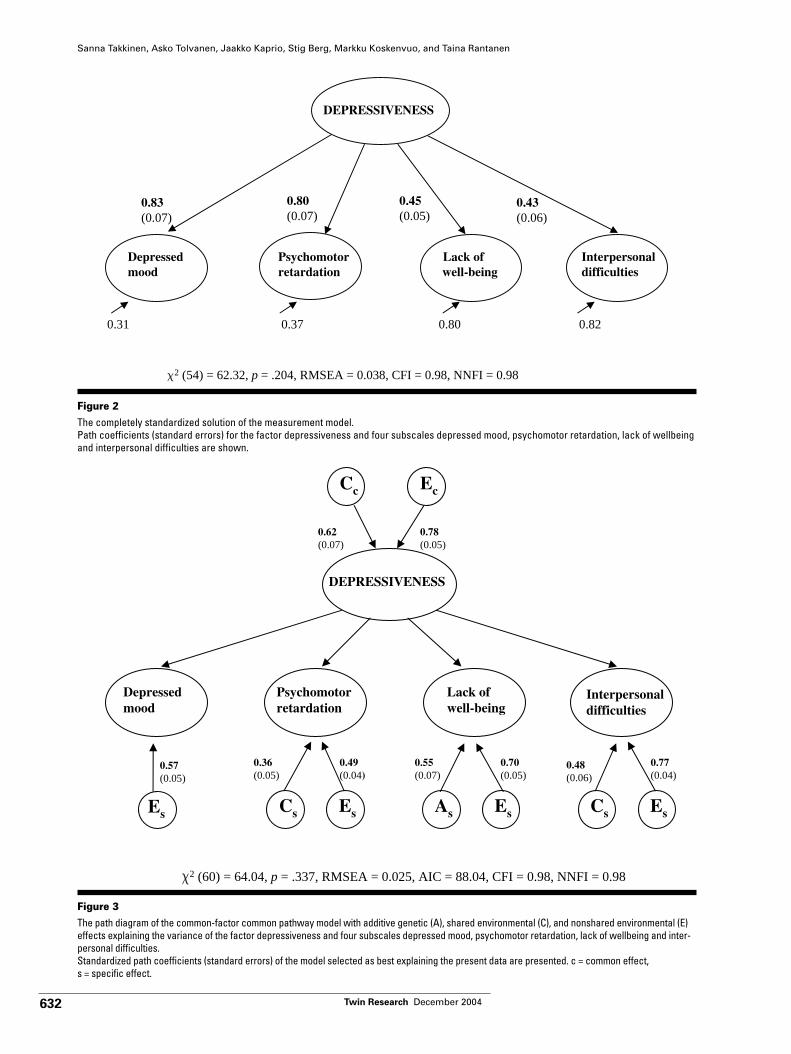
According to the theoretical background of thescale, the measurement model included four subscalesconstructed of the mean scores of depressed mood,psychomotor retardation, lack of wellbeing and inter-personal difficulties. The factor of depressiveness wasconstructed of the four subscales. Each factor forTwin A and comparable factor for twin B wasallowed to correlate. Multisample method was usedin order to include MZ and DZ groups in the sameanalysis. The model fitted well to the data (Figure 2).The subscales, especially depressed mood and psy-chomotor retardation, showed substantial loadings tothe factor of depressiveness. Because of the prominentinfluence of the latent factor depressiveness, thewithin-twin-pair correlations for depressed moodturned out to be nonsignificant, and these subscale-
SSENEVISSERPED
desserpeDdoom
rotomohcysPnoitadrater
fo kcaLgnieb-llew
lanosrepretnIseitluciffid
Cc EcAc
Cs EsAs Cs EsAs Cs EsAs Cs EsAs
desserpeDdoom
rotomohcysPnoitadrater
fo kcaLgnieb-llew
lanosrepretnIseitluciffid
Cc EcAc
Cs EsAs Cs EsAs Cs EsAs Cs EsAs
Figure 1A schematic diagram of common-factor common pathway model (top), and multifactor independent pathway model (bottom). A = additive genetic effect, C = shared environmental effect, E = nonshared environmental effect, c = common effect, s = specific effect.
630 Twin Research December 2004
Sanna Takkinen, Asko Tolvanen, Jaakko Kaprio, Stig Berg, Markku Koskenvuo, and Taina Rantanen
specific correlations were set as zero in the furtheranalysis (Table 2).
The assumption that there is no difference inmeans and variances between MZ and DZ twins wastested in the measurement model. First, the meanswere set to be equal for MZ and DZ twins, andsecond, the means were let to be unequal. The sameprocedure was carried out for variances. Theobserved nonsignificant χ2 difference between themodels indicated that means and variances did notdiffer significantly between the groups (χ2[4] = 5.48, p= 0.24 for means, and χ2[5] = 4.78, p = 0.44 for vari-ances). The effect of age was added to themeasurement model, but it had very low correlationsto the factors (between –.13 and .11), and it was notsignificantly related to any of the factors in the model.
Genetic and Environmental Variance
The structural equation modeling for common-factorcommon pathway model started with testing ACE,AE, CE and E models for the factor of depressiveness(Table 3; models 2.1–2.4). Then, the subscales of psy-chomotor retardation, lack of wellbeing andinterpersonal difficulties, which had turned out tohave significant own within-twin correlations in themeasurement model, were added to the model to testtheir genetic and environmental components (Table 3;models 3.1–5.4). The model comparison indicatedthat for the factor depressiveness, and the subscalespsychomotor retardation and interpersonal difficul-ties, CE models fitted best. For lack of wellbeing, AEmodel fitted best.
Next, the best-fitting submodels were combined ina final model (Figure 3). The final model fitted well tothe data. The percentages of common and specificgenetic and environmental influence for the CES-Dfactors are shown in Table 4. The model indicatedmoderate shared environmental effect on the factordepressiveness and the subscales depressed mood,psychomotor retardation and interpersonal difficul-
ties. For the lack of wellbeing, there was in additionto environmental effects a moderate additive geneticeffect. The common contribution provided throughthe factor depressiveness to the subscale depressedmood was considerable, leaving only some nonsharedenvironmental effect specific to depressed mood. Thecommon contribution provided through the factordepressiveness to psychomotor retardation was alsoconsiderably high. In the subscales lack of wellbeingand interpersonal difficulties, the specific effects had amore extensive role than the common effects.
The multifactor independent pathway model wastested as an alternative model. The parameters thatwere nonsignificant were excluded one by one fromthe model, starting from the smallest value. Themodel with all paths significant is presented in Figure4. Similar to the previous model, this model hascommon C and common E factors for all four sub-scales. The contribution is higher to the subscalesdepressed mood and psychomotor retardation than tolack of wellbeing and interpersonal difficulties. Thecombinations of the variable-specific A, C and E ineach subscale are also similar to the previous model.
Table 1
Correlations, Means and Standard Deviations of the CES-D Total Scale and Subscales Among MZ (N of Pairs = 102) and DZ (N of Pairs = 115)Female Twins
CES-D total Depressed Psychomotor Lack of Interpersonal MZ MZscale mood retardation wellbeing difficulties mean (SD) intraclass r
CES-D total scale .86 .81 .74 .42 0.70 (0.27) .38Depressed mood .81 .69 .43 .31 0.37 (0.46) .31Psychomotor retardation .81 .62 .34 .32 0.50 (0.41) .35Lack of wellbeing .72 .34 .35 .23 1.11 (0.75) .45Interpersonal difficulties .47 .41 .37 .14 0.17 (0.33) .32DZ mean (SD) 0.68 (0.26) 0.32 (0.37) 0.44 (0.38) 1.13 (0.75) 0.20 (0.37)DZ intraclass r .34 .25 .32 .22 .34
Note: All correlations significant at least at p < .05.MZ correlations are given above the diagonal and DZ correlations are below the diagonal. Means and standard deviations are shown for raw, nontransformed scores. In calculating the correlations, log-transformed scores for depressed mood, psychomotor retardation and interpersonal difficulties were used.
Table 2
Within Mono-(MZ) And Dizygotic (DZ) Twin Pair Correlations forMeasurement Model Factors Depressiveness, Depressed Mood,Psychomotor Retardation, Lack of Wellbeing and InterpersonalDifficulties
Measurement model factor MZ twin pairs DZ twin pairs
(n = 102) (n = 115)
Depressiveness 0.35 0.41Psychomotor retardation 0.40 0.31Lack of wellbeing 0.39 0.16Interpersonal difficulties 0.30 0.27
Note: For the subscale depressed mood, the twin-pair correlations were providedthrough the factor depressiveness.

631Twin Research December 2004
Genetic and Environmental Effects on Depressive Symptoms
Compared to the common-factor common pathwaymodel, the multifactor independent pathway modelhad a slightly bigger AIC value indicating worse fit.Therefore, the final model with the best fit is thecommon-factor common pathway model.
DiscussionThe present study showed that about two thirds ofthe influence on depressive symptoms is due to envi-ronmental variation that is unique to each individual.The results are congruent with the previous findingsthat environmental factors explained most of the vari-ance in depressive symptoms in older people (Gatz etal. 1992; Jansson et al., 2004; McGue & Christensen,1997). Familial influence also plays a role, though ina smaller scope. For lack of wellbeing, that is, therevised scale for positive mood, the familial influenceappeared to be genetic in origin. For depressed mood,psychomotor retardation and interpersonal difficul-ties, that is, negative mood, in turn, the familialinfluence was due to the shared environment, forinstance parenting style and early social experiences,and peer effects in common or shared life events (seeRomanov et al., 2003; Rose et al., 2003). The influ-ence varied in the subscales of depressive symptomsindicating differences in the sources of variance in dif-ferent aspects of mood.
Our structural equation model confirmed the factorstructure of the CES-D. The latent factor depressive-ness was underlying the four subscale scores. In thedesign of the scale the emphasis was on the affectivecomponent, depressed mood (Radloff, 1977). Ourfindings are in line with this as the depressivenessfactor explained practically all of the variation in thesubscale depressed mood. The variation in the sub-scales for negative mood was entirely explained byenvironmental effects, whereas positive mood wasexplained by genetic and environmental affects thatwere unique to an individual. Silberg et al. (1990) alsofound that positive mood and interpersonal difficulties
Table 3
The Fit and Comparison of the Nested Models for Factor Depressiveness, and the Subscales Depressed Mood, Psychomotor Retardation, Lack ofWellbeing and Interpersonal Difficulties
Model χ2 df RMSEA AIC NNFI CFI Model ∆χ2 (df)comparison
1 Measurement model 62.32 54 0.038 98.32 0.98 0.98
2 Nested models for the factor depressiveness2.1 Depressiveness ACE 111.23 62 0.086 125.23 0.88 0.902.2 Depressiveness AE 116.09 63 0.089 128.09 0.89 0.88 2.2 vs. 2.1 4.86 (1)*2.3 Depressiveness CE 111.23 63 0.084 123.23 0.89 0.90 2.3 vs. 2.1 0 (1) NS2.4 Depressiveness E 138.11 64 0.104 148.11 0.83 0.85 2.4 vs. 2.1 26.87 (2)**
3–5 Nested models for the subscales under depressiveness CE3.1 Psychomotor retardation ACE 99.78 60 0.079 117.78 0.91 0.923.2 Psychomotor retardation AE 100.17 61 0.077 116.17 0.91 0.92 3.1 vs. 3.2 0.39 (1) NS3.3 Psychomotor retardation CE 100.08 61 0.077 116.08 0.91 0.92 3.3 vs. 3.1 0.30 (1) NS3.4 Psychomotor retardation E 264.39 62 0.174 279.39 0.00 0.04 3.4 vs. 3.1 63.61 (2)**
4.1 Lack of wellbeing ACE 91.07 60 0.069 109.07 0.92 0.934.2 Lack of wellbeing AE 91.07 61 0.068 107.07 0.92 0.93 4.2 vs. 4.1 0 (1) NS4.3 Lack of wellbeing CE 95.20 61 0.072 111.20 0.92 0.92 4.3 vs. 4.1 4.13 (1)*4.4 Lack of wellbeing E 111.23 62 0.086 125.23 0.88 0.90 4.4 vs. 4.1 20.16 (2)**
5.1 Interpersonal difficulties ACE 94.55 60 0.073 112.55 0.92 0.925.2 Interpersonal difficulties AE 96.43 61 0.074 112.43 0.92 0.92 5.2 vs. 5.1 1.88 (1) NS5.3 Interpersonal difficulties CE 94.51 61 0.071 110.51 0.92 0.93 5.3 vs. 5.1 0.04 (1) NS5.4 Interpersonal difficulties E 111.23 62 0.086 125.23 0.88 0.91 5.4 vs. 5.1 16.68 (2)**
Note: NS = nonsignificant, * p < .05, ** p < .001For the subscale depressed mood, the environmental influences were provided through the factor depressiveness.
Table 4
Percentage of Genetic and Environmental Effects in the Final Model
Common SpecificA C E A C E
Depressiveness – 39 61Depressed mood – 27 42 – – 31Psychomotor retardation – 24 38 – 13 24Lack of wellbeing – 8 12 30 – 49Interpersonal difficulties – 7 11 – 23 59
Note: A = additive genetic; C = shared environmental; E = nonshared environmentaleffect.
632 Twin Research December 2004
Sanna Takkinen, Asko Tolvanen, Jaakko Kaprio, Stig Berg, Markku Koskenvuo, and Taina Rantanen
SSENEVISSERPED
desserpeDdoom
rotomohcysPnoitadrater
fo kcaLgnieb-llew
lanosrepretnIseitluciffid
2 = .337, RMSEA = 0.025, AIC = 88.04, CFI = 0.98, NNFI = 0.98 p ,40.46 = )06(
As
Cc
Cs Cs
Ec
Es Es Es
63.0)50.0(
55.0)70.0(
94.040.0( )
07.0)50.0(
84.0)60.0(
77.0)40.0(
26.0)70.0(
87.0)50.0(
Es
75.0)50.0(
Figure 3The path diagram of the common-factor common pathway model with additive genetic (A), shared environmental (C), and nonshared environmental (E)effects explaining the variance of the factor depressiveness and four subscales depressed mood, psychomotor retardation, lack of wellbeing and inter-personal difficulties.Standardized path coefficients (standard errors) of the model selected as best explaining the present data are presented. c = common effect,s = specific effect.
SSENEVISSERPED
desserpeDdoom
rotomohcysPnoitadrater
lanosrepretnIseitluciffid
28.008.073.013.0
38.0)70.0(
08.0)70.0(
54.0)50.0(
34.0)60.0(
2 = .204, RMSEA = 0.038, CFI = 0.98, NNFI = 0.98 p ,23.26 = )45(
fo kcaLgniebwell-
Figure 2The completely standardized solution of the measurement model.Path coefficients (standard errors) for the factor depressiveness and four subscales depressed mood, psychomotor retardation, lack of wellbeingand interpersonal difficulties are shown.

633Twin Research December 2004
Genetic and Environmental Effects on Depressive Symptoms
had moderate genetic effects, whereas depressed moodand psychomotor retardation were explained by onlyenvironmental effects. The results of our study indicatethat the positive mood subscale has its own differentetiology giving support to the earlier suggestion that itscontent cannot be interpreted only as an inverse to neg-ative mood (Radloff, 1977; Zich et al., 1990).
The interrelation between the positive and nega-tive mood is interesting. Subjective wellbeing is not asingle dimension, but composed of dimensions of pos-itive and negative affect (Diener et al., 1985; Emmons& Diener, 1985). These dimensions have shown to beindependent of each other and have different corre-lates (Baker et al., 1992; Stallings et al, 1997; Watson,1988). On the other hand, strong negative correla-tions have also been found, for instance betweensatisfaction with life and depression, neuroticism andsuicide risk (see Hayes & Joseph, 2003; Koivumaa-Honkanen et al., 2000; Lewis et al., 1999). Inunraveling the ambiguous relationship between posi-tive and negative, the results of the present studyprovide some interesting aspects. According to theresults, negative and positive affect are correlated andpart of the environmental factors underlying them arecommon for the subscales of lack of wellbeing andthe rest of the CES-D scale. However, the geneticsource of variance is characteristic only of lack of
wellbeing and not of the subscales measuring negativemood in the rest of the scale.
The subscale lack of wellbeing was not only differ-ent from the other CES-D subscales in terms of itssources for individual differences, it also had highestmean scores and biggest variance of the four subscalesin this sample. The result goes along with the previousfindings that the lack of wellbeing is a relatively bigcontributor to the overall depression (Haynie et al.,2001), and maybe more so among older compared toyounger people (Gatz et al., 1992). The high preva-lence of lack of wellbeing may also increase thelikelihood to find genetic influence.
The present study focused on depressive symptomsin older female twins. The inclusion of only olderfemales means that care should be taken in generalizingthe findings to men and other age groups. Studyingdepressive symptoms only among older women is,however, well-grounded as depressive symptoms aremore prevalent among women than men (Piccinelli &Wilkinson, 2000; Sonnenberg et al., 2000; Takkinen etal., 2004). In the present study approximately a thirdof the sample scored 16 or more in the scale, a vali-dated cut-off for increased risk. High prevalence ofdepressive symptoms has also been reported earlieramong Finnish populations (Heikkinen et al., 1995,2002; Varjonen, et al., 1998). It is noteworthy that in
2 .300, RMSEA = 0.021, AIC = 89.72, CFI = 0.98, NNFI = 0.99 = p ,27.95 = )75(
desserpeDdoom
rotomohcysPnoitadrater
fo kcaLgnieb-llew
lanosrepretnIseitluciffid
Cc Ec
Es Cs Es As Es Cs Es
45.0)70.0(
24.0)70.0(
83.0)80.0(
43.0)80.0(
16.0)60.0(
17.0)70.0( 92.0
)60.0(
32.0)50.0(
85.0)50.0(
93.0)50.0(
14.0)80.0(
25.0)70.0(
17.0)50.0(
74.0)70.0(
77.0)40.0(
Figure 4 The path diagram of the multifactor independent pathway model with additive genetic (A), shared environmental (C), and nonsharedenvironmental (E) effects explaining the variance of the factor depressiveness and four subscales depressed mood, psychomotor retardation,lack of wellbeing and interpersonal difficulties.Standardized path coefficients (standard errors) of the model selected as best explaining the present data are presented. c = common effect,s = specific effect.
634 Twin Research December 2004
Sanna Takkinen, Asko Tolvanen, Jaakko Kaprio, Stig Berg, Markku Koskenvuo, and Taina Rantanen
the current study mean scores of negative affect wereapproximately the same in magnitude as found in pre-vious studies in other countries (Gatz et al., 1992;Haynie et al., 2001). Thus, the higher prevalence ofdepressive symptoms in Finland than other countries isprobably primarily explained by higher scores in thesubscale of the lack of wellbeing indicating lower posi-tive mood in our population.
There is a great interest in searching for genetic sus-ceptibility to mood disorders, and to find geneticmarkers for depression. The previous studies on thesources of variation in depressive symptoms measuredby CES-D among older people have usually found onlysmall or no genetic influences (Gatz et al., 1992;Jansson et al., 2004; Silberg et al., 1990). Studies thatfocused on major depression report genetic influencesup to 50% (Johansson et al., 2001; Sullivan et al.,2000). Heterogeneity in the genetic and environmentaleffects on the different dimensions of major depressionhas been reported (Kendler et al., 1994a). In thepresent study, genetic influence was found only in onesubscale, lack of wellbeing. The finding suggests thatthere may be a bigger chance to find genes for happi-ness and wellbeing than for depressed mood. It isknown that subjective wellbeing shares genes withsome personality traits (Bergeman et al., 1991; Eid etal., 2003). Moreover, animal models on the traitsrelated to depressive symptoms, such as neuroticismand anxiety, provide evidence of gene–environmentinteraction (see Bakshi & Kalin, 2000; Holmes, 2001).More research on genetic correlations may help indetecting the genetic background of wellbeing and pos-itive mood.
Are there means to enhance positive mood orreduce the lack of wellbeing? Lack of wellbeing seemsto be the biggest reason for scoring high in the depres-sion scale for older women, and besides the largeproportion of environmental effects that are unique toeach individual, there is a moderate additive geneticeffect. Lykken and Tellegen (1996) concluded afterfinding correlations suggesting a high nonadditivegenetic effect (interactions between different genes —epistasis) in subjective wellbeing that trying to behappier may be as futile as trying to be taller. Toomuch pessimism may, however, be groundless. Inseveral studies, positive affect and subjective wellbeinghave been mainly due to additive genetic effects andsupport for nonadditivity is scarce (Bergeman et al.,1991; Harris et al., 1992; Roysamb et al., 2002).Moreover, the proportion of genetic influence does notexceed half of the total variance. Many environmentalfactors unique to an individual affect wellbeing in addi-tion to genes. On the other hand, possiblegene–environment interaction enables interventionwith the effects that are due to genetic variation. Untilnow, unfortunately, very little has been known ofgene–environment interaction in positive affect.
In terms of depressed mood or negative affect, thesources lie partly in shared environment (such as early
home environment, school and peers, and shared lifeevents), the behavioral patterns that have been learnedthere and partly in the experiences unique to an indi-vidual. These environmental factors may includelearned helplessness, emotional abuse and neglectduring childhood, lack of social support and stressrelated to social relationships, and adverse life events(Blazer, 2003; Piccinelli & Wilkinson, 2000).Psychological or psychosocial approaches as well asother nonpharmacological treatment that take intoaccount environmental factors might be worth trying,especially as medical treatment has been shown to beless successful in treating milder depressive disorders(see Blazer, 2003). It is important that further researchtake into account the interaction, origin and specificcharacteristics of positive and negative mood withindepressive symptomatology.
AcknowledgmentsThe study has been funded by the Academy ofFinland and the Finnish Ministry of Education. Theauthor is a participant in the ‘Burden of Disease inOld Age (BURDIS) network’, which is a projectwithin Key Action 6 The Ageing Population andTheir Disabilities of the European Union’s Quality ofLife and Management of Living Resources programand is funded by the European Commission. Thecontent of this article does not represent the opinionof the European Community and the Community isnot responsible for any use that might be made of theinformation presented here.
ReferencesAkaike, H. (1987). Factor analysis and AIC.
Psychometrika, 52, 317–332.
Baker, L. A., Cesa, I. L., Gatz, M., & Mellins, C. (1992).Genetic and environmental influences on positive andnegative affect: Support for a two-factor theory.Psychology and Aging, 7, 158–163.
Bakshi, V. P., & Kalin, N. H. (2000). Corticotropin-releasing hormone and animal models of anxiety:Gene–environment interactions. Biological Psychiatry,48, 1175–1198.
Beekman, A. T. F., Deeg, D. J. H., van Limbeek, J.,Braam, A. W., de Vries, M. Z, & van Tilburg, W.(1997). Criterion validity of the Center forEpidemiologic Studies Depression Scale (CES-D):Results from a community-based sample of older sub-jects in the Netherlands. Psychological Medicine, 27,231–235.
Bentler, P. M., & Bonnet, D. G. (1980). Significance testand goodness of fit in the analysis of covariance struc-tures. Psychological Bulletin, 88, 588–606.
Bergeman, C. S, Plomin, R., Pedersen, N. L., &McClearn, G. E. (1991). Genetic mediation of therelationship between social support and psychologicalwellbeing. Psychology and Aging, 6, 640–646.

635Twin Research December 2004
Genetic and Environmental Effects on Depressive Symptoms
Blazer, D. G. (2003). Depression in late life: Review andcommentary. Journal of Gerontology, 58A, 249–265.
Clifford, C. A., Hopper, J. L., Fulker, D., & Murray, R. M.(1984). A genetic and environmental analysis of a twinfamily study of alcohol use, anxiety, and depression.Genetic Epidemiology, 1, 63–79.
Diener, E., Larsen, R. J., Levine, S., & Emmons, R. A.(1985). Intensity and frequency: Dimensions underlyingpositive and negative affect. Journal of Personality andSocial Psychology, 48, 1253–1265.
Eid, M., Reimann, R., Angleitner, A., & Borkenau, P.(2003). Sociability and positive emotionality: Geneticand environmental contributions to the covariationbetween different facets of extraversion. Journal ofPersonality, 71, 319–346.
Emmons, R. A., & Diener, E. (1985), Personality correlatesof subjective wellbeing. Personality and SocialPsychology Bulletin, 11, 89–97.
Foley, D. L., Neale, M. C., & Kendler, K. S. (2001). Geneticand environmental risk factors for depression assessedby subject-rated Symptom Check List versus StructuredClinical Interview. Psychological Medicine, 31,1413–1423.
Gatz, M., Johansson, B., Pedersen, N., Berg, S., &Reynolds, C. (1993). A cross-national self-reportmeasure of depressive symptomatology. InternationalPsychogeriatrics, 5, 147–156.
Gatz, M., Pedersen, N. L., Plomin, R., Nesselroade, J. R., &McClearn, G. E. (1992). Importance of shared genesand shared environments for symptoms of depression inolder adults. Journal of Abnormal Psychology, 101,701–708.
Harris, J. R., Pedersen, N. L., Stacey, C., & McClearn, G. E.(1992). Age differences in the etiology of the relation-ship between life satisfaction and self-rated health.Journal of Aging and Health, 4, 349–368.
Hayes, N., & Joseph, S. (2003). Big 5 correlates of threemeasures of subjective wellbeing. Personality andIndividual Differences, 34, 723–727.
Haynie, D. A., Berg, S., Johansson, B., Gatz, M., & Zarit, S.H. (2001). Symptoms of depression in the oldest old: Alongitudinal study. Journal of Gerontology, 56B,111–118.
Heikkinen, R.-L., Berg, S., & Avlund, K. (1995). Depressivesymptoms in late life: Results from a study in threeNordic urban localities. Journal of Cross-CulturalGerontology, 10, 315–330.
Heikkinen, R.-L., Berg, S., Avlund, K., & Törmäkangas, T.(2002). Depressed mood: Changes during a five-yearfollow-up in 75-year-old men and women in threeNordic localities. Aging Clinical and ExperimentalResearch, 14(Suppl. 3), 16–28.
Holmes, A. (2001). Targeted gene mutation approaches tothe study of anxiety-like behavior in mice. Neuroscienceand Biobehavioral Reviews, 25, 261–273.
Hu, L., & Bentler, P. M. (1995). Evaluating model fit. In R.H. Hoyle (Ed.), Structural equation modeling: Concepts,issues, and applications. Thousand Oaks, CA: Sage.
Hu, L., & Bentler, P. M. (1999). Cutoff criteria for fitindexes in covariance structure analysis: Conventionalcriteria versus new alternative. Structural EquationModeling, 6, 1–55.
Jang, K. L., Livesley, W. J., Taylor, S., Stein, M. B., &Moon, E. C. (2004). Heritability of individual depres-sive symptoms. Journal of Affective Disorders, 80,125–133.
Jansson, M., Gazt, M., Berg, S., Johansson, B., Malmberg,B., McClearn, G. E., Schalling, M., & Pedersen, N.(2004). Gender differences in heritability of depressivesymptoms in the elderly. Psychological Medicine, 34,471–479.
Jardine, R., Martin, N. G., & Henderson, A. S. (1984).Genetic covariation between neuroticism, and the symp-toms of anxiety and depression. Genetic Epidemiology,1, 89–107.
Johansson, C., Jansson, M., Linnér, L., Yuan, Q. -P.,Pedersen, N. L., Blackwood, D., Barden, N., Kelsoe, J.,& Schalling, M. (2001). Genetics of affective disorders.European Neuropharmacology, 11, 385–394.
Jöreskog, K., Sörblom, D., du Toit, S., & du Toit, M.(1999). LISREL 8: New statistical features. Chicago, IL:Scientific Software International.
Kaprio, J., & Koskenvuo, M. (2002). Genetic and environ-mental factors in complex diseases: The Older FinnishTwin Cohort. Twin Research, 5, 358–365.
Kaprio, J., Sarna, S., Koskenvuo, M., & Rantasalo, I.(1978). The Finnish Twin Registry: Formation and com-pilation, questionnaire study, zygosity determinationprocedures and research program. Prognostic Clinicaland Biological Research, 24, 179–184.
Kendler, K. S., & Gardner, C. O. (1998). Boundaries ofmajor depression: An evaluation of DSM-IV criteria.American Journal of Psychiatry, 155, 172–177.
Kendler, K. S., Neale, M. C., Kessler, R. C., Heath, A. C., &Eaves, L. J. (1994a). The clinical characteristics of majordepression as indices of the familial risk to illness.British Journal of Psychiatry, 165, 66–72.
Kendler, K. S., Walters, E. E., Truett, K. R., Heath, A. C.,Neale, M. C., Martin, N. G., & Eaves, L. J. (1994b).Sources of individual differences in depressive symp-toms: Analysis of two samples of twins and theirfamilies. American Journal of Psychiatry, 151,1605–1614.
Koivumaa-Honkanen, H., Honkanen, R., Viinamäki, H.,Heikkilä, K., Kaprio, J., & Koskenvuo, M. (2000). Self-reported life satisfaction and 20-year mortality inhealthy Finnish adults. American Journal ofEpidemiology, 152, 983–991.
Lewinsohn, P. M., Seeley, J. R., Roberts, R. E., & Allen, N.B. (1997). Center for Epidemiologic Studies DepressionScale (CES-D) as a screening instrument for depression

636 Twin Research December 2004
Sanna Takkinen, Asko Tolvanen, Jaakko Kaprio, Stig Berg, Markku Koskenvuo, and Taina Rantanen
among community-residing older adults. Psychologyand Aging, 12, 277–287.
Lewis, C. A., Dorahy, M. J., & Schumaker, J. F. (1999).Depression and life satisfaction among Northern Irishadults. Journal of Social Psychology, 139, 533–535.
Lykken, D., & Tellegen, A. (1996). Happiness is a stochas-tic phenomenon. Psychological Science, 7, 185–189.
McDowell, I., & Newell, C. (1996). Measuring health: Aguide to rating scales and questionnaires. New York:Oxford University Press.
MacKinnon, A. J., Henderson, A. S., & Andrews, G.(1990). Genetic and environmental determinants of thelability of trait neuroticism and symptoms of anxietyand depression. Psychological Medicine, 20, 581–590.
McGue, M., & Christensen, K. (1997). Genetic and envi-ronmental contributions to depression symptomatology:Evidence from Danish twins 75 years of age and older.Journal of Abnormal Psychology, 106, 436–448.
Piccinelli, M., & Wilkinson, G. (2000). Gender differencesin depression: Critical review. British Journal ofPsychiatry, 177, 486–492.
Posthuma, D., Beem, A. L., de Geua, E. J., van Baal, G. C.,von Hjelmborg, J. B., Iachine, I., & Boomsma, D. I.(2003). Theory and practice in quantitative genetics.Twin Research, 6, 361–376.
Radloff, L. S. (1977). The CES-D scale: A self-reportdepression scale for research in the general population.Applied Psychological Measurement, 1, 385–401.
Rijsdijk, F. V., & Sham, P. C. (2002). Analytic approachesto twin data using structural equation models. Briefingsin Bioinformatics, 3, 119–133.
Romanov, K., Varjonen, J., Kaprio, J., & Koskenvuo, M.(2003). Life events and depressiveness: The effects ofadjustment for psychosocial factors, somatic health andgenetic liability. Acta Psychiatrica Scandinavica, 107,25–33.
Rose, R. J., Viken, R. J., Dick, D. M., Bates, J. E.,Pulkkinen, L., & Kaprio, J. (2003). It does take avillage: Nonfamilial environments and children’s behav-iour. Psychological Science, 14, 273–277.
Roysamb, E., Harris, J., Magnus, P., Vitterso, J., & Tambs,K. (2002). Subjective wellbeing: Sex-specific effects ofgenetic and environmental factors. Personality andIndividual Differences, 32, 211–223.
Sarna, S., Kaprio, J., Sistonen, P., & Koskenvuo, M. (1978).Diagnosis of twin zygosity by mailed questionnaire.Human Heredity, 28, 241–254.
Scott, B., & Melin, L. (1998). Psychometric properties andstandardized data for questionnaires measuring negativeaffect, dispositional style and daily hassles. ScandinavianJournal of Psychology, 39, 301–307.
Silberg, J. L., Heath, A. C., Kessler, R., Neale, M. C.,Meyer, J. M., Eaves, L. J., & Kendler, K. S. (1990).Genetic and environmental effects on self-reporteddepressive symptoms in a general population twinsample. Journal of Psychiatric Research, 24, 197–212.
Sonnenberg, C. M., Beekman, A. T. F., Deeg, D. J. H., &van Tilburg, W. (2000). Sex differences in late-lifedepression. Acta Psychiatrica Scandinavica, 101,286–292.
Stallings, M. C., Dunham, C. C., Gatz, M., Baker, L., &Bengtson, V. L. (1997). Relationship among life eventsand psychological wellbeing: More evidence for a two-factor theory of wellbeing. The Journal of AppliedGerontology, 16, 104–119.
Steiger, J. H. (1990). Structural model evaluation and modi-fication: An interval estimation approach. MultivariateBehavioral Research, 25, 173–180.
Sullivan, P. F., Neale, M. C., & Kendler, K. S. (2000).Genetic epidemiology of major depression: A reviewand meta-analysis. American Journal of Psychiatry, 157,1552–1562.
Takkinen, S., Gold, C., Pedersen, N. L., Malmberg, B.,Nilsson, S., & Rovine, M. (2004). Gender differences indepression: A study of older unlike-sex twins. Journal ofAging and Mental Health, 8, 187–195.
van der Berg, M. D., Oldehinkel, A. J., Brilman, E. I.,Bouhuys, A. L., & Ormel, J. (1999). Correlates ofsymptomatic, minor and major depression in the elderly.Journal of Affective Disorders, 60, 87–95.
van der Berg, M. D., Oldehinkel, A. J., Bouhuys, A. I.,Brilman, E. I., Beekman, A. T. F., & Ormel, J. (2001).Depression in later life: Three etiologically different sub-groups. Journal of Affective Disorders, 65, 19–26.
Varjonen, J., Romanov, K., Kaprio, J., Heikkilä, M., &Koskenvuo, M. (1998). Self-rated depression in 12,063middle aged adults. Nordic Journal of Psychiatry, 51,331–338.
Watson, D. (1988). Intraindividual and interindividualanalysis of positive and negative affect: Their relation tohealth complaints, perceived stress and daily activities.Journal of Personality and Social Psychology, 54,1021–1030.
Zich, J. M., Attkinsson, C. C., & Greenfield, T. K. (1990).Screening for depression in primary care clinics: TheCES-D and the BDI. International Journal of Psychiatryand Medicine, 20, 259–277.
Zonderman, A. B., Herbst, J. H., Schmidt, C., & Costa, P.T. (1993). Depressive symptoms as a nonspecific, gradedrisk for psychiatric diagnoses. Journal of AbnormalPsychology, 102, 544–552.
Copyright © 2022 FDOKUMEN