Prevalence and risk of depressive symptoms 3–4 months post ...
18
HAL Id: hal-00478309 https://hal.archives-ouvertes.fr/hal-00478309 Submitted on 30 Apr 2010 HAL is a multi-disciplinary open access archive for the deposit and dissemination of sci- entific research documents, whether they are pub- lished or not. The documents may come from teaching and research institutions in France or abroad, or from public or private research centers. L’archive ouverte pluridisciplinaire HAL, est destinée au dépôt et à la diffusion de documents scientifiques de niveau recherche, publiés ou non, émanant des établissements d’enseignement et de recherche français ou étrangers, des laboratoires publics ou privés. Prevalence and risk of depressive symptoms 3–4 months post-surgery in a nationwide cohort study of Danish women treated for early stage breast-cancer Søren Christensen, Robert Zachariae, Anders Bonde Jensen, Michael Væth, Susanne Møller, Joan Ravnsbæk, Hans Maase To cite this version: Søren Christensen, Robert Zachariae, Anders Bonde Jensen, Michael Væth, Susanne Møller, et al.. Prevalence and risk of depressive symptoms 3–4 months post-surgery in a nationwide cohort study of Danish women treated for early stage breast-cancer. Breast Cancer Research and Treatment, Springer Verlag, 2008, 113 (2), pp.339-355. 10.1007/s10549-008-9920-9. hal-00478309
-
Upload
khangminh22 -
Category
Documents
-
view
1 -
download
0
Transcript of Prevalence and risk of depressive symptoms 3–4 months post ...
HAL Id: hal-00478309https://hal.archives-ouvertes.fr/hal-00478309
Submitted on 30 Apr 2010
HAL is a multi-disciplinary open accessarchive for the deposit and dissemination of sci-entific research documents, whether they are pub-lished or not. The documents may come fromteaching and research institutions in France orabroad, or from public or private research centers.
L’archive ouverte pluridisciplinaire HAL, estdestinée au dépôt et à la diffusion de documentsscientifiques de niveau recherche, publiés ou non,émanant des établissements d’enseignement et derecherche français ou étrangers, des laboratoirespublics ou privés.
Prevalence and risk of depressive symptoms 3–4 monthspost-surgery in a nationwide cohort study of Danish
women treated for early stage breast-cancerSøren Christensen, Robert Zachariae, Anders Bonde Jensen, Michael Væth,
Susanne Møller, Joan Ravnsbæk, Hans Maase
To cite this version:Søren Christensen, Robert Zachariae, Anders Bonde Jensen, Michael Væth, Susanne Møller, et al..Prevalence and risk of depressive symptoms 3–4 months post-surgery in a nationwide cohort study ofDanish women treated for early stage breast-cancer. Breast Cancer Research and Treatment, SpringerVerlag, 2008, 113 (2), pp.339-355. �10.1007/s10549-008-9920-9�. �hal-00478309�
EPIDEMIOLOGY
Prevalence and risk of depressive symptoms 3–4 months post-surgery in a nationwide cohort study of Danish women treated forearly stage breast-cancer
Søren Christensen Æ Robert Zachariae Æ Anders Bonde Jensen ÆMichael Væth Æ Susanne Møller Æ Joan Ravnsbæk Æ Hans von der Maase
Received: 24 January 2008 / Accepted: 28 January 2008 / Published online: 16 February 2008
� Springer Science+Business Media, LLC. 2008
Abstract Background Elevated levels of depressive symp-
toms are generally found among cancer patients, but results
from existing studies vary considerably with respect to prev-
alence and proposed risk factors. Purpose To study the
prevalence of depressive symptoms and major depression 3–4
months following surgery for breast cancer, and to identify
clinical risk factors while adjusting for pre-cancer sociode-
mographic factors, comorbidity, and psychiatric history.
Patients and methods The study cohort consists of 4917 Danish
women, aged 18–70 years, receiving standardized treatment
for early stage invasive breast cancer during the 2 1/2 year
study period. Of these, 3343 women (68%) participated in a
questionnaire study 12–16 weeks following surgery. Depres-
sive symptoms (Beck’s Depression Inventory II) and health-
related behaviors were assessed by questionnaire. The Danish
Breast Cancer Cooperative Group (DBCG) and the surgical
departments provided disease-, treatment-, and comorbidity
data for the study cohort. Information concerning sociode-
mographics and psychiatric history were obtained from
national longitudinal registries. Results The results indicated
an increased prevalence of depressive symptoms and major
depression (13.7%) compared to population-based samples.
The pre-cancer variables: Social status, net-wealth, ethnicity,
comorbidity, psychiatric history, and age were all independent
risk factors for depressive symptoms. Of the clinical variables,
only nodal status carried additional prognostic information.
Physical functioning, smoking, alcohol use, and BMI were
also independently associated with depressive symptoms.
Conclusion Risk factors for depressive symptoms were
primarily restricted to pre-cancer conditions rather than dis-
ease-specific conditions. Special attention should be given
to socio-economically deprived women with a history of
somatic- and psychiatric disease and poor health behaviors.
Keywords Age � Alcohol consumption �Body-mass index � Breast-cancer �Breast neoplasms psychology � Chemotherapy �Cohort studies � Comorbidity � Depression � Epidemiology �Health behavior � Major mastectomy �Neoplasms psychology � Physical function � Prevalence �Prospective studies � Psychiatry � Psychosocial �Radiotherapy � Risk-factors � Smoking �Socioeconomic factors � Stage
Introduction
While depressive disorders are generally believed to be
more prevalent in breast cancer patients than in the general
S. Christensen (&) � R. Zachariae
Psychooncology Reseach Unit, Aarhus University Hospital,
Nobelparken, Bygn. 1483, 8000 Aarhus C, Denmark
e-mail: [email protected]
A. B. Jensen
Department of Oncology, Aarhus University Hospital,
Aarhus, Denmark
M. Væth
Department of Biostatistics, Aarhus University,
Aarhus, Denmark
S. Møller
Danish Breast Cancer Cooperative Group (DBCG),
Rigshospitalet, Copenhagen University Hospital,
Copenhagen, Denmark
J. Ravnsbæk
Aarhus Breast Care Clinic, Aarhus, Denmark
H. von der Maase
Department of Oncology, Rigshospitalet, Copenhagen
University Hospital, Copenhagen, Denmark
123
Breast Cancer Res Treat (2009) 113:339–355
DOI 10.1007/s10549-008-9920-9
population, the literature indicates considerable variability
[1], with rates from 0–2% [2, 3] up to 55% [4]. Previous
studies have generally used relatively small samples of
convenience with varying demographic characteristics. The
variability of the results could also stem from methodo-
logical differences between studies, including the criteria
used to define depression, the timing of assessment, disease
stage, and treatment status of the women.
Older age is generally associated with reduced emo-
tional expressivity [5, 6], and older women with breast
cancer experience report fewer depressive symptoms [7].
Other age-related differences in health status, treatment,
and social support may also play a role together with socio-
demographic factors such as marital status [8, 9], number
of children [10], and socio-economic status [11].
Several studies have used structured psychiatric inter-
views to assess depression according to diagnostic criteria,
primarily as defined in DSM-III [12] or DSM-IV [13],
while others have measured depressive symptoms using
rating scales such as the Center for Epidemiological
Studies Depression Scale (CES-D) [14], the Hospital
Anxiety and Depression Scale (HADS) [15], or the Beck
Depression Inventory (BDI), [16, 17]. These instruments
generally compare well [18, 19] and seem suitable for
assessing depression in cancer patients [19, 20]. The
HADS, however, may be less suitable than other measures
[21–24].
There is considerable variation in the timing of assess-
ment both between- and within studies, with recently
diagnosed patients being assessed over time-spans of sev-
eral months [25, 26], and disease-free breast cancer
survivors being assessed from a few months to 18 years
after diagnosis [2, 27–29]. The available data indicate that
cancer-related distress generally diminishes with time after
diagnosis [10, 30–32], increasing again after a possible
recurrence [33, 34].
There are also considerable within- and between study
differences with respect to the disease and treatment
characteristics. Some studies only include patients with
early stages of breast cancer [35, 36], while others have
investigated more advanced breast cancer [11, 23, 37].
Stage of disease and tumor grade have been reported
inconsistently related to psychological problems in cancer
and is generally uncorrelated with depression in breast-
cancer [38–41]. While breast conserving surgery has been
found associated with better body image [42] and lower
prevalence of depression [27], there is no clear indication
that depression is associated with type of surgery [32, 43, 44].
Radiotherapy [45] and tamoxifen [46, 47] has previously
been linked to depression in breast-cancer, but more recent
studies have not confirmed these findings [41, 48–50]. There
are conflicting results concerning the possible role of che-
motherapy [48, 50] and estrogen receptor status [39, 50, 51].
More consistent associations have been found with physi-
cal function [41, 52, 53] and overweight [54], whereas the
role of poor health behaviors are less frequently investi-
gated [41].
In an ageing population the prevalence of coexisting
medical diseases in addition to cancer becomes increas-
ingly important [55, 56]. Depression is common not only
among cancer patients but also in other medical illnesses
such as diabetes and cardiovascular diseases [57, 58], these
being the most common coexisting illnesses in cancer
patients [59]. Comorbidity may thus confound possible
associations between depression and factors such as treat-
ment or age.
Finally, the generalizability of results may suffer from
unknown differences between participants and non-partic-
ipants, introducing potential confounding by factors such
as socio-economic status, comorbidity and psychiatric
history. However, in the available studies, these factors are
rarely explored.
Aim of the study
While the literature suggests that women treated for breast
cancer may be at increased risk of depression, there is
considerable variability in the results and proposed risk
factors, which may stem from methodological between-
study differences, and studies using large population-based
samples are needed. In the present study, we present data,
collected at baseline, from a large prospective nation-wide
cohort study of Danish women recently treated for early
stage breast cancer, with the aim of assessing the preva-
lence of depressive symptoms and investigating the role of
potential risk factors, including disease- and treatment-
related factors, demographic- and socio-economic factors,
psychiatric history, and medical comorbidity.
Methods
Study design
The present study is designed as a nationwide prospective
cohort study and consists of 4917 women surgically treated
for early stage invasive breast cancer in Denmark between
October 2001 and March 2004. The study is conducted in
collaboration with The Danish Breast Cancer Cooperative
Group (DBCG) and the 24 largest surgical departments
responsible for treating breast cancer in Denmark during
the inclusion period. Data concerning eligibility, comor-
bidity, histopathology, and treatment-related variables
were obtained from the DBCG registry as well as from the
surgical departments. Demographics, psychiatric history
and socio-economic variables were obtained from the
340 Breast Cancer Res Treat (2009) 113:339–355
123
unique Danish longitudinal registries. At baseline, 12–
16 weeks post-surgery, 3343 (68.0%) women from the
cohort also provided extensive information regarding
health behaviors, health status, and psychosocial variables
through a mail-out questionnaire.
Eligibility
Eligible patients were aged 18–70 years, Danish residents
with histologically confirmed stage I or II breast cancer T1-3,
N0-3, and M0 according to the TNM classification [60] and
no history of other cancers except non-melanoma skin
cancer or carcinoma in situ of the cervix uteri. The ability
to read Danish, being physically/mentally capable of
completing a questionnaire, and allocation to one of the
five existing standard DBCG treatment protocols was also
required. The protocols were: (A) No adjuvant therapy; (B)
Seven courses of chemotherapy (CEF) followed by endo-
crine treatment for 5 years; (C) Endocrine treatment for
5 years, and (D or E) Seven courses of chemotherapy with
CEF or CMF. Women treated with lumpectomy, or who
had tumor positive lymph nodes in the axillae and/or non-
radical surgery and/or tumors with a diameter [50mm
were also allocated to radiotherapy.
Procedure
Eligible women were informed orally and in writing about
the study at the surgical departments. The Charlson
Comorbidity Index [61] was completed by a physician
together with a form indicating the date of surgery, each
patient’s unique personal identification number (CPR-
number), and information regarding eligibility for each
woman. Data were sent to the Study Secretariat at the
Psychooncology Research Unit at Aarhus University Hos-
pital on a monthly basis. Addresses of eligible women were
obtained from the DBCG registry on a monthly basis
during the study period, or directly from The Danish Civil
Registration System (DCRS), using the CPR-numbers on
the Charlson forms. Eligible women were mailed an
informed consent form, additional information, a ques-
tionnaire package, and a prepaid return envelope, and
invited to participate in the study 12–16 weeks after sur-
gery. A hotline telephone and e-mail service was offered to
answer questions regarding the study and the questionnaire.
If the questionnaires and the written consent form were not
returned within 3 weeks, a single reminder was sent. The
questionnaires were designed, processed and verified using
optical scanning and software (Teleform 7.1; Cardiff).
Approval of the study was obtained from The Regional
Science-Ethical Committees and The Danish Data Protec-
tion Agency.
Subjects
DBCG and/or the collaborating surgical departments ini-
tially identified a total of 5441 women as being potentially
eligible for the study. Of these, 237 women (4.4%)
received treatment at one of the 11 minor surgical
departments not participating in the study and were hence
excluded. Information from the surgical departments
showed that 68 women had a previous cancer disease
unknown to the DBCG at the time and that an additional 24
women did not receive standard treatment (typically neo-
adjuvant chemotherapy). Furthermore, 99 women were
considered unable to read Danish sufficiently well by the
surgical departments or as being physically/mentally
incapable to fill in a questionnaire. Three women had
distant metastases diagnosed within 12 weeks post-surgery,
and two women who had left the country within the same
time period were also excluded. One woman was reported
by her relatives to be hospitalized due to psychiatric illness,
and one woman was shown to have had surgery prior to the
study period.
In all, 5,006 women were thus eligible for the study.
Subsequently seven women who had chosen to block sci-
entific access to their addresses through their CPR-number,
and two women who withdrew their consent were deleted
from the database. Finally, 80 women were excluded in
order to minimize zero-time bias, because their data and
addresses were not available within 28 weeks post-surgery.
A total of 4,917 women thus constituted the study
cohort. Of these, 3343 women (68.0%) returned a valid
questionnaire. The majority of the questionnaires (91%)
were mailed out 12–16 weeks after primary surgery. The
remaining questionnaires were mailed out during the
following three months.
Measures
Depressive symptoms
The 21-item Beck Depression Inventory – Second Edition
(BDI-II) is a widely used questionnaire developed for the
assessment of symptoms corresponding to criteria for
diagnosing depressive disorder listed in The American
Psychiatric Associations Diagnostic and Statistical Manual
of Mental Disorders – Fourth Edition (DSM-IV). Accord-
ing to the manual, a cut score of 17 has yielded a 93% true-
positive rate and 18% false-positive rate for the presence of
major depression [17]. Its two factor-analytically derived
subscales measuring somatic- and cognitive/affective
depressive symptoms respectively, makes it particularly
useful in medical ill populations in terms of identifying the
potentially disease-, and treatment-related symptoms of
depression. Internal consistency (Chronbach’s Alpha) was
Breast Cancer Res Treat (2009) 113:339–355 341
123
satisfactory (Total: 0.90; Somatic symptoms: 0.75; Cog-
nitive/Affective symptoms: 0.89).
Physical function (PF)
The SF-36 PF 10 item subscale was used to measure physical
functioning. The SF-36 is a widely used measure of health
related quality of life and PF measures limitations chiefly in
basic daily physical activities such as lifting or carrying
groceries, climbing stairs etc. There are three response
types: ‘‘Yes limited a lot’’ (=1), ‘‘Yes limited a little’’ (=2)
and, ‘‘No not limited at all’’ (=3). Individual scores were
calculated as outlined in the manual: 100 9 ((Sum score –
lowest possible score (i.e. 10)) / (Highest possible raw score
(i.e. 30) – lowest possible score (i.e. 10))). This transfor-
mation yields a score range from 0 (lowest PF) to 100 (best
PF) [62, 63]. Internal consistency was satisfactory (Chron-
bach’s alpha = 0.86).
Health behaviors and BMI
Data on health behaviors and BMI were obtained by
questionnaire. BMI was calculated as: current weight (Kg)/
Height (m2) and categorized according to WHO guidelines
[64]: Underweight (BMI B 18.5); Normal weight ([18.5
and\25); Overweight (C25 and\30); Obese and severely
obese (C30) were collapsed due to few observations (\3%)
among severely obese. Alcohol intake was measured as
total self-reported consumption during the past seven days
and is presented in units per day (beers, glasses of wine or
drinks). Ex-drinkers were defined as previous users who
had stopped drinking. Never smokers and ex-smokers were
categorized separately.
Comorbidity
The Charlson Comorbidity Index (CCI) [61] is a widely
used measure of nineteen comorbid conditions that can
alter the risk of mortality in longitudinal studies. CCI has
been validated among breast cancer patients and the
weighted index score takes into account the number and the
seriousness of comorbid disease [55, 65]. Cancer specific
conditions are not included in the present study since
patients with previous malign cancers or metastatic tumors
were not eligible. Missing data identified through a linkage
with the DBCG registry were requested from the depart-
ments every third month.
Clinical variables and treatment
Data on histopathology and treatment-related variables
from all eligible patients were obtained through a linkage
with the DBCG registry. DBCG was established in 1976
with the aim of ensuring optimal diagnostics and treatment
of operable primary breast cancer on a nation-wide basis.
DBCG has worked out uniform national guidelines and the
participants include all departments of surgery, pathology,
radiotherapy, and oncology involved in the treatment of
breast cancer in Denmark. The departments provide data to
the DBCG on a regularly basis. A previous study [66] has
shown that only 3% of all eligible patients fulfilling the
criteria’s of enrollment in a DBCG protocol between 1978
and 1994 where missing when validating the DBCG reg-
istry against The Danish Cancer Registry. Less than one
percent was registered by the DBCG but missing in the
Danish Cancer Registry. It was also shown that the com-
pleteness of the DBCG registry was improving through the
study period. The data provided by the DBCG in the
present study can therefore be considered as nearly
complete.
Sociodemographics
Since 1968, all Danish residents have been assigned a 10-
digit personal identification number (CPR-number) by the
DCRS, which is used across all public registration systems,
making linkages with a large number of registry-based data
sources possible. Data were collected through a linkage
with six of the nationwide Danish longitudinal registers
available for researchers. All registries are administered by
the central government agency of statistics in Denmark
(Statistics Denmark) [67] except the Danish Psychiatric
Central Research Registry, which is administered by the
Department of Psychiatric Demography at Aarhus Univer-
sity Hospital. The linkage of all registries was serviced by
Statistics Denmark. Age at the time of surgery was calcu-
lated on the basis of the CPR-number and time of surgery.
All sociodemographic variables refer to pre-cancer condi-
tions either in the year prior to the date of surgery minus one
month or, when appropriate, at the date of surgery minus
one month. The following registries were used:
The Registry of Income Statistics: (Personal income, net-
wealth). The registry is based on the information that banks,
employers and others who pay out wages and salaries,
remunerations, pensions etc. are required to report to the tax
authority. Income was adjusted for the yearly wage-
increases for women in Denmark by a weighted average of
the three indices of the average earnings in the private-, and
public sector (local- and central government) published by
Statistics Denmark. The weights were calculated on the
basis of the occupational distribution in the 2002 indices for
women, also published by Statistics Denmark. Due to the
significant fluctuations on the financial markets in the study
period and a low Danish core inflation rate in the study
period net-wealth was left unadjusted. A mean household
net-wealth variable (excluding principal shareholder positions
342 Breast Cancer Res Treat (2009) 113:339–355
123
and value of privately held enterprises) was calculated
by using the mean total net-wealth for cohabiting couples.
The amounts in Danish kroner (Kr.) were subsequently
converted into US dollars ($) on the basis of the exchange
rates published by Danmarks Nationalbank (Basis: 12/31
2003).
The Registry-based labor-force statistics (RAS): (Social
status). RAS Statistics provides a description of the Danish
populations attachment to the labor market and follows the
guidelines set by the International Labour Organisation
(ILO). RAS Employee skill level acquired through edu-
cation or learning in praxis is defined on the basis of the
Danish version of the European Unions official nomen-
clature for occupations, ISCO-88 (International Standard
Classification of Occupations).
The Registry for Education of the Population (BUE):
(Level of Education). Level of education was coded
according to UNESCO’s International Standard Classifi-
cation of Education (ISCED-97) nomenclature [68].
Because a significant proportion of the women had 7 years
of education, the Lower secondary general category was
divided into two categories: 7 years (mandatory for the
elderly in the cohort) and 8–10 years. At the tertiary level,
data are categorized as pre-, and post master degree. The
approximate corresponding years of schooling are indi-
cated in the tables.
Integrated Database for Labor Market Research (IDA):
(Marital status, ethnicity and urbanicity). The group of
immigrants/descendants is defined by Statistics Denmark
as persons for whom neither of their parents are Danish
citizens born in Denmark. Women were defined as
cohabiting when registered at the same address as one non-
related male adult and no other adults. Married, but not
cohabiting women were categorized as separated. The
urbanicity variable was categorized on the basis of
municipality sizes in the year 2002.
The Fertility Database: (Number of children). The
database includes information on date of birth and death of
children of Danish residents. We calculated the number of
children alive at the time of surgery.
The Danish Psychiatric Central Research Registry
(DPCR). DPCR is a nationwide administrative registry to
which psychiatric inpatients treated in Denmark has been
reported since 1969. Since 1995, outpatients have been
registered as well [69]. In the present study, psychiatric
history was coded as positive in case of psychiatric hos-
pitalization for any reason until one month pre-surgery.
From 1995, outpatient history was also coded as positive.
Missing values
Participants were specifically instructed to check for
missing answers before returning the questionnaire. The
following procedure was applied: Subscale totals with
more than 50% missing values were coded as missing and
no total score was calculated. Missing values on subscales
with an alpha [ 0.7 were substituted with the mean of the
remaining filled items on the subscale. This procedure is
identical to the procedure described in the manual of SF-36
and is regarded as adequate and preferable to procedures
such as list-wise deleting or scale mean-substitution of
scale-scores when one or more values are missing [62, 70].
Statistical analysis
Response rates were computed in categories of each vari-
able and the unadjusted association with non-response was
assessed by Chi2-test. Subsequently the associations were
evaluated simultaneously by a logistic regression analysis
with response to the questionnaire (yes or no) as the
dependent variable. The results of the logistic regression
were presented as adjusted odds ratios (OR).
For each variable an unadjusted comparison of BDI
scores across categories was carried out by a Kruskal-
Wallis test. Next, a negative binomial regression model
was used to evaluate the association of each variable with
total BDI score adjusted for the influence of other vari-
ables. Results of these analyses were presented as a Ratios
of Means (RM), which gives the expected BDI score in a
category relative to the expected BDI score in the reference
category.
The independent variables considered in the regression
models referred to three phases of the woman’s cancer
history: Pre-cancer, peri-surgery and post-surgery, and data
were analyzed accordingly. Demographics and health sta-
tus data were analyzed in the first step, since these data
refer to pre-cancer conditions and therefore are unbiased by
the cancer experience. Information and experiences related
to the disease and its treatment had been known to the
women for more than 2 months, when the questionnaire
was completed. Clinical variables were therefore analyzed
in the second step. Post-cancer health behaviors and other
health-related variables might be moderated by the cancer
diagnosis and treatment, and were therefore analyzed in the
third step. At each step, we report the unadjusted stratified
mean values and the prevalence of major depression as
percentages. At step 2 and 3, we also report RM adjusted
for all variables included at the previous steps in the
analysis as well as age-adjusted RM. Finally, we consid-
ered a total risk-model for the prevalence of depressive
symptoms 3–4 month post-surgery using backward nega-
tive binomial regression analysis. Supplementary analyses
of the somatic and the cognitive/affective subscales of BDI
were also performed. In order to validate and elaborate our
findings, we also applied logistic regression analysis to
calculate the odds ratios for major depression for the
Breast Cancer Res Treat (2009) 113:339–355 343
123
identified risk factors. Age was treated as a continuous
variable in all multivariate analyses.
The nbreg procedure in STATA 9.2 for UNIX was used
for the negative binomial regression analyses; all other
analyses were conducted with SPSS 14.0.1 for Windows
2000.
Results
Non-responders
Data on psychiatric history, co-morbidity, socio-demo-
graphics, and histopathology and treatment for each
variable were obtained for at least 98.5% of all eligible
women, allowing a nearly complete comparison of ques-
tionnaire responders with non-responders (Table 1). When
adjusting for age, neither histopathology nor treatment-
related variables were significantly related to response rate
(all P-values [.21). Also, there were no differences in
participation related to DBCG’s five standard treatment
protocols (P = .38, data not shown). In contrast, psychiatric
history, comorbidity and all the sociodemographic vari-
ables, except having children (P = .06), were found to be
significantly associated to response rate when controlling
for age (Table 1). Responders were generally younger,
better educated, had higher incomes, higher mean net-
wealth, higher social status (employed in jobs requiring
medium to high skill levels, excluding self-employed or
assisting spouses), and were more likely to be married or
cohabiting. Lower participation was found for women
having a psychiatric history, serious comorbid disease, for
immigrants/descendants, and residents of the center of
Copenhagen.
Depression
Total BDI-II scores could be calculated for all but 22 women
(n = 3321) and only 46 respondents had more than one
missing item on the BDI. Median age was 55.7 years (range:
26–70 years) and mean BDI Total score was 8.85 (SD =
7.44). Mean scores on the somatic-, and cognitive/affective
subscales were 3.59 (SD = 2.38) and 4.48 (SD = 5.25)
respectively. In all, 13.7% had a BDI score above or equal to
17 and could thus be classified as suffering from major
depression. BDI scores of responders who returned the
reminder questionnaire (n = 444) did not differ signifi-
cantly from scores of the remaining responders (P = .26).
Time from surgery to the first questionnaire was mailed out
was not associated to the BDI score (Rho = -.008;
P = .64). For major depression, the overall proportion of
users of prescribed anti-depressive medications or anxioly-
tica for more than 3 days the previous month was 35%.
When adding women who had consulted a psychiatrist or
psychologist more than once since diagnosis, the percentage
was 51% (data not shown).
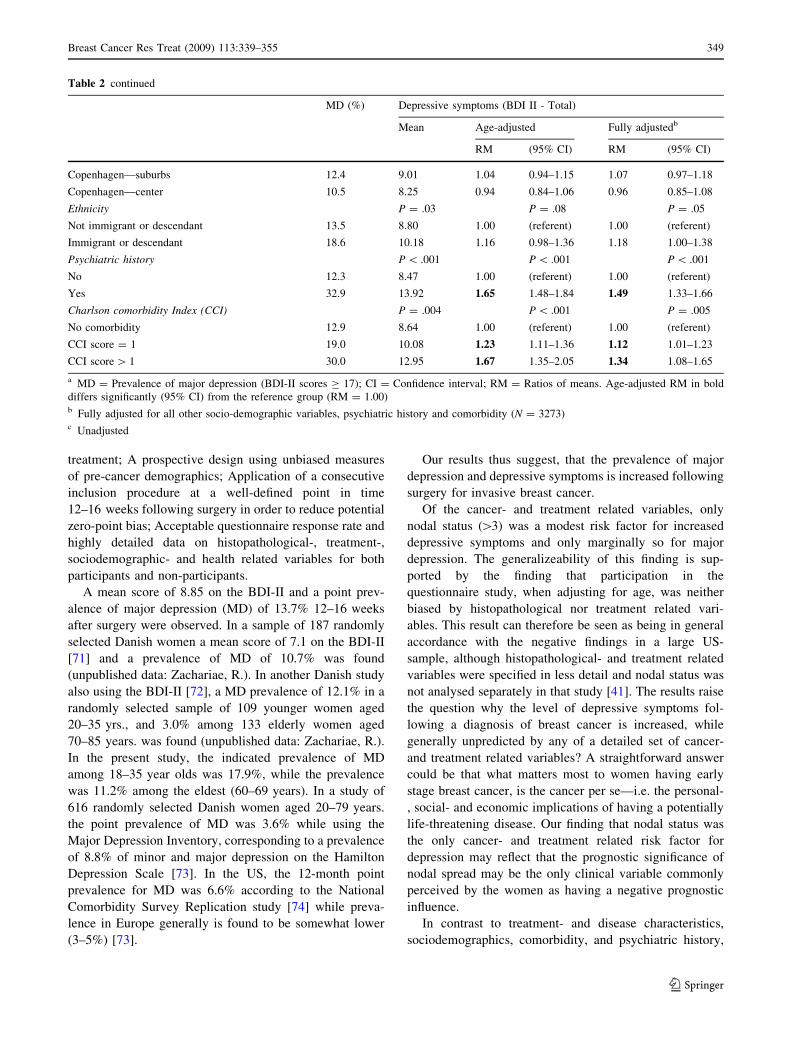
Sociodemographic- and health-related risk factors
for depressive symptoms
A significant negative correlation was found between age
and BDI total scores (Rho = - .17; P \ .001), with fewer
depressive symptoms found among the 50–69 year old
women compared to the 18–35 year old women. Nearly a
third of the patients with a psychiatric history (33%) or
with a score above one point on the Charlson Comorbidity
Index (30%) were classified as suffering from major
depression. In the age-adjusted analyses, risk factors for
depressive symptoms were: Younger age, low income
(B20.000$), negative net-wealth, low social status (being
outside the workforce, i.e. old age pensioners, unemployed
etc. and recipients of early retirement pension etc.), less
education, being divorced/separated, and having a history
of somatic- or psychiatric disease (Table 2). When entering
all the sociodemographic variables into a regression anal-
ysis with additional adjustment for psychiatric history and
comorbidity, the independent pre-cancer risk factors for
depressive symptoms were: Younger age, psychiatric his-
tory, comorbidity, being a recipient of early retirement
pension, rehabilitation- or sickness benefits, and having a
negative mean household net-wealth. In addition, an
increased prevalence of depressive symptoms among
immigrants and descendants was observed (P = .05)
(Table 2).
Clinical risk factors for depressive symptoms
In the unadjusted analyses, higher levels of depressive
symptoms were predicted by axillary lymph node
involvement, pre-menopausal status, and treatment with
chemotherapy (Table 3). After adjustment for age, only
axillary lymph node involvement ([3) was a risk factor
(RM = 1.11, 95% CI = 1.03–1.20). The age-adjusted
analyses revealed no further influence of disease- and
treatment-related factors (all P [ .11), including the five
standard DBCG treatment protocols (P = .10, data not
shown). Additional adjustment for sociodemographics-,
psychiatric history and comorbidity resulted only in minor
and insignificant changes (Table 3).
Analyses of the subscale scores on the BDI while
adjusting for age, pre-cancer health status, and sociode-
mographic variables revealed that the observed effects for
both lymph node involvement was driven by an association
with the somatic subscale of the BDI (P \ .001), while
there were no associations with scores on the cognitive/
affective subscale (P = .38).
344 Breast Cancer Res Treat (2009) 113:339–355
123
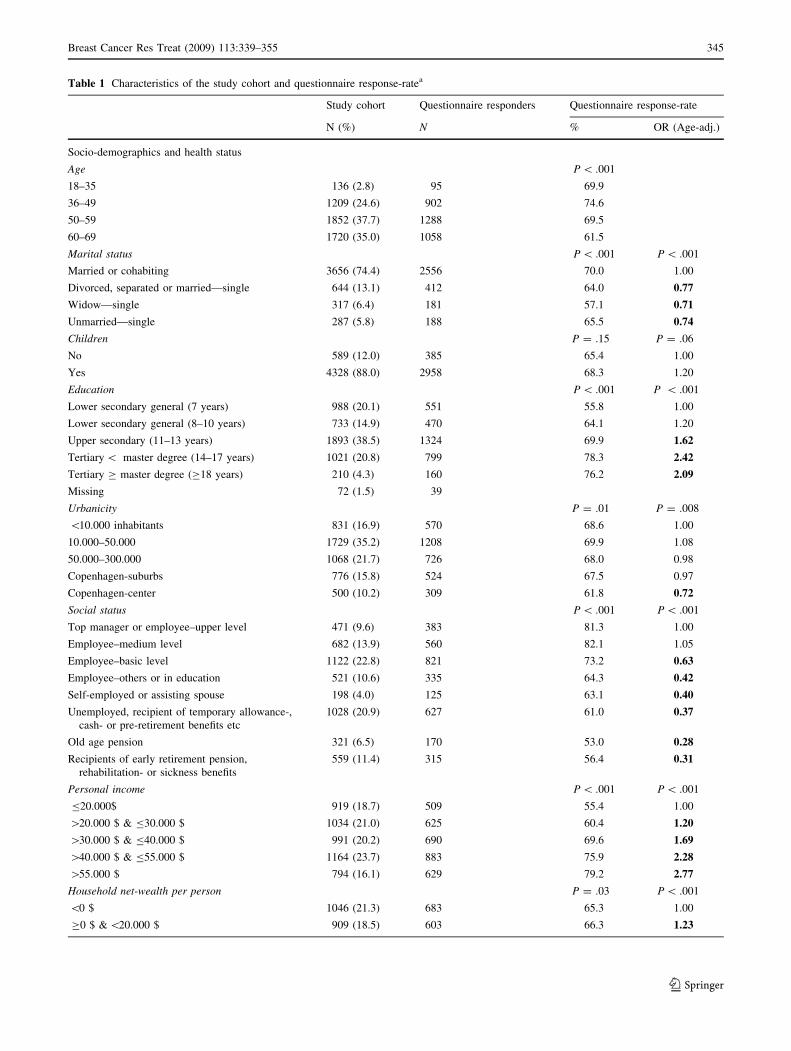
Table 1 Characteristics of the study cohort and questionnaire response-ratea
Study cohort Questionnaire responders Questionnaire response-rate
N (%) N % OR (Age-adj.)
Socio-demographics and health status
Age P \ .001
18–35 136 (2.8) 95 69.9
36–49 1209 (24.6) 902 74.6
50–59 1852 (37.7) 1288 69.5
60–69 1720 (35.0) 1058 61.5
Marital status P \ .001 P \ .001
Married or cohabiting 3656 (74.4) 2556 70.0 1.00
Divorced, separated or married—single 644 (13.1) 412 64.0 0.77
Widow—single 317 (6.4) 181 57.1 0.71
Unmarried—single 287 (5.8) 188 65.5 0.74
Children P = .15 P = .06
No 589 (12.0) 385 65.4 1.00
Yes 4328 (88.0) 2958 68.3 1.20
Education P \ .001 P \ .001
Lower secondary general (7 years) 988 (20.1) 551 55.8 1.00
Lower secondary general (8–10 years) 733 (14.9) 470 64.1 1.20
Upper secondary (11–13 years) 1893 (38.5) 1324 69.9 1.62
Tertiary \ master degree (14–17 years) 1021 (20.8) 799 78.3 2.42
Tertiary C master degree (C18 years) 210 (4.3) 160 76.2 2.09
Missing 72 (1.5) 39
Urbanicity P = .01 P = .008
\10.000 inhabitants 831 (16.9) 570 68.6 1.00
10.000–50.000 1729 (35.2) 1208 69.9 1.08
50.000–300.000 1068 (21.7) 726 68.0 0.98
Copenhagen-suburbs 776 (15.8) 524 67.5 0.97
Copenhagen-center 500 (10.2) 309 61.8 0.72
Social status P \ .001 P \ .001
Top manager or employee–upper level 471 (9.6) 383 81.3 1.00
Employee–medium level 682 (13.9) 560 82.1 1.05
Employee–basic level 1122 (22.8) 821 73.2 0.63
Employee–others or in education 521 (10.6) 335 64.3 0.42
Self-employed or assisting spouse 198 (4.0) 125 63.1 0.40
Unemployed, recipient of temporary allowance-,
cash- or pre-retirement benefits etc
1028 (20.9) 627 61.0 0.37
Old age pension 321 (6.5) 170 53.0 0.28
Recipients of early retirement pension,
rehabilitation- or sickness benefits
559 (11.4) 315 56.4 0.31
Personal income P \ .001 P \ .001
B20.000$ 919 (18.7) 509 55.4 1.00
[20.000 $ & B30.000 $ 1034 (21.0) 625 60.4 1.20
[30.000 $ & B40.000 $ 991 (20.2) 690 69.6 1.69
[40.000 $ & B55.000 $ 1164 (23.7) 883 75.9 2.28
[55.000 $ 794 (16.1) 629 79.2 2.77
Household net-wealth per person P = .03 P \ .001
\0 $ 1046 (21.3) 683 65.3 1.00
C0 $ & \20.000 $ 909 (18.5) 603 66.3 1.23
Breast Cancer Res Treat (2009) 113:339–355 345
123
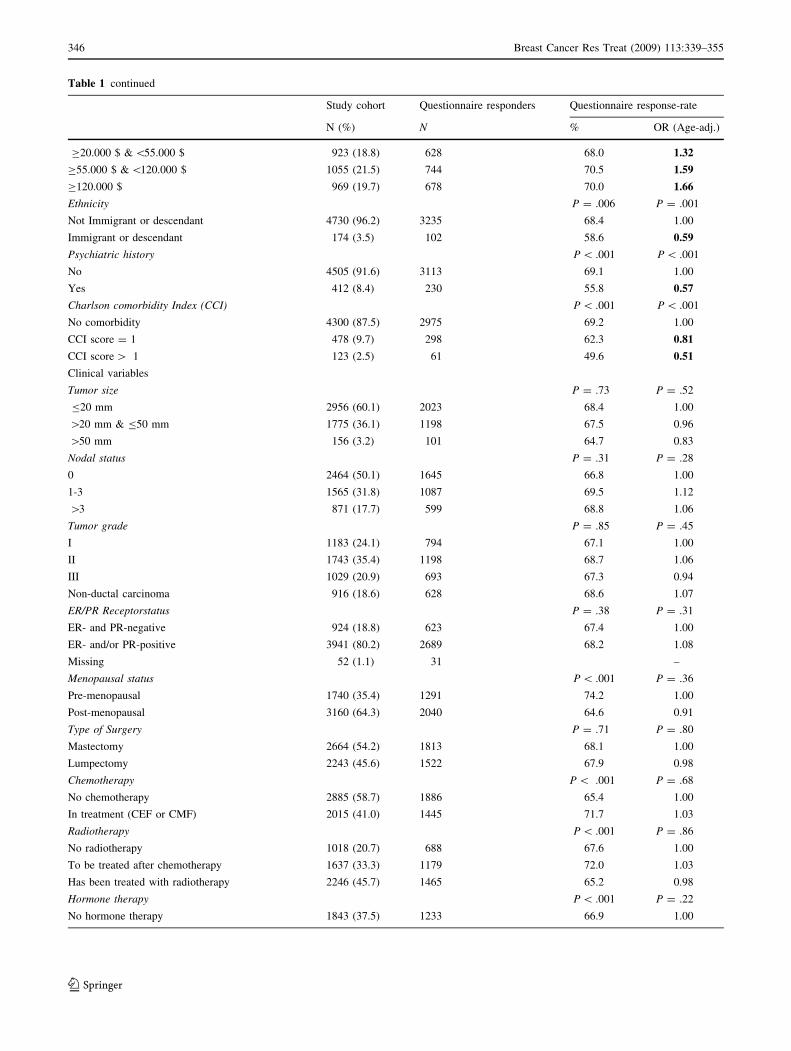
Table 1 continued
Study cohort Questionnaire responders Questionnaire response-rate
N (%) N % OR (Age-adj.)
C20.000 $ & \55.000 $ 923 (18.8) 628 68.0 1.32
C55.000 $ & \120.000 $ 1055 (21.5) 744 70.5 1.59
C120.000 $ 969 (19.7) 678 70.0 1.66
Ethnicity P = .006 P = .001
Not Immigrant or descendant 4730 (96.2) 3235 68.4 1.00
Immigrant or descendant 174 (3.5) 102 58.6 0.59
Psychiatric history P \ .001 P \ .001
No 4505 (91.6) 3113 69.1 1.00
Yes 412 (8.4) 230 55.8 0.57
Charlson comorbidity Index (CCI) P \ .001 P \ .001
No comorbidity 4300 (87.5) 2975 69.2 1.00
CCI score = 1 478 (9.7) 298 62.3 0.81
CCI score [ 1 123 (2.5) 61 49.6 0.51
Clinical variables
Tumor size P = .73 P = .52
B20 mm 2956 (60.1) 2023 68.4 1.00
[20 mm & B50 mm 1775 (36.1) 1198 67.5 0.96
[50 mm 156 (3.2) 101 64.7 0.83
Nodal status P = .31 P = .28
0 2464 (50.1) 1645 66.8 1.00
1-3 1565 (31.8) 1087 69.5 1.12
[3 871 (17.7) 599 68.8 1.06
Tumor grade P = .85 P = .45
I 1183 (24.1) 794 67.1 1.00
II 1743 (35.4) 1198 68.7 1.06
III 1029 (20.9) 693 67.3 0.94
Non-ductal carcinoma 916 (18.6) 628 68.6 1.07
ER/PR Receptorstatus P = .38 P = .31
ER- and PR-negative 924 (18.8) 623 67.4 1.00
ER- and/or PR-positive 3941 (80.2) 2689 68.2 1.08
Missing 52 (1.1) 31 –
Menopausal status P \ .001 P = .36
Pre-menopausal 1740 (35.4) 1291 74.2 1.00
Post-menopausal 3160 (64.3) 2040 64.6 0.91
Type of Surgery P = .71 P = .80
Mastectomy 2664 (54.2) 1813 68.1 1.00
Lumpectomy 2243 (45.6) 1522 67.9 0.98
Chemotherapy P \ .001 P = .68
No chemotherapy 2885 (58.7) 1886 65.4 1.00
In treatment (CEF or CMF) 2015 (41.0) 1445 71.7 1.03
Radiotherapy P \ .001 P = .86
No radiotherapy 1018 (20.7) 688 67.6 1.00
To be treated after chemotherapy 1637 (33.3) 1179 72.0 1.03
Has been treated with radiotherapy 2246 (45.7) 1465 65.2 0.98
Hormone therapy P \ .001 P = .22
No hormone therapy 1843 (37.5) 1233 66.9 1.00
346 Breast Cancer Res Treat (2009) 113:339–355
123
When entered into a logistic regression with major
depression vs. no major depression as the dependent vari-
able while adjusting for age and sociodemographic factors,
nodal status only exhibited a trend towards being a risk
factor for major depression (P = .07, data not shown).
Results of similar analyses of all other clinical variables,
including treatment, did not reach statistical significance
(all P [ .30, data not shown).
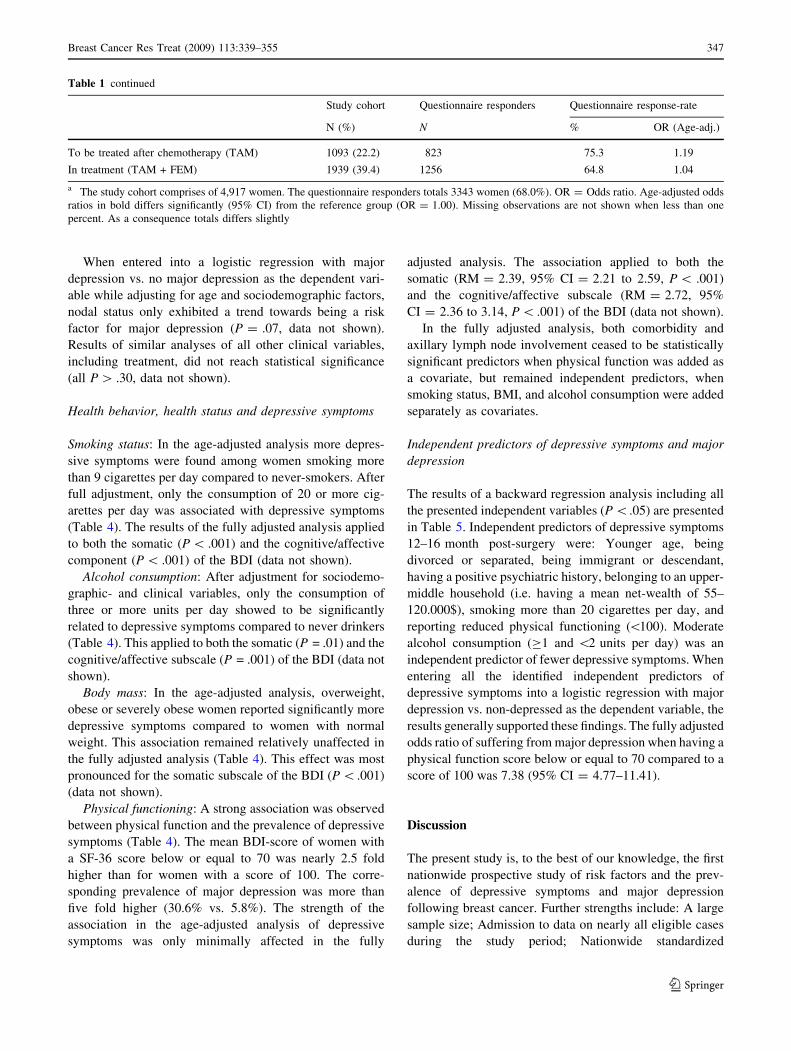
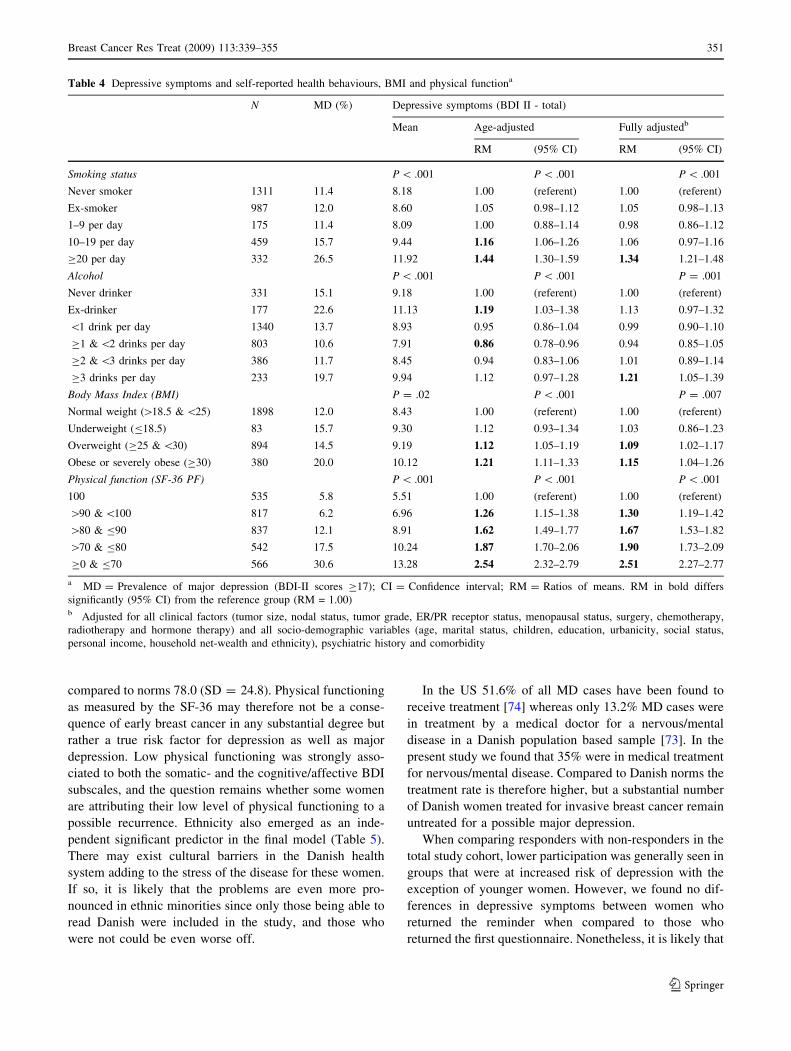
Health behavior, health status and depressive symptoms
Smoking status: In the age-adjusted analysis more depres-
sive symptoms were found among women smoking more
than 9 cigarettes per day compared to never-smokers. After
full adjustment, only the consumption of 20 or more cig-
arettes per day was associated with depressive symptoms
(Table 4). The results of the fully adjusted analysis applied
to both the somatic (P \ .001) and the cognitive/affective
component (P \ .001) of the BDI (data not shown).
Alcohol consumption: After adjustment for sociodemo-
graphic- and clinical variables, only the consumption of
three or more units per day showed to be significantly
related to depressive symptoms compared to never drinkers
(Table 4). This applied to both the somatic (P = .01) and the
cognitive/affective subscale (P = .001) of the BDI (data not
shown).
Body mass: In the age-adjusted analysis, overweight,
obese or severely obese women reported significantly more
depressive symptoms compared to women with normal
weight. This association remained relatively unaffected in
the fully adjusted analysis (Table 4). This effect was most
pronounced for the somatic subscale of the BDI (P \ .001)
(data not shown).
Physical functioning: A strong association was observed
between physical function and the prevalence of depressive
symptoms (Table 4). The mean BDI-score of women with
a SF-36 score below or equal to 70 was nearly 2.5 fold
higher than for women with a score of 100. The corre-
sponding prevalence of major depression was more than
five fold higher (30.6% vs. 5.8%). The strength of the
association in the age-adjusted analysis of depressive
symptoms was only minimally affected in the fully
adjusted analysis. The association applied to both the
somatic (RM = 2.39, 95% CI = 2.21 to 2.59, P \ .001)
and the cognitive/affective subscale (RM = 2.72, 95%
CI = 2.36 to 3.14, P \ .001) of the BDI (data not shown).
In the fully adjusted analysis, both comorbidity and
axillary lymph node involvement ceased to be statistically
significant predictors when physical function was added as
a covariate, but remained independent predictors, when
smoking status, BMI, and alcohol consumption were added
separately as covariates.
Independent predictors of depressive symptoms and major
depression
The results of a backward regression analysis including all
the presented independent variables (P \.05) are presented
in Table 5. Independent predictors of depressive symptoms
12–16 month post-surgery were: Younger age, being
divorced or separated, being immigrant or descendant,
having a positive psychiatric history, belonging to an upper-
middle household (i.e. having a mean net-wealth of 55–
120.000$), smoking more than 20 cigarettes per day, and
reporting reduced physical functioning (\100). Moderate
alcohol consumption (C1 and \2 units per day) was an
independent predictor of fewer depressive symptoms. When
entering all the identified independent predictors of
depressive symptoms into a logistic regression with major
depression vs. non-depressed as the dependent variable, the
results generally supported these findings. The fully adjusted
odds ratio of suffering from major depression when having a
physical function score below or equal to 70 compared to a
score of 100 was 7.38 (95% CI = 4.77–11.41).
Discussion
The present study is, to the best of our knowledge, the first
nationwide prospective study of risk factors and the prev-
alence of depressive symptoms and major depression
following breast cancer. Further strengths include: A large
sample size; Admission to data on nearly all eligible cases
during the study period; Nationwide standardized
Table 1 continued
Study cohort Questionnaire responders Questionnaire response-rate
N (%) N % OR (Age-adj.)
To be treated after chemotherapy (TAM) 1093 (22.2) 823 75.3 1.19
In treatment (TAM + FEM) 1939 (39.4) 1256 64.8 1.04
a The study cohort comprises of 4,917 women. The questionnaire responders totals 3343 women (68.0%). OR = Odds ratio. Age-adjusted odds
ratios in bold differs significantly (95% CI) from the reference group (OR = 1.00). Missing observations are not shown when less than one
percent. As a consequence totals differs slightly
Breast Cancer Res Treat (2009) 113:339–355 347
123
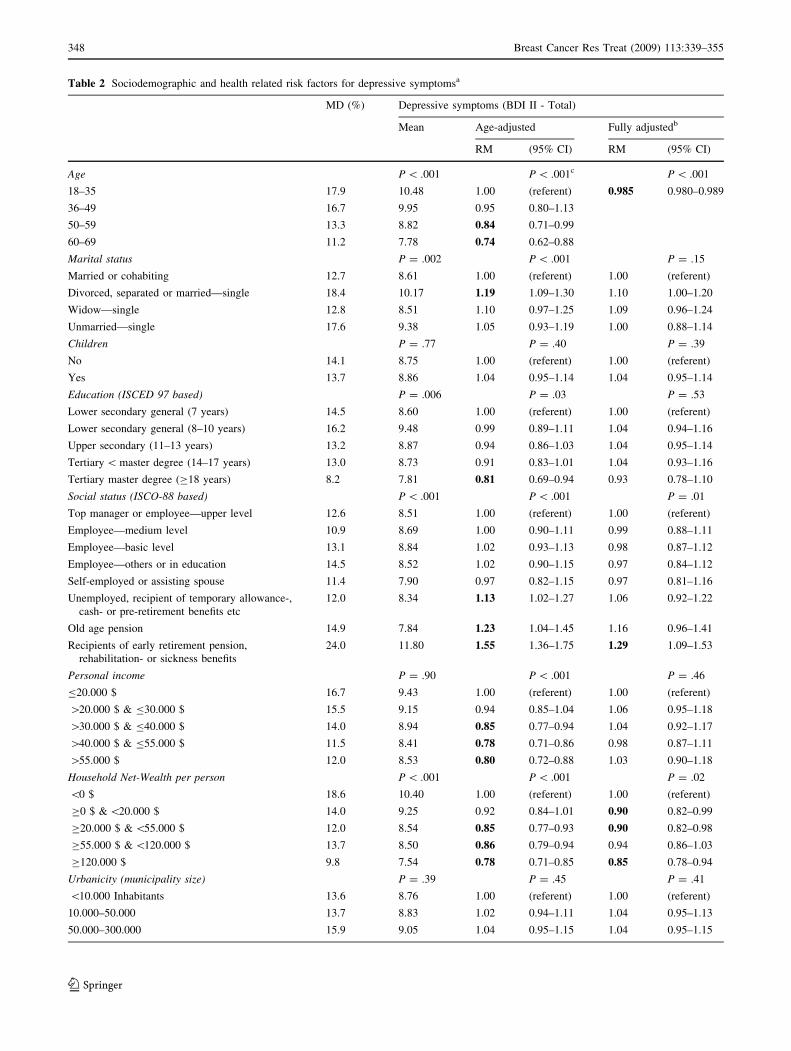
Table 2 Sociodemographic and health related risk factors for depressive symptomsa
MD (%) Depressive symptoms (BDI II - Total)
Mean Age-adjusted Fully adjustedb
RM (95% CI) RM (95% CI)
Age P \ .001 P \ .001c P \ .001
18–35 17.9 10.48 1.00 (referent) 0.985 0.980–0.989
36–49 16.7 9.95 0.95 0.80–1.13
50–59 13.3 8.82 0.84 0.71–0.99
60–69 11.2 7.78 0.74 0.62–0.88
Marital status P = .002 P \ .001 P = .15
Married or cohabiting 12.7 8.61 1.00 (referent) 1.00 (referent)
Divorced, separated or married—single 18.4 10.17 1.19 1.09–1.30 1.10 1.00–1.20
Widow—single 12.8 8.51 1.10 0.97–1.25 1.09 0.96–1.24
Unmarried—single 17.6 9.38 1.05 0.93–1.19 1.00 0.88–1.14
Children P = .77 P = .40 P = .39
No 14.1 8.75 1.00 (referent) 1.00 (referent)
Yes 13.7 8.86 1.04 0.95–1.14 1.04 0.95–1.14
Education (ISCED 97 based) P = .006 P = .03 P = .53
Lower secondary general (7 years) 14.5 8.60 1.00 (referent) 1.00 (referent)
Lower secondary general (8–10 years) 16.2 9.48 0.99 0.89–1.11 1.04 0.94–1.16
Upper secondary (11–13 years) 13.2 8.87 0.94 0.86–1.03 1.04 0.95–1.14
Tertiary \ master degree (14–17 years) 13.0 8.73 0.91 0.83–1.01 1.04 0.93–1.16
Tertiary master degree (C18 years) 8.2 7.81 0.81 0.69–0.94 0.93 0.78–1.10
Social status (ISCO-88 based) P \ .001 P \ .001 P = .01
Top manager or employee—upper level 12.6 8.51 1.00 (referent) 1.00 (referent)
Employee—medium level 10.9 8.69 1.00 0.90–1.11 0.99 0.88–1.11
Employee—basic level 13.1 8.84 1.02 0.93–1.13 0.98 0.87–1.12
Employee—others or in education 14.5 8.52 1.02 0.90–1.15 0.97 0.84–1.12
Self-employed or assisting spouse 11.4 7.90 0.97 0.82–1.15 0.97 0.81–1.16
Unemployed, recipient of temporary allowance-,
cash- or pre-retirement benefits etc
12.0 8.34 1.13 1.02–1.27 1.06 0.92–1.22
Old age pension 14.9 7.84 1.23 1.04–1.45 1.16 0.96–1.41
Recipients of early retirement pension,
rehabilitation- or sickness benefits
24.0 11.80 1.55 1.36–1.75 1.29 1.09–1.53
Personal income P = .90 P \ .001 P = .46
B20.000 $ 16.7 9.43 1.00 (referent) 1.00 (referent)
[20.000 $ & B30.000 $ 15.5 9.15 0.94 0.85–1.04 1.06 0.95–1.18
[30.000 $ & B40.000 $ 14.0 8.94 0.85 0.77–0.94 1.04 0.92–1.17
[40.000 $ & B55.000 $ 11.5 8.41 0.78 0.71–0.86 0.98 0.87–1.11
[55.000 $ 12.0 8.53 0.80 0.72–0.88 1.03 0.90–1.18
Household Net-Wealth per person P \ .001 P \ .001 P = .02
\0 $ 18.6 10.40 1.00 (referent) 1.00 (referent)
C0 $ & \20.000 $ 14.0 9.25 0.92 0.84–1.01 0.90 0.82–0.99
C20.000 $ & \55.000 $ 12.0 8.54 0.85 0.77–0.93 0.90 0.82–0.98
C55.000 $ & \120.000 $ 13.7 8.50 0.86 0.79–0.94 0.94 0.86–1.03
C120.000 $ 9.8 7.54 0.78 0.71–0.85 0.85 0.78–0.94
Urbanicity (municipality size) P = .39 P = .45 P = .41
\10.000 Inhabitants 13.6 8.76 1.00 (referent) 1.00 (referent)
10.000–50.000 13.7 8.83 1.02 0.94–1.11 1.04 0.95–1.13
50.000–300.000 15.9 9.05 1.04 0.95–1.15 1.04 0.95–1.15
348 Breast Cancer Res Treat (2009) 113:339–355
123
treatment; A prospective design using unbiased measures
of pre-cancer demographics; Application of a consecutive
inclusion procedure at a well-defined point in time
12–16 weeks following surgery in order to reduce potential
zero-point bias; Acceptable questionnaire response rate and
highly detailed data on histopathological-, treatment-,
sociodemographic- and health related variables for both
participants and non-participants.
A mean score of 8.85 on the BDI-II and a point prev-
alence of major depression (MD) of 13.7% 12–16 weeks
after surgery were observed. In a sample of 187 randomly
selected Danish women a mean score of 7.1 on the BDI-II
[71] and a prevalence of MD of 10.7% was found
(unpublished data: Zachariae, R.). In another Danish study
also using the BDI-II [72], a MD prevalence of 12.1% in a
randomly selected sample of 109 younger women aged
20–35 yrs., and 3.0% among 133 elderly women aged
70–85 years. was found (unpublished data: Zachariae, R.).
In the present study, the indicated prevalence of MD
among 18–35 year olds was 17.9%, while the prevalence
was 11.2% among the eldest (60–69 years). In a study of
616 randomly selected Danish women aged 20–79 years.
the point prevalence of MD was 3.6% while using the
Major Depression Inventory, corresponding to a prevalence
of 8.8% of minor and major depression on the Hamilton
Depression Scale [73]. In the US, the 12-month point
prevalence for MD was 6.6% according to the National
Comorbidity Survey Replication study [74] while preva-
lence in Europe generally is found to be somewhat lower
(3–5%) [73].
Our results thus suggest, that the prevalence of major
depression and depressive symptoms is increased following
surgery for invasive breast cancer.
Of the cancer- and treatment related variables, only
nodal status ([3) was a modest risk factor for increased
depressive symptoms and only marginally so for major
depression. The generalizeability of this finding is sup-
ported by the finding that participation in the
questionnaire study, when adjusting for age, was neither
biased by histopathological nor treatment related vari-
ables. This result can therefore be seen as being in general
accordance with the negative findings in a large US-
sample, although histopathological- and treatment related
variables were specified in less detail and nodal status was
not analysed separately in that study [41]. The results raise
the question why the level of depressive symptoms fol-
lowing a diagnosis of breast cancer is increased, while
generally unpredicted by any of a detailed set of cancer-
and treatment related variables? A straightforward answer
could be that what matters most to women having early
stage breast cancer, is the cancer per se—i.e. the personal-
, social- and economic implications of having a potentially
life-threatening disease. Our finding that nodal status was
the only cancer- and treatment related risk factor for
depression may reflect that the prognostic significance of
nodal spread may be the only clinical variable commonly
perceived by the women as having a negative prognostic
influence.
In contrast to treatment- and disease characteristics,
sociodemographics, comorbidity, and psychiatric history,
Table 2 continued
MD (%) Depressive symptoms (BDI II - Total)
Mean Age-adjusted Fully adjustedb
RM (95% CI) RM (95% CI)
Copenhagen—suburbs 12.4 9.01 1.04 0.94–1.15 1.07 0.97–1.18
Copenhagen—center 10.5 8.25 0.94 0.84–1.06 0.96 0.85–1.08
Ethnicity P = .03 P = .08 P = .05
Not immigrant or descendant 13.5 8.80 1.00 (referent) 1.00 (referent)
Immigrant or descendant 18.6 10.18 1.16 0.98–1.36 1.18 1.00–1.38
Psychiatric history P \ .001 P \ .001 P \ .001
No 12.3 8.47 1.00 (referent) 1.00 (referent)
Yes 32.9 13.92 1.65 1.48–1.84 1.49 1.33–1.66
Charlson comorbidity Index (CCI) P = .004 P \ .001 P = .005
No comorbidity 12.9 8.64 1.00 (referent) 1.00 (referent)
CCI score = 1 19.0 10.08 1.23 1.11–1.36 1.12 1.01–1.23
CCI score [ 1 30.0 12.95 1.67 1.35–2.05 1.34 1.08–1.65
a MD = Prevalence of major depression (BDI-II scores C 17); CI = Confidence interval; RM = Ratios of means. Age-adjusted RM in bold
differs significantly (95% CI) from the reference group (RM = 1.00)b Fully adjusted for all other socio-demographic variables, psychiatric history and comorbidity (N = 3273)c Unadjusted
Breast Cancer Res Treat (2009) 113:339–355 349
123
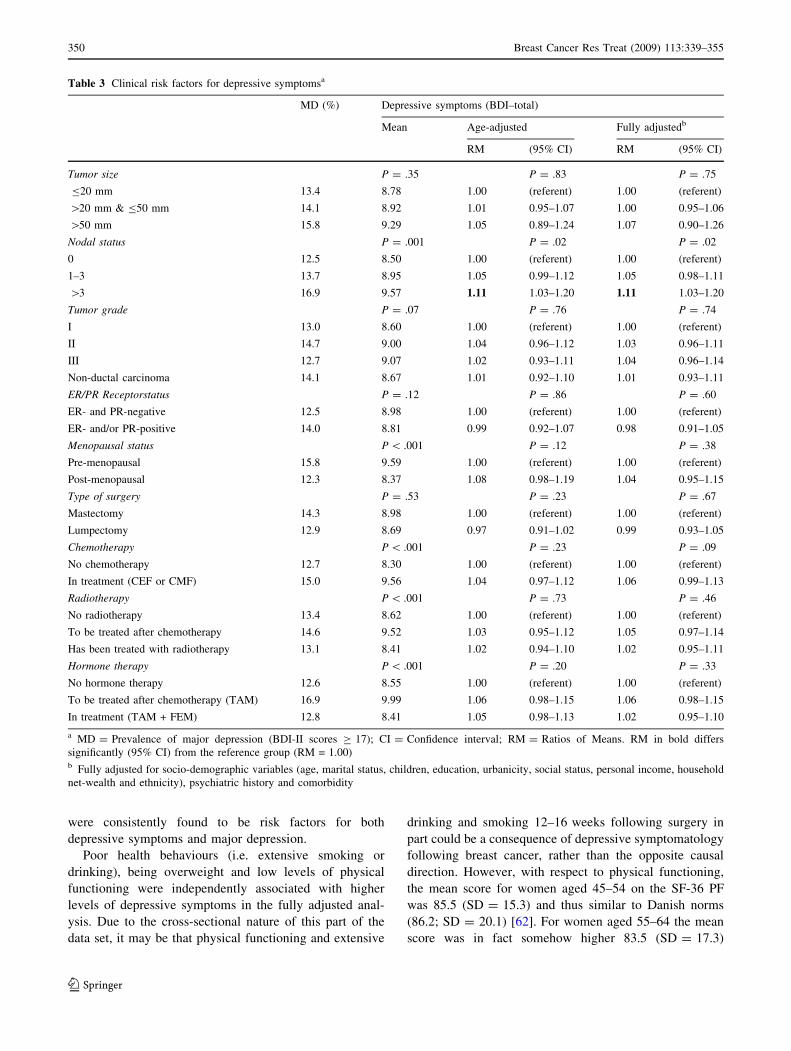
were consistently found to be risk factors for both
depressive symptoms and major depression.
Poor health behaviours (i.e. extensive smoking or
drinking), being overweight and low levels of physical
functioning were independently associated with higher
levels of depressive symptoms in the fully adjusted anal-
ysis. Due to the cross-sectional nature of this part of the
data set, it may be that physical functioning and extensive
drinking and smoking 12–16 weeks following surgery in
part could be a consequence of depressive symptomatology
following breast cancer, rather than the opposite causal
direction. However, with respect to physical functioning,
the mean score for women aged 45–54 on the SF-36 PF
was 85.5 (SD = 15.3) and thus similar to Danish norms
(86.2; SD = 20.1) [62]. For women aged 55–64 the mean
score was in fact somehow higher 83.5 (SD = 17.3)
Table 3 Clinical risk factors for depressive symptomsa
MD (%) Depressive symptoms (BDI–total)
Mean Age-adjusted Fully adjustedb
RM (95% CI) RM (95% CI)
Tumor size P = .35 P = .83 P = .75
B20 mm 13.4 8.78 1.00 (referent) 1.00 (referent)
[20 mm & B50 mm 14.1 8.92 1.01 0.95–1.07 1.00 0.95–1.06
[50 mm 15.8 9.29 1.05 0.89–1.24 1.07 0.90–1.26
Nodal status P = .001 P = .02 P = .02
0 12.5 8.50 1.00 (referent) 1.00 (referent)
1–3 13.7 8.95 1.05 0.99–1.12 1.05 0.98–1.11
[3 16.9 9.57 1.11 1.03–1.20 1.11 1.03–1.20
Tumor grade P = .07 P = .76 P = .74
I 13.0 8.60 1.00 (referent) 1.00 (referent)
II 14.7 9.00 1.04 0.96–1.12 1.03 0.96–1.11
III 12.7 9.07 1.02 0.93–1.11 1.04 0.96–1.14
Non-ductal carcinoma 14.1 8.67 1.01 0.92–1.10 1.01 0.93–1.11
ER/PR Receptorstatus P = .12 P = .86 P = .60
ER- and PR-negative 12.5 8.98 1.00 (referent) 1.00 (referent)
ER- and/or PR-positive 14.0 8.81 0.99 0.92–1.07 0.98 0.91–1.05
Menopausal status P \ .001 P = .12 P = .38
Pre-menopausal 15.8 9.59 1.00 (referent) 1.00 (referent)
Post-menopausal 12.3 8.37 1.08 0.98–1.19 1.04 0.95–1.15
Type of surgery P = .53 P = .23 P = .67
Mastectomy 14.3 8.98 1.00 (referent) 1.00 (referent)
Lumpectomy 12.9 8.69 0.97 0.91–1.02 0.99 0.93–1.05
Chemotherapy P \ .001 P = .23 P = .09
No chemotherapy 12.7 8.30 1.00 (referent) 1.00 (referent)
In treatment (CEF or CMF) 15.0 9.56 1.04 0.97–1.12 1.06 0.99–1.13
Radiotherapy P \ .001 P = .73 P = .46
No radiotherapy 13.4 8.62 1.00 (referent) 1.00 (referent)
To be treated after chemotherapy 14.6 9.52 1.03 0.95–1.12 1.05 0.97–1.14
Has been treated with radiotherapy 13.1 8.41 1.02 0.94–1.10 1.02 0.95–1.11
Hormone therapy P \ .001 P = .20 P = .33
No hormone therapy 12.6 8.55 1.00 (referent) 1.00 (referent)
To be treated after chemotherapy (TAM) 16.9 9.99 1.06 0.98–1.15 1.06 0.98–1.15
In treatment (TAM + FEM) 12.8 8.41 1.05 0.98–1.13 1.02 0.95–1.10
a MD = Prevalence of major depression (BDI-II scores C 17); CI = Confidence interval; RM = Ratios of Means. RM in bold differs
significantly (95% CI) from the reference group (RM = 1.00)b Fully adjusted for socio-demographic variables (age, marital status, children, education, urbanicity, social status, personal income, household
net-wealth and ethnicity), psychiatric history and comorbidity
350 Breast Cancer Res Treat (2009) 113:339–355
123
compared to norms 78.0 (SD = 24.8). Physical functioning
as measured by the SF-36 may therefore not be a conse-
quence of early breast cancer in any substantial degree but
rather a true risk factor for depression as well as major
depression. Low physical functioning was strongly asso-
ciated to both the somatic- and the cognitive/affective BDI
subscales, and the question remains whether some women
are attributing their low level of physical functioning to a
possible recurrence. Ethnicity also emerged as an inde-
pendent significant predictor in the final model (Table 5).
There may exist cultural barriers in the Danish health
system adding to the stress of the disease for these women.
If so, it is likely that the problems are even more pro-
nounced in ethnic minorities since only those being able to
read Danish were included in the study, and those who
were not could be even worse off.
In the US 51.6% of all MD cases have been found to
receive treatment [74] whereas only 13.2% MD cases were
in treatment by a medical doctor for a nervous/mental
disease in a Danish population based sample [73]. In the
present study we found that 35% were in medical treatment
for nervous/mental disease. Compared to Danish norms the
treatment rate is therefore higher, but a substantial number
of Danish women treated for invasive breast cancer remain
untreated for a possible major depression.
When comparing responders with non-responders in the
total study cohort, lower participation was generally seen in
groups that were at increased risk of depression with the
exception of younger women. However, we found no dif-
ferences in depressive symptoms between women who
returned the reminder when compared to those who
returned the first questionnaire. Nonetheless, it is likely that
Table 4 Depressive symptoms and self-reported health behaviours, BMI and physical functiona
N MD (%) Depressive symptoms (BDI II - total)
Mean Age-adjusted Fully adjustedb
RM (95% CI) RM (95% CI)
Smoking status P \ .001 P \ .001 P \ .001
Never smoker 1311 11.4 8.18 1.00 (referent) 1.00 (referent)
Ex-smoker 987 12.0 8.60 1.05 0.98–1.12 1.05 0.98–1.13
1–9 per day 175 11.4 8.09 1.00 0.88–1.14 0.98 0.86–1.12
10–19 per day 459 15.7 9.44 1.16 1.06–1.26 1.06 0.97–1.16
C20 per day 332 26.5 11.92 1.44 1.30–1.59 1.34 1.21–1.48
Alcohol P \ .001 P \ .001 P = .001
Never drinker 331 15.1 9.18 1.00 (referent) 1.00 (referent)
Ex-drinker 177 22.6 11.13 1.19 1.03–1.38 1.13 0.97–1.32
\1 drink per day 1340 13.7 8.93 0.95 0.86–1.04 0.99 0.90–1.10
C1 & \2 drinks per day 803 10.6 7.91 0.86 0.78–0.96 0.94 0.85–1.05
C2 & \3 drinks per day 386 11.7 8.45 0.94 0.83–1.06 1.01 0.89–1.14
C3 drinks per day 233 19.7 9.94 1.12 0.97–1.28 1.21 1.05–1.39
Body Mass Index (BMI) P = .02 P \ .001 P = .007
Normal weight ([18.5 & \25) 1898 12.0 8.43 1.00 (referent) 1.00 (referent)
Underweight (B18.5) 83 15.7 9.30 1.12 0.93–1.34 1.03 0.86–1.23
Overweight (C25 & \30) 894 14.5 9.19 1.12 1.05–1.19 1.09 1.02–1.17
Obese or severely obese (C30) 380 20.0 10.12 1.21 1.11–1.33 1.15 1.04–1.26
Physical function (SF-36 PF) P \ .001 P \ .001 P \ .001
100 535 5.8 5.51 1.00 (referent) 1.00 (referent)
[90 & \100 817 6.2 6.96 1.26 1.15–1.38 1.30 1.19–1.42
[80 & B90 837 12.1 8.91 1.62 1.49–1.77 1.67 1.53–1.82
[70 & B80 542 17.5 10.24 1.87 1.70–2.06 1.90 1.73–2.09
C0 & B70 566 30.6 13.28 2.54 2.32–2.79 2.51 2.27–2.77
a MD = Prevalence of major depression (BDI-II scores C17); CI = Confidence interval; RM = Ratios of means. RM in bold differs
significantly (95% CI) from the reference group (RM = 1.00)b Adjusted for all clinical factors (tumor size, nodal status, tumor grade, ER/PR receptor status, menopausal status, surgery, chemotherapy,
radiotherapy and hormone therapy) and all socio-demographic variables (age, marital status, children, education, urbanicity, social status,
personal income, household net-wealth and ethnicity), psychiatric history and comorbidity
Breast Cancer Res Treat (2009) 113:339–355 351
123
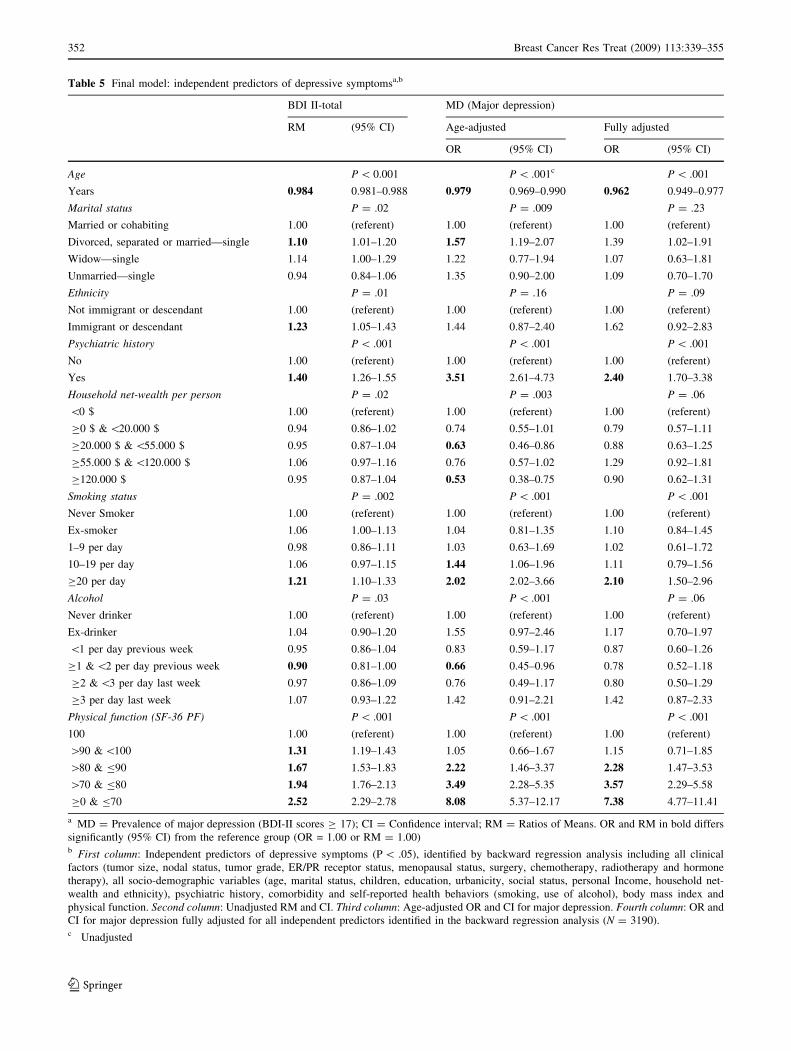
Table 5 Final model: independent predictors of depressive symptomsa,b
BDI II-total MD (Major depression)
RM (95% CI) Age-adjusted Fully adjusted
OR (95% CI) OR (95% CI)
Age P \ 0.001 P \ .001c P \ .001
Years 0.984 0.981–0.988 0.979 0.969–0.990 0.962 0.949–0.977
Marital status P = .02 P = .009 P = .23
Married or cohabiting 1.00 (referent) 1.00 (referent) 1.00 (referent)
Divorced, separated or married—single 1.10 1.01–1.20 1.57 1.19–2.07 1.39 1.02–1.91
Widow—single 1.14 1.00–1.29 1.22 0.77–1.94 1.07 0.63–1.81
Unmarried—single 0.94 0.84–1.06 1.35 0.90–2.00 1.09 0.70–1.70
Ethnicity P = .01 P = .16 P = .09
Not immigrant or descendant 1.00 (referent) 1.00 (referent) 1.00 (referent)
Immigrant or descendant 1.23 1.05–1.43 1.44 0.87–2.40 1.62 0.92–2.83
Psychiatric history P \ .001 P \ .001 P \ .001
No 1.00 (referent) 1.00 (referent) 1.00 (referent)
Yes 1.40 1.26–1.55 3.51 2.61–4.73 2.40 1.70–3.38
Household net-wealth per person P = .02 P = .003 P = .06
\0 $ 1.00 (referent) 1.00 (referent) 1.00 (referent)
C0 $ & \20.000 $ 0.94 0.86–1.02 0.74 0.55–1.01 0.79 0.57–1.11
C20.000 $ & \55.000 $ 0.95 0.87–1.04 0.63 0.46–0.86 0.88 0.63–1.25
C55.000 $ & \120.000 $ 1.06 0.97–1.16 0.76 0.57–1.02 1.29 0.92–1.81
C120.000 $ 0.95 0.87–1.04 0.53 0.38–0.75 0.90 0.62–1.31
Smoking status P = .002 P \ .001 P \ .001
Never Smoker 1.00 (referent) 1.00 (referent) 1.00 (referent)
Ex-smoker 1.06 1.00–1.13 1.04 0.81–1.35 1.10 0.84–1.45
1–9 per day 0.98 0.86–1.11 1.03 0.63–1.69 1.02 0.61–1.72
10–19 per day 1.06 0.97–1.15 1.44 1.06–1.96 1.11 0.79–1.56
C20 per day 1.21 1.10–1.33 2.02 2.02–3.66 2.10 1.50–2.96
Alcohol P = .03 P \ .001 P = .06
Never drinker 1.00 (referent) 1.00 (referent) 1.00 (referent)
Ex-drinker 1.04 0.90–1.20 1.55 0.97–2.46 1.17 0.70–1.97
\1 per day previous week 0.95 0.86–1.04 0.83 0.59–1.17 0.87 0.60–1.26
C1 & \2 per day previous week 0.90 0.81–1.00 0.66 0.45–0.96 0.78 0.52–1.18
C2 & \3 per day last week 0.97 0.86–1.09 0.76 0.49–1.17 0.80 0.50–1.29
C3 per day last week 1.07 0.93–1.22 1.42 0.91–2.21 1.42 0.87–2.33
Physical function (SF-36 PF) P \ .001 P \ .001 P \ .001
100 1.00 (referent) 1.00 (referent) 1.00 (referent)
[90 & \100 1.31 1.19–1.43 1.05 0.66–1.67 1.15 0.71–1.85
[80 & B90 1.67 1.53–1.83 2.22 1.46–3.37 2.28 1.47–3.53
[70 & B80 1.94 1.76–2.13 3.49 2.28–5.35 3.57 2.29–5.58
C0 & B70 2.52 2.29–2.78 8.08 5.37–12.17 7.38 4.77–11.41
a MD = Prevalence of major depression (BDI-II scores C 17); CI = Confidence interval; RM = Ratios of Means. OR and RM in bold differs
significantly (95% CI) from the reference group (OR = 1.00 or RM = 1.00)b First column: Independent predictors of depressive symptoms (P \ .05), identified by backward regression analysis including all clinical
factors (tumor size, nodal status, tumor grade, ER/PR receptor status, menopausal status, surgery, chemotherapy, radiotherapy and hormone
therapy), all socio-demographic variables (age, marital status, children, education, urbanicity, social status, personal Income, household net-
wealth and ethnicity), psychiatric history, comorbidity and self-reported health behaviors (smoking, use of alcohol), body mass index and
physical function. Second column: Unadjusted RM and CI. Third column: Age-adjusted OR and CI for major depression. Fourth column: OR and
CI for major depression fully adjusted for all independent predictors identified in the backward regression analysis (N = 3190).c Unadjusted
352 Breast Cancer Res Treat (2009) 113:339–355
123
the true level of depression in the study cohort may be
somehow underestimated. The finding that women with an
indication of major depression were more than 2.5 times
likely to be in treatment for nervous/mental disease com-
pared to a population based Danish sample, thereby
reducing the ‘‘natural’’ level of depressive symptoms fol-
lowing breast-cancer, may further add to such a bias.
Conclusion
The present study confirms that the prevalence of major
depression and depressive symptoms is increased among
women treated for early stage breast-cancer. Concerns have
been raised with respect to potentially adverse conse-
quences of treatment for breast-cancer, e.g. chemotherapy,
radiotherapy, mastectomy, and tamoxifen, but our results
suggest that these concerns are unjustified with respect to
depression. While cancer-specific variables were of minor
importance, socio-economic and general health-related
factors seem to play a substantial role as risk factors for
depressive symptoms. It is possible that the influence of
these risk factors is even more pronounced in countries
with greater inequality in public access to adequate health
services and treatment. The results calls for considerations
about establishing screening procedures for major depres-
sion in breast-cancer, in order to provide adequate support
and treatment to those who are in need.
Acknowledgements We thank all the women who participated in
the study. We also wish to thank the participating surgical depart-
ments and their staff at the following Danish hospitals:
Rigshospitalet; Herlev Amtssygehus; Hørsholm Sygehus; Roskilde
Amtssygehus; Ringsted Sygehus; Næstved Sygehus; Nykøbing F.
Centralsygehuset; Bornholm Sygehus; Svendborg Sygehus; Odense
Universitetshospital; Aabenraa Sygehus; Esbjerg Centralsygehus;
Fredericia Sygehus; Vejle Sygehus; Holstebro Centralsygehus;
Herning Centralsygehus; Aarhus Amtssygehus; Randers Central-
sygehus; Odder Centralsygehus; Skive Sygehus; Viborg Sygehus;
Sygehus Nord Nykøbing-Thisted; Aalborg Sygehus; and Hjørring
Sygehus. Funding The Danish Cancer Society (9915008, PP00014,
PP03034); Sygekassernes Helsefond (2005B075). Notes The study
sponsors had no role in the design of the study; the collection, anal-
ysis, and interpretation of data; the writing of the manuscript; or the
decision to submit the manuscript for publication. No authors have
any conflict of interest to declare.
References
1. Massie NJ, Popkin MK (1998) Depressive disorders. In: Holland
J (ed) Psycho-oncology. Oxford University Press, New York
2. Al Ghazal SK, Sully L, Fallowfield L et al (2000) The psycho-
logical impact of immediate rather than delayed breast
reconstruction. Eur J Surg Oncol 26:17–19
3. Maraste R, Brandt L, Olsson H et al (1992) Anxiety and
depression in breast-cancer patients at start of adjuvant
radiotherapy—relations to age and type of surgery. Acta Oncol
31:641–643
4. Gaston-Johansson F, Fall-Dickson JM, Bakos AB et al (1999)
Fatigue, pain, and depression in pre-autotransplant breast cancer
patients. Cancer Pract 7:240–247
5. Gross JJ, Carstensen LL, Pasupathi M et al (1997) Emotion and
aging: experience, expression, and control. Psychol Aging
12:590–599
6. Charles ST, Reynolds CA, Gatz M (2001) Age-related differ-
ences and change in positive and negative affect over 23 years.
J Pers Soc Psychol 80:136–151
7. Mosher CE, Danoff-Burg S (2005) A review of age differences in
psychological adjustment to breast cancer. J Psychosoc Oncol
23:101–114
8. Dean C (1987) Psychiatric morbidity following mastectomy—
preoperative predictors and types of illness. J Psychosom Res
31:385–392
9. Bloom JR (1982) Social support, accommodation to stress and
adjustment to breast-cancer. Soc Sci Med 16:1329–1338
10. Deshields T, Tibbs T, Fan MY et al (2006) Differences in pat-
terns of depression after treatment for breast cancer.
Psychooncology 15:398–406
11. Pinder KL, Ramirez AJ, Black ME et al (1993) Psychiatric-
disorder in patients with advanced breast-cancer—prevalence and
associated factors. Eur J Cancer 29A:524–527
12. Spitzer RL, Williams JBW, Gibbon M et al (1992) The structured
clinical interview for Dsm-Iii-R (Scid).1. History, rationale, and
description. Arch Gen Psychiatry 49:624–629
13. First MB, Gibbon M, Spitzer RL (1996) Structured clinical
interview for DSM-IV (IP). New York, Biometrics research
department, New York State Psychiatric Institute.
14. Radlof LS (1977) The CES-D Scale: A self-report depression
scale for research in the general population. J Applied Psychol
Meas 1:385–401
15. Zigmond AS, Snaith RP (1983) The hospital anxiety and
depression scale. Acta Psychiatr Scand 67:361–370
16. Beck AT, Erbaugh J, Ward CH et al (1961) An inventory for
measuring depression. Arch Gen Psychiatry 4:561–571
17. Beck AT, Steer RA, Brown GK (1996) Manual: Beck depression
inventory, 2nd edn. The Psychological Corp Hartcourt & Brace,
San Antonio, TX
18. Wilcox H, Field T (1998) Correlations between the BDI and
CES-D in a sample of adolescent mothers. Adolescence 33:565–
574
19. Berard RMF, Boermeester F, Viljoen G (1998) Depressive
disorders in an out-patient oncology setting: prevalence, assess-
ment, and management. Psychooncology 7:112–120
20. Hann D, Winter K, Jacobsen P (1999) Measurement of depressive
symptoms in cancer patients: Evaluation of the Center for
Epidemiological Studies Depression Scale (CES-D). J Psychosom
Res 46:437–443
21. Hall A, A’Hern R, Fallowfield L (1999) Are we using appropriate
self-report questionnaires for detecting anxiety and depression in
women with early breast cancer?. Eur J Cancer 35:79–85
22. Groenvold M, Fayers PM, Sprangers MAG et al (1999) Anxiety
and depression in breast cancer patients at low risk of recurrence
compared with the general population: A valid comparison?
J Clin Epidemiol 52:523–530
23. Love AW, Grabsch B, Clarke DM et al (2004) Screening for
depression in women with metastatic breast cancer: a comparison
of the Beck depression inventory short form and the hospital
anxiety and depression scale. Aust N Z J Psychiatry 38:526–531
24. Love AW, Kissane DW, Bloch S et al (2002) Diagnostic effi-
ciency of the Hospital Anxiety and Depression Scale in women
with early stage breast cancer. Aust N Z J Psychiatry 36:246–250
Breast Cancer Res Treat (2009) 113:339–355 353
123
25. Farragher B (1998) Psychiatric morbidity following the diagnosis
and treatment of early breast cancer. Ir J Med Sci 167:166–169
26. Pasacreta JV (1997) Depressive phenomena, physical symptom
distress, and functional status among women with breast cancer.
Nurs Res 46:214–221
27. Al Ghazal SK, Fallowfield L, Blamey RW (2000) Comparison of
psychological aspects and patient satisfaction following breast
conserving surgery, simple mastectomy and breast reconstruc-
tion. Eur J Cancer 36:1938–1943
28. Cordova MJ, Cunningham LLC, Carlson CR et al (2001) Post-
traumatic growth following breast cancer: a controlled
comparison study. Health Psychol 20:176–185
29. Yeter K, Rock CL, Pakiz B et al (2006) Depressive symptoms,
eating psychopathology, and physical activity in obese breast
cancer survivors. Psychooncology 15:453–462
30. Burgess C, Cornelius V, Love S et al (2005) Depression and
anxiety in women with early breast cancer: five year observa-
tional cohort study. Br Med J 330:702–705
31. Goldberg JA, Scott RN, Davidson PM et al (1992) Psychological
morbidity in the 1st year after breast surgery. Eur J Surg Oncol
18:327–331
32. Rijken M, de Kruif AT, Komproe IH et al (1995) Depressive
symptomatology of post-menopausal breast cancer patients: a
comparison of women recently treated by mastectomy or by
breast-conserving therapy. Eur J Surg Oncol 21:498–503
33. Andersen BL, Kiecoltglaser JK, Glaser R (1994) A Biobehavioral
Model of Cancer Stress and Disease Course. Am Psychol 49:389–
404
34. Andersen BL, Shapiro CL, Farrar WB et al (2005) Psychological
responses to cancer recurrence—a controlled prospective study.
Cancer 104:1540–1547
35. Antoni MH, Lehman JM, Kilbourn KM et al (2001) Cognitive-
behavioral stress management intervention decreases the preva-
lence of depression and enhances benefit finding among women
under treatment for early-stage breast cancer. Health Psychol
20:20–32
36. Green BL, Krupnick JL, Rowland JH et al (2000) Trauma history
as a predictor of psychologic symptoms in women with breast
cancer. J Clin Oncol 18:1084–1093
37. Hopwood P, Howell A, Maguire P (1991) Psychiatric morbidity
in patients with advanced cancer of the breast—prevalence
measured by 2 self-rating questionnaires. Br J Cancer 64:349–352
38. vantSpijker A, Trijsburg RW, Duivenvoorden HJ (1997) Psy-
chological sequelae of cancer diagnosis: a meta-analytical review
of 58 studies after 1980. Psychosom Med 59:280–293
39. Aragona M, Muscatello MRA, Mesiti M (1997) Depressive mood
disorders in patients with operable breast cancer. J Exp Clin Canc
Res 16:111–118
40. Ell K, Sanchez K, Vourlekis B, Lee PJ et al (2005) Depression,
correlates of depression, and receipt of depression care among
low-income women with breast or gynecologic cancer. J Clin
Oncol 23:3052–3060
41. Bardwell WA, Natarajan L, Dimsdale JE et al (2006) Objective
cancer-related variables are not associated with depressive
symptoms in women treated for early-stage breast cancer. J Clin
Oncol 24:2420–2427
42. Kissane DW, Clarke DM, Ikin J et al (1998) Psychological
morbidity and quality of life in Australian women with early-
stage breast cancer: a cross-sectional survey. Med J Aust
169:192–196
43. Aukst-Margetic B, Jakovljevic M, Margetic B et al (2005)
Religiosity, depression and pain in patients with breast cancer.
Gen Hosp Psychiatry 27:250–255
44. Fallowfield LJ, Hall A, Maguire GP et al (1990) Psychological
outcomes of different treatment policies in women with early
breast-cancer outside a clinical-trial. Br Med J 301:575–580
45. Lasry JCM, Margolese RG, Poisson R et al (1987) Depression
and body-image following mastectomy and lumpectomy. J
Chronic Dis 40:529–534
46. Duffy LS, Greenberg DB, Younger J et al (1999) Iatrogenic acute
estrogen deficiency and psychiatric syndromes in breast cancer
patients. Psychosomatics 40:304–308
47. Cathcart CK, Jones SE, Pumroy CS et al (1993) Clinical recog-
nition and management of depression in node-negative breast-
cancer patients treated with Tamoxifen. Breast Cancer Res Treat
27:277–281
48. Kissane DW, Grabsch B, Love A et al (2004) Psychiatric disorder
in women with early stage and advanced breast cancer: a com-
parative analysis. Aust N Z J Psychiatry 38:320–326
49. Day R, Ganz PA, Costantino JP (2001) Tamoxifen and depres-
sion: More evidence from the National Surgical Adjuvant Breast
and Bowel Project’s Breast Cancer Prevention (P-1) randomized
study. J Natl Cancer Inst 93:1615–1623
50. Lee KC, Ray GT, Hunkeler EM et al (2007) Tamoxifen treatment
and new-onset depression in breast cancer patients. Psychoso-
matics 48:205–210
51. Tjemsland L, Soreide JA, Malt UF (1995) Psychosocial factors in
women with operable breast-cancer—an association to estrogen-
receptor status. J Psychosom Res 39:875–881
52. Stommel M, Kurtz ME, Kurtz JC et al (2004) A longitudinal
analysis of the course of depressive symptomatology in geriatric
patients with cancer of the breast, colon, lung, or prostate. Health
Psychol 23:564–573
53. Krishnan L, Stanton AL, Collins CA et al (2001) Form or func-
tion? Part 2. Objective cosmetic and functional correlates of
quality of life in women treated with breast-conserving surgical
procedures and radiotherapy. Cancer 91:2282–2287
54. Werrij MQ, Mulkens S, Hospers HJ et al (2006) Overweight and
obesity: the significance of a depressed mood. Patient Educ
Couns 62:126–131
55. Extermann M (2000) Measurement and impact of comorbidity in
older cancer patients. Crit Rev Oncol Hematol 35:181–200
56. Janssen-Heijnen MLG, Houterman S, Lemmens VEPP et al
(2005) Prognostic impact of increasing age and co-morbidity in
cancer patients: a population-based approach. Crit Rev Oncol
Hematol 55:231–240
57. Evans DL, Charney DS, Lewis L et al (2005) Mood disorders in
the medically ill: scientific review and recommendations. Biol
Psychiatry 58:175–189
58. Krishnan KRR, Delong M, Kraemer H et al (2002) Comorbidity
of depression with other medical diseases in the elderly. Biol
Psychiatry 52:559–588
59. Louwman WJ, Janssen-Heijnen MLG, Houterman S et al (2005)
Less extensive treatment and inferior prognosis for breast cancer
patient with comorbidity: a population-based study. Eur J Cancer
41:779–785
60. Singletary SE, Allred C, Ashley P et al (2002) Revision of the
American joint committee on cancer staging system for breast
cancer. J Clin Oncol 20:3628–3636
61. Charlson ME, Pompei P, Ales KL et al (1987) A new
method of classifying prognostic comorbidity in longitudinal
studies: development and validation. J Chronic Dis 40:373–
383
62. Bjørner JB, Damsgaard MT, Watt T et al (1997) Dansk manual
for SF-36 (Danish manual for the SF-36), Lægemiddelindustri-
foreningen, Copenhagen.
63. Ware JE, Sherbourne CD (1992) The Mos 36-item short-form
health survey (Sf-36) .1. Conceptual-Framework and Item
Selection. Med Care 30:473–483
64. World Health Organization (2000) Obesity. Preventing and
managing the global endemic. Technical report series no 894,
WHO, Geneva.
354 Breast Cancer Res Treat (2009) 113:339–355
123
65. Extermann M (2000) Measuring comorbidity in older cancer
patients. Eur J Cancer 36:453–471
66. Rostgaard K, Holst H, Mouridsen HT et al (2000) Do clinical
databases render population-based cancer registers obsolete? The
example of breast cancer in Denmark. Cancer Causes Control
11:669–674
67. Statistics Denmark (2005). Statistics Denmark. Numbers on time.
http://www.dst.dk/HomeUK/About/introSD.aspx. Cited 23 nov
2007
68. UNESCO (2006) ISCED 1997. International standard classification
of education, Re-edition. http://www.uis.unesco.org/TEMPLATE/
pdf/isced/ISCED_A.pdf. Cited 11 oct 2007.
69. Munk-Jorgensen P, Mortensen PB (1997) The Danish Psychiatric
Central Register. Dan Med Bull 44:82–84
70. Schafer JL, Graham JW (2002) Missing data: our view of the
state of the art. Psychol Methods 7:147–177
71. Zachariae R, Zachariae C, Ibsen HHW et al (2004) Psychological
symptoms and quality of life of dermatology outpatients and
hospitalized dermatology patients. Acta Derm Venereol 84:205–
212
72. Thomsen DK, Mehlsen MY, Viidik A et al (2005) Age and
gender differences in negative affect—Is there a role for emotion
regulation? Personality and Individual Differences 38:1935–1946
73. Olsen LR, Mortensen EL, Bech P (2004) Prevalence of major
depression and stress indicators in the Danish general population.
Acta Psychiatr Scand 109:96–103
74. Kessler RC, Berglund P, Demler O et al (2003) The Epidemiol-
ogy of Major Depressive Disorder: Results From the National
Comorbidity Survey Replication (NCS-R). JAMA 289:3095–
3105
Breast Cancer Res Treat (2009) 113:339–355 355
123