
The Fertility Transition in Egypt: Intraurban Patterns in Cairo
20
The Fertility Transition in Egypt: Intraurban Patterns in Cairo John R. Weeks,* Arthur Getis,** Allan G. Hill,*** M. Saad Gadalla,* and Tarek Rashed**** *International Population Center, Department of Geography, San Diego State University **Department of Geography, San Diego State University ***Center for Population and Development Studies, Harvard School of Public Health, Harvard University ****Department of Geography, University of Oklahoma Fertility transitions are historically thought to have started in cities and then spread to the rest of the country. This would suggest that in Egypt we would find that Cairo was well ahead of the rest of the nation in its fertility transition. The data suggest otherwise and highlight the fact that many parts of Cairo are still experiencing high levels of fertility. Population geographers have generally examined differences only between urban and nonurban areas, but incorporating census tract level data from the 1996 and 1986 censuses of Egypt into a geographic information system, we are able to show that there are substantial intraurban geographic variations in fertility within the greater Cairo area. These spatial patterns are indicative of underlying clusters of differences in human reproduction that have important implications for understanding the decline of fertility within Cairo and the spread of that decline throughout the remainder of Egypt. Key Words: Fertility transition, geographic information systems (GIS), Spatial analysis, Cairo, Egypt. Cities T he history of fertility transitions is almost uni- versally a picture of fertility declining first in cities, with a later spread to rural areas (Sharlin 1986). are places where different bundles of ideas come together about how human society should be organized, and since humans are inherently social creatures, these ideas are more likely to be shared and acted upon when there are more rather than fewer people. It would not be unfair to apply a core–periphery framework to this pattern. The cities, as the dominant core regions, set the agenda, and the periphery eventually follows suit. Some of the reasons for this can perhaps be captured by the blended perspective on the fertility transition, which combines elements of the supply-demand framework and diffusion theory (see, for example, Cleland 2001; Lesthaeghe and Surkyn 1988). The higher densities and nonagricultural economies of urban places generally serve to reduce the demand for children, and with fewer children to deal with, women, in particular, are better able to improve their educational levels, participate more fully in the paid labor force, and become financially more independent, all of which provide additional incentives to limit the level of reproduction. Over time, the ideational changes that occur in the context of the shifting demand for children is theorized to spread outward from the city. Throughout the world, this can occur very quickly as a result of improved communication and transportation that allow the routine and rapid transfer of people and ideas between the urban core and the rural periphery. A decline in mortality, especially among infants, has been a widespread, albeit not universal, precursor to a drop in the demand for children, since it increases the supply beyond that with which families can easily cope. This is the essence of Kingsley Davis’s theory of demographic change and response (Davis 1963). Yet, we have to recognize that birth rates were low in cities even before mortality de- clined. In fact, when the now industrialized nations were beginning to urbanize, death rates were higher in the city than in the countryside (Landers 1993; Williams and Galley 1995). Davis (1973) estimated that in Stockholm in 1861–1870, the average life expectancy at birth was only 28 years, whereas for Sweden as a whole, at that time, life expectancy was 45 years. Despite the high mortality, fertility in European cities was lower than in rural areas, and lower than the death rate, so that cities would have depopulated without a constant influx of migrants from the countryside. John Graunt, in the seventeenth century, concluded that London marriages were less fruitful than those in the country because of ‘‘the intemperance in feeding, and especially the Adulteries and Fornications, supposed more frequent in London than elsewhere . . . and . . . the minds of men in London are more thought- ful and full of business than in the Country’’ (quoted by Eversley 1959, 38). In Paris in the 19th century, there was an increase in the percentage of women working outside the home (especially among middle class artisans and shopkeepers). A woman with a baby who wished to continue working had to hire a wet nurse, but most wet Annals of the Association of American Geographers, 94(1), 2004, pp. 74–93 r 2004 by Association of American Geographers Initial submission, August 2002; revised submission, April 2003; final acceptance, June 2003. Published by Blackwell Publishing, 350 Main Street, Malden, MA 02148, and 9600 Garsington Road, Oxford OX4 2DQ, U.K.
Transcript of The Fertility Transition in Egypt: Intraurban Patterns in Cairo

The Fertility Transition in Egypt:Intraurban Patterns in Cairo
John R. Weeks,* Arthur Getis,** Allan G. Hill,***M. Saad Gadalla,* and Tarek Rashed****
*International Population Center, Department of Geography, San Diego State University**Department of Geography, San Diego State University
***Center for Population and Development Studies, Harvard School of Public Health, Harvard University****Department of Geography, University of Oklahoma
Fertility transitions are historically thought to have started in cities and then spread to the rest of the country. Thiswould suggest that in Egypt wewould find that Cairo was well ahead of the rest of the nation in its fertility transition.The data suggest otherwise and highlight the fact that many parts of Cairo are still experiencing high levels offertility. Population geographers have generally examined differences only between urban and nonurban areas, butincorporating census tract level data from the 1996 and 1986 censuses of Egypt into a geographic informationsystem, we are able to show that there are substantial intraurban geographic variations in fertility within the greaterCairo area. These spatial patterns are indicative of underlying clusters of differences in human reproduction thathave important implications for understanding the decline of fertility within Cairo and the spread of that declinethroughout the remainder of Egypt. Key Words: Fertility transition, geographic information systems (GIS), Spatialanalysis, Cairo, Egypt.
CitiesT
he history of fertility transitions is almost uni-versally a picture of fertility declining first in cities,with a later spread to rural areas (Sharlin 1986).are places where different bundles of ideas come
together about how human society should be organized,and since humans are inherently social creatures, theseideas are more likely to be shared and acted upon whenthere are more rather than fewer people. It would not beunfair to apply a core–periphery framework to this pattern.The cities, as the dominant core regions, set the agenda,and the periphery eventually follows suit. Some of thereasons for this can perhaps be captured by the blendedperspective on the fertility transition, which combineselements of the supply-demand framework and diffusiontheory (see, for example, Cleland 2001; Lesthaeghe andSurkyn 1988). The higher densities and nonagriculturaleconomies of urban places generally serve to reduce thedemand for children, andwith fewer children to deal with,women, in particular, are better able to improve theireducational levels, participate more fully in the paid laborforce, and become financially more independent, all ofwhich provide additional incentives to limit the levelof reproduction. Over time, the ideational changes thatoccur in the context of the shifting demand for children istheorized to spread outward from the city. Throughout theworld, this can occur very quickly as a result of improvedcommunication and transportation that allow the routineand rapid transfer of people and ideas between the urbancore and the rural periphery.
A decline in mortality, especially among infants, hasbeenawidespread, albeit not universal, precursor to a dropin the demand for children, since it increases the supplybeyond thatwithwhich families can easily cope.This is theessence of Kingsley Davis’s theory of demographic changeand response (Davis 1963). Yet, we have to recognize thatbirth rates were low in cities even before mortality de-clined. In fact, when the now industrialized nations werebeginning to urbanize, death rates were higher in the citythan in the countryside (Landers 1993; Williams andGalley 1995). Davis (1973) estimated that in Stockholmin 1861–1870, the average life expectancy at birth wasonly 28 years, whereas for Sweden as a whole, at that time,life expectancy was 45 years. Despite the high mortality,fertility in European cities was lower than in rural areas,and lower than the death rate, so that cities would havedepopulated without a constant influx of migrants fromthe countryside. JohnGraunt, in the seventeenth century,concluded that London marriages were less fruitful thanthose in the country because of ‘‘the intemperance infeeding, and especially the Adulteries and Fornications,supposed more frequent in London than elsewhere . . .and . . . the minds of men in London are more thought-ful and full of business than in the Country’’ (quoted byEversley 1959, 38). In Paris in the 19th century, there wasan increase in the percentage of women working outsidethe home (especially among middle class artisans andshopkeepers). A woman with a baby who wished tocontinue working had to hire a wet nurse, but most wet
Annals of the Association of American Geographers, 94(1), 2004, pp. 74–93 r 2004 by Association of American GeographersInitial submission, August 2002; revised submission, April 2003; final acceptance, June 2003.
Published by Blackwell Publishing, 350 Main Street, Malden, MA 02148, and 9600 Garsington Road, Oxford OX4 2DQ, U.K.

nurses were peasant women who lived in the countryside.Thus, a mother would have to give up the child for severalmonths if shewished to keepworking. Infantmortalitywasas high as 250deaths per 1,000 infants among those placedwith wet nurses (Sussman 1977), yet in the early 1800snearly one fourth of all babies born in Paris were placedwith wet nurses. Infants were a bother, and the risk wasworth taking.
Cities are also the places where innovations of everykind are apt to bediscovered and/or accepted and incorpo-rated into society through the processes of diffusion.London has for centuries been the source of inspiration offashion of all kinds for the rest of England (Wrigley 1987),and it was inNewYorkCity that Italian immigrant womenfound out how middle class American women kept theirfamilies small (Sanger 1938).Cities epitomize the environ-ment in which elements of rational choice (the trade-offbetween the supply of and demand for children) intersectand interact with the diffusion of innovations (methods offertility control) to keep fertility low. From this urban plat-form, the innovations of fertility regulationwithinmarriagemay diffuse to the rest of the population, especially, as inthe past few decades, when mortality has been decliningrapidly among bothurban and rural populations and so thesupply of children has been rapidly increasing, whereasthe demand for children has not (Cleland 2001).
Cities in developing countries, especially in Africa andwestern Asia, have fertility levels that are probably higherthaneverexperienced inEuropeancities.Data fromDemo-graphic and Health Surveys in developing countries inthe 1990s show total fertility rates (TFRs) in urban areasin 16 surveys that are above 5.0 and an additional 14surveys in which urban areas have TFRs between 4.0 and4.9. Without exception, the countries with urban TFRsof 4.0 or above are in sub-Saharan Africa or western Asia.When we say that cities undergo a fertility transition,however, we must recognize that it is people, not cities,who bear children. Different cultural patterns may yielddifferent levels of fertility between and, as we will see,within urban places. The overwhelming majority ofstudies in the literature that examine fertility by regiondo so on the basis of a simple urban–rural dichotomy, asthough somehow there was spatial uniformity of fertilitywithin urban areas and within rural areas and the dif-ferences between the two represented the only elementof analytical interest. Yet, it has already been shown thatthere are important variations in fertilitywithin rural areasin Egypt (Weeks et al. 2000), and in this paper we askwhether the urban areas also exhibit predictable patternsof spatial variation in this regard.
We cannot therefore understand the fertility transitionin any country by simple reference to urban places as the
source of low fertility (nor to rural areas as the source ofhigh fertility). We have to ask why, and under whatconditions, urban residents choose to limit their fertility.This calls for a perspective that is as much cultural innature as it is economic. It is not enough to suggest, forexample, that the participation of females in the paid laborforce (an economic perspective) is typically associatedwith lower levels of fertility. We have to ask why thisconnection would exist—what would lead women tobecome involved in the paid labor forcewhen theyhadnotpreviously been so engaged (a cultural perspective) andthen ask how that decision influences, or is influenced by,the number of children that they decide to have. Indeed,we even have to ask, as Coale did many years ago (Coale1973), what it is that influences women to think ofthemselves as the decision makers with respect to humanreproduction. These questions are at the heart of theconcept of culture, which we define as the manifestationof the way in which we humans solve the problems ofeveryday life and transmit those solutions to other peopleand subsequent generations through the teaching/learn-ing process. What do we eat and how do we eat it? Howand with what do we protect ourselves from nature andpredators? How do we organize our lives to minimize riskand maximize satisfaction?
If we accept this idea of culture, then we can see thatculture is bound to be highly spatial in its nature because itis easier to copy than to invent (the essence of diffusion)and people are likely to copy solutions to their problemsfrom neighbors: the fewer and the less diverse yourneighbors, the fewer options you have from which tochoose. The city is the fount of innovation, including thatwith respect to human reproduction, precisely because itbrings together a greater diversity of people and theirdifferent solutions to life’s problems than will typicallyexist in a small rural village. In the latter places, it is muchmore likely that a group’s solutions will become reified—perhaps justified as having been derived from a super-natural power or thought of as having been inheritedgenetically. This promotes resistance to change, includingchange in family structure, gender relations, and repro-ductive behavior.
But even within a city, the social context will vary fromplace to place, in a pattern thatmight be called intraurbanecology, borrowing from a growing body of research inintraorganizational ecology (for a review, see Galunic andWeeks 2001; Weeks and Galunic 2003). This idea is alsocaptured by the concept of environmental context, whichsuggests that the community within which you live willinfluence your behavior because we are social creatureswho respond to the behavioral cues of people around us.Gladwell has called this the Power of Context, which
Fertility Transition in Egypt: Intraurban Patterns in Cairo 75

powerfully shapes our lives: ‘‘the streets we walk down,the people we encounter—play a huge role in shapingwho we are and how we act’’ (Gladwell 2000, 167).
If the fertility transition within cities is a culturalphenomenon, then places where fertility is clustered atlow levels ought to represent those parts of the city thatare most heavily modernized—places where women aredelayingmarriage, becomingmore educated, and enteringthe labor force in greater numbers, in response to newwaysof thinking about theworld in a social environment that atleast permits, if not encourages, these innovative approa-ches to the changing circumstances. As Kohler (2001,183) has put it, ‘‘Demographic behavior is associated withexternalities that renders the adoption of low fertility byone couple dependent on the contemporaneous fertilitybehavior of other community members. . . . [The extern-alities] arise because the adoption of low fertility by someparents contributes to the erosion of traditional norms orpressures to conform. They occur because the diffusion ofinformation is a path-dependent process and the choicesof early adopters influence the availability of informationfor later decision makers.’’
Women in more innovative areas may potentially berole models for those in other parts of the city wherefertility remains high, unless of course there are relativelylimitedmeans of communications between areas or groupsof people. If the communication and transportationinfrastructure has not kept pace with urban populationgrowth, an already large city can seem even larger dueto the difficulty of traversing from one part of town toanother. Furthermore, we might expect that areas popu-lated by migrants from rural places, and/or areas withhigher concentrations of peoplewhoholdmore traditionalreligious perspectiveswill be places inwhichpeoplemaybeactively discouraged from seeking new solutions to theirproblems. To the extent that this is so, these would beplaces where fertility would be expected to be highest andwherewomen’s participation in extrafamilial activities willbe most limited. This perspective posits that the socialand physical environment in which people live and workrepresents an important part of the broader matrix ofnetworks by which change (e.g., the diffusion of innova-tions) is explained (see, for example, Kohler 2001; Kohler,Behrman, and Watkins 2001). Thus, one way to thinkabout the spatial contextualization of reproductive deci-sions relates to the way in which social networks mayhelp or hinder the spread of innovations—be theyideational (people’s ideas about family size) or techno-logical (people’s ability to control family size). Carley(2001), in discussing the diffusion of ideas about familysize and contraceptive behavior, has argued that spatialfactors that influence who interacts with whom can
give rise to locally consistent patterns of shared attitudes,meanings, and beliefs (194). Following Burt’s (1992)concept of structural holes (built on Granovetter’s [1973]notion of the strength of weak ties), we would expect thatstrong family structures, even within a city environment,would create fewer structural holes in the lives of familymembers, thus reducing the chance of having the kinds ofweak ties that encourage innovation. From this perspec-tive, we would hypothesize that neighborhoods domina-ted by dense and complex family relationships would beunlikely to be among the early participants in a city’sfertility transition. We would expect this influence tooperate especially through themechanism of gender roles.
We argue then that spatial patterns are importantbecause they offer clues to underlying causes and potentialconsequences of behavior. As Weeks (2003a) has noted,there is very little attention given in the literature tothe social causes and consequences of fertility trends at thelocal level. It might be argued that these spatial patternsare obvious, but this is a testable hypothesis that has not, infact, been tested in the literature. Rather, the emphasisin the literature has been on examining fertility at theindividual level, using data from surveys that by and largedo not permit a neighborhood analysis. These studies, ofnecessity, focus attention on national comparisons or onregional differences within a country. We suggest that theintraurban ecology—the local, within-city, place-to-placevariations—may hold the key to understanding thefertility transitions that occur among urban populations,and thus to a better understanding of how it is that lowfertility is accomplished beyond the city. There can belittle doubt that national and regional events affectfertility levels regardless of where a person lives (see, forexample, Fargues 1997) and that events outside an areacan therefore be instrumental in producing change at thelocal level (Courbage 1994). These ideational changesmay have less spatial dependence than other forms ofinfluence, but the extent to whichmessages are heard andinterpreted in a particular way, and thus the extent towhich they ultimately affect behavior, may be closelyrelated to the local environmental context. It is our viewthat the lack of literature on intraurban patterns of humanreproduction is not due to a lack of interest in the subject,nor to the belief that somehow such results are trivial, butrather to the limited ability to conduct such an analysisprior to the recent technological developments in the fieldof geographic information science.
It is well known that cities may take on any of a widevariety of spatial patterns with respect to where people ofdiffering social classes might live. (Knox 1994; Macionisand Parrillo 1998). In general, these patterns can be classi-fied as being consistent with concentric zones, sectors, or
Weeks et al.76

multiple nuclei models. To the extent that (a) residentialsegregation exists by social class and (b) social classdetermines fertility, these residential patterns will define acity’s spatial pattern of reproduction. It has been knownfor centuries that fertility tends to be lower in the highersocial classes. Adam Smith observed in the Wealth ofNations that ‘‘Barrenness, so frequent among womenof fashion, is very rare among those of inferior station.Luxury in the fair sex,while it inflames perhaps the passionfor enjoyment, seems always to weaken, and frequently todestroy altogether, the powers of generation’’ (Smith 1776,Book 1, viii.37). If social class determines both where youlive and how many children you have, then the spatialcomponent of reproduction will be explained completelyby social status. If social class does not determine resi-dence, but does determine levels of reproduction, thenwewould not expect to find a spatial pattern to fertility.Similarly, if social class determines residence but is notpredictive of fertility, then again we would not expect tofind a spatial pattern to fertility, at least not one that wasassociated with social status per se.
Our hypothesis in this research is that fertility levels aredetermined partly by social class, measured by humancapital variables such as education, labor force participa-tion, and occupation. We expect that this determinant offertility will have a spatial component, but that the spatialcomponent will be explained by residential separation interms of social class. However, we also hypothesize thatthere is a distinctly spatial component to fertility levelsthat is independent of social class or human capitalvariables. This is what has been called the neighborhoodor environmental context effect on demographic behavior(Weeks 2003a). Because humans are inherently socialcreatures, we are influenced in our behavior by the peoplewithwhomwecome into contact andwithwhomwe inter-act. While much of that interaction may occur in placesother than where we live, it is also likely that some of themost intensive and persuasive influences will in fact occurin the context of the local area in which we reside. Thiseffect is a result of the networking and connectivity ofhumans, and of the diffusion of ideas and behavior (or thestifling of such innovation—social control) that occursamong people sharing the same physical space, regardlessof their social class or human capital characteristics. Wehypothesize that this influence on levels of reproductionwill be spatially dependent and will index unmeasuredattributes of the neighborhood that affect fertility inde-pendently of the social status of neighborhood inhabi-tants.More formally, themodels thatwe test are as follows:
1. Fertility at time t5 fn {social class1neighborhoodcontext}
2. Fertility at time t1n5 fn {social class1neighbor-hood context}
3. D Fertility from time t to t1n5 fn{D social class1D neighborhood context}.
Within cities of developing nations, then, we expect todiscover distinct spatial clusterings of high and lowfertility, of declining and not declining fertility levels. Aportion of this clustering will be due to the effect of resi-dential patterns by social class, but another portion will beindependent of human capital factors and will be due towhat we have called neighborhood context. Changes inboth of these sets of factors can be expected to influencethe change in fertilityover time.Furthermore, to the extentthat cities differ in their fertility transition, their impact onthe fertility transition in the peripheral areas, and on thenation as a whole, may also differ. In other words, the typeof fertility transition taking place within an urban area ishypothesized todetermine the influence that a givenurbanarea will have on fertility levels beyond the metropolitanboundaries. This paper, then, tests hypotheses aboutspatial dependence in the levels of human reproductionwithin cities of developing countries. We test these hypo-theses with data from Cairo, Egypt, and then discuss howthis perspective helps us better to understand the broaderpatterns of the fertility transition in developing nations.
The Fertility Transition in Egypt and in Cairo
Egyptbegan the20thcenturywith10millionpeople andended it with almost 70 million. United Nations projec-tions suggest that the population will exceed 127 millionby 2050 (UnitedNations PopulationDivision2003).Mostof the increase has taken place since the end ofWorldWarII, with a rapid decline inmortality, unaccompanied at firstby any noticeable decline in fertility. Prior toWorldWar II,more than 250 out of every 1,000 Egyptian infants diedbefore reaching their first birthday (Bucht and El-Badry1986; Fargues 2000), but since the late 1940s, the infantmortality rate has dropped quite steadily, down to thecurrent level in which about 40 in 1,000 die beforeage one.
For at least 20 years this decline in mortality was notmatched by a drop in birth rates. Data from the WorldFertility Survey suggest that the total fertility rate for allof Egypt was 7.1 in the early 1960s, and even in themetropolitan areas (Cairo and Alexandria combined),the TFR in the 1960–1965 period was 5.9 (InternationalStatistical Institute 1983). Abu-Lughod (1965) used datafrom the 1960 census to show that women in Cairo whohad been married for 30 or more years had averaged8.1 live births.At the same time, therewas a clear negative
Fertility Transition in Egypt: Intraurban Patterns in Cairo 77
relationship between education and fertility, so thatilliterate women in Cairo averaged 8.4 live births after30 or more years of marriage, compared to 3.9 live birthsfor women who had at least completed high school. Sheconcluded that the major proximate determinant of thesedifferences was age at marriage, and this conclusion wasechoed in the findings from the 1980 Egyptian FertilitySurvey (the Egyptian implementation of the WorldFertility Survey).
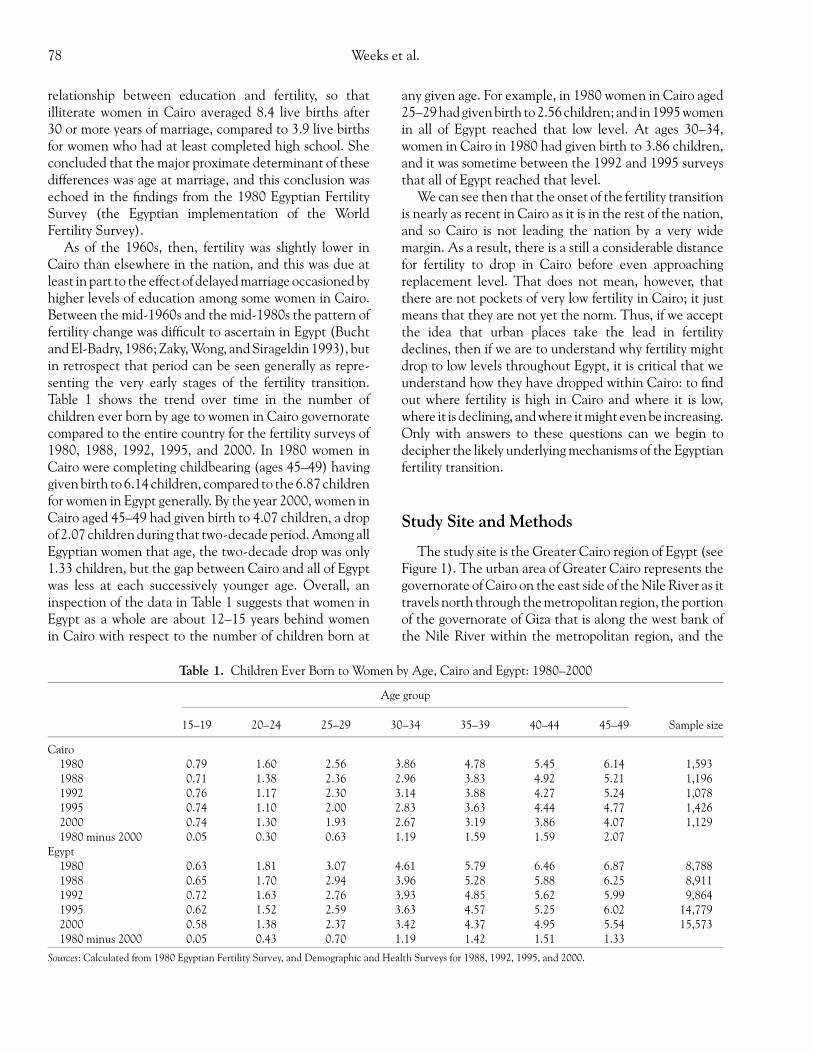
As of the 1960s, then, fertility was slightly lower inCairo than elsewhere in the nation, and this was due atleast in part to the effect of delayedmarriage occasioned byhigher levels of education among some women in Cairo.Between the mid-1960s and the mid-1980s the pattern offertility change was difficult to ascertain in Egypt (BuchtandEl-Badry, 1986;Zaky,Wong, andSirageldin1993), butin retrospect that period can be seen generally as repre-senting the very early stages of the fertility transition.Table 1 shows the trend over time in the number ofchildren ever born by age to women in Cairo governoratecompared to the entire country for the fertility surveys of1980, 1988, 1992, 1995, and 2000. In 1980 women inCairo were completing childbearing (ages 45–49) havinggivenbirth to 6.14children, compared to the6.87childrenfor women in Egypt generally. By the year 2000, women inCairo aged 45–49 had given birth to 4.07 children, a dropof 2.07 children during that two-decade period.Among allEgyptian women that age, the two-decade drop was only1.33 children, but the gap between Cairo and all of Egyptwas less at each successively younger age. Overall, aninspection of the data in Table 1 suggests that women inEgypt as a whole are about 12–15 years behind womenin Cairo with respect to the number of children born at
any given age. For example, in 1980 women in Cairo aged25–29hadgivenbirth to2.56children; and in1995womenin all of Egypt reached that low level. At ages 30–34,women in Cairo in 1980 had given birth to 3.86 children,and it was sometime between the 1992 and 1995 surveysthat all of Egypt reached that level.
We can see then that the onset of the fertility transitionis nearly as recent in Cairo as it is in the rest of the nation,and so Cairo is not leading the nation by a very widemargin. As a result, there is a still a considerable distancefor fertility to drop in Cairo before even approachingreplacement level. That does not mean, however, thatthere are not pockets of very low fertility in Cairo; it justmeans that they are not yet the norm. Thus, if we acceptthe idea that urban places take the lead in fertilitydeclines, then if we are to understand why fertility mightdrop to low levels throughout Egypt, it is critical that weunderstand how they have dropped within Cairo: to findout where fertility is high in Cairo and where it is low,where it is declining, andwhere itmight evenbe increasing.Only with answers to these questions can we begin todecipher the likely underlyingmechanisms of the Egyptianfertility transition.
Study Site and Methods
The study site is the Greater Cairo region of Egypt (seeFigure 1). The urban area of Greater Cairo represents thegovernorate of Cairo on the east side of theNile River as ittravels north through themetropolitan region, the portionof the governorate of Giza that is along the west bank ofthe Nile River within the metropolitan region, and the
Table 1. Children Ever Born to Women by Age, Cairo and Egypt: 1980–2000
15–19
Age group
Sample size20–24 25–29 30–34 35–39 40–44 45–49
Cairo198019881992199520001980 minus 2000
Egypt198019881992199520001980 minus 2000
0.790.710.760.740.740.05
0.630.650.720.620.580.05
1.601.381.171.101.300.30
1.811.701.631.521.380.43
2.562.362.302.001.930.63
3.072.942.762.592.370.70
3.862.963.142.832.671.19
4.613.963.933.633.421.19
4.783.833.883.633.191.59
5.795.284.854.574.371.42
5.454.924.274.443.861.59
6.465.885.625.254.951.51
6.145.215.244.774.072.07
6.876.255.996.025.541.33
1,5931,1961,0781,4261,129
8,7888,9119,864
14,77915,573
Sources: Calculated from 1980 Egyptian Fertility Survey, and Demographic and Health Surveys for 1988, 1992, 1995, and 2000.
Weeks et al.78

southern portion of the governorate of Qalyubia, just tothe north of Cairo. The United Nations estimates thepopulation of the Cairo metropolitan area to have been9.5million as of the year 2000 (UnitedNations 2002).Ourstudy area represents data for 299 shiakhas (equivalent tocensus tracts) in the Greater Cairo area. El-Batran (1997)notes that the shiakha has traditionally been viewed inEgypt as the equivalent of a neighborhood—a place witha social identity where services to the population wereprovided through local resources. The census is the onlyavailable source of population data at the local level ofgeography in Egypt, and the amount of informationavailable from the census in Egypt is somewhat limited.However, we have been able to use spatial analytictechniques in conjunction with Demographic and HealthSurvey (DHS) data to improve the depth of our findings.We utilize data from the 1986 and 1996 censuses in Egypt,relying upon indirect measures of fertility derived fromthe age structure. Our study site had an unadjustedpopulation count of 8.4 million in the 1996 census, so itrepresents most of the population within Greater Cairo.
The first question to be dealt with is with regard to theaccuracy of the age and sex structure. We have usedinformation from the 1995 Demographic and HealthSurvey in Egypt, as well as vital statistics for the years1995–1997 for Greater Cairo as sources of data againstwhich to compare the results of the 1996census, especially
at the youngest ages. The 1995 DHS included 1,613households from 41 different shiakhas in our greater Cairostudy site. From the household listing in theDHSwewereable to reconstruct the age and sex structure as reportedfor each household, representing a sample householdpopulation in Cairo in the 1995 DHS of 7,721 persons.The age groups that are of importance for estimatingfertility are children aged 0–4 and women of reproductiveage (15–49), so we focused attention on those age andsex categories, but especially on the youngest age group,which is notoriously the least well enumerated. Weassumed that the experienced interviewers of the DHSwere likely to obtain more accurate information thanwould have been obtained by enumerators in the census,so we assumed that if the census age distribution showed asmaller percentage of children than the DHS, then thatwas evidence of underenumeration in the census.
We did not assume that underenumeration, if it exists,would be spatially uniform. The size of the DHS samplepermitted us to disaggregate the household listings bygovernorate within Greater Cairo, of which there arethree—Cairo, Giza, andQalyubia. For smaller areal units,the sample size was too small to yield useful comparisonswith the census.Comparing theDHSagedistributionwiththe census age distribution led to the conclusion that in1996children aged0–4were24percentunderenumeratedinCairo governorate, and 16 percent underenumerated in
10 Kilometers
AirportAirport
HeliopolisHeliopolis
0 5
Zaytun al-GharbiaZaytun al-Gharbia
ImbabaImbaba
ZamalekZamalek
GizaGiza
SayyidaSayyidaZaynabZaynab
Darb al-AhmarDarb al-Ahmar
Manshiat NassirManshiat Nassir
Talaat Harb SquareTalaat Harb SquareCentral CairoCentral Cairo
al-Waylial-WayliShubraShubra
Figure 1. The study site of Greater Cairo, Egypt.
Fertility Transition in Egypt: Intraurban Patterns in Cairo 79

Giza governorate. In Qalyubia governorate, there wasnot a statistically significant level of underenumeration.
We were also able to draw upon vital statistics data toevaluate underenumeration.Wehave data on the numberof live births by qism (the aggregation of shiakhas) forGreater Cairo for the years 1995 through 1997. We tookthe average of those three years, multiplied it by five, andthen applied survival ratios from life tables for Cairo(described below) to estimate the population aged 0–4that would be implied by those data on live births, andthen we compared that number with the data from thecensus. Again, we compared data at the governorate levelwithin Greater Cairo. The results are nearly identical tothe comparisons with the DHS data, in that we found a24 underenumeration of children 0–4 in Cairo, a 19percent underenumeration in Giza, and no statisticallysignificant underenumeration in Qalyubia.
We have therefore adjusted the census figures in eachshiakha in Cairo governorate to reflect a 24 percentunderenumeration of children aged 0–4. For the shiakhasin Giza governorate, census data were adjusted upward atage 0–4 to reflect a 17.5 percent underenumeration (theaverage of the DHS and vital statistics estimates), and noadjustment was made for shiakhas in Qalyubia governor-ate. Our adjustment for underenumeration is consistentwith the concern that existed on the part of the Egyptiangovernment,whichwithheld release of data from the 1996census for more than two years, at least in part becauseof concern about the apparent undercount (Sutton andFahmi 2001).
We also conducted a similar comparison of the 1986census data at the youngest ages with information drawnfrom the 1988 DHS. We ignored the two-year temporalmismatch since we had no way to account for it. In 1988therewere 24 shiakhas in our study area thatwere sampledfor the DHS. They included a total of 1,451 households,fromwhichwewere able to extract age distributions basedon a total of 6,638 persons. Again we separated theshiakhas into each of the three respective governorates.However, in this comparison we found that none of thedifferences in the percentage of the population that wasaged0–4was statistically significant, and sono adjustmentfor underenumeration was made for the 1986 census.However, we did drop one shiakha—al-Mohammadi,which is in theAl-Waily qism, or district. In 1976 thiswas aslum area that was then torn down for the construction ofthe Ain Shams Hospital, essentially leaving no one to becounted in the 1986 census, and then the area was rebuiltand repopulated by 1996. Because of the lackof continuityof the population, it was dropped from the analysis.
Inorder to indirectly estimate the total fertility rate fromthe adjusted age data, we then rejuvenated the adjusted
population of girls and boys aged 0–4 from the census bydividing by the respective sex-specific survivorship rates.We tested the issue of spatial variability in infantmortalityrates by calculating infant mortality rates from the vitalstatistics. This comparison was restricted to the governor-ate level, since infant deaths, even more than live births,seem to bedisproportionately numerous in those qism thathad more hospitals, suggesting that infant deaths wereoften recorded at the address of the hospital, rather thanthe residence.The analysis didnot suggest the existence ofstatistically significant differences in infant mortality ratesamong the three constituent governorates, so no spatialadjustment was made in survivorship rates. These rateswere calculated from life tables derived from nMx datacompiled by the Cairo Demographic Center (2001). Forfemales in 1996 theprobability of survival frombirth to agefive was estimated to be 0.94350 and for males it was0.94334. The population of females of reproductive age(15–49) was then rejuvenated using the same life tabledata, applying a five-year survival probability of 0.99035.From these estimates we calculated a five-year generalfertility rate, and dividing that by five produced an esti-mate of the average single-year general fertility rate. Thisvaluewas combinedwith data on the female population byfive-year age groups in each shiakha to estimate the totalfertility rate based on empirically derived relationshipsbetween theGFR, the female population, and age-specificfertility rates, using algorithms developed by Arriaga andhis associates (Arriaga, Johnson, and Jamison 1994). For1986, we rejuvenated the population of boys aged 0–4with a survivorship ratio of .91266, and a rate of .92234for girls. The survival rate applied towomen aged 15–49 in1986 was .97887.
Using this approach, the weighted TFR for GreaterCairo in 1996 was calculated to be 2.89. We were able totest the validity of this approach to measuring fertility byapplying it to thedata derived from the1995DemographicHealth Survey for households in theGreater Cairo region.First, we used the DHS age data to indirectly estimate thetotal fertility rate for the DHS households followingthe algorithm described above, and we then comparedthat calculation with the TFR as measured directly by theresponses that women gave to the question of births inthe year preceding the DHS. Our indirect method of esti-mation, as described above, yielded aTFRof 2.92,whereasthe TFR based on the DHS responses of women to thequestion of births in the past five years produced a valueof 3.11. There is no direct way to evaluate the statisticalsignificance of these observed differences, but we judgedthe three values to be sufficiently similar to give us con-fidence in the validity of the indirectmethod ofmeasuringfertility that we are employing in our analysis.
Weeks et al.80

Spatial Variability in Fertility in Cairoin 1986 and 1996
Our calculation of the TFR in Cairo for 1996 was, asindicated above, 2.89. This represented a decline from3.47 in 1986, calculated in the same way as the data for1996. This did not represent a substantial decline, ofcourse, and it was a smaller decline than for the country asa whole. Overall, fertility in Cairo is still a considerabledistance from replacement level, but there are pocketsof below-replacement fertility, just as there are pockets ofvery high fertility. In 1986 the highest TFR registeredwithin a shiakhawas 7.40,whereas thehighest in 1996was5.84. In 1986 the lowest TFR was 1.09, and the bottomdropped to 1.00 by 1996. Figure 2 illustrates the spatialvariability in Cairo in 1996, while Figure 3 shows thepattern in 1986.
Fertility by shiakha shows an unmistakable pattern oflowest fertility in the center of Cairo in 1996 (Figure 2),with fertility increasing in a manner similar to that ofconcentric rings as onemoves out from the center. From itslowest values nearTahrir andTalaatHarbSquares, fertilityincreases with distance from the center of the older part ofthe city. In a small section of the center of the city, fertilitylevels are at below-replacement levels, but at the suburbanedge of the city, TFRs are routinely above 3.5 children perwoman. If we assume that the wealthier, better-educated,elite residents live in the city center, that they have thelowest fertility, and that social status declines and thusfertility rises in a gradient out from the city center, thenthat is at least consistent with the pattern that can beobserved in Figures 2 and 3.
On the other hand, anecdotal evidence suggeststhat the middle classes have been abandoning the centerof the city as it becomes increasingly noisy, polluted, anddegentrified (Rodenbeck 1999). These families have
moved into many of the informal settlements (see below)on the edges of the older part of Cairo (El-Batran 1997),and so, to the extent that fertility levels are influenced bysuch residential shifts, the concentric ring patternmaynotrepresent our expectations. We test these propositionsin the analysis described below.
The pattern in 1986 (Figure 3) is similar to that in 1996,with a general replication of the concentric ring picture,but with higher fertility levels in most places in 1986 thanin 1996. In 1986 there is a more obvious dichotomybetween the lower fertility in the older parts of Cairoand the considerably higher levels of fertility in thenewer suburbs,whichare heavily characterizedby informalsettlements. The change in fertility between the two cen-suses can be anticipated by the patterns in Figures 2 and 3and, indeed, Figure 4 shows that the most rapid rateof decline tended to be in the more suburban areas,whereas most of the older, central portion of Cairo wasexperiencing either no change or even a slight rise infertility levels.
Without question, the fertility transition is taking placeunevenly within the Cairo metropolitan area. The centerof the city is where fertility remained low (typically belowthe replacement level) between 1986 and 1996. This arearepresents essentially an axis from the older parts of Giza(to the west of the Nile), through downtown Cairo, andout toward the airport (which is just beyond our study sitein the northeast section). Scattered throughout this area,however, are neighborhoods that experienced rapiddecline in fertility between 1986 and 1996. The area justbeyond the city center tended to experience more rapiddeclines in fertility— keeping in mind that most of theseareas nonetheless had fertility levels that were still wellabove replacement in 1996. These areas include the well-known popular quarters ofManshiat Nassir on the eastern
TFR 1996
less than 2
2.00 - 2.49
2.50 - 2.99
3.00 - 3.49
3.50 - 3.99
4 or more
Figure 2. Spatial variability in fertility in Greater Cairo, 1996.
TFR 1986
less than 2
2.00 - 2.49
2.50 - 2.99
3.00 - 3.49
3.50 - 3.99
4 or more
Figure 3. Spatial variability in fertility in Greater Cairo, 1986.
Fertility Transition in Egypt: Intraurban Patterns in Cairo 81

edge of the city, and the Imbaba slum area on theGiza sideof the Nile to the northwest of downtown Cairo. As al-ready noted, however, therewere pockets inwhich fertilitydid not drop—in fact, increased—during that intercensalperiod. This pattern is especially noticeable in the SayyidaZeiynab area which, although a well-established neigh-borhood, has taken onmany characteristics of an informalarea (Bayat 1997). Between 1986 and 1996, fertility levelsincreased in 12 of the 15 shiahkas that comprise the qismof Sayyida Zeiynab. The qism of Darb Al-Ahmar, whichis adjacent and to the northeast of Sayyida Zeiynab, isthe othermajor neighborhood experiencing an increase infertility. Between 1986 and 1996 11 of Darb Al-Ahmar’s14 shiakhas increased their TFRs.
The pattern of change in fertility between 1986 and1996 is consistent with the idea that the middle classeswere vacating the inner areas (leading to a stop in the dec-line of fertility in those places) and moving into the moresuburban areas (perhaps leading the fertility decline inthose places). Furthermore, some of the areas near thecenter of Cairo have been increasingly transformed intoinformal settlements, with the potential for higher fertility.If these interpretations are correct, then any diffusion oflow fertility norms in Cairo would have to be explainedby relocation factors (lower fertility couples moving todifferent parts of the city) as well as by contagion factors(those couples influencing fertility norms in their newlocation and the couples left behind in the old locationhaving a potentially opposite effect).
We can use the Gi(d) statistic (Getis and Ord 1996,1992; Ord and Getis 1995) to evaluate the contagioneffect between 1986 and 1996 around those places thathad the lowest fertility inCairo in 1986.TheGi(d) statisticindicates the extent to which a location (i) is surroundedby a cluster of highor lowvalues.The statistic incorporatesa symmetric one/zero spatial weight matrix, with ones for
all links (j) defined as being within distance (d) of a given(i), excluding (i), and all other links are zero. Distance ismeasured between the centroids of the polygons (in thiscase the geographic center of each shiakha). In its originalform (Getis andOrd 1992) the numerator of the statistic isthe sum of all x(j) within (d) of (i), while the denominatoris the sum of all x(j). The null hypothesis is that there isno association between the value found at site (i) andits neighbors within a specified distance (d). When thestatistic is treated as a standard normal deviate, the ex-pectedvalueunder thenull hypothesis is 0,with a varianceof 1 (Ord and Getis 1995). Positive values of Gi(d) thatexceed a z-score of 1.96 (the .05 level of statistical signi-ficance) indicate spatial associationofhighvalues,whereasnegative values of Gi(d) that are less than � 1.96 indicatespatial association of low values. An increase between1986 and 1996 in the distance at which Gi(d) peakedaround a site (i) would be consistent with a pattern ofdiffusion around that neighborhood.
We calculated this statistic for the lowest fertilityshiakhas in 1986 to see if the distance at which clusteringpeaked changed between 1986 and 1996. Qasr al-Nilis the area (qism) at the heart of the elite portion ofolder Cairo, and in both 1986 and 1996 it registered thelowest levels of fertility in Greater Cairo. Its four shiakhasinclude Ismailiyya, Ma’ruf, Qasr al-Dubara, and GardenCity, and institutions such as the American Embassy andthe American University in Cairo are within this qism.In 1986 (and again in 1996) each of these four neighbor-hoods had TFRs that were below replacement level.In 1986 the value ofGi(d) peaked at 5,000meters for threeof the four neighborhoods and at 6,000 for the fourth(Garden City). In 1996, the peak distance remainedat 5,000 for two of the four, but actually declined forthe other two, indicating no increase in the patternof clustering between 1986 and 1996. We interpretthis to mean that there is no evidence that low fertilitynorms were diffusing from the low fertility area of Qasral-Nil to other parts of the city during this period oftime.
Quantifying the Spatial Componentin Fertility in Cairo
Our goal, analytically, is to decompose the variabilityin fertility in Greater Cairo across space and over timeinto that part that is attributable to human capital/socialclass factors that are only incidentally associated withlocational attributes, and that part that is specificallyspatial because it is associated with characteristics of thelocal neighborhood context. The variables in the analysis
TFRPercent Change1986 - 96
−50 - −40
−39 - −30
−29 - −20
−19 - −10
−9 - 0
1 - 84
Figure 4. Changes in fertility in Greater Cairo, 1986 to 1996.
Weeks et al.82
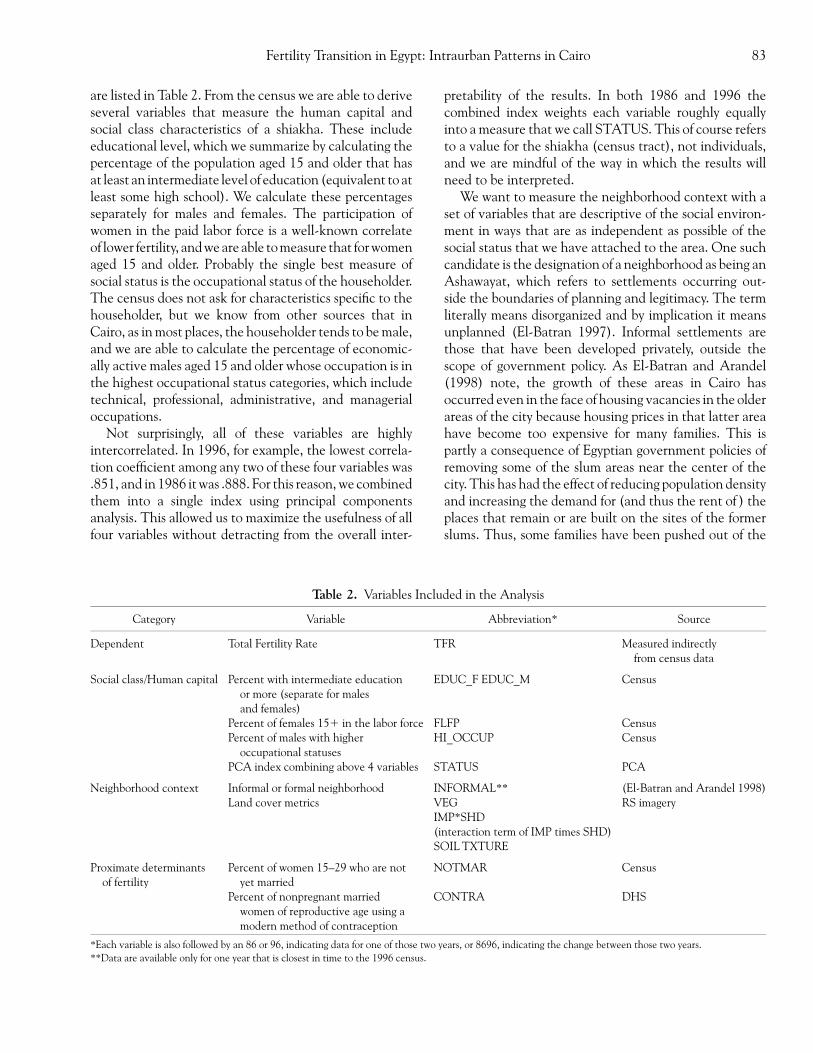
are listed in Table 2. From the census we are able to deriveseveral variables that measure the human capital andsocial class characteristics of a shiakha. These includeeducational level, which we summarize by calculating thepercentage of the population aged 15 and older that hasat least an intermediate level of education (equivalent to atleast some high school). We calculate these percentagesseparately for males and females. The participation ofwomen in the paid labor force is a well-known correlateof lower fertility, andweareable tomeasure that forwomenaged 15 and older. Probably the single best measure ofsocial status is the occupational status of the householder.The census does not ask for characteristics specific to thehouseholder, but we know from other sources that inCairo, as inmost places, the householder tends to bemale,and we are able to calculate the percentage of economic-ally active males aged 15 and older whose occupation is inthe highest occupational status categories, which includetechnical, professional, administrative, and managerialoccupations.
Not surprisingly, all of these variables are highlyintercorrelated. In 1996, for example, the lowest correla-tion coefficient among any two of these four variables was.851, and in 1986 itwas .888. For this reason,we combinedthem into a single index using principal componentsanalysis. This allowed us to maximize the usefulness of allfour variables without detracting from the overall inter-
pretability of the results. In both 1986 and 1996 thecombined index weights each variable roughly equallyinto a measure that we call STATUS. This of course refersto a value for the shiakha (census tract), not individuals,and we are mindful of the way in which the results willneed to be interpreted.
We want to measure the neighborhood context with aset of variables that are descriptive of the social environ-ment in ways that are as independent as possible of thesocial status that we have attached to the area. One suchcandidate is the designation of a neighborhood as being anAshawayat, which refers to settlements occurring out-side the boundaries of planning and legitimacy. The termliterally means disorganized and by implication it meansunplanned (El-Batran 1997). Informal settlements arethose that have been developed privately, outside thescope of government policy. As El-Batran and Arandel(1998) note, the growth of these areas in Cairo hasoccurred even in the face of housing vacancies in the olderareas of the city because housing prices in that latter areahave become too expensive for many families. This ispartly a consequence of Egyptian government policies ofremoving some of the slum areas near the center of thecity. This has had the effect of reducing population densityand increasing the demand for (and thus the rent of ) theplaces that remain or are built on the sites of the formerslums. Thus, some families have been pushed out of the
Table 2. Variables Included in the Analysis
Category Variable Abbreviation* Source
Dependent
Social class/Human capital
Neighborhood context
Proximate determinantsof fertility
Total Fertility Rate
Percent with intermediate educationor more (separate for malesand females)
Percent of females 151 in the labor forcePercent of males with higher
occupational statusesPCA index combining above 4 variables
Informal or formal neighborhoodLand cover metrics
Percent of women 15–29 who are notyet married
Percent of nonpregnant marriedwomen of reproductive age using amodern method of contraception
TFR
EDUC_F EDUC_M
FLFPHI_OCCUP
STATUS
INFORMAL**
VEGIMP*SHD(interaction term of IMP times SHD)SOILTXTURE
NOTMAR
CONTRA
Measured indirectlyfrom census data
Census
CensusCensus
PCA
(El-Batran and Arandel 1998)RS imagery
Census
DHS
*Each variable is also followed by an 86 or 96, indicating data for one of those two years, or 8696, indicating the change between those two years.**Data are available only for one year that is closest in time to the 1996 census.
Fertility Transition in Egypt: Intraurban Patterns in Cairo 83

center into informal areas that tend to be on the edges ofthe older parts of Cairo. Almost by definition, they are notwell served by infrastructure, leading to quality of lifeissues that will have an impact on all residents, regardlessof social class. However, in the 1990s, the governmentembarked on a program of improving infrastructure in in-formal settlements inorder todampencomplaint and tampdown the rise of Islamic fundamentalism. This has ledto continuous increases in land prices, putting many ofthese places beyond the reach of the poor. As a result, theinformal areas increasingly tend to house middle- andupper-income groups. Thus, informal does not necessarilymean poor, and although living in an informal settlementcould be thought of as an indicator of social class, it ismorea characteristic of a place rather than of the people wholive there, and for that reason, properly belongs in thecategory of neighborhood context.
Another way to characterize the built environment isthrough the classification of data from remotely sensedimagery, and we were able to draw upon such analysesthat have already been done for the Greater Cairo areafrom imagery for both 1986 and 1996. The details ofthe classification procedures are described elsewhere(Rashed et al. 2001; Weeks 2003b). We employed Ridd’s(1995) V-I-S (vegetation, impervious surface, soil) modelof urban ecology from remotely sensed data to guide aspectral mixture analysis (SMA) of medium-resolution,multi-spectral images forGreaterCairo for 1986and1996.The usefulness of this approach has been noted by Phinnand his associates (2002), Rashed and his associates(Rashed and Weeks 2003; Rashed et al. 2001; Rashedet al. 2003), and Wu and Murray (2003). We addedanother component to Ridd’s physical model—shade/water—following the work of Ward, Phinn, and Murray(2000) indicating that the fourth physical componentimproves the model in settings outside of the UnitedStates. Spectral mixture analysis permits a soft classifica-tion of a pixel into the likely fraction of the pixel that iscomposed of each of the four physical elements (vegeta-tion, impervious surface, soil, and shade). By summing upthese fractions over all pixels contained within eachcensus tract, we have a composite measure of the fractionof area in each census tract covered by each of the fourland cover types. This provides us with a quantitative wayof describing the built and natural environment in eachneighborhood. For each shiakha we have a measure ofthe percentage of land cover that is characterized asvegetation, the percent that is impervious soil, bare soil,and shade.
Following theRiddmodel, we expect that areas that arein the older part of Cairo will be characterized by higherfractions of impervious surface and lower fractions of
vegetation. However, informal settlements are also ex-pected to have a higher fraction of bare soil, since many ofthe buildings are made of local material and are thuspotentially indistinguishable from bare ground. In theouter suburbs we expect to find a higher proportion ofvegetation relative to all other types of land cover. Notethat we will include only three of the four land-coverclasses in the model in order to keep from overspecifyingthe model. We will exclude the vegetation fraction be-cause it has the lowest variability and is the most highlyskewed of the fractions, with only a few of the shiakhashaving more than very low fractions of area covered byvegetation. Shade in our land cover classification is largelya proxy for the presence of multistory buildings, and inmany areas the percentage of impervious surface andshade vary closely together. We used a rule of thumb thatany variable with a variance inflation factor (VIF) greaterthan 10 would be excluded from the model (Montgomeryand Peck 1992) or combined in an interaction term. Onthis basis, the fractions of both impervious surface andshade were replaced by an interaction term representingthe product of the two. To those variables we have added atexture measure obtained by passing a moving windowover the surface of a panchromatic image to measurethe variability in brightness within the window comparedto the average of windows surrounding that one. A highlevel of variability or contrast represents a heterogene-ous surface, such as we would expect to find in thesuburbs, whereas a low level of variability represents amore homogeneous surface, such as the older quarters ofcentral Cairo.
The final set of variables represents the proximatedeterminants of fertility (Bongaarts 1978, 1982), thosefactors through which the previously listed variables mustact in order to influence fertility. Education, for example,does not directly influence fertility; rather, it influencesthe timing ofmarriage and the likelihood of usingmeans toprevent pregnancy.We do not have precise data on age atmarriage, but we do have a proxy variable from the census,measured as the ratio of women 15 years of age and olderwho are not currently married to all women aged 15 to 29.The higher this ratio, the higher will be the average age atmarriage in the neighborhood. We do not have data foreach shiakha on contraceptive utilization, but we do havesuch data for women sampled in the 1995 and 1988Demographic and Health Surveys. The 1995 DHSinterviewed married women of reproductive age in 41 dif-ferent shiakhas in Greater Cairo. For each of these 41neighborhoods we have summarized the percentage ofnonpregnant women who were currently using a modernmethod of contraception.Those datawere then combinedwith the census data on the percentage of women who
Weeks et al.84

were single and with the total fertility rate in theneighborhood. We employed data from the 1988 DHSin a similar comparison with the 1986 census. For 1988,the DHS included 24 shiakhas in the Greater Cairo area,and so we used data for those places.
For 1996, the analysis shows that the combination ofthe percent of young women who are single and thenumber of women using modern contraceptives accountsfor 70percent of the variation in fertility in the 41 shiakhasthat were included in the DHS. However, the respectivebeta coefficients of � .784 for the percent single and� .171 for the percent using modern contraceptives show(when squared) that variability in the delay in marriage is20 times more important a predictor of fertility levels thanis contraceptive utilization, which, in fact, was not astatistically significant predictor. We mentioned abovethat the delay in marriage has regularly been cited as animportant factor in the Arab fertility transition (see alsoRashad 2000), and these findings are consistent with thatconclusion. Contraceptives tend to be far more availableto married women than to single women, and singlewomen tend to be much more heavily supervised in theirrelations with men than would be true in more Westerncountries. Thus, unlike in Europe and the United States,a delay in marriage is much more closely associated with adecline in fertility, rather than with a rise in out-of-wedlock births.
The data for 1986, combined with contraceptive usefrom the 1988 DHS, yielded comparable results. Thecombination of the percent of young women still singleand the use of modern contraceptives by married womenof childbearing age accounted for 96 percent of thevariability in fertility in the 24 shiakhas from whichrespondents were drawn for the 1988 survey. Virtually allof that explanatory power resided in the marriage agevariable (with a standardized beta coefficient of � .969)and the contraceptive use variable not only had a low, notstatistically significant beta coefficient (.030), but it wasalso in the wrong direction. If we compare the weightedpercentage of women using modern contraceptives in1988 (55 percent) with that in 1995 (53 percent), we findthat this difference is negligible and not statisticallysignificant. On the other hand, the percent of youngwomen remaining single went up from 44 percent in 1986to 54 percent in 1996 in the neighborhoods included inthe respective DHS samples. That difference is still notquite large enough to be statistically significant, given therelatively small number of shiakhas in the 1988 DHS, butit is in the expected direction. The important point to betaken from these analyses drawing upon the DHS data isthat we can best understand the spatial patterns of fertilityin Greater Cairo by reference to the percentage of young
women who are not yet married (a delay in marriage), andso our lack of contraceptive use data for each shiakhaseems unlikely to influence our results.
We know already from Figures 2 through 4 that fertilitylevels in both years are spatially autocorrelated and thatthe change over time is autocorrelated. Using Moran’s Ias the index of spatial correlation, with a weights matrixbased on the inverse of squared distance between shiakhacentroids, the z-normal value of I for fertility in both 1986and 1996 was statistically significant, as it was also for thechange between 1986 and 1996. The question is whetherthe predictor variables are able to account for that spa-tial pattern on their own, or whether there is a residualspatial component that is unmeasured in the initial modeland must thus be accounted for.
Predictors of Fertility Levels in Cairo in 1996
Our first model looks at the first and most basicquestion that we posed in this research: Is the spatialvariation in fertility in Cairo explained simply by theresidential pattern of the population by socioeconomicstatus? We examined this question by calculating an OLSbivariate regression between TFR and STATUS andthen examining the residuals of that model. In 1996, theresulting R2 was only .30 and Moran’s I, calculated forthe residuals, was very high and statistically significant,signaling the presence of spatial autocorrelation in theresiduals. From this we can conclude that (a) socio-economic status is not the sole predictor of fertility rates inCairo, and (b) there is a spatial pattern to fertility thatis not accounted for by the socioeconomic status ofneighborhoods. The residuals are mapped by neighbor-hood in Figure 5 where it can be seen that STATUS tendsto overpredict the TFR in the central part of the city(where the predicted TFR tends to be higher than theactual values) and it underpredicts fertility in the suburbs,especially inGiza. (These patterns are very similar in 1986,and so we have not shown them here.)
Having determined that STATUS is not going to giveus a full picture of fertility patterns in Cairo, we move to amore complete model in which we estimate TFR based onthe combination of socioeconomic status, environmentalcontext variables, and the proximate determinant of theproportion of young women who are single.
TFR ¼ b0 þ fb1STATUSg þ fb2INFORMAL
þ b3IMP�SHDþ b5SOILþ b6TEXTURE96gb7NOTMAR eþ f g þ
The results for 1996 are shown below, where thestandardized beta coefficient and its associated t-score
Fertility Transition in Egypt: Intraurban Patterns in Cairo 85

(in parentheses) is shown for each variable in the equation(variables that are not significant at the .05 level are initalics):
TFR96 ¼f�:020ð�:451ÞSTATUS96gþ f�:060ð�1:943ÞINFORMAL
þ�:139ð�3:280ÞIMP�SHD96
þ�:121ð�2:342ÞSOIL96
þ�:124ð�2:348ÞTXTURE96g:824 15:141 NOTMAR96þ f� ð� Þ g
The R2 for 1996 was .763, indicating a good fit with thedata. There was no evidence of strong multicollinearity,nor of heteroscedasticity. However, the residuals werespatially autocorrelated, measured by the z-normalizedMoran’s I. This indicates that the model is spatiallymisspecified and we will correct for that below. However,we can note at this point that the variable NOTMAR,representing the percentage of young women who are stillsingle (our proxy for age at marriage), is by far the mostimportant predictor of fertility. The higher this fraction,the lower is fertility. This, of course, is what we wouldexpect. We anticipate that it is through this proximatedeterminant that fertility is influenced. Three of theenvironmental context variables (the interaction ofimpervious surface and shade, the soil fraction, andtexture) are statistically significant, but the standardizedbeta coefficients indicate that they are only weaklypredictive of fertility independently of the age at marriagevariable. As impervious surface and shade increasetogether, fertility declines, which is what we expected.However, as texture increases, fertility declines, and thatis contrary to our expectations. We expected that more
texture would be associated with the outer areas wherefertility is higher. The socioeconomic status variable is notsignificantly significant in combination with the othervariables in the model, even though it does have a fairlyhigh bivariate correlation with fertility, as we discus-sed above.
Spatially Filtered Regression
In order properly to specify ourmodel, wemust accountfor the spatial dependence that exists within the data.Anselin and Rey (1991) have differentiated between twoforms of spatial dependence: that which is a nuisance andthat which represents a substantive spatial process. As anuisance, it can be controlled with a properly designedweights matrix within a spatially autoregressive model.However, when the spatial dependence is a subject ofinquiry, as it is in this research, it is useful to be able toquantify the role that it plays within each of the predictorvariables. Spatial filtering, based on the Gi(d) statistic,offers a way of decomposing each variable into its spatialand nonspatial components and then reintroducing eachcomponent separately into the regressionmodel. The finalmodel fit has been shown to be comparable using spatialfiltering and autoregressive models (Getis and Griffith2002), but the spatial filtering technique has the advan-tage of giving us intermediate information about the effectof spatial dependence on the dependent variable that isnot available within an autoregressive framework.
In this statistical approach, we first test for the presenceof spatial dependence in each of the predictor variables bycalculatingMoran’s I, using an inverse of squared distanceweights matrix, where distance is measured between thecentroids of shiakhas. For each spatially dependent inde-pendent variable, we use the Gi(d) statistic as a spatialfilter to extract the spatially autocorrelated portion ofthat variable. The difference between the original variablexi and the filtered variable xf sp
i is a new variable xi , thatrepresents the spatial effects embedded in xi (Getis 1995;Getis and Griffith 2002). These two variables, xf sp
i and xireplace the original variable xi in the regression equationto produce a spatially filtered regression model in whichthe contribution of the spatial and filtered (nonspatial)components of each variable can be determined by thebeta coefficients in the resulting model. These techniquesof spatial filtering have been programmed in Fortran byScott (1999).
All of the predictor variables were spatially dependent(based on a statistically significantMoran’s I), and all werefiltered and then reintroduced into the respective regres-sion models. If we use only the filtered (nonspatial) com-ponents of the variables to predict fertility in 1996, the
Standardizedresiduals
of TFRpredicted by
STATUS1996
−2.54 - −1.21
−1.20 - −0.53
−0.52 - 0.03
0.04 - 0.75
0.76 - 1.70
1.71 - 3.85
Figure 5. Map of residuals of predicted values of TFR based onsocioeconomic level of neighborhoods, Cairo 1996.
Weeks et al.86
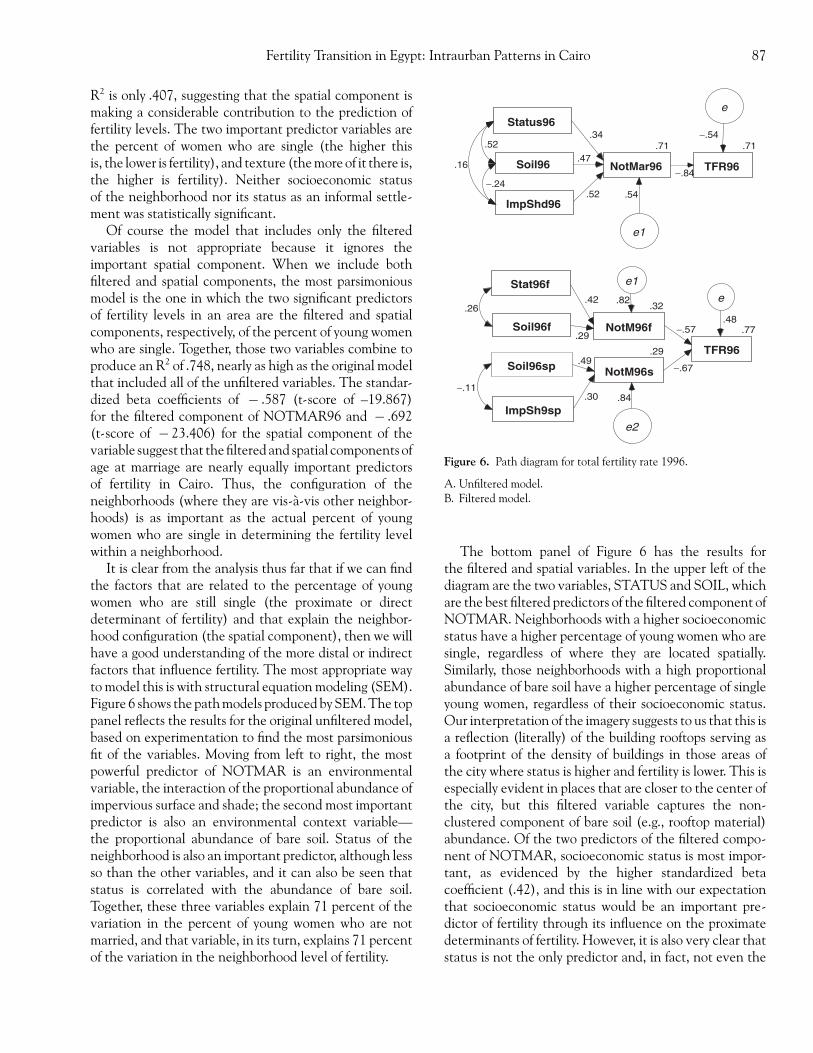
R2 is only .407, suggesting that the spatial component ismaking a considerable contribution to the prediction offertility levels. The two important predictor variables arethe percent of women who are single (the higher thisis, the lower is fertility), and texture (themore of it there is,the higher is fertility). Neither socioeconomic statusof the neighborhood nor its status as an informal settle-ment was statistically significant.
Of course the model that includes only the filteredvariables is not appropriate because it ignores theimportant spatial component. When we include bothfiltered and spatial components, the most parsimoniousmodel is the one in which the two significant predictorsof fertility levels in an area are the filtered and spatialcomponents, respectively, of the percent of young womenwho are single. Together, those two variables combine toproduce an R2 of .748, nearly as high as the original modelthat included all of the unfiltered variables. The standar-dized beta coefficients of � .587 (t-score of –19.867)for the filtered component of NOTMAR96 and � .692(t-score of � 23.406) for the spatial component of thevariable suggest that thefilteredand spatial components ofage at marriage are nearly equally important predictorsof fertility in Cairo. Thus, the configuration of theneighborhoods (where they are vis-a-vis other neighbor-hoods) is as important as the actual percent of youngwomen who are single in determining the fertility levelwithin a neighborhood.
It is clear from the analysis thus far that if we can findthe factors that are related to the percentage of youngwomen who are still single (the proximate or directdeterminant of fertility) and that explain the neighbor-hood configuration (the spatial component), then we willhave a good understanding of the more distal or indirectfactors that influence fertility. The most appropriate wayto model this is with structural equationmodeling (SEM).Figure 6 shows the pathmodels producedbySEM.The toppanel reflects the results for the original unfiltered model,based on experimentation to find the most parsimoniousfit of the variables. Moving from left to right, the mostpowerful predictor of NOTMAR is an environmentalvariable, the interaction of the proportional abundance ofimpervious surface and shade; the second most importantpredictor is also an environmental context variable—the proportional abundance of bare soil. Status of theneighborhood is also an important predictor, although lessso than the other variables, and it can also be seen thatstatus is correlated with the abundance of bare soil.Together, these three variables explain 71 percent of thevariation in the percent of young women who are notmarried, and that variable, in its turn, explains 71 percentof the variation in the neighborhood level of fertility.
The bottom panel of Figure 6 has the results forthe filtered and spatial variables. In the upper left of thediagram are the two variables, STATUS and SOIL, whichare the best filtered predictors of the filtered component ofNOTMAR. Neighborhoods with a higher socioeconomicstatus have a higher percentage of young women who aresingle, regardless of where they are located spatially.Similarly, those neighborhoods with a high proportionalabundance of bare soil have a higher percentage of singleyoung women, regardless of their socioeconomic status.Our interpretation of the imagery suggests to us that this isa reflection (literally) of the building rooftops serving asa footprint of the density of buildings in those areas ofthe city where status is higher and fertility is lower. This isespecially evident in places that are closer to the center ofthe city, but this filtered variable captures the non-clustered component of bare soil (e.g., rooftop material)abundance. Of the two predictors of the filtered compo-nent of NOTMAR, socioeconomic status is most impor-tant, as evidenced by the higher standardized betacoefficient (.42), and this is in line with our expectationthat socioeconomic status would be an important pre-dictor of fertility through its influence on the proximatedeterminants of fertility. However, it is also very clear thatstatus is not the only predictor and, in fact, not even the
e
.77
TFR96
.32
NotM96f
.29
NotM96s
Stat96f
Soil96sp
ImpSh9sp
−.57
−.67.49
.30−.11
e1
e2
.42
Soil96f.29
.26.48
.84
.82
e
.71
TFR96
.71
NotMar96
Status96
e1
.34
Soil96
.54ImpShd96
.52−.24
.52
.16.47
−.54
−.84
Figure 6. Path diagram for total fertility rate 1996.
A. Unfiltered model.B. Filtered model.
Fertility Transition in Egypt: Intraurban Patterns in Cairo 87

most important one. That honor goes to the spatialcomponent of bare soil, which embodies much of thespatial autocorrelation found in the data. In other words,the configuration of bare soil (probably the footprints ofbuildings) is amore important influence on the percentageof young women who are single than is socioeconomicstatus, per se, and thus it is reasonable to conclude that inCairo in 1996, fertility levels were more influenced bywhere a neighborhood was located than by the socio-economic status of that neighborhood. As we will discussbelow, this is very important because it suggests adeepening shift in the status of women, as evidenced bya delay in marriage, that is not dependent necessarilyon a rising standard of living, and this portends a broaderchange in social structure than simply a decline in fertility.
Predictors of Fertility Levels in Cairo in 1986
We turn now to the results for 1986, looking first at theprediction of the total fertility rate for that year based onthe original (unfiltered) variables. The standardized betacoefficient and its associated t-score (in parentheses) isshown for each variable in the equation
TFR86 ¼f�:084ð�2:657ÞSTATUS86gþ f�:045ð�2:211ÞINFORMAL
þ�:107ð�3:947ÞIMP�SHD86
þ�:107ð�4:911ÞSOIL86
þ :063ð2:947ÞTXTURE86gþ f�:789ð�20:298ÞNOTMAR86g
The R2 for 1986 was .898, suggesting an even better fitto the data than in 1996. Once again, there was no strongevidence of multicollinearity, nor of heteroscedasticity,but the residuals were spatially autocorrelated, based on az-normalized Moran’s I. As was true in 1996, the statusvariable was a statistically significant predictor of fertility,but in fact all of the variables were statistically significantpredictors of fertility, even if most were only weakly so. Aswas true for 1996, the percentage of young women whoare still single was highly correlated with fertility at theshiakha level, and, as expected, it was by far the mostimportant of the explanatory variables.
The top panel of Figure 7 shows the final pathmodel forthe 1986 data. In order to improve the overall fit of thedata, themodel was reduced to three variables (STATUS,SOIL, and IMP*SHD) as predictors of NOTMAR, withNOTMAR then being the proximate determinant ofTFR. It can be seen that there are onlymodest correlationsamong the leftmost exogenous variables, and STATUSis a somewhat stronger predictor of NOTMAR than is
IMP*SHD, but, in fact, the neighborhood environmentvariables of IMP*SHD and SOIL are important indepen-dent influences of the percentage of youngwomenwhoaresingle, independent of the impact of the socioeconomicstatus of the neighborhood. The combination of thosethree variables explains 73% percent of the variation inNOTMAR, as can be seen in the figure.
In order to improve the specification of the model bycontrolling for the spatial autocorrelation, we once againundertook the filtering of variables. The R2 for only thefiltered variables as predictors of fertility was .604,suggesting again that the spatial component was a majorcontribution to the overall explanatory power. Whenboth filtered and spatial components were introduced intothe model, the overall R2 jumped to .905, but now it ispossible to see that the spatial component of NOTMARwasclearly the strongest predictor of fertility levels in1986,followed closely by the filtered component of NOTMAR.Several of the other variables were statistically significant,but of the significant variables, the spatial and filteredcomponents of NOTMAR alone had an R2 of .883 as apredictor of total fertility rates. The other variablescombined to add very little explanatory power. That is,of course, what we expect since the NOTMAR variable isthe important proximate determinant of fertility.
e
.90
TFR86
.32
NotM86f
.17
NotM86sp
Stat86f
−.55
−.77
e1
e2
.57
Txtr86f.20
.32
.91
.83
Impsh8sp
Stat96sp
−.07
.38
.19
−.16
e
.88
TFR86
.73
NotMar86
Status86
e1
.55
Soil86
.52ImpShd86.45
−.14
.25
.34.19
.35
−.94
Figure 7. Path diagram for total fertility rate 1986.
A. Unfiltered model.B. Filtered model.
Weeks et al.88

Once again, then, the next interesting question relatesto which of the distal or indirect variables best predictthe proximate determinant of fertility. The bottom panelof Figure 7 shows the most parsimonious version of thefiltered model for 1986. The filtered component ofNOTMAR in 1986 is explained largely by the filteredcomponent of neighborhood socioeconomic status—regardless of where a neighborhood is located, the higherthe status, the higher the percent of young women whoare single, and, then, of course, the lower is fertility. Thespatial component of status is weakly predictive ofthe spatial component of NOTMAR, suggesting that thearrangements of neighborhoods by status does have aneffect on age at marriage and fertility, regardless of theactual status level. Themeasures of neighborhood contextderived from the remotely sensed imagery also havespatial and nonspatial components, which are predictorsof marital status (and thus of fertility). Even whenwe control for status, the data show that the higherthe fractionof anarea that is coveredby impervious surfaceand shade (the interaction of the two), the lower is thefertility in that area. Furthermore, the greater the amountof texture in the land cover describing the neighborhood,the lower is the age at marriage and thus the higher isfertility. This latter effect is embodied in the filteredcomponent and is consistent with the idea that thesuburbs are where fertility is highest, even controlling forsocial status of the neighborhoods. We interpret thesefindings to mean that the variability in age at marriage(and thus in fertility) is partly related to the status ofthe neighborhood, but it is also importantly influencedby the neighborhood context and the arrangement ofneighborhoods within the city.
Informal settlements are not statistically significantlyrelated to age at marriage or fertility, after controlling forthe other variables in themodel.This variable is, of course,a blunt instrument since we have only a binary classifica-tion, when, in fact, many neighborhoods almost certainlyhave a mix of informal and formal elements. At thebivariate level, we do know that the percent of womenwho are single is lower and fertility is higher in informalsettlements. In both 1996 and 1986 fertility levels werestatistically significantly higher in informal settlementsthan in other areas, but that relationship disappears whenwe take other factors into account.
Change in Fertility between 1986 and 1996
We turn now to an analysis of the change in fertilitybetween 1986 and 1996 to see if the change in thesignificant predictor variables discussed above can explainthe change in the age at marriage, and thus in fertility,
between those two years. The initialmodel, comparable tothe ones tested for each year individually, is as follows:
DTFR ¼ b0 þ fb1DSTATUSg þ fb2DIMP SHD
þ b3DSOILþ b4DTEXTUREgb5DNOTMAR eþ f g þ
�
Not unexpectedly, this model produces only onestatistically significant predictor of the percent change infertility—namely, the percent change in the proportion ofyoung women who are single. The higher the rise in thatproportion, the greater the drop in fertility, with an R2 of.56. Underlying that relationship was the high negativecorrelation between the percent not married in 1986 andthe relative change in that percentage between 1986and 1996. Those neighborhoods with the lowest percent-age of women who were not married in 1986 tended to bethe places where the percentage increased most rapidly.
Figure 8 shows that the overall R2 improved to .59 forthe path model fitted to the unfiltered data. It can be seenthat an increase in the age at marriage is able to explaina large fraction of the decline in fertility (R25 .59), but wehave amore difficult time explaining the change inmaritalbehavior (R25 .27). The best predictor of that changeis the change in socioeconomic status—a more rapidincrease in a neighborhood’s status was associated with amore rapid rise in the percentage of young women whowere single. Largely independent of that effect was therelationship between a neighborhood’s status in 1986and its change in the percent not married—the lower thestatus in 1986 the more rapid was the increase inthe percent single between1986 and1996.Changes in theenvironmental context variables derived from the imagerywere very modest in their effect. The bigger the change inthe proportional abundance of soil, the slower was theincrease in the age at marriage, but this was essentiallyoffset by an increase in the pace of age at marriage as therate of change increased in the interaction of impervioussurfaces and shade. The low standardized beta coefficients
e
.59
TFRpctch
Statchng
ImpSchng
−.03
.27
NotMchng
e2
.34
.13
STATUS86
−.28−.20
−.10
Soilchng −.15
.04
.15
.16
−.77
.64
.86
Figure 8. Path diagram for percent change in total fertility rate1986–1996.
Fertility Transition in Egypt: Intraurban Patterns in Cairo 89

of these latter two variables, however, limit the value ofthese conclusions.
Keep in mind that the change in status of a neighbor-hood is positively correlated with the change in fertility,which is the opposite of what we would expect. It wouldbe anticipated that a faster increase in status would beassociated with a faster decline in fertility, but the resultssuggest the opposite pattern. This is, however, entirelyconsistent with the spatial pattern of fertility declineshown in Figure 4. Although fertility is lower toward thecenter of the city (in the higher socioeconomic areas) inboth 1986 and 1996, it was in the lower-status outersuburbs where the decline in fertility was most rapid. Thisdecline is largely a consequence of a delay in marriage onthe part of young women in lower-status (probably moretraditional) areas, which as noted above, is suggestive of amore fundamental shift in gender relations in Cairo thatportend deeper social changes.
Howmight this process be taking place, despite the lackof evidence of a pattern of diffusion?One possibility is thatsocial change is occurring more subtly than our statisticscan detect. The demographics of Cairo have been in-fluenced by the scarcity of housing, occasioned both byrent control in the center of the city, which has discour-aged new construction, and by a decline in governmentspending on housing, as funding has been diverted insteadto military resources (El-Batran and Arandel 1998). As aconsequence, informal settlements beyond the city centerhave attracted bothmigrants toCairo andnativeCaireneswho cannot afford to live in the older, more establishedparts of the city:
Essentially, home-seekers lack access to rent-controlledaccommodation even though these flats might not actuallybe occupied. The very low (controlled) rents encourageholders to retain these homes even if they do not occupythem. Beyond that, the unaffordable prices of newly builtformal housing exclude the low-income groups from thehousing market. Thus, there remains no other option foryoung people, in particular those intending to start a family,but to seek housing in the informal market. Hence, theyventure out to join the outsiders who inhabit the largeashwaiyyat, the informal agglomerations surrounding metro-politan areas, some of which already accommodate groupsof indigenous populations such as villagers or tribal people.
—(Bayat and Denis 2000, 191–92)
Although these informal settlements have been as-sumed to essentially ruralize the urban environment, itis reasonable to expect that the intermixing of peopleof differing backgrounds will have the opposite effect ofincreasing the likelihood that migrants and other urbanpeasants will come into contact with more modern views
about gender relations and about the tradeoff between thequantity and quality of children. Evidence of these types ofsocial forces in Cairo are largely anecdotal (Obermeyer1995), but it is consistent with the fact that informalsettlements are believed to be an important element in thesocial structure of Cairo, even if they do not emerge ontheir own as statistically significant predictors of demo-graphic patterns.
Conclusion
The Greater Cairo region has not necessarily been astrong leader in the fertility transition currently underwayinEgypt.The trenddata show thatCairo is onlymarginallyahead of the rest of the country in terms of its fertilitydecline and, more importantly, the greater Cairo regionexhibits considerable intraurban variability in its ownlevels of fertility. Some areas of Cairo are much fartherdown the road toward low levels than are others.We haveshown that, in general, fertility is lowest in the center ofthe city and highest in the suburbs. That is not toosurprising on its own, but we have also shown that there isa very important spatial dependence to the bundlingof fertility and its predictors in Cairo. Differences inreproductive behavior are often based upon differencesin human capital, measured especially by education, andespecially by female education (Bledsoe et al. 1999),which has had a strong history of relationship to fertilityin Egypt (Abu-Lughod 1965; El Attar 1973; Gadalla1978;Gadalla ,McCarthy, andKak1987), as almost every-where in theworld.The economic or humancapital theoryof fertility makes no explicit claim about the role of place,but it is clear that some neighborhoods or social environ-ments offer more economic opportunity than others, andsome environmental contexts offer more opportunitiesfor their residents to engage in innovative behavior. Itdoes matter where you are. The socioeconomic status ofneighborhoods is certainly related to fertility in Cairo, butit is not necessarily the most important factor influencingrecent patterns of fertility change. Something about thespatial structure of theGreater Cairo area is clearly havingan impact on fertility levels and changes. Such influencesinclude the clearing of slums, rent control in the core ofCairo, and the rise of informal settlements throughout thesuburban areas.
We have found no direct evidence of a spatial diffusionof innovative behavior, but we can observe very clearlythat neighborhoods with an early age at marriage in 1986weremore likely to experience adelay inmarriage and thusa drop in fertility in the subsequent decade. This hascreated flux in the fertility transition in Cairo, reflected in
Weeks et al.90

the fact that our models fit the data better in 1986, beforethese changes appeared to unfold, than in 1996. Thereis strong evidence that in Egypt, including its urbanareas, traditional gender role attitudes are still prevalent(Mensch et al. 2003). Teenage girls (and boys) still acceptthe idea that when girls get married, they will give up theirsocial freedomvis-a-vis the outsideworld andwill accept adominant role within the family in exchange for economicsupport from the husband. But, the data on the delay inmarriage suggests that as girls in Cairo reach adulthood,theymaybe chafing at that traditional role set out for themby society, even if they do not openly object to it.
Young Egyptian women are dealing with traditionalgender-role attitudes in a manner similar to women innorthernMediterranean countries such as Italy and Spainwhere fertility has droppedquickly because of a substantialdelay in marriage and then a restriction of births withinmarriage. The current level of contraceptive use amongmarried women in Cairo (53 percent) is consistent withCairo’s overall TFRof just less than 3 (Bongaarts 1986), soultimately contraceptive use will have to rise if fertility inCairo is to drop closer to replacement. The current delayin marriage is only marking time for that eventual occur-rence, but in the meantime, it is almost certainly creatingthe context in which broader social changes in the lives ofyoung women can occur, first at the neighborhood level,then regionally, and then eventually at national levels.
Regardless of the particular sociodemographic circum-stances, behaviormaywell be influencedby the social pres-sures on offer within the neighborhood in which peoplelive, and these local influences can have a powerfuleffect on both the quantum and the tempo of the ferti-lity transition. Urban places represent a wide array of eco-logical settings in which a multiplicity and diversity ofideas about how to live life come together and influencebehavior. Culture then builds on itself, and it does so in thefashion of Levi-Strauss’s (1966, 17) bricoleur or handyman:making use of the materials at hand. Taking Levi-Straussone step further, we suggest that these ingredients includeideationalmaterial (whichhas limited spatial dependence)and social material (which is much more spatiallydependent). In sum, we have shown that intraurbanvariability exists in the fertility transitionwithinCairo, andwe infer that an important component of this variability isthe underlying spatial dependenceof cultural phenomena.
Acknowledgments
This researchwas supported by grants from theAndrewMellon Foundation and theNational Science Foundation(GrantNo. BCS-0095641). The authors acknowledge the
´help provided by the Centre d’Etudes et de Documenta-´tion Economique, Juridique and Sociale (CEDEJ) inCairo
(Egypt), and thankM.G.E. Rashed for assistance with thevital statistics data. Useful comments were provided byMichael Goodchild, Ronald Lesthaeghe,MarkMontgom-ery, Douglas A. Stow, and anonymous Annals reviewers.Earlier versions of this paperwere presented at theAnnualMeeting of theAssociation ofAmericanGeographers, LosAngeles, March 2002 and the Annual Meeting of thePopulation Association of America, Atlanta, May 2002.
References
Abu-Lughod, J. 1965. The emergence of differential fertility inEgypt.Milbank Memorial Fund Quarterly 43:235–53.
Anselin, L., and S. Rey. 1991. Properties of tests for spatialdependence in linear regression models. Geographical Ana-lysis 23:112–32.
Arriaga, E. E., P. D. Johnson, and E. Jamison. 1994. Populationanalysis aith microcomputers.Washington, DC:U.S. Bureau ofthe Census.
Bayat, A. 1997. Cairo’s poor: Dilemmas of survival and solidarity.Middle East Report. http://www.merip.org/mer/mer202/mer202.html.
Bayat, A., and E. Denis. 2000.Who is afraid of ashwaiyyat? Urbanchange and politics in Egypt. Environment and Urbanization12:185–99.
Bledsoe, C. H., J. B. Casterline, J. A. Johnson-Kuhn, and J. G.Haaga. 1999. Critical perspectives on schooling and fertilityin the developing world. Washington, DC: National AcademyPress.
Bongaarts, J. 1978. A framework for analyzing the proximatedeterminants of fertility. Population and Development Review4:105–32.
FFF. 1982. The fertility-inhibiting effects of the intermediatefertility variables. Studies in Family Planning 13:179–89.
FFF. 1986. Contraceptive use and annual acceptors requiredfor fertility transition: Results of a projectionmodel.Studies inFamily Planning 17.
Bucht, B., and M. A. El-Badry. 1986. Reflections on recent levelsand trends of fertility and mortality in Egypt. PopulationStudies 40:101–13.
Burt, R. S. 1992. Structural holes: The social structure of competition.Cambridge: Harvard University Press.
Cairo Demographic Center. 2001.Mortality: Age-Specific Mortal-ity Rates (ASMRs), 1986 & 1996. http://www.cdc.eun.eg/popin/popin.htm (last accessed 2001).
Carley, K. M. 2001. Learning and using new ideas: A socio-cognitive perspective. In Diffusion processes and fertilitytransition: Selected perspectives, ed. J. B. Casterline. Washing-ton, DC: National Academy Press.
Cleland, J. 2001. Potatoes and pills: An overview of innovation-diffusion contributions to explanations of fertility decline. InDiffusion processes and fertility transition: Selected perspectives,ed. J. B. Casterline. Washington, DC: National AcademyPress.
Coale, A. 1973. The demographic transition. In Internationalpopulation conference. Vol. I, ed. IUSS, 53–72. Liege, Belgium:IUSSP.
Fertility Transition in Egypt: Intraurban Patterns in Cairo 91

Courbage, Y. 1994. Demographic change in the Arab world: Theimpact of migration, education, and taxes in Egypt andMorocco.Middle East Report 24:19–22.
Davis, K. 1963. The theory of change and response in moderndemographic history. Population Index 29:345–66.
FFF. 1973. Cities and mortality. Liege: IUSSP.ElAttar,M.E. (1973).Differential fertility in theArabRepublic of
Egypt. Social Biology 20:323–34.El-Batran, M. 1997. The mechanism of informal land develop-
ment and its impact onurban expansion in Egypt:The case ofGiza City (1976–1996). Ph.D. thesis, Urban Planning, CairoUniversity, Cairo.
El-Batran, M., and C. Arandel. 1998. A shelter of their own:Informal settlement expansion in greater Cairo and govern-ment responses. Environment and Urbanization 10:217–32.
Eversley, D. 1959. Social theories of Malthus and the Malthusiandebate. Oxford: Clarendon Press.
Fargues, P. 1997. State policies and the birth rate in Egypt: Fromsocialism to liberalism. Population and Development Review23:115–38.
FFF. 2000. Generations Arabes. Paris: Fayard.Gadalla, S. 1978. Is there hope? Fertility and family planning in a rural
community in Egypt. Chapel Hill, NC: Carolina PopulationCenter, University of North Carolina.
Gadalla, S., J. McCarthy, and N. Kak. 1987. The determinants offertility in rural Egypt: A study of Menoufia and Beni-Suef.Journal of Biosocial Science 19:195–207.
Galunic, D. C., and J. R. Weeks Jr. 2001. Intraorganizationalecology. In Companion to organizations, ed. J. A. C. Baum.Oxford: Blackwell Publishers.
Getis, A. 1995. Spatial filtering in a regression framework:Examples using data on urban crime, regional inequality, andgovernment expenditures. In New directions in spatial econo-metrics, ed. L.Anselin andR. Florax, 172–85. Berlin: Spriger-Verlag.
Getis,A., andD.A.Griffith. 2002.Comparative spatial filtering inregression analysis. Geographical Analysis 34:130–40.
Getis, A., and J. K. Ord. 1992. The analysis of spatial associationbyuse of distance statistics.GeographicalAnalysis 24:189–206.
Getis, A., and J. K. Ord. 1996. Local spatial statistics: Anoverview. In Spatial analysis: Modelling in a GIS environment,ed. P. Longley andM. Batty, 261–77. Cambridge, U.K.: Geo-Information International.
Gladwell, M. 2000. Tipping point. London: Little, Brown andCompany.
Granovetter,M. 1973.The strengthofweak ties.American Journalof Sociology 78:1360–80.
International Statistical Institute. 1983. The Egyptian FertilitySurvey, 1980: A summary of findings. Voorburg, Netherlands:International Statistical Institute.
Knox, P. 1994. Urbanization: An introduction to urban geography.Englewood Cliffs, NJ: Prentice Hall.
Kohler, H-P. 2001. Fertility and social interaction: An economicperspective. Oxford: Oxford University Press.
Kohler, H-P., J. R. Behrman, and S. C.Watkins. 2001. The densityof social networks and fertility decisions: Evidence fromSouth Nyanza District, Kenya. Demography 38:43–58.
Landers, J. 1993. Death and the metropolis: Studies in thedemographic history of London 1670–1830. Cambridge: Cam-bridge University Press.
Lesthaeghe, R. J., and J. Surkyn. 1988. Cultural dynamics andeconomic theories of fertility change. Population and Devel-opment Review 14:1–45.
Levi-Strauss, C. 1966. The savage mind. Chicago: University ofChicago Press.
Macionis, J. J., and V.N. Parrillo. 1998.Cities and urban life. UpperSaddle River, NJ: Prentice Hall.
Mensch, B. S., B. L. Ibrahim, S. M. Lee, and O. ElGibaly. 2003.Gender-role attitudes among Egyptian adolescents. Studies inFamily Planning 34:8–18.
Montgomery, D. C., and E. A. Peck. 1992. Introduction to linearregression analysis. New York: John Wiley and Sons, Inc.
Obermeyer,C.M. 1995.Family, gender, and population in theMiddleEast. Cairo: The American University in Cairo Press.
Ord, J. K., and A. Getis. 1995. Local spatial autocorrelationstatistics: Distributional issues and an application. Geogra-phical Analysis 27:286–306.
Phinn, S. R., M. Stanford, P. Scarth, A. T. Murray, and P. T. Shyy.2002. Monitoring the composition of urban environmentsbasedon the vegetation-impervious surface-soil (VIS)modelby subpixel analysis techniques. International Journal ofRemote Sensing 23:4131–53.
Rashad, H. 2000. Demographic transition in Arab countries: Anew perspective. Journal of Population Research (Australia)17:55–70.
Rashed, T., and J. R. Weeks. 2003. Assessing vulnerability toearthquake hazards through spatial multicriteria analysis ofurban areas. International Journal of Geographical InformationScience. 17:547–76.
Rashed, T., J. R. Weeks, M. S. Gadalla, and A. G. Hill. 2001.Revealing the anatomy of cities through spectral mixtureanalysis of multispectral imagery: A case study of the GreaterCairo Region, Egypt. Geocarto International 16:5–16.
Rashed, T., J. R. Weeks, D. A. Roberts, J. Rogan, and R. Powell.2003.Measuring the physical composition of urbanmorpho-logy using multiple endmember Spectral Mixture Analysis.Photogrammetric Engineering and Remote Sensing.
Ridd,M. 1995. Exploring a V-I-S (Vegetation-Imperious Surface-Soil) model or urban ecosystem analysis through remotesensing: Comparative anatomy of cities. International Journalof Remote Sensing 16:2165–85.
Rodenbeck, M. 1999.Cairo: The city victorious. New York: AlfredA. Knopf.
Sanger,M. 1938.Margaret Sanger:An autobiography.NewYork:W.W. Norton and Company.
Scott, L. 1999. The accessible city: Employment opportunities intime and space. Ph.D. Dissertation, Department of Geo-graphy, San Diego State University.
Sharlin, A. 1986. Urban-Rural differences in fertility in Europeduring the demographic transition. In The decline of fertilityin Europe, ed. A. Coale and S. C. Watkins. Princeton, NJ:Princeton University Press.
Smith, A. 1776. An inquiry into the nature and causes of the wealthof nations. http://www.socsci.mcmaster.ca/~econ/ugcm/3ll3/smith/wealth/wealbk01 (last accessed 2003).
Sussman, G. 1977. Parisian infants andNorman wet nurses in theearly nineteenth century: A statistical study. Journal ofInterdisciplinary History 7:637–53.
Sutton, K., and W. Fahmi. 2001. Cairo’s urban growth andstrategic master plans in the light of Egypt’s 1996 populationcensus results. Cities 18:135–49.
United Nations. 2002. World urbanization prospects: The 2001revisions. New York: United Nations Population Division.
United Nations Population Division. 2003. World populationprospects: The 2002 revision, highlights. New York: UnitedNations.
Weeks et al.92

Ward,D., S.R. Phinn, andA.T.Murray. 2000.Monitoring growthin rapidly urbanizing areas using remotely sensed data. TheProfessional Geographer 52:371–85.
Weeks, J. R. 2003a. The role of spatial analysis in demographicresearch. In Spatially integrated social science: Examples in bestpractice, ed. M. F. Goodchild and D. G. Janelle. New York:Oxford University Press.
FFF. 2003b. Using remote sensing and Geographic Informa-tion Systems to identify the underlying properties of urbanenvironments. In New forms of urbanization: Conceptualizingand measuring human settlement in the twenty-first century, ed.A. G. Champion and G. Huge. London: Ashgate PublishingLimited.
Weeks, J. R.,M. S.Gadalla, T. Rashed, J. Stanforth, andA.G.Hill.2000. Spatial variability in fertility in Menoufia, Egypt,assessed through the application of remote sensing and
GIS technologies. Environment and Planning A 32:695–714.
Weeks, J. R. Jr., andD.CharlesGalunic. 2003.Acultural evolutionin business thinking. InMastering people management, ed. byJ. Pickford. London: Prentice Hall/Financial Times.
Williams, N., and C. Galley. 1995. Urban-rural differentials ininfant mortality in Victorian England. Population Studies49:401–20.
Wrigley, E. A. 1987. People, cities and wealth. Oxford: BlackwellPublishers.
Wu, C., and A. T. Murray. 2003. Estimating impervious surfacedistribution by spectral mixture analysis. Remote Sensing ofEnvironment 84:493–505.
Zaky, H. H. M., R. Wong, and I. Sirageldin. 1993. Testing for theonset of fertility decline: An illustration with the case ofEgypt. The Pakisatan Development Review 32:285–301.
Correspondence: International Population Center, Department of Geography, San Diego State University, San Diego, CA 92182-4493, e-mail:[email protected] (Weeks); Department of Geography, San Diego State University, San Diego, CA 92182-4493, e-mail: [email protected] (Getis), [email protected] (Gadalla);HarvardCenter for Population andDevelopment Studies, 9 BowSt., Cambridge,MA02138,e-mail: [email protected] (Hill); Department of Geography, University of Oklahoma, Norman, OK 73019-1007, e-mail: [email protected] (Rashed).
Fertility Transition in Egypt: Intraurban Patterns in Cairo 93