The Face of Risk: CEO Testosterone and Risk Taking Behavior
59
1 The Face of Risk: CEO Testosterone and Risk Taking Behavior Shinichi Kamiya 1 Y. Han (Andy) Kim 2 Jungwon Suh 3 03/15/2016 Abstract This study examines whether the CEO’s facial masculinity—measured by facial width-to-height ratio— can predict the riskiness of his firm’s financial and investment policy. Our sample consists of male CEOs who are covered by the Execucomp and BoardEx databases and who also held an interview with CNBC over the period 1997-2009. Controlling for selection bias, our results suggest that the CEO’s facial width- to-height ratio is positively associated with (i) stock return volatility, (ii) leverage ratio, (iii) the frequency of undertaking acquisitions and (iv) the Vega of the CEO compensation. The positive association remains significant after controlling for the selection bias and overconfidence. Interestingly, this positive association is strengthened after controlling for the likelihood of the CEO having a dangerous hobby. Overall, our findings suggest that a CEO’s personal traits can be a key predictor of the riskiness of corporate financial and investment policy. Key word: testosterone, risk, CEO, leverage, M&A, fWHR, VEGA JEL Classification: G02, G32, G34, M1, Z1 1 Assistant professor of Finance, Nanyang Business School, [email protected], +65-6790-5718, S3-B1B-64 Nanyang Business School, Nanyang Technological University, Nanyang Avenue, Singapore 639798. 2 Corresponding author. Assistant Professor of Finance, SKKU, email: [email protected] . Tel: +82-2-760-0622. Business School Building #524, Sungkyunkwan University, Seoul, Korea. 3 Associate Professor of Finance, SKKU. Email: [email protected] We thank the seminar participants at FMA Asian Conference in Seoul, 2015, Korea Finance Association Annual Meeting 2015, SKKU, and UNIST. We thank Henrik Cronqvist, Stephen Dimmock, Mark Humphrey-Jenner, Angie Low, Jun-Koo Kang, Chris Parsons, and Richard Roll for insightful comments. We also thank the research assistantship of Yujing Ma, Matthew Lim, and Youngjae Jay Choi. All errors are our own.
-
Upload
khangminh22 -
Category
Documents
-
view
3 -
download
0
Transcript of The Face of Risk: CEO Testosterone and Risk Taking Behavior

1
The Face of Risk:
CEO Testosterone and Risk Taking Behavior
Shinichi Kamiya1 Y. Han (Andy) Kim2 Jungwon Suh3
03/15/2016
Abstract
This study examines whether the CEO’s facial masculinity—measured by facial width-to-height ratio—can predict the riskiness of his firm’s financial and investment policy. Our sample consists of male CEOs who are covered by the Execucomp and BoardEx databases and who also held an interview with CNBC over the period 1997-2009. Controlling for selection bias, our results suggest that the CEO’s facial width-to-height ratio is positively associated with (i) stock return volatility, (ii) leverage ratio, (iii) the frequency of undertaking acquisitions and (iv) the Vega of the CEO compensation. The positive association remains significant after controlling for the selection bias and overconfidence. Interestingly, this positive association is strengthened after controlling for the likelihood of the CEO having a dangerous hobby. Overall, our findings suggest that a CEO’s personal traits can be a key predictor of the riskiness of corporate financial and investment policy.
Key word: testosterone, risk, CEO, leverage, M&A, fWHR, VEGA
JEL Classification: G02, G32, G34, M1, Z1
1 Assistant professor of Finance, Nanyang Business School, [email protected], +65-6790-5718, S3-B1B-64 Nanyang Business School, Nanyang Technological University, Nanyang Avenue, Singapore 639798. 2 Corresponding author. Assistant Professor of Finance, SKKU, email: [email protected] . Tel: +82-2-760-0622. Business School Building #524, Sungkyunkwan University, Seoul, Korea. 3 Associate Professor of Finance, SKKU. Email: [email protected] We thank the seminar participants at FMA Asian Conference in Seoul, 2015, Korea Finance Association Annual Meeting 2015, SKKU, and UNIST. We thank Henrik Cronqvist, Stephen Dimmock, Mark Humphrey-Jenner, Angie Low, Jun-Koo Kang, Chris Parsons, and Richard Roll for insightful comments. We also thank the research assistantship of Yujing Ma, Matthew Lim, and Youngjae Jay Choi. All errors are our own.

1
I. INTRODUCTION
Testosterone, a steroid hormone secreted mainly by the testicles of males, shapes a
person’s neural circuit which regulates his/her behaviors. The level of testosterone is thought to
be associated with the person’s behaviors through neural mechanisms (Dabbs and Morris, 1990;
and Mehta and Beer, 2009). Studies have uncovered that a set of related behavioral
characteristics are associated with the testosterone levels. Those include aggression (e.g., Ancher,
2006), sensation seeking (e.g., Roberti, 2004), hostility (Hartgens and Kuipers, 2004),
dominance (Mazur and Booth, 1998), egocentrism (e.g., Eisenegger, Naef, Snozzi, Heinrichs,
and Fehr, 2010), and risk seeking (e.g., Apicella, Dreber, Campbell, Gray, Hoffman, and Little,
2008).4
In upper echelon of corporate management, the literature stemming from Bertrand and
Schoar (2003) finds significant impact of the traits of the CEO on firm decision making. On the
behavioral front, the association between CEO overconfidence and corporate behavior and
performance has been widely studied. For example, the impact of CEO overconfidence or self-
attribution bias on corporate investment (Malmendier and Tate, 2005); acquisitions (Kim, 2013;
Malmendier and Tate, 2005); and innovation (Hirshleifer, Low, and Teoh, 2012) have been
examined. Wong and Ormiston (2012) find that CEOs with high fWHR deliver better firm
performance. Mayew, Parsons, and Venkatachalam (2013) find that CEOs with lower voice pitch
tend to manage larger firms. Extending the literature, we study whether the CEOs with high
testosterone level make the firm more risky, given their tendency of risk seeking.
The importance of our study is highlighted by the criticism from the general public that
the testosterone-driven corporate culture was one of the important causes of the recent global
financial crisis in 2008 (Sherman, 2012).5 Our argument is different from proposing more
gender diversity as in Adams and Ragunathan (2012) or Faccio, Marchica, and Mura (2014).
Instead, our argument is whether, within the same gender (specifically male) group, the different
level of testosterone of the CEO would be driving the firm to be systematically different in terms 4Other studies include Mehta, Jones, and Josephes (2008), Pound, Penton-Voak, and Surridge (2009), and Zuckerman and Kuhlman (2000) for risky behavior; Wright, Bahrami, Johnson, Di Malta, Rees, Frith, and Dolan (2012) for egocentric behavior. Other studies include Van Honk and Schutter (2007), Wirth and Schultheiss (2007), Josephes, Sellers, Newman, and Mehta (2006). 5 Some people in the Wall Street Journal pointed out that Lehman Brothers may have been safer if it was Lehman Sisters or Lehman Brothers and Sisters (Kristoff, 2009).

2
of risk. A recent report by Perman (2012) reveals that testosterone therapy is becoming popular
among Wall Street traders and some corporate CEOs. Therefore, it is imperative to study the
impact of the testosterone of the CEO on the risk of the firm.
Ideally, the most precise measurement of testosterone levels of the CEOs could be done
by collecting saliva-assay of the CEOs. However, it is next to impossible to implement such
experiments for a large sample of CEOs of the public firms in the US. Yet, we use an alternative
way of gauging the relative cross-sectional variation in testosterone level among the male CEOs
that is easy to implement for any researchers. A person’s adolescent testosterone not only affects
the development of neural circuit but also affects the bone growth, including craniofacial growth.
Moreover, an individual’s facial width to height ratio (fWHR, hereafter) does not change
significantly over time (Jia, van Lent, and Zeng, 2014), and Lefevre et al. (2013) find that fWHR
is significantly positively correlated with both the levels of baseline (circulating) and reactive
testosterone. Penton-Voak and Chen (2004) find that male with facial masculinity have higher
testosterone level in his saliva. These findings validate CEO’s facial features as a measure to
infer his testosterone exposure during puberty and development of the neural circuits which
regulate a person’s aggression and risk takings (Lindberg, Vandenput, Movèrare Skrtic,
Vanderschueren, Boonen, Bouillon, and Ohlsson, 2005; Thornhill and Gangestad, 1999;
Thornhill and Møller, 1997; Verdonck, Gaethofs, Carels, and de Zegher, 1999; Bandiera, Guiso,
Prat, and Sadun, 2010; Penton-Voak and Chen, 2004; Pound, et al., 2009).
Indeed, Carré and McCormick (2008) and Christiansen and Winkler (1992) find that high
fWHR of male predicts more aggressions. Haselhuhn and Wong (2011) find that high fWHR
predicts more cheating and deception, Campbell, Dreber, Apicella, Eisenberg, Gray, Little,
Garcia, Zamore, and Lum (2010) find that it predicts sensation seeking behavior. Moreover,
Apicella (2011), Apicella, Dreber, Campbell, Gray, Hoffman, and Little (2008), and Wong et al.
(2011) find that fWHR predicts more competition driven behavior and higher risk taking of the
person.
Recent literature has discussed the relationship between testosterone, a steroid hormone,
and economic and financial decision-making and economic behavior. In the literature related to
financial risk taking, Apicella et al. (2008) find that men with masculine face as a proxy for
higher testosterone exposure during puberty are more likely to make risky financial decisions.

3
Sapienza, Zingales, and Maestripieri (2009) and Stenstrom, Saad, Nepomuceno, and
Mendemhall (2011) show that risk aversion is negatively related to prenatal testosterone
exposure measured by the ratio of the length of the 2nd (index) finger to the length of the 4th
(ring) finger (2D:4D ratio).6 Coates, Gurnell, and Rustichini (2009) find that lower 2D:4D ratio
of male traders have better trading performance.7
We start by collecting the facial photographs of 3,298 unique CEOs that had CNBC
interviews over 1997~2009, because the CEOs that had interviews by one of the most influential
financial television networks may have more photographs available in the internet. Then we
narrow down to 1,387 CEOs with the best quality pictures agreed by three researchers. Then we
further narrow down to 558 CEOs that are covered in Execucomp. Controlling for selection bias
to be interviewed by CNBC, our multiple regression analyses show significantly positive
association between fWHR and the risk of the firm measured by daily return volatility of the firm.
The finding is robust when we control for CEO’s overconfidence based on option holdings
(Malmendier and Tate (2005)), vocal masculinity measures - such as voice pitch and formant
position of the voice (Mayew, Parsons, Venkatachalam (2013)) -, and CEO’s risky hobbies (Cain
and McKeown, 2014). Also, to make sure that what we find is not driven by some extreme
values of our explanatory variable, we use alternative measures of fWHR, such as the inverse
rank of fWHR (highest (lowest) fWHR CEO having the largest (smallest) ordinal number), the
dummy variables that are one if the CEO belongs to the highest quintile, tercile, and half of
fWHR and find consistent results. One might question whether the result is driven by the cross-
sectional variation between the firms that had only one CEO throughout the sample period.
Therefore, we narrow down to the firms that had CEO turnovers and find consistent results.
For the testosterone level of the CEOs to influence the risk of the firm, the channel
should be either through capital structure decision or capital budgeting decision. Therefore, we
first look at the leverage ratio, and find that high testosterone CEOs are associated with higher
leverage ratio (financial risk), which is consistent with their risk seeking tendency. For capital
budgeting decisions, we look at the acquisitions, because higher testosterone CEOs would be
striving to have dominant position (Mazur and Booth, 1998). We find that high testosterone
6 Higher (lower) prenatal testosterone causes lower (higher) 2D:4D ratio. 7 Coates, Gurnell and Sarnyai (2010) summarize their findings and provide an excellent survey of the relationship between steroid hormones and financial risk-taking.

4
CEOs are more acquisitive in terms of the frequency of the deals and the dollar amounts spent on
acquisitions. Moreover, we find that investor response to acquisition announcement is
significantly more negative when the deal is done by high testosterone CEOs.
To the extent that CEO’s testosterone affects risk taking in his corporate decisions, the
compensation contract should also be affected by the testosterone of the CEO. We analyze the
compensation structure of the CEO and find that high testosterone CEOs’ compensation
packages are significantly more sensitive to the risk (higher Vega) and more sensitive to
performance (delta), using Coles, Daniel, and Naveen’s (2006) measures.
We contribute to the literature about the link between CEO’s traits and organizational
characteristics. Wong, Haselhuhn, and Ormiston (2011) are the first to find positive association
between fWHR and firm performance. Mayew, Parsons, and Venkatachalam (2013) find that
among male CEOs, the ones with deeper voice are more likely to manage larger sized firms. We
look from the angle of company risks and find positive association between testosterone and risk.
Another contribution of our paper is to link between testosterone and acquisitiveness of
the CEO. Mergers and acquisitions have been one of the most widely studied areas in business
and economics, and the hubris or overconfidence of the CEO has been to blame for value
destruction through the acquisition process (Roll, 1986; Malmendier and Tate, 2005; Kim, 2013).
We bring another culprit of the value destruction in acquisition, which is testosterone.
The rest of the paper is organized as follows: In section II, we develop hypotheses to test
throughout the paper. In section III, we describe how we collect the data and construct the
variables. Then we discuss empirical methodology. In section IV, we discuss the empirical
results, and we conclude in section V.
II. HYPOTHESESDEVELOPMENT
A series of studies in accounting and finance have attempted to establish the relationship
between personal characteristics of senior management and corporate financial reporting practice
(Davidson, Dey, and Smith, 2011; Dikolli, Mayew, and Steffen, 2012; Schrand and Zechman,
2012). The recent literature associates CEO personal characteristics with economic decisions

5
through a CEO’s level of testosterone exposure. Wong et al. (2011) use CEO’s fWHR to predict
a firm-level performance and find that CEOs with higher testosterone levels have a higher ROA,
especially for the firms with less cognitively complex firms due to the lower likelihood of
delegating authority to lower level managers. Jia, van Lent, and Zeng (2014) come closest to our
study in that they find that high testosterone CEOs (measured by fWHR) are more likely to
misreport financial statements, to do opportunistic insider trading, and to backdate the option
grant. In comparison, we directly link the testosterone of the CEO to the risk of the firm.8
Therefore, we formulate our most important hypothesis as follows:
H1: High-testosterone CEOs increase the risk of the firms.
To the extent that a CEO could influence the risk level of the firm, he could do so in the
process of either in financing decisions or investment decisions. For financing decisions, we
focus on leverage ratio. Higher leverage ratio increases financial risk of the firm (Hamada, 1972)
Chava and Purnanandam (2010) find that CEO’s incentive is strongly correlated with the capital
structure of the firm. Therefore, we hypothesize as follows:
H2: High- testosterone CEOs increase the leverage ratio (financial risk) of the firms.
For investment decisions, we focus on acquisitions. Graham, Harvey, and Puri (2012)
find that the decision making authority for acquisitions typically belongs to the CEOs. Moreover,
they find that CEO’s preference for risk is an important factor in merger decisions. Even though
acquisition, especially diversifying mergers lowers the risk of the firm (Amihud and Lev, 1981),
excessively frequent mergers or spending too much money on acquisitions may increase the risk
of the firm.9 Therefore, our third hypothesis is as follows:
H3: High-testosterone CEOs are more acquisitive.
If testosterone level of the CEO affects the risk of the firm, it should also affect the
incentive contract of the CEO because of the relation between risk and compensation
(Holmstrom and Milgrom, 1991; Lambert and Larcker, 1987; Yermack, 1995; Bushman et al.,
1996; Aggarwal and Samwick, 1999; Core and Guay, 1999, 2002; Jin, 2002; and Oyer and
8 In untabulated tests, we do not find significant correlation between testosterone and personal violent incidences, or risky hobbies, or extra-marital affairs. 9 Cain and McKeown (2014) find that acquisitions driven by the CEOs that have sensation seeking tendency increases the risk of the firm.

6
Shaefer, 2001). Aggarwal and Samwick (1999) find that pay-performance sensitivity is weaker
for high risk companies due to the difficulty of monitoring. Prendergast (2002) argues that
because of delegation of responsibility, compensation to a manager is positively correlated with
the uncertainty of the firm despite the difficulty of monitoring under uncertainty. Since
compensation is an outcome of a contract between the CEO and the board of directors (Shleifer
and Vishny, 1997), it would reflect CEO’s risk preference, which in turn is affected by his
testosterone level. Since high-testosterone CEOs are more risk seeking, they would prefer to
have compensation package that are more sensitive to the risk of the firm. Empirically, the
sensitivity of compensation to the risk is measured with Vega of the compensation (Core and
Guay, 2002; Coles, Daniel, and Naveen, 2006). Thus, our fourth hypothesis is as follows:
H4: High-testosterone CEOs prefer compensation packages with high VEGA.
III. METHODS
Sample
Because we need to obtain the facial photos of the CEOs from Google Image, we start
with the CEOs that had interviews on CNBC over the period of 1997~2009. We believe that the
images of these CEOs would be easier to find in the web due to the fact that their CNBC
interviews and their associated images would be available given that CNBC has been one of the
most influential financial television networks (Kim and Meschke, 2012; Engelberg, Sasseville,
and Williams,2011). We collect 10,958 CEO interviews from 2,764 unique public firms in the
US done by 3,136 unique CEOs10. After going through the picture collection and measurement
process described in the Appendix A, we narrow down to the 558 unique male CEOs in the
Execucomp to combine the best quality face pictures with their compensation data. The
Execucomp covers the 1,500 largest public firms in the US, and it provides detailed information
about the compensation package, such as option grants and equity ownership of the five highest
paid executives including the CEO. We drop financial institutions (SIC code 6XXX), because
10 For the 6,799 interviews in 1997~2006, we collect the transcripts from Factiva and hand matched their company symbols with CRSP Permno. Since 2007, CNBC stopped providing interview transcripts to Factiva. Thus, we hand collected the remaining interviews (only timestamps, title, and one line summary) from CNBC website over the period of 2007~2009.

7
they are heavily regulated and have drastically different financial risk characteristics than typical
firms in manufacturing industry or service industry.
DependentVariable
Since our primary research question is whether the variation in testosterone level of the
CEOs explains the variation in firm risk, our dependent variable is the total risk of the firm. It is
measured as the standard deviation of the daily stock returns over the fiscal year. Due to the
skewness of the distribution of the variable, we take natural log of it throughout the paper. As
robustness checks, we also use equivalently measured total risk based on six month window that
finishes at the end of fiscal year. Additionally, we use total risk based on monthly return over
the trailing two fiscal years.
IndependentVariable
Testosterone level of the male CEO is proxied by the facial width to height ratio (fWHR)
of the CEO. We follow Carré, McCormick, and Mondloch (2009) to measure fWHR, using
ImageJ software provided by the National Institute of Health (Rasband, 2012). The measure is
defined as the bizygomatic distance divided by the distance between the upper lip and the mid-
brow. Weston, Friday, and Lio (2007) find that male and female start to diverge in terms of their
fWHR at puberty, which suggests that wider face of male is attributable to higher testosterone
level (Verdonck et al.1997).
Controlvariables
We have controls for CEO characteristics and firm characteristics following Cain and
McKeown (2014) where they investigate the impact of CEO’s personal risk-taking measured by
the pilot license of the CEO upon firm risk. CEO characteristics include CEO age and tenure,
and we also use his compensation delta and Vega. We control for CEO age, because testosterone
level decreases in age (Harman et al., 2001). For the CEOs that were appointed during our
sample period, we can calculate the tenure. For the CEOs that stepped down during the sample
period, we look for the tenure information in the Forbes and Google. If missing, we treat the
first year of appearing in the Execucomp as the first year of tenure. Firm risk may be affected by
the incentive structure of the CEO (Core and Guay 2002). Compensation Delta measures the
dollar amount sensitivity of CEO’s total compensation to the change in stock return by one

8
percentage point. Compensation Vega measures the dollar amount sensitivity of CEO’s total
compensation to the change in the volatility of stock return by one percentage point (0.01). We
follow Coles, Daniel, and Naveen (2006) in constructing these two measures.
Size of the firm is proxied by natural log of the book value of assets. We control for
financial risk of the firm, which is book value based leverage ratio ((short term interest bearing
debt + current portion of long term debt + long term debt)/total assets). R&D margin is defined
as R&D expenditure divided by total assets. When R&D is missing, we treat it as zero. Historical
growth of the firm size is proxied by sales growth. Profitability is measured by ROA, which is
computed as operating income before depreciation and amortization divided by total assets.
Growth potential or investment opportunity of the firm is proxied by market to book ratio which
is market capitalization of common stocks divided by book value of equity. We also control for
log of firm age. In all of the regressions, we take industry (four-digit SIC code) fixed effects and
year dummies due to the concern that unobserved heterogeneity attributable to time invariant
characteristics of the industry and time specific shocks may drive the results.
EmpiricalModel
Our empirical model of firm risk is as follows:
Risk . …(1)
fWHR is the facial width to height ratio of the CEO of the firm i in fiscal year t. is a
vector of controls, such as CEO characteristics and firm characteristics that are listed in the
previous subsection11. Because the sample of CEO picture collection started from the CEOs that
had CNBC interviews, we control for self-selection bias by including the inverse Mills’ ratio
(IMR) in all of the regressions (Heckman, 1979), which is obtained from the first stage
regression explained below.
Engelberg and Parsons (2010) point out that media coverage is endogenous. Gurun (2009)
finds that the slant and coverage of a firm by media are significantly affected by whether the
company has media experts in the board of directors. Thus, we conjecture that the probability of
11 In untabulated tests, we also investigate whether the relation between fWHR and risk is curve-linear by including a square term of fWHR. However, we do not find strong support.

9
having CNBC interview would be high if the firm has media experts in the board. We use
BoardEx data to identify the media experts (the ones who are currently working for media
companies or the ones who used to work for media companies during their career history) from
the directors. The detail of collecting the data from BoardEx is described in Appendix B and C.
Gentzkow and Shapiro (2006, 2010) find that readers of newspapers have significant
preference for like-minded news and the media firms try to satisfy their needs by covering the
firms the audience want and give the slant to the direction the audience want. Given that
CNBC’s stated goal is to enable the individual investors to “level the playing field with the
institutional investors,” CNBC would attempt to cover the firms and CEOs that individual
investors are interested in. Also, assuming that individual investors’ demand for coverage could
be inferred from the coverage of other media, we conjecture that CNBC would be more likely to
cover the firms and CEOs that draw much attention from the other media. At the same time,
there could be significant information cascade from CNBC to the other media so that the
companies CNBC cover could also be covered intensively by the other media companies (Kim
and Meschke, 2014). Lastly, media companies can herd in terms of coverage of firms. Thus, our
first stage probit regression is as follows12:
Φ CNBCinterview β β 1 ln 1 #
ln 1 # ………………………………………….(2)
Where CNBCinterview is a dummy variable that is one if the CEO of the firm i had an
interview with CNBC in fiscal year t. # is the number of news articles about the
firm that had CEO’s name in the text. # is the number of news articles about the
firm that did not have CEO’s name in the text. is a vector of controls such as leverage ratio,
log of Tobin’s Q, Return on assets, CEO tenure, lagged value of natural log of total risk of the
firm over the year. Appendix D describes how we collect and count the news articles about the
firms in Execucomp over the sample period and classify the articles into the ones with CEO
names (nicknames) and the ones without.
12 One might question whether the investor response to CEO interviews is any different to the fWHR of the CEO due to the potential of increasing risk of the firm, but we do not find any correlation (untabulated). We believe that the testosterone level of the CEO should be already priced in the market, and should not bring any surprise as the CEO comes to the television media.

10
IV. RESULTS
IV.1.MainResults
We first show the summary statistics of the sample of the firm years for the first stage
selection regression of having CNBC interviews on Panel A of Table 1. Panel B shows the first
stage probit regression. We confirm that the CEOs are more likely to have CNBC interviews
(CNBC is more likely to cover a CEO/firm) if (1) the firm has media experts on the board; (2)
CEO receives more media coverage; (3) the firm receives more media coverage; (4) the firm is
large; (5) the firm has low financial risk; (6) the firm is more profitable; (8) the CEO is more
experienced; and (9) the firm’s total risk was high in the previous year. Notice that the likelihood
of CNBC interview is higher for the firms with higher risk. We obtain inverse Mills’ ratio and
use it in the subsequent second stage regressions.
[Table 1 & 2 about here]
In Panel A of Table 2, we first show the breakdown of the CEOs in our sample by the
industry (1 digit SIC code). Average fWHR of the US CEOs is 2.0207 with a standard deviation
of 0.167. We do not find statistically significant variation in fWHR level across the industries.
One may argue that the fWHR in agriculture, forestry, and fishing industry is low, but we only
have three CEOs in that industry. Besides, our results are robust when we exclude these three
CEOs (untabulated). Eighty seven (87) out of the 558 CEOs are from financial services industry,
but we remove these CEOs because of the drastically different regulatory environment of
banking and insurance industries (notice that financial services firms were excluded in the first
stage selection regression in Table 1 as well).
Panel B of Table 2 shows summary statistics of the sample used in the second stage
regressions of firm risk upon the testosterone level of the CEO. Specifically, we focus on the
regressions where the dependent variable is one year daily return volatility (N=1,976). Notice
that the number of observations is only 1,978 even though we have fWHR for 558 CEOs,
because our first stage regression restricts our data to the ones with valid observations in
BoardEx database.

11
Panel C confirms our hypothesis that high testosterone level CEOs drive up the risk level
of the company. The coefficient of fWHR is 0.101~0.131 depending on the choice of the risk
measurement (6 month~2 years), and the results are significant at 5% level. We concentrate our
analysis on the total risk based on one year period, where the average annualized return volatility
is 44.17%[=2.783%*√252]. Starting from the mean fWHR of 2.020, one standard deviation
increase in fWHR (0.166) is associated with 0.101*0.166=0.0168 increase in ln(total risk over
one year) or 0.75% point increase in annualized return volatility to 44.92%. The coefficients of
the controls generally follow the results in Cain and McKeown (2014), e.g. negative association
with firm CEO compensation Vega, size, sales growth, ROA, and firm age; and positive
association with compensation delta, leverage, and market to book.
IV.2.ControllingforCEOOverconfidence
Some readers may wonder if the fWHR is highly correlated with CEO overconfidence,
because literature finds that male are more likely to be overconfident than female (Barber and
Odean, 2001) and overconfident CEOs are more likely to drive the firm more risky (Malmendier
and Tate (2005). Thus, we control for CEO overconfidence in our next set of regressions.
Overconfidence of the CEO is measured using CEO’s option compensation data, as in
Malmendier and Tate (2005), Campbell, Gallmeyer, Johnson, Rutherford, and Stanley (2011).
“Overconfidence” is a dummy variable that is one if the unexercised option holding of the CEO
is on average more than 67% in the money for a second time or more over the sample period13.
[Table 3 about here]
We show the results in Table 3, and find the correlation between testosterone and risk is
robust with similar economic magnitude. Besides, we do not find statistically significant
correlation between our testosterone measure and overconfidence measure (Pearson
correlation=-0.044 with statistical insignificance). Still, we find separate impact of CEO
overconfidence upon the level of firm risk. When we compare the result in column 3 of Table 3
and that in column 3 of Table 2 (return volatility measured over trailing two years), the economic
magnitude of the coefficient increases with higher statistical significance as we control for the
impact of overconfidence. This assures that the effect of our testosterone upon the firm risk is 13 Our results are similar when we use 100%, 150%, and 200% threshold level of option exercises (untabulated).

12
uniquely different from the effect of CEO overconfidence, which is common in the literature (Jia,
van Lent, and Zeng (2014); Johnson et al. (2006)).14
IV.3.ControllingforVocalMasculinity
Some readers may question whether our testosterone measure could be explained away
by other masculinity measures such as voice pitch (Puts, Hodges, Cardenas, and Gaulin, 2007;
Puts, Apicella, and Cardenas, 2011; Mayew, Parsons, and Venkatachalam, 2013). So, we control
for these variables. Vocal masculinity has two dimensions, voice pitch and formant position.
Because men’s vocal folds and tracts are longer than those of women, men produce voices of
lower fundamental frequency (we label it as F0, following the literature, which is commonly
perceived as voice pitch) and tighter spacing of formant position. Appendix E describes in detail
about how we collect voice pitch and formant position using Praat software and the CNBC
interview video files.
[Table 4 about here]
The results in Table 4 clearly shows that the explanatory power of fWHR is not washed
away after controlling for CEO voice pitch and formant position, as well as overconfidence.
Again, the economic magnitude and statistical significance only increases when we compare the
regressions in the third column of Table 4 and the third column of Table 2. Since deeper male
voice is associated with more male dominance, one may anticipate negative sign of the
coefficient of voice pitch. Also, if we conjecture higher risk level for the firms with more threat
potential (lower formant position) of the CEOs, we may expect negative sign of the coefficient of
the control variable. Interestingly, the coefficients of voice pitch are positive and significant
when the risk is measured over the past 6 months or 2 years. The coefficient of formant position
is not statistically significant at all. One might wonder if the fWHR and the vocal masculinity
are highly correlated through testosterone and provide in insignificant coefficients of the latter
two. However, Pearson correlation between fWHR and voice pitch is -0.009 (statistically
insignificant) and that between fWHR and formant position is only 0.105 (significant at 1%).
We believe that the insignificance of the voice related variables may be attributable to the fact 14 In an untabulated testing, we fail to find correlation between narcissism and testosterone, using the transcripts of the CNBC interviews and the transcripts of quarterly earnings conference calls. Again, this reaffirms that testosterone is a trait distinct from narcissism.

13
that only a subset of the sample with fWHR has valid voice data. What is important is that the
effect of fWHR is robust throughout our tests.
IV.4.ControllingforriskypersonalhobbiesoftheCEO
Cain and McKeown (2014) find that firm level risk is significantly associated with
personal level risk taking behavior, proxied by CEO’s private pilot’s license. Thus, some readers
may argue that the fWHR of the CEO may be merely proxying for the personal risk preference
or sensation seeking tendency of the CEO. Some of the CEOs disclose their hobbies in media
interviews. Therefore, we extensively search in Google, Forbes, Bloomberg Businessweek,
Fortune, and other internet sources for CEO’s hobbies with the caveat that there should be
selection bias to disclose voluntarily. We collect maximum five different hobbies of the CEO.
In the process, we also collect CEO’s personal history to check if the testosterone level of the
CEO is highly correlated with having other risky personal behavior, such as extra-marital affairs,
divorce, drugs, prostitution, physical violence, accounting restatement (GAO database and
Factiva search), and class-action lawsuit (Stanford Lawsuit Clearing House database). However,
we do not find any significant correlation with these incidences, partly because of the media slant
for the firms potentially managed by the PR division of the firms.
Among the 558 CEOs in our sample, we were able to collect the hobby information for
255 CEOs. We standardize the names of the hobbies into 58 hobbies and show the ranking of
the 25 most common hobbies of the CEOs in Figure 1. Golf is by far the most common hobby
(29% of the CEOs claimed golf is their hobby), followed by skiing (13%), reading (12%),
basketball (9%, and tennis (8%). We classify the hobbies of the CEO into risky sports versus not
using a criterion set by the life insurance experts based on the list of risky hobbies by referring to
six websites, such as “13 Hobbies That Drive Up Term Life Insurance Rates.”15 Among the 58
hobbies, we label the following nine hobbies as risky hobbies: flying airplanes (pilot: 6 CEOs),
15 The list of risky hobbies change as new hobbies are explored and invented by many people. We use the following list of websites to come up with the list of risky hobbies: “13 Hobbies That Drive Up Term Life Insurance Rates” by INSWEB (http://www.insweb.com/life-insurance/13-hobbies-life-insurance.html), “Top 10 Incredibly Dangerous Sports” by LISTVERSE (http://listverse.com/2009/06/18/top-10-incredibly-dangerous-sports/), “The 7 Deadly Hobbies: Pastimes Your Insurer Hates” by (http://www.dailyfinance.com/2011/10/04/the-7-deadly-hobbies-pastimes-your-insurer-hates/), “Hazardous Pastimes & Hobbies” by Life-insurance-help.co.uk (http://www.life-insurance-help.co.uk/life_insurance_hazardous_hobbies.php), “Eight Hobbies Your Life Insurer Won’t Approve Of” by Investopedia (http://www.investopedia.com/slide-show/dangerous-hobbies/), and “Top 10 Deadliest Hobbies” by TOPTENZ.NET (http://www.toptenz.net/top-10-deadliest-hobbies.php).

14
scuba diving (4 CEOs), car racing (8 CEOs), martial art (boxing, Tae-Kwan-do, and wrestling: 3
CEOs), hose riding (horse-back riding:7 CEOs), ranching (horse cutting and ranching:2 CEOs),
mountain climbing (including rock climbing: 3 CEOs), risky boating (ocean kayaking: 1 CEO),
risky biking (motor cycle racing and off-road motor biking: 3 CEOs).
[Figure 1 about here]
In the regressions of Panel A of Table 5, we include the dummy variable that is one if the
CEO has risky hobbies as a control variable. We find that CEO’s that enjoy risky hobbies
significantly increase the firm’s total risk (coefficient is 0.088 with a t-stat of 2.08 in the
regression of one year risk). Interestingly, our testosterone measure, fWHR, preserves its
explanatory power. The coefficient almost doubles from the coefficients in Table 3 to
0.25~0.296 with a t-stat of 2.46~2.64 depending on the methods of risk measures.
In Panel B of Table 5, we replace the “risky hobbies” dummy with the set of nine dummy
variables of the categories of specific risky hobbies. For example, “flying airplanes” is takes the
value of one if the CEO is reported to have the hobby of civil aviation.
[Table 4 about here]
Consistent with Cain and McKeown (2014), we find that CEOs with a hobby of piloting
an airplane significantly increase the firm risk. We also find that CEOs having the hobbies of
horse-back riding and risky biking increase the firm risk. Some supposedly risky hobbies such as
mountain climbing are associated with lowering the risk of the firm. However, these effects of
hobbies do not wash away the impact of testosterone (fWHR). 16
16 In an untabulated analysis, we fail to find significant correlation between our testosterone measure and other personal specifics, such as experiencing divorce or separation, having love affairs, having sexual harassment related accusations, being reported as having committed physical violence. The psychology literature documents close correlation of these occurrences with higher testosterone which is proxied by wider faces. However, there are several problems to empirically test it. For a wrongdoing to be observable, it has to be detected as well as committed. Since our CEOs are high profile persons of big corporations with a lot of economic resources. To the extent that these people are high ability persons, they may be able to conceal significant part of their own wrongdoings under the radar. Also, even if there were some wrongdoings, the PR division would try their best not to publicize. Therefore, the data we obtain through class action lawsuits database and news article search through Factiva has substantial limitations.

15
IV.5.AlternativemeasuresoffWHR
One may question whether our result is robust if we switch our continuous measure of
testosterone with non-parametric measures. Thus, in Panel A of Table 6, we replace fWHR with
the inverse rank of fWHR (1st column: smallest fWHR being rank 1 and largest fWHR being
rank 558), the dummy variable that is one if the CEO belongs to the highest quintile (1/5) in
terms of fWHR, the dummy variable that is one if the CEO belongs to the highest tercile (1/3) in
terms of fWHR, and the dummy variable that is one if the CEO belongs to the highest half in
terms of fWHR. The result is robust. In untabulated tests, (1) we replace the set of hobby
variables with the risky hobbies dummy and obtain similar results; and (2) we run the same
regressions as in Table 4 by excluding highest quartiles of fWHR, and we obtain consistent
results.
Some readers may question whether the correlation is robust when we restrict our sample
to the firms that had at least one CEO turnovers to check if what we document is not attributable
to unobserved heterogeneity among different firms. Panel B in Table 6 confirms the robustness.
In this set of regressions, we report only on 1 year risk measure to save space.
[Table 6 about here]
IV.6.LeverageandTestosterone
If the testosterone level increases the risk level of the firm, one of the possible channels
could be the CEO’s decision on financial leverage. Thus, in this subsection we investigate
whether CEOs with high testosterone level increase the leverage ratio of the firm. The empirical
model is as follows:
Leverage …(3)
Where Leverage is market value based leverage ratio that is computed as total
debt/(total debt + market value of equity). We compute market value of equity as the number of
common shares outstanding times the stock price as of the fiscal year end. X is a vector of
control variables, which consists of the following variables: (1) dummy variable of risky hobbies
that is one if the CEO has risky hobbies; (2) voice pitch of the CEO; (3) formant position of the
CEO’s voice; (4) overconfidence dummy; (5) CEO age; (6) log of CEO tenure; (7) compensation

16
delta; (8) compensation VEGA; (9) sales growth; (10) ROA; (11) market to book ratio; (12) firm
size (log of assets); and (13) collateral, proxied by the gross property, plant, and equipment
divided by total assets.
Consistent with our hypothesis, we find that CEOs with higher testosterone level
significantly increase the leverage ratio of the firm. One standard deviation increase in fWHR
translates into an increase of leverage ratio by 2.82% point from the sample average of 19.95%
with a t-statistic of 2.99. The result is robust when we replace the fWHR with non-parametric
measures of testosterone level. In Panel B, we do a robustness check by replacing the dependent
variable with book value of leverage ratio. The result is robust.
[Table 7 about here]
IV.7.AcquisitivenessandTestosterone
Since testosterone is associated with male dominance, one of the ways to achieve such
dominance in the profession of the CEO is to take over another firm. In addition, acquisition is
an important capital budgeting decision that could affect the risk of the firm. Thus, in this
subsection, we test whether high testosterone CEOs are more acquisitive. Using SDC Platinum
data, we obtain the information about completed acquisitions in which more than 50% target
shares were acquired and in which the deal value was at least five million dollars. As in Güner,
Malmendier and Tate (2008), leveraged buyouts, recapitalizations, self-tenders, subsidiary
acquisitions, spin-offs, exchange offers, repurchases, minority stake purchases, privatizations,
and remaining interest acquisitions are excluded. We set up the empirical model as follows:
1 acquired irm …(4)
Where 1 acquired is a dummy variable that is one if the company acquired a target
company in fiscal year t. Following Cain and McKeown (2014) the control variables ( ) are
1{Risky Hobbies}, voice pitch and formant position of the CEO, overconfidence, age, tenure,
compensation delta and VEGA of the CEO, leverage ratio, dividend yield, ROA, firm size, cash
flow (=(net income + depreciation)/lagged property, plant, and equipment), Tobin’s Q ((book
value of assets + market value of equity - book value of equity)/book value of assets), and
investment (=capital expenditure/ lagged property, plant, and equipment). The result is shown in

17
Panel A of Table 7. The coefficient of fWHR is 2.605 with a t-statistic of 2.84, supporting that
high-testosterone CEOs are more acquisitive. The result is robust when we use alternative
measures of testosterone.
In Panel B, we replace the dependent variable with (1) the aggregate dollar amount of
deal values (columns 1 and 2) and (2) the average dollar amount per deal (columns 3 and 4). The
result is consistent, and it shows that CEOs with higher testosterone level are more likely to have
bigger sized deals on average and spend more money in total. Starting from the mean of
aggregate deal value of $196 million, one standard deviation increase in fWHR is associated
with an increase in the aggregate deal value by $1,847 million. The economic magnitude of the
impact of testosterone is very large. We do not find significant impact of testosterone on the
frequency of the acquisition. Instead, we find its impact on the average deal size. Therefore,
high-testosterone CEOs seem to do large sized acquisitions to establish dominant positions than
frequent acquisitions. It may be that Roll’s hubris hypothesis (1980) is mainly attributable to the
CEOs with higher testosterone level given that male are more likely to be overconfident (Barber
and Odean, 2002).
[Table 8 about here]
Given that we find high testosterone CEOs spend more dollars per deal, it is conceivable
that high-testosterone CEOs destroy shareholder value by spending too much on acquisition. As
a consequence, once an acquisition is announced, the stock market response would be more
negative for the deals done by high-testosterone CEOs. Thus, we do regression analyses of
cumulative abnormal returns around the time of acquisition announcements. We follow Cain
and McKeown (2014) in terms of the specification of control variables that are lagged by one
year. The result in Table 9 confirms our hypothesis. We find significant negative coefficient on
the measure of testosterone. When testosterone level is higher by one standard deviation, the
announcement return is 0.88% lower (=0.053*0.1669; t-statistic=2.09 in column 2).
[Table 9 about here]

18
IV.8.TestosteroneandCEOcompensationstructure
Thus far, we find that high-testosterone CEOs increase the risk of the firm. Given that
compensation contract is a mechanism to align the interest of the CEO with that of the
shareholders, the choice of compensation package by the CEO may be significantly affected by
the testosterone level of the CEO. Specifically, since high testosterone CEOs are less afraid to
take the risk, he may choose the compensation that increases more when the risk of the firm
increases. Consequently, high testosterone CEOs may prefer high VEGA compensation package,
in which VEGA measures the dollar amount change in CEO option holdings when the volatility
of the stock changes by one percentage point (Coles, Daniel, and Naveen, 2006). Also, since
high testosterone would spur the CEO to make decisions to be dominant in terms of performance,
he would prefer high Delta compensation package. Delta measures the dollar amount change in
compensation when the stock return increases by one percentage point (Coles, Daniel, and
Naveen, 2006). At the same time, the board of directors may want to exploit the CEO’s traits,
such as high-testosterone. Our argument is equivalent to the theoretical prediction about the
relation between overconfidence and CEO incentives in Gervais, Heaton, and Odean (2010).
There, the authors predict that companies would provide convex compensation to overconfident
CEOs. In empirical model, we largely follow Low (2009) where the author finds exogenous
increase in takeover protection results in lower Vega of CEO compensation.
ln 1 VEGA irm ….(5),
ln 1 DELTA irm ….(6),
where is a vector of the following control variables: overconfidence, tenure, chairman CEO
duality dummy, dummy variable for high ownership of the CEO, CEO age, total return volatility
over one year, ROA, leverage ratio, firm size, and market to book ratio.
[Table 10 about here]
The results show that high-testosterone CEOs have high-VEGA compensation and high-
Delta compensation. One standard deviation increase in fWHR is associated with an increase in
Vega by $391,674 from the sample mean of $241,097 (t-stat of 3.97) and an increase in Delta by
$6.4 million from the sample mean of $2.6 million (t-stat of 4.12). The results are similar when

19
we replace fWHR with other alternative measures such as the inverse of rank and the dummy
variables of highest fWHR quantile.
V. CONCLUSION
Recent global financial crisis gave a serious lesson about the downside risk of high-
testosterone corporate culture (Adams and Ragunathan, 2012; Kristof, 2009; and Sherman, 2012).
Until now, it has been impossible to measure the testosterone levels of a large sample of CEOs.
Borrowing from the literature of neuroendocrinology, we proxy for the testosterone of the CEOs
by measuring the facial width-to-height ratio of male CEOs (Wong, Ormiston, Haselhuhn, 2011;
Carré and McCormick, 2008). The findings in our paper suggest that CEOs of high testosterone
level indeed increase the risk level of the firm. The empirical channels we find are through
leverage increase and acquisitions. Naturally, the high-testosterone CEOs prefer volatility
inducing compensation package. Our paper contributes to the literature in a handful of aspects.
First, it fills the gap in the literature by finding the direct evidence that high testosterone of the
CEO increases firm risk. The result is important because it is the first finding that the hormone
level of the leader has an impact on the organization’s risk level and decision making, while the
literature has been finding evidence on personal financial decisions. Second, we contribute to
the literature about capital structure by providing the first evidence that it is significantly affected
by testosterone of the CEO. Third, we contribute to the literature about M&A and CEO
characteristics in the sense that testosterone level affects the acquisitiveness of the CEO.
Our finding that testosterone level is not significantly correlated with overconfidence
identifier is commonly reported by contemporaneous researchers (Jia, van Lent, and Zeng, 2014).
Also, it is noteworthy that our testosterone measure is not a substitute of personal risk-taking
proxied by CEO’s exotic hobbies (Cain and McKeown, 2014). Lastly, one of the practical
implications of our paper is that frontal face photos of male candidates could be informative
about their testosterone level and risk appetite in organizational decision making. Hence,
collecting face photos could be helpful for the underwriters in insurance industry (at least for
director and executive insurance).

20
References Adams, R. B. and V. Ragunathan, 2012. Lehman Sisters. UNSW working paper.
http://abfer.org/docs/2014/track1/lehman-sisters.pdf Amihud, Y, and Lev, B., 1981. Risk Reduction as a Managerial Motive for Conglomerate
Mergers, The Bell Journal of Economics, Vol. 12. No. 2, 605-617. Aggarwal, R. K., and Samwick, A. A., 1999. The Other Side of the Trade-off: The Impact of
Risk on Executive Compensation. Journal of Political Economy, 107, 65-105. Apicella, C. L. “Androgens and competitiveness in men.” Journal of Neuroscience, Psychology,
and Economics 4 (2011). Apicella, C. L.; A. Dreber; B. Campbell; P. B. Gray; M. Hoffman and A. C. Little.
“Testosterone and financial risk preferences.” Evolution and Human Behavior 29 (2008): 384-390.
Archer, J., 2006, “Testosterone and human aggression: an evaluation of the challenge hypothesis,” Neuroscience and Biobehavioral Reviews 30(3): 319–345.
Bandiera, O.; L. Guiso; A. Prat and R. Sadun 'Matching firms, managers, and incentives,' 2010. Barber, B. M. and T. Odean, 2001. “Boys will be boys: Gender, overconfidence, and common
stock investment.” The Quarterly Journal of Economics 116: 261-292. Bertrand, M. and A. Schoar. “Managing with style: the effect of managers of firm policies.”
Quarterly Journal of Economics CXVIII (2003): 1169-1208. Bushman, R. M., Dai, and Wang, X., 2010. Risk and CEO Turnover. Journal of Financial
Economics, Bushman, R. M., Indjejikian, R. J., and Smith A., 1996. CEO Compensation: The Role of
Individual Performance Evaluation, Journal of Accounting and Economics, 21, 161-193. Cain, M. D., McKeown, S. B., 2014. CEO personal risk-taking and corporate policies. Journal
of Financial and Quantitative Analysis, forthcoming. Campbell, T. C., M. Gallmeyer, S. A. Johnson, J. Rutherford, and B. W. Stanley, 2011. CEO
Optimism and Forced Turnover. Journal of Financial Economics, Vol. 101 (3), 695-712. Campbell, B. C.; A. Dreber; C. L. Apicella; D. T. A. Eisenberg; P. B. Gray; A. C. Little; J. R.
Garcia; R. S. Zamore and J. K. Lum. “Testosterone exposure, dopaminergic reward, and sensation-seeking in young men.” Physiology & Behavior 99 (2010): 451-456.
Carre, J. M., and C. M. McCormick, 2008. In your face: facial metrics predict aggressive behavior in the laboratory and in varsity and professional hockey players. Proceedings of the Royal Society Bulletin” Biological Sciences, 275, 2651-2656.
Carre, J. M., C. M. McCormick, and C. J. Mondloch, 2009. Facial structure is a reliable cue of aggressive behavior. Psychological Science, 20, 1194-1198.
Cesarini, D.; C. T. Dawes; M. Johannesson; P. Lichtenstein and B. Wallace. “Genetic Variation in Preferences for Giving and Risk Taking.” The Quarterly Journal of Economics 124 (2009): 809-842.
Cesarini, D.; M. Johannesson; P. Lichtenstein; Ö. Sandewall and B. Wallace. “Genetic Variation in Financial Decision-Making.” The Journal of Finance 65 (2010): 1725-1754.
Chava, S., and A. Purnanandam, 2010. “CEOs versus CFOs: Incentives and corporate policies,” 97(2):263-278.
Christiansen, K. and E.-M. Winkler. “Hormonal, anthropometrical, and behavioural correlates of physical aggression in !Kung San men of Namibia.” Aggressive Behavior 18 (1992): 271-280.

21
Coates, J. M.; M. Gurnell and A. Rustichini. “Second-to-fourth digit ratio predicts success among high-frequency financial traders.” Proceedings of the National Academy of Sciences 106 (2009): 623-628.
Coates, J. M. and J. Herbert. “Endogenous steroids and financial risk taking on a London trading floor.” Proceedings of the National Academy of Sciences 105 (2008): 6167-6172.
Coates, J. M., M. Gurnell, and Z. Sarnyai, 2010. “From molecule to market: steroid hormones and financial risk-taking,” Philosophical Transactions of the Royal Society B: Biological Sciences 365(1538):331-343.
Coles, J. L., N. D. Daniel, L. Naveen, 2006. “Managerial incentives and risk-taking,” Journal of Financial Economics, 79(2): 431–468.
Core, J., and Guay, W., 1999. The Use of Equity Grants to Manage Optimal Equity Incentive Levels. Journal of Accounting and Economics, 28, 151-184.
Core, J., and Guay, W.,2002. The Other Side of the Trade-off: The Impact of Risk on Executive Compensation: Comment, Journal of Political Economy.
Dabbs, J. M. and R. Morris. “Testosterone, social class, and antisocial behavior in a sample of 4,462 men.” Psychological Science 1 (1990): 209-211.
Davidson, R. H.; A. Dey and A. Smith 'Executives' 'off-the-job' behavior, corporate culture, and financial reporting risk,' 2011.
Dikolli, S. S.; W. J. Mayew and T. D. Steffen 'Honoring one's word: CEO integrity and accruals quality,' 2012.
Eisenegger, C.; M. Naef; R. Snozzi; M. Heinrichs and E. Fehr. “Prejudice and truth about the effect of testosterone on human bargaining behaviour.” Nature 463 (2010): 356-359.
Engelberg, J., and C. A., Parsons, 2010. The Causal Impact of Media in Financial Markets. The Journal of Finance,
Engelberg, J., Sasseville, C., and Williams, J., 2012. Market madness: the case of Mad Money, Management Science, 351-364.
Faccio, M., M-T. Marchica, and R. Mura, 2014. CEO gender and corporate risk-taking. Purdue University working paper.
Fee, C. E.; C. J. Hadlock and J. R. Pierce. “Managers with and without Style: Evidence Using Exogenous Variation.” Review of Financial Studies 26 (2013): 567-601.
Gentzkow, M. and J. M. Shapiro, 2006. Media Bias and Reputation. Journal of Political Economy, vol. 114, No. 2, 280-316.
Gentzkow, M. and J. M. Shapiro, 2010. What drives media slant? Evidence from US Daily Newspapers. Econometrica, Vol. 78, No. 1, 35-71.
Gervais, S., Heaton, J.B., Odean, T., 2011. Overconfidence, Compensation Contracts, and Capital Budgeting. The Journal of Finance 66, 1735-1777
Graham, J. R.; C. R. Harvey and M. Puri. “Managerial Attitudes and Corporate Actions.” Journal of Financial Economics in press (2012).
Güner, A. B., U. Malmendier, and G. Tate, 2008. “Financial expertise of directors,” Journal of Financial Economics, 88(2): 323–354.
Gurun, U. G., 2009. “Good New Is Endogenous,” Working Paper, University of Texas at Dallas.
Hamada, R.S., 1972. The Effect of the Firm's Capital Structure on the Systematic Risk of Common Stocks, The Journal of Finance, 27(2):435-452.

22
Hartgens, F., and H. Kuipers, 2004. “Effects of androgenic-anabolic steroids in athletes,” Sports Medicine, 34: 513–554.
Harman, S. M., E. J. Metter, J. D. Tobin, J. Pearson, and M. R. Blackman, 2001, “Longitudinal Effects of Aging on Serum Total and Free Testosterone Levels in Healthy Men,” Journal of Clinical Endocrinology & Metabolism, 86(2):724-731.
Haselhuhn, M. P. and E. M. Wong, 2011. “Bad to the bone: facial structure predicts unethical behaviour.” Proceedings of the Royal Society B: Biological Sciences.
Heckman, J. J., 1979. “Sample Selection Bias as a Specification Error,” Econometrica, 47(1): 153-161.
Hirshleifer, D., A. LOW and S. H. Teoh, 2012, “Are Overconfident CEOs Better Innovators?,” Journal of Finance, 67(4): 1457–1498.
Holmstrom, B. and P. Milgrom, “Multitask Principal-Agent Analyses: Incentive Contracts, Asset Ownership, and Job Design,” Journal of Law, Economics, & Organization, 7: 24-52.
Jia, Y., L. van Lent, Y. Zeng, 2014. Testosterone and Financial Misreporting. SSRN eLibrary http://ssrn.com/abstract=2265510
Jin, L., 2002. “CEO compensation, diversification, and incentives,” Journal of Financial Economics, 66(1): 29–63. Johnson, D. D. P.; R. McDermott; E. S. Barrett; J. Cowden; R. Wrangham; M. H. McIntyre and S.
P. Rosen, 2006. “Overconfidence in wargames: experimental evidence on expectations, aggression, gender and testosterone.” Proceedings of the Royal Society B: Biological Sciences 273: 2513-2520.
Josephs, R. A., Sellers, J. G., Newman, M. L., & Mehta, P. H., 2006. The mismatch effect: When testosterone and status are at odds. Journal of Personality and Social Psychology, 90, 999–1013.
Kastlunger, B.; S. G. Dressler; E. Kirchler; L. Mittone and M. Voracek. “Sex differences in tax compliance: Differentiating between demographic sex, gender role orientation, and prenatal masculinization (2D:4D).” Journal of Economic Psychology 31 (2010): 542-552.
Kim, A. Y. H., 2013. Self-attribution bias of the CEO: Evidence from CEO interviews on CNBC. Journal of Banking & Finance, 2472-2489.
Kim, A. Y. H, and F. Meschke, 2013. CEO Interviews on CNBC. Nanyang Business School working paper.
Kristof, N., 2009, “Mistresses of the Universe,” The New York Times, February 7, http://www.nytimes.com/2009/02/08/opinion/08kristof.html.
Lambert, R. A., and D. F. Larcker, 1987. “An Analysis of the use of Accounting and Market Measures of Performance in Executive Compensation Contracts,” Journal of Accounting Research, 25: 85-125.
Lefevre, C. E., G. J. Lewis, D. I. Perrett and L. Penke, 2013. “Telling facial metrics: facial width is associated with testosterone levels in men,” Evolution and Human Behavior, 34(4): 273-279.
Lindberg, M. K.; L. Vandenput; S. Moverare Skrtic; D. Vanderschueren; S. Boonen; R. Bouillon and C. Ohlson,2005. “Androgens and the skeleton.” Minerva endocrinologica 30: 15-25.
Low, A., 2009. Managerial risk-taking behavior and equity-based compensation. Journal of Financial Economics, 97, 12-32.

23
Malmendier, U., and G. Tate, 2005. CEO Overconfidence and Corporate Investment. The Journal of Finance, Vol.XL, No.6, 2661-2700.
Malmendier, U., and G. Tate, 2008. “Who makes acquisitions? CEO overconfidence and the market's reaction.” Journal of Financial Economics, 89(1): 20-43.
Mayew, W. J., C. A. Parsons, and M. Venkatachalam, 2013. Voice pitch and the labor market success of male chief executive officers Evolution and Human Behavior, 34, 243-248.
Mazur, A., and Booth, A., 1998. Testosterone and dominance in men. Behavior Brain Science, 21, 353-363.
Mehta, P. H. and J. Beer. “Neural mechanisms of the testosterone-aggression relation: the role of orbitofrontal cortex.” Journal of Cognitive Neuroscience 22 (2009): 2357-2368.
Mehta, P. H.; A. C. Jones and R. A. Josephs. “The Social Endocrinology of Dominance: Basal Testosterone Predicts Cortisol Changes and Behavior Following Victory and Defeat.” Journal of Personality and Social Psychology 94 (2008): 1078-1093.
Oyer, P. and Shaefer, S., 2001. Why Do Some Firms Give Stock Options to All Employees? An Empirical Examination of Alternative Theories. Journal of Financial Economics, 76, 99-133.
Penton-Voak, I. S. and J. Y. Chen. “High salivary testosterone is linked to masculine male facial appearance in humans.” Evolution and Human Behavior 25 (2004): 229-241.
Perman, C., 2012. “Wall Street’s Secret Weapon for Getting an Edge,” July 11, http://www.cnbc.com/id/48149955
Pound, N.; I. S. Penton - Voak and A. K. Surridge. “Testosterone responses to competition in men are related to facial masculinity.” Proceedings of the Royal Society B: Biological Sciences 276 (2009): 153-159.
Prendergast, C., 2002. “The Tenuous Trade‐off between Risk and Incentives,” Journal of Political Economy, 110(5): 1071-1102.
Puts, D. A., C. L. Apicella, and R. A. Cárdenas, 2011. “Masculine voices signal men's threat potential in forager and industrial societies,” Proceedings of The Royal Society: B, rspb.2011.0829.
Puts, D. A., C. R. Hodges, R. A. Cárdenas, S. J.C. Gaulin, 2007. “Men's voices as dominance signals: vocal fundamental and formant frequencies influence dominance attributions among men,” Evolution and Human Behavior, 28(5): 340–344.
Rasband, W. S., 2012. ImageJ. [Computer software] retrieved from http://imagej.nih.gov/ij/index.html
Roberti, J. W., 2004. “A review of behavioral and biological correlates of sensation seeking,” Journal of Research in Personality, 38: 256–279.
Roll, R., 1986. The Hubris Hypothesis of Corporate Takeovers. Journal of Business, Vol. 59, 197-216.
Sapienza, P.; L. Zingales and D. Maestripieri. “Gender differences in financial risk aversion and career choices are affected by testosterone.” Proceedings of the National Academy of Sciences 106 (2009): 15268-15273.
Schrand, C. M. and S. L. C. Zechman. “Executive overconfidence and the slippery slope to financial misreporting.” Journal of Accounting and Economics 53 (2012): 311-329.
Sherman, G., 2012. “The End of Wall Street as They Knew It,” New York Magazine, February http://nymag.com/news/features/wall-street-2012-2/ .
Shleifer, A., and R. W. Vishny, 1997. “A Survey of Corporate Governance,” Journal of Finance,

24
52(2): 737–783. Stenstrom, E., G. Saad, M. V. Nepomuceno, Z. Mendenhall, 2011. “Testosterone and domain-
specific risk: Digit ratios (2D:4D and rel2) as predictors of recreational, financial, and social risk-taking behaviors,” Personality and Individual Differences 51(4): 412–416.
Thornhill, R. and S. W. Gangestad. “Facial attractiveness.” Trends in cognitive sciences 3 (1999): 452-460.
Thornhill, R. and A. P. Moller. “Developmental stability, disease and medicine.” Biological Reviews 72 (1997): 497-548.
Van Honk, j. and D. J.L.G. Schutter, 2007, “Testosterone Reduces Conscious Detection of Signals Serving Social Correction,” Psychological Science, 18(8):663-667.
Verdonck, A.; M. Gaethofs; C. Carels and F. De Zegher. “Effect of low-dose testosterone treatment on craniofacial growth in boys with delayed puberty.” The European Journal of Orthodontics 21 (1999): 137-143.
Weston E.M., A.E. Friday, P. Liò, 2007. “Biometric Evidence that Sexual Selection Has Shaped the Hominin Face,” PLoS ONE 2(8): e710
Wirth, M., and Schultheiss, O. (2007). Basal testosterone moderates responses to anger faces in humans. Physiology & Behavior, 90, 496–505.
Wong, E. M.; M. E. Ormston and M. P. Haselhuhn, 2011. “A Face Only an Investor Could Love.” Psychological Science, 22(12): 1478-83.
Wright, N. D.; B. Bahrami; E. Johnson; G. Di Malta; G. Rees; C. D. Frith and R. J. Dolan. “Testosterone disrupts human collaboration by increasing egocentric choices.” Proceedings of the Royal Society B: Biological Sciences 279 (2012): 2275-2280.
Yermack, D., 1995. “Do corporations award CEO stock options effectively,” Journal of Financial Economics, 39(2–3), 237–269.
Zuckerman, M. and D. M. Kuhlman. “Personality and Risk-Taking: Common Bisocial Factors.” Journal of Personality 68 (2000): 999-1029.

25
AppendixA.ProcedureofselectingbestqualityCEOpicturesWe start with the 3,298 unique CEOs that had CNBC interviews at least one time over the sample period. For each of the CEOs, we collect the facial pictures of the person using his name string and company name (either from CNBC transcript or from Compustat) using Google Image. We are able to obtain facial pictures for 3,136 unique CEOs. We follow Carré, McCormick, and Mondloch (2009) to measure the facial width to height ratio. First, each photo was converted to 8-bit, gray scale image with a standard height of 400 pixels. When a picture is big and contains more than the face and upper chest of the CEO, we cut the picture to focus on the facial part and convert it similarly. Then with the converted picture files two research assistants independently measure the bizygomatic distance and upper facial height (fWHR). Even though we try to obtain CEO pictures of directly facing the front, we are not able to obtain the highest quality photographs for all of the CEOs. For example, some pictures are too small and have low resolution. Also, since human face is a 3-dimensional object while fWHR is measured through a 2-dimensional photo, the measure could be affected by the head posture of the CEO and the angle of the camera. Some pictures are taken from sideways (about 30~45 degrees) or angled from downside or upside, which makes it difficult to measure his bizygomatic distance. Also, in some pictures, even though the camera angle was perfectly from the front, the CEO rotated his face clockwise or counterclockwise. But in this case, we treat it as high quality picture, because we can reverse the rotation and measure correctly. Therefore, each research assistant gives ratings of the photographs from zero to three in terms of suitability for measuring fWHR.
0: Worst posture in which only one ear is visible, because (1) the person is facing sideways; or (2) the photographer took the picture from below or from above so that the measurement of facial height could be problematic.
1: One ear is perfectly visible but only half of the other ear is visible, because the person is facing slightly sideways. The photographer took the picture from below or from above so that the measurement of facial height could be problematic.
2: Both ears are clearly visible to their roots in the face and the person is looking straight to the front, but the head is slightly rotated either clockwise or counterclockwise.
3: Perfect posture in which both ears are clearly visible to their roots in the head and the person is looking straight to the front.
In addition, one of the coauthors independently gave ratings of the pictures. Then, we narrow down to the pictures in which all three raters gave the rating of at least 2. By these, we narrowed down to 1,387 CEO pictures. Cronbach’s alpha for the two RA’s measures was 0.85. Notice almost 2/3 of the initially collected pictures was dropped at this stage even though all of these were deemed as best candidate pictures for the respective CEOs in our sample. Furthermore, we narrow down to the CEOs in the Execucomp, which finally gives us 558 unique CEOs.

26
AppendixFigure1.MeasuringfWHRusingCEOpictures
[Photograph of Robert I. Toll, CEO of Toll Brothers (TOL), source: Google Image Search]
We follow Carré and McCormick (2008) and Mayew, Parsons, and Venkatachalam (2013) in measuring the facial width-to-height ratio. Specifically, it is the distance between the left and the right zygion (bizygomatic width) divided by the distance between upper lip and the midpoint of the inner ends of the eyebrows (upper facial height). Some researchers, such as Jia, van Lent, and Zeng (2014) and Lefevre, Lewis, Perrett, and Penke (2013) measure the upper facial height in a slightly different manner in that they measure the distance between the upper lip and the heights point of the eyelids. We believe that our measurement process is better following the theory, because it is about the growth of sexually dimorphic growth of the bones (not the skin) triggered by different testosterone levels.
Some readers may question that sometimes the pictures are squeezed horizontally or vertically, which may bring about unwanted noises. We have two answers: (1) such manipulation biases against finding the results; (2) it is very difficult to believe that the modifiers of risky firms are intentionally flattening the face; (3) Google image search throws us many different pictures of the same CEO, which enables us to sort out some potentially manipulated pictures.

27
[Photograph of Steve Jobs, CEO of Apple Inc (AAPL), source: Google Image Search]
For some CEO pictures, the difference in measurement algorithm does not make any difference, because the highest point of the eyelids and the midpoint of the two inner points of the eyebrows are at the same height.

28
AppendixB.LinkbetweenBoardExandCompustatdatabasesandidentifyingexecutivesThe problem with BoardEx data is that less than 7,185 firm names out of 601,442 organization names are matched with the Compustat database on a one-to-one basis through the CIK number. One slightly different name spelling of the same company would fail to have a matching CIK. Since BoardEx is only partially merged with Compustat, I run exhaustive fuzzy text/string matches to find firm identification numbers from all the databases to which the school subscribes. I run multiple rounds of string matching using the following databases in a recursive manner in the sense that whatever is left over from the current matching round with a certain database is used again in the next matching round with the next database. These databases include Compustat North America, Compustat Global, CRSP, Dealscan, Bank Regulatory Database by Chicago FED (find Bank Holding Company Names), Jay Ritter's IPO Adviser ranking table, SDC Platinum (M&A/IPO adviser names). I use the compged function of SAS, which is the most sophisticated linguistic string match technique. I obtain identification numbers for 40,434 organization names in BoardEx from any of the databases listed above, and I am then able to identify whether the company is a commercial bank or investment bank. For these 40,434 matched names, I hand-check whether the two company names (one from BoardEx and the other from one of the listed databases) really are the same business identity using BusinessWeek and Hoovers databases and then checking their websites. In checking whether the companies really are a bank holding company, I use the FDIC Bankfind database on their website. After this procedure, 39,370 of the BoardEx company names are matched with the ID numbers of one of the databases above17. Focusing on the GVKEYs, 27,035 unique GVKEYs are matched to 33,030 firm names in BoardEx, which is 4.6 times the number of initial matches through CIK.
17 This number means that 6.55% different organization names in BoardEx are linked to standard databases. The reason for such a small matching result is that most of the organizations are non-profit organizations such as universities, clubs, government organizations, international organizations, etc.

29
AppendixC.TheprocedureofidentifyingdirectorswithmediaexpertiseWe first identify all the firms that belong to printed, audio, or visual media. From the list of organizations in BoardEx, we first extract the firms with GVKEY match, because we can track the SIC code. For this group, we identify the firm as a potential media company if the SIC code belongs to the following set: {SIC code = X | 2700 <= X <=2709, 2710 <= X <=2719, 2720 <= X <=2729, 2730 <= X <=2739, 2740 <= X <=2749, 4800 <= X <=4800, 4830 <= X <=4839, 4840 <= X <=4841, 4880 <= X <=4889, 4890 <= X <=4890, 4891 <= X <=4891, 4892 <= X <=4892, 4899 <= X <=4899, 7383 <= X <=7383, 7800<= X <=7829, 8740 <= X <=8748} We obtain 672 potential media firms. For organizations that do not have a GVKEY match, we identify them as potential media companies if the name string has any of the following key words: TRIBUNE COMPANY, JOURNAL REGISTER COMPANY, KNIGHT RIDDER, THE MCCLATCHY COMPANY, MEDIANEWS GROUP, THE SEATTLE TIMES COMPANY, GANNETT COMPANY, LEE ENTERPRISE, HEARST COMMUNICATIONS, THE NEW YORK TIMES COMPANY, E W SCRIPTS, THE WASHINGTON POST, NEWS CORPORATION, WASHINGTON POST, WALL STREET JOURNAL, WALL STREET JOURNAL INC, JOURNAL, MEDIA, NEWS, TIMES, TELEVISION, RADIO, REUTERS, PUBLISHING, TRIBUNE, TIME WARNER. We find 5,369 potential media firms. For the two groups of firm names, we search Google and company history on the internet to find out whether they are or were media companies at one point in their history. Through this process we identify 3,651 unique company IDs of the BoardEx that are in the media industry. Then we identify all the directors that had work experience in the media companies throughout their career history up to 2009. For each company, we aggregate the number of directors with career experience in the media.

30
AppendixD.CollectingandclassifyingnewsarticleswithCEOnamesandtheoneswithoutFor the firms in the Execucomp database, we searched in the Factiva for any news articles that have the company names in the first paragraph or the title. We followed the official company names in Execucomp after removing the suffixes, such as “/DE” and “- CA.” We restricted the sources of the news in Factiva to the “Top Sources: Dow Jones Newswires, Major News and Business Publications, Reuters Newswires, and the Wall Street Journal.” For the 3,262 unique firms in our sample, we downloaded 1,768,269 articles. Because our focus was on the media exposure of the CEO, not the firm itself, we classified the news articles into the ones with CEO title or names and the ones without. For this procedure, we identified the news articles that have the “CEO” title in the article and exactly the same name strings as shown in the Execucomp database (EXEC_FULLNAME) in any part of the text. One empirical issue about going beyond searching for CEO title is that regional or divisional CEOs or the CEO of another company (competitors or customers or CEO of equity research firms) could be cited for the company of our attention. Another empirical issue is that sometimes the journalists mention CEOs names in nicknames, which may be different from the first or middle names in the Execucomp and that the CEOs sometimes use their middle names more often than their first names. Therefore, in our second round of name search in the articles, if we found the last name of the CEO in the article, we checked if any of the official first name, middle name, or their possible nickname is found in the word before the last name. We referred to Baby Name Wizard18 and Baby Names Pedia19 to come up with an exhaustive list of nicknames for any given first names and middle names. As a result, we found CEO names in 149,647 of the news articles about the firms.
Because the distribution of news coverage for the CEOs in a fiscal year was highly skewed (mean=4.79, median=0, standard deviation=24.64, 25th percentile=0, 75th percentile=2, skewness=25.49), we added one and took the natural log of the count of news articles with CEO names.
Appendix Table 1. Breakdown of the news articles by the fiscal year
Fiscal year
N
#news with CEO names #news without CEO names
Total Average 25th pctl Median 75th pctl Total Average 25th pctl Median 75th pctl
1992 1392 1,859 1.34 0 0 0 31,404 22.59 0 0 14
1993 1564 2,231 1.43 0 0 0 36,668 23.46 0 1 16
1994 1636 1,884 1.15 0 0 0 34,903 21.35 0 0 19
1995 1725 1,329 0.77 0 0 0 32,277 18.72 0 0 16
1996 1855 1,674 0.90 0 0 0 35,212 19.00 0 0 17
1997 1911 2,351 1.23 0 0 0 50,810 26.67 0 1 38
1998 1922 4,744 2.47 0 0 0 117,245 61.00 1 10 70
1999 1854 5,449 2.94 0 0 0 123,590 66.73 2 21 66
2000 1756 6,715 3.82 0 0 1 96,271 54.95 3 18 50
2001 1754 9,251 5.27 0 0 1 95,243 54.39 3 13 39
2002 1706 13,040 7.64 0 0 2 122,753 71.95 4 14 52
18 http://www.babynamewizard.com/baby-name) 19 http://www.babynamespedia.com/

31
2003 1729 11,516 6.66 0 0 2 116,168 67.19 5 12 50
2004 1714 15,090 8.80 0 1 2 124,760 73.00 6 13 54
2005 1660 14,196 8.55 0 0 2 120,850 73.02 6 14 54
2006 1742 17,504 10.05 0 0 3 128,329 73.84 6 16 57
2007 1698 17,812 10.49 0 1 4 135,996 80.19 7 18 67
2008 1850 12,101 6.54 0 0 2 113,559 61.45 4 10 44
2009 1794 10,901 6.08 0 0 2 102,584 57.31 4 11 41
We also control for the visibility of the firms with the count of news articles without CEO names. Due to the skewness from the distribution of the count of news articles (mean=51.88, median=9, standard deviation=181.53, 25th percentile=0, 75th percentile=43, skewness=14.39), so we transformed the variable by adding one and taking natural log.

32
AppendixE.MeasuringtheVocalMasculinityoftheCEOVoice pitch: F0, Fundamental Frequency. Mayew, Parsons, and Venkatachalam (2013) find that CEOs with lower voice pitch (F0) manage larger firms and receive more compensation, indicating their male dominance at work in corporate setting. Following their method, we use Praat software to measure the voice pitch of the CEO. We search for the CEO interview video clips from Youtube.com and Google.com for the CEOs in our sample. Since the minimum length of the voice recording of the CEO has to be 20 seconds, we make sure that the video clip is longer than 20 seconds and the length of speech by the CEO is more than 20 seconds. We download the sound files into MP3 format using the free online service from YouTube mp3 (http://www.youtube-mp3.org/). Following Mayew, Parsons, Venkatachalam (2013), we run Praat acoustic software version 5.3.41 to measure the fundamental frequency (F0) over the first 20 seconds of CEO’s speech in each of the downloaded sound file. Our procedure includes setting the pitch floor as 75 Hz and the ceiling as 300 Hz in recognition that these are the well accepted boundaries to analyze speech of adult males (Puts, Hodges, Cardenas, and Gaulin, 2007). Through this, we are able to collect the voice pitch for 336 CEOs in our sample. Average fundamental frequency is 122.31 Hz with a standard deviation of 22.86 Hz.
Formant position ( ) is another sexually dimorphic acoustic feature. Puts, Hodges, Cardenas and Gaulin (2007) argue that through evolutionary process lower male voice – characterized by lower fundamental frequency (voice pitch) and lower formant position – came to be perceived as a sign of physical dominance among men. Puts, Apicella, and Cardenas (2011) find that formant position is an indicator of men’s threat potential. We follow Puts, Apicella, and Cardenas (2011) in measuring formant position as the average standardized formant ( . value for the first four formants using Praat software via GSU Praat quantify formants add-on tools.
∑ ., . ……………………………………..(A.1.),
Where j is a subscript of the CEO and i is the subscript for the ith formant. We set the maximum thresholds of F as 1000, F as 2850, F as 3750, and F as 4500 Hz, respectively. Before standardizing, mean F =187.66±23.66, mean F =862.49±108.99, mean F =1986.87±125.80, and mean F =3304.11 ±123.88. Through this procedure, we find the average and standard deviation of formant position are 0 and 0.557, respectively. Because these two variables are controls and we need to secure enough number of observations, whenever the value is missing, we attribute the average values to the variables in the following regressions. However, the result does not change when we work with the observations with non-missing voice pitch values.

33
AppendixFigure2.ScreenCaptureofAnalyzingvoicefilesusingPraatSoftware

34
AppendixF.VariableDefinitionVariable definition Firm Characteristics #articles about CEOt The number of news articles about the company in fiscal year t
that has any versions of CEO name.
#articles about Firmt The number of news articles about the company in fiscal year t that does not have any versions of CEO name. Appendix D describes our procedure of collecting and counting news articles and our algorithm of text searching for CEO names.
1{CEO was interviewed}t
1 if CEO was interviewed by CNBC in fiscal year t
1{Have Media Experts on Board}t
1 if the firm has one or more directors that have work experience in media companies. For definition of media companies, please refer to Appendix C.
1yr daily return volatility
Standard deviation of daily return over the fiscal year.
2 years monthly return volatility
Standard deviation of monthly return over the second half of fiscal year.
6 mo daily return volatility
Standard deviation of daily return over the second half of fiscal year.
Cash Flow the net income plus depreciation divided by lagged property, plant, and equipment
Collateral Net PP&E divided by total assets Dividend Yield Dividend divided by share price as of fiscal year end
(DVPSP_F / PRCC_F) following Cain and McKeown (2014).
Firm Age Fiscal year minus the minimum of two: the first year that the company appeared in Compustat or the first year the company appeared in CRSP.
Investment the capital expenditure divided by lagged property, plant, and equipment
Leverage Book value of leverage ratio is defined as (DLC+DLTT)/AT
M/B Market value of equity divided by book value of equity R&D Research and development expenditure divided by total assets. ROA Operating income before depreciation and amortization divided
by assets
Sales Growth REVT(t)-REVT(t-1) in Computat Tobin's Q Book value of assets plus market value of equity minus book
value of equity divided by book value of assets.
total assets ($Million) Compustat data item AT
CEO Characteristics

35
1{Widest Half} A dummy variable that is one if the fWHR of the CEO belongs to the largest 1/2 of the sample
1{Widest Quartile} A dummy variable that is one if the fWHR of the CEO belongs to the largest 1/4 of the sample
1{Widest Quintile} A dummy variable that is one if the fWHR of the CEO belongs to the largest 1/5 of the sample
1{Widest Tercile} A dummy variable that is one if the fWHR of the CEO belongs to the largest 1/3 of the sample
1{Chairman=CEO} A dummy variable that is one if the CEO is the chairman of the board, which is obtained from Risk Metrics database.
1{Ownership>5%} A dummy variable that is one if the stock ownership of the CEO is greater than 5%.
1{Risky Hobbies} A dummy variable that is one if the CEO is found to have any of the following hobbies: flying airplanes, scuba diving, car racing, martial art, horse-back riding, ranching, mountain climbing, risky boating, and risky biking.
Car Racing A dummy variable that is one if the CEO's hobby is car racing CEO age Age of the CEO Delta Dollar change in CEO's wealth for a 1% change in stock price,
following Coles, Daniel, and Naveen (2006).
Flying Airplanes A dummy variable that is one if the CEO's hobby is aviation with his pilot license
fWHR Facial width-to-height ratio. Appendix A describes the detailed procedure of obtaining the facial pictures of the CEOs and measuring fWHR.
Horse Riding A dummy variable that is one if the CEO's hobby is horseback riding
Inverse Rank of WHR
Inverse of the ranking of the fWHR. Smallest fWHR being rank 1 and largest fWHR being largest rank number.
Martial Art A dummy variable that is one if the CEO's hobby is martial art such as wrestling and Taekwondo.
Mountain Climbing A dummy variable that is one if the CEO's hobby is mountain climbing or rock climbing (excluding hiking).
overconfidence A dummy variable that is one if the unexercised option holding of the CEO is on average more than 67% in the money for a second time or more over the sample period. We follow Campbell, Gallmeyer, Johnson, Rutherford, and Stanley (2011).
Pf Formant position of the voice of the CEO. Appendix E describes the procedure of measuring.
Ranching A dummy variable that is one if the CEO's hobby is cutting horses and ranching.

36
Risky Biking A dummy variable that is one if the CEO's hobby is off-road motorcycling and motorcycle racing.
Risky Boating A dummy variable that is one if the CEO's hobby is power boating, and ocean kayaking.
Scuba Diving A dummy variable that is one if the CEO's hobby is scuba diving.
Tenure Tenure is the number of years the CEO has been in the position. For the CEOs that were captured in turnover classification process, we hand collected the year of appointment. For the CEOs that did not have turnover, we attribute the first year of the CEO in Execucomp as the year of appointment.
Vega Dollar change in CEO's wealth for a 0.01 change in standard deviation of returns, following Coles, Daniel, and Naveen (2006).
Voice Pitch Fundamental frequency of the voice of the CEO. Appendix E describes the procedure of measuring.
M&A Related Variables 1{Cash Deal} A dummy variable that is one if the merger is 100% financed
with cash
1{diversifying merger}
A dummy variable that is one if the two digits SIC codes of the target and the acquirer are different.
1{private target} A dummy variable that is one if the target firm is a private company
CAR[-1,1] Cumulative abnormal return over the event window of [-1, 1] trading days using market model based on CRSP VWRETD.
ln(deal value/assets) Natural log of deal value (SDC Platinum) divided by total assets (Compustat, AT).
All the continuous variables are winsorized at 1% and 99% level.

37
Table1.CNBCinterviewselectionprobitmodel
PanelA.Summarystatisticsfortheobservationsinthefirststageselectionmodel
Variable N Mean Std. 10pct median 90pct
1{CEO was interviewed}t 14680 0.131 0.337 0.000 0.000 1.0001{Have Media Experts on Board}t 14680 0.012 0.109 0.000 0.000 0.000#articles about CEOt 14680 6.562 31.358 0.000 0.000 15.000#articles about Firmt 14680 69.609 199.902 0.000 15.000 150.000total assetst ($Million) 14680 6921.474 25701.660 245.179 1552.744 15163.650Leveraget 14680 0.232 0.170 0.000 0.227 0.447Tobin's Qt 14680 2.020 1.351 1.042 1.581 3.450ROAt 14680 0.140 0.097 0.052 0.138 0.246Tenuret 14680 7.377 7.281 1.000 5.000 23.0001yr daily return volatilityt-1 14680 0.027 0.013 0.013 0.023 0.045
PanelB.1ststageselectionofsample:likelihoodofbeingtheCEOtobeinterviewsbyCNBCthroughoutthesampleperiod–Probitmodel.Dependent variable is one if the CEO had an interview with CNBC in year t and zero otherwise. Z-statistics reported in every second line are based on heteroskedasticity robust standard errors. *, **, and *** represent statistical significance at 10%, 5%, and 1% level, respectively. For variable definition, please refer to Appendix F.
Dependent variable:1{CEO was interviewed}t 1{Have Media Experts on Board}t 0.249 ** (2.08) ln(1+#articles about CEO)t 0.261 *** (19.91) ln(1+#articles about Firm)t 0.019 ** (2.11) size:ln(total assets)t 0.289 *** (23.49) Leveraget -0.45 *** (-4.59) ln(Tobin's Q)t 0.344 *** (9.87) ROAt -0.079 (-0.42) Tenuret 0.006 *** (2.94) Ln(1yr daily return volatility)t-1 0.571 *** (15.80) constant -1.767 *** (-14.28) N 14680 Pseudo R2 0.214

38
Table2.CEO’sfacialwidthtoheightratioandfirmlevelrisk
PanelA.Breakdownofobservationsbytheindustry(1digitSICcode)1st digit SIC
code Description N Mean Std. Median
0 Agriculture, forestry, and fishing* 3 1.872 0.071 1.869 1 Mining & Construction 33 2.020 0.164 2.007 2 Beverages, Apparel, Lumber, and Manufacturing 77 2.005 0.156 2.010
3 Plastic, Steel, Computer, Electronic Manufacturing
142 2.034 0.165 2.028
4 Transportation, Communications 53 2.043 0.174 2.037 5 Wholesale, Retail Stores 61 2.047 0.146 2.048 6 Financial Services** 87 2.021 0.161 2.015 7 Hotels, Services, Amusement Parks 89 2.020 0.198 1.963 8 Medical Services, Consulting 11 2.053 0.150 2.051 9 Public Administration 2 2.053 0.078 2.053
Total 558 2.027 0.167 2.014 * Our results in the paper are robust when we exclude these CEOs in the agriculture, forestry, and fishing industry. ** CEOs of financial services industry are taken out of the analysis due to the drastically different regulatory environment and capital structure.
PanelB.Summarystatisticsoftheselectedfirmyears
Variable N Mean Std. 10pct median 90pct1yr daily return volatility 1976 0.028 0.014 0.014 0.024 0.047fWHR 1976 2.020 0.166 1.803 2.006 2.231CEO age 1976 54.090 6.515 46.000 54.000 62.000Tenure 1976 7.492 6.698 1.000 5.000 17.000Delta 1976 2601.183 23702.030 71.521 433.625 2341.629Vega 1976 241.097 381.310 10.408 115.825 595.850Assets($Million) 1976 14785.400 50750.830 449.663 3243.309 31062.000Leverage 1976 0.227 0.169 0.001 0.222 0.441R&D 1976 0.066 0.187 0.000 0.003 0.174Sales Growth 1976 0.130 0.274 -0.105 0.086 0.392ROA 1976 0.147 0.091 0.063 0.143 0.253M/B 1976 3.535 3.490 1.177 2.637 6.641Firm Age 1976 29.817 17.622 9.000 26.000 55.000

39
PanelC.2ndstageregressionoftotalriskonfWHRcontrollingforselectionbiasDependent variable is the natural log of total risk of stock return based on the estimation windows and frequency specified. All regressions include industry (4 digit SIC code) fixed effects and year fixed effects. T-statistics are based on heteroskedasticity robust standard errors. *, **, and *** represent statistical significance at 10%, 5%, and 1% level, respectively. For variable definition, please refer to Appendix F.
Estimation window 6mo 1 year 2 years Frequency of return daily daily monthly fWHR 0.118 ** 0.101 ** 0.131 ** (2.08) (1.97) (2.34) CEO age -0.001 0 -0.002 (-0.56) (-0.28) (-1.21) ln(Tenure) 0.037 *** 0.03 *** 0.027 ** (2.85) (2.64) (2.04) Delta -0.019 ** -0.016 * 0.003 (-1.98) (-1.96) (0.30) Vega -0.019 ** -0.018 *** -0.011 (-2.58) (-2.72) (-1.48) Size:ln(Assets) -0.092 *** -0.108 *** -0.137 *** (-7.96) (-10.53) (-11.84) Leverage 0.286 *** 0.252 *** 0.354 *** (4.66) (4.55) (5.29) R&D 0.022 0.032 0.149 ** (0.47) (0.73) (2.32) Sales Growth 0.087 *** 0.058 *** 0.022 (3.54) (2.59) (0.78) ROA -0.815 *** -0.87 *** -0.971 *** (-7.97) (-8.68) (-8.34) M/B 0.001 0.002 0.002 (0.39) (1.06) (0.76) ln(Firm Age) -0.003 *** -0.003 *** -0.004 *** (-3.28) (-4.12) (-4.58) IMR 0.264 *** 0.335 *** 0.41 *** (6.28) (8.58) (9.00) constant -3.225 *** -3.042 *** -1.509 *** (-22.48) (-24.10) (-10.81) N 1978 1976 1971 Adj.R2 0.736 0.765 0.739

40
Table3.ControllingforCEOoverconfidenceDependent variable is the total risk of stock return based on the estimation windows and frequency specified. All regressions include industry (4 digit SIC code) fixed effects and year fixed effects. T-statistics are based on heteroskedasticity robust standard errors. *, **, and *** represent statistical significance at 10%, 5%, and 1% level, respectively. For variable definition, please refer to Appendix F.
Estimation window 6mo 1 year 2 years Frequency of return daily daily monthly fWHR 0.113 * 0.095 * 0.14 ** (1.94) (1.82) (2.44) overconfidence 0.057 *** 0.05 *** 0.065 *** (2.90) (2.89) (3.42) CEO age 0 0 -0.002 (0.05) (0.18) (-1.06) ln(Tenure) 0.031 ** 0.027 ** 0.026 * (2.27) (2.18) (1.91) Delta -0.017 -0.014 0.001 (-1.48) (-1.46) (0.06) Vega -0.022 ** -0.022 *** -0.013 (-2.51) (-2.67) (-1.39) Size:ln(Assets) -0.092 *** -0.108 *** -0.135 *** (-7.40) (-9.82) (-11.22) Leverage 0.279 *** 0.237 *** 0.337 *** (4.16) (3.99) (4.84) R&D 0.012 0.023 0.135 ** (0.25) (0.51) (2.08) Sales Growth 0.08 *** 0.05 ** 0.016 (3.25) (2.20) (0.55) ROA -0.825 *** -0.886 *** -1.032 *** (-7.76) (-8.53) (-8.95) M/B 0 0.002 0.003 (0.06) (0.78) (1.02) ln(Firm Age) -0.003 *** -0.003 *** -0.004 *** (-2.97) (-3.66) (-4.36) IMR 0.248 *** 0.321 *** 0.39 *** (5.75) (8.01) (8.23) constant -3.283 *** -3.074 *** -1.547 *** (-22.25) (-23.80) (-10.78) N 1906 1904 1899 Adj.R2 0.74 0.767 0.741

41
Table4.ControllingforVoicePitchandOverconfidenceDependent variable is the total risk of stock return based on the estimation windows and frequency specified. All regressions include industry fixed effects (4 digit SIC code) and year fixed effects. T-statistics are based on heteroskedasticity robust standard errors. *, **, and *** represent statistical significance at 10%, 5%, and 1% level, respectively. For variable definition, please refer to Appendix F.
Estimation window 6mo 1 year 2 years
Frequency of return daily daily monthly
fWHR 0.111 * 0.092 * 0.136 **
(1.88) (1.75) (2.36)
Voice Pitch 0.001 ** 0.001 0.001 **
(2.13) (1.43) (2.45)
Pf 0.006 0.009 0.011
(0.22) (0.43) (0.45)
overconfidence 0.056 *** 0.05 *** 0.064 ***
(2.87) (2.86) (3.36)
CEO age 0 0 -0.001
(0.13) (0.22) (-0.98)
ln(Tenure) 0.028 ** 0.025 ** 0.023 *
(2.05) (2.04) (1.66)
Delta -0.015 -0.014 0.002
(-1.34) (-1.37) (0.24)
Vega -0.023 *** -0.022 *** -0.013
(-2.59) (-2.72) (-1.48)
Size:ln(Assets) -0.093 *** -0.108 *** -0.136 ***
(-7.51) (-9.85) (-11.32)
Leverage 0.283 *** 0.238 *** 0.341 ***
(4.25) (4.01) (4.88)
R&D 0.018 0.028 0.142 **
(0.37) (0.61) (2.20)
Sales Growth 0.079 *** 0.05 ** 0.015
(3.20) (2.17) (0.52)
ROA -0.809 *** -0.875 *** -1.013 ***
(-7.63) (-8.40) (-8.82)
M/B 0 0.002 0.002
(-0.06) (0.70) (0.89)
ln(Firm Age) -0.003 *** -0.003 *** -0.004 ***
(-3.05) (-3.72) (-4.49)
IMR 0.253 *** 0.323 *** 0.395 ***
(5.86) (7.99) (8.25)
constant -3.396 *** -3.137 *** -1.675 ***
(-21.02) (-22.23) (-10.50)
N 1906 1904 1899
Adj.R2 0.741 0.767 0.742

42
Table5.ControllingforCEO’sriskyhobbiesDependent variable is the total risk of stock return based on the estimation windows and frequency specified. All regressions include industry (4 digit SIC code) fixed effects and year fixed effects. T-statistics are based on heteroskedasticity robust standard errors. *, **, and *** represent statistical significance at 10%, 5%, and 1% level, respectively. For variable definition, please refer to Appendix F.
PanelA.UsingRiskyHobbiesdummyvariable
Estimation window 6mo 1 year 2 yearsFrequency of return daily daily monthly
fWHR 0.297 ** 0.251 ** 0.274 ***(2.50) (2.49) (2.68)
1{Risky Hobbies} 0.062 0.07 * 0.042(1.26) (1.70) (0.84)
Voice Pitch 0.002 * 0.001 0.002 *(1.78) (1.60) (1.87)
Pf 0.043 0.059 * 0.059(1.11) (1.91) (1.59)
overconfidence 0.058 0.068 ** 0.092 ***(1.65) (2.37) (3.06)
CEO age 0.001 0 0.001(0.40) (0.14) (0.28)
ln(Tenure) 0.018 0.017 0.005(0.77) (0.88) (0.27)
Delta 0.005 0.002 0.014(0.22) (0.14) (0.90)
Vega -0.017 -0.012 0.01 (-1.25) (-1.00) (0.77)
Size:ln(Assets) -0.131 *** -0.13 *** -0.178 *** (-6.51) (-7.77) (-9.55)
Leverage 0.334 *** 0.322 *** 0.511 ***(2.61) (3.07) (4.85)
R&D 0.008 0.051 0.205 **(0.10) (0.74) (2.04)
Sales Growth 0.113 ** 0.079 ** 0.034(2.55) (2.16) (0.91)
ROA -1.407 *** -1.376 *** -1.529 *** (-7.01) (-7.52) (-7.75)
M/B -0.001 0.002 0.005 (-0.13) (0.57) (1.27)
ln(Firm Age) -0.002 -0.003 * -0.002 (-1.46) (-1.86) (-1.19)
IMR 0.336 *** 0.368 *** 0.504 ***(4.88) (6.23) (7.44)
constant -3.758 *** -3.517 *** -2.006 *** (-12.46) (-14.52) (-6.58)
N 837 837 831Adj.R2 0.786 0.82 0.82

43
PanelB.ControllingforCEO’sdifferentkindsofriskyhobbiesEstimation window 6mo 1 year 2 years Frequency of return daily daily monthly fWHR 0.3 ** 0.261 ** 0.253 ** (2.44) (2.49) (2.42) Flying Airplanes 0.249 ** 0.266 ** 0.266 ** (2.18) (2.38) (2.07) Scuba Diving 0.092 0.128 0.077 (0.61) (1.12) (0.71) Car Racing -0.009 0.011 -0.033 (-0.09) (0.15) (-0.34) Martial Art 0.005 0.043 0.039 (0.05) (0.58) (0.52) Horse Riding 0.463 ** 0.457 *** 0.722 *** (2.36) (3.06) (7.55) Ranching -0.046 -0.098 -0.279 (-0.29) (-0.64) (-1.27) Mountain Climbing -0.52 * -0.494 ** -0.37 (-1.78) (-2.15) (-1.40) Risky Boating 0.073 0.045 -0.191 (0.33) (0.26) (-1.34) Risky Biking 0.27 0.017 0.237 (1.59) (0.11) (1.20) Voice Pitch 0 0 0 (0.02) (-0.28) (0.36) Pf 0.067 0.088 ** 0.072 * (1.49) (2.49) (1.77) overconfidence 0.075 ** 0.081 *** 0.101 *** (2.01) (2.68) (3.29) CEO age 0.001 0 0 (0.24) (-0.10) (-0.04) ln(Tenure) 0.023 0.022 0.005 (1.00) (1.12) (0.28) Delta -0.004 -0.006 0.006 (-0.20) (-0.33) (0.41) Vega -0.017 -0.014 0.006 (-1.28) (-1.21) (0.47) Size:ln(Assets) -0.129 *** -0.125 *** -0.17 *** (-6.08) (-7.04) (-8.55) Leverage 0.313 ** 0.296 *** 0.455 *** (2.34) (2.72) (4.31) R&D 0.02 0.043 0.229 ** (0.22) (0.53) (2.01) Sales Growth 0.104 ** 0.071 ** 0.026 (2.40) (1.97) (0.70) ROA -1.307 *** -1.272 *** -1.381 *** (-6.31) (-6.78) (-6.82) M/B -0.002 0 0.003
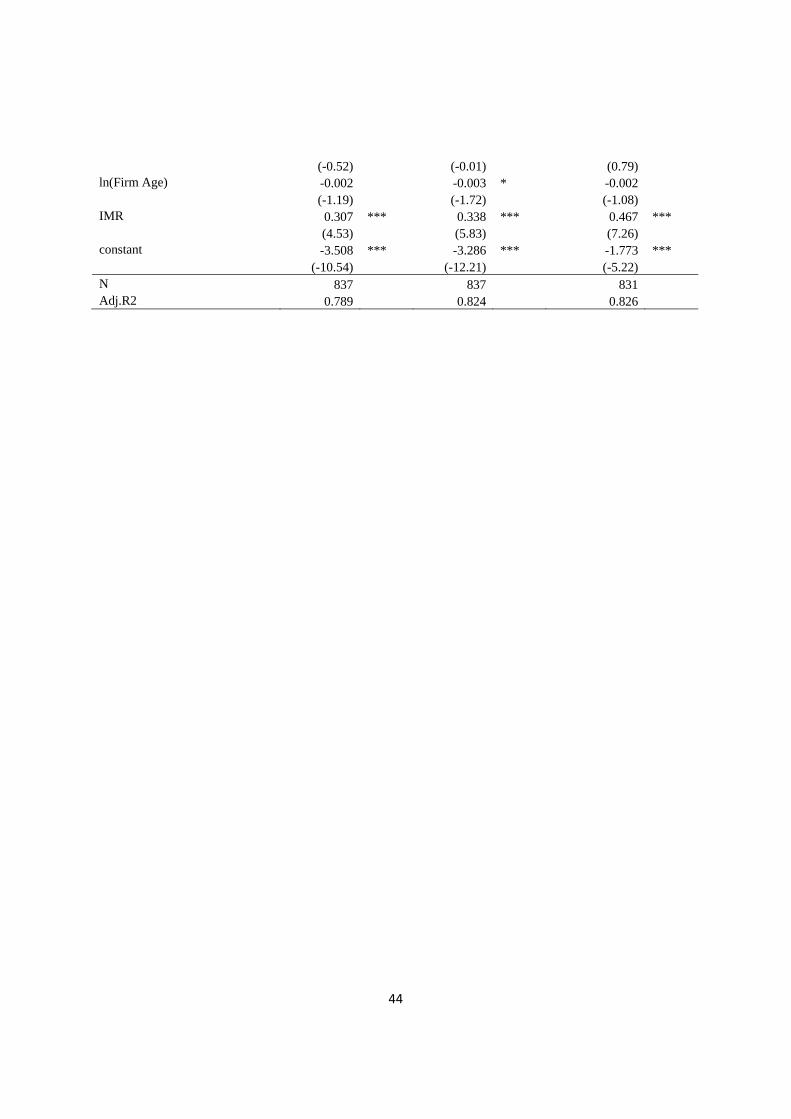
44
(-0.52) (-0.01) (0.79) ln(Firm Age) -0.002 -0.003 * -0.002 (-1.19) (-1.72) (-1.08) IMR 0.307 *** 0.338 *** 0.467 *** (4.53) (5.83) (7.26) constant -3.508 *** -3.286 *** -1.773 *** (-10.54) (-12.21) (-5.22) N 837 837 831 Adj.R2 0.789 0.824 0.826

45
Table6.RobustnesscheckDependent variable is the total risk of stock return based on the estimation windows and frequency specified. All regressions include industry (4 digit SIC code) fixed effects and year fixed effects. T-statistics are based on heteroskedasticity robust standard errors. *, **, and *** represent statistical significance at 10%, 5%, and 1% level, respectively. For variable definition, please refer to Appendix F.
PanelA.Usingalternativemeasuresoffacialwidth‐to‐heightratio
Dependent variable: 1 year daily return volatility
Inverse Rank of WHR 0 ***
(2.62)
1{Widest Quintile} 0.103 **
(2.43)
1{Widest Tercile} 0.094 **
(2.47)
1{Widest Half} 0.057 **
(2.01)
Flying Airplanes 0.264 ** 0.246 ** 0.258 ** 0.27 **
(2.39) (2.19) (2.32) (2.36)
Scuba Diving 0.125 0.131 0.138 0.11
(1.09) (1.12) (1.15) (0.94)
Car Racing 0.02 -0.028 0.026 0.007
(0.25) (-0.37) (0.33) (0.08)
Martial Art 0.048 0.045 0.043 0.066
(0.64) (0.61) (0.57) (0.90)
Horse Riding 0.452 *** 0.434 *** 0.468 *** 0.452 ***
(3.01) (2.86) (3.06) (2.96)
Ranching -0.097 -0.151 -0.13 -0.113
(-0.64) (-0.96) (-0.84) (-0.75)
Mountain Climbing -0.487 ** -0.406 * -0.417 * -0.459 **
(-2.13) (-1.77) (-1.82) (-2.00)
Risky Boating 0.039 0.032 -0.06 0.049
(0.22) (0.18) (-0.33) (0.28)
Risky Biking 0.016 0.017 -0.008 0.013
(0.10) (0.12) (-0.05) (0.09)
Voice Pitch 0 0 0 0
(-0.24) (-0.15) (-0.03) (-0.17)
Pf 0.087 ** 0.089 ** 0.089 ** 0.083 **
(2.44) (2.48) (2.48) (2.31)
overconfidence 0.081 *** 0.072 ** 0.085 *** 0.074 **
(2.69) (2.53) (2.80) (2.49)
CEO age 0 0 -0.001 0
(-0.21) (-0.10) (-0.25) (-0.00)

46
ln(Tenure) 0.021 0.022 0.021 0.019
(1.11) (1.15) (1.09) (0.98)
Delta -0.006 -0.003 -0.004 -0.005
(-0.34) (-0.19) (-0.22) (-0.28)
Vega -0.013 -0.014 -0.012 -0.011
(-1.09) (-1.13) (-0.94) (-0.85)
Size:ln(Assets) -0.126 *** -0.116 *** -0.123 *** -0.129 ***
(-7.09) (-6.22) (-6.90) (-7.27)
Leverage 0.29 *** 0.297 *** 0.312 *** 0.295 ***
(2.66) (2.74) (2.91) (2.70)
R&D 0.046 0.031 0.017 0.051
(0.57) (0.39) (0.21) (0.65)
Sales Growth 0.071 * 0.068 * 0.067 * 0.071 *
(1.95) (1.83) (1.82) (1.95)
ROA -1.266 *** -1.207 *** -1.221 *** -1.225 ***
(-6.73) (-6.65) (-6.57) (-6.52)
M/B 0 0 -0.001 0
(-0.03) (-0.08) (-0.20) (-0.14)
ln(Firm Age) -0.003 * -0.003 ** -0.004 ** -0.002
(-1.73) (-1.99) (-2.12) (-1.44)
IMR 0.343 *** 0.323 *** 0.338 *** 0.351 ***
(5.84) (5.55) (5.74) (5.88)
constant -2.824 *** -2.863 *** -2.838 *** -2.819 ***
(-14.06) (-14.25) (-14.09) (-14.10)
N 837 837 837 837
Adj.R2 0.824 0.823 0.823 0.822

47
PanelB.SubsampleofthefirmsthathadCEOturnoversatsomepointoverthesampleperiod
Dependent Variable: 1 year daily return volatility fWHR 0.12 ** 0.096 * 0.283 *** 0.266 ** (2.10) (1.67) (2.84) (2.45) overconfidence 0.039 * 0.08 ** 0.105 *** (1.95) (2.53) (3.12) Voice Pitch 0 0 (0.01) (-0.02) Pf 0.08 ** 0.065 (2.06) (1.59) 1{Risky Hobbies} 0.097 * (1.87) Flying Airplanes 0.245 ** (2.07) Scuba Diving 0.022 (0.18) Car Racing 0.095 (1.02) Martial Art -0.046 (-0.30) Horse Riding 0.464 *** (2.82) Ranching -0.136 (-0.84) Risky Boating -0.021 (-0.11) CEO age 0.002 0.002 0.004 0.004 (1.46) (1.24) (1.47) (1.24) ln(Tenure) 0.015 0.014 -0.001 -0.01 (1.12) (0.96) (-0.05) (-0.42) Delta -0.006 -0.006 0.005 0.002 (-0.63) (-0.53) (0.34) (0.11) Vega -0.02 ** -0.019 ** -0.013 -0.017 (-2.41) (-1.98) (-1.02) (-1.33) Size:ln(Assets) -0.117 *** -0.126 *** -0.142 *** -0.135 *** (-9.97) (-9.96) (-7.32) (-6.87) Leverage 0.271 *** 0.299 *** 0.267 ** 0.21 (4.08) (4.07) (2.02) (1.54) R&D 0.023 0.004 0.102 0.127 (0.18) (0.03) (0.51) (0.66) Sales Growth 0.052 * 0.043 0.105 ** 0.095 **

48
(1.85) (1.51) (2.16) (1.97) ROA -0.773 *** -0.788 *** -1.355 *** -1.247 *** (-6.84) (-6.69) (-6.11) (-5.68) M/B 0 -0.001 0.003 0.002 (-0.08) (-0.29) (0.86) (0.66) ln(Firm Age) -0.003 *** -0.002 *** -0.004 * -0.004 * (-3.53) (-2.60) (-1.79) (-1.80) IMR 0.309 *** 0.318 *** 0.294 *** 0.26 *** (7.26) (7.34) (4.69) (3.97) constant -3.169 *** -3.092 *** -3.487 *** -3.441 *** (-23.06) (-22.31) (-11.47) (-9.45) N 1473 1428 626 626 Adj.R2 0.77 0.772 0.822 0.825

49
Table7.DohightestosteroneCEOsincreaseleverageratio?
PanelA.MarketvaluebasedleverageratioandtestosteroneDependent variable is market value based leverage ratio (book value of debt/ (book value of debt + market capitalization)), where market capitalization is computed as the number of common shares outstanding times the price as of the end of fiscal year. We control for industry (4 digit SIC code) and year fixed effects. T-statistics are based on heteroskedasticity robust standard errors. *, **, and *** represent statistical significance at 10%, 5%, and 1% level, respectively. For variable definition, please refer to Appendix F.
Dependent Variable: MV Leveraget+1
fWHR 0.17 ***
(2.99)
Inverse Rank of WHR 0.0002 ***
(3.59)
1{Widest Quintile} 0.066 ***
(2.84)
1{Widest Tercile} 0.052 ***
(3.03)
1{Widest Half} 0.081 ***
(4.58)
1{Risky Hobbies} 0.017 0.019 0.01 0.016 0.031
(0.60) (0.70) (0.38) (0.58) (1.14)
Voice Pitch 0 0 0 0 0
(0.54) (0.67) (0.17) (0.37) (1.00)
Pf 0.048 *** 0.047 *** 0.05 *** 0.053 *** 0.043 ***
(2.77) (2.75) (2.82) (2.90) (2.60)
overconfidence 0.006 0.008 0.003 0.009 0.01
(0.37) (0.55) (0.21) (0.61) (0.65)
CEO age -0.002 -0.002 * -0.002 -0.002 * -0.002 *
(-1.61) (-1.85) (-1.51) (-1.73) (-1.68)
ln(Tenure) 0.033 *** 0.033 *** 0.033 *** 0.034 *** 0.03 **
(2.89) (2.86) (2.96) (2.96) (2.56)
Delta -0.025 *** -0.025 *** -0.024 ** -0.024 ** -0.024 **
(-2.60) (-2.61) (-2.51) (-2.56) (-2.54)
Vega 0.002 0.002 0.003 0.004 0.004
(0.32) (0.37) (0.52) (0.68) (0.70)
Sales Growth -0.001 -0.001 -0.001 -0.001 -0.001
(-0.03) (-0.06) (-0.04) (-0.04) (-0.05)
ROA -0.618 *** -0.631 *** -0.573 *** -0.579 *** -0.642 ***
(-5.82) (-5.96) (-5.57) (-5.56) (-6.07)
M/B 0 0 0 0 0.001
(0.22) (0.24) (0.06) (-0.04) (0.28)
Size:ln(Assets) 0.041 *** 0.04 *** 0.044 *** 0.039 *** 0.038 ***

50
(4.76) (4.68) (5.06) (4.66) (4.53)
Collateral 0 -0.013 0.01 0.012 -0.049
(-0.00) (-0.12) (0.08) (0.10) (-0.45)
IMR -0.109 *** -0.103 *** -0.116 *** -0.107 *** -0.094 ***
(-3.24) (-3.09) (-3.54) (-3.18) (-2.82)
constant -0.162 0.145 0.143 0.167 * 0.146
(-1.15) (1.49) (1.52) (1.75) (1.50)
N 760 760 760 760 760
Adj.R2 0.679 0.682 0.678 0.677 0.688

51
PanelB.BookvaluebasedleverageratioandtestosteroneDependent variable is book value based leverage ratio (book value of debt/total assets = (DLC+DLTT)/AT). We control for industry (4 digit SIC code) and year fixed effects. T-statistics are based on heteroskedasticity robust standard errors. *, **, and *** represent statistical significance at 10%, 5%, and 1% level, respectively. For variable definition, please refer to Appendix F.
fWHR 0.129 **
(2.49)
Inverse Rank of WHR 0.0002 ***
(3.03)
1{Widest Quintile} 0.07 ***
(3.65)
1{Widest Tercile} 0.036 **
(2.31)
1{Widest Half} 0.06 ***
(3.53)
1{Risky Hobbies} 0.086 *** 0.088 *** 0.078 *** 0.085 *** 0.096 ***
(3.50) (3.61) (3.30) (3.47) (3.90)
Voice Pitch -0.001 *** -0.001 *** -0.002 *** -0.001 *** -0.001 ***
(-3.60) (-3.52) (-3.91) (-3.69) (-3.38)
Pf 0.083 *** 0.082 *** 0.084 *** 0.087 *** 0.08 ***
(4.41) (4.42) (4.30) (4.36) (4.29)
overconfidence -0.004 -0.001 -0.003 -0.002 -0.001
(-0.24) (-0.06) (-0.17) (-0.15) (-0.06)
CEO age 0 0 0 0 0
(0.16) (-0.07) (0.15) (0.13) (0.06)
ln(Tenure) 0.018 0.017 0.018 * 0.018 * 0.016
(1.63) (1.60) (1.70) (1.69) (1.38)
Delta -0.031 *** -0.031 *** -0.029 *** -0.03 *** -0.03 ***
(-4.54) (-4.59) (-4.39) (-4.46) (-4.47)
Vega -0.001 0 0 0.001 0.001
(-0.16) (-0.11) (-0.11) (0.25) (0.30)
Sales Growth 0.039 * 0.039 * 0.039 * 0.038 * 0.04 *
(1.74) (1.73) (1.71) (1.69) (1.74)
ROA -0.1 -0.113 -0.073 -0.066 -0.111
(-1.10) (-1.25) (-0.77) (-0.70) (-1.22)
M/B 0 0 0 0 0
(0.16) (0.19) (0.12) (0.01) (0.19)
Size:ln(Assets) 0.043 *** 0.042 *** 0.046 *** 0.042 *** 0.042 ***
(6.12) (6.00) (6.39) (5.99) (5.78)
Collateral 0.179 *** 0.169 *** 0.188 *** 0.187 *** 0.145 **
(2.79) (2.66) (2.84) (2.79) (2.28)
IMR -0.152 *** -0.147 *** -0.158 *** -0.15 *** -0.141 ***
(-5.87) (-5.65) (-6.36) (-5.81) (-5.32)
constant -0.016 0.218 ** 0.221 ** 0.232 *** 0.219 **
(-0.12) (2.43) (2.49) (2.62) (2.45)
N 827 827 827 827 827
Adj.R2 0.643 0.646 0.646 0.64 0.648
Dependent Variable: BV Leveraget+1

52
Table8.ArehightestosteroneCEOsmoreacquisitive?
PanelA.LinearprobabilitymodelofacquisitionDependent variable is a dummy variable that is one if the firm announces a successful merger bid in fiscal year t+1 and zero otherwise. We control for firm and year fixed effects. T-statistics are based on heteroskedasticity robust standard errors. *, **, and *** represent statistical significance at 10%, 5%, and 1% level, respectively. For variable definition, please refer to Appendix F.
Dependent Variable: 1{Acquired a company}t+1 fWHR 2.11 ** (2.29) Inverse Rank of WHR 0.003 *** (2.77) 1{Widest Quintile} 0.682 * (1.75) 1{Widest Quartile} 0.894 *** (3.10) 1{Risky Hobbies} 0.019 0.027 0.038 -0.258 (0.06) (0.09) (0.12) (-0.83) Voice Pitch -0.012 * -0.011 * -0.01 -0.007 (-1.87) (-1.91) (-1.22) (-1.01) Pf -0.2 ** -0.168 ** -0.243 0.146 (-2.42) (-2.25) (-1.52) (1.07) overconfidence 0.181 ** 0.176 ** 0.232 *** 0.182 *** (2.59) (2.57) (3.16) (2.75) CEO age -0.005 -0.011 0.002 -0.024 * (-0.70) (-1.32) (0.16) (-1.88) ln(Tenure) 0.038 0.045 -0.009 0.064 (0.56) (0.66) (-0.12) (0.88) Delta 0.048 0.048 0.053 0.059 (1.32) (1.35) (1.37) (1.63) Vega 0 0 0.003 -0.002 (-0.01) (-0.01) (0.07) (-0.04) Leverage 0.549 ** 0.557 ** 0.545 ** 0.57 ** (2.30) (2.34) (2.27) (2.41) Dividend Yield 0.779 0.759 0.783 0.788 (0.69) (0.69) (0.68) (0.70) ROA -0.121 -0.135 -0.164 -0.205 (-0.28) (-0.31) (-0.37) (-0.47) Size:ln(Assets) 0.07 0.068 0.056 0.06 (0.83) (0.81) (0.68) (0.72)

53
Cash Flow -0.019 -0.019 -0.018 -0.019 (-0.94) (-0.95) (-0.87) (-0.93) Q 0.013 0.013 0.007 0.01 (0.52) (0.52) (0.30) (0.40) CapEx 0.138 * 0.138 * 0.138 * 0.132 * (1.93) (1.93) (1.90) (1.83) IMR -0.054 -0.048 -0.044 -0.061 (-0.32) (-0.28) (-0.25) (-0.36) constant -3.111 * 0.546 0.473 0.979 (-1.70) (0.74) (0.44) (1.36) N 830 830 830 830 Adj.R2 0.279 0.281 0.278 0.282

54
PanelB.RobustnesscheckusingdealvaluesasdependentvariablesDependent variable is the natural log of one plus the aggregate amount spent on all the acquisition deals in fiscal year t [columns 1 and 2] or the natural log of one plus the average acquisition deal value in fiscal year t[columns 3 and 4]. We control for firm and year fixed effects. T-statistics are based on heteroskedasticity robust standard errors. *, **, and *** represent statistical significance at 10%, 5%, and 1% level, respectively. For variable definition, please refer to Appendix F.
Dependent Variable: Ln(1+Agg.Deal Value)t Ln(1+Avg.Deal Value) t fWHR 13.398 *** 13.102 *** (3.29) (3.45) Inverse Rank of WHR 0.018 *** 0.017 *** (3.38) (3.41) 1{Risky Hobbies} -2.111 -2.056 -1.855 -1.8 (-1.26) (-1.23) (-1.16) (-1.12) Voice Pitch -0.04 -0.039 -0.032 -0.032 (-1.02) (-1.03) (-0.87) (-0.88) Pf -0.658 -0.454 -0.54 -0.342 (-1.34) (-1.02) (-1.19) (-0.82) overconfidence 0.602 0.586 0.647 * 0.634 * (1.59) (1.57) (1.84) (1.83) CEO age -0.058 -0.09 * -0.063 -0.094 * (-1.35) (-1.75) (-1.53) (-1.86) ln(Tenure) 0.367 0.393 0.373 0.396 (1.09) (1.15) (1.17) (1.23) Delta 0.261 0.265 0.235 0.239 (1.47) (1.51) (1.38) (1.43) Vega -0.11 -0.109 -0.113 -0.111 (-0.56) (-0.56) (-0.63) (-0.63) Leverage 2.407 ** 2.452 ** 2.309 ** 2.352 ** (2.25) (2.29) (2.35) (2.39) Dividend Yield 3.226 3.134 4.061 3.979 (0.53) (0.52) (0.68) (0.67) ROA -1.002 -1.097 -1.474 -1.569 (-0.41) (-0.45) (-0.64) (-0.69) Size:ln(Assets) 0.649 0.64 0.562 0.553 (1.45) (1.44) (1.32) (1.30) Cash Flow -0.133 -0.134 -0.126 -0.126 (-1.27) (-1.28) (-1.23) (-1.23) Q 0.12 0.118 0.106 0.105 (0.90) (0.89) (0.88) (0.87) CapEx 1.084 *** 1.081 *** 1.048 *** 1.045 *** (2.70) (2.69) (2.75) (2.74)

55
IMR -0.53 -0.503 -0.511 -0.488 (-0.52) (-0.50) (-0.54) (-0.52) constant -23.526 *** -0.051 -23.251 *** -0.24 (-2.82) (-0.01) (-2.99) (-0.06) N 830 830 830 830 Adj.R2 0.049 0.05 0.049 0.05

56
Table9.CARregressionsofacquisitionannouncement.Isinvestorresponsemorenegativewhenanacquisitionisdrivenbytestosterone?Dependent variable is CAR[-1,1] of acquisition announcements (cumulative abnormal return over the [-1, 1] trading day window relative to the announcement). Market model based on CRSP value weighted index return is used to obtain the CAR. All the explanatory variables and controls are lagged by one year. We control for firm and year fixed effects. T-statistics are based on the standard errors clustered at the firm level. *, **, and *** represent statistical significance at 10%, 5%, and 1% level, respectively. For variable definition, please refer to Appendix F.
Dependent Variable: CAR[-1,1]
Coeff. t-stat Coeff. t-stat
fWHR -0.04 (-2.43) ** -0.053 (-2.09) ** 1{Risky Hobbies} -0.014 (-0.86) Voice Pitch 0 (-0.82) Pf -0.003 (-0.26) overconfidence 0 (-0.05) CEO age -0.001 (-1.18) -0.001 (-0.94) ln(Tenure) 0 (-0.02) 0.003 (0.50) Delta 0 (-0.02) 0.002 (0.33) Vega 0.001 (0.47) 0.003 (0.65) ln(Firm Age) 0.006 (1.21) 0.018 (1.96) * Cash Flow 0.063 (0.23) 0.426 (1.58) Investment 0.229 (0.19) -0.469 (-0.36) Size:ln(Assets) 0.002 (0.34) 0.002 (0.32) ROA 0.063 (1.32) 0.017 (0.25) Leverage 0.028 (0.97) 0.052 (1.01) Dividend Yield -0.321 (-1.28) -1.081 (-2.23) ** 1{Cash Deal} 0.003 (0.69) 0.007 (1.29) ln(deal value/assets) -0.03 (-1.42) -0.05 (-2.45) ** 1{private target} 0.011 (2.03) ** 0.011 (1.77) * 1{diversifying merger} -0.002 (-0.45) 0.003 (0.48) IMR 0.015 (0.76) 0.004 (0.18) constant 0.033 (0.41) 0.086 (0.98) N 947 533 Adj.R2 0.036 0.125

57
Table10.DohightestosteroneCEOshavecompensationstructurethatisloadedmoretowardsequitycompensation?We run the following regression models.
Ln(1+VEGA)=b*fWHR +Controls +Firm & Year FE
Ln(1+DELTA)=b*fWHR +Conrols +Firm & Year FE
VEGA and DELTA of CEO compensation are obtained following Coles, Daniel, and Naveen (2006). T-statistics are based on heteroskedasticity robust standard errors. *, **, and *** represent statistical significance at 10%, 5%, and 1% level, respectively. For variable definition, please refer to Appendix F.
Dependent Variable: ln(1+VEGA)t ln(1+DELTA)t
fWHR 1.154 *** 6.247 *** 1.345 *** 7.463 *** (2.84) (3.97) (3.15) (4.12) 1{Risky Hobbies} 0.215 -0.957 * (0.16) (-1.89) Voice Pitch -0.011 0.003 (-0.97) (0.39) Pf 0.405 * 0.592 (1.67) (1.41) Overconfidence -0.013 -0.281 ** 0.343 *** 0.082 (-0.15) (-2.17) (5.29) (0.75) Ln(Tenure) 0.364 *** 0.337 *** 0.448 *** 0.614 *** (5.07) (2.70) (8.95) (6.99) 1{Chairman=CEO} 0.094 0.347 *** -0.027 -0.07 (1.42) (2.68) (-0.46) (-0.76) 1{Ownership>5%} -0.058 -0.349 1.156 *** 0.654 ** (-0.32) (-1.27) (5.32) (2.20) Age -0.033 ** -0.053 *** 0.021 *** -0.039 ** (-2.40) (-2.98) (3.18) (-2.21) 1yr daily ret. volatility -0.344 *** -0.454 *** -0.439 *** -0.407 *** (-3.03) (-2.60) (-5.02) (-2.91) ROA 0.303 1.125 1.318 *** 1.645 *** (0.85) (1.39) (4.46) (3.12) Leverage -0.704 *** -1.164 *** -0.91 *** -1.493 *** (-2.78) (-2.82) (-4.06) (-3.69) Size:ln(Assets) 0.463 *** 0.532 *** 0.391 *** 0.361 *** (5.36) (4.75) (5.79) (3.90) M/B 0.012 0.016 0.059 *** 0.061 *** (1.45) (1.38) (5.54) (4.10) IMR -0.622 ** -0.588 0.326 ** 0.503 ** (-2.57) (-1.47) (2.19) (2.04) constant -2.411 ** -10.995 *** -4.19 *** -13.209 *** (-2.11) (-3.21) (-4.00) (-3.53) N 1955 861 1955 861 Adj.R2 0.769 0.763 0.821 0.802
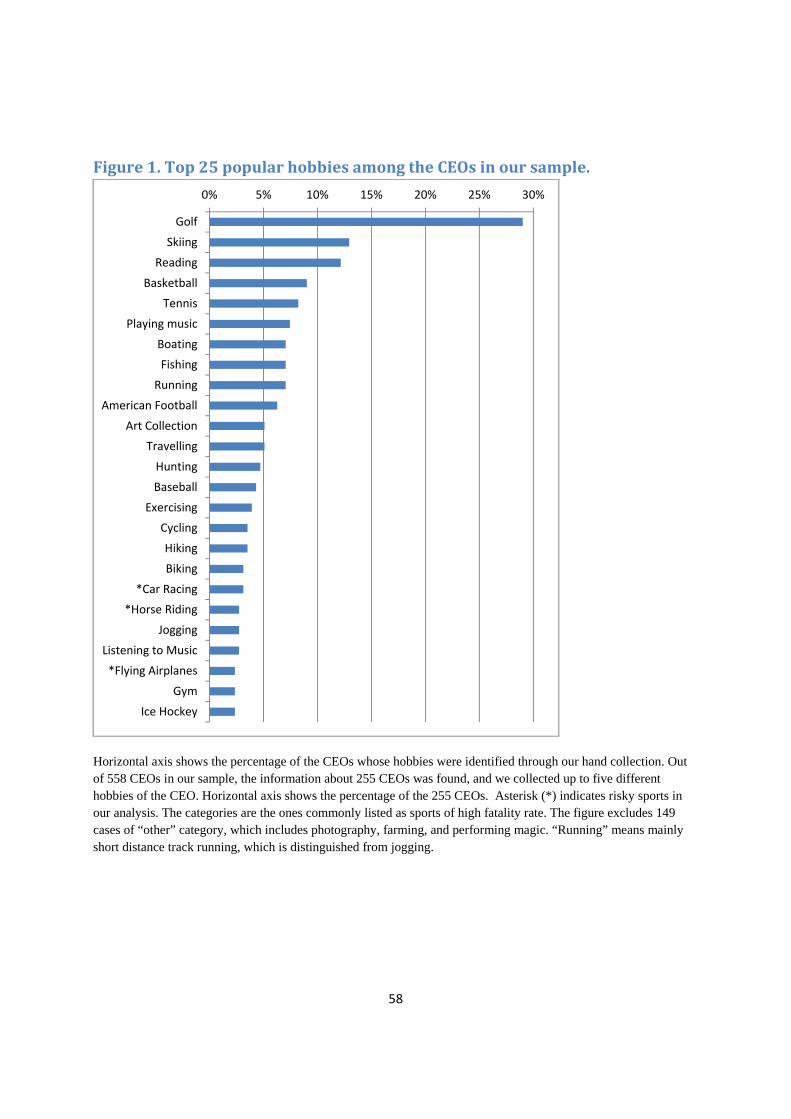
58
Figure1.Top25popularhobbiesamongtheCEOsinoursample.
Horizontal axis shows the percentage of the CEOs whose hobbies were identified through our hand collection. Out of 558 CEOs in our sample, the information about 255 CEOs was found, and we collected up to five different hobbies of the CEO. Horizontal axis shows the percentage of the 255 CEOs. Asterisk (*) indicates risky sports in our analysis. The categories are the ones commonly listed as sports of high fatality rate. The figure excludes 149 cases of “other” category, which includes photography, farming, and performing magic. “Running” means mainly short distance track running, which is distinguished from jogging.
0% 5% 10% 15% 20% 25% 30%
Golf
Skiing
Reading
Basketball
Tennis
Playing music
Boating
Fishing
Running
American Football
Art Collection
Travelling
Hunting
Baseball
Exercising
Cycling
Hiking
Biking
*Car Racing
*Horse Riding
Jogging
Listening to Music
*Flying Airplanes
Gym
Ice Hockey