Swinging For the Fences: The Effects of CEO Stock Options on Company Risk-Taking and Performance
53
Swinging For the Fences: The Effects of CEO Stock Options on Company Risk-Taking and Performance Wm. Gerard Sanders 790 TNRB Marriott School of Management Brigham Young University Provo, UT 84602 (801) 422-7607 [email protected] Donald C. Hambrick Smeal College of Business The Pennsylvania State University 414 Business Building University Park, PA 16802 (814) 863-0917 [email protected] This paper has benefited from the insights of Amy Hillman and three anonymous reviewers. For specific comments we thank Trevis Certo, Luis Gomez-Mejia Andrew Henderson, and Tim Pollock. © Academy of Management. All rights reserved. Content may NOT be copied, e-mailed, shared or otherwise transmitted without written permission. This non-copyedited article version was obtained from the Academy of Management InPress website and is intended for personal or individual use.
Transcript of Swinging For the Fences: The Effects of CEO Stock Options on Company Risk-Taking and Performance
Swinging For the Fences: The Effects of CEO Stock Options on Company
Risk-Taking and Performance
Wm. Gerard Sanders790 TNRB
Marriott School of ManagementBrigham Young University
Provo, UT 84602(801) 422-7607
Donald C. HambrickSmeal College of Business
The Pennsylvania State University414 Business Building
University Park, PA 16802(814) [email protected]
This paper has benefited from the insights of Amy Hillman and three anonymous reviewers. For specific comments we thank Trevis Certo, Luis Gomez-Mejia Andrew Henderson, and Tim Pollock.
© Academy of Management. All rights reserved. Content may NOT be copied, e-mailed, shared or otherwise transmitted without written permission. This non-copyedited article version was
obtained from the Academy of Management InPress website and is intended for personal or individual use.

1
Swinging For the Fences: The Effects of CEO Stock Options on Company Risk-
Taking and Performance
Abstract
We unpack the concept of managerial risk-taking, distinguishing among three of
its major elements: the size of the outlay; the variance of the potential outcomes; and the
likelihood of extreme loss. We then apply our framework in hypothesizing the effects of
CEO stock options on strategic behavior and company performance. We find that CEO
stock options engender high levels of investment outlays and bring about extreme
corporate performance (big gains and big losses), suggesting that stock options prompt
CEOs to make high-variance bets, not simply larger bets. Finally, we find that option-
loaded CEOs deliver more big losses than big gains.
2
It is an axiom of agency theory that managers tend to be more risk-averse than
shareholders would like them to be (Eisenhardt, 1989). Because CEOs have so much of
their economic wherewithal, as well as their reputations, tied to their focal firms, they are
relatively “underdiversified” and stand to lose a great deal if their companies stumble or
fail (Milgrom & Roberts, 1992). Thus, out of an overwhelming aversion to downside
outcomes, managers tend to avoid taking large risks. Shareholders, on the other hand, are
generally widely diversified in their holdings; hence they are risk-neutral and seek to
maximize returns. Because large gains tend to require that large risks be taken,
shareholders therefore favor more risk-taking than do CEOs. In this regard, agency
theorists draw on a central concept of financial economics – the correlation of risk and
return (Fama, 1976; Sharpe, 1964) – to argue that the two go hand in hand; you cannot
have big returns without taking big risks (Core, Guay, & Larcker, 2003).
Despite their zeal about risk-taking, however, agency theorists have been
generally ambiguous about just what they mean when they say they want managers to
take bigger risks.1 In some instances, agency theorists refer to the importance of placing
bigger bets, or making larger strategic outlays (Larcker, 1983). In other instances, they
refer to the importance of placing bets that have more extreme potential outcomes
(Jensen & Meckling, 1976; Wright, Kroll, Lado, & VanNess, 2002). And in still other
cases, agency theorists suggest that the main problem is that managers worry too much
about downside/losses which then prevents them from taking needed risks (Amihud &
Lev, 1983). It is due to this conceptual complexity, as well as other ambiguities, that
Wiseman & Gomez-Mejia (1998) described agency theory’s portrayal of risk as
“underdeveloped.”
1 Agency theorists want managers to join shareholders in being “risk-neutral,” which is defined as indifference between receiving a fixed sum and taking a chance on an uncertain action that has an expected value equal to the fixed sum (Milgrom & Roberts, 1992). Such a choice situation can be engineered in experimental settings, but its direct translation into managerial behavior is not straightforward.
3
But such limitations have not prevented agency theorists from making
prescriptions about how to promote managerial risk-taking. Among these prescriptions
has been the call for the heavy use of stock options to motivate CEOs, as when Hall &
Liebman (1998: 656) said that “the most direct solution to [the] agency problem is to
align the incentives of executives with the interests of shareholders by granting (or
selling) stock and stock options to the CEO.” Moreover, boards have largely followed
this advice. At their peak, in 2001, stock options (valued ex ante) accounted for over 50
percent of the pay of CEOs of major U.S. firms. In 2005, options were still the single
biggest element of CEO pay accounting for 41 percent (Lublin, 2006).
Oddly, the most vigorous discussions about stock options have been over whether
they should be expensed when they are granted, and over the practice of back-dating
options, rather than over the far more consequential question: Do stock options promote
constructive executive behavior, particularly sensible risk-taking? Studies have indicated
that stock options tend to induce managers to take bigger risks (e.g., Rajgopal & Shevlin,
2002), but have generally stopped short of examining whether these increased risk-taking
behaviors are value- and profit-enhancing or not. The central tension, to paraphrase the
arguments raised by Hanlon, Rajgopal, and Shevlin (2003), is whether stock options are
economically efficient, helping to enhance firm value, or whether they mostly create the
illusion of stimulating constructively aggressive behavior, while diverting windfalls to
executives. In this latter vein, only lately have some agency theorists conceded that stock
options may not resolve the agency problem in the way they had initially envisioned
(Jensen, Murphy, & Wruck, 2004).
In recent years, theorists have shown interest in how stock options shape
managerial perceptions and behaviors. For example, in an experimental setting, Devers,
Wiseman, and Holmes (in press) examined how option-holders revise their subjective
valuations of their options, depending on the interaction of the company’s recent stock
price trend and volatility. This finding leads to the important insight that managers
4
continuously update their assessment of the worth of their options, in ways that can be
expected to affect their strategic behaviors. Another recent study by Sanders (2001),
which is pivotal for our own inquiry, finds that stock options cause managers to engage in
risk-taking, as expected; but the form of risk-taking examined – acquisitions – is widely
believed to be value-destroying on average (Bruner, 2004; Jensen & Ruback, 1983;
Porter, 1987). The thrust of that study, then, is that stock options induce risk-taking, but
not necessarily wise risk-taking.
Our study attempts to make a theoretical contribution on two fronts. First, we
unpack the concept of managerial risk-taking. Specifically, we distinguish among three
elements of risk-taking: the size of the outlay or bet; the variance of the potential
outcomes; and the likelihood of extreme loss. As noted, prior research has tended either
to equate one of these elements with overall risk-taking or to speak about risk-taking
broadly without consideration of these distinct elements. Second, we apply our
framework of managerial risk-taking in examining the effects of stock options – a
favorite prescription for heightening executive risk-taking – on strategic behavior and
company performance. As noted above, relatively little is known about the inter-
connected consequences of CEO stock options for firm behavior and performance.
A brief overview of our line of argument is helpful at this point. First, we argue
that stock options encourage CEOs to place relatively large bets on uncertain investments
categories, such as R&D, capital expenditures, and acquisitions. Second, we argue that
stock options tend to bring about extreme corporate performance – big wins and big
losses. Moreover, we anticipate that the interaction of high levels of stock options and
high levels of investment spending will exacerbate performance extremeness, beyond the
simple additive effects of the two, indirectly indicating that option-loaded executives not
only make bigger investments but also (unobserved) higher-variance investments. Third,
and finally, we hypothesize that heavy use of CEO stock options will bring about more
big losses than big wins. This counterintuitive expectation is based upon the asymmetric
5
payoffs that CEOs experience when they hold large quantities of stock options: big
personal gains for performance improvements, but no losses for big company setbacks.
Based upon a multi-year analysis of over 800 companies, we find considerable support
for our hypotheses.
Before proceeding, we wish to note three limits to the scope of our study. First,
we focus specifically on CEO stock options, in keeping with the prevailing approach of
scholars of executive compensation, even though we recognize that many strategic
actions emanate from decision-making beyond the CEO. While we expect that CEO
compensation directly affects many strategic choices, we can also envision fruitful
research on how stock option allocations to entire top management teams might affect
organizational outcomes. Second, our empirical tests rely upon ex post evidence of risk-
taking, as reflected in corporate expenditures, performance extremes, and aggregate
financial ratios. Although this approach has been widely followed in research on
compensation and risk-taking (Carpenter, Pollock, & Leary, 2003; Eisenmann, 2002;
Wright et al., 2007), it does not allow examination of the ex ante risk profiles of the
choices made by the CEOs in our sample. Data allowing such insights are exceedingly
rare, and would almost always fall short of providing the fine detail required to directly
test our risk-taking framework. As a partial effort in this regard, however, we will report
a supplementary analysis of the characteristics of the acquisitions made by CEOs in our
sample. Third, an emerging stream of research suggests that executives continuously
update their subjective assessments of their option values, in ways that could influence
their strategic behaviors (Devers et al., forthcoming; Wiseman & Gomez-Mejia, 1998).
We do not attempt to develop our theory and hypotheses around this interesting line of
thought, but we do control for factors that should lead to this endowment effect.
6
Unpacking the Concept of Managerial Risk-Taking
Prior Literature
A voluminous literature on managerial risk-taking (dating back to Knight, 1921;
von Neuman & Morgenstern, 1947; and Arrow, 1965) has contributed greatly to our
understanding of a central feature of executive work (e.g., Bloom & Milkovich, 1998;
March & Shapira, 1987; Palmer & Wiseman, 1999; Shapira, 1995; Sitkin & Pablo, 1992;
Wiseman & Gomez-Mejia, 1998). Yet this literature carries some substantial
ambiguities, which pose difficulties for researchers who are concerned with fundamental
questions such as these: Just what do we mean when we say that a manager is taking a
risk? Is it possible that a given course of action is risky in some ways but not in others?
Namely, are there multiple elements or dimensions of risk?
Perhaps the main factor contributing to an over-aggregation of the risk-taking
construct in the management literature is that definitions generally have been abstract and
all-encompassing. For example, Wright, et al., (1996: 442) defined corporate risk-taking
as “the analysis and selection of projects that have varying uncertainties associated with
their expected outcomes.” Bloom & Milkovich (1998: 285) similarly defined risk as
“uncertainty about outcomes or events.”2 But because there is some uncertainty with
almost any managerial action, and because uncertainty itself begs explication, such
definitions leave the reader still puzzled as to just what constitutes risk-taking.3
In treating risk as a composite construct, prior researchers have not considered the
components, or elements, that comprise a risk; in turn, they have not examined the
possibility that a manager might make a decision that is risky when viewed on one
2 Much of the literature uses the terms risk and uncertainty interchangeably, or with one term being used to define the other. Knight (1921) defined the two as distinct constructs; risk being a condition to which a manager can assign probabilities to various possible outcomes, and uncertainty being a condition when outcomes are not knowable and thus void of assigned probabilities. In contrast, our study is specifically about “risk taking” (its antecedents and outcomes), which may involve both risk and uncertainty as Knight defined the terms. 3 It should be noted that we do not aim to provide a comprehensive elaboration of all forms of risk taking. Scholars from such diverse disciplines as political science, psychology, anthropology, and economics have varying epistemological notions of what constitutes taking a risk (Althaus, 2005).

7
dimension but not so risky on another. Indeed, the foundational work on risk and
uncertainty in economics clearly notes that the construct is multidimensional (Rothschild
& Stiglitz, 1970). In a managerial decision-making context, March and Shapira (1987)
(and later Shapira, 1995) made a step toward disaggregating the concept of managerial
risk-taking, proposing that “likelihood of outcomes and their values enter into
calculations of risk independently, rather than as their product” (p. 1405), and when they
observed that managers hold a special concern for “the worst outcomes” in weighing
choice alternatives. So far, however, these insights have generally not been systematized
or put to use in theory or research on incentives and managerial risk-taking.
The Elements of Risk
In this section, we seek to address the ambiguities just noted, by presenting a
framework for assessing the amount of risk associated with a managerial decision. We
define risk as the degree to which potential outcomes associated with a decision are
consequential, vary widely, and include the possibility of extreme loss. To elaborate,
potential outcomes are deemed consequential to the extent they have the potential to alter
– positively or negatively – the health and vitality of the firm; potential outcomes vary
widely to the extent there is a large spread in the possible results; and the possibility of
extreme loss exists when one of the potential outcomes is a loss of most or all of the
outlay made (which we discuss again below).
In our conceptualization, then, the riskiness of a managerial decision can be
decomposed into three conceptually distinct, but inter-related elements: 1) the size of the
outlay, or the amount at stake; 2) the variance of probabilistic outcomes; and 3) the
likelihood of losing most or all of the investment. These three elements can be thought of
as “dimensions” of risk. Thus, even though we have offered a single definition of risk, a
given choice alternative might be very risky on one dimension but not so risky on
another.

8
Figure 1 helps to illustrate the three elements of risk, by showing the potential
outcomes associated with several alternative risk-taking scenarios (A through E) for a
given manager. The figure depicts three main characteristics of each scenario: the size
of the investment being considered, the probabilistic distribution of alternative outcomes,
and the possible gains and losses. For example, Scenario A involves an investment of
$100 million; and, the manager estimates that there is a 25% chance of a 40% profit, a
25% chance of a 20% profit, and a 50% chance of a 20% loss. Obviously, this figure is a
simplification of managerial alternatives, for ease of presentation and discussion. For
example, it omits consideration of timing, including the possibility that an investment can
be made in stages, so as to minimize risk (Miller & Folta, 2002). More significantly, the
figure implies that the probabilities associated with the various alternatives are knowable
– when in actuality, such is almost never the case. It is reasonable to speak of the
probability of “heads” in a coin toss, but far less reasonable to speak of the probability of
a given outcome in a complex business situation. Indeed, March and Shapira (1987)
found in field research that managers generally do not think in terms of probabilities of
outcomes, but instead view risk subjectively or according to the likelihood of a large loss.
These complications do not negate the basic logic of our figure, but rather reaffirm that it
is a simplified depiction of managerial choice alternatives.-----------------------------------
Insert Figure 1 about Here-----------------------------------
We can use the figure to explicate the three inter-related elements of risk. First,
ceteris paribus, the bigger the investment (for a given firm), the bigger the exposure and
hence the bigger the risk. (We assume that, in business, almost all investments have
some likelihood of some loss; if no loss is possible, then the size of investment does not
matter – at least on the downside). Small investments (again ceteris paribus) tend not to
yield very consequential outcomes; or worded conversely, for a given distribution of
payoff probabilities, a small investment will yield less consequential outcomes – in terms
9
of both gains or losses – than a large investment. Thus, for the manager facing the
scenarios in Figure 1, Scenario B is riskier than Scenario A. The potential distribution of
outcome probabilities is identical for the two scenarios, but the stakes are ten times
greater for B than for A. Interestingly, most researchers omit any consideration of “the
size of the bet” in conceptualizing risk-taking, while others treat it as a relatively
complete indicator of risk-taking (Larker, 1983; Hoskisson, Hitt, & Hill, 1993; Lee &
O’Neill, 2003). But, the size of the outlay is just one element of risk-taking.4
The second element of risk-taking is the variance of potential outcome
probabilities. (We should note that the term “variance” is used in two very different ways
in the literature on managerial risk-taking. The first way, and the one we adopt here, is to
refer to the dispersion of possible outcomes from a given action. The second way is to
refer to the intertemporal volatility of company performance.) A decision that can lead to
a wide range of possible results is riskier than one that can lead to a narrow, tightly-
bounded array of possible outcomes (Rothschild & Stiglitz, 1970). Thus, returning to
Figure 1, Scenario C is riskier than Scenario B. Although the two involve identical
outlays, the possible outcomes for C are much more extreme (ranging from the possibility
of a 40% loss to the possibility of an 80% gain). Scenario C might represent, for
example, the alternative of spending a billion dollars to build a facility to produce a
potentially high-margin product with unproven demand, whereas Scenario B involves an
outlay of the same amount to expand capacity to meet predictable demand for the
company’s existing low-margin products.
We do not wish to propose a precise quantification of this second element of risk-
taking – variance, or range, in possible outcomes – but rather are content to describe it
conceptually. What is useful to point out (and presaging our eventual empirical analysis)
4 We acknowledge that executive investment actions are not literally “bets,” and that executives do not like for gambling terminology to be applied to their behaviors (Shapira, 1995); still, such expressions as “the size of the bet” allow a convenient shorthand for some of our descriptions.

10
is that if two sets of companies make identical levels of investment (or their levels of
investment are otherwise statistically controlled for), but they differ in how extreme their
subsequent performance is, then there is a good chance that those companies with the
more extreme performance took courses of action that had widely varying potential
outcomes (as in Scenario C), while the other companies pursued actions that had less
extreme potential outcomes (as in Scenario B).
The third element of risk – and the one closest to the connotation among
managers – is the likelihood that most or all of the investment will be lost. Among the
few theorists who have pointed to this specific element of risk are Sitkin and Pablo
(1992:10), who defined risk as “uncertainty about whether potentially significant and/or
disappointing outcomes…will be realized.” Shapira (1986) also concluded that extreme
loss is a distinct aspect of risk, particularly in the eyes of executives. Most of his
interviewees, when asked how they think about risk, referred to concern for “worst
outcome” or “maximum loss.” If the only possible negative outcome is just mildly
negative – as when an asset can be readily re-sold at close to its purchase price – then the
risk is far more limited than if the potential negative outcomes include, say, loss of half or
all of the investment. We are not proposing a universal threshold for what constitutes the
likelihood of extreme loss, for it depends on the practical matters involved, as well as the
researcher’s specific interest. But, for the sake of discussion, let us assume this condition
exists for any investment that has at least a 10% chance of resulting in a loss of 50% or
more. Under this conception, Scenarios D and E in Figure 1 contain this third element of
risk, while A, B, and C do not. (Likelihood of a major loss could obviously be
operationalized in other ways).
It is important to note that the first two dimensions of risk are not fully
determinative of the third. For example, Scenario B in Figure 1 involves a large
investment that has a narrow band of potential outcomes and no possibility of extreme
loss. Now consider a slightly modified scenario, in which the downside consists of a
11
40% chance of a 20% loss, as well as a 10% chance of a total 100% loss. The outlay is
the same; the variance of probabilistic outcomes has changed only slightly (and is still
smaller than in Scenario C, D, or E); but now the possibility of extreme loss exists. We
could also envision a situation in which a large investment is made, and the payoffs
consist of the possibility of modest loss and extraordinary upside; hence great variance
exists, but there is no likelihood of extreme loss. Thus, the three dimensions of risk are
somewhat interdependent but not conceptually redundant.
In sum, we have presented a framework for dimensionalizing managerial risk.
When an executive faces an investment decision, he or she will consider – implicitly or
explicitly – three aspects of each alternative: How big of an outlay is involved? How
much variance is there in the possible outcomes? And what is the likelihood that I will
lose most or all of my investment? These three dimensions of risk allow an unpacking of
this important construct, which may yield new theoretical, empirical, and practical
insights beyond those that have arisen from more aggregated portrayals. Returning to
Figure 1, we can say that the overall riskiness of the scenarios increases monotonically
from A through E. Scenario A involves a small bet, with a relatively narrow range of
potential outcomes. B is a big bet, with a narrow range of possible outcomes. C is a big
bet, with a moderate range of outcomes. And D and E involve even more extreme
potential outcomes, including the possibility of extreme loss.5
According to agency theorists, managers who lack appropriate incentives will be
timid and risk-averse, favoring investments such as in Scenario A. But because investors
are widely-diversified and risk-neutral, they want managers to be more aggressive;
specifically they want managers to take the highest expected-value actions among all
those available. In Figure 1, that is Scenario C. In our framework, Scenario C (compared
5 We have constructed the scenarios in Figure 1 so as to yield monotonic increases in aggregate risk. Other, more complex combinations could be imagined which would make it difficult to rank scenarios in terms of overall risk.
12
to the others) happens to involve a major investment, with a wide range of outcomes
(including a possible 80% gain), and no apparent chance of extreme loss.
Agency theorists have argued that one way of getting executives to overcome
their risk-aversion, and to see investment alternatives as shareholders do, is to pay them
heavily with stock options. But what the architects of such plans fail to anticipate is that
a very high level of stock option pay may induce executives to surpass the level of
riskiness that is prudent for shareholders. The executives may become “risk-lovers”
(Wiseman & Gomez-Mejia, 1998) and gravitate to whichever alternative carries the
greatest expected value of upside outcomes, even if that value is exceeded by the
possibility of substantial loss. Option-loaded CEOs will be inclined to pursue Scenario
E.6
CEO Stock Options and Risk-Taking
According to agency theory, the ideal instrument for rewarding CEOs will
overcome three major problems that arise when relying on base salary alone: shirking,
short-sightedness, and risk aversion (Haugen & Senbet, 1981; Jensen & Murphy, 1990).
Stock options are thought to address all three of these problems. First, stock options help
to ameliorate problems of shirking, by aligning CEO payoffs with shareholder payoffs.7
To the extent that CEO effort brings about high levels of company performance, those
CEOs whose rewards are tied to company performance will exert themselves in their jobs
(Eisenhardt, 1989). Second, stock options should help overcome the problem of short-
sightedness. If paid as bureaucrats, CEOs will under-invest in the future (Hall &
Liebman, 1998). They have little incentive to undertake projects that will benefit only
6 We thank an anonymous reviewer for pointing out that a related factor that likely affects the choices among risky alternatives is the difference between objective properties of risk and subjective perceptions of it. Moreover, CEOs might impose decision weights that vary from what objective data might suggest. Cumulative prospect theory (Tversky & Kahneman, 1992) might shed some light on how decision weighting affects the relationship between stock option incentives and the choice of risky investments. However, because our data do not allow us to assess CEOs’ subjective risk assessments, we defer this for future research. 7 Shirking is a generalizable label that encompasses all forms of self-serving behavior.
13
their successors, even if those projects might improve the strategic health, and hence the
value, of the firm. Stock options help to overcome this problem by making the CEO
eligible to participate in future gains of the company’s share price. Because there is
typically a vesting period before options can be exercised, CEOs who are paid with stock
options have an incentive to take the long view in their decisions about investments.
Stock options also help to solve the third basic challenge of CEO compensation,
by encouraging CEOs to take greater risks on behalf of shareholders (Haugen & Senbet,
1981; Rajgopal & Shevlin, 2002; Sanders, 2001; Tufano, 1996). Stock options are
thought to help overcome the CEO’s risk aversion, by allowing the CEO to participate in
upside gains without limit, while providing a floor to avoid losses. With enough stock
options, risky projects that work out well can make the CEO very wealthy. If the projects
fail, and the company’s shares drop, the CEO neither gains nor loses – at least not from
the stock options. It is this supposed feature of CEO stock options – increasing
managerial risk-taking – to which we turn momentarily, organizing our hypotheses in line
with our earlier discussion of the elements of risk-taking.
An emerging stream of research provides evidence that stock option pay may
affect managerial decision making. For instance, scholars have found that stock option
pay is negatively associated with the use of derivatives to hedge financial risk (Rajgopal
& Shevlin, 2002; Tufano, 1996). Others have linked stock option pay to specific
investment choices, such as the number of acquisitions firms make (Sanders, 2001), and
the riskiness of acquisitions (Wright et al., 2002). Very few studies have gone the extra
step by attempting to find a link between stock option pay and subsequent firm
performance. Exceptions include recent studies which have reported that executive stock
option plans are associated with increases in operating performance (Hanlon, Rajgopal, &
Shevlin, 2003; Kato, Lemmon, Luo, & Schallheim, 2005). Notwithstanding these recent
strides to examine the effects of stock option pay, essentially all of this early work has
significant limitations. First, few studies link stock option pay to substantive strategic
14
decisions, or they focus on only one type of investment (e.g., acquisitions). Second, most
research on the effects of stock option pay is highly vulnerable to the analytic problem of
endogeneity (Rajgopal & Shevlin, 2002). Specifically, prior studies that have tried to
link stock option pay to risk-taking have largely failed to account for the fact that firm
characteristics such as risk and investment behavior are also antecedents of stock option
pay (Beatty & Zajac, 1994; Henderson & Fredrickson, 1996; Zajac & Westphal, 1994).
Effects of CEO Stock Options on Investment Magnitude
The first element of risk-taking is the size of the bet, or, for CEOs, the magnitude
of investment outlays they make. The idea that incentives can cause CEOs to make large
investments is supported by Larcker’s (1983) study, which found that the adoption of
long-term incentive programs (LTIPs) for CEOs was associated with increases in capital
spending levels. According to Larcker, these LTIPs – which provided payoffs for multi-
year performance improvements – prompted CEOs to invest more in fixed assets, which
by their very nature tend to deliver the bulk of their returns in future years rather than
currently. In the absence of such incentives, Larcker asserted, CEOs were reluctant to
sacrifice current earnings for initiatives that had uncertain returns only in the future.
So far, evidence that stock options prompt larger investment spending is only
indirect. In an early study, Lambert et al. (1989) found that option pay adoption was
associated with a reduction in dividend payouts. This result logically follows from the
fact that options only give executives rights to share price appreciation, but not to income
distributions; therefore option-loaded executives prefer to retain earnings, so that they can
be applied toward long-term investment that might help push up future share prices. In a
more recent study, Sanders (2001) found that CEO stock option pay was positively
related to the number of acquisitions that companies made; although data on the scale of
the acquisitions were not reported, the results suggest that stock options promote
investment spending.

15
Bearing in mind that option-loaded CEOs are aiming for large share-price
increases, and that consequential outcomes tend to require large investment spending, we
anticipate that stock options will increase a CEO’s willingness to make large outlays on
uncertain projects, such as R&D, capital expenditures, and acquisitions. Modest
investment spending will tend to have little potential to dramatically alter the company’s
share price. Large spending, however, will have much greater chance to substantially
affect company performance, including in the upward direction that the option-loaded
CEO is hoping for. This line of thought leads to our first hypothesis:
Hypothesis 1: The more that CEO compensation consists of stock options, the greater the magnitude of investments made by the firm.
We should acknowledge at this point that our empirical analysis examines
aggregate investment outlays (as Larcker (1983) did in his study of LTIPs), even though
we would ideally like to examine the size of individual investment projects. In line with
our earlier argument (reflected in Figure 1), option-loaded executives are expected to
invest heavily in uncertain projects, but they are especially expected to invest in big
projects rather than spread modest investments over many projects. We will revisit this
distinction in our discussion.
Performance Extremeness and the High-Variance Nature of Investments
Stock options not only stimulate CEOs to make large strategic investments, but
also encourage them to direct such spending to high-variance initiatives. As envisioned
by agency theorists, CEOs who are loaded-up with stock options will undertake more
extreme, high-variance risks than those who are not (Agrawal & Mandelker, 1987;
Wright et al., 2002). For example, we can anticipate that they will be more likely to
invest in the development of radical new products instead of safer product-line
extensions; they will be more likely to build new plants in anticipation of uncertain
demand, instead of only after demand has materialized; and so on. Because option-
loaded CEOs stand to gain substantially from every upward increment in the company’s
16
share price, but are buffered from any downward movement, they are relatively willing to
engage in what we earlier referred to as the second element of risk-taking: high-variance
investing. Option-loaded CEOs will “swing for the fences,” hoping to hit home runs but
knowing that they also have an increased likelihood of striking-out.
To date, evidence that stock options lead to high-variance investments is limited.
Tufano (1996) and Rajgopal and Shevlin (2002) reported that, in raw material extraction
industries (gold mining and oil and gas, respectively), CEOs who were paid with stock
options were less likely to hedge their risks with derivatives, inferring that option-loaded
CEOs were willing to accept more exploration risk. Wright et al., (2002) reported that,
among firms completing large acquisitions, stock option pay was positively associated
with riskier acquisitions, as measured by the degree of ex ante covariance of stock returns
(of the acquirer and target firms). The authors reasoned that stock options motivate
executives to make riskier acquisitions than they would otherwise.
In a related vein, Agrawal and Mandelker (1987) investigated the stock price
variance, or intertemporal volatility, of firms that completed acquisitions and divestitures.
They divided their sample of firms into those that had an increase in stock price volatility
following the acquisition or divestiture and those that experienced a decrease in stock
price volatility. They then examined the mean level of option pay and ownership (these
two variables were collapsed into a single measure) of these two groups and found that
the combined value of CEO stock options and ownership was significantly higher in the
variance-increasing group than in the variance-decreasing group. The interpretation was
that options and equity holdings prompted CEOs to take riskier initiatives.
What has not been directly considered, although it follows logically from prior
work, as well as from the basic rationale of stock options, is that CEOs who are paid
heavily with stock options will tend to generate extreme performance. Because stock
options increase the propensity of executives to make large and high-variance bets, stock
options should also be associated with a greater propensity to both “hit home runs” and to

17
“strike out.” That is, option pay should lead to performance extremes, defined as
performance that deviates widely from neutral or moderate levels. Large high-variance
bets, as undertaken by option-loaded CEOs, are likely to either pay off handsomely or to
lead to large losses. In contrast, decision makers who are without such incentives are
likely to make smaller and lower-variance bets, and their firms will be more likely to
achieve moderate, relatively neutral performance. This logic leads to the following
hypothesis:
Hypothesis 2: The more that CEO compensation consists of stock options, the more extreme will be the firm’s subsequent performance.
If the extreme performance (big wins and big losses) of option-loaded CEOs is
due, as we have argued, to bets that are both big and of high-variance, then both of these
elements of risk-taking should be detectable in empirical analysis, even though only one
– the size of the bet – is directly observable. If option-loaded CEOs not only make bigger
investments, but also investments with high-variance (which is unobservable), then we
can expect that the interaction of CEO stock options and investment magnitude will be
positively associated with performance extremeness – beyond the independent, additive
effects of the two. We anticipate that the combination of heavy use of CEO stock options
and large levels of investment spending tend to generate extraordinarily extreme
performance – very big wins and losses – due to the (unobserved) high-variance nature
of the investments made. Put another way, high levels of stock options and investment
spending are like a “combustible combination” that leads to even greater performance
extremeness than the additive effects of stock option pay and investment magnitude do
on their own. Thus:
Hypothesis 3: The interaction between CEO stock options and magnitude of investments will be positively related to performance extremeness.
We can expect to observe suggestive evidence of the distinct effects of investment
magnitude and investment outcome-variance on extreme performance in yet one more
way. If it were the case that stock options cause CEOs to make large investments, but not
18
higher-variance investments, then investment magnitude would fully mediate the
relationship between stock options and performance extremeness. If, on the other hand,
and as we have argued, stock options lead CEOs not only to make bigger bets, but also
high-variance bets, then investment magnitude will not fully explain the extreme
performance of option-loaded CEOs. If CEOs who are paid heavily with stock options
undertake systematically, higher-variance projects – or otherwise engage in an
investment style that brings about extreme performance – then investment magnitude will
not be a full mediator of the relationship between CEO stock options and performance
extremeness. Instead, the high-variance nature of the projects undertaken is an
additional, but unobserved, causal mechanism leading to extreme performance outcomes.
Because an absence of full mediation does not provide any direct insight as to
what the unobserved operative mechanism actually is, we do not posit this line of thought
as a formal hypothesis. Still, we will empirically assess whether the magnitude of
investment spending fully accounts for the association between CEO stock options and
performance extremeness.
Performance Asymmetry
In espousing the use of stock options, agency theorists not only anticipate that
such incentives will bring about greater managerial risk-taking, but also that such risk-
taking will be beneficial to company performance and shareholder interests (Jensen &
Murphy, 1990; Mehran, 1995). Some prior studies indicate that shareholders seem to
subscribe to these beliefs. For instance, Brickley, Bhagat, and Lease (1985) reported a
positive abnormal return for firms upon adoption of stock-based compensation plans, and
Yermack (1997) and Morgan and Poulsen (2001) similarly found that stock prices
increased upon adoption of executive stock option plans. Thus, it appears that investors
believe that stock options will have positive performance effects.
In our preceding discussion, we argued that high levels of stock option pay tend to
bring about extreme performance – big wins and big losses. In responding favorably to
19
stock option pay, investors seem to believe there will be more of the former than the
latter. But other scenarios are possible. For instance, it could be that the extreme
performance levels delivered by CEOs who are under aggressive stock option plans will
be centered on zero, evenly divided between big wins and big losses. This performance
symmetry would occur if stock options prompt CEOs to be more aggressive but not
necessarily smarter or luckier. It is also possible that CEOs who are paid largely with
stock options will generate more big losses than big wins. That is our expectation, and
we shall now develop this as a formal hypothesis.
Managers generally tend to be very concerned – too concerned, according to
agency theorists – with the potential downside, especially the maximum possible loss, of
the alternatives they consider (Amihud & Lev, 1983; Shapira, 1996). But with enough
stock options, CEOs have significant incentive to focus on possible gains but little reason
to be concerned with the possibility of big losses. This shift of attention is due to the
asymmetric payoffs from stock options: unlimited upside but no downside (Sanders,
2001). As a result, option-loaded CEOs are more likely to prioritize their alternatives
according to the expected value of the upside outcomes, rather than the expected value of
the full range of all possible outcome possibilities. If we acknowledge the premise
(which originated in financial economics and is now central to agency theory) that the
possibility of big payoffs is typically accompanied by the possibility of big losses
(Milgrom & Roberts, 1992), and then couple that premise with the fact that option-loaded
CEOs are oriented toward ignoring or downplaying the potential magnitude and
likelihood of those losses, then it becomes straightforward to see how such CEOs will
often pursue projects in which the chances of major loss are substantial. Returning to our
earlier Figure 1, which laid out several investment scenarios, we can anticipate that the
option-loaded CEO would pursue Scenario E, because it has the greatest expected value
for gains, even though it has a negative expected value overall and carries a 60% chance
20
of generating a extreme loss. With enough stock options, CEOs lose sight of the
downside and become “risk-lovers” (Wiseman & Gomez-Mejia, 1998).
The asymmetric payoff from stock options encourages risk-taking that is more
careless and uncontrolled than envisioned by the theoretical models justifying stock
options. Indeed, it is not difficult to imagine a CEO who derives a large portion of his
compensation in stock options, and stands to make millions from those stock options,
who undertakes a spate of far-fetched, exceedingly long-shot initiatives – in hopes of the
big win that will push the company’s share price greatly upward. Concerns about failure
are minimized not only because of the floor-effect of the stock options, but also possibly
by other forms of protection, including a co-opted or congenial board (Mace, 1971;
Westphal, 1998; 1999), the CEO’s ability to create the impression that he or she was
acting in an appropriate entrepreneurial fashion (Davidson et al., 2004), and even a
handsome severance agreement (Almazan & Suarez, 2003; Dalton, Daily, and Kesner,
1993).8 Thus, not only do we expect that option-loaded CEOs will generate more large
losses than large gains, but we can place this idea in a more rigorous, comparative
hypothesis:
Hypothesis 4: Large losses will constitute a greater percentage of all instances of extreme performance (large losses and large gains combined) when stock options are a large part of CEO pay than when stock options are a small or moderate part of CEO pay.
RESEARCH METHOD
Our sample frame included all firms listed on the Standard & Poor’s 500, Mid-
Cap, and Small-Cap indices in 1998. We randomly selected 1,000 of these firms and
collected data for them over the period 1993 to 2000. Not all firms were observed in
8 Anecdotal evidence suggests that CEOs who are under stock option plans are sometimes additionally buffered from downside penalties – in two ways. First, in some cases their existing options are “re-priced” to accommodate the fact that the company’s share price has dropped; this repricing of course sets a new, lower floor from which the CEO “tries again” (Pollock, Fischer, & Wade, 2002). Second, and less well known, some boards perversely reward CEOs who have not performed well under an option plan, by giving them new rounds of even more options – out of a belief that the original amount must not have been sufficiently motivating.
21
each year, due to mergers or missing compensation data. We dropped 50 firms because
of too much missing data, reducing the number of unique firms to 950 (the mean values
of the independent and dependent variables for the dropped firms did not differ from
those of the retained firms).
Because the hypotheses deal with the effects of stock option incentives on
subsequent investments and performance, a lagged model structure was in order
(described in detail below). Various model designs were tested, but we adopted an
approach that uses information on CEO stock options measured over a three-year period
(t-3, t-2, and t-1) to predict investments in the fourth year (t); these were then used to
predict performance extremeness in the fifth year (t+1). Thus, the lag design resulted in
the pooling of five four-year data panels to predict investment spending, and four five-
year data panels to predict performance extremeness. There were 3,820 firm-years in the
models predicting investment spending, and 2,862 firm-years in the performance models
(the fewer observations being largely due to one more lagged year).
Financial data were drawn from COMPUSTAT. Acquisition data came from the
Securities Data Corporation (SDC) merger and acquisitions database. Compensation data
were collected from Execucomp.
Measures
Dependent variables. We examined three distinct types of investment spending:
R&D investment, capital investment, and acquisition investment. These three measures
have been used as indicators of risky and uncertain long-term investment behavior in
prior research (Beckman & Haunschild, 2002; Hoskisson et al., 1993; Larcker, 1983).
R&D and capital expenditures were coded as reported in Compustat. Acquisition
expenditures were measured as the sum of the transaction values for all acquisitions
completed during the year, as reported in SDC. The values were all log transformed
(after adding the constant 1 to all cases). We also estimated the models using the sum of
22
all three types of expenditures. As a way to allow parsimonious tests of our interaction
hypothesis, we used this summed aggregate measure of long-term investment.
Performance extremeness was assessed by transforming two common indicators
of firm performance: total shareholder returns (TSR) and return on assets (ROA). TSR, a
stock market measure, is calculated as year-end stock price minus year-start stock price,
plus dividends paid, all divided by year-start stock price. ROA, a common accounting-
based indicator of performance, is net income divided by year-end assets. Both of these
measures of performance have been widely used in compensation studies (Bloom &
Milkovich, 1998; David et al., 1998; Finkelstein & Boyd, 1998; Henderson and
Fredrickson, 1996; 2001; Sanders & Carpenter, 1998).
To derive our theoretical variable of interest, performance extremeness in t+1, we
applied a two-step process. First, we estimated “predicted performance” by regressing
performance on all control variables discussed below.9 These models generated expected
performance levels, based on information from a comprehensive set of control variables
known to affect firm performance; they had χ2s of 1,259 (p<.0001) for TSR and 485
(p<.0001) for ROA. Next, we took the residual from the first regression (i.e., the
difference between the firm’s actual performance and predicted performance calculated
in the first step). We then calculated the absolute difference score (i.e., the absolute value
of the residual), to indicate how divergent, or extreme, the firm’s performance was in t+1,
relative to a best estimate of what the firm’s performance was expected to be. The
absolute value of the residual, then, is an indicator of how much actual performance
deviated from what might have been reasonably expected (without regard for the
direction of that extremeness). We will describe below our approach for operationalizing
“large losses” and “large gains” (for testing Hypotheses 4).
9 One of these controls is prior performance, which will likely be correlated with the error term. To avoid this problem, we used the well known instrumental variable technique (Johnston & DiNardo, 1997) to create an instrument that is correlated with prior performance but not with the error term.
23
Independent variables. Consistent with our hypotheses and prior research, we
measured stock option pay as the proportion of total compensation paid as stock options
(which could theoretically range from zero to 100 percent). We repeated all analyses
using a second operationalization – the natural log of the dollar value of stock option pay
– and the results (not shown) were essentially identical to those we report here. Stock
option values, based upon the Black-Scholes method, were calculated by Execucomp.
Because some firms award stock options periodically rather than annually, and because
incentives carry motivational effects over multiple years, we used a lagged model design.
We experimented with two alternative methods for creating this lag. First, we estimated
a model that used the simple average percentage of stock option pay for the prior three
years ((t-1 + t-2 + t-3) / 3). Second, we used a distributed lag model that included as
variables the percentage of stock option pay for each of the prior three years in the model
(t-1, t-2, and t-3) (e.g., Ahuja, 2000). These two lag structures produced substantially
similar results. For ease of presentation, we report results only for the first approach, in
which we used the three-year average of stock option pay as a percentage of total pay.
While our theory focuses on CEO incentives, it might be reasonable to ask whether stock
option pay measured at the level of the TMT would result in similar or different results
(Carpenter & Sanders, 2004). In supplementary analysis not reported in the tables, we
found that the average level of TMT stock option pay produced results very similar to
those we report.
Control variables. We included several control variables, all measured one year
prior to whichever dependent variable was under examination. Firm size, measured as
the natural log of revenues, was included because it affects investment levels and
performance. We included measures of firm diversification (entropy measure) and
international scope (foreign sales as a percentage of total sales) (Finkelstein & Boyd,
1998; Henderson & Fredrickson, 1996; Sanders and Carpenter, 1998), because firms
facing different institutional and competitive dynamics face distinct investment
24
opportunities and imperatives. Since investments and performance are likely to be
strongly affected by industry context, we included dummy variables for each 2-digit SIC
represented in the sample. There were 59 separate two-digit industries in the sample;
therefore, all analyses include 58 industry dummies as controls. In addition, we included
dummy variables to account for the calendar year of observation (year t). In models
predicting investment spending, we also controlled for prior year performance, measured
as TSR(t-1). Using ROA instead of (or in addition to) TSR yielded the same results.
Recent research suggests executives continuously reassess the subjective value of
their stock options, depending on the firm’s stock price volatility and stock price trend
(Devers, Wiseman, & Holmes, forthcoming). Therefore, we included these as control
variables. Stock price volatility was measured using the Black-Scholes volatility factor
(60 month). Stock price trend was measured as the percentage change in stock price
between the beginning of the year in which options were awarded to the end of t-1.
Because we measured stock option incentives over the prior three years, and the price
trend that is most relevant to executives is that which coincides with the period between
the grant date and the current time, we used a weighted average stock price trend. This
price trend was calculated by weighting each year’s grants (as a percentage of all grants
during the three years) by the change in stock price between the year of the grant and the
end of year t-1. Illustratively, if an executive was awarded 100,000 options in t-3 and no
options in t-2 and t-1, and the change in stock price from the beginning of t-3, t-2, and t-1
to the end of t-1 was 30%, 20%, and 10%, respectively, the weighted average stock price
trend would be 30% (30%*100%+20%*0%+10%*0%). Alternatively, if the executive
was granted 25,000 options in t-3, 25,000 in t-2 and 50,000 in t-1, the weighted average
stock price trend would be 17.5% (30%*25% + 20%*25% + 10%*50%).
Because stock options represent only one form of incentive, we also controlled for
CEO stock ownership, measured as the natural log of the value of the CEO’s equity
ownership. Stock ownership values are highly inertial, so there was no need to include
25
three years’ values; we thus included the value of stock ownership for t-1. Finally, to
control for the possibility that high levels of stock option pay could be offset, or
outweighed, by high levels of other forms of pay, we included a control for the total value
of all other forms of CEO compensation (excluding stock options). Total other
compensation was measured as the natural logarithm of the dollar value of all forms of
compensation (except stock options) awarded in t-1.
Endogeneity control. Finally, although we aim to examine the effects of stock
option pay on investment and performance, it is quite likely that option pay is itself
partially determined by firm investment patterns and performance. In other words, this is
a classic problem of endogeneity. Most of the prior empirical work on CEO pay suffers
from the threat of endogeneity, and very few studies account for this problem (Rajgopal
& Shevlin, 2002). We experimented with several techniques to control for endogeneity
(Hamilton & Nickerson, 2003), all with similar results. The endogeneity control we used
is a parameter that was created by regressing CEO stock option pay in t-1 on firm and
executive characteristics in t-2, and industry and year dummies. From that initial
regression, we retained all predictors that were significant. The significant predictors that
were positive included R&D intensity, capital intensity, prior performance, stock price
volatility, and firm size, while CEO stock ownership was negative and significant. In
addition, several industry dummies and all year dummies were significant. These results
are consistent with prior research on the antecedents of CEO incentive pay. Using these
regression results, we calculated the “predicted” level of CEO stock option pay, which
was then included as an endogeneity control in all our analyses.
Estimation Method
Our data consists of multiple, unbalanced panels of observations. As a result,
ordinary least squares regression would result in correlated error terms, understated
standard errors, and inflated t-statistics. Fortunately, there are several models appropriate
for pooled cross sectional panel data. We settled on using the cross-sectional time series
26
regression with random-effects models and generalized least square (GLS) estimators
with controls for autocorrelation (xtregar in STATA). This procedure estimates cross-
sectional time-series regression models that have a first-order autoregressive disturbance
term and it accommodates unbalanced panels with unequally spaced observations over
time. Our findings were also robust to using a relatively new class of robust estimators
known as generalized estimating equations, using the XTGEE procedure in STATA. Our
results were robust to this specification.10 In both instances, we corrected for
autoregressive disturbance (to conserve space, the latter method is not shown in the
tables). The results were substantially similar; all signs were the same and the levels of
significance were similar in both models. We tested Hypotheses 4 in several ways,
including a Kolmogorov-Smirnov test of the homogeneity of distributions of performance
across different levels of CEO stock option pay, z-ratio tests for the equality of
proportions of cases of big losses and big gains, and polynomial logistic regression
predicting the incidence of big losses and big gains.
RESULTS
Descriptive statistics and correlations are reported in Table 1. Statistics for
industry and year dummy variables are not shown.
-----------------------------------Insert Table 1 about Here
-----------------------------------
10 Our use of random-effects models follows prior research studying similar strategy initiatives (Beckman, 2006; Beckman, Haunschild, & Phillips, 2004, Gulati, 1995, & Lavie & Rosenkopf, 2006). Random-effects models are efficient while fixed-effects models reduce degrees of freedom and are especially problematic and unstable when estimating models where n is large and T is small. In our sample, we have over 900 firms with a maximum number of observations per firm of five years. Moreover, fixed-effects models predict the annual change in the dependent variable, while we are more interested in the explaining the variance across firms in risk-taking and performance. Fixed-effects models also preclude the use of any control variable that invariant over time, such as industry membership. Finally, random-effects estimators are preferred when there is reason to believe that Xit and Xit-1 are correlated, which they are in our case (Johnston & DiNardo, 1997).
27
Stock Options and Investment Behavior
Table 2 reports the results of the analysis of CEO stock options on investment
spending. Models 1 and 2 examine R&D investment, Models 3 and 4 examine capital
investment, Models 5 and 6 examine acquisition investment, and finally Models 7 and 8
examine the aggregate measure of overall long-term investment. Industry and year
dummies are not shown, but many were significant; moreover, several of the reported
control variables were significant in explaining each measure of investment spending.
The base models, which regressed the four dependent variables on all control variables
(1, 3, 5, and 7), were highly significant (by Wald Chi-squared test).
CEO stock option pay was significantly positively related to all four investment
spending measures (as show in Models 2, 4, 6, and 8). In support of Hypothesis 1, then,
high levels of stock options engendered high levels of investment spending.
-----------------------------------Insert Table 2 about Here
-----------------------------------
Stock Options and Extreme Performance
Hypothesis 2 predicted that CEO stock option pay would be positively associated
with extreme levels of subsequent performance. Table 3 presents the results for
regressions predicting performance extremeness. Models 1-4 report the results for TSR
extremeness, while Models 5-8 report the results for ROA extremeness. Recall that our
measures of performance extremeness were the absolute value of the residuals from an
initial regression (not shown) in which the dependent variable was the respective
performance indicator (in year t+1), and the independent variables were: industry
dummies and year dummies; performance, diversification, international scope, firm size,
stock price volatility, and stock price trend (all in t). In Models 1 and 5, we enter the
controls for total CEO pay, stock ownership and the endogeneity control. CEO stock
ownership was positively related to both measures of performance extremeness.
28
In Models 2 and 6 we add stock option pay. Consistent with Hypothesis 2, the
coefficients for stock option pay were significantly positive predictors of performance
extremeness for both TSR and ROA. Thus, higher levels of CEO stock option pay were
associated with more extreme levels of subsequent firm performance.
-----------------------------------Insert Table 3 about Here
-----------------------------------
Models 3 and 7 include the magnitude of overall investment spending, and
Models 4 and 8 then add the interaction of CEO stock option pay and overall investment
spending. The first pattern worth noting is that the magnitude of investment spending did
not at all mediate the relationship between CEO stock options and performance
extremeness, inasmuch as the addition of investment spending (in Models 3 and 7) did
not diminish the coefficients or significance of CEO stock options. Thus, even though
CEO stock options engender large levels of spending (as seen above), it is not this high
level of investment spending that causes performance extremeness. From our data, we
have no way of knowing what the unobserved mechanism might be, but the results
clearly point away from investment magnitude and more toward what might be called
“investment style,” possibly including the tendency to engage in long-odds projects.
In this same vein, we now turn to results for Hypothesis 3, which posited that
stock options and investment spending would have an interactive effect on performance
extremeness. Table 3 indicates strong support for this hypothesis for TSR extremeness
(Model 4) but no support for ROA extremeness (Model 8). Thus, for one of the
performance indicators there is evidence that large levels of CEO stock options and large
levels of investment spending bring about very extreme outcomes; we have no way of
knowing why this is a “combustible combination,” but our theory points to the likelihood
that option-loaded CEOs undertake big projects that are long-odds in nature.

29
Stock Options, Big Losses, and Big Gains
Our remaining hypothesis predicted that when stock options constitute a large part
of CEOs’ pay packages, large losses will be more prevalent than large gains. To test this
hypothesis, we examined the distribution of performance outcomes (in year t+1) for three
subsamples of observations, divided into roughly equal thirds based on the CEO’s
percentage of stock option pay. Cases in which stock options accounted for less than 20
percent of CEO pay were considered “low stock option pay;” cases between 20 and 49
percent were considered “medium;” and cases of 50 percent or more were conditions of
“high stock option pay.” Our results remain robust across other categorization cutpoints.
We first examined the distribution of performance outcomes under the three
different levels of CEO stock option pay, shown in Figure 2 (for both TSR and ROA).
To calculate performance outcomes, we used the residuals described above (e.g., the
residual from a regression in which performance was the dependent variable, and all
control and predictor variables except stock options were the independent variables) – but
now we retain the directionality of these residuals. The measure thus indicates the degree
to which performance was higher or lower than estimated by all the available predictors
(except CEO stock options). For both performance measures, we show brackets of
outcomes in increments of half standard deviations, centered on zero (or the outcome in
which a firm’s performance was exactly what would be predicted from all controls). To
aid visual interpretation, we also show curves fitted to the bracket outcomes. -----------------------------------
Insert Figure 2 about Here------------------------------------
Two primary conclusions can be drawn from Figure 2. First, reaffirming our
earlier results in Table 3, performance was much more likely to be neutral, or
nonextreme, under conditions of low and medium stock options than under conditions of
high CEO stock options. For example, if we look at the brackets that are within half a
standard deviation either side of zero, the frequencies (for both performance measures)
30
are substantially greater for the low and medium stock option subsamples than for the
high stock option subsample. As a systematic test for whether these distributions
differed, we applied the Kolmogorov-Smirnov test for homogeneity between sample
distributions. Various iterations of this test confirmed that the distribution of
performance outcomes (for both TSR and ROA) under conditions of high CEO stock
option pay was significantly different (p<.001) from the distribution for all other firms
combined, as well as from both the low and medium stock option firms separately.
Second, big losses were more common than big gains under high levels of stock
option pay. If we define extreme performance as greater than 1.5 standard deviations
away from zero, then among those firms with high stock option pay, the percentage of
cases with big TSR losses was 10.1 percent, while only 6.8 percent of the cases were of
big gains, a significant difference (by z-ratio test, p<.001). For ROA, the corresponding
proportions were 6.9 percent extreme losses and 3.9 percent extreme gains, again a
significant difference (p<.001).
Hypothesis 4 was more rigorous in proposing that large losses would constitute a
greater percentage of extreme outcomes (large losses and large gains combined) among
firms with high levels of stock option pay than among firms with low and moderate
levels. To test this hypothesis, we calculated the ratio of large losses to total cases of
extreme performance (large gains and large losses combined) for the high stock option
category and compared it with the same ratio for all other firms. For TSR, this ratio was
.60 for high stock option firms and .40 for all other firms, a significant difference
(p<.001). The difference was starker in the comparison of high and low stock option
firms: .60 vs. .32 (p<.001). For ROA, the ratios were .63 and .62 for high stock option
firms versus all other firms, which was not a significant difference. The difference in the
ratio for high stock option firms (.63) and low stock option firms (.48) was significant
(p<.05). Thus, there was considerable evidence that the extreme performance delivered
by high stock option CEOs was more lopsidedly negative than for other CEOs.
31
It might reasonably be asked whether our results were sensitive to where we drew
the cutoff for defining a “high level” of CEO stock options. Accordingly, we conducted
extensive sensitivity analyses (not shown), in which we varied our definition of high
stock option pay, using seven different cutoffs (ranging from 30 to 60 percent of pay).
We found substantial support for Hypothesis 4 across almost all these operationalizations.
Only when “high” was defined as above 30 percent of pay, did support for Hypothesis 4
disappear. Thus, the support we found for Hypothesis 4 was generally robust, not an
artifact of our specific cutoff for defining high stock option CEOs.
As a final test of performance asymmetry (i.e., Hypothesis 4), we conducted
multinomial logit on our sample, in which we sought to predict three alternative
outcomes: a big loss, a big gain, or neither (neutral performance). Big losses and big
gains were defined as performance that was 1.5 standard deviations below or above,
respectively, the value that was predicted from all control variables. Results are reported
in Table 4.
-----------------------------------Insert Table 4 about Here
-----------------------------------
In analyses A and B, we assess the effect of CEO stock option pay (as a
continuous variable) in predicting big losses, big gains, or neither (the omitted outcome),
for TSR and ROA, respectively. For TSR, CEO stock option pay was positively related
to the incidence of big losses and big gains; but the coefficient was more than two times
greater for big losses (coefficients differed at p<.01). For ROA, stock options were
highly predictive of big losses but were not predictive of big gains (difference of p<.01).
In analyses C and D, we used our stock option categories instead of the
continuous measure. Low stock option pay (under 20% of pay) was the omitted category.
Moderate stock option pay (20 – 49% of pay) was somewhat more positively related to
big losses than big gains, for both TSR and ROA. But differences were especially
pronounced under high stock option pay. High stock option pay was positively
32
associated with both big losses and big gains in TSR, but the coefficient for big losses
was about four times that for big gains (differing at p<.01). And, high stock option pay
was related to big losses and big gains in ROA, but the coefficient for losses was twice as
for gains (differing at p<.01).
In sum, the multinomial logit analysis strongly supports our earlier results. We
find robust evidence of two interrelated patterns: The more that a CEO is paid in stock
options, the more extreme the firm’s subsequent performance, and the greater the
likelihood that the extreme performance will be a big loss rather than a big gain.
DISCUSSION
CEO Stock Options and Three Elements of Risk-Taking
Our study was motivated by a desire to unpack and clarify the concept of
managerial risk-taking and to examine how a CEO’s financial incentives can influence
different dimensions of risk-taking and performance. We focused specifically on the
effects of CEO stock options, because 1) they have been the most vigorously-espoused
tool for encouraging CEOs to take bigger risks, and yet, 2) in sufficient quantities, stock
options can be expected to bring about imprudent risk-taking.
Perhaps the most basic element of managerial risk-taking is the size of the outlay
made (Larcker, 1983). We found, as expected, that stock options stimulate investment
spending. The more that CEOs were paid in stock options, the more aggressive they
were in their outlays in three major investment categories: R&D, capital spending, and
acquisitions (as well as in an aggregate index of all three).
The second element of managerial risk-taking is the variance, or range, of
potential outcomes. One of the objectives of stock options is to encourage CEOs to take
more extreme risks, which carry the prospect of greater payoffs, and which risk-neutral
shareholders prefer (Wright et al., 2002). We were not able to observe the a priori
probability distributions of the actions taken by the CEOs in our sample, but we used a
33
two-step analysis to infer that stock options were associated not only with large
investments, as just discussed, but also with high-variance investments.
We first demonstrated that CEO stock options were associated with subsequently
extreme company performance. Then we showed that investment spending did not at all
mediate the relationship between CEO stock options and extreme performance. Thus,
option-loaded executives delivered extreme performance for reasons other than their
large investments. From our data, we cannot be sure of what the unobserved
mechanism(s) might be. But we surmise that the undertaking of high-variance projects,
along with possibly other factors (such as hubris, impatience, and noncomprehensive
decision-making) contribute to the extreme performance of option-loaded CEOs. We
explored this idea of (unobserved) high-variance projects in one additional way, by
examining the interactive effect of CEO stock options and investment spending levels on
performance extremeness. This effect was highly positively significant for TSR
extremeness (but not for ROA extremeness), thus suggesting that large investments made
by option-loaded CEOs deliver more extreme performance than do investments (of the
same magnitude) made by CEOs who are not heavily paid with options. In hindsight, the
strong effect for TSR, but lack of effect for ROA extremeness, may not be surprising
given that stock option payoffs are tied to stock prices rather than operational
performance. Again, we cannot be sure of how option-loaded CEOs differ in their
investment styles from other CEOs, but our interpretation is that they invest in riskier
projects – presumably in more uncertain markets, with newer technologies, ahead of
competitors – all in hopes of greatly pushing up their companies’ share prices, so they
can exercise their options for a large gain.
The third element of managerial risk-taking is the likelihood of a major loss. And
this is where CEO stock options have their most provocative effect. Because option-
loaded CEOs benefit from share price increases but lose nothing if share prices drop, they
can be expected to sort investment alternatives according to the expected values of gains
34
while paying little attention to the likelihoods or magnitudes of losses (Sanders, 2001). If
we accept the commonsense idea that the projects with the biggest possible upside are
likely to also have the biggest possible downside, and then couple it with the assumption
that option-loaded CEOs have little concern with the size or probabilities of downside
outcomes, it is straightforward to expect that option-loaded CEOs have a relatively high
likelihood of delivering big losses.
Our results in this regard were strong. In our sample, those CEOs who derived a
high level of their pay from stock options generated more big losses than big gains (as
measured both by market and accounting metrics); and their ratio of big losses to big
gains was greater than the corresponding ratios for CEOs who derived less of their pay
from stock options. This result held over a wide range of cutpoints for defining a “high”
level of stock option pay.
In sum, high levels of stock options appear to motivate CEOs to take big risks, or
to “swing for the fences.” This outcome would seemingly be in keeping with what
agency theorists would expect (Jensen & Murphy, 1990). But option-loaded CEOs have
a disproportionate tendency to generate more big losses than big gains; they strike out
much more often than they hit home runs. Our data do not allow any insights as to why
this inferior performance comes about, but we anticipate that it is because option-loaded
CEOs are riveted on upside possibilities, with little concern for downside. Not only does
this asymmetry affect the selection of strategic initiatives, as we have discussed, but it
may also cause CEOs to be inattuned to early signs of project failure and generally
careless about risk mitigation.
Some organizational theorists have criticized agency theory for its single-minded
focus on shareholder wealth maximization and lack of concern for other constituencies
(e.g., Ghoshal, 2005). What has not been considered is that the prescriptions of agency
theorists, when taken to their extremes, may not even be beneficial for shareholders.
Based upon our results, this appears to be the case for CEO stock options. As agency

35
theorists envision, we found that stock options prompted CEOs to undertake large-scale,
risky investments that tended to deliver extreme company performance. What agency
theorists did not envision, however, was that the extreme performance delivered by
option-loaded CEOs was more likely to be in the form of big losses than big gains.
Investors – not even risk-neutral investors – would have desired this outcome.
Supplementary Analysis of Acquisition Behavior
As acknowledged earlier, we used ex post financial data as evidence of risk-taking
behaviors, even though indicators of ex ante actions would have been preferable. As a
supplementary analysis, we attempted to partially overcome this limitation by examining
whether some of the specific ex ante characteristics of acquisitions were associated with
CEO stock option pay. (Data on individual capital investments and R&D projects are not
available.) Following from prior research on acquisitions, we reasoned that the following
acquisition characteristics would carry more risk, and hence be associated with CEO
stock options: large aggregate spending relative to firm size, a large number of
acquisitions, large average size of each deal, large premiums paid, low target ROA, and
high target ROA volatility.
Using data from SDC, we measured these six dimensions of acquisition behavior
for each year as follows: 1) relative aggregate acquisition investment, which was the
same indicator reported above, but indexed by firm size (ln (aggregate expenditures on all
acquisitions, divided by acquiring firm’s revenues)); 2) relative number of acquisitions
(ln(number of acquisitions divided by acquiring firm’s revenues)); 3) average size of
acquisitions (average revenues of acquisitions, divided by acquirer revenues; 4) average
premium paid for acquisitions (price paid per share, divided by the target’s share price
one week prior to attempted takeover announcement, averaged over all public firm
acquisitions); 5) target’s ROA for the year prior, averaged over all public firm
acquisitions; and 6) target’s ROA volatility (standard deviation of ROA over three prior
years, averaged over all public firm acquisitions). (For the last three characteristics, there
36
were reduced sample sizes, as the needed data were only available for publicly traded
targets.)
Based upon the same type of multivariate analysis reported in Table 2, we report
in Table 5 the coefficients (and significance) for CEO stock options in predicting each of
these acquisition behaviors. As can be seen, there was considerable evidence that the
nature of acquisitions made by option-loaded CEOs differed systematically from the
acquisitions made by other CEOs. Not only did option-loaded CEOs spend more money
in aggregate on acquisitions (as previously presented), but they also made more
acquisitions, acquired targets that were large relative to their firm, the average size of
their targets was larger, and the premiums they paid were larger. Thus, option-loaded
CEOs lay more bets, and in line with our theoretical argument, they tend to take on more
risk with each bet. As noted above, we could not conduct such an analysis for R&D or
capital spending, but these results for acquisitions reaffirm the opportunity for scholars to
examine the strategic consequences of compensation arrangements in a more fine-grained
manner than was allowed by aggregate financial data such as we primarily relied upon.
Practical Implications
Our study has implications for the design of CEO incentive systems. It may seem
that our findings suggest that CEO stock options are generally a bad idea. But such a
conclusion would be an overstatement. For, without suitable incentives, CEO’s will tend
to be too risk-averse; stock options, in reasonable amounts, may bring about the desired
level of risk-taking. Indeed, our results suggest that moderation may be the key. The
distributions of performance outcomes in our sample, presented in Figure 2, indicate that
CEOs who derive a moderate percentage of their pay from stock options (20 to 50%)
deliver more extreme performance (and hence are taking bigger risks) than CEOs who
receive low levels of stock options. But, compared to the most option-loaded CEOs, their
performance is more symmetrically divided between gains and losses, particularly at the
extremes. It thus appears that moderate amounts of stock options achieve some of the
37
risk-taking that risk-neutral investors desire, but without producing the disproportionate
tendency for big losses that accompany more aggressive stock option plans.
However, there may be an even better solution for encouraging reasonable risk-
taking: paying CEOs in restricted stock, rather than in stock options. In the period of our
sample, grants of restricted stock were relatively rare (too rare, in fact, to examine
quantitatively). However, we did examine – as a control variable – the effects of CEO
stock ownership (which primarily reflected the CEOs’ own purchases, rather than stock
grants), and the results are noteworthy. As shown in Table 3, CEO stock ownership had
a very substantial positive effect on performance extremeness, just as did stock options.
Where the two incentive mechanisms diverge, however, is in the proportions of big gains
and big losses they generate. Whereas option-loaded CEOs delivered many more big
losses than big gains, Table 4 indicates that CEOs who held large amounts of stock
delivered results that were not as lopsidedly negative (for TSR, results were slightly more
negative than positive, and for ROA there were no differences). Thus, CEO
shareholdings seemed to promote a more prudent type of risk-taking than was generated
by stock options. Sanders (2001) provided a detailed discussion of how stock ownership
causes CEOs to be equally concerned about gains and losses, whereas stock options
encourage CEOs to think primarily about upside potential and little about downside. Our
results support this distinction and suggest that the current trend toward motivating CEOs
with restricted stock may be generally sensible (McGeehan, 2004).
LIMITATIONS AND FUTURE RESEARCH
As with any study, ours has limitations, which in turn suggest future research
opportunities. We will highlight several such opportunities.
First, our study examined the use of CEO stock options strictly on a ceteris
paribus basis, by holding constant the effects of other pay elements. It may be, however,
that the most fruitful way for scholars (and boards) to think about CEO pay is in terms of
combinations, or mixtures, of pay elements. So, instead of asking whether stock options
38
are positively or negatively associated with an outcome variable, it might be useful to
consider how certain combinations of stock ownership, stock options, salary, and bonuses
tend to bring about distinctive outcomes. For the scholar, there may be an opportunity to
develop a taxonomy of highly common mixtures of pay elements, which could then be
used for theoretical predictions and practical prescriptions.
-----------------------------------Insert Table 4 about Here
-----------------------------------
Second, our study falls short of considering how option-loaded CEOs transmit
their aggressive risk propensities to others in their organizations. How do option-loaded
CEOs encourage their subordinates to propose and pursue more risky initiatives? How
do option-loaded CEOs design formal processes, such as information systems, budgets
and control systems, and capital allocation reviews, to accommodate their intense interest
in upside gains and their relative disinterest in downside losses? There has been almost
no attention to the relationships among CEO compensation, CEO leadership behaviors,
and organization processes, but such research is needed.
Third, we did not examine the details of stock option plans. It may by, however,
that certain features of stock option programs – possibly vesting period, frequency of
grants, and number of people included – serve to significantly alter the relationships we
have observed. We encourage scholars who have an interest in the technical design of
compensation plans to use our results as a starting point to explore how refinements in
option plans can lead to better outcomes than we have found to generally occur.
Relatedly, there is a significant need to examine how governance arrangements (e.g.,
board composition) might be associated with the design of stock option programs.
Fourth, there is an opportunity to explore how different business conditions or
contexts might alter the effects (and effectiveness) of CEO stock options. Our study
included a host of controls for firm-level and industry-level factors, but future studies
39
might beneficially examine the interaction of contextual conditions and stock option pay.
For example, perhaps CEO stock options bring about different outcomes in high-
technology than in low-technology industries; or they might have different effects on
CEOs who have recently been performing well versus those who have been performing
poorly. Other contingency perspectives also could be pursued.
Finally, our results are based upon a particular time period, 1994-2000, and they
may or may not have the same relevance today. In recent years, a number of changes
have occurred that may alter the dynamics of executive compensation and its effects on
firms, including the Federal Accounting Standards Board (FASB) ruling in December
2004 that companies must begin to expense stock option payments. Although options
still represent the largest single form of CEO compensation, the relative mix of
compensation elements for U.S. CEOs could look different in years to come.
SUMMARY
Stock options are the largest component of the average American CEO’s pay, but
we know little about how they affect CEOs’ outlooks and behaviors. Our study addresses
the fundamental question of how stock options affect executive risk-taking. First, we
demonstrated that stock options encourage CEOs to invest heavily in uncertain
categories, including R&D, capital expenditures, and acquisitions. Second, we argued,
and found, that stock option pay, and the risk-taking behaviors it generates, tend to bring
about extreme corporate performance – big wins and big losses. Like baseball players,
CEOs who take very big swings have increased likelihoods of either hitting home runs or
striking out. We found that option-loaded CEOs delivered more big losses (strike-outs)
than big wins (home runs). Our study thus reaffirms that CEO behavior can be
influenced by the structure of monetary incentives, but that the heavy use of stock
options, a favorite prescription of agency theorists, yields more unfavorable than
favorable results.
40
References
Agrawal, A, & Mandelker, G. 1987. Managerial incentives and corporate investment and financing decisions. Journal of Finance, 42: 823-837.
Ahuja, G. 2000. The duality of collaboration: Inducements and opportunities in the formation of interfirm linkages. Strategic Management Journal, 21: 317-343.
Almazan, A. & Suarez, J. 2003. Entrenchment and severance pay in optimal governance structures. Journal of Finance, 58:519-548.
Althaus, C. E., 2005. A Disciplinary Perspective on the Epistemological Status of Risk. Risk Analysis: An International Journal, 25: 567-588.
Amihud, Y. & Lev, B. 1981. Risk reduction as a managerial motive for conglomerate mergers. Bell Journal of Economics, 12: 605-617.
Arrow, K., 1971, Essays in the Theory of Risk Bearing. Chicago: Markham Publishing Company.
Baron, R. M. & Kenny, D. A. (1986). The moderator-mediator variable distinction in social psychological research: Conceptual, strategic, and statistical considerations. Journal of Personality and Social Psychology, 51, 1173-1182.
Beatty, R. & Zajac, E. J. 1994. Managerial incentives, monitoring, and risk bearing: A study of executive compensation, ownership, and board structure in initial public offerings. Administrative Science Quarterly, 39: 313-335.
Beckman, C. M. 2006. The Influence of founding team company affiliations on firm behavior. Academy of Management Journal, 49: 741-758,
Beckman, C. M. & Haunschild, P. R. 2002. Network learning: The effects of partners' heterogeneity of experience on corporate acquisitions. Administrative Science Quarterly, 47:92-125.
Beckman, C. M., Haunschild, P. R., & Phillips, D. J. 2004. Friends or strangers? Firm-specific uncertainty, market uncertainty, and network partner selection. Organization Science, 15: 259-275.
Bloom, M. & Milkovich, G. T. 1998. Relationships among risk, incentive pay, and organizational performance. Academy of Management Journal, 41: 283-297.
Brickley, J, Bhagat, S, & Lease, R. 1985. The impact of long-range managerial compensation plans on shareholder wealth. Journal of Accounting and Economics, 1: 115-129.
Bruner, R. 2004. Where M&A pays and where it strays: A survey of the research. Journal of Applied Corporate Finance, 16(4): 63-75.
41
Carpenter, M. C., Pollock, T. G., & Leary, M. M. 2003. Testing a model of reasoned risk-taking: Governance, the experience of principals and agents, and global strategy in high technology IPO firms. Strategic Management Journal, 24: 802-820.
Core, J. E., Guay, W. R, & Larcker, D. F., 2003. Executive equity compensation andincentives: A survey. Economic Policy Review, 9:27-50.
Dalton, D. R., Daily, C. M., & Kesner, I. F. 1993. Executive severance agreements: Benefit or burglary? Academy of Management Executive, 7:69-76.
David, P, Kochhar, R, & Levitas, E. 1998. The effect of institutional investors on the level and mix of CEO compensation. Academy of Management Journal, 41: 200-208.
Davidson, W. N., Jirapor, P., Young, S. K., & Nemec, C. 2004. Earnings management following duality-creating successions: Ethnostatistics, impression management, and agency theory. Academy of Management Journal, 47:267-275.
Devers, C. E., Wiseman, R., & Holmes, R. M. forthcoming. The effects of endowment and loss aversion in managerial stock option valuation. Academy of Management Journal.
Eisenhardt, K. M. 1989. Agency theory: An assessment and review. Academy of Management Review, 14: 57-74.
Eisenmann, T. R. 2002. The effects of CEO equity ownership and firm diversification on risk taking. Strategic Management Journal, 23: 513-534.
Eisinger, J. 2006. What backdating of stock options means. Wall Street Journal, May 24, C1.
Fama, E. F., 1976. Foundations of Finance (New York: Basic Books)
Finkelstein, S. & Boyd, B. K. 1998. How much does the CEO matter? The role of managerial discretion in the setting of CEO compensation. Academy of Management Journal, 41: 179-199.
Ghoshal, S. 2005. Bad management theories are destroying good management practices. Academy of Management Learning & Education, 4: 75-91
Goodman, L. A. (1960). On the exact variance of products. Journal of the American Statistical Association, 55, 708-713.
Gulati, R. 1995. Social structure and alliance formation patterns: A longitudinal analysis. Administrative Science Quarterly, 40: 619-652,
Hall, B.J. & Liebman, J. B. 1998. Are CEOs really paid like bureaucrats? The Quarterly Journal of Economics, 113:653-691.
42
Hanlon, M., Rajgopal, S., & Shevlin, T. 2003. Are executive stock options associated with future earnings? Journal of Accounting & Economics, 36: 3-43.
Haugen, R.A. & Senbet, L. W. 1981. Resolving the agency problems of external capital through options. Journal of Finance, 36:629-647.
Henderson, A. D. & Fredrickson, J. W. 1996. Information processing demands as a determinant of CEO compensation. Academy of Management Journal, 39: 575-606.
Henderson, A. D. & Fredrickson, JW. 2001. Top management team coordination needs and the CEO pay gap: A competitive test of economic and behavioral views. Academy of Management Journal, 44: 96-117.
Hoskisson, R. E., Hitt, M. A. & Hill, C. W. L. 1993. Managerial incentives and investment in R&D in large multiproduct firms. Organization Science, 4: 325-341.
Jensen, M. C. & Meckling, W. H. 1976. Theory of the firm: Managerial behavior, agency costs and ownership structure. Journal of Financial Economics, 3: 305-360.
Jensen, M. C. & Murphy, K. J. 1990. CEO incentives: It’s not how much you pay, but how. Harvard Business Review, May-June: 138-153.
Jensen, M. C., Murphy, K. J. & Wruck, K. H. 2004. Remuneration: Where we’ve been, how we got here, what are the problems, and how to fix them. Harvard Business School NOM Research Paper No. 04-28.
Jensen, M. C. & Ruback, R. S. 1983. The market for corporate control: The scientific evidence. Journal of Financial Economics, 11: 5-50.
Johnston, J, DiNardo, J. 1997. Econometric methods, 4th Ed., McGraw Hill: New York.
Kato, H. K., Lemmon, M., Luo, M. & Schallheim, J. 2005. An empirical examination of the costs and benefits of executive stock options: Evidence from Japan. Journal ofFinancial Economics, 78: 453-461.
Knight, F. H. 1921. Risk, uncertainty, and profit. Boston, MA: Houghton Mifflin Company.
Lambert, R., Lanen, W. N. & Larcker, D. F. 1989. Executive Stock Option Plans and Corporate Dividend Policy. Journal of Financial & Quantitative Analysis, 24:409-425.
Larcker, D. F. 1983. The association between performance plan adoption and corporate capital investment. Journal of Accounting and Economics, 5: 3-30.
Lavelle, L. 2005. Time to start weighing the options. Business Week, 1/17/2005:32-33.
Lavie, D. & Rosenkopf, L. 2006.. Balancing exploration and exploitation in alliance formation. Academy of Management Journal, 49: 797-818.

43
Lee, P. M. & O’Neill, H. M., 2003. Ownership structures and R&D investments of U.S. and Japanese Firms: Agency and stewardship perspectives. Academy of Management Journal, 46:212-225.
Liang, K. Y. & Zeger, S. L. 1986. Longitudinal data analysis using generalized linear models. Biometrika, 73: 13-22.
Lublin, J. S. 2006. Adding it all up. Wall Street Journal, April 10: R1.
Mace, M. L. 1971. Directors: Myth and reality. Boston: Harvard University Press.
March, J. G. & Shapira, Z. 1987. Managerial perspectives on risk and risk taking. Management Science, 33: 1404-1418.
McGeehan, P. 2004. Is C.E.O. pay up or down? Both. The New York Times (East Coast Edition), April 4, 2004 p. 3.
McNamee, M. & Borrus, A. 2005. Option expensing is here to stay. Business Week, June 20 (3938): 44.
Mehran, H. 1995. Executive compensation structure, ownership, and firm performance. Journal of Financial Economics, 38: 163-184.
Milgrom, P. & Roberts, J., 1992. Economics, Organization, & Management. (Englewood Cliffs, NJ: Prentice Hall).
Miller, K. D. & Folta, Timothy B., 2002. Option Value and Entry Timing. Strategic Management Journal, 23:655-665.
Palmer, T. B. & Wiseman, R. M. 1999. Decoupling risk taking from income stream uncertainty: A holistic model of risk. Strategic Management Journal, 20: 1037-1062.
Pollock, T. G., Fischer, H. M., & Wade, J. B. 2002. The role of power and politics in the repricing of executive options. Academy of Management Journal, 45:1172-1182.
Porter, M. E. 1987. From competitive advantage to corporate strategy. Harvard Business Review, May-June: 43-59.
Rajgopal, S. & Shevlin, T. 2002. Empirical evidence on the relation between stock option compensation and risk taking. Journal of Accounting & Economics, 33: 145-171.
Rothschild, M, & Stiglitz, J. E. 1970. Increasing risk I: A definition. Journal of Economic Theory, 2(3): 225-243.
Sanders, W. G. 2001. Behavioral responses of CEOs to stock ownership and stock option pay. Academy of Management Journal, 44: 477-492.
Sanders, W. G. & Carpenter, M. A. 1998. Internationalization and firm governance. Academy of Management Journal, 41: 158-178.
44
Shapira, Z. 1995. Risk taking: A managerial perspective. New York: Russell Sage Foundation.
Sharpe, W. F., 1964. Capital asset prices: A theory of market equilibrium under conditions of risk. Journal of Finance 19: 425-442.
Sitkin, S. G. & Pablo, A. L. 1992. Reconceptualizing the determinants of risk behavior. Academy of Management Review, 17: 9-38.
Sobel, M. E. (1982). Asymptotic intervals for indirect effects in structural equations models. In S. Leinhart (Ed.), Sociological methodology 1982 (pp.290-312). San Francisco: Jossey-Bass.
Tufano, P. 1996. Who manages risk? An empirical examination of risk management practices in the gold mining industry. The Journal of Finance, 51: 1097-1137.
Tversky, A. & Kahneman, D. 1992. Advances in prospect theory: Cumulative representation of uncertainty. Journal of Risk & Uncertainty. 5: 297-323.
Von Neuman, J. & Mogenstern, O. (1947). The Theory of Games and Economic Behaviour. Princeton, NJ: Princeton University Press.
Westphal, J. D., 1998. Board Games: How CEOs Adapt to Increases in Structural Board Independence from Management. Administrative Science Quarterly, 43: 511-538.
Westphal, J. D., 1999. Collaboration in the boardroom: Behavioral and performance consequences of CEO-board ties. Administrative Science Quarterly, 44: 7-24.
Wiseman, R. M. & Gomez-Mejia, L.R. 1998. A behavioral agency model of managerial risk taking. Academy of Management Review, 23: 133-153.
Wright, P., Kroll, M. Krug, M., & Pettus, M. 2007. Influences of top management team incentives on firm risk taking. Strategic Management Journal, 28: 81-89.
Wright, P, Kroll, M, Lado, A, Van Ness, B. 2002. The structure of ownership and corporate acquisition strategies. Strategic Management Journal, 23: 41-55.
Wright, P., Ferris, S. P., Sarin, A. & Awasthi, V. 1996. Impact of corporate insider, blockholder, and institutional equity ownership on firm risk taking. Academy of Management Journal, 39: 441-458.
Yermack, D. 1997. Good timing: CEO stock option awards and company news announcements. Journal of Finance, 52: 449-476.
Zajac, E. J. & Westphal, J. D. 1994. The costs and benefits of managerial incentives and monitoring in large U.S. corporations: When is more not better? Strategic Management Journal, 15:121-142.

45
TABLE 1DESCRIPTIVE STATISTICS AND CORRELATIONS a
Mean S.D. 1 2 3 4 5 6 7 8 9 10 11 12 13 14 151 R&D investment (ln $000,000) 1.56 2.192 Capital investment (ln $000,000) 4.15 2.04 .313 Acquisition investment (ln
$000,000)1.65 2.62 .08 .08
4 Overall investment (ln $000,000) 4.89 2.02 .38 .77 .525 TSR performance extremeness 69.48 136.82 -.02 .05 .02 .046 ROA performance extremeness 3.72 6.56 .12 -.02 -.06 -.03 .057 Stock option pay % (avg t-1 to t-3) .25 .18 .27 .13 .13 .19 .12 .108 Firm size (ln $000,000 sales) 7.44 1.42 .23 .52 .23 .57 -.05 -.19 .149 Diversification (entropy) .75 .76 .42 .37 .07 .33 -.03 .02 .13 .30
10 International scope .43 .57 .52 .28 .09 .30 .01 .09 .23 .19 .5611 Prior performance 18.67 13.83 .15 -.15 .09 -.04 -.01 .05 .15 -.08 -.11 .0012 Stock price volatility .30 .08 .05 -.19 -.13 -.26 .39 .20 .17 -.55 -.13 .08 .1513 Stock price trend .06 .16 -.07 -.05 .04 -.02 .01 -.05 .07 .02 -.02 -.07 .06 .0314 Total other compensation (ln $000) 7.04 .83 .21 .30 .23 .38 -.03 -.07 .11 .62 .26 .21 .04 -.31 .0615 CEO Stock ownership (ln $000) 5.92 2.02 .00 -.04 .05 -.01 .02 .05 .01 .05 -.03 .03 .29 .10 .03 .2216 Control for endogeneity .28 .09 .36 .14 .15 .23 .08 .09 .43 .26 .16 .31 .24 .21 .02 .24 .03
aCorrelations greater than .03 are significant at p<.05.n=3820 (except for variables 5 and 6, for which n=2862)
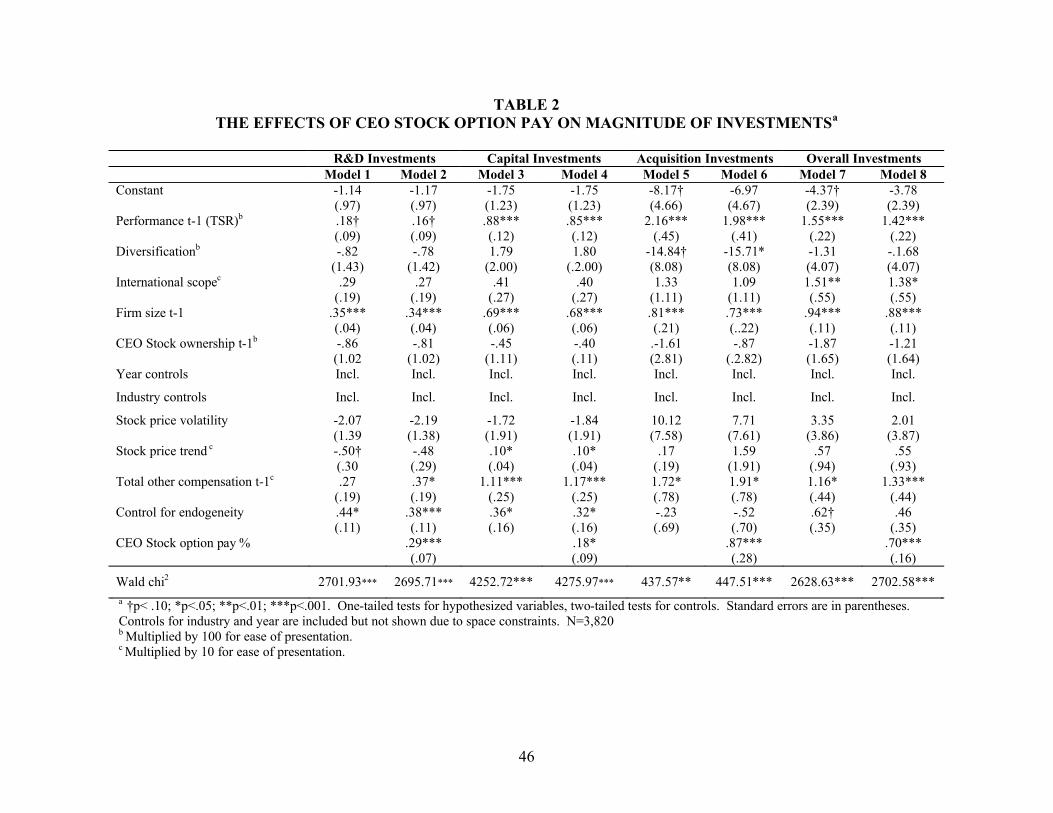
46
TABLE 2THE EFFECTS OF CEO STOCK OPTION PAY ON MAGNITUDE OF INVESTMENTSa
R&D Investments Capital Investments Acquisition Investments Overall InvestmentsModel 1 Model 2 Model 3 Model 4 Model 5 Model 6 Model 7 Model 8
Constant -1.14(.97)
-1.17(.97)
-1.75(1.23)
-1.75(1.23)
-8.17†(4.66)
-6.97(4.67)
-4.37†(2.39)
-3.78(2.39)
Performance t-1 (TSR)b .18†(.09)
.16†(.09)
.88***(.12)
.85***(.12)
2.16***(.45)
1.98***(.41)
1.55***(.22)
1.42***(.22)
Diversificationb -.82(1.43)
-.78(1.42)
1.79(2.00)
1.80(.2.00)
-14.84†(8.08)
-15.71*(8.08)
-1.31(4.07)
-.1.68(4.07)
International scopec .29(.19)
.27(.19)
.41(.27)
.40(.27)
1.33(1.11)
1.09(1.11)
1.51**(.55)
1.38*(.55)
Firm size t-1 .35***(.04)
.34***(.04)
.69***(.06)
.68***(.06)
.81***(.21)
.73***(..22)
.94***(.11)
.88***(.11)
CEO Stock ownership t-1b -.86(1.02
-.81(1.02)
-.45(1.11)
-.40(.11)
.-1.61(2.81)
-.87(.2.82)
-1.87(1.65)
-1.21(1.64)
Year controls Incl. Incl. Incl. Incl. Incl. Incl. Incl. Incl.
Industry controls Incl. Incl. Incl. Incl. Incl. Incl. Incl. Incl.
Stock price volatility -2.07(1.39
-2.19(1.38)
-1.72(1.91)
-1.84(1.91)
10.12(7.58)
7.71(7.61)
3.35(3.86)
2.01(3.87)
Stock price trend c -.50†(.30
-.48(.29)
.10*(.04)
.10*(.04)
.17(.19)
1.59(1.91)
.57(.94)
.55(.93)
Total other compensation t-1c .27(.19)
.37*(.19)
1.11***(.25)
1.17***(.25)
1.72*(.78)
1.91*(.78)
1.16*(.44)
1.33***(.44)
Control for endogeneity .44*(.11)
.38***(.11)
.36*(.16)
.32*(.16)
-.23(.69)
-.52(.70)
.62†(.35)
.46(.35)
CEO Stock option pay % .29***(.07)
.18*(.09)
.87***(.28)
.70***(.16)
Wald chi2 2701.93*** 2695.71*** 4252.72*** 4275.97*** 437.57** 447.51*** 2628.63*** 2702.58***a †p< .10; *p<.05; **p<.01; ***p<.001. One-tailed tests for hypothesized variables, two-tailed tests for controls. Standard errors are in parentheses. Controls for industry and year are included but not shown due to space constraints. N=3,820b Multiplied by 100 for ease of presentation. c Multiplied by 10 for ease of presentation.

47
TABLE 3THE EFFECTS OF CEO STOCK OPTION PAY ON
SUBSEQUENT FIRM PERFORMANCE EXTREMENESSa
TSR Extremeness ROA ExtremenessModel 1 Model 2 Model 3 Model 4 Model 5 Model 6 Model 7 Model 8
Constant 40.11†(23.44)
31.63(23.45)
31.71(23.45)
52.25*(24.59)
6.80***(1.32)
6.41***(1.31)
6.41***(1.31)
6.01***(1.41)
Total other compensation t-1 .06(3.37)
-.90(3.37)
-.87(3.45)
-1.01(3.45)
-.60**(..19)
-.68***(.19)
-.69***(.20)
-.68***(.20)
CEO Stock Ownership 4.32**(1.53)
4.29**(1.52)
4.28**(1.52)
4.02**(1.51)
.20*(..08)
.21**(.08)
.21**(.08)
.21**(.08)
CEO Stock option pay % 67.67***(13.64)
67.78***(13.73)
-10.72(31.70)
3.88***(.81)
3.87***(.82)
5.41**(2.16)
Overall investment -.06(1.23)
-3.99*(1.88)
.004(.08)
.08(.12)
Stock option pay X Overallinvestment
16.02**(5.83)
-.31(.40)
Wald chi2 8.37* 32.83*** 32.83*** 40.43*** 13.35** 36.59*** 36.58*** 37.16***a †p< .10; *p<.05; **p<.01; ***p<.001. One-tailed tests for hypothesized variables, two-tailed tests for controls. Standard errors are in parentheses. N=2,862
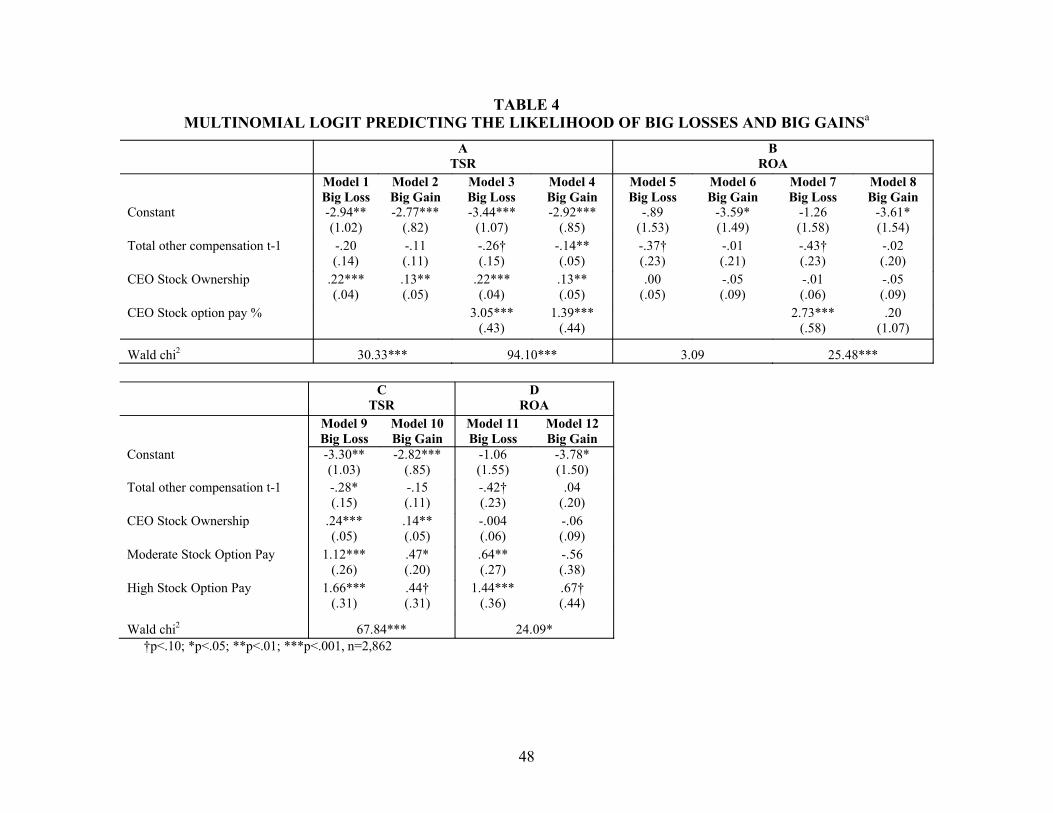
48
TABLE 4MULTINOMIAL LOGIT PREDICTING THE LIKELIHOOD OF BIG LOSSES AND BIG GAINSa
ATSR
BROA
Model 1Big Loss
Model 2Big Gain
Model 3Big Loss
Model 4Big Gain
Model 5Big Loss
Model 6Big Gain
Model 7Big Loss
Model 8Big Gain
Constant -2.94**(1.02)
-2.77***(.82)
-3.44***(1.07)
-2.92***(.85)
-.89(1.53)
-3.59*(1.49)
-1.26(1.58)
-3.61*(1.54)
Total other compensation t-1 -.20(.14)
-.11(.11)
-.26†(.15)
-.14**(.05)
-.37†(.23)
-.01(.21)
-.43†(.23)
-.02(.20)
CEO Stock Ownership .22***(.04)
.13**(.05)
.22***(.04)
.13**(.05)
.00(.05)
-.05(.09)
-.01(.06)
-.05(.09)
CEO Stock option pay % 3.05***(.43)
1.39***(.44)
2.73***(.58)
.20(1.07)
Wald chi2 30.33*** 94.10*** 3.09 25.48***
CTSR
DROA
Model 9Big Loss
Model 10Big Gain
Model 11Big Loss
Model 12Big Gain
Constant -3.30**(1.03)
-2.82***(.85)
-1.06(1.55)
-3.78*(1.50)
Total other compensation t-1 -.28*(.15)
-.15(.11)
-.42†(.23)
.04(.20)
CEO Stock Ownership .24***(.05)
.14**(.05)
-.004(.06)
-.06(.09)
Moderate Stock Option Pay 1.12***(.26)
.47*(.20)
.64**(.27)
-.56(.38)
High Stock Option Pay 1.66***(.31)
.44†(.31)
1.44***(.36)
.67†(.44)
Wald chi2 67.84*** 24.09*†p<.10; *p<.05; **p<.01; ***p<.001, n=2,862

49
TABLE 5THE EFFECTS OF CEO STOCK OPTION PAY ON RISKINESS OF ACQUISITION INVESTMENTSa
Ex Ante Acquisition Characteristics Coefficient for CEO Stock Option Pay
(Standard Errors in Parentheses)
Model Wald chi-squared
Relative aggregate acquisition investment b .64*(.29)
280.74***
Relative number of acquisitions b .05*(.03)
262.85***
Average size of acquisitions b .04**(.02)
163.41***
Average Premiumc 28.15*(17.22)
28.84*
Target ROAd -.03(.09)
15.84
Target ROA volatilitye -7.13(12.45)
13.58
a †p< .10; *p<.05; **p<.01; ***p<.001.b N=3820c N=212d N=205e N=127
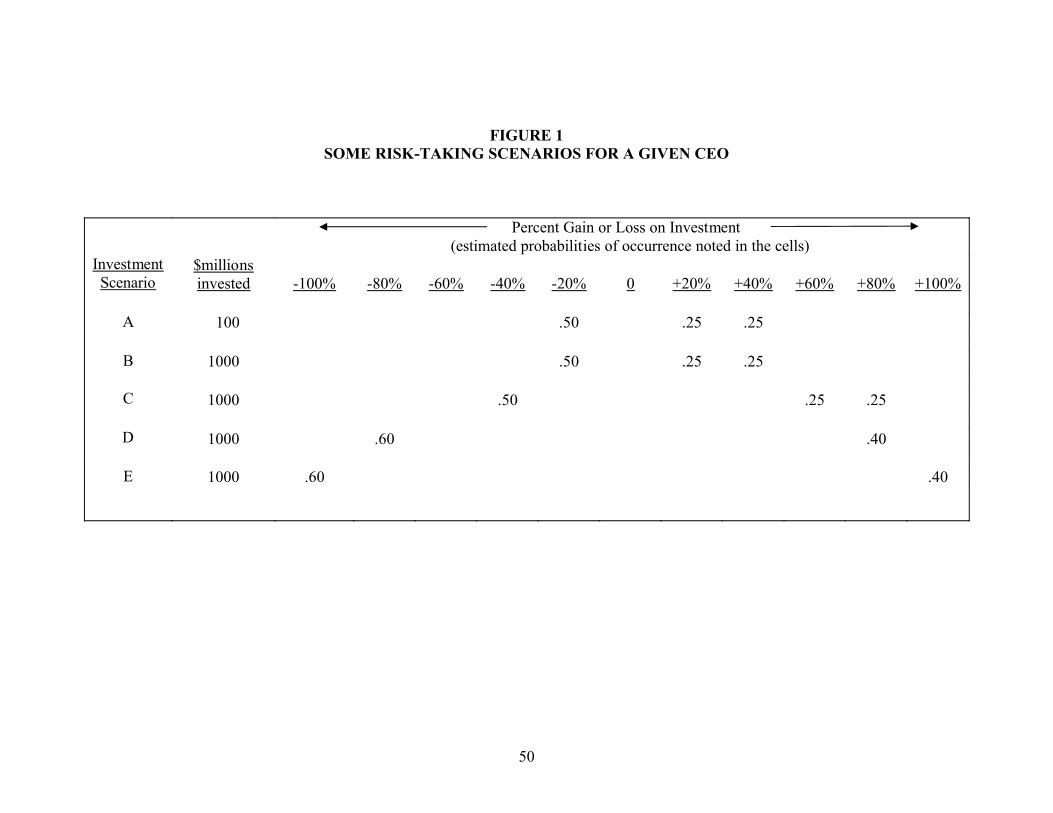
50
FIGURE 1SOME RISK-TAKING SCENARIOS FOR A GIVEN CEO
Percent Gain or Loss on Investment (estimated probabilities of occurrence noted in the cells)
InvestmentScenario
$millionsinvested -100% -80% -60% -40% -20% 0 +20% +40% +60% +80% +100%
A 100 .50 .25 .25
B 1000 .50 .25 .25
C 1000 .50 .25 .25
D 1000 .60 .40
E 1000 .60 .40

51
FIGURE 2DISTRIBUTION OF PERFORMANCE OUTCOMES UNDER DIFFERENT LEVELS OF
CEO STOCK OPTION PAY
Distribution of TSR Outcomes
0
0.05
0.1
0.15
0.2
0.25
0.3
< -1.5 -1.0 to -1.5 -.5 to -1.0 0 to -.5 0 to .5 .5 to 1.0 1.0 to 1.5 >1.5
Standard DeviationsAway From "Expected TSR" (Standard Deviation = 19.5)
% o
f Cas
es
Stock Option Pay Below 20% Stock Options Between 20% and 49% Stock Options 50% and Above
Distribution of ROA Outcomes
0
0.05
0.1
0.15
0.2
0.25
0.3
0.35
0.4
0.45
< -1.5 -1.0 to -1.5 -.5 to -1.0 0 to -.5 0 to .5 .5 to 1.0 1.0 to 1.5 > 1.5
Standard DeviationsAway From "Expected ROA" (Standard Deviation = 7.5)
% o
f Cas
es
Stock Option Pay Below 20% Stock Options Between 20% and 49% Stock Options 50% and Above
52
Wm. Gerard Sanders ([email protected]) is the J. Earl Garrett Fellow and an associate professor at the Marriott School of Management, Brigham Young University. He received his Ph.D. from the University of Texas at Austin. His research focuses on the intersection of corporate governance, executive leadership, and firm strategy.
Donald Hambrick ([email protected]) is the Smeal Chaired Professor of Management, Smeal College of Business Administration, at The Pennsylvania State University. He is also Samuel Bronfman Professor Emeritus of Columbia University’s Graduate School of Business. He holds degrees from the University of Colorado (B.S.), Harvard University (M.B.A.), and The Pennsylvania State University (Ph.D.). His research focuses primarily on the study of top executives and their effects on strategy and performance. An active consultant and executive education instructor, he also served as president of the Academy of Management. .