The excited states of 34Cl
24
Nuciear Physics A411 (1983) 81-104 @ North-Holland Publishing Company THE EXCITED STATES OF 34C1 F. B. WAANDERS, J. P. L. REINECKE, H. N. JACOBS, J. J. A. SMIT, M. A. MEYER and P. M. ENDT’ Physics ~eF~~trnent, Patche~str#m U~i~~sity, South Africa Received 1 August 1983 Abstract: The y-decay of 41 and strengths of 40 %S(p, Y)~~CI resonances were studied for E, < 2.0 MeV. The excitation energies of 37 and the ydecay of 41 bound levels were determined. The Q-value of the reaction was found to be Q = 5142.5kO.2 keV. Spin and parity assignments J” = 2, 2+ and 2- were made to the bound states at E, = 4.14, 4.33 and 4.42 MeV and the spin and parity of six bound levels were restricted to two values. Mean lifetimes of 17 bound levels were measured by means of the DSA technique. The spins and/or parities of eight resonances were unambiguously determined from y-ray angular distributions and strengths. NUCLEAR REACTIONS 33S(p,y), E = 0.4-2.0 MeV; measured b(Er. Er), Q, E,, I,(@), E DSA. 34Cl levets deduced, resonance strengths, y-branchings, 7& J, x. Enriched targets. 1. Introduction Previous to this experiment the only extensive study of the 33S(p, y)34C1 reaction was undertaken by Dassie et al. ‘), who studied the resonances in the energy region E, = W-2.0 MeV. The present experiment was undertaken to study the resonances with E, -c 1.0 MeV. The only available information on the y-decay of these resonances was obtained by Glaudemans et al. 2, with NaI detectors and nothing was known about the spins of these resonances. A number of the resonances in the E, = 1.0-2.0 MeV region was included in the present experiment in order to obtain sufficient information to deduce reliable branching ratios for the bound levels of 34C1. 2. ExperImental details The present experiment was carried out with a 2.5 MV Van de Graaff accelerator. The proton beam was deflected through 90” with an anaiysing magnet ’ Rijksuniversiteit, Utrecht, The Netherlands. 81
-
Upload
independent -
Category
Documents
-
view
1 -
download
0
Transcript of The excited states of 34Cl

Nuciear Physics A411 (1983) 81-104
@ North-Holland Publishing Company
THE EXCITED STATES OF 34C1
F. B. WAANDERS, J. P. L. REINECKE, H. N. JACOBS, J. J. A. SMIT, M. A. MEYER and P. M. ENDT’
Physics ~eF~~trnent, Patche~str#m U~i~~sity, South Africa
Received 1 August 1983
Abstract: The y-decay of 41 and strengths of 40 %S(p, Y)~~CI resonances were studied for E, < 2.0 MeV. The excitation energies of 37 and the ydecay of 41 bound levels were determined. The Q-value of the reaction was found to be Q = 5142.5kO.2 keV. Spin and parity assignments J” = 2, 2+ and 2- were made to the bound states at E, = 4.14, 4.33 and 4.42 MeV and the spin and parity of six bound levels were restricted to two values. Mean lifetimes of 17 bound levels were measured by means of the DSA technique. The spins and/or parities of eight resonances were unambiguously determined from y-ray angular distributions and strengths.
NUCLEAR REACTIONS 33S(p,y), E = 0.4-2.0 MeV; measured b(Er. Er), Q, E,, I,(@), E DSA. 34Cl levets deduced, resonance strengths, y-branchings, 7& J, x. Enriched
targets.
1. Introduction
Previous to this experiment the only extensive study of the 33S(p, y)34C1 reaction was undertaken by Dassie et al. ‘), who studied the resonances in the energy region E, = W-2.0 MeV. The present experiment was undertaken to study the resonances with E, -c 1.0 MeV. The only available information on the y-decay of these resonances was obtained by Glaudemans et al. 2, with NaI detectors and nothing was known about the spins of these resonances. A number of the resonances in the E, = 1.0-2.0 MeV region was included in the present experiment in order to obtain sufficient information to deduce reliable branching ratios for the bound levels of 34C1.
2. ExperImental details
The present experiment was carried out with a 2.5 MV Van de Graaff accelerator. The proton beam was deflected through 90” with an anaiysing magnet
’ Rijksuniversiteit, Utrecht, The Netherlands.
81

82 F. B. Waanders et al. / 34Cl
and the energy spread of the proton beam was 1 keV at 1 MeV. Beam currents varied between 30 PA and 50 PA and the total charge deposited on the targets varied between 0.8 C and 4.0 C depending on the strength of the resonance.
To prepare the targets a thin layer of silver was evaporated on 0.3 mm tantalum backings which were previously cleaned in vacuum by electron bombardment. The thickness of this layer determined the thickness of the targets. Sulphur enriched to 92 “/ in 33S was dissolved in pure ethanol at a temperature of about 75 “C. This so&on was then deposited by means of a micropipet on the silver-coated backings which were at a temperature of 110 “C. At 110 OC the sulphur combines with the silver to form Ag,S. Any uncombined sulphur that remains on the surface of the targets quickly sublimates if the targets are left in vacuum for a few hours. This method enables one to manufacture clean targets of a uniform thickness and excellent quality. The thickness of the targets varied between 1 keV and 15 keV, depending on the type of measurement for which they were needed.
Gamma rays were detected in 80 and 140 cm3 Ge(Li) detectors and ,stored in a 4000 channel analyser. The resolution of the detection system was 2.4 keV at 1.33 MeV and 7 keV at I MeV.
3. Experimental results
3.1. STRENGTHS OF RESONANCES
The relative strengths of 41 resonances were derived from the areas under the resonance peaks of a yield curve for the 33S(p,y)34C1 reaction. This curve was measured with a 10 cm x 10 cm NaI detector placed at an angle of 5S’ with respect to the proton beam and at a distance of 4 cm from the target. Only y-rays with E, > 2.4 MeV were detected. The relative strengths were corrected for the differences in the decay modes of the resonances. These corrections varied between 10% and 50% depending on the decay of the resonance under consideration.
The absolute strengths of the resonances at E, = 10’70, 1544, 1829 and 1974 keV were measured by Dassie et al. ‘). From their absolute strengths obtained by means of the step in the thick-target yield, Dassie et al. ‘) calculated the ratio S(E, = 1070 keV)/S(~~) for the E;, = 1544, 1829 and 1974 keV resonances. They also calculated these ratios from their relative strengths obtained from thin-target yields. There was excellent agreement between the two independent sets of values. In the present experiment the above-mentioned ratios were also calculated from the measured relative strengths and the agreement with Dassie et ~1. ‘) was excellent. The absolute strengths obtained by Dassie et al. ‘) and shown in table 1 were used to convert the present relative strengths to absolute strengths. The results of the present experiment are compared with those of Dassie et al. ‘) in table 1. The agreement is reasonably good except in a few cases where the errors on either one or both of the values from the two sets of measurements are large. The strength of

F. B. Waanders et al. / 34C1 83
TABLE 1
Strengths of 33S(p, Y)~~CI resonances
E, “) (keW present exp. refs. ‘. ‘) b,
E,“) Rev)
s = (2-J + 1 V-J, r (ev)
present exp. ref. ’ )
447 0.4 kO.1 507.6 + 0.2 0.7 kO.2 546 0.7 +0.3 639 0.06 + 0.03 662 0.4 kO.2 683 0.4 f0.2 731.4-10.3 0.5 kO.2 777 0.5 kO.2 822 0.8 +0.2 914 0.4 +0.2 976 1.0 +0.3
1023 0.7 kO.2 1029 1.1 +0.3 1057 1.8 +0.5 1069.7 + 0.2 3.6 +O.S’) 1097 1.4 +0.3 11185~0.3 1.2 kO.3 1158 0.4 +0.2 1165 3.3 +0.7 1215 2.2 kO.9
0.8 1.6 0.4 0.11 0.34 0.5 0.5 0.5 1.2 0.5 1.3
0.6 _+ 0.2 0.9 + 0.5 1.5 *0.7 3.6kO.5 2.2* 1.0 0.9 kO.3 0.2kO.l 2.7* 1.0 1.9+0.7
1264.4 + 0.2 2.7 +0.6 1347.3 kO.2 0.9 kO.3 1386 0.6kO.3 1448 1.4kO.4 1477 0.7io.3 1528 0.4+0.1 1543.6kO.2 3.8 50.6 ‘) 1629.4k0.3 1.0&0.4 1644 0.7 +0.3 1698 0.2kO.l 1706 4.8 + 1 .O 1738 0.4kO.l 1762 2.1kO.5 1752 4.7 * 2.0 1780.7*0.3 0.4 * 0.2 1798.1 kO.3 2.9kl.O 1812.3k0.3 2.4 + 0.6 1829 11 +2’) 1843 0.8 +0.3 1974.4kO.3 8 k2’) 1997 1.7kO.4
2.5 +0.8 0.9kO.3 0.8 +0.3 1.6iO.5 0.6 f 0.2 0.2+0.1 3.8 kO.6 0.9 + 0.4 0.5 +0.2 0.6kO.3 4.0 + 2.5 0.6kO.3 2.3 +0.7 1.8* 1.0 1.6kO.8 2.0 + 0.6 2.8 kO.9
11 *2 0.8 +0.5 8 +2 4.4 f 2.0
“) E, without errors from ref. ‘) and with errors as obtained in the present experiment; see subsect. 3.3. ‘) Strengths for E, < 1.0 MeV were taken from ret j) and strengths for E, > 1.0 MeV were taken
from ref. I). ‘) The absolute strengths listed for the E, = 1070 and 1544 keV resonances t ) were used for calibration
purposes for E, < 1700 keV and for E, > 1700 keV the absolute strengths of the E, = 1829 and 1974 keV resonances ‘) were used in addition to the above-mentioned two resonances.
the E, = 1752 keV resonance is an exception. The present value is a factor 2.6
larger than the result from ref. ‘). A new, clean and thin target was used for the
measurement of this -strength and the resonance was nearly totally resolved from
the E, = 1749 keV resonance of the ’ %(p, ?;) reaction. In the 55’ spectrum no lines
were found which could account for a large scale falsification of the strength of the
E, = 1752 keV resonance.
3.2. GAMMA DECAY OF RESONANCES
The only groups that used large Ge(Li) detectors in their study of the
33S(p, y)34C1 reaction were Dassie et al. ‘), Hyder and Harris 5, and Graber and
Harris6) who worked in the energy region E, = 1.0-2.0 MeV. In the present
experiment the y-decay of 41 resonances was studied in the energy region

84 F. 3. Waanders et al. I 34CI
E, = 0.4-2.0 MeV. The y-ray spectra were recorded and analysed as in previous experiments ‘). A level was only accepted in the decay scheme of a resonance if both the primary transition to the level and at least the strongest decay of the level was observed in the spectrum. A typical spectrum is shown in fig. 1.
The y-ray branchings of the resonances studied are shown in table 2. The values shown were corrected for possible contributions from stronger and/or broader resonances in the neighbourhood and for contributions from direct proton capture. The agreement between the results obtained by Dassie et al. ‘) and the present experiment is excellent although additional weak transitions were observed at most of the resonances. Two notable exceptions are the E, = 1158 and 1528 keV resonances. In the spectrum recorded at the weak E, = 1158 keV resonance the peak from the r -+ 0.15 MeV transition was obscured by the E, = 6.13 MeV y-ray from the r9F(p, rxy)i60 reaction. The 31% branch from the resonance state to the E, = 0.15 MeV level was deduced from the total intensity of ihe secondary feedings of the E;, = 0.15 MeV level and the intensities of the E, = 2.13 MeV and 3.30 MeV y-rays which both result from the 34mC1 P-decay. At the weak E, = 1528 keV resonance 14 primaries were observed in the present experiment whilst Dassie et al. ‘) listed only five. On the ground of Weisskopf estimates of the strengths of primary y-ray transitions, Dassie et al. ‘) assigned J” = (2-, 3) to this resonance. In the present experiment a 3.6% transition from the resonance state to the E, = 3.63 MeV, J” = 5- level has been observed. Dassie et al. i) did not indicate that this transition was present in their spectrum. The strengths of possible M2, E3 and M3 character for the Y + 3.43 MeV transition exceed Endt and Van der Leun’s RUL values 12) by a factor of at least 25 and therefore exclude Jn(E, = 1528 keV) = (2-, 3+). The M2 strength of the r + 0.46 MeV, J” = 1+ transition is 5.3 + 1.4 W.U. and this implies that J”(E, = 1528 keV) = 3- is highly improbable. All the other transitions observed in the present experiment are however compatible with J”(E, = 1528 keV) = (2-, 3). The presence of the r -+ 3.62 + 2.38 MeV peaks in the present spectrum of this resonance cannot be argued away. The only possible explanation is that there exists a doublet at E, = 1528 keV. The members of this doublet must be very closely spaced, because a careful examination of the shape of the resonance peak at E, = 1528 keV showed no sign of a possible doublet.
3.3. EXCITATION ENERGIES OF BOUND LEVELS AND REACTION Q-VALUE
The Q-value of the reaction and the excitation energies of 37 bound levels were determined from 90° spectra. These spectra were recorded with a y-ray spectrometer which consisted of a 140 cm3 Canberra Ge(Li) detector, a model 2020 spectroscopic amplifier and a series 80 multichannel analyser, both from Canberra. The excellent linearity of this system made very accurate y-ray energy measurements possible.

F. B. Wuunders et al. / %2
x.. w .I --
9H3-68’1.-
EZ’L-tgz d ,EW-1 i
so-z-OSF.-=y
. . co-CZ’l m,, ‘T
; -<*
EZ’L- 91’2~~7
6B’,--1 -.._$t:’
czl--Bc&. Bs’z-1. - .-i .-.-._
tg.z-, .-$
,QL’Z’-1 -=Xx_+: ‘:
Z&q_,.-??’
: ‘_

86 F. 8. Waanders et al. / 34CI
TABLE 2
Gamma decay of 33S(p, y)WI resonances
Resonances Gamma decay to E, (MeV) in ?I in percentages Other levels
&I”) Exb) J”‘c) ’
0 0.15 0.46 0.67 1.23 1.89 2.16 Ex(%) (keV) (keV) 0+;1 3+ 1+ 1+ 2+ 2+ 2+;1
447 5576 3;l’)
508 5635 (L2+)
546 5672 (l,2+)
639 5763 (1,2+) 662 5785 (l+-3-)
683 5805 2-
731 5852 (2,3)-
777 5896 2
822 5940 2+
914 6029 (l,2)+ 976 6090 (1,2+)
1023
1029
1057
1070
1097
1119
1158 6266 (1+-3+)d);(0) <l.l 31 il.0 13 3.7 1165 6272 3d); 1 <O.l 5.0 to.1 to.1
<O.l 26 <0.6 <0.3 4.2
69 10.3 2.0 11 0.4
74 10.3 <0.4 6.1
24 8.4 1.6 11.3 <0.3 50 <0.6 <0.3 3.0
1.9 20 31 18 4.1
<0.2 50 10.5 <0.5 14
1.7 29 34 11 14
0.7 4.8 15 0.7
90 5.8 <OX <0.5 <0.5 90 < 0.3 2.4 <l.O <0.6
6136 (1+-3+);(l)‘) 9.9 <0.3 58 20
6141 (1,2+) 86 <0.3 <O.l <0.2
6168 3-;l <0.3 28 to.3 10.2 3.1
6180 (l+,2) 0.8 10 4.5 42 9.5
6206 . 4’-‘. l <O.l 0.8 <O.l <O.l
6228 1-;l 2.3 <0.2 2.1 to.2
2.0 2.38(0.4), 2.61(0.3), 2.72(8.9), 3.55(42), 3.60(16), 4.14(0.2)
1.3 2.58(10), 2.72(0.5), 3.13(2X), 3.77(0.7), 3.79(1.7), 4.42(0.3), 4.64(0.3)
1.3 7.4 2.58(4.9). 3.13(2.1), 3.77(0.4), 3.79(1.4). 3.94(1.5), 4.35(0.6), 4.42(0.3)
0.7 54 3.13(0.8), 3.38(9.3), 3.94(1.2) 0.8 16 2.18(1.5), 2.61(1.4), 2.72(0.3),
3.33(0.6), 3.38(26), 3.77(0.4) 0.4 2.58(18), 2.38(1.2), 3.55(0.4),
3.60(0.5), 3.98(0.6), 4.15(1.0), 4.61(2.9)
3.1 4.2 2.18(1.2), 2.61(0.3), 2.72(3.8), 3.38(1.8). 3.55(6.6), 3.60(4.2), 3.77(0.2), 3.98(1.4), 4.15(9.2)
3.7 2.58(0.8), 2.72(1.7), 3.33(0.3), 3.38(0.4), 3.55(1.7), 4.61(1.7)
0.8 71 2.38(0.4), 2.58(1.1), 2.61(0.4), 3.38(4.5), 4.70(0.6)
<0.6 <0.3 3.38(4.2) 2.3 <0.3 2.58(0.3), 2.72(4.2), 3.77(0.5),
13.80(0.3) 6.3 2.18(1.0), 2.58(0.7), 2.61(2.2),
2.72(1.1), 3.38(0.8) 0.5 2.58(1.2), 2.72(5.7), 3.77(2.2),
3.79(0.5), 4.35(1.5), 4.42(1.3), 4.52(1.1)
2.1 0.7 2.18(4.8), 2.61(2.9), 2.72(8.2), 3.55(4X), 3.60(7.6), 3.98(33), 4.08(4.8)
4.1 4.3 2.18(0.6), 2.58(8.0), 2.61(3.6), 2.72(0.4), 3.13(0.3), 3.33(2.3), 3.38(3.1), 3.96(1.3), 4.33(5.2)
0.2 2.18(2.7), 2.38(2.1), 3.55(23), 3.60(47), 3.63(8.7), 3.98(6.0), 4.08(8.6), 4.82(0.9)
3.9 2.72(41), 3.13(1.0), 3.77(18), 4.14(5.0), 4.33(0.9), 4.35(9.6), 4.42(2.6), 4.52(12), 4.64(1.6)
4.7 43 2.18(2.5), 2.72(2.1) 6.4 0.9 2.18(14), 2.38(65), 2.61(6.7),
3.33(0.5), 3.96(0.9), 4.08(0.4), 4.45tO.21
F. B. Waanders et al. / 34CI 87
TABLE 2 (continued)
Resonances Gamma decay to E, (MeV) in %Zl in percentages Other levels
Ep”) Exb) J”‘c) T
0 0.15 0.46 0.67 1.23 1.89 2.16 Ex( “<I) (keV) (keV) 0+;1 3+ 1+ 1+ 2+ 2+ _ , 7+.,
1215 6322 2d) <0.3 49 8.0 20
1264 6369 2+ 14 14 7.2 33
1347 6450 (3_,4) <0.8 48 <0.4 <0.5
1386 6488 Id);(O) 21 <0.5 7.9 1.2
1448 6547 3+, (2)d) <0.4 84 <0.4 <0.3 1477 6576 (2+4+)d);(0) <0.6 5.2 <0.6 1528 ‘) 6626 12 13 10.5
1544 6640 4-;l <0.4 26 <0.2 <0.3
1629 6724 (3.4)+ d) <0.2 16 <0.5 <0.3
1644 6738 (1+-3+);(O) ~0.6 30 11 15
1698 6790 (1,Zf) 100 <6.0 <4.0 ~3.0
1706 6798 (2+-4+) <0.4 92 <0.3 <0.2 1738 6829 (2,3+)d);(0) co.7 14 17 6.1
1752 6842 2;l <0.3 2.0 16 7.1
1762 6852 (1,2)+ d, 4.5 4.0 39 7.0
1781 6871 5-;l <0.6 <0.6 <0.7 <0.6
1798 6887 2+ ;o <0.4 6.7 <0.3 10.3
1812 6901 (1,2)+ d);O 7.4 2.1 0.9 <0.2 1829 6917 4d);l 10.4 62 <0.2 <O.l
1.7 0.7 2.18(0.8), 2.58(8.5), 2.61(0.3). 2.72(5.1). 3.55(4.1). 4.35(1.0), 4.606(0.8)
3.0 1.0 2.2 2.18(2.4), 2.58(7.0), 2.61(0.7), 2.72(6.0), 3.13(0.5), 3.33(0.7), 3.38(0.7), 3.55(2.2), 3.96(0.5), 3.98(0.5), 4.35(2.0), 4.52(1.3), 4.64(1.1)
<0.2 2.18(1.2), 2.61(12). 3.33(0.5), 3.55(4.2). 3.60(18), 3.63(4.2), 4.08(1.3), 4.45(3.4), 4.46(3.3), 4.606(3.9)
59 3.13(0.9), 3.94(10) 9.3 2.58(4.6), 3.38(0.8), 5.17(1.3)
93 2.38( 1.8) 2.7 10 2.18(9.0). 2.61(3.0), 3.33(6.8),
3.55(6.8). 3.60( 13). 3.63(3.6), 4.08(9.7). 4.14(2.4), 4.72(4.1), 5.39(3.9) 2.18(0.6), 2.38(5.0), 2.61(3.8), 3.55(16), 3.60(2.8). 3.98(1.8). 4.08(44)
1.9 2.18(1.4), 2.38(23). 2.61(18), 3.38(0.4), 3.65(8.2). 3.96(1.2). 4.70(4.9), 4.82(25)
4.3 1.3 36 3.13(2.4) < 3.0
3.6 0.4 2.38(1.0), 2.61(2.0), 3.96( 1.0) < 0.6 52 3.38(7.1), 3.55(3.8) 12 6.0 4.7 2.18(1.1), 2.58(7.3), 2.61(2.5),
3.13(1.5). 3.33(1.8), 3.38(2.9). 3.77(1.0), 3.98(8.7). 4.14(2.5), 4.15(5.5), 4.35(7.9), 4.52(5.6), 4.606(2.8), 4.61(1.1)
13 22 2.58(3.5), 3.13(3.2), 3.55(2.0), 4.70(0.9), S.OO(O.9)
~0.4 2.38(6.5), 3.63(46), 4.08(2.6), 4.45(28), 5.17(11). 5.39(1.3), 5.54(4.6)
1.4 82 2.18(2.9), 3.38(1.4), 4.606(1.1), 4.72(3.5), 4.96(1.0)
0.6 74 3.38(15) 2.18(5.0). 2.38(25), 2.61(2.4), 3.33(1.4), 3.55(0.5). 3.63(2.2), 3.65( 1.2). 5.54(0.3)
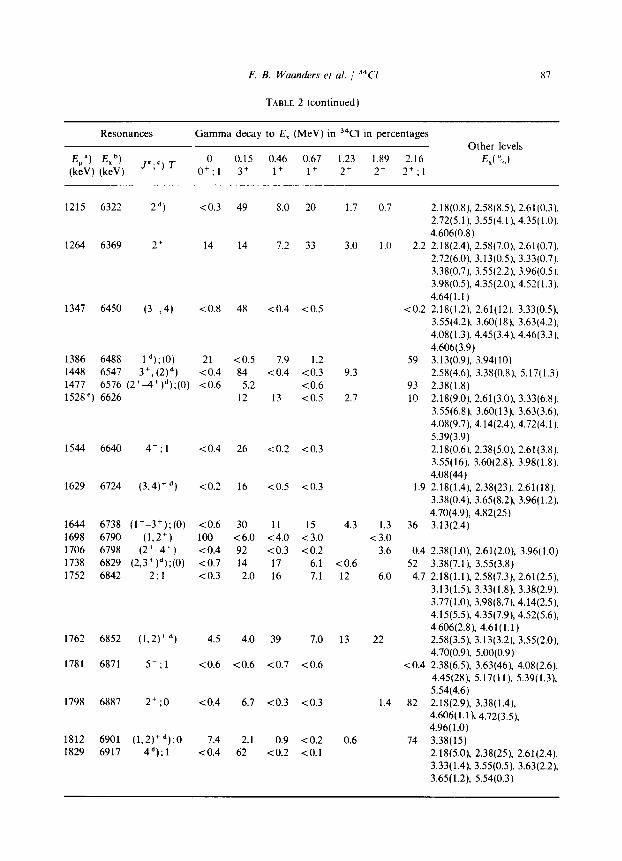
88 F. B. Waanders et al. / “Cl
TABLE 2 (continued)
Resonances Gamma decay to E, (MeV) in 34C1 in percentages Other levels
&“) Kb) ““) ’
0 0.15 0.46 0.67 1.23 1.89 2.16 E,( %) (keV) (keV) 0+;1 3+ 1+ 1+ 2+ 2+ 2+;1
1843 6931 (2-,3+) <1.5 11 <2.0 10 4.2 2.58(4.2), 2.72(2.8). 3.38(12), 3.55(4.5), 3.60(1.0), 3.98(3.3), 4.35(2.0), 4.46(2.0), 4.52(1.8), 4.606(14),4.610(22),4.72(5.2)
1974 7058 (1+,2)d); 1 <0.2 0.5 58 23 3.3 4.1 0.5 2.18(0.8), 2.58(0.8), 2.61(0.7), 2.72(0.7), 3.13(3.1), 3.66(0.8),
3.77(0.1),4.33(0.4),4.61(0.5), 4.70(0.2). 4.94(1.2), 5.00(1.3)
1997 7080 33;l <0.8 9.0 <0.6 <0.6 27 2.4 2.18(2.3), 2.72(11), 3.55(15), 3.60(15), 3.98(16), 4.33(0.6), 4.61(1.7)
“) From ref.3). “) Calculated from Q = 5142.5 +0.2 keV and E, from table 1. ‘) For E, < 1.0 MeV from the present experiment (see table 6). For E, > 1.0 MeV from ret3) unless otherwise indicated.
d, Present experiment. See subsect. 4.2. ‘) A possible doublet. See subsect. 3.2. r) See subsect. 4.3.
In order to determine the Q-value of the 33S(p. Y)~~C~ reaction and certain
excitation energies of bound levels of 34Cl it was necessary to measure a few
proton energies accurately. For this purpose a 10 cm x 10 cm NaI detector was
placed at a distance of 5 cm from a thin target and at 55” with respect to the
proton beam. A relativistic correction was applied to the proton energies which
were calculated from the measured NMR frequencies using the relation E, = kf’ where f is the frequency. The calibration constant k was determined by using the
E, values from ref. 3, for nearby 27Al(p y)28Si resonances. The results are shown in , table 1.
The Q-value of the reaction was determined from measurements at four
resonances. The energies is) of y-rays from the radioactive sources 22Na, 6oCo, **Y
and *‘sTh were used as calibration energies for the 90” spectra. This yielded
accurate energies for the Y --* 4.33 + 2.16 MeV and I + 2.61 -P 0 MeV cascades at
the E, = 1069.7kO.2 keV resonance, the r + 2.72 + 0 MeV cascade at the
E, = 1118.5 f0.3 keV and E, = 1264.4kO.2 keV resonances and the
r + 3.60 + 2.38 MeV cascade at the E, = 1347.3k0.2 keV resonance. All the 90”
spectra were recorded twice and yielded ten values for Q from which the mean
value Q = 5142.5 f0.2 keV was obtained. The difference between this result and
the result Q = 5140.3 f 1.5 keV obtained by Dassie et al. ‘) is mainly due to the
fact that the E, values used in the present experiment are on the average 1.5 keV
smaller than those measured by Dassie et al. ‘).

F. B. Waanders et al. / 34CI 89
For the determination of the excitation energies of bound levels two calibration
procedures were followed. For y-rays with E, < 2.6 MeV only y-rays from the
above-mentioned radioactive sources and the decay y-rays from the E, = 0.46 and
0.67 MeV energy levels of 34C1 were used in the energy calibrations. For
determining the energies of y-rays with E, > 2.6 MeV primary transitions to some
of the first ten excited states and the E, = 6129.27kO.05 keV y-ray from the
19F(p, cry) reaction were used as additional calibration points. Corrections for recoil
losses were applied in order to determine the excitation energies of the bound
levels. With the exception of six cases the excitation energy of a bound level was
obtained from at least two different transitions and every measurement was
repeated. In more than two thirds of the cases the excitation energies shown in
table 3 are the averages of at least six consistent values. The agreement between
the present results and those from the compilation of Endt and Van der Leun 3, is
generally good. One notable exception is the E, = 3983.5kO.2 keV level. The
present value was obtained from three different transitions and at two different
resonances and the results were very consistent. The present set of results is much
more accurate than any previous set of measurements.
TABLE 3
Excitation energies of %I levels
E, (kev) E, (kev)
present experiment ref. 3, present experiment ref. ‘)
1230.33 *0.08 1230.24 k 0.07 3983.5 +0.2 3982.1 0.3 k
1887.31 +0.08 1887.3 +0.3 4076.3 kO.2 4075.7 +0.7
2157.9OkO.08 2158.2 kO.2 4139.8 +0.2 4137.5+ 1.7 2181.10&0.08 2181.0 +0.4 4147.8 50.2 4146 k3
2375.7 +0.2 2376.1 kO.4 4325.91 kO.15 4325.6k0.5 2580.4 kO.2 2580.0 kO.5 4354.3 kO.2 4352.8 +0.7
2611.05*0.11 2610.7 kO.5 4417.4 +0.2 4416.4kO.5
2721.1 +0.2 2721.7 f0.3 4446.6 kO.2 4444.7& 1.5 3129.13f0.12 3128.9 kO.5 4461.4 +0.3 4462.2 f 1.5 3334.0 kO.2 3333.9 * 1.0 4515.8 +0.2 4515.0+0.4
3383.3 kO.2 3383.6 kO.6 4638.9 kO.4 4638.3 f 1.5 3545.07*0.15 3545.3 +0.5 4695.7 f 0.2 (4695 f2)
3600.27~0.11 3600.6 +0.4 4717.4 kO.6 4717.5* 1.0 3631.8 +0.3 3631.4 kO.7 4824.5 +0.2 4823.4 1.0 +
3646.3 kO.2 3645.6 f 1.5 4941.9 kO.4 4941.4* 1.5 3660.0 kO.3 (3659.4 f 1.5) 4957.3 + 1.1 4959 *2
3773.84kO.15 3772.0 f 1.9 4995.6 +0.3 4993 *2 3791.7 kO.2 “) 5171.6 +0.3 5170 *2 3940.1 kO.3 3941.2 * 1.5 5386.8 f 1.5 (5383 f2) 3964.1 kO.3 3964.2 k 1.5 5540.8 + 1.1 5540 *2
“) This level has not been observed in previous experiments.

90 F. B. Waanders et al. / “Cl
3.4. GAMMA DECAY OF BOUND LEVELS
The y-decay of 41 bound levels was deduced from the 41 resonances studied. The results shown in table 4 are in good agreement with the measurements from Dassie et af. ‘) which Endt and Van der Leun took up unaltered in their compilation 3). The errors on two-thirds of the present values are however on the average more than a factor two smalfer than those of Dassie et al. ‘f.
The present values for the branching ratios of the E, = 3.33 MeV level differ from those given by Dassie et al. ‘). The peak resulting from the 3.33 + 2.16 MeV transition will always be contaminated by the E, = 1176 keV y-ray which results from the 34mCl b-decay. It seems likely that Dassie et al. ‘) were unaware of this contamination and therefore obtained too large an intensity for the 3.33 -+ 2.16 MeV transition. The bound levels at E, = 3.66, 4.70 and the unbound level at E, = 5.39 MeV observed by Dassie et al. ‘) are shown in brackets in their paper. These levels were also observed in the present experiment and the excitation energies and y-decays are in full agreement with the measurements of Dassie et al. ‘1. The previously unknown E, = 3.79 MeV level was observed at three resonances in the E, < 1 MeV region. The two branches observed by Dassie et al. ’ ) for the E;, = 3.94 MeV level, were also observed in the present experiment but the branching ratios have opposite values. A 3.96 -+ 2.38 MeV transition (Er = 1588 keV) was reported by Dassie er al. I). The E, = 3.96 MeV level was only weakly excited at a few resonances both in the present experiment and in that of Dassie et al. ‘). In the present experiment a background y-ray with E, z 1590 keV was detected in all the spectra. No evidence was found that a 3.96 + 2.38 MeV transition was masked by this y-ray and the existence of the transition is considered to be doubtful. The new 4.14 + 1.23 MeV and 4.14 -+ 2.58 MeV transitions were both observed at the E, = 1120 and 1752 keV resonances (see fig. 2). In the present experiment a E, = 4147.8+0.2 keV level was observed at three resonances (see subsect. 4.1). The y-decay of this level is here reported for the first time. The levels at E, = 3.65, 3.77, 4.33, 4.94 and 5.00 MeV were weakly excited in the present experiment and the branching ratios differ from the values given by Dassie et af. ‘). The weak 4.82 + 2.18 MeV and 4.82 + 3.63 MeV transitions observed by Van der Poe1 ef al. 9, were confirmed.
3.5. MEAN LIFETIMES OF BOUND LEVELS
The mean lifetimes of 17 bound levels in 34C1 were determined by means of the DSA method. Thick targets were used and all the levels studied were excited by primary transitions only. The positions of the y-ray peaks were measured at 0” and 130* with respect to the proton beam to determine the Doppler shift attenuation factor F. The relation between F and the mean lifetimes was calculated by using

F. B. Waanders et al. / 34Cl
Ep=508 keV
I I I 1 I I 1.83 1.85 331 333 2.88 2.90 1.54 156
Es(MeV)
Ep=731 keV
. . . 5.8 - 62-
I I I I I 1 4.13 4.15 1.97 1.99
Es (MeV) l.95 l.97
91
Fig. 2. Parts of the y-ray spectra showing a number of the new weak transitions discussed in
subsect. 3.3.
Blaugrund’s analysis IQ). Corrections to the expression used by Blaugrund for the
electronic stopping cross section as observed by Ormrod et al. “) were introduced.
Every F-value shown in table 5 is the average from at least two sets of
measurements. The present results are in agreement with existing data. Notable
exceptions are the present result for the level at E, = 2.61 MeV which is nearly a
factor four smaller than the value obtained by Carola and Sikora l’) and the
present value for the E, = 3.77 MeV level which is a factor two smaller than the
result from ref. 17). The lifetimes of the E, = 4.52, 4.70 and 5.00 MeV levels are
reported here for the first time.

TA
BL
E 4
Gam
ma
deca
y of
bou
nd l
evel
s of
j4C
1
Bou
nd l
evel
in
34C
I D
ecay
in
perc
enta
ges
to E
, (M
eV)“
) O
ther
le
vels
(k
s;
J”;T
b)
O$
0.15
0.
46
0.67
1.
23
1.89
2.
16
2.18
2.
38
2.12
E
, ( %
) 3
3+
1+
1+
2+
2+
2+;1
3+
4+
2-
P
461
If
100
<I
F Es
666
1+
100
<1
<1
h 12
30
2+
<2
30.5
+0.
5 35
.0+
0.5
34.5
&0,
5 2
1887
2’
<
1 42
.6+
0.7
57.4
kO.7
42
r?
21
58
2+;1
15
.6kO
.3
13.2
kO.3
65
.6kO
.4
< 2
5.
650.
2 a ?
2181
3+
<
2 51
.4f1
.3
35.9
rt1.
4 12
.71-
0.7
<2
2376
4+
<
2 99
.2-1
-0.2
~4
<
2 0.
8 *
0.2
2580
1’
10
0 <
2 c2
<
2 <
l g
2611
3+
39
.4t1
.3
<2
15.1
f 1.
1 26
.7-1
1.3
cl 1
21
.8,
I.3
2721
2-
16
.0*0
.5
18.5
&0.
5 46
.9f0
.7
7.1+
0.5
2.1+
0.2
2.O
iO.2
6.
8kO
.5
3129
1+
10
0 <
2 <
2 <
2 33
34
3+,(
2+)‘
) <
3 <
2 22
f5
37
*5
<
2 <
2 41
&
6 33
83
Z+
;l <
1 32
.341
.1
23.4
k1.4
27
.5j;
1.4
16.8
kO.8
35
45
3-
<3
96.6
+0.
6 <
3
3.4k
O.6
36
00
4-
<2
47.7
-to.
5 t2
<
2 7.
5_tO
.9
44.8
kO.5
36
32
(3&
r)
<3
45.5
$0”
7 <
3
<2
<2
54.5
10.
7 36
46
t3
75
f5
<3
<2
(not
obs
erve
d 25
%)
3660
(1
-3)‘
) <
3 <
5 <
2 <
2 <
2 12
10
0 37
14
77
+5
(not
obs
erve
d 23
%)
3792
&
‘)
t6
<7
85
+6
<3
(not
obs
erve
d 15
%)
3940
0+
;1
<3
42
15
58
15
12
3964
(2
,3)+
‘)
40
+15
60
+
15

3984
3-
64
+
2 ri
<
5 40
76
2:;;)
‘)
<2
60.0
5 1.
5 <
2
<3
4140
<
2 51
+
3 t2
<
5 7
+2
4148
(1
,2)+
‘)
5.2k
O.g
<
2 35
.Ort
:l.O
52
.9f.
1.2
4326
i+
‘);O
<
4 <
2 43
54
1-
11
t2
<2
4417
2-
‘)
<5
<4
4447
(A
- <
3 10
0 44
61
4516
(A
)‘)
<4
20
;2
4606
46
10
(2,3
);(l
)‘)
4639
(k
-3)‘
) - 29
;9
46
96
<2
4717
(l
-3)+
;(
l)f)
61
f3
48
25
i:;;!
<
2 62
&
2 49
42
(l&
(l)f
) 70
+
10
4957
<
2 49
+s
49
96
(1,2
)+ ;
(0)
5172
d)
4 X
~338
7~)
(4-6
-)
<3
<3
5541
d)
(4,5
_)
<4
<5
t3
<2
7 12
<
3 64
*3
36
f3
<2
11
+9
<4
<3
<2 43
<4
<3
80
*i?
<5 <3 <3 <2
<6
il
<2
<3 X
X
X
<4
<4
<3
<2
<7
51
t5
<2
<2
27.1
&1.
1 13
.4kO
.8
21.3
+o.
s 23
12
3.
2 kO
.7
3.7
&O
S 80
+
5 22
+
2
X
100
11
&3
18
&3
3 *1
70
f10
8.9
f 0.
7 5.
3+0.
5 2.
58(1
94;3
)
(not
obs
erve
d 20
%)
X
X
2.61
(10+
3)
3,60
(31+
2);
363(
4&l)
2
(not
obs
erve
d 30
%)
4 (n
ot o
bser
ved
30%
) r:
$
3.60
( 100
) 2
3.55
(36+
5);
360(
64&
S)
z 9
“) E
, fr
om t
able
3 a
nd r
ef. 3
).
b, R
ef. ‘
) un
less
oth
erw
ise
indi
cate
d.
‘) T
rans
ition
s sh
own
with
an
x w
ere
obse
rved
bu
tthe
data
w
as j
nsu~
cien
t fo
r th
e ca
lcul
atio
n of
bra
nchi
ng
ratio
s.
d, T
his
is a
n un
boun
d le
vel.
“) R
ef.9
).
‘) P
rese
nt e
x~ri
men
t; se
e su
bsec
t. 4.
1 an
d/or
su
bsec
t. 4.
3.

94 F. 3. Waanaers et al. / ?3
TABLE 5
Mean lifetimes of bound levels in 34C1
Ex Lifetime Lifetime Ref. r ) unless
(MeV) determined W,)“) r, (fs) adopted b, otherwise at E, (keV) (fs) indicated
2.16 1477 0.55+0.04 1629 0.47 f 0.04
2.18 1165 0.05 + 0.02 1264 0.06 + 0.02
2.38 1165 0.17&0.03 1629 0.18+0.03
2.58 1448 1.00~0.03 2.61 1070 0.17*0.03
1165 0.12+0.03 3.13 1974 0.89 +0.03 3.38 1812 0.89 +0.03 3.55 1997 0.26 + 0.03 3.77 1119 0.42 f 0.03 3.98 1057 0.19 +0.03 4.14 1119 0.24 f 0.03 4.35 1070 0.90+0.03 4.45 1781 0.20 + 0.03 4.52 1119 0.74 + 0.03 4.70 1629 0.90 * 0.03 4.82 1629 0.08 iO.03 5.00 1974 1.05+0.05
40* 7 57& 10
700 + 200 560 1.200 200& 40 200+ 40
<5 1705 50 270& 60
< 10 < 10
140+ 25 55+ 8
165+_ 35 1202 20
< 10 1801 3.5 151 5 < 10
480_+200 <.5
46_+ 10
630f 190
2OOi 50
<5 210+ 60
c 10 c 10
140* 45 55* 15
165+ 60 120+ 40
< 10 180+ 60 15* 7 < 10
480 f 220 <5
364 15
6OOk3SO
2lO;t 80
3.Ok2.5 8201350’)
40* 12”) <3
140* 40”) 115Ifr 30”) 160+_ 60 150+ SOC) 65_+ 20”)
160& 60
450120@)
“) Corrected for solid angle of the detector. b, The error was obtained by adding (in quadrature) 15 y0 of the lifetime to the statistical error. ‘) Ref. I’). d, Ref. ‘).
3.6. ANGULAR DISTRIBUTIONS
Angular distributions were measured at a number of resonances with a 140 cm3 Ge(Li) detector at a distance of 10 cm from the target. Spectra were measured at O*, 30°, 60° and 90” with respect to the beam and stored in separate quadrants of a 4000 channel analyser. A 0” + 90° + O” sequence was maintained and checks were made on the eccentricity of the turntable and isotropy of the y-ray attenuation through the backing and water mantle of the cooling system.
The angular distribution coehicients, A, and Ah, were obtained from a least- squares fit of the data to the expression N(0) = B(1 +A,P, +A,P,). The results are shown in table 6. Corrections for attenuations due to the finite size of the counter have been applied. The number of pulses observed at each angle was used as input data for a computer program which calculated the quantity

F. B. Waanders et 01. 1 34CI 95
TABLE 6
Angular distribution coefficients and allowed J-values
EP (kev)
Transition A, &AA,“) J-values J” allowed adopted b,
508
822 976
1023
1029
1057
1069
1165
1215
1347
1386 1544
1706 1829
1974
r-+0 0.27 kO.03 0.05 + 0.04 r + 2.58 -0.13&0.06 0.05 f 0.07 r + 2.16 0.05 & 0.02 - 0.05 * 0.03 r-0 0.53 * 0.07 - 0.00 k 0.08 r + 0.67 0.28 + 0.05 - 0.0 1 & 0.06 r + 1.23 - 0.32 + 0.04 0.02 * 0.05 r-0 -0.14+0.03 0.08 + 0.03 r + 0.15 0.27 f 0.04 - 0.03 + 0.05 r + 3.98 0.25 kO.06 0.07 + 0.07 r + 0.67 0.00 k 0.03 0.07 + 0.04 r + 1.23 - 0.07 + 0.04 - 0.05 * 0.05 r--t 2.18 0.18 kO.04 - 0.05 * 0.05 r + 2.38 0.00 f 0.02 - 0.04 * 0.02 r + 1.89 0.00 f 0.07 0.05 * 0.09
r-+0.15 - 0.04 f 0.03 0.01 kO.03 r + 2.58 - 0.23 f 0.05 - 0.07 f 0.06 r + 0.15 0.03 * 0.07 - 0.06 k 0.09 r + 3.60 0.46+0.10 -0.18&-0.12 r + 2.16 0.15+0.07 0.07 f 0.08 r * 0.15 -0.27 +0.07 -0.04+0.09 r + 3.55 -0.27&0.09 0.00+0.11 r + 4.08 0.44 & 0.05 0.01 + 0.06 r -+ 0.15 0.16&0.05 -0.04&0.07 r + 0.15 0.06 & 0.02 - 0.04 f 0.02 r -+ 2.38 0.50 f 0.04 0.04 f 0.05 r + 0.46 0.04 f 0.02 - 0.03 * 0.03 r -+ 0.67 0.03 k 0.06 -0.13*0.07
1. 2
l-3 1, 2 l-3
1. 2 225
1. 2
2. 3
1. 2
3, 4
14
3,4
l-5
3. 4
I,2
c1,2+1
2+
(1.2+) (1+-3+)
(1,2+) 3-
(1+.2)
3
(33.4)
1 4-
(2’4’) 4
(1+,2)
“) Corrected for the finite size of the detector. ‘) See tables 2 and 7 and subsect. 4.2.
where B is a normalization constant and N,(ei) is given by
N,(ei) = 1 + Q~A~P~(cos ei)+ QbA,*P,(COS ei).
The quantities Qz and Q4 are attenuation factors which correct for the finite size of
the detector and AT and AZ are the theoretical coefficients which are functions of
the spins, population parameters and mixing ratios. Additional terms were added to
the above expression for Q’ when more than one angular distribution had been
measured. The parameters in A: and AZ were varied in a systematic manner in order to find the minima of Q2. A spin was considered unacceptable if the
corresponding minimum of Q2 was larger than the 0.1% limit. In table 6 the
allowed spin values are shown.

96 F. B. Waanders et al. / 34CI
4. Discussion
The possible spins and parities of bound and resonance levels were restricted on
the basis of the strengths of y-ray transitions. Spins and/or parities were rejected if
they gave rise to transition strenghts which exceeded the following recommended
upper limits (RUL) r2) :
Elts: 3 mW.u., Ml,, : 0.03 W.U.,
E2,,: 100 W.U., E2,,: 10 W.U.,
M2: 3 W.U., E3: 100 W.U., M3: 10 W.U.
In all cases except one, spin and/or parity assignments to resonance states, other
than those adopted, gave rise to transition strengths which were at least twice the
relevant RUL.
4.1. SPINS AND PARITIES OF BOUND LEVELS
In addition to the above-mentioned criteria it was assumed that the higher
situated bound levels only decay through El, Ml and E2,, transitions. This
criterion was also used by Endt and Van der Leun in their 1979 compilation 3).
The spin and parity assignments (see table 4) to the E, = 3.66, 3.79 and 4.15 MeV
levels, are based only on the decay of these levels. The assignments to the
E, = 3.33, 3.96, 4.14, 4.33, 4.42, 4.606, 4.610 and 4.70 MeV levels follow from the
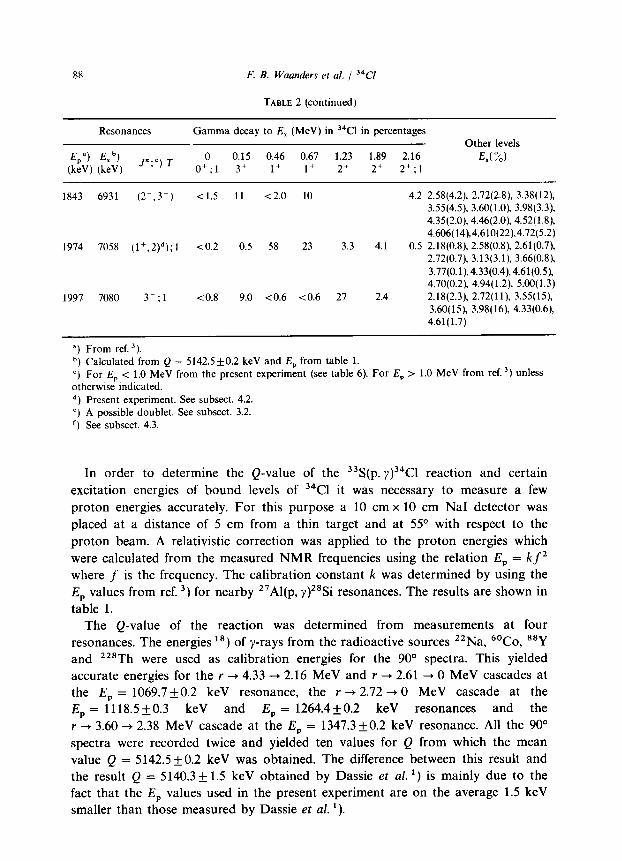
arguments presented in table 7. A number of cases need further discussion.
The E, = 3.65 Mel/ level. The feeding and decay of this level led to J”(E, = 3.65
MeV) = (225+) (see table 7). The J = 2 possibility was rejected because the
isovector E2 strength in table 7 shows that J(E, = 3.65 MeV) = 2 would make the
I + 3.65 MeV transition at the E, = 1829 keV resonance the strongest known
isovector E2 transition 12).
The E, = 4.14 and 4.15 Mel/ levels. In the present experiment, two distinctly
different levels at E, = 4140 keV and E, = 4148 keV, respectively, were observed
(see table 3). The existence of the E, = 4140 keV level was previously well
established in (p, y) experiments ‘* ‘). In their (r,d) experiment, Erskine et al. 13) observed a level with excitation energy E, = 4145.8k2.7 keV as obtained from
their own data. Taking the then existing literature into consideration they adopted
E, = 4143 keV for this level. If one compares the excitation energies obtained by
Erskine et al. 13) with Endt and Van der Leun’s compilation 3, one finds that the
two sets of data agree excellently, the biggest difference being 2 keV. One must
therefore most probably identify the level observed by Erskine et al. 13) with the
level observed at E, = 4148 keV in the present experiment. Erskine et al. 13) allocated J” = 2+, T = 1 to the level observed by them because they considered it
to be the analogue of the E, = 4.11 MeV, J” = 2+ excited state of 34S [ref. ‘“)I.
TA
BL
E I
Tra
nsiti
ons
and
stre
ngth
s us
ed
for
.I”
assi
gnm
ents
to
bo
und
leve
ls
in
“‘C
l “)
4 .I”
va
lues
.I
” va
lues
(M
eV)
cons
ider
ed
b,
reje
cted
r
-+ E
,
at
E,(
J”)
(keV
)‘)
M2
Tra
nsiti
on
stre
ngth
s in
W
.U. “
)
E3
M3
J”
adop
ted
3.33
3.65
3.96
(l
-3)+
8)
4.
14
(2.3
’)“)
4.
33
(l-3
)+
B)
4.42
4.
606
4.61
0
4.70
(l-5
)+
‘)
(1+-
s+)
I% ‘)
(l+
-3)
(l-3
)
1+
(2+
)
(4,5
)+
1+
2 1+
3+
If
3+
(Y
1+
1-
1829
(4);
T
=
1 18
29(4
);
T
= 1
3.33
+
0.67
(1 +
)r)
1829
(4);
T
=
1
1829
(4);
T
=
1 11
65(3
);
T =
1
1119
(1_)
; T
=
1 19
97(3
_);
T =
1
1119
(1_)
; T
=
1 15
44(4
_);
T =
1
1347
(33,
4)‘)
19
97(3
3);
T =
1
1629
(3,4
)+
‘)
180+
50
250+
70
40
0+
150
60&
20
90
0 *
400
(1.5
&0.
7)x
10s
300*
90
(1
.3&
0.5)
x 10
s
(8.4
+2.3
)x
IO“
(3.O
kO.8
) x
lo6
3+(2
+)
(iso
vect
or
E2
stre
ngth
:
5.3
k 1.
4)
(8.4
*2.6
)x
lo4
(3.O
kO.9
) x
10”
(1.4
f0.4
)X
10s
(4.9
k 1.
3) x
lo6
(3
-5+)
(i
sove
ctor
E
2 st
reng
th:
7.3*
2.
0)
3
(iso
vect
or
E2
stre
ngth
: 12
+
4)
(2.3
)+
@J
(iso
vect
or
E2
stre
ngth
: 9
0 k
30)
2 2+
2 !z-
(1.1
+0.3
)x
106
(4.0
&0.
9)x
10’
2-
E:
(l--
3)
2
(233
) z
(1+-
3)
‘y
“)
See
also
su
bsec
t. 4.
2.
b,
J”
was
re
stri
cted
to
th
e va
lues
sh
own
in t
his
colu
mn
usin
g th
e cr
iteri
on
that
th
e le
vel
only
de
cays
vi
a E
l, M
l or
E
2ts
tran
sitio
ns.
Thi
s cr
iteri
on
was
no
t us
ed
in
the
case
of
the
E
, =
3.33
M
eV
leve
l. ‘)
J”
an
d T
for
re
sona
nces
fr
om
tabl
e 2.
d,
rY f
or
the
reso
nanc
e le
vels
w
as
calc
ulat
ed
from
th
e re
sona
nce
stre
ngth
s in
ta
ble
1.
‘)
The
pa
rity
as
sign
men
t is
fro
m
ref.
13)
. ‘)
rY
for
th
e E
, =
3.
33
MeV
le
vel
was
ca
lcul
ated
fr
om
the
mea
n lif
etim
e gi
ven
in
ref.
3).
‘)
The
pa
rity
as
sign
men
t is
fro
m
ref.
t5)
. h,
T
he
J”
= (2
,3+
) as
sign
men
t fr
om
angu
lar
corr
elat
ion
mea
sure
men
ts
s) a
nd
the
deca
y of
the
le
vel.
‘)
The
J”
po
ssib
ility
w
hich
le
d to
th
e lo
wes
t m
ultip
olar
ity
was
us
ed.

98 F. B. Waanders et al. / 34CI
In their (z, a) experiment Van Gasteren et al. ’ 5, observed a level at E, = 4.14
MeV but unfortunately they did not indicate the accurate energy of the level as
measured in their own experiment. They identified their level with the E, = 4140
keV level observed in (p, y) experiments 5, and also with the level observed by
Erskine et al. 13). On the basis of the excitation energy and the average energy
resolution (FWHM) of 15 keV given in their paper it is not clear, however, with
which one of the two levels at E, = 4140 and 4148 keV one should identify the
E, = 4.14 MeV level observed by Van Gasteren et al. 15). The J” = 2+, T = 1
assignment to the E, = 4140 keV level based on the I-value measured by Van
Gasteren et al. “) should therefore be viewed with some caution.
In the present experiment J = 2 was assigned to the E, = 4140 keV level (see
table 7). On the basis of the decay of the level J” = (1,2)+ was assigned to the
E, = 4148 keV level.
The E, = 4.72 MeV leoel. According to Van Gasteren et al. “) this level has
positive parity. From the decay of the level it then follows that J” (E, = 4.72
MeV) = (14)+. Van Gasteren et al. “) also identified this level as the analogue of
the E, = 4.69 MeV, J” = 4+ state in 34S If the E, = 4.72 MeV level has J” = 4+, .
T = 1, the r + 4.72 MeV transition at the E, = 1799 keV, J” = 2+, T = 0 resonance has isovector E2 character with a strength of 8Ok 30 W.U. Even for an
isoscalar E2 transition this strength is unexplainably large. The J”(E, = 4.72 MeV) = 4+ possibility is therefore considered unacceptable and hence J”(E, = 4.72 MeV) = (l-3)+. In subsect. 4.3 the analogue status of this level is discussed
further.
4.2. SPINS AND PARITIES OF RESONANCE STATES
Spins and/or parities were assigned to a number of resonance states on the basis
of the angular distribution measurements (table 6) and Weisskopf estimates of
transition strengths (table 8). Unique spin and/or parities were assigned- by means
of Weisskopf estimates to the resonances at E, = 447, 683, 777, 822 and 1386 keV
whilst the spins of the resonances at E, = 508, 546, 639, 731, 914, 976, 1629, 1738,
1762 and 1812 keV were restricted to two values. The primary transitions and
transition strengths used in the Weisskopf estimates are shown in table 8. The
spins of two resonances were restricted to three possible values. The previous
unambiguous spin assignments3) to the resonances at E, = 1057, 1264, 1752 and
1997 keV were confirmed in the present experiment. The assignments to a few
resonances need further discussion.
The E, = 1165 keV resonance. A J”(E, = 1165 keV) = 3(+’ assignment was
made by Graber and Harris6). Their angular correlation measurements yielded
J = (3,4). The J” = (3-,4) possibilities were rejected because these authors
believed to have observed a 1% r + 0.67 MeV, J” = 1’ transition. In the present
experiment this transition was not observed (upper limit 0.1%). The spin of the

F. 3. Waanders et al. / 34fl 99
E, = 1165 keV resonance was determined in the present experiment to be f = 3 (see table 6 and fig. 3).
10’
10
a’
15
I(
Epr1165keV
r--1*9.r--218 r--2%?
I / t 1 I
-60D -3oO OS 30* so” 0 = tan% for J =2
0 =tan“yfor J =3
0’= tan-‘y’for J = 4
= 1829 keV
EI=tan-‘x for J =2,3.4
Q=tan--‘y for J =5
10‘
10
Q‘
IO
1
-!
Ep: 1215 kW
r-.0!5?--258
I I I I I
-60° -30m o” 30* 6OO SO” 9: tan -‘x for J=2,3
i3=tan-‘y forJ=l
I I I I I I
-go* -60° -30° 0” 3o” 60S
8=tan-‘x for J =1,23
Fig. 3. Values of QZ for the y-ray angular distributions at E, = 1165, 1215, 1829 and 1974 keV. The curves are those sections through the Q* = f(x, 3’) surfaces which yielded the lowest Q&.

TABLE 8
Arg
umen
ts
for
J” a
ssig
nmen
ts
to j
3S(p
, y)3
qC1 r
eson
ance
s
Res
onan
ce
J-va
lues
J*
val
ues
E,
(keV
f co
nsid
ered
re
ject
ed
Tra
nsiti
on
used
r
+ E,
(J
”)
“)
(E,
in M
eV)
M2
Tra
nsiti
on
stre
ngth
s in
W.U
. bf
E3
M3
?i
J” a
dopt
ed
b 3:
447
l-5
1,2+
2-
4-
4+
,5
508
1-3
Z-,
3 54
6 i-
3 z-
,3
639
l-3
2-
3 68
3 1-
3 1-
1*
2+
3-
3+
73
1 1-
4 :;
“+
4-
3:
777
1-3
1-
1”
3+
3-
r -+
3.
60(4
-)
r -+
2.
38(4
+ )
r -*
1.23
(2+
) r
-+ 2
.72(
2-)
r -O
(O+
) r
-+O
(OC
) T
-t
3.94
(0’)
r-
+0(
0+)
r +0
.15(
3+)
r -+
3.
55(Y
) r-
t3.6
0(4-
) r
-* 0
.67(
1 + )
r-
+0(
0+)
r +
3.60
(4-)
r
-+ 2.
72(2
-)
r +
3.
38(2
+)
r -+
3.7
7(1_
) r-
t 0.
15(3
+)
r -+
3.5
5(3-
) r-
+0(
0+)
r -+
2.5
8(1+
)
(l.s
+o.
4)x
103
(2.2
kO
.6)
x lo
6 @
.Ort
Z.l)
x 10
’ 3
6k
2 5 h
8+
2 5
130+
40
(7
.7 f2
.5)
x lo
4 (2
.7 k
O.9
) x
10’
0
110*
30
(1
.5Jr
O.5
) x l
o4
(5.2
zt1.
7)x
iOf
(1,2
*)
z 11
0-t
50
(1.5
&0.
7)x
IO4
(5.2
_t2.
3)x
10s
u,2+
1 45
&
23
(k2’
) 2
4OO
f200
(1
.3&
0.7)
X l
o4
30+
15
2-
60
+
30
50+
25
18
k 9
(6.6
+ 3
.3) x
lo3
50
0~20
0 (9
.0 &
3.6
) x 1
0’
(3.2
rt: 1
.3) x
10’
(2
,3)_
45
* 20
70
+
30
23+
10
50
&
20
2 24
0+
90
9f
4 (6
.1+
2.5)
x i0
3

822
l-3
914
1-3
976
1-3
1215
14
1386
1-
3
1448
l-
3
1629
14
1738
14
1762
1-
3
1812
l-
3
1829
l-
5
1,2-
3-
3+
1-
2-,3
2-,3
3-
.4
1-
1+
2+
2-,3
1-
d) 3-
1,2-
2,
3-
4-
1-
1+
3-,4
1-
2-.3
1-
2-,3
1,2-
2+
, 3+
3-
5-
r +
2.38
(4+)
r-0.
46(1
+)
r +O
(O+)
r +
0.15
(3+)
r
+O(O
+)
r-+0
(0+)
r +0
.67(
1+)
r -+
0.1
5(3+
)
r +
3.55
(3-)
r
+ 3.
94(0
+,
T =
1)
r
--t
o(o+
) r
+ 0.
15(3
+)
r --*
5.
17(4
) r
+ 5.
17(4
) r
-P 2
.58(
1+)
r +
2.38
(4+)
r
-P
4.82
(5+)
r
+ 2.
16(2
+)
r -+
0.1
5(3+
)
r +
3.55
(3-)
r
-+ 0
.46(
1+ )
r +
0.15
(3+)
r+
O(O
+)
r -r
0.
15(3
+)
r +O
(O+)
r -,
2.38
(4+)
r
+ 3.
63(5
-)
r-~
3.63
(5-)
r-
-t
2.18
(3+)
I*
3 (5
.5 f
2.0)
x
lo3
22k
6
7+
3
6Ok
30
(6.7
f
3.3)
x l
o3
140*
40
(1
.6*0
.5)x
10
“ 70
+ 30
(1
.0*0
.4)x
lo
4 25
0+
100
(1.2
+0.5
)x
lo3
21+(
11 ts
ovec
tor
E2
stre
ngth
: 3
0 k
15)
230:
70
(2
.lk
1.1)
x 1
03
(2.0
+0.7
)x
10’
(4.1
k
1.6)
x l
o3
(2.4
+ 1
.2)
x 10
’
(5.5
+ 1.
8) x
10s
(3
.6+
1.0)
x l
o5
(7.4
&3.
8)x
lo*
(2.4
f0.8
) x
10’
(8.5
k 3
.0)
x 10
’ (4
.6*
1.6)
x l
o3
(and
E
2 st
engt
h:
135
+_5
0)
6Ok
20
190+
80
(9
.9*4
.1)x
lo
4 (3
.5 &
1.4
) x
lo6
900_
+400
(1
.5*0
.7)x
lo
6 (5
.3 k
2.4)
x
10’
I*
3
9+
2 85
+ 25
6+
2 70
0~20
0 (2
.4+0
.6)x
lo
4 13
* 4
81
2 70
0 &
220
(2
.4kO
.8)
x lo
4
8+
3 14
* 5
(1.3
f0.4
)X
103
(4.6
+ 1
.5)
x 10
“ (1
.8&
0.4)
x 10
’ (8
.7*
1.8)
x 1
0s
(3.1
kO
.7)
x 10
’ 6O
Ok
150
(4.4
k 1.
2) x
105
ts
ovec
tor
E2
stre
ngth
:
17 +
4)
130+
(4
0 _
2+
(1,2
Y
(1,2
+)
2’)
1 3+,
(2)~
)
(1,2
)+
2
4’)
“)
J”
for
boun
d le
vels
fr
om
tabl
e 4.
“)
ry
fo
r th
e re
sona
nce
leve
ls
was
ca
lcul
ated
fr
om
the
reso
nanc
e st
reng
ths
in
tabl
e 1
‘)
See
subs
ect.
4.2.

102 F. B. Waanders et al. / 34Cl
The Ep = 1215 keV resonance. Weisskopf estimates restricted the spin of this
resonance to J” = (2,3+) (see table 8). The present angular distribution
measurements only allow J = (1,2). It can therefore be concluded that
J(E, = 1215 keV) = 2. The r + 3.63 (J” = 55) and I + 4.08 (J” = 44) MeV
transitions reported in ref. ‘) were not observed in the present experiment and
therefore the J” = 2+ possibility cannot be rejected.
The E, = 1448 keV resonance. Weisskopf estimates restricted the spin of this
resonance to J” = (2,3+) (see table 8). The strengths of 135 f 50 and (4.6 f 1.6) x lo3
W.U. for possible E2 and M2 r + 5.17 MeV, J = 4 transitions all but exclude the
J(E, = 1448 keV) = 2 possibility.
The E, = 1829 keV resonance. The spin of this T = 1 resonance is restricted to
J” = (4,5+) in table 8. The angular distribution results in table 6 allow J = (3,4)
and one therefore concludes to J(E, = 1829 keV) = 4.
The E, = 1974 keV resonance. The angular distribution measurements allow
J = (1,2) for this resonance (see table 6). The strength of the possible M2 r + 2.18
MeV, J” = 3+ transition is 50 + 15 W.U. and therefore excludes the J” = l-
possibility. Hence JR(E, = 1974 keV) = (l’, 2).
4.3. ANALOGUE STATES
A number of T = 1 states in 34C1 have already been identified 3). Previously the
E, = 4.14 MeV level was considered to be the analogue of the E, = 4.11 MeV,
J” = 2+ state in 34S. From the discussion in subsect. 4.1 it follows that this assignment should be reconsidered. For the E, = 4.14 MeV level J” = 2-, T = 1 can be
excluded because the first J* = 2-, T = 1 state should occur at E, g 5.32 MeV. If
one assumes that the E, = 4.14 MeV level has J” = 2+, T = 1 then the r + 4.14
MeV transition at the E, = 1119 keV, J” = l-, T = 1 resonance has isoscalar El
character with a strength of 3.lkO.8 mW.u. One therefore concludes that it is very
unlikely that the E, = 4.14 MeV level has T = 1. The levels at E, = 4.15 MeV and
E, = 4.21 MeV can also be considered as candidates for the T = 1 analogue of the
E,=4.11 MeV,J”=2+statein . 34S Only the E, = 4.15 MeV level was excited in
the present experiment and no conclusive evidence was found on the basis of which
a T-assignment could be made to this level.
The E, = 4.606 and 4.610 MeV levels are the only candidates for the T = 1
analogue of the E, = 4.62 MeV, J” = 3- level in 34S. If the E, = 4.606 MeV level
has J” = 3- the r + 4.606 MeV transition at the E, = 1798 keV, J” = 2+, T = 0 resonance would have El character with a strength of 0.8 mW.u. which indicates
T = 0 for the E, = 4.606 MeV level. The E, = 4.610 MeV, J = (2,3) level was
excited at the E, = 683 keV, J” = 2- resonance. This resonance has T = 0 because no J” = 2-, T = 1 state is expected at E, r 5.81 MeV in 34C1. The
strengths for possible El or Ml character of the r + 4.610 MeV transition strongly
indicate that the E, = 4.610 MeV level has T = 1.

F. B. Waanders et al. / 34CI 103
The E, = 4.72 MeV level was previously considered to be the T = 1 analogue of
the E, = 4.69 MeV, J” = 4+ level in 34S [ref. ‘“)I. In subsect. 4.1 it was shown that
the E, = 4.72 MeV level in 34C1 does not have J” = 4+ and thus cannot be the
analogue of the E, = 4.69 MeV level in j4S. Presently there is no definite candidate
in 34C1 for the analogue of this level.
The J” = (l-3)+ assignment to the E, = 4.72 MeV level, leads to Ml character
for the r + 4.72 MeV transition at the E, = 1798 keV, J” = 2+, T = 0 resonance.
This transition has a strength of (0.10+0.04) W.U. which is three times larger than
the isoscalar Ml RUL. One therefore concludes to T(E, = 4.72 MeV) = 1. This
level is probably the analogue of the E, = 4.88 MeV, J” = 3+ state in 34S.
The levels at E, = 4.94 and 4.96 MeV are the only 34C1 states populated in the
present experiment that can be considered as candidates for the T = 1 analogue of
the E, = 4.89 MeV, J” = 2+ level in 34S. The strengths for possible El and Ml
character of the Y -+ 4.94 MeV transition at the E, = 1974 keV, J” = (l+, 2), T = 1
resonance, show that the E, = 4.94 MeV level has T = 0. The J” = 4+ possibility
for the E, = 4.96 MeV level should not be considered too seriously because it
would lead to a E2 character for the I + 4.96 MeV transition at the E, = 1798
keV, J” = 2+, T = 0 resonance, with a strength of 40+ 15 W.U. The J” = (l-3)+
possibilities all give rise to Ml character for the above-mentioned transition, with a
strength of 0.04kO.01 W.U. which strongly indicates that T(E, = 4.96 MeV) = 1.
According to Grawe et al. 20) the E, = 5.68 MeV level in 34S has J” = 33(2-).
The most likely candidate in 34C1 for the T = 1 analogue of this state, is the
E, = 447 keV (E, = 5.58 MeV), J = 3 resonance. The r -+ 3.55 MeV, J” = 3-,
T = 0 transition at this resonance has strengths of respectively 4+ 1 mW.u. and
0.14f0.04 W.U. for possible El and Ml character and therefore T(E, = 447 keV) = 1.
The E, = 777 and 822 keV resonances are possible candidates for the analogue
of the E, = 5.99 MeV, J” = 2+ state in 34S The E = 822 keV resonance decays .
mainly to T = 1 states and therefore probably ha: T = 0. If the parity of the
E, = 777 keV resonance is 7c = + this resonance is a more likely candidate,
because it then decays mainly with Ml transitions with strengths well within the
upper limit for Ml, AT = 1 transitions.
There are several candidates for the T = 1 analogue of the E, = 6.12 MeV,
J” = 2+ state in 34S. The E, = 1023 keV (E, = 6.14 MeV) resonance in 34C1 is the
only one of these candidates that does not have its main decay to a T = 1 state.
Furthermore if one assumes J” = 2+ for this resonance its main decays all have
Ml character. The E, = 1023 keV resonance therefore very likely has T = 1.
This experiment was supported by the South African Council for Scientilic and
Industrial Research to whom the authors are greatly indebted.

104 F. B. Waanders et al. / j4Cl
References
1) D. Dassie, F. Lecca and P. Mennrath, Nucl. Phys. A276 (1977) 260; D. Dassie, F. Leccia, P. Mennrath and J. C. Sens, Nucl. Phys. A276 (1977) 279
2) P. W. Glaudemans, L. Erikson and J. A. R. Werkhoven, Nucl. Phys. 55 (1964) 559 3) P. M. Endt and C. van der Leun, Nucl. Phys. A310 (1978) 1 4) J. Keinonen, M. Riihonen and A. Antilla, Phys. Scripta 12 (1975) 280 5) A. K. Hyder and G. I. Harris, Phys. Rev. C4 (1971) 2046 6) H. D. Graber and G. I. Harris, Phys. Rev. 188 (1969) 1685 7) J. J. A. Smit, J. P. L. Reinecke, M. A. Meyer and D. Reitman, Nucl. Phys. A170 (1971) 471 8) P. M. Endt, At. Data and Nucl. Data Tables 19 (1977) 175 9) C. J. van der Poe1 et al., Nucl. Phys. A373 (1982) 81
10) A. E. Blaugrund, Nucl. Phys. 88 (1966) 501 11) J. A. Ormrod, J. R. McDonald and H. E. Duckworth, Can. J. Phys. 43 (1965) 275 12) P. M. Endt, At. Data and Nucl. Data Tables 23 (1979) 3 13) J. R. Erskine, D. J. Crozier, J. P. Schiffer and W. P. Alford, Phys. Rev. C3 (1971) 1976 14) D. J. Crozier, Nucl. Phys. Al98 (1972) 209 15) J. J. M. van Gasteren, B. Sikora and A. van der Steld, Nucl. Phys. A231 (1974) 411 16) P. M. Endt and C. van der Leun, Nucl. Phys. A235 (1974) 1 17) T. P. G. Carola and B. Sikora, Nucl. Phys. A206 (1973) 427 18) R. G. Helmer, P. H. M. van Assche and C. van der Leun. At. Data and Nucl. Data Tables 24
(1979) 39 19) R. J. de Meijer et al., Nucl. Phys. A386 (1982) 200 20) Grawe and Kiindler, Proc. Tokyo Conf. (1977) 217, and private communication with P. M. Endt