the evaluation of a school-based - CiteSeerX
231
1 THE EVALUATION OF A SCHOOL-BASED SUBSTANCE ABUSE PREVENTION PROGRAMME By ANZÉL SCHÖNFELDT SUBMITTED IN FULFILMENT OF THE REQUIREMENTS FOR THE DEGREE MASTERS PSYCHOLOGY IN THE FACULTY OF HUMANTIES DEPARTMENT OF PSYCHOLOGY AT THE UNIVERSITY OF PRETORIA PROMOTER: PROF MJ VISSER NOVEMBER 2007
-
Upload
khangminh22 -
Category
Documents
-
view
2 -
download
0
Transcript of the evaluation of a school-based - CiteSeerX

1
THE EVALUATION OF A SCHOOL-BASED
SUBSTANCE ABUSE PREVENTION
PROGRAMME
By
ANZÉL SCHÖNFELDT
SUBMITTED IN FULFILMENT OF THE REQUIREMENTS
FOR THE DEGREE
MASTERS PSYCHOLOGY
IN THE
FACULTY OF HUMANTIES
DEPARTMENT OF PSYCHOLOGY
AT THE
UNIVERSITY OF PRETORIA
PROMOTER: PROF MJ VISSER
NOVEMBER 2007
2
ACKNOWLEDGEMENTS
I wish to express my sincere gratitude to the following individuals: Our Heavenly father for his abundant Grace. My family for their patience and continuous support. Prof. M.J. Visser, my promoter, for her guidance and patience. Benita van Wyk, for all her support and advice. The National Research Foundation for allocating the funding for the study. The Department of Education and all other stakeholders, including the participants in this study. Mary Richards for proof reading this document. Brennan Walsh for producing GIS maps. Mariska Griesel for lending an ear.

3
ABSTRACT
THE EVALUATION OF A SCHOOL-BASED
SUBSTANCE ABUSE PREVENTION
PROGRAMME
By
ANZÉL SCHÖNFELDT
FACULTY OF HUMANTIES
DEPARTMENT OF PSYCHOLOGY
PROMOTER: PROF MJ VISSER

4
Abstract
This research report presents the findings of an evaluation of a school-based substance abuse
prevention programme presented as part of Project Awareness. The programme was presented
as a one-day intervention for grade ten learners in eleven schools in Tshwane. The prevention
program taught substance abuse refusal skills, anti-substance norms, personal self-management
skills, and general social skills in an effort to provide students with skills and information for
resisting substance offers, to decrease motivations to use substances, and decrease vulnerability
to substance use social influences. The study evaluated this school-based substance abuse
prevention intervention in a sample of learners (N=300) in six of the eleven schools.
Measures were obtained on a behavioural survey to ascertain whether any knowledge, behaviour
or attitude change occurred between the pre-intervention and post-intervention phases. In
addition, focus group data and observational measures were implemented to determine how the
learners experienced the programme and whether the programme was effective in capturing the
attention of the learners.
Results indicated that, from learners perceptions of the programme, the intervention seems to
have had a positive impact on substance abuse prevention, but not on changing the behaviour of
learners already engaging in substance abuse. The results from the behavioural survey indicated
some change in learner attitudes to some degree, but not behavioural change. Suggestions for
the improvement of the programme were made throughout the report, and the observational
measures specifically indicated that the more practical oriented tasks were more efficient in
capturing the attention of learners. It is concluded that although the programme certainly had
room for improvement, that the programme did indeed address relevant issues. The program also
had a direct positive effect on several cognitive, attitudinal, and personality variables believed to
play a role in adolescent substance use.

5
Key Terms Evaluation
School-based
Substance Abuse
Prevention
Adolescent
Programme Evaluation
Intervention
Focused school intervention
Kirkpatrick Model
Health Belief Model
Theory of Reasoned Action
Theory of Planned Be
Drug Abuse
Prevention Programme

6
Table of Contents Chapter 1
1. Introduction ................................................................................................................................................. 9
1.1. Substance Abuse .............................................................................................................................. 10
1.2. Prevention and Programme Evaluation .............................................................................. 13
1.3. Existing Research............................................................................................................................ 16
1.4 Project Background ............................................................................................................................. 18
1.5 Focused School Intervention………………………………………..…………………………...…………….20
1.6 Evaluation of the Focused School Intervention………………………………………………..………….….21
Chapter 2
2. Theoretical Models ............................................................................................................................ 23
2.1 Kirkpatrick’s Model ........................................................................................................................... 23
2.1.1 Levels of Kirkpatrick’s Model .................................................................................................. 24
2.3 Value and Limitations of the Kirkpatrick Model………………………………………………………………………31
2.4. The Health Belief Model................................................................................................................. 31
2.5 The Theory of Reasoned Action............................................................................................... 35
2.6 The Theory of Planned Behaviour............................................................................................ 39
2.7 Conclusion ............................................................................................................................................... 40
Chapter 3

7
3. Methodology.............................................................................................................................................. 41
3.1 Research adnd Hypothesis Statement.................................................................................. 41
3.2 Data Collection Techniques ....................................................................................................... 42
3.3 Data Collection Instruments .......................................................................................................................... 44
3.4 Sampling .................................................................................................................................................... 51
3.5 Data Analysis ................................................................................................................................................... 53
3.6. Ethical Considerations ...................................................................................................................... 55
3.7. Conclusion ................................................................................................................................................ 55
Chapter 4
4. Results ........................................................................................................................................................... 56
4.1 Introduction ................................................................................................................................................ 56
4.2 Programme Implementation ........................................................................................................... 56
4.3 Results: Observational Data .......................................................................................................... 57
4.4 Results: Behavioural Data ................................................................................................................ 68
4.5 Results: Focus Groups ...................................................................................................................... 78
4.6 Summary....................................................................................................................................................... 83
Chapter 5
5. 1 The Behavioural Learner Survey............................................................................................... 84

8
5.2 Programme Delivery and Content………………………………………………………………………...…..…………87
5.3 Observational Data…………………………………………………………………………………………………….….….91
5.4 Gender and Age Related Factors………………………………………………………………………………92
5.5 The project in comparison to other interventions………………………………………………………...…...92
5.6 Conclusion…………………………………………………………………………………………………………………..…94
List of Tables
TABLE 1: PROJECT AWARENESS OUTLINE……………………………………………………………………18 TABLE 2: LEVELS OF KIRKPATRICK’S MODEL ........................................................................................24 TABLE 3: SELECTION OF SCHOOLS PER CLUSTER...............................................................................51 TABLE 4: PROPORTION INVOLVED LEARNERS ......................................................................................57 TABLE 5: SCHOOL ONE INVOLVEMENT ANALYSIS.................................................................................60 TABLE 6: SCHOOL TWO INVOLVEMENT ANALYSIS ................................................................................61 TABLE 7: SCHOOL THREE INVOLVEMENT ANALYSIS ............................................................................62 TABLE 8: SCHOOL FOUR INVOLVEMENT ANALYSIS ..............................................................................63 TABLE 9: SCHOOL FIVE INVOLVEMENT ANALYSIS ................................................................................64 TABLE 10: SCHOOL SIX INVOLVEMENT ANALYSIS.................................................................................66 TABLE 11: LEANER SURVEY: FREQUENCIES BY GENDER....................................................................70 TABLE 12: AGE BY GENDER (WHOLE GROUP) .......................................................................................71 TABLE 13: SIGNIFICANT SURVEY ITEMS (GENDER)...............................................................................76
Table of Appendices
A. Presenter's Manual................................................................................................................................................... 107
B. Learner Survey ......................................................................................................................................................... 114
C. Observation Sheets................................................................................................................................................... 118
D. Moderator's Guide - Focus Groups ......................................................................................................................... 120
E. Ensomar Guideline................................................................................................................................................... 121
F. Survey Analysis of Variance: Age and School……………………………………………………………….………………125
G. Results Matrix .......................................................................................................................................................... 126
H.. Bivariate Analysis of Variance - Survey Question 8 ............................................................................................... 131
I. Bivariate Analysis of Variance – Survey Question 9 ................................................................................................. 134
J. McNemar Analysis – Male Survey Respondents ....................................................................................................... 136
K. McNemar Analysis – Female Survey Respondents................................................................................................... 138
9
L. McNemar Analysis – Whole School Survey .............................................................................................................. 141
M. Age and Gender – Whole Group Levene and T-Test Results………………...……………………………………………143 N. Age and School Crosstabulation………………………………………………………………………………………………144
9
Chapter 1 1. Introduction
“Our country is faced with a growing problem of substance
abuse. This has serious implications for the millions of
citizens because it contributes to crime, domestic violence,
family disintegration and other social problems.”
-Nelson Mandela
There is great concern about substance use and abuse among secondary school learners in
South Africa. According to Rocha-Silva, de Miranda and Erasmus (1996) general or drastic socio-
economic changes (such as the case in South Africa) contribute to an escalation of risk-behaviour
such as substance abuse and the spread of HIV/AIDS. Research conducted by Yamada, Kendix
and Yamda (1996) found that increased incidences of alcoholic consumption and frequent
cannabis use also significantly reduce the probability of high-school graduation.
This has then, in turn, far-reaching individual and societal implications and has increased the
need for cost- efficient national intervention programmes. As South Africa re-emerges as a
member of the international community, we are faced with heightened risk and prevalence of
substance abuse. Flisher (1999) confirms that there is room to believe that data from a 1990
study is no longer valid because of social and political changes as well as an increase of
available drugs in South Africa due to globalization. Research has shown that the influence of
substance abuse transcends social, racial, cultural, religious and gender barriers. The reality is
that substance abuse affects everyone, whether directly or indirectly.
Calls for preventative action have progressively intensified in the last couple of years (World Drug
Report, 1997; Declaration and Plan of Action on Drug Abuse and Illicit Trafficking Control in
Africa, 1996; World Summit for Social Development, 1995:8, 107-109; World Health Organization,
1993). According to the World Drug Report of 1997, the relationship of drug use to the
transmission of infectious disease such as hepatitis and HIV/AIDS, the costs incurred by the
individual and society in terms of physical harm, increased taxation (e.g. to provide health care
and maintain the criminal justice apparatus) and lower productivity are serious causes for
concern. Parry (2005) reported that in recent years, national surveys that included questions on
substance use behaviour (Parry, Plüdderman & Steyn, 1998; and Reddy, Pandas & Swart, 2002)
as well as surveillance systems on treatment demand and on alcohol-related mortality
(Matzopoulos, Seedat & Marais, 2004) had received additional funding. Parry (2005) further
10
elaborated that the Medical Research Council has also explored risk and protective factors for
adolescent substance (ab)use (Morojele, Flisher & Muller, 2002; Parry, Morojele & Flisher, 2004).
The research base underpinning substance abuse policy and practice in South Africa needs to be
strengthened, and various gaps need to be addressed, including in-depth evaluations of
prevention programmes.
1.1. Substance Abuse
According to Reber and Reber (2001) substance abuse refers to the improper, irresponsible, or
self-damaging use of addictive substances. According to the World Health Organization (1992)
substance abuse refers to using a substance continually even with knowledge that usage of this
or these substance(s) may cause several debilitating problems and may eventually lead to some
form of addiction. The Diagnostic and Statistical Manual of Metal Disorders (DSM – IV-TR) (APA,
2000) describes substance abuse as a maladaptive pattern of substance usage, leading to
clinically significant impairment or distress which usually manifests in one or more of the
following symptoms within a year: recurrent substance use in a situation that cause physical
danger to the user, or, in the face of obvious incapacitation or impairment in school or
employment contexts, or despite resulting in social, interpersonal or legal problems. Searll (1995)
defines substance abuse in similar terms, namely the excessive usage of psychoactive
substances or alcohol resulting in lowered levels of functioning on several cognitive and physical
levels.
The Department of Health widens the definition slightly in its National Drug Master Plans of 1999
and 2006 to encompass both misuse and abuse of legal substances such as nicotine, alcohol,
over-the-counter drugs, prescribed drugs, alcohol related concoctions, indigenous plants,
solvents, inhalants, as well as the usage of illicit substances. Newcomb and Bentler (1989) report
that any substance abuse amongst children and adolescents up until the age of sixteen (18 years
in South Africa) constitutes a form of abuse. Newcomb and Bentler (1989) further elaborate that
reasons for this classification include that the negative effects of substance usage on a still-
developing nervous system makes adolescents more susceptible to the adverse effects of
substances. Additionally, substance abuse at an early age has been clearly linked to later
substance abuse (Kandel, 1980 Du Pont, 1989; Catalano, Kosterman, Hawkins, Newcomb &
Abbott, 1996), as well as other serious behavioural problems, including truancy, school drop out,
delinquent activities and precocious sexual activities (Newcomb & Bentler, 1989).
According to Visser and Routledge (2007) research conducted in South Africa report that
substance abuse among adolescents is one of the most significant health and social problems,
11
and that data show a progressive increase in the use of alcohol during the past decade. Parry,
Bhana, Myers, Plüdderman, Siefried, Morojele, Flisher and Kozel (2002) report that alcohol is the
dominant form of substance abuse. According to Rocha-Silva, de Miranda and Erasmus (1996)
42% of black youth respondents in both rural and urban areas reported to have drunk alcohol at
some point in their lives, with 34% reported current drinking patterns in the 12 months preceding
the survey. Rocha-Silva, Mokoko and Malaka (1998) further report that prevalence rates for
substance usage and abuse amongst youth between the ages of ten and twenty-five years of age
seem to reflect comparative figures in the Unites States (The National Drug Control Strategy
1997). Rocha-Silva et al. (1998) found that over-the counter-medicine, alcohol, tobacco, cannabis
and solvents seem to be the drugs of choice amongst the majority of South African youth, followed
by sedatives and stimulants and, to a lesser extent, designer drugs such as cocaine, heroin,
ecstasy and LSD. Rocha-Silva et al. (1998) claim that substance abuse is especially common
among males and that usage generally increased in intensity in older age groups. According to
Parry, Plüdderman, Bhana, Matthysen, Potgieter and Gerber (2001) approximately one in four
grade ten learners reported getting drunk occasionally during the course of a month in a school
survey undertaken by the University of South Africa. Parry et al. (2002) further report that over-
the-counter and prescription medicines, such as slimming substances, analgesics and headache
medication appear to be the most commonly abused substances in Gauteng.
Gilles (1996) reports trends that indicate a tendency for progressively younger learners
experimenting with substances, which remain a cause for concern. During adolescence,
substance use generally progresses in terms of frequency and quantity of usage as well as in the
number of substances abused (Millman & Botvin, 1992). Additionally, there seems to be a
progression in the type of drug(s) used over a period of time. So-called gateway drugs such as
alcohol and tobacco are usually the first substances that are abused, partially due to their wide
availability within the community. Later, a percentage of these youth graduate to cannabis and
over-the-counter medication, and some eventually go on to use stimulants, opiates and other illicit
substances.
Nesser, Ovens, Victor-Zietsman, Ladikos and Olivier (2001) report that within the periods of 1998
and 1999, 31% of grade 12 learners and 26% of grade 10 learners reported heavy drinking in the
United States. Disturbingly, Pytel (2007) reports that learners who start drinking before the age of
fifteen are five times more likely to have alcohol-related problems in later life. Botvin and Griffin
(2001) maintain that research findings around substance abuse trends and prevention in schools
across the United States over the last two decades provide a firm conceptual foundation of
effective approaches to substance abuse prevention. Etiology research has identified several
significant risk and protective factors that seem to be important in counteracting the effects of
12
these risks (Hawkins, Catalano & Miller, 1992). All of these factors need to be addressed in order
for an intervention to be affective. These factors are usually grouped into the social sphere in
which they operate:
1. Peer and school-related domains and their associated risk and protective factors
2. Family domain and its associated factors
3. Personal or individual domains and their associated factors
4. Community domain and its associated factors
Peer and school-related risk factors include friends who engage in high-risk behaviour, availability
of substances, a lack of support in schools, as well as a lack of shared norms for behaviour. In
counter to these risk factors in the peer and school related domains, Hawkins, Catalano and
Miller (1992) suggest that a resilient temperament, positive social orientation, healthy beliefs and
clear standards such as an anti-substance abuse policy at school heighten an adolescent’s
resilience to risk factors. Rocha-Silva et al. (1998) found that drug-taking generally takes place in
company (except, to some extent, in the case of illicit drugs) and fairly uncontrolled social settings
(e.g. taverns/shebeens, bottle-stores, clubs/discothèques and the homes of friends), and that youth
usually experience direct pressure to start using substances.
Family conflict, a family history of risk behaviour as well as a favourable parental attitude towards
substance abuse constitutes risk. Many prevention strategies focus on protective factors in order
counter these risk factors by addressing issues such as social-problem solving or skills building
components within interventions (Bry, 1982; Greenberg, Kusche, Cook & Quamma, 1995;
Lochman, 1992).
Adolescent substance abuse prevention initiatives that are typically classroom-bound are usually
designed to have an impact on the Individual domain. By intervening with a prevention program
for adolescents, it is presumed that the prevalence amongst these youth will ultimately be
reduced as they become older. According to Hawkins et al. (1992) personal factors include
cognitive expectancies (e.g. attitude, beliefs, and normative expectations regarding substance
use/abuse), personal competencies and skills (e.g. decision making and self-control), social skills
(e.g. communication skills and assertiveness), as well a set of relevant psychological factors
including self-efficacy, self-esteem and overall psychological well-being as is the case with the
programme evaluated in this study. An emotionally supportive family unit where there is a high
level of bonding amongst family members with clear and consistent expectations is able to
counter any risk factors associated with the Family domain (Lang, Rosati, Jones & Garcia, 1996).
13
The last domain deals with community risk factors such as the availability of substances, media
portrayal of substance abuse, community norms that favour substance abuse in addition to
poverty. Prevention programmes that address the strengthening of community protective factors
focus on youth participation within the community, a noted decrease in availability of substances
within the community as well as community norms such as non-smoking laws in public areas.
Mathias (1996) reports that universal community programmes need to be comprehensive with
well- coordinated components for the individual, the family, the school, the media, and community
organizations. One such universal community-based programme, developed by the National
Institute on Drug Abuse-funded researchers at the University of Southern California in Los
Angeles, has reduced substance abuse over a five-year period among middle-school students in
Kansas City, Missouri. In this comprehensive programme, a classroom curriculum teaches
learners how to resist risk factors associated with substance abuse. In addition, schools, parents,
mass media, and community organizations work together to promote consistent anti-substance
messaging, attitudes, and policies within the community.
1.2. Prevention and Programme Evaluation
Traditionally, prevention practices have been divided into three main categories. Primary
prevention, as is the case in the intervention described in this study, focuses on individuals prior
to the onset of any signs of the unwanted behaviour, while secondary prevention are directed at
individuals who demonstrate early signs of unwanted behaviour. Tertiary prevention (often
referred to as treatment) is usually directed at individuals who already manifest unwanted
behavioural patterns. More recently, researchers sought to redefine the traditional view on
prevention (American Institute of Medicine, 1994). Three types of prevention where outlined,
namely:
• Universal prevention, directed at whole populations;
• Selective prevention, targeted at individuals demonstrating at-risk factors associated with
the unwanted behaviour, and
• Indicated prevention aimed at individuals who are in the so called “treatment” phase;
corresponding to the traditional tertiary intervention level.
According to Tarter (2006) the traditional and more recent classification of prevention strategies
are not mutually exclusive. The newer classifications strategy is more focused inasmuch as it
specifies the type of population and the presence or absence of identifiable factors that require
intervention. Johnson, Amatetti, Funkhouser and Johnson (1988) note that because prevention is

14
an evolutionary field that is continuously growing, the current knowledge base will expand and
emerge in new combinations, providing better tools with which to address substance abuse.
Programme evaluation research revolves around the establishing of the effectiveness of social
programmes. According to Terre Blance and Durrheim (1999) the number of evaluations being
conducted locally is comparatively small in relation to the number of social interventions that are
in existence. Indications are that over R6 billion of both foreign and local funding has been spent
on social interventions since 1970, of which only a fraction was evaluated.
South African researchers have only recently begun to show an increased interest in programme
evaluation (Terre Blance & Durrheim, 1999; Peltzer, Cherian & Cherian, 1999). This does not
reflect the trend in countries like America and Canada, where there seems to be greater
emphasis on the rights of donors and the public to be informed about the success of social
programmes. Some researchers believe that social interventions can only be viable if they are
externally evaluated (Worthen & White, 1987). Potter (in Terre Blanche & Durrheim, 1999, p.225)
believes that evaluation is an area of applied social science research that “holds great promise to
those social scientists that wish to conduct research with high social relevance”. In an
increasingly difficult economic climate, it is important that evaluation evidence be taken into
account to develop more cost and content -efficient interventions to promote effective social
change.
The development of comprehensive, community-based interventions for the prevention of
substance use and abuse calls for careful evaluation of these programmes (Hansen & Kaftarian,
1994). With more refined evaluation methods, it will be possible to identify characteristics of
successful interventions as well as common challenges in the design and implementation of
school-based interventions. A study conducted by Peltzer, Cherian and Cherian (1999) among
secondary school pupils in the Northern Province called for a systematic collection of data on
substance abuse and subsequent use of this data in various parts of the country in order to
design an effective national substance abuse prevention programme.
To date, the response to the country’s substance abuse problem was at best uncoordinated and
disjointed. The duplication of services and the non-existence of others have led to
mismanagement of dwindling resources and failure to secure new funding. According to Zafar
(1998) there is a need to improve the management and coordination of interventions to ensure
that adequate funding is secured to support much needed research. Parry and Bhana (1997)
confirmed that widespread dissemination of locally and internationally derived research findings
will help to determine which modifications are required for successful prevention in a local
context.

15
According to the World Health Organization (Expert Committee on Drug Dependence, 1993),
evaluation is needed to establish the extent of the need for prevention programmes, but also to
identify ways in which particular kinds of drug related harm can be reduced. Intervention and
operational research is needed to make closer matches between substance abusers and specific
treatment problems. Appropriate modifications will then, in turn, lead to the development of more
effective treatment models.
Tarter (2006) comments that there seems to be numerous reasons for the variation in
effectiveness of prevention programmes and the evaluation thereof. Not all individuals are at
equal risk for developing the particular disease or behaviour. Consequent to a unique genetic
makeup, environmental factors, and developmental history, each person in the population has a
different level of risk for manifesting the adverse outcome. Persons at elevated risk are less
amenable to universal preventions. Hence, despite widespread knowledge dissemination, public
relations campaigns, and educational programming, a relatively large proportion of the population
engages in substance abuse. Tarter (2006) further documents that intensive individualized
prevention is required to effectively reduce, or more expectantly, ameliorate the risk. Toward this
end, selective and indicated preventions are required.
There has been a call for an increased number of gender/age specific models and programmes
for behavioural change, as well as the evaluation of these programmes. Guthrie and Flinchbaugh
(2001) report that “… programme designers in the 21st century concerned with programmes for
adolescents need to make concerted efforts to understand that gender does matter and to include
gender as a social construct in substance abuse prevention programmes for adolescents,
generally, and for early adolescent girls, in particular.” According to the National Institute on
Drug Abuse (1996) in the United States, there should be more preventative programmes and
evaluations that focus on a general assumption that the negative consequences of drug abuse
may have differential impact and may require targeted prevention intervention strategies for some
of the population, especially young woman in the adolescent age cohort.
It is clear that evaluation research needs to be documented consistently on an empirical level.
This study, although not longitudinal, has a contribution to make in terms of the growing body of
South African research on the subject. The intervention evaluated during this study was
developed by professionals as part of a team effort for a one-day intervention in schools. The
programme consisted of exercises and discussions of the impact of substance abuse in the life of
a teenager as well as information on the risks of substance abuses. Life skills related to the
handling of peer group pressure, stress and problem solving skills were trained to assist the
learners not to become involved in substance abuse. The content of the intervention was largely

16
based on information dissemination and aspects of the health belief model. This study focused
on the evaluation of the implementation and impact of the intervention in the schools.
1.3. Existing research findings related to school-based substance abuse
prevention
Several organizations have published substance abuse prevention results over the last couple of
decades, including government departments, universities and other research institutions as well
as local stakeholders (NGO’s and CBO’s). According to the National Institute on Drug Abuse
(2003) any period of change or transition (such as adolescence), is a risk period for substance
abuse onset. Research conducted by Kandel (1978) around the age of substance abuse onset
indicates that prevention programmes should target individuals by at least the onset of
adolescence.
The National Institute on Drug Abuse (2003) found that the consequences of drug abuse by
females are more severe and data indicate that after initial use, females may proceed more
rapidly to drug abuse than males. The causes, correlates, and consequences of drug abuse and
addiction appear also to differ with respect to girls and boys. Women's initiation into drug use
also differs from that of men's. Preliminary results from a study on gender differences in cocaine
initiation and abuse indicate that approximately 90 percent of women reported that men played
some role in their involvement with crack cocaine. By contrast, only 17 percent of men reported
that women were involved in their initiating or maintaining the use of crack cocaine. Women were
more likely to begin or maintain cocaine use in order to develop more intimate relationships, while
men were more likely to use the drug with male friends and in relation to the drug trade.
Successful prevention programmes should therefore contain life skills’ training that is specifically
related to gender differences regarding substance abuse onset during adolescence.
Programmes that have had some success in the prevention of substance abuse among
adolescents include Project SOAR (Skills, Opportunity and Recognition), also previously known
as the Seattle Social Development Programme. According to Hawkins, Catalano, Kosterman,
Abbott and Hill (1999), this school-based intervention seeks to reduce the risk of substance
abuse by enhancing protective factors. Lonczak, Abbott, Hawkins, Kosterman and Catalano
(2002) point out that this programme is designed to enhance opportunities, skills and rewards for
learner’s pro-social involvement. The United States Department of Education (2001) reports that
long-term results for this programme show positive outcomes for participants, including reduced
anti-social behaviour, substance abuse and teen pregnancy.

17
Morojele, Knott, Myberg and Finkelstein (1997) report on a sub-committee of the Western Cape
Alcohol and Drug Abuse Forum (Education and Prevention Committee) which formed to
assess/audit school-based substance-abuse prevention programmes based in the Western Cape.
The aim was to determine the appropriateness of each programme being implemented in
schools, as well as the extent of coverage of prevention activities in the Western Cape. Eight
programmes participated in the evaluation (including the Lion’s Quest Skills for Adolescence
described below in its American context). Of these eight organizations, only three have
undergone previous formal evaluation. Morojele et al. (1997) subsequently concluded that
interventions with basic information approaches to prevention should also utilize interactive
teaching methods and include skills training elements (without the use of shock tactics). These
substance abuse prevention programmes should also be extended to cover the primary school
levels, and should be extended to cover multiple years. Morojele et al. (1997) also suggest that:
1. Programmes should seek to extend levels of community involvement.
2. Programmes should seek to serve historically disadvantaged communities.
3. Programmes should seek to serve rural communities.
4. Programmes should aim to include more intensive teaching methods such as the use of
extended practice, role-playing and modeling.
5. Programme providers should recognise shortcomings in their approaches, where present,
and be open to modifying potentially ineffective aspects.
Additionally, Morojele et al. (1997) argue that there is a need to prevent duplication of programme
activities and consistency within the same school settings, as well as a need for more trained
programme facilitators. Interventions should also be evaluated to determine their outcomes as
well as the degree to which they are effective in achieving expected outcomes.
Similarly, The Lions-Quest Skills for Adolescence (SFA) is a life skills education programme
which entails a drug prevention programme focus on the prevention and delay of substance
abuse onset in high school. The programme consists of forty sessions and includes components
on self esteem and personal responsibility, communication, peer influence and knowledge and
consequences around substance abuse.
According to Keister (2000), results indicate that exposure to the Skills for Adolescents (SFA)
programme can help deter initiation of regular smoking and marijuana usage, results which held
true across all ethnic groupings in the United States. A study conducted in 34 schools in Detroit,
Lost Angeles and Baltimore found that SFA participants had significantly lower self-reported rates
of using beer, liquor, and chewing tobacco in the previous month in addition to lower predictions
of use of five harmful substances in the next 30 days. The same study indicated that the
respondents’ level of knowledge, awareness and attitudes about the risks of both alcohol and
18
other drug usage improved by 43 percent after participating in the Skills for Adolescents
programme.
Another programme, Project ALERT, is a two year universal programme for school learners that
aim to reduce substance abuse onset. Its focus is on participatory activities, including small
group activities, role playing exercises, guided classroom discussions and videos that assist
learners in establishing anti-substance norms and resist pro-substance pressures. The United
States Department of Education reports that this programme has proven successful with high-and
low-risk youth from a variety of communities, reducing initiation of marijuana usage and current
usage by 30 and 60 percent respectively, and developing significantly enhanced anti-drug beliefs.
Sussman (1996) evaluated the Project Towards No Drug Abuse (Project TND) in the United
States, a heterogeneous intervention that targets high school learners in the form of 12 in-class
sessions that provide motivation, social and self-control skills. The instruction to students
provides cognitive motivation enhancement activities (to not use drugs), detailed information
about the social and health consequences of drug use, and correction of cognitive
misperceptions. Results indicated that the intervention was effective at a one year follow-up
across three true experimental field trials and across variable outcomes.
2. 1.4 Project Background
This document contains the evaluation of a one-day school-based substance abuse prevention
programme. The project constituted part of a large-scale intervention carried out under the
auspices of the Gauteng Department of Education in which various role players took part. The
primary focus was on the evaluation of one of the programmes within the larger intervention.
A multi-disciplinary prevention of high-risk behaviour amongst the youth in secondary schools of
Pretoria West, Laudium and Atteridgeville was initiated by the Greater–Pretoria Child Protection
Committee. It was an initiative combining resources of fifteen organizations, including several
government departments (Health, Education, Welfare and Safety and Security), local
stakeholders such as tertiary institutions (UP, UNISA and Technikon Pretoria) and various non-
profit organizations (NICRO, FAMSA, SANCA, CANSA, NIPILAR, The Traffic Department and
Mental Health). An estimated three hundred and fifty teachers and thirteen thousand learners
from eleven secondary schools in Tshwane were exposed to the intervention in a time frame of
eleven weeks.
The intervention consisted of various components intended to be implemented / sustained for a
three year period. These were:

19
• Implementing a focused one-day school intervention by a team of interdisciplinary
facilitators. A group of facilitators join each class in the school for a whole day and
present a workshop on specific themes (Given in Table 1) to prevent various forms of
high-risk behaviour (primary prevention). The current project forms part of this
programmatic component.
• Establishing a youth self help centre involving two teachers, sixteen interested learners
and two facilitators.
• Establishing small group counselling opportunities (Secondary intervention)
• Providing individual treatment and referral opportunities (Tertiary intervention).Table 1
contains an overview of the broader project.
Table 1: Project Awareness: Basic Outline
Phase 1 Phase 2 Phase 3 Phase 4 Full day inter-disciplinary intervention at secondary schools (1 presenter and teacher per class)
Establishing Youth Self Help Center (Two teachers, 2-3 facilitators, 16 learners per school)
Small group counselling (One Teacher and One facilitator with 5/6 learners)
Individual Treatment
One full day Presentation to whole school (1 presenter per class, 4 hours)
Six general follow up sessions: Drama Strategies to promote Life Skills (1 hr session)
Two sessions Referral to specialist Service Provider
Time Frames
Grade 8:
Sexuality and HIV/Aids; Responsible choices; Problem Solving/Gender
Grade 9:
Planning/Guidance, Environment; Subjects and Career; Decision Making
Grade 10:
Substance Abuse; Peer Pressure; Stress Management; Problem Solving Skills, Cancer (lungs/liver)
Grade 11:
Crime/Violence, Self Awareness; Self Esteem
Themes
Grade 12:
Parenting/abuse; Nurturing/Coping Conflict Management; Problem Solving Skills
FIRST ENCOUNTER
Ice breaker, establish relationship, agreements and ground rules
SECOND ENCOUNTER
Learners reflect on possible problems and solutions
THIRD ENCOUNTER
Acting out possible solutions/reflection
FOURTH ENCOUNTER
Theme expansion; Identify learners for
FIRST ENCOUNTER
More self awareness
Exercises
Reflecting
Counselling
SECOND ENCOUNTER
Sharing and support
Problem Solving
Identify
REFER
Facilitator follow the progress
School support and follow progress
School starts with the next group of learners
Following the same patterns and plans
More teachers get involved
Youth Empowerment Center is an ongoing school activity, 6-8 weeks with one group,

20
PLANNING STAGE FOR FOLLOW UP
Learners indicate that they are interested Teachers identify learners with problems Follow up facilitators choose particular group Other names in other phases kept by Life Skills Teacher for the next follow up sessions
group therapy
FIFTH ENCOUNTER
Rest of the group continues with one teacher, one facilitator
Another scenario – More practice
SIXTH ENCOUNTER
Where do you go from here?
Use newly acquired Skills, Market the club, peer education
and forms part of the school disciplinary system.
Learner with behavioural problems first completes this course before further action is taken
Unfortunately, although the project was planned to continue for 3 years, the intervention ended
after the first phase of the project due to restructuring in the Department of Education. The only
component that was implemented and, eventually evaluated, was the focused school intervention
component. The highlighted area indicates where this project fits into the larger project.
1. 1.5 Focused School Intervention
The focused school intervention focused on providing general information and life skills to
learners at eleven target schools in Pretoria West, Atteridgeville and Laudium. This was intended
as primary prevention of negative behaviours (e.g. substance abuse, high risk sexual behaviour,
crime and high drop out rates) amongst all learners in the school, whether they were exposed to
these psycho-social problems or not. Additionally the focused school intervention was intended to
provide a means for identifying learners in need of secondary intervention such as support groups
and counselling.
The focused school intervention included visits from a team of interdisciplinary experts at each of
the target schools for one day period. During these visits, experts facilitated knowledge and skills
workshops focusing on topics as indicated in Table 1, with all of the learners from a specific grade
attending school on that day. Learners from each grade were exposed to a different topic. The
intervention was implemented according to an implementer’s guide (Appendix A) which was
designed by members of the implementation team. The programmatic content was presented in a
workshop format.

21
Figure 1: Geographic location of Schools taking part in Programme Evaluation
1. 1.6 Evaluation of the Focused School Intervention
Evaluation has come to play an increasingly important role in the operation of education and
social programs. The University of Pretoria was approached to assist with the evaluation of the
Focused School Intervention. This evaluation focused specifically on the evaluation of the grade
ten substance abuse prevention sub-components. This sub-component centred mainly on
knowledge regarding substances, peer pressure, stress management and problem solving skills.
The programme consisted of the following content areas:
• Substance Abuse: knowledge about various substances, effects on the body, danger of
using substances
• Peer Pressure and how to resist peer pressure
• Stress Management: what causes stress for school going youth, how to deal with stress
in constructive ways.
• Problem Solving Skills: steps to solve a problem constructively.
The content was presented in a workshop format involving demonstrations, discussions, case
studies, and role-plays. A video on drug use was also included. The following evaluation aimed to
answer various questions regarding the intervention.

22
• Did learners find the programme sufficiently interesting and topical to allow for the
successful transfer (learning) of the messages contained in the programme, during the
presentation of the programme?
• Were the anti-substance abuse messages (knowledge) of the programme retained by
the learners after the programme?
• Were the learners’ attitudes congruent with the anti-substance abuse messages
transferred by the programme, after the programme?
• Did the learners indicate or report any behavioural change after the programme?
In addition, specific components of the intervention was examined in order to find out which
sections of the programme worked best to facilitate the above mentioned evaluation aims.
Various instruments were designed in order to answer the questions detailed above. A pre-post
behavioural survey (Appendix B) was developed in order to measure any attitudinal, behavioural
and knowledge components of the programme that may have had an impact on learners.
Additionally, programmatic content, presentation and learner involvement were tracked by means
of an observational data collection sheet (Appendix C), followed up by focus groups (Appendix D)
conducted in conjunction with the administration of the post- behavioural survey.
In chapter two an outline will be given around the theoretical models used to ground the
evaluation; detailing the Kirkpatrick Model and its associated levels of measurement, the Health
Belief Model, the Theory of Reasoned Action as well as the theory of Planned Behaviour. Chapter
three will describe the methodology used to measure the outcomes of the intervention, while
chapter four will detail the findings. Chapter five will round off the evaluation with a discussion of
the evaluation as a whole and to interpret the data in terms of the theoretical approach and other
research findings.

Chapter 2 Theoretical Models
1. 2.1 Introduction
This chapter will describe the various theoretical models that were utilised in conjunction with
data gathered during this project. Each theoretical model will be reviewed in terms of its
successes and shortfalls in relation to programme evaluation, and related to the intervention
being evaluated in this document.
Reeves and Hedberg (2003) is of the opinion that there seems to be no single correct approach
for conducting a programme evaluation. There seems to be no clearly defined criterion for
choosing any particular theories to inform interventions, and a wide range of theories exists with
substantial overlap in terms of constructs (Fishbein, Triandis, Kanfer, Becker, Middlestadt &
Eichler, 2001; Nigg, Allegrane & Ory, 2002). Researchers typically choose an appropriate
methodology to fit the pragmatic requirements and practical constraints of each intervention,
rather than being guided by one particular model or approach.
For the purpose of this evaluation, the Strategic Training Model, also known as the Kirkpatrick
Model was used as a theoretical framework. In addition, the two social cognition models of
Health Belief, augmented by the Theory of Reasoned Action, as well as the Theory of Planned
Behaviour, were used to interpret the outcome of the programme evaluation.
1. 2.2 The Kirkpatrick Model
The Kirkpatrick Model was developed by Donald Kirkpatrick and has been used as an evaluation
model since the late 1950’s. The Kirkpatrick model postulates that there are four levels of
outcomes that could result from an intervention, and therefore an evaluation could focus on any
or all of these four levels (Reeves & Hedberg, 2003). Kirkpatrick (1976) believed that in order to
evaluate training programmes, four measurements must be taken, however, Kirkpatrick revisited
(1996) points out that “the model doesn’t provide details on how to implement all four levels. Its
main purpose is to clarify the meaning of evaluation, and offer guidelines on how to get started
and proceed” (p. 223).
Learner’s experience of the intervention, either positive or negative (reaction), knowledge and
skills gained by the learners (learning); any improvement to the learner’s skills (behaviour); and
24
impact on the organization, or in this case society (results) must be measured and evaluated.
Admittedly, Kirkpatrick’s model was intended for an industrial setting, but there are many parallels
between his idea of training and the training of learners in life skills based interventions (Alliger &
Janak, 1989). Clark (2003) summarized the levels of the Kirkpatrick Model as follows:
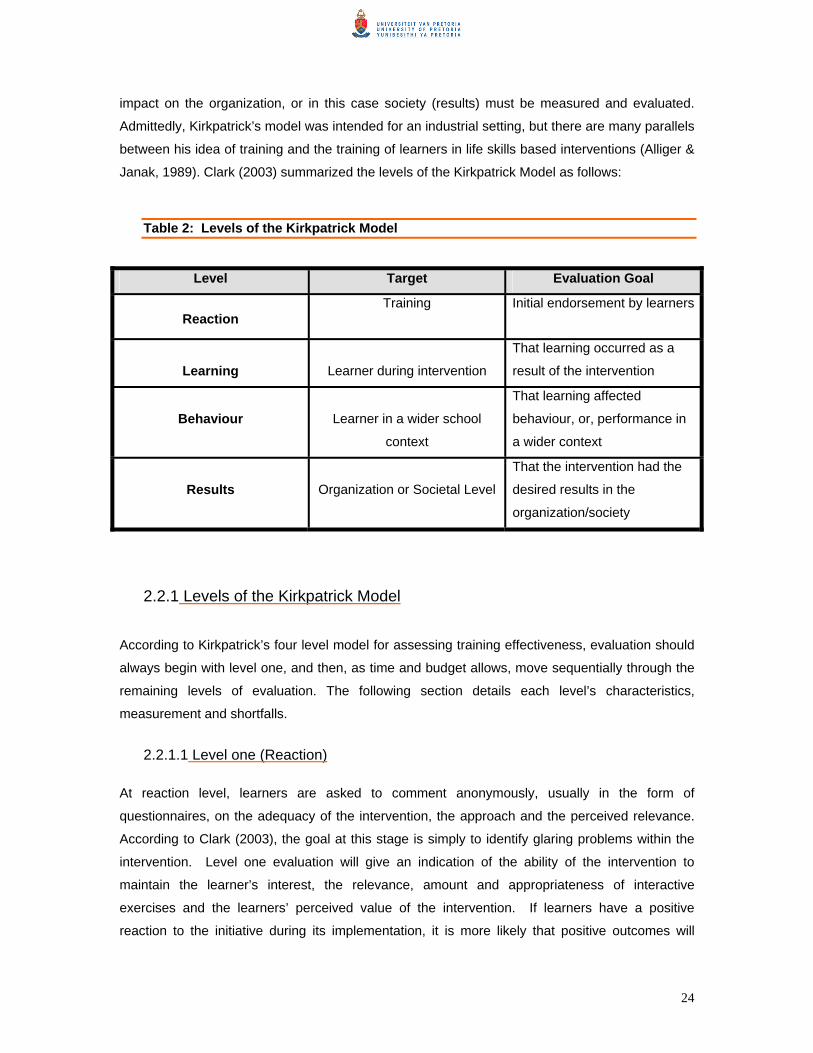
Table 2: Levels of the Kirkpatrick Model
Level Target Evaluation Goal
Reaction Training Initial endorsement by learners
Learning
Learner during intervention
That learning occurred as a
result of the intervention
Behaviour
Learner in a wider school
context
That learning affected
behaviour, or, performance in
a wider context
Results
Organization or Societal Level
That the intervention had the
desired results in the
organization/society
1. 2.2.1 Levels of the Kirkpatrick Model
According to Kirkpatrick’s four level model for assessing training effectiveness, evaluation should
always begin with level one, and then, as time and budget allows, move sequentially through the
remaining levels of evaluation. The following section details each level’s characteristics,
measurement and shortfalls.
1. 2.2.1.1 Level one (Reaction) At reaction level, learners are asked to comment anonymously, usually in the form of
questionnaires, on the adequacy of the intervention, the approach and the perceived relevance.
According to Clark (2003), the goal at this stage is simply to identify glaring problems within the
intervention. Level one evaluation will give an indication of the ability of the intervention to
maintain the learner’s interest, the relevance, amount and appropriateness of interactive
exercises and the learners’ perceived value of the intervention. If learners have a positive
reaction to the initiative during its implementation, it is more likely that positive outcomes will

25
result . Level one is perhaps the most frequently used measurement because it is the easiest to
measure.
According to Clementz (2003), the questions asked on level one are related to:
o Presentation techniques
o How thoroughly the topic was covered
o The value of each module of the program
o Relevance of the program content
o How learners plan to use their new skills in a wider context
According to Kirkpatrick (1994), at the very least, each programme should be evaluated at this
level. In addition, learner’s reactions have important consequences for learning (level two). Level
one measures how worthwhile and enjoyable the intervention was to the learners. Predicated on
the premises that learners can learn only in a positive environment, level one evaluation is easy
to obtain and is painless for participants (Alliger & Janak, 1989; p.333).
Measurement on Level One Clark (2003) offers several guidelines on the assessment of level one goal. He suggests that no
more than fifteen to twenty questions, designed to obtain both qualitative and quantitative data,
should be included in a survey measurement for level one evaluation. In addition, he suggests
that:
• Most survey questions should be ranked on a quantitative scale, with only two or three
open ended (qualitative) questions.
• Data gathered should be tracked over time, comparing trainers and other variables so
that it is easier to isolate causes and view trends. This assists in determining what actions
are appropriate to improve the intervention accordingly.
• Evaluation results should be compared over all four levels in order to determine
relationships.
The most commonly used method of level one evaluation is the so-called “smiley sheets”
completed by learners after the completion of the programme. In their simplest form, they
measure how well learners liked the training. According to Kruse (2003), this type of evaluation
can reveal valuable data if the questions asked are more complex, including the relevance of the
programme objectives, the ability of the course to maintain interest, the amount and
appropriateness of any interactive exercises and the perceived value of the information conveyed
by the intervention.

26
Limitations of Level One
This level is not indicative of the intervention’s success, as it does not truly measure what new
skills the learners have acquired or what they have learned and can transfer to a wider context.
This has caused some evaluators (Clark, 2003) to downplay its value. However, it seems that the
interest, attention and motivation of the learners are critical to the success of any intervention.
In addition, level one research has reportedly shown relatively little correlation between learner
reactions and measures of learning, or subsequent measures of changed behaviour. Criticism of
level one includes that it is too simple and that it does not take into account the various
intervening variables affecting learning and information transfer. Kirkpatrick’s emphasis on self-
reporting measures at level one is often viewed as being negative. In contradiction with level
one’s premise that learner satisfaction is a forerunner to the learning process, there have been
suggestions that “satisfaction” is not necessarily related to good learning, and that discomfort is
sometimes essential in the learning process.
2.2.1.2 Level Two (Learning)
The extents to which learners change their attitudes, improve knowledge and increase skill as a
result of participating in the intervention are varying measures at level two. The learning
evaluation requires a post-testing to ascertain what skills were learnt during the intervention. The
post-test is only valid when combined with pre-testing, so that the researcher can differentiate
between existing knowledge and information learnt during the programme. Blanchard and
Thacker (1999) believe that on level two there is usually a critical relationship between an
identified learning need and the evaluation. The typical level-two evaluation focuses on questions
such as:
• What knowledge did the learners acquire as a result of the intervention?
• What skills were developed or enhanced as a result of the programme?
• What attitudes were changed as a result of participation in the intervention?
Assessment of learning is not exclusively confined to level two, and can be implemented
throughout the intervention, using a variety of evaluation techniques. Pre- and post measures are
often utilised to determine the retention of knowledge, along with observational data and
interviews. Measurement at level two might indicate that an intervention’s instructional methods
are effective or ineffective.

27
Limitations of Level Two Caution must be urged in interpreting data obtained on level two as an absolute measure of
acquired skills and knowledge. Learners might be able to repeat but not apply the knowledge.
Performance during or very shortly after a programme is not necessarily a predictor of post-
training performance.
2.2.1.3 Level Three ( Behaviour)
Many researchers believe that the third level of evaluation represents the truest assessment of an
intervention’s effectiveness (Clark, 2003). However, measuring at this level is usually difficult as
it is often impossible to predict when the change in behaviour will occur. This requires important
decisions in terms of when, how and how often to evaluate.
Level three measures the extent to which behavioural change, or the ability to transfer learnt
information into action, has occurred because of programme participation. Evaluation can be
conducted formally (testing) or informally (observation). The measurement of behaviour is
important because the primary purpose of the intervention is to improve results through
behavioural change (in this case skills, knowledge, behaviour and attitude). Simply put, level-
three evaluation attempts to answer the following question: Are the newly acquired skills,
knowledge and attitudes being used or transferred in the learner’s everyday environment?
Boverie, Sanchez-Mulcahy and Zondle (1994) suggested ten guidelines for designing training that
ensures transfer. Five of these guidelines relate to education, and should be considered when
analyzing the evaluation results and reporting to stakeholders:
• Consider transfer as an objective of the unit of study, thus objectives are not met until
transfer has taken place;
• A plan of transfer should be built into the unit of study from the outset;
• The learning environment must provide positive incentives to apply knowledge and
understanding gained in the unit of study;
• Use specific topics that are relevant and related to the learner’s environment; and
• Ensure that intervention learning activities clearly match the situation in which learners
will apply skills in future.
According to Clark (2003), learners typically score well on post-tests, but the real question is
whether any of the new knowledge and skills are retained and transferred back into a wider

28
context. Level three evaluations attempt to answer whether or not learner’s behaviour actually
change as a result of new learning.
Level three evaluation is usually conducted at predetermined intervals. Kirkpatrick (1976)
recommended that a post-test be conducted between three to six months after the intervention.
By allowing some time to pass, students have the opportunity to implement new skills and
retention rates can be checked. Reeves and Hedberg (2003) cautioned against placing too much
emphasis on one evaluation strategy and advocated collecting data from multiple sources using
multiple methods on levels two and three. In their experience, results were often influenced by
many factors other than the training.
Limitations of Level Three There are a wealth of studies that comment on the failure of training to transfer into trainees own
context, and which have identified a range of organizational factors that inhibit transfer.
According to Kirkpatrick (1976), important factors relating to transfer are perceived usefulness,
job autonomy and commitment. In addition, individual factors also play a role, including self-
efficacy, motivation to learn and general levels of intelligence. Evaluation needs to become more
complex. It is suggested that manager assessment or self-assessment needs to be conducted,
but these methods are not always accurate.
2.2.1.4 Level Four (Results)
Level four moves away from the impact on the individual and looks at an organizational or
community level. Level four evaluations look at the learners’ ability to apply learned skills to new
and unfamiliar situations. Clark (2003) described it as evaluation being expanded beyond the
impact on the learners. The focus broadens the impact of the intervention on the wider
community (results) – in other words, on how the training influenced the whole context. For
example: what changes took place in the broader community because of the intervention.
Training effectiveness is measured on this level – whether the training is working and yielding
value on an organizational level – and measures impacts including legal action, efficiency,
morale, teamwork and reduced errors.
Collecting and analyzing data on level four is widely regarded as very difficult, time consuming
and costly. As we move from level one to four the process becomes more difficult although it
seems to provide data of increasing significant value. It is suggested that each level should be
used to provide a cross set of data for measuring a training programme.

29
Limitations of Level Four Level four measures the success of the programme from a business and organizational point of
view, yet this level is not often addressed by researchers (Kirkpatrick, 1994). Determining results
in financial terms or in terms of community processes are difficult to measure and to relate
directly to the training. Alliger and Janak (1989) reported that at best, level four evaluations yield
only a likelihood that training could have affected the organization or community processes.
In addition, Burrow and Berardinelli (2003) argued that level four evaluations are never pure; both
because of the time interval between interventions and measurement, and because of the broad
focus, other factors can influence these outcomes.
Is the Kirkpatrick model hierarchical? The Kirkpatrick model has often been interpreted as four hierarchical levels that researchers go
through in the evaluation process. Bernthal (1995) however, questioned the existence of a
hierarchy of superiority within the model, and argued that “each level can provide equally valuable
information depending on the type of trainees being evaluated”.
Blanchard and Thacker (1999) argued that the four levels of evaluation are ordered - reaction
outcomes come first and will influence how much will be learned. The skills developed as a
learning outcome determine how much behaviour can change concerning the job. In turn,
behaviour on the job determines how much organizational impact the training had overall.
Hesketh and Ivancic (2001) however, questioned the notion of there being any significant causal
connection between the four levels. Tamkin, Yarnall and Kerrin (2002) also criticized the implied
hierarchy of the four levels, claiming that the assumption that levels are each associated to the
previous and next level implies a causal relationship that has not always been established by
researchers.
It is clear that there are a number of contradicting opinions regarding the connection and
interrelation of the four evaluation levels of the Kirkpatrick model. As mentioned earlier,
Kirkpatrick (1996) held that the model’s chief purpose is to clarify the meaning of evaluation and
offer guidelines on how to get started and proceed. Therefore, although Kirkpatrick’s four level
model was chosen as a guide for the evaluation of this project, it was decided to slightly adapt it
to suit the educational environment and the evaluation needs of the intervention.
30
Concisely, levels to be interpreted in this research project are: Level one (Reaction)
Level one measures student satisfaction, assessed through questionnaire, field observation and
focus group discussions. The data gathered here is usually used as a guide for modification of
and the enhancement of teaching material, aimed at improving the student learning experience.
Level two (Learning)
Level two assessment uses pre- and post-tests, observations, and focus group data to access the
skills and knowledge gained during the intervention. Pre- and post behavioural, attitudinal and
behavioural changes were self-reported by means of a questionnaire for the purposes of this
study.
Level three (Transfer)
Level three refers to a certain measure of knowledge skills and understanding gained in the
intervention. Level three evaluations attempt to answer whether or not learner’s behaviours
actually change as a result of new learning gained during the intervention. Kirkpatrick (1996)
recommended pre-and post-test measures to determine the level of transfer that has taken place.
A section pertaining to self-reported behaviour, along with focus group discussions were used to
determine whether any knowledge and skills transferred during the intervention was retained and
subsequently used.
Level four (Results)
Level four represents the dissemination and value of the training to the organization or
community, a measure of cost effectiveness and organizational benefits, such as:
• Whether the programme meet the long and short term goals of the training, and
• Whether the intervention produced the results the organizers expected.
For the purpose of this study, no specific measurements were taken for level four. Secondary
data, including observation, learner satisfaction, student retention and level of learner
participation were utilised.

31
2.2 Value and limitations of the Kirkpatrick Model Despite the popularity of Kirkpatrick’s model, several researchers have commented on the lack of
completeness of the model. Alliger, Tannenbaum, Bennett, Traver and Shotland (1997) asserted
that level two (learning) should be subdivided into learning that occurs immediately following the
intervention and learning that occurs after a period of time. In addition, they believe that level
three (behaviour) should be classified as transfer of training/learning.
There is some difficulty in trying to use the four levels to determine where a problem exists with a
given educational programme. Holton (1996) proposes a new model of training evaluation that,
unlike Kirkpatrick’s four level system, will account for the impact of the primary intervening
variables such as motivation to learn, trainability, personal characteristics and transfer of training
conditions. Despite the Kirkpatrick model’s limitations, it offers an elegant simplicity that lends
itself well towards a programme-model fit for the purpose of this study.
2.3 The Health Belief Model
The Health Belief Model is a value expectancy model, which holds beliefs and values at its core,
and was developed as a means to explain and predict preventive health behaviour. It is valuable
in ascertaining learner’s perceived susceptibility towards substance abuse and provides important
information regarding behavioural cues, whether present or future driven. The model is a good fit
for prevention-focused programmes like the one described in this study, because prevention
programmes usually promote specific actions, and the Health Belief Model assists in
understanding the possible factors that influence these action or behaviour.
“It is now believed that individuals will take action if they regard themselves as susceptible, if they believe there are potentially serious consequences, if they belief that a course of action available to them would be beneficial in reducing either their susceptibility to or the severity of the condition, and if they believe that the anticipated barriers to taking the action are outweighed by their benefits” - I.M. Rosenstock (1990).

32
2.3.1 Definition and Rationale of the Health Belief Model
The Health Belief model was originally devised by a group of United States Public Health social
scientists to explain how health educators could encourage preventive health behaviour
(Rosenstock, 1974). One of the most widely used conceptual frameworks for the understanding
of health behaviour, the model seeks to explain the link between exposure to persuasive health
messages and behaviour. Based on cognitive behavioural theory, the model hinges on the
learner’s desire to be healthy, the personal value he or she places on a particular health goal, and
what he or she thinks is the likelihood of achieving that goal (Janz & Becker, 1984). The Health Belief Model is based on the core assumption that an individual will take health
related action (e.g. not smoke), if the learner feels that a negative health condition (for example
lung cancer) can be avoided, and if he or she has a positive expectation that by taking action, he
or she can avoid the negative health condition. In addition, the individual must believe that he or
she can successfully take a recommended health action.
As some learners may already be smoking and drinking, changes in behaviour may occur to
prevent illness if a learner sees himself as being at risk (perceived susceptibility), or if he believes
that it will have a serious impact on aspects of his life (perceived severity). Learners should also
believe that specific behaviour would prevent substance abuse and that they will benefit from
such behaviour. Botvin, Gilbert and Botvin (1992) reported a progression in the type of drug(s)
used over a period of time. So-called gateway substances such as alcohol and tobacco are
usually the first substances that are abused, partially due to their wide availability within the
community. Later, a percentage of these youth graduate to cannabis and over-the-counter
medication, and some eventually go on to use stimulants, opiates and other illicit substances.
For adolescents not yet experimenting with substances, the consequences of substance abuse
(perceived severity) should prevent them from abuse onset.
The positive results from the new behaviour (perceived chances of success) should be rated
higher in the minds of the learners than the cost or negative aspects (perceived chances of failure
and cost) of the new behaviour. There should also be something that motivates the onset of the
behavioural change, like an intense experience or seeing someone with a drug problem.
A person’s perception of his/her risk of being affected by abusing substances, (e.g. lung cancer)
is referred to as perceived susceptibility. This is one of the most important components in
predicting behaviour change. Only when a person sees her- or himself as being at risk will
he/she take precautions to prevent it. The intervention sends a clear message that substance
abuse is not necessarily something that only happens to others, it can to anyone.

33
Perceived severity involves the learner’s belief that substance use or abuse will have a serious
impact on aspects of his or her life - that it is a real threat to him/her. The person’s perception of
the severity of substance abuse can be measured by his or her emotional reaction to the
consequences of substance abuse and how he/she thinks it will affect their lives. Behaviour and
attitude both have cognitive and affective components. Extreme scare and shock tactics,
however, tend to inhibit learning and consequential behavioural change and should be avoided.
If perceived benefits are more than the costs, the learner will be more likely to engage in
preventive behaviour. Emphasis on the benefits of behavioural change is important in the
planning of any intervention. The perceived costs of changing behaviour are the most important
obstacle, because in the case of substance abuse it relates to both physical and psychological
needs. The substance abuse -intervention focuses on the costs of both these needs, highlighting
the negative outcomes on both the mind and body.
The situation is complicated by norms and values, which may lead to ambivalent attitudes, for
example, the fact that dagga is considered a medicinal substance in some cultures, but is
classified as a prohibited substance, in others. The decision to engage in high risk-behaviour is
also influenced by peer norms in many ways. It is strongly linked to social acceptance, and
complicates the promotion of socially responsible behaviour. Misconceptions and myths (i.e.
drugs are not habitual) also have to be addressed in order to underline the perceived (and often
hidden) costs of substance abuse. Traditional stereotypes (for example macho men advertising
cigarettes) and stigmatisation (drugs only affect a certain segment of the population) also need to
be addressed.
The focus of this study is the evaluation of a school-based prevention programme in order to
determine its effectiveness. The Health Belief Model and its constructs are used in an attempt to
predict intended behavioural change.
According to this model, changes in behaviour depend on five factors:
1. Perceived severity---the belief that a health problem is serious
2. Perceived threat---the belief that one is susceptible to the problem
3. Perceived benefit---the belief that changing one's behaviour will reduce the threat
4. Perceived barriers---a perception of the obstacles to changing one's behaviour
5. Self efficacy---the belief that one has the ability to change one's behaviour

34
Marlatt, Baer and Quigley (1994) proposed five categories of self-efficacy that are related to
stages of motivation and prevention, of which the first one is particularly relevant for the purposes
of this study:
• Primary and Secondary Prevention
(a) Resistance Self-Efficacy
(b) Harm-Reduction Self-Efficacy
• Self-Change, Treatment, and Relapse Prevention
(c) Action Self-Efficacy
(d) Coping Self-Efficacy
(e) Recovery Self-Efficacy
Resistance Self-Efficacy relates to the confidence of learner’s abilities to avoid the onset of
substance abuse. It implies resistance against peer pressure. It has been repeatedly found that
the combination of peer pressure and low self-efficacy predicts the onset of smoking and
substance use in adolescents (Conrad, Flay & Hill, 1992). With these findings in mind, one would
expect that the training of resistance skills would raise resistance self-efficacy, which in turn
would reduce future substance use.
It is important to note that avoiding a negative health consequence is a key element of the Health
Belief Model. For example, a learner might stop smoking in order to save some money. That
example does not fit the model because the learner is not motivated by a negative health
outcome — even though the health action of the non-smoking learner is the same as for the
individual who wants to save money by buying fewer cigarettes.
2.3.2 Values and limitations of the Health Belief Model
Regis (1990) believed that the Health Belief Model assumes that all the most relevant aspects of
behaviour are health-related. He postulates that this model may possibly not be generalized to
other types of behaviours. Another issue that has plagued the Health Belief Model, is a lack of
question conformity. Different questions are used in different studies to determine the same
beliefs; consequently, it is difficult to compare results across studies. Additionally, factors other
than health beliefs influence health behavioural practices, such as cultural- and socio-economic
factors and previous experiences.

35
However, the Health Belief Model stands out among psychosocial models in its particular relation
to individual decision making, and is often utilitised because of its predictive value. Calnan and
Moss (1984) argue that the Health Belief Model is supported by a myriad of empirical evidence in
which data on behaviour and beliefs were simultaneously collected. In further support of the
model, it has various applications in the field of health education, namely:
• Provides incentives to take action
• Enhancing learner’s feelings of competency to take action
• Provides clear courses of action at an acceptable cost.
In conclusion, the Health Belief Model (figure 2) provides insights into the reasons why individuals
make health decisions and creates a process of encouraging and facilitating change. It was
decided to combine the Health Belief Model with other learning and change theories that offer
more specific guidelines on other aspects of the study.
2.4 The Theory of Reasoned Action
Ajzen and Fishbein formulated their theory for reasoned action (TRA) in the late seventies after
trying to estimate discrepancy between attitude and behaviour. The theory was developed to
predict and explain social relevance that is under a person’s voluntary control.
The approach to behaviour that Ajzen and Fishbein proposed centers on the notion of “reasoned
action”. They maintained that people are essentially rational, in that they "make systematic use of
information available to them" and are not "controlled by unconscious motives or overpowering
desires", neither is their behaviour "capricious or thoughtless" (Fishbein & Ajzen, 1975:15). Thus,
the theory is based on the learner’s intent to perform certain behaviour.

36
Figure 2: The Health Belief Model (Regis, 1990)
Motivations Includes habits and
intentions
Value of Illness Threat
Reduction Perceived susceptibility
Perceived Severity
Probability that complaint behaviour
will reduce threat Including disadvantages
of compliance
Modifying and Enabling Factors
Likelihood of e.g. compliance with recommendations

37
According to the theory of reasoned action, behavioural intention is the most immediate
determinant of any social behaviour, but only under conditions where the behaviour in question is
under volitional control and behavioural intention remains unchanged. The theory proposes that
an individual’s intention is determined, in turn, by two significant factors: his or her attitude, and
subjective norm regarding the performance of the behaviour.
• The learner’s attitude towards the behaviour is accounted for by beliefs about the
outcomes of the behaviour, and evaluations of those outcomes.
• The subjective norm is determined by perceived pressure from significant others (for
example the learner’s peers) to carry out the behaviour and motivation to comply with the
wishes with those significant others.
Marcoux and Shope (1997) indicated that literature on substance usage suggested that attitudes
towards alcohol use, normative influences and intention to use alcohol are important predictors of
adolescent alcohol use. According to Ajzen and Fishbein (1980), external factors to the model
will indirectly influence the behaviour through the model components. Situational factors such as
physical location, the presence of peers and thoughts and feelings about substance usage are
likely to be important in the learner’s decision to use substances. According to Morojele and Stephenson (1994) many studies have successfully applied the theory
of reasoned action, or variations of it, in the prediction of intentions to perform versus actual
performance of behaviours commonly associated with addictions such as drinking, smoking and
substance usage. The theory of Reasoned Action, despite its limitations, remains the most
widely used theory of motivation and seems most suitable for an examination of the motives that
lie behind smoking and drinking. It measures mostly cognitive elements that might be supposed
to be of relevance. Regis (1990) believed that this theory might provide a convenient non-
experimental vehicle for the examination of the relative importance of attitudinal and normative
considerations in determining the behaviour of young people.
Regis (1990) notes that Fishbein and Ajzen are to be commended for coming up with a way of
looking at action, which is apparently very basic and yet seems to work in a wide variety of
contexts.
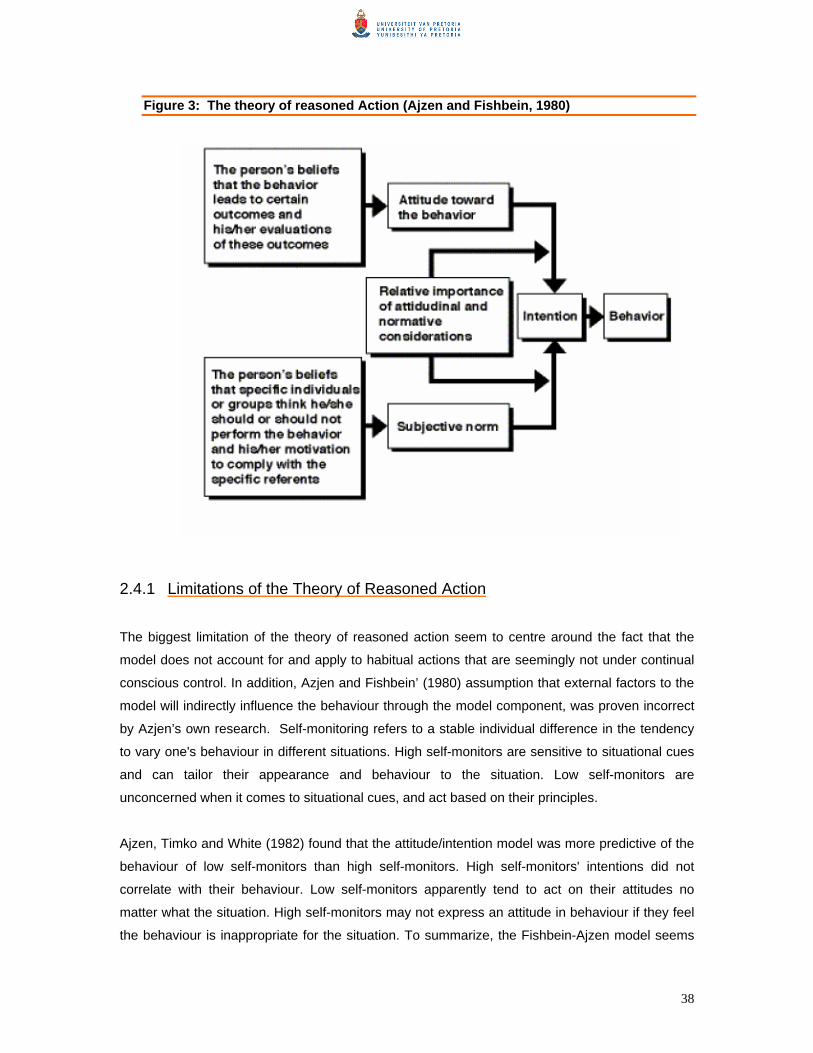
38
Figure 3: The theory of reasoned Action (Ajzen and Fishbein, 1980)
2.4.1 Limitations of the Theory of Reasoned Action
The biggest limitation of the theory of reasoned action seem to centre around the fact that the
model does not account for and apply to habitual actions that are seemingly not under continual
conscious control. In addition, Azjen and Fishbein’ (1980) assumption that external factors to the
model will indirectly influence the behaviour through the model component, was proven incorrect
by Azjen’s own research. Self-monitoring refers to a stable individual difference in the tendency
to vary one's behaviour in different situations. High self-monitors are sensitive to situational cues
and can tailor their appearance and behaviour to the situation. Low self-monitors are
unconcerned when it comes to situational cues, and act based on their principles.
Ajzen, Timko and White (1982) found that the attitude/intention model was more predictive of the
behaviour of low self-monitors than high self-monitors. High self-monitors' intentions did not
correlate with their behaviour. Low self-monitors apparently tend to act on their attitudes no
matter what the situation. High self-monitors may not express an attitude in behaviour if they feel
the behaviour is inappropriate for the situation. To summarize, the Fishbein-Ajzen model seems

39
to work better for low self-monitors because these people are more likely to translate their
attitudes into behaviour across a variety of situations.
A further criticism is that the model seems to rely too heavily on self-reported data. Self-reports
may vary with individual attitudes. Learners with more positive attitudes may report more positive
actions than actually performed, and vice versa. However, it soon became clear that some
important limitations on the theory's domain, required that additional variables would need to be
included, and that the theory was perhaps better understood as taxonomy, as opposed to an
explanatory system. This lead to Ajzen’s (1987) updated version of the theory of reasoned action
called the theory of planned behaviour.
2.5 The theory of Planned Behaviour
In view of the Theory of Reasoned Action’s inability to account for involuntary behaviour, Ajzen
developed the Theory of Planned Behaviour to include the perceived behavioural control
component. The Theory of Planned Behaviour is thus an extension of the Theory of Reasoned
Action. According to the Theory of Planned Action (figure 4), behaviour is guided by three
considerations:
• Behavioural Beliefs (beliefs about the likely consequences of behaviour).
• Normative Beliefs (beliefs about the normative expectations of others).
• Control Beliefs (beliefs about the presence of factors that may facilitate or impede
performance of the behaviour). The concept of perceived behavioural control is similar to
the concept of self-efficacy in the Health Belief Model – the person’s perception of his or
her ability to perform the behaviour.
Behavioural beliefs result in a positive or negative attitude toward the behaviour, while normative
beliefs result in perceived social pressure or subjective norm. Control Beliefs lead to perceived
behavioural control. In combination, attitude towards behaviour, subjective norm and the
perception of behavioural control leads to the formation of behavioural intent. With the exclusion
of the Theory of Reasoned Action’s inability to account for involuntary behaviour, all its other
limitations are present in the Theory of Planned Behaviour.

40
Figure 4: The Theory of Planned Behaviour (Ajzen, 1991)
The theoretical models described in this chapter were chosen on the bases of theory-model fit. In
conjunction each model explains aspects of the evaluation conducted for the purpose of this
study; lessening some of the limitations described in this chapter for each of these models. Each
of these models builds on the strengths of its counterpart, assisting in framing the analysis within
a behavioural and psychosocial context.
2.6 Conclusion This chapter described the theoretical approaches in relation to the prevention of substance
abuse. Having discussed the theoretical review with relevant information in this chapter, the
following chapter will discuss the research methodology that was utilised for the purposes of this
study.

41
Chapter 3 Methodology Research methodology defines what the activity of the research is, how to proceed, how to
measure progress or outcomes, and what constitutes as success. In many ways, methodology
refers to more than a simple set of methods. It refers to the rationale that underlies a specific
study. This chapter will describe the hypothesis, research methods and procedures followed in
conducting the study, including data collection techniques, instruments used, sampling and
analysis.
2 3.1 Research questions and hypothesis statement
In order to ascertain whether any intervention programme was effective, Arthur and Blitz (2000)
are of the opinion that one might consider how well the outcomes of the programme reflects the
goals and objectives of the programme, in addition to how the process contributed towards these
elements. As touched on in Chapter 1, the objectives and goals of the programme could be
outlined as follow:
Objectives: • The programme attempted to convey knowledge about the abuse of substances such as
alcohol, tobacco, cannabis and other drugs
• It attempted to change attitudes regarding the use of the named substances to such an
extent that drug abuse is seen as negative by means of discussions on the possible
outcomes of drug abuse.
• It attempted to teach learners skills to cope with peer pressure by means of role-plays.
Goals • As a general goal, the programme attempted to protect, empower and support the
learners in the involved teaching district.
• More specifically the programme aimed to change and prevent high-risk behaviour and the pattern of substance abuse amongst grade ten learners.
A concise statement of the research question based on the above mentioned goals and
objectives would then be:
42
Research Question 1: “Was the drug prevention programme in Project Awareness effective in
dispersion of skills and knowledge to the extent that grade 10 learners - in the traditionally
disadvantaged areas of Tshwane - changed their attitudes regarding substance abuse in such a
way that this form of high-risk behaviour could be prevented?”
Hypothesis 1: The bivariate relationship between self-reported knowledge, skills, behaviour and
attitude (respectively), and the intervention, will be positive and significant.
Research Question 2: Are there any significant differences between demographic indicators
(age and/or gender) and self-reported reported knowledge, skills, behaviour and attitude
(respectively) that may require a more targeted prevention intervention strategy in future.
Hypothesis 2: The bivariate relationship between self-reported skills, behaviour and attitude
(respectively), and gender as well as age will be significant and positive.
3 3.2 Data collection techniques
The focused school intervention included visits from a team of interdisciplinary experts at eleven
Tshwane schools for one day. During these visits, experts facilitated knowledge and skills
workshops focusing on specific grade-assigned topics, with all of the learners from a specific
grade attending school on that day. For the purpose of this study it was decided to focus on the
grade ten substance abuse prevention components. Presenters were randomly assigned to a
grade ten class at each school where they followed a predetermined programme as outlined in a
presenter’s manual (Appendix 1).
The development of community-based interventions for the prevention of substance use and
abuse calls for careful evaluation (Hansen & Kaftarian, 1994). With more refined evaluation
methods, it will be possible to identify characteristics of successful interventions as well as
common challenges in the design and implementation of school-based interventions.
Three data collection techniques were used, and will mainly be discussed as they relate to each
level of the Kirkpatrick Model, aspects of the Health Belief Model and the Theory of Reasoned
Action. The interrelatedness of especially the four evaluation levels in the Kirkpatrick Model
allowed for the relevance of the focus group discussion and learner survey data on more than
one level of evaluation.
• Level 1: Focus group discussions and classroom observation schedules
• Level 2: Learner survey

43
• Level 3: Learner survey and focus group discussions
2 3.2.1 Level 1 —Reaction
Level one postulates that if learners have a positive reaction to the initiative during its
implementation, it is more likely that positive outcomes will result. Classroom observation
schedules were used to determine the learner’s reactions to the initiative during its
implementation. The ability of the intervention to maintain interest was linked to the learner’s
behaviour; judged according to task- or non-task involved behaviour or activities. The classroom
observation schedule will be discussed in section 3.2.1 of this document.
2 3.2.2 Level 2 —Learning
Kirkpatrick proposed that if the learners are able to learn and retain the messages conveyed in
the intervention, it is more likely that positive outcomes will result. For the purpose of level two
and to a certain extent level three evaluation, a pre- and post-measure Learner Survey was
implemented in an attempt to assess learner’s skills, attitude and knowledge levels before and
after the intervention.
The Learner survey (Appendix B) measured knowledge (Items 8 and 9), attitude (Questions 3
through 7) and skills (Items 8 and 9). The survey was administered the morning before the
project was implemented at a specific school. The same questionnaire was then conducted
again about one month after the learners were exposed to the programme, in order for any
probable behavioural or attitudinal change to be measured. Additionally, focus group discussions
were conducted one-and-a-half months after the intervention to assess the learner’s perceived
value and transferability of skills learnt during the programme to new and unfamiliar situations.
2 3.2.3 Level 3 —Behaviour
According to Kirkpatrick (1976), level three evaluation attempts to measure the transfer of
learning to a wider context of behaviour. The sections pertaining to self-reported behaviour in the
post learner survey (items 2.1 to 2.15), along with the focus group discussions were used to
determine whether the knowledge and skills learnt during the intervention was retained and put
into action. Clark (2003) believed that this level of evaluation represents the truest assessment of
a course’s effectiveness.

44
2 3.2.4 Level 4 —Results
The extent to which the learners applied the information and skills acquired during the
intervention to a wider behavioural context, and the impact on the context, was not determined in
this study.
3.3 Data collection instruments
The following section will describe the various data collection instruments and the rationale
behind the design of each.
3.3.1 Classroom Observation Schedule
Field workers systematically watched learners’ reaction and programmatic events to gather more
information about behaviour and interaction during programme delivery. According to Mays and
Pope (2006) such observations epitomises the idea of the researcher as the actual research
instrument in a natural setting (naturalistic research). Mays and Pope (2006) further elaborated
that observational data gathering measures have several advantages that can assist in
overcoming any discrepancies between self-reported behaviour. It was decided to build in an
observational component primarily to circumvent the inherent biases normally associated with
self-reported behaviour, such as faking good or bad responses, especially amongst adolescent
learners in a school based environment. Furthermore, observational methods are well suited to
uncover behaviours or routines of which the learners and presenters alike may be unaware of
themselves.
Kelleher (1993) believed that observation offer several other advantages. Observation forces the
observer to familiarize him- or herself with the learners, while allowing previously unnoticed or
ignored aspects to be documented and included as data. Kellehear (1993) further states that
people’s actions are probably much more telling than their verbal accounts, and therefore
unobtrusive observation becomes very valuable. With this in mind, in order to determine whether
the programme was able to retain the learner’s attention, learners were observed during the
presentation of the programme.
The implementation assessment (programme monitoring) attempted to determine whether the
programme was able to grasp the learner’s attention and which part of the programme or what
activity of the presenter caused them to loose or keep interest. The objective of the observation
was:
45
• To determine which parts of the programme and content was effective or was not effective
• To determine the learners’ degree of engagement at various stages of the intervention
• To record any errors pointed out or confusion encountered in the intervention, and the
response of the presenters to these challenges.
The selection for suitably experienced field workers commenced well in advance. Several
candidates were screened for interest and basic qualifications for the position (in this case
Honours Psychology students.) All candidates who passed the initial paper selection were then
interviewed. The interviews culminated in the hiring and training of four observers in addition to
two researchers, who were chosen on the grounds of previous fieldwork, research and data
collection experience. As far as was possible, fieldworkers were encouraged to record exactly
what happened during the programme, including any relevant observations regarding the
implementation of the programme activities.
Observation sheets were designed to measure the learner’s task involvement or disinterest in the
programme’s content (Appendix C), and observations took place on two levels. Firstly, the
involvement behaviour of learners during the presentation of the programme (quantitatively)
involved field workers (observers) that where then tasked to each judge a specific group of
learner’s task involvement according to specific time intervals (every 5 minutes) during the
presentation of the programme. Task- involved behaviour included the level of facilitator-learner
interaction, task participation and general attentiveness (interest) in programme activities. Non-
task involved behaviour included distracted behaviour, unresponsiveness to programme
activities, non-programme related activities such as talking to friends at inappropriate times, or
looking out of the window. An average of four observers was deployed during each programme
implementation. Field workers managed to keep detailed field records including subjective
observations and categorised behavioural data linked to task involvement.
Secondly, the presentation of the programme was also linked to 5-minute time intervals where
learner behaviour was noted to coincide with these predetermined programme time intervals. A
possible confounding factor would be that all programme implementations did not go as outlined
in the Implementer’s manual (Appendix A). Apart from documenting task-involvement and task
non-involvement, field workers also recorded programmatic aspects of the intervention such as
time keeping of presenters and learners, time allocation of tasks in the programme, programme
delivery and programmatic content. A different presenter’s programme was observed at each
school in order to gain insight into different presentation styles.
Observational data and the gathering, therefore, also have various pitfalls. Due to various ethical
considerations in conducting covert observational research, it was decided that the gathering of

46
observational data would be disclosed to learners. On the downside, certain behavioural
modifications may occur as a reaction to disclosed observational data gathering (Hawthorne
effect), or, according to Mays and Pope (2006) “encourage introspection or self questioning
among those being researched” (p.1). Although it is clearly difficult to completely eliminate all
these confounding factors with the utmost certainty, efforts were nonetheless made to verify data
across the different measuring instruments. Learners were informed of the purpose of the study,
and were assured of the confidentiality of the data gathered. It was found that learners soon
forgot about the observers in the room as programme activities started.
The selection for suitably experienced field workers commenced well in advance. Several
candidates were screened for interest and basic qualifications for the position (in this case
Honours Psychology students). All candidates who passed the initial paper selection were then
interviewed. The interviews culminated in the hiring and training of four observers in addition to
two researchers, who were chosen on the grounds of previous research and data collection
experience. As far as was possible, fieldworkers were encouraged to record exactly what
happened during the programme, including any relevant observations regarding the
implementation of the programme activities.
3.3.2 Focus group discussions
Focus group discussions were held with a sample of learners from the participating schools to
determine their experience and evaluation of the intervention. The discussions were conducted
by the trained field workers one-and-a-half month after the intervention. Topics that were included
aimed at tapping into the learners’ experience of the programme, and the broader context in
which they lived. It was the aim of the researcher to keep the language used in the focus group
as simple and straightforward as possible, keeping in mind that many of the learners were not
first language English speakers. A moderator’s manual (Appendix D) was compiled from general
observational and field notes taken by the researcher while the learners were exposed to the
programme.
According to Kitzinger (1994:103) “focus groups are group discussions organized to explore
people’s views and experiences on a specific set of issues”. What distinguishes the focus group
technique from the wider range of group interviews is the explicit use of the group interaction to
produce data and insights that would be less accessible without the interaction and dynamics
found in a group (Morgan 1997:12). In short, focus group discussions uncover or explore not only
what learners think, but also provide the opportunity as to why they hold the views they do.
47
Morgan (1997:8) further believes that the main advantage of focus group data in comparison to
participant observation is “the opportunity to observe a large amount of interaction on a topic in a
limited time period. Group discussions provide direct evidence about similarities and differences
in the participants’ opinions and experiences as opposed to reaching such conclusions from post
hoc analyses”.
Focus groups seem to hold several advantages. It is a flexible, cost-effective way of gathering
data, allowing for direct interaction between the researcher and the respondents (learners). This
enables the researcher to clarify or follow up on issues discussed, and allows for the observation
of non-verbal responses. However, it is often difficult to generalise information from data gathered
from a focus group because of its smaller size and often sampling convenience. Additionally,
responses from different learners are not independent of one another, and participants that are
more dominant may bias the results obtained. Moderator bias may also result by either
intentionally or unintentionally neglecting cues within the focus group. Selecting a properly trained
moderator is thus of utmost importance.
The selection of a sizable group has both logistical and substantive aspects that need to be taken
into consideration. Morgan (1997) argued that small groups could be less productive as they are
more sensitive to group dynamics, however, larger groups may be more difficult to control,
maximising the risks of subgroup development.
Focus group discussions were held at the six schools that participated in the evaluation of the
intervention. The already identified six cluster schools, who participated in the learner’s survey
(sampling discussed in 3.4), provided the sample from which learners were selected to represent
a heterogeneous cross section of each of their classes in the focus groups. The aim was to
conduct a fifty-minute focus group with ten randomly selected learners, as the literature reveals
that 4 should be the minimum size for a group while 12 is the upper, and 6-8 accounting for the
average limit. This group consisted of a heterogeneous cross section of male and female learners
in each of the six schools, but due to time constraints and other interruptions it was often not
possible to conduct a full fifty-minute discussion. The detailed sampling of learners assigned to
participate in the focus group discussions will be discussed in detail in section 3.4.
Learners were assured of the confidentiality of their comments, and were given the option not to
take part in the groups at the beginning of each session. None of the selected learners did
however choose to go back to class and everyone got the opportunity to speak their mind on the
chosen topics. Questions discussed (as detailed in Appendix D) included learner’s views on the
necessity of a substance abuse prevention programme, as well as the identification of the

48
successes and failures of the intervention. Learners were encouraged to share their suggestions
around future programmes, in addition to general thoughts and feelings regarding school-based
programmes in general. Learners had the opportunity to air their opinions regarding whether the
programme had made a difference in their perceptions, knowledge, attitude and behaviour
surrounding substance abuse issues.
3.3.3 Learner survey
Substance usage-related behaviour is a largely private activity, subject to varying degrees of
social, cultural, religious, moral and legal norms and constraints. A key challenge for all such
research is to generate unbiased and precise measures of individual and population behaviour
patterns. Usually, inbuilt measures are needed to curtain measurement error, resulting from
participation bias and learner’s self-reported exposure to and usage of various substances or
socially censured attitudes and behaviours.
Various respondent variables had to be taken into account when the behavioural measurement
tool (survey) was designed. An acceptable response rate is core to the studies’
representativeness and reduced participation bias. Participation bias is defined by Fenton,
Johnson, McManus and Erens (2001) as the error arising from systematic differences (for
example drug usage) of respondents who took part in the study versus those who did not
participate. Participation bias can introduce significant errors in measuring estimates of any type
of behavioural risk. Clement (1990) believed that the more intrusive a survey, the more likely it is
to encounter participation bias that overestimates the variability and frequency of substance
usage related behaviour. Care was taken to glean sensitive information by attempting to frame all
survey questions as tactfully as possible. In order to accommodate different language groups and
comprehension of survey questions, survey questions were read to learners in their own
language, and questions were explained to them verbally. As with the other levels of
measurement, participation in the learner survey was voluntary, and learners were given the
chance to opt out. Learners were reminded that results would be considered confidential.
Survey questions were based on those used by Rocha-Silva et al. (1996). In order to minimise
the measurement error associated with pen and paper surveys, questions were formulated in an
easy to understand way, with field workers translating surveys into learners’ language of
preference. Field workers were able to explain the rationale and format of the survey to the
learners. The survey questions were designed to check for internal consistency, while the validity
was accounted for by using more than one measuring instrument. Re-administration of the same
survey (pre- and post test design) after a brief time interval provided an index of stability of

49
learners’ self reported drug usage over time. Care was taken to construct a questionnaire that
would need a maximum of 30 minutes to complete. This time restriction was put in place in order
to avoid concentration difficulties on the part of the learners and not to disrupt their classes too
much.
The survey (Appendix B), measuring knowledge (Items 8 and 9), attitude (Questions 3 through 7)
and behavioural change (Items 2.1 – 2.15), was administered the morning before the project was
implemented at a specific school. A repeated measure design with pre- and post-test was
implemented to assess any attitude, knowledge or behavioural changes taking place after the
intervention. In the original planning, a control group was added, but due to practical factors (e.g.
an absence of available control schools in a cluster) a control group could not be included. The
post-test measure was taken one month after learners’ exposure to the programme. Numbering
of questionnaires allowed for pairing of pre- and post measures. Learners who were absent at
either of the measuring instances were excluded from the sample. Figure 4 describes the data
collection process.
Figure 5: The data collection process
A pilot study was conducted at a school where the intervention took place, but which was not
selected in the sampling for this study, in order to ensure that the learner survey was appropriate
in terms of content and whether research protocols could be properly followed. Although pilot
studies are subject to a number of limitations (Peat, Mellis, Williams & Xuan; 2002) their
importance cannot be negated. De Vaus (1993:45) listed a myriad of reasons for conducting pilot
studies:
• Developing and testing adequacy of research instruments
Time Lapse: 45 days
Post-Test Survey (30 days after
Intervention) Focus Group (45 days
after Intervention
Intervention Pre-Test Survey
Pilot Study
Intervention
Observation of behaviour
50
• Assessing the feasibility of a (full-scale) study/survey
• Designing a research protocol
• Assessing whether the research protocol is realistic and workable
• Establishing whether the sampling frame and technique are effective
• Identifying logistical problems which might occur using proposed methods
• Estimating variability in outcomes to help determining sample size
• Determining what resources (finance, staff) are needed for a planned study
• Assessing the proposed data analysis techniques to uncover potential problems
• Developing a research question and research plan
• Training a researcher in as many elements of the research process as possible
Care was taken to curb any limitations regarding the pilot, for example, in order to counter
contamination, data and respondents from the pilot study were excluded from the main findings.
De Vaus (1993:54) reiterated: “Do not take the risk. Pilot test first." A set of procedures were
followed to ensure the optimal internal validity of the survey (Table 3.23 in Peat et al. 2002: 123).
• The survey was administered to learners in the school where the pilot study was done
after the intervention in exactly the same way as it will be administered in the main
study
• Learners were asked for feedback to identify ambiguities and difficult questions
• The time it had taken to complete the questionnaire was recorded in order to ensure
that time frames were realistically projected
• The survey was assessed to whether each question elicited an adequate range of
responses
• The survey was checked in order to ensure that all questions were answered.
After administering the pilot study, slight changes were made, mostly relating to phrasing of
survey questions. It was decided to exclude some of the substance’s street or slang names, as it
seems to have confused some learners. The most confusing survey items seemed to be the
street names for LSD which was also indicated on the questionnaire (Candy, Smarties), as well
as the reference to steroids as muscle builders. This was rectified after the first measurement
instance by either removing the street names from the questionnaire, or specifically stating that
the street names were not to mislead the learners.
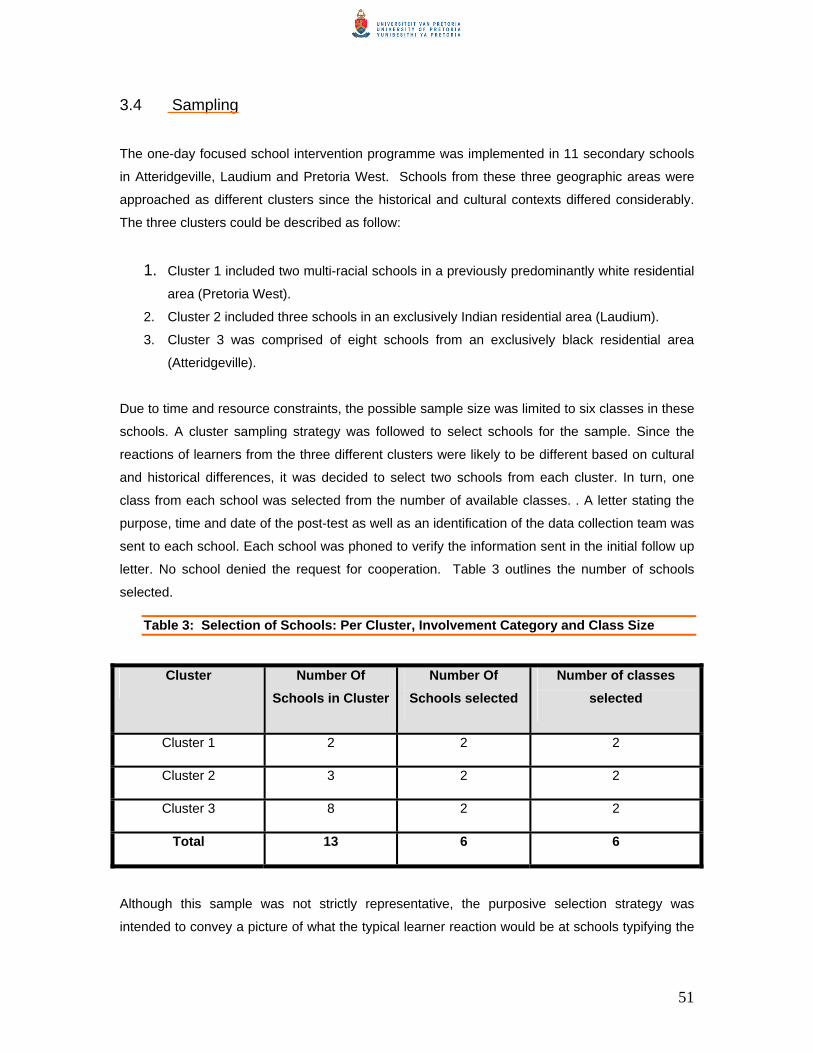
51
3.4 Sampling
The one-day focused school intervention programme was implemented in 11 secondary schools
in Atteridgeville, Laudium and Pretoria West. Schools from these three geographic areas were
approached as different clusters since the historical and cultural contexts differed considerably.
The three clusters could be described as follow:
1. Cluster 1 included two multi-racial schools in a previously predominantly white residential
area (Pretoria West). 2. Cluster 2 included three schools in an exclusively Indian residential area (Laudium).
3. Cluster 3 was comprised of eight schools from an exclusively black residential area
(Atteridgeville).
Due to time and resource constraints, the possible sample size was limited to six classes in these
schools. A cluster sampling strategy was followed to select schools for the sample. Since the
reactions of learners from the three different clusters were likely to be different based on cultural
and historical differences, it was decided to select two schools from each cluster. In turn, one
class from each school was selected from the number of available classes. . A letter stating the
purpose, time and date of the post-test as well as an identification of the data collection team was
sent to each school. Each school was phoned to verify the information sent in the initial follow up
letter. No school denied the request for cooperation. Table 3 outlines the number of schools
selected.
Table 3: Selection of Schools: Per Cluster, Involvement Category and Class Size
Cluster Number Of Schools in Cluster
Number Of Schools selected
Number of classes selected
Cluster 1 2 2 2
Cluster 2 3 2 2
Cluster 3 8 2 2
Total 13 6 6
Although this sample was not strictly representative, the purposive selection strategy was
intended to convey a picture of what the typical learner reaction would be at schools typifying the
52
culture and ethos of each of the three clusters. The criteria used to select schools from each of
these clusters, is elaborated below:
• Cluster 1: The project was presented at both schools in the Pretoria West area, and it
was decided to include both these schools in the sample. Project members that worked in
this cluster of schools indicated that some discrepancy might exist between the two
schools in terms of their culture and ethos, and that visiting both these schools would
provide a more balanced view.
• Cluster 2: The project was presented at all three schools in the Laudium area and it was
decided to include two of these schools in the sample. Information from project members
indicated that some differences in the culture and ethos of these schools existed. Two of
these schools were identified as most likely to present a balanced view. • Cluster 3: The project was presented at all eight of the schools in the Atteridgeville area,
and it was decided to select two schools most likely to typify the response from learners
from this context. Project members with experience from these schools assisted with the
identification of two typical (i.e. not the best or the poorest) schools in terms of culture
and ethos.
Further sampling was conducted to select learners to be included in the different research
techniques. These are described below.
3.4.1 Selection of learners for the Learner Survey
One grade ten class in each of the selected schools was randomly assigned to participate in the
evaluation. Random probability sampling methods can reduce volunteer bias by yielding
unbiased samples of the target population. Learners in these classes were requested to complete
a questionnaire before and after the intervention. Numbering of questionnaires allowed for
pairing of pre-and post measures. Only the data of learners who completed the pre- and post-
measure were analysed. A total of 215 learners completed the evaluation questionnaire.
3.4.2 Selection of learners for the Classroom Observation
Observation sheets were designed to measure learner’s task involvement (Appendix C). Three to
four observers were assigned to observe one or two rows of learners in the classroom during the
presentation. In most cases it was possible to observe 75% of learners in the class. The main
purpose behind this type of selection was not to necessarily generalise results to a population,
53
but to highlight common links or categories shared between the different schools observed,
specifically in relation to programme content and delivery.
3.4.3 Selection of learners for the Focus Group Discussions
Learners were selected for the focus group discussion to represent a heterogeneous cross
section of each of these classes who participated in the evaluation. Ten learners, male and
female, were selected from the same classes to participate in each focus group discussion. In
total, six focus groups were held; one for each school which participated in the evaluation.
3.5 Data Analysis
Miles and Huberman (1994) propose that data analysis consist of three different phases, which
include data reduction, data display and information verification. The following section aims to
describe the conversion of raw information into meaningful information.
3.5.1 Observational data
Data obtained from observations were systematically analysed by theme (as put forth in the
presenter’s manual) and its coinciding time interval. Bloor (1976) described the analytical process
for variants of all content analysis (as was used for this particular data set) as follow:
1. Provisional Classification (task involvement, uninvolvement)
2. Identification of provisional case features - common features identified in each category
and across sites (e.g. overall higher level of task uninvolvement during the second
programme segment)
3. Scrutiny of deviant cases (e.g. mean age for school one as outlier)
3.1.1 Identification of shared case features with non deviant data (despite age
deviance in school one, all other categories were very similar to those of other
sites)
4. Repetition of steps two and three for each disposal category.
The observational data for each school produced frequencies of task-involved and task non-
involved learners for five-minute intervals. All observers’ data was added and for every five-
minute interval the proportion of involved and uninvolved learners was calculated. These
proportions were then averaged to get a baseline proportion of task-involved and task-uninvolved
learners for each school. The data was then investigated for intervals where the learners were
54
significantly uninvolved or involved. Any interval where more than the baseline proportion of
learners was not task-involved, was categorised as significantly not task non- involved. At school
one for example the baseline proportion of involved learners was 0.858. All intervals where less
than 0.858 learners were task involved, was investigated. In the case of one school however, the
baseline proportion of involved learners proved to be very high – (0.924), and “significantly not
task-involved” was then defined by any instance where less than 0.90 learners were task
involved.
It was investigated what parts of the programme was not well attended and what could have
contributed to this loss in learner attention. All instances where 100% of the observed learners
were task-involved were investigated to determine the sections of the programme that were very
successful in keeping learners’ attention.
3.5.2 Focus group discussions
Each focus group discussion was transcribed and the contents analysed for main themes (Miles
& Huberman, 1994.) These themes were then compared across different schools. A summary of
the main themes will be discussed. Although the primary goals of these focus groups was to
gather information on the process, some information could also be utilised in conjunction with the
quantitative data obtained from the pre-and post learner survey, to determine whether a positive
outcome was achieved. Focus group discussions survey the perception of the effectiveness
rather than the actual outcome of the project however, these results were useful in
contextualising the quantitative results. 3.5.3 Learner survey
To analyse the difference between the pre- and post-test of learners in terms of attitude and
behaviour the non-parametric McNemar test (also referred to as McNemar’s test of symmetry or
McNemar symmetry chi square) on SPSS was used to analyse questions two to seven. The
McNemar test assesses the significance of the difference between two dependent samples where
the variable of interest is a dichotomy. It is primarily used in before-after studies to test for an
experimental effect. The goal was to determine whether any significant change (p<0.05) in
attitude or behaviour was effected between the pre- and post-measurement. Regarding the
McNemar test’s power efficiency, when it is used with nominal measures (e.g. gender), the
concept of power efficiency becomes meaningless; according to Siegel (1956), as there is no
alternative with which to compare the test.

55
Questions eight and nine were measured on a five point interval scale, and therefore repeated
measures analysis of variance could be conducted. This test was used to determine whether any
difference between the pre- and post-tests occurred. The learners’ age was also compared
between schools by making use of a one-way analysis of variance. Visual inspection of the
distributions indicated that the data in general was normally distributed and although the
assumption of homogeneity of variance was perhaps not satisfied, Ferguson (1981) said: “One
advantage of the analysis of variance is that reasonable departure from the assumptions of
normality and homogeneity may occur without seriously affecting the validity of the inferences
drawn from the data” (p. 246).
3.6 Ethical considerations
Ethical conflicts often arise in evaluation research because people have opposing interests in the
findings of the programme. These ethical issues are aggravated by limits on research cost, time
limits and the degree of cooperation among those involved. An attempt was made to adhere to
the general principles of autonomy, non-malevolence and beneficence as set out in the Esomar
guidelines (Appendix E). Participants received a full, non-technical and clear explanation of the
tasks expected of them. Verbal consent was obtained from all learners throughout the research
and evaluation process. Participation in the research was voluntarily and the participant’s
attention was drawn to this fact at every level of the evaluation. Confidentiality of individuals was
protected at all times and only summarised group information or anonymous quotations were
published. The format of the results was specified as academic and competent and appropriate
professional resources were identified and consulted.
3.7 Conclusion
This chapter dealt with the description and outline of the research design and methodology of the
evaluated programme. The next chapter provides the presentation of the findings in the form of a
detailed analysis in addition to data interpretation.

56
Chapter 4 Results 4.1 Introduction Chapter four focuses on the data analysis and interpretation obtained from the research
instruments. Each research instrument and the results that it yielded will be discussed in full.
Where appropriate, specific areas of an instrument was analysed in more detail where results
indicated possible significant differences in pre-and post-test measurement.
4.2 Programme implementation A realistic interpretation of data collected can only be made if various confounding factors are
taken into account. The availability of time at each of the six locations, late return by learners
after breaks, lack of onsite resources including electricity, as well as the presentation styles of the
presenters may have influenced outcomes. Additionally, variance in programmatic content should
also be examined in order to reach a reasonable conclusion when presenting evaluation results.
An analysis was conducted of the field notes taken by observers during the implementation of the
programme. The results are subsequently discussed below.
4.2.1 Time Allocation Time allocation could have affected both programmatic delivery and outcomes. During the
presentation of the programme, lack of time resulted in presenters seldom keeping to the time
schedule as was originally detailed in the programme manual (Appendix A). In the manual,
several different options for activities were included, which varied in length. In general, time
allocated for each activity was not sufficient, as learner discussion and questions posed to the
presenters were not figured into the original programmatic time schedule. A lack of resources
also resulted in time constraints, as in one instance it was planned to show a video snippet,
resulting in the delivery and setup of equipment only to realise that the school had no electricity.
Most presenters either substituted this activity with a lesson on the consequences of substance
abuse, or allowed time for a quick discussion on learners’ suggestions for a substance prevention
action plan at their school. In some presentations, this activity was totally excluded. In most
cases, very little time was left for activity wrap-ups and revisitation of key concepts. Additionally,
presenters had difficulty in following through on ground rules, as learners were often late for
sessions after breaks. In some instances, this activity was totally excluded. In most cases, very
little time was left for the wrapping up of any of these activities.

57
4.2.2 Programme Delivery Interaction during this intervention was characterised by collaboration, and, although educators
were not always actively involved in presenting content, most were actively engaging with the
programmatic content during delivery. However, one could assume that these joint performance
delivery systems would be associated with a certain degree of teacher training, a component that
was missing during this intervention. All of the presenters followed an informal and flexible
approach concerning planned activities, resulting in learners not being exposed to the same
material with the same intensity across the six schools.
4.3 Observational Data
As described in Chapter 3, Learner’s behaviour was judged according to task- or non-task
involved behaviour or activities (Appendix C). A total of 192 learners in the six selected classes
were observed at five-minute intervals, equaling 3,552 observations. Overall, 85% of learners
remained task-involved during the majority of the programme, while non-task involvement was
associated wit 15% of learners observed. The average task-involvement of learners observed in
each school was summarised in table 4.
Table 4: Proportion of involved learners per school at 5-minute intervals (from highest to lowest baseline involvement).
School Baseline Proportion involved Number of children
5 .924 27 2 .897 31 1 .858 41 3 .855 33 6 .830 30 4 .795 30
A Pearson correlation revealed a very weak non-significant negative correlation of r =-.171 (r² =
0.0292) between the size of class and the average involvement, which implies that smaller
classes were not generally more task-involved than the bigger classes. In the same way, no
apparent relationship between the proportion of involved students and the cluster in which the
school was located was found. The investigation into the instances where learners were
significantly not task - involved, did not indicate a specific activity that generally led to the loss of
learner attention.
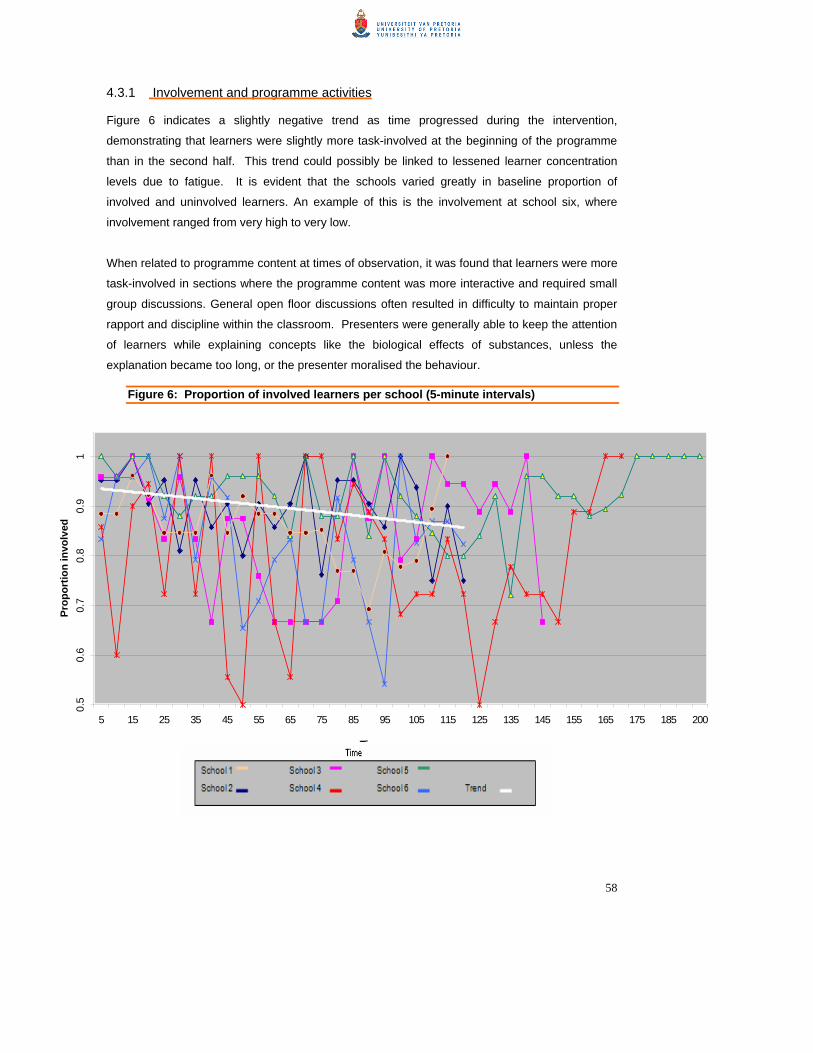
58
4.3.1 Involvement and programme activities Figure 6 indicates a slightly negative trend as time progressed during the intervention,
demonstrating that learners were slightly more task-involved at the beginning of the programme
than in the second half. This trend could possibly be linked to lessened learner concentration
levels due to fatigue. It is evident that the schools varied greatly in baseline proportion of
involved and uninvolved learners. An example of this is the involvement at school six, where
involvement ranged from very high to very low.
When related to programme content at times of observation, it was found that learners were more
task-involved in sections where the programme content was more interactive and required small
group discussions. General open floor discussions often resulted in difficulty to maintain proper
rapport and discipline within the classroom. Presenters were generally able to keep the attention
of learners while explaining concepts like the biological effects of substances, unless the
explanation became too long, or the presenter moralised the behaviour.
Figure 6: Proportion of involved learners per school (5-minute intervals)
0.5
0.6
0.7
0.8
0.9
1
5 15 25 35 45 55 65 75 85 95 105 115 125 135 145 155 165 175 185 200
Ti
Prop
ortio
n in
volv
ed
59
Towards the end of the programme, learners seem to pay less attention to instances of presenter
monologue. Learners also tended to get less interested while the presenter addressed questions
posed by fellow classmates, because attention is then given to individuals and not to the group as
a whole.
Interactive activities seem to have held learner’s attention for much longer. When all the learners
were invited to give input (e.g. the icebreaker where they had to relate their dreams), they
generally tended to stay more focused. Learners generally enjoyed the role-play activities,
although task involvement was sometimes low during the planning and performance of the
dramas, especially in the larger groups. Due to previously mentioned time constraints, many
learners attempted to finish their role-play outline while other groups were already presenting.
It was not possible to make any definite conclusions regarding topics generally leading to less
task involvement, because the same topics that co-occurred with a significant decline in task-
noninvolvement, often also co-occurred with perfect task-involvement in other instances. One
such example is when the topic of the influence of the use of dagga was discussed. Although, in
some instances, the majority of learners actively tried to convince others that it did or did not have
medicinal qualities and health implications, there were a proportion of learners who became
uninvolved in the task.
Themes that could be identified in the programmatic content across the majority of schools and
presenters during the second session, and which influenced learner attention levels, included:
• The consequences of substance abuse – on a physical, mental, financial and social level
(lower level of non-task involvement)
• The religious and moral implications of substance abuse (higher level of non-task
involvement)
An analysis of content per activity revealed some interpretational difficulty, as programme
presentation, content and duration in each school differed somewhat from that detailed in the
presenter’s manual, and from school to school. It is necessary to examine each school in detail
in order to determine which aspects of or activities as a whole were more successful. The
following section will thus cover a detailed breakdown of observational data at each school.
4.3.2 Site Level Data Data analysed by school confirmed the overall trends described above. In most instances, it was
difficult to identify one overall topic across the board that caused the learners to lose interest in

60
the programme per school. Conclusions reached were based on detailed field notes
corresponding to a five-minute time interval in each observed classroom.
School 1 Prior to the commencement of the session, it became evident that learners in school one were
assigned to classes according to academic achievement. The presenter referred to this class of
41 learners as the “survival class”, indicating that these particular learners demonstrate low
academic achievement in addition to behavioural problems.
Instances where learners seemed less task-involved (table 5) could be linked to background
noise coming from outside the classroom, rather than to a specific theme within the programme
content. Learners had some difficulty understanding certain terminologies used, for example
“syringe”. However, the rapport between the presenter and learners was comfortable enough for
them to ask questions when they did not understand sections of the programme content.
Learners responded well to all visual stimuli as well as interactive activities such as being taught
a song. Lack of time was a hampering factor, and there was no break between activities. On
average, approximately four learners were non-task involved across the entire programme span;
whilst 21 learners were actively involved in tasks and content presented in the classroom
observed in school one.
Table 5: School 1 (Cluster 2 – Laudium): Proportion of Task-Involved versus Uninvolved learners across five-minute observation intervals
Time Interval Theme Proportion Uninvolved Proportion Involved
5 Ground Rules 0.115 0.885 10 Dreams 0.115 0.885 15 Dreams 0.038 0.962 20 Dream Killers 0.077 0.923
25 Dagga smoking lead to
dependency 0.154 0.846
30 Dagga smoking lead to
dependency 0.154 0.846
35 Dagga smoking lead to
dependency 0.154 0.846
40 Physical consequences of
smoking dagga 0.038 0.962
45 Financial implications of
dependency 0.154 0.846
50 Consequences of increased
tolerance 0.080 0.920 55 LSD 0.115 0.885 60 Cocaine 0.115 0.885 65 Dagga 0.154 0.846 70 Consequences of Rape 0.154 0.846
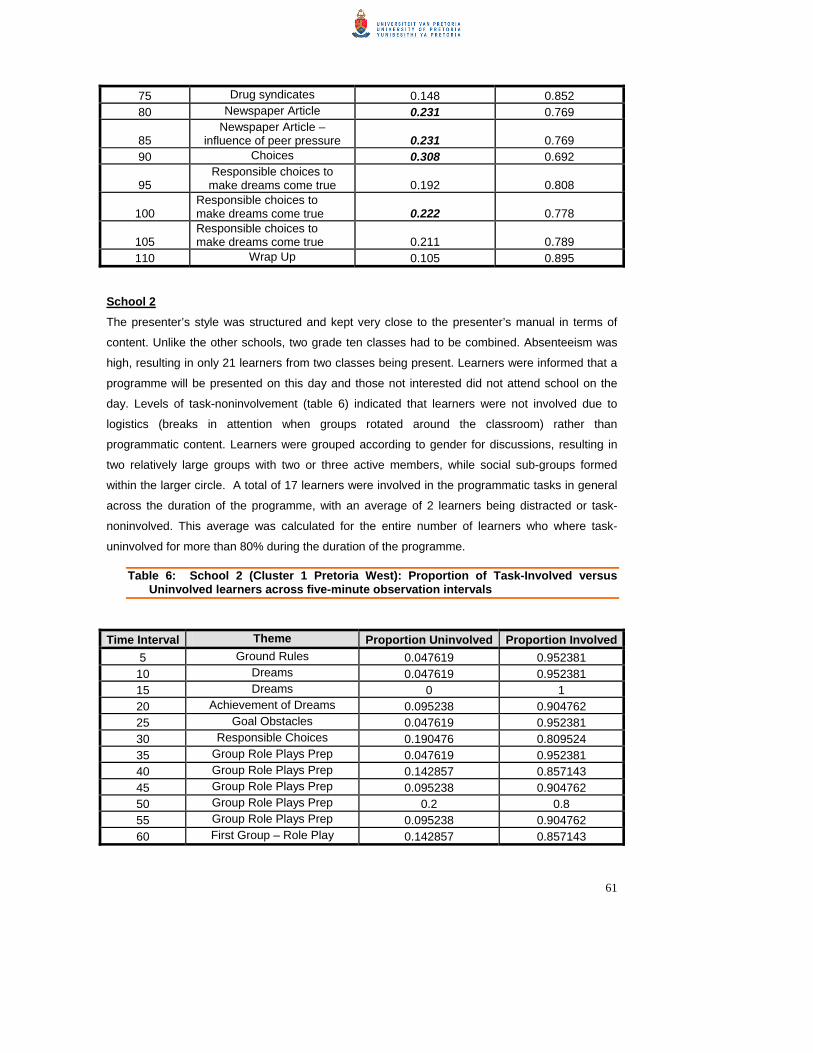
61
75 Drug syndicates 0.148 0.852 80 Newspaper Article 0.231 0.769
85 Newspaper Article –
influence of peer pressure 0.231 0.769 90 Choices 0.308 0.692
95 Responsible choices to make dreams come true 0.192 0.808
100 Responsible choices to make dreams come true 0.222 0.778
105 Responsible choices to make dreams come true 0.211 0.789
110 Wrap Up 0.105 0.895 School 2
The presenter’s style was structured and kept very close to the presenter’s manual in terms of
content. Unlike the other schools, two grade ten classes had to be combined. Absenteeism was
high, resulting in only 21 learners from two classes being present. Learners were informed that a
programme will be presented on this day and those not interested did not attend school on the
day. Levels of task-noninvolvement (table 6) indicated that learners were not involved due to
logistics (breaks in attention when groups rotated around the classroom) rather than
programmatic content. Learners were grouped according to gender for discussions, resulting in
two relatively large groups with two or three active members, while social sub-groups formed
within the larger circle. A total of 17 learners were involved in the programmatic tasks in general
across the duration of the programme, with an average of 2 learners being distracted or task-
noninvolved. This average was calculated for the entire number of learners who where task-
uninvolved for more than 80% during the duration of the programme.
Table 6: School 2 (Cluster 1 Pretoria West): Proportion of Task-Involved versus Uninvolved learners across five-minute observation intervals
Time Interval Theme Proportion Uninvolved Proportion Involved
5 Ground Rules 0.047619 0.952381 10 Dreams 0.047619 0.952381 15 Dreams 0 1 20 Achievement of Dreams 0.095238 0.904762 25 Goal Obstacles 0.047619 0.952381 30 Responsible Choices 0.190476 0.809524 35 Group Role Plays Prep 0.047619 0.952381 40 Group Role Plays Prep 0.142857 0.857143 45 Group Role Plays Prep 0.095238 0.904762 50 Group Role Plays Prep 0.2 0.8 55 Group Role Plays Prep 0.095238 0.904762 60 First Group – Role Play 0.142857 0.857143
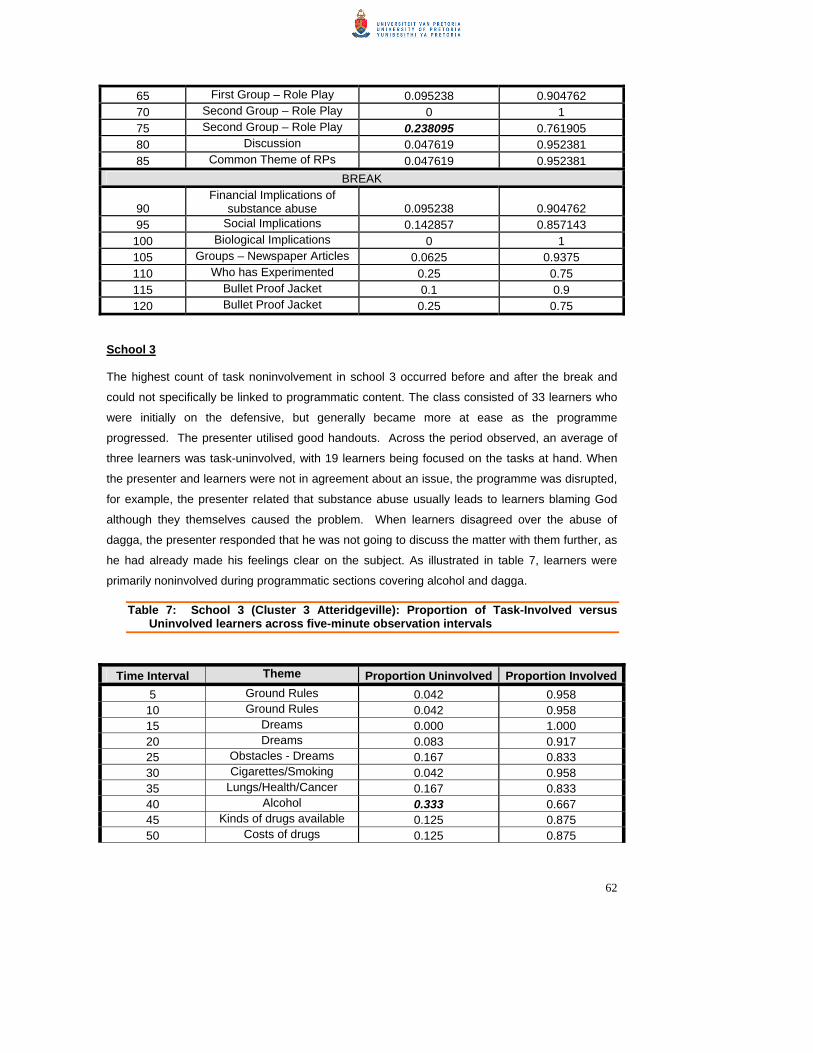
62
65 First Group – Role Play 0.095238 0.904762 70 Second Group – Role Play 0 1 75 Second Group – Role Play 0.238095 0.761905 80 Discussion 0.047619 0.952381 85 Common Theme of RPs 0.047619 0.952381
BREAK
90 Financial Implications of
substance abuse 0.095238 0.904762 95 Social Implications 0.142857 0.857143
100 Biological Implications 0 1 105 Groups – Newspaper Articles 0.0625 0.9375 110 Who has Experimented 0.25 0.75 115 Bullet Proof Jacket 0.1 0.9 120 Bullet Proof Jacket 0.25 0.75
School 3 The highest count of task noninvolvement in school 3 occurred before and after the break and
could not specifically be linked to programmatic content. The class consisted of 33 learners who
were initially on the defensive, but generally became more at ease as the programme
progressed. The presenter utilised good handouts. Across the period observed, an average of
three learners was task-uninvolved, with 19 learners being focused on the tasks at hand. When
the presenter and learners were not in agreement about an issue, the programme was disrupted,
for example, the presenter related that substance abuse usually leads to learners blaming God
although they themselves caused the problem. When learners disagreed over the abuse of
dagga, the presenter responded that he was not going to discuss the matter with them further, as
he had already made his feelings clear on the subject. As illustrated in table 7, learners were
primarily noninvolved during programmatic sections covering alcohol and dagga.
Table 7: School 3 (Cluster 3 Atteridgeville): Proportion of Task-Involved versus Uninvolved learners across five-minute observation intervals
Time Interval Theme Proportion Uninvolved Proportion Involved 5 Ground Rules 0.042 0.958
10 Ground Rules 0.042 0.958 15 Dreams 0.000 1.000 20 Dreams 0.083 0.917 25 Obstacles - Dreams 0.167 0.833 30 Cigarettes/Smoking 0.042 0.958 35 Lungs/Health/Cancer 0.167 0.833 40 Alcohol 0.333 0.667 45 Kinds of drugs available 0.125 0.875 50 Costs of drugs 0.125 0.875

63
55 Where would you get the
money 0.240 0.760 60 Dagga is not a medicine 0.333 0.667
65 Dagga can cause mental
illness 0.333 0.667
70 Effects of drugs on your
soul 0.333 0.667
75 Effects of dagga on your
body 0.333 0.667
80 Slimmers/Over the
counter drugs 0.292 0.708
85 Slimmers/Over the
counter drugs 0.000 1.000 BREAK
90 Groups – Role Play 0.125 0.875 95 Groups – Role Play 0.000 1.000 100 Role Play 0.208 0.792 105 Role Play 0.167 0.833 110 Role Play 0.000 1.000 115 Role Play 0.056 0.944 120 Discussion on Role Play 0.056 0.944 125 Discussion on Role Play 0.111 0.889
130 Follow up – RP – how did
you feel 0.056 0.944
135 Reading of two case
studies 0.111 0.889
140 Do these prevent you from
reaching your dreams? 0.000 1.000
145 What would you do to
keep your school drug free 0.333 0.667 School 4 When taking into account the task-involvement of the 30 learners in school 4 across programme
duration, an average of 4 learners was task-noninvolved compared to an average of 14 involved
learners. The presenter had an excellent rapport with the learners, at times switching over to their
native language to get a point across. Time allocated to the preparation of role-play could be
shortened in future, as it seemed that learners lost interest in the task at hand when time
allocation to an activity were not adhered to, as can clearly be seen from the time extension of
certain activities and of this presentation as a whole when compared with implementation at other
schools.
In general, the consequences of using dagga and drinking alcohol also appeared to have
generated less interest amongst the learners, possibly due to desensitisation and moralization
towards these specific topics in the mass media and educators. This is a great cause for concern,
as these substances are regarded as “gateway drugs” and should be a critical focal point for
substance abuse prevention.
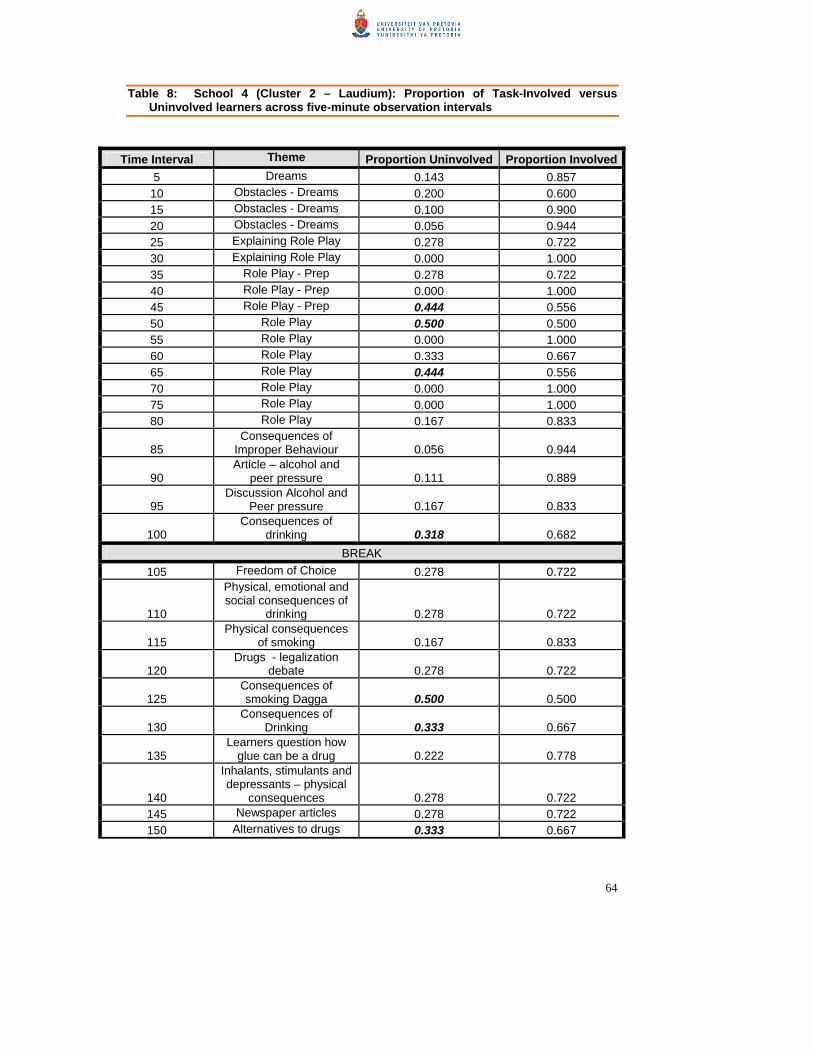
64
Table 8: School 4 (Cluster 2 – Laudium): Proportion of Task-Involved versus Uninvolved learners across five-minute observation intervals
Time Interval Theme Proportion Uninvolved Proportion Involved 5 Dreams 0.143 0.857 10 Obstacles - Dreams 0.200 0.600 15 Obstacles - Dreams 0.100 0.900 20 Obstacles - Dreams 0.056 0.944 25 Explaining Role Play 0.278 0.722 30 Explaining Role Play 0.000 1.000 35 Role Play - Prep 0.278 0.722 40 Role Play - Prep 0.000 1.000 45 Role Play - Prep 0.444 0.556 50 Role Play 0.500 0.500 55 Role Play 0.000 1.000 60 Role Play 0.333 0.667 65 Role Play 0.444 0.556 70 Role Play 0.000 1.000 75 Role Play 0.000 1.000 80 Role Play 0.167 0.833
85 Consequences of
Improper Behaviour 0.056 0.944
90 Article – alcohol and
peer pressure 0.111 0.889
95 Discussion Alcohol and
Peer pressure 0.167 0.833
100 Consequences of
drinking 0.318 0.682 BREAK
105 Freedom of Choice 0.278 0.722
110
Physical, emotional and social consequences of
drinking 0.278 0.722
115 Physical consequences
of smoking 0.167 0.833
120 Drugs - legalization
debate 0.278 0.722
125 Consequences of smoking Dagga 0.500 0.500
130 Consequences of
Drinking 0.333 0.667
135 Learners question how
glue can be a drug 0.222 0.778
140
Inhalants, stimulants and depressants – physical
consequences 0.278 0.722 145 Newspaper articles 0.278 0.722 150 Alternatives to drugs 0.333 0.667
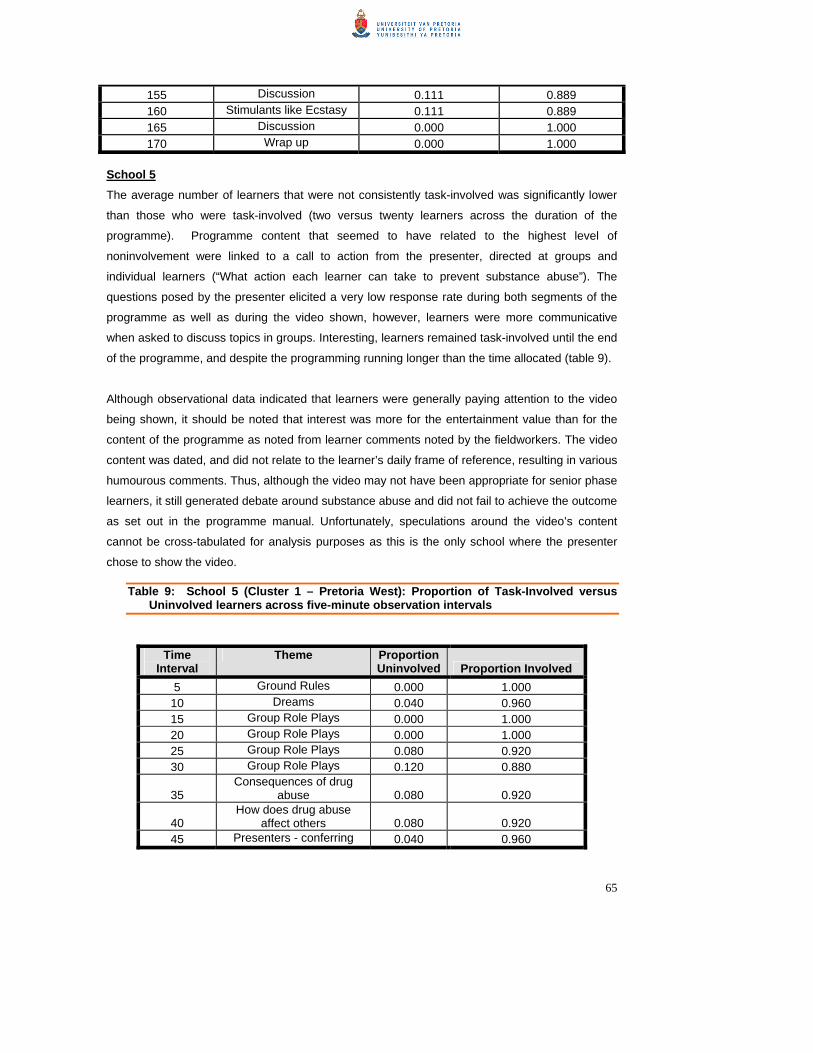
65
155 Discussion 0.111 0.889 160 Stimulants like Ecstasy 0.111 0.889 165 Discussion 0.000 1.000 170 Wrap up 0.000 1.000
School 5 The average number of learners that were not consistently task-involved was significantly lower
than those who were task-involved (two versus twenty learners across the duration of the
programme). Programme content that seemed to have related to the highest level of
noninvolvement were linked to a call to action from the presenter, directed at groups and
individual learners (“What action each learner can take to prevent substance abuse”). The
questions posed by the presenter elicited a very low response rate during both segments of the
programme as well as during the video shown, however, learners were more communicative
when asked to discuss topics in groups. Interesting, learners remained task-involved until the end
of the programme, and despite the programming running longer than the time allocated (table 9).
Although observational data indicated that learners were generally paying attention to the video
being shown, it should be noted that interest was more for the entertainment value than for the
content of the programme as noted from learner comments noted by the fieldworkers. The video
content was dated, and did not relate to the learner’s daily frame of reference, resulting in various
humourous comments. Thus, although the video may not have been appropriate for senior phase
learners, it still generated debate around substance abuse and did not fail to achieve the outcome
as set out in the programme manual. Unfortunately, speculations around the video’s content
cannot be cross-tabulated for analysis purposes as this is the only school where the presenter
chose to show the video.
Table 9: School 5 (Cluster 1 – Pretoria West): Proportion of Task-Involved versus Uninvolved learners across five-minute observation intervals
Time Interval
Theme Proportion Uninvolved Proportion Involved
5 Ground Rules 0.000 1.000 10 Dreams 0.040 0.960 15 Group Role Plays 0.000 1.000 20 Group Role Plays 0.000 1.000 25 Group Role Plays 0.080 0.920 30 Group Role Plays 0.120 0.880
35 Consequences of drug
abuse 0.080 0.920
40 How does drug abuse
affect others 0.080 0.920 45 Presenters - conferring 0.040 0.960
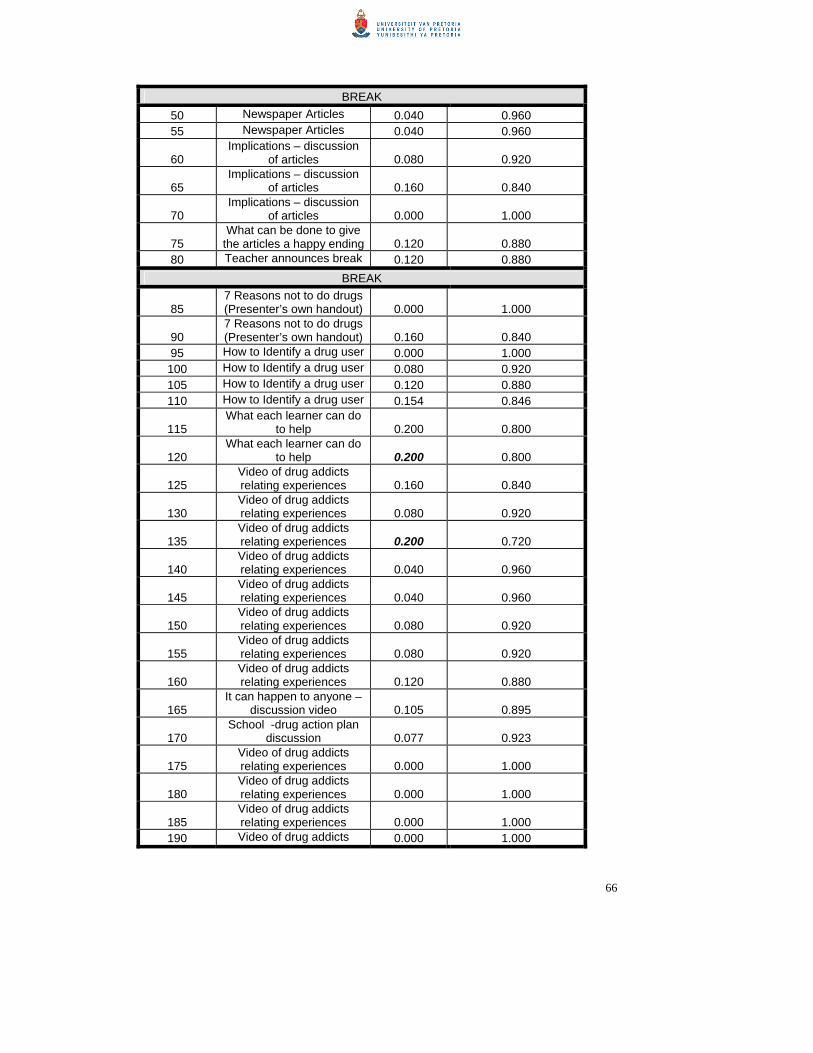
66
BREAK 50 Newspaper Articles 0.040 0.960 55 Newspaper Articles 0.040 0.960
60 Implications – discussion
of articles 0.080 0.920
65 Implications – discussion
of articles 0.160 0.840
70 Implications – discussion
of articles 0.000 1.000
75 What can be done to give
the articles a happy ending 0.120 0.880 80 Teacher announces break 0.120 0.880
BREAK
85 7 Reasons not to do drugs (Presenter’s own handout) 0.000 1.000
90 7 Reasons not to do drugs (Presenter’s own handout) 0.160 0.840
95 How to Identify a drug user 0.000 1.000 100 How to Identify a drug user 0.080 0.920 105 How to Identify a drug user 0.120 0.880 110 How to Identify a drug user 0.154 0.846
115 What each learner can do
to help 0.200 0.800
120 What each learner can do
to help 0.200 0.800
125 Video of drug addicts relating experiences 0.160 0.840
130 Video of drug addicts relating experiences 0.080 0.920
135 Video of drug addicts relating experiences 0.200 0.720
140 Video of drug addicts relating experiences 0.040 0.960
145 Video of drug addicts relating experiences 0.040 0.960
150 Video of drug addicts relating experiences 0.080 0.920
155 Video of drug addicts relating experiences 0.080 0.920
160 Video of drug addicts relating experiences 0.120 0.880
165 It can happen to anyone –
discussion video 0.105 0.895
170 School -drug action plan
discussion 0.077 0.923
175 Video of drug addicts relating experiences 0.000 1.000
180 Video of drug addicts relating experiences 0.000 1.000
185 Video of drug addicts relating experiences 0.000 1.000
190 Video of drug addicts 0.000 1.000
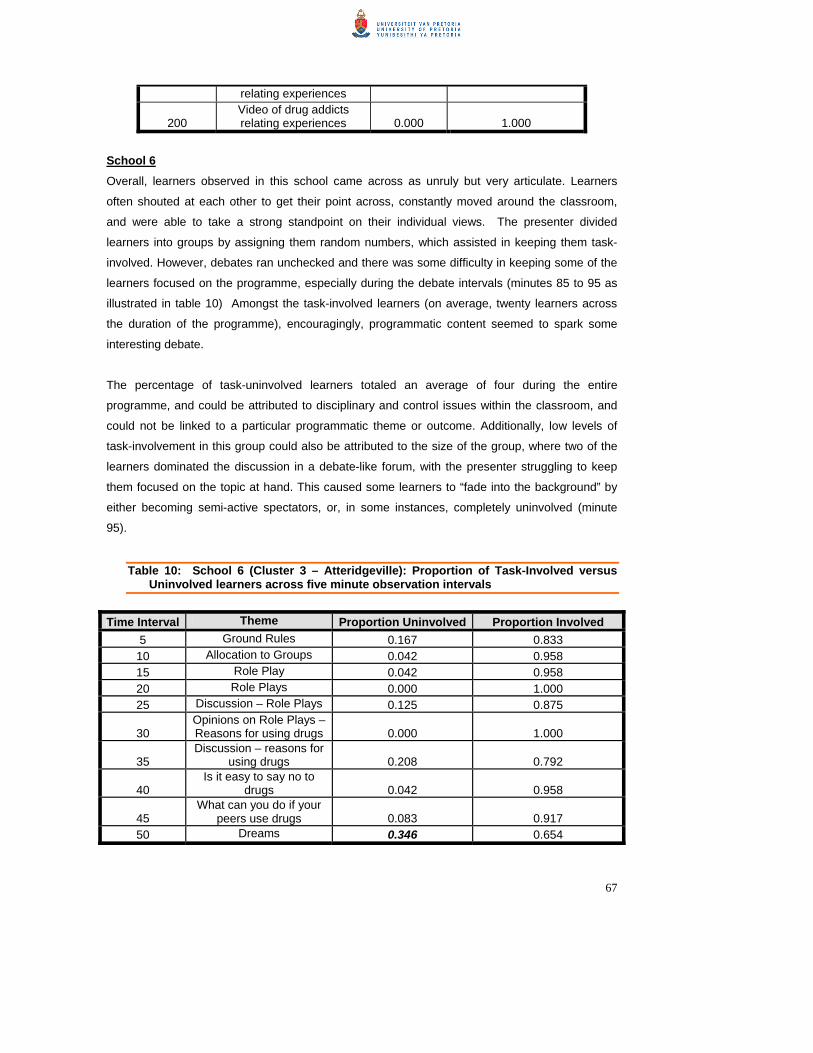
67
relating experiences
200 Video of drug addicts relating experiences 0.000 1.000
School 6 Overall, learners observed in this school came across as unruly but very articulate. Learners
often shouted at each other to get their point across, constantly moved around the classroom,
and were able to take a strong standpoint on their individual views. The presenter divided
learners into groups by assigning them random numbers, which assisted in keeping them task-
involved. However, debates ran unchecked and there was some difficulty in keeping some of the
learners focused on the programme, especially during the debate intervals (minutes 85 to 95 as
illustrated in table 10) Amongst the task-involved learners (on average, twenty learners across
the duration of the programme), encouragingly, programmatic content seemed to spark some
interesting debate.
The percentage of task-uninvolved learners totaled an average of four during the entire
programme, and could be attributed to disciplinary and control issues within the classroom, and
could not be linked to a particular programmatic theme or outcome. Additionally, low levels of
task-involvement in this group could also be attributed to the size of the group, where two of the
learners dominated the discussion in a debate-like forum, with the presenter struggling to keep
them focused on the topic at hand. This caused some learners to “fade into the background” by
either becoming semi-active spectators, or, in some instances, completely uninvolved (minute
95).
Table 10: School 6 (Cluster 3 – Atteridgeville): Proportion of Task-Involved versus Uninvolved learners across five minute observation intervals
Time Interval Theme Proportion Uninvolved Proportion Involved
5 Ground Rules 0.167 0.833 10 Allocation to Groups 0.042 0.958 15 Role Play 0.042 0.958 20 Role Plays 0.000 1.000 25 Discussion – Role Plays 0.125 0.875
30 Opinions on Role Plays – Reasons for using drugs 0.000 1.000
35 Discussion – reasons for
using drugs 0.208 0.792
40 Is it easy to say no to
drugs 0.042 0.958
45 What can you do if your
peers use drugs 0.083 0.917 50 Dreams 0.346 0.654

68
55 Dream Breakers 0.292 0.708 60 Dream Breakers 0.208 0.792 65 Choice 0.167 0.833 70 Debate 0.333 0.667 75 Debate 0.333 0.667
80 Still discussing dream
breakers 0.083 0.917 85 Debate 0.208 0.792
90 Debate – dreams and
choices 0.333 0.667 95 Debate 0.458 0.542
BREAK 100 Debate 0.000 1.000 105 Debate 0.174 0.826 110 Debate 0.130 0.870 115 Wrap Up 0.130 0.870 120 Wrap Up 0.176 0.824
In summary, it is clear that time allocation, modality of presentation and interactivity of the
programme seems to have an influence on learner task-involvement and noninvolvement.
4.4 Behavioural Data The learner survey was used to determine learner’s attitude, knowledge and behaviour in relation
to substance abuse. In the outcome evaluation quantitative methods were used to determine
whether the programme contributed to behavioural change. A quasi-experimental design with
pre- and post-test was implemented. The strengths of this design included the ability to attribute
change between the pre- and post test to the intervention given certain outcomes. According to
Brogan and Kutner (1990) this is one of the most frequently used designs in social research,
although the strength of this design is, in this case, slightly weakened by the absence of a control
group. For the purpose of this analysis, significance will be determined at 0.05 level. This means
that there is a 95% chance that the results are due to the independent variables and not chance.
4.4.1 General Overview The survey consisted of 9 questions and was related to different aspects of the intervention,
including:
• Biographical Information (age and gender)
• Attitude
• Peer pressure
• Knowledge
• Behaviour
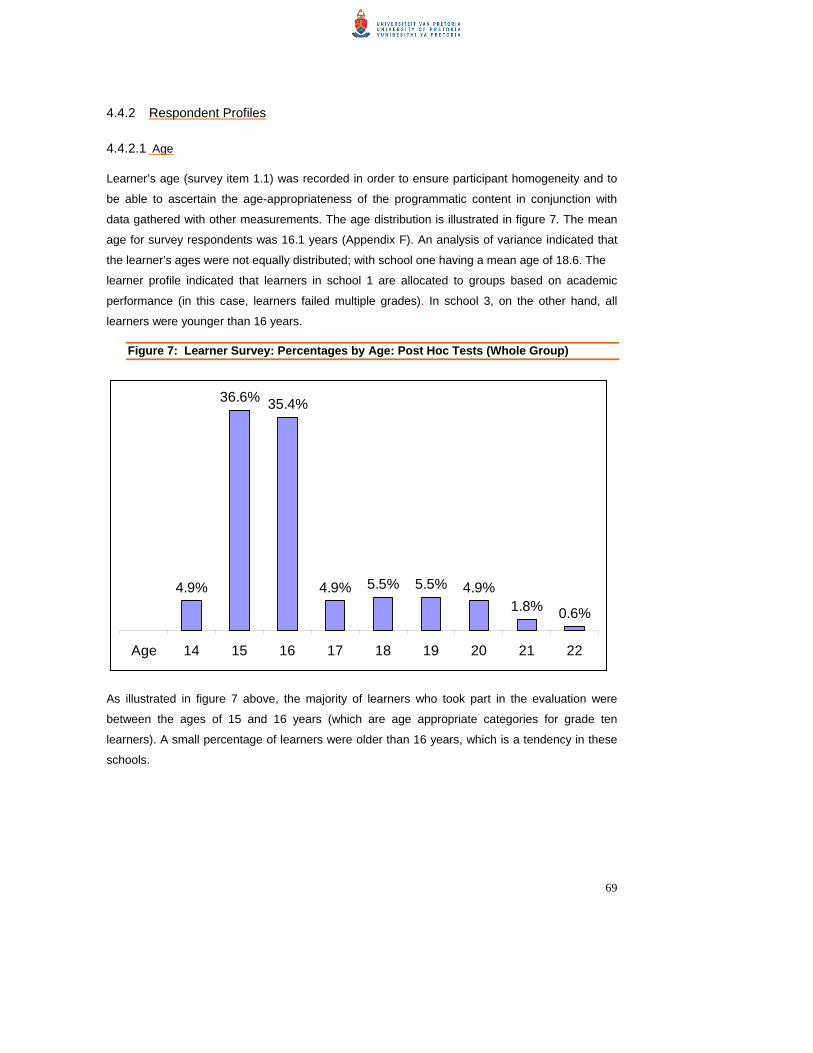
69
4.4.2 Respondent Profiles
4.4.2.1 Age Learner’s age (survey item 1.1) was recorded in order to ensure participant homogeneity and to
be able to ascertain the age-appropriateness of the programmatic content in conjunction with
data gathered with other measurements. The age distribution is illustrated in figure 7. The mean
age for survey respondents was 16.1 years (Appendix F). An analysis of variance indicated that
the learner’s ages were not equally distributed; with school one having a mean age of 18.6. The
learner profile indicated that learners in school 1 are allocated to groups based on academic
performance (in this case, learners failed multiple grades). In school 3, on the other hand, all
learners were younger than 16 years.
Figure 7: Learner Survey: Percentages by Age: Post Hoc Tests (Whole Group)
0.6%1.8%4.9%5.5%5.5%4.9%
35.4%36.6%
4.9%
Age 14 15 16 17 18 19 20 21 22
As illustrated in figure 7 above, the majority of learners who took part in the evaluation were
between the ages of 15 and 16 years (which are age appropriate categories for grade ten
learners). A small percentage of learners were older than 16 years, which is a tendency in these
schools.

70
4.4.2.2 Gender Females accounted for 58% of the total number of learners partaking in the learner survey, while
males accounted for 42% as indicated in table 11 below.
Table 11: Learner Survey: Frequencies by Gender: Post Hoc Tests
Gender Frequency Percent Male 69 42.1 Female 95 57.9 Total 164 100.0
Analysis indicates that the average age for female learners participating in the evaluation is 16
years, compared to 17 years for male learners. The standard deviation of both groups is 1.498
and 1.802 respectively. The boy’s age varies with approximately 2 years and girls with
approximately 1 year. The measures of tendency for both populations with respect to age are
approximately equal, which suggest normality between the populations, but also show data
skewness, which indicates there are fewer values when navigating through the right as compared
to on the left.
The next step was to determine if there is any significant statistical difference between the mean
ages for each gender category. An independent samples test (Appendix M) was run to test the
homogeneity of variance (whether the null hypothesis is met), indicating a significant value
(usually 0.09 above alpha or a cut off of 0.05). The null hypothesis of equality of means that
significance values are those above 0.05, indicating that, according to the null hypothesis, the
means are statistically equal. In this case, the null hypothesis is thus rejected due to a Levene
Test result of 0.009. Proceeding to the t-test results, with an assumption of equal variance, the
result is 0.009, concluding that there is a significant difference between gender groups
concerning age. 4.4.3 Behaviour change from survey results A whole group analysis (including all learners from all schools regardless of gender or age)
revealed no significant change in substance abuse behaviour between pre-and post-test scores,
with the exception of the item pertaining to refusing substances in a social, peer pressure related
settings (item 3.4). During the pre-test on survey item 3.4, 7 (or 4%)1 of the learners indicated
they would accept substances under peer pressure, while 100 (62%) learners indicated a similar
response during the post-test, resulting in a negative 23% difference between pre-and post-test.
1 N=164 in the pre-test for survey item 3.4, while the post-test had an N=160. Percentage change between pre-and post tests were calculated based on the average (N=162)

71
Similarly, 62 learners indicated they would refuse substances under peer pressure during the pre-
test, in comparison with only 48 during the post-test (23% difference between pre-and post-test
scores). Learners who aligned themselves to the “uncertain” category during the pre-test (95
learners), dwindled to only 12 learners in the post-test (87% difference between the two
measurements). A detailed results matrix is presented in Appendix G. The results summarised in
table 12, indicate items which where either problematic2 (indicated in bold) or yielded a significant
change on a whole group level. Items 2.15, 4.2 and 6.2 relating to alcohol was included in the
table for interest sake.
Table 12: Learner Survey: Whole Group
Total Percentage Change3
Pre-Test Post-Test Pre- and Post-Test (Whole Group)
Question 2: Have you used any of the following substances over the past 30 days?
2.1
Over the counter pain relief substances • Yes
• No
• Uncertain
94
63
7
114
44
5
21%
-30%
-29%
2.2
Over the counter substances e.g. cough medicines
• Yes
• No
• Uncertain
102
52
10
114
44
5
12%
-15%
-50%
2.6
LSD • Yes
• No
• Uncertain
Significance4
146
9
8
148
0
10
1%
-100%
25%
0.031
2.11
Substances that relieve sever pain • Yes
• No
• Uncertain
Significance
130
25
9
130
25
9
-
-
-
0.011
2.12
Steroids • Yes
• No
• Uncertain
150
7
3
141
14
8
-6%
100%
167%
2.14
Alcohol • Yes
• No
92
66
100
58
9%
-12%
2 Problematic items are items that were generally misunderstood and subsequently and that was filled out incorrectly by learners, and these items are indicated in bold 3 Percentage difference between total pre-test and total post-test (thus, whole group difference and not calculated for each school) 4 P-Value Significance
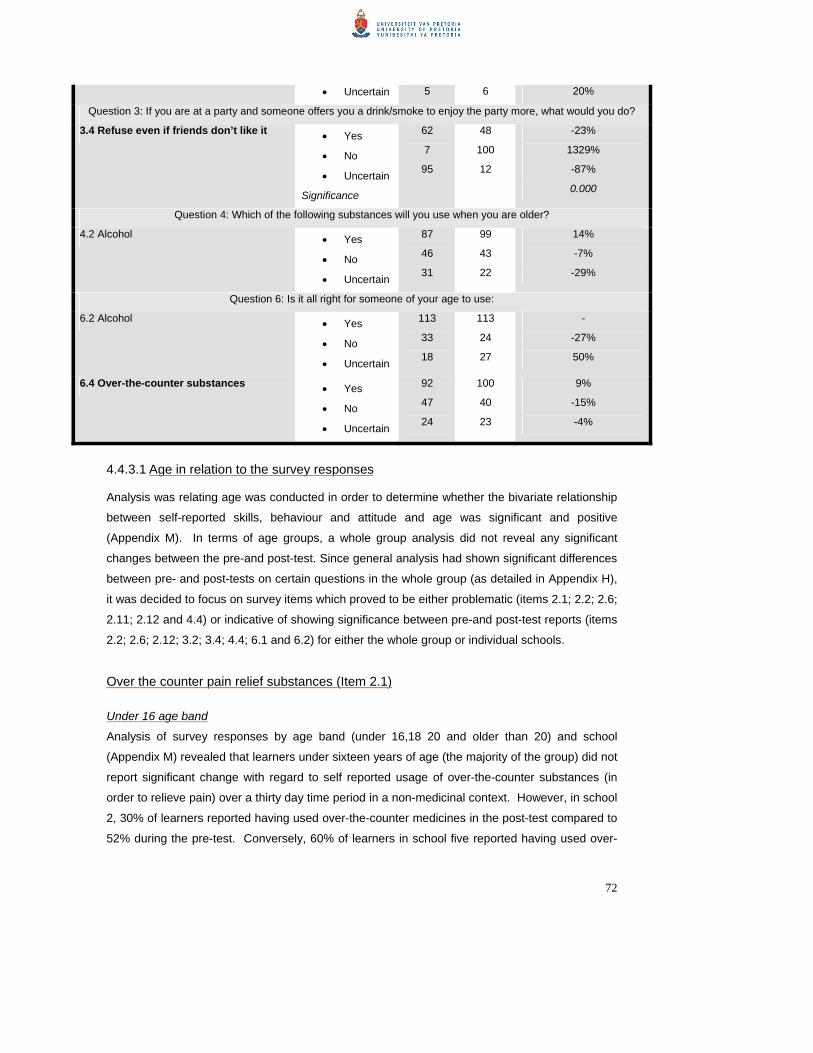
72
• Uncertain 5 6 20%
Question 3: If you are at a party and someone offers you a drink/smoke to enjoy the party more, what would you do?
3.4 Refuse even if friends don’t like it • Yes
• No
• Uncertain
Significance
62
7
95
48
100
12
-23%
1329%
-87%
0.000
Question 4: Which of the following substances will you use when you are older?
4.2 Alcohol • Yes
• No
• Uncertain
87
46
31
99
43
22
14%
-7%
-29%
Question 6: Is it all right for someone of your age to use:
6.2 Alcohol • Yes
• No
• Uncertain
113
33
18
113
24
27
-
-27%
50%
6.4 Over-the-counter substances • Yes
• No
• Uncertain
92
47
24
100
40
23
9%
-15%
-4%
4.4.3.1 Age in relation to the survey responses Analysis was relating age was conducted in order to determine whether the bivariate relationship
between self-reported skills, behaviour and attitude and age was significant and positive
(Appendix M). In terms of age groups, a whole group analysis did not reveal any significant
changes between the pre-and post-test. Since general analysis had shown significant differences
between pre- and post-tests on certain questions in the whole group (as detailed in Appendix H),
it was decided to focus on survey items which proved to be either problematic (items 2.1; 2.2; 2.6;
2.11; 2.12 and 4.4) or indicative of showing significance between pre-and post-test reports (items
2.2; 2.6; 2.12; 3.2; 3.4; 4.4; 6.1 and 6.2) for either the whole group or individual schools.
Over the counter pain relief substances (Item 2.1)
Under 16 age band
Analysis of survey responses by age band (under 16,18 20 and older than 20) and school
(Appendix M) revealed that learners under sixteen years of age (the majority of the group) did not
report significant change with regard to self reported usage of over-the-counter substances (in
order to relieve pain) over a thirty day time period in a non-medicinal context. However, in school
2, 30% of learners reported having used over-the-counter medicines in the post-test compared to
52% during the pre-test. Conversely, 60% of learners in school five reported having used over-
73
the-counter medicine before the intervention, with 77% of learners in that school reporting they
were using these substances in the post-test. Data on the other schools indicated only marginal
increases or decreases between the pre-and post measurement in either the “yes” or “no”
categories.
As illustrated in table 12, item 2.1 was a problematic survey item and was not validly answered by
learners, which can primarily be attributed to the survey design. On the printed questionnaire,
there was no mention of usage of over the counter pain relief substances for non-medicinal
purposes. Although field workers gave a verbal explanation around the concept of non-medicinal
purposes on survey item 2, learners still misinterpreted the item and answered from a medicinal
usage viewpoint.
Non-prescriptive over the counter substances (Item 2.2)
The item pertaining to over-the-counter substances which can be bought without a prescription
based on usage over a period of thirty days (item 2.2 on the survey and incidentally also a
problematic item), indicated a significant pre- and post-test difference in school 2. Overall,
learners did not complete this survey item in a valid way. As with survey item 2.1, learners
answered item 2.2 from a legitimate medicinal usage viewpoint, and did not necessarily
understand the survey item as pertaining to non-medicinal usage of over the counter substances.
Under 16 age band
As an example of learner’s misinterpretation of item 2.2, analysis indicates that the learners in
school one reported unanimously that they do not abuse over-the-counter prescription medicine
in the pre-measurement, while indicating the opposite during the post-measurement.
LSD (Item 2.6)
Under 16 age band
Results obtained from survey item 2.6 are not valid due to confusion amongst the learners
created by the inclusion of LSD’s street names (acid/candy/green goblins/smarties/strawberry
fields) in the survey. Five out of the six schools reported a 100% abuse rate on problematic
survey item 2.6 pertaining to the usage of LSD (acid/candy/smarties) in the under-sixteen age
group. The only school that reported a positive change after the post measurement was school
six (improved from a 100% reported abuse rate to a 75% reported abuse rate). From learner
responses, it was clear that learners interpreted the question as pertaining to candy and not an
abused substance.

74
Alcohol (Item 2.14)
Under 16 age band
More learners under sixteen years of age in school one reported not having used alcohol in the
last 30 days during the post-test measurement when compared to the pre-test.
Under 18 age band
Sixteen to eighteen year old learners in school one reported a positive change to survey item 2.6,
with 63% of learners indicating that they have not used alcohol in the post-test, compared to only
38% during the pre-test. The overall number of “uncertain” answers for this age group was
minimal. None of the learners reported being “uncertain” in the pre-test, with one learner reporting
the same in the post-test within the entire under eighteen age band across all six schools.
Peer pressure and the acceptance of substances in a social setting (Item 3.2) Under 18 age band
In the analysis of the younger than eighteen age band, there are some significant changes
between the pre- and post-test measures, with learners between the ages of sixteen and
eighteen reporting an increased non-usage rate of 62% and 37% respectively in schools one and
two. As was evident in analysis for survey items 2.1,2.11, 3.4 and 4.2, investigation of item 3.2
similarly indicated that the sixteen to eighteen old group reported less “uncertain” survey answers
(a decrease of 55% in “uncertain” across schools one, two, four, five and six) in favour of positive
behaviour in social settings when peer pressure and substance abuse is involved.
Predictive substance usage (Item 4.4)
Question four of the survey dealt with learner’s opinions on future use of over-the-counter
substance usage (“which of the following substances you think you will use when you are older”).
As item 4.4 relating to over-the counter-medicines for non-medicinal purposes indicated a
significant change for school two (0.015 between pre- and post measurement), it merited further
investigation.
Under 16 age band
The under-sixteen group in two schools indicated a reduction in perceived future usage (21% ad
9% difference respectively) between the two measurements. The same results were not found for
all the other age bands surveyed.
Attitude towards peer tobacco and cigarette usage (Item 6.1)

75
Under 16 age band
In the under-sixteen group, no significant change was observed in schools six, three and four,
however, in school one, 86% of under-sixteen learners thought it was acceptable for someone
their age to smoke, while only 57% thought so after the intervention. Similarly, school two
learners went from 72% positive answers to smoking, to 59% after the intervention.
Under 18 age band
In analysis of the under-eighteen group, there was no significant change in school two. In school
one, twelve percent less learners thought smoking by peers were acceptable; 25% less learners
thought so in school five, while 50% of learners in school six indicated their change in attitude
towards smoking. Respondents in schools one and four did not show any significant changes.
Attitude towards peer alcohol usage (Item 6.2) In school one more learners were negative about the acceptability of alcohol usage amongst their
peers.
Under 16 age band
In examination of the under-sixteen group, there were indications that more learners disapproved
of their peers using alcohol, for example, 71% of the sampled learners in school one reported
during the pre-test that it was acceptable for someone their age to drink alcohol, while 57%
reported so in the post-test. In school six, 67% of learners thought using alcohol was acceptable,
while 50% thought so during the post-measure.
As stated previously, a whole group analysis did not reveal any significant changes between the
pre-and post-test in terms of respondent age. Learners in the older age bands reported fewer
responses in the “uncertain” category than the younger age bands.
4.4.3.2 Gender in relation to survey responses Whole group analysis reveals that, with regard to gender (item 1.2); there were no significant
differences between learner’s responses before and after the intervention (Appendixes I and K
respectively). Interestingly, the only question (Question 3.4 indicated in table 13 and figure 8)
which indicated a slight change was the question related to peer pressure (would they refuse
using drugs even if their friends found it the “unpopular” choice). During the pre-test, the majority
of both male and females reported as being “uncertain” when it comes to the refusal of
substances under peer pressure, however, although responses in the “uncertain” category was
less in the post-measurement, learners indicated that they would not be able to resist peer

76
pressure linked to substance abuse. In both the pre-and-post-test as illustrated in figure 8, more
girls indicated that they would not use substances, even if friends thought it an unpopular choice.
Table 13: Survey Item 3.4 (Peer pressure) that showed a significant difference between pre – and post – test (Gender Breakdown - Whole group analysis5 (p values)
Males Females
Question 3.4 0.013 Question 3.4 0.000
4.4.4 Summary– Self-reported behavioural aspects of substance abuse (Questions 2
to 7)
Question 2 to 7 in the learner survey focussed on behavioural aspects of substance abuse.With
the exception of the excluded items on over-the- counter drugs, very little change was measured
between the pre- and post-tests (Appendix L). The item that produced the most consistent
change was item 3.4, focusing on pressure where learners in four of the experimental schools,
learners indicated that they were more likely to refuse substances after the programme, even
when under pressure from their friends. On question 3.2 learners in two schools indicated that
they were less likely to accept the substance and not use it after the programme. Schools that
reported the most change when analysed by age and gender included schools one, two and six,
although there were no indication of significant changes for the group as a whole. Concerning
age, the under sixteen group showed some change (for example, on items 2.14, 4.4 and 6.2),
while girls indicated a greater positive change between the pre-and post-test regarding substance
abuse under peer pressure.
5 Whole group analysis is indicative of analysis conducted on all data available, i.e. data collected across all six schools.

77
UncertainNoYes
q3.4
60
50
40
30
20
10
0
Cou
nt
GirlBoy
q1.2
UncertainNoYes
pq3.4
60
50
40
30
20
10
0
Co
un
t
GirlBoy
q1.2
Figure 8: Pre- and Post -Test Cross Tabulation of item 3.4 by Gender (Whole Group)
4.4.5 Knowledge (Questions 8 and 9)
Question 8 pertained to knowledge around behavioural warning signs of substance abuse, while
question 9 investigated if the learners knew where to go for help if they had a substance abuse
problem. Questions were qualitative and open ended, and were coded into quantitative
categories for analysis purposes. No significant difference was found regarding levels of
knowledge on Questions 8 and 9 between the pre-test and post-test, and between schools. (See
Appendices F & G for SPSS output). Since these questions were an assumed indication of
where they had to go if they had a substance abuse problem, it seems that the programme did
not succeed in improving learner’s knowledge – or at least the knowledge measured on the two
items included in the questionnaire.
4.4.6 Conclusion From the results, certain patterns were identified. No behavioural change in the use of specific
substances was evident from the measurement after the intervention by the group as a whole. No
change in knowledge about substance use was evident from the measurement, while
contradictory findings were found regarding attitude change. Regarding age and gender, no
significant changes were reported for the group as a whole.
Pre-Test Post-Test Formatted: Font: (Default)Arial, 10 pt
Formatted: Font: (Default)Arial, 10 pt

78
4.5 Themes from focus group discussions The primary goal of the focus group discussions was to gather information on the process of
implementation. From the analysis of the discussions the following themes can be identified.
4.5.1 There is a need for education on substance abuse
Learners reported to have had limited previous exposure to programmes aimed at preventing
substance abuse. Learners at school 3 said that a combined substance abuse preventions and
HIV/Aids programme had been presented at their school the previous year, but the learners did
not remember much of the programme. Learners from two neighbouring schools also mentioned
that they had exposure to substance abuse prevention and HIV/Aids programme in primary
school. The only other information on substance abuse that they had access to, was mass-media
initiatives such as posters, radio and television campaigns. Although the learners said that they
had seen posters on substance abuse, one learner summed it up as follows: “I don’t read it. I just
see it. I don’t experience it in my life and that’s why I don’t give attention to it”.
Substance abuse was perceived to be a serious problem in most schools. Learners sometimes
smoked cannabis at school, and one learner said that alcohol abuse on the school premises was
common. Interestingly learners also smoked openly during the presentation of the programme at
two of the schools.
Alcohol and cannabis were perceived to be the most frequently abused substances. It also seems
as if authorities at different schools addressed the problem with different levels of seriousness. At
school 3, the police conducted random drug searches, while a learner at school 6 was of opinion
that the problem is denied. “Hulle steek dit weg” (They are hiding it) was his comment.
4.5.2 Perceived impact of programme Although learners said that a one day intervention was not sufficient, and that many learners felt it
was “a joke” and “...a nice way to miss class” most said that the programme had “a positive
impact”, mostly in terms of knowledge gained. Although one learner shared that he had stopped
using dagga after the program, most of the learners thought that the program did not influence a
large number of learners to discontinue the use of substances. They were aware that the physical
dependency on substances might require a rehabilitation session before the serious users would
quit.
Learners said that the programme might have been more effective in preventing substance abuse
and experimenting, rather than stopping already set patterns of behaviour. The programme’s

79
focus on the consequences of substance abuse, handling of peer pressure and guidelines for
helping a friend, were mentioned as contributing factors.
Learners concurred that although the programme addressed issues that they had heard about on
previous occasions, that it was good to repeat the message. Even though some learners reported
that they would have been able to resist experimenting with substances before the programme, it
was said that the intervention refreshed their memories and they were able to practice skills,
making them less vulnerable.
4.5.3 Gains from the programme
Amongst the things that learners could remember of the programme, they said to have gained the
following:
Knowledge:
Where pictures of drugs were shown, they could now better recognize drugs
They learnt that cigarettes contained many dangerous chemicals
They learnt about the consequences of substance abuse
In addition, in one school learners said that they had learnt about the many names for cocaine,
and LSD.
Skills:
Learners said that they had learnt how to say “no” through the role-plays
They were more certain of how to handle themselves at a party
Awareness was created:
Learners said that they were now more aware of the dangers of sexual abuse often coupled with
substance abuse
They were more aware of the negative consequences of substance abuse, alcohol consumption
and smoking cigarettes
One learner said that she was now also aware that Panado could be a drug
They were empowered
They were made aware that they could choose to achieve their dreams by saying no to drugs.
80
4.5.4 Programme highlights
Learners said that the role-plays were the most memorable part of the programme. The dramas
were said to be really enjoyable and fun and that it succeeded in bringing the programme’s
message across. The opportunity for open discussions and “debates” was also identified as a
major positive point for the programme. Furthermore, some learners were adamant that the
advice given during the programme was very positive. Learners also commented positively on the
fact that the questionnaires were anonymous, and that all the learners were treated on an equal
and respectful footing.
4.5.5 Programme challenges
The “long speeches” which was seen to be very boring and “made us [the learners] fall asleep”,
were areas that learners identified needed rethinking. Learners also said that they did not like it
when the presenter said things like “Dagga is bad” without giving reasons and opportunities for
learners to air their own viewpoints. The programme was perceived as being not visual or task-
involved enough.
4.5.6 Suggestions for improvement
The learners said that they would have liked to see pictures or examples of substances and some
shocking pictures to show the “before” and “after” effects of the face of a drug addict. They
suggested the incorporation of a video “to show us how it is in real life”. They also suggested that
a recovered drug addict speak to them about how he/she got into drugs, how he/she experienced
it, and how difficult it was to recover. Another learner suggested that learners visit a rehabilitation
centre.
Learners said that in order for them to make the choice whether or not to experiment with
substances, they needed more than just information about the consequences. They had to see it,
or experience it. One learner suggested that a “dagga zol” be passed around in class for learners
to really experience it. They said that learners would want to experiment with drugs, but that this
usually happened at home and was limited to drugs such as cannabis. They were generally
worried about being caught with drugs in their possession.
Other suggestions included the mobilisation of learners by means of dramas. Learners indicated
that professional drama’s or ones created by learners could be used to carry out the message to
the rest of the school and other schools. They did however feel strongly about the fact that they
did not have the expertise to initiate something like this, and suggested that someone from the

81
outside help them, or that teachers trained by an outside body assist. One learner suggested that
comedians or celebrities must be used to carry out the message in a fun and interactive way.
Learners suggested that similar programmes should already have been presented from a very
young age. They did however feel that drug enforcement was not effective and that drug dealers
should be eliminated before the problem will cease. One learner also related how a book about
drug abuse and the effects it had on the main character contributed towards his choice to stay
drug free. If books of this nature could be made available as an active part of the curriculum, the
message could reach more learners.
Other suggestions included that more information on the origin of drugs be included in future
programmes, and, if possible, shorter programmes should be presented to smaller groups at
regular intervals (e.g. once a week). Learners should be allowed to be actively involved in these
suggested sessions, with more varied activities including music and drama. The suggestion was
also made that more attention should be paid to the precipitating factors of drug abuse, and that
professional help should be made available to those already using substances.
4.5.7 Perceived reasons for drug abuse
Learners said that peers use drugs to feel good, and because they “want to be cool”. One learner
explained that if “you don’t know how to roll the dice and take your drugs... Ya... You feel like an
outcast” thus explaining the very real influence of peer group pressure.
They further reported that people in general are not aware of the negative consequences of drug
abuse when they start using drugs. Abuse of drugs such as cannabis is viewed as not having
serious short-term consequences, and is therefore not seen to be a serious threat. Learners were
adamant that if they were aware of the consequences, they still would not have sufficient skills to
handle peer pressure associated with drug usage. Additionally, it is accepted in certain social
circles that specific drugs enhances one’s ability to concentrate and perform better in sports.
Other drugs such as cannabis have medicinal qualities, and that it enhances one’s attraction to
the opposite sex.
The use of cannabis is often associated with the Rastafarian culture, which is seen to be “very
cool”. Because they believe in the use of cannabis for religious purposes, many learners aspire to
become part of this subculture. One learner said that people often say that they are Rastafarians
just to justify their drug abuse while they do not participate in any of the other Rastafarian
practices.

82
Some learners were of opinion that learners use drugs when they do not have any constructive
hobbies or anything better to do. Yet others said that using drugs were a way to feel better about
negative home circumstances. Hopelessness regarding job opportunities and the absence of
parental authority were seen to be major contributing factors to drug abuse.
4.5.8 Some programme presenters were more effective in addressing the issue in an
enjoyable manner
Although some presenters were seen to be boring, the ones that were more effective were
perceived to be
Funny, yet believable when they told kids those drugs “would make [them]... crazy”.
Treated learners with respect
Encouraged learners to be open and honest
Were very active
Didn’t moralize
Were friendly.
4.5.9 Conclusion
Focus group discussions indicate that the outcome of the programme was evaluated positively
and perceived by the learners as being effective at addressing the issues. They did however
indicate that the learners would have liked to be more involved and active throughout the
programme and that a longer-term programme was preferred. Although some learners had
thought it to be a big joke and would have stayed home if they knew the programme would be
presented, most learners in the group felt that the programme was a positive experience.
Additionally, they requested similar interventions on HIV/Aids.
4.6 Summary As mentioned previously, although data obtained from the learner survey fail to indicate any
significant changes in behaviour for the group as a whole, focus group interviews indicate that
learners perceived the programme as being effective and useful, and report several gains that
learners identified during focus group discussions.
83
Chapter 5 The following chapter will explore elements generated from results detailed in chapter 4.
Discussion According to Akerlund (2000) a sustainable program state priorities and systems, are community
driven, are of high quality, have ongoing evaluation and strong management and fiscal practices.
In addition the program should be of reasonable cost, have the potential for replication, allow for
modifications to meet changing community needs and provide technology transfer and other by-
products. Measured against these criteria Project Awareness certainly has room for improvement,
but if it is taken into account that the project was run and implemented by volunteer workers in
various professions, then the magnitude of the effort certainly becomes evident. Although the
programme did not produce any tangible proof of behavioural change, the implementation of
similar programmes is of paramount importance in providing learners with much needed
knowledge and skills. In addition to this, it broadens our understanding of factors that influence
behaviour. Additionally, the evaluation also did not attempt to indicate whether learners already
engaged in risk behaviour decided to change their behaviour in accordance with the messages of
the programme. It is recognized that true behaviour change is unlikely without the secondary and
tertiary level interventions originally intended by the project. The purpose of the focused school
intervention was to prevent risk behaviour amongst the learners not yet engaged in it and that
can only really be measured in a few years’ time. It is recognised that true behaviour change is
unlikely without the secondary and tertiary level interventions originally intended by the project.
To summarise the crux of the matter in the words of one of the learners who participated in the
programme:
“Maybe it should be taken more seriously...More people should be told about it; maybe more
programs can be done”
In addition to the previously mentioned recommendations in the results chapter, it is
recommended that the programme is co-ordinated with initiatives of the Central Drug Authority,
Local Drug Action Committees and Provincial Drug Forums as stipulated in the National Drug
Master Plan (1999). Although the amount of human resources successfully mobilised in this
project was quite amazing, liaising with other bodies might have made more financial resources
available thus relieving the strain on presenters and allowing them to be better equipped (e.g.
with items such as colour photo’s of drugs etc). It is also recommended that educators and
support staff be trained in order to incorporate some of these programmes’ objectives into the
general curriculum, as well as implement a more standardized programme. The following
84
sections will detail some discussion around various programmatic aspects and is presented in the
order of analysis detailed in chapter 4.
5.1 Behavioural Survey
Results of the behavioural survey items indicated that there was no significance change for the
whole group of learners between the pre- and post-test analysis. The research instrument used to
assess behavioural change limited the possible results and did not indicate any change in
behaviour after the programme due to problems with some of its items. The learners indicated in
the focus groups that, although behavioural change was not likely to occur after the programme,
learners might have been prevented from experimenting with drugs after the programme. This
could be confirmed by the fact that the behavioural survey indicated some change in attitude
regarding certain drugs and the use thereof.
The lack of adequate power analysis (the ability of a test to detect an effect, given that the effect
actually exists) at the start of the research procedure needs to be mentioned at this point. There
has been some indication that the effect sizes for drug prevention programmes have generally
been limited (Mays & Pope, 2006). The scale of measurement included in this study also did not
provide for much variance opportunities, further limiting the chances of obtaining a large effect
size. If the effect size is predicted to be low, then the statistical power of the measurements and
analysis needs to be very high in order to measure this effect. In this case, non-parametric tests
with relatively small samples certainly did not contribute towards the statistical power of the
analyses. It was thus expected that a certain degree of spuriousness would be encountered in the
analysis (Aron & Aron, 1997).
Rocha-Silva et al. (1996) further pointed out that it is widely acknowledged that all data-gathering
instruments have built-in validity problems. Survey questionnaires, whether self-completed or
not, is no exception, this relates in particular to studies on drinking or drug taking among
adolescents (Fossey, 1994; Loretto, 1994; May, 1992). May (1992:110) point out that:
“….in spite of difficulties, surveys has provided valuable insight
into the nature of the phenomenon of youthful drinking, from both
a regional and a national perspective. …What is most important,
though, is to recognize and explicitly acknowledge that survey
research can never determine the distribution of alcohol and
other drug use in any absolute sense across the young
population as a whole”.

85
It is necessary to clarify some methodological aspects before the opening of discussion around
the programme analysis. Additionally, it was planned to identify three control schools in terms of
the evaluation of the intervention. Due to problems in locating a third control group school with
similar demographic characteristics, it was decided to exclude data of schools in the control group
from the analysis.
The questionnaire proved to be somewhat problematic even though the items were based on
those used by Rocha-Silva et al. (1996), and no issues were detected during the pilot phase. It
was discovered that some questions were being misunderstood by the learners on analysis of the
first school’s data, specifically pertaining to the use of over- the- counter drugs (as the medical
usage thereof could be associated with abuse). When this problem was identified, researchers
and field workers were instructed to verbally explain questions to learners; yet results still
remained incommensurable with other findings. (For example, 37% of learners indicated in the
pre-test that they had abused over-the-counter pain relieving drugs in the past 30 days, whereas
other research (Rocha-Silva et al. 1996), indicated that this is usually less than 10% .
Additionally, there seemed to be some confusion regarding the prevalence of LSD and Steroids
usage. Although some learners indicated that they did not think it was right to use hardcore
drugs, and that they did not use any of the other drugs surveyed, some of them indicated that
they had used LSD (90% of learners surveyed during pre-test and 93% of learners during post-
test) and steroids (a pre-test measurement of 91% of all learners and a post-test score of 87%) in
the 30-day period preceding measurement. Since this combination of answers seemed highly
unlikely, it was concluded that some confusion might have arisen because of the street names for
LSD, which was also indicated, on the questionnaire (Candy, Smarties), and the reference to
steroids as muscle builders. This was rectified after the first measurement instance (first school
data collection process) by removing some of the street names from the questionnaire, in
addition to specifically stating that the remaining street names were not to mislead learners.
A serious shortcoming of the questionnaire was the lack of questions pertaining to the use of
cannabis. Although the questionnaire to some extent measured the learner’s attitude regarding
cannabis usage, no actual measure of personal cannabis usage was included. Focus group data
did however indicate that the use of this substance was particularly prevalent amongst high
school learners. Shortcomings in the research design and statistical power of the analyses thus
seriously hindered the adequate explication of results.
According to Conner and Norman (1995), longitudinally, both poor refusal skills and risk-taking
were associated with higher alcohol use. High personal competence was associated with lower

86
alcohol use in both the eighth and tenth grades, but had no long-term effects on alcohol use.
Findings highlight the close interplay between perceived competence and refusal skill efficacy,
both of which should be included as essential components of school-based prevention strategies.
Becker (1974) and Rosenstock (1974) have incorporated self-efficacy into their Health Belief
Model, mainly by reinterpreting what used to be "barriers" to action, while Ajzen (1988, 1991) has
extended the Theory of Reasoned Action to the Theory of Planned Behaviour by adding a
predictor labeled "perceived behavioural control”. Analysis on the whole group level indicated
that there was a negative significance (behavioural change but in a negative direction) in terms
of questions related to refusal skills where peer pressure was involved (item 3), however, analysis
indicates that the under-eighteen group saw the “uncertain” category decrease by 55% across
schools one, two, four, five and six. More learners that were uncertain on how to deal with peer
pressure said no after the programme (55%) in five of the schools.
Kirkpatrick’s second and third levels respectively focus on the skills, knowledge and attitude that
learners have gained as a result of the intervention. Additionally, it aims to expose the extent to
which behavioural change has or has not taken place. Behavioural intention was measured by
asking the individuals the likelihood that they will perform certain drug related behaviour. Analysis
of items geared towards measuring behavioural aspects in the survey indicated no statistically
significant difference. Attitude toward substance abuse, perceived behavioural control, and beliefs
about the subjective norm concerning drugs was assessed. Situational factors such as the
presence of peers (subjective norms) and normative beliefs play a critical part in behavioural
decisions. Interestingly enough, questions relating to self-worth and peer pressure as a predicator
to substance abuse and prevention featured prominently within the foregoing results, on both a
qualitative and quantitative platform (as seen in survey results for item 3.4 as well as data
gleaned from the focus groups).
5.2 Programmatic Delivery and Content According to Burkhart and Lopez (2002) an important factor in most school prevention
programmes is its delivery. According to their research, most secondary school based
interventions cue a “joint performance” (p.9) delivery system, wherein educators and
professionals cooperatively deliver programmes. This cooperation then, in turn, seems to
generally correlate with more favourable evaluation results. According to the National Institute of
Drug Abuse (2003), the evaluation of the effectiveness of an intervention should adhere to basic
prevention principles, including the enhancement of protective factors. It should target all forms of
substance abuse, should include a skills sub-component and attitudinal reinforcement of those
skills (including anti-drug norms), and in the case of adolescents, include interactive components
such as discussions and role plays. When compared to these guidelines, the programme design

87
of this intervention compares relatively favourably, as seen in the high involvement level of
learners during the interactive sections of the intervention as indicated by results obtained from
the observational and focus group data.
Additionally, the National Institute of Drug Abuse further outlines that successful prevention
programmes should be long term, with repeated interventions across time with a family
involvement component to strengthen the programme’s impact. It this regard, although the
original programme outline was to include multiple interventions over a series of time including
wider community involvement, the intervention does meet the required baseline of successful
programme design.
As previously stated, delivery of content varied greatly across the six schools (presented by six
different presenters in each school, which made it key to investigate observational data at site
level in order to determine whether this had an impact on results obtained from the evaluation.
According to Tobler (2001) non-interactive preventative substance abuse programme content
show a far smaller reduction in prevalence rate, while interactive programs shows a much more
significant reduction. Tobler (2001) further found that smaller interactive programmes are usually
more successful, probably due to program protocol being more closely followed. In general,
observational data seems to indicate that there were a sufficient number of interactive activities in
order to maintain a relevantly sufficient level of task-involvement amongst the learners.
When reviewing the results against the backdrop of Kirkpatrick’s Model, level one postulates that
if learners have a positive reaction to the initiative during its implementation, it is more likely that
positive outcomes will result. Although reactional output is by no means equivalent to actual
behavioural or attitudinal change, data gathered on this level proved to be insightful in gaining
information that could be used to improve future interventions. More specifically, the reactional
measures on level one were useful as to determine whether various course components
managed to maintain the learner’s interest, as well as the amount and appropriateness of
interactive exercises provided during the intervention. The program was generally able to grasp
the learner’s attention although both observational measures and the focus group data indicated
that learners needed a more practically oriented programme. The parts that involved learners
were evaluated very positively in the focus groups, and proved to keep the learners more task-
involved. When activities dragged on for too long, learners also seemed to loose interest in the
program. The need for more interactive activities was stressed, and it was suggested that shock
tactics be used to show learners what the real consequences of drug abuse was. The perceived
value and transferability to a greater context manifested itself in focus group data, where learners

88
indicated a greater awareness, however, transferability to a real life context could not be
accurately determined.
The Health Belief Model is essentially a decision making paradigm with elements of rationality,
but its main focus is on perception, with disease-threat as central concept. It is clear that the
likelihood that learners will adopt a valued health behaviour (abstaining from substance abuse),
or change a detrimental habit (ceasing or decreasing alcohol consumption) may therefore depend
on three sets of cognitions mentioned in the Health Belief Model in Chapter Two: (a) the
expectancy that one is at risk ("My risk of getting cancer from smoking is above average"), (b) the
expectancy that behavioural change would reduce the threat ("If I quit smoking, I will reduce my
risk"), and (c) the expectancy that one is sufficiently capable of adopting a positive behaviour or
refraining from a risky habit ("I am capable of quitting smoking permanently"). Self-efficacy can
therefore be identified as a critical aspect to the prevention process. Learners stressed the fact
that talking alone would not stop them from experimenting / using substances. A variety of
reasons was given for substance abuse that ranged from peer pressure and a fear of being
rejected, to the relief from hopelessness regarding lost or non-existing job opportunities or other
family conditions. It was suggested that the programme did touch on the lack of knowledge and
the inability to handle peer pressure, but that additional training would be necessary to address
some other factors contributing to substance abuse.
Dielman (1995) reports that changes in attitude and knowledge, does not always necessarily
correlate with subsequent behavioural changes. The lack of change in knowledge about
substance abuse might be explained by the fact that all the learners did not receive the same
information due to different presenters and across schools. Additionally, it is difficult to ascertain
change in knowledge from answers to open ended questions. From the focus group data it
became evident that the learners did in fact acquire some knowledge regarding the
consequences of substance abuse. The opportunity to practice skills pertaining to effective
handling of peer pressure was also seen as a valuable contribution made by the programme. The
programme and its contents were thus perceived by learners to have had at least some positive
outcomes (perceived benefit).
Overall, the program did attempt to influence the learners’ ability to choose from behaviours other
than substance abuse. They were made aware of other goals that might not be attainable if they
did indulge in substance abuse (self-efficacy). In terms of the health belief model the programme
was perceived to be successful to some degree in triggering appropriate health behaviour only
amongst learners that did not already use drugs. The lack in behavioural change did however
confirm that other aspects (from the ones addressed in the programme) might be necessary in
89
order for learners to take action in line with the belief that their health might be in danger
(perceived threat). An additional explanation for the lack of significant change amongst learners
could also be that the percentage of substance abuse was low, which makes it more difficult to
detect any behavioural change.
It is possible that each model applies to different situations. For example, the fear-based nature of
the Health Belief Model may be most appropriate in adult populations or those already involved in
substance abuse, or in those where prevention of the complications of substance abuse is a key
issue. This model may not be applicable among children who are blind to their vulnerabilities, as
requested by learners to have these interventions at an earlier age during the focus groups. A
categorisation of situations by levels of need and type of population may be valuable for
delineation of when each model is appropriate. Emotions (depression, anxiety, and arousal) are
important aspects of behaviour. Depression and anxiety may be particularly important aspects of
substance abuse. According to Bagozzi, Baumgartner and Pieters (1998) only investigators in
the tradition of Theory of Planned Behaviour have made substantial attempts to incorporate
emotion-related variables. In future research, it seems that the greatest benefits would be
attained by pursuing research within the Theory of Planned Behaviour tradition.
One can but wonder if there isn’t a need to add cultural aspects of disease perception into the
model as well as in prevention programme content. Cultural definitions of disease and illness
vary, for example beliefs about the intake of certain substances viewed by Western society as
harmful, yet viewed medicinally elsewhere. It is therefore important to recognize that accurate
knowledge and misconceptions can coexist. Sigelman, Rinehart, Sorongon, Bridges and Wirtz
(1993) cautions that learners should be taught not only not only what a given substance does to
undermine health but what it does not do, which, in the case of the intervention, may have been
an effective way to train around learner’s seemingly acceptable attitude towards the usage of
dagga and the debate that was triggered between learners in some of the schools and the
specific presenters of the programme.
In order to overcome any programmatic disadvantages of being implemented in various cultural
and social contexts (wherein standardisation becomes difficult due to heterogeneity encountered
in schools across South Africa), some programme presenters resort to adapting material
themselves instead of following the set programme in the moderators manual (Burkhart & Lopez,
2002, p.12). The presentation of content followed the guidelines of the original programme, but
was adapted to the specific needs of the implementation environment. Presenters showed a high
level of adaptability during the delivery of this programme, using both adaptive techniques and
self-developed material (mostly in the form of handouts) during this programme, often substituting
90
their own handouts when not being able to show a video due to lack of electricity. Thus, the
programme was not delivered uniformly across sites.
Regarding Kirkpatrick’s fourth level of measurement (the results or payoff level), no measurement
was conducted; however, levels of cooperation with other departments and stakeholders can be
deemed a resounding success during the implementation of this intervention when looking at the
implementation of the programme. Combining resources of fifteen organizations within the larger
school focused intervention, this programme is a step in the right direction where the focus was
on knowledge, competencies and skills assembled and therefore assisted in the improvement of
learner knowledge, attitudes and behaviour where substance abuse is concerned (as indicated in
the focus group results).
5.3 Observational Data
The modality of presentation, the amount of time spent on each activity, and the presenter’s
capability to handle discipline, were found to be more accurate predictors of non-task – learner
involvement than the actual programmatic content. Although the presenters were flexible enough
to adapt to the different limiting circumstances, the lack of standardisation across presenters,
programmatic content and various school related factors might have negative implications for the
attainment of outcome-related goals in general.
Programme sections that require learner attention for a long period of time should be moved to
the first program segment, or shortened and varied with more interactive activities. Activities after
learners have returned from break also generally correlated higher task –noninvolvement levels.
It is suggested that some form of energiser be included in the programme after each break.
Furthermore, more interactive modalities could be utilised to part with information that is more
important. Activities could be shortened in order to keep the learners interested, and to allow
presenters to adequately manage the time allocated to the programme.
Themes that were identified to be effective across the majority of schools and presenters during
the second half of the programme included interactive activities such as videos and the
“protective jacket” exercises, (protective factors are pinned on a learner’s jacket) and debates.
Small group discussions proved to be more effective when the instructions were given clearly,
and groups were small enough that the learners had to participate. In future, presenters may want
to consider writing down the questions of the learners as they are asked. Learners could then be
divided into small groups to discuss these questions, ensuring that everyone has the opportunity
to participate. This will also aid the presenter to comment on learner feedback.

91
Programme content could be enhanced by updating language to speak more directly to the
learner’s cultural and direct experiences, and care should be taken to explain any terminology
that may have been unfamiliar to some learners.
On a logistical level, the presenters involved proved to be both resourceful and flexible,
improvising often around difficult circumstances (lack of resources, time constraints and lack of
human resources), and should be commended for their overall commitment to the project.
5.4 Gender and age related factors
Learners in the older age bands (a significantly smaller proportion of the sample as illustrated in
figure 7), interestingly had a minimal number of responses in the “uncertain” category (4% of the
total respondents in those age bands across both the pre-and post-test), reporting either “yes” or
“no” responses in the survey. According to Bocknek (1980), who makes a case for age and
gender specific interventions, this is congruent with older adolescents’ “absolute idealism”, where
the adolescent is likely to ignore subtle differences and tend to judge in strongly polarized
extremes due to limited experience of the reality and complexity of adult life, which may account
for the low number of survey responses in the “uncertain” category amongst the older age bands
as detailed in chapter 4. It is argued that older adolescents will respond to interventions which
are direct, linked to role models and peer education.
The National Institute on Drug Abuse (2006) has conducted longitudinal research, which has
shown that gender differences play a role from the very earliest opportunity to use drugs.
Females and males tend to abuse different drugs, that the effects of drugs are different in terms
of gender, and that some approaches to treatment are more successful depending on gender.
Griffin, Weiss, Mirin, and Lange (1989) confirm that, though more males than females use drugs,
the consequences of drug use by women are often more severe, and after initial use, women may
proceed more rapidly to drug abuse than men. Although analysis of data revealed no significant
differences between responses investigated by gender, there seems to be a strong case for more
gender specific programmes as well as more research to understand gender differences in terms
of substance abuse.
5.5 The programme in relation to other interventions
According to Sussman (1996) drug abuse prevention programs that have worked with general
populations of younger adolescents in junior high and middle school in the United States are less
likely to be effective with older, at-risk high school students. Learners in high schools present a
complex mix of behavioural and social problems and come into daily contact with many other
students who use drugs and have a favorable attitude toward substances. Caulkins, Liccardo,

92
Paddock and Chiesa (2002) believe that while cutting-edge prevention programs are a wise use
of public funds, it is mainly because they are relatively cheap and because drug use is so costly
to society, and not because the programs, even the model ones, eliminate a large proportion of
drug use. In fact, the best estimates obtained by Caulkins and his colleagues in the United States
are that prevention reduces lifetime consumption of tobacco by 2.3%, abuse of alcohol by 2.2%,
and use of cocaine by 3.%. Caulkins et al. (2002) stresses however, that most of the reductions in
use occur several years after the program is implemented, so the present value of those
reductions, discounted at 4% per year, is only about half as great as their nominal value.
Considering that longitudinal and much more comprehensive projects like The Lions-Quest Skills
for Adolescence, which consists of 40 sessions (lower rates of lifetime (27.24% vs. 30.5%) and
recent marijuana use (11.32% vs. 13.79%), and Project TND, which consists of 12 sessions
(successfully effecting cigarettes, marijuana, alcohol, and hard drug use at a 1-year follow-up)
,show marginal success rates, it seems impressive that a one day, limited cross-sectional
substance abuse prevention programme can affect some positive change despite its limitations.
In fact, according to Cagampang, Barth, Korpi and Kirby (1997), smaller-scale interventions
appeared to be more effective than large-scale programs. Cagampang et al. (1997) argues that it
may be that, in large-scale studies, it becomes harder to control for confounding variables that
may have an adverse impact on the outcomes. Additionally, Cagampang et al. (1997) points out
that the length or duration of the programme, which has often been singled out, as a potential
explanation of the absence of significant behavioural effects in larger-scale evaluations, does not
appear to be consistently associated with desired behaviour.
Despite some glaring differences in terms of duration approach and resources, there are some
similarities between these larger initiatives and the programme under investigation – all of these
initiatives recognise the need for participatory activities, including small group activities, role-
playing exercises, guided classroom discussions and videos that assist learners in establishing
anti-substance norms and resist pro-substance pressures. It is clear that there seem to be mixed
results when it comes to substance abuse programmes. It is therefore advisable that preventive
interventions focus on the specific needs and associated risk factors of the target group, and that
one size does not necessarily fit all where prevention is concerned.

93
5.6 Conclusion
At post-test measurement, results of the behavioural survey failed to reveal significant change,
however, focus group participants rated the program favourably on several parameters; indicating
that the learners viewed the programme as being effective in addressing substance abuse issues.
Additionally, learners were able to identify several gains in terms of knowledge, skills,
empowerment and heightened awareness during focus group discussions.
In addition to the previously mentioned recommendations in the results chapter, it is
recommended that the programme is co-ordinated with initiatives of the Central Drug Authority,
Local Drug Action Committees and Provincial Drug Forums as stipulated in the National Drug
Master Plan (1999). Although the amount of human resources successfully mobilised in this
project was quite amazing, liaising with other bodies might have made more financial resources
available thus relieving the strain on presenters and allowing them to be better equipped (e.g.
with items such as colour photo’s of drugs etc). It is also recommended that educators and
support staff be trained in order to incorporate some of these programmes’ objectives into the
general curriculum, as well as implement a more standardised programme.
The findings of this study lend modest support to school-based substance abuse interventions
with foci on strengthening certain protective factors among adolescents in a school setting, as
well as certain programmatic components to be included in future interventions. Interventions,
which involve the collaborating of various stakeholders towards a common outcome, should be
encouraged and acknowledged as an integral part in the battle against substance abuse among
youth in South Africa.
As such, a short-term substance abuse prevention programme can positively affect learner’s
outlook despite its weaknesses. The study’s data lay the foundation for additional work to
advance substance abuse prevention programme design and delivery, perhaps around the
aspect of ethniticity, gender, age and cultural bias. More interdisciplinary prevention and
research should be conducted around substance abuse in South Africa. There should be a
movement away from Eurocentric approaches towards creative solution to suit Africa’s culturally
vibrant and diverse groupings.
94
References
American Institute of Medicine. (1994). Reducing risks for mental disorders. DHHS Publication
Nr (ADM/87-1492), Rockville, MD, Department of Health and Human Services.
American Psychiatric Association (APA) (2000). Diagnostic and statistical manual of mental
disorders. Washington, DC: American Psychiatric Association.
Ajzen, I. (1987). Attitudes, traits, and actions: Dispositional prediction of behavior in personality
and social psychology. In L. Berkowitz (Ed.), Advances in experimental social psychology (Vol.
20, pp. 1-63). New York: Academic Press.
Ajzen, I., Timko, C. & White, J. B. (1982). Self-monitoring and the attitude-behavior relation.
Journal of Personality and Social Psychology, 42, 426-435.
Ajzen, I. (1991). The theory of planned behaviour. Organizational Behaviour and Human Decision
Processes, 50, 179-211.
Ajzen, I., Bamberg, S. & Schmidt, P. (2003). Choice of Travel Mode in the Theory of Planned
Behaviour: The Roles of Past Behaviour, Habit, and Reasoned Action. Basic and Applied Social
Psychology, 25(3), 175-187.
Ajzen, I. & Fishbein, M. (1970). The prediction of behaviour from attitudinal and normative
beliefs. Journal of Experimental Social Psychology, 6, 466-487. Ajzen, I. (1991). The theory of planned behaviour. Organizational Behaviour and Human Decision
Processes, 50, 179-211.
Ajzen, I. & Fishbein, M. (1980). Understanding attitudes and predicting social behaviour.
Englewood Cliffs (NJ): Prentice-Hall.
Akerlund, K. M. (2000). Prevention program sustainability: The state’s perspective. Journal of
Community Psychology, 28(3), 353-362.
Alliger, G. & Janak, E. (1989). Kirkpatrick’s Level of Training Criteria: Thirty years later.
Personnel Psychology, 42(3), 331-342.

95
Alliger, G., Tannenbaum, S., Bennett, W., Traver, H., & Shotland, A. (1997). A meta-analysis of
the relations among training criteria. Personnel Psychology, 41, 63-105.
Aron A. & Aron, E.N. (1997). Statistics for the behavioural and Social Sciences. Upper Saddle
River: Prentice Hall.
Arthur, M.W. & Blitz, C. (2000). Bridging the gap between science and practice in drug abuse
prevention through needs assessment and strategic community planning. Journal of Community
Psychology, 28(3), 241-255.
Azjen, I., Timko, C. & White, J.B. (1982). Self-monitoring and the attitude-behaviour relation.
Journal of Personality and Social Psychology, 42, 426-435.
Bagozzi, R.P., Baumgartner, H., Pieters, R. (1998) Goal-directed emotions. Cognitive Emotion
12, 1-26.
Becker, M.H. (1974). The Health Belief Model and Personal Health Behavior. Health Education
Monographs, 42(4).
Bernthal, P.R. (1995). Evaluation that goes the distance. Training & Development, September,
41-45.
Blanchard, N., & Thacker, J. (1999). Effective Training: Systems, Strategies and Practices.
Alabama: Prentice Hall.
Bloor, M. (1967). Bishop Berkeley and the Aden tonsillectomy enigma: an exploration of the
social construction of medical disposals. Sociology, 10, 43-61.
Bocknek, G. (1980). The young adult. Monterey, California: Brooks and Cole.
Boverie, P., Sanchez-Mulcahy, D. & Zondle, J.A. (1994). Evaluating the effectiveness of training
programs. [Online] Available at http://hale.pepperdine.edu/cscunha/Pages. Accessed January
2006.
Botvin, Gilbert J., and E.M. Botvin. 1992. Adolescent Tobacco, Alcohol, and Drug Abuse:
Prevention Strategies, Empirical Findings, and Assessment Issues. Journal of Behavioral
Pediatrics, 13, 290-301.

96
Botvin, G.J. & Griffin, K.W. (1990). Life skills training: Theory, method and effectiveness of drug
abuse prevention approaches. New York: Elsevier Science Ltd.
Brogan, D.R. & Kutner, M.H. (1990). Comparative analysis of pretest-post-test research designs.
The American Statistician, 34, 229-232.
Bry, B. (1982). Reducing the incidence of adolescent problems through preventive interventions:
One- and five- year follow up. American Journal of Community Psychology, 10, 265-276.
Burrow, J. & Berardinelli, P. (2003). Systematic performance improvement – refining the space
between learning and results. Journal of workplace learning, 15, 15-21.
Burkhart, M. & Lopez, F. (2002). Screening family planning needs. An operations research project
in Gautemala. [Online] Available at http://biomedcentral.com. Accessed January 2006.
Cagampang, H., Barth, R., Korpi, M. & Kirby, D. (1997). Education Now And Babies Later
(ENABL): life history of a campaign to postpone sexual involvement. Family Planning
Perspectives, 29, 109–114.
Calnan, W.E. & Moss, S. (1984). The Health Belief Model and compliance with education given at
a class in breast self-examination. Journal of Health and social behaviour, 25(2),198-210.
Catalano, R.F., Kosterman, R., Hawkins, J.D., Newcomb, M.D., & Abbott, J.D. (1996). Modeling
the etiology of adolescent substance use: Test of the social development model. Journal of drug
issues, 26(2), 429-455.
Caulkins, J.P., Liccardo, R., Paddock, S., Chiesa, J.A., (2002). School-Based Drug Prevention:
What Kind of Drug Use Does It Prevent? Santa Monica: Rand.
Clark, D. (2003). Epic White paper: Evaluation of learning. London: Epic.
Clark, Donald. (1997). Instructional System Development, evaluation phase Chapter VI [Online]
Available at www.nwlink.com/~donclark/hrd/sat6.html. Accessed September 2004.
Clement, U. (1990). Surveys of heterosexual behaviour. Annual Review of Sex Research, 1, 45–
74.

97
Clementz, A. R. (2003). Programme level evaluation: Using Kirkpatrick’s four levels of evaluation
to conduct systematic evaluation of undergraduate college programs. Faculty Development
Center. Bryant University. [Online] Available at http://web.bryant.edu/. Accessed September
2003.
Cook, T.D. & Cambell, D.T. (1979). Quasi-Experimentation Design and Analysis Issues for Field
Settings. London: Houghton Mifflin Company.
Conner, M., & Norman, P. (1995). Predicting Health Behaviour: Research and Practice with
Social Cognition Models. Buckingham: Open University Press.
Conrad, K. M., Flay, B. R., & Hill, D. (1992). Why children start smoking cigarettes: Predictors of
onset. British Journal of Addiction, 87, 1711-1724.
Declaration and Plan of Action on Drug Abuse and Illicit Trafficking Control in Africa. (1996). Addis
Ababa: Organization of African Unity.
De Vaus, D.A. (1993). Surveys in Social Research (3rd Ed.). London: UCL Press.
Dielman, T.E. (1995). School-Based Research on the Prevention of Adolescent Alcohol Use and
Misuse: Methodological Issues and Advances. Hillsdale, United Kingdom: Lawrence Erlbaum and
Associate Publishers.
Drug Advisory Board, Department of Welfare (1999). National Drug Master Plan: Republic of
South Africa 1999 – 2004. Cape Town: CTP Book Printers.
Drug Advisory Board (1999). National Drub master Plan. Retrieved 2007, from
http://www.info.gov.za/view/DownloadFileAction?id=70476
Drug Advisory Board (2006). National Drug Master Plan 2006 - 2011. Retrieved 2006, from
http://www.dsd.gov.za/manuals/master_plan.pdf
Du Pont, R.L., (1989). Stopping alcohol and other drug use before it starts: The future of
prevention (OSAP prevention monograph 1). Rockville, MED: US Department of Health and
Human Services, Alcohol, Drug Abuse and Mental Health Administration.
98
ESOMAR. (2000). ESOMAR Guideline: Tape and video-recording and client observation of
interviews and group discussions. [Online]. Available at http://www.ESOMAR.co.uk. Accessed
January 2000.
Fenton, K., Johnson, A., McManus, S., and Erens, B. (2001). Measuring sexual behaviour:
Methodological challenges in survey research. Sexual Transmission and Infection. 77(2), 84–92.
Fishbein, M., & Ajzen, I. (1975). Belief, Attitude, Intention, and Behavior: An Introduction to
Theory and Research. Reading, MA: Addison-Wesley.
Fishbein, M., Triandis, H.C., Kanfer, F.H., Becker, M., Middlestadt, S.E. and Eichler, A. (2001)
Factors influencing behavior and behavior change. In Baum, A., Revenson T.A. and Singer, J.E.
(eds), Handbook of Health Psychology. New Jersey: Erlbaum.
Flisher, A.J., Ziervogel, C.F., Chalton, D.O. & Robertson, B.A. (1999). Risk-taking behaviour of
Cape Peninsula high school students. South African Medical Journal, 83(7), 469-497.
Ferguson, G.A. (1981). Statistical Analysis in psychology and Education. (5th Ed.). Singapore:
McGraw Hill.
Fossey, E. (1994). Growing up with alcohol. London. Routledge.
Gillis, H. (1996). Counselling young people. Tshwane: Sigma.
Griffin, M.L., Weiss, R.D., Mirin, S.M. & Lange, U. (1989). A comparison of male and female
cocaine abusers. [Online]. Available at
http://archpsyc.amaassn.org/cgi/content/abstract/46/2/122. Accessed June 2006.
Glanz, K., Marcus Lewis, F. & Rimer, B.K. (1997). Theory at a Glance: A Guide for Health
Promotion Practice. London: National Institute of Health.
Greenberg, M., Kusche, C., Cook, E., & Quamma, J. (1995). Promoting emotional competence in
school-aged children: The effects of the PATHS curriculum. Development and Psychopathology
7, 117-136.
Goffman E. (1961). Asylums. Harmondsworth: Penguin.
99
Guthrie, B., & Flinchbaugh, L. (2001). Gender-specific substance prevention programming: Going
beyond just focusing on girls. Journal of Early Adolescence, 21(3), 354-372.
Hansen, W.B. & Kaftarian, S.J. (1994). Improving methodologies for the evaluation of community-
based substance abuse prevention programs. Journal of Community Psychology CSAP special
issue, 3 – 5.
Hansen, W.B. & Kaftarian, S.J. (1994). Strategies for comparing multiple – site evaluation under
non-equivalent design conditions. Journal of Community Psychology CSAP special issue, (3)
170-187.
Hawkins, J.D., Catalano, R.F., Kosterman, R., Abbott, and Hill, K.G. (1999). Preventing
adolescent health risk-behaviours by strengthening protective protection during childhood.
Archives of Pediatric and Adolescent Medicine, 153,: 226-234.
Hawkins, J.D., Catalano, R.F., & Miller, J.Y. (1992). Risk and Protective Factors for Alcohol and
other Drug Problems in Adolescence and Early Adulthood: Implications for Substance Abuse
Prevention. Psychological Bulleting, 112, 64-105.
Hesketh, B. & Ivancic, K. (2001). Enhancing performance though training, in S. Sonnentag (Ed).,
The psychological management of individual performance in organization. London: Sage.
Holton, E. (1996). Training design/delivery/evaluation, E-learning, Team training. HRD quarterly,
7(1), 5-21. [Online]. Available at http://hale.pepperdine.edu/~cscunha/Pages/Kirk.htm Accessed
December 2004.
Janz, N. K., & Becker, M. H. (1984). The health belief model: A decade later. Health Education
Quarterly, 11(1), 1-47.
Johnson A.M., Copas A., & Field J.D. (1999). Computerised self-completion interviews influence
the reporting of sexual behaviours? A methodological experiment. Proceedings of the Thirteenth
Meeting of the International Society for Sexually Transmitted Diseases Research, Denver
Colorado, 11–14 July, 1999.
Johnson, E.M., Amatetti, S., Funkhouser, J.E. & Johnson, S. (1988). Theories and models
supporting prevention approaches to alcohol problems among youth. Public Health Reports, 103
(6), 578-585.
100
Kandel, D.B. (1978). Convergences in prospective longitudinal surveys of drug use in normal
populations. In: Kandel, D.B., ed. Longitudinal Research on Drug Use: Empirical Findings and
Methodological Issues. Washington, DC: Hemisphere (Halsted-Wiley).
Kandel, D.B. (1980). Drug and drinking behaviour among youth. Annual review of Sociology, 6, 235-285.
Kandel, D.B. (1982). Epidemiology and psychosocial perspectives on adolescent drug use.
Journal of American Academic Clinical Psychiatry, 21,328-347.
Keister, S. (2000). Lions-Quest Skills for Adolescence. [Online] Available at: http://lions-
quest.org/downloads/LCIF_311_SFA-SMAHSA_brochure.pdf . Accessed 13 June 2007.
Kellehear, A. (1993). The unobtrusive researcher: A guide to methods. New South Wales:
Allen and Unwin.
Kirkpatrick, D. (1976). Evaluation of Training. New York: McGraw-Hill.
Kirkpatrick, D. (1994). Evaluating training programs. The four levels. San Fransisco, CA:
Berrett-Koehler.
Kirkpatrick, D. (1996). Revisiting Kirkpatrick’s four level model, part of Great Ideas Revisited
series in Training & Development, January, 54-59.
Kitzinger Jenny (1994). The methodology of Focus Groups: the importance of interaction between
research participants. Sociology of Health and Illness, 16, 103-121.
Kruse, K. (2003). “Evaluating e-Learning: Introduction to the Kirkpatrick Model.” [Online]
Available at http://www.e-learningguru.com/ Accessed 15 January 2005.
Lang, C., Rosait, M., Jones, A., & Garcia, T. (1996). Tackling the tough ones: Tools for
community change. Newton, Massachusetts: Education Development Center, Incorporated.
Lochman, J. (1992). Cognitive-behavioural intervention with aggressive boys: Three-year follow-
up and preventive efforts. Journal of Counselling and Clinical Psychology, 60, 426-432.
Loretto, W.A. (1994). Youthful drinking in Northern Ireland and Scotland: Preliminary results
from a comparative study. Drugs: Education, Prevention and Policy, 1(2), 143-152.

101
Lonczak, H.S., Abbott, R.D., Hawkins, J.D., Kosterman, R., and Catalano, R.F. (2002). Effects of
the Seattle Social Development Project. Archives of Pediatric and Adolescent Medicine, 156,
438-447.
Marcoux, B.C. & Shope, J.T. (1997). Application of the Theory of Planned Behaviour to
adolescent use and misuse of alcohol. Journal of Health Education Research, 12(3), 323-331.
Marlatt, G.A., Baer, J.S., & Quigley, L.A. (1994). Self-efficacy and addictive behaviour. In A.
Bandura (Ed.), Self-efficacy in changing societies. Marbach, Germany: Johann Jacobs
Foundation.
Marlatt, G.A., Curry, S., & Gordon, J.R. (1988). A longitudinal analysis of unaided smoking
cessation. Journal of Consulting and Clinical Psychology, 56, 715-720.
Marlatt, G.A., & Gordon, J.R. (Eds.). (1985). Relapse prevention. New York: Guilford.
Matzopoulos R., Seedat, M. & Marais, S. (2004). A profile of fatal injuries in South Africa: a
platform for safety promotion. MRC Policy Brief. 2004, 2, 1–8.
May, C. (1992). A burning issue? Adolescent alcohol use in Britain 1970-1991. Alcohol and
Alcoholism, 27(2), 109-115.
Mays, N. & Pope, C. (2006). Qualitative research: Observational methods in health care settings
[Online] Available at http://bmj.bmjjournals.com/cgi/content/full/311/6998/182. Accessed June
2006.
McManus, S., Erens, B., Field J., Johnson, A.M., Mercer, C.H., Wellings, K., Macdowall, W.,
Nanchahal, K., & Fenton, K.A. (2004). The National Survey of sexual Attitudes and Lifestyles:
summary of key findings. AIDS & Hepatitis Digest, 2004, 99.
Mathias, R. (1996). Protective factors can buffer high-risk youths from drug use [Online]
Available at http://www.nida.nih.gov/NIDA_Notes/NNVol11N3/Protective.html. Accessed October
2006.
McCormack, K. (1999). The Health Belief Model. University of South Florida, Florida.
Miles, M. B., & Huberman, A. M. (1994). Qualitative data analysis (2nd Ed.). Thousand Oaks, CA:
SAGE.

102
Millman, R.B., & Botvin, E.M. (1992). Substance use, abuse and dependence In Levine, M.,
Carey, N.B., Crocjer, A.C. & Gross, R.T. (Eds.). Development-behavioural pediatrics (2nd Ed.).
New York: W.B. Sauners Co.
Mittman, R. & Cain, M. (2001). The future of the Internet in health care. Chapter in The Internet
and Health Communication: Experiences and Expectations, ed. Ronald E. Rice and James E.
Katz. Thousand Oaks, CA: Sage Publications.
Morojele, N.K., and Stephenson, G.M. (1994). Addictive behaviours: predicting intentions and
expectations in the theory of planned behaviour. In D. Rutter and LO Quine (Eds). Social
Psychology and Health: European Perspectives. Aldershot: Averbury.
Morojele, N.K., Flisher A.J., & Muller M. (2002) Measurement of risk and protective factors for
drug use and anti-social behaviour among high school students in South Africa. Journal of Drug
Education. 2002, 32, 25–39.
Morojele, N.K., Knott, R., Myburg, H., & Finkelstein, N. (1997). Audit of school-based substance
abuse prevention programmes in Cape Town. [Online] Available at
http://www.sahealthinfo.org/admodule/schoolaudit.htm. Accessed October 2006.
Morgan, D.L. (1997). Focus groups as qualitative research: Qualitative research methods Series
Vol.16. Thousand Oaks: Sage.
National Institute on Drug Abuse. (1996). Preventing drug use among children and adolescents:
A research-based guide. [Online] Available at www.nida.gov/prevention/prevopen .html.
Accessed March 2006.
National Institute on Drug Abuse. (2003). Drug abuse prevention intervention for women and
minorities. [Online] Available http://www.nida.gov/prevention/guides.html. Accessed 30 October
2006.
National Drug Control Strategy (1997). [Online] Available http://www.ncjrs.gov/htm/toc.htm.
Accessed in September 2006.
Newcomb, M.D. & Bentler, P.M. (1989). Substance use and abuse among children and
teenagers. American Psychologist, 44, 242-248.

103
Nigg, C.R., Allegrante, J.P. and Ory, M. (2002). Theory-comparison and multiple-behavior
research: common themes advancing health behavior research. Health Education Research, 17,
670–679.
Parry, C.D.H. & Bhana, A. (1997). South African Community Epidemiology Network on drug use
(SACENDU): drug abuse trends: Proceedings of Report Back. [Online] Available at
http://www.sciencedirect.com/science?. Accessed June 2006.
Parry, C.D.H., Bhana, A., Myers, B., Plüdderman, A., Siegfried, N., Morojele,N., Flisher, A.J. &
Kozel, N.J. (2002). The South African Community Epidemiology Network on drug Use
(SACENDU): Description, findings (1997-1999) and policy implications. Addiction, 97, 969-976.
Parry, C.D.H., Morojele, N.K. & Flisher AJ. (2004). Social and neighbourhood correlates of
adolescent drunkenness: a pilot study in Cape Town, South Africa. Journal of Adolescence, 27,
369–374.
Parry, C.D.H., Pluddeman, A., Bhana, A., Matthysen, S., Potgieter, H. & Gerber, W. South African
Community Epidemiology Network on Drug Use (SACENDU). Alcohol and drug abuse trends:
January – June 2001. [Online] Available at www.mrc.ac.za. Accessed June 2006.
Parry, C.D.H, Plüddemann, A. & Steyn, K. (1998). Alcohol use in South Africa: findings from the
first demographic and health survey, 66, 91-97.
Parry, C.D.H. (2005). A review of policy relevant strategies and interventions to address the
burden of on individuals and society in South Africa. South African Psychiatric Review; 8; 20-24.
Peat, J., Mellis, C., Williams, K. & Xuan W. (2002). Health Science Research: A Handbook of
Quantitative Methods. London: Sage.
Peltzer, K., Cherian, V.I. & Cherian, L. (1999). Substance use among rural secondary school
pupils in the Northern Province, South Africa. Journal of Psychology in Africa, 9 (1), 5-16.
Pytel, B. (2007). Student Substance Abuse. [Online]. Available at http://student-health-
issues.suite101.com/article.cfm/student_substance_abuse. Accessed July 2007.

104
Reddy, S.P., Panday, S., Swart, D. (2002). Umthenthe Uhlaba Usamila - The South African
youth risk behaviour survey 2002. Cape Town: South African Medical Research Council.
Reber, A.S & Reber, E.S. (2001). The Penguin Dictionary of Psychology.( 3rd ed.). Penguin
Books.
Reeves, T. & Hedberg, J.G. (2003). Interactive learning systems evaluation. Engelwood Cliffs
(NJ): Educational Technology Publications.
Regis, D. (1990). Self-concept and conformity in theories of health education. School of
Education, University of Exeter.
Richter, L., Panday, S., Emmett,T., Makiwane, M., Du Toit, R., Brooks, H., Potgieter, C., Altman,
M. & Makura, M. (2006). Young people in South Africa: The status of youth report 2003: Final
report. Research commissioned by the Umsobomvu Youth Fund, Pretoria: Human Sciences
Research Council.
Roche-Silva, L., de Miranda, S. & Erasmus, R. (1996). Alcohol, Tobacco and other drug use
among South African Youth. Pretoria: Human Sciences Research Council.
Roche-Silva, L., Mokoko, E. & Malaka, D. (1998). Drug use in South Africa. Center for Alcohol
and drug related research. Pretoria: Human Sciences Research Council.
Rosenstock, I. M. (1974). Historical origins of the health belief model. Health Education
Monographs, 2, 328-335.
Rosenstock, I.M. (1990). The Health Belief Model: Explaining Health Behaviour Through
Expectations. In K.Glanz, F.M. Lewis & B.K. Rimer (Eds.) Health behaviour and Health
Education 3, 39-59. San Fransisco: Jossey Bass.
Searll, A. (1995). Getting High on Life. Struik Publishers: Cape Town
Siegel, S. (1956). Nonparametric statistics for the behavioral sciences. New York: McGraw-Hill.
105
Sigelman, C.K., Rinehart, S.C., Sorongon, A.G., Bridges, L.J. & Wirtz, P.W. (1993). Teaching a
coherent theory of drug action to elementary school children. [Online) Available at
http://her.oxfordjournals.org/cgi/content/abstract/19/5/501. Accessed February 2006.
Snyder, M. (1974). Self Monitoring of expressive behavior. Journal of Personality and Social
Psychology, 30, 526-537.
Sussman, S. (1996). Development of a school-based drug abuse prevention curriculum for high-
risk youths. Journal of Psychoactive Drugs, 28(2),169-182.
Tamkin, P., Yarnall, J. & Kerrin, M. (2002). Kirkpatrick and beyond: A review of models of training evaluation.
[Online] Available at http;//employment-studies.co.uk/summary/summary.php. Accessed May 2006.
Tarter, R. (2006). Applying Prevention Theory to prevention practice. Pittsburgh: CEDAR.
Terre Blanche, M. & Durrheim, K. (1999). Research in practice: Applied methods for the social
sciences. Cape Town: University of Cape Town Press.
Tobler, N.S. (2001). The value of interactive training in schools. Journal of Primary Prevention
20(4), 261 – 274.
Visser, M.J. & Routledge, L. (2007). Substance Abuse and Psychological well-being of South
African adolescents in an urban context. Pretoria: Unpublished Article.
World Drug Report. (1997). Oxford: Oxford University Press.
World Health Organization. (1992). A guideline for assessing alcohol and drug prevention
programs. Geneva: World Health Organization.
World Health Organization. (1993). WHO Expert Committee on Drug Dependence. Twenty-eighth
Report. Geneva: World Health Organization.
World Summit for social development. (1995). New York: United Nations.
Worthen, B.R. & White, K.R. (1987). Evaluating educational and social programs: Guidelines for
proposal review, onsite evaluation, evaluation contracts and technical assistance. Boston:
Kluwer- Nijhoff Publishing.

106
Yamada, T., Kendix, M. & Yamda, T. (1996). The impact of Alcohol consumption and Marijuana
use on High school graduation. Health Economics, 5, 77-92.
Zafar, S. (1998). School-based initiatives to address racial and cultural diversity in newly
integrating public schools. Unpublished Education Policy Unit Report, University of Natal.

107
Appendix A Presenter’s Manual
PROJECT AWARENESS
A MULTI – DISCIPLINARY, WHOLE SCHOOL, ONE DAY INTERVENTION
GRADE 10
SUBSTANCE ABUSE
A MANUAL FOR PRESENTERS
COMPILED BY: J VAN STADEN M KALJAN L MOTAUNG S ROOSENDAAL M SMITH P BARKHUIZEN C JANSEN N LOUW
SUBSTANCE ABUSE
8:30 – 9:00 INTRODUCTION AND SETTING THE SCENE AIM: ESTABLISHING A RELATIONSHIP OF TRUST
Greet learners in a friendly manner, suing their own language if possible
Facilitator introduces him/herself
If the group is small, ask learners to introduce themselves
Ask their ages
Explain why this visit to the school is taking place
Set the ground rules for good communication. Learners say, facilitator writes on
board/paper (i.e. speak one at a time; respect each other’s opinions, punctuality after
break etc.)

108
ICE BREAKER 1 AIM: PROBLEM STATEMENT
Request the learners to close their eyes for 3 minutes During these 3 minutes, they should think and dream of their goals/things they would
like to attain/accomplish in their lives, one day (“what do you dream of becoming,
doing, on day?) From these dreams they should then each select the one most important/attractive
dream for him/her As many as possible learners should get an opportunity to write their special
dream/goal on the black board A short discussion follows during which the facilitator ask the learners to describe the
way they think dreams come true/materialize The discussion should, amongst others, preferably cover the fact that
RESPONSIBLE DECISIONS determine a successful future Make a list of things which the learners think might prevent the realization of their
dreams
9:00 – 10:00 FIRST ACTIVITY AIM: HANDLING PEER PRESSURE BY USING THE FOLLOWING SKILLS:
1. ASSERTIVENESS 2. NEGOTIATION
WE RESPECT EACH OTHER: WE TALK ONE AT A TIME
ONE DAY I WOULD LIKE TO……

109
3. PROBLEM SOLVING 4. CONFLICT RESOLUTION
Divide the class into groups of 8-10 learners
Learners are guided to discuss the role-plays they have observed. They voice their
opinions and feelings and these are written on a flip-chart
Evaluate the sills that were used and discuss how they could improve
Show a picture of a drug addict (show a video snippet) and discuss the
consequences of alcohol and drug abuse
Touch the feelings of the learners without being over-dramatic
INSTRUCTIONS TO GROUPS 1 AND 2:
Ronnie is invited to a party at his friend’s house. At the party, he is first convinced by his
friends, Pete and Joe, to drink some beer and then to smoke a little dagga. Ronnie, at first,
doesn’t want to, but his friends give him many reasons why he should drink and smoke
dagga. Ronnie can’t handle the situation and eventually gives in to their pressure.
INSTRUCTIONS TO GROUPS 3 AND 4:
Louise goes to a street party and her friends, Mina and Josi, try to convince her to drink some
Ecstasy tablets so that she can enjoy the dancing. They give her many reasons for drinking
the tablets. Louise manages to refuse and gives her reasons for not wanting to use the
tablets.
1. Act out the situation described above
2. Act out a discussion between Mina and Josi the next day. They don’t feel well and
wish that they had not used the Ecstasy. They discuss their admiration for Louise and
wish that they had made better choices.

110
10:00 – 10:45 SECOND ACTIVITY AIM: PROBLEM SOLVING: ALTERNATIVES TO USING DRUGS
Give out newspaper articles (stories) to groups
Read the articles to the class if their English is not very good
Groups have to discuss why the person in the article started using the substance (Drug)
What could have been a happy ending – groups brainstorm possible alternatives to
handling stress which caused the alcohol or drug abuse in each story
NEWS ARTICLES:
10:45 – 11:15 BREAK
WHY DID I START………….?
WHAT ELSE COULD I HAVE DONE…………?
NEWS ARTICLE 1
TEENAGER (15 YRS) DEAD The police confirmed having found a corpse in Church Street West last week. The body was
identified by Me Wilson, the mother of the deceased 15 year old boy, called Sam. Sam died
as a result of an overdose of the drug Cocaine (also known as “crack, snow, stuff, candy,
coke or rocks” by youths familiar with the substance). Me Wilson reported that Sam mixed
with friends who pressurized Sam to start smoking at a very young age. Same carried on from
smoking cigarettes and dagga to taking ever-increasing amounts of drugs. Same chose to be
“DIFFERENT” from the beginning and reacted very negatively to whatever disciplinary
measures his parents could think of. He used to say that he wanted to be COOL and that
nobody really understood him. During the last six months, Sam was very irritated, anxious,
aggressive, and restless, lost a lot of weight and couldn’t sleep at night. He underwent a total
personality change – he turned into a total loner and none of his friends visited him anymore.
Sam’s heart just stopped beating last Saturday night. The school where Sam used to be up to
two years ago, indicated that there wouldn’t be learners attending Sam’s funeral on
Wednesday.

111
11:30 – 12:30 THIRD ACTIVITY AIM: CONSEQUENCES FOR SUBSTANCE ABUSE
NEWS ARTICLE 2
STREET BASH LEADS TO RAPE
On Saturday Mmapula went to a street bash in Atteridgeville (Kudu Street). Someone slipped
something into her drink while she was not watching. She woke up in the hospital the
following day and could not remember what had happened to her. She was in pain. She
went to the doctor at Kalafong and was examined. The doctor told her that she had been
raped. She will receive counseling at the hospital. Some of the people, who were present at
the party, said some boys put shabba (a drug) in Mmapula’s cool drink.
NEWS ARTICLE 3
15 YEAR OLD EXPERIENCES A “TRIP” TO REMEMBER
A 15-year old school boy is in a critical condition at a Pretoria Hospital after experiencing a
massive heart attack. According to sources, the scholar was at a Rave party when the
attack occurred. The reason for the massive heart attack was that the scholar consumed
drugs which he mixed with coke at the club. Apparently the scholar has prepared for a night
of “raving”, “drugging” and experiencing a “trip”. Early that evening he went to a pharmacy
and purchased diet mix and ephedrine (other medicines). At the race he combined these
drugs with Ecstasy tablets. After a while the scholar’s heart rate rose dramatically to
approximately 200 beats per minute and friends rushed him to a local hospital.
This is a common occurrence at Rave clubs. Parents should be aware of the dangers and
harmful effects of drug abuse amongst their children. Doctors managed to save this
scholar’s life but your child may not be lucky next time.

112
IDEAS FOR ACTION AT OUR SCHOOL
Show video extracts of the consequences of alcohol and drug abuse
OR Ask a teenager in rehabilitation to come and address the learners; to tell how and
why she/he started using substances, and what the consequences were Ask learners for ideas for a plan of action at their school (i.e. graffiti wall, establishing
support groups etc)
OR
Facilitate role plays*1
12:30 – 13:00 EVALUATION AND WRAPPING UP AIM: CLOSURE AND PLANNING FOLLOW-UP
Put up a picture of a jacket or ask one of the learners to put on a jacket
Tell the learners that this is “My bullet proof jacket”. It protects me against injury, pain
and death
Each learner gets a piece of paper on which he/she has to write ONE way of preventing
alcohol and drug abuse
Learners pin/stick their “advice” for survival to the jacket
The “protection messages” are read to the class
Learners are asked to fill in the evaluation form in which they also indicate:
1. Whether they need help themselves
2. Would like to join a support group of learners with problems
3. Would like to be trained so that they can help others
1 This option was added in of some facilitator’s own accord and was not part of the original programme
ACTION! ACTION! ACTION!

113
PLEASE HELP ME!
I WANT TO JOIN A SUPPORT GROUP
I WANT TO HELP OTHERS
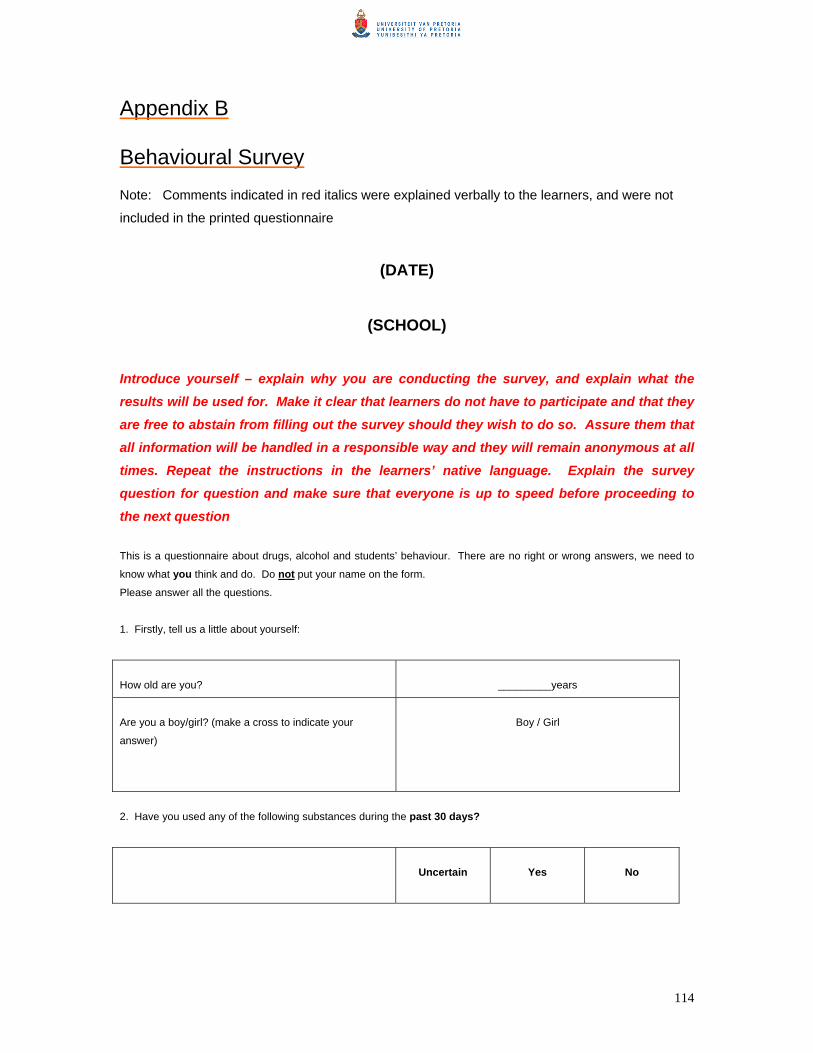
114
Appendix B Behavioural Survey
Note: Comments indicated in red italics were explained verbally to the learners, and were not
included in the printed questionnaire
(DATE)
(SCHOOL)
Introduce yourself – explain why you are conducting the survey, and explain what the results will be used for. Make it clear that learners do not have to participate and that they
are free to abstain from filling out the survey should they wish to do so. Assure them that all information will be handled in a responsible way and they will remain anonymous at all
times. Repeat the instructions in the learners’ native language. Explain the survey question for question and make sure that everyone is up to speed before proceeding to
the next question
This is a questionnaire about drugs, alcohol and students’ behaviour. There are no right or wrong answers, we need to
know what you think and do. Do not put your name on the form.
Please answer all the questions.
1. Firstly, tell us a little about yourself:
How old are you?
_________years
Are you a boy/girl? (make a cross to indicate your
answer)
Boy / Girl
2. Have you used any of the following substances during the past 30 days?
Uncertain
Yes
No

115
Substances that one can buy over the counter to relieve
pain (e.g. Grandpa /Syndol / Disprin) (for non medicinal
purposes)
Uncertain
Yes
No
Substances that one can buy over the counter without a
prescription (e.g., cough medicine/allergy
medicine/Lennon’s)
Uncertain
Yes
No
Substances that help people sleep/rest (e.g.
Amytal/Nembutal)
Uncertain
Yes
No
Substances that help people relax/calm (e.g.
Valium/Librium/Ativan)
Uncertain
Yes
No
Substances that help people to stay awake/give more
energy (e.g. diet pills/uppers/amphetamines)
Uncertain
Yes
No
LSD (acid/candy/green goblins/smarties/strawberry
fields)
Uncertain
Yes
No
Mandrax
Uncertain
Yes
No
Cocaine (coke/crack) (not coco or coca cola)
Uncertain
Yes
No
Heroin (junk/smack)
Uncertain
Yes
No
Ecstasy (E) (a name of a drug)
Uncertain
Yes
No
Substances that relieve severe pain and for which a
doctors’ prescription is needed
(e.g.morphine/opium/Welconal) for the purpose of
getting high
Uncertain
Yes
No
Steroids (muscle builders, substances used to increase
one’s physical performance
Uncertain
Yes
No
Tobacco/cigarettes
Uncertain
Yes
No
Alcohol
Uncertain
Yes
No
5 or more drinks with alcohol on at least one occasion
Uncertain
Yes
No
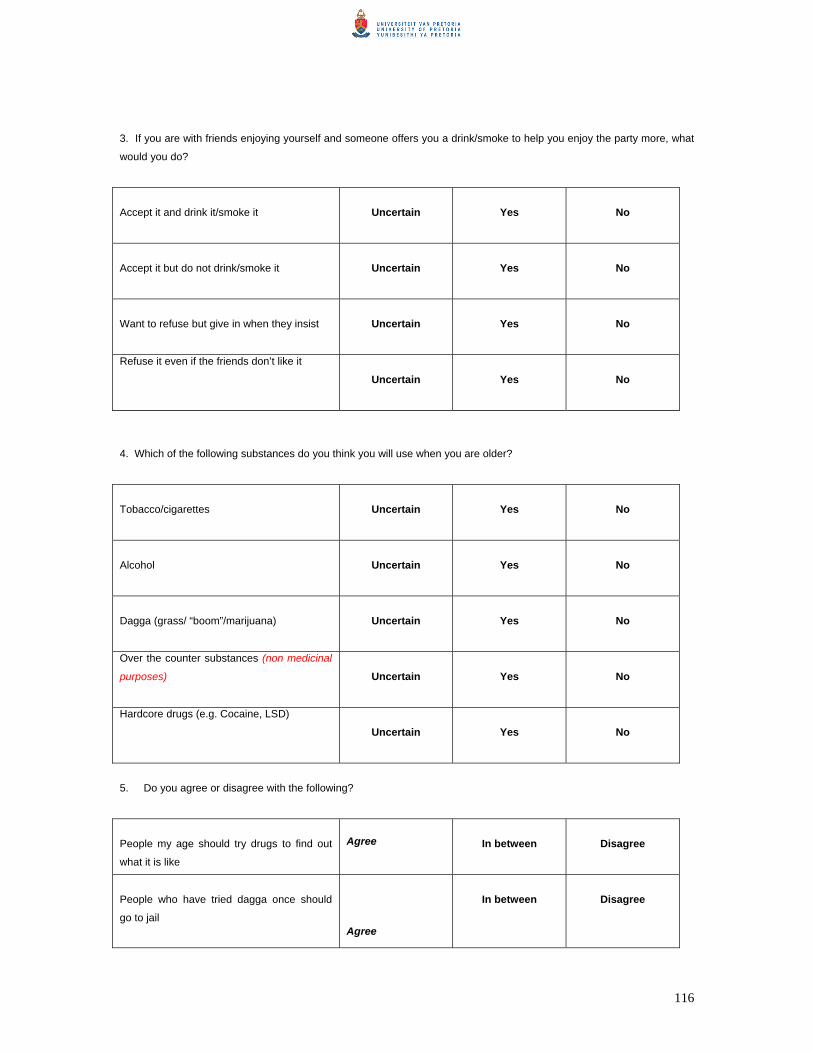
116
3. If you are with friends enjoying yourself and someone offers you a drink/smoke to help you enjoy the party more, what
would you do?
Accept it and drink it/smoke it
Uncertain
Yes
No
Accept it but do not drink/smoke it
Uncertain
Yes
No
Want to refuse but give in when they insist
Uncertain
Yes
No
Refuse it even if the friends don’t like it Uncertain
Yes
No
4. Which of the following substances do you think you will use when you are older?
Tobacco/cigarettes
Uncertain
Yes
No
Alcohol
Uncertain
Yes
No
Dagga (grass/ “boom”/marijuana)
Uncertain
Yes
No
Over the counter substances (non medicinal
purposes)
Uncertain
Yes
No
Hardcore drugs (e.g. Cocaine, LSD) Uncertain
Yes
No
5. Do you agree or disagree with the following?
People my age should try drugs to find out
what it is like
Agree
In between
Disagree
People who have tried dagga once should
go to jail
Agree
In between
Disagree

117
6. Is it all right for someone your age to use:
Tobacco/
Cigarettes
Uncertain
Yes
No
Alcohol
Uncertain
Yes
No
Dagga
Uncertain
Yes
No
Over the counter
substances (non medicinal
purposes)
Uncertain
Yes
No
Hardcore drugs (Cocaine,
LSD, etc)
Uncertain
Yes
No
7. How many of your friends use
drugs?
Most
Some
None
8. If you use drugs, how will you know if your behaviour becomes a problem or is dangerous?
9. Where would you go if you had a drug problem?
Thank you.
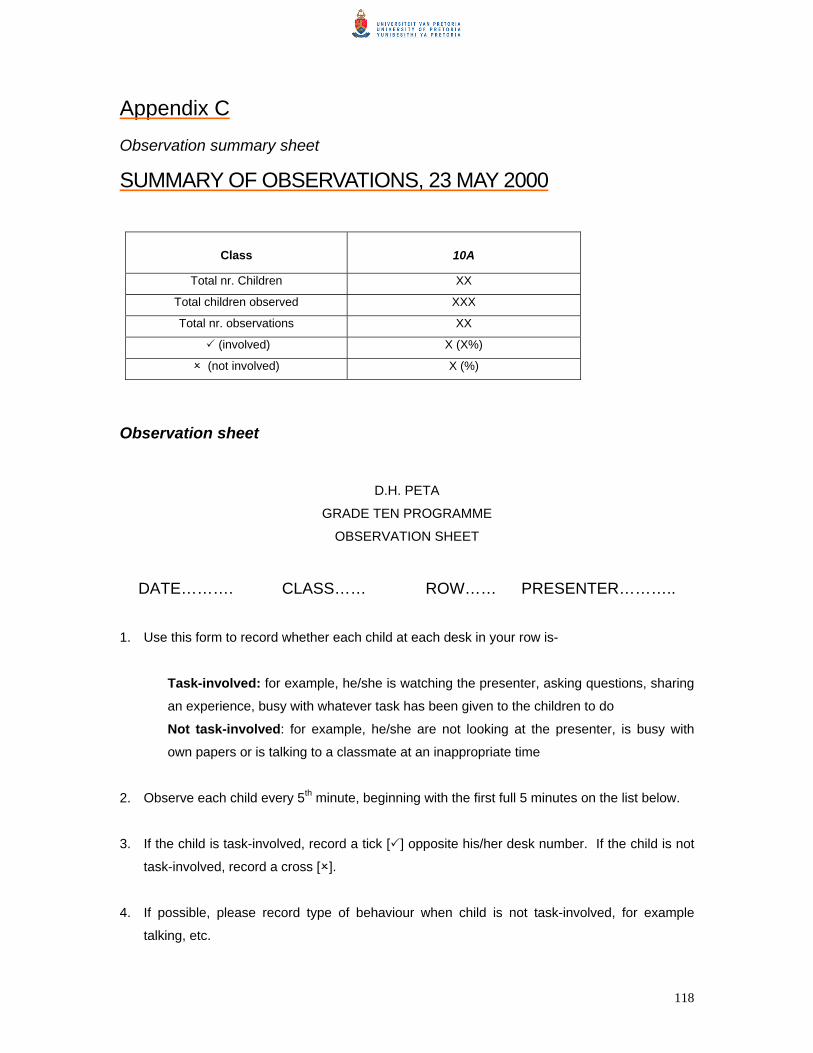
118
Appendix C Observation summary sheet
SUMMARY OF OBSERVATIONS, 23 MAY 2000
Class 10A
Total nr. Children XX
Total children observed XXX
Total nr. observations XX
(involved) X (X%)
(not involved) X (%)
Observation sheet
D.H. PETA
GRADE TEN PROGRAMME
OBSERVATION SHEET
DATE………. CLASS…… ROW…… PRESENTER………..
1. Use this form to record whether each child at each desk in your row is-
Task-involved: for example, he/she is watching the presenter, asking questions, sharing
an experience, busy with whatever task has been given to the children to do
Not task-involved: for example, he/she are not looking at the presenter, is busy with
own papers or is talking to a classmate at an inappropriate time
2. Observe each child every 5th minute, beginning with the first full 5 minutes on the list below.
3. If the child is task-involved, record a tick [ ] opposite his/her desk number. If the child is not
task-involved, record a cross [ ].
4. If possible, please record type of behaviour when child is not task-involved, for example
talking, etc.

119
5. Indicate breaks or any other interruptions in the programme
DESK NUMBERS
Time Interval 1 2 3 4 5 6
5
10
15
20
25
30
35
40
45
50
55
60
65
70
75
80
85
90

120
Appendix D
Moderators Guide Focus Groups
Good morning everyone
(Introduce yourself, ensure all respondents that the information gathered will be handled in the
strictest confidence, and give the learners an estimate of the time it will take to complete the
focus group. Advise the learners that they are free to withdraw from participation at any time)
We are here to listen to your opinions about the drug prevention programme, which was
presented here a little while ago. We want you to talk freely about anything that you think might
be useful to us. The conversation will be tape-recorded so that we can remember what you have
said. No one but my colleague and I will listen to the tape. Remember that you are not forced to
participate. If you feel that you do not want to participate, please leave now so that we do not
have any disturbance during the conversation. If you decide to stay however, you will be
expected to express your honest views. It is very important that everyone tells us what you feel
and think even if you do not agree with the others in the group. You would also be expected to
treat everything said in this conversation as confidential, in other words, you are not allowed to
tell anybody else what was said here.
Before we start, is there anyone that would like to leave? Are there any questions?
1. First of all, I want you to discuss whether you think a drug prevention programme was
necessary and why/not? (10 minutes)
2. What were the good (best) things about the programme? (10 min)
3. What was bad (worst) about the programme? (10 min)
4. Do you have any suggestions on how such a programme can be more effective? (10 min)
5. Do you think that the programme actually made a difference (10 min)
6. Anything else you would like to add? (5 min)
Key words: Presenter?
Duration?
Format?
Knowledge?
Behavioural change?
Thank you very much for your co-operation.

121
Appendix E
ESOMAR Guideline
Tape and video-recording and client observation
of interviews and group discussions
Introduction
Tape and video recording of interviews are now commonly used in research and widely accepted
by respondents. Two issues arise under the ICC/ESOMAR International Code of Marketing and
Social Research Practice:
(1) What form of permission should be obtained from respondents when such techniques are
used?
(2) How far, and under what safeguards, may tape or video recordings be played or supplied to
people outside the research organisation carrying out the research?
Video-recording presents the most obvious problems. First, it is far more likely that a respondent
may be identified from a video than from a tape recording. Second, it is also more likely that
requests will be made by clients, advertising agencies etc to see a video recording, and/or to
have a copy of this, than in the case of a tape recording.
If a copy of a video recording passes out of the hands of the research organisation it becomes
even more important, although more difficult, to ensure its proper use and to protect respondents'
anonymity. This problem is most acute in the case of business-to-business, medical and other
research among special sub-groups of the population where there is much higher probability that
some of the respondents may be identifiable by people who subsequently see the recording; but
in principle it applies to all types of surveys.
Public interest in data protection and with avoiding unnecessary intrusions on privacy means that
researchers must therefore ensure that tape and video recording is used with great care and with
appropriate safeguards for the rights of respondents. This is provided for by Rule 7 of the
International Code. The present Guideline sets out in more detail the ways in which this Rule
should be applied in practice.
Similar considerations arise where an interview or group discussion is to be observed by a client
or his representatives (including advertising agency staff, etc.), whether for quality control
purposes or to gain a better understanding of the findings of the research. This is especially the
case where the fact of being observed is not easily apparent to respondents, for example where
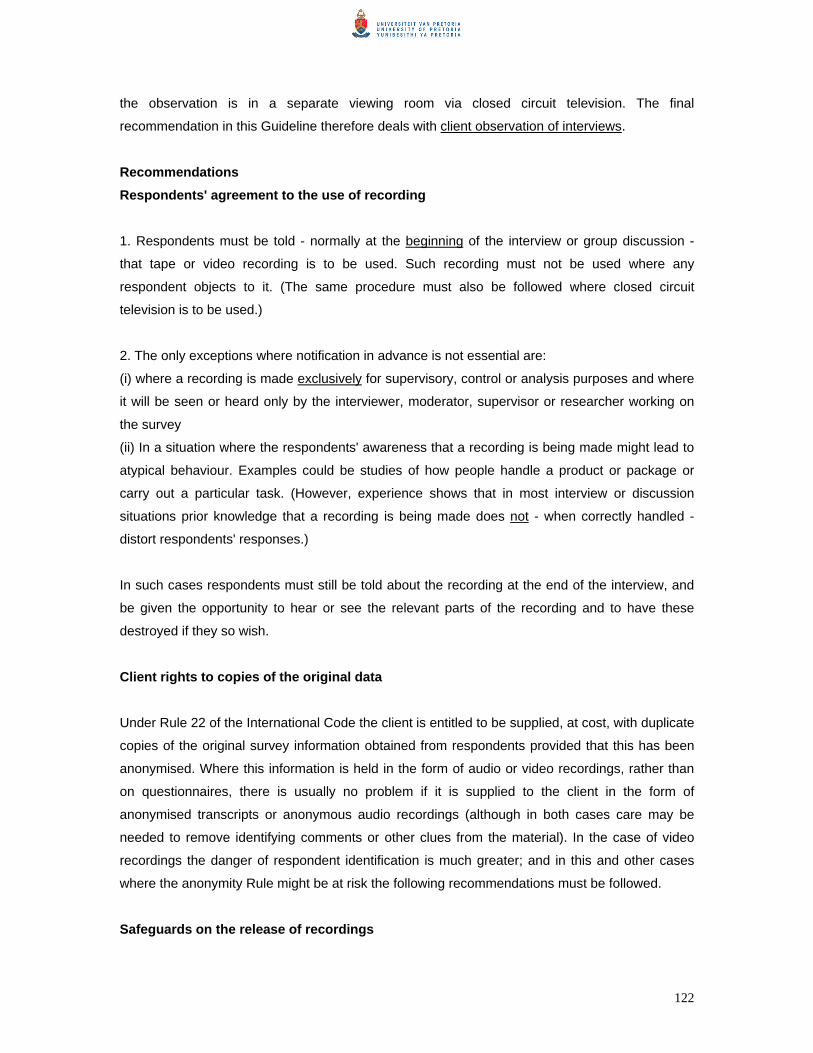
122
the observation is in a separate viewing room via closed circuit television. The final
recommendation in this Guideline therefore deals with client observation of interviews.
Recommendations
Respondents' agreement to the use of recording
1. Respondents must be told - normally at the beginning of the interview or group discussion -
that tape or video recording is to be used. Such recording must not be used where any
respondent objects to it. (The same procedure must also be followed where closed circuit
television is to be used.)
2. The only exceptions where notification in advance is not essential are:
(i) where a recording is made exclusively for supervisory, control or analysis purposes and where
it will be seen or heard only by the interviewer, moderator, supervisor or researcher working on
the survey
(ii) In a situation where the respondents' awareness that a recording is being made might lead to
atypical behaviour. Examples could be studies of how people handle a product or package or
carry out a particular task. (However, experience shows that in most interview or discussion
situations prior knowledge that a recording is being made does not - when correctly handled -
distort respondents' responses.)
In such cases respondents must still be told about the recording at the end of the interview, and
be given the opportunity to hear or see the relevant parts of the recording and to have these
destroyed if they so wish.
Client rights to copies of the original data
Under Rule 22 of the International Code the client is entitled to be supplied, at cost, with duplicate
copies of the original survey information obtained from respondents provided that this has been
anonymised. Where this information is held in the form of audio or video recordings, rather than
on questionnaires, there is usually no problem if it is supplied to the client in the form of
anonymised transcripts or anonymous audio recordings (although in both cases care may be
needed to remove identifying comments or other clues from the material). In the case of video
recordings the danger of respondent identification is much greater; and in this and other cases
where the anonymity Rule might be at risk the following recommendations must be followed.
Safeguards on the release of recordings

123
4. Recordings must not be allowed out of the hands of the researcher or research organisation
carrying out the study unless explicit permission has previously been obtained from all the
respondents included in the recording.
5. Where such permission is to be obtained the researcher must ensure that respondents are
given as much relevant information as possible about the future use of the recording, in particular:
- to whom the recording is to be given
- to whom it is likely to be shown
- for what purposes it is likely to be used
6. In particularly sensitive cases, the possibility (where technically feasible) of blurring or
obscuring the identifying characteristics of respondents should be considered when a video
recording is to be released outside the research organisation. In certain cases it may be sufficient
to release the soundtrack only.
7. When a recording is released in conformity with these recommendations it should be labeled
with the appropriate restrictions on the purposes for which it may be used. The researcher must
also ensure, under Rule 29 of the International Cole, that the recipient of the recording is aware of
the requirements of the Code and the need to abide by these (the restrictions on the use of
recordings should be made known at the start of the project where there is any possibility that the
client might later ask to see copies of these). The recipient should be told that permission must be
obtained from the researcher (and where appropriate the respondents) before the recording is
used for any other purpose not previously agreed; and that under no circumstances may the
recording be used for non-research purposes such as promotion or direct sales activities.
8. If any part of a recording is to be played (but not handed over) by the researcher to anyone
other than authorised research personnel within his own organisation, the researcher must
ensure that the requirements of Rule 4 of the International Code are fully met. No reference may
be made to the identity of any of the respondents involved without their prior permission.
Client observation of interviews
9. In certain cases clients and their representatives may be allowed under the International Code
to observe an interview or group discussion at the time it is carried out (with or without the
simultaneous use of recording equipment). Wherever this happens the researcher must ensure

124
that all such observers are fully aware of the requirements of the International Code and agree to
abide by these.
10. The researcher must also try to ensure that such observers do not include people who are
likely to know, or have any direct dealings with, any of the individual respondents being
interviewed (for example client sales staff in the case of a survey among business managers
or doctors). If there is any danger that this requirement will not be met, or that the
respondents' rights to anonymity might be otherwise breached, respondents should be told in
advance about the presence of the observer(s) and their consent obtained to this. The actual
identity of the client need not be revealed unless asked for by the respondents. It is in any
case good practice always to inform respondents, where this is not already obvious to them,
that the interview or discussion is being observed by other persons.
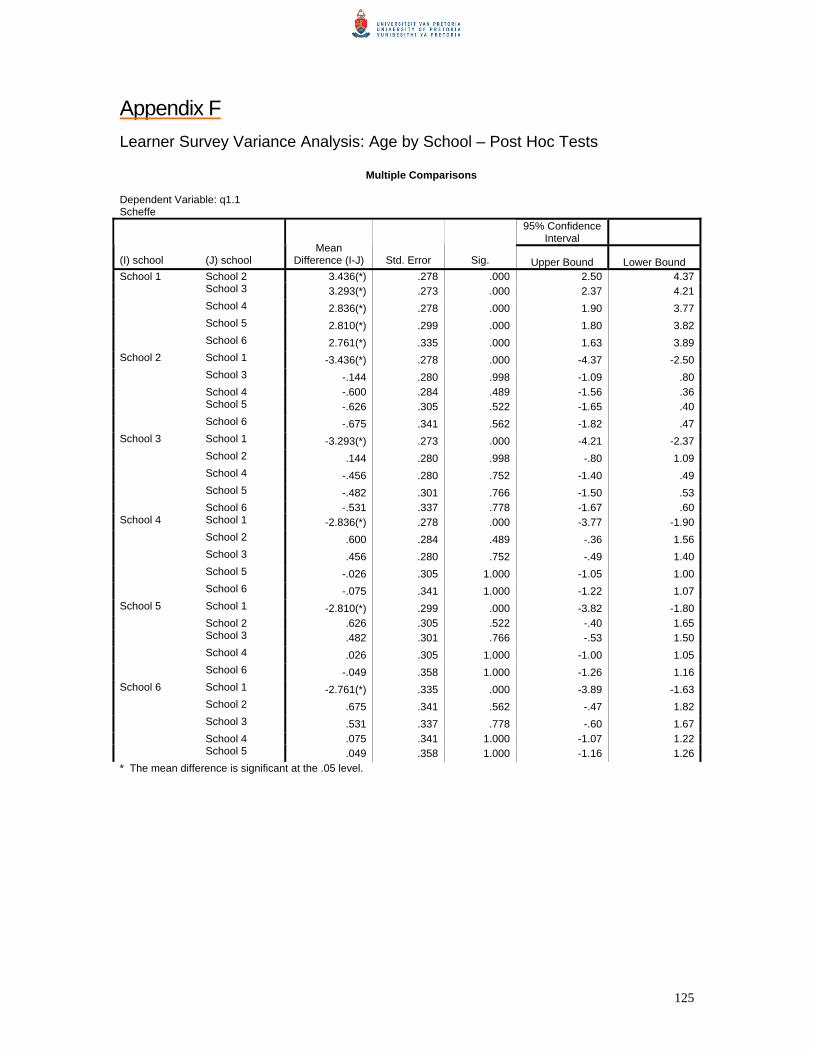
125
Appendix F Learner Survey Variance Analysis: Age by School – Post Hoc Tests Multiple Comparisons Dependent Variable: q1.1 Scheffe
95% Confidence Interval
(I) school (J) school Mean
Difference (I-J) Std. Error Sig. Upper Bound Lower Bound School 1 School 2 3.436(*) .278 .000 2.50 4.37 School 3 3.293(*) .273 .000 2.37 4.21 School 4 2.836(*) .278 .000 1.90 3.77 School 5 2.810(*) .299 .000 1.80 3.82 School 6 2.761(*) .335 .000 1.63 3.89School 2 School 1 -3.436(*) .278 .000 -4.37 -2.50 School 3 -.144 .280 .998 -1.09 .80 School 4 -.600 .284 .489 -1.56 .36 School 5 -.626 .305 .522 -1.65 .40 School 6 -.675 .341 .562 -1.82 .47School 3 School 1 -3.293(*) .273 .000 -4.21 -2.37 School 2 .144 .280 .998 -.80 1.09 School 4 -.456 .280 .752 -1.40 .49 School 5 -.482 .301 .766 -1.50 .53 School 6 -.531 .337 .778 -1.67 .60School 4 School 1 -2.836(*) .278 .000 -3.77 -1.90 School 2 .600 .284 .489 -.36 1.56 School 3 .456 .280 .752 -.49 1.40 School 5 -.026 .305 1.000 -1.05 1.00 School 6 -.075 .341 1.000 -1.22 1.07School 5 School 1 -2.810(*) .299 .000 -3.82 -1.80 School 2 .626 .305 .522 -.40 1.65 School 3 .482 .301 .766 -.53 1.50 School 4 .026 .305 1.000 -1.00 1.05 School 6 -.049 .358 1.000 -1.26 1.16School 6 School 1 -2.761(*) .335 .000 -3.89 -1.63 School 2 .675 .341 .562 -.47 1.82 School 3 .531 .337 .778 -.60 1.67 School 4 .075 .341 1.000 -1.07 1.22 School 5 .049 .358 1.000 -1.16 1.26* The mean difference is significant at the .05 level.

126
Appendix G: Results Matrix School One School Two School Three School Four School Five School Six Total Percentage
Change2
Pre-Test
Post-Test
Pre-Test Post-Test
Pre-Test
Post-Test
Pre-Test
Post-Test
Pre-Test
Post-Test
Pre-Test
Post-Test
Pre-Test
Post-Test
Pre- and Post-Test
(Whole Group)
Question 2: Have you used any of the following substances over the past 30 days?
2.1
Over the counter pain relief substances3
• Yes
• No
• Uncertain
Significance4
6(6%5)
24(38%)
43(43%)
21(18%)
11(25%)
1(20%)
15(16%)
14(22%)
1(14%)
20(18%)
8(18%)
1(20%)
24(26%)
8(13%)
0%
22(19%)
8(18%)
2(40%)
18(19%)
12(19%)
0%
21(18%)
9(21%)
0%
23(25%)
0%
0%
20(18%)
3(7%)
0%
8(9%)
5(8%)
3(43%)
10(9%)
5(11%)
1(20%)
94
63
7
114
44
5
21%
-30%
-29%
2.2
Over the counter substances e.g. cough medicines
• Yes
• No
• Uncertain
Significance
11(11%)
19(37%)
3(30%)
21(18%)
11(25%)
1(20%)
13(13%0
15(29%)
2(20%)
20(18%)
8(18%)
1(20%)
0.092
21(21%)
8(15%)
3(30%)
22(19%)
8(18%)
2(40%)
21(21%)
9(17%)
0%
21(18%)
9(21%)
0%
23(23%)
0%
0%
20(18%)
3(7%)
0%
13(13%)
1(2%)
2(20%)
10(9%)
5(11%)
1(20%)
102
52
10
114
44
5
12%
-15%
-50%
2.3
Substances that helps one sleep
• Yes
• No
• Uncertain
Significance
18(13%)
8(67%)
7(70%)
24(17%)
9(82%)
0%
28(20%)
1(8%)
1(10%)
28(19%)
0%
2(33%)
28(20%)
2(17%)
1(10%)
30(21%)
1(9%)
0%
29(20%)
0%
1(10%)
27(19%)
0%
2(33%)
23(16%)
0%
0%
22(15%)
0%
1(17%)
15(11%)
1(8%)
0%
14(10%)
1(9%)
1(17%)
15
1
0
145
11
6
867%
1000%
600%
2.4
Substances that helps one relax
• Yes
• No
• Uncertain
Significance
20(14%)
11(79%)
2(33%)
22(15%)
7(88%)
4(44%)
29(20%)
0%
1(17%)
28(19%)
0%
1(11%)
28(20%)
0%
3(50%)
31(21%)
0%
1(11%)
29(20%)
1(7%)
0%
29(20%)
0%
0%
23(16%)
0%
0%
22(15%)
0%
11(1%)
14(10%)
2(14%)
0%
13(9%)
1(13%)
2(22%)
143
14
6
145
8
9
1%
-43%
50%
2.5 Substances that helps one stay awake
• Yes 16(11%) 18(13%) 29(21%) 25(18%) 31(22%) 31(23%) 28(20%) 29(21%) 21(15%) 19(14%) 15(11%) 16(12%) 140 138 -1%
2 Percentage difference between total pre-test and total post-test (thus, whole group difference and not calculated for each school) 3 Problematic survey items indicated in bold 4 P-value significance 5 Percentages indicative of count within question, for example in item 2.1, six learners reported that they had used over the counter pain relief substances in the last 30 days, which accounts for 6% of the total group response in that particular response category (yes).

127
• No
• Uncertain
Significance
14(70%)
3(75%)
9(60%)
3(38%)
1(5%)
0%
4(27%)
1(13%)
1(5%)
0%
0%
1(13%)
1(5%)
1(25%)
0%
1(13%)
2(10%)
0%
2(13%)
2(25%)
1(5%)
0%
0%
0%
20
4
15
8
-25%
100%
2.6
LSD
• Yes
• No
• Uncertain
Significance
17(12%)
9(100%)
6(75%)
21(14%)
0%
6(60%)
0.031
30(21%)
0%
0%
29(20%)
0%
1(10%)
32(22%)
0%
0%
32(22%)
0%
0%
28(19%)
0%
2(25%)
28(19%)
0%
2(20%)
23(16%)
0%
0%
23(16%)
0%
0%
16(11%)
0%
0%
15(10%)
0%
1(10%)
146
9
8
148
0
10
1%
-100%
25%
0.031
2.7
Mandrax
• Yes
• No
• Uncertain
Significance
32(20%)
1(100%)
0%
27(17%)
1(100%)
3(100%)
30(18%)
0%
0%
30(19%)
0%
0%
32(20%)
0%
0%
32(20%)
0%
0%
30(18%)
0%
0%
30(19%)
0%
0%
23(14%)
0%
0%
23(15%)
0%
0%
16(10%)
0%
0%
16(10%)
0%
0%
163
1
0
158
1
3
-3%
-
300%
2.8
Cocaine
• Yes
• No
• Uncertain
Significance
27(17%)
3(100%)
3(100%)
32(20%)
1(100%)
0%
30(19%)
0%
0%
30(18%)
0%
0%
32(20%)
0%
0%
32(20%)
0%
0%
29(19%)
0%
0%
30(18%)
0%
0%
23(15%)
0%
0%
23(14%)
0%
0%
16(10%)
0%
0%
16(10%)
0%
0%
157
3
3
163
1
0
4%
-67%
-100%
2.9
Heroin
• Yes
• No
• Uncertain
Significance
28(18%)
3(100%)
1(100%)
26(17%)
2(40%)
2(100%)
30(19%)
0%
0%
29(19%)
1(20%)
0%
30(19%)
0%
0%
31(20%)
1(20%)
0%
30(19%)
0%
0%
29(19%)
1(20%)
0%
23(15%)
0%
0%
22(14%)
0%
0%
16(10%)
0%
0%
16(11%)
0%
0%
157
3
1
153
5
2
-3%
67%
100%
2.10
Ecstacy
• Yes
• No
• Uncertain
Significance
28(18%)
4*80%)
1(50%)
28(18%)
3(100%)
0%
28(18%)
0%
1(50%)
29(19%)
0%
1(50%)
31(20%)
0%
0%
32(20%)
0%
0%
30(19%)
0%
0%
29(19%)
0%
1(50%)
22(14%)
1(20%
0%
23(15%)
0%
0%
16(10%)
0%
0%
16(10%)
0%
0%
155
5
2
157
3
2
1%
-40%
-
2.11
Substances that relieve sever pain
• Yes
• No
• Uncertain
Significance
13(10%)
14(56%)
6(67%)
24(19%)
7(28%)
2(22%)
0.039
24(19%)
4(16%)
2(22%)
26(20%)
3(12%)
1(11%)
28(22%)
4(16%)
0%
26(20%)
2(8%)
4(44%)
28(22%)
1(4%)
1(11%)
24(19%)
4(16%)
2(22%)
23(18%)
0%
0%
20(15%)
3(12%)
0%
14(11%)
2(8%)
0%
10(8%)
6(24%)
0%
130
25
9
130
25
9
-
-
-
0.011

128
2.12
Steroids
• Yes
• No
• Uncertain
Significance
25(17%)
5(71%)
1(33%)
13(9%)
13(93%)
6(75%)
28(18%)
0%
0%
29(21%)
0%
1(13%)
32(21%)
0%
0%
30(21%)
1(7%)
1(13%)
29(19%)
1(14%)
0%
30(21%)
0%
0%
23(15%)
0%
0%
23(16%)
0%
0%
13(9%)
1(14%)
2(67%)
16(11%)
0%
0%
150
7
3
141
14
8
-6%
100%
167%
2.13 Tobacco/Cigarettes
• Yes
• No
• Uncertain
Significance
21(20%)
10(19%)
2(50%)
15(15%)
18(31%)
0%
21(20%)
9(17%)
0%
23(23%)
6(10%
1(17%)
28(26%)
4(8%)
0%
25(25%)
6(10%)
1(17%)
17(16%)
11(21%)
2(50%)
17(17%)
10(17%)
3(50%)
12(11%)
11(21%)
0%
12(12%)
10(17%)
1(17%)
8(8%)
8(15%)
0%
8(8%)
8(14%)
0%
107
53
4
100
58
6
-7%
9%
50%
2.14
Alcohol
• Yes
• No
• Uncertain
Significance
18(20%)
13(20%)
1(20%)
15(15%)
18(31%)
0%
22(24%)
7(11%)
1(20%)
23(23%)
6(10%)
1(17%)
24(26%)
7(11%)
1(20%)
25(25%)
6(10%)
1(17%)
12(13%)
17(26%)
1(20%)
17(17%)
10(17%)
3(50%)
11(12%)
12(18%)
0%
12(12%)
10(17%)
1(17%)
5(5%)
10(15%)
1(20%)
8(8%)
8(14%)
0%
92
66
5
100
58
6
9%
-12%
20%
2.15
Five/more alcoholic beverages at once
• Yes
• No
• Uncertain
Significance
18(15%)
14(37%)
1(33%)
18(14%)
15(52%)
0%
27(22%)
3(8%)
0%
27(21%)
1(3%)
2(25%)
29(24%)
3(8%)
0%
31(24%)
1(3%)
0%
23(19%)
5(13%)
2(67%)
22(17%)
5(17%)
3(38%)
16(13%)
7(18%)
0%
18(14%)
4(14%)
1(13%)
10(8%)
6(16%)
0%
11(9%)
3(10%)
2(25%)
123
38
3
127
29
8
3%
-24%
167%
Question 3: If you are at a party and someone offers you a drink/smoke to enjoy the party more, what would you do
3.1 Accept it and drink/smoke it
• Yes
• No
• Uncertain
Significance
22(18%)
7(28%)
3(18%)
22(18%)
7(35%)
4(20%)
24(20%)
3(12%)
3(18%)
24(20%)
2(10%)
3(15%)
27(22%)
2(8%)
3(18%)
28(23%)
1(5%)
3(15%)
22(18%)
4(16%)
4(24%)
21(17%)
3(15%)
6(30%)
15(12%)
7(28%)
1(6%)
15(12%)
6(30%)
2(10%)
11(9%)
2(8%)
3(18%)
13(11%)
1(5%)
2(10%)
121
25
17
123
20
20
2%
-20%
18%
3.2 Accept it but not drink/smoke it
• Yes
• No
• Uncertain
Significance
11(13%)
15(24%)
5(46%)
22(23%)
9(18%)
2(13%)
0.092
13(15%)
15(24%)
2(18%)
18(19%)
7(14%)
5(31%)
0.016
21(24%)
10(16%)
1(9%)
16(17%)
14(28%)
2(13%)
14(16%)
15(24%)
1(9%)
15(16%)
13(26%)
2(13%)
18(21%)
4(6%)
1(9%)
16(17%)
4(8%)
2(13%)
11(13%)
4(6%)
1(9%)
9(9%)
4(8%)
3(19%)
88
63
11
96
51
16
9%
-19%
45%
3.3 Want to refuse, but then give in
• Yes
• No
• Uncertain
Significance
14(12%)
11(50%)
7(27%)
20(16%)
7(41%)
4(21%)
25(21%)
2(9%)
3(16%)
25(20%)
1(6%)
4(21%)
27(22%)
1(5%)
4(21%)
26(21%)
3(18%)
3(16%)
24(20%)
4(18%)
2(11%)
23(19%)
4(24%)
2(11%)
23(19%)
0%
0%
17(14%)
2(12%)
2(11%)
9(7%)
4(18%)
3(16%)
12(10%)
0%
4(21%)
122
4
3
123
17
19
1%
325%
533%
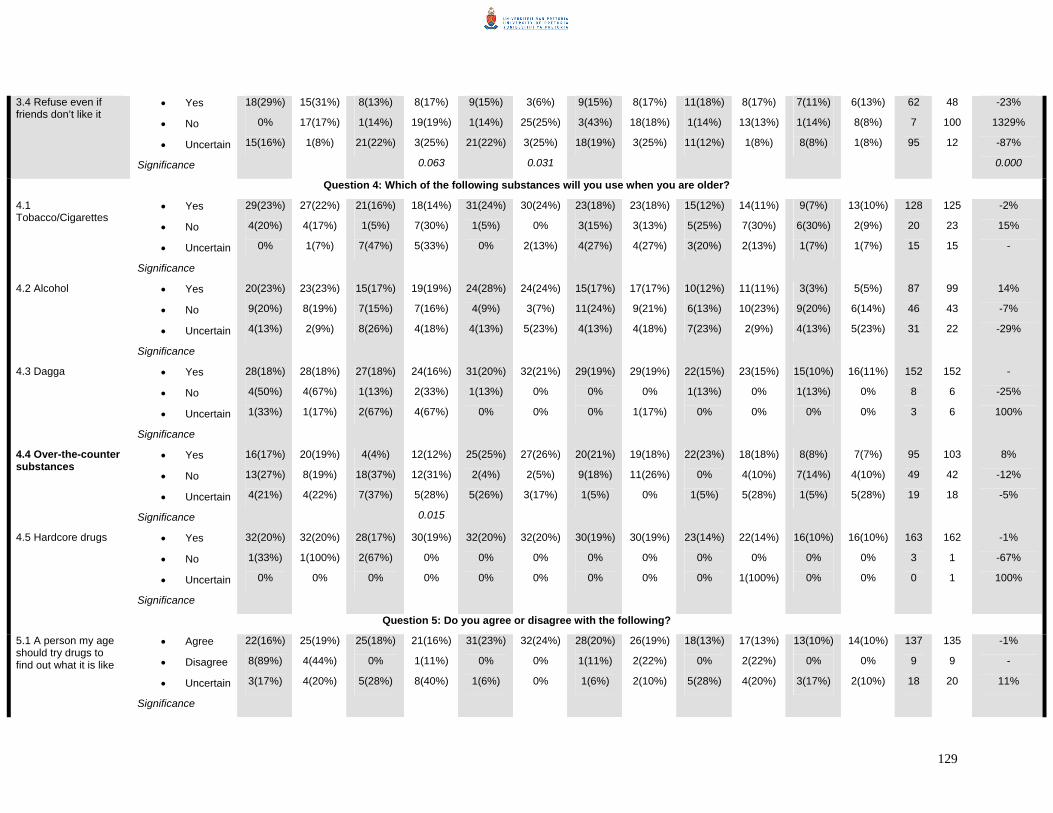
129
3.4 Refuse even if friends don’t like it
• Yes
• No
• Uncertain
Significance
18(29%)
0%
15(16%)
15(31%)
17(17%)
1(8%)
8(13%)
1(14%)
21(22%)
8(17%)
19(19%)
3(25%)
0.063
9(15%)
1(14%)
21(22%)
3(6%)
25(25%)
3(25%)
0.031
9(15%)
3(43%)
18(19%)
8(17%)
18(18%)
3(25%)
11(18%)
1(14%)
11(12%)
8(17%)
13(13%)
1(8%)
7(11%)
1(14%)
8(8%)
6(13%)
8(8%)
1(8%)
62
7
95
48
100
12
-23%
1329%
-87%
0.000
Question 4: Which of the following substances will you use when you are older?
4.1 Tobacco/Cigarettes
• Yes
• No
• Uncertain
Significance
29(23%)
4(20%)
0%
27(22%)
4(17%)
1(7%)
21(16%)
1(5%)
7(47%)
18(14%)
7(30%)
5(33%)
31(24%)
1(5%)
0%
30(24%)
0%
2(13%)
23(18%)
3(15%)
4(27%)
23(18%)
3(13%)
4(27%)
15(12%)
5(25%)
3(20%)
14(11%)
7(30%)
2(13%)
9(7%)
6(30%)
1(7%)
13(10%)
2(9%)
1(7%)
128
20
15
125
23
15
-2%
15%
-
4.2 Alcohol • Yes
• No
• Uncertain
Significance
20(23%)
9(20%)
4(13%)
23(23%)
8(19%)
2(9%)
15(17%)
7(15%)
8(26%)
19(19%)
7(16%)
4(18%)
24(28%)
4(9%)
4(13%)
24(24%)
3(7%)
5(23%)
15(17%)
11(24%)
4(13%)
17(17%)
9(21%)
4(18%)
10(12%)
6(13%)
7(23%)
11(11%)
10(23%)
2(9%)
3(3%)
9(20%)
4(13%)
5(5%)
6(14%)
5(23%)
87
46
31
99
43
22
14%
-7%
-29%
4.3 Dagga • Yes
• No
• Uncertain
Significance
28(18%)
4(50%)
1(33%)
28(18%)
4(67%)
1(17%)
27(18%)
1(13%)
2(67%)
24(16%)
2(33%)
4(67%)
31(20%)
1(13%)
0%
32(21%)
0%
0%
29(19%)
0%
0%
29(19%)
0%
1(17%)
22(15%)
1(13%)
0%
23(15%)
0%
0%
15(10%)
1(13%)
0%
16(11%)
0%
0%
152
8
3
152
6
6
-
-25%
100%
4.4 Over-the-counter substances
• Yes
• No
• Uncertain
Significance
16(17%)
13(27%)
4(21%)
20(19%)
8(19%)
4(22%)
4(4%)
18(37%)
7(37%)
12(12%)
12(31%)
5(28%)
0.015
25(25%)
2(4%)
5(26%)
27(26%)
2(5%)
3(17%)
20(21%)
9(18%)
1(5%)
19(18%)
11(26%)
0%
22(23%)
0%
1(5%)
18(18%)
4(10%)
5(28%)
8(8%)
7(14%)
1(5%)
7(7%)
4(10%)
5(28%)
95
49
19
103
42
18
8%
-12%
-5%
4.5 Hardcore drugs • Yes
• No
• Uncertain
Significance
32(20%)
1(33%)
0%
32(20%)
1(100%)
0%
28(17%)
2(67%)
0%
30(19%)
0%
0%
32(20%)
0%
0%
32(20%)
0%
0%
30(19%)
0%
0%
30(19%)
0%
0%
23(14%)
0%
0%
22(14%)
0%
1(100%)
16(10%)
0%
0%
16(10%)
0%
0%
163
3
0
162
1
1
-1%
-67%
100%
Question 5: Do you agree or disagree with the following?
5.1 A person my age should try drugs to find out what it is like
• Agree
• Disagree
• Uncertain
Significance
22(16%)
8(89%)
3(17%)
25(19%)
4(44%)
4(20%)
25(18%)
0%
5(28%)
21(16%)
1(11%)
8(40%)
31(23%)
0%
1(6%)
32(24%)
0%
0%
28(20%)
1(11%)
1(6%)
26(19%)
2(22%)
2(10%)
18(13%)
0%
5(28%)
17(13%)
2(22%)
4(20%)
13(10%)
0%
3(17%)
14(10%)
0%
2(10%)
137
9
18
135
9
20
-1%
-
11%

130
5.2 A person who has tried dagga once should go to jail
• Yes
• No
• Uncertain
Significance
11(16%)
16(35%)
6(13%)
14(19%)
11(26%)
8(17%)
11(16%)
9(20%)
10(21%)
14(19%)
8(19%)
8(17%)
13(19%)
12(26%)
7(15%)
12(16%)
11(26%)
9(19%)
11(16%)
7(15%)
12(25%)
10(14%)
5(12%)
15(31%)
16(23%)
1(2%)
6(13%)
17(23%)
3(7%)
3(6%)
8(11%)
1(2%)
7(15%)
7(10%)
4(10%)
5(10%)
70
46
48
74
42
48
6%
-9%
-
Question 6: Is it all right for someone of your age to use:
6.1Tobacco/Cigarettes • Yes
• No
• Uncertain
Significance
29(22%)
4(17%)
0%
27(22%)
5(21%)
1(6%)
22(16%)
3(13%)
5(71%)
18(15%)
7(29%)
5(31%)
0.063
29(22%)
2(9%)
1(14%)
28(23%)
3(13%)
1(6%)
28(21%)
2(9%)
0%
28(23%)
1(4%)
1(6%)
16(12%)
7(30%)
0%
12(10%)
6(25%)
5(31%)
10(8%)
5(22%)
1(14%)
11(9%)
2(8%)
3(19%)
134
23
7
124
24
16
-7%
4%
129%
6.2 Alcohol • Yes
• No
• Uncertain
Significance
23(20%)
9(27%)
1(6%)
24(21%)
7(29%)
2(7%)
19(17%)
3(9%)
8(44%)
19(17%)
5(21%)
6(22%)
26(23%)
3(9%)
3(17%)
25(22%)
2(8%)
5(19%)
21(19%)
6(18%)
3(17%)
24(21%)
2(8%)
4(15%)
0.053
15(13%)
6(18%)
2(11%)
14(12%)
7(29%)
2(7%)
9(8%)
6(18%)
1(6%)
7(6%)
1(4%)
8(30%)
113
33
18
113
24
27
-
-27%
50%
6.3 Dagga • Yes
• No
• Uncertain
Significance
30(20%)
3(50%)
0%
29(19%)
1(25%)
3(33%)
27(18%)
1(17%)
2(33%)
24(16%)
2(50%)
4(44%)
29(19%)
1(17%)
2(33%)
30(20%)
1(25%)
1(11%)
30(20%)
0%
0%
30(20%)
0%
0%
21(14%)
0%
2(33%)
22(15%)
0%
1(11%)
15(10%)
1(17%)
0%
16(11%)
0%
0%
152
6
6
151
4
9
-1%
-33%
50%
6.4 Over-the-counter substances
• Yes
• No
• Uncertain
Significance
16(17%)
12(26%)
4(17%)
20(20%)
10(25%)
3(13%)
5(5%)
18(38%)
7(29%)
11(11%)
13(33%)
6(26%)
26(28%)
2(4%)
4(17%)
24(24%)
2(5%)
5(22%)
15(16%)
12(26%)
3(13%)
17(17%)
7(18%)
6(26%)
19(21%)
0%
4(17%)
19(19%)
3(8%)
1(4%)
11(12%)
3(6%)
2(8%)
9(9%)
5(13%)
2(9%)
92
47
24
100
40
23
9%
-15%
-4%
6.5 Hardcore drugs • Yes
• No
• Uncertain
Significance
33(21%)
0%
0%
32(20%)
1(100%)
0%
27(17%)
2(100%)
1(33%)
30(19%)
0%
0%
31(20%)
0%
1(33%)
32(20%)
0%
0%
29(18%)
0%
0%
30(19%)
0%
0%
22(14%)
0%
1(33%)
22(14%)
0%
1(100%)
16(10%)
0%
0%
16(10%)
0%
0%
158
2
3
162
1
1
3%
-50%
-67%

131
Between-Subjects Factors
33303230231651
1.002.003.004.005.006.009.00
SCHOOLN Within-Subjects Factors
Measure: TIME
Q8PQ8
B_OR_A12
DependentVariable
Appendix H Bivariate analysis of variance with repeated measures on one factor – Question 8 General Linear Model
Multivariate Testsb
.005 1.032a 1.000 208.000 .311
.995 1.032a 1.000 208.000 .311
.005 1.032a 1.000 208.000 .311
.005 1.032a 1.000 208.000 .311
.021 .757a 6.000 208.000 .604
.979 .757a 6.000 208.000 .604
.022 .757a 6.000 208.000 .604
.022 .757a 6.000 208.000 .604
Pillai's TraceWilks' LambdaHotelling's TraceRoy's Largest RootPillai's TraceWilks' LambdaHotelling's TraceRoy's Largest Root
EffectB_OR_A
B_OR_A * SCHOOL
Value F Hypothesis df Error df Sig.
Exact statistica.
Design: Intercept+SCHOOL Within Subjects Design: B_OR_A
b.

132
Tests of Within-Subjects Effects
Measure: TIME
.774 1 .774 1.032 .311
.774 1.000 .774 1.032 .311
.774 1.000 .774 1.032 .311
.774 1.000 .774 1.032 .3113.403 6 .567 .757 .6043.403 6.000 .567 .757 .6043.403 6.000 .567 .757 .6043.403 6.000 .567 .757 .604
155.843 208 .749155.843 208.000 .749155.843 208.000 .749155.843 208.000 .749
Sphericity AssumedGreenhouse-GeisserHuynh-FeldtLower-boundSphericity AssumedGreenhouse-GeisserHuynh-FeldtLower-boundSphericity AssumedGreenhouse-GeisserHuynh-FeldtLower-bound
SourceB_OR_A
B_OR_A * SCHOOL
Error(B_OR_A)
Type III Sumof Squares df Mean Square F Sig.
Tests of Between-Subjects Effects
Measure: TIMETransformed Variable: Average
1313.868 1 1313.868 702.440 .00023.424 6 3.904 2.087 .056
389.050 208 1.870
SourceInterceptSCHOOLError
Type III Sumof Squares df Mean Square F Sig.
Post Hoc Tests School

133
Multiple Comparisons
Measure: TIME
-.1894 .2440 .996 -1.0640 .6852-.3404 .2399 .918 -1.2006 .5198.1273 .2440 1.000 -.7474 1.0019
4.611E-02 .2627 1.000 -.8957 .9879.4252 .2946 .911 -.6310 1.4814.2763 .2160 .949 -.4983 1.0509.1894 .2440 .996 -.6852 1.0640
-.1510 .2458 .999 -1.0322 .7301.3167 .2497 .951 -.5786 1.2119.2355 .2680 .993 -.7254 1.1964.6146 .2994 .648 -.4588 1.6879.4657 .2225 .626 -.3321 1.2635.3404 .2399 .918 -.5198 1.2006.1510 .2458 .999 -.7301 1.0322.4677 .2458 .727 -.4134 1.3488.3865 .2644 .906 -.5613 1.3344.7656 .2961 .355 -.2960 1.8272.6167 .2181 .244 -.1652 1.3986
-.1273 .2440 1.000 -1.0019 .7474-.3167 .2497 .951 -1.2119 .5786-.4677 .2458 .727 -1.3488 .4134
-8.1159E-02 .2680 1.000 -1.0421 .8798.2979 .2994 .986 -.7754 1.3713.1490 .2225 .998 -.6487 .9468
-4.6113E-02 .2627 1.000 -.9879 .8957-.2355 .2680 .993 -1.1964 .7254-.3865 .2644 .906 -1.3344 .5613
8.116E-02 .2680 1.000 -.8798 1.0421.3791 .3148 .962 -.7496 1.5078.2302 .2429 .989 -.6407 1.1010
-.4252 .2946 .911 -1.4814 .6310-.6146 .2994 .648 -1.6879 .4588-.7656 .2961 .355 -1.8272 .2960-.2979 .2994 .986 -1.3713 .7754-.3791 .3148 .962 -1.5078 .7496-.1489 .2771 1.000 -1.1424 .8446-.2763 .2160 .949 -1.0509 .4983-.4657 .2225 .626 -1.2635 .3321-.6167 .2181 .244 -1.3986 .1652-.1490 .2225 .998 -.9468 .6487-.2302 .2429 .989 -1.1010 .6407.1489 .2771 1.000 -.8446 1.1424
(J) SCHOOL234569134569124569123569123469123459123456
(I) SCHOOL1
2
3
4
5
6
9
Scheffe
MeanDifference
(I-J) Std. Error Sig. Lower Bound Upper Bound95% Confidence Interval
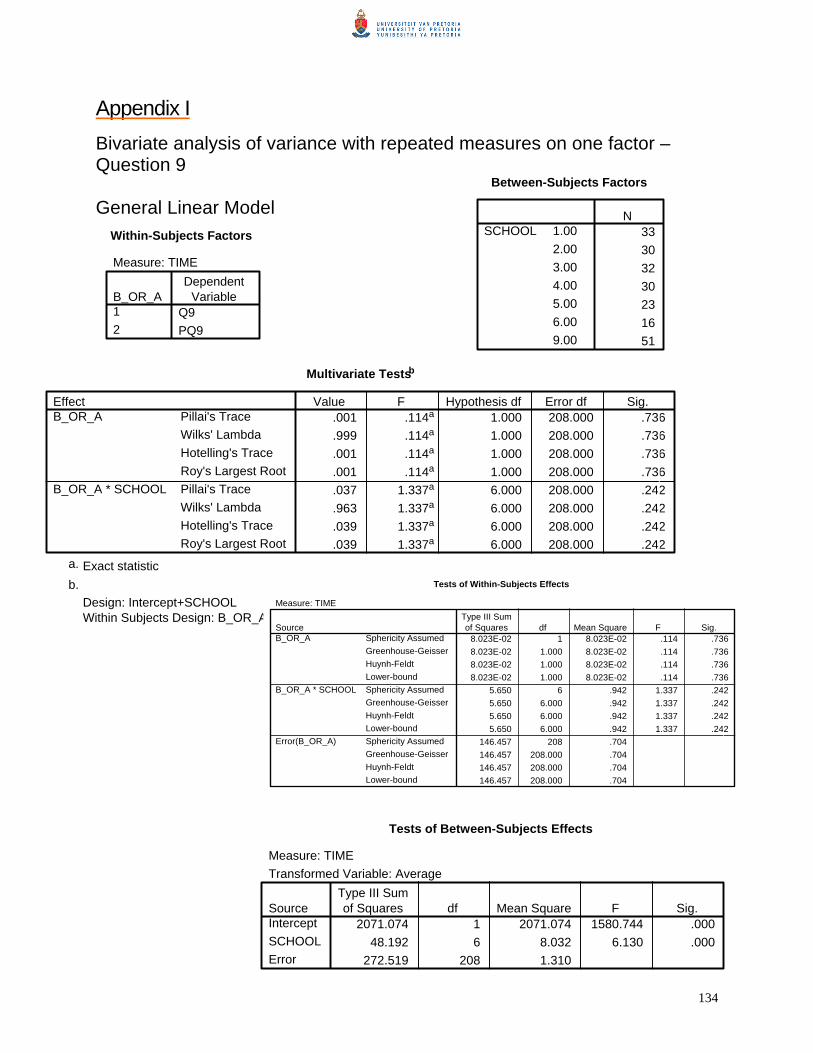
134
Within-Subjects Factors
Measure: TIME
Q9PQ9
B_OR_A12
DependentVariable
Between-Subjects Factors
33303230231651
1.002.003.004.005.006.009.00
SCHOOLN
Multivariate Testsb
.001 .114a 1.000 208.000 .736
.999 .114a 1.000 208.000 .736
.001 .114a 1.000 208.000 .736
.001 .114a 1.000 208.000 .736
.037 1.337a 6.000 208.000 .242
.963 1.337a 6.000 208.000 .242
.039 1.337a 6.000 208.000 .242
.039 1.337a 6.000 208.000 .242
Pillai's TraceWilks' LambdaHotelling's TraceRoy's Largest RootPillai's TraceWilks' LambdaHotelling's TraceRoy's Largest Root
EffectB_OR_A
B_OR_A * SCHOOL
Value F Hypothesis df Error df Sig.
Exact statistica.
Design: Intercept+SCHOOL Within Subjects Design: B_OR_A
b. Tests of Within-Subjects Effects
Measure: TIME
8.023E-02 1 8.023E-02 .114 .7368.023E-02 1.000 8.023E-02 .114 .7368.023E-02 1.000 8.023E-02 .114 .7368.023E-02 1.000 8.023E-02 .114 .736
5.650 6 .942 1.337 .2425.650 6.000 .942 1.337 .2425.650 6.000 .942 1.337 .2425.650 6.000 .942 1.337 .242
146.457 208 .704146.457 208.000 .704146.457 208.000 .704146.457 208.000 .704
Sphericity AssumedGreenhouse-GeisserHuynh-FeldtLower-boundSphericity AssumedGreenhouse-GeisserHuynh-FeldtLower-boundSphericity AssumedGreenhouse-GeisserHuynh-FeldtLower-bound
SourceB_OR_A
B_OR_A * SCHOOL
Error(B_OR_A)
Type III Sumof Squares df Mean Square F Sig.
Tests of Between-Subjects Effects
Measure: TIMETransformed Variable: Average
2071.074 1 2071.074 1580.744 .00048.192 6 8.032 6.130 .000
272.519 208 1.310
SourceInterceptSCHOOLError
Type III Sumof Squares df Mean Square F Sig.
Appendix I Bivariate analysis of variance with repeated measures on one factor – Question 9 General Linear Model

135
Post Hoc Tests
Multiple Comparisons
Measure: TIME
-.2879 .2042 .920 -1.0199 .4441-.8452* .2008 .009 -1.5651 -.1252
-8.7879E-02 .2042 1.000 -.8199 .64416.719E-02 .2198 1.000 -.7210 .8554
-7.9545E-02 .2466 1.000 -.9636 .8045-.6604* .1808 .042 -1.3087 -1.2134E-02.2879 .2042 .920 -.4441 1.0199
-.5573 .2057 .295 -1.2947 .1802.2000 .2090 .988 -.5493 .9493.3551 .2243 .867 -.4492 1.1593.2083 .2506 .995 -.6900 1.1067
-.3725 .1862 .676 -1.0402 .2951.8452* .2008 .009 .1252 1.5651.5573 .2057 .295 -.1802 1.2947.7573* .2057 .039 1.984E-02 1.4947.9124* .2213 .011 .1191 1.7056.7656 .2478 .151 -.1229 1.6541.1847 .1825 .984 -.4697 .8392
8.788E-02 .2042 1.000 -.6441 .8199-.2000 .2090 .988 -.9493 .5493-.7573* .2057 .039 -1.4947 -1.9838E-02.1551 .2243 .998 -.6492 .9593
8.333E-03 .2506 1.000 -.8900 .9067-.5725 .1862 .156 -1.2402 9.514E-02
-6.7194E-02 .2198 1.000 -.8554 .7210-.3551 .2243 .867 -1.1593 .4492-.9124* .2213 .011 -1.7056 -.1191-.1551 .2243 .998 -.9593 .6492-.1467 .2635 .999 -1.0914 .7979-.7276 .2033 .051 -1.4565 1.234E-03
7.955E-02 .2466 1.000 -.8045 .9636-.2083 .2506 .995 -1.1067 .6900-.7656 .2478 .151 -1.6541 .1229
-8.3333E-03 .2506 1.000 -.9067 .8900.1467 .2635 .999 -.7979 1.0914
-.5809 .2319 .397 -1.4124 .2506.6604* .1808 .042 1.213E-02 1.3087.3725 .1862 .676 -.2951 1.0402
-.1847 .1825 .984 -.8392 .4697.5725 .1862 .156 -9.5135E-02 1.2402.7276 .2033 .051 -1.2336E-03 1.4565.5809 .2319 .397 -.2506 1.4124
(J) SCHOOL234569134569124569123569123469123459123456
(I) SCHOOL1
2
3
4
5
6
9
Scheffe
MeanDifference
(I-J) Std. Error Sig. Lower Bound Upper Bound95% Confidence Interval

136
Appendix J
Survey: NParametric Tests - Gender – Male: McNemar Test –
Crosstabs
Q2.1 & PQ2.1
PQ2.1 Q2.1
0 1
0 27 10
1 9 16
Q2.2 & PQ2.2
PQ2.2Q2.2
0 1
0 27 11
1 17 7
Q2.3 & PQ2.3
PQ2.3Q2.3
0 1
0 57 2
1 0 0
Q2.4 & PQ2.4
PQ2.4Q2.4
0 1
0 55 1
1 4 1
Q2.5 & PQ2.5
PQ2.5 Q2.5
0 1
0 50 3
1 5 5
Q2.6 & PQ2.6
PQ2.6Q2.6
0 1
0 49 0
1 2 0
Q2.7 & PQ2.7
PQ2.7Q2.7
0 1
0 63 1
1 0 0
Q2.8 & PQ2.8
PQ2.8Q2.8
0 1
0 62 1
1 3 0
Q2.9 & PQ2.9
PQ2.9 Q2.9
0 1
0 58 4
1 2 0
Q2.10 & PQ2.10
PQ2.10Q2.10
0 1
0 62 2
1 3 0
Q2.11 & PQ2.11
PQ2.11Q2.11
0 1
0 42 6
1 8 3
Q2.12 & PQ2.12
PQ2.12Q2.12
0 1
0 53 2
1 4 3
Q2.13 & PQ2.13
PQ2.13 Q2.13
0 1
0 34 2
1 8 20
Q2.14 & PQ2.14
PQ2.14Q2.14
0 1
0 24 8
1 7 23
Q2.15 & PQ2.15
PQ2.15Q2.15
0 1
0 36 6
1 9 12
Q3.1 & PQ3.1
PQ3.1Q3.1
0 1
0 35 2
1 4 9
Q3.2 & PQ3.2
PQ3.2 Q3.2
0 1
0 20 11
1 14 11
Q3.3 & PQ3.3
PQ3.3Q3.3
0 1
0 29 5
1 10 4
Q3.4 & PQ3.4
PQ3.4Q3.4
0 1
0 11 12
1 2 1
Q4.1 & PQ4.1
PQ4.1Q4.1
0 1
0 43 1
1 3 7
Q4.2 & PQ4.2
PQ4.2 Q4.2
0 1
0 22 7
1 9 16
Q4.3 & PQ4.3
PQ4.3Q4.3
0 1
0 52 2
1 6 1
Q4.4 & PQ4.4
PQ4.4Q4.4
0 1
0 29 8
1 6 13
Q4.5 & PQ4.5
PQ4.5Q4.5
0 1
0 68 0
1 0 1

137
Q5.1 & PQ5.1
PQ5.1 Q5.1
0 1
0 47 1
1 3 1
Q5.2 & PQ5.2
PQ5.2Q5.2
0 1
0 20 7
1 5 10
Q6.1 & PQ6.1
PQ6.1Q6.1
0 1
0 44 5
1 3 8
Q6.2 & PQ6.2
PQ6.2Q6.2
0 1
0 35 1
1 4 13
Q6.3 & PQ6.3
PQ6.3 Q6.3
0 1
0 55 2
1 3 1
Q6.4 & PQ6.4
PQ6.4Q6.4
0 1
0 25 7
1 9 14
Q6.5 & PQ6.5
PQ6.5Q6.5
0 1
0 66 1
1 0 0
Q7 & PQ7
PQ7Q7
0 1
0 20 1
1 1 3
Test Statistics
Q2.1 & PQ2.1
Q2.2 & PQ2.2
Q2.3 & PQ2.3
Q2.4 & PQ2.4
Q2.5 & PQ2.5
Q2.6 & PQ2.6
Q2.7 & PQ2.7
Q2.8 & PQ2.8
Q2.9 & PQ2.9
Q2.10 & PQ2.10
Q2.11 & PQ2.11
Q2.12 & PQ2.12
Q2.13 & PQ2.13
Q2.14 & PQ2.14
Q2.15 & PQ2.15
N 62 62 59 61 63 51 64 66 64 67 59 62 64 62 63
Chi-Square(a) .893
Asymp. Sig. .345
Exact Sig. (2-tailed) 1.000(b) .500(b) .375(b) .727(b) .500(b) 1.000(b) .625(b) .688(b) 1.000(b) .791(b) .688(b) .109(b) 1.000(b) .607(b)
a Continuity Corrected; b Binomial distribution used; c McNemar Test
Q2.15 & PQ2.15
Q3.1 & PQ3.1
Q3.2 & PQ3.2
Q3.3 & PQ3.3
Q3.4 & PQ3.4
Q4.1 & PQ4.1
Q4.2 & PQ4.2
Q4.3 & PQ4.3
Q4.4 & PQ4.4
Q4.5 & PQ4.5
N 63 50 56 48 26 54 54 61 56 69
Chi-Square(a)
Asymp. Sig.
Exact Sig. (2-tailed) .607(b) .688(b) .690(b) .302(b) .013(b) .625(b) .804(b) .289(b) .791(b) 1.000(b)
Q5.1 & PQ5.1
Q5.2 & PQ5.2
Q6.1 & PQ6.1
Q6.2 & PQ6.2
Q6.3 & PQ6.3
Q6.4 & PQ6.4
Q6.5 & PQ6.5
Q7 & PQ7
N 52 42 60 53 61 55 67 25
Chi-Square(a)
Asymp. Sig.
Exact Sig. (2-tailed) .625(b) .774(b) .727(b) .375(b) 1.000(b) .804(b) 1.000(b) 1.000(b)
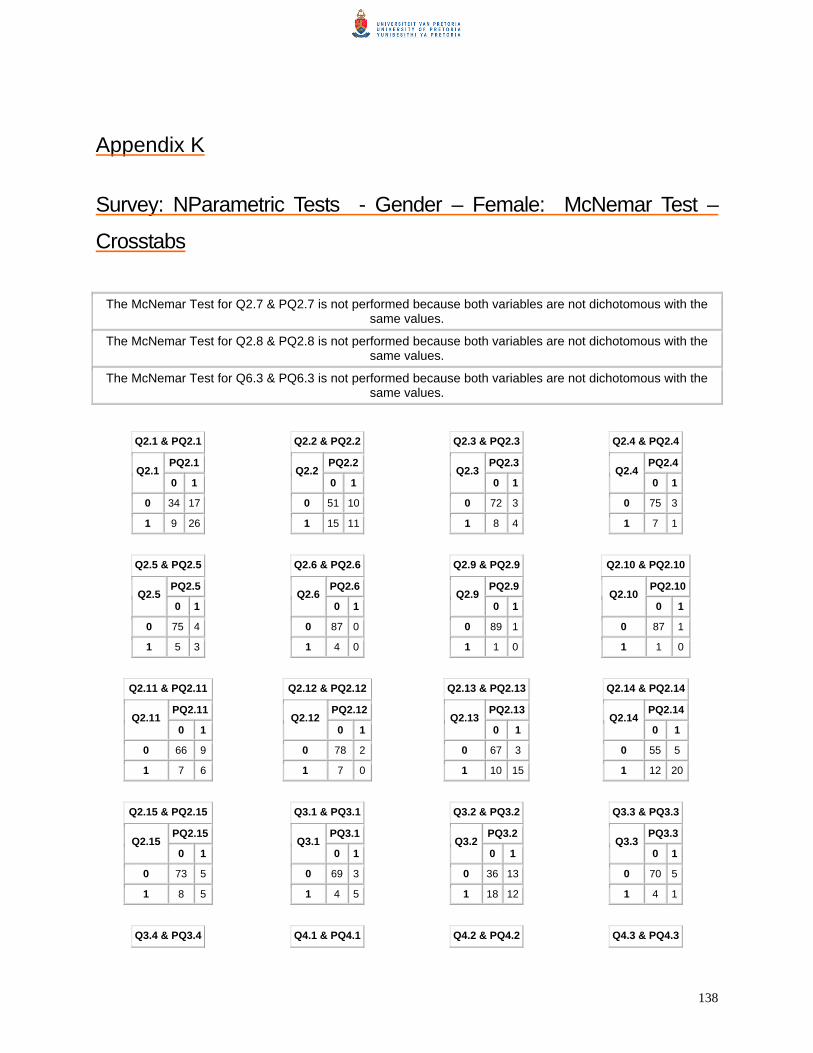
138
Appendix K
Survey: NParametric Tests - Gender – Female: McNemar Test –
Crosstabs
The McNemar Test for Q2.7 & PQ2.7 is not performed because both variables are not dichotomous with the same values.
The McNemar Test for Q2.8 & PQ2.8 is not performed because both variables are not dichotomous with the same values.
The McNemar Test for Q6.3 & PQ6.3 is not performed because both variables are not dichotomous with the same values.
Q2.1 & PQ2.1
PQ2.1 Q2.1
0 1
0 34 17
1 9 26
Q2.2 & PQ2.2
PQ2.2Q2.2
0 1
0 51 10
1 15 11
Q2.3 & PQ2.3
PQ2.3Q2.3
0 1
0 72 3
1 8 4
Q2.4 & PQ2.4
PQ2.4Q2.4
0 1
0 75 3
1 7 1
Q2.5 & PQ2.5
PQ2.5 Q2.5
0 1
0 75 4
1 5 3
Q2.6 & PQ2.6
PQ2.6Q2.6
0 1
0 87 0
1 4 0
Q2.9 & PQ2.9
PQ2.9Q2.9
0 1
0 89 1
1 1 0
Q2.10 & PQ2.10
PQ2.10Q2.10
0 1
0 87 1
1 1 0
Q2.11 & PQ2.11
PQ2.11 Q2.11
0 1
0 66 9
1 7 6
Q2.12 & PQ2.12
PQ2.12Q2.12
0 1
0 78 2
1 7 0
Q2.13 & PQ2.13
PQ2.13Q2.13
0 1
0 67 3
1 10 15
Q2.14 & PQ2.14
PQ2.14Q2.14
0 1
0 55 5
1 12 20
Q2.15 & PQ2.15
PQ2.15 Q2.15
0 1
0 73 5
1 8 5
Q3.1 & PQ3.1
PQ3.1Q3.1
0 1
0 69 3
1 4 5
Q3.2 & PQ3.2
PQ3.2Q3.2
0 1
0 36 13
1 18 12
Q3.3 & PQ3.3
PQ3.3Q3.3
0 1
0 70 5
1 4 1
Q3.4 & PQ3.4 Q4.1 & PQ4.1 Q4.2 & PQ4.2 Q4.3 & PQ4.3

139
PQ3.4 Q3.4 0 1
0 14 18
1 0 0
PQ4.1Q4.1 0 1
0 74 3
1 1 5
PQ4.2Q4.20 1
0 50 3
1 2 12
PQ4.3Q4.3 0 1
0 90 3
1 0 0
Q4.4 & PQ4.4
PQ4.4 Q4.4
0 1
0 47 8
1 8 11
Q4.5 & PQ4.5
PQ4.5Q4.5
0 1
0 92 0
1 2 0
Q5.1 & PQ5.1
PQ5.1Q5.1
0 1
0 75 3
1 2 2
Q5.2 & PQ5.2
PQ5.2Q5.2
0 1
0 25 2
1 4 14
Q6.1 & PQ6.1
PQ6.1 Q6.1
0 1
0 72 5
1 1 6
Q6.2 & PQ6.2
PQ6.2Q6.2
0 1
0 65 0
1 1 6
Q6.4 & PQ6.4
PQ6.4Q6.4
0 1
0 46 4
1 8 12
Q6.5 & PQ6.5
PQ6.5Q6.5
0 1
0 90 0
1 2 0
Q7 & PQ7
PQ7 Q7
0 1
0 51 0
1 0 0
Test Statistics
Q2.1
& PQ2.1
Q2.2 & PQ2.2
Q2.3 & PQ2.3
Q2.4 & PQ2.4
Q2.5 & PQ2.5
Q2.6 & PQ2.6
Q2.9 & PQ2.9
Q2.10 & PQ2.10
Q2.11 &
PQ2.11
Q2.12 &
PQ2.12
Q2.13 &
PQ2.13
Q2.14 &
PQ2.14
Q2.15 &
PQ2.15
N 86 87 87 86 87 91 91 89 88 87 95 92 91
Chi-Square(a) 1.885
Asymp. Sig. .170
Exact Sig. (2-tailed)
.424(b) .227(b) .344(b) 1.000(b) .125(b) 1.000(b) 1.000(b) .804(b) .180(b) .092(b) .143(b) .581(b)
Q3.1 & PQ3.1
Q3.2 & PQ3.2
Q3.3 & PQ3.3
Q3.4 & PQ3.4
Q4.1 & PQ4.1
Q4.2 & PQ4.2
Q4.3 & PQ4.3
Q4.4 & PQ4.4
Q4.5 & PQ4.5
N 81 79 80 32 83 67 93 74 94
Chi-Square(a) .516
Asymp. Sig. .472
Exact Sig. 1.000(b) 1.000(b) .000(b) .625(b) 1.000(b) .250(b) 1.000(b) .500(b)

140
(2-tailed)
Q5.1 & PQ5.1
Q5.2 & PQ5.2
Q6.1 & PQ6.1
Q6.2 & PQ6.2
Q6.4 & PQ6.4
Q6.5 & PQ6.5
Q7 & PQ7
N 82 45 84 72 70 92 51
Chi-Square(a)
Asymp. Sig.
Exact Sig. (2-tailed) 1.000(b) .688(b) .219(b) 1.000(b) .388(b) .500(b) 1.000(b)

141
Appendix L
WHOLE GROUP - NPar Tests - Crosstabulation
Q2.1 & PQ2.1
PQ2.1 Q2.1
0 1
0 61 27
1 18 42
Q2.2 & PQ2.2
PQ2.2Q2.2
0 1
0 78 21
1 32 18
Q2.3 & PQ2.3
PQ2.3Q2.3
0 1
0 129 5
1 8 4
Q2.4 & PQ2.4
PQ2.4Q2.4
0 1
0 130 4
1 11 2
Q2.5 & PQ2.5
PQ2.5 Q2.5
0 1
0 125 7
1 10 8
Q2.6 & PQ2.6
PQ2.6Q2.6
0 1
0 136 0
1 6
Q2.7 & PQ2.7
PQ2.7Q2.7
0 1
0 158 1
1 0 0
Q2.8 & PQ2.8
PQ2.8Q2.8
0 1
0 156 1
1 3 0
Q2.9 & PQ2.9
PQ2.9 Q2.9
0 1
0 147 5
1 3 0
Q2.10 & PQ2.10
PQ2.10Q2.10
0 1
0 149 3
1 4 0
Q2.11 & PQ2.11
PQ2.11Q2.11
0 1
0 108 15
1 15 9
Q2.12 & PQ2.12
PQ2.12Q2.12
0 1
0 131 4
1 11 3
Q2.13 & PQ2.13
PQ2.13 Q2.13
0 1
0 101 5
1 18 35
Q2.14 & PQ2.14
PQ2.14Q2.14
0 1
0 79 13
1 19 43
Q2.15 & PQ2.15
PQ2.15Q2.15
0 1
0 109 11
1 17 17
Q3.1 & PQ3.1
PQ3.1 Q3.1
0 1
0 104 5
1 8 14
Q3.2 & PQ3.2
PQ3.2 Q3.2
0 1
0 56 24
1 32 23
Q3.3 & PQ3.3
PQ3.3Q3.3
0 1
0 99 10
1 14 5
Q3.4 & PQ3.4
PQ3.4Q3.4
0 1
0 25 30
1 2 1
Q4.1 & PQ4.1
PQ4.1 Q4.1
0 1
0 117 4
1 4 12
Q4.2 & PQ4.2
PQ4.2 Q4.2
0 1
0 72 10
1 11 28
Q4.3 & PQ4.3
PQ4.3Q4.3
0 1
0 142 5
1 6 1
Q4.4 & PQ4.4
PQ4.4Q4.4
0 1
0 76 16
1 14 24
Q4.5 & PQ4.5
PQ4.5Q4.5
0 1
0 160 0
1 2 1
Q5.1 & PQ5.1 Q5.2 & PQ5.2 Q6.1 & PQ6.1 Q6.2 & PQ6.2
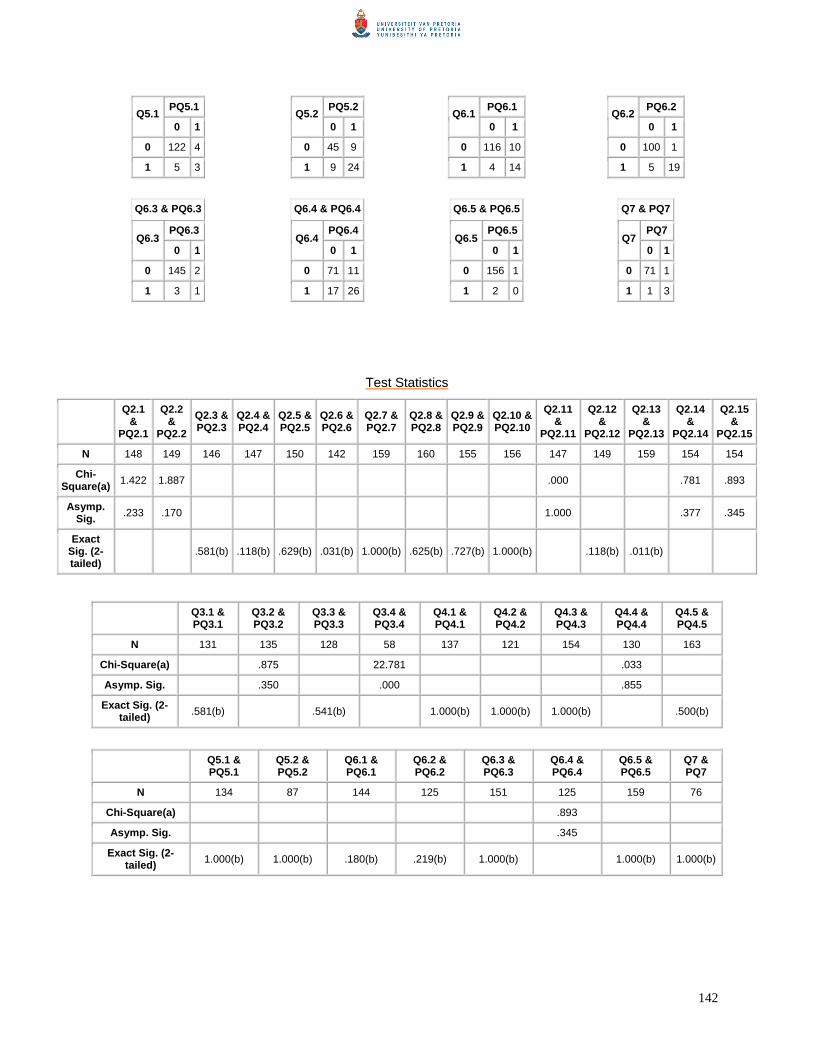
142
PQ5.1 Q5.1 0 1
0 122 4
1 5 3
PQ5.2Q5.2 0 1
0 45 9
1 9 24
PQ6.1 Q6.10 1
0 116 10
1 4 14
PQ6.2 Q6.2 0 1
0 100 1
1 5 19
Q6.3 & PQ6.3
PQ6.3 Q6.3
0 1
0 145 2
1 3 1
Q6.4 & PQ6.4
PQ6.4Q6.4
0 1
0 71 11
1 17 26
Q6.5 & PQ6.5
PQ6.5Q6.5
0 1
0 156 1
1 2 0
Q7 & PQ7
PQ7Q7
0 1
0 71 1
1 1 3
Test Statistics
Q2.1
& PQ2.1
Q2.2 &
PQ2.2
Q2.3 & PQ2.3
Q2.4 & PQ2.4
Q2.5 & PQ2.5
Q2.6 & PQ2.6
Q2.7 & PQ2.7
Q2.8 & PQ2.8
Q2.9 & PQ2.9
Q2.10 & PQ2.10
Q2.11 &
PQ2.11
Q2.12 &
PQ2.12
Q2.13 &
PQ2.13
Q2.14 &
PQ2.14
Q2.15 &
PQ2.15
N 148 149 146 147 150 142 159 160 155 156 147 149 159 154 154
Chi-Square(a) 1.422 1.887 .000 .781 .893
Asymp. Sig. .233 .170 1.000 .377 .345
Exact Sig. (2-tailed)
.581(b) .118(b) .629(b) .031(b) 1.000(b) .625(b) .727(b) 1.000(b) .118(b) .011(b)
Q3.1 & PQ3.1
Q3.2 & PQ3.2
Q3.3 & PQ3.3
Q3.4 & PQ3.4
Q4.1 & PQ4.1
Q4.2 & PQ4.2
Q4.3 & PQ4.3
Q4.4 & PQ4.4
Q4.5 & PQ4.5
N 131 135 128 58 137 121 154 130 163
Chi-Square(a) .875 22.781 .033
Asymp. Sig. .350 .000 .855
Exact Sig. (2-tailed) .581(b) .541(b) 1.000(b) 1.000(b) 1.000(b) .500(b)
Q5.1 & PQ5.1
Q5.2 & PQ5.2
Q6.1 & PQ6.1
Q6.2 & PQ6.2
Q6.3 & PQ6.3
Q6.4 & PQ6.4
Q6.5 & PQ6.5
Q7 & PQ7
N 134 87 144 125 151 125 159 76
Chi-Square(a) .893
Asymp. Sig. .345
Exact Sig. (2-tailed) 1.000(b) 1.000(b) .180(b) .219(b) 1.000(b) 1.000(b) 1.000(b)

143
Appendix M
AGE BY GENDER (WHOLE GROUP) q1.2 Statistic Std. Error
Mean 16.58 .217Median 16.00
Boy
Std. Deviation 1.802 Mean 15.89 .154Median 16.00
q1.1
Girl
Std. Deviation 1.498
Independent Samples Test
q1.1 F Equal variances assumed
7.027 Levene's Test for Equality of Variances
Sig. Equal variances assumed .009 Equal variances assumed
2.653 t
Equal variances not assumed 2.576 Equal variances assumed
162 df
Equal variances not assumed 129.749
Equal variances assumed .009
Sig. (2-tailed)
Equal variances not assumed .011
Equal variances assumed .685
t-test for Equality of Means
Mean Difference
Equal variances not assumed .685

144
Appendix N
AGE BAND PER SCHOOL PER SURVEY QUESTIONS:
Crosstabulations: Pre- and post-test results Question 2.1 – Pre-test
Crosstab
q2.1 Total
school Yes No Uncertain Yes Count 2 4 1 7
% within page (Binned) 28.6% 57.1% 14.3% 100.0%
Under 16
% within q2.1 33.3% 16.7% 33.3% 21.2% Count 2 5 1 8
% within page (Binned) 25.0% 62.5% 12.5% 100.0%
Under 18
% within q2.1 33.3% 20.8% 33.3% 24.2% Count 2 10 1 13
% within page (Binned) 15.4% 76.9% 7.7% 100.0%
Under 20
% within q2.1 33.3% 41.7% 33.3% 39.4% Count 0 5 0 5
% within page (Binned) .0% 100.0% .0% 100.0%
page (Binned)
Older than 20
% within q2.1 .0% 20.8% .0% 15.2% Count 6 24 3 33
% within page (Binned) 18.2% 72.7% 9.1% 100.0%
School 1
Total
% within q2.1 100.0% 100.0% 100.0% 100.0% Count 15 13 1 29
% within page (Binned) 51.7% 44.8% 3.4% 100.0%
Under 16
% within q2.1 100.0% 92.9% 100.0% 96.7% Count 0 1 0 1
% within page (Binned) .0% 100.0% .0% 100.0%
page (Binned)
Under 18
% within q2.1 .0% 7.1% .0% 3.3% Count 15 14 1 30
% within page (Binned) 50.0% 46.7% 3.3% 100.0%
School 2
Total
% within q2.1 100.0% 100.0% 100.0% 100.0% Count 24 8 32
% within page (Binned) 75.0% 25.0% 100.0% page
(Binned) Under 16
% within q2.1 100.0% 100.0% 100.0% Count 24 8 32
% within page (Binned) 75.0% 25.0% 100.0%
School 3
Total
% within q2.1 100.0% 100.0% 100.0% Count 15 9 24
% within page (Binned) 62.5% 37.5% 100.0%
Under 16
% within q2.1 83.3% 75.0% 80.0% Count 3 2 5
% within page (Binned) 60.0% 40.0% 100.0% Under 18
% within q2.1 16.7% 16.7% 16.7% Count 0 1 1
% within page (Binned) .0% 100.0% 100.0%
page (Binned)
Under 20
% within q2.1 .0% 8.3% 3.3% Count 18 12 30
% within page (Binned) 60.0% 40.0% 100.0%
School 4
Total
% within q2.1 100.0% 100.0% 100.0%
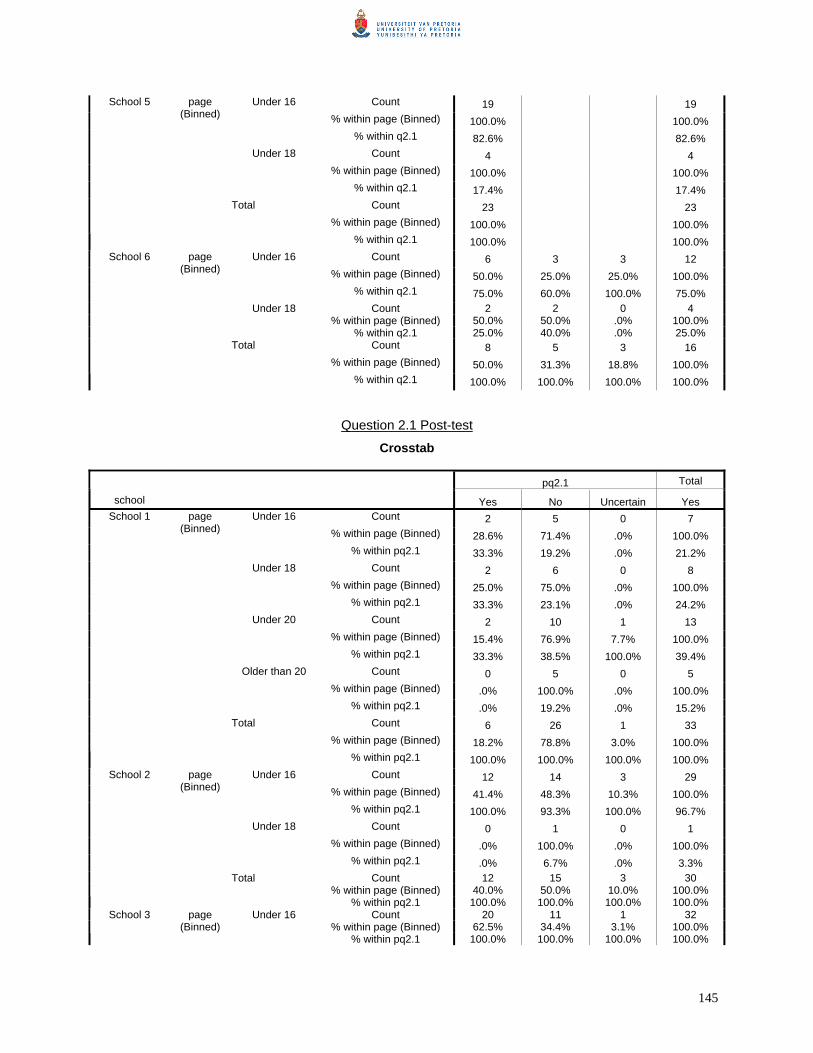
145
Count 19 19 % within page (Binned) 100.0% 100.0%
Under 16
% within q2.1 82.6% 82.6% Count 4 4
% within page (Binned) 100.0% 100.0%
page (Binned)
Under 18
% within q2.1 17.4% 17.4% Count 23 23
% within page (Binned) 100.0% 100.0%
School 5
Total
% within q2.1 100.0% 100.0% Count 6 3 3 12
% within page (Binned) 50.0% 25.0% 25.0% 100.0%
Under 16
% within q2.1 75.0% 60.0% 100.0% 75.0% Count 2 2 0 4
% within page (Binned) 50.0% 50.0% .0% 100.0%
page (Binned)
Under 18
% within q2.1 25.0% 40.0% .0% 25.0% Count 8 5 3 16
% within page (Binned) 50.0% 31.3% 18.8% 100.0%
School 6
Total
% within q2.1 100.0% 100.0% 100.0% 100.0%
Question 2.1 Post-test
Crosstab
pq2.1 Total
school Yes No Uncertain Yes Count 2 5 0 7
% within page (Binned) 28.6% 71.4% .0% 100.0%
Under 16
% within pq2.1 33.3% 19.2% .0% 21.2% Count 2 6 0 8
% within page (Binned) 25.0% 75.0% .0% 100.0%
Under 18
% within pq2.1 33.3% 23.1% .0% 24.2% Count 2 10 1 13
% within page (Binned) 15.4% 76.9% 7.7% 100.0%
Under 20
% within pq2.1 33.3% 38.5% 100.0% 39.4% Count 0 5 0 5
% within page (Binned) .0% 100.0% .0% 100.0%
page (Binned)
Older than 20
% within pq2.1 .0% 19.2% .0% 15.2% Count 6 26 1 33
% within page (Binned) 18.2% 78.8% 3.0% 100.0%
School 1
Total
% within pq2.1 100.0% 100.0% 100.0% 100.0% Count 12 14 3 29
% within page (Binned) 41.4% 48.3% 10.3% 100.0%
Under 16
% within pq2.1 100.0% 93.3% 100.0% 96.7% Count 0 1 0 1
% within page (Binned) .0% 100.0% .0% 100.0%
page (Binned)
Under 18
% within pq2.1 .0% 6.7% .0% 3.3% Count 12 15 3 30
% within page (Binned) 40.0% 50.0% 10.0% 100.0%
School 2
Total
% within pq2.1 100.0% 100.0% 100.0% 100.0% Count 20 11 1 32
% within page (Binned) 62.5% 34.4% 3.1% 100.0% School 3 page
(Binned) Under 16
% within pq2.1 100.0% 100.0% 100.0% 100.0%

146
Count 20 11 1 32 % within page (Binned) 62.5% 34.4% 3.1% 100.0%
Total
% within pq2.1 100.0% 100.0% 100.0% 100.0% Count 15 8 1 24
% within page (Binned) 62.5% 33.3% 4.2% 100.0%
Under 16
% within pq2.1 83.3% 72.7% 100.0% 80.0% Count 3 2 0 5
% within page (Binned) 60.0% 40.0% .0% 100.0% Under 18
% within pq2.1 16.7% 18.2% .0% 16.7% Count 0 1 0 1
% within page (Binned) .0% 100.0% .0% 100.0%
page (Binned)
Under 20
% within pq2.1 .0% 9.1% .0% 3.3% Count 18 11 1 30
% within page (Binned) 60.0% 36.7% 3.3% 100.0%
School 4
Total
% within pq2.1 100.0% 100.0% 100.0% 100.0% Count 14 3 1 18
% within page (Binned) 77.8% 16.7% 5.6% 100.0%
Under 16
% within pq2.1 82.4% 75.0% 100.0% 81.8% Count 3 1 0 4
% within page (Binned) 75.0% 25.0% .0% 100.0%
page (Binned)
Under 18
% within pq2.1 17.6% 25.0% .0% 18.2% Count 17 4 1 22
% within page (Binned) 77.3% 18.2% 4.5% 100.0%
School 5
Total
% within pq2.1 100.0% 100.0% 100.0% 100.0% Count 6 6 0 12
% within page (Binned) 50.0% 50.0% .0% 100.0%
Under 16
% within pq2.1 66.7% 100.0% .0% 75.0% Count 3 0 1 4
% within page (Binned) 75.0% .0% 25.0% 100.0%
page (Binned)
Under 18
% within pq2.1 33.3% .0% 100.0% 25.0% Count 9 6 1 16
% within page (Binned) 56.3% 37.5% 6.3% 100.0%
School 6
Total
% within pq2.1 100.0% 100.0% 100.0% 100.0%
Question 2.2 – Pre- test
Crosstab
q2.2 Total
school Yes No Uncertain Yes Count 0 7 0 7
% within page (Binned) .0% 100.0% .0% 100.0%
Under 16
% within q2.2 .0% 36.8% .0% 21.2% Count 2 5 1 8
% within page (Binned) 25.0% 62.5% 12.5% 100.0%
Under 18
% within q2.2 18.2% 26.3% 33.3% 24.2% Count 5 6 2 13
% within page (Binned) 38.5% 46.2% 15.4% 100.0%
Under 20
% within q2.2 45.5% 31.6% 66.7% 39.4% Count 4 1 0 5
page (Binned)
Older than 20 % within page (Binned) 80.0% 20.0% .0% 100.0%

147
% within q2.2 36.4% 5.3% .0% 15.2% Count 11 19 3 33
% within page (Binned) 33.3% 57.6% 9.1% 100.0%
Total
% within q2.2 100.0% 100.0% 100.0% 100.0% Count 12 15 2 29
% within page (Binned) 41.4% 51.7% 6.9% 100.0%
Under 16
% within q2.2 92.3% 100.0% 100.0% 96.7% Count 1 0 0 1
% within page (Binned) 100.0% .0% .0% 100.0%
page (Binned)
Under 18
% within q2.2 7.7% .0% .0% 3.3% Count 13 15 2 30
% within page (Binned) 43.3% 50.0% 6.7% 100.0%
School 2
Total
% within q2.2 100.0% 100.0% 100.0% 100.0% Count 21 8 3 32
% within page (Binned) 65.6% 25.0% 9.4% 100.0% page
(Binned) Under 16
% within q2.2 100.0% 100.0% 100.0% 100.0% Count 21 8 3 32
% within page (Binned) 65.6% 25.0% 9.4% 100.0%
School 3
Total
% within q2.2 100.0% 100.0% 100.0% 100.0% Count 18 6 24
% within page (Binned) 75.0% 25.0% 100.0%
Under 16
% within q2.2 85.7% 66.7% 80.0% Count 3 2 5
% within page (Binned) 60.0% 40.0% 100.0% Under 18
% within q2.2 14.3% 22.2% 16.7% Count 0 1 1
% within page (Binned) .0% 100.0% 100.0%
page (Binned)
Under 20
% within q2.2 .0% 11.1% 3.3% Count 21 9 30
% within page (Binned) 70.0% 30.0% 100.0%
School 4
Total
% within q2.2 100.0% 100.0% 100.0% Count 19 19
% within page (Binned) 100.0% 100.0%
Under 16
% within q2.2 82.6% 82.6% Count 4 4
% within page (Binned) 100.0% 100.0%
page (Binned)
Under 18
% within q2.2 17.4% 17.4% Count 23 23
% within page (Binned) 100.0% 100.0%
School 5
Total
% within q2.2 100.0% 100.0% Count 9 1 2 12
% within page (Binned) 75.0% 8.3% 16.7% 100.0%
Under 16
% within q2.2 69.2% 100.0% 100.0% 75.0% Count 4 0 0 4
% within page (Binned) 100.0% .0% .0% 100.0%
page (Binned)
Under 18
% within q2.2 30.8% .0% .0% 25.0% Count 13 1 2 16
% within page (Binned) 81.3% 6.3% 12.5% 100.0%
School 6
Total
% within q2.2 100.0% 100.0% 100.0% 100.0%
Question 2.2 – Post-test
Crosstab

148
pq2.2 Total
school Yes No Uncertain Yes Count 7 0 0 7
% within page (Binned) 100.0% .0% .0% 100.0%
Under 16
% within pq2.2 33.3% .0% .0% 21.2% Count 4 4 0 8
% within page (Binned) 50.0% 50.0% .0% 100.0%
Under 18
% within pq2.2 19.0% 36.4% .0% 24.2% Count 7 6 0 13
% within page (Binned) 53.8% 46.2% .0% 100.0%
Under 20
% within pq2.2 33.3% 54.5% .0% 39.4% Count 3 1 1 5
% within page (Binned) 60.0% 20.0% 20.0% 100.0%
page (Binned)
Older than 20
% within pq2.2 14.3% 9.1% 100.0% 15.2% Count 21 11 1 33
% within page (Binned) 63.6% 33.3% 3.0% 100.0%
School 1
Total
% within pq2.2 100.0% 100.0% 100.0% 100.0% Count 19 8 1 28
% within page (Binned) 67.9% 28.6% 3.6% 100.0%
Under 16
% within pq2.2 95.0% 100.0% 100.0% 96.6% Count 1 0 0 1
% within page (Binned) 100.0% .0% .0% 100.0%
page (Binned)
Under 18
% within pq2.2 5.0% .0% .0% 3.4% Count 20 8 1 29
% within page (Binned) 69.0% 27.6% 3.4% 100.0%
School 2
Total
% within pq2.2 100.0% 100.0% 100.0% 100.0% Count 22 8 2 32
% within page (Binned) 68.8% 25.0% 6.3% 100.0% page
(Binned) Under 16
% within pq2.2 100.0% 100.0% 100.0% 100.0% Count 22 8 2 32
% within page (Binned) 68.8% 25.0% 6.3% 100.0%
School 3
Total
% within pq2.2 100.0% 100.0% 100.0% 100.0% Count 18 6 24
% within page (Binned) 75.0% 25.0% 100.0%
Under 16
% within pq2.2 85.7% 66.7% 80.0% Count 3 2 5
% within page (Binned) 60.0% 40.0% 100.0% Under 18
% within pq2.2 14.3% 22.2% 16.7% Count 0 1 1
% within page (Binned) .0% 100.0% 100.0%
page (Binned)
Under 20
% within pq2.2 .0% 11.1% 3.3% Count 21 9 30
% within page (Binned) 70.0% 30.0% 100.0%
School 4
Total
% within pq2.2 100.0% 100.0% 100.0% Count 16 3 19
% within page (Binned) 84.2% 15.8% 100.0%
Under 16
% within pq2.2 80.0% 100.0% 82.6% Count 4 0 4
% within page (Binned) 100.0% .0% 100.0%
page (Binned)
Under 18
% within pq2.2 20.0% .0% 17.4% Count 20 3 23
% within page (Binned) 87.0% 13.0% 100.0%
School 5
Total
% within pq2.2 100.0% 100.0% 100.0% School 6 page Under 16 Count 7 5 0 12

149
% within page (Binned) 58.3% 41.7% .0% 100.0% % within pq2.2 70.0% 100.0% .0% 75.0%
Count 3 0 1 4 % within page (Binned) 75.0% .0% 25.0% 100.0%
(Binned)
Under 18
% within pq2.2 30.0% .0% 100.0% 25.0% Count 10 5 1 16
% within page (Binned) 62.5% 31.3% 6.3% 100.0%
Total
% within pq2.2 100.0% 100.0% 100.0% 100.0%
Question 2.3 – Pre-test
Crosstab
q2.3 Total
school Yes No Uncertain Yes Count 3 3 1 7
% within page (Binned) 42.9% 42.9% 14.3% 100.0%
Under 16
% within q2.3 16.7% 37.5% 14.3% 21.2% Count 4 1 3 8
% within page (Binned) 50.0% 12.5% 37.5% 100.0%
Under 18
% within q2.3 22.2% 12.5% 42.9% 24.2% Count 7 4 2 13
% within page (Binned) 53.8% 30.8% 15.4% 100.0%
Under 20
% within q2.3 38.9% 50.0% 28.6% 39.4% Count 4 0 1 5
% within page (Binned) 80.0% .0% 20.0% 100.0%
page (Binned)
Older than 20
% within q2.3 22.2% .0% 14.3% 15.2% Count 18 8 7 33
% within page (Binned) 54.5% 24.2% 21.2% 100.0%
School 1
Total
% within q2.3 100.0% 100.0% 100.0% 100.0% Count 27 1 1 29
% within page (Binned) 93.1% 3.4% 3.4% 100.0%
Under 16
% within q2.3 96.4% 100.0% 100.0% 96.7% Count 1 0 0 1
% within page (Binned) 100.0% .0% .0% 100.0%
page (Binned)
Under 18
% within q2.3 3.6% .0% .0% 3.3% Count 28 1 1 30
% within page (Binned) 93.3% 3.3% 3.3% 100.0%
School 2
Total
% within q2.3 100.0% 100.0% 100.0% 100.0% Count 28 2 1 31
% within page (Binned) 90.3% 6.5% 3.2% 100.0% page
(Binned) Under 16
% within q2.3 100.0% 100.0% 100.0% 100.0% Count 28 2 1 31
% within page (Binned) 90.3% 6.5% 3.2% 100.0%
School 3
Total
% within q2.3 100.0% 100.0% 100.0% 100.0% Count 23 1 24
% within page (Binned) 95.8% 4.2% 100.0%
Under 16
% within q2.3 79.3% 100.0% 80.0% Count 5 0 5
% within page (Binned) 100.0% .0% 100.0% Under 18
% within q2.3 17.2% .0% 16.7%
School 4 page (Binned)
Under 20 Count 1 0 1

150
% within page (Binned) 100.0% .0% 100.0% % within q2.3 3.4% .0% 3.3%
Count 29 1 30 % within page (Binned) 96.7% 3.3% 100.0%
Total
% within q2.3 100.0% 100.0% 100.0% Count 19 19
% within page (Binned) 100.0% 100.0%
Under 16
% within q2.3 82.6% 82.6% Count 4 4
% within page (Binned) 100.0% 100.0%
page (Binned)
Under 18
% within q2.3 17.4% 17.4% Count 23 23
% within page (Binned) 100.0% 100.0%
School 5
Total
% within q2.3 100.0% 100.0% Count 11 1 12
% within page (Binned) 91.7% 8.3% 100.0%
Under 16
% within q2.3 73.3% 100.0% 75.0% Count 4 0 4
% within page (Binned) 100.0% .0% 100.0%
page (Binned)
Under 18
% within q2.3 26.7% .0% 25.0% Count 15 1 16
% within page (Binned) 93.8% 6.3% 100.0%
School 6
Total
% within q2.3 100.0% 100.0% 100.0%
Question 2.3 – Post-test
Crosstab
pq2.3 Total
school Yes No Uncertain Yes Count 6 1 7
% within page (Binned) 85.7% 14.3% 100.0%
Under 16
% within pq2.3 25.0% 11.1% 21.2% Count 7 1 8
% within page (Binned) 87.5% 12.5% 100.0%
Under 18
% within pq2.3 29.2% 11.1% 24.2% Count 8 5 13
% within page (Binned) 61.5% 38.5% 100.0%
Under 20
% within pq2.3 33.3% 55.6% 39.4% Count 3 2 5
% within page (Binned) 60.0% 40.0% 100.0%
page (Binned)
Older than 20
% within pq2.3 12.5% 22.2% 15.2% Count 24 9 33
% within page (Binned) 72.7% 27.3% 100.0%
School 1
Total
% within pq2.3 100.0% 100.0% 100.0% Count 27 2 29
% within page (Binned) 93.1% 6.9% 100.0%
Under 16
% within pq2.3 96.4% 100.0% 96.7% Count 1 0 1
% within page (Binned) 100.0% .0% 100.0%
page (Binned)
Under 18
% within pq2.3 3.6% .0% 3.3%
School 2
Total Count 28 2 30

151
% within page (Binned) 93.3% 6.7% 100.0% % within pq2.3 100.0% 100.0% 100.0%
Count 30 1 31 % within page (Binned) 96.8% 3.2% 100.0%
page (Binned)
Under 16
% within pq2.3 100.0% 100.0% 100.0% Count 30 1 31
% within page (Binned) 96.8% 3.2% 100.0%
School 3
Total
% within pq2.3 100.0% 100.0% 100.0% Count 22 2 24
% within page (Binned) 91.7% 8.3% 100.0%
Under 16
% within pq2.3 81.5% 100.0% 82.8% Count 4 0 4
% within page (Binned) 100.0% .0% 100.0% Under 18
% within pq2.3 14.8% .0% 13.8% Count 1 0 1
% within page (Binned) 100.0% .0% 100.0%
page (Binned)
Under 20
% within pq2.3 3.7% .0% 3.4% Count 27 2 29
% within page (Binned) 93.1% 6.9% 100.0%
School 4
Total
% within pq2.3 100.0% 100.0% 100.0% Count 18 1 19
% within page (Binned) 94.7% 5.3% 100.0%
Under 16
% within pq2.3 81.8% 100.0% 82.6% Count 4 0 4
% within page (Binned) 100.0% .0% 100.0%
page (Binned)
Under 18
% within pq2.3 18.2% .0% 17.4% Count 22 1 23
% within page (Binned) 95.7% 4.3% 100.0%
School 5
Total
% within pq2.3 100.0% 100.0% 100.0% Count 11 1 0 12
% within page (Binned) 91.7% 8.3% .0% 100.0%
Under 16
% within pq2.3 78.6% 100.0% .0% 75.0% Count 3 0 1 4
% within page (Binned) 75.0% .0% 25.0% 100.0%
page (Binned)
Under 18
% within pq2.3 21.4% .0% 100.0% 25.0% Count 14 1 1 16
% within page (Binned) 87.5% 6.3% 6.3% 100.0%
School 6
Total
% within pq2.3 100.0% 100.0% 100.0% 100.0%
Question 2.4 Pre-test
Crosstab
q2.4 Total
school Yes No Uncertain Yes Count 5 2 0 7
% within page (Binned) 71.4% 28.6% .0% 100.0%
Under 16
% within q2.4 25.0% 18.2% .0% 21.2% Count 5 3 0 8
% within page (Binned) 62.5% 37.5% .0% 100.0%
Under 18
% within q2.4 25.0% 27.3% .0% 24.2% Count 9 2 2 13
% within page (Binned) 69.2% 15.4% 15.4% 100.0%
Under 20
% within q2.4 45.0% 18.2% 100.0% 39.4%
School 1 page (Binned)
Older than 20 Count 1 4 0 5
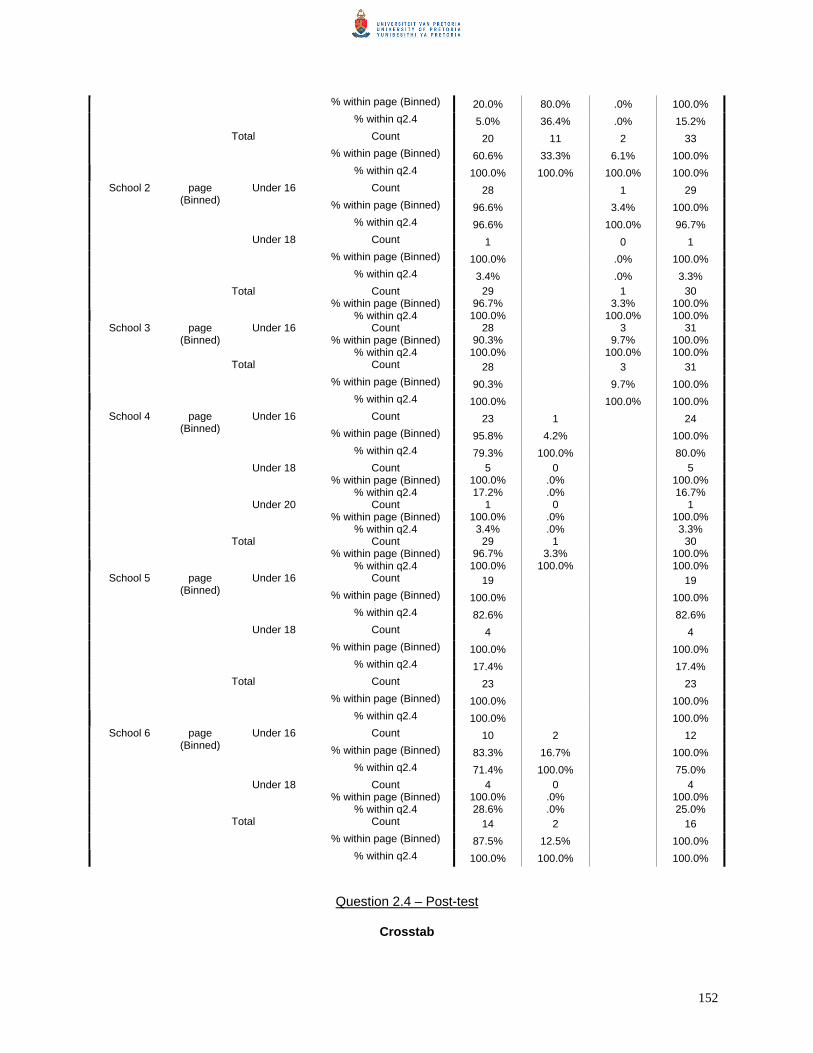
152
% within page (Binned) 20.0% 80.0% .0% 100.0% % within q2.4 5.0% 36.4% .0% 15.2%
Count 20 11 2 33 % within page (Binned) 60.6% 33.3% 6.1% 100.0%
Total
% within q2.4 100.0% 100.0% 100.0% 100.0% Count 28 1 29
% within page (Binned) 96.6% 3.4% 100.0%
Under 16
% within q2.4 96.6% 100.0% 96.7% Count 1 0 1
% within page (Binned) 100.0% .0% 100.0%
page (Binned)
Under 18
% within q2.4 3.4% .0% 3.3% Count 29 1 30
% within page (Binned) 96.7% 3.3% 100.0%
School 2
Total
% within q2.4 100.0% 100.0% 100.0% Count 28 3 31
% within page (Binned) 90.3% 9.7% 100.0% page
(Binned) Under 16
% within q2.4 100.0% 100.0% 100.0% Count 28 3 31
% within page (Binned) 90.3% 9.7% 100.0%
School 3
Total
% within q2.4 100.0% 100.0% 100.0% Count 23 1 24
% within page (Binned) 95.8% 4.2% 100.0%
Under 16
% within q2.4 79.3% 100.0% 80.0% Count 5 0 5
% within page (Binned) 100.0% .0% 100.0% Under 18
% within q2.4 17.2% .0% 16.7% Count 1 0 1
% within page (Binned) 100.0% .0% 100.0%
page (Binned)
Under 20
% within q2.4 3.4% .0% 3.3% Count 29 1 30
% within page (Binned) 96.7% 3.3% 100.0%
School 4
Total
% within q2.4 100.0% 100.0% 100.0% Count 19 19
% within page (Binned) 100.0% 100.0%
Under 16
% within q2.4 82.6% 82.6% Count 4 4
% within page (Binned) 100.0% 100.0%
page (Binned)
Under 18
% within q2.4 17.4% 17.4% Count 23 23
% within page (Binned) 100.0% 100.0%
School 5
Total
% within q2.4 100.0% 100.0% Count 10 2 12
% within page (Binned) 83.3% 16.7% 100.0%
Under 16
% within q2.4 71.4% 100.0% 75.0% Count 4 0 4
% within page (Binned) 100.0% .0% 100.0%
page (Binned)
Under 18
% within q2.4 28.6% .0% 25.0% Count 14 2 16
% within page (Binned) 87.5% 12.5% 100.0%
School 6
Total
% within q2.4 100.0% 100.0% 100.0%
Question 2.4 – Post-test
Crosstab

153
pq2.4 Total
school Yes No Uncertain Yes Count 4 2 1 7
% within page (Binned) 57.1% 28.6% 14.3% 100.0%
Under 16
% within pq2.4 18.2% 28.6% 25.0% 21.2% Count 6 1 1 8
% within page (Binned) 75.0% 12.5% 12.5% 100.0%
Under 18
% within pq2.4 27.3% 14.3% 25.0% 24.2% Count 8 4 1 13
% within page (Binned) 61.5% 30.8% 7.7% 100.0%
Under 20
% within pq2.4 36.4% 57.1% 25.0% 39.4% Count 4 0 1 5
% within page (Binned) 80.0% .0% 20.0% 100.0%
page (Binned)
Older than 20
% within pq2.4 18.2% .0% 25.0% 15.2% Count 22 7 4 33
% within page (Binned) 66.7% 21.2% 12.1% 100.0%
School 1
Total
% within pq2.4 100.0% 100.0% 100.0% 100.0% Count 27 1 28
% within page (Binned) 96.4% 3.6% 100.0%
Under 16
% within pq2.4 96.4% 100.0% 96.6% Count 1 0 1
% within page (Binned) 100.0% .0% 100.0%
page (Binned)
Under 18
% within pq2.4 3.6% .0% 3.4% Count 28 1 29
% within page (Binned) 96.6% 3.4% 100.0%
School 2
Total
% within pq2.4 100.0% 100.0% 100.0% Count 31 1 32
% within page (Binned) 96.9% 3.1% 100.0% page
(Binned) Under 16
% within pq2.4 100.0% 100.0% 100.0% Count 31 1 32
% within page (Binned) 96.9% 3.1% 100.0%
School 3
Total
% within pq2.4 100.0% 100.0% 100.0% Count 24 24
% within page (Binned) 100.0% 100.0%
Under 16
% within pq2.4 82.8% 82.8% Count 4 4
% within page (Binned) 100.0% 100.0% Under 18
% within pq2.4 13.8% 13.8% Count 1 1
% within page (Binned) 100.0% 100.0%
page (Binned)
Under 20
% within pq2.4 3.4% 3.4% Count 29 29
% within page (Binned) 100.0% 100.0%
School 4
Total
% within pq2.4 100.0% 100.0% Count 18 1 19
% within page (Binned) 94.7% 5.3% 100.0%
Under 16
% within pq2.4 81.8% 100.0% 82.6% Count 4 0 4
% within page (Binned) 100.0% .0% 100.0%
page (Binned)
Under 18
% within pq2.4 18.2% .0% 17.4% Count 22 1 23
% within page (Binned) 95.7% 4.3% 100.0%
School 5
Total
% within pq2.4 100.0% 100.0% 100.0% School 6 page Under 16 Count 11 1 0 12

154
% within page (Binned) 91.7% 8.3% .0% 100.0% % within pq2.4 84.6% 100.0% .0% 75.0%
Count 2 0 2 4 % within page (Binned) 50.0% .0% 50.0% 100.0%
(Binned)
Under 18
% within pq2.4 15.4% .0% 100.0% 25.0% Count 13 1 2 16
% within page (Binned) 81.3% 6.3% 12.5% 100.0%
Total
% within pq2.4 100.0% 100.0% 100.0% 100.0%
Question 2.5 – Pre-test
Crosstab
q2.5 Total
school Yes No Uncertain Yes Count 2 5 0 7
% within page (Binned) 28.6% 71.4% .0% 100.0%
Under 16
% within q2.5 12.5% 35.7% .0% 21.2% Count 3 2 3 8
% within page (Binned) 37.5% 25.0% 37.5% 100.0%
Under 18
% within q2.5 18.8% 14.3% 100.0% 24.2% Count 7 6 0 13
% within page (Binned) 53.8% 46.2% .0% 100.0%
Under 20
% within q2.5 43.8% 42.9% .0% 39.4% Count 4 1 0 5
% within page (Binned) 80.0% 20.0% .0% 100.0%
page (Binned)
Older than 20
% within q2.5 25.0% 7.1% .0% 15.2% Count 16 14 3 33
% within page (Binned) 48.5% 42.4% 9.1% 100.0%
School 1
Total
% within q2.5 100.0% 100.0% 100.0% 100.0% Count 28 1 29
% within page (Binned) 96.6% 3.4% 100.0%
Under 16
% within q2.5 96.6% 100.0% 96.7% Count 1 0 1
% within page (Binned) 100.0% .0% 100.0%
page (Binned)
Under 18
% within q2.5 3.4% .0% 3.3% Count 29 1 30
% within page (Binned) 96.7% 3.3% 100.0%
School 2
Total
% within q2.5 100.0% 100.0% 100.0% Count 31 1 32
% within page (Binned) 96.9% 3.1% 100.0% page
(Binned) Under 16
% within q2.5 100.0% 100.0% 100.0% Count 31 1 32
% within page (Binned) 96.9% 3.1% 100.0%
School 3
Total
% within q2.5 100.0% 100.0% 100.0% Count 23 1 0 24
% within page (Binned) 95.8% 4.2% .0% 100.0%
Under 16
% within q2.5 82.1% 100.0% .0% 80.0% Count 4 0 1 5
% within page (Binned) 80.0% .0% 20.0% 100.0% Under 18
% within q2.5 14.3% .0% 100.0% 16.7% Count 1 0 0 1
% within page (Binned) 100.0% .0% .0% 100.0%
School 4 page (Binned)
Under 20
% within q2.5 3.6% .0% .0% 3.3%

155
Count 28 1 1 30 % within page (Binned) 93.3% 3.3% 3.3% 100.0%
Total
% within q2.5 100.0% 100.0% 100.0% 100.0% Count 17 2 19
% within page (Binned) 89.5% 10.5% 100.0%
Under 16
% within q2.5 81.0% 100.0% 82.6% Count 4 0 4
% within page (Binned) 100.0% .0% 100.0%
page (Binned)
Under 18
% within q2.5 19.0% .0% 17.4% Count 21 2 23
% within page (Binned) 91.3% 8.7% 100.0%
School 5
Total
% within q2.5 100.0% 100.0% 100.0% Count 11 1 12
% within page (Binned) 91.7% 8.3% 100.0%
Under 16
% within q2.5 73.3% 100.0% 75.0% Count 4 0 4
% within page (Binned) 100.0% .0% 100.0%
page (Binned)
Under 18
% within q2.5 26.7% .0% 25.0% Count 15 1 16
% within page (Binned) 93.8% 6.3% 100.0%
School 6
Total
% within q2.5 100.0% 100.0% 100.0% .
Question 2.5 – Post-test
Crosstab
pq2.5 Total
school Yes No Uncertain Yes Count 5 1 1 7
% within page (Binned) 71.4% 14.3% 14.3% 100.0%
Under 16
% within pq2.5 27.8% 11.1% 33.3% 23.3% Count 4 2 1 7
% within page (Binned) 57.1% 28.6% 14.3% 100.0%
Under 18
% within pq2.5 22.2% 22.2% 33.3% 23.3% Count 7 5 0 12
% within page (Binned) 58.3% 41.7% .0% 100.0%
Under 20
% within pq2.5 38.9% 55.6% .0% 40.0% Count 2 1 1 4
% within page (Binned) 50.0% 25.0% 25.0% 100.0%
page (Binned)
Older than 20
% within pq2.5 11.1% 11.1% 33.3% 13.3% Count 18 9 3 30
% within page (Binned) 60.0% 30.0% 10.0% 100.0%
School 1
Total
% within pq2.5 100.0% 100.0% 100.0% 100.0% Count 24 4 1 29
% within page (Binned) 82.8% 13.8% 3.4% 100.0%
Under 16
% within pq2.5 96.0% 100.0% 100.0% 96.7% Count 1 0 0 1
% within page (Binned) 100.0% .0% .0% 100.0%
page (Binned)
Under 18
% within pq2.5 4.0% .0% .0% 3.3% Count 25 4 1 30
School 2
Total % within page (Binned) 83.3% 13.3% 3.3% 100.0%
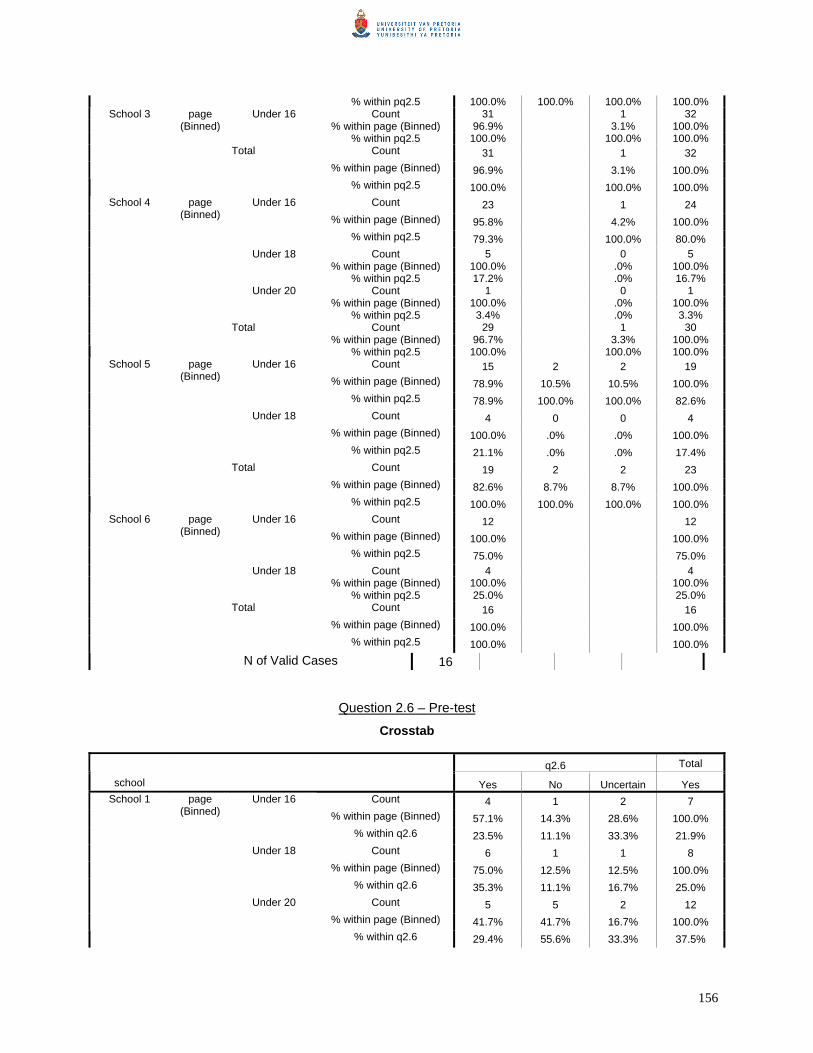
156
% within pq2.5 100.0% 100.0% 100.0% 100.0% Count 31 1 32
% within page (Binned) 96.9% 3.1% 100.0% page
(Binned) Under 16
% within pq2.5 100.0% 100.0% 100.0% Count 31 1 32
% within page (Binned) 96.9% 3.1% 100.0%
School 3
Total
% within pq2.5 100.0% 100.0% 100.0% Count 23 1 24
% within page (Binned) 95.8% 4.2% 100.0%
Under 16
% within pq2.5 79.3% 100.0% 80.0% Count 5 0 5
% within page (Binned) 100.0% .0% 100.0% Under 18
% within pq2.5 17.2% .0% 16.7% Count 1 0 1
% within page (Binned) 100.0% .0% 100.0%
page (Binned)
Under 20
% within pq2.5 3.4% .0% 3.3% Count 29 1 30
% within page (Binned) 96.7% 3.3% 100.0%
School 4
Total
% within pq2.5 100.0% 100.0% 100.0% Count 15 2 2 19
% within page (Binned) 78.9% 10.5% 10.5% 100.0%
Under 16
% within pq2.5 78.9% 100.0% 100.0% 82.6% Count 4 0 0 4
% within page (Binned) 100.0% .0% .0% 100.0%
page (Binned)
Under 18
% within pq2.5 21.1% .0% .0% 17.4% Count 19 2 2 23
% within page (Binned) 82.6% 8.7% 8.7% 100.0%
School 5
Total
% within pq2.5 100.0% 100.0% 100.0% 100.0% Count 12 12
% within page (Binned) 100.0% 100.0%
Under 16
% within pq2.5 75.0% 75.0% Count 4 4
% within page (Binned) 100.0% 100.0%
page (Binned)
Under 18
% within pq2.5 25.0% 25.0% Count 16 16
% within page (Binned) 100.0% 100.0%
Total
% within pq2.5 100.0% 100.0%
School 6
N of Valid Cases 16
Question 2.6 – Pre-test
Crosstab
q2.6 Total
school Yes No Uncertain Yes Count 4 1 2 7
% within page (Binned) 57.1% 14.3% 28.6% 100.0%
Under 16
% within q2.6 23.5% 11.1% 33.3% 21.9% Count 6 1 1 8
% within page (Binned) 75.0% 12.5% 12.5% 100.0%
Under 18
% within q2.6 35.3% 11.1% 16.7% 25.0% Count 5 5 2 12
% within page (Binned) 41.7% 41.7% 16.7% 100.0%
School 1 page (Binned)
Under 20
% within q2.6 29.4% 55.6% 33.3% 37.5%

157
Count 2 2 1 5 % within page (Binned) 40.0% 40.0% 20.0% 100.0%
Older than 20
% within q2.6 11.8% 22.2% 16.7% 15.6% Count 17 9 6 32
% within page (Binned) 53.1% 28.1% 18.8% 100.0%
Total
% within q2.6 100.0% 100.0% 100.0% 100.0% Count 29 29
% within page (Binned) 100.0% 100.0%
Under 16
% within q2.6 96.7% 96.7% Count 1 1
% within page (Binned) 100.0% 100.0%
page (Binned)
Under 18
% within q2.6 3.3% 3.3% Count 30 30
% within page (Binned) 100.0% 100.0%
School 2
Total
% within q2.6 100.0% 100.0% Count 32 32
% within page (Binned) 100.0% 100.0% page
(Binned) Under 16
% within q2.6 100.0% 100.0% Count 32 32
% within page (Binned) 100.0% 100.0%
School 3
Total
% within q2.6 100.0% 100.0% Count 24 0 24
% within page (Binned) 100.0% .0% 100.0%
Under 16
% within q2.6 85.7% .0% 80.0% Count 3 2 5
% within page (Binned) 60.0% 40.0% 100.0% Under 18
% within q2.6 10.7% 100.0% 16.7% Count 1 0 1
% within page (Binned) 100.0% .0% 100.0%
page (Binned)
Under 20
% within q2.6 3.6% .0% 3.3% Count 28 2 30
% within page (Binned) 93.3% 6.7% 100.0%
School 4
Total
% within q2.6 100.0% 100.0% 100.0% Count 19 19
% within page (Binned) 100.0% 100.0%
Under 16
% within q2.6 82.6% 82.6% Count 4 4
% within page (Binned) 100.0% 100.0%
page (Binned)
Under 18
% within q2.6 17.4% 17.4% Count 23 23
% within page (Binned) 100.0% 100.0%
School 5
Total
% within q2.6 100.0% 100.0% Count 12 12
% within page (Binned) 100.0% 100.0%
Under 16
% within q2.6 75.0% 75.0% Count 4 4
% within page (Binned) 100.0% 100.0%
page (Binned)
Under 18
% within q2.6 25.0% 25.0% Count 16 16
% within page (Binned) 100.0% 100.0%
School 6
Total
% within q2.6 100.0% 100.0% .
Question 2.6 – Post-test
Crosstab

158
pq2.6 Total
school Yes Uncertain Yes Count 5 1 6
% within page (Binned) 83.3% 16.7% 100.0%
Under 16
% within pq2.6 23.8% 16.7% 22.2% Count 6 2 8
% within page (Binned) 75.0% 25.0% 100.0%
Under 18
% within pq2.6 28.6% 33.3% 29.6% Count 7 2 9
% within page (Binned) 77.8% 22.2% 100.0%
Under 20
% within pq2.6 33.3% 33.3% 33.3% Count 3 1 4
% within page (Binned) 75.0% 25.0% 100.0%
page (Binned)
Older than 20
% within pq2.6 14.3% 16.7% 14.8% Count 21 6 27
% within page (Binned) 77.8% 22.2% 100.0%
School 1
Total
% within pq2.6 100.0% 100.0% 100.0% Count 28 1 29
% within page (Binned) 96.6% 3.4% 100.0%
Under 16
% within pq2.6 96.6% 100.0% 96.7% Count 1 0 1
% within page (Binned) 100.0% .0% 100.0%
page (Binned)
Under 18
% within pq2.6 3.4% .0% 3.3% Count 29 1 30
% within page (Binned) 96.7% 3.3% 100.0%
School 2
Total
% within pq2.6 100.0% 100.0% 100.0% Count 32 32
% within page (Binned) 100.0% 100.0% page
(Binned) Under 16
% within pq2.6 100.0% 100.0% Count 32 32
% within page (Binned) 100.0% 100.0%
School 3
Total
% within pq2.6 100.0% 100.0% Count 22 2 24
% within page (Binned) 91.7% 8.3% 100.0%
Under 16
% within pq2.6 78.6% 100.0% 80.0% Count 5 0 5
% within page (Binned) 100.0% .0% 100.0% Under 18
% within pq2.6 17.9% .0% 16.7% Count 1 0 1
% within page (Binned) 100.0% .0% 100.0%
page (Binned)
Under 20
% within pq2.6 3.6% .0% 3.3% Count 28 2 30
% within page (Binned) 93.3% 6.7% 100.0%
School 4
Total
% within pq2.6 100.0% 100.0% 100.0% Count 19 19
% within page (Binned) 100.0% 100.0%
Under 16
% within pq2.6 82.6% 82.6% Count 4 4
% within page (Binned) 100.0% 100.0%
page (Binned)
Under 18
% within pq2.6 17.4% 17.4% Count 23 23
% within page (Binned) 100.0% 100.0%
School 5
Total
% within pq2.6 100.0% 100.0%

159
Count 12 0 12 % within page (Binned) 100.0% .0% 100.0%
Under 16
% within pq2.6 80.0% .0% 75.0% Count 3 1 4
% within page (Binned) 75.0% 25.0% 100.0%
page (Binned)
Under 18
% within pq2.6 20.0% 100.0% 25.0% Count 15 1 16
% within page (Binned) 93.8% 6.3% 100.0%
School 6
Total
% within pq2.6 100.0% 100.0% 100.0%
Question 2.7 – Pre-test
Crosstab
q2.7 Total
school Yes No Yes Count 6 1 7
% within page (Binned) 85.7% 14.3% 100.0%
Under 16
% within q2.7 18.8% 100.0% 21.2% Count 8 0 8
% within page (Binned) 100.0% .0% 100.0%
Under 18
% within q2.7 25.0% .0% 24.2% Count 13 0 13
% within page (Binned) 100.0% .0% 100.0%
Under 20
% within q2.7 40.6% .0% 39.4% Count 5 0 5
% within page (Binned) 100.0% .0% 100.0%
page (Binned)
Older than 20
% within q2.7 15.6% .0% 15.2% Count 32 1 33
% within page (Binned) 97.0% 3.0% 100.0%
School 1
Total
% within q2.7 100.0% 100.0% 100.0% Count 29 29
% within page (Binned) 100.0% 100.0%
Under 16
% within q2.7 96.7% 96.7% Count 1 1
% within page (Binned) 100.0% 100.0%
page (Binned)
Under 18
% within q2.7 3.3% 3.3% Count 30 30
% within page (Binned) 100.0% 100.0%
School 2
Total
% within q2.7 100.0% 100.0% Count 32 32
% within page (Binned) 100.0% 100.0% page
(Binned) Under 16
% within q2.7 100.0% 100.0% Count 32 32
% within page (Binned) 100.0% 100.0%
School 3
Total
% within q2.7 100.0% 100.0% Count 24 24
% within page (Binned) 100.0% 100.0%
Under 16
% within q2.7 80.0% 80.0% Count 5 5
% within page (Binned) 100.0% 100.0%
School 4 page (Binned)
Under 18
% within q2.7 16.7% 16.7%
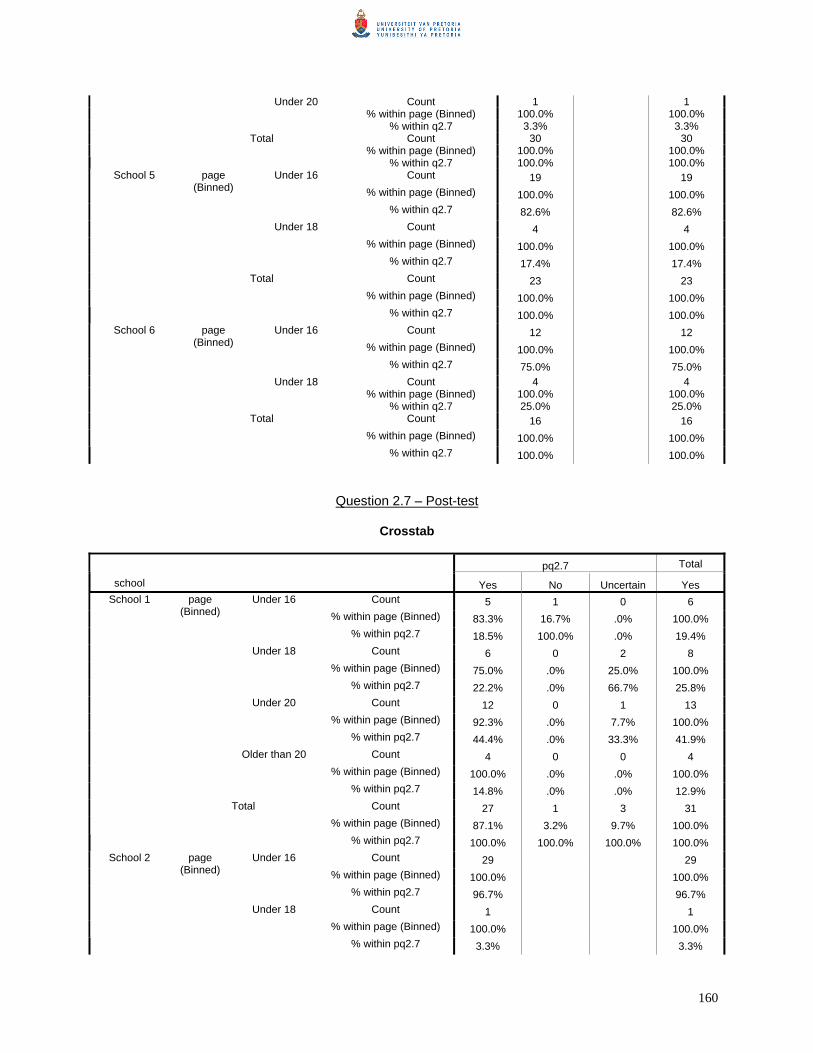
160
Count 1 1 % within page (Binned) 100.0% 100.0%
Under 20
% within q2.7 3.3% 3.3% Count 30 30
% within page (Binned) 100.0% 100.0% Total
% within q2.7 100.0% 100.0% Count 19 19
% within page (Binned) 100.0% 100.0%
Under 16
% within q2.7 82.6% 82.6% Count 4 4
% within page (Binned) 100.0% 100.0%
page (Binned)
Under 18
% within q2.7 17.4% 17.4% Count 23 23
% within page (Binned) 100.0% 100.0%
School 5
Total
% within q2.7 100.0% 100.0% Count 12 12
% within page (Binned) 100.0% 100.0%
Under 16
% within q2.7 75.0% 75.0% Count 4 4
% within page (Binned) 100.0% 100.0%
page (Binned)
Under 18
% within q2.7 25.0% 25.0% Count 16 16
% within page (Binned) 100.0% 100.0%
School 6
Total
% within q2.7 100.0% 100.0%
Question 2.7 – Post-test
Crosstab
pq2.7 Total
school Yes No Uncertain Yes Count 5 1 0 6
% within page (Binned) 83.3% 16.7% .0% 100.0%
Under 16
% within pq2.7 18.5% 100.0% .0% 19.4% Count 6 0 2 8
% within page (Binned) 75.0% .0% 25.0% 100.0%
Under 18
% within pq2.7 22.2% .0% 66.7% 25.8% Count 12 0 1 13
% within page (Binned) 92.3% .0% 7.7% 100.0%
Under 20
% within pq2.7 44.4% .0% 33.3% 41.9% Count 4 0 0 4
% within page (Binned) 100.0% .0% .0% 100.0%
page (Binned)
Older than 20
% within pq2.7 14.8% .0% .0% 12.9% Count 27 1 3 31
% within page (Binned) 87.1% 3.2% 9.7% 100.0%
School 1
Total
% within pq2.7 100.0% 100.0% 100.0% 100.0% Count 29 29
% within page (Binned) 100.0% 100.0%
Under 16
% within pq2.7 96.7% 96.7% Count 1 1
% within page (Binned) 100.0% 100.0%
School 2 page (Binned)
Under 18
% within pq2.7 3.3% 3.3%

161
Count 30 30 % within page (Binned) 100.0% 100.0%
Total
% within pq2.7 100.0% 100.0% Count 32 32
% within page (Binned) 100.0% 100.0% page
(Binned) Under 16
% within pq2.7 100.0% 100.0% Count 32 32
% within page (Binned) 100.0% 100.0%
School 3
Total
% within pq2.7 100.0% 100.0% Count 24 24
% within page (Binned) 100.0% 100.0%
Under 16
% within pq2.7 80.0% 80.0% Count 5 5
% within page (Binned) 100.0% 100.0% Under 18
% within pq2.7 16.7% 16.7% Count 1 1
% within page (Binned) 100.0% 100.0%
page (Binned)
Under 20
% within pq2.7 3.3% 3.3% Count 30 30
% within page (Binned) 100.0% 100.0%
School 4
Total
% within pq2.7 100.0% 100.0% Count 19 19
% within page (Binned) 100.0% 100.0%
Under 16
% within pq2.7 82.6% 82.6% Count 4 4
% within page (Binned) 100.0% 100.0%
page (Binned)
Under 18
% within pq2.7 17.4% 17.4% Count 23 23
% within page (Binned) 100.0% 100.0%
School 5
Total
% within pq2.7 100.0% 100.0% Count 12 12
% within page (Binned) 100.0% 100.0%
Under 16
% within pq2.7 75.0% 75.0% Count 4 4
% within page (Binned) 100.0% 100.0%
page (Binned)
Under 18
% within pq2.7 25.0% 25.0% Count 16 16
% within page (Binned) 100.0% 100.0%
School 6
Total
% within pq2.7 100.0% 100.0% .
Question 2.8 – Pre-test
Crosstab
q2.8 Total
school Yes No Uncertain Yes Count 5 2 0 7
% within page (Binned) 71.4% 28.6% .0% 100.0%
Under 16
% within q2.8 18.5% 66.7% .0% 21.2% Count 6 1 1 8
% within page (Binned) 75.0% 12.5% 12.5% 100.0%
School 1 page (Binned)
Under 18
% within q2.8 22.2% 33.3% 33.3% 24.2%

162
Count 11 0 2 13 % within page (Binned) 84.6% .0% 15.4% 100.0%
Under 20
% within q2.8 40.7% .0% 66.7% 39.4% Count 5 0 0 5
% within page (Binned) 100.0% .0% .0% 100.0%
Older than 20
% within q2.8 18.5% .0% .0% 15.2% Count 27 3 3 33
% within page (Binned) 81.8% 9.1% 9.1% 100.0%
Total
% within q2.8 100.0% 100.0% 100.0% 100.0% Count 29 29
% within page (Binned) 100.0% 100.0%
Under 16
% within q2.8 96.7% 96.7% Count 1 1
% within page (Binned) 100.0% 100.0%
page (Binned)
Under 18
% within q2.8 3.3% 3.3% Count 30 30
% within page (Binned) 100.0% 100.0%
School 2
Total
% within q2.8 100.0% 100.0% Count 32 32
% within page (Binned) 100.0% 100.0% page
(Binned) Under 16
% within q2.8 100.0% 100.0% Count 32 32
% within page (Binned) 100.0% 100.0%
School 3
Total
% within q2.8 100.0% 100.0% Count 24 24
% within page (Binned) 100.0% 100.0%
Under 16
% within q2.8 82.8% 82.8% Count 4 4
% within page (Binned) 100.0% 100.0% Under 18
% within q2.8 13.8% 13.8% Count 1 1
% within page (Binned) 100.0% 100.0%
page (Binned)
Under 20
% within q2.8 3.4% 3.4% Count 29 29
% within page (Binned) 100.0% 100.0%
School 4
Total
% within q2.8 100.0% 100.0% Count 19 19
% within page (Binned) 100.0% 100.0%
Under 16
% within q2.8 82.6% 82.6% Count 4 4
% within page (Binned) 100.0% 100.0%
page (Binned)
Under 18
% within q2.8 17.4% 17.4% Count 23 23
% within page (Binned) 100.0% 100.0%
School 5
Total
% within q2.8 100.0% 100.0% Count 12 12
% within page (Binned) 100.0% 100.0%
Under 16
% within q2.8 75.0% 75.0% Count 4 4
% within page (Binned) 100.0% 100.0%
page (Binned)
Under 18
% within q2.8 25.0% 25.0% Count 16 16
% within page (Binned) 100.0% 100.0%
School 6
Total
% within q2.8 100.0% 100.0%
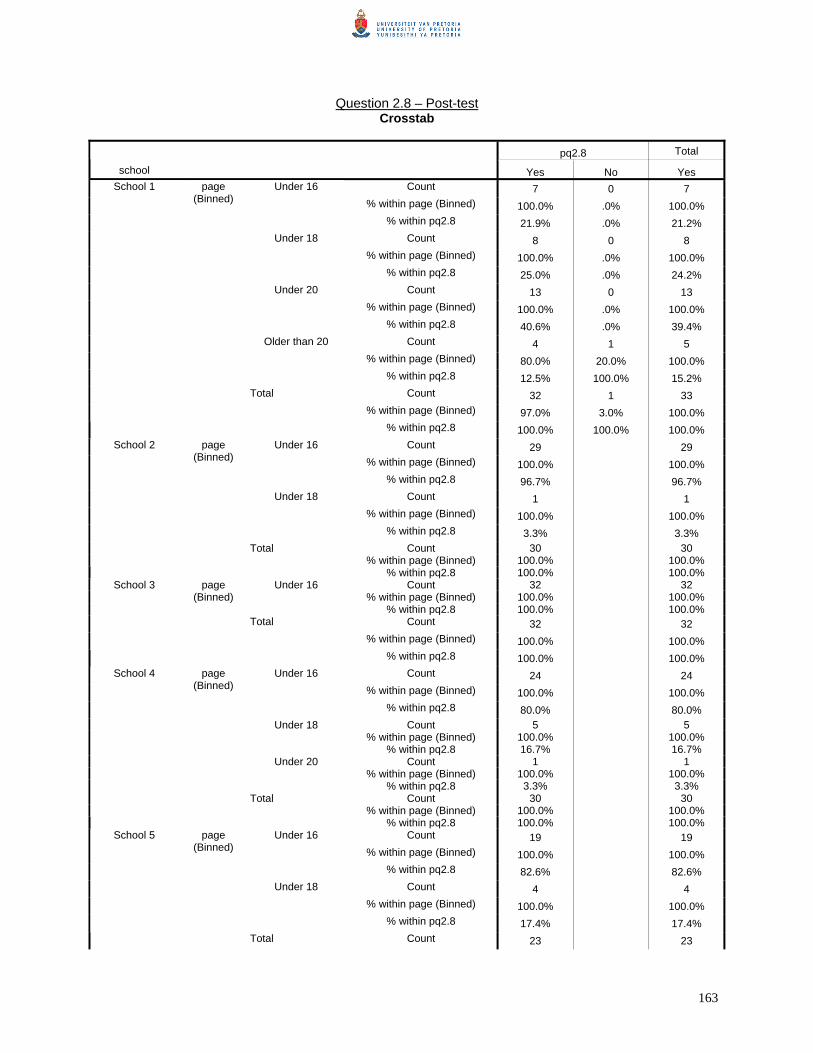
163
Question 2.8 – Post-test Crosstab
pq2.8 Total
school Yes No Yes Count 7 0 7
% within page (Binned) 100.0% .0% 100.0%
Under 16
% within pq2.8 21.9% .0% 21.2% Count 8 0 8
% within page (Binned) 100.0% .0% 100.0%
Under 18
% within pq2.8 25.0% .0% 24.2% Count 13 0 13
% within page (Binned) 100.0% .0% 100.0%
Under 20
% within pq2.8 40.6% .0% 39.4% Count 4 1 5
% within page (Binned) 80.0% 20.0% 100.0%
page (Binned)
Older than 20
% within pq2.8 12.5% 100.0% 15.2% Count 32 1 33
% within page (Binned) 97.0% 3.0% 100.0%
School 1
Total
% within pq2.8 100.0% 100.0% 100.0% Count 29 29
% within page (Binned) 100.0% 100.0%
Under 16
% within pq2.8 96.7% 96.7% Count 1 1
% within page (Binned) 100.0% 100.0%
page (Binned)
Under 18
% within pq2.8 3.3% 3.3% Count 30 30
% within page (Binned) 100.0% 100.0%
School 2
Total
% within pq2.8 100.0% 100.0% Count 32 32
% within page (Binned) 100.0% 100.0% page
(Binned) Under 16
% within pq2.8 100.0% 100.0% Count 32 32
% within page (Binned) 100.0% 100.0%
School 3
Total
% within pq2.8 100.0% 100.0% Count 24 24
% within page (Binned) 100.0% 100.0%
Under 16
% within pq2.8 80.0% 80.0% Count 5 5
% within page (Binned) 100.0% 100.0% Under 18
% within pq2.8 16.7% 16.7% Count 1 1
% within page (Binned) 100.0% 100.0%
page (Binned)
Under 20
% within pq2.8 3.3% 3.3% Count 30 30
% within page (Binned) 100.0% 100.0%
School 4
Total
% within pq2.8 100.0% 100.0% Count 19 19
% within page (Binned) 100.0% 100.0%
Under 16
% within pq2.8 82.6% 82.6% Count 4 4
% within page (Binned) 100.0% 100.0%
page (Binned)
Under 18
% within pq2.8 17.4% 17.4%
School 5
Total Count 23 23

164
% within page (Binned) 100.0% 100.0% % within pq2.8 100.0% 100.0%
Count 12 12 % within page (Binned) 100.0% 100.0%
Under 16
% within pq2.8 75.0% 75.0% Count 4 4
% within page (Binned) 100.0% 100.0%
page (Binned)
Under 18
% within pq2.8 25.0% 25.0% Count 16 16
% within page (Binned) 100.0% 100.0%
School 6
Total
% within pq2.8 100.0% 100.0% .
Question 2.9 – Pre-test
Crosstab
q2.9 Total
school Yes No Uncertain Yes Count 7 0 0 7
% within page (Binned) 100.0% .0% .0% 100.0%
Under 16
% within q2.9 25.0% .0% .0% 21.9% Count 6 1 1 8
% within page (Binned) 75.0% 12.5% 12.5% 100.0%
Under 18
% within q2.9 21.4% 33.3% 100.0% 25.0% Count 11 1 0 12
% within page (Binned) 91.7% 8.3% .0% 100.0%
Under 20
% within q2.9 39.3% 33.3% .0% 37.5% Count 4 1 0 5
% within page (Binned) 80.0% 20.0% .0% 100.0%
page (Binned)
Older than 20
% within q2.9 14.3% 33.3% .0% 15.6% Count 28 3 1 32
% within page (Binned) 87.5% 9.4% 3.1% 100.0%
School 1
Total
% within q2.9 100.0% 100.0% 100.0% 100.0% Count 29 29
% within page (Binned) 100.0% 100.0%
Under 16
% within q2.9 96.7% 96.7% Count 1 1
% within page (Binned) 100.0% 100.0%
page (Binned)
Under 18
% within q2.9 3.3% 3.3% Count 30 30
% within page (Binned) 100.0% 100.0%
School 2
Total
% within q2.9 100.0% 100.0% Count 30 30
% within page (Binned) 100.0% 100.0% page
(Binned) Under 16
% within q2.9 100.0% 100.0% Count 30 30
% within page (Binned) 100.0% 100.0%
School 3
Total
% within q2.9 100.0% 100.0% Count 24 24
% within page (Binned) 100.0% 100.0%
Under 16
% within q2.9 80.0% 80.0%
School 4 page (Binned)
Under 18 Count 5 5

165
% within page (Binned) 100.0% 100.0% % within q2.9 16.7% 16.7%
Count 1 1 % within page (Binned) 100.0% 100.0%
Under 20
% within q2.9 3.3% 3.3% Count 30 30
% within page (Binned) 100.0% 100.0% Total
% within q2.9 100.0% 100.0% Count 19 19
% within page (Binned) 100.0% 100.0%
Under 16
% within q2.9 82.6% 82.6% Count 4 4
% within page (Binned) 100.0% 100.0%
page (Binned)
Under 18
% within q2.9 17.4% 17.4% Count 23 23
% within page (Binned) 100.0% 100.0%
School 5
Total
% within q2.9 100.0% 100.0% Count 12 12
% within page (Binned) 100.0% 100.0%
Under 16
% within q2.9 75.0% 75.0% Count 4 4
% within page (Binned) 100.0% 100.0%
page (Binned)
Under 18
% within q2.9 25.0% 25.0% Count 16 16
% within page (Binned) 100.0% 100.0%
School 6
Total
% within q2.9 100.0% 100.0%
Question 2.9 – Post-test
Crosstab
pq2.9 Total
school Yes No Uncertain Yes Count 6 1 0 7
% within page (Binned) 85.7% 14.3% .0% 100.0%
Under 16
% within pq2.9 23.1% 50.0% .0% 23.3% Count 7 0 1 8
% within page (Binned) 87.5% .0% 12.5% 100.0%
Under 18
% within pq2.9 26.9% .0% 50.0% 26.7% Count 10 1 0 11
% within page (Binned) 90.9% 9.1% .0% 100.0%
Under 20
% within pq2.9 38.5% 50.0% .0% 36.7% Count 3 0 1 4
% within page (Binned) 75.0% .0% 25.0% 100.0%
page (Binned)
Older than 20
% within pq2.9 11.5% .0% 50.0% 13.3% Count 26 2 2 30
% within page (Binned) 86.7% 6.7% 6.7% 100.0%
School 1
Total
% within pq2.9 100.0% 100.0% 100.0% 100.0% Count 28 1 29
% within page (Binned) 96.6% 3.4% 100.0%
Under 16
% within pq2.9 96.6% 100.0% 96.7% Count 1 0 1
School 2 page (Binned)
Under 18 % within page (Binned) 100.0% .0% 100.0%
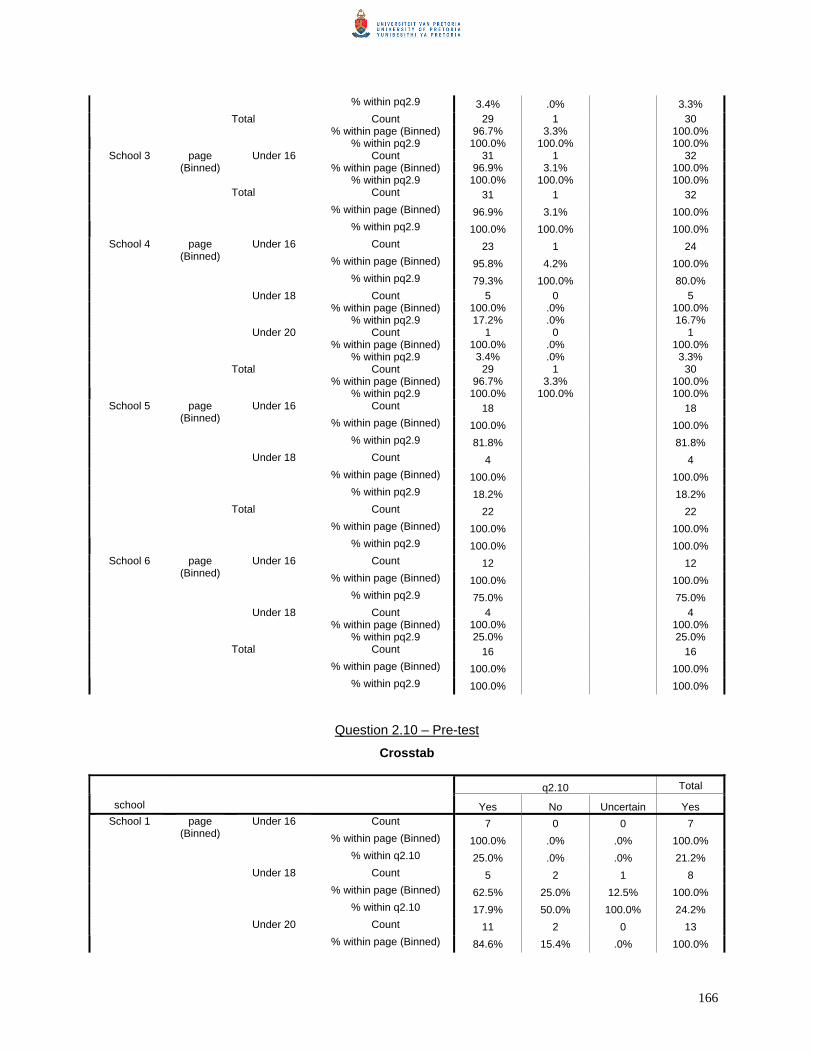
166
% within pq2.9 3.4% .0% 3.3% Count 29 1 30
% within page (Binned) 96.7% 3.3% 100.0% Total
% within pq2.9 100.0% 100.0% 100.0% Count 31 1 32
% within page (Binned) 96.9% 3.1% 100.0% page
(Binned) Under 16
% within pq2.9 100.0% 100.0% 100.0% Count 31 1 32
% within page (Binned) 96.9% 3.1% 100.0%
School 3
Total
% within pq2.9 100.0% 100.0% 100.0% Count 23 1 24
% within page (Binned) 95.8% 4.2% 100.0%
Under 16
% within pq2.9 79.3% 100.0% 80.0% Count 5 0 5
% within page (Binned) 100.0% .0% 100.0% Under 18
% within pq2.9 17.2% .0% 16.7% Count 1 0 1
% within page (Binned) 100.0% .0% 100.0%
page (Binned)
Under 20
% within pq2.9 3.4% .0% 3.3% Count 29 1 30
% within page (Binned) 96.7% 3.3% 100.0%
School 4
Total
% within pq2.9 100.0% 100.0% 100.0% Count 18 18
% within page (Binned) 100.0% 100.0%
Under 16
% within pq2.9 81.8% 81.8% Count 4 4
% within page (Binned) 100.0% 100.0%
page (Binned)
Under 18
% within pq2.9 18.2% 18.2% Count 22 22
% within page (Binned) 100.0% 100.0%
School 5
Total
% within pq2.9 100.0% 100.0% Count 12 12
% within page (Binned) 100.0% 100.0%
Under 16
% within pq2.9 75.0% 75.0% Count 4 4
% within page (Binned) 100.0% 100.0%
page (Binned)
Under 18
% within pq2.9 25.0% 25.0% Count 16 16
% within page (Binned) 100.0% 100.0%
School 6
Total
% within pq2.9 100.0% 100.0%
Question 2.10 – Pre-test
Crosstab
q2.10 Total
school Yes No Uncertain Yes Count 7 0 0 7
% within page (Binned) 100.0% .0% .0% 100.0%
Under 16
% within q2.10 25.0% .0% .0% 21.2% Count 5 2 1 8
% within page (Binned) 62.5% 25.0% 12.5% 100.0%
Under 18
% within q2.10 17.9% 50.0% 100.0% 24.2% Count 11 2 0 13
School 1 page (Binned)
Under 20 % within page (Binned) 84.6% 15.4% .0% 100.0%

167
% within q2.10 39.3% 50.0% .0% 39.4% Count 5 0 0 5
% within page (Binned) 100.0% .0% .0% 100.0%
Older than 20
% within q2.10 17.9% .0% .0% 15.2% Count 28 4 1 33
% within page (Binned) 84.8% 12.1% 3.0% 100.0%
Total
% within q2.10 100.0% 100.0% 100.0% 100.0% Count 27 1 28
% within page (Binned) 96.4% 3.6% 100.0%
Under 16
% within q2.10 96.4% 100.0% 96.6% Count 1 0 1
% within page (Binned) 100.0% .0% 100.0%
page (Binned)
Under 18
% within q2.10 3.6% .0% 3.4% Count 28 1 29
% within page (Binned) 96.6% 3.4% 100.0%
School 2
Total
% within q2.10 100.0% 100.0% 100.0% Count 31 31
% within page (Binned) 100.0% 100.0% page
(Binned) Under 16
% within q2.10 100.0% 100.0% Count 31 31
% within page (Binned) 100.0% 100.0%
School 3
Total
% within q2.10 100.0% 100.0% Count 24 24
% within page (Binned) 100.0% 100.0%
Under 16
% within q2.10 80.0% 80.0% Count 5 5
% within page (Binned) 100.0% 100.0% Under 18
% within q2.10 16.7% 16.7% Count 1 1
% within page (Binned) 100.0% 100.0%
page (Binned)
Under 20
% within q2.10 3.3% 3.3% Count 30 30
% within page (Binned) 100.0% 100.0%
School 4
Total
% within q2.10 100.0% 100.0% Count 18 1 19
% within page (Binned) 94.7% 5.3% 100.0%
Under 16
% within q2.10 81.8% 100.0% 82.6% Count 4 0 4
% within page (Binned) 100.0% .0% 100.0%
page (Binned)
Under 18
% within q2.10 18.2% .0% 17.4% Count 22 1 23
% within page (Binned) 95.7% 4.3% 100.0%
School 5
Total
% within q2.10 100.0% 100.0% 100.0% Count 12 12
% within page (Binned) 100.0% 100.0%
Under 16
% within q2.10 75.0% 75.0% Count 4 4
% within page (Binned) 100.0% 100.0%
page (Binned)
Under 18
% within q2.10 25.0% 25.0% Count 16 16
% within page (Binned) 100.0% 100.0%
School 6
Total
% within q2.10 100.0% 100.0%
Question 2.10 – Post-test

168
Crosstab
pq2.10 Total
school Yes No Uncertain Yes Count 5 2 7
% within page (Binned) 71.4% 28.6% 100.0%
Under 16
% within pq2.10 17.9% 66.7% 22.6% Count 7 0 7
% within page (Binned) 100.0% .0% 100.0%
Under 18
% within pq2.10 25.0% .0% 22.6% Count 12 0 12
% within page (Binned) 100.0% .0% 100.0%
Under 20
% within pq2.10 42.9% .0% 38.7% Count 4 1 5
% within page (Binned) 80.0% 20.0% 100.0%
page (Binned)
Older than 20
% within pq2.10 14.3% 33.3% 16.1% Count 28 3 31
% within page (Binned) 90.3% 9.7% 100.0%
School 1
Total
% within pq2.10 100.0% 100.0% 100.0% Count 28 1 29
% within page (Binned) 96.6% 3.4% 100.0%
Under 16
% within pq2.10 96.6% 100.0% 96.7% Count 1 0 1
% within page (Binned) 100.0% .0% 100.0%
page (Binned)
Under 18
% within pq2.10 3.4% .0% 3.3% Count 29 1 30
% within page (Binned) 96.7% 3.3% 100.0%
School 2
Total
% within pq2.10 100.0% 100.0% 100.0% Count 32 32
% within page (Binned) 100.0% 100.0% page
(Binned) Under 16
% within pq2.10 100.0% 100.0% Count 32 32
% within page (Binned) 100.0% 100.0%
School 3
Total
% within pq2.10 100.0% 100.0% Count 23 1 24
% within page (Binned) 95.8% 4.2% 100.0%
Under 16
% within pq2.10 79.3% 100.0% 80.0% Count 5 0 5
% within page (Binned) 100.0% .0% 100.0% Under 18
% within pq2.10 17.2% .0% 16.7% Count 1 0 1
% within page (Binned) 100.0% .0% 100.0%
page (Binned)
Under 20
% within pq2.10 3.4% .0% 3.3% Count 29 1 30
% within page (Binned) 96.7% 3.3% 100.0%
School 4
Total
% within pq2.10 100.0% 100.0% 100.0% Count 19 19
% within page (Binned) 100.0% 100.0%
Under 16
% within pq2.10 82.6% 82.6% Count 4 4
% within page (Binned) 100.0% 100.0%
page (Binned)
Under 18
% within pq2.10 17.4% 17.4%
School 5
Total Count 23 23
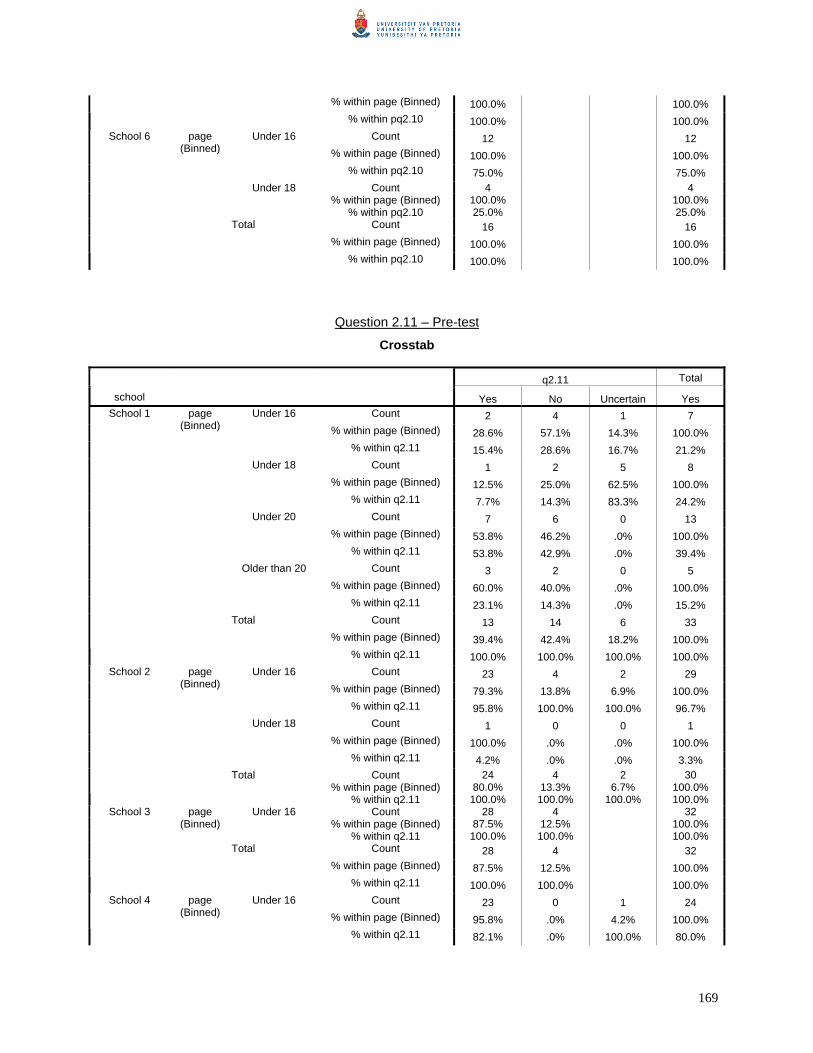
169
% within page (Binned) 100.0% 100.0% % within pq2.10 100.0% 100.0%
Count 12 12 % within page (Binned) 100.0% 100.0%
Under 16
% within pq2.10 75.0% 75.0% Count 4 4
% within page (Binned) 100.0% 100.0%
page (Binned)
Under 18
% within pq2.10 25.0% 25.0% Count 16 16
% within page (Binned) 100.0% 100.0%
School 6
Total
% within pq2.10 100.0% 100.0%
Question 2.11 – Pre-test
Crosstab
q2.11 Total
school Yes No Uncertain Yes Count 2 4 1 7
% within page (Binned) 28.6% 57.1% 14.3% 100.0%
Under 16
% within q2.11 15.4% 28.6% 16.7% 21.2% Count 1 2 5 8
% within page (Binned) 12.5% 25.0% 62.5% 100.0%
Under 18
% within q2.11 7.7% 14.3% 83.3% 24.2% Count 7 6 0 13
% within page (Binned) 53.8% 46.2% .0% 100.0%
Under 20
% within q2.11 53.8% 42.9% .0% 39.4% Count 3 2 0 5
% within page (Binned) 60.0% 40.0% .0% 100.0%
page (Binned)
Older than 20
% within q2.11 23.1% 14.3% .0% 15.2% Count 13 14 6 33
% within page (Binned) 39.4% 42.4% 18.2% 100.0%
School 1
Total
% within q2.11 100.0% 100.0% 100.0% 100.0% Count 23 4 2 29
% within page (Binned) 79.3% 13.8% 6.9% 100.0%
Under 16
% within q2.11 95.8% 100.0% 100.0% 96.7% Count 1 0 0 1
% within page (Binned) 100.0% .0% .0% 100.0%
page (Binned)
Under 18
% within q2.11 4.2% .0% .0% 3.3% Count 24 4 2 30
% within page (Binned) 80.0% 13.3% 6.7% 100.0%
School 2
Total
% within q2.11 100.0% 100.0% 100.0% 100.0% Count 28 4 32
% within page (Binned) 87.5% 12.5% 100.0% page
(Binned) Under 16
% within q2.11 100.0% 100.0% 100.0% Count 28 4 32
% within page (Binned) 87.5% 12.5% 100.0%
School 3
Total
% within q2.11 100.0% 100.0% 100.0% Count 23 0 1 24
% within page (Binned) 95.8% .0% 4.2% 100.0%
School 4 page (Binned)
Under 16
% within q2.11 82.1% .0% 100.0% 80.0%
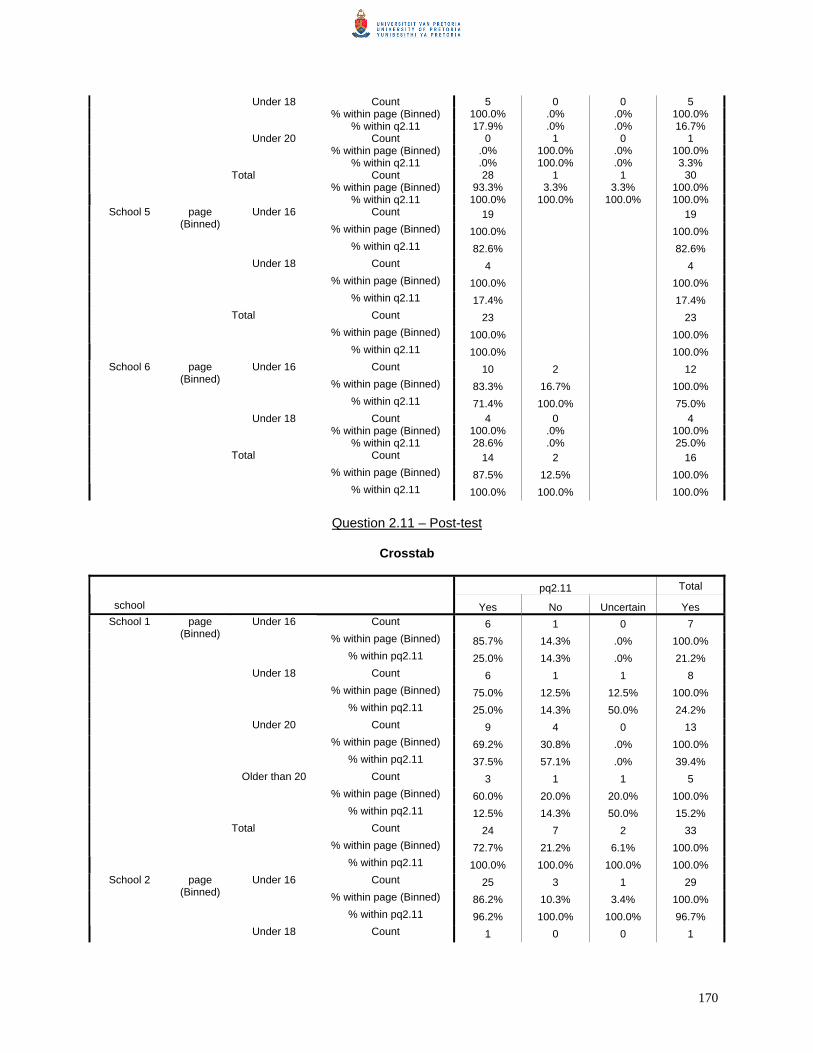
170
Count 5 0 0 5 % within page (Binned) 100.0% .0% .0% 100.0%
Under 18
% within q2.11 17.9% .0% .0% 16.7% Count 0 1 0 1
% within page (Binned) .0% 100.0% .0% 100.0% Under 20
% within q2.11 .0% 100.0% .0% 3.3% Count 28 1 1 30
% within page (Binned) 93.3% 3.3% 3.3% 100.0% Total
% within q2.11 100.0% 100.0% 100.0% 100.0% Count 19 19
% within page (Binned) 100.0% 100.0%
Under 16
% within q2.11 82.6% 82.6% Count 4 4
% within page (Binned) 100.0% 100.0%
page (Binned)
Under 18
% within q2.11 17.4% 17.4% Count 23 23
% within page (Binned) 100.0% 100.0%
School 5
Total
% within q2.11 100.0% 100.0% Count 10 2 12
% within page (Binned) 83.3% 16.7% 100.0%
Under 16
% within q2.11 71.4% 100.0% 75.0% Count 4 0 4
% within page (Binned) 100.0% .0% 100.0%
page (Binned)
Under 18
% within q2.11 28.6% .0% 25.0% Count 14 2 16
% within page (Binned) 87.5% 12.5% 100.0%
School 6
Total
% within q2.11 100.0% 100.0% 100.0%
Question 2.11 – Post-test
Crosstab
pq2.11 Total
school Yes No Uncertain Yes Count 6 1 0 7
% within page (Binned) 85.7% 14.3% .0% 100.0%
Under 16
% within pq2.11 25.0% 14.3% .0% 21.2% Count 6 1 1 8
% within page (Binned) 75.0% 12.5% 12.5% 100.0%
Under 18
% within pq2.11 25.0% 14.3% 50.0% 24.2% Count 9 4 0 13
% within page (Binned) 69.2% 30.8% .0% 100.0%
Under 20
% within pq2.11 37.5% 57.1% .0% 39.4% Count 3 1 1 5
% within page (Binned) 60.0% 20.0% 20.0% 100.0%
page (Binned)
Older than 20
% within pq2.11 12.5% 14.3% 50.0% 15.2% Count 24 7 2 33
% within page (Binned) 72.7% 21.2% 6.1% 100.0%
School 1
Total
% within pq2.11 100.0% 100.0% 100.0% 100.0% Count 25 3 1 29
% within page (Binned) 86.2% 10.3% 3.4% 100.0%
Under 16
% within pq2.11 96.2% 100.0% 100.0% 96.7%
School 2 page (Binned)
Under 18 Count 1 0 0 1
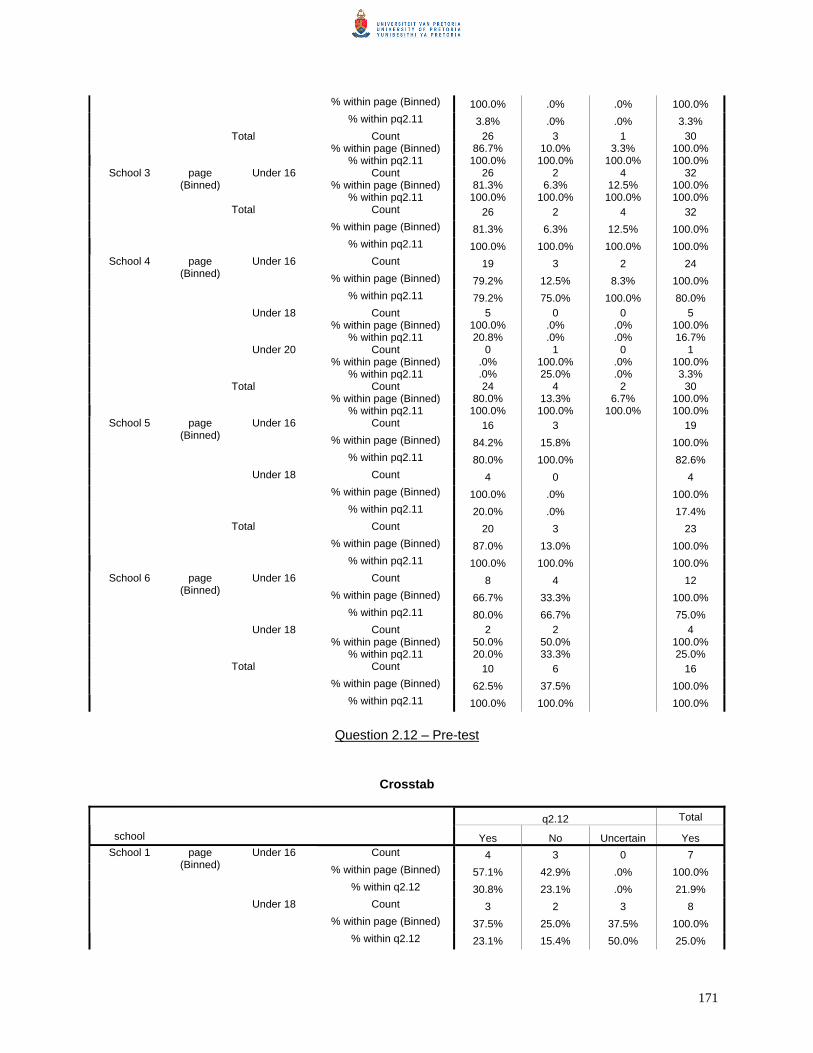
171
% within page (Binned) 100.0% .0% .0% 100.0% % within pq2.11 3.8% .0% .0% 3.3%
Count 26 3 1 30 % within page (Binned) 86.7% 10.0% 3.3% 100.0%
Total
% within pq2.11 100.0% 100.0% 100.0% 100.0% Count 26 2 4 32
% within page (Binned) 81.3% 6.3% 12.5% 100.0% page
(Binned) Under 16
% within pq2.11 100.0% 100.0% 100.0% 100.0% Count 26 2 4 32
% within page (Binned) 81.3% 6.3% 12.5% 100.0%
School 3
Total
% within pq2.11 100.0% 100.0% 100.0% 100.0% Count 19 3 2 24
% within page (Binned) 79.2% 12.5% 8.3% 100.0%
Under 16
% within pq2.11 79.2% 75.0% 100.0% 80.0% Count 5 0 0 5
% within page (Binned) 100.0% .0% .0% 100.0% Under 18
% within pq2.11 20.8% .0% .0% 16.7% Count 0 1 0 1
% within page (Binned) .0% 100.0% .0% 100.0%
page (Binned)
Under 20
% within pq2.11 .0% 25.0% .0% 3.3% Count 24 4 2 30
% within page (Binned) 80.0% 13.3% 6.7% 100.0%
School 4
Total
% within pq2.11 100.0% 100.0% 100.0% 100.0% Count 16 3 19
% within page (Binned) 84.2% 15.8% 100.0%
Under 16
% within pq2.11 80.0% 100.0% 82.6% Count 4 0 4
% within page (Binned) 100.0% .0% 100.0%
page (Binned)
Under 18
% within pq2.11 20.0% .0% 17.4% Count 20 3 23
% within page (Binned) 87.0% 13.0% 100.0%
School 5
Total
% within pq2.11 100.0% 100.0% 100.0% Count 8 4 12
% within page (Binned) 66.7% 33.3% 100.0%
Under 16
% within pq2.11 80.0% 66.7% 75.0% Count 2 2 4
% within page (Binned) 50.0% 50.0% 100.0%
page (Binned)
Under 18
% within pq2.11 20.0% 33.3% 25.0% Count 10 6 16
% within page (Binned) 62.5% 37.5% 100.0%
School 6
Total
% within pq2.11 100.0% 100.0% 100.0%
Question 2.12 – Pre-test
Crosstab
q2.12 Total
school Yes No Uncertain Yes Count 4 3 0 7
% within page (Binned) 57.1% 42.9% .0% 100.0%
Under 16
% within q2.12 30.8% 23.1% .0% 21.9% Count 3 2 3 8
% within page (Binned) 37.5% 25.0% 37.5% 100.0%
School 1 page (Binned)
Under 18
% within q2.12 23.1% 15.4% 50.0% 25.0%

172
Count 5 5 2 12 % within page (Binned) 41.7% 41.7% 16.7% 100.0%
Under 20
% within q2.12 38.5% 38.5% 33.3% 37.5% Count 1 3 1 5
% within page (Binned) 20.0% 60.0% 20.0% 100.0%
Older than 20
% within q2.12 7.7% 23.1% 16.7% 15.6% Count 13 13 6 32
% within page (Binned) 40.6% 40.6% 18.8% 100.0%
Total
% within q2.12 100.0% 100.0% 100.0% 100.0% Count 28 1 29
% within page (Binned) 96.6% 3.4% 100.0%
Under 16
% within q2.12 96.6% 100.0% 96.7% Count 1 0 1
% within page (Binned) 100.0% .0% 100.0%
page (Binned)
Under 18
% within q2.12 3.4% .0% 3.3% Count 29 1 30
% within page (Binned) 96.7% 3.3% 100.0%
School 2
Total
% within q2.12 100.0% 100.0% 100.0% Count 30 1 1 32
% within page (Binned) 93.8% 3.1% 3.1% 100.0% page
(Binned) Under 16
% within q2.12 100.0% 100.0% 100.0% 100.0% Count 30 1 1 32
% within page (Binned) 93.8% 3.1% 3.1% 100.0%
School 3
Total
% within q2.12 100.0% 100.0% 100.0% 100.0% Count 24 24
% within page (Binned) 100.0% 100.0%
Under 16
% within q2.12 80.0% 80.0% Count 5 5
% within page (Binned) 100.0% 100.0% Under 18
% within q2.12 16.7% 16.7% Count 1 1
% within page (Binned) 100.0% 100.0%
page (Binned)
Under 20
% within q2.12 3.3% 3.3% Count 30 30
% within page (Binned) 100.0% 100.0%
School 4
Total
% within q2.12 100.0% 100.0% Count 19 19
% within page (Binned) 100.0% 100.0%
Under 16
% within q2.12 82.6% 82.6% Count 4 4
% within page (Binned) 100.0% 100.0%
page (Binned)
Under 18
% within q2.12 17.4% 17.4% Count 23 23
% within page (Binned) 100.0% 100.0%
School 5
Total
% within q2.12 100.0% 100.0% Count 12 12
% within page (Binned) 100.0% 100.0%
Under 16
% within q2.12 75.0% 75.0% Count 4 4
% within page (Binned) 100.0% 100.0%
page (Binned)
Under 18
% within q2.12 25.0% 25.0% Count 16 16
% within page (Binned) 100.0% 100.0%
School 6
Total
% within q2.12 100.0% 100.0%

173
Question 2.12 – Post-test
Crosstab
pq2.12 Total
school Yes No Uncertain Yes Count 5 2 0 7
% within page (Binned) 71.4% 28.6% .0% 100.0%
Under 16
% within pq2.12 20.0% 40.0% .0% 22.6% Count 7 1 0 8
% within page (Binned) 87.5% 12.5% .0% 100.0%
Under 18
% within pq2.12 28.0% 20.0% .0% 25.8% Count 9 1 1 11
% within page (Binned) 81.8% 9.1% 9.1% 100.0%
Under 20
% within pq2.12 36.0% 20.0% 100.0% 35.5% Count 4 1 0 5
% within page (Binned) 80.0% 20.0% .0% 100.0%
page (Binned)
Older than 20
% within pq2.12 16.0% 20.0% .0% 16.1% Count 25 5 1 31
% within page (Binned) 80.6% 16.1% 3.2% 100.0%
School 1
Total
% within pq2.12 100.0% 100.0% 100.0% 100.0% Count 27 27
% within page (Binned) 100.0% 100.0%
Under 16
% within pq2.12 96.4% 96.4% Count 1 1
% within page (Binned) 100.0% 100.0%
page (Binned)
Under 18
% within pq2.12 3.6% 3.6% Count 28 28
% within page (Binned) 100.0% 100.0%
School 2
Total
% within pq2.12 100.0% 100.0% Count 32 32
% within page (Binned) 100.0% 100.0% page
(Binned) Under 16
% within pq2.12 100.0% 100.0% Count 32 32
% within page (Binned) 100.0% 100.0%
School 3
Total
% within pq2.12 100.0% 100.0% Count 23 1 24
% within page (Binned) 95.8% 4.2% 100.0%
Under 16
% within pq2.12 79.3% 100.0% 80.0% Count 5 0 5
% within page (Binned) 100.0% .0% 100.0% Under 18
% within pq2.12 17.2% .0% 16.7% Count 1 0 1
% within page (Binned) 100.0% .0% 100.0%
page (Binned)
Under 20
% within pq2.12 3.4% .0% 3.3% Count 29 1 30
% within page (Binned) 96.7% 3.3% 100.0%
School 4
Total
% within pq2.12 100.0% 100.0% 100.0% Count 19 19
% within page (Binned) 100.0% 100.0%
Under 16
% within pq2.12 82.6% 82.6% Count 4 4
School 5 page (Binned)
Under 18 % within page (Binned) 100.0% 100.0%
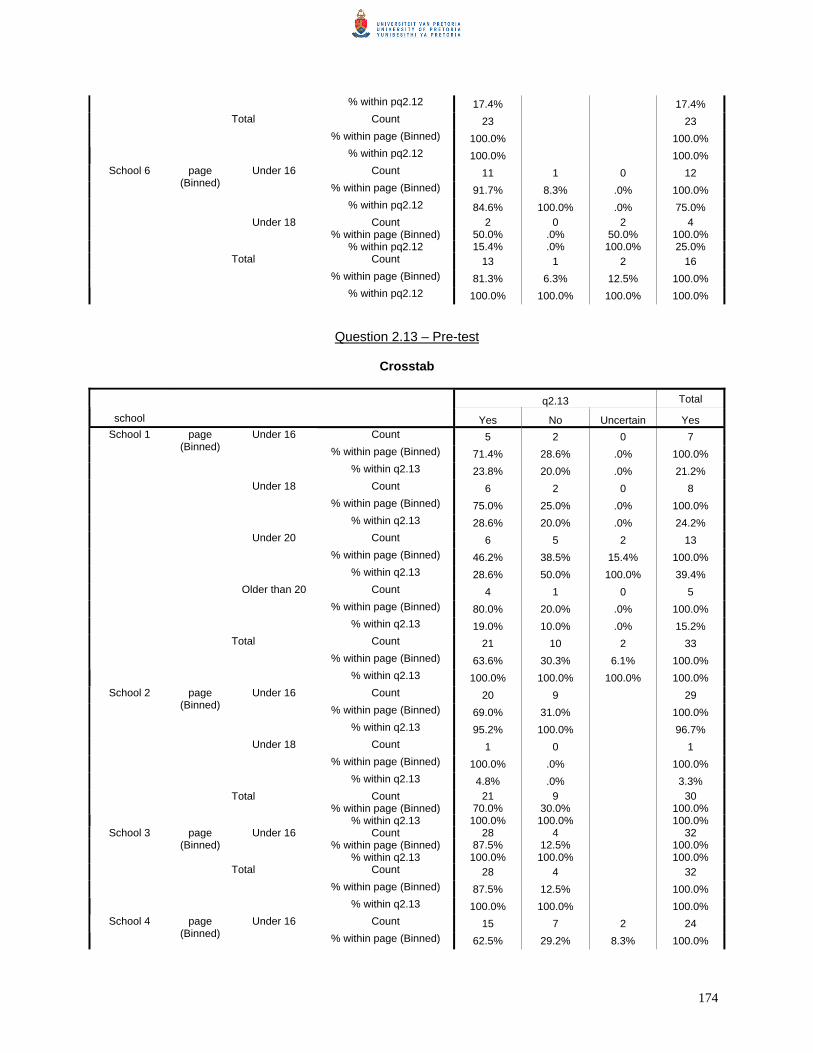
174
% within pq2.12 17.4% 17.4% Count 23 23
% within page (Binned) 100.0% 100.0%
Total
% within pq2.12 100.0% 100.0% Count 11 1 0 12
% within page (Binned) 91.7% 8.3% .0% 100.0%
Under 16
% within pq2.12 84.6% 100.0% .0% 75.0% Count 2 0 2 4
% within page (Binned) 50.0% .0% 50.0% 100.0%
page (Binned)
Under 18
% within pq2.12 15.4% .0% 100.0% 25.0% Count 13 1 2 16
% within page (Binned) 81.3% 6.3% 12.5% 100.0%
School 6
Total
% within pq2.12 100.0% 100.0% 100.0% 100.0%
Question 2.13 – Pre-test
Crosstab
q2.13 Total
school Yes No Uncertain Yes Count 5 2 0 7
% within page (Binned) 71.4% 28.6% .0% 100.0%
Under 16
% within q2.13 23.8% 20.0% .0% 21.2% Count 6 2 0 8
% within page (Binned) 75.0% 25.0% .0% 100.0%
Under 18
% within q2.13 28.6% 20.0% .0% 24.2% Count 6 5 2 13
% within page (Binned) 46.2% 38.5% 15.4% 100.0%
Under 20
% within q2.13 28.6% 50.0% 100.0% 39.4% Count 4 1 0 5
% within page (Binned) 80.0% 20.0% .0% 100.0%
page (Binned)
Older than 20
% within q2.13 19.0% 10.0% .0% 15.2% Count 21 10 2 33
% within page (Binned) 63.6% 30.3% 6.1% 100.0%
School 1
Total
% within q2.13 100.0% 100.0% 100.0% 100.0% Count 20 9 29
% within page (Binned) 69.0% 31.0% 100.0%
Under 16
% within q2.13 95.2% 100.0% 96.7% Count 1 0 1
% within page (Binned) 100.0% .0% 100.0%
page (Binned)
Under 18
% within q2.13 4.8% .0% 3.3% Count 21 9 30
% within page (Binned) 70.0% 30.0% 100.0%
School 2
Total
% within q2.13 100.0% 100.0% 100.0% Count 28 4 32
% within page (Binned) 87.5% 12.5% 100.0% page
(Binned) Under 16
% within q2.13 100.0% 100.0% 100.0% Count 28 4 32
% within page (Binned) 87.5% 12.5% 100.0%
School 3
Total
% within q2.13 100.0% 100.0% 100.0% Count 15 7 2 24 School 4 page
(Binned) Under 16
% within page (Binned) 62.5% 29.2% 8.3% 100.0%

175
% within q2.13 88.2% 63.6% 100.0% 80.0% Count 1 4 0 5
% within page (Binned) 20.0% 80.0% .0% 100.0% Under 18
% within q2.13 5.9% 36.4% .0% 16.7% Count 1 0 0 1
% within page (Binned) 100.0% .0% .0% 100.0% Under 20
% within q2.13 5.9% .0% .0% 3.3% Count 17 11 2 30
% within page (Binned) 56.7% 36.7% 6.7% 100.0% Total
% within q2.13 100.0% 100.0% 100.0% 100.0% Count 9 10 19
% within page (Binned) 47.4% 52.6% 100.0%
Under 16
% within q2.13 75.0% 90.9% 82.6% Count 3 1 4
% within page (Binned) 75.0% 25.0% 100.0%
page (Binned)
Under 18
% within q2.13 25.0% 9.1% 17.4% Count 12 11 23
% within page (Binned) 52.2% 47.8% 100.0%
School 5
Total
% within q2.13 100.0% 100.0% 100.0% Count 7 5 12
% within page (Binned) 58.3% 41.7% 100.0%
Under 16
% within q2.13 87.5% 62.5% 75.0% Count 1 3 4
% within page (Binned) 25.0% 75.0% 100.0%
page (Binned)
Under 18
% within q2.13 12.5% 37.5% 25.0% Count 8 8 16
% within page (Binned) 50.0% 50.0% 100.0%
School 6
Total
% within q2.13 100.0% 100.0% 100.0%
Question 2.13 – Post-test
Crosstab
pq2.13 Total
school Yes No Uncertain Yes Count 3 3 1 7
% within page (Binned) 42.9% 42.9% 14.3% 100.0%
Under 16
% within pq2.13 13.6% 33.3% 50.0% 21.2% Count 6 2 0 8
% within page (Binned) 75.0% 25.0% .0% 100.0%
Under 18
% within pq2.13 27.3% 22.2% .0% 24.2% Count 9 3 1 13
% within page (Binned) 69.2% 23.1% 7.7% 100.0%
Under 20
% within pq2.13 40.9% 33.3% 50.0% 39.4% Count 4 1 0 5
% within page (Binned) 80.0% 20.0% .0% 100.0%
page (Binned)
Older than 20
% within pq2.13 18.2% 11.1% .0% 15.2% Count 22 9 2 33
% within page (Binned) 66.7% 27.3% 6.1% 100.0%
School 1
Total
% within pq2.13 100.0% 100.0% 100.0% 100.0% Count 22 7 29 School 2 page
(Binned) Under 16
% within page (Binned) 75.9% 24.1% 100.0%

176
% within pq2.13 95.7% 100.0% 96.7% Count 1 0 1
% within page (Binned) 100.0% .0% 100.0%
Under 18
% within pq2.13 4.3% .0% 3.3% Count 23 7 30
% within page (Binned) 76.7% 23.3% 100.0% Total
% within pq2.13 100.0% 100.0% 100.0% Count 28 4 32
% within page (Binned) 87.5% 12.5% 100.0% page
(Binned) Under 16
% within pq2.13 100.0% 100.0% 100.0% Count 28 4 32
% within page (Binned) 87.5% 12.5% 100.0%
School 3
Total
% within pq2.13 100.0% 100.0% 100.0% Count 18 6 24
% within page (Binned) 75.0% 25.0% 100.0%
Under 16
% within pq2.13 81.8% 75.0% 80.0% Count 3 2 5
% within page (Binned) 60.0% 40.0% 100.0% Under 18
% within pq2.13 13.6% 25.0% 16.7% Count 1 0 1
% within page (Binned) 100.0% .0% 100.0%
page (Binned)
Under 20
% within pq2.13 4.5% .0% 3.3% Count 22 8 30
% within page (Binned) 73.3% 26.7% 100.0%
School 4
Total
% within pq2.13 100.0% 100.0% 100.0% Count 11 8 19
% within page (Binned) 57.9% 42.1% 100.0%
Under 16
% within pq2.13 73.3% 100.0% 82.6% Count 4 0 4
% within page (Binned) 100.0% .0% 100.0%
page (Binned)
Under 18
% within pq2.13 26.7% .0% 17.4% Count 15 8 23
% within page (Binned) 65.2% 34.8% 100.0%
School 5
Total
% within pq2.13 100.0% 100.0% 100.0% Count 9 3 12
% within page (Binned) 75.0% 25.0% 100.0%
Under 16
% within pq2.13 81.8% 60.0% 75.0% Count 2 2 4
% within page (Binned) 50.0% 50.0% 100.0%
page (Binned)
Under 18
% within pq2.13 18.2% 40.0% 25.0% Count 11 5 16
% within page (Binned) 68.8% 31.3% 100.0%
School 6
Total
% within pq2.13 100.0% 100.0% 100.0%
Question 2.14 – Pre-test
Crosstab
q2.14 Total
school Yes No Uncertain Yes Count 5 2 0 7
% within page (Binned) 71.4% 28.6% .0% 100.0%
Under 16
% within q2.14 27.8% 15.4% .0% 21.9%
School 1 page (Binned)
Under 18 Count 5 3 0 8

177
% within page (Binned) 62.5% 37.5% .0% 100.0% % within q2.14 27.8% 23.1% .0% 25.0%
Count 7 4 1 12 % within page (Binned) 58.3% 33.3% 8.3% 100.0%
Under 20
% within q2.14 38.9% 30.8% 100.0% 37.5% Count 1 4 0 5
% within page (Binned) 20.0% 80.0% .0% 100.0%
Older than 20
% within q2.14 5.6% 30.8% .0% 15.6% Count 18 13 1 32
% within page (Binned) 56.3% 40.6% 3.1% 100.0%
Total
% within q2.14 100.0% 100.0% 100.0% 100.0% Count 21 7 1 29
% within page (Binned) 72.4% 24.1% 3.4% 100.0%
Under 16
% within q2.14 95.5% 100.0% 100.0% 96.7% Count 1 0 0 1
% within page (Binned) 100.0% .0% .0% 100.0%
page (Binned)
Under 18
% within q2.14 4.5% .0% .0% 3.3% Count 22 7 1 30
% within page (Binned) 73.3% 23.3% 3.3% 100.0%
School 2
Total
% within q2.14 100.0% 100.0% 100.0% 100.0% Count 24 7 1 32
% within page (Binned) 75.0% 21.9% 3.1% 100.0% page
(Binned) Under 16
% within q2.14 100.0% 100.0% 100.0% 100.0% Count 24 7 1 32
% within page (Binned) 75.0% 21.9% 3.1% 100.0%
School 3
Total
% within q2.14 100.0% 100.0% 100.0% 100.0% Count 11 12 1 24
% within page (Binned) 45.8% 50.0% 4.2% 100.0%
Under 16
% within q2.14 91.7% 70.6% 100.0% 80.0% Count 1 4 0 5
% within page (Binned) 20.0% 80.0% .0% 100.0% Under 18
% within q2.14 8.3% 23.5% .0% 16.7% Count 0 1 0 1
% within page (Binned) .0% 100.0% .0% 100.0%
page (Binned)
Under 20
% within q2.14 .0% 5.9% .0% 3.3% Count 12 17 1 30
% within page (Binned) 40.0% 56.7% 3.3% 100.0%
School 4
Total
% within q2.14 100.0% 100.0% 100.0% 100.0% Count 9 10 19
% within page (Binned) 47.4% 52.6% 100.0%
Under 16
% within q2.14 81.8% 83.3% 82.6% Count 2 2 4
% within page (Binned) 50.0% 50.0% 100.0%
page (Binned)
Under 18
% within q2.14 18.2% 16.7% 17.4% Count 11 12 23
% within page (Binned) 47.8% 52.2% 100.0%
School 5
Total
% within q2.14 100.0% 100.0% 100.0% Count 4 7 1 12
% within page (Binned) 33.3% 58.3% 8.3% 100.0%
Under 16
% within q2.14 80.0% 70.0% 100.0% 75.0% Count 1 3 0 4
% within page (Binned) 25.0% 75.0% .0% 100.0%
page (Binned)
Under 18
% within q2.14 20.0% 30.0% .0% 25.0% Count 5 10 1 16
School 6
Total % within page (Binned) 31.3% 62.5% 6.3% 100.0%

178
% within q2.14 100.0% 100.0% 100.0% 100.0%
Question 2.14 – Post-test
Crosstab
pq2.14 Total
school Yes No Uncertain Yes Count 3 4 7
% within page (Binned) 42.9% 57.1% 100.0%
Under 16
% within pq2.14 20.0% 22.2% 21.2% Count 3 5 8
% within page (Binned) 37.5% 62.5% 100.0%
Under 18
% within pq2.14 20.0% 27.8% 24.2% Count 7 6 13
% within page (Binned) 53.8% 46.2% 100.0%
Under 20
% within pq2.14 46.7% 33.3% 39.4% Count 2 3 5
% within page (Binned) 40.0% 60.0% 100.0%
page (Binned)
Older than 20
% within pq2.14 13.3% 16.7% 15.2% Count 15 18 33
% within page (Binned) 45.5% 54.5% 100.0%
School 1
Total
% within pq2.14 100.0% 100.0% 100.0% Count 22 6 1 29
% within page (Binned) 75.9% 20.7% 3.4% 100.0%
Under 16
% within pq2.14 95.7% 100.0% 100.0% 96.7% Count 1 0 0 1
% within page (Binned) 100.0% .0% .0% 100.0%
page (Binned)
Under 18
% within pq2.14 4.3% .0% .0% 3.3% Count 23 6 1 30
% within page (Binned) 76.7% 20.0% 3.3% 100.0%
School 2
Total
% within pq2.14 100.0% 100.0% 100.0% 100.0% Count 25 6 1 32
% within page (Binned) 78.1% 18.8% 3.1% 100.0% page
(Binned) Under 16
% within pq2.14 100.0% 100.0% 100.0% 100.0% Count 25 6 1 32
% within page (Binned) 78.1% 18.8% 3.1% 100.0%
School 3
Total
% within pq2.14 100.0% 100.0% 100.0% 100.0% Count 14 8 2 24
% within page (Binned) 58.3% 33.3% 8.3% 100.0%
Under 16
% within pq2.14 82.4% 80.0% 66.7% 80.0% Count 2 2 1 5
% within page (Binned) 40.0% 40.0% 20.0% 100.0% Under 18
% within pq2.14 11.8% 20.0% 33.3% 16.7% Count 1 0 0 1
% within page (Binned) 100.0% .0% .0% 100.0%
page (Binned)
Under 20
% within pq2.14 5.9% .0% .0% 3.3% Count 17 10 3 30
% within page (Binned) 56.7% 33.3% 10.0% 100.0%
School 4
Total
% within pq2.14 100.0% 100.0% 100.0% 100.0% Count 10 8 1 19
% within page (Binned) 52.6% 42.1% 5.3% 100.0%
School 5 page (Binned)
Under 16
% within pq2.14 83.3% 80.0% 100.0% 82.6%

179
Count 2 2 0 4 % within page (Binned) 50.0% 50.0% .0% 100.0%
Under 18
% within pq2.14 16.7% 20.0% .0% 17.4% Count 12 10 1 23
% within page (Binned) 52.2% 43.5% 4.3% 100.0%
Total
% within pq2.14 100.0% 100.0% 100.0% 100.0% Count 6 6 12
% within page (Binned) 50.0% 50.0% 100.0%
Under 16
% within pq2.14 75.0% 75.0% 75.0% Count 2 2 4
% within page (Binned) 50.0% 50.0% 100.0%
page (Binned)
Under 18
% within pq2.14 25.0% 25.0% 25.0% Count 8 8 16
% within page (Binned) 50.0% 50.0% 100.0%
School 6
Total
% within pq2.14 100.0% 100.0% 100.0%
Question 2.15 – Pre-test
Crosstab
q2.15 Total
school Yes No Uncertain Yes Count 4 3 0 7
% within page (Binned) 57.1% 42.9% .0% 100.0%
Under 16
% within q2.15 22.2% 21.4% .0% 21.2% Count 5 2 1 8
% within page (Binned) 62.5% 25.0% 12.5% 100.0%
Under 18
% within q2.15 27.8% 14.3% 100.0% 24.2% Count 6 7 0 13
% within page (Binned) 46.2% 53.8% .0% 100.0%
Under 20
% within q2.15 33.3% 50.0% .0% 39.4% Count 3 2 0 5
% within page (Binned) 60.0% 40.0% .0% 100.0%
page (Binned)
Older than 20
% within q2.15 16.7% 14.3% .0% 15.2% Count 18 14 1 33
% within page (Binned) 54.5% 42.4% 3.0% 100.0%
School 1
Total
% within q2.15 100.0% 100.0% 100.0% 100.0% Count 26 3 29
% within page (Binned) 89.7% 10.3% 100.0%
Under 16
% within q2.15 96.3% 100.0% 96.7% Count 1 0 1
% within page (Binned) 100.0% .0% 100.0%
page (Binned)
Under 18
% within q2.15 3.7% .0% 3.3% Count 27 3 30
% within page (Binned) 90.0% 10.0% 100.0%
School 2
Total
% within q2.15 100.0% 100.0% 100.0% Count 29 3 32
% within page (Binned) 90.6% 9.4% 100.0% page
(Binned) Under 16
% within q2.15 100.0% 100.0% 100.0% Count 29 3 32
% within page (Binned) 90.6% 9.4% 100.0%
School 3
Total
% within q2.15 100.0% 100.0% 100.0%

180
Count 21 2 1 24 % within page (Binned) 87.5% 8.3% 4.2% 100.0%
Under 16
% within q2.15 91.3% 40.0% 50.0% 80.0% Count 1 3 1 5
% within page (Binned) 20.0% 60.0% 20.0% 100.0% Under 18
% within q2.15 4.3% 60.0% 50.0% 16.7% Count 1 0 0 1
% within page (Binned) 100.0% .0% .0% 100.0%
page (Binned)
Under 20
% within q2.15 4.3% .0% .0% 3.3% Count 23 5 2 30
% within page (Binned) 76.7% 16.7% 6.7% 100.0%
School 4
Total
% within q2.15 100.0% 100.0% 100.0% 100.0% Count 13 6 19
% within page (Binned) 68.4% 31.6% 100.0%
Under 16
% within q2.15 81.3% 85.7% 82.6% Count 3 1 4
% within page (Binned) 75.0% 25.0% 100.0%
page (Binned)
Under 18
% within q2.15 18.8% 14.3% 17.4% Count 16 7 23
% within page (Binned) 69.6% 30.4% 100.0%
School 5
Total
% within q2.15 100.0% 100.0% 100.0% Count 9 3 12
% within page (Binned) 75.0% 25.0% 100.0%
Under 16
% within q2.15 90.0% 50.0% 75.0% Count 1 3 4
% within page (Binned) 25.0% 75.0% 100.0%
page (Binned)
Under 18
% within q2.15 10.0% 50.0% 25.0% Count 10 6 16
% within page (Binned) 62.5% 37.5% 100.0%
School 6
Total
% within q2.15 100.0% 100.0% 100.0%
Question 2.15 – Post-test
Crosstab
pq2.15 Total
school Yes No Uncertain Yes Count 3 4 7
% within page (Binned) 42.9% 57.1% 100.0%
Under 16
% within pq2.15 16.7% 26.7% 21.2% Count 5 3 8
% within page (Binned) 62.5% 37.5% 100.0%
Under 18
% within pq2.15 27.8% 20.0% 24.2% Count 8 5 13
% within page (Binned) 61.5% 38.5% 100.0%
Under 20
% within pq2.15 44.4% 33.3% 39.4% Count 2 3 5
% within page (Binned) 40.0% 60.0% 100.0%
page (Binned)
Older than 20
% within pq2.15 11.1% 20.0% 15.2% Count 18 15 33
% within page (Binned) 54.5% 45.5% 100.0%
School 1
Total
% within pq2.15 100.0% 100.0% 100.0% School 2 page Under 16 Count 26 1 2 29
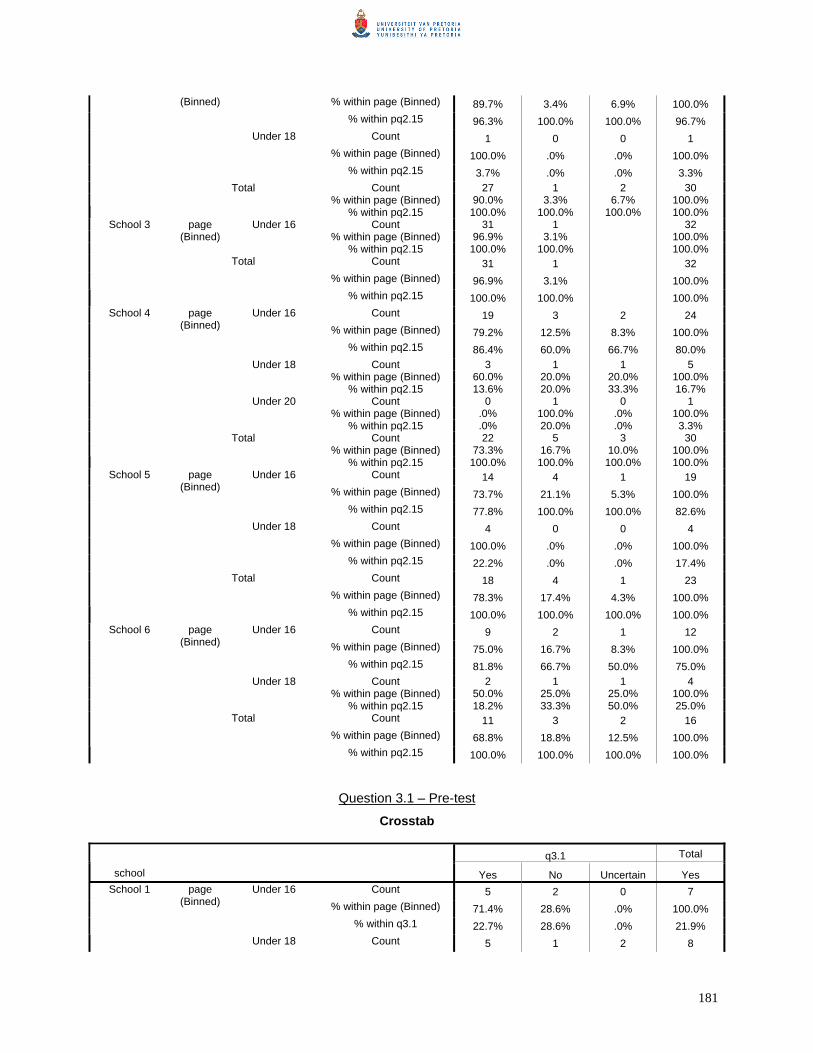
181
% within page (Binned) 89.7% 3.4% 6.9% 100.0% % within pq2.15 96.3% 100.0% 100.0% 96.7%
Count 1 0 0 1 % within page (Binned) 100.0% .0% .0% 100.0%
(Binned)
Under 18
% within pq2.15 3.7% .0% .0% 3.3% Count 27 1 2 30
% within page (Binned) 90.0% 3.3% 6.7% 100.0% Total
% within pq2.15 100.0% 100.0% 100.0% 100.0% Count 31 1 32
% within page (Binned) 96.9% 3.1% 100.0% page
(Binned) Under 16
% within pq2.15 100.0% 100.0% 100.0% Count 31 1 32
% within page (Binned) 96.9% 3.1% 100.0%
School 3
Total
% within pq2.15 100.0% 100.0% 100.0% Count 19 3 2 24
% within page (Binned) 79.2% 12.5% 8.3% 100.0%
Under 16
% within pq2.15 86.4% 60.0% 66.7% 80.0% Count 3 1 1 5
% within page (Binned) 60.0% 20.0% 20.0% 100.0% Under 18
% within pq2.15 13.6% 20.0% 33.3% 16.7% Count 0 1 0 1
% within page (Binned) .0% 100.0% .0% 100.0%
page (Binned)
Under 20
% within pq2.15 .0% 20.0% .0% 3.3% Count 22 5 3 30
% within page (Binned) 73.3% 16.7% 10.0% 100.0%
School 4
Total
% within pq2.15 100.0% 100.0% 100.0% 100.0% Count 14 4 1 19
% within page (Binned) 73.7% 21.1% 5.3% 100.0%
Under 16
% within pq2.15 77.8% 100.0% 100.0% 82.6% Count 4 0 0 4
% within page (Binned) 100.0% .0% .0% 100.0%
page (Binned)
Under 18
% within pq2.15 22.2% .0% .0% 17.4% Count 18 4 1 23
% within page (Binned) 78.3% 17.4% 4.3% 100.0%
School 5
Total
% within pq2.15 100.0% 100.0% 100.0% 100.0% Count 9 2 1 12
% within page (Binned) 75.0% 16.7% 8.3% 100.0%
Under 16
% within pq2.15 81.8% 66.7% 50.0% 75.0% Count 2 1 1 4
% within page (Binned) 50.0% 25.0% 25.0% 100.0%
page (Binned)
Under 18
% within pq2.15 18.2% 33.3% 50.0% 25.0% Count 11 3 2 16
% within page (Binned) 68.8% 18.8% 12.5% 100.0%
School 6
Total
% within pq2.15 100.0% 100.0% 100.0% 100.0%
Question 3.1 – Pre-test
Crosstab
q3.1 Total
school Yes No Uncertain Yes Count 5 2 0 7
% within page (Binned) 71.4% 28.6% .0% 100.0%
Under 16
% within q3.1 22.7% 28.6% .0% 21.9%
School 1 page (Binned)
Under 18 Count 5 1 2 8

182
% within page (Binned) 62.5% 12.5% 25.0% 100.0% % within q3.1 22.7% 14.3% 66.7% 25.0%
Count 8 3 1 12 % within page (Binned) 66.7% 25.0% 8.3% 100.0%
Under 20
% within q3.1 36.4% 42.9% 33.3% 37.5% Count 4 1 0 5
% within page (Binned) 80.0% 20.0% .0% 100.0%
Older than 20
% within q3.1 18.2% 14.3% .0% 15.6% Count 22 7 3 32
% within page (Binned) 68.8% 21.9% 9.4% 100.0%
Total
% within q3.1 100.0% 100.0% 100.0% 100.0% Count 23 3 3 29
% within page (Binned) 79.3% 10.3% 10.3% 100.0%
Under 16
% within q3.1 95.8% 100.0% 100.0% 96.7% Count 1 0 0 1
% within page (Binned) 100.0% .0% .0% 100.0%
page (Binned)
Under 18
% within q3.1 4.2% .0% .0% 3.3% Count 24 3 3 30
% within page (Binned) 80.0% 10.0% 10.0% 100.0%
School 2
Total
% within q3.1 100.0% 100.0% 100.0% 100.0% Count 27 2 3 32
% within page (Binned) 84.4% 6.3% 9.4% 100.0% page
(Binned) Under 16
% within q3.1 100.0% 100.0% 100.0% 100.0% Count 27 2 3 32
% within page (Binned) 84.4% 6.3% 9.4% 100.0%
School 3
Total
% within q3.1 100.0% 100.0% 100.0% 100.0% Count 19 2 3 24
% within page (Binned) 79.2% 8.3% 12.5% 100.0%
Under 16
% within q3.1 86.4% 50.0% 75.0% 80.0% Count 2 2 1 5
% within page (Binned) 40.0% 40.0% 20.0% 100.0% Under 18
% within q3.1 9.1% 50.0% 25.0% 16.7% Count 1 0 0 1
% within page (Binned) 100.0% .0% .0% 100.0%
page (Binned)
Under 20
% within q3.1 4.5% .0% .0% 3.3% Count 22 4 4 30
% within page (Binned) 73.3% 13.3% 13.3% 100.0%
School 4
Total
% within q3.1 100.0% 100.0% 100.0% 100.0% Count 12 6 1 19
% within page (Binned) 63.2% 31.6% 5.3% 100.0%
Under 16
% within q3.1 80.0% 85.7% 100.0% 82.6% Count 3 1 0 4
% within page (Binned) 75.0% 25.0% .0% 100.0%
page (Binned)
Under 18
% within q3.1 20.0% 14.3% .0% 17.4% Count 15 7 1 23
% within page (Binned) 65.2% 30.4% 4.3% 100.0%
School 5
Total
% within q3.1 100.0% 100.0% 100.0% 100.0% Count 9 1 2 12
% within page (Binned) 75.0% 8.3% 16.7% 100.0%
Under 16
% within q3.1 81.8% 50.0% 66.7% 75.0% Count 2 1 1 4
% within page (Binned) 50.0% 25.0% 25.0% 100.0%
page (Binned)
Under 18
% within q3.1 18.2% 50.0% 33.3% 25.0% Count 11 2 3 16
School 6
Total % within page (Binned) 68.8% 12.5% 18.8% 100.0%

183
% within q3.1 100.0% 100.0% 100.0% 100.0%
Question 3.1 – Post-test
Crosstab
pq3.1 Total
school Yes No Uncertain Yes Count 3 2 2 7
% within page (Binned) 42.9% 28.6% 28.6% 100.0%
Under 16
% within pq3.1 13.6% 28.6% 50.0% 21.2% Count 6 1 1 8
% within page (Binned) 75.0% 12.5% 12.5% 100.0%
Under 18
% within pq3.1 27.3% 14.3% 25.0% 24.2% Count 10 3 0 13
% within page (Binned) 76.9% 23.1% .0% 100.0%
Under 20
% within pq3.1 45.5% 42.9% .0% 39.4% Count 3 1 1 5
% within page (Binned) 60.0% 20.0% 20.0% 100.0%
page (Binned)
Older than 20
% within pq3.1 13.6% 14.3% 25.0% 15.2% Count 22 7 4 33
% within page (Binned) 66.7% 21.2% 12.1% 100.0%
School 1
Total
% within pq3.1 100.0% 100.0% 100.0% 100.0% Count 23 2 3 28
% within page (Binned) 82.1% 7.1% 10.7% 100.0%
Under 16
% within pq3.1 95.8% 100.0% 100.0% 96.6% Count 1 0 0 1
% within page (Binned) 100.0% .0% .0% 100.0%
page (Binned)
Under 18
% within pq3.1 4.2% .0% .0% 3.4% Count 24 2 3 29
% within page (Binned) 82.8% 6.9% 10.3% 100.0%
School 2
Total
% within pq3.1 100.0% 100.0% 100.0% 100.0% Count 28 1 3 32
% within page (Binned) 87.5% 3.1% 9.4% 100.0% page
(Binned) Under 16
% within pq3.1 100.0% 100.0% 100.0% 100.0% Count 28 1 3 32
% within page (Binned) 87.5% 3.1% 9.4% 100.0%
School 3
Total
% within pq3.1 100.0% 100.0% 100.0% 100.0% Count 17 2 5 24
% within page (Binned) 70.8% 8.3% 20.8% 100.0%
Under 16
% within pq3.1 81.0% 66.7% 83.3% 80.0% Count 4 0 1 5
% within page (Binned) 80.0% .0% 20.0% 100.0% Under 18
% within pq3.1 19.0% .0% 16.7% 16.7% Count 0 1 0 1
% within page (Binned) .0% 100.0% .0% 100.0%
page (Binned)
Under 20
% within pq3.1 .0% 33.3% .0% 3.3% Count 21 3 6 30
% within page (Binned) 70.0% 10.0% 20.0% 100.0%
School 4
Total
% within pq3.1 100.0% 100.0% 100.0% 100.0% Count 11 6 2 19
% within page (Binned) 57.9% 31.6% 10.5% 100.0%
Under 16
% within pq3.1 73.3% 100.0% 100.0% 82.6%
School 5 page (Binned)
Under 18 Count 4 0 0 4

184
% within page (Binned) 100.0% .0% .0% 100.0% % within pq3.1 26.7% .0% .0% 17.4%
Count 15 6 2 23 % within page (Binned) 65.2% 26.1% 8.7% 100.0%
Total
% within pq3.1 100.0% 100.0% 100.0% 100.0% Count 10 1 1 12
% within page (Binned) 83.3% 8.3% 8.3% 100.0%
Under 16
% within pq3.1 76.9% 100.0% 50.0% 75.0% Count 3 0 1 4
% within page (Binned) 75.0% .0% 25.0% 100.0%
page (Binned)
Under 18
% within pq3.1 23.1% .0% 50.0% 25.0% Count 13 1 2 16
% within page (Binned) 81.3% 6.3% 12.5% 100.0%
School 6
Total
% within pq3.1 100.0% 100.0% 100.0% 100.0%
Question 3.2 – Pre-test
Crosstab
q3.2 Total
school Yes No Uncertain Yes Count 2 3 2 7
% within page (Binned) 28.6% 42.9% 28.6% 100.0%
Under 16
% within q3.2 18.2% 20.0% 40.0% 22.6% Count 3 5 0 8
% within page (Binned) 37.5% 62.5% .0% 100.0%
Under 18
% within q3.2 27.3% 33.3% .0% 25.8% Count 5 4 2 11
% within page (Binned) 45.5% 36.4% 18.2% 100.0%
Under 20
% within q3.2 45.5% 26.7% 40.0% 35.5% Count 1 3 1 5
% within page (Binned) 20.0% 60.0% 20.0% 100.0%
page (Binned)
Older than 20
% within q3.2 9.1% 20.0% 20.0% 16.1% Count 11 15 5 31
% within page (Binned) 35.5% 48.4% 16.1% 100.0%
School 1
Total
% within q3.2 100.0% 100.0% 100.0% 100.0% Count 13 14 2 29
% within page (Binned) 44.8% 48.3% 6.9% 100.0%
Under 16
% within q3.2 100.0% 93.3% 100.0% 96.7% Count 0 1 0 1
% within page (Binned) .0% 100.0% .0% 100.0%
page (Binned)
Under 18
% within q3.2 .0% 6.7% .0% 3.3% Count 13 15 2 30
% within page (Binned) 43.3% 50.0% 6.7% 100.0%
School 2
Total
% within q3.2 100.0% 100.0% 100.0% 100.0% Count 21 10 1 32
% within page (Binned) 65.6% 31.3% 3.1% 100.0% page
(Binned) Under 16
% within q3.2 100.0% 100.0% 100.0% 100.0% Count 21 10 1 32
% within page (Binned) 65.6% 31.3% 3.1% 100.0%
School 3
Total
% within q3.2 100.0% 100.0% 100.0% 100.0% School 4 page Under 16 Count 10 13 1 24
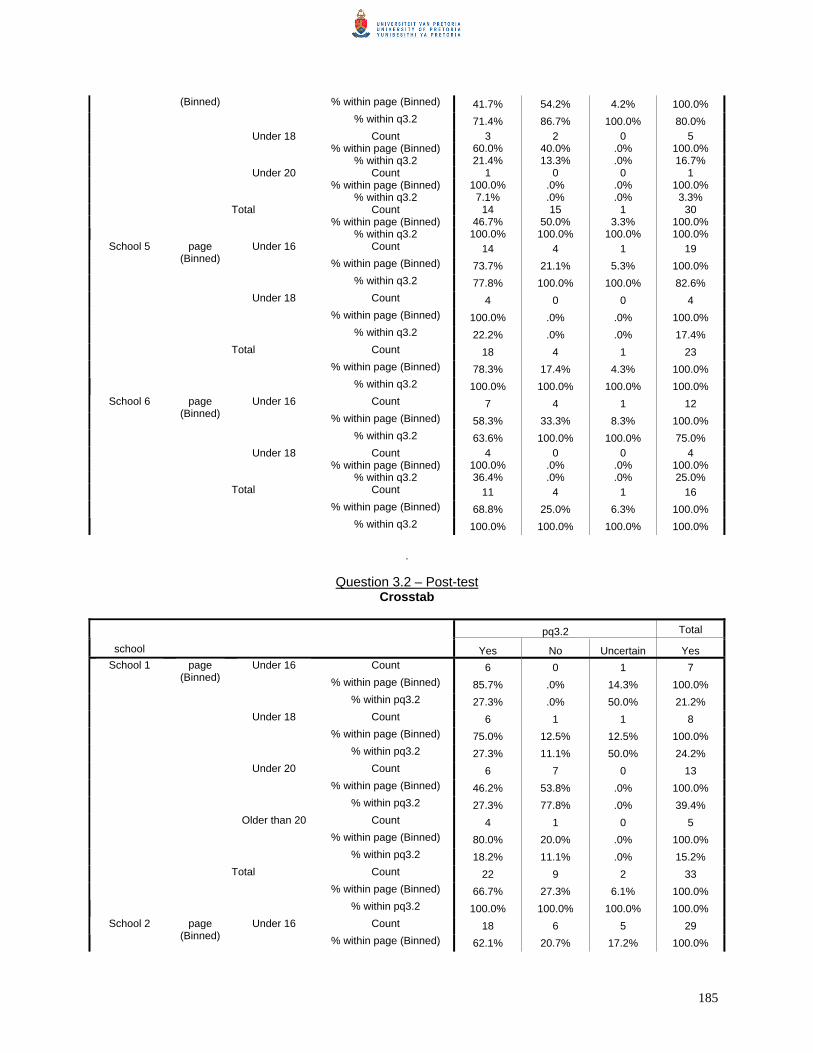
185
% within page (Binned) 41.7% 54.2% 4.2% 100.0% % within q3.2 71.4% 86.7% 100.0% 80.0%
Count 3 2 0 5 % within page (Binned) 60.0% 40.0% .0% 100.0%
Under 18
% within q3.2 21.4% 13.3% .0% 16.7% Count 1 0 0 1
% within page (Binned) 100.0% .0% .0% 100.0%
(Binned)
Under 20
% within q3.2 7.1% .0% .0% 3.3% Count 14 15 1 30
% within page (Binned) 46.7% 50.0% 3.3% 100.0% Total
% within q3.2 100.0% 100.0% 100.0% 100.0% Count 14 4 1 19
% within page (Binned) 73.7% 21.1% 5.3% 100.0%
Under 16
% within q3.2 77.8% 100.0% 100.0% 82.6% Count 4 0 0 4
% within page (Binned) 100.0% .0% .0% 100.0%
page (Binned)
Under 18
% within q3.2 22.2% .0% .0% 17.4% Count 18 4 1 23
% within page (Binned) 78.3% 17.4% 4.3% 100.0%
School 5
Total
% within q3.2 100.0% 100.0% 100.0% 100.0% Count 7 4 1 12
% within page (Binned) 58.3% 33.3% 8.3% 100.0%
Under 16
% within q3.2 63.6% 100.0% 100.0% 75.0% Count 4 0 0 4
% within page (Binned) 100.0% .0% .0% 100.0%
page (Binned)
Under 18
% within q3.2 36.4% .0% .0% 25.0% Count 11 4 1 16
% within page (Binned) 68.8% 25.0% 6.3% 100.0%
School 6
Total
% within q3.2 100.0% 100.0% 100.0% 100.0% .
Question 3.2 – Post-test Crosstab
pq3.2 Total
school Yes No Uncertain Yes Count 6 0 1 7
% within page (Binned) 85.7% .0% 14.3% 100.0%
Under 16
% within pq3.2 27.3% .0% 50.0% 21.2% Count 6 1 1 8
% within page (Binned) 75.0% 12.5% 12.5% 100.0%
Under 18
% within pq3.2 27.3% 11.1% 50.0% 24.2% Count 6 7 0 13
% within page (Binned) 46.2% 53.8% .0% 100.0%
Under 20
% within pq3.2 27.3% 77.8% .0% 39.4% Count 4 1 0 5
% within page (Binned) 80.0% 20.0% .0% 100.0%
page (Binned)
Older than 20
% within pq3.2 18.2% 11.1% .0% 15.2% Count 22 9 2 33
% within page (Binned) 66.7% 27.3% 6.1% 100.0%
School 1
Total
% within pq3.2 100.0% 100.0% 100.0% 100.0% Count 18 6 5 29 School 2 page
(Binned) Under 16
% within page (Binned) 62.1% 20.7% 17.2% 100.0%

186
% within pq3.2 100.0% 85.7% 100.0% 96.7% Count 0 1 0 1
% within page (Binned) .0% 100.0% .0% 100.0%
Under 18
% within pq3.2 .0% 14.3% .0% 3.3% Count 18 7 5 30
% within page (Binned) 60.0% 23.3% 16.7% 100.0% Total
% within pq3.2 100.0% 100.0% 100.0% 100.0% Count 16 14 2 32
% within page (Binned) 50.0% 43.8% 6.3% 100.0% page
(Binned) Under 16
% within pq3.2 100.0% 100.0% 100.0% 100.0% Count 16 14 2 32
% within page (Binned) 50.0% 43.8% 6.3% 100.0%
School 3
Total
% within pq3.2 100.0% 100.0% 100.0% 100.0% Count 13 9 2 24
% within page (Binned) 54.2% 37.5% 8.3% 100.0%
Under 16
% within pq3.2 86.7% 69.2% 100.0% 80.0% Count 2 3 0 5
% within page (Binned) 40.0% 60.0% .0% 100.0% Under 18
% within pq3.2 13.3% 23.1% .0% 16.7% Count 0 1 0 1
% within page (Binned) .0% 100.0% .0% 100.0%
page (Binned)
Under 20
% within pq3.2 .0% 7.7% .0% 3.3% Count 15 13 2 30
% within page (Binned) 50.0% 43.3% 6.7% 100.0%
School 4
Total
% within pq3.2 100.0% 100.0% 100.0% 100.0% Count 14 2 2 18
% within page (Binned) 77.8% 11.1% 11.1% 100.0%
Under 16
% within pq3.2 87.5% 50.0% 100.0% 81.8% Count 2 2 0 4
% within page (Binned) 50.0% 50.0% .0% 100.0%
page (Binned)
Under 18
% within pq3.2 12.5% 50.0% .0% 18.2% Count 16 4 2 22
% within page (Binned) 72.7% 18.2% 9.1% 100.0%
School 5
Total
% within pq3.2 100.0% 100.0% 100.0% 100.0% Count 8 2 2 12
% within page (Binned) 66.7% 16.7% 16.7% 100.0%
Under 16
% within pq3.2 88.9% 50.0% 66.7% 75.0% Count 1 2 1 4
% within page (Binned) 25.0% 50.0% 25.0% 100.0%
page (Binned)
Under 18
% within pq3.2 11.1% 50.0% 33.3% 25.0% Count 9 4 3 16
% within page (Binned) 56.3% 25.0% 18.8% 100.0%
School 6
Total
% within pq3.2 100.0% 100.0% 100.0% 100.0%
Question 3.3 – Pre-test
Crosstab
q3.3 Total
school Yes No Uncertain Yes Count 5 1 1 7
% within page (Binned) 71.4% 14.3% 14.3% 100.0%
Under 16
% within q3.3 35.7% 9.1% 14.3% 21.9% Count 5 1 2 8
School 1 page (Binned)
Under 18 % within page (Binned) 62.5% 12.5% 25.0% 100.0%

187
% within q3.3 35.7% 9.1% 28.6% 25.0% Count 3 7 2 12
% within page (Binned) 25.0% 58.3% 16.7% 100.0%
Under 20
% within q3.3 21.4% 63.6% 28.6% 37.5% Count 1 2 2 5
% within page (Binned) 20.0% 40.0% 40.0% 100.0%
Older than 20
% within q3.3 7.1% 18.2% 28.6% 15.6% Count 14 11 7 32
% within page (Binned) 43.8% 34.4% 21.9% 100.0%
Total
% within q3.3 100.0% 100.0% 100.0% 100.0% Count 24 2 3 29
% within page (Binned) 82.8% 6.9% 10.3% 100.0%
Under 16
% within q3.3 96.0% 100.0% 100.0% 96.7% Count 1 0 0 1
% within page (Binned) 100.0% .0% .0% 100.0%
page (Binned)
Under 18
% within q3.3 4.0% .0% .0% 3.3% Count 25 2 3 30
% within page (Binned) 83.3% 6.7% 10.0% 100.0%
School 2
Total
% within q3.3 100.0% 100.0% 100.0% 100.0% Count 27 1 4 32
% within page (Binned) 84.4% 3.1% 12.5% 100.0% page
(Binned) Under 16
% within q3.3 100.0% 100.0% 100.0% 100.0% Count 27 1 4 32
% within page (Binned) 84.4% 3.1% 12.5% 100.0%
School 3
Total
% within q3.3 100.0% 100.0% 100.0% 100.0% Count 21 1 2 24
% within page (Binned) 87.5% 4.2% 8.3% 100.0%
Under 16
% within q3.3 87.5% 25.0% 100.0% 80.0% Count 2 3 0 5
% within page (Binned) 40.0% 60.0% .0% 100.0% Under 18
% within q3.3 8.3% 75.0% .0% 16.7% Count 1 0 0 1
% within page (Binned) 100.0% .0% .0% 100.0%
page (Binned)
Under 20
% within q3.3 4.2% .0% .0% 3.3% Count 24 4 2 30
% within page (Binned) 80.0% 13.3% 6.7% 100.0%
School 4
Total
% within q3.3 100.0% 100.0% 100.0% 100.0% Count 19 19
% within page (Binned) 100.0% 100.0%
Under 16
% within q3.3 82.6% 82.6% Count 4 4
% within page (Binned) 100.0% 100.0%
page (Binned)
Under 18
% within q3.3 17.4% 17.4% Count 23 23
% within page (Binned) 100.0% 100.0%
School 5
Total
% within q3.3 100.0% 100.0% Count 7 3 2 12
% within page (Binned) 58.3% 25.0% 16.7% 100.0%
Under 16
% within q3.3 77.8% 75.0% 66.7% 75.0% Count 2 1 1 4
% within page (Binned) 50.0% 25.0% 25.0% 100.0%
page (Binned)
Under 18
% within q3.3 22.2% 25.0% 33.3% 25.0% Count 9 4 3 16
% within page (Binned) 56.3% 25.0% 18.8% 100.0%
School 6
Total
% within q3.3 100.0% 100.0% 100.0% 100.0%
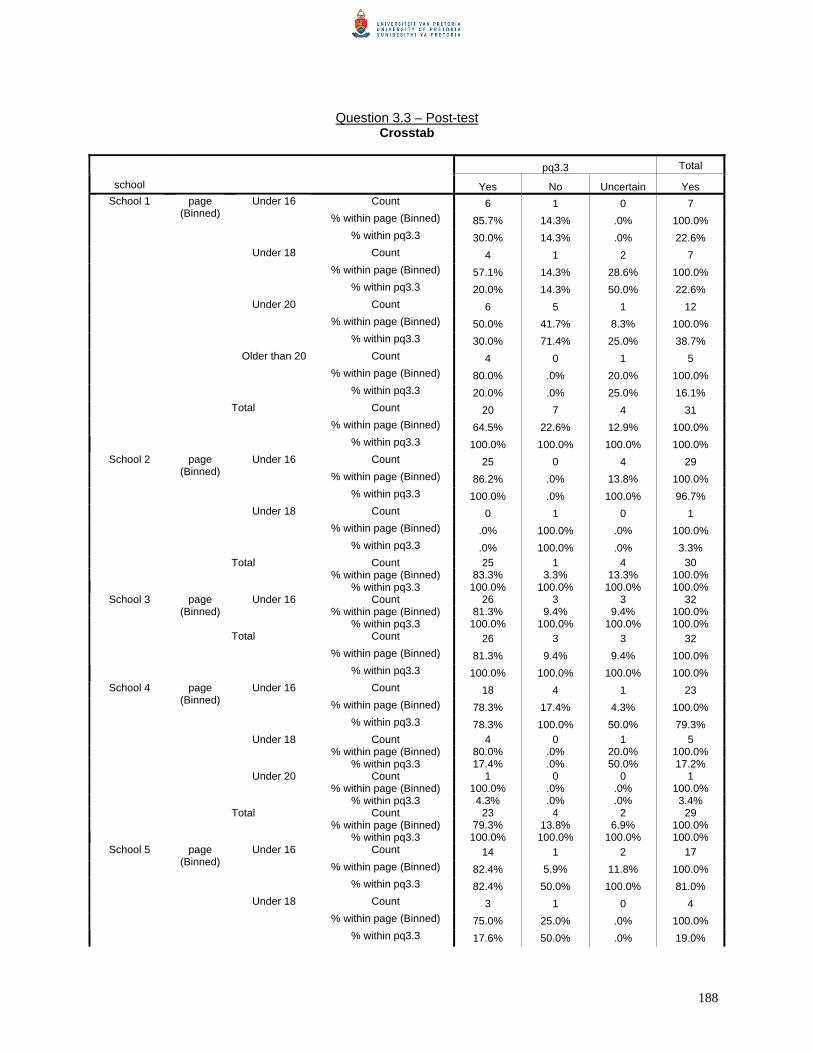
188
Question 3.3 – Post-test
Crosstab
pq3.3 Total
school Yes No Uncertain Yes Count 6 1 0 7
% within page (Binned) 85.7% 14.3% .0% 100.0%
Under 16
% within pq3.3 30.0% 14.3% .0% 22.6% Count 4 1 2 7
% within page (Binned) 57.1% 14.3% 28.6% 100.0%
Under 18
% within pq3.3 20.0% 14.3% 50.0% 22.6% Count 6 5 1 12
% within page (Binned) 50.0% 41.7% 8.3% 100.0%
Under 20
% within pq3.3 30.0% 71.4% 25.0% 38.7% Count 4 0 1 5
% within page (Binned) 80.0% .0% 20.0% 100.0%
page (Binned)
Older than 20
% within pq3.3 20.0% .0% 25.0% 16.1% Count 20 7 4 31
% within page (Binned) 64.5% 22.6% 12.9% 100.0%
School 1
Total
% within pq3.3 100.0% 100.0% 100.0% 100.0% Count 25 0 4 29
% within page (Binned) 86.2% .0% 13.8% 100.0%
Under 16
% within pq3.3 100.0% .0% 100.0% 96.7% Count 0 1 0 1
% within page (Binned) .0% 100.0% .0% 100.0%
page (Binned)
Under 18
% within pq3.3 .0% 100.0% .0% 3.3% Count 25 1 4 30
% within page (Binned) 83.3% 3.3% 13.3% 100.0%
School 2
Total
% within pq3.3 100.0% 100.0% 100.0% 100.0% Count 26 3 3 32
% within page (Binned) 81.3% 9.4% 9.4% 100.0% page
(Binned) Under 16
% within pq3.3 100.0% 100.0% 100.0% 100.0% Count 26 3 3 32
% within page (Binned) 81.3% 9.4% 9.4% 100.0%
School 3
Total
% within pq3.3 100.0% 100.0% 100.0% 100.0% Count 18 4 1 23
% within page (Binned) 78.3% 17.4% 4.3% 100.0%
Under 16
% within pq3.3 78.3% 100.0% 50.0% 79.3% Count 4 0 1 5
% within page (Binned) 80.0% .0% 20.0% 100.0% Under 18
% within pq3.3 17.4% .0% 50.0% 17.2% Count 1 0 0 1
% within page (Binned) 100.0% .0% .0% 100.0%
page (Binned)
Under 20
% within pq3.3 4.3% .0% .0% 3.4% Count 23 4 2 29
% within page (Binned) 79.3% 13.8% 6.9% 100.0%
School 4
Total
% within pq3.3 100.0% 100.0% 100.0% 100.0% Count 14 1 2 17
% within page (Binned) 82.4% 5.9% 11.8% 100.0%
Under 16
% within pq3.3 82.4% 50.0% 100.0% 81.0% Count 3 1 0 4
% within page (Binned) 75.0% 25.0% .0% 100.0%
School 5 page (Binned)
Under 18
% within pq3.3 17.6% 50.0% .0% 19.0%

189
Count 17 2 2 21 % within page (Binned) 81.0% 9.5% 9.5% 100.0%
Total
% within pq3.3 100.0% 100.0% 100.0% 100.0% Count 11 1 12
% within page (Binned) 91.7% 8.3% 100.0%
Under 16
% within pq3.3 91.7% 25.0% 75.0% Count 1 3 4
% within page (Binned) 25.0% 75.0% 100.0%
page (Binned)
Under 18
% within pq3.3 8.3% 75.0% 25.0% Count 12 4 16
% within page (Binned) 75.0% 25.0% 100.0%
School 6
Total
% within pq3.3 100.0% 100.0% 100.0%
Question 3.4 – Pre-test
Crosstab
q3.4 Total
school Yes No Uncertain Yes Count 4 3 7
% within page (Binned) 57.1% 42.9% 100.0%
Under 16
% within q3.4 22.2% 20.0% 21.2% Count 4 4 8
% within page (Binned) 50.0% 50.0% 100.0%
Under 18
% within q3.4 22.2% 26.7% 24.2% Count 8 5 13
% within page (Binned) 61.5% 38.5% 100.0%
Under 20
% within q3.4 44.4% 33.3% 39.4% Count 2 3 5
% within page (Binned) 40.0% 60.0% 100.0%
page (Binned)
Older than 20
% within q3.4 11.1% 20.0% 15.2% Count 18 15 33
% within page (Binned) 54.5% 45.5% 100.0%
School 1
Total
% within q3.4 100.0% 100.0% 100.0% Count 7 1 21 29
% within page (Binned) 24.1% 3.4% 72.4% 100.0%
Under 16
% within q3.4 87.5% 100.0% 100.0% 96.7% Count 1 0 0 1
% within page (Binned) 100.0% .0% .0% 100.0%
page (Binned)
Under 18
% within q3.4 12.5% .0% .0% 3.3% Count 8 1 21 30
% within page (Binned) 26.7% 3.3% 70.0% 100.0%
School 2
Total
% within q3.4 100.0% 100.0% 100.0% 100.0% Count 9 1 22 32
% within page (Binned) 28.1% 3.1% 68.8% 100.0% page
(Binned) Under 16
% within q3.4 100.0% 100.0% 100.0% 100.0% Count 9 1 22 32
% within page (Binned) 28.1% 3.1% 68.8% 100.0%
School 3
Total
% within q3.4 100.0% 100.0% 100.0% 100.0% Count 6 3 15 24
% within page (Binned) 25.0% 12.5% 62.5% 100.0%
Under 16
% within q3.4 66.7% 100.0% 83.3% 80.0%
School 4 page (Binned)
Under 18 Count 3 0 2 5

190
% within page (Binned) 60.0% .0% 40.0% 100.0% % within q3.4 33.3% .0% 11.1% 16.7%
Count 0 0 1 1 % within page (Binned) .0% .0% 100.0% 100.0%
Under 20
% within q3.4 .0% .0% 5.6% 3.3% Count 9 3 18 30
% within page (Binned) 30.0% 10.0% 60.0% 100.0% Total
% within q3.4 100.0% 100.0% 100.0% 100.0% Count 9 1 9 19
% within page (Binned) 47.4% 5.3% 47.4% 100.0%
Under 16
% within q3.4 81.8% 100.0% 81.8% 82.6% Count 2 0 2 4
% within page (Binned) 50.0% .0% 50.0% 100.0%
page (Binned)
Under 18
% within q3.4 18.2% .0% 18.2% 17.4% Count 11 1 11 23
% within page (Binned) 47.8% 4.3% 47.8% 100.0%
School 5
Total
% within q3.4 100.0% 100.0% 100.0% 100.0% Count 5 0 7 12
% within page (Binned) 41.7% .0% 58.3% 100.0%
Under 16
% within q3.4 71.4% .0% 87.5% 75.0% Count 2 1 1 4
% within page (Binned) 50.0% 25.0% 25.0% 100.0%
page (Binned)
Under 18
% within q3.4 28.6% 100.0% 12.5% 25.0% Count 7 1 8 16
% within page (Binned) 43.8% 6.3% 50.0% 100.0%
School 6
Total
% within q3.4 100.0% 100.0% 100.0% 100.0%
Question 3.4 – Post-test
Crosstab
pq3.4 Total
school Yes No Uncertain Yes Count 3 4 0 7
% within page (Binned) 42.9% 57.1% .0% 100.0%
Under 16
% within pq3.4 20.0% 23.5% .0% 21.2% Count 5 3 0 8
% within page (Binned) 62.5% 37.5% .0% 100.0%
Under 18
% within pq3.4 33.3% 17.6% .0% 24.2% Count 7 5 1 13
% within page (Binned) 53.8% 38.5% 7.7% 100.0%
Under 20
% within pq3.4 46.7% 29.4% 100.0% 39.4% Count 0 5 0 5
% within page (Binned) .0% 100.0% .0% 100.0%
page (Binned)
Older than 20
% within pq3.4 .0% 29.4% .0% 15.2% Count 15 17 1 33
% within page (Binned) 45.5% 51.5% 3.0% 100.0%
School 1
Total
% within pq3.4 100.0% 100.0% 100.0% 100.0% Count 8 18 3 29
% within page (Binned) 27.6% 62.1% 10.3% 100.0%
Under 16
% within pq3.4 100.0% 94.7% 100.0% 96.7%
School 2 page (Binned)
Under 18 Count 0 1 0 1

191
% within page (Binned) .0% 100.0% .0% 100.0% % within pq3.4 .0% 5.3% .0% 3.3%
Count 8 19 3 30 % within page (Binned) 26.7% 63.3% 10.0% 100.0%
Total
% within pq3.4 100.0% 100.0% 100.0% 100.0% Count 3 25 3 31
% within page (Binned) 9.7% 80.6% 9.7% 100.0% page
(Binned) Under 16
% within pq3.4 100.0% 100.0% 100.0% 100.0% Count 3 25 3 31
% within page (Binned) 9.7% 80.6% 9.7% 100.0%
School 3
Total
% within pq3.4 100.0% 100.0% 100.0% 100.0% Count 6 15 2 23
% within page (Binned) 26.1% 65.2% 8.7% 100.0%
Under 16
% within pq3.4 75.0% 83.3% 66.7% 79.3% Count 1 3 1 5
% within page (Binned) 20.0% 60.0% 20.0% 100.0% Under 18
% within pq3.4 12.5% 16.7% 33.3% 17.2% Count 1 0 0 1
% within page (Binned) 100.0% .0% .0% 100.0%
page (Binned)
Under 20
% within pq3.4 12.5% .0% .0% 3.4% Count 8 18 3 29
% within page (Binned) 27.6% 62.1% 10.3% 100.0%
School 4
Total
% within pq3.4 100.0% 100.0% 100.0% 100.0% Count 6 11 1 18
% within page (Binned) 33.3% 61.1% 5.6% 100.0%
Under 16
% within pq3.4 75.0% 84.6% 100.0% 81.8% Count 2 2 0 4
% within page (Binned) 50.0% 50.0% .0% 100.0%
page (Binned)
Under 18
% within pq3.4 25.0% 15.4% .0% 18.2% Count 8 13 1 22
% within page (Binned) 36.4% 59.1% 4.5% 100.0%
School 5
Total
% within pq3.4 100.0% 100.0% 100.0% 100.0% Count 4 6 1 11
% within page (Binned) 36.4% 54.5% 9.1% 100.0%
Under 16
% within pq3.4 66.7% 75.0% 100.0% 73.3% Count 2 2 0 4
% within page (Binned) 50.0% 50.0% .0% 100.0%
page (Binned)
Under 18
% within pq3.4 33.3% 25.0% .0% 26.7% Count 6 8 1 15
% within page (Binned) 40.0% 53.3% 6.7% 100.0%
School 6
Total
% within pq3.4 100.0% 100.0% 100.0% 100.0%
Question 4.1 – Pre-test
Crosstab
q4.1 Total
school Yes No Uncertain Yes Count 6 1 7
% within page (Binned) 85.7% 14.3% 100.0%
Under 16
% within q4.1 20.7% 25.0% 21.2% Count 8 0 8
% within page (Binned) 100.0% .0% 100.0%
School 1 page (Binned)
Under 18
% within q4.1 27.6% .0% 24.2%

192
Count 10 3 13 % within page (Binned) 76.9% 23.1% 100.0%
Under 20
% within q4.1 34.5% 75.0% 39.4% Count 5 0 5
% within page (Binned) 100.0% .0% 100.0%
Older than 20
% within q4.1 17.2% .0% 15.2% Count 29 4 33
% within page (Binned) 87.9% 12.1% 100.0%
Total
% within q4.1 100.0% 100.0% 100.0% Count 20 1 7 28
% within page (Binned) 71.4% 3.6% 25.0% 100.0%
Under 16
% within q4.1 95.2% 100.0% 100.0% 96.6% Count 1 0 0 1
% within page (Binned) 100.0% .0% .0% 100.0%
page (Binned)
Under 18
% within q4.1 4.8% .0% .0% 3.4% Count 21 1 7 29
% within page (Binned) 72.4% 3.4% 24.1% 100.0%
School 2
Total
% within q4.1 100.0% 100.0% 100.0% 100.0% Count 31 1 32
% within page (Binned) 96.9% 3.1% 100.0% page
(Binned) Under 16
% within q4.1 100.0% 100.0% 100.0% Count 31 1 32
% within page (Binned) 96.9% 3.1% 100.0%
School 3
Total
% within q4.1 100.0% 100.0% 100.0% Count 20 1 3 24
% within page (Binned) 83.3% 4.2% 12.5% 100.0%
Under 16
% within q4.1 87.0% 33.3% 75.0% 80.0% Count 2 2 1 5
% within page (Binned) 40.0% 40.0% 20.0% 100.0% Under 18
% within q4.1 8.7% 66.7% 25.0% 16.7% Count 1 0 0 1
% within page (Binned) 100.0% .0% .0% 100.0%
page (Binned)
Under 20
% within q4.1 4.3% .0% .0% 3.3% Count 23 3 4 30
% within page (Binned) 76.7% 10.0% 13.3% 100.0%
School 4
Total
% within q4.1 100.0% 100.0% 100.0% 100.0% Count 11 5 3 19
% within page (Binned) 57.9% 26.3% 15.8% 100.0%
Under 16
% within q4.1 73.3% 100.0% 100.0% 82.6% Count 4 0 0 4
% within page (Binned) 100.0% .0% .0% 100.0%
page (Binned)
Under 18
% within q4.1 26.7% .0% .0% 17.4% Count 15 5 3 23
% within page (Binned) 65.2% 21.7% 13.0% 100.0%
School 5
Total
% within q4.1 100.0% 100.0% 100.0% 100.0% Count 8 3 1 12
% within page (Binned) 66.7% 25.0% 8.3% 100.0%
Under 16
% within q4.1 88.9% 50.0% 100.0% 75.0% Count 1 3 0 4
% within page (Binned) 25.0% 75.0% .0% 100.0%
page (Binned)
Under 18
% within q4.1 11.1% 50.0% .0% 25.0% Count 9 6 1 16
% within page (Binned) 56.3% 37.5% 6.3% 100.0%
School 6
Total
% within q4.1 100.0% 100.0% 100.0% 100.0%

193
Question 4.1 – Post-test Crosstab
pq4.1 Total
school Yes No Uncertain Yes Count 4 2 1 7
% within page (Binned) 57.1% 28.6% 14.3% 100.0%
Under 16
% within pq4.1 14.8% 50.0% 100.0% 21.9% Count 7 0 0 7
% within page (Binned) 100.0% .0% .0% 100.0%
Under 18
% within pq4.1 25.9% .0% .0% 21.9% Count 11 2 0 13
% within page (Binned) 84.6% 15.4% .0% 100.0%
Under 20
% within pq4.1 40.7% 50.0% .0% 40.6% Count 5 0 0 5
% within page (Binned) 100.0% .0% .0% 100.0%
page (Binned)
Older than 20
% within pq4.1 18.5% .0% .0% 15.6% Count 27 4 1 32
% within page (Binned) 84.4% 12.5% 3.1% 100.0%
School 1
Total
% within pq4.1 100.0% 100.0% 100.0% 100.0% Count 17 7 5 29
% within page (Binned) 58.6% 24.1% 17.2% 100.0%
Under 16
% within pq4.1 94.4% 100.0% 100.0% 96.7% Count 1 0 0 1
% within page (Binned) 100.0% .0% .0% 100.0%
page (Binned)
Under 18
% within pq4.1 5.6% .0% .0% 3.3% Count 18 7 5 30
% within page (Binned) 60.0% 23.3% 16.7% 100.0%
School 2
Total
% within pq4.1 100.0% 100.0% 100.0% 100.0% Count 30 2 32
% within page (Binned) 93.8% 6.3% 100.0% page
(Binned) Under 16
% within pq4.1 100.0% 100.0% 100.0% Count 30 2 32
% within page (Binned) 93.8% 6.3% 100.0%
School 3
Total
% within pq4.1 100.0% 100.0% 100.0% Count 19 2 3 24
% within page (Binned) 79.2% 8.3% 12.5% 100.0%
Under 16
% within pq4.1 82.6% 66.7% 75.0% 80.0% Count 3 1 1 5
% within page (Binned) 60.0% 20.0% 20.0% 100.0% Under 18
% within pq4.1 13.0% 33.3% 25.0% 16.7% Count 1 0 0 1
% within page (Binned) 100.0% .0% .0% 100.0%
page (Binned)
Under 20
% within pq4.1 4.3% .0% .0% 3.3% Count 23 3 4 30
% within page (Binned) 76.7% 10.0% 13.3% 100.0%
School 4
Total
% within pq4.1 100.0% 100.0% 100.0% 100.0% Count 10 7 2 19
% within page (Binned) 52.6% 36.8% 10.5% 100.0%
Under 16
% within pq4.1 71.4% 100.0% 100.0% 82.6% Count 4 0 0 4
% within page (Binned) 100.0% .0% .0% 100.0%
page (Binned)
Under 18
% within pq4.1 28.6% .0% .0% 17.4%
School 5
Total Count 14 7 2 23

194
% within page (Binned) 60.9% 30.4% 8.7% 100.0% % within pq4.1 100.0% 100.0% 100.0% 100.0%
Count 10 1 1 12 % within page (Binned) 83.3% 8.3% 8.3% 100.0%
Under 16
% within pq4.1 76.9% 50.0% 100.0% 75.0% Count 3 1 0 4
% within page (Binned) 75.0% 25.0% .0% 100.0%
page (Binned)
Under 18
% within pq4.1 23.1% 50.0% .0% 25.0% Count 13 2 1 16
% within page (Binned) 81.3% 12.5% 6.3% 100.0%
School 6
Total
% within pq4.1 100.0% 100.0% 100.0% 100.0%
Question 4.2 – Pre-test
Crosstab
q4.2 Total
school Yes No Uncertain Yes Count 4 2 1 7
% within page (Binned) 57.1% 28.6% 14.3% 100.0%
Under 16
% within q4.2 20.0% 22.2% 25.0% 21.2% Count 5 2 1 8
% within page (Binned) 62.5% 25.0% 12.5% 100.0%
Under 18
% within q4.2 25.0% 22.2% 25.0% 24.2% Count 8 4 1 13
% within page (Binned) 61.5% 30.8% 7.7% 100.0%
Under 20
% within q4.2 40.0% 44.4% 25.0% 39.4% Count 3 1 1 5
% within page (Binned) 60.0% 20.0% 20.0% 100.0%
page (Binned)
Older than 20
% within q4.2 15.0% 11.1% 25.0% 15.2% Count 20 9 4 33
% within page (Binned) 60.6% 27.3% 12.1% 100.0%
School 1
Total
% within q4.2 100.0% 100.0% 100.0% 100.0% Count 15 7 7 29
% within page (Binned) 51.7% 24.1% 24.1% 100.0%
Under 16
% within q4.2 100.0% 100.0% 87.5% 96.7% Count 0 0 1 1
% within page (Binned) .0% .0% 100.0% 100.0%
page (Binned)
Under 18
% within q4.2 .0% .0% 12.5% 3.3% Count 15 7 8 30
% within page (Binned) 50.0% 23.3% 26.7% 100.0%
School 2
Total
% within q4.2 100.0% 100.0% 100.0% 100.0% Count 24 4 4 32
% within page (Binned) 75.0% 12.5% 12.5% 100.0% page
(Binned) Under 16
% within q4.2 100.0% 100.0% 100.0% 100.0% Count 24 4 4 32
% within page (Binned) 75.0% 12.5% 12.5% 100.0%
School 3
Total
% within q4.2 100.0% 100.0% 100.0% 100.0% Count 13 9 2 24
% within page (Binned) 54.2% 37.5% 8.3% 100.0%
Under 16
% within q4.2 86.7% 81.8% 50.0% 80.0% Count 1 2 2 5
% within page (Binned) 20.0% 40.0% 40.0% 100.0%
School 4 page (Binned)
Under 18
% within q4.2 6.7% 18.2% 50.0% 16.7%
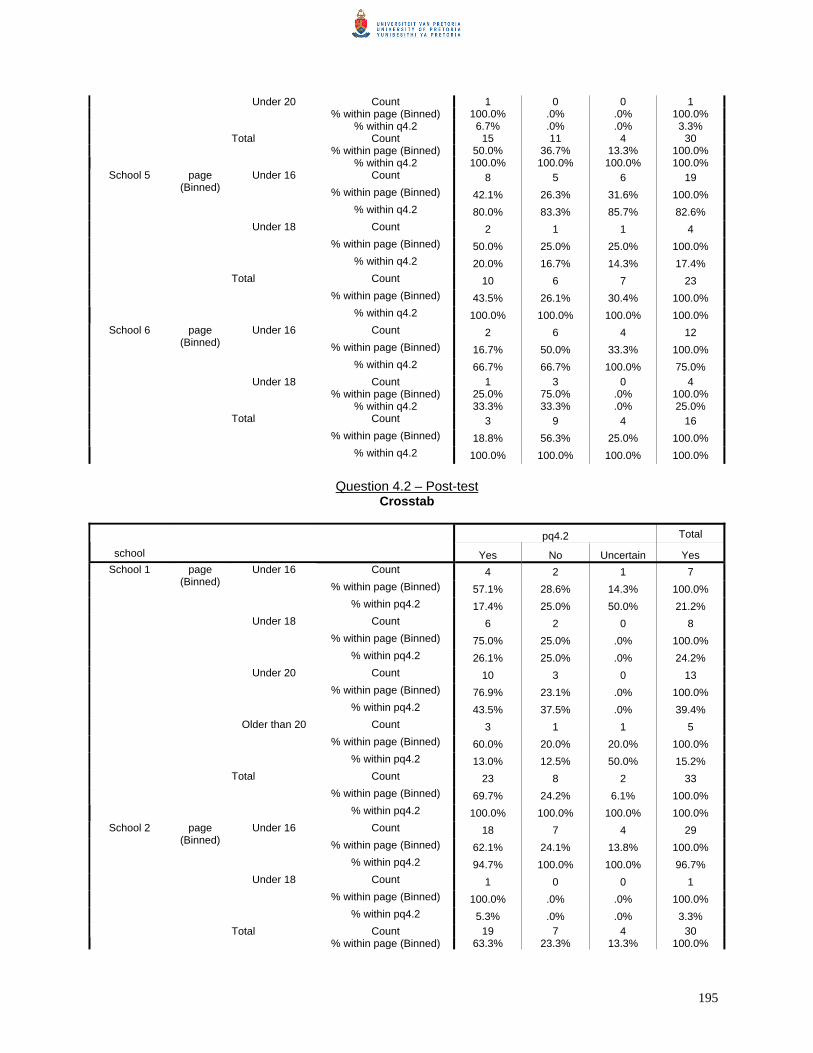
195
Count 1 0 0 1 % within page (Binned) 100.0% .0% .0% 100.0%
Under 20
% within q4.2 6.7% .0% .0% 3.3% Count 15 11 4 30
% within page (Binned) 50.0% 36.7% 13.3% 100.0% Total
% within q4.2 100.0% 100.0% 100.0% 100.0% Count 8 5 6 19
% within page (Binned) 42.1% 26.3% 31.6% 100.0%
Under 16
% within q4.2 80.0% 83.3% 85.7% 82.6% Count 2 1 1 4
% within page (Binned) 50.0% 25.0% 25.0% 100.0%
page (Binned)
Under 18
% within q4.2 20.0% 16.7% 14.3% 17.4% Count 10 6 7 23
% within page (Binned) 43.5% 26.1% 30.4% 100.0%
School 5
Total
% within q4.2 100.0% 100.0% 100.0% 100.0% Count 2 6 4 12
% within page (Binned) 16.7% 50.0% 33.3% 100.0%
Under 16
% within q4.2 66.7% 66.7% 100.0% 75.0% Count 1 3 0 4
% within page (Binned) 25.0% 75.0% .0% 100.0%
page (Binned)
Under 18
% within q4.2 33.3% 33.3% .0% 25.0% Count 3 9 4 16
% within page (Binned) 18.8% 56.3% 25.0% 100.0%
School 6
Total
% within q4.2 100.0% 100.0% 100.0% 100.0%
Question 4.2 – Post-test Crosstab
pq4.2 Total
school Yes No Uncertain Yes Count 4 2 1 7
% within page (Binned) 57.1% 28.6% 14.3% 100.0%
Under 16
% within pq4.2 17.4% 25.0% 50.0% 21.2% Count 6 2 0 8
% within page (Binned) 75.0% 25.0% .0% 100.0%
Under 18
% within pq4.2 26.1% 25.0% .0% 24.2% Count 10 3 0 13
% within page (Binned) 76.9% 23.1% .0% 100.0%
Under 20
% within pq4.2 43.5% 37.5% .0% 39.4% Count 3 1 1 5
% within page (Binned) 60.0% 20.0% 20.0% 100.0%
page (Binned)
Older than 20
% within pq4.2 13.0% 12.5% 50.0% 15.2% Count 23 8 2 33
% within page (Binned) 69.7% 24.2% 6.1% 100.0%
School 1
Total
% within pq4.2 100.0% 100.0% 100.0% 100.0% Count 18 7 4 29
% within page (Binned) 62.1% 24.1% 13.8% 100.0%
Under 16
% within pq4.2 94.7% 100.0% 100.0% 96.7% Count 1 0 0 1
% within page (Binned) 100.0% .0% .0% 100.0%
page (Binned)
Under 18
% within pq4.2 5.3% .0% .0% 3.3% Count 19 7 4 30
School 2
Total % within page (Binned) 63.3% 23.3% 13.3% 100.0%

196
% within pq4.2 100.0% 100.0% 100.0% 100.0% Count 24 3 5 32
% within page (Binned) 75.0% 9.4% 15.6% 100.0% page
(Binned) Under 16
% within pq4.2 100.0% 100.0% 100.0% 100.0% Count 24 3 5 32
% within page (Binned) 75.0% 9.4% 15.6% 100.0%
School 3
Total
% within pq4.2 100.0% 100.0% 100.0% 100.0% Count 14 7 3 24
% within page (Binned) 58.3% 29.2% 12.5% 100.0%
Under 16
% within pq4.2 82.4% 77.8% 75.0% 80.0% Count 2 2 1 5
% within page (Binned) 40.0% 40.0% 20.0% 100.0% Under 18
% within pq4.2 11.8% 22.2% 25.0% 16.7% Count 1 0 0 1
% within page (Binned) 100.0% .0% .0% 100.0%
page (Binned)
Under 20
% within pq4.2 5.9% .0% .0% 3.3% Count 17 9 4 30
% within page (Binned) 56.7% 30.0% 13.3% 100.0%
School 4
Total
% within pq4.2 100.0% 100.0% 100.0% 100.0% Count 8 9 2 19
% within page (Binned) 42.1% 47.4% 10.5% 100.0%
Under 16
% within pq4.2 72.7% 90.0% 100.0% 82.6% Count 3 1 0 4
% within page (Binned) 75.0% 25.0% .0% 100.0%
page (Binned)
Under 18
% within pq4.2 27.3% 10.0% .0% 17.4% Count 11 10 2 23
% within page (Binned) 47.8% 43.5% 8.7% 100.0%
School 5
Total
% within pq4.2 100.0% 100.0% 100.0% 100.0% Count 3 4 5 12
% within page (Binned) 25.0% 33.3% 41.7% 100.0%
Under 16
% within pq4.2 60.0% 66.7% 100.0% 75.0% Count 2 2 0 4
% within page (Binned) 50.0% 50.0% .0% 100.0%
page (Binned)
Under 18
% within pq4.2 40.0% 33.3% .0% 25.0% Count 5 6 5 16
% within page (Binned) 31.3% 37.5% 31.3% 100.0%
School 6
Total
% within pq4.2 100.0% 100.0% 100.0% 100.0%
Question 4.3 – Pre-test
Crosstab
q4.3 Total
school Yes No Uncertain Yes Count 5 2 0 7
% within page (Binned) 71.4% 28.6% .0% 100.0%
Under 16
% within q4.3 17.9% 50.0% .0% 21.2% Count 8 0 0 8
% within page (Binned) 100.0% .0% .0% 100.0%
Under 18
% within q4.3 28.6% .0% .0% 24.2% Count 11 1 1 13
% within page (Binned) 84.6% 7.7% 7.7% 100.0%
Under 20
% within q4.3 39.3% 25.0% 100.0% 39.4% Count 4 1 0 5
School 1 page (Binned)
Older than 20 % within page (Binned) 80.0% 20.0% .0% 100.0%

197
% within q4.3 14.3% 25.0% .0% 15.2% Count 28 4 1 33
% within page (Binned) 84.8% 12.1% 3.0% 100.0%
Total
% within q4.3 100.0% 100.0% 100.0% 100.0% Count 26 1 2 29
% within page (Binned) 89.7% 3.4% 6.9% 100.0%
Under 16
% within q4.3 96.3% 100.0% 100.0% 96.7% Count 1 0 0 1
% within page (Binned) 100.0% .0% .0% 100.0%
page (Binned)
Under 18
% within q4.3 3.7% .0% .0% 3.3% Count 27 1 2 30
% within page (Binned) 90.0% 3.3% 6.7% 100.0%
School 2
Total
% within q4.3 100.0% 100.0% 100.0% 100.0% Count 31 1 32
% within page (Binned) 96.9% 3.1% 100.0% page
(Binned) Under 16
% within q4.3 100.0% 100.0% 100.0% Count 31 1 32
% within page (Binned) 96.9% 3.1% 100.0%
School 3
Total
% within q4.3 100.0% 100.0% 100.0% Count 24 24
% within page (Binned) 100.0% 100.0%
Under 16
% within q4.3 82.8% 82.8% Count 4 4
% within page (Binned) 100.0% 100.0% Under 18
% within q4.3 13.8% 13.8% Count 1 1
% within page (Binned) 100.0% 100.0%
page (Binned)
Under 20
% within q4.3 3.4% 3.4% Count 29 29
% within page (Binned) 100.0% 100.0%
School 4
Total
% within q4.3 100.0% 100.0% Count 18 1 19
% within page (Binned) 94.7% 5.3% 100.0%
Under 16
% within q4.3 81.8% 100.0% 82.6% Count 4 0 4
% within page (Binned) 100.0% .0% 100.0%
page (Binned)
Under 18
% within q4.3 18.2% .0% 17.4% Count 22 1 23
% within page (Binned) 95.7% 4.3% 100.0%
School 5
Total
% within q4.3 100.0% 100.0% 100.0% Count 12 0 12
% within page (Binned) 100.0% .0% 100.0%
Under 16
% within q4.3 80.0% .0% 75.0% Count 3 1 4
% within page (Binned) 75.0% 25.0% 100.0%
page (Binned)
Under 18
% within q4.3 20.0% 100.0% 25.0% Count 15 1 16
% within page (Binned) 93.8% 6.3% 100.0%
School 6
Total
% within q4.3 100.0% 100.0% 100.0%
Question 4.3 – Post-test Crosstab
school pq4.3 Total

198
Yes No Uncertain Yes Count 5 1 1 7
% within page (Binned) 71.4% 14.3% 14.3% 100.0%
Under 16
% within pq4.3 17.9% 25.0% 100.0% 21.2% Count 7 1 0 8
% within page (Binned) 87.5% 12.5% .0% 100.0%
Under 18
% within pq4.3 25.0% 25.0% .0% 24.2% Count 11 2 0 13
% within page (Binned) 84.6% 15.4% .0% 100.0%
Under 20
% within pq4.3 39.3% 50.0% .0% 39.4% Count 5 0 0 5
% within page (Binned) 100.0% .0% .0% 100.0%
page (Binned)
Older than 20
% within pq4.3 17.9% .0% .0% 15.2% Count 28 4 1 33
% within page (Binned) 84.8% 12.1% 3.0% 100.0%
School 1
Total
% within pq4.3 100.0% 100.0% 100.0% 100.0% Count 23 2 4 29
% within page (Binned) 79.3% 6.9% 13.8% 100.0%
Under 16
% within pq4.3 95.8% 100.0% 100.0% 96.7% Count 1 0 0 1
% within page (Binned) 100.0% .0% .0% 100.0%
page (Binned)
Under 18
% within pq4.3 4.2% .0% .0% 3.3% Count 24 2 4 30
% within page (Binned) 80.0% 6.7% 13.3% 100.0%
School 2
Total
% within pq4.3 100.0% 100.0% 100.0% 100.0% Count 32 32
% within page (Binned) 100.0% 100.0% page
(Binned) Under 16
% within pq4.3 100.0% 100.0% Count 32 32
% within page (Binned) 100.0% 100.0%
School 3
Total
% within pq4.3 100.0% 100.0% Count 24 0 24
% within page (Binned) 100.0% .0% 100.0%
Under 16
% within pq4.3 82.8% .0% 80.0% Count 4 1 5
% within page (Binned) 80.0% 20.0% 100.0% Under 18
% within pq4.3 13.8% 100.0% 16.7% Count 1 0 1
% within page (Binned) 100.0% .0% 100.0%
page (Binned)
Under 20
% within pq4.3 3.4% .0% 3.3% Count 29 1 30
% within page (Binned) 96.7% 3.3% 100.0%
School 4
Total
% within pq4.3 100.0% 100.0% 100.0% Count 19 19
% within page (Binned) 100.0% 100.0%
Under 16
% within pq4.3 82.6% 82.6% Count 4 4
% within page (Binned) 100.0% 100.0%
page (Binned)
Under 18
% within pq4.3 17.4% 17.4% Count 23 23
% within page (Binned) 100.0% 100.0%
School 5
Total
% within pq4.3 100.0% 100.0% Count 12 12 School 6 page
(Binned) Under 16
% within page (Binned) 100.0% 100.0%

199
% within pq4.3 75.0% 75.0% Count 4 4
% within page (Binned) 100.0% 100.0% Under 18
% within pq4.3 25.0% 25.0% Count 16 16
% within page (Binned) 100.0% 100.0%
Total
% within pq4.3 100.0% 100.0%
Question 4.4 – Pre-test
Crosstab
q4.4 Total
school Yes No Uncertain Yes Count 2 4 1 7
% within page (Binned) 28.6% 57.1% 14.3% 100.0%
Under 16
% within q4.4 12.5% 30.8% 25.0% 21.2% Count 5 2 1 8
% within page (Binned) 62.5% 25.0% 12.5% 100.0%
Under 18
% within q4.4 31.3% 15.4% 25.0% 24.2% Count 7 4 2 13
% within page (Binned) 53.8% 30.8% 15.4% 100.0%
Under 20
% within q4.4 43.8% 30.8% 50.0% 39.4% Count 2 3 0 5
% within page (Binned) 40.0% 60.0% .0% 100.0%
page (Binned)
Older than 20
% within q4.4 12.5% 23.1% .0% 15.2% Count 16 13 4 33
% within page (Binned) 48.5% 39.4% 12.1% 100.0%
School 1
Total
% within q4.4 100.0% 100.0% 100.0% 100.0% Count 4 18 6 28
% within page (Binned) 14.3% 64.3% 21.4% 100.0%
Under 16
% within q4.4 100.0% 100.0% 85.7% 96.6% Count 0 0 1 1
% within page (Binned) .0% .0% 100.0% 100.0%
page (Binned)
Under 18
% within q4.4 .0% .0% 14.3% 3.4% Count 4 18 7 29
% within page (Binned) 13.8% 62.1% 24.1% 100.0%
School 2
Total
% within q4.4 100.0% 100.0% 100.0% 100.0% Count 25 2 5 32
% within page (Binned) 78.1% 6.3% 15.6% 100.0% page
(Binned) Under 16
% within q4.4 100.0% 100.0% 100.0% 100.0% Count 25 2 5 32
% within page (Binned) 78.1% 6.3% 15.6% 100.0%
School 3
Total
% within q4.4 100.0% 100.0% 100.0% 100.0% Count 16 7 1 24
% within page (Binned) 66.7% 29.2% 4.2% 100.0%
Under 16
% within q4.4 80.0% 77.8% 100.0% 80.0% Count 4 1 0 5
% within page (Binned) 80.0% 20.0% .0% 100.0% Under 18
% within q4.4 20.0% 11.1% .0% 16.7% Count 0 1 0 1
% within page (Binned) .0% 100.0% .0% 100.0%
page (Binned)
Under 20
% within q4.4 .0% 11.1% .0% 3.3%
School 4
Total Count 20 9 1 30

200
% within page (Binned) 66.7% 30.0% 3.3% 100.0% % within q4.4 100.0% 100.0% 100.0% 100.0%
Count 18 1 19 % within page (Binned) 94.7% 5.3% 100.0%
Under 16
% within q4.4 81.8% 100.0% 82.6% Count 4 0 4
% within page (Binned) 100.0% .0% 100.0%
page (Binned)
Under 18
% within q4.4 18.2% .0% 17.4% Count 22 1 23
% within page (Binned) 95.7% 4.3% 100.0%
School 5
Total
% within q4.4 100.0% 100.0% 100.0% Count 5 6 1 12
% within page (Binned) 41.7% 50.0% 8.3% 100.0%
Under 16
% within q4.4 62.5% 85.7% 100.0% 75.0% Count 3 1 0 4
% within page (Binned) 75.0% 25.0% .0% 100.0%
page (Binned)
Under 18
% within q4.4 37.5% 14.3% .0% 25.0% Count 8 7 1 16
% within page (Binned) 50.0% 43.8% 6.3% 100.0%
School 6
Total
% within q4.4 100.0% 100.0% 100.0% 100.0%
Question 4.4 – Post-test
Crosstab
pq4.4 Total
school Yes No Uncertain Yes Count 3 3 1 7
% within page (Binned) 42.9% 42.9% 14.3% 100.0%
Under 16
% within pq4.4 15.0% 37.5% 25.0% 21.9% Count 5 1 2 8
% within page (Binned) 62.5% 12.5% 25.0% 100.0%
Under 18
% within pq4.4 25.0% 12.5% 50.0% 25.0% Count 8 4 0 12
% within page (Binned) 66.7% 33.3% .0% 100.0%
Under 20
% within pq4.4 40.0% 50.0% .0% 37.5% Count 4 0 1 5
% within page (Binned) 80.0% .0% 20.0% 100.0%
page (Binned)
Older than 20
% within pq4.4 20.0% .0% 25.0% 15.6% Count 20 8 4 32
% within page (Binned) 62.5% 25.0% 12.5% 100.0%
School 1
Total
% within pq4.4 100.0% 100.0% 100.0% 100.0% Count 12 13 4 29
% within page (Binned) 41.4% 44.8% 13.8% 100.0%
Under 16
% within pq4.4 100.0% 100.0% 80.0% 96.7% Count 0 0 1 1
% within page (Binned) .0% .0% 100.0% 100.0%
page (Binned)
Under 18
% within pq4.4 .0% .0% 20.0% 3.3% Count 12 13 5 30
% within page (Binned) 40.0% 43.3% 16.7% 100.0%
School 2
Total
% within pq4.4 100.0% 100.0% 100.0% 100.0% Count 27 2 3 32 School 3 page
(Binned) Under 16
% within page (Binned) 84.4% 6.3% 9.4% 100.0%

201
% within pq4.4 100.0% 100.0% 100.0% 100.0% Count 27 2 3 32
% within page (Binned) 84.4% 6.3% 9.4% 100.0%
Total
% within pq4.4 100.0% 100.0% 100.0% 100.0% Count 14 10 24
% within page (Binned) 58.3% 41.7% 100.0%
Under 16
% within pq4.4 73.7% 90.9% 80.0% Count 4 1 5
% within page (Binned) 80.0% 20.0% 100.0% Under 18
% within pq4.4 21.1% 9.1% 16.7% Count 1 0 1
% within page (Binned) 100.0% .0% 100.0%
page (Binned)
Under 20
% within pq4.4 5.3% .0% 3.3% Count 19 11 30
% within page (Binned) 63.3% 36.7% 100.0%
School 4
Total
% within pq4.4 100.0% 100.0% 100.0% Count 14 4 1 19
% within page (Binned) 73.7% 21.1% 5.3% 100.0%
Under 16
% within pq4.4 77.8% 100.0% 100.0% 82.6% Count 4 0 0 4
% within page (Binned) 100.0% .0% .0% 100.0%
page (Binned)
Under 18
% within pq4.4 22.2% .0% .0% 17.4% Count 18 4 1 23
% within page (Binned) 78.3% 17.4% 4.3% 100.0%
School 5
Total
% within pq4.4 100.0% 100.0% 100.0% 100.0% Count 4 3 5 12
% within page (Binned) 33.3% 25.0% 41.7% 100.0%
Under 16
% within pq4.4 57.1% 75.0% 100.0% 75.0% Count 3 1 0 4
% within page (Binned) 75.0% 25.0% .0% 100.0%
page (Binned)
Under 18
% within pq4.4 42.9% 25.0% .0% 25.0% Count 7 4 5 16
% within page (Binned) 43.8% 25.0% 31.3% 100.0%
School 6
Total
% within pq4.4 100.0% 100.0% 100.0% 100.0%
Question 4.5 – Pre-test
Crosstab
q4.5 Total
school Yes No Yes Count 7 0 7
% within page (Binned) 100.0% .0% 100.0%
Under 16
% within q4.5 21.9% .0% 21.2% Count 8 0 8
% within page (Binned) 100.0% .0% 100.0%
Under 18
% within q4.5 25.0% .0% 24.2% Count 12 1 13
% within page (Binned) 92.3% 7.7% 100.0%
Under 20
% within q4.5 37.5% 100.0% 39.4% Count 5 0 5
% within page (Binned) 100.0% .0% 100.0%
page (Binned)
Older than 20
% within q4.5 15.6% .0% 15.2%
School 1
Total Count 32 1 33
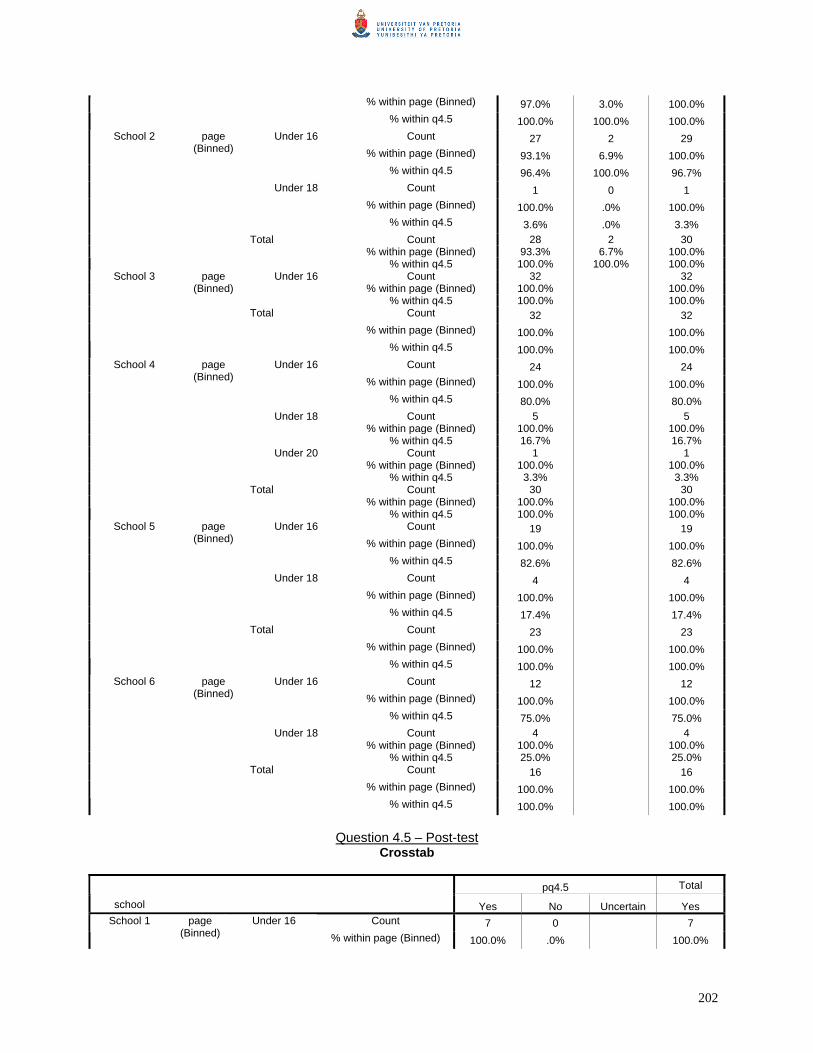
202
% within page (Binned) 97.0% 3.0% 100.0% % within q4.5 100.0% 100.0% 100.0%
Count 27 2 29 % within page (Binned) 93.1% 6.9% 100.0%
Under 16
% within q4.5 96.4% 100.0% 96.7% Count 1 0 1
% within page (Binned) 100.0% .0% 100.0%
page (Binned)
Under 18
% within q4.5 3.6% .0% 3.3% Count 28 2 30
% within page (Binned) 93.3% 6.7% 100.0%
School 2
Total
% within q4.5 100.0% 100.0% 100.0% Count 32 32
% within page (Binned) 100.0% 100.0% page
(Binned) Under 16
% within q4.5 100.0% 100.0% Count 32 32
% within page (Binned) 100.0% 100.0%
School 3
Total
% within q4.5 100.0% 100.0% Count 24 24
% within page (Binned) 100.0% 100.0%
Under 16
% within q4.5 80.0% 80.0% Count 5 5
% within page (Binned) 100.0% 100.0% Under 18
% within q4.5 16.7% 16.7% Count 1 1
% within page (Binned) 100.0% 100.0%
page (Binned)
Under 20
% within q4.5 3.3% 3.3% Count 30 30
% within page (Binned) 100.0% 100.0%
School 4
Total
% within q4.5 100.0% 100.0% Count 19 19
% within page (Binned) 100.0% 100.0%
Under 16
% within q4.5 82.6% 82.6% Count 4 4
% within page (Binned) 100.0% 100.0%
page (Binned)
Under 18
% within q4.5 17.4% 17.4% Count 23 23
% within page (Binned) 100.0% 100.0%
School 5
Total
% within q4.5 100.0% 100.0% Count 12 12
% within page (Binned) 100.0% 100.0%
Under 16
% within q4.5 75.0% 75.0% Count 4 4
% within page (Binned) 100.0% 100.0%
page (Binned)
Under 18
% within q4.5 25.0% 25.0% Count 16 16
% within page (Binned) 100.0% 100.0%
School 6
Total
% within q4.5 100.0% 100.0%
Question 4.5 – Post-test Crosstab
pq4.5 Total
school Yes No Uncertain Yes Count 7 0 7 School 1 page
(Binned) Under 16
% within page (Binned) 100.0% .0% 100.0%

203
% within pq4.5 21.9% .0% 21.2% Count 8 0 8
% within page (Binned) 100.0% .0% 100.0%
Under 18
% within pq4.5 25.0% .0% 24.2% Count 12 1 13
% within page (Binned) 92.3% 7.7% 100.0%
Under 20
% within pq4.5 37.5% 100.0% 39.4% Count 5 0 5
% within page (Binned) 100.0% .0% 100.0%
Older than 20
% within pq4.5 15.6% .0% 15.2% Count 32 1 33
% within page (Binned) 97.0% 3.0% 100.0%
Total
% within pq4.5 100.0% 100.0% 100.0% Count 29 29
% within page (Binned) 100.0% 100.0%
Under 16
% within pq4.5 96.7% 96.7% Count 1 1
% within page (Binned) 100.0% 100.0%
page (Binned)
Under 18
% within pq4.5 3.3% 3.3% Count 30 30
% within page (Binned) 100.0% 100.0%
School 2
Total
% within pq4.5 100.0% 100.0% Count 32 32
% within page (Binned) 100.0% 100.0% page
(Binned) Under 16
% within pq4.5 100.0% 100.0% Count 32 32
% within page (Binned) 100.0% 100.0%
School 3
Total
% within pq4.5 100.0% 100.0% Count 24 24
% within page (Binned) 100.0% 100.0%
Under 16
% within pq4.5 80.0% 80.0% Count 5 5
% within page (Binned) 100.0% 100.0% Under 18
% within pq4.5 16.7% 16.7% Count 1 1
% within page (Binned) 100.0% 100.0%
page (Binned)
Under 20
% within pq4.5 3.3% 3.3% Count 30 30
% within page (Binned) 100.0% 100.0%
School 4
Total
% within pq4.5 100.0% 100.0% Count 18 1 19
% within page (Binned) 94.7% 5.3% 100.0%
Under 16
% within pq4.5 81.8% 100.0% 82.6% Count 4 0 4
% within page (Binned) 100.0% .0% 100.0%
page (Binned)
Under 18
% within pq4.5 18.2% .0% 17.4% Count 22 1 23
% within page (Binned) 95.7% 4.3% 100.0%
School 5
Total
% within pq4.5 100.0% 100.0% 100.0% Count 12 12
% within page (Binned) 100.0% 100.0%
Under 16
% within pq4.5 75.0% 75.0% Count 4 4
% within page (Binned) 100.0% 100.0%
School 6 page (Binned)
Under 18
% within pq4.5 25.0% 25.0%
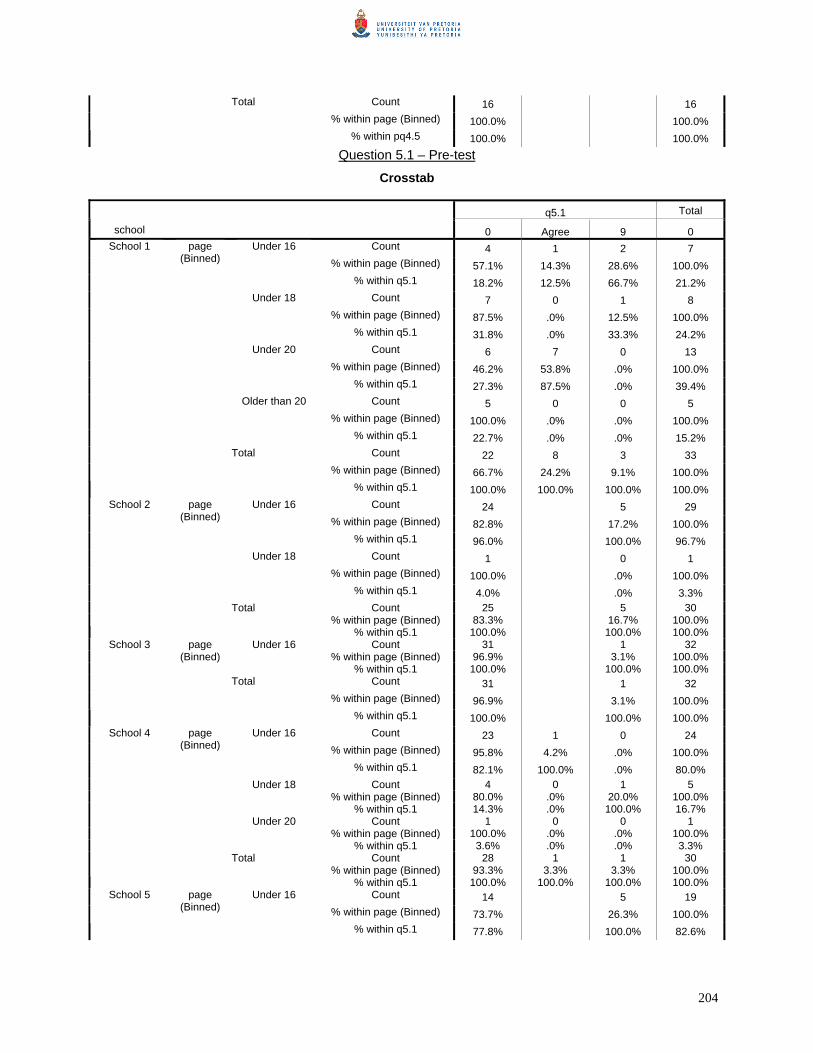
204
Count 16 16 % within page (Binned) 100.0% 100.0%
Total
% within pq4.5 100.0% 100.0% Question 5.1 – Pre-test
Crosstab
q5.1 Total
school 0 Agree 9 0 Count 4 1 2 7
% within page (Binned) 57.1% 14.3% 28.6% 100.0%
Under 16
% within q5.1 18.2% 12.5% 66.7% 21.2% Count 7 0 1 8
% within page (Binned) 87.5% .0% 12.5% 100.0%
Under 18
% within q5.1 31.8% .0% 33.3% 24.2% Count 6 7 0 13
% within page (Binned) 46.2% 53.8% .0% 100.0%
Under 20
% within q5.1 27.3% 87.5% .0% 39.4% Count 5 0 0 5
% within page (Binned) 100.0% .0% .0% 100.0%
page (Binned)
Older than 20
% within q5.1 22.7% .0% .0% 15.2% Count 22 8 3 33
% within page (Binned) 66.7% 24.2% 9.1% 100.0%
School 1
Total
% within q5.1 100.0% 100.0% 100.0% 100.0% Count 24 5 29
% within page (Binned) 82.8% 17.2% 100.0%
Under 16
% within q5.1 96.0% 100.0% 96.7% Count 1 0 1
% within page (Binned) 100.0% .0% 100.0%
page (Binned)
Under 18
% within q5.1 4.0% .0% 3.3% Count 25 5 30
% within page (Binned) 83.3% 16.7% 100.0%
School 2
Total
% within q5.1 100.0% 100.0% 100.0% Count 31 1 32
% within page (Binned) 96.9% 3.1% 100.0% page
(Binned) Under 16
% within q5.1 100.0% 100.0% 100.0% Count 31 1 32
% within page (Binned) 96.9% 3.1% 100.0%
School 3
Total
% within q5.1 100.0% 100.0% 100.0% Count 23 1 0 24
% within page (Binned) 95.8% 4.2% .0% 100.0%
Under 16
% within q5.1 82.1% 100.0% .0% 80.0% Count 4 0 1 5
% within page (Binned) 80.0% .0% 20.0% 100.0% Under 18
% within q5.1 14.3% .0% 100.0% 16.7% Count 1 0 0 1
% within page (Binned) 100.0% .0% .0% 100.0%
page (Binned)
Under 20
% within q5.1 3.6% .0% .0% 3.3% Count 28 1 1 30
% within page (Binned) 93.3% 3.3% 3.3% 100.0%
School 4
Total
% within q5.1 100.0% 100.0% 100.0% 100.0% Count 14 5 19
% within page (Binned) 73.7% 26.3% 100.0%
School 5 page (Binned)
Under 16
% within q5.1 77.8% 100.0% 82.6%

205
Count 4 0 4 % within page (Binned) 100.0% .0% 100.0%
Under 18
% within q5.1 22.2% .0% 17.4% Count 18 5 23
% within page (Binned) 78.3% 21.7% 100.0%
Total
% within q5.1 100.0% 100.0% 100.0% Count 11 1 12
% within page (Binned) 91.7% 8.3% 100.0%
Under 16
% within q5.1 84.6% 33.3% 75.0% Count 2 2 4
% within page (Binned) 50.0% 50.0% 100.0%
page (Binned)
Under 18
% within q5.1 15.4% 66.7% 25.0% Count 13 3 16
% within page (Binned) 81.3% 18.8% 100.0%
School 6
Total
% within q5.1 100.0% 100.0% 100.0%
Question 5.1 – Post-test
Crosstab
pq5.1 Total
school 0 Agree 9 0 Count 5 1 1 7
% within page (Binned) 71.4% 14.3% 14.3% 100.0%
Under 16
% within pq5.1 20.0% 25.0% 25.0% 21.2% Count 8 0 0 8
% within page (Binned) 100.0% .0% .0% 100.0%
Under 18
% within pq5.1 32.0% .0% .0% 24.2% Count 8 3 2 13
% within page (Binned) 61.5% 23.1% 15.4% 100.0%
Under 20
% within pq5.1 32.0% 75.0% 50.0% 39.4% Count 4 0 1 5
% within page (Binned) 80.0% .0% 20.0% 100.0%
page (Binned)
Older than 20
% within pq5.1 16.0% .0% 25.0% 15.2% Count 25 4 4 33
% within page (Binned) 75.8% 12.1% 12.1% 100.0%
School 1
Total
% within pq5.1 100.0% 100.0% 100.0% 100.0% Count 20 1 8 29
% within page (Binned) 69.0% 3.4% 27.6% 100.0%
Under 16
% within pq5.1 95.2% 100.0% 100.0% 96.7% Count 1 0 0 1
% within page (Binned) 100.0% .0% .0% 100.0%
page (Binned)
Under 18
% within pq5.1 4.8% .0% .0% 3.3% Count 21 1 8 30
% within page (Binned) 70.0% 3.3% 26.7% 100.0%
School 2
Total
% within pq5.1 100.0% 100.0% 100.0% 100.0% Count 32 32
% within page (Binned) 100.0% 100.0% page
(Binned) Under 16
% within pq5.1 100.0% 100.0% Count 32 32
% within page (Binned) 100.0% 100.0%
School 3
Total
% within pq5.1 100.0% 100.0%

206
Count 21 2 1 24 % within page (Binned) 87.5% 8.3% 4.2% 100.0%
Under 16
% within pq5.1 80.8% 100.0% 50.0% 80.0% Count 4 0 1 5
% within page (Binned) 80.0% .0% 20.0% 100.0% Under 18
% within pq5.1 15.4% .0% 50.0% 16.7% Count 1 0 0 1
% within page (Binned) 100.0% .0% .0% 100.0%
page (Binned)
Under 20
% within pq5.1 3.8% .0% .0% 3.3% Count 26 2 2 30
% within page (Binned) 86.7% 6.7% 6.7% 100.0%
School 4
Total
% within pq5.1 100.0% 100.0% 100.0% 100.0% Count 13 2 4 19
% within page (Binned) 68.4% 10.5% 21.1% 100.0%
Under 16
% within pq5.1 76.5% 100.0% 100.0% 82.6% Count 4 0 0 4
% within page (Binned) 100.0% .0% .0% 100.0%
page (Binned)
Under 18
% within pq5.1 23.5% .0% .0% 17.4% Count 17 2 4 23
% within page (Binned) 73.9% 8.7% 17.4% 100.0%
School 5
Total
% within pq5.1 100.0% 100.0% 100.0% 100.0% Count 11 1 12
% within page (Binned) 91.7% 8.3% 100.0%
Under 16
% within pq5.1 78.6% 50.0% 75.0% Count 3 1 4
% within page (Binned) 75.0% 25.0% 100.0%
page (Binned)
Under 18
% within pq5.1 21.4% 50.0% 25.0% Count 14 2 16
% within page (Binned) 87.5% 12.5% 100.0%
School 6
Total
% within pq5.1 100.0% 100.0% 100.0%
Question 5.2 – Pre-test
Crosstab
q5.2 Total
school 0 Agree 9 0 Count 4 1 2 7
% within page (Binned) 57.1% 14.3% 28.6% 100.0%
Under 16
% within q5.2 36.4% 6.3% 33.3% 21.2% Count 2 4 2 8
% within page (Binned) 25.0% 50.0% 25.0% 100.0%
Under 18
% within q5.2 18.2% 25.0% 33.3% 24.2% Count 3 8 2 13
% within page (Binned) 23.1% 61.5% 15.4% 100.0%
Under 20
% within q5.2 27.3% 50.0% 33.3% 39.4% Count 2 3 0 5
% within page (Binned) 40.0% 60.0% .0% 100.0%
page (Binned)
Older than 20
% within q5.2 18.2% 18.8% .0% 15.2% Count 11 16 6 33
% within page (Binned) 33.3% 48.5% 18.2% 100.0%
School 1
Total
% within q5.2 100.0% 100.0% 100.0% 100.0% Count 11 8 10 29 School 2 page
(Binned) Under 16
% within page (Binned) 37.9% 27.6% 34.5% 100.0%

207
% within q5.2 100.0% 88.9% 100.0% 96.7% Count 0 1 0 1
% within page (Binned) .0% 100.0% .0% 100.0%
Under 18
% within q5.2 .0% 11.1% .0% 3.3% Count 11 9 10 30
% within page (Binned) 36.7% 30.0% 33.3% 100.0% Total
% within q5.2 100.0% 100.0% 100.0% 100.0% Count 13 12 7 32
% within page (Binned) 40.6% 37.5% 21.9% 100.0% page
(Binned) Under 16
% within q5.2 100.0% 100.0% 100.0% 100.0% Count 13 12 7 32
% within page (Binned) 40.6% 37.5% 21.9% 100.0%
School 3
Total
% within q5.2 100.0% 100.0% 100.0% 100.0% Count 8 5 11 24
% within page (Binned) 33.3% 20.8% 45.8% 100.0%
Under 16
% within q5.2 72.7% 71.4% 91.7% 80.0% Count 2 2 1 5
% within page (Binned) 40.0% 40.0% 20.0% 100.0% Under 18
% within q5.2 18.2% 28.6% 8.3% 16.7% Count 1 0 0 1
% within page (Binned) 100.0% .0% .0% 100.0%
page (Binned)
Under 20
% within q5.2 9.1% .0% .0% 3.3% Count 11 7 12 30
% within page (Binned) 36.7% 23.3% 40.0% 100.0%
School 4
Total
% within q5.2 100.0% 100.0% 100.0% 100.0% Count 12 1 6 19
% within page (Binned) 63.2% 5.3% 31.6% 100.0%
Under 16
% within q5.2 75.0% 100.0% 100.0% 82.6% Count 4 0 0 4
% within page (Binned) 100.0% .0% .0% 100.0%
page (Binned)
Under 18
% within q5.2 25.0% .0% .0% 17.4% Count 16 1 6 23
% within page (Binned) 69.6% 4.3% 26.1% 100.0%
School 5
Total
% within q5.2 100.0% 100.0% 100.0% 100.0% Count 6 1 5 12
% within page (Binned) 50.0% 8.3% 41.7% 100.0%
Under 16
% within q5.2 75.0% 100.0% 71.4% 75.0% Count 2 0 2 4
% within page (Binned) 50.0% .0% 50.0% 100.0%
page (Binned)
Under 18
% within q5.2 25.0% .0% 28.6% 25.0% Count 8 1 7 16
% within page (Binned) 50.0% 6.3% 43.8% 100.0%
School 6
Total
% within q5.2 100.0% 100.0% 100.0% 100.0%
Question 5.2 – Post-test Crosstab
pq5.2 Total
school 0 Agree 9 0 Count 4 2 1 7
% within page (Binned) 57.1% 28.6% 14.3% 100.0%
Under 16
% within pq5.2 28.6% 18.2% 12.5% 21.2% Count 3 2 3 8
School 1 page (Binned)
Under 18 % within page (Binned) 37.5% 25.0% 37.5% 100.0%

208
% within pq5.2 21.4% 18.2% 37.5% 24.2% Count 4 5 4 13
% within page (Binned) 30.8% 38.5% 30.8% 100.0%
Under 20
% within pq5.2 28.6% 45.5% 50.0% 39.4% Count 3 2 0 5
% within page (Binned) 60.0% 40.0% .0% 100.0%
Older than 20
% within pq5.2 21.4% 18.2% .0% 15.2% Count 14 11 8 33
% within page (Binned) 42.4% 33.3% 24.2% 100.0%
Total
% within pq5.2 100.0% 100.0% 100.0% 100.0% Count 14 8 7 29
% within page (Binned) 48.3% 27.6% 24.1% 100.0%
Under 16
% within pq5.2 100.0% 100.0% 87.5% 96.7% Count 0 0 1 1
% within page (Binned) .0% .0% 100.0% 100.0%
page (Binned)
Under 18
% within pq5.2 .0% .0% 12.5% 3.3% Count 14 8 8 30
% within page (Binned) 46.7% 26.7% 26.7% 100.0%
School 2
Total
% within pq5.2 100.0% 100.0% 100.0% 100.0% Count 12 11 9 32
% within page (Binned) 37.5% 34.4% 28.1% 100.0% page
(Binned) Under 16
% within pq5.2 100.0% 100.0% 100.0% 100.0% Count 12 11 9 32
% within page (Binned) 37.5% 34.4% 28.1% 100.0%
School 3
Total
% within pq5.2 100.0% 100.0% 100.0% 100.0% Count 8 3 13 24
% within page (Binned) 33.3% 12.5% 54.2% 100.0%
Under 16
% within pq5.2 80.0% 60.0% 86.7% 80.0% Count 1 2 2 5
% within page (Binned) 20.0% 40.0% 40.0% 100.0% Under 18
% within pq5.2 10.0% 40.0% 13.3% 16.7% Count 1 0 0 1
% within page (Binned) 100.0% .0% .0% 100.0%
page (Binned)
Under 20
% within pq5.2 10.0% .0% .0% 3.3% Count 10 5 15 30
% within page (Binned) 33.3% 16.7% 50.0% 100.0%
School 4
Total
% within pq5.2 100.0% 100.0% 100.0% 100.0% Count 13 3 3 19
% within page (Binned) 68.4% 15.8% 15.8% 100.0%
Under 16
% within pq5.2 76.5% 100.0% 100.0% 82.6% Count 4 0 0 4
% within page (Binned) 100.0% .0% .0% 100.0%
page (Binned)
Under 18
% within pq5.2 23.5% .0% .0% 17.4% Count 17 3 3 23
% within page (Binned) 73.9% 13.0% 13.0% 100.0%
School 5
Total
% within pq5.2 100.0% 100.0% 100.0% 100.0% Count 5 4 3 12
% within page (Binned) 41.7% 33.3% 25.0% 100.0%
Under 16
% within pq5.2 71.4% 100.0% 60.0% 75.0% Count 2 0 2 4
% within page (Binned) 50.0% .0% 50.0% 100.0%
page (Binned)
Under 18
% within pq5.2 28.6% .0% 40.0% 25.0% Count 7 4 5 16
% within page (Binned) 43.8% 25.0% 31.3% 100.0%
School 6
Total
% within pq5.2 100.0% 100.0% 100.0% 100.0%
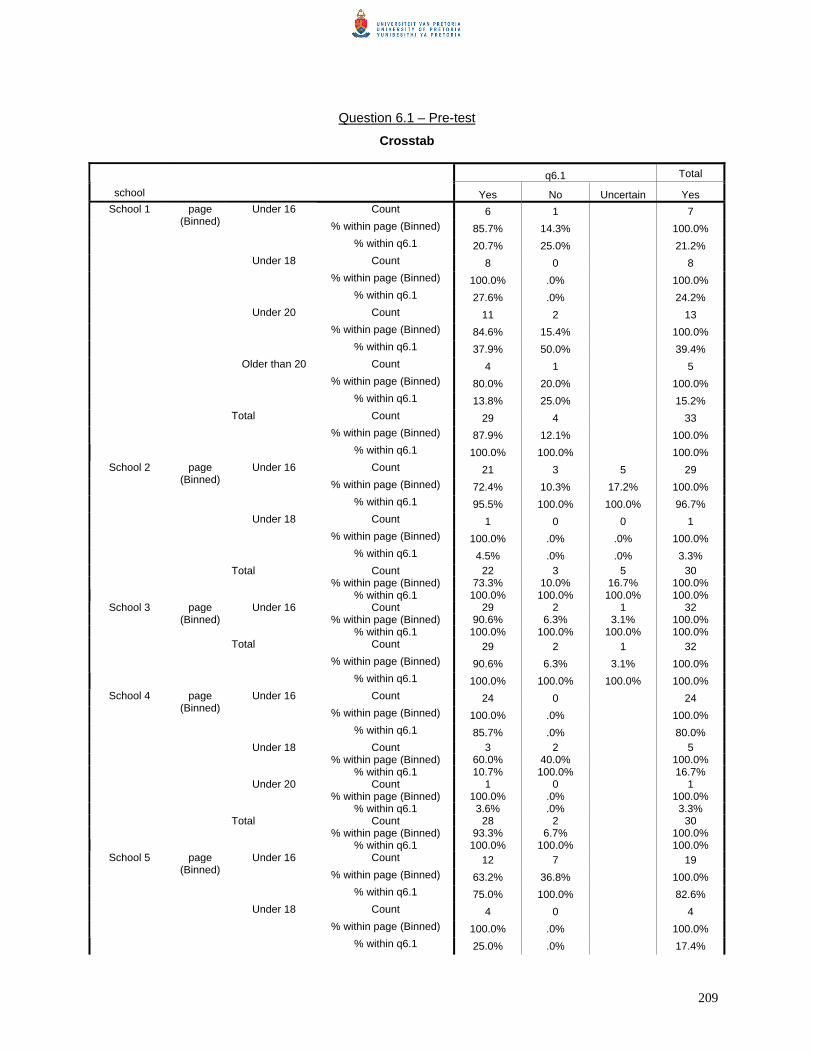
209
Question 6.1 – Pre-test
Crosstab
q6.1 Total
school Yes No Uncertain Yes Count 6 1 7
% within page (Binned) 85.7% 14.3% 100.0%
Under 16
% within q6.1 20.7% 25.0% 21.2% Count 8 0 8
% within page (Binned) 100.0% .0% 100.0%
Under 18
% within q6.1 27.6% .0% 24.2% Count 11 2 13
% within page (Binned) 84.6% 15.4% 100.0%
Under 20
% within q6.1 37.9% 50.0% 39.4% Count 4 1 5
% within page (Binned) 80.0% 20.0% 100.0%
page (Binned)
Older than 20
% within q6.1 13.8% 25.0% 15.2% Count 29 4 33
% within page (Binned) 87.9% 12.1% 100.0%
School 1
Total
% within q6.1 100.0% 100.0% 100.0% Count 21 3 5 29
% within page (Binned) 72.4% 10.3% 17.2% 100.0%
Under 16
% within q6.1 95.5% 100.0% 100.0% 96.7% Count 1 0 0 1
% within page (Binned) 100.0% .0% .0% 100.0%
page (Binned)
Under 18
% within q6.1 4.5% .0% .0% 3.3% Count 22 3 5 30
% within page (Binned) 73.3% 10.0% 16.7% 100.0%
School 2
Total
% within q6.1 100.0% 100.0% 100.0% 100.0% Count 29 2 1 32
% within page (Binned) 90.6% 6.3% 3.1% 100.0% page
(Binned) Under 16
% within q6.1 100.0% 100.0% 100.0% 100.0% Count 29 2 1 32
% within page (Binned) 90.6% 6.3% 3.1% 100.0%
School 3
Total
% within q6.1 100.0% 100.0% 100.0% 100.0% Count 24 0 24
% within page (Binned) 100.0% .0% 100.0%
Under 16
% within q6.1 85.7% .0% 80.0% Count 3 2 5
% within page (Binned) 60.0% 40.0% 100.0% Under 18
% within q6.1 10.7% 100.0% 16.7% Count 1 0 1
% within page (Binned) 100.0% .0% 100.0%
page (Binned)
Under 20
% within q6.1 3.6% .0% 3.3% Count 28 2 30
% within page (Binned) 93.3% 6.7% 100.0%
School 4
Total
% within q6.1 100.0% 100.0% 100.0% Count 12 7 19
% within page (Binned) 63.2% 36.8% 100.0%
Under 16
% within q6.1 75.0% 100.0% 82.6% Count 4 0 4
% within page (Binned) 100.0% .0% 100.0%
School 5 page (Binned)
Under 18
% within q6.1 25.0% .0% 17.4%

210
Count 16 7 23 % within page (Binned) 69.6% 30.4% 100.0%
Total
% within q6.1 100.0% 100.0% 100.0% Count 9 2 1 12
% within page (Binned) 75.0% 16.7% 8.3% 100.0%
Under 16
% within q6.1 90.0% 40.0% 100.0% 75.0% Count 1 3 0 4
% within page (Binned) 25.0% 75.0% .0% 100.0%
page (Binned)
Under 18
% within q6.1 10.0% 60.0% .0% 25.0% Count 10 5 1 16
% within page (Binned) 62.5% 31.3% 6.3% 100.0%
School 6
Total
% within q6.1 100.0% 100.0% 100.0% 100.0%
Question 6.1 – Post-test Crosstab
pq6.1 Total
school Yes No Uncertain Yes Count 4 3 0 7
% within page (Binned) 57.1% 42.9% .0% 100.0%
Under 16
% within pq6.1 14.8% 60.0% .0% 21.2% Count 7 0 1 8
% within page (Binned) 87.5% .0% 12.5% 100.0%
Under 18
% within pq6.1 25.9% .0% 100.0% 24.2% Count 11 2 0 13
% within page (Binned) 84.6% 15.4% .0% 100.0%
Under 20
% within pq6.1 40.7% 40.0% .0% 39.4% Count 5 0 0 5
% within page (Binned) 100.0% .0% .0% 100.0%
page (Binned)
Older than 20
% within pq6.1 18.5% .0% .0% 15.2% Count 27 5 1 33
% within page (Binned) 81.8% 15.2% 3.0% 100.0%
School 1
Total
% within pq6.1 100.0% 100.0% 100.0% 100.0% Count 17 7 5 29
% within page (Binned) 58.6% 24.1% 17.2% 100.0%
Under 16
% within pq6.1 94.4% 100.0% 100.0% 96.7% Count 1 0 0 1
% within page (Binned) 100.0% .0% .0% 100.0%
page (Binned)
Under 18
% within pq6.1 5.6% .0% .0% 3.3% Count 18 7 5 30
% within page (Binned) 60.0% 23.3% 16.7% 100.0%
School 2
Total
% within pq6.1 100.0% 100.0% 100.0% 100.0% Count 28 3 1 32
% within page (Binned) 87.5% 9.4% 3.1% 100.0% page
(Binned) Under 16
% within pq6.1 100.0% 100.0% 100.0% 100.0% Count 28 3 1 32
% within page (Binned) 87.5% 9.4% 3.1% 100.0%
School 3
Total
% within pq6.1 100.0% 100.0% 100.0% 100.0% Count 23 0 1 24
% within page (Binned) 95.8% .0% 4.2% 100.0%
Under 16
% within pq6.1 82.1% .0% 100.0% 80.0% Count 4 1 0 5
% within page (Binned) 80.0% 20.0% .0% 100.0%
School 4 page (Binned)
Under 18
% within pq6.1 14.3% 100.0% .0% 16.7%
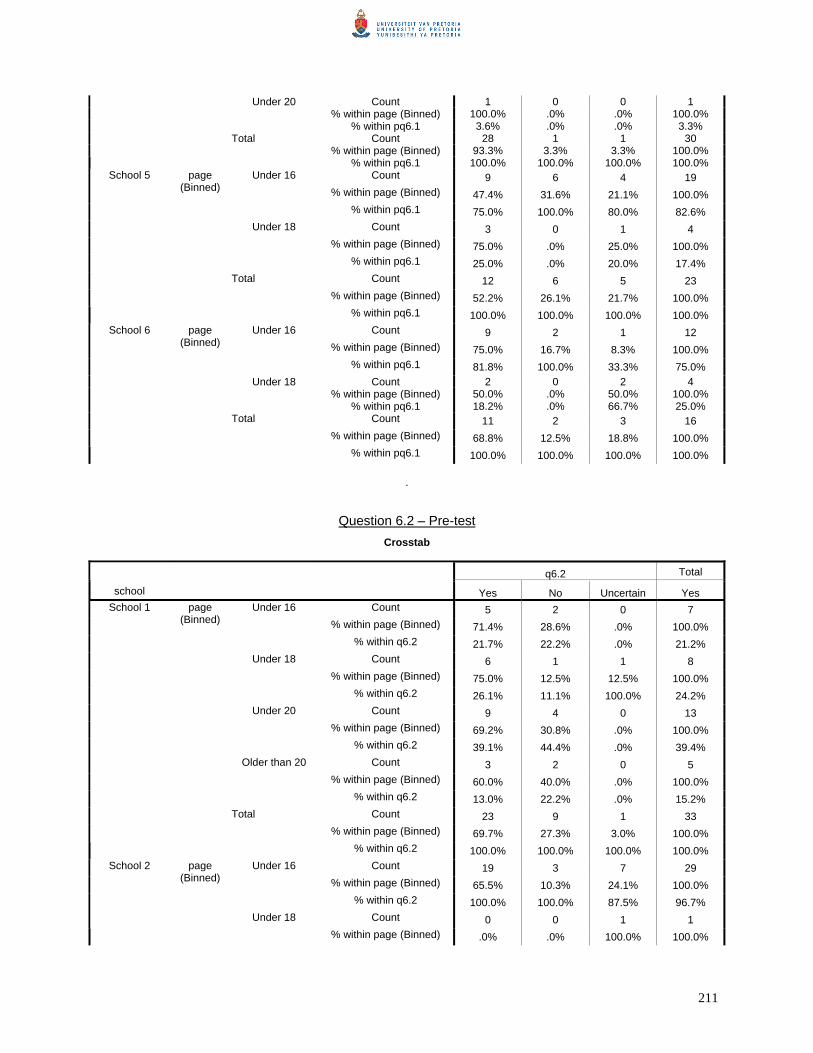
211
Count 1 0 0 1 % within page (Binned) 100.0% .0% .0% 100.0%
Under 20
% within pq6.1 3.6% .0% .0% 3.3% Count 28 1 1 30
% within page (Binned) 93.3% 3.3% 3.3% 100.0% Total
% within pq6.1 100.0% 100.0% 100.0% 100.0% Count 9 6 4 19
% within page (Binned) 47.4% 31.6% 21.1% 100.0%
Under 16
% within pq6.1 75.0% 100.0% 80.0% 82.6% Count 3 0 1 4
% within page (Binned) 75.0% .0% 25.0% 100.0%
page (Binned)
Under 18
% within pq6.1 25.0% .0% 20.0% 17.4% Count 12 6 5 23
% within page (Binned) 52.2% 26.1% 21.7% 100.0%
School 5
Total
% within pq6.1 100.0% 100.0% 100.0% 100.0% Count 9 2 1 12
% within page (Binned) 75.0% 16.7% 8.3% 100.0%
Under 16
% within pq6.1 81.8% 100.0% 33.3% 75.0% Count 2 0 2 4
% within page (Binned) 50.0% .0% 50.0% 100.0%
page (Binned)
Under 18
% within pq6.1 18.2% .0% 66.7% 25.0% Count 11 2 3 16
% within page (Binned) 68.8% 12.5% 18.8% 100.0%
School 6
Total
% within pq6.1 100.0% 100.0% 100.0% 100.0% .
Question 6.2 – Pre-test Crosstab
q6.2 Total
school Yes No Uncertain Yes Count 5 2 0 7
% within page (Binned) 71.4% 28.6% .0% 100.0%
Under 16
% within q6.2 21.7% 22.2% .0% 21.2% Count 6 1 1 8
% within page (Binned) 75.0% 12.5% 12.5% 100.0%
Under 18
% within q6.2 26.1% 11.1% 100.0% 24.2% Count 9 4 0 13
% within page (Binned) 69.2% 30.8% .0% 100.0%
Under 20
% within q6.2 39.1% 44.4% .0% 39.4% Count 3 2 0 5
% within page (Binned) 60.0% 40.0% .0% 100.0%
page (Binned)
Older than 20
% within q6.2 13.0% 22.2% .0% 15.2% Count 23 9 1 33
% within page (Binned) 69.7% 27.3% 3.0% 100.0%
School 1
Total
% within q6.2 100.0% 100.0% 100.0% 100.0% Count 19 3 7 29
% within page (Binned) 65.5% 10.3% 24.1% 100.0%
Under 16
% within q6.2 100.0% 100.0% 87.5% 96.7% Count 0 0 1 1
School 2 page (Binned)
Under 18 % within page (Binned) .0% .0% 100.0% 100.0%

212
% within q6.2 .0% .0% 12.5% 3.3% Count 19 3 8 30
% within page (Binned) 63.3% 10.0% 26.7% 100.0% Total
% within q6.2 100.0% 100.0% 100.0% 100.0% Count 26 3 3 32
% within page (Binned) 81.3% 9.4% 9.4% 100.0% page
(Binned) Under 16
% within q6.2 100.0% 100.0% 100.0% 100.0% Count 26 3 3 32
% within page (Binned) 81.3% 9.4% 9.4% 100.0%
School 3
Total
% within q6.2 100.0% 100.0% 100.0% 100.0% Count 17 4 3 24
% within page (Binned) 70.8% 16.7% 12.5% 100.0%
Under 16
% within q6.2 81.0% 66.7% 100.0% 80.0% Count 3 2 0 5
% within page (Binned) 60.0% 40.0% .0% 100.0% Under 18
% within q6.2 14.3% 33.3% .0% 16.7% Count 1 0 0 1
% within page (Binned) 100.0% .0% .0% 100.0%
page (Binned)
Under 20
% within q6.2 4.8% .0% .0% 3.3% Count 21 6 3 30
% within page (Binned) 70.0% 20.0% 10.0% 100.0%
School 4
Total
% within q6.2 100.0% 100.0% 100.0% 100.0% Count 12 5 2 19
% within page (Binned) 63.2% 26.3% 10.5% 100.0%
Under 16
% within q6.2 80.0% 83.3% 100.0% 82.6% Count 3 1 0 4
% within page (Binned) 75.0% 25.0% .0% 100.0%
page (Binned)
Under 18
% within q6.2 20.0% 16.7% .0% 17.4% Count 15 6 2 23
% within page (Binned) 65.2% 26.1% 8.7% 100.0%
School 5
Total
% within q6.2 100.0% 100.0% 100.0% 100.0% Count 8 3 1 12
% within page (Binned) 66.7% 25.0% 8.3% 100.0%
Under 16
% within q6.2 88.9% 50.0% 100.0% 75.0% Count 1 3 0 4
% within page (Binned) 25.0% 75.0% .0% 100.0%
page (Binned)
Under 18
% within q6.2 11.1% 50.0% .0% 25.0% Count 9 6 1 16
% within page (Binned) 56.3% 37.5% 6.3% 100.0%
School 6
Total
% within q6.2 100.0% 100.0% 100.0% 100.0% .
Question 6.2 – Post-test Crosstab
pq6.2 Total
school Yes No Uncertain Yes Count 4 3 0 7
% within page (Binned) 57.1% 42.9% .0% 100.0%
Under 16
% within pq6.2 16.7% 42.9% .0% 21.2% Count 6 1 1 8
% within page (Binned) 75.0% 12.5% 12.5% 100.0%
Under 18
% within pq6.2 25.0% 14.3% 50.0% 24.2% Count 11 2 0 13
School 1 page (Binned)
Under 20 % within page (Binned) 84.6% 15.4% .0% 100.0%

213
% within pq6.2 45.8% 28.6% .0% 39.4% Count 3 1 1 5
% within page (Binned) 60.0% 20.0% 20.0% 100.0%
Older than 20
% within pq6.2 12.5% 14.3% 50.0% 15.2% Count 24 7 2 33
% within page (Binned) 72.7% 21.2% 6.1% 100.0%
Total
% within pq6.2 100.0% 100.0% 100.0% 100.0% Count 19 5 5 29
% within page (Binned) 65.5% 17.2% 17.2% 100.0%
Under 16
% within pq6.2 100.0% 100.0% 83.3% 96.7% Count 0 0 1 1
% within page (Binned) .0% .0% 100.0% 100.0%
page (Binned)
Under 18
% within pq6.2 .0% .0% 16.7% 3.3% Count 19 5 6 30
% within page (Binned) 63.3% 16.7% 20.0% 100.0%
School 2
Total
% within pq6.2 100.0% 100.0% 100.0% 100.0% Count 25 2 5 32
% within page (Binned) 78.1% 6.3% 15.6% 100.0% page
(Binned) Under 16
% within pq6.2 100.0% 100.0% 100.0% 100.0% Count 25 2 5 32
% within page (Binned) 78.1% 6.3% 15.6% 100.0%
School 3
Total
% within pq6.2 100.0% 100.0% 100.0% 100.0% Count 19 1 4 24
% within page (Binned) 79.2% 4.2% 16.7% 100.0%
Under 16
% within pq6.2 79.2% 50.0% 100.0% 80.0% Count 4 1 0 5
% within page (Binned) 80.0% 20.0% .0% 100.0% Under 18
% within pq6.2 16.7% 50.0% .0% 16.7% Count 1 0 0 1
% within page (Binned) 100.0% .0% .0% 100.0%
page (Binned)
Under 20
% within pq6.2 4.2% .0% .0% 3.3% Count 24 2 4 30
% within page (Binned) 80.0% 6.7% 13.3% 100.0%
School 4
Total
% within pq6.2 100.0% 100.0% 100.0% 100.0% Count 11 6 2 19
% within page (Binned) 57.9% 31.6% 10.5% 100.0%
Under 16
% within pq6.2 78.6% 85.7% 100.0% 82.6% Count 3 1 0 4
% within page (Binned) 75.0% 25.0% .0% 100.0%
page (Binned)
Under 18
% within pq6.2 21.4% 14.3% .0% 17.4% Count 14 7 2 23
% within page (Binned) 60.9% 30.4% 8.7% 100.0%
School 5
Total
% within pq6.2 100.0% 100.0% 100.0% 100.0% Count 6 1 5 12
% within page (Binned) 50.0% 8.3% 41.7% 100.0%
Under 16
% within pq6.2 85.7% 100.0% 62.5% 75.0% Count 1 0 3 4
% within page (Binned) 25.0% .0% 75.0% 100.0%
page (Binned)
Under 18
% within pq6.2 14.3% .0% 37.5% 25.0% Count 7 1 8 16
% within page (Binned) 43.8% 6.3% 50.0% 100.0%
School 6
Total
% within pq6.2 100.0% 100.0% 100.0% 100.0% Question 6.3 – Pre-test
Crosstab

214
q6.3 Total
school Yes No Uncertain Yes Count 6 1 7
% within page (Binned) 85.7% 14.3% 100.0%
Under 16
% within q6.3 20.0% 33.3% 21.2% Count 8 0 8
% within page (Binned) 100.0% .0% 100.0%
Under 18
% within q6.3 26.7% .0% 24.2% Count 12 1 13
% within page (Binned) 92.3% 7.7% 100.0%
Under 20
% within q6.3 40.0% 33.3% 39.4% Count 4 1 5
% within page (Binned) 80.0% 20.0% 100.0%
page (Binned)
Older than 20
% within q6.3 13.3% 33.3% 15.2% Count 30 3 33
% within page (Binned) 90.9% 9.1% 100.0%
School 1
Total
% within q6.3 100.0% 100.0% 100.0% Count 26 1 2 29
% within page (Binned) 89.7% 3.4% 6.9% 100.0%
Under 16
% within q6.3 96.3% 100.0% 100.0% 96.7% Count 1 0 0 1
% within page (Binned) 100.0% .0% .0% 100.0%
page (Binned)
Under 18
% within q6.3 3.7% .0% .0% 3.3% Count 27 1 2 30
% within page (Binned) 90.0% 3.3% 6.7% 100.0%
School 2
Total
% within q6.3 100.0% 100.0% 100.0% 100.0% Count 29 1 2 32
% within page (Binned) 90.6% 3.1% 6.3% 100.0% page
(Binned) Under 16
% within q6.3 100.0% 100.0% 100.0% 100.0% Count 29 1 2 32
% within page (Binned) 90.6% 3.1% 6.3% 100.0%
School 3
Total
% within q6.3 100.0% 100.0% 100.0% 100.0% Count 24 24
% within page (Binned) 100.0% 100.0%
Under 16
% within q6.3 80.0% 80.0% Count 5 5
% within page (Binned) 100.0% 100.0% Under 18
% within q6.3 16.7% 16.7% Count 1 1
% within page (Binned) 100.0% 100.0%
page (Binned)
Under 20
% within q6.3 3.3% 3.3% Count 30 30
% within page (Binned) 100.0% 100.0%
School 4
Total
% within q6.3 100.0% 100.0% Count 17 2 19
% within page (Binned) 89.5% 10.5% 100.0%
Under 16
% within q6.3 81.0% 100.0% 82.6% Count 4 0 4
% within page (Binned) 100.0% .0% 100.0%
page (Binned)
Under 18
% within q6.3 19.0% .0% 17.4% Count 21 2 23
% within page (Binned) 91.3% 8.7% 100.0%
School 5
Total
% within q6.3 100.0% 100.0% 100.0% School 6 page Under 16 Count 12 0 12

215
% within page (Binned) 100.0% .0% 100.0% % within q6.3 80.0% .0% 75.0%
Count 3 1 4 % within page (Binned) 75.0% 25.0% 100.0%
(Binned)
Under 18
% within q6.3 20.0% 100.0% 25.0% Count 15 1 16
% within page (Binned) 93.8% 6.3% 100.0%
Total
% within q6.3 100.0% 100.0% 100.0%
Question 6.3 – Post-test
Crosstab
pq6.3 Total
school Yes No Uncertain Yes Count 5 1 1 7
% within page (Binned) 71.4% 14.3% 14.3% 100.0%
Under 16
% within pq6.3 17.2% 100.0% 33.3% 21.2% Count 7 0 1 8
% within page (Binned) 87.5% .0% 12.5% 100.0%
Under 18
% within pq6.3 24.1% .0% 33.3% 24.2% Count 13 0 0 13
% within page (Binned) 100.0% .0% .0% 100.0%
Under 20
% within pq6.3 44.8% .0% .0% 39.4% Count 4 0 1 5
% within page (Binned) 80.0% .0% 20.0% 100.0%
page (Binned)
Older than 20
% within pq6.3 13.8% .0% 33.3% 15.2% Count 29 1 3 33
% within page (Binned) 87.9% 3.0% 9.1% 100.0%
School 1
Total
% within pq6.3 100.0% 100.0% 100.0% 100.0% Count 23 2 4 29
% within page (Binned) 79.3% 6.9% 13.8% 100.0%
Under 16
% within pq6.3 95.8% 100.0% 100.0% 96.7% Count 1 0 0 1
% within page (Binned) 100.0% .0% .0% 100.0%
page (Binned)
Under 18
% within pq6.3 4.2% .0% .0% 3.3% Count 24 2 4 30
% within page (Binned) 80.0% 6.7% 13.3% 100.0%
School 2
Total
% within pq6.3 100.0% 100.0% 100.0% 100.0% Count 30 1 1 32
% within page (Binned) 93.8% 3.1% 3.1% 100.0% page
(Binned) Under 16
% within pq6.3 100.0% 100.0% 100.0% 100.0% Count 30 1 1 32
% within page (Binned) 93.8% 3.1% 3.1% 100.0%
School 3
Total
% within pq6.3 100.0% 100.0% 100.0% 100.0% Count 24 24
% within page (Binned) 100.0% 100.0%
Under 16
% within pq6.3 80.0% 80.0% Count 5 5
% within page (Binned) 100.0% 100.0% Under 18
% within pq6.3 16.7% 16.7% Count 1 1
% within page (Binned) 100.0% 100.0%
School 4 page (Binned)
Under 20
% within pq6.3 3.3% 3.3%

216
Count 30 30 % within page (Binned) 100.0% 100.0%
Total
% within pq6.3 100.0% 100.0% Count 18 1 19
% within page (Binned) 94.7% 5.3% 100.0%
Under 16
% within pq6.3 81.8% 100.0% 82.6% Count 4 0 4
% within page (Binned) 100.0% .0% 100.0%
page (Binned)
Under 18
% within pq6.3 18.2% .0% 17.4% Count 22 1 23
% within page (Binned) 95.7% 4.3% 100.0%
School 5
Total
% within pq6.3 100.0% 100.0% 100.0% Count 12 12
% within page (Binned) 100.0% 100.0%
Under 16
% within pq6.3 75.0% 75.0% Count 4 4
% within page (Binned) 100.0% 100.0%
page (Binned)
Under 18
% within pq6.3 25.0% 25.0% Count 16 16
% within page (Binned) 100.0% 100.0%
School 6
Total
% within pq6.3 100.0% 100.0% Question 6.4 – Pre-test
Crosstab
q6.4 Total
school Yes No Uncertain Yes Count 0 7 0 7
% within page (Binned) .0% 100.0% .0% 100.0%
Under 16
% within q6.4 .0% 58.3% .0% 21.9% Count 4 2 1 7
% within page (Binned) 57.1% 28.6% 14.3% 100.0%
Under 18
% within q6.4 25.0% 16.7% 25.0% 21.9% Count 9 2 2 13
% within page (Binned) 69.2% 15.4% 15.4% 100.0%
Under 20
% within q6.4 56.3% 16.7% 50.0% 40.6% Count 3 1 1 5
% within page (Binned) 60.0% 20.0% 20.0% 100.0%
page (Binned)
Older than 20
% within q6.4 18.8% 8.3% 25.0% 15.6% Count 16 12 4 32
% within page (Binned) 50.0% 37.5% 12.5% 100.0%
School 1
Total
% within q6.4 100.0% 100.0% 100.0% 100.0% Count 5 18 6 29
% within page (Binned) 17.2% 62.1% 20.7% 100.0%
Under 16
% within q6.4 100.0% 100.0% 85.7% 96.7% Count 0 0 1 1
% within page (Binned) .0% .0% 100.0% 100.0%
page (Binned)
Under 18
% within q6.4 .0% .0% 14.3% 3.3% Count 5 18 7 30
% within page (Binned) 16.7% 60.0% 23.3% 100.0%
School 2
Total
% within q6.4 100.0% 100.0% 100.0% 100.0% Count 26 2 4 32
% within page (Binned) 81.3% 6.3% 12.5% 100.0% School 3 page
(Binned) Under 16
% within q6.4 100.0% 100.0% 100.0% 100.0%

217
Count 26 2 4 32 % within page (Binned) 81.3% 6.3% 12.5% 100.0%
Total
% within q6.4 100.0% 100.0% 100.0% 100.0% Count 13 9 2 24
% within page (Binned) 54.2% 37.5% 8.3% 100.0%
Under 16
% within q6.4 86.7% 75.0% 66.7% 80.0% Count 2 2 1 5
% within page (Binned) 40.0% 40.0% 20.0% 100.0% Under 18
% within q6.4 13.3% 16.7% 33.3% 16.7% Count 0 1 0 1
% within page (Binned) .0% 100.0% .0% 100.0%
page (Binned)
Under 20
% within q6.4 .0% 8.3% .0% 3.3% Count 15 12 3 30
% within page (Binned) 50.0% 40.0% 10.0% 100.0%
School 4
Total
% within q6.4 100.0% 100.0% 100.0% 100.0% Count 15 4 19
% within page (Binned) 78.9% 21.1% 100.0%
Under 16
% within q6.4 78.9% 100.0% 82.6% Count 4 0 4
% within page (Binned) 100.0% .0% 100.0%
page (Binned)
Under 18
% within q6.4 21.1% .0% 17.4% Count 19 4 23
% within page (Binned) 82.6% 17.4% 100.0%
School 5
Total
% within q6.4 100.0% 100.0% 100.0% Count 8 2 2 12
% within page (Binned) 66.7% 16.7% 16.7% 100.0%
Under 16
% within q6.4 72.7% 66.7% 100.0% 75.0% Count 3 1 0 4
% within page (Binned) 75.0% 25.0% .0% 100.0%
page (Binned)
Under 18
% within q6.4 27.3% 33.3% .0% 25.0% Count 11 3 2 16
% within page (Binned) 68.8% 18.8% 12.5% 100.0%
School 6
Total
% within q6.4 100.0% 100.0% 100.0% 100.0%
Question 6.4 – Post-test
Crosstab
pq6.4 Total
school Yes No Uncertain Yes Count 4 3 0 7
% within page (Binned) 57.1% 42.9% .0% 100.0%
Under 16
% within pq6.4 20.0% 30.0% .0% 21.2% Count 5 1 2 8
% within page (Binned) 62.5% 12.5% 25.0% 100.0%
Under 18
% within pq6.4 25.0% 10.0% 66.7% 24.2% Count 7 5 1 13
% within page (Binned) 53.8% 38.5% 7.7% 100.0%
Under 20
% within pq6.4 35.0% 50.0% 33.3% 39.4% Count 4 1 0 5
% within page (Binned) 80.0% 20.0% .0% 100.0%
page (Binned)
Older than 20
% within pq6.4 20.0% 10.0% .0% 15.2%
School 1
Total Count 20 10 3 33

218
% within page (Binned) 60.6% 30.3% 9.1% 100.0% % within pq6.4 100.0% 100.0% 100.0% 100.0%
Count 11 13 5 29 % within page (Binned) 37.9% 44.8% 17.2% 100.0%
Under 16
% within pq6.4 100.0% 100.0% 83.3% 96.7% Count 0 0 1 1
% within page (Binned) .0% .0% 100.0% 100.0%
page (Binned)
Under 18
% within pq6.4 .0% .0% 16.7% 3.3% Count 11 13 6 30
% within page (Binned) 36.7% 43.3% 20.0% 100.0%
School 2
Total
% within pq6.4 100.0% 100.0% 100.0% 100.0% Count 24 2 5 31
% within page (Binned) 77.4% 6.5% 16.1% 100.0% page
(Binned) Under 16
% within pq6.4 100.0% 100.0% 100.0% 100.0% Count 24 2 5 31
% within page (Binned) 77.4% 6.5% 16.1% 100.0%
School 3
Total
% within pq6.4 100.0% 100.0% 100.0% 100.0% Count 13 5 6 24
% within page (Binned) 54.2% 20.8% 25.0% 100.0%
Under 16
% within pq6.4 76.5% 71.4% 100.0% 80.0% Count 4 1 0 5
% within page (Binned) 80.0% 20.0% .0% 100.0% Under 18
% within pq6.4 23.5% 14.3% .0% 16.7% Count 0 1 0 1
% within page (Binned) .0% 100.0% .0% 100.0%
page (Binned)
Under 20
% within pq6.4 .0% 14.3% .0% 3.3% Count 17 7 6 30
% within page (Binned) 56.7% 23.3% 20.0% 100.0%
School 4
Total
% within pq6.4 100.0% 100.0% 100.0% 100.0% Count 15 3 1 19
% within page (Binned) 78.9% 15.8% 5.3% 100.0%
Under 16
% within pq6.4 78.9% 100.0% 100.0% 82.6% Count 4 0 0 4
% within page (Binned) 100.0% .0% .0% 100.0%
page (Binned)
Under 18
% within pq6.4 21.1% .0% .0% 17.4% Count 19 3 1 23
% within page (Binned) 82.6% 13.0% 4.3% 100.0%
School 5
Total
% within pq6.4 100.0% 100.0% 100.0% 100.0% Count 7 4 1 12
% within page (Binned) 58.3% 33.3% 8.3% 100.0%
Under 16
% within pq6.4 77.8% 80.0% 50.0% 75.0% Count 2 1 1 4
% within page (Binned) 50.0% 25.0% 25.0% 100.0%
page (Binned)
Under 18
% within pq6.4 22.2% 20.0% 50.0% 25.0% Count 9 5 2 16
% within page (Binned) 56.3% 31.3% 12.5% 100.0%
School 6
Total
% within pq6.4 100.0% 100.0% 100.0% 100.0%
Question 6.5 – Pre-test Crosstab
q6.5 Total
school Yes No Uncertain Yes School 1 page Under 16 Count 7 7

219
% within page (Binned) 100.0% 100.0% % within q6.5 21.2% 21.2%
Count 8 8 % within page (Binned) 100.0% 100.0%
Under 18
% within q6.5 24.2% 24.2% Count 13 13
% within page (Binned) 100.0% 100.0%
Under 20
% within q6.5 39.4% 39.4% Count 5 5
% within page (Binned) 100.0% 100.0%
(Binned)
Older than 20
% within q6.5 15.2% 15.2% Count 33 33
% within page (Binned) 100.0% 100.0%
Total
% within q6.5 100.0% 100.0% Count 26 2 1 29
% within page (Binned) 89.7% 6.9% 3.4% 100.0%
Under 16
% within q6.5 96.3% 100.0% 100.0% 96.7% Count 1 0 0 1
% within page (Binned) 100.0% .0% .0% 100.0%
page (Binned)
Under 18
% within q6.5 3.7% .0% .0% 3.3% Count 27 2 1 30
% within page (Binned) 90.0% 6.7% 3.3% 100.0%
School 2
Total
% within q6.5 100.0% 100.0% 100.0% 100.0% Count 31 1 32
% within page (Binned) 96.9% 3.1% 100.0% page
(Binned) Under 16
% within q6.5 100.0% 100.0% 100.0% Count 31 1 32
% within page (Binned) 96.9% 3.1% 100.0%
School 3
Total
% within q6.5 100.0% 100.0% 100.0% Count 23 23
% within page (Binned) 100.0% 100.0%
Under 16
% within q6.5 79.3% 79.3% Count 5 5
% within page (Binned) 100.0% 100.0% Under 18
% within q6.5 17.2% 17.2% Count 1 1
% within page (Binned) 100.0% 100.0%
page (Binned)
Under 20
% within q6.5 3.4% 3.4% Count 29 29
% within page (Binned) 100.0% 100.0%
School 4
Total
% within q6.5 100.0% 100.0% Count 18 1 19
% within page (Binned) 94.7% 5.3% 100.0%
Under 16
% within q6.5 81.8% 100.0% 82.6% Count 4 0 4
% within page (Binned) 100.0% .0% 100.0%
page (Binned)
Under 18
% within q6.5 18.2% .0% 17.4% Count 22 1 23
% within page (Binned) 95.7% 4.3% 100.0%
School 5
Total
% within q6.5 100.0% 100.0% 100.0% Count 12 12
% within page (Binned) 100.0% 100.0%
Under 16
% within q6.5 75.0% 75.0%
School 6 page (Binned)
Under 18 Count 4 4

220
% within page (Binned) 100.0% 100.0% % within q6.5 25.0% 25.0%
Count 16 16 % within page (Binned) 100.0% 100.0%
Total
% within q6.5 100.0% 100.0%
Question 6.5 – Post-test
Crosstab
pq6.5 Total
school Yes No Uncertain Yes Count 7 0 7
% within page (Binned) 100.0% .0% 100.0%
Under 16
% within pq6.5 21.9% .0% 21.2% Count 8 0 8
% within page (Binned) 100.0% .0% 100.0%
Under 18
% within pq6.5 25.0% .0% 24.2% Count 12 1 13
% within page (Binned) 92.3% 7.7% 100.0%
Under 20
% within pq6.5 37.5% 100.0% 39.4% Count 5 0 5
% within page (Binned) 100.0% .0% 100.0%
page (Binned)
Older than 20
% within pq6.5 15.6% .0% 15.2% Count 32 1 33
% within page (Binned) 97.0% 3.0% 100.0%
School 1
Total
% within pq6.5 100.0% 100.0% 100.0% Count 29 29
% within page (Binned) 100.0% 100.0%
Under 16
% within pq6.5 96.7% 96.7% Count 1 1
% within page (Binned) 100.0% 100.0%
page (Binned)
Under 18
% within pq6.5 3.3% 3.3% Count 30 30
% within page (Binned) 100.0% 100.0%
School 2
Total
% within pq6.5 100.0% 100.0% Count 32 32
% within page (Binned) 100.0% 100.0% page
(Binned) Under 16
% within pq6.5 100.0% 100.0% Count 32 32
% within page (Binned) 100.0% 100.0%
School 3
Total
% within pq6.5 100.0% 100.0% Count 24 24
% within page (Binned) 100.0% 100.0%
Under 16
% within pq6.5 80.0% 80.0% Count 5 5
% within page (Binned) 100.0% 100.0% Under 18
% within pq6.5 16.7% 16.7% Count 1 1
% within page (Binned) 100.0% 100.0%
page (Binned)
Under 20
% within pq6.5 3.3% 3.3% Count 30 30
% within page (Binned) 100.0% 100.0%
School 4
Total
% within pq6.5 100.0% 100.0%

221
Count 18 1 19 % within page (Binned) 94.7% 5.3% 100.0%
Under 16
% within pq6.5 81.8% 100.0% 82.6% Count 4 0 4
% within page (Binned) 100.0% .0% 100.0%
page (Binned)
Under 18
% within pq6.5 18.2% .0% 17.4% Count 22 1 23
% within page (Binned) 95.7% 4.3% 100.0%
School 5
Total
% within pq6.5 100.0% 100.0% 100.0% Count 12 12
% within page (Binned) 100.0% 100.0%
Under 16
% within pq6.5 75.0% 75.0% Count 4 4
% within page (Binned) 100.0% 100.0%
page (Binned)
Under 18
% within pq6.5 25.0% 25.0% Count 16 16
% within page (Binned) 100.0% 100.0%
School 6
Total
% within pq6.5 100.0% 100.0%
Question 7 – Pre-test
Crosstab
q7 Total
school 0 Most 9 0 Count 5 1 1 7
% within page (Binned) 71.4% 14.3% 14.3% 100.0%
Under 16
% within q7 27.8% 50.0% 7.7% 21.2% Count 6 0 2 8
% within page (Binned) 75.0% .0% 25.0% 100.0%
Under 18
% within q7 33.3% .0% 15.4% 24.2% Count 7 1 5 13
% within page (Binned) 53.8% 7.7% 38.5% 100.0%
Under 20
% within q7 38.9% 50.0% 38.5% 39.4% Count 0 0 5 5
% within page (Binned) .0% .0% 100.0% 100.0%
page (Binned)
Older than 20
% within q7 .0% .0% 38.5% 15.2% Count 18 2 13 33
% within page (Binned) 54.5% 6.1% 39.4% 100.0%
School 1
Total
% within q7 100.0% 100.0% 100.0% 100.0% Count 17 3 9 29
% within page (Binned) 58.6% 10.3% 31.0% 100.0%
Under 16
% within q7 94.4% 100.0% 100.0% 96.7% Count 1 0 0 1
% within page (Binned) 100.0% .0% .0% 100.0%
page (Binned)
Under 18
% within q7 5.6% .0% .0% 3.3% Count 18 3 9 30
% within page (Binned) 60.0% 10.0% 30.0% 100.0%
School 2
Total
% within q7 100.0% 100.0% 100.0% 100.0% Count 25 1 6 32
% within page (Binned) 78.1% 3.1% 18.8% 100.0% School 3 page
(Binned) Under 16
% within q7 100.0% 100.0% 100.0% 100.0%

222
Count 25 1 6 32 % within page (Binned) 78.1% 3.1% 18.8% 100.0%
Total
% within q7 100.0% 100.0% 100.0% 100.0% Count 13 2 9 24
% within page (Binned) 54.2% 8.3% 37.5% 100.0%
Under 16
% within q7 86.7% 66.7% 75.0% 80.0% Count 1 1 3 5
% within page (Binned) 20.0% 20.0% 60.0% 100.0% Under 18
% within q7 6.7% 33.3% 25.0% 16.7% Count 1 0 0 1
% within page (Binned) 100.0% .0% .0% 100.0%
page (Binned)
Under 20
% within q7 6.7% .0% .0% 3.3% Count 15 3 12 30
% within page (Binned) 50.0% 10.0% 40.0% 100.0%
School 4
Total
% within q7 100.0% 100.0% 100.0% 100.0% Count 8 11 19
% within page (Binned) 42.1% 57.9% 100.0%
Under 16
% within q7 80.0% 84.6% 82.6% Count 2 2 4
% within page (Binned) 50.0% 50.0% 100.0%
page (Binned)
Under 18
% within q7 20.0% 15.4% 17.4% Count 10 13 23
% within page (Binned) 43.5% 56.5% 100.0%
School 5
Total
% within q7 100.0% 100.0% 100.0% Count 7 3 2 12
% within page (Binned) 58.3% 25.0% 16.7% 100.0%
Under 16
% within q7 100.0% 50.0% 66.7% 75.0% Count 0 3 1 4
% within page (Binned) .0% 75.0% 25.0% 100.0%
page (Binned)
Under 18
% within q7 .0% 50.0% 33.3% 25.0% Count 7 6 3 16
% within page (Binned) 43.8% 37.5% 18.8% 100.0%
School 6
Total
% within q7 100.0% 100.0% 100.0% 100.0% .
Question 7 – Post-test Crosstab
pq7 Total
school 0 Most 9 0 Count 4 1 2 7
% within page (Binned) 57.1% 14.3% 28.6% 100.0%
Under 16
% within pq7 28.6% 33.3% 12.5% 21.2% Count 6 1 1 8
% within page (Binned) 75.0% 12.5% 12.5% 100.0%
Under 18
% within pq7 42.9% 33.3% 6.3% 24.2% Count 4 0 9 13
% within page (Binned) 30.8% .0% 69.2% 100.0%
Under 20
% within pq7 28.6% .0% 56.3% 39.4% Count 0 1 4 5
% within page (Binned) .0% 20.0% 80.0% 100.0%
page (Binned)
Older than 20
% within pq7 .0% 33.3% 25.0% 15.2%
School 1
Total Count 14 3 16 33

223
% within page (Binned) 42.4% 9.1% 48.5% 100.0% % within pq7 100.0% 100.0% 100.0% 100.0%
Count 19 1 9 29 % within page (Binned) 65.5% 3.4% 31.0% 100.0%
Under 16
% within pq7 95.0% 100.0% 100.0% 96.7% Count 1 0 0 1
% within page (Binned) 100.0% .0% .0% 100.0%
page (Binned)
Under 18
% within pq7 5.0% .0% .0% 3.3% Count 20 1 9 30
% within page (Binned) 66.7% 3.3% 30.0% 100.0%
School 2
Total
% within pq7 100.0% 100.0% 100.0% 100.0% Count 21 1 10 32
% within page (Binned) 65.6% 3.1% 31.3% 100.0% page
(Binned) Under 16
% within pq7 100.0% 100.0% 100.0% 100.0% Count 21 1 10 32
% within page (Binned) 65.6% 3.1% 31.3% 100.0%
School 3
Total
% within pq7 100.0% 100.0% 100.0% 100.0% Count 12 0 12 24
% within page (Binned) 50.0% .0% 50.0% 100.0%
Under 16
% within pq7 80.0% .0% 85.7% 80.0% Count 2 1 2 5
% within page (Binned) 40.0% 20.0% 40.0% 100.0% Under 18
% within pq7 13.3% 100.0% 14.3% 16.7% Count 1 0 0 1
% within page (Binned) 100.0% .0% .0% 100.0%
page (Binned)
Under 20
% within pq7 6.7% .0% .0% 3.3% Count 15 1 14 30
% within page (Binned) 50.0% 3.3% 46.7% 100.0%
School 4
Total
% within pq7 100.0% 100.0% 100.0% 100.0% Count 8 3 8 19
% within page (Binned) 42.1% 15.8% 42.1% 100.0%
Under 16
% within pq7 80.0% 75.0% 88.9% 82.6% Count 2 1 1 4
% within page (Binned) 50.0% 25.0% 25.0% 100.0%
page (Binned)
Under 18
% within pq7 20.0% 25.0% 11.1% 17.4% Count 10 4 9 23
% within page (Binned) 43.5% 17.4% 39.1% 100.0%
School 5
Total
% within pq7 100.0% 100.0% 100.0% 100.0% Count 6 0 6 12
% within page (Binned) 50.0% .0% 50.0% 100.0%
Under 16
% within pq7 100.0% .0% 66.7% 75.0% Count 0 1 3 4
% within page (Binned) .0% 25.0% 75.0% 100.0%
page (Binned)
Under 18
% within pq7 .0% 100.0% 33.3% 25.0% Count 6 1 9 16
% within page (Binned) 37.5% 6.3% 56.3% 100.0%
School 6
Total
% within pq7 100.0% 100.0% 100.0% 100.0%
Question 8 – Pre-test Crosstab
q8 Total
school 0 Most Some None 4 0 School 1 page Under 16 Count 2 3 2 0 0 7

224
% within page (Binned) 28.6% 42.9% 28.6% .0% .0% 100.0%
% within q8 50.0% 30.0% 25.0% .0% .0% 21.2% Count 1 0 2 2 3 8
% within page (Binned) 12.5% .0% 25.0% 25.0% 37.5% 100.0%
Under 18
% within q8 25.0% .0% 25.0% 33.3% 60.0% 24.2% Count 1 5 4 3 0 13
% within page (Binned) 7.7% 38.5% 30.8% 23.1% .0% 100.0%
Under 20
% within q8 25.0% 50.0% 50.0% 50.0% .0% 39.4% Count 0 2 0 1 2 5
% within page (Binned) .0% 40.0% .0% 20.0% 40.0% 100.0%
(Binned)
Older than 20
% within q8 .0% 20.0% .0% 16.7% 40.0% 15.2% Count 4 10 8 6 5 33
% within page (Binned) 12.1% 30.3% 24.2% 18.2% 15.2% 100.0%
Total
% within q8 100.0% 100.0% 100.0% 100.0% 100.0% 100.0% Count 4 21 3 1 29
% within page (Binned) 13.8% 72.4% 10.3% 3.4% 100.0%
Under 16
% within q8 100.0% 100.0% 75.0% 100.0% 96.7% Count 0 0 1 0 1
% within page (Binned) .0% .0% 100.0% .0% 100.0%
page (Binned)
Under 18
% within q8 .0% .0% 25.0% .0% 3.3% Count 4 21 4 1 30
% within page (Binned) 13.3% 70.0% 13.3% 3.3% 100.0%
School 2
Total
% within q8 100.0% 100.0% 100.0% 100.0% 100.0% Count 4 5 9 7 7 32
% within page (Binned) 12.5% 15.6% 28.1% 21.9% 21.9% 100.0%
page (Binned)
Under 16
% within q8 100.0% 100.0% 100.0% 100.0% 100.0% 100.0% Count 4 5 9 7 7 32
% within page (Binned) 12.5% 15.6% 28.1% 21.9% 21.9% 100.0%
School 3
Total
% within q8 100.0% 100.0% 100.0% 100.0% 100.0% 100.0% Count 1 4 11 6 2 24
% within page (Binned) 4.2% 16.7% 45.8% 25.0% 8.3% 100.0%
Under 16
% within q8 33.3% 57.1% 91.7% 100.0% 100.0% 80.0% Count 2 3 0 0 0 5
% within page (Binned) 40.0% 60.0% .0% .0% .0% 100.0%
Under 18
% within q8 66.7% 42.9% .0% .0% .0% 16.7% Count 0 0 1 0 0 1
% within page (Binned) .0% .0% 100.0% .0% .0% 100.0%
page (Binned)
Under 20
% within q8 .0% .0% 8.3% .0% .0% 3.3% Count 3 7 12 6 2 30
% within page (Binned) 10.0% 23.3% 40.0% 20.0% 6.7% 100.0%
School 4
Total
% within q8 100.0% 100.0% 100.0% 100.0% 100.0% 100.0% Count 3 1 8 4 3 19
% within page (Binned) 15.8% 5.3% 42.1% 21.1% 15.8% 100.0%
Under 16
% within q8 75.0% 50.0% 100.0% 66.7% 100.0% 82.6% Count 1 1 0 2 0 4
School 5 page (Binned)
Under 18 % within page
(Binned) 25.0% 25.0% .0% 50.0% .0% 100.0%

225
% within q8 25.0% 50.0% .0% 33.3% .0% 17.4% Count 4 2 8 6 3 23
% within page (Binned) 17.4% 8.7% 34.8% 26.1% 13.0% 100.0%
Total
% within q8 100.0% 100.0% 100.0% 100.0% 100.0% 100.0% Count 4 6 2 12
% within page (Binned) 33.3% 50.0% 16.7% 100.0%
Under 16
% within q8 66.7% 75.0% 100.0% 75.0% Count 2 2 0 4
% within page (Binned) 50.0% 50.0% .0% 100.0%
page (Binned)
Under 18
% within q8 33.3% 25.0% .0% 25.0% Count 6 8 2 16
% within page (Binned) 37.5% 50.0% 12.5% 100.0%
School 6
Total
% within q8 100.0% 100.0% 100.0% 100.0% .
Question 8 – Post-test
Crosstab
pq8 Total
school 0
Bad / Wrong Answer
Fair Answer
Good Answer
Very Good
Answer 0 Count 3 1 2 0 1 7
% within page (Binned) 42.9% 14.3% 28.6% .0% 14.3% 100.0%
Under 16
% within pq8 60.0% 12.5% 18.2% .0% 25.0% 21.2% Count 1 1 3 2 1 8
% within page (Binned) 12.5% 12.5% 37.5% 25.0% 12.5% 100.0%
Under 18
% within pq8 20.0% 12.5% 27.3% 40.0% 25.0% 24.2% Count 1 6 3 2 1 13
% within page (Binned) 7.7% 46.2% 23.1% 15.4% 7.7% 100.0%
Under 20
% within pq8 20.0% 75.0% 27.3% 40.0% 25.0% 39.4% Count 0 0 3 1 1 5
% within page (Binned) .0% .0% 60.0% 20.0% 20.0% 100.0%
page (Binned)
Older than 20
% within pq8 .0% .0% 27.3% 20.0% 25.0% 15.2% Count 5 8 11 5 4 33
% within page (Binned) 15.2% 24.2% 33.3% 15.2% 12.1% 100.0%
School 1
Total
% within pq8 100.0% 100.0% 100.0% 100.0% 100.0% 100.0% Count 2 6 9 11 1 29
% within page (Binned) 6.9% 20.7% 31.0% 37.9% 3.4% 100.0%
Under 16
% within pq8 100.0% 100.0% 90.0% 100.0% 100.0% 96.7% Count 0 0 1 0 0 1
% within page (Binned) .0% .0% 100.0% .0% .0% 100.0%
page (Binned)
Under 18
% within pq8 .0% .0% 10.0% .0% .0% 3.3% Count 2 6 10 11 1 30
% within page (Binned) 6.7% 20.0% 33.3% 36.7% 3.3% 100.0%
School 2
Total
% within pq8 100.0% 100.0% 100.0% 100.0% 100.0% 100.0%
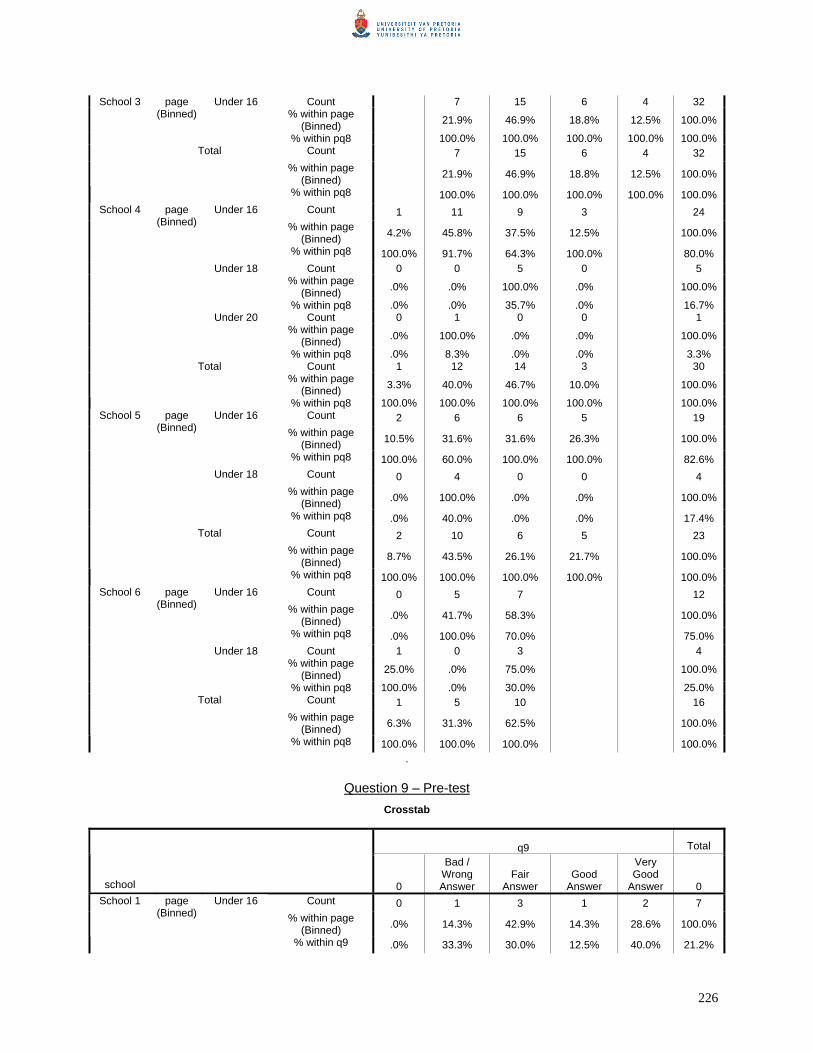
226
Count 7 15 6 4 32 % within page
(Binned) 21.9% 46.9% 18.8% 12.5% 100.0%
page (Binned)
Under 16
% within pq8 100.0% 100.0% 100.0% 100.0% 100.0% Count 7 15 6 4 32
% within page (Binned) 21.9% 46.9% 18.8% 12.5% 100.0%
School 3
Total
% within pq8 100.0% 100.0% 100.0% 100.0% 100.0% Count 1 11 9 3 24
% within page (Binned) 4.2% 45.8% 37.5% 12.5% 100.0%
Under 16
% within pq8 100.0% 91.7% 64.3% 100.0% 80.0% Count 0 0 5 0 5
% within page (Binned) .0% .0% 100.0% .0% 100.0%
Under 18
% within pq8 .0% .0% 35.7% .0% 16.7% Count 0 1 0 0 1
% within page (Binned) .0% 100.0% .0% .0% 100.0%
page (Binned)
Under 20
% within pq8 .0% 8.3% .0% .0% 3.3% Count 1 12 14 3 30
% within page (Binned) 3.3% 40.0% 46.7% 10.0% 100.0%
School 4
Total
% within pq8 100.0% 100.0% 100.0% 100.0% 100.0% Count 2 6 6 5 19
% within page (Binned) 10.5% 31.6% 31.6% 26.3% 100.0%
Under 16
% within pq8 100.0% 60.0% 100.0% 100.0% 82.6% Count 0 4 0 0 4
% within page (Binned) .0% 100.0% .0% .0% 100.0%
page (Binned)
Under 18
% within pq8 .0% 40.0% .0% .0% 17.4% Count 2 10 6 5 23
% within page (Binned) 8.7% 43.5% 26.1% 21.7% 100.0%
School 5
Total
% within pq8 100.0% 100.0% 100.0% 100.0% 100.0% Count 0 5 7 12
% within page (Binned) .0% 41.7% 58.3% 100.0%
Under 16
% within pq8 .0% 100.0% 70.0% 75.0% Count 1 0 3 4
% within page (Binned) 25.0% .0% 75.0% 100.0%
page (Binned)
Under 18
% within pq8 100.0% .0% 30.0% 25.0% Count 1 5 10 16
% within page (Binned) 6.3% 31.3% 62.5% 100.0%
School 6
Total
% within pq8 100.0% 100.0% 100.0% 100.0% .
Question 9 – Pre-test Crosstab
q9 Total
school 0
Bad / Wrong Answer
Fair Answer
Good Answer
Very Good
Answer 0 Count 0 1 3 1 2 7
% within page (Binned) .0% 14.3% 42.9% 14.3% 28.6% 100.0%
School 1 page (Binned)
Under 16
% within q9 .0% 33.3% 30.0% 12.5% 40.0% 21.2%

227
Count 1 2 3 2 0 8 % within page
(Binned) 12.5% 25.0% 37.5% 25.0% .0% 100.0%
Under 18
% within q9 14.3% 66.7% 30.0% 25.0% .0% 24.2% Count 4 0 3 4 2 13
% within page (Binned) 30.8% .0% 23.1% 30.8% 15.4% 100.0%
Under 20
% within q9 57.1% .0% 30.0% 50.0% 40.0% 39.4% Count 2 0 1 1 1 5
% within page (Binned) 40.0% .0% 20.0% 20.0% 20.0% 100.0%
Older than 20
% within q9 28.6% .0% 10.0% 12.5% 20.0% 15.2% Count 7 3 10 8 5 33
% within page (Binned) 21.2% 9.1% 30.3% 24.2% 15.2% 100.0%
Total
% within q9 100.0% 100.0% 100.0% 100.0% 100.0% 100.0% Count 5 1 11 7 5 29
% within page (Binned) 17.2% 3.4% 37.9% 24.1% 17.2% 100.0%
Under 16
% within q9 100.0% 100.0% 100.0% 87.5% 100.0% 96.7% Count 0 0 0 1 0 1
% within page (Binned) .0% .0% .0% 100.0% .0% 100.0%
page (Binned)
Under 18
% within q9 .0% .0% .0% 12.5% .0% 3.3% Count 5 1 11 8 5 30
% within page (Binned) 16.7% 3.3% 36.7% 26.7% 16.7% 100.0%
School 2
Total
% within q9 100.0% 100.0% 100.0% 100.0% 100.0% 100.0% Count 11 16 5 32
% within page (Binned) 34.4% 50.0% 15.6% 100.0%
page (Binned)
Under 16
% within q9 100.0% 100.0% 100.0% 100.0% Count 11 16 5 32
% within page (Binned) 34.4% 50.0% 15.6% 100.0%
School 3
Total
% within q9 100.0% 100.0% 100.0% 100.0% Count 2 14 7 1 24
% within page (Binned) 8.3% 58.3% 29.2% 4.2% 100.0%
Under 16
% within q9 100.0% 73.7% 87.5% 100.0% 80.0% Count 0 4 1 0 5
% within page (Binned) .0% 80.0% 20.0% .0% 100.0%
Under 18
% within q9 .0% 21.1% 12.5% .0% 16.7% Count 0 1 0 0 1
% within page (Binned) .0% 100.0% .0% .0% 100.0%
page (Binned)
Under 20
% within q9 .0% 5.3% .0% .0% 3.3% Count 2 19 8 1 30
% within page (Binned) 6.7% 63.3% 26.7% 3.3% 100.0%
School 4
Total
% within q9 100.0% 100.0% 100.0% 100.0% 100.0% Count 5 1 4 4 5 19
% within page (Binned) 26.3% 5.3% 21.1% 21.1% 26.3% 100.0%
Under 16
% within q9 100.0% 100.0% 57.1% 80.0% 100.0% 82.6% Count 0 0 3 1 0 4
% within page (Binned) .0% .0% 75.0% 25.0% .0% 100.0%
page (Binned)
Under 18
% within q9 .0% .0% 42.9% 20.0% .0% 17.4%
School 5
Total Count 5 1 7 5 5 23

228
% within page (Binned) 21.7% 4.3% 30.4% 21.7% 21.7% 100.0%
% within q9 100.0% 100.0% 100.0% 100.0% 100.0% 100.0% Count 2 1 3 6 12
% within page (Binned) 16.7% 8.3% 25.0% 50.0% 100.0%
Under 16
% within q9 66.7% 100.0% 60.0% 85.7% 75.0% Count 1 0 2 1 4
% within page (Binned) 25.0% .0% 50.0% 25.0% 100.0%
page (Binned)
Under 18
% within q9 33.3% .0% 40.0% 14.3% 25.0% Count 3 1 5 7 16
% within page (Binned) 18.8% 6.3% 31.3% 43.8% 100.0%
School 6
Total
% within q9 100.0% 100.0% 100.0% 100.0% 100.0%
Question 9 – Post-test
Crosstab
pq9 Total
school 0
Bad / Wrong Answer
Fair Answer
Good Answer
Very Good
Answer 0 Count 0 0 5 1 1 7
% within page (Binned) .0% .0% 71.4% 14.3% 14.3% 100.0%
Under 16
% within pq9 .0% .0% 23.8% 16.7% 100.0% 21.2% Count 1 1 4 2 0 8
% within page (Binned) 12.5% 12.5% 50.0% 25.0% .0% 100.0%
Under 18
% within pq9 100.0% 25.0% 19.0% 33.3% .0% 24.2% Count 0 2 9 2 0 13
% within page (Binned) .0% 15.4% 69.2% 15.4% .0% 100.0%
Under 20
% within pq9 .0% 50.0% 42.9% 33.3% .0% 39.4% Count 0 1 3 1 0 5
% within page (Binned) .0% 20.0% 60.0% 20.0% .0% 100.0%
page (Binned)
Older than 20
% within pq9 .0% 25.0% 14.3% 16.7% .0% 15.2% Count 1 4 21 6 1 33
% within page (Binned) 3.0% 12.1% 63.6% 18.2% 3.0% 100.0%
School 1
Total
% within pq9 100.0% 100.0% 100.0% 100.0% 100.0% 100.0% Count 3 2 10 7 7 29
% within page (Binned) 10.3% 6.9% 34.5% 24.1% 24.1% 100.0%
Under 16
% within pq9 100.0% 100.0% 90.9% 100.0% 100.0% 96.7% Count 0 0 1 0 0 1
% within page (Binned) .0% .0% 100.0% .0% .0% 100.0%
page (Binned)
Under 18
% within pq9 .0% .0% 9.1% .0% .0% 3.3% Count 3 2 11 7 7 30
% within page (Binned) 10.0% 6.7% 36.7% 23.3% 23.3% 100.0%
School 2
Total
% within pq9 100.0% 100.0% 100.0% 100.0% 100.0% 100.0% Count 1 7 16 8 32
% within page (Binned) 3.1% 21.9% 50.0% 25.0% 100.0%
School 3 page (Binned)
Under 16
% within pq9 100.0% 100.0% 100.0% 100.0% 100.0%

229
Count 1 7 16 8 32 % within page
(Binned) 3.1% 21.9% 50.0% 25.0% 100.0%
Total
% within pq9 100.0% 100.0% 100.0% 100.0% 100.0% Count 1 5 12 5 1 24
% within page (Binned) 4.2% 20.8% 50.0% 20.8% 4.2% 100.0%
Under 16
% within pq9 100.0% 83.3% 85.7% 62.5% 100.0% 80.0% Count 0 1 1 3 0 5
% within page (Binned) .0% 20.0% 20.0% 60.0% .0% 100.0%
Under 18
% within pq9 .0% 16.7% 7.1% 37.5% .0% 16.7% Count 0 0 1 0 0 1
% within page (Binned) .0% .0% 100.0% .0% .0% 100.0%
page (Binned)
Under 20
% within pq9 .0% .0% 7.1% .0% .0% 3.3% Count 1 6 14 8 1 30
% within page (Binned) 3.3% 20.0% 46.7% 26.7% 3.3% 100.0%
School 4
Total
% within pq9 100.0% 100.0% 100.0% 100.0% 100.0% 100.0% Count 2 3 10 3 1 19
% within page (Binned) 10.5% 15.8% 52.6% 15.8% 5.3% 100.0%
Under 16
% within pq9 100.0% 50.0% 90.9% 100.0% 100.0% 82.6% Count 0 3 1 0 0 4
% within page (Binned) .0% 75.0% 25.0% .0% .0% 100.0%
page (Binned)
Under 18
% within pq9 .0% 50.0% 9.1% .0% .0% 17.4% Count 2 6 11 3 1 23
% within page (Binned) 8.7% 26.1% 47.8% 13.0% 4.3% 100.0%
School 5
Total
% within pq9 100.0% 100.0% 100.0% 100.0% 100.0% 100.0% Count 3 2 7 12
% within page (Binned) 25.0% 16.7% 58.3% 100.0%
Under 16
% within pq9 75.0% 50.0% 87.5% 75.0% Count 1 2 1 4
% within page (Binned) 25.0% 50.0% 25.0% 100.0%
page (Binned)
Under 18
% within pq9 25.0% 50.0% 12.5% 25.0% Count 4 4 8 16
% within page (Binned) 25.0% 25.0% 50.0% 100.0%
School 6
Total
% within pq9 100.0% 100.0% 100.0% 100.0%
230