An Overview of MANETs Simulation Université du Luxembourg Luxembourg
Upload
independentCategory
view
0download
0
The European Comparison of Absolute Gravimeters 2011 (ECAG-2011) in Walferdange,
Luxembourg: results and recommendations
This article has been downloaded from IOPscience. Please scroll down to see the full text article.
2013 Metrologia 50 257
(http://iopscience.iop.org/0026-1394/50/3/257)
Download details:
IP Address: 188.115.47.184
The article was downloaded on 19/05/2013 at 11:22
Please note that terms and conditions apply.
View the table of contents for this issue, or go to the journal homepage for more
Home Search Collections Journals About Contact us My IOPscience

IOP PUBLISHING METROLOGIA
Metrologia 50 (2013) 257–268 doi:10.1088/0026-1394/50/3/257
The European Comparison of AbsoluteGravimeters 2011 (ECAG-2011) inWalferdange, Luxembourg: resultsand recommendationsOlivier Francis1, Henri Baumann2,Tomas Volarik3, Christian Rothleitner1,Gilbert Klein1, Marc Seil1, Nicolas Dando4, Ray Tracey4,Christian Ullrich5, Stefaan Castelein6, Hu Hua7, Wu Kang7,Shen Chongyang8, Xuan Songbo8, Tan Hongbo8, Li Zhengyuan8,Vojtech Palinkas9, Jakub Kostelecky9, Jaakko Makinen10, Jyri Naranen10,Sebastien Merlet11, Tristan Farah11, Christine Guerlin11,Franck Pereira Dos Santos11, Nicolas Le Moigne12, Cedric Champollion12,Sabrina Deville12, Ludger Timmen13, Reinhard Falk14, Herbert Wilmes14,Domenico Iacovone15, Francesco Baccaro15, Alessandro Germak16,Emanuele Biolcati16, Jan Krynski17, Marcin Sekowski17, Tomasz Olszak18,Andrzej Pachuta18, Jonas Agren19, Andreas Engfeldt19, Rene Reudink20,Pedro Inacio20, Daniel McLaughlin21, Geoff Shannon21, Marc Eckl22,Tim Wilkins22, Derek van Westrum23 and Ryan Billson23
1 University of Luxembourg, Luxembourg2 Federal Office of Metrology METAS, Switzerland3 Brno University of Technology, Czech Republic4 Geoscience Australia, Australia5 Federal Office of Metrology and Surveying, Austria6 Royal Observatory of Belgium, Belgium7 Tsinghua University, China8 Institute of Seismology, China Earthquake Administration, China9 Research Institute of Geodesy, Topography and Cartography, Czech Republic10 Finnish Geodetic Institute, Finland11 LNE-SYRTE, France12 Universite de Montpellier 2, France13 Leibniz Universitat Hannover, Germany14 Federal Agency for Cartography and Geodesy (BKG), Germany15 ASI (Agenzia Spaziale Italiana), Italy16 INRIM–Istituto Nazionale di Ricerca Metrologica, Italy17 Institute of Geodesy and Cartography, Poland18 Warsaw University of Technology, Poland19 Lantmateriet—the Swedish mapping, cadastral and land registration, Sweden20 Delft University of Technology, The Netherlands21 National Oceanography Centre, Liverpool, UK22 National Geodetic Survey, USA23 Micro-g LaCoste, USA
E-mail: [email protected]
Received 26 October 2012, in final form 12 April 2013Published 16 May 2013Online at stacks.iop.org/Met/50/257
0026-1394/13/030257+12$33.00 © 2013 BIPM & IOP Publishing Ltd Printed in the UK & the USA 257

O Francis et al
AbstractWe present the results of the third European Comparison of Absolute Gravimeters held inWalferdange, Grand Duchy of Luxembourg, in November 2011. Twenty-two gravimeters fromboth metrological and non-metrological institutes are compared. For the first time, correctionsfor the laser beam diffraction and the self-attraction of the gravimeters are implemented. Thegravity observations are also corrected for geophysical gravity changes that occurred during thecomparison using the observations of a superconducting gravimeter. We show that thesecorrections improve the degree of equivalence between the gravimeters. We present the resultsfor two different combinations of data. In the first one, we use only the observations from themetrological institutes. In the second solution, we include all the data from both metrologicaland non-metrological institutes. Those solutions are then compared with the official result of thecomparison published previously and based on the observations of the metrological institutesand the gravity differences at the different sites as measured by non-metrological institutes.Overall, the absolute gravity meters agree with one another with a standard deviation of3.1 µGal. Finally, the results of this comparison are linked to previous ones. We conclude withsome important recommendations for future comparisons.
(Some figures may appear in colour only in the online journal)
Notation and acronyms
AG absolute gravimeterCCM Consultative Committee for Mass and
Related QuantitiesCRV Comparison Reference ValueCIPM International Committee for Weights
and MeasuresDI Designated InstituteDoE degrees of equivalence (DoE) of the AGECAG European Comparison of Absolute
gravimetersEURAMET European Association of National Metrology
Institutesg free-fall accelerationICAG International Comparison of Absolute
GravimetersKC Key ComparisonKCRV Key Comparison Reference ValueKCDB Key Comparison Data BaseMETAS Federal Institute of Metrology of SwitzerlandMRA Mutual Recognition ArrangementNMI National Metrology InstitutePS Pilot StudySG superconducting gravimeterTP: Technical Protocol1 Gal = 1×10⁻² m s−2
Introduction
In November 2011, the third European Comparison ofAbsolute Gravimeters (ECAG) was held in the UndergroundLaboratory for Geodynamics in Walferdange, Luxembourg.The ECAG-2011 is registered as EURAMET project 1186as well as Key Comparison EURAMET.M.G-K1. It wasorganized by the University of Luxembourg (O Francis) andMETAS (H Baumann) is the Pilot Laboratory.
The key comparison is organized in accordance withdocument CIPM MRA-D-05 (www.bipm.org/en/cipm-mra/).Only National Metrology Institutes (NMI) that are signatoriesof the CIPM Mutual Recognition Arrangement (CIPM MRA)and laboratories officially designated by those institutes(DI) can participate in a Key Comparison (KC). Theirmeasurements contribute to the evaluation of the KCRVs(Key Comparison Reference Values) and their degrees ofequivalence (DoE) (metrological terminology for bias) arepublished in the Key Comparison Data Base (KCDB)(http://kcdb.bipm.org/). Non-designated institutes alsoparticipated in the comparison. Their results will be includedin the Pilot Study (PS) but not in the KC. According tothe rules, the results of EURAMET.M.G-K1 are linked tothe KCRV of the corresponding KC organized by a CIPMConsultative Committee, in this case to CCM.G-K1 organizedwithin the Consultative Committee for Mass and RelatedQuantities (CCM).
Absolute gravimeters are used in geophysics formonitoring gravity variations due to mass changes withinthe Earth (i.e. the motion of magma underneath volcanoes),mass changes within the Earth’s upper layers (i.e. the seasonalvariations of continental water storage that might be related toglobal warming), density changes and vertical displacementcaused by deformations of the Earth’s crust (i.e. tectonicdeformations associated with the build-up and release of strainduring an earthquake). In most applications, geophysicistsare interested more in the gravity change over decades than inthe actual gravity value. For these, the reproducibility andrepeatability of the measurements of the gravity meter arecritical. In metrology, absolute gravimeters are used in thedetermination of standards derived from the kilogram (ampere,pressure, force) and for the watt balance. The primary goal isto meet requirements of the MRA by quantitative measures ofthe degree of equivalence of national standards for gravitationalacceleration. These applications require the actual value of g.
Comparisons are indispensable to monitor if theinstruments are operating properly and to ensure the
258 Metrologia, 50 (2013) 257–268

The European Comparison of Absolute Gravimeters 2011 (ECAG-2011)
Table 1. Participants in ECAG-2011 (NMI = National Metrology Institutes; DI = Designated Institutes).
# Country Institution Gravimeter NMI or DI
1 Australia Geoscience Australia FG5-237 NO2 Austria Federal Office of Metrology and Surveying (BEV) FG5-242 YES3 Belgium Royal Observatory of Belgium FG5-202 NO4 China Tsinghua University T1 NO5 China Institute of Seismology, China Earthquake Administration, Wuhan FG5-232 NO6 Czech Republic Research Institute of Geodesy, Topography and Cartography FG5-215 YES7 Finland Finnish Geodetic Institute FG5-221 YES8 France LNE-SYRTE CAG-1 YES9 France Universite de Montpellier 2 FG5-228 NO
10 Germany Leibniz Universitat Hannover FG5-220 NO11 Germany Federal Agency for Cartography and Geodesy (BKG) FG5-301 NO12 Italy ASI (Agenzia Spaziale Italiana) FG5-218 NO13 Italy INRIM—Istituto Nazionale di Ricerca Metrologica IMGC-02 YES14 Luxembourg University of Luxembourg FG5X-216 NO15 Poland Institute of Geodesy and Cartography A10-020 NO16 Poland Warsaw University of Technology FG5-230 NO17 Sweden Lantmateriet—the Swedish mapping, cadastral and land registration authority FG5-233 NO18 Switzerland METAS FG5-209 YES19 The Netherlands Delft University of Technology FG5-234 NO20 United Kingdom National Oceanography Centre—Liverpool FG5-103 NO21 USA National Geodetic Survey FG5-102 NO22 USA Micro-g LaCoste FG5X-302 NO
consistency of the observations especially if differentgravimeters are used for the same project at different epochs.They must be regularly compared with other instruments of thesame accuracy and different types that could reveal systematicerrors. The gravimeter itself cannot be calibrated againstknown g-values as there is no other independent techniqueto measure g than using the absolute gravimeters themselves.However, some of their components (such as the atomic clockor the laser) can be calibrated by comparison with knownstandards.
During a comparison, the accuracy of the gravimeterscannot be estimated as there is no other way than usingthe observations of the gravimeters themselves to know thetrue value of g. This type of comparison allows us todetermine the relative bias (or degree of equivalence) betweeninstruments. This means that all instruments can suffer fromthe same unknown and undetectable systematic error. Clearly,differences larger than the uncertainty of the measurements arean indication of possible systematic errors.
Before the comparison, the Technical Protocol (TP) basedon the document of the ICAG-2009 (http://kcdb.bipm.org/AppendixB/appBresults/CCM.G-K1/CCM.G-K1 Technicalprotocol.pdf) was presented to the participants. This importantdocument includes the list of the registered participants, a de-scription of the comparison site, the timetable of the measure-ments, and a standardized Excel table to express the uncertaintyof the gravimeters. The TP also specifies the data processingas well as the reporting of the results. The final version of theTP was approved by all the participants on 15 September 2011.
During the comparison, the opportunity to check thelaser calibration was offered to the participants. Five teamsrequested such a calibration. Their lasers were compared withthe backup laser of the University of Luxembourg. As notraceability has been ensured, the results have been presented
only to the operators of the lasers. They are not included inthis report.
This report is an extended version of the report publishedin the Technical Supplement of Metrologia on the KeyComparison results only (Francis et al 2012). This firstreport contains a description of the Walferdange UndergroundLaboratory for Geodynamics (WULG) where the comparisontook place, the measurement strategy, a discussion on the self-attraction and laser beam diffraction corrections as well as thedata processing. In this paper, the results including all thegravimeters in the KC and PS are presented and discussed. Inthe conclusion, we also propose some recommendations forfuture comparisons.
1. Participants
ECAG-2011 is a regional comparison. Most of the participants(table 1) come from European Institutes. However, somenon-European teams took part in the comparison to establisha link with other regional comparisons organized in otherparts of the world. Twenty-two absolute gravimeters of sixdifferent types were compared: mostly FG5 (including thenew model FG5X) free-fall gravimeters (Niebauer et al 2011),one atomic gravimeter (CAG-1) (Louchet-Chauvet et al 2011),one rise-and-fall gravimeter (IMGC-02) (D’Agostino et al2008) and a new free-fall prototype from China (T1) (Hu et al2012). Overall, only six teams come from National MetrologyInstitutes (NMI) or Designated Institutes (DI).
2. Raw absolute gravity measurements
In figure 1, the raw measurements or g-values are plottedfor all the gravimeters at all the stations. The table withthe AG measurements can be found in Francis et al (2012).They are not corrected for the self-attraction and diffraction
Metrologia, 50 (2013) 257–268 259

O Francis et al
Figure 1. Raw gravity measurements of each gravimeter for all the 15 stations. The diamonds depict the gravimeters participating in theKC, the circles the gravimeters participating in the PS and the squares the gravimeter for which the data were not included in the dataadjustment (see section 3.3).
corrections that will be applied afterwards. The IMGC-02data were presented with the self-attraction and diffractioncorrections included. These corrections were not appliedin producing figure 1. The sum of these two corrections
(see Francis et al 2012) is around 1 µGal for the majorityof the gravimeters except for the IMGC-02 and the T-1 forwhich it reaches (+5.8 ± 0.5) µGal and (+2.2 ± 0.9) µGal,respectively.
260 Metrologia, 50 (2013) 257–268

The European Comparison of Absolute Gravimeters 2011 (ECAG-2011)
Figure 2. (a) Gravity changes as observed with the superconducting gravimeter OSG-CT040 during the ECAG-2011; a constant offset wassubtracted in such a way that the average is zero. (b) Measurement time windows of the absolute gravimeters (bold lines).
It is interesting to note that the site A4 was occupied byonly two gravimeters. This is a consequence of the last minuteabsence of registered participants. It makes it extremelydifficult to modify the occupation scheme. The site A1 shouldhave been measured by the CAG-1. However, it was misplacedon A2 by the operators. From figure 1, we can see that onlysites A1 and A4 have been visited by fewer than four differentgravimeters.
In the mine, the superconducting gravimeter OSG-CT040(Lampitelli and Francis 2010) has been recording continuouslythe variations of the acceleration due to gravity with a precisionof 5 nm s−2 Hz−1/2 (Van Camp et al 2005) since 2002. Itsmeasurements during the comparison are shown in figure 2.The changes lie between ±1 µGal. In the same figure 2, the
observational times of each gravimeter are represented by boldlines.
Considering only the gravimeters participating in the KC,one can make the following observations:
(1) sites A1, B2, B3, C1 and C3 were not measured;(2) sites A3, A4, B1 and C2 were measured by only one
gravimeter. These measurements will thus not contributeto the KC solutions as there is no link with othermeasurements;
(3) sites A2, A5, B4 and B5 were measured by twogravimeters and C5 by three. On these five sites, eachgravimeter occupied the same site as two to four othergravimeters.
Metrologia, 50 (2013) 257–268 261
O Francis et al
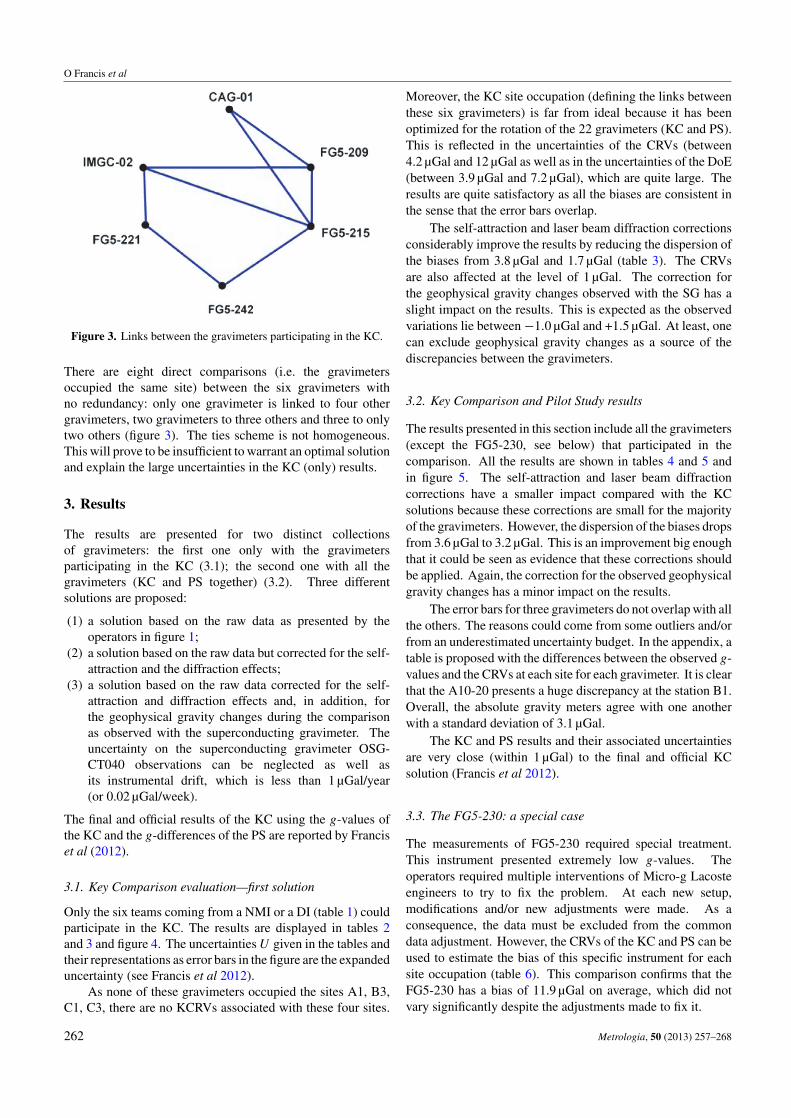
Figure 3. Links between the gravimeters participating in the KC.
There are eight direct comparisons (i.e. the gravimetersoccupied the same site) between the six gravimeters withno redundancy: only one gravimeter is linked to four othergravimeters, two gravimeters to three others and three to onlytwo others (figure 3). The ties scheme is not homogeneous.This will prove to be insufficient to warrant an optimal solutionand explain the large uncertainties in the KC (only) results.
3. Results
The results are presented for two distinct collectionsof gravimeters: the first one only with the gravimetersparticipating in the KC (3.1); the second one with all thegravimeters (KC and PS together) (3.2). Three differentsolutions are proposed:
(1) a solution based on the raw data as presented by theoperators in figure 1;
(2) a solution based on the raw data but corrected for the self-attraction and the diffraction effects;
(3) a solution based on the raw data corrected for the self-attraction and diffraction effects and, in addition, forthe geophysical gravity changes during the comparisonas observed with the superconducting gravimeter. Theuncertainty on the superconducting gravimeter OSG-CT040 observations can be neglected as well asits instrumental drift, which is less than 1 µGal/year(or 0.02 µGal/week).
The final and official results of the KC using the g-values ofthe KC and the g-differences of the PS are reported by Franciset al (2012).
3.1. Key Comparison evaluation—first solution
Only the six teams coming from a NMI or a DI (table 1) couldparticipate in the KC. The results are displayed in tables 2and 3 and figure 4. The uncertainties U given in the tables andtheir representations as error bars in the figure are the expandeduncertainty (see Francis et al 2012).
As none of these gravimeters occupied the sites A1, B3,C1, C3, there are no KCRVs associated with these four sites.
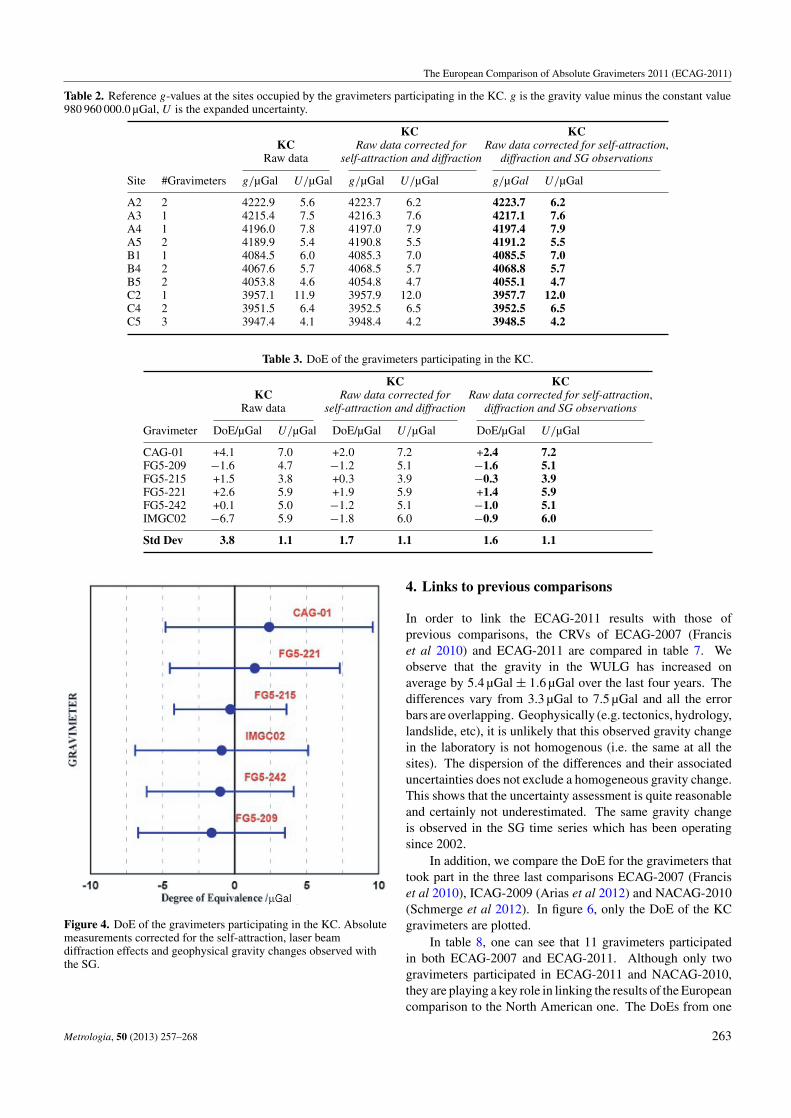
Moreover, the KC site occupation (defining the links betweenthese six gravimeters) is far from ideal because it has beenoptimized for the rotation of the 22 gravimeters (KC and PS).This is reflected in the uncertainties of the CRVs (between4.2 µGal and 12 µGal as well as in the uncertainties of the DoE(between 3.9 µGal and 7.2 µGal), which are quite large. Theresults are quite satisfactory as all the biases are consistent inthe sense that the error bars overlap.
The self-attraction and laser beam diffraction correctionsconsiderably improve the results by reducing the dispersion ofthe biases from 3.8 µGal and 1.7 µGal (table 3). The CRVsare also affected at the level of 1 µGal. The correction forthe geophysical gravity changes observed with the SG has aslight impact on the results. This is expected as the observedvariations lie between −1.0 µGal and +1.5 µGal. At least, onecan exclude geophysical gravity changes as a source of thediscrepancies between the gravimeters.
3.2. Key Comparison and Pilot Study results
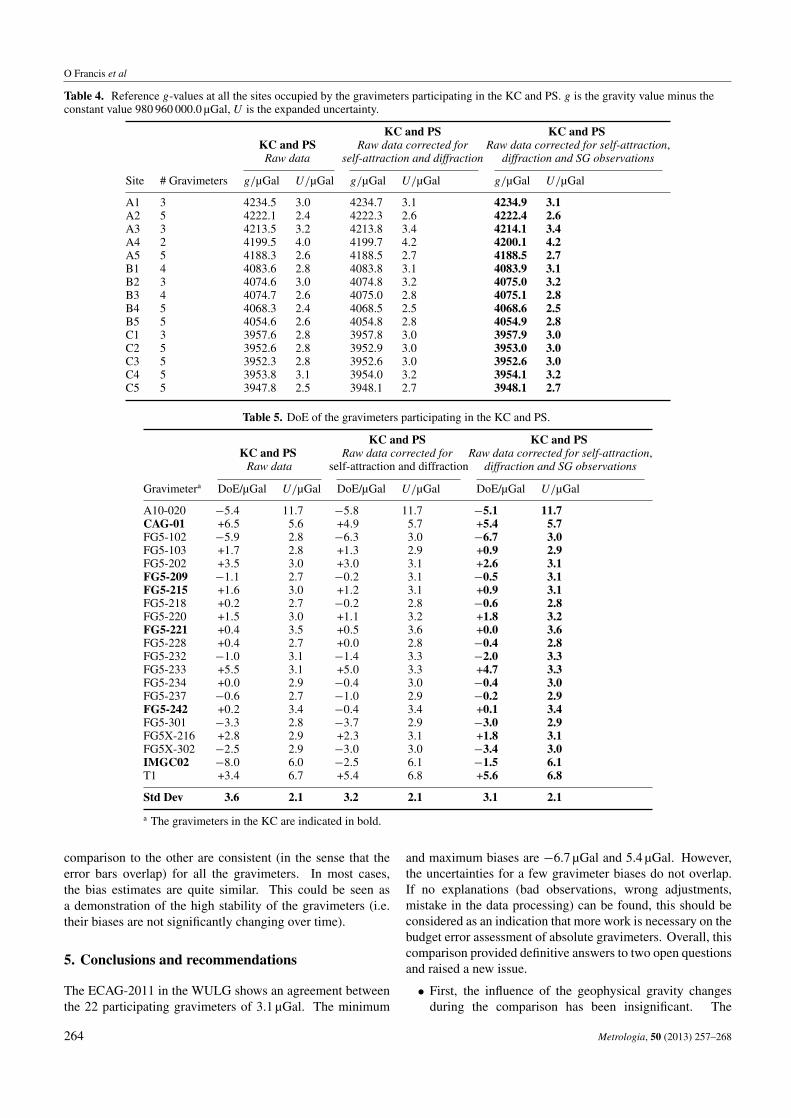
The results presented in this section include all the gravimeters(except the FG5-230, see below) that participated in thecomparison. All the results are shown in tables 4 and 5 andin figure 5. The self-attraction and laser beam diffractioncorrections have a smaller impact compared with the KCsolutions because these corrections are small for the majorityof the gravimeters. However, the dispersion of the biases dropsfrom 3.6 µGal to 3.2 µGal. This is an improvement big enoughthat it could be seen as evidence that these corrections shouldbe applied. Again, the correction for the observed geophysicalgravity changes has a minor impact on the results.
The error bars for three gravimeters do not overlap with allthe others. The reasons could come from some outliers and/orfrom an underestimated uncertainty budget. In the appendix, atable is proposed with the differences between the observed g-values and the CRVs at each site for each gravimeter. It is clearthat the A10-20 presents a huge discrepancy at the station B1.Overall, the absolute gravity meters agree with one anotherwith a standard deviation of 3.1 µGal.
The KC and PS results and their associated uncertaintiesare very close (within 1 µGal) to the final and official KCsolution (Francis et al 2012).
3.3. The FG5-230: a special case
The measurements of FG5-230 required special treatment.This instrument presented extremely low g-values. Theoperators required multiple interventions of Micro-g Lacosteengineers to try to fix the problem. At each new setup,modifications and/or new adjustments were made. As aconsequence, the data must be excluded from the commondata adjustment. However, the CRVs of the KC and PS can beused to estimate the bias of this specific instrument for eachsite occupation (table 6). This comparison confirms that theFG5-230 has a bias of 11.9 µGal on average, which did notvary significantly despite the adjustments made to fix it.
262 Metrologia, 50 (2013) 257–268
The European Comparison of Absolute Gravimeters 2011 (ECAG-2011)
Table 2. Reference g-values at the sites occupied by the gravimeters participating in the KC. g is the gravity value minus the constant value980 960 000.0 µGal, U is the expanded uncertainty.
KC KCKC Raw data corrected for Raw data corrected for self-attraction,
Raw data self-attraction and diffraction diffraction and SG observations
Site #Gravimeters g/µGal U/µGal g/µGal U/µGal g/µGal U/µGal
A2 2 4222.9 5.6 4223.7 6.2 4223.7 6.2A3 1 4215.4 7.5 4216.3 7.6 4217.1 7.6A4 1 4196.0 7.8 4197.0 7.9 4197.4 7.9A5 2 4189.9 5.4 4190.8 5.5 4191.2 5.5B1 1 4084.5 6.0 4085.3 7.0 4085.5 7.0B4 2 4067.6 5.7 4068.5 5.7 4068.8 5.7B5 2 4053.8 4.6 4054.8 4.7 4055.1 4.7C2 1 3957.1 11.9 3957.9 12.0 3957.7 12.0C4 2 3951.5 6.4 3952.5 6.5 3952.5 6.5C5 3 3947.4 4.1 3948.4 4.2 3948.5 4.2
Table 3. DoE of the gravimeters participating in the KC.
KC KCKC Raw data corrected for Raw data corrected for self-attraction,
Raw data self-attraction and diffraction diffraction and SG observations
Gravimeter DoE/µGal U/µGal DoE/µGal U/µGal DoE/µGal U/µGal
CAG-01 +4.1 7.0 +2.0 7.2 +2.4 7.2FG5-209 −1.6 4.7 −1.2 5.1 −1.6 5.1FG5-215 +1.5 3.8 +0.3 3.9 −0.3 3.9FG5-221 +2.6 5.9 +1.9 5.9 +1.4 5.9FG5-242 +0.1 5.0 −1.2 5.1 −1.0 5.1IMGC02 −6.7 5.9 −1.8 6.0 −0.9 6.0
Std Dev 3.8 1.1 1.7 1.1 1.6 1.1
Figure 4. DoE of the gravimeters participating in the KC. Absolutemeasurements corrected for the self-attraction, laser beamdiffraction effects and geophysical gravity changes observed withthe SG.
4. Links to previous comparisons
In order to link the ECAG-2011 results with those ofprevious comparisons, the CRVs of ECAG-2007 (Franciset al 2010) and ECAG-2011 are compared in table 7. Weobserve that the gravity in the WULG has increased onaverage by 5.4 µGal ± 1.6 µGal over the last four years. Thedifferences vary from 3.3 µGal to 7.5 µGal and all the errorbars are overlapping. Geophysically (e.g. tectonics, hydrology,landslide, etc), it is unlikely that this observed gravity changein the laboratory is not homogenous (i.e. the same at all thesites). The dispersion of the differences and their associateduncertainties does not exclude a homogeneous gravity change.This shows that the uncertainty assessment is quite reasonableand certainly not underestimated. The same gravity changeis observed in the SG time series which has been operatingsince 2002.
In addition, we compare the DoE for the gravimeters thattook part in the three last comparisons ECAG-2007 (Franciset al 2010), ICAG-2009 (Arias et al 2012) and NACAG-2010(Schmerge et al 2012). In figure 6, only the DoE of the KCgravimeters are plotted.
In table 8, one can see that 11 gravimeters participatedin both ECAG-2007 and ECAG-2011. Although only twogravimeters participated in ECAG-2011 and NACAG-2010,they are playing a key role in linking the results of the Europeancomparison to the North American one. The DoEs from one
Metrologia, 50 (2013) 257–268 263
O Francis et al
Table 4. Reference g-values at all the sites occupied by the gravimeters participating in the KC and PS. g is the gravity value minus theconstant value 980 960 000.0 µGal, U is the expanded uncertainty.
KC and PS KC and PSKC and PS Raw data corrected for Raw data corrected for self-attraction,Raw data self-attraction and diffraction diffraction and SG observations
Site # Gravimeters g/µGal U/µGal g/µGal U/µGal g/µGal U/µGal
A1 3 4234.5 3.0 4234.7 3.1 4234.9 3.1A2 5 4222.1 2.4 4222.3 2.6 4222.4 2.6A3 3 4213.5 3.2 4213.8 3.4 4214.1 3.4A4 2 4199.5 4.0 4199.7 4.2 4200.1 4.2A5 5 4188.3 2.6 4188.5 2.7 4188.5 2.7B1 4 4083.6 2.8 4083.8 3.1 4083.9 3.1B2 3 4074.6 3.0 4074.8 3.2 4075.0 3.2B3 4 4074.7 2.6 4075.0 2.8 4075.1 2.8B4 5 4068.3 2.4 4068.5 2.5 4068.6 2.5B5 5 4054.6 2.6 4054.8 2.8 4054.9 2.8C1 3 3957.6 2.8 3957.8 3.0 3957.9 3.0C2 5 3952.6 2.8 3952.9 3.0 3953.0 3.0C3 5 3952.3 2.8 3952.6 3.0 3952.6 3.0C4 5 3953.8 3.1 3954.0 3.2 3954.1 3.2C5 5 3947.8 2.5 3948.1 2.7 3948.1 2.7
Table 5. DoE of the gravimeters participating in the KC and PS.
KC and PS KC and PSKC and PS Raw data corrected for Raw data corrected for self-attraction,
Raw data self-attraction and diffraction diffraction and SG observations
Gravimetera DoE/µGal U/µGal DoE/µGal U/µGal DoE/µGal U/µGal
A10-020 −5.4 11.7 −5.8 11.7 −5.1 11.7CAG-01 +6.5 5.6 +4.9 5.7 +5.4 5.7FG5-102 −5.9 2.8 −6.3 3.0 −6.7 3.0FG5-103 +1.7 2.8 +1.3 2.9 +0.9 2.9FG5-202 +3.5 3.0 +3.0 3.1 +2.6 3.1FG5-209 −1.1 2.7 −0.2 3.1 −0.5 3.1FG5-215 +1.6 3.0 +1.2 3.1 +0.9 3.1FG5-218 +0.2 2.7 −0.2 2.8 −0.6 2.8FG5-220 +1.5 3.0 +1.1 3.2 +1.8 3.2FG5-221 +0.4 3.5 +0.5 3.6 +0.0 3.6FG5-228 +0.4 2.7 +0.0 2.8 −0.4 2.8FG5-232 −1.0 3.1 −1.4 3.3 −2.0 3.3FG5-233 +5.5 3.1 +5.0 3.3 +4.7 3.3FG5-234 +0.0 2.9 −0.4 3.0 −0.4 3.0FG5-237 −0.6 2.7 −1.0 2.9 −0.2 2.9FG5-242 +0.2 3.4 −0.4 3.4 +0.1 3.4FG5-301 −3.3 2.8 −3.7 2.9 −3.0 2.9FG5X-216 +2.8 2.9 +2.3 3.1 +1.8 3.1FG5X-302 −2.5 2.9 −3.0 3.0 −3.4 3.0IMGC02 −8.0 6.0 −2.5 6.1 −1.5 6.1T1 +3.4 6.7 +5.4 6.8 +5.6 6.8
Std Dev 3.6 2.1 3.2 2.1 3.1 2.1
a The gravimeters in the KC are indicated in bold.
comparison to the other are consistent (in the sense that theerror bars overlap) for all the gravimeters. In most cases,the bias estimates are quite similar. This could be seen asa demonstration of the high stability of the gravimeters (i.e.their biases are not significantly changing over time).
5. Conclusions and recommendations
The ECAG-2011 in the WULG shows an agreement betweenthe 22 participating gravimeters of 3.1 µGal. The minimum
and maximum biases are −6.7 µGal and 5.4 µGal. However,the uncertainties for a few gravimeter biases do not overlap.If no explanations (bad observations, wrong adjustments,mistake in the data processing) can be found, this should beconsidered as an indication that more work is necessary on thebudget error assessment of absolute gravimeters. Overall, thiscomparison provided definitive answers to two open questionsand raised a new issue.
• First, the influence of the geophysical gravity changesduring the comparison has been insignificant. The
264 Metrologia, 50 (2013) 257–268

The European Comparison of Absolute Gravimeters 2011 (ECAG-2011)
Figure 5. DoE for the gravimeters participating in the KC(surrounded by a rectangular box) and PS (the FG5-230 excluded).Absolute measurements corrected for the self-attraction, laser beamdiffraction effects and geophysical gravity changes observed withthe SG.
observed variations with the SG were between −1 µGaland 1.5 µGal. It means that the gravity variations shouldbe much bigger to affect the comparison results. In theabsence of a SG, they could be easily monitored by anabsolute gravimeter measuring once a day at the same site(as was done during the ICAG-2005 and ICAG-2009, forexample).
• Secondly, the self-attraction and laser beam diffractioncorrections should be applied especially when differenttypes of gravimeters are compared. The final results areimproved once these effects were corrected for.
• Finally, we should mention that the Key Comparisonevaluation—first solution is not the best one. It is basedon the measurements of only six gravimeters. The siteoccupation was optimized for all the gravimeters (KC andPS). The KC dataset shows a poor site occupation as wellas poor links between the involved gravimeters (figure 3).These shortcomings partly explain why the uncertainties
Table 6. Comparison between the FG5-230 measurements(corrected for self-attraction and laser beam diffraction effects) andthe KC and PS results.
FG5-230 KC and PS Difference
Site g/µGal U/µGal g/µGal U/µGal g/µGal U/µGal
A3 4201.6 4.0 4213.8 3.4 −12.5 5.2B2 4064.3 4.0 4074.8 3.2 −10.5 5.1C1 3945.0 4.0 3957.8 3.0 −12.8 5.0
Mean −11.9Std Dev 1.2
Table 7. Comparison of the CRVs between ECAG-2007 andECAG-2011. The participants (in terms of number and instruments)differ from one comparison to the other. However, a majority of thegravimeters participated in both comparisons.
ECAG-2007 ECAG-2011 Difference
Site g/µGal U/µGal g/µGal U/µGal g/µGal U/µGal
A1 4227.4 2.0 4234.9 3.1 −7.5 3.7A2 4216.4 2.0 4222.4 2.6 −6.0 3.3A3 4206.6 2.4 4214.1 3.4 −7.5 4.2A4 4192.6 2.2 4200.1 4.2 −7.5 4.7A5 4184.7 2.2 4188.5 2.7 −3.8 3.4B1 4079.3 2.4 4083.9 3.1 −4.6 3.9B2 4070.6 4.2 4075.0 3.2 −4.4 5.2B3 4069.0 1.2 4075.1 2.8 −6.1 3.0B4 4064.5 2.0 4068.6 2.5 −4.1 3.2B5 4049.9 2.0 4054.9 2.8 −5.0 3.4C1 3951.9 1.8 3957.9 3.0 −6.0 3.5C2 3949.3 1.8 3953.0 3.0 −3.7 3.4C3 3949.3 1.8 3952.6 3.0 −3.3 3.4C4 3946.5 2.2 3954.1 3.2 −7.6 3.9C5 3943.8 2.0 3948.1 2.7 −4.3 3.4
Mean −5.4Std Dev 1.6
Figure 6. DoE for the KC gravimeters which participated inECAG-2007, ICAG-2009 and ECAG-2011.
of the adjustment of the KC solutions are twice as big asthose for the KC and PS solutions.
From the experience gained from this comparison, werecommend to include the KC raw measurements and the PS
Metrologia, 50 (2013) 257–268 265
O Francis et al
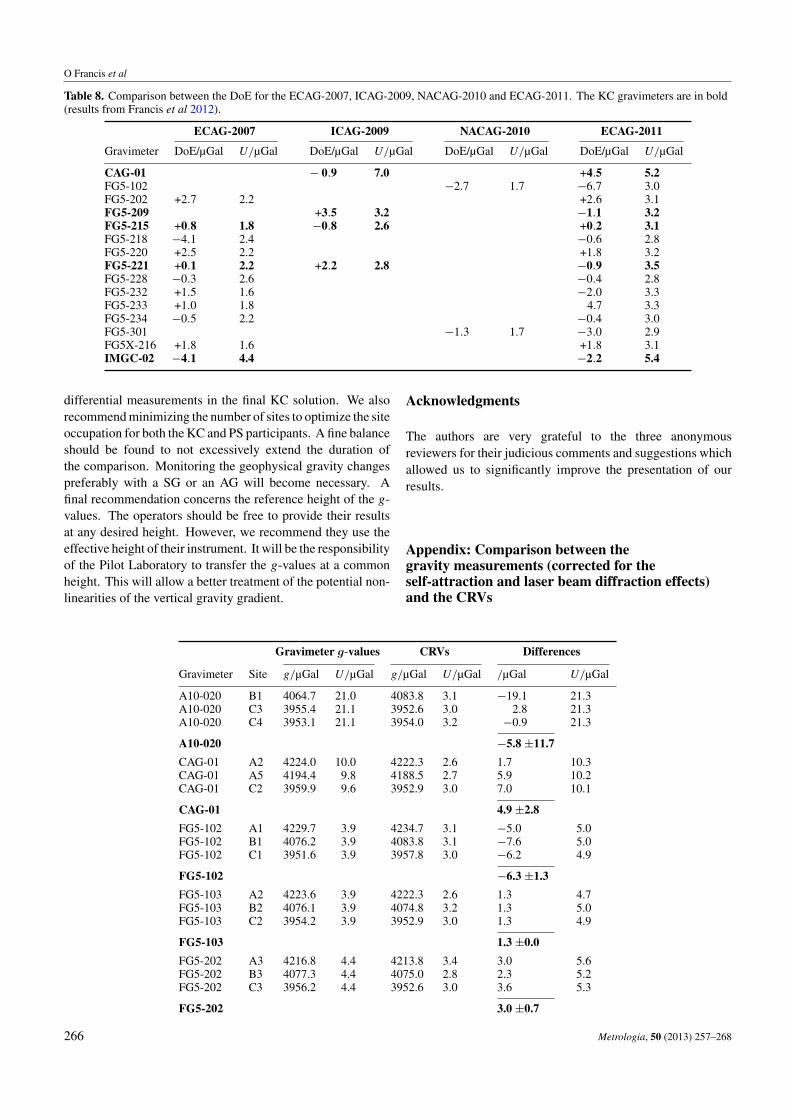
Table 8. Comparison between the DoE for the ECAG-2007, ICAG-2009, NACAG-2010 and ECAG-2011. The KC gravimeters are in bold(results from Francis et al 2012).
ECAG-2007 ICAG-2009 NACAG-2010 ECAG-2011
Gravimeter DoE/µGal U/µGal DoE/µGal U/µGal DoE/µGal U/µGal DoE/µGal U/µGal
CAG-01 − 0.9 7.0 +4.5 5.2FG5-102 −2.7 1.7 −6.7 3.0FG5-202 +2.7 2.2 +2.6 3.1FG5-209 +3.5 3.2 −1.1 3.2FG5-215 +0.8 1.8 −0.8 2.6 +0.2 3.1FG5-218 −4.1 2.4 −0.6 2.8FG5-220 +2.5 2.2 +1.8 3.2FG5-221 +0.1 2.2 +2.2 2.8 −0.9 3.5FG5-228 −0.3 2.6 −0.4 2.8FG5-232 +1.5 1.6 −2.0 3.3FG5-233 +1.0 1.8 4.7 3.3FG5-234 −0.5 2.2 −0.4 3.0FG5-301 −1.3 1.7 −3.0 2.9FG5X-216 +1.8 1.6 +1.8 3.1IMGC-02 −4.1 4.4 −2.2 5.4
differential measurements in the final KC solution. We alsorecommend minimizing the number of sites to optimize the siteoccupation for both the KC and PS participants. A fine balanceshould be found to not excessively extend the duration ofthe comparison. Monitoring the geophysical gravity changespreferably with a SG or an AG will become necessary. Afinal recommendation concerns the reference height of the g-values. The operators should be free to provide their resultsat any desired height. However, we recommend they use theeffective height of their instrument. It will be the responsibilityof the Pilot Laboratory to transfer the g-values at a commonheight. This will allow a better treatment of the potential non-linearities of the vertical gravity gradient.
Gravimeter g-values CRVs Differences
Gravimeter Site g/µGal U/µGal g/µGal U/µGal /µGal U/µGal
A10-020 B1 4064.7 21.0 4083.8 3.1 −19.1 21.3A10-020 C3 3955.4 21.1 3952.6 3.0 2.8 21.3A10-020 C4 3953.1 21.1 3954.0 3.2 −0.9 21.3
A10-020 −5.8 ±11.7
CAG-01 A2 4224.0 10.0 4222.3 2.6 1.7 10.3CAG-01 A5 4194.4 9.8 4188.5 2.7 5.9 10.2CAG-01 C2 3959.9 9.6 3952.9 3.0 7.0 10.1
CAG-01 4.9 ±2.8
FG5-102 A1 4229.7 3.9 4234.7 3.1 −5.0 5.0FG5-102 B1 4076.2 3.9 4083.8 3.1 −7.6 5.0FG5-102 C1 3951.6 3.9 3957.8 3.0 −6.2 4.9
FG5-102 −6.3 ±1.3
FG5-103 A2 4223.6 3.9 4222.3 2.6 1.3 4.7FG5-103 B2 4076.1 3.9 4074.8 3.2 1.3 5.0FG5-103 C2 3954.2 3.9 3952.9 3.0 1.3 4.9
FG5-103 1.3 ±0.0
FG5-202 A3 4216.8 4.4 4213.8 3.4 3.0 5.6FG5-202 B3 4077.3 4.4 4075.0 2.8 2.3 5.2FG5-202 C3 3956.2 4.4 3952.6 3.0 3.6 5.3
FG5-202 3.0 ±0.7
Acknowledgments
The authors are very grateful to the three anonymousreviewers for their judicious comments and suggestions whichallowed us to significantly improve the presentation of ourresults.
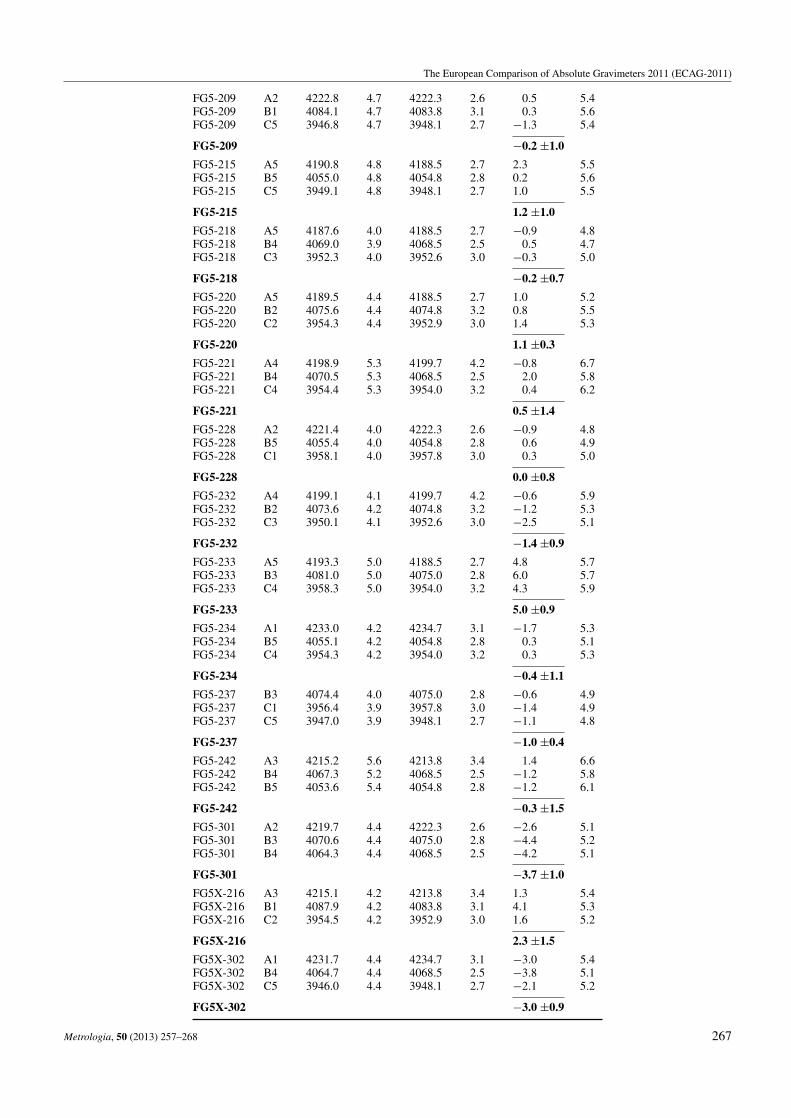
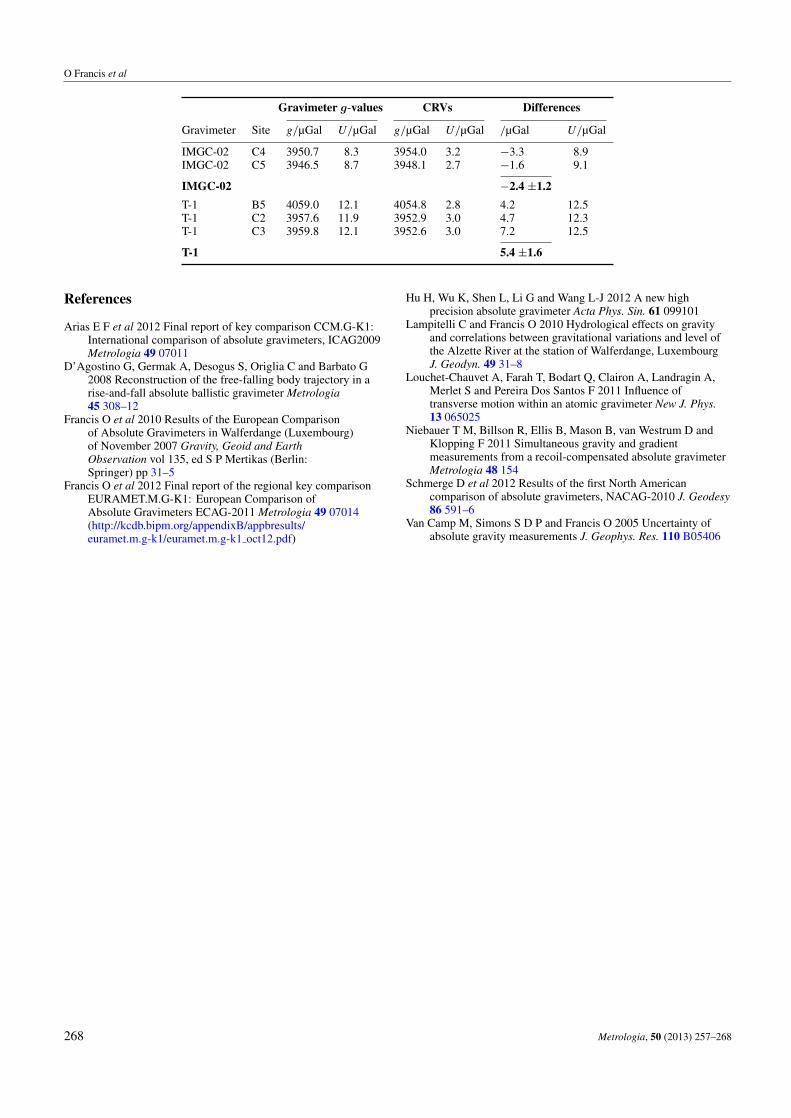
Appendix: Comparison between thegravity measurements (corrected for theself-attraction and laser beam diffraction effects)and the CRVs
266 Metrologia, 50 (2013) 257–268
The European Comparison of Absolute Gravimeters 2011 (ECAG-2011)
FG5-209 A2 4222.8 4.7 4222.3 2.6 0.5 5.4FG5-209 B1 4084.1 4.7 4083.8 3.1 0.3 5.6FG5-209 C5 3946.8 4.7 3948.1 2.7 −1.3 5.4
FG5-209 −0.2 ±1.0
FG5-215 A5 4190.8 4.8 4188.5 2.7 2.3 5.5FG5-215 B5 4055.0 4.8 4054.8 2.8 0.2 5.6FG5-215 C5 3949.1 4.8 3948.1 2.7 1.0 5.5
FG5-215 1.2 ±1.0
FG5-218 A5 4187.6 4.0 4188.5 2.7 −0.9 4.8FG5-218 B4 4069.0 3.9 4068.5 2.5 0.5 4.7FG5-218 C3 3952.3 4.0 3952.6 3.0 −0.3 5.0
FG5-218 −0.2 ±0.7
FG5-220 A5 4189.5 4.4 4188.5 2.7 1.0 5.2FG5-220 B2 4075.6 4.4 4074.8 3.2 0.8 5.5FG5-220 C2 3954.3 4.4 3952.9 3.0 1.4 5.3
FG5-220 1.1 ±0.3
FG5-221 A4 4198.9 5.3 4199.7 4.2 −0.8 6.7FG5-221 B4 4070.5 5.3 4068.5 2.5 2.0 5.8FG5-221 C4 3954.4 5.3 3954.0 3.2 0.4 6.2
FG5-221 0.5 ±1.4
FG5-228 A2 4221.4 4.0 4222.3 2.6 −0.9 4.8FG5-228 B5 4055.4 4.0 4054.8 2.8 0.6 4.9FG5-228 C1 3958.1 4.0 3957.8 3.0 0.3 5.0
FG5-228 0.0 ±0.8
FG5-232 A4 4199.1 4.1 4199.7 4.2 −0.6 5.9FG5-232 B2 4073.6 4.2 4074.8 3.2 −1.2 5.3FG5-232 C3 3950.1 4.1 3952.6 3.0 −2.5 5.1
FG5-232 −1.4 ±0.9
FG5-233 A5 4193.3 5.0 4188.5 2.7 4.8 5.7FG5-233 B3 4081.0 5.0 4075.0 2.8 6.0 5.7FG5-233 C4 3958.3 5.0 3954.0 3.2 4.3 5.9
FG5-233 5.0 ±0.9
FG5-234 A1 4233.0 4.2 4234.7 3.1 −1.7 5.3FG5-234 B5 4055.1 4.2 4054.8 2.8 0.3 5.1FG5-234 C4 3954.3 4.2 3954.0 3.2 0.3 5.3
FG5-234 −0.4 ±1.1
FG5-237 B3 4074.4 4.0 4075.0 2.8 −0.6 4.9FG5-237 C1 3956.4 3.9 3957.8 3.0 −1.4 4.9FG5-237 C5 3947.0 3.9 3948.1 2.7 −1.1 4.8
FG5-237 −1.0 ±0.4
FG5-242 A3 4215.2 5.6 4213.8 3.4 1.4 6.6FG5-242 B4 4067.3 5.2 4068.5 2.5 −1.2 5.8FG5-242 B5 4053.6 5.4 4054.8 2.8 −1.2 6.1
FG5-242 −0.3 ±1.5
FG5-301 A2 4219.7 4.4 4222.3 2.6 −2.6 5.1FG5-301 B3 4070.6 4.4 4075.0 2.8 −4.4 5.2FG5-301 B4 4064.3 4.4 4068.5 2.5 −4.2 5.1
FG5-301 −3.7 ±1.0
FG5X-216 A3 4215.1 4.2 4213.8 3.4 1.3 5.4FG5X-216 B1 4087.9 4.2 4083.8 3.1 4.1 5.3FG5X-216 C2 3954.5 4.2 3952.9 3.0 1.6 5.2
FG5X-216 2.3 ±1.5
FG5X-302 A1 4231.7 4.4 4234.7 3.1 −3.0 5.4FG5X-302 B4 4064.7 4.4 4068.5 2.5 −3.8 5.1FG5X-302 C5 3946.0 4.4 3948.1 2.7 −2.1 5.2
FG5X-302 −3.0 ±0.9
Metrologia, 50 (2013) 257–268 267
O Francis et al
Gravimeter g-values CRVs Differences
Gravimeter Site g/µGal U/µGal g/µGal U/µGal /µGal U/µGal
IMGC-02 C4 3950.7 8.3 3954.0 3.2 −3.3 8.9IMGC-02 C5 3946.5 8.7 3948.1 2.7 −1.6 9.1
IMGC-02 −2.4 ±1.2
T-1 B5 4059.0 12.1 4054.8 2.8 4.2 12.5T-1 C2 3957.6 11.9 3952.9 3.0 4.7 12.3T-1 C3 3959.8 12.1 3952.6 3.0 7.2 12.5
T-1 5.4 ±1.6
References
Arias E F et al 2012 Final report of key comparison CCM.G-K1:International comparison of absolute gravimeters, ICAG2009Metrologia 49 07011
D’Agostino G, Germak A, Desogus S, Origlia C and Barbato G2008 Reconstruction of the free-falling body trajectory in arise-and-fall absolute ballistic gravimeter Metrologia45 308–12
Francis O et al 2010 Results of the European Comparisonof Absolute Gravimeters in Walferdange (Luxembourg)of November 2007 Gravity, Geoid and EarthObservation vol 135, ed S P Mertikas (Berlin:Springer) pp 31–5
Francis O et al 2012 Final report of the regional key comparisonEURAMET.M.G-K1: European Comparison ofAbsolute Gravimeters ECAG-2011 Metrologia 49 07014(http://kcdb.bipm.org/appendixB/appbresults/euramet.m.g-k1/euramet.m.g-k1 oct12.pdf)
Hu H, Wu K, Shen L, Li G and Wang L-J 2012 A new highprecision absolute gravimeter Acta Phys. Sin. 61 099101
Lampitelli C and Francis O 2010 Hydrological effects on gravityand correlations between gravitational variations and level ofthe Alzette River at the station of Walferdange, LuxembourgJ. Geodyn. 49 31–8
Louchet-Chauvet A, Farah T, Bodart Q, Clairon A, Landragin A,Merlet S and Pereira Dos Santos F 2011 Influence oftransverse motion within an atomic gravimeter New J. Phys.13 065025
Niebauer T M, Billson R, Ellis B, Mason B, van Westrum D andKlopping F 2011 Simultaneous gravity and gradientmeasurements from a recoil-compensated absolute gravimeterMetrologia 48 154
Schmerge D et al 2012 Results of the first North Americancomparison of absolute gravimeters, NACAG-2010 J. Geodesy86 591–6
Van Camp M, Simons S D P and Francis O 2005 Uncertainty ofabsolute gravity measurements J. Geophys. Res. 110 B05406
268 Metrologia, 50 (2013) 257–268
Copyright © 2022 FDOKUMEN