The end Triassic mass extinction record of Williston Lake, British Columbia
22
The end Triassic mass extinction record of Williston Lake, British Columbia P.B. Wignall a, ⁎ , J.-P. Zonneveld b , R.J. Newton a , K. Amor c , M.A. Sephton d , S. Hartley a a School of Earth and Environment, University of Leeds, Leeds, LS2 9JT, UK b Geological Survey of Canada, 3303-33rd Street Northwest, Calgary, Alberta, Canada T21 2A7 c Department of Earth Sciences, Parks Road, University of Oxford, Oxford OX1 3PR, UK d Department of Earth Science and Engineering, Imperial College, Prince Consort Road, London SW7 2BP, UK Received 4 November 2005; received in revised form 4 April 2007; accepted 14 June 2007 Abstract Triassic–Jurassic boundary sections on the shore of Lake Williston, British Columbia record a spectrum of depositional environments from the western Canadian continental margin. A primarily deep-water, anoxic record of deposition, indicated by V/V+Ni, V/Cr, Th/U indices and pyrite framboid and facies data, is seen throughout the Late Triassic–Early Jurassic (Norian- Hettangian) interval in a section at Black Bear Ridge. Abundant Monotis bivalve populations in Norian strata are interpreted to have lived on the seabed during transient oxygenation events that punctuated the background anoxic conditions. Monotis went extinct around the Norian/Rhaetian boundary and the deep-water assemblages are subsequently dominated by thin-shelled pectinids. An intra-Rhaetian sea-level fall generated a major hiatus in the proximal Black Bear Ridge section whilst distinctive lowstand strata were developed in the more distal and more complete Ne Parle Pas Point and Pardonet Creek sections. These consist of shallow-water, phosphatic ooid sand facies that contain diverse bivalves. The majority of the infaunal bivalves (but not the epifaunal ones) disappeared at the acme of the regression. This is the end-Triassic mass extinction event and it occurred shortly before a terminal Triassic flooding event. This transgressive event is associated with a rapid negative shift of δ 13 C org values interpreted to be the Initial Isotope Excursion of Hesselbo et al. [Hesselbo, S.P., Robinson, S.A., Surlyk, F., Piasecki, S., 2002. Terrestrial and marine extinction at the Triassic-Jurassic boundary synchronized with major carbon-cycle perturbation: a link to initiation of massive volcanism? Geology 30, 251–254]. The Rhaetian record of Williston Lake thus records an extinction of shallow-water infaunal bivalves during a lowstand prior to the development of a transgressive record that is associated with a major, negative C isotope. © 2007 Elsevier B.V. All rights reserved. Keywords: Triassic; Mass extinction; Bivalves; Anoxia 1. Introduction The study of the end-Triassic mass extinction has received considerable impetus in recent years primarily through the recognition of a distinct series of carbon and nitrogen isotope oscillations (Hesselbo et al., 2002; Palaeogeography, Palaeoclimatology, Palaeoecology 253 (2007) 385 – 406 www.elsevier.com/locate/palaeo ⁎ Corresponding author. E-mail address: [email protected] (P.B. Wignall). 0031-0182/$ - see front matter © 2007 Elsevier B.V. All rights reserved. doi:10.1016/j.palaeo.2007.06.020
Transcript of The end Triassic mass extinction record of Williston Lake, British Columbia
laeoecology 253 (2007) 385–406www.elsevier.com/locate/palaeo
Palaeogeography, Palaeoclimatology, Pa
The end Triassic mass extinction record of Williston Lake,British Columbia
P.B. Wignall a,⁎, J.-P. Zonneveld b, R.J. Newton a, K. Amor c, M.A. Sephton d, S. Hartley a
a School of Earth and Environment, University of Leeds, Leeds, LS2 9JT, UKb Geological Survey of Canada, 3303-33rd Street Northwest, Calgary, Alberta, Canada T21 2A7
c Department of Earth Sciences, Parks Road, University of Oxford, Oxford OX1 3PR, UKd Department of Earth Science and Engineering, Imperial College, Prince Consort Road, London SW7 2BP, UK
Received 4 November 2005; received in revised form 4 April 2007; accepted 14 June 2007
Abstract
Triassic–Jurassic boundary sections on the shore of Lake Williston, British Columbia record a spectrum of depositionalenvironments from the western Canadian continental margin. A primarily deep-water, anoxic record of deposition, indicated byV/V+Ni, V/Cr, Th/U indices and pyrite framboid and facies data, is seen throughout the Late Triassic–Early Jurassic (Norian-Hettangian) interval in a section at Black Bear Ridge. Abundant Monotis bivalve populations in Norian strata are interpreted tohave lived on the seabed during transient oxygenation events that punctuated the background anoxic conditions. Monotis wentextinct around the Norian/Rhaetian boundary and the deep-water assemblages are subsequently dominated by thin-shelledpectinids. An intra-Rhaetian sea-level fall generated a major hiatus in the proximal Black Bear Ridge section whilst distinctivelowstand strata were developed in the more distal and more complete Ne Parle Pas Point and Pardonet Creek sections. Theseconsist of shallow-water, phosphatic ooid sand facies that contain diverse bivalves. The majority of the infaunal bivalves (but notthe epifaunal ones) disappeared at the acme of the regression. This is the end-Triassic mass extinction event and it occurred shortlybefore a terminal Triassic flooding event. This transgressive event is associated with a rapid negative shift of δ13Corg valuesinterpreted to be the Initial Isotope Excursion of Hesselbo et al. [Hesselbo, S.P., Robinson, S.A., Surlyk, F., Piasecki, S., 2002.Terrestrial and marine extinction at the Triassic-Jurassic boundary synchronized with major carbon-cycle perturbation: a link toinitiation of massive volcanism? Geology 30, 251–254]. The Rhaetian record of Williston Lake thus records an extinction ofshallow-water infaunal bivalves during a lowstand prior to the development of a transgressive record that is associated with amajor, negative C isotope.© 2007 Elsevier B.V. All rights reserved.
Keywords: Triassic; Mass extinction; Bivalves; Anoxia
⁎ Corresponding author.E-mail address: [email protected] (P.B. Wignall).
0031-0182/$ - see front matter © 2007 Elsevier B.V. All rights reserved.doi:10.1016/j.palaeo.2007.06.020
1. Introduction
The study of the end-Triassic mass extinction hasreceived considerable impetus in recent years primarilythrough the recognition of a distinct series of carbon andnitrogen isotope oscillations (Hesselbo et al., 2002;
386 P.B. Wignall et al. / Palaeogeography, Palaeoclimatology, Palaeoecology 253 (2007) 385–406
Sephton et al., 2002; Ward et al., 2001, 2004). Carbonisotope trends in particular have proved useful inevaluating the palaeoenvironmental changes during thebiotic crisis and also in discussions on the long-vexedand separate issue of the placement of the Triassic–Jurassic (T–J) boundary and its global correlation (e.g.Pálfy et al., 2001; Galli et al., 2005). Resolution of theextinction timing and the recognition of an ecologicalselectivity to the extinctions, particularly for thebivalves, has also helped clarify the nature of the crisis(McRoberts and Newton, 1995; Sephton et al., 2002;Ward et al., 2001, 2004). However, there are still manyunresolved issues concerning the timing and nature ofenvironmental change during this biotic crisis interval.This paper attempts to address these issues using amultidisciplinary dataset gathered from three boundarysections on the shores of Williston Lake in northernBritish Columbia, Canada. Field-determined fossil, faciesand gamma-ray spectrometry analyses are compared withlaboratory analyses of selected (redox sensitive) tracemetals, organic C isotopes, carbonate and organic Ccontents and pyrite framboid size populations.
Our principal aim has been to locate the level of theextinctions in these mostly deep-water sections and seehow these correspond to changes in redox conditions,relative sea-level change and C isotope values. Oceanicanoxic events, regression, primary productivity crash,gas hydrate release and rapid global warming, globalcooling and calcification crises have all figured in recentproposed kill mechanisms (Hallam and Wignall, 1997,1999; Pálfy et al., 2000, 2001; Hesselbo et al., 2002;Ward et al., 2001, 2004; Galli et al., 2005).
2. Placement of the Triassic–Jurassic boundary
Precise correlation of the T–J boundary rocks haslong been difficult primarily because of a dearth ofbiostratigraphically useful fossils around this level.Until recently, no sections were known to yieldammonoids between the highest occurrence of the lastTriassic ammonoid Choristoceras and the first Jurassicammonite Psiloceras. Thus, sequence stratigraphic andchemostratigraphic events and other biostratigraphicmarkers have been suggested as a substitute marker forthe base of the Jurassic in the ammonoid-free interval(Hallam, 1990; Hesselbo et al., 2002). A radiolarian-defined boundary has been suggested for deep-watersections (Carter and Hori, 2005) and the first appearanceof the bivalve Agerchlamys boellingi has also beenproposed (Ward et al., 2007).
Intensive collecting over many years has graduallylowered the first occurrence datum of Psiloceras species
in several sections, most noticeably in NewYork Canyon,Nevada where the ranges of Psiloceras and Choristo-ceras species are now seen to overlap (Guex et al., 2004).The first appearance datum (FAD) of Psiloceras at NewYork Canyon has been used to denote the base of theJurassic (e.g. Galli et al., 2005). However, this ammoniteis exceptionally rare in the early part of its range and itsFAD is therefore unlikely to be synchronous. As Guex etal. (2004, p. 34) note “As far as we know, the oldestrepresentatives of Psiloceras… are recorded only inNevada.” A more utilitarian (and reliable) T–J boundarycould be taken at the level marked by the suddenappearance of prolific numbers of psiloceratid ammo-nites. In the senior author's experience this is one of themost distinctive and instantly recognisable features ofTriassic–Jurassic boundary sections throughout theworld. Guex et al. (2004, p. 34) consider this to be “amore or less penecontemporaneous evolutionary eventrepresenting a good proxy for large-scale correlation”. Asshown below, the psiloceratid “explosion” event isimmediately preceded by a distinctive succession ofchemostratigraphic and sequence stratigraphic events thatsuggests that this event is globally synchronous andtherefore of chronostratigraphic utility.
3. Regional geology
Early Mesozoic strata in northeastern British Colum-bia comprise a westward thickening wedge of silici-clastic, carbonate and subordinate evaporite sedimentsdeposited on the western margin of the North Americancraton portion of the Pangaean supercontinent (Gibson,1993). Triassic and lowest Jurassic strata in the studyarea were deposited in the Peace River Embayment, aDevonian–earliest Jurassic depocentre (Poulton et al.,1993). Deposition of these strata preceded accretion ofallochthonous terranes that now comprise the Cordillerawest of the Rocky Mountain Front Ranges (Gibson,1993). Thus siliciclastic sediment in the study interval istexturally mature and was sourced primarily from theeast (Ross et al., 1997).
Latest Triassic and earliest Jurassic strata in the PeaceRiver valley/Williston Lake area have traditionally beenassigned to the Pardonet and Fernie formationsrespectively (McLearn, 1940; McLearn and Kindle,1950; Tozer, 1982; Stott, 1998). McLearn (1937, 1960)was the first to discuss the possible presence of a T–Jboundary section in this area after observing anappreciable thickness of post-Monotis, psiloceratid-free beds at Rapide-qui-ne-parle-pas (subsequentlyreferred to as either Ne-parle-pas Rapids or Parle PasRapids). Ammonoid successions in these beds led him
387P.B. Wignall et al. / Palaeogeography, Palaeoclimatology, Palaeoecology 253 (2007) 385–406
to infer the presence of an appreciable unconformityresulting in the lack of Rhaetian and some LowerJurassic stages (McLearn, 1960).
The post-Monotis, pre-Jurassic beds were noted tocontain Triassic ammonoids (Placites polydactylus,Rhabdoceras suessi and Rhacophyllites debilis) andwere informally designated the “Rhacophyllites beds” ofthe Pardonet Formation (McLearn, 1960; Tozer, 1982).Crushed ammonoid impressions at the top of the outcropsection were determined to be earliest Jurassic formsconfirming the presence of Triassic strata in this section.Although Tozer (1982) acknowledged that the bedsbearing the Jurassic ammonoids overlay “harder, but notdramatically dissimilar Triassic beds with perfectconcordance, and with no lithological indication ofunconformity” he nonetheless assigned the Jurassicstrata to the Fernie Formation.
Subsequently, although some workers have followedthis convention, placing the lithostratigraphic contact at theinferred T–J boundary (e.g. Gibson and Edwards, 1990,1992)most have placed the lithostratigraphic contact at themarked facies change between the top of the uppermostMonotis-bearing bed and the overlying brown, calcareous,siltstone succession (e.g. Zonneveld and Gingras, 2001;Orchard et al., 2001a,b; Pitaru, 2005). As lithostratigraphicunits are defined as bodies of rock with shared lithiccharacteristics and are commonly diachronous entities thislatter convention is followed here. The Pardonet–Ferniecontact is therefore placed immediately above the highestbed with abundantMonotis.
The precise placement of the T–J boundary in theWilliston Lake area has proved contentious. Tozer(1982) was uncertain as to the precise level, inferringthat the boundary likely occurs either at the fibrouscalcite beds (0.9 m above the top Monotis bed in theBlack Bear Ridge section, also studied here) oralternatively at the top of the Monotis beds. Stott(1998) argued for the latter position and identified adiscontinuous phosphate granule lag at this contact asevidence of an unconformity. The presence of severallarge conodont elements including Epigondolellamosheri and E. ex. gr. bidentata identified by Orchardet al. (2001a,b) from a concretion above the last beddingsurface of Monotis at Black Bear Ridge indicates aTriassic age and they, like Tozer before them, placed theT–J boundary near the level of the fibrous calcite beds.Sephton et al. (2002) placed the T–J boundary at thelevel of the first recorded specimen of Psiloceras byTozer (1982), that is 9 m above the top Monotis bed atBlack Bear Ridge. However, Hall and Pitaru (2003)presented new data and extended the range of Psilo-ceras down to a level 2.9 m above the top Monotis bed.
Although the precise boundary between the Triassicand Jurassic remains uncertain at Black Bear Ridge,most workers agree that it occurs somewhere betweenthe highest occurrence of the conodont Epigondolellasp. (1.7 m above the top Monotis beds at Black BearRidge) and the first definite Psiloceras (2.9 m aboveMonotis) (Hall and Pitaru, 2003; Wignall et al., 2003;Hall and Pitaru, 2004; Pitaru, 2005).
4. Methodology
4.1. Facies
Facies determinations were undertaken during sedi-mentary logging at three sections on the shores ofWilliston Lake, British Columbia; Black Bear Ridge,Pardonet Creek and Ne Parle Pas point (Fig. 1). Thesedata were complemented with thin section and SEManalysis. The last technique was also used to measurethe sizes of pyrite framboid populations using theapproach described in Wignall and Newton (1998).
4.2. Organic C isotopes
The stable isotope composition of the organic carboncontent was determined by mass spectrometry asdescribed in Sephton et al. (2002) who presented someresults from the Black Bear Ridge section. Furthersamples from this section were analysed (doubling theoriginal sample density) together with samples from NeParle Pas. As discussed below these provide a record froma portion of the Rhaetian Stage not represented at BlackBear Ridge. The samples were analysed using the sealed-tube combustion method, described in Sephton et al.'swork. Thus, 1 mg of carbon in acid-washed sampledresidue was mixed with excess copper oxide (preheated at550 °C to remove organic contaminants), placed in a glasstube and sealed, and then combusted at 870 °C for 12 h.The CO2 produced was cryogenically dried and distilledon a vacuum line to remove other gases evolved duringcombustion. AVG SIRA 10 mass spectrometer was thenused for the analyses. The standard deviation of δ13Cdeterminations on a laboratory standard of SrCO3 for 10repeat analyses was ±0.09‰. All analyses in this studyshould therefore be considered to have an error of ±0.2‰at two standard deviations.
4.3. Organic carbon and carbonate
Total organic carbon (TOC) content was measured bypreparing between 1 and 3 mg of the ground and acid-washed residue. The carbon concentration was
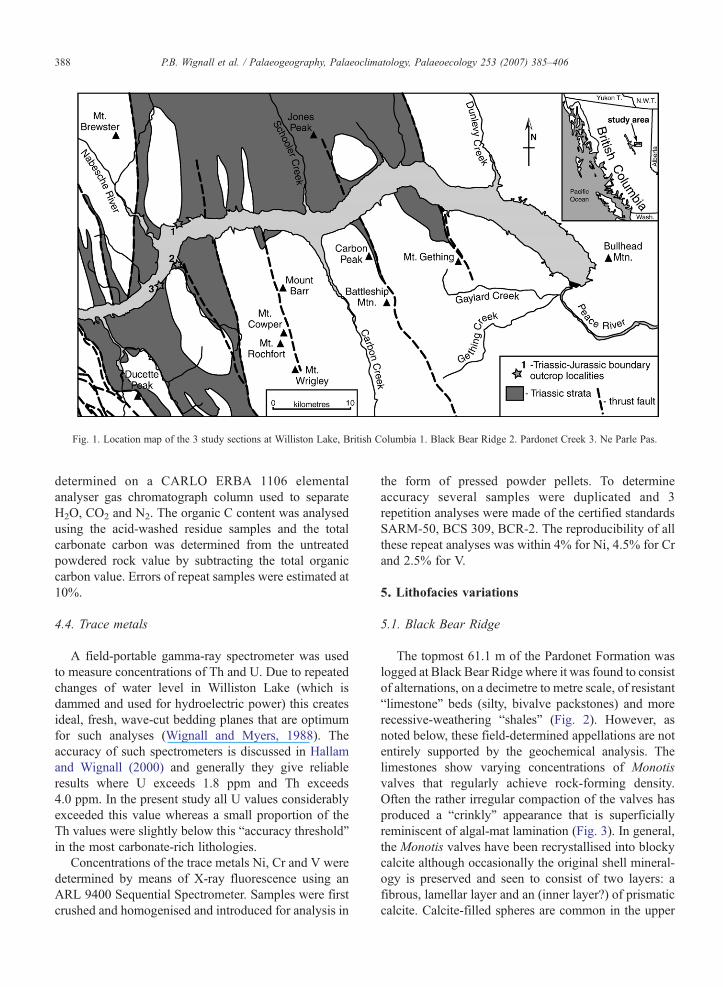
Fig. 1. Location map of the 3 study sections at Williston Lake, British Columbia 1. Black Bear Ridge 2. Pardonet Creek 3. Ne Parle Pas.
388 P.B. Wignall et al. / Palaeogeography, Palaeoclimatology, Palaeoecology 253 (2007) 385–406
determined on a CARLO ERBA 1106 elementalanalyser gas chromatograph column used to separateH2O, CO2 and N2. The organic C content was analysedusing the acid-washed residue samples and the totalcarbonate carbon was determined from the untreatedpowdered rock value by subtracting the total organiccarbon value. Errors of repeat samples were estimated at10%.
4.4. Trace metals
A field-portable gamma-ray spectrometer was usedto measure concentrations of Th and U. Due to repeatedchanges of water level in Williston Lake (which isdammed and used for hydroelectric power) this createsideal, fresh, wave-cut bedding planes that are optimumfor such analyses (Wignall and Myers, 1988). Theaccuracy of such spectrometers is discussed in Hallamand Wignall (2000) and generally they give reliableresults where U exceeds 1.8 ppm and Th exceeds4.0 ppm. In the present study all U values considerablyexceeded this value whereas a small proportion of theTh values were slightly below this “accuracy threshold”in the most carbonate-rich lithologies.
Concentrations of the trace metals Ni, Cr and V weredetermined by means of X-ray fluorescence using anARL 9400 Sequential Spectrometer. Samples were firstcrushed and homogenised and introduced for analysis in
the form of pressed powder pellets. To determineaccuracy several samples were duplicated and 3repetition analyses were made of the certified standardsSARM-50, BCS 309, BCR-2. The reproducibility of allthese repeat analyses was within 4% for Ni, 4.5% for Crand 2.5% for V.
5. Lithofacies variations
5.1. Black Bear Ridge
The topmost 61.1 m of the Pardonet Formation waslogged at Black Bear Ridge where it was found to consistof alternations, on a decimetre to metre scale, of resistant“limestone” beds (silty, bivalve packstones) and morerecessive-weathering “shales” (Fig. 2). However, asnoted below, these field-determined appellations are notentirely supported by the geochemical analysis. Thelimestones show varying concentrations of Monotisvalves that regularly achieve rock-forming density.Often the rather irregular compaction of the valves hasproduced a “crinkly” appearance that is superficiallyreminiscent of algal-mat lamination (Fig. 3). In general,the Monotis valves have been recrystallised into blockycalcite although occasionally the original shell mineral-ogy is preserved and seen to consist of two layers: afibrous, lamellar layer and an (inner layer?) of prismaticcalcite. Calcite-filled spheres are common in the upper
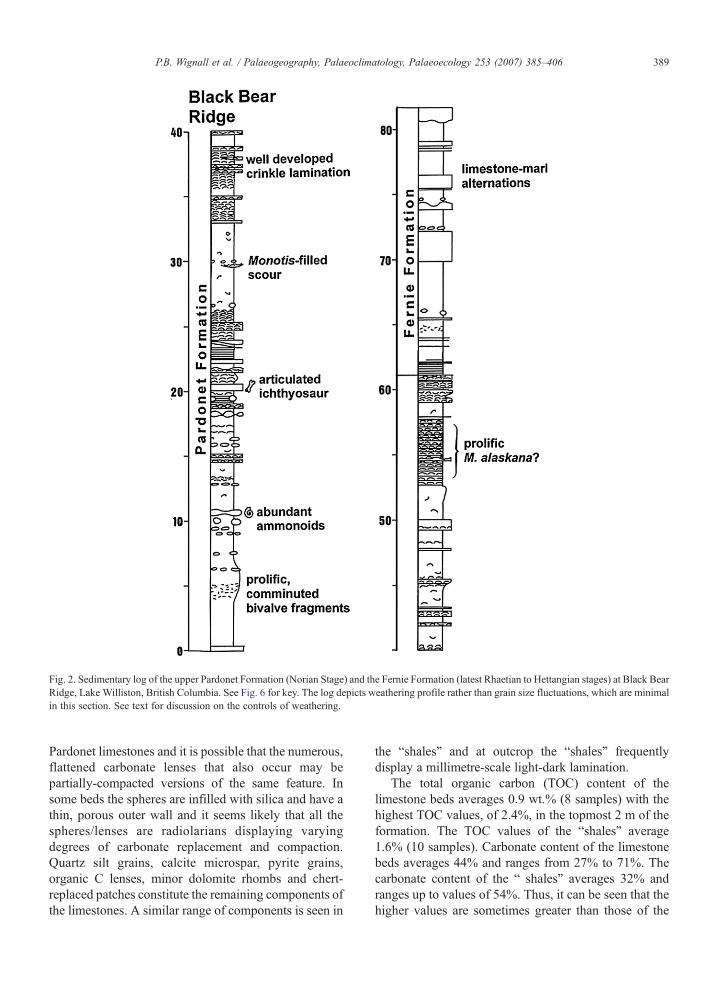
Fig. 2. Sedimentary log of the upper Pardonet Formation (Norian Stage) and the Fernie Formation (latest Rhaetian to Hettangian stages) at Black BearRidge, Lake Williston, British Columbia. See Fig. 6 for key. The log depicts weathering profile rather than grain size fluctuations, which are minimalin this section. See text for discussion on the controls of weathering.
389P.B. Wignall et al. / Palaeogeography, Palaeoclimatology, Palaeoecology 253 (2007) 385–406
Pardonet limestones and it is possible that the numerous,flattened carbonate lenses that also occur may bepartially-compacted versions of the same feature. Insome beds the spheres are infilled with silica and have athin, porous outer wall and it seems likely that all thespheres/lenses are radiolarians displaying varyingdegrees of carbonate replacement and compaction.Quartz silt grains, calcite microspar, pyrite grains,organic C lenses, minor dolomite rhombs and chert-replaced patches constitute the remaining components ofthe limestones. A similar range of components is seen in
the “shales” and at outcrop the “shales” frequentlydisplay a millimetre-scale light-dark lamination.
The total organic carbon (TOC) content of thelimestone beds averages 0.9 wt.% (8 samples) with thehighest TOC values, of 2.4%, in the topmost 2 m of theformation. The TOC values of the “shales” average1.6% (10 samples). Carbonate content of the limestonebeds averages 44% and ranges from 27% to 71%. Thecarbonate content of the “ shales” averages 32% andranges up to values of 54%. Thus, it can be seen that thehigher values are sometimes greater than those of the
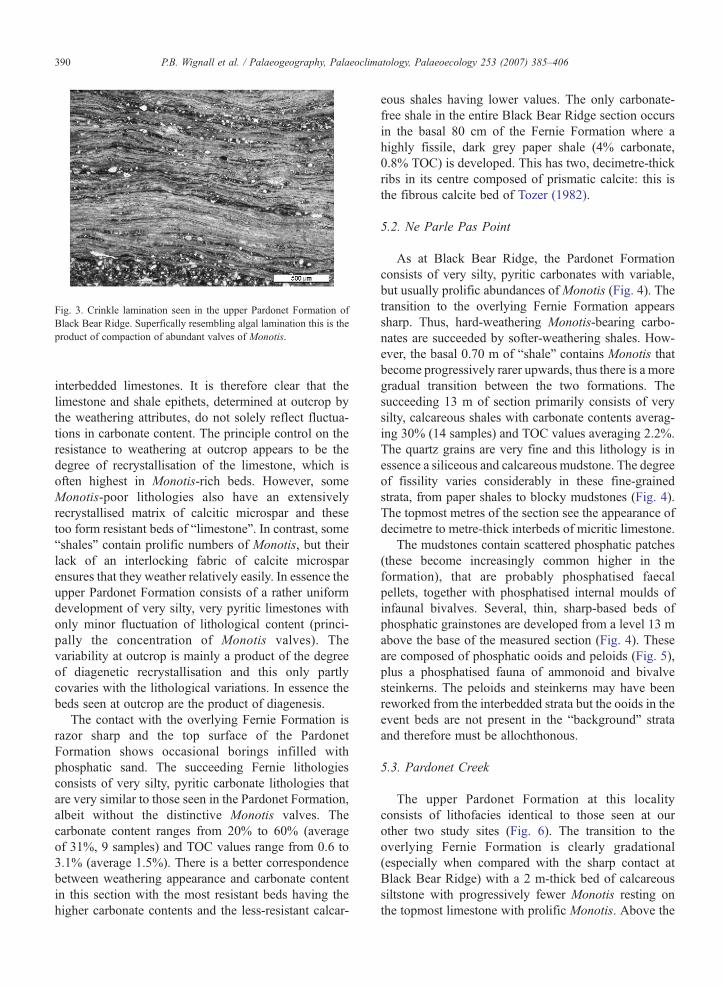
Fig. 3. Crinkle lamination seen in the upper Pardonet Formation ofBlack Bear Ridge. Superfically resembling algal lamination this is theproduct of compaction of abundant valves of Monotis.
390 P.B. Wignall et al. / Palaeogeography, Palaeoclimatology, Palaeoecology 253 (2007) 385–406
interbedded limestones. It is therefore clear that thelimestone and shale epithets, determined at outcrop bythe weathering attributes, do not solely reflect fluctua-tions in carbonate content. The principle control on theresistance to weathering at outcrop appears to be thedegree of recrystallisation of the limestone, which isoften highest in Monotis-rich beds. However, someMonotis-poor lithologies also have an extensivelyrecrystallised matrix of calcitic microspar and thesetoo form resistant beds of “limestone”. In contrast, some“shales” contain prolific numbers of Monotis, but theirlack of an interlocking fabric of calcite microsparensures that they weather relatively easily. In essence theupper Pardonet Formation consists of a rather uniformdevelopment of very silty, very pyritic limestones withonly minor fluctuation of lithological content (princi-pally the concentration of Monotis valves). Thevariability at outcrop is mainly a product of the degreeof diagenetic recrystallisation and this only partlycovaries with the lithological variations. In essence thebeds seen at outcrop are the product of diagenesis.
The contact with the overlying Fernie Formation israzor sharp and the top surface of the PardonetFormation shows occasional borings infilled withphosphatic sand. The succeeding Fernie lithologiesconsists of very silty, pyritic carbonate lithologies thatare very similar to those seen in the Pardonet Formation,albeit without the distinctive Monotis valves. Thecarbonate content ranges from 20% to 60% (averageof 31%, 9 samples) and TOC values range from 0.6 to3.1% (average 1.5%). There is a better correspondencebetween weathering appearance and carbonate contentin this section with the most resistant beds having thehigher carbonate contents and the less-resistant calcar-
eous shales having lower values. The only carbonate-free shale in the entire Black Bear Ridge section occursin the basal 80 cm of the Fernie Formation where ahighly fissile, dark grey paper shale (4% carbonate,0.8% TOC) is developed. This has two, decimetre-thickribs in its centre composed of prismatic calcite: this isthe fibrous calcite bed of Tozer (1982).
5.2. Ne Parle Pas Point
As at Black Bear Ridge, the Pardonet Formationconsists of very silty, pyritic carbonates with variable,but usually prolific abundances ofMonotis (Fig. 4). Thetransition to the overlying Fernie Formation appearssharp. Thus, hard-weathering Monotis-bearing carbo-nates are succeeded by softer-weathering shales. How-ever, the basal 0.70 m of “shale” contains Monotis thatbecome progressively rarer upwards, thus there is a moregradual transition between the two formations. Thesucceeding 13 m of section primarily consists of verysilty, calcareous shales with carbonate contents averag-ing 30% (14 samples) and TOC values averaging 2.2%.The quartz grains are very fine and this lithology is inessence a siliceous and calcareous mudstone. The degreeof fissility varies considerably in these fine-grainedstrata, from paper shales to blocky mudstones (Fig. 4).The topmost metres of the section see the appearance ofdecimetre to metre-thick interbeds of micritic limestone.
The mudstones contain scattered phosphatic patches(these become increasingly common higher in theformation), that are probably phosphatised faecalpellets, together with phosphatised internal moulds ofinfaunal bivalves. Several, thin, sharp-based beds ofphosphatic grainstones are developed from a level 13 mabove the base of the measured section (Fig. 4). Theseare composed of phosphatic ooids and peloids (Fig. 5),plus a phosphatised fauna of ammonoid and bivalvesteinkerns. The peloids and steinkerns may have beenreworked from the interbedded strata but the ooids in theevent beds are not present in the “background” strataand therefore must be allochthonous.
5.3. Pardonet Creek
The upper Pardonet Formation at this localityconsists of lithofacies identical to those seen at ourother two study sites (Fig. 6). The transition to theoverlying Fernie Formation is clearly gradational(especially when compared with the sharp contact atBlack Bear Ridge) with a 2 m-thick bed of calcareoussiltstone with progressively fewer Monotis resting onthe topmost limestone with prolific Monotis. Above the
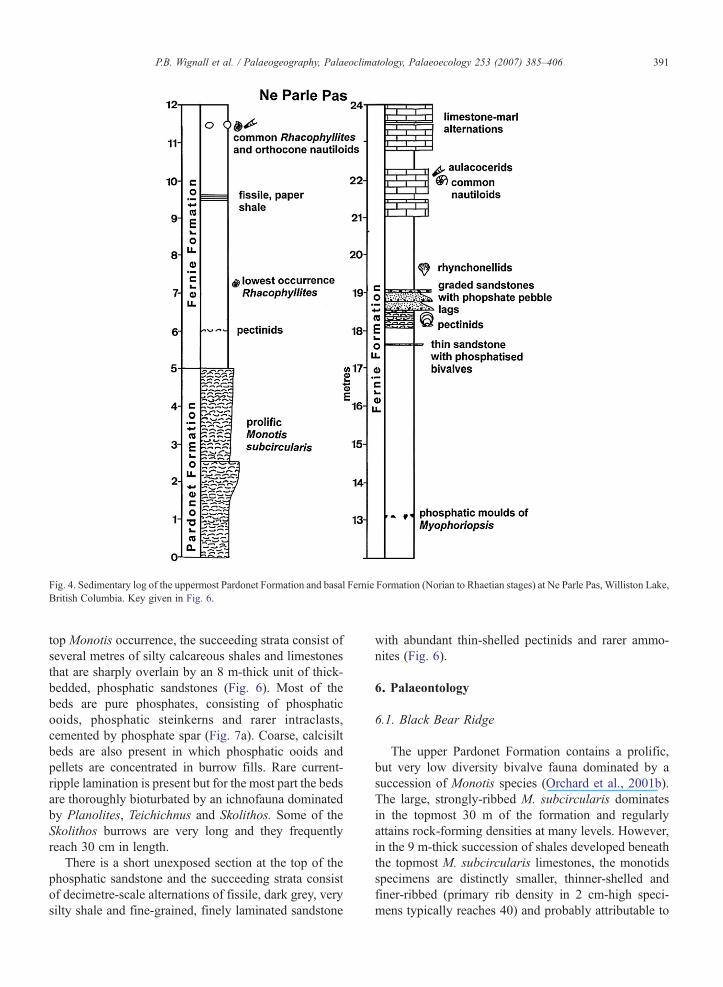
Fig. 4. Sedimentary log of the uppermost Pardonet Formation and basal Fernie Formation (Norian to Rhaetian stages) at Ne Parle Pas, Williston Lake,British Columbia. Key given in Fig. 6.
391P.B. Wignall et al. / Palaeogeography, Palaeoclimatology, Palaeoecology 253 (2007) 385–406
top Monotis occurrence, the succeeding strata consist ofseveral metres of silty calcareous shales and limestonesthat are sharply overlain by an 8 m-thick unit of thick-bedded, phosphatic sandstones (Fig. 6). Most of thebeds are pure phosphates, consisting of phosphaticooids, phosphatic steinkerns and rarer intraclasts,cemented by phosphate spar (Fig. 7a). Coarse, calcisiltbeds are also present in which phosphatic ooids andpellets are concentrated in burrow fills. Rare current-ripple lamination is present but for the most part the bedsare thoroughly bioturbated by an ichnofauna dominatedby Planolites, Teichichnus and Skolithos. Some of theSkolithos burrows are very long and they frequentlyreach 30 cm in length.
There is a short unexposed section at the top of thephosphatic sandstone and the succeeding strata consistof decimetre-scale alternations of fissile, dark grey, verysilty shale and fine-grained, finely laminated sandstone
with abundant thin-shelled pectinids and rarer ammo-nites (Fig. 6).
6. Palaeontology
6.1. Black Bear Ridge
The upper Pardonet Formation contains a prolific,but very low diversity bivalve fauna dominated by asuccession of Monotis species (Orchard et al., 2001b).The large, strongly-ribbed M. subcircularis dominatesin the topmost 30 m of the formation and regularlyattains rock-forming densities at many levels. However,in the 9 m-thick succession of shales developed beneaththe topmost M. subcircularis limestones, the monotidsspecimens are distinctly smaller, thinner-shelled andfiner-ribbed (primary rib density in 2 cm-high speci-mens typically reaches 40) and probably attributable to
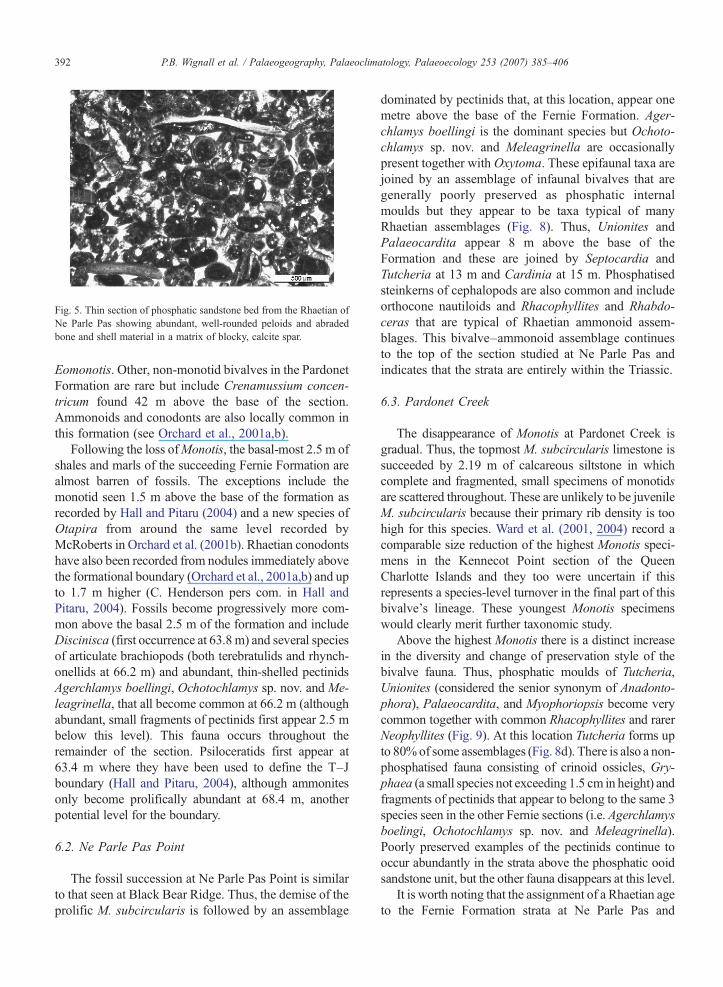
Fig. 5. Thin section of phosphatic sandstone bed from the Rhaetian ofNe Parle Pas showing abundant, well-rounded peloids and abradedbone and shell material in a matrix of blocky, calcite spar.
392 P.B. Wignall et al. / Palaeogeography, Palaeoclimatology, Palaeoecology 253 (2007) 385–406
Eomonotis. Other, non-monotid bivalves in the PardonetFormation are rare but include Crenamussium concen-tricum found 42 m above the base of the section.Ammonoids and conodonts are also locally common inthis formation (see Orchard et al., 2001a,b).
Following the loss ofMonotis, the basal-most 2.5 m ofshales and marls of the succeeding Fernie Formation arealmost barren of fossils. The exceptions include themonotid seen 1.5 m above the base of the formation asrecorded by Hall and Pitaru (2004) and a new species ofOtapira from around the same level recorded byMcRoberts in Orchard et al. (2001b). Rhaetian conodontshave also been recorded from nodules immediately abovethe formational boundary (Orchard et al., 2001a,b) and upto 1.7 m higher (C. Henderson pers com. in Hall andPitaru, 2004). Fossils become progressively more com-mon above the basal 2.5 m of the formation and includeDiscinisca (first occurrence at 63.8 m) and several speciesof articulate brachiopods (both terebratulids and rhynch-onellids at 66.2 m) and abundant, thin-shelled pectinidsAgerchlamys boellingi, Ochotochlamys sp. nov. and Me-leagrinella, that all become common at 66.2 m (althoughabundant, small fragments of pectinids first appear 2.5 mbelow this level). This fauna occurs throughout theremainder of the section. Psiloceratids first appear at63.4 m where they have been used to define the T–Jboundary (Hall and Pitaru, 2004), although ammonitesonly become prolifically abundant at 68.4 m, anotherpotential level for the boundary.
6.2. Ne Parle Pas Point
The fossil succession at Ne Parle Pas Point is similarto that seen at Black Bear Ridge. Thus, the demise of theprolific M. subcircularis is followed by an assemblage
dominated by pectinids that, at this location, appear onemetre above the base of the Fernie Formation. Ager-chlamys boellingi is the dominant species but Ochoto-chlamys sp. nov. and Meleagrinella are occasionallypresent together with Oxytoma. These epifaunal taxa arejoined by an assemblage of infaunal bivalves that aregenerally poorly preserved as phosphatic internalmoulds but they appear to be taxa typical of manyRhaetian assemblages (Fig. 8). Thus, Unionites andPalaeocardita appear 8 m above the base of theFormation and these are joined by Septocardia andTutcheria at 13 m and Cardinia at 15 m. Phosphatisedsteinkerns of cephalopods are also common and includeorthocone nautiloids and Rhacophyllites and Rhabdo-ceras that are typical of Rhaetian ammonoid assem-blages. This bivalve–ammonoid assemblage continuesto the top of the section studied at Ne Parle Pas andindicates that the strata are entirely within the Triassic.
6.3. Pardonet Creek
The disappearance of Monotis at Pardonet Creek isgradual. Thus, the topmost M. subcircularis limestone issucceeded by 2.19 m of calcareous siltstone in whichcomplete and fragmented, small specimens of monotidsare scattered throughout. These are unlikely to be juvenileM. subcircularis because their primary rib density is toohigh for this species. Ward et al. (2001, 2004) record acomparable size reduction of the highest Monotis speci-mens in the Kennecot Point section of the QueenCharlotte Islands and they too were uncertain if thisrepresents a species-level turnover in the final part of thisbivalve's lineage. These youngest Monotis specimenswould clearly merit further taxonomic study.
Above the highest Monotis there is a distinct increasein the diversity and change of preservation style of thebivalve fauna. Thus, phosphatic moulds of Tutcheria,Unionites (considered the senior synonym of Anadonto-phora), Palaeocardita, and Myophoriopsis become verycommon together with common Rhacophyllites and rarerNeophyllites (Fig. 9). At this location Tutcheria forms upto 80%of some assemblages (Fig. 8d). There is also a non-phosphatised fauna consisting of crinoid ossicles, Gry-phaea (a small species not exceeding 1.5 cm in height) andfragments of pectinids that appear to belong to the same 3species seen in the other Fernie sections (i.e. Agerchlamysboelingi, Ochotochlamys sp. nov. and Meleagrinella).Poorly preserved examples of the pectinids continue tooccur abundantly in the strata above the phosphatic ooidsandstone unit, but the other fauna disappears at this level.
It is worth noting that the assignment of a Rhaetian ageto the Fernie Formation strata at Ne Parle Pas and
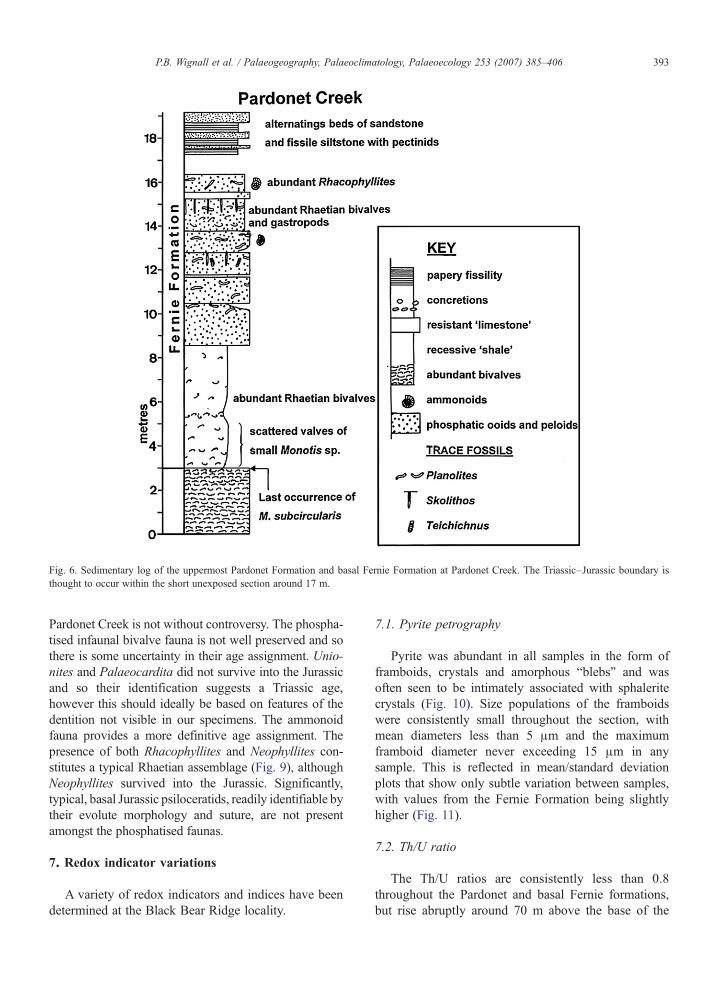
Fig. 6. Sedimentary log of the uppermost Pardonet Formation and basal Fernie Formation at Pardonet Creek. The Triassic–Jurassic boundary isthought to occur within the short unexposed section around 17 m.
393P.B. Wignall et al. / Palaeogeography, Palaeoclimatology, Palaeoecology 253 (2007) 385–406
Pardonet Creek is not without controversy. The phospha-tised infaunal bivalve fauna is not well preserved and sothere is some uncertainty in their age assignment. Unio-nites and Palaeocardita did not survive into the Jurassicand so their identification suggests a Triassic age,however this should ideally be based on features of thedentition not visible in our specimens. The ammonoidfauna provides a more definitive age assignment. Thepresence of both Rhacophyllites and Neophyllites con-stitutes a typical Rhaetian assemblage (Fig. 9), althoughNeophyllites survived into the Jurassic. Significantly,typical, basal Jurassic psiloceratids, readily identifiable bytheir evolute morphology and suture, are not presentamongst the phosphatised faunas.
7. Redox indicator variations
A variety of redox indicators and indices have beendetermined at the Black Bear Ridge locality.
7.1. Pyrite petrography
Pyrite was abundant in all samples in the form offramboids, crystals and amorphous “blebs” and wasoften seen to be intimately associated with sphaleritecrystals (Fig. 10). Size populations of the framboidswere consistently small throughout the section, withmean diameters less than 5 μm and the maximumframboid diameter never exceeding 15 μm in anysample. This is reflected in mean/standard deviationplots that show only subtle variation between samples,with values from the Fernie Formation being slightlyhigher (Fig. 11).
7.2. Th/U ratio
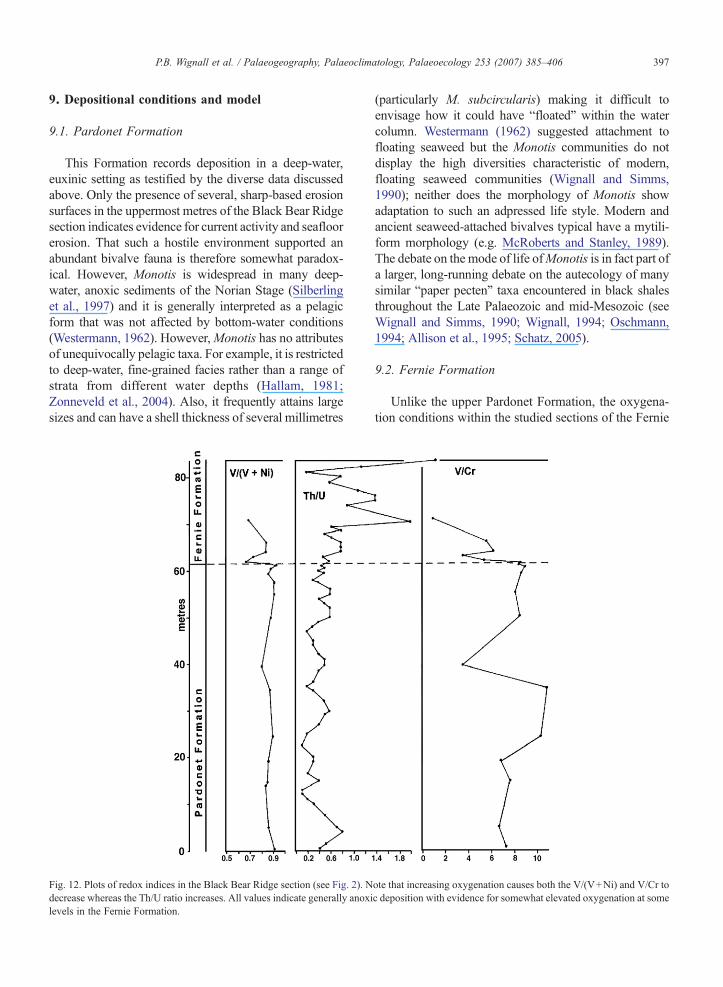
The Th/U ratios are consistently less than 0.8throughout the Pardonet and basal Fernie formations,but rise abruptly around 70 m above the base of the
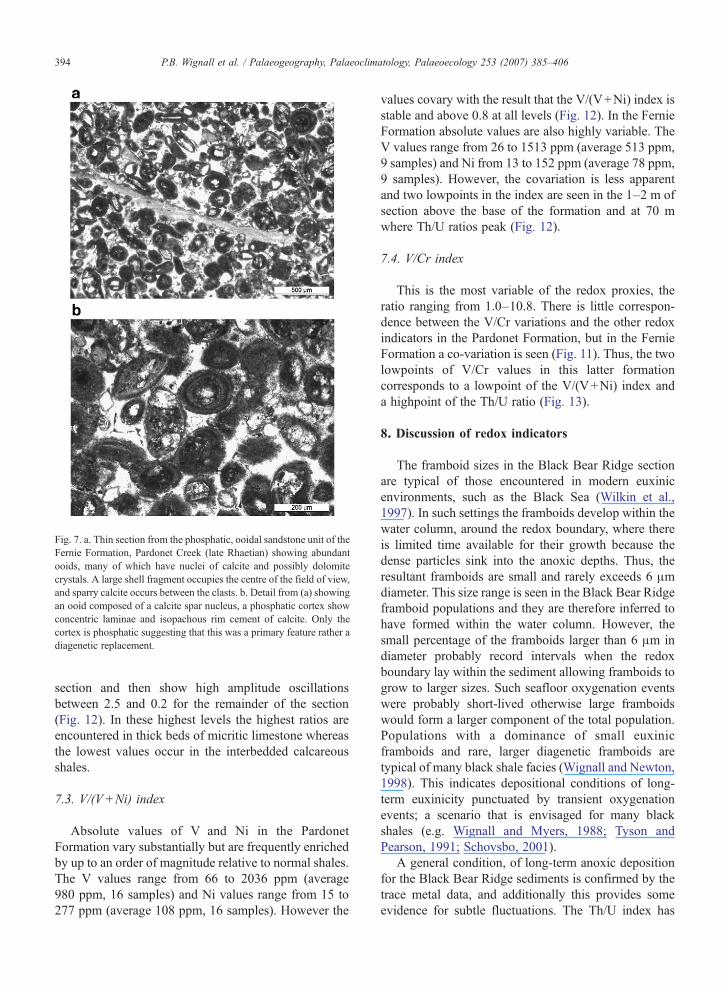
Fig. 7. a. Thin section from the phosphatic, ooidal sandstone unit of theFernie Formation, Pardonet Creek (late Rhaetian) showing abundantooids, many of which have nuclei of calcite and possibly dolomitecrystals. A large shell fragment occupies the centre of the field of view,and sparry calcite occurs between the clasts. b. Detail from (a) showingan ooid composed of a calcite spar nucleus, a phosphatic cortex showconcentric laminae and isopachous rim cement of calcite. Only thecortex is phosphatic suggesting that this was a primary feature rather adiagenetic replacement.
394 P.B. Wignall et al. / Palaeogeography, Palaeoclimatology, Palaeoecology 253 (2007) 385–406
section and then show high amplitude oscillationsbetween 2.5 and 0.2 for the remainder of the section(Fig. 12). In these highest levels the highest ratios areencountered in thick beds of micritic limestone whereasthe lowest values occur in the interbedded calcareousshales.
7.3. V/(V+Ni) index
Absolute values of V and Ni in the PardonetFormation vary substantially but are frequently enrichedby up to an order of magnitude relative to normal shales.The V values range from 66 to 2036 ppm (average980 ppm, 16 samples) and Ni values range from 15 to277 ppm (average 108 ppm, 16 samples). However the
values covary with the result that the V/(V+Ni) index isstable and above 0.8 at all levels (Fig. 12). In the FernieFormation absolute values are also highly variable. TheV values range from 26 to 1513 ppm (average 513 ppm,9 samples) and Ni from 13 to 152 ppm (average 78 ppm,9 samples). However, the covariation is less apparentand two lowpoints in the index are seen in the 1–2 m ofsection above the base of the formation and at 70 mwhere Th/U ratios peak (Fig. 12).
7.4. V/Cr index
This is the most variable of the redox proxies, theratio ranging from 1.0–10.8. There is little correspon-dence between the V/Cr variations and the other redoxindicators in the Pardonet Formation, but in the FernieFormation a co-variation is seen (Fig. 11). Thus, the twolowpoints of V/Cr values in this latter formationcorresponds to a lowpoint of the V/(V+Ni) index anda highpoint of the Th/U ratio (Fig. 13).
8. Discussion of redox indicators
The framboid sizes in the Black Bear Ridge sectionare typical of those encountered in modern euxinicenvironments, such as the Black Sea (Wilkin et al.,1997). In such settings the framboids develop within thewater column, around the redox boundary, where thereis limited time available for their growth because thedense particles sink into the anoxic depths. Thus, theresultant framboids are small and rarely exceeds 6 μmdiameter. This size range is seen in the Black Bear Ridgeframboid populations and they are therefore inferred tohave formed within the water column. However, thesmall percentage of the framboids larger than 6 μm indiameter probably record intervals when the redoxboundary lay within the sediment allowing framboids togrow to larger sizes. Such seafloor oxygenation eventswere probably short-lived otherwise large framboidswould form a larger component of the total population.Populations with a dominance of small euxinicframboids and rare, larger diagenetic framboids aretypical of many black shale facies (Wignall and Newton,1998). This indicates depositional conditions of long-term euxinicity punctuated by transient oxygenationevents; a scenario that is envisaged for many blackshales (e.g. Wignall and Myers, 1988; Tyson andPearson, 1991; Schovsbo, 2001).
A general condition, of long-term anoxic depositionfor the Black Bear Ridge sediments is confirmed by thetrace metal data, and additionally this provides someevidence for subtle fluctuations. The Th/U index has
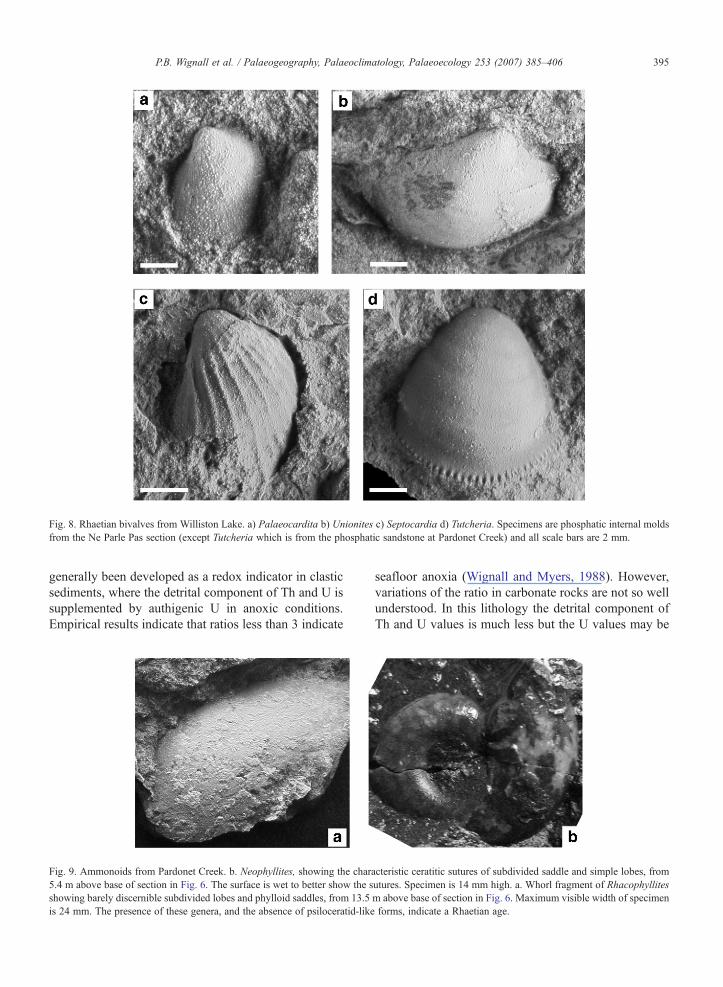
Fig. 8. Rhaetian bivalves from Williston Lake. a) Palaeocardita b) Unionites c) Septocardia d) Tutcheria. Specimens are phosphatic internal moldsfrom the Ne Parle Pas section (except Tutcheria which is from the phosphatic sandstone at Pardonet Creek) and all scale bars are 2 mm.
395P.B. Wignall et al. / Palaeogeography, Palaeoclimatology, Palaeoecology 253 (2007) 385–406
generally been developed as a redox indicator in clasticsediments, where the detrital component of Th and U issupplemented by authigenic U in anoxic conditions.Empirical results indicate that ratios less than 3 indicate
Fig. 9. Ammonoids from Pardonet Creek. b. Neophyllites, showing the char5.4 m above base of section in Fig. 6. The surface is wet to better show the sshowing barely discernible subdivided lobes and phylloid saddles, from 13.5is 24 mm. The presence of these genera, and the absence of psiloceratid-like
seafloor anoxia (Wignall and Myers, 1988). However,variations of the ratio in carbonate rocks are not so wellunderstood. In this lithology the detrital component ofTh and U values is much less but the U values may be
acteristic ceratitic sutures of subdivided saddle and simple lobes, fromutures. Specimen is 14 mm high. a. Whorl fragment of Rhacophyllitesm above base of section in Fig. 6. Maximum visible width of specimenforms, indicate a Rhaetian age.
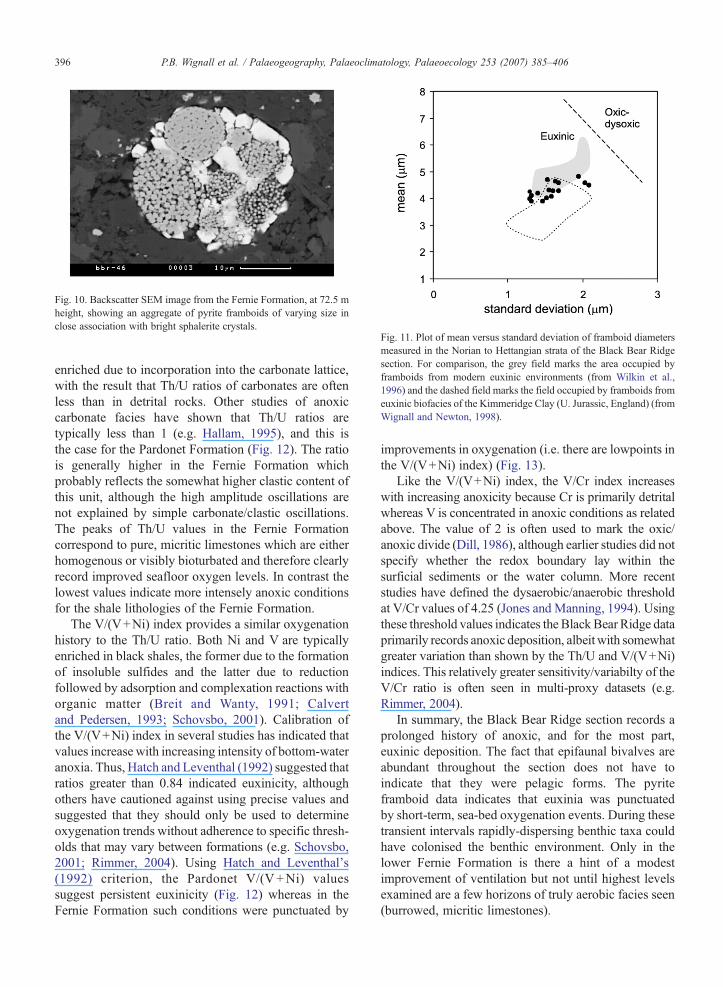
Fig. 10. Backscatter SEM image from the Fernie Formation, at 72.5 mheight, showing an aggregate of pyrite framboids of varying size inclose association with bright sphalerite crystals.
Fig. 11. Plot of mean versus standard deviation of framboid diametersmeasured in the Norian to Hettangian strata of the Black Bear Ridgesection. For comparison, the grey field marks the area occupied byframboids from modern euxinic environments (from Wilkin et al.,1996) and the dashed field marks the field occupied by framboids fromeuxinic biofacies of the Kimmeridge Clay (U. Jurassic, England) (fromWignall and Newton, 1998).
396 P.B. Wignall et al. / Palaeogeography, Palaeoclimatology, Palaeoecology 253 (2007) 385–406
enriched due to incorporation into the carbonate lattice,with the result that Th/U ratios of carbonates are oftenless than in detrital rocks. Other studies of anoxiccarbonate facies have shown that Th/U ratios aretypically less than 1 (e.g. Hallam, 1995), and this isthe case for the Pardonet Formation (Fig. 12). The ratiois generally higher in the Fernie Formation whichprobably reflects the somewhat higher clastic content ofthis unit, although the high amplitude oscillations arenot explained by simple carbonate/clastic oscillations.The peaks of Th/U values in the Fernie Formationcorrespond to pure, micritic limestones which are eitherhomogenous or visibly bioturbated and therefore clearlyrecord improved seafloor oxygen levels. In contrast thelowest values indicate more intensely anoxic conditionsfor the shale lithologies of the Fernie Formation.
The V/(V+Ni) index provides a similar oxygenationhistory to the Th/U ratio. Both Ni and V are typicallyenriched in black shales, the former due to the formationof insoluble sulfides and the latter due to reductionfollowed by adsorption and complexation reactions withorganic matter (Breit and Wanty, 1991; Calvertand Pedersen, 1993; Schovsbo, 2001). Calibration ofthe V/(V+Ni) index in several studies has indicated thatvalues increase with increasing intensity of bottom-wateranoxia. Thus, Hatch and Leventhal (1992) suggested thatratios greater than 0.84 indicated euxinicity, althoughothers have cautioned against using precise values andsuggested that they should only be used to determineoxygenation trends without adherence to specific thresh-olds that may vary between formations (e.g. Schovsbo,2001; Rimmer, 2004). Using Hatch and Leventhal's(1992) criterion, the Pardonet V/(V+Ni) valuessuggest persistent euxinicity (Fig. 12) whereas in theFernie Formation such conditions were punctuated by
improvements in oxygenation (i.e. there are lowpoints inthe V/(V+Ni) index) (Fig. 13).
Like the V/(V+Ni) index, the V/Cr index increaseswith increasing anoxicity because Cr is primarily detritalwhereas V is concentrated in anoxic conditions as relatedabove. The value of 2 is often used to mark the oxic/anoxic divide (Dill, 1986), although earlier studies did notspecify whether the redox boundary lay within thesurficial sediments or the water column. More recentstudies have defined the dysaerobic/anaerobic thresholdat V/Cr values of 4.25 (Jones and Manning, 1994). Usingthese threshold values indicates the Black Bear Ridge dataprimarily records anoxic deposition, albeit with somewhatgreater variation than shown by the Th/U and V/(V+Ni)indices. This relatively greater sensitivity/variabilty of theV/Cr ratio is often seen in multi-proxy datasets (e.g.Rimmer, 2004).
In summary, the Black Bear Ridge section records aprolonged history of anoxic, and for the most part,euxinic deposition. The fact that epifaunal bivalves areabundant throughout the section does not have toindicate that they were pelagic forms. The pyriteframboid data indicates that euxinia was punctuatedby short-term, sea-bed oxygenation events. During thesetransient intervals rapidly-dispersing benthic taxa couldhave colonised the benthic environment. Only in thelower Fernie Formation is there a hint of a modestimprovement of ventilation but not until highest levelsexamined are a few horizons of truly aerobic facies seen(burrowed, micritic limestones).
397P.B. Wignall et al. / Palaeogeography, Palaeoclimatology, Palaeoecology 253 (2007) 385–406
9. Depositional conditions and model
9.1. Pardonet Formation
This Formation records deposition in a deep-water,euxinic setting as testified by the diverse data discussedabove. Only the presence of several, sharp-based erosionsurfaces in the uppermost metres of the Black Bear Ridgesection indicates evidence for current activity and seafloorerosion. That such a hostile environment supported anabundant bivalve fauna is therefore somewhat paradox-ical. However, Monotis is widespread in many deep-water, anoxic sediments of the Norian Stage (Silberlinget al., 1997) and it is generally interpreted as a pelagicform that was not affected by bottom-water conditions(Westermann, 1962). However,Monotis has no attributesof unequivocally pelagic taxa. For example, it is restrictedto deep-water, fine-grained facies rather than a range ofstrata from different water depths (Hallam, 1981;Zonneveld et al., 2004). Also, it frequently attains largesizes and can have a shell thickness of several millimetres
Fig. 12. Plots of redox indices in the Black Bear Ridge section (see Fig. 2). Ndecrease whereas the Th/U ratio increases. All values indicate generally anoxilevels in the Fernie Formation.
(particularly M. subcircularis) making it difficult toenvisage how it could have “floated” within the watercolumn. Westermann (1962) suggested attachment tofloating seaweed but the Monotis communities do notdisplay the high diversities characteristic of modern,floating seaweed communities (Wignall and Simms,1990); neither does the morphology of Monotis showadaptation to such an adpressed life style. Modern andancient seaweed-attached bivalves typical have a mytili-form morphology (e.g. McRoberts and Stanley, 1989).The debate on the mode of life ofMonotis is in fact part ofa larger, long-running debate on the autecology of manysimilar “paper pecten” taxa encountered in black shalesthroughout the Late Palaeozoic and mid-Mesozoic (seeWignall and Simms, 1990; Wignall, 1994; Oschmann,1994; Allison et al., 1995; Schatz, 2005).
9.2. Fernie Formation
Unlike the upper Pardonet Formation, the oxygena-tion conditions within the studied sections of the Fernie
ote that increasing oxygenation causes both the V/(V+Ni) and V/Cr toc deposition with evidence for somewhat elevated oxygenation at some
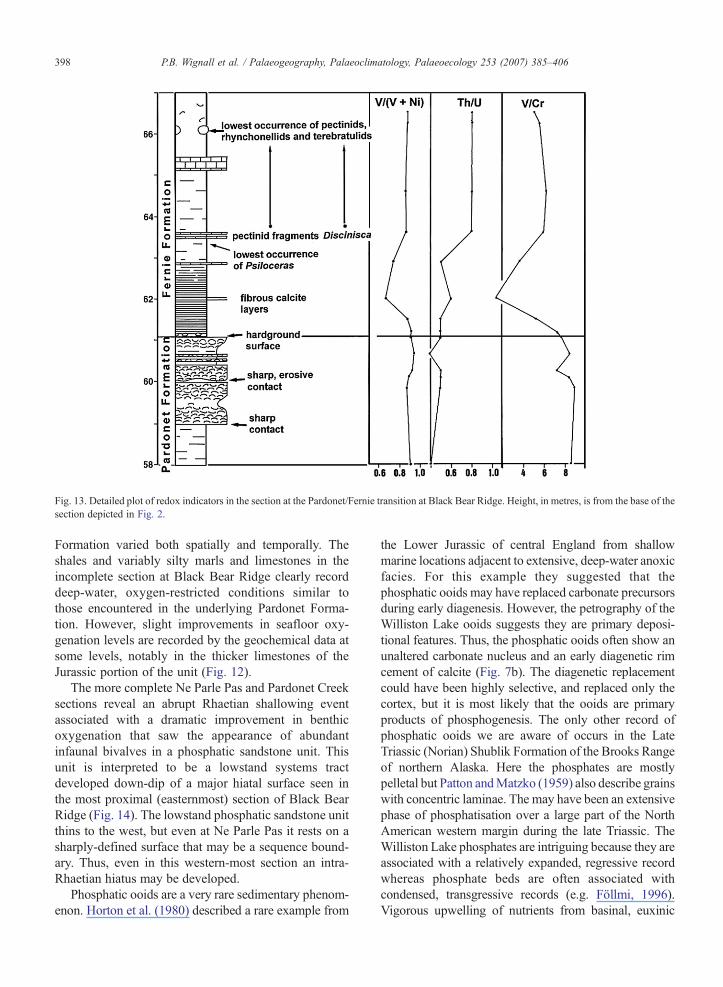
Fig. 13. Detailed plot of redox indicators in the section at the Pardonet/Fernie transition at Black Bear Ridge. Height, in metres, is from the base of thesection depicted in Fig. 2.
398 P.B. Wignall et al. / Palaeogeography, Palaeoclimatology, Palaeoecology 253 (2007) 385–406
Formation varied both spatially and temporally. Theshales and variably silty marls and limestones in theincomplete section at Black Bear Ridge clearly recorddeep-water, oxygen-restricted conditions similar tothose encountered in the underlying Pardonet Forma-tion. However, slight improvements in seafloor oxy-genation levels are recorded by the geochemical data atsome levels, notably in the thicker limestones of theJurassic portion of the unit (Fig. 12).
The more complete Ne Parle Pas and Pardonet Creeksections reveal an abrupt Rhaetian shallowing eventassociated with a dramatic improvement in benthicoxygenation that saw the appearance of abundantinfaunal bivalves in a phosphatic sandstone unit. Thisunit is interpreted to be a lowstand systems tractdeveloped down-dip of a major hiatal surface seen inthe most proximal (easternmost) section of Black BearRidge (Fig. 14). The lowstand phosphatic sandstone unitthins to the west, but even at Ne Parle Pas it rests on asharply-defined surface that may be a sequence bound-ary. Thus, even in this western-most section an intra-Rhaetian hiatus may be developed.
Phosphatic ooids are a very rare sedimentary phenom-enon. Horton et al. (1980) described a rare example from
the Lower Jurassic of central England from shallowmarine locations adjacent to extensive, deep-water anoxicfacies. For this example they suggested that thephosphatic ooids may have replaced carbonate precursorsduring early diagenesis. However, the petrography of theWilliston Lake ooids suggests they are primary deposi-tional features. Thus, the phosphatic ooids often show anunaltered carbonate nucleus and an early diagenetic rimcement of calcite (Fig. 7b). The diagenetic replacementcould have been highly selective, and replaced only thecortex, but it is most likely that the ooids are primaryproducts of phosphogenesis. The only other record ofphosphatic ooids we are aware of occurs in the LateTriassic (Norian) Shublik Formation of the Brooks Rangeof northern Alaska. Here the phosphates are mostlypelletal but Patton andMatzko (1959) also describe grainswith concentric laminae. The may have been an extensivephase of phosphatisation over a large part of the NorthAmerican western margin during the late Triassic. TheWilliston Lake phosphates are intriguing because they areassociated with a relatively expanded, regressive recordwhereas phosphate beds are often associated withcondensed, transgressive records (e.g. Föllmi, 1996).Vigorous upwelling of nutrients from basinal, euxinic
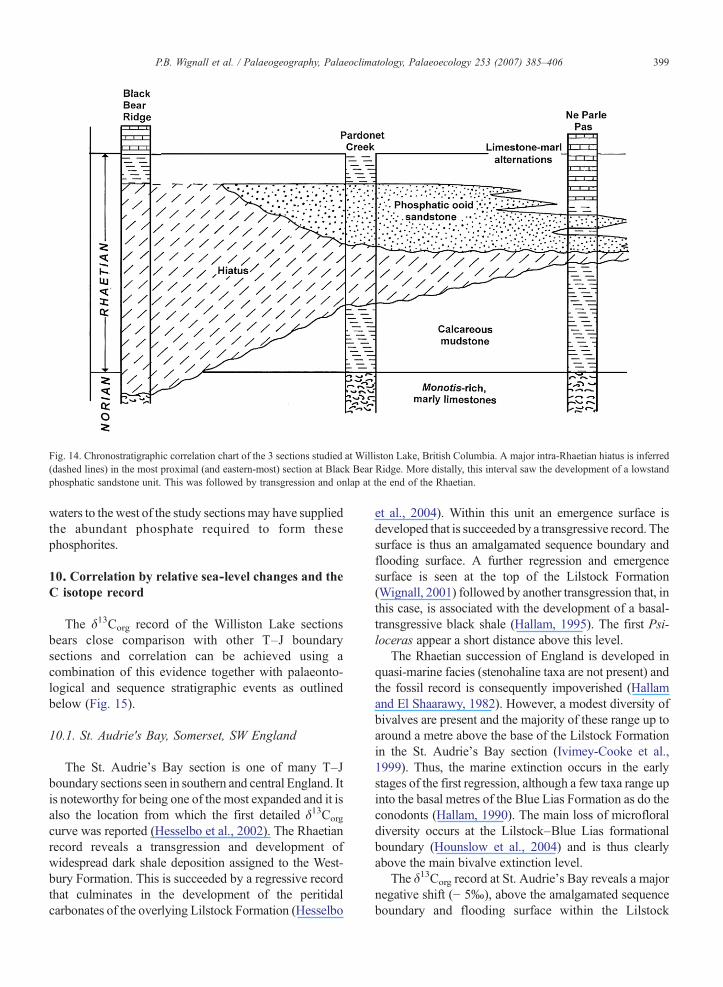
Fig. 14. Chronostratigraphic correlation chart of the 3 sections studied at Williston Lake, British Columbia. A major intra-Rhaetian hiatus is inferred(dashed lines) in the most proximal (and eastern-most) section at Black Bear Ridge. More distally, this interval saw the development of a lowstandphosphatic sandstone unit. This was followed by transgression and onlap at the end of the Rhaetian.
399P.B. Wignall et al. / Palaeogeography, Palaeoclimatology, Palaeoecology 253 (2007) 385–406
waters to the west of the study sectionsmay have suppliedthe abundant phosphate required to form thesephosphorites.
10. Correlation by relative sea-level changes and theC isotope record
The δ13Corg record of the Williston Lake sectionsbears close comparison with other T–J boundarysections and correlation can be achieved using acombination of this evidence together with palaeonto-logical and sequence stratigraphic events as outlinedbelow (Fig. 15).
10.1. St. Audrie's Bay, Somerset, SW England
The St. Audrie's Bay section is one of many T–Jboundary sections seen in southern and central England. Itis noteworthy for being one of the most expanded and it isalso the location from which the first detailed δ13Corg
curve was reported (Hesselbo et al., 2002). The Rhaetianrecord reveals a transgression and development ofwidespread dark shale deposition assigned to the West-bury Formation. This is succeeded by a regressive recordthat culminates in the development of the peritidalcarbonates of the overlying Lilstock Formation (Hesselbo
et al., 2004). Within this unit an emergence surface isdeveloped that is succeeded by a transgressive record. Thesurface is thus an amalgamated sequence boundary andflooding surface. A further regression and emergencesurface is seen at the top of the Lilstock Formation(Wignall, 2001) followed by another transgression that, inthis case, is associated with the development of a basal-transgressive black shale (Hallam, 1995). The first Psi-loceras appear a short distance above this level.
The Rhaetian succession of England is developed inquasi-marine facies (stenohaline taxa are not present) andthe fossil record is consequently impoverished (Hallamand El Shaarawy, 1982). However, a modest diversity ofbivalves are present and the majority of these range up toaround a metre above the base of the Lilstock Formationin the St. Audrie's Bay section (Ivimey-Cooke et al.,1999). Thus, the marine extinction occurs in the earlystages of the first regression, although a few taxa range upinto the basal metres of the Blue Lias Formation as do theconodonts (Hallam, 1990). The main loss of microfloraldiversity occurs at the Lilstock–Blue Lias formationalboundary (Hounslow et al., 2004) and is thus clearlyabove the main bivalve extinction level.
The δ13Corg record at St. Audrie's Bay reveals a majornegative shift (− 5‰), above the amalgamated sequenceboundary and flooding surface within the Lilstock
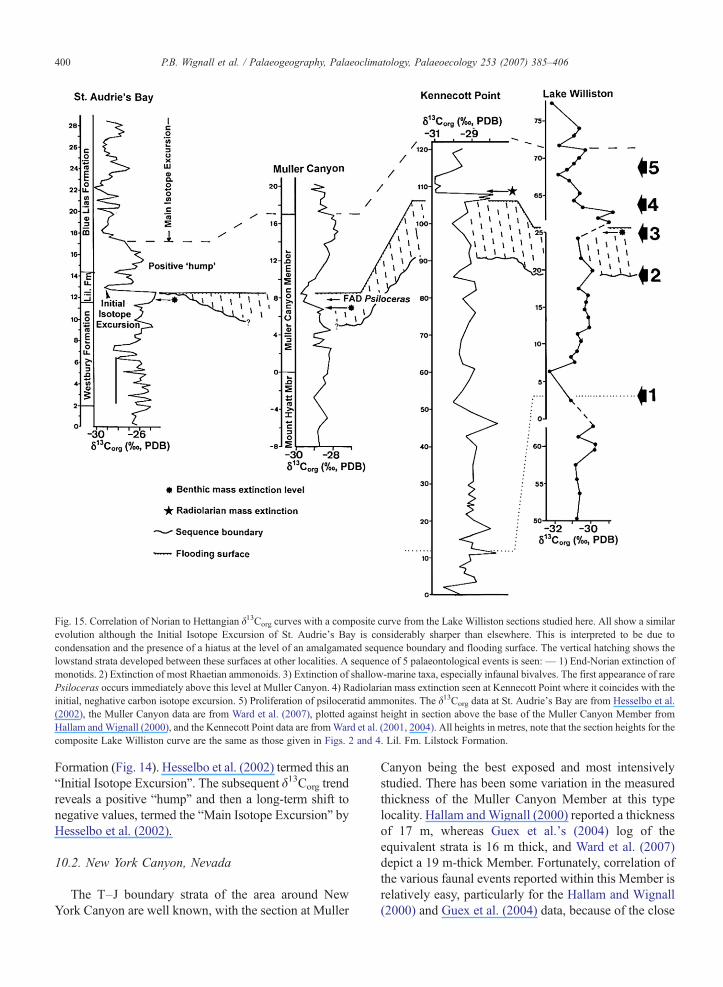
Fig. 15. Correlation of Norian to Hettangian δ13Corg curves with a composite curve from the Lake Williston sections studied here. All show a similarevolution although the Initial Isotope Excursion of St. Audrie's Bay is considerably sharper than elsewhere. This is interpreted to be due tocondensation and the presence of a hiatus at the level of an amalgamated sequence boundary and flooding surface. The vertical hatching shows thelowstand strata developed between these surfaces at other localities. A sequence of 5 palaeontological events is seen:— 1) End-Norian extinction ofmonotids. 2) Extinction of most Rhaetian ammonoids. 3) Extinction of shallow-marine taxa, especially infaunal bivalves. The first appearance of rarePsiloceras occurs immediately above this level at Muller Canyon. 4) Radiolarian mass extinction seen at Kennecott Point where it coincides with theinitial, neghative carbon isotope excursion. 5) Proliferation of psiloceratid ammonites. The δ13Corg data at St. Audrie's Bay are from Hesselbo et al.(2002), the Muller Canyon data are from Ward et al. (2007), plotted against height in section above the base of the Muller Canyon Member fromHallam andWignall (2000), and the Kennecott Point data are fromWard et al. (2001, 2004). All heights in metres, note that the section heights for thecomposite Lake Williston curve are the same as those given in Figs. 2 and 4. Lil. Fm. Lilstock Formation.
400 P.B. Wignall et al. / Palaeogeography, Palaeoclimatology, Palaeoecology 253 (2007) 385–406
Formation (Fig. 14). Hesselbo et al. (2002) termed this an“Initial Isotope Excursion”. The subsequent δ13Corg trendreveals a positive “hump” and then a long-term shift tonegative values, termed the “Main Isotope Excursion” byHesselbo et al. (2002).
10.2. New York Canyon, Nevada
The T–J boundary strata of the area around NewYork Canyon are well known, with the section at Muller
Canyon being the best exposed and most intensivelystudied. There has been some variation in the measuredthickness of the Muller Canyon Member at this typelocality. Hallam andWignall (2000) reported a thicknessof 17 m, whereas Guex et al.'s (2004) log of theequivalent strata is 16 m thick, and Ward et al. (2007)depict a 19 m-thick Member. Fortunately, correlation ofthe various faunal events reported within this Member isrelatively easy, particularly for the Hallam and Wignall(2000) and Guex et al. (2004) data, because of the close
401P.B. Wignall et al. / Palaeogeography, Palaeoclimatology, Palaeoecology 253 (2007) 385–406
similarity of the sequence of beds depicted in the logspublished in these studies. The Hallam and Wignall(2000) heights for the Muller Canyon section are usedhere. Rhaetian strata of the New York Canyon arearecord regression as open-marine limestones of theMount Hyatt Member are succeeded by calcisiltites ofthe Muller Canyon Member (Hallam and Wignall,2000). These become increasingly rich in quartz silt upto the middle of the Member. This level is interpreted tobe the peak of regression (Guex et al., 2004). Ward et al.(2007) argue for a highstand at the base of the MullerCanyon Member but this probably occurred a littlelower, at the top of the Mount Hyatt Member, prior tothe introduction of terrigenous material in the overlyingMuller Canyon Member. The upper Muller CanyonMember records a progressive deepening, indicated by adeclining terrigenous content, and the appearance of athin bed of anoxic, black shale facies, suggesting aflooding surface, at 15.5 m (Hallam and Wignall, 2000;Fig. 15).
The main ammonoid losses at Muller Canyon occuraround the boundary of the Mount Hyatt and MullerCanyon members (Guex et al., 2004; Ward et al., 2007).No ammonoids are then seen until a level around 7.5 mabove the base of the Muller Canyon Member, when thefirst Psiloceras, P. spelae and P. tilmani appear,although prolific Psiloceras do not appear until thetopmost metre of the Member (Guex et al., 2004). Thehighest occurrence of a diverse Triassic assemblage(mostly bivalves but also including orthocone nauti-loids) occurs at 7.0 m above the base of the MullerCanyon Member (Hallam and Wignall, 2000). Abovethis an impoverished bivalve fauna consists of long-ranging forms (Modiolus and Oxytoma) and Agerchla-mys boellingi (reported as Chlamys subcutiformis inHallam and Wignall (2000)); this last species ranges upto 15.5 m.
There have been two studies of the δ13Corg recordfrom the New York Canyon area and they differ insignificant details (Guex et al., 2004; Ward et al., 2007).The data of Ward et al. (2007) are chosen and correlatedhere (Fig. 15), because they are the least likely of thetwo to be altered by weathering (samples were obtainedfrom a trench dug to an impressive depth of 1.5 m) andare more readily correlated with other T–J boundaryrecords. Attempts by Galli et al. (2005) to correlate theMuller Canyon section using the δ13Corg data of Guexet al. (2004) produces a distinctly different interpretationof the mass extinction record as noted below.
The δ13Corg record ofWard et al. (2007) reveals a− 1‰negative spike at a level between 7.5 and 10.0 m in theirmeasured log. Given that their measured section is around
10% thicker than that of Hallam and Wignall (2000) itseems likely that the onset of this excursion occurs at the7.0mmass extinction level recorded in this earlier work. Itis clearly tempting to correlate this negative spike with theInitial Isotope Excursion of St. Audrie's Bay. In theirsequence stratigraphic context both excursions occur in asimilar place, at the turnaround point from a regressivemaximum to the initial stages of relative sea-level rise.Above this level the Ward et al. (2007) record is also verysimilar to that of St. Audrie's Bay. Thus, there is a positive“hump” of δ13Corg values in the upper Muller CanyonMember before a decline to a prolonged interval ofnegative values in the overlying, Psiloceras-rich SunriseFormation.
Using the δ13Corg data of Guex et al. (2004), Galliet al. (2005) have suggested an alternative correlation ofthese two sections in which a single-point spike at thebase of the Muller Canyon Formation is correlated withthe Initial Isotope Excursion. This alternative rendersany sequence stratigraphic correlation between Nevadaand elsewhere problematic.
10.3. Kennecott Point, British Columbia
The Kennecott Point section provides a valuablerecord of contemporaneous events in a Norian–Hettangian deep-water setting dominated by turbiditeand shale deposition (Ward et al., 2001, 2004). TheNorian–Rhaetian transition is marked by a complex, butpositive “hump” of δ13Corg values that have beenequated with a similar record at Williston Lake (Wardet al., 2004). Higher in the Kennecott Point section arapid negative excursion (that coincides with a radio-larian mass extinction) is considered to be the InitialIsotope Excursion of St. Audrie's Bay (Galli et al.,2005). There are potentially sequence stratigraphicsurfaces within the section (although hitherto nonehave been identified) that support this chemostrati-graphic correlation. Thus, approximately 15 m belowthe negative shift of δ13C values Ward et al. (2004)illustrate a sharp transition from shales and siltstones toa 10 m thick package of thick-bedded turbiditesandstones. This in turn is sharply overlain by a 10 m-thick development of black shales. If the turbidite–sandstone package is interpreted to be a lowstandsystems tract (resting on a correlative conformity of asequence boundary) capped by a flooding surface, thenthe Initial Isotopic Excursion can be said to occur withina transgressive systems tract as it also does in Nevadaand England (Fig. 15). The subsequent return to morepositive values of δ13Corg at Kennecott Point thenequates to the positive “hump”.
402 P.B. Wignall et al. / Palaeogeography, Palaeoclimatology, Palaeoecology 253 (2007) 385–406
10.4. Williston Lake
The Williston Lake record is a composite δ13Corg
curve generated from the Ne Parle Pas and Black BearRidge data. At the latter site there is a sharp contactbetween the Pardonet and Fernie formations and theappearance of psiloceratid ammonites a short distanceabove the contact suggests that all but the topmost partof the Rhaetian Stage is absent at this locality (Hall andPitaru, 2003, 2004; Pitaru, 2005). In contrast, at NeParle Pas there is 20 m of post-Monotis strata containingabundant fossils including Rhaetian ammonoids. Thisindicates a substantially more complete Rhaetian Stageand the isotopic record from Ne Parle Pas has thereforebeen inserted into the stratigraphic gap between thePardonet/Fernie formations in the Black Bear Ridgesection to produce a composite curve (Fig. 15).
The resultant curve shows close similarities with theother T–J sections. Thus, the end-Norian demise ofmonotids coincides with a positive excursion. The mainfeature of the Williston record is a major, negative shiftto generally low values a short distance below theappearance of swarm abundances of psilocertids(Fig. 15). This is considered to be the Initial IsotopeExcursion of other sections. This interpretation issupported by the position of both the mass extinctionlevel and the sequence stratigraphic record. Thus, thestrata immediately below the excursion reveals, inascending order, a regression (marked by the sequenceboundary at the base of the phosphatic sandstone), a latelowstand extinction of shallow-water bivalves andfinally, a flooding surface. This history of events isidentical to that seen in Nevada and England. The higherlevels of the Fernie Formation δ13Corg record areinterpreted to be the positive “hump” and Main IsotopeExcursion although they are relatively condensed (orunder sampled) relative to the other sections.
11. Implications for Late Triassic extinctions
Comparison of the environmental and biotic recordin the Williston Lake sections with other T–J boundarysections reveals a similar succession of events that aretherefore inferred to be global phenomena.
11.1. Event 1: End-Norian extinctions
The abrupt disappearance of monotids is one of themost distinctive extinction features of Upper Triassicstrata because the loss of a taxon of such rock-formingabundance caused a major lithological change. It shouldbe noted, however, that most bivalve taxa survived into
the Rhaetian only to succumb during the end-Triassicmass extinction (Hallam, 1981). The end-Norianextinctions are therefore a phenomenon of deep-waterpopulations only. Ward et al. (2004) suggest that theonset of bottom-water anoxia in the basal Rhaetian maybe responsible for these losses. There is evidence for thisin their Queen Charlotte sections where the Monotis aresaid to occur in bioturbated (and therefore oxygenated)strata whilst the overlying strata are laminated and lackbenthos. The positive δ13Corg excursions around thislevel further supports this suggestion because they pointto global elevation of organic C burial rates that could befostered by the widespread development of oceanicanoxia. However, Monotis is typically encountered inlowest dysaerobic biofacies, such as those seen in theWilliston Lake sections, and they appear to have beensupremely well-adapted to survival under very lowoxygen levels. Death-by-anoxia therefore seems anunlikely scenario for this genus at least. Alternatively, achange in nutrient dynamics, associated with the onsetof oceanic anoxia may have been more directlyresponsible for this initial extinction event (Sephtonet al., 2002). There is no evidence for any sea-leveloscillation associated with this biotic crisis.
11.2. Event 2: mid-Rhaetian regression and ammonoidextinction
In the Williston Lake sections there is clear evidencefor the development of a sequence boundary andassociated abrupt downward-shift of facies belts, withthe result that shallow-water facies are intercalatedwithin a succession that is otherwise dominated byoffshore mudrocks. This boundary is equated with thesequence boundary within the Lilstock Formation ofSW England and also with the base of the thick-beddedturbidite unit within the Queen Charlotte succession and(less precisely) with a level low in the Muller CanyonMember (Fig. 15). The ammonoid record, best seen inNevada (Guex et al., 2004), indicates that the principalRhaetian ammonoid extinctions occurred during thisevent or slightly before it, and preferentially eliminatedshallow-water taxa (Guex, 2006).
11.3. Event 3: mass extinction and terminal Triassiclowstand
At Williston Lake the end-Triassic mass extinction isrecorded by the loss of an abundant infaunal bivalvefauna from the lowstand, shallow-water facies devel-oped above the sequence boundary of event 2. It isnoteworthy that the thin-shelled pectinids, that are found
403P.B. Wignall et al. / Palaeogeography, Palaeoclimatology, Palaeoecology 253 (2007) 385–406
in facies from a broad range of water depths, wereunaffected by this extinction. McRoberts and Newton(1995) have similarly noted, from the European bivalverecord, a preferential extinction of infaunal bivalve taxarelative to epifaunal ones. The time-equivalent extinc-tion event at New York Canyon also coincides with peakregression and is similarly marked by a loss of a mostlyinfaunal bivalve fauna (Hallam and Wignall, 2000;Guex et al., 2004). At St. Audrie's Bay the main marineextinctions occur in the early stages of regression andbeneath the sequence boundary of event 2. It is possiblethat the extinction event has been back-smeared in theEnglish sections because the peritidal facies of the laterstages of regression, seen in the basal metres of theLilstock Formation, do not preserve a fossil record ofthese offshore taxa.
Event 3 is the end-Triassic mass extinction of theliterature although the “end-Triassic” designationdepends on the choice of marker for the T–J boundary.If the FAD of Psiloceras in Nevada is used then event 3occurs immediately below (only 0.5 m below at MullerCanyon) the base of the Jurassic. If the first appearanceof prolific psiloceratids is used instead then it remains alatest Triassic event.
11.4. Event 4: radiolarian extinction, transgression andthe Initial Isotopic Excursion
The Williston Lake, New York Canyon and SWEngland sections all show a transgression associatedwith a rapid decline of δ13Corg values of the InitialIsotope Excursion. In the deep-water Queen Charlottesection this event coincides with the development ofblack shale facies and a radiolarian mass extinction(Ward et al., 2001, 2004; Carter and Hori, 2005). Anoxicconditions also reappeared at Williston Lake, followingthe oxygenated interlude of phosphatic sandstonedeposition. It also appears that the final few conodontsdisappeared at this time in the deep-water sections(Pálfy et al., 2000), and also at the base of the FernieFormation at Black Bear Ridge where this topmostRhaetian flooding event is preserved.
Hesselbo et al. (2002) have suggested that the InitialIsotopic Excursion also equates with a palynologicalcrisis in the SW England sections although, as shown byHounslow et al. (2004), this occurs distinctly higherwithin the succeeding positive “hump”. McElwain et al.(1999) use stomatal index data to infer a rapid rise ofatmospheric CO2 in the Triassic–Jurassic boundaryinterval of Greenland which maybe coincident withevent 4 described here. The warming in turn may havedestabilised gas hydrate reservoirs releasing isotopically
light methane and thus contributing to the negativeexcursion and further exacerbating the warming trend(Pálfy et al., 2001). A calcification crisis has also beenadded to the list of contemporary woes (Hautmann,2004; Galli et al., 2005) providing further (somewhatindirect) evidence of elevated atmospheric CO2 levels.The basal 0.80 m of the Fernie Formation at Black BearRidge is the only carbonate-free lithology in the entireNorian-Hettangian section and may be the localexpression of this calcification crisis.
11.5. Event 5: Psiloceratid swarms
The most distinctive faunal event of most T–Jboundary sections is the appearance of spectacularnumbers of psiloceratids. It is tempting to see this as theproliferation of a disaster taxon following massextinction, although this was considerably delayedafter the main ammonoid extinction losses during events1 and 2. In European sections this event closely followsa brief regressive–transgressive sea-level oscillation thathas been related to the onset of Central Atlanticvolcanism (Wignall, 2001). The values of δ13Corg
remain generally low in this earliest Jurassic interval.
11.6. Discussion
Many of the inferred environmental changes of event4 (transgression, rapid and severe global warming,marine anoxia, calcification crisis) are identical to thoseseen during several other extinction crises, notably theend-Permian and Early Jurassic events (Hallam andWignall, 1997, 1999). These changes have been widely“blamed” as the cause of the end-Triassic massextinction too (McElwain et al., 1999; Pálfy et al.,2000, 2001; Beerling and Berner, 2002; Hesselbo et al.,2002; Hautmann, 2004; Galli et al., 2005; Huynh andPoulsen, 2005), although Hallam and Wignall (1999)prefer to relate the mass extinction to the precedingregression. However, the environmental changes ofevent 4 only clearly coincide with the extinction of theconodonts and a radiolarian mass extinction event. AtWilliston Lake it could be argued that the extinctionlosses of events 3 and 4 are part of the same eventbecause the benthic bivalves losses occur at the peak ofregression and so could conceivably have been causedby the spread of anoxic waters in the succeedingtransgression. However, in both the Muller Canyon andSt. Audrie's Bay sections the main benthic extinctionsclearly occur within a regressive sequence (andammonoid losses occurred even earlier) and not duringthe subsequent transgression. It is noteworthy that in
404 P.B. Wignall et al. / Palaeogeography, Palaeoclimatology, Palaeoecology 253 (2007) 385–406
other regions the benthic mass extinction is alsoconsistently seen to occur late in a regressive recordrather than during the subsequent transgression (e.g.McRoberts et al., 1997). At Muller Canyon thedevelopment of anoxic, black shales in the upper MullerCanyon is only associated with the demise of Ager-chlamys boellingi, a species that flourishes in theaftermath of the main extinction event at this locality.
12. Conclusions
Sections exposed on the shores of Williston Lakeprovide a valuable record of the Triassic–Jurassictransition. Deep-water, oxygen-restricted and often in-tensely euxinic conditions dominated throughout much ofthis interval. In the Norian a low diversity and prolificallyabundant Monotis fauna thrived in these conditions butthis disappeared abruptly at the end of the stage.Intensification of anoxia is unlikely to have killed thiseuryoxic taxon but an associated decrease in surface-waternutrient availability may have (Sephton et al., 2002).
The succeeding Rhaetian strata record regression,sequence boundary generation followed by the progra-dation of an unusual phosphatic ooid sandbody intothe area. This very shallower-water facies contain aninfaunal bivalve-dominated fauna that disappeared latein the Rhaetian slightly before a major transgressionassociated with a large, negative δ13Corg excursion. Thissecond extinction event did not affect the epifaunalbivalve assemblages of Williston Lake. The benthiclosses probably predated the radiolarian mass extinctionseen in the Queen Charlotte sections of British Columbiaand thus the mass extinction is seen to display a distinctlynon-synchronous temporal–environmental history.The cause of this second crisis, the end-Triassicmass extinction of the literature, is enigmatic but it isassociated with a eustatic regressive–transgressivecouplet and (in its later stages) with the spread of anoxiaand development of a major, negative δ13Corg excursion.
Acknowledgements
This research was funded by NERC grant NER/B/S/2001/00237. We thank Chris McRoberts and AndyJohnson for their help in identifying the pectinid fauna,and Tony Hallam, Chris McRoberts and an anonymousreviewer for their comments on the manuscript.
References
Allison, P.A., Wignall, P.B., Brett, C.E., 1995. Palaeo-oxygenation:effects and recognition. In: Bosence, D.W.J., Allison, P.A. (Eds.),
Marine palaeoenvironmental analysis from fossils. Geol. Soc.Spec. Publ., vol. 83, pp. 97–112.
Beerling, D.J., Berner, R.A., 2002. Biogeochemical constraints on theTriassic–Jurassic boundary carbon cycle event. Glob. Biogeo-chem. Cycles 16 (art.1036).
Breit, G.N., Wanty, R.B., 1991. Vanadium accumulation in carbona-ceous rocks: a review of geochemical controls during depositionand diagenesis. Chem. Geol. 91, 83–97.
Calvert, S.E., Pedersen, T.F., 1993. Geochemistry of Recent oxic andanoxic marine sediments: implications for the geological record.Mar. Geol. 113, 67–88.
Carter, E.S., Hori, R.S., 2005. Global correlation of the radiolarianfaunal change across the Triassic–Jurassic boundary. Can. J. EarthSci. 42, 777–790.
Metallogenesis of early Palaeozoic graptolite shales from theGraefenthal Horst (northern Bavaria — Federal Republic ofGermany). Econ. Geol. 81, 889–903.
Föllmi, K.B., 1996. The phosphorus cycle, phosphogenesis and marinephosphate-rich deposits. Earth-Sci. Rev. 40, 55–124.
Galli, M.T., Jadoul, F., Bernasconi, S.M., Weissert, H., 2005.Anomalies in global carbon cycling and extinction at theTriassic/Jurassic boundary: evidence from a marine C-isotoperecord. Palaeogeogr. Palaeoclimatol. Palaeoecol. 216, 203–214.
Gibson, D.W., 1993. Triassic; Subchapter 4G. In: Stott, D.F., Aitken, J.D.(Eds.), Sedimentary cover of the craton in Canada. Geology ofCanada, vol. 5. Geological Survey of Canada, pp. 294–320.
Gibson, D.W., Edwards, D.E., 1990. An overview of Triassicstratigraphy and depositional environments in the RockyMountainFoothills and Western Interior Plains, Peace River Arch, northeast-ern British Columbia. Bull. Can. Pet. Geol. 38A, 146–158.
Gibson, D.W., Edwards, D.E., 1992. Triassic stratigraphy andsedimentary environments of the Williston Lake area and adjacentsubsurface plains, northeastern British Columbia. Amer. Assoc.Petrol. Geol., Field Trip Guidebook. 125 pp.
Guex, J., 2006. Reinitialization of evolutionary clocks during sublethalenvironmental stress in some invertebrates. Earth Planet. Sci. Lett.242, 240–253.
Guex, J., Bartolini, A., Atudorei, V., Taylor, D., 2004. High-resolutionammonite and carbon isotope stratigraphy across the Triassic–Jurassic boundary at New York Canyon (Nevada). Earth Planet.Sci. Lett. 225, 29–41.
Hall, R.L., Pitaru, S., 2003. Carbon and nitrogen isotope disturbancesand an end-Norian (Late Triassic) extinction event: comment.Geology Online Forum, pp. e24–e25.
Hall, R., Pitaru, S., 2004. New Hettangian ammonite faunas and aTriassic–Jurassic boundary section, Fernie Formation, WillistonLake British Columbia. Riv. Ital. Paleontol. Stratigr. 110, 53–60.
Hallam, A., 1981. The end-Triassic bivalve extinction event.Palaeogeogr. Palaeoclimatol. Palaeoecol. 35, 1–44.
Hallam, A., 1990. Correlation of the Triassic–Jurassic boundary inEngland and Austria. J. Geol. Soc. Lond. 147, 421–424.
Hallam, A., 1995. Oxygen-restricted facies of the basal Jurassic ofNorth West Europe. Hist. Biol. 10, 247–257.
Hallam, A., El Shaarawy, Z., 1982. Salinity reduction of the end-Triassic sea from the Alpine region northwestern Europe. Lethaia15, 169–178.
Hallam, A., Wignall, P.B., 1997. Mass Extinctions and theirAftermath. Oxford University Press, Oxford. 320 pp.
Hallam, A., Wignall, P.B., 1999. Mass extinctions and sea-levelchanges. Earth-Sci. Rev. 48, 217–250.
Hallam, A., Wignall, P.B., 2000. Facies changes across the Triassic–Jurassic boundary in Nevada USA. J. Geol. Soc. Lond. 157, 49–54.
405P.B. Wignall et al. / Palaeogeography, Palaeoclimatology, Palaeoecology 253 (2007) 385–406
Hatch, J.R., Leventhal, J.S., 1992. Relationship between inferredredox potential of the depositional environment and geochemistryof the Upper Pennsylvanian (Missourian) Stark Shale Member ofthe Dennis Limestone, Wabaunsee County, Kansas, USA. Chem.Geol. 99, 65–82.
Hautmann,M., 2004. Effect of end-Triassic CO2maximum on carbonatesedimentation and marine mass extinction. Facies 50, 257–261.
Hesselbo, S.P., Robinson, S.A., Surlyk, F., Piasecki, S., 2002.Terrestrial and marine extinction at the Triassic–Jurassic boundarysynchronized with major carbon-cycle perturbation: a link toinitiation of massive volcanism? Geology 30, 251–254.
Hesselbo, S.P., Robinson, S.A., Surlyk, F., 2004. Sea-level change andfacies development across potential Triassic–Jurassic boundaryhorizons SW Britain. J. Geol. Soc. Lond. 161, 365–379.
Horton, A., Ivimey-Cook, H.C., Harrison, R.K., Young, B.R., 1980.Phosphatic ooids in the Upper Lias (Lower Jurassic) of centralEngland. J. Geol. Soc. Lond. 137, 731–740.
Hounslow, M.W., Posen, P.E., Warrington, G., 2004. Magnetostrati-graphy and biostratigraphy of the Upper Triassic and lowermostJurassic succession, St. Audire's Bay, UK. Palaeogeogr. Palaeo-climatol. Palaeoecol. 213, 331–358.
Huynh, T.T., Poulsen, C.J., 2005. Rising atmospheric CO2 as a possibletrigger for the end-Triassic mass extinction. Palaeogeogr. Palaeo-climatol. Palaeoecol. 217, 1–21.
Ivimey-Cooke, H.C., Hodges, P., Swift, A., Radley, J.D., 1999.Bivalves. In: Swift, A., Martill, D.M. (Eds.), Fossils of the RhaetianPenart Group. Pal. Assoc. Field Guide, vol. 9, pp. 83–128.
Jones, B., Manning, D.A.C., 1994. Comparison of geochemicalindices used for the interpretation of depositional environments inancient mudstones. Chem. Geol. 111, 112–129.
McElwain, J.C., Beerling, D.J., Woodward, F.I., 1999. Fossils plantsand global warming at the Triassic–Jurassic boundary. Science285, 1386–1390.
McLearn, F.H., 1937. Contributions to the Triassic of Peace River,British Columbia. Can. Field-Nat. 51/9, 127–131 (1 plate).
McLearn, F.H., 1940. Notes on the geography and geology of the PeaceRiver Foothills. Trans. R. Soc. Can., 3rd series 34, 63–74 (sec. 4).
McLearn, F.H., 1960. Ammonoid faunas of the Upper TriassicPardonet Formation, Peace River Foothills, British Columbia.Geol. Surv. Canada Mem., vol. 311. 118 pp. 21 plates.
McLearn, F.H., Kindle, E.D., 1950. Geology of northeastern BritishColumbia. Geol. Surv. Canada, Mem., vol. 259. 236 pp.
McRoberts, C.A., Newton, C.R., 1995. Selective extinction amongend-Triassic European bivalves. Geology 23, 102–104.
McRoberts, C.A., Stanley Jr., G.D., 1989. A unique bivalve-algae lifeassemblage from the Bear Gulch Limestone (Upper Mississippian)of central Montana. J. Paleontol. 63, 578–581.
McRoberts, C.A., Furrer, H., Jones, D.S., 1997. Palaeoenvironmentalinterpretation of a Triassic–Jurassic boundary section fromWestern Austria based on palaeoecological and geochemicaldata. Palaeogeogr. Palaeoclimatol. Palaeoecol. 136, 79–96.
Orchard,M.J., McRoberts, C.A., Tozer, E.T., Johns,M.J., Sandy,M.R.,Shaner, J.S., 2001a. The Upper Triassic of Black Bear Ridge,Williston Lake, northeast British Columbia: an integrated biochro-nology. Geol. Surv. Can., Current Res. 2001-A6, 1–21.
Orchard, M.J., Zonneveld, J.-P., Johns, M.J., McRoberts, C.A., Sandy,M.R., Tozer, E.T., Carrelli, G.G., 2001b. Fossil succession andsequence stratigraphy of the Upper Triassic of Black Bear Ridge,northeast British Columbia. Albertiana 25, 10–22.
Oschmann, W., 1994. Adaptive pathways of benthic organisms inmarine oxygen-controlled environments. Neues Jahrb. Geol.Palaontol. Abh. 191, 393–444.
Pálfy, J., Mortensen, J.K., Carter, E.S., Smith, P.L., Friedman, R.M.,Tipper, H.W., 2000. Timing the end-Triassic mass extinction: firston land, then in the sea? Geology 28, 39–42.
Pálfy, J., Demény,A., Haas, J.,Hetényi,M., Orchard,M.J.,Vetö, I., 2001.Carbon isotope anomaly and other geochemical changes at theTriassic–Jurassic boundary from a marine section in Hungary.Geology 29, 1047–1050.
Patton, W.W., Matzko, J.J., 1959. Phosphate deposits in northernAlaska. U.S. Geol. Surv. Prof. Pap., vol. 302-A, pp. 1–17.
Pitaru, S.L., 2005. Hettangian ammonite faunas and a Triassic–Jurassic boundary section at Williston Lake, British Columbia.Unpubl. M.Sc. Thesis, Univ. Calgary, 433 pp.
Poulton, T.P., Braun, W.K., Brooke, M.M., Davies, E.H., 1993.Jurassic; Subchapter 4H. In: Stott, D.F., Aitken, J.D. (Eds.),Sedimentary Cover of the Craton in Canada. Geol. Surv. Canada,Geology of Canada, vol. 5, pp. 321–357.
Rimmer, S.A., 2004. Geochemical paleoredox indicators in Devoni-an–Mississippian black shales Central Appalachian Basin, (USA).Chem. Geol. 206, 373–391.
Ross, G.M., Gehrels, G.E., Patchett, P.J., 1997. Provenance of Triassicstrata in the Cordilleran miogeocline of western Canada. In:Moslow,T.F., Wittenberg, J. (Eds.), Triassic of the Western CanadaSedimentary Basin. Bull. Canad. Petrol. Geol., vol. 45, pp. 461–473.
Schatz, W., 2005. Palaeoecology of the Triassic black shale bivalveDaonella — new insights into an old controversy. Palaeogeogr.Palaeoclimatol. Palaeoecol. 216, 189–201.
Schovsbo, N.H., 2001. Why barren intervals? A taphonomic casestudy of the Scandanavian Alum Shale and its fauna. Lethaia 34,271–286.
Sephton, M.A., Amor, K., Franchi, I.A., Wignall, P.B., Newton, R.,Zonneveld, J.-P., 2002. Carbon and nitrogen isotope disturbancesand an end-Norian (Late Triassic) extinction event. Geology 30,1119–1122.
Silberling, N.J., Grant-Mackie, J., Nichols, K.M., 1997. The LateTriassic bivalveMonotis in accreted terranes of Alaska. U.S. Geol.Surv. Bull. 2151, 1–21.
Stott, D.F., 1998. Fernie Formation and Minnes Group (Jurassic andlowermost Cretaceous), northern Rocky Mountain Foothills,Alberta and British Columbia. Geol. Surv. Can. Bull. 516. 516 pp.
Tozer, E.T., 1982. Late Triassic (Upper Norian) and earliest Jurassic(Hettangian) rocks and ammonoid faunas, Halfway River andPine Pass areas, British Columbia. Geol. Surv. Can., Current Res.82-1A, 385–391.
Tyson, R.V., Pearson, T.H., 1991. Modern and ancient continentalshelf anoxia: an overview. In: Tyson, R.V., Pearson, T.H. (Eds.),Modern and ancient continental shelf anoxia. Geol. Soc. Spec.Publ., vol. 58, pp. 1–26.
Ward, P.D., Garrison, G.H., Haggart, J.W., Kring, D.A., Beattie, M.J.,2004. Isotopic evidence bearing on Late Triassic extinction events,Queen Charlotte Islands, British Columbia, and implications forthe duration and cause of the Triassic/Jurassic mass extinction.Earth Planet. Sci. Lett. 224, 589–600.
Ward, P.D., Haggart, J.W., Carter, E.S., Wilbur, D., Tipper, H.W.,Evans, T., 2001. Sudden productivity collapse associated with theTriassic–Jurassic boundary mass extinction. Science 292,1148–1151.
Ward, P.D., Garrison, G.H., Williford, K.H., Kring, D.A., Goodwin,D., Beattie, M.J., McRoberts, C.A., 2007. The organic carbonisotopic and paleontoloical record across the Triassic–Jurassicboundary at the candidate GSSP section at Ferguson Hill, MullerCanyon, Nevada, USA. Palaeogeogr. Palaeoclimatol. Palaeoecol.246, 281–290.
406 P.B. Wignall et al. / Palaeogeography, Palaeoclimatology, Palaeoecology 253 (2007) 385–406
Westermann, G.E.G., 1962. Succession and variation ofMonotis and theassociated fauna in the Norian Pine River Bridge section BritishColumbia (Triassic, Pelecypoda). J. Paleontol. 36, 745–792.
Wignall, P.B., 1994. Black shales. Oxford Monographs in Geologyand Geophysics, vol. 30. Oxford University Press, Oxford. 127 pp.
Wignall, P.B., 2001. Sedimentology of the Triassic–Jurassic boundarybeds in Pinhay Bay (Devon SW England). Proc. Geol. Assoc. 112,349–360.
Wignall, P.B., Myers, K.J., 1988. Interpreting benthic oxygen levels inmudrocks: a new approach. Geology 16, 452–455.
Wignall, P.B., Newton, R., 1998. Pyrite framboid diameter as ameasure of oxygen deficiency in ancient mudrocks. Am. J. Sci.298, 537–552.
Wignall, P.B., Simms, M.J., 1990. Pseudoplankton. Palaeontology 33,359–378.
Wignall, P.B., Zonneveld, J.-P., Sephton, M.A., 2003. Reply tocomment by Hall, R.L. and Pitaru, S. on “Carbon and nitrogenisotope disturbances and an end-Norian (Late Triassic extinctionevent”. Geology Online Forum doi:10.1130/0091-7613(2003)31Ne25:Rb2.0.CO;2.
All in-text references underlined in blue are linked to publications o
Wilkin, R.T., Barnes, H.L., Brantley, S.L., 1996. The size distributionof framboidal pyrite in modern sediments: an indicator of redoxconditions. Geochim. Cosmochim. Acta 60, 3897–3912.
Wilkin, R.T., Arthur, M.A., Dean, W.E., 1997. History of water-column anoxia in the Black Sea indicated by pyrite framboid sizedistributions. Earth Planet. Sci. Lett. 148, 517–525.
Zonneveld, J.-P., Gingras, M.K., 2001. Sedimentology and ichnologyof the Triassic of northeastern British Columbia. Rock theFoundation. Canad, Soc. Pet. Geol. Ann. Conv., Calgary, Alberta.159 pp.
Zonneveld, J.-P., Carrelli, G.G., Riediger, C., 2004. Sedimentology ofthe Upper Triassic Charlie Lake, Baldonnel and PardonetFormations from outcrop exposures in the southern Trutch region,northeastern British Columbia. In: Lane, L.S. (Ed.), CentralForeland NATMAP: stratigraphic and structural evolution of theCordilleran Foreland— Part 1. Bull. Canad. Petrol. Geol., vol. 52,pp. 343–375.
n ResearchGate, letting you access and read them immediately.