
DJF Thesis - Columbia Academic Commons
179
An Evaluation of Computational Methods to Support the Clinical Management of Chronic Disease Populations Daniel Feller Submitted in partial fulfillment of the requirements for the degree of Doctor of Philosophy under the Executive Committee of the Graduate School of Arts and Sciences COLUMBIA UNIVERSITY 2020
-
Upload
khangminh22 -
Category
Documents
-
view
1 -
download
0
Transcript of DJF Thesis - Columbia Academic Commons

An Evaluation of Computational Methods to Support the Clinical Management of
Chronic Disease Populations
Daniel Feller
Submitted in partial fulfillment of the
requirements for the degree of
Doctor of Philosophy
under the Executive Committee
of the Graduate School of Arts and Sciences
COLUMBIA UNIVERSITY
2020

© 2020
Daniel Feller
All Rights Reserved

Abstract
An Evaluation of Computational Methods to Support the Clinical Management of
Chronic Disease Populations
Daniel Feller
Innovative primary care models that deliver comprehensive primary care to address
medical and social needs are an established means of improving health outcomes and reducing
healthcare costs among persons living with chronic disease. Care management is one such
approach that requires providers to monitor their respective patient panels and intervene on
patients requiring care. Health information technology (IT) has been established as a critical
component of care management and similar care models. While there exist a plethora of health IT
systems for facilitating primary care, there is limited research on their ability to support care
management and its emphasis on monitoring panels of patients with complex needs. In this
dissertation, I advance the understanding of how computational methods can better support
clinicians delivering care management, and use the management of human immunodeficiency
virus (HIV) as an example scenario of use.
The research described herein is segmented into 3 aims; the first was to understand the
processes and barriers associated with care management and assess whether existing IT can
support clinicians in this domain. The second and third aim focused on informing potential
solutions to the technological shortcomings identified in the first aim. In the studies of the first

aim, I conducted interviews and observations in two HIV primary care programs and analyzed
the data generated to create a conceptual framework of population monitoring and identify
challenges faced by clinicians in delivering care management. In the studies of the second aim, I
used computational methods to advance the science of extracting from the patient record social
and behavioral determinants of health (SBDH), which are not easily accessible to clinicians and
represent an important barrier to care management. In the third aim, I conducted a controlled
experimental evaluation to assess whether data visualization can improve clinician’s ability to
maintain awareness of their patient panels.

i
Table of Contents
Table of Contents ................................................................................................................. i
List of Tables ..................................................................................................................... iv
List of Figures ..................................................................................................................... v
Chapter 1: Introduction ....................................................................................................... 1
1.1 Dissertation Introduction .................................................................................. 1
1.2 Dissertation Overview ...................................................................................... 2
1.3 Knowledge Gaps ............................................................................................... 5
1.4 Contributions..................................................................................................... 7
1.5 Limitations ........................................................................................................ 9
Chapter 2: Background & Literature Review ................................................................... 11
2.1 Care Management ........................................................................................... 11
2.2 Health IT Systems in Care Management ........................................................ 16
2.3 Interaction Design for Care Management ....................................................... 21
Chapter 3: Challenges Associated with the Clinical Management of Large Groups of HIV
Patients .............................................................................................................................. 30
3.1 Background & Significance ............................................................................ 30
3.2 Research Questions ......................................................................................... 31
3.3 Study 1: An investigation of the informatics needs associated with delivering
chronic disease care to large clinical populations ................................................. 32

ii
3.4 Study 2: Situational Awareness in Chronic Disease Care: Requirements for
Patient and Population Monitoring ....................................................................... 52
Chapter 4: Social and Behavioral Determinants of Sexual Health in the Patient Record 68
4.1 Background & Significance ............................................................................ 68
4.2 Research Questions ......................................................................................... 69
4.3: Study 1: Towards the Inference of Social and Behavioral Determinants of
Sexual Health: Development of a Gold-Standard Corpus with Semi-Supervised
Learning ................................................................................................................ 70
4.4 Study 2: Longitudinal analysis of social and behavioral determinants of health
in the EHR: exploring the impact of patient trajectories and documentation
practices ................................................................................................................ 82
4.5 Study 3: Automated identification of social and behavioral determinants of
health with structured and free-text clinical data .................................................. 94
Chapter 5: Using Visualization to Improve the Situational Awareness of Clinicians in
Chronic Disease Care ...................................................................................................... 107
5.1 Background & Significance .......................................................................... 107
5.2 Research Questions ....................................................................................... 108
5.3 Study 1: Using interactive visualization to improve population monitoring in
chronic disease care ............................................................................................ 109
Chapter 6: Conclusions ................................................................................................... 136
6.1 Summary of Work......................................................................................... 136
This dissertation consisted on six distinct studies that used both qualitative and
quantitative methods to explore how computational methods can better support

iii
clinicians in care management settings. I will now provide an overview of these
studies and their principal research findings. ...................................................... 136
6.2 Contributions................................................................................................. 142
6.3 Limitations .................................................................................................... 144
6.4 Future Work .................................................................................................. 147
6.5 Conclusions ................................................................................................... 149
References ....................................................................................................................... 150

iv
List of Tables
Table 3.1. Assessment of needs and bottlenecks associated with care management of chronic
disease patients
Table 3.2. Similarities and Differences Between Study Clinics
Table 3.3. Summary of Situational Awareness Constructs in Chronic Disease Care
Table 3.4. Recommendations to Support Situational Awareness in Chronic Disease Care
Table 4.1. Summary of annotation guideline for 6 domain-level and 32 individual-level SBDH
indicators.
Table 4.2. Performance of models inferring presence of SBDH documentation among 1,501
patients using 5-fold cross validation
Table 4.3. Performance of models inferring SBDH labels using 5-fold cross validation
Table 5.1. Situational awareness constructs and corresponding study tasks
Table 5.2 Data dictionary provided to study participants
Table 5.3 Adapted Health-ITUES survey
Table 5.4 Situational awareness constructs, user needs, and design requirements
Table 5.5 Ability of baseline and PanelViz tools to support design requirements
Table 5.6 Accuracy of participant responses to study tasks
Table 5.7 Health-ITUES scale scores across study conditions

v
List of Figures
Figure 1.1 Overview of dissertation
Figure 3.1 Conceptual framework of patient and population monitoring in chronic disease care
Figure 4.1 Label dependence among SBDH indicators
Figure 4.2. State diagram of changes in documentation of alcohol use across all patients in the
cohort.
Figure 4.3 Survival function of SBDH changes for drug use, housing, sexual orientation, and
alcohol use.
Figure 4.4 Prediction Task for SBDH labels
Figure 4.5 Overview of methods for machine learning
Figure 4.6 Relationship between SBDH prevalence and classifier performance
Figure 5.1 Study Procedure
Figure 5.2 Baseline Interface
Figure 5.3 PanelViz interface.

1
Chapter 1: Introduction
1.1 Dissertation Introduction
Ensuring the delivery of primary and secondary preventative care to persons living with
chronic disease is a critical aspect of efforts to improve health and reduce costs in modern
healthcare systems.(1) A particularly promising approach, referred to as care management (CM),
involves identifying patients with care gaps - unmet preventative screenings and chronic care
needs - and arranging services to address those gaps.(2) This approach has been most
prominently adopted in chronic disease settings, where secondary prevention is often life-
saving.(3) The successful provision of such preventative care at scale has been associated with
the availability of information technology (IT) tools that support components of CM including
population monitoring, interoperability between care settings, collaborative care, and quality
measurement.(4–6)
Despite claims that IT is essential to care management, there has been limited research
focused on the ability of existing systems to satisfy the IT needs of clinicians providing such
care.(7) In this dissertation, I detail findings from qualitative research that resulted in a set of
design requirements for IT systems that support the management of large groups of patients with
chronic disease. I then assess whether computational methods such as natural language
processing and information visualization can satisfy the aforementioned needs and requirements.
Throughout the thesis, I use the management of human immunodeficiency virus (HIV) as an
example but assert that these findings are generalizable to other care settings.

2
1.2 Dissertation Overview
The goals of this dissertation can be generalized into 3 specific aims that together
demonstrate how health information technology (IT) can improve the delivery of care
management. In Aim 1, we characterized the IT needs of clinicians and evaluated whether
existing IT systems satisfy those needs in the context of CM. The shortcomings of the systems
observed in Aim 1 motivated Aims 2 and 3, which identified computational approaches that may
better support healthcare providers in care management settings. Aim 2 attempts to provide
insight into how social and behavioral determinants (SBDH) - factors important to the
management of patients with complex care needs - are expressed in the patient record and
leverage those insights to improve approaches to automated inference. Aim 3 addresses
clinician’s inability to maintain awareness of patients with complex needs - a paramount task not
supported by contemporary IT systems. Towards this goal, an experimental study was conducted
to assess whether data visualization can improve provider’s awareness of patients compared to
patient registries. The visual interface evaluated in the experimental study was informed by the
findings of Aim 1, which yielded a set of requirements for population monitoring, and Aim 2,
which suggested that information on patient SBDH can be inferred from patient records and
included in population monitoring systems.

3
Aim 1: Assess the IT needs of clinicians and identify inefficiencies and bottlenecks
associated with care management provided to populations of HIV patients
The research conducted in Aim 1 advances a comprehensive understanding of the IT
needs of providers delivering care management and a conceptual framework that describes the
process of population monitoring. Research findings were generated through a qualitative study
conducted in two HIV primary care clinics that included semi-structured interviews and direct
observation. The qualitative inquiry focused on the following research questions which were
related to the ability of existing health IT systems to support care management: 1) what
information is required to successfully perform activities related to care management delivered to
HIV populations, 2) how do information requirements vary across different staff roles in
Figure 1.1 Overview of dissertation
4
ambulatory HIV practices, and 3) what components of existing IT systems support or undermine
complex care management delivered to HIV populations?
Aim 2: Extract from clinical data the information required for HIV care management,
including relevant social and behavioral determinants of health
Aim 2 consisted of multiple studies that together advance knowledge related to
automated classification of social and behavioral determinants (SBDH) from clinical data. First,
we developed a gold-standard corpus of clinical notes annotated with an array of SBDH using
semi-supervised learning. This was necessary due to the low prevalence of notes with
documentation of SBDH, and this approach significantly increased the yield of the manual
annotation process. Second, the sizeable annotated corpus was used to analyze the longitudinal
manifestation of SBDH within individual patient records. This analysis yielded insight into the
frequency changes in patient SBDH status as well as data quality issues in SBDH
documentation. Third, we used the aforementioned insights to inform our approach to automated
classification of patient SBDH status, which leveraged unstructured and structured data and
supervised learning to infer a range of distinct SBDH factors from clinical data.
Aim 3: Design and evaluate an interface that supports monitoring and prioritization of
patient panels
Aim 3 entailed the development and evaluation of an interactive tool designed to improve
a healthcare providers’ situational awareness of their patients and respective panels. First, user-
centered design was employed to develop an interactive tool that leveraged data visualization to
support population monitoring. A within-subjects experimental study assessed whether the this
interactive visualization improved healthcare provider’s awareness compared to a simulated

5
patient registry. Subjects participated in 15-minute trials, in which they performed a series of
tasks related to population monitoring.
1.3 Knowledge Gaps
This dissertation is motivated by the need for the informatics community to better
understand the requirements of clinicians delivering care management and the computational
tools that could support these requirements. While health IT is considered an essential
component of modern primary care, there is limited research on the ability of health IT to support
care management and more specifically, the important task of monitoring and intervening on
large populations of patients with complex needs.(8,9)
Aim 1 attempts to address the fact that little is known about the IT needs of clinicians
delivering care management, reflecting the relatively recent emergence of this care model. To
our knowledge, no previous studies have conducted a comprehensive assessment of clinicians’
needs associated with delivering care management to large patient groups.(3,7) As a result, the
most dominant approach to providing clinicians with information on care gaps among their
respective patients has been exceedingly simple; patient registries are simple unsorted lists of
patients with a specific care gap.(10) Despite being endorsed for use in primary care by the
American Medical Association, patient registries have not been evaluated for their ability to
support population monitoring.(11) The volume of patients presented on these registries is likely
to be overwhelming; contemporary primary care providers are responsible for more than 1,500
patients on average.(12) An improved understanding of the requirements for IT systems designed
to support such activities could enable the development of interfaces more sophisticated than
patient registries and thereby improve the ability of clinicians to provide care management.

6
Aim 2 attempts to provide insight into how social and behavioral determinants are
expressed in the patient record and leverage those insights to improve approaches to automated
inference, with the ultimate goal of providing this information at the point-of-care. Previous
research on extracting SBDH from clinical data has primarily employed Natural Language
Processing (NLP) techniques and have achieved modest performance. (13) However, structured
data elements in the EHR can also be utilized to infer SBDH. It has been established that alcohol
abuse, drug abuse, and homelessness are represented by International Classification of Diseases
(ICD) codes which exhibit high specificity but poor sensitivity for the determinants they
represent.(14–17) Despite the potential utility of this information in systems for extracting social
and behavioral determinants, no previous study has leveraged heterogenous clinical data to
improve information extraction compared to one data source alone. Moreover, previous
experiments related to retrieval of SBDH from patient records have not considered the
characteristics of clinical documentation related to SBDH. This creates an opportunity to develop
a better understanding of how patient SBDH status is manifested in clinical data and thereby
inform the design of novel approaches to automated inference.
Aim 3 provides insight into ways that interactive systems can improve healthcare
provider’s awareness of their respective panels. It has been established that EHRs are unable to
support providers in monitoring populations, as EHR systems are designed to support
information retrieval for individual patients.(18–20) To complement EHRs, many providers use
patient registries (11,21) but due to the limitations of registries, clinicians often must create
‘homegrown’ tools such as paper-based lists and Excel spreadsheets that can better satisfy their
needs related to population monitoring.(4,22–24) Although both the American Academy of
Family Physicians and American Academy of Pediatrics have asserted that new IT tools are

7
required to support population monitoring in ambulatory care (25), little research has been
conducted in this area. Increasingly, information visualization is being considered as a means to
support healthcare providers utilize large volumes of clinical data.(26–28) Research is needed to
assess whether visualization can support providers delivering care management.
1.4 Contributions
This dissertation makes several contributions to the informatics community that can
inform the design interactive systems for clinicians and improve approaches to automated
inference of social and behavioral determinants of health from electronic health records. In
addition, the research described herein contributes to the international community of HIV care
providers a better understanding of how information technology can improve the quality of HIV
care.
First, we establish a comprehensive set of IT needs for clinicians managing large groups
of patients. Our study suggests that existing IT tools may not adequately support care
management and that the information contained in these systems may be insufficient to identify
patients requiring enhanced attention. To inform the design and evaluation of novel systems, we
introduce a conceptual framework of population monitoring in care management that is grounded
in the theory of situational awareness; this framework can inform researchers as they strive to
better understand the process by which clinicians monitor and prioritize patients on their panels.
In addition, the conceptual framework also advances a set of design requirements and evaluation
metrics that may guide the development and evaluation of novel systems that improve the ability
of healthcare providers to deliver care management.

8
Second, we advance the science of extracting social and behavioral determinants from
clinical documentation. This is an important contribution because it is well established that
providers who lack access to this information provide worse quality care.(29,30) First, we
present a means of accelerating the process of generating an annotated corpus of clinical notes
annotated for SBDH. In addition, we advance a set social and behavioral determinants of sexual
health such as sexual orientation and safe sex practices that may be used in future inquiry.
Second, I present a longitudinal analysis of the aforementioned gold-standard corpus, which
provides insight on how a patient’s documented SBDH status changes over time. This analysis
suggests that there may be data quality issues in SBDH documentation. Third, we demonstrate
that structured EHR data provides indicators of patient SBDH status and that classifiers
attempting to infer patient SBDH status should leverage both structured and unstructured data .
Third, our study findings provide evidence that data visualization exists as a useful paradigm to
support population monitoring. A convenience sample of physicians and nurse practitioners
overwhelmingly preferred an interactive visualization to patient registries - which are the most
commonly used IT tool for monitoring – when asked to complete several tasks related to
population monitoring. The informatics community should assess whether such tools can
successfully be integrated into clinical practice among providers responsible for monitoring large
populations of chronic disease patients.
Fourth, many of the findings enumerated in this dissertation propose several ways in
which the provision of HIV primary care can be improved through the use of IT. In Aim 1,
interviews with clinical staff suggested that HIV care providers would benefit from novel
systems that better enable population monitoring, facilitate communication between providers,
and help address psychosocial barriers to treatment. Aim 2 explores the feasibility of

9
automatically inferring the presence of SBDH. Our findings suggest that some SBDH related to
sexual health can be inferred from patient records, which may provide an opportunity to build
clinical decision support systems that help providers identify patients at risk of contracting HIV.
Aim 3 provides evidence that data visualization can improve healthcare provider’s awareness of
patients with complex care needs. These findings raise the possibility that visualization may
improve the quality of HIV primary care and support providers as they attempt to ensure that all
patients achieve continuous adherence to HIV antiviral therapy.(31)
1.5 Limitations
The findings of Aim 1 were drawn from two HIV primary care programs in New York
City. As a result, study findings may have limited generalizability to clinical settings other than
HIV management. In addition, data collected via semi-structured interviews and observation of
multidisciplinary care team meetings; we did not directly observe clinicians during clerical work.
As a result, the qualitative data collected may have been impacted by participant’s recall bias.
The studies of Aim 2 related to SBDH documentation have several limitations that should
be considered. In the longitudinal analysis of SBDH documentation, we were unable definitively
distinguish legitimate changes in patient SBDH status from status due to data quality issues.
Future studies should attempt to capture unassailable information on changes in patient SBDH
status (likely direct report from patients) to ascertain the proportion of changes in SBDH
documentation that reflect true changes in the patient state. In addition, for our approach to
automated SBDH inference we chose to obtain document-level annotations rather than mention-
level annotations because we observed that SBDH are not typically expressed as named entities.
However, this precludes comparison of our results to the majority of other studies of using NLP
for SBDH documentation that leveraged named-entity recognition.

10
Aim 3 has several limitations that should be considered. First and foremost, the
experimental evaluation was conducted with dataset of synthetic patients. In actual practice,
clinicians would be familiar with most or all of the patients on their panels and thus some of the
study tasks are more challenging to accomplish in a laboratory setting. Second, the user-centered
design and experimental evaluation was conducted in a simulated HIV primary care setting and
thus results may not be generalizable to other healthcare settings. The components of the
interactive solution may support the management of HIV but not be relevant to the management
of other chronic diseases. Third, we used datasets containing 500 patients in study trials, but the
actual caseload of providers may vary given different clinical settings. Third, our visualization
tool was a prototype, and we expect that usability would improve with further refinement.

11
Chapter 2: Background & Literature Review
2.1 Care Management
2.1.1 The Triple Aim
In the past decade, it has been oft-repeated that the American healthcare system is
plagued by high costs and poor outcomes; the United States spends more per capita on healthcare
than any other nation on the globe.(32) However, American have little to show for it, as disease
burdens and age-adjusted mortality rates are worse compared to other developed countries.(33)
This has resulted in the pursuit of the so called ‘Triple Aim’ - controlling healthcare spending,
securing high-quality patient experiences, and improving the health of the general
population.(34) The central notion that underpins the Triple Aim is that by increasing the health
of the population, population-wide healthcare care costs decrease thereby resulting in affordable
healthcare costs for all. Policymakers have spawn a host of initiatives to achieve the Triple Aim;
these include the Affordable Care Act and more recent initiatives that leverage financial
incentives to compel healthcare providers to provide higher-value care.(35,36)
2.1.2 The Role Of Preventative Care
Health systems have several means of controlling costs and improving the health of the
population and such as increased rates of screening and preventative care, targeting intensive
care to ensure that persons with chronic disease patients can control their diseases, and using
non-medical interventions that remove barriers to care such as social and behavioral
determinants of health.
A recent nation-wide study observed that only 8 percent of US adults had received all of
the preventative care recommended for them. This includes screening for common cancers,

12
hypertension and cholesterol, and determinants of health outcomes such as tobacco and alcohol
use, and depression.(1) Without proper diagnosis and management, these medical problems can
lead to the development of chronic diseases which require lifelong care and exert an outsize
impact on healthcare systems. 25% of adults have 2 or more chronic conditions such as heart
disease, diabetes, or chronic obstructive pulmonary disease (COPD) and despite the availability
of medical treatment, many persons with chronic disease do not achieve desirable health
outcomes.(37) This reflects the patient’s burden which involves altering their health-related
behavior and taking medication and interacting with medical care over extended periods of
time.(38)
Finally, the widespread absence of services for persons with social and behavioral needs
also contributes to the incidence of acute and chronic illnesses. Social and behavioral
determinants (SBDH) are environmental and behavioral factors that impede disease self-
management and lead to or exacerbate existing comorbid conditions.(39) The impact of
determinants such as unstable housing and substance use disorders on medical and cost outcomes
has resulted in health systems being increasingly attuned to these determinants.(40,41) ED usage
is disproportionately higher among persons with low socioeconomic status, who are more likely
perceive the ED as the most convenient source of care.(42)
2.1.3 Delivering Preventative Care: The Emergence of Care Management
The achievement of the aforementioned goals has been hypothesized by policymakers
and clinical thought leaders as being predicated on the delivery of high-quality care delivered in
primary care and office settings (aka ambulatory care).(43,44) Innovative care models that
deliver comprehensive care to address both medical and social needs can improve health and
reduce healthcare costs among this vulnerable population.(2,6) One such model, care

13
management (CM), involves using clinic-based staff, often referred to as care managers or care
coordinators, who monitor patients’ health outcomes, prioritize allocation of care and resources,
and communicate directly with patients who require assistance.(45) In contrast to more ‘reactive’
care models that require patients to seek care, CM emphasizes the delivery of proactive care that
requires clinicians to monitor and intervene on patients with unmet care needs.(45) There are
many distinct styles of care management that reflect the care settings in which they are used; a
care manager in a chronic disease program might be responsible for a small number of highly
complex patients and thus sustain frequent contact with each patient while a care manager in a
large family practice may contact patients infrequently to schedule screenings and visits.(2,6)
Regardless of the type of care management deployed, transitioning to such care models requires
changes in clinic staffing and organization. For example, CM employs care coordinators and
additional non-physician staff that are often organized into multidisciplinary care teams(46).
While not specific to chronic disease care, by definition CM includes the care coordination
activities associated with the management of chronic illness.
The 2010 passage of the Affordable Care Act (ACA) facilitated this rise by making it
easier for healthcare providers to be reimbursed for care management services delivered to
Medicaid and Medicare recipients.(47) National initiatives such as the Comprehensive Primary
Care program sponsored by the Center for Medicaid and Medicare Services have further
established care management as a strategy for improving patient care.(48)
Moreover, evidence suggests that care management achieves its goals. Population health
approaches that leverage care managers to provide healthcare navigation and education and also
address social determinants have been shown to decrease the likelihood of ED visits and reduce
costs.(49,50) Care management also is well suited to the management of co-occuring social and

14
behavioral problems; engaging vulnerable patients with social workers and behavioral health
clinicians can effectively address such determinants.(51,52)
2.1.4 Care Models Used In Care Management
Care management is most typically performed by multiple collaborating clinicians,
although different care models are used to organize such collaboration. In many settings, a nurse-
provider dyad is used to deliver care management: the nurse monitors the provider’s panel and
contacts any patients with care gaps, thereby freeing the physician from the time-consuming task
of scheduling clinic visits. In other settings where patient needs are more complex,
multidisciplinary care teams are composed of clinicians, including, but not limited to,
physicians, nurses, behavioral health specialists or social workers, and case managers.(53) In this
model, the nurse is often referred to as a ‘nurse care manager’, and monitors the providers panel
similar to a nurse in a provider dyad.(54) This role is also referred to as a ‘care coordinator’.
2.1.5 The Challenges of Care Management
Despite the established effectiveness of care management, it is not without challenges.
First, the volume of patients that care managers are required to provide care for is large. Second,
care managers do not have access to all of the information that is required for effective patient
outreach.
Contemporary primary care panels consist of 1,500 or more patients and it has been
estimated that physicians would require 18 hours per day to deliver recommended care to all of
their patients.(55,56) Previous research has demonstrated that clinicians with large panels
provide care of lower quality compared to those with lighter caseloads.(53,57) This may reflect
the fact that providers with large panels struggle to maintain adequate awareness for all patients
for whom they are responsible and inevitably neglect some patients who require care. The

15
volume of messages that care managers receive from patients can quickly overwhelm their
ability to respond in a timely manner.(58)
Another aspect that increases the difficulty of providing preventative care to large groups
of patients is the outsize impact of social and behavioral determinants of health (SBDH) on
chronic disease outcomes.(2,59) SBDH are environmental and behavioral factors such as
unstable housing and substance use disorders and often impede disease self-management and
lead to or exacerbate existing comorbid conditions. For instance, environmental factors such as
food insecurity and neighborhood poverty are associated with adverse health outcomes, while
housing instability and unmanaged substance use disorders can impede the delivery and efficacy
of care and result in nonadherence to medication.(40,60–63) Due to the established impact of
SBDH on health outcomes for persons living with chronic disease, health systems are
increasingly attuned to these determinants. Although information on social and behavioral
determinants of health provide clinically meaningful information and can lead to tailored care
plans, they are typically recorded in clinical notes and thus not easily accessible.
A critical aspect that increases the difficulty of providing preventative care to large
groups of patients is the outsize impact of social and behavioral determinants of health (SBDH)
on chronic disease outcomes. Although information on social and behavioral determinants of
health provide clinically meaningful information and can lead to tailored care plans, they are
typically recorded in clinical notes and thus not easily accessible. There is evidence providers
often struggle to retrieve information related to SBDH, and that those who are unaware of SBDH
provide worse quality care.(29,30)

16
2.2 Health IT Systems in Care Management
Health information technology (IT) is an established requirement for care management
and other care models that aim to coordinate the care of complex patients.(7,64,65) The Agency
for Healthcare Research and Quality (AHRQ) Care Coordination Framework outlines several
activities essential for achieving coordinated care, most of which rely on health information
technology (HIT).(4,66) For example, electronic handoff tools, continuity of care documents,
and interoperability are critical for facilitating transitions, linking patients to community
resources, and communication between care providers.(67–69) Tools for electronic clinical
quality measures can facilitate the assessment of needs and the alignment of resources with
patient and population needs by providing insight into population health outcomes.(70)
Monitoring and follow-up is most commonly performed using population registries, IT tools that
list disease outcomes and gaps in preventative care for a defined patient panel (71–73) which are
widely used by alternative practice organizations such as Accountable Care Organizations.(74)
Care management is closely related to care coordination and thus relies on the aforementioned
health IT – with the added emphasis placed on tracking and monitoring patient populations.(45)
Despite calls from clinical thought leaders and professional associations to improve IT
tools for population monitoring, limited research has been conducted in this area. This is an area
I focus on in Aim 3 of this dissertation, so I will describe existing IT solutions designed to
support monitoring of large patient populations and potential opportunities to improve those
systems.
2.2.1 Existing Systems Used in Care Management
The most frequently used IT tool in healthcare settings is the electronic health record
(EHR). However, several studies have found EHRs inadequate for population monitoring –
17
defined as the process by which providers review their respective patient caseloads and intervene
on any patients with unmet primary and secondary preventative care needs. Goetz et. al. reported
that primary care physicians and staff perceived that their EHR does not adequately track
patients and their disease status.(20) Berry and colleagues evaluated PCMHs in Louisiana and
observed that EHRs did not support monitoring of adult and pediatric patients.(18) Alyousef and
colleagues reported that systems that do not support efficient access of patient-related
information create inefficiencies in clinical care, and that population monitoring systems that
were challenging to use increased their perceived workload.(19)
The most basic form of care management interfaces are patient registries; these IT tools
list all empaneled patients in a tabular format and present disease outcomes and health-related
information in 1 or more columns. The American Medical Association recommends that primary
care providers use disease registries to monitor patients for whom they are responsible, and the
Meaningful Use program requires that certified EHRs generate registries.(11,75) For example, a
diabetes registry might identify patients with high HbA1c values and relevant risk factors such as
whether the patient is a smoker. Evidence suggests that providers deliver improved quality of
care when utilizing registries. In addition, preventative care registries are also recommended;
instead of disease outcomes such registries present care gaps – which represent missing
screenings or evidence-based interventions appropriate for a given patient (e.g. overdue
colonoscopy if patient is older than 50 or referral to a behavioral health provider if the patient
has unmanaged depression).(11) Registries are widespread across Accountable Care
Organizations and other advanced practice models; 65% used such tools in 2017.(74)
Despite these challenges, there has been limited research focused on addressing the needs
of clinicians who manage large volumes of chronic disease patients. Because providers are often

18
attentive to multiple disease & quality indicators, clinics typically use several registries. Despite
their ease of use, basic registries do not support surveillance across large groups of patients or
multiple conditions.(76) While interfaces have been developed to consolidate multiple disease &
preventative indicators, these systems have the potential to elicit information overload and have
not been formally evaluated. In 2014, a consortium led by the American Academy of Family
Physicians (AAFP) and American Academy of Pediatrics (AAP) asserted that existing IT
systems lacked many components necessary to support primary care.(25) This included not
supporting coordination by lacking dashboards that ‘synthesize and prioritizes information about
panels of patients’, and failing to support population management by lacking tools that ‘identify
and reach out to patients overdue for care’. Reflecting on these shortcomings, multiple studies
have reported that clinicians often use paper-based lists and Excel spreadsheets for monitoring
patient panels. Richardson and colleagues observed that the use of ‘homegrown’ tools such as
spreadsheets reflected the inability of existing systems to generate patient panels and use real-
time clinical data to monitor patients with complex conditions.(4) Cifuentes and colleagues
studied EHR challenges in 11 primary care and behavioral health practices and found that
multiple clinics also used Excel spreadsheets to facilitate close monitoring of patients.(22) In
addition, when patient information was challenging to access in the EHR, clinicians were more
likely to rely on recall, which is problematic because clinicians do not always remember
information. In these studies, nurses and other non-physician staff were the primary creators of
these homegrown systems and use them to target patients requiring outreach.
2.2.2 Approaches to Patient Prioritization in Care Management
Prioritization of patients who require enhanced attention is a growing need among
clinicians in primary care settings who have, on average, between 1,500 and 2,000 patients.(55)

19
Risk-stratified care management was one of the fundamental components of the nation-wide
Comprehensive Primary Care Initiative (CPC) launched by the Centers for Medicare and
Medicaid Services (CMS).(48) This care model required primary care practices to identify high-
risk patients such as those with high ED utilization rates or multiple chronic conditions and
assign them to care managers, who would assist the patient in navigating medical and non-
medical services. However, some participating practices reported that they had insufficient health
information technology to support care delivery.(77)
A variety of risk-stratification approaches have been implemented in primary care but all
have limitations. Prioritization based on manual screening are considered too labor-intensive to
administer to be practically useful.(78,79) Acuity-based scales such as the Elixhauser
comorbidity index are the most commonly used stratification techniques but are as imprecise due
to their reliance on diagnosis codes and don’t accurately represent clinician’s conception of
medical complexity.(80) Predictive models are increasingly used by health systems and clinics to
stratify patient populations and assign different intensities of care. Models typically predict cost-
related outcomes such as risk of hospital admission and typically have modest performance and
perform similar to physician judgement.(81)
Moreover, several studies have observed that clinicians object to the use of predictive
models because they restrict their autonomy over clinical decision making. Ross and colleagues
observed that more than 80% of clinicians implementing risk-stratification were mistrustful of
automated stratification and incorporated human review into the process.(82) Two other studies
reviewing multiple sites implementing risk-stratification found that physicians often rejected
approaches that were unable to incorporate clinical intuition and had limited
interpretability.(83,84) Another limitation that all the aforementioned prioritization approaches

20
share is that they only account for a single outcome. Clinicians often make decisions by
considering multiple criteria when assigning interventions to patients to receive intensive case
management, clinicians must take several patient dimensions into account including treatment
adherence, unmanaged behavioral health problems, the duration the patient has been receiving
care, and other factors.(85,86) The availability of stratification methods that could engender
transparency while accounting for multiple disparate outcomes could address the noted
shortcomings and allow clinicians to have more control over which patients are targeted for
enhanced care. This could further the ‘doctor-in-the-loop’ paradigm, which dictates that the
clinical intuition of a provider is supported by machine-driven stratification and subsequently
reviewed by the clinician.(87)
2.2.3 Novel IT systems for Care Management
There have been a limited number of dashboards created specifically for care
management. Studies by Loo et. al. and Zhou et. al. describe the development of basic interfaces
for care management.(88,89) These two papers were the first to assert that a consolidated view of
a provider’s panel has utility and to leverage color-coding to represent varying degrees of
priority for patient problems. Use of data visualization can reduce cognitive load and improve
comprehension, thereby increasingly the likelihood that clinicians are attentive to all patients for
whom they are responsible. However, these interfaces use rudimentary stratification and sort
empaneled patients on the number of ‘care gaps’ (e.g. required colonoscopy = 1 care gap)
associated with each patient. This representation is undesirable given that some patient problems
are far more critical to a patient’s quality-of-life (and/or the health system’s bottom line)
compared to others. These studies both represent the ‘state-of-the-art’ for consolidated panel
views, which aggregate the information contained in relevant disease and preventative registries.

21
The development and evaluation of such tools have been described by Zhou and Loo. Such tools
have several general features: 1) tabular representation of entire patient panels, 2) presentation of
preventative care & disease indicators tailored to clinic population, 3) generate automated
reminders (e.g. texts & emails) to patients to schedule preventative screenings, 4) use colors to
highlight key care gaps, 5) enable sorting of panel by basic prioritization.
Despite these advances, important features are still lacking. First, care management tools
must enable tailoring to the clinical environments in which they are implemented; out-of-the-box
systems have had poor uptake.(23,90) Second, clinicians require high-quality, continuously
updated information on their empaneled patients.(23) Moreover, existing tools do not include
key disease risk factors that would inform patient outreach.(4,22,91) Third, there is a lack of
monitoring tools for prioritizing high-risk patients.(4,25) Fourth, care managers have previously
described the need for a IT system to use visualization to reveal patients who may be in need of
outreach.(4) Fifth, there is momentum towards including patient-generated data into EHRs from
patient portals or mHealth applications.(92,93) It is unclear how these requirements can be met
by interactive systems.
2.3 Interaction Design for Care Management
The following section provides an overview of methods that are likely relevant to the
design of novel IT systems that can support healthcare providers in care management settings.
First, I provide an overview of how conceptual frameworks and theories are relevant to this
dissertation and describe how frameworks have been used previously to inform the design of
novel systems. I then describe systems that have been developed in various application domains
that may inform the design of novel systems that support care management.

22
2.3.1 The Role of Theory in Human-Computer Interaction Research
The scholarly disciplines of human-computer interaction (HCI) and computer-supported
collaborative work (CSCW) have often adopted theoretical constructs to advance a more detailed
understanding of how humans make decisions as well as design and evaluate novel applications.
Christine Halverson (2002) enumerated four specific areas where theory is helpful in these
domains(94):
1. A theory should be descriptive and help us make sense of the world without applying
needless reductionism. Theories often “shape the object of study” and enable a more intimate
understanding of complex situations by bringing certain important objects into focus.
2. Theories should be rhetorical and enable stakeholders to more easily describe the
situation being studied.
3. Some theories are inferential and enable stakeholders to make predictions about decision
agents, although these are less important in the early stages of design.
4. Designers often utilize theories to support application design by highlighting important
aspects & considerations for interaction design.
Conceptual frameworks have been widely used in health informatics research to explain
complex problem domains (95) and incorporate critical human and institutional characteristics
into technology design.(96) Frameworks have been often used in informatics research to
understand the elements of success for informatics interventions; the RE-AIM framework
developed by Bakken and Ruland.(97) Another common application of frameworks in health
informatics research is in modeling the cognitive processes used by healthcare providers. One
such theory is distributed cognition, which posits that actions are coordinated between persons

23
and devices which constitutes a “cognitive ecosystem” that supports decision making.(98)
Finally, frameworks such as the technology acceptance model (TAM) have also been applied to
healthcare consumers to understand their usage and acceptance of informatics interventions.(99)
2.3.2 The Theory of Situational Awareness
Situational awareness (SA) is a critical skill in high-risk industries such as aviation and
disaster response. It asserts that perceiving and understanding all elements in one’s immediate
environment enables successful decision-making.(100,101) Situational awareness has been
informally defined as “knowing what’s going on” but more formally can be understood as
describing how individuals anticipate future events. SA segments a decision-maker’s
environmental understanding into 3 components; 1) perception of environmental elements in
time and space, 2) comprehension of the meaning of these elements, and 3) projection of their
future status.(102) For example, SA is often applied in air traffic control settings, where a
controller must have adequate perception of all aircraft in a given airspace, comprehend potential
traffic control problems, and project each aircraft’s location in the near future. SA has been
applied in other settings where decision agents must develop and maintain a deep understanding
of their environments, such emergency response and nuclear power plant management.
Across industries and applications, the human-computer interaction (HCI) community
has explored interaction modalities that support situational awareness of stakeholders responsible
for monitoring populations. Perhaps the most well-researched settings application domain is
education, as teachers are responsible for tracking the scholastic progress of students in one or
more courses. Many teacher dashboards use tabular visualizations wherein each student is
represented by a single row.(103,104) In these applications, color-coding is used almost
universally to improve a decision-maker’s situational awareness by focusing attention on urgent

24
and/or extraordinary persons. (108,110,111) While color-coded tabular visualizations are the
most common paradigm, other innovative systems exist. One such system uses risk quadrants to
isolate students at risk of both academic underachievement and poor attendance.(112)
Multimodal interfaces (e.g. text and image) have also been observed to improve situational
awareness of severe illness within a simulated patient population.(113)
2.3.3 Situational Awareness in Healthcare
As a result, there have been several previous applications of SA to healthcare settings
where physicians and nurses must maintain longitudinal awareness of groups of patients.
(114,115) Situational awareness has been used to describe the administration of anesthesia(116)
and monitoring of patient status during surgery(117–119) and in intensive care units.(120,121)
SA is also commonly used as a means of assessing the quality of team-based care in both
ambulatory and hospital settings.(122–124) The concept of SA has also been applied in public
health for monitoring population health.(125,126) To our knowledge, SA has not been applied to
chronic disease care or CM, and we hypothesize that such application is appropriate given how
clinicians delivering care management are required to maintain longitudinal awareness of the
state of their respective panels and the patients for whom they provide care.
SA can also be used as a means of assessing the quality of team-based care in both
ambulatory and hospital settings. Singh et. al used SA to examine diagnostic errors among
primary care clinicians.(127) Among the 86 errors studied, analysis of interviews related to those
errors revealed deficits in the three levels of SA: information perception, information
comprehension, forecasting future events, and choosing appropriate action based on the first
three levels. In cases without error, the application of the SA framework provided insight into
processes involved in attention management.

25
2.3.4 Visualization of Patient Records
Now that I’ve described how conceptual frameworks inform the design and evaluation of
novel systems, I’ll provide a broad overview of systems that may inform the design of IT
solutions for care management.
Interactive systems have been previously developed to improve healthcare provider’s
awareness of clinical data. Many systems have been developed to visualize data from multiple
patient records and support two general tasks: 1) exploration of patient cohorts and 2) therapeutic
decision making. Systems that support therapeutic decision making by comparing an individual
to similar patients are not well suited to care management activities. In contrast, tools that
visualize multiple patient records such as the widely cited “Lifelines” system typically visualize
a single patient’s longitudinal record on parallel lines with a common time axis.(128) Such
visualizations provide an overview of event sequences extracted from multiple patient records
and generally do not process data to support decision making. Several aspects of the
aforementioned tools might provide useful paradigms for care management solutions. First,
published systems have emphasized querying, sorting, aggregating, and clustering of patients
using both query-by-example (IPBC and Similan) and more expressive queries
(Lifelines2).(129,130) Gravi++ and TimeRider color-code patients based on shared attributes to
create visually distinctive patient groups.(131,132) The LifeLines tool groups related items in
facets (eg. medications in one facet, test results in another facet) and such facets are collapsible,
enabling users to expand only facets that are important to them.
2.3.5 Clinical Dashboards
Similar to patient record visualizations, dashboards offer useful paradigms that can be
improve provider’s awareness of clinical data. Dashboards provide “summary data on

26
performance measured against care quality or productivity metrics” in a visual format.(26) Many
dashboards have been described in the literature. Franklin and colleagues developed a system to
visualize all admitted ED patients and their disposition across time. Such “electronic
whiteboards” are increasingly used in emergency departments (EDs) by physicians and nurses
list the names and status of the entire population of patients on the ward and were developed
under the assumption that these displays would improve situational awareness and result in rapid
decision-making.(133) Such tools have had mixed results adoption due to limitations in
information timeliness, quality of data and lack of customization for different user
groups.(134,135) Croon et. al. developed an interactive visualization to enable general
practitioners to identify patients requiring follow-up; however, the tool was basic and solely used
filtering on patient characteristics (e.g. systolic blood pressure, BMI, etc.) and did not
recommend specific tasks.(136) Waitman et. al. developed a surveillance tool for monitoring
hospitalized patients treated with medications with likely adverse effects.(137) Riad Alharbey
developed a remote monitoring tool for patients with COPD that used an ANN algorithm to
identify individuals at risk of flare-ups.(138) Badgeley and colleauges developed a clinical
dashboard for monitoring lab values of patients in ICU wards but visualize only 1 longitudinal
physiologic indicator per patient and do no evaluate their tool.(139) Bakos et. al. describe the
development and implementation of a patient safety dashboard at a large hospital, although the
amount of information is overwhelming and the authors conduct no evaluation.(140) Tan et. al.
developed a dashboard to mitigate information overload wrought by a CPOE system in a
Singapore hospital and observed broad adoption.(141)
The success of visual dashboards in clinical settings motivates continued inquiry into
interactive tools that use data visualization to support healthcare providers. Novel systems can

27
follow the paradigm set by these systems; the majority of the aforementioned systems present
data in a table format with color coding in the ‘traffic light’ format; wherein green indicates no
action is required and red indicates that action is required.(26) In addition, many of these systems
leverage simply table-based visualizations, which have been observed to be widely accessible to
care providers with minimal computational and numerical literacy.(142)
2.3.6 Prioritization of Multidimensional Data
As described in section 2.2, prioritization is an important aspect of alternative primary
care models such as care management. Although in contemporary systems prioritization is
achieved through the use of algorithms that use either simple rules (e.g. Elixhauser comorbidity
index) or more complex equations (i.e. predictive analytics), there is an opportunity to give users
direct control of prioritization. In the seminal 2008 paper “Grand Challenges of Clinical Decision
Support”, Dean Sittig and colleagues recommended the development of clinical decision support
systems that could prioritize recommendations using an explicit value model, thereby accounting
for multiple decision criteria such as “expected mortality, cost to the individual or organization,
etc”. (143) The main challenge is to “appropriately account for competing influences and values
impacting clinical decision-making while reducing the number of computer-generated
recommendations into a manageable number”.
Methods known as multi-criteria decision methods have been used to prioritize patient’s
access to limited care resources, such as selecting patients for elective surgery and assigning
patients to receive liver transplants.(144,145) Longaray and colleagues conducted a systemic
review of multicriteria decision making applications in healthcare management and identified 22
papers describing the use of such methods for clinical decision support.(146) The review also
found that Analytic Hierarchical Process to the most frequently used MCDM method, followed

28
by utility-based methods. This latter finding was corroborated by an earlier review by Adunlin et.
al.(147) These findings may be explained by Weernink et. al.’s finding that relatively simplistic
methods are adequate in clinical decision making because they have low cognitive burden and
are easy to administer. There is a general consensus that the MAGIQ technique requires less user
input than commonly-used alternatives such as SMARTER and Analytic Hierarchical
Process.(85,148) While MCDM methods have not been evaluated in the context of care
management, three studies have demonstrated that MCDM methods can be applied to the
problem of ED triage, whereby clinic leaders must enumerate a set of preferences (e.g. mortality
prevention is 1st priority, resource utilization is 2nd, etc.) to create a ranked list of patients to be
admitted.(86,149–151) MCDM methods have been used for patient prioritization in other realms
including prioritization of patients awaiting elective surgery in New Zealand, and allocation of
organs among patients awaiting transplantation.(144,145)
2.3.7 Visualization of Prioritization
A range of visual interfaces have been developed to make multi-criteria decision making
methods more accessible to end-users. Wall and colleauges develops a tool called Podium, which
allows decision makers to drag rows in a table of multi-variate data points and the tool then
infers a weighting model using Ranking SVM.(152) The authors reason that decision makers
cannot often specify attribute weights accurately. Pajet et. al. contributed an interactive
visualization technique that allows users to explore distinct combination of criteria weights for
multi-criteria decision making.(153) Dimara et. al. used pair plots to provide decision support
over multi-attribute rankings.(154)
Other tools have been developed for visualization multi-attribute data without relying on
MCDM methods, and best practices for visualizing multidimensional data have been established.

29
Plots that visualize multidimensional data are typically constructed using 1 of 2 conventions: 1)
using position markers for cells based on cell value (eg. scatterplots) and 2) retain item position
across columns and use markers within cells (eg. heatmaps). The highly cited TableLens retains
the rows and columns convention of tabular data but represents numbers and binary variables
using horizontal bar charts.(155) In addition, this work pioneered the ‘fish-eye’ technique which
‘zooms out’ on a table and enables the visualization of a larger quantity of data than is typically
available. Gratzl and colleagues extended this work into the context of sorting and developed a
technique that leverages barcharts to manifest the various attributes of an item in a ranked list.
(156) The tool enables users to interactively refine parameters and explore the effects of changes
in the item ranking, and was inspired by the author’s comprehensive analysis of requirements for
the visualization of multi-attribute rankings.(156)

30
Chapter 3: Challenges Associated with the Clinical
Management of Large Groups of HIV Patients
3.1 Background & Significance
In the United States, 42% of adults live with multiple chronic conditions and account for
71% of total healthcare spending.(157) Individuals in this high-need, high-risk population have
conditions such as heart disease, diabetes, COPD, or HIV with co-occurring social and
behavioral challenges that complicate disease management.(2) Innovative primary care models
that deliver comprehensive care to address medical and social needs have been established as an
approach to improve health and reduce healthcare costs among this vulnerable population.(2,45)
Care management is one such approach that emphasizes proactive care and requires providers to
monitor and intervene on patients with unmet care needs. This approach contrasts with
traditional reactive care and has been shown to improve health outcomes and patient satisfaction
among chronic disease patients. However, transitioning to such care models requires changes in
clinic staffing and organization. For example, CM employs care coordinators and additional non-
physician staff – often organized into multidisciplinary care teams – to provide intensive medical
care and simultaneously address comorbid social and behavioral determinants of health
(SBDH).(12,45,66)
While there is a rich body of knowledge on requirements for HIT in primary care, few
studies have specifically focused on examining HIT needs in the context of CM and its focus on
population monitoring. Moreover, delivering CM in primary care settings may be especially

31
challenging, as primary care providers are typically responsible for tracking and monitoring
more than 1,500 patients and may be unable to deliver all recommended care. To our knowledge,
no previous studies have conducted a comprehensive assessment of clinicians’ needs associated
with delivering CM to large patient groups. An improved understanding of the requirements for
IT systems designed to support CM could enable more effective management of large groups of
chronic disease patients.
3.2 Research Questions
Research Question 1: What information is required to successfully perform activities related to
complex care management delivered to HIV populations?
Research Question 2: How do information requirements vary across different staff roles in
ambulatory HIV practices?
Research Question 3: What components of existing IT systems support or undermine complex
care management delivered to HIV populations?
32
3.3 Study 1: An investigation of the informatics needs associated with delivering chronic disease
care to large clinical populations
3.3.1 Background
Health information technology (IT) is an established requirement for care management
and other care models that aim to coordinate the care of complex patients. The Agency for
Healthcare Research and Quality (AHRQ) Care Coordination Framework outlines several
activities essential for achieving coordinated care, most of which rely on health information
technology (HIT).(158) For example, electronic handoff tools, continuity of care documents, and
interoperability are critical for facilitating transitions (1), linking patients to community
resources (2), and communication between care providers (3). Tools for electronic clinical
quality measures can facilitate the assessment of needs (4) and the alignment of resources with
patient and population needs (5) by providing insight into population health outcomes.
Monitoring and follow-up (6) is most commonly performed using population registries, IT tools
that list disease outcomes and gaps in preventative care for a defined patient panel which are
widely used by alternative practice organizations such as Accountable Care Organizations.
However, it is not clear whether care management, as delivered to persons with HIV, is
analogous to the domains where care coordination has been previously studied.
3.3.2 Objectives
The purpose of this study was to develop an improved understanding of inefficiencies
and bottlenecks associated with providing proactive care to patients with chronic disease. In this
work, we focus on the delivery of CM to persons living with HIV. Because many HIV+ persons
have multiple medical and psychosocial comorbidities, CM in this population is especially
challenging and has traditionally been a component of HIV primary care.

33
3.3.3 Methods
This qualitative study employed semi-structured interviews and observations of clinical
practice to better understand the information needs of stakeholders delivering proactive care to
HIV patients. Interviews and observations of clinical workflows focused on the ability of IT
systems to support care management activities. We used member checks with participants to
ensure validity.
Participants & Settings
Interviews and observations were conducted in two established HIV care programs in
New York City. The programs are hereafter referred to as clinic #1 and clinic #2 and their
respective characteristics are described below.
Clinic 1
The first clinic studied is a large sexual health program at an urban academic center that
provides primary care to 2500 persons living with HIV and individuals at risk of sexually
transmitted infections. While the majority of patients are Medicaid or Medicare beneficiaries,
some patients had private insurance. Most patients are African American or Hispanic.
The clinic is organized around 5 multidisciplinary care teams that each consist of 2 physicians, 1
RN care manager, 1 social worker, and several case managers and are responsible for 500
patients. Physicians have the most patient interaction while care managers are responsible for
contacting patients in response to missed visits or abnormal lab tests. Each care team has a social
worker who provides short-term behavioral health care and several grant-funded case managers,
who provide services to high-need patients such as daily-observed therapy for HIV treatment.

34
The multidisciplinary care teams have weekly ‘case conferences’ wherein they discuss a limited
number of patients requiring follow-up from clinic staff. Patient registries are the primary IT tool
employed in these meetings used to identify patients with recent adverse outcomes and those at
high-risk of future adverse outcomes. Team meetings are attended by all staff and are typically
led by physicians and care managers who synthesize patient information and assign tasks to
members of the care team.
Clinic 2
The second clinic studied is situated in an HIV primary care program at a large urban
‘safety net’ hospital that serves persons with public insurance and the uninsured. The clinic
provides primary care to approximately 2800 persons living with HIV. Many patients treated in
this clinic have multiple chronic conditions and/or psychosocial problems and are predominantly
African American. Enrolled patients are almost exclusively Medicaid or Medicare beneficiaries.
Unlike clinic 1, clinical practice in this setting is not organized around defined multidisciplinary
care teams. Physicians each manage 300-500 patients but are supported by non-physician staff.
Two social workers and a cadre of community health workers (CHW) are available to support
treatment of psychosocial issues and are not paired with specific physicians. Patients with
uncontrolled HIV and significant medical and psychosocial issues are enrolled in the clinic’s
Medical Case Management program and assigned a dedicated CHW. Another contrast with clinic
1 was that this clinic did not have additional grant funded case managers and thus had less
resources to support high-risk patients.
In order to ensure that care is adequately coordinated for the most vulnerable patients,
clinic staff meet biweekly to discuss patients who have repeatedly failed to achieve care goals.
This meeting, referred to as the ‘Ambulatory ICU’, includes physicians, nurses, social workers,

35
and community health workers and typically discusses 5-6 patients who physicians believe are at
risk of imminent medical or social instability.
Procedures
Participants were recruited from the professional network of investigators and invited to
participate in the study via email. Inclusion criteria included working within the clinics studied
for at least 6 months prior to the observation period.
We conducted semi-structured interviews with study participants that lasted between 30
and 60 minutes. Participants were asked questions about their experience managing patients with
complex needs; questions ranged from general (e.g. “What is the most challenging aspect of your
job?”) to specific (e.g. “On a day-to-day basis, which types of patients are you most concerned
about?”). Interviews were conducted in person at each clinic and audio-recorded.
We also observed interdisciplinary care teams during regularly scheduled meetings
wherein clinical staff discussed high-need patients and collaborated to develop action items.
Study staff were passive during these sessions and recorded notes and audio with a digital
recorder. Data collection continued until data saturation was reached when semi-structured
interviews and observations yielded no additional information.
All procedures were reviewed and approved by the Institutional Review Boards at
Columbia University and BronxCare Health System. Participating staff reviewed and signed
informed consent prior to participation. Patient consent was waived due to the fact that personal
health information was removed from audio recordings and patients were not directly involved in
study procedures.
Analysis

36
All audio recordings were de-identified and transcribed verbatim for analysis. The
analysis of the interview transcripts and transcripts of interdisciplinary care team meetings was
combined and conducted using inductive thematic analysis.33 Three of the authors (LM, DJF,
ML) met for 4 1-hour collaborative coding sessions using the NVivo software involving the
following analysis steps. First, the three authors read the transcripts and familiarized themselves
with the data. Second, the authors generated initial codes by summarizing the interview data on a
more abstract level. Third, the authors performed axial coding to generate higher-level themes.
Fourth, the authors concluded the analysis by assessing whether the interview data aligned with
the final themes. To reduce the likelihood of misinterpretation, we performed member checks
with three study participants.34 This involved presenting participants with summarized findings
and select quotes that evidenced the findings. Another means of ensuring validity was the
triangulation of information from administrators, physicians, care managers and social workers
through both interviews and care team observations.
3.3.4 Results
We conducted 24 semi-structured interviews with 22 participants and observed 5
multidisciplinary care team meetings. This included 13 interviewees from clinic 1 (2
administrators, 4 physicians, 2 care managers, 2 social workers, 3 case managers) and 9
interviewees from clinic 2 (3 administrators, 3 physicians, 2 social workers, and 1 care manager);
two participants were interviewed twice to clarify prior responses. Participants ranged in age
between 30 and 60 years and 12 of 22 participants were female. Their length of experience
delivering HIV care varied widely, from 6 months to 20 years. The thematic analysis identified 4
major themes presented in Table 3.1 that were largely consistent across clinics; 1) both clinics
sought to deliver proactive care by continuously monitoring patient populations, although

37
Table 3.1 Assessment of needs and bottlenecks associated with care management of
chronic disease patients
Theme 1: Delivering proactive care requires continuous monitoring of the clinic
population and identification of high-risk patients
Proactive care challenging
to scale
“I’m regularly scanning these spreadsheets to see whether there is
someone that really needs follow-up. We don’t want people to
fall through the cracks. But there is not a system that it’s really
derived for me...it tends to be ‘putting out fires’ with so many
patients now involved in this process” (Administrator 1 – Clinic
2)
List-making as a strategy
for monitoring clinic
population
“I have to develop my own spreadsheets so I have an idea of who
[my patients] are... Imagine if I didn’t have this list – names
wouldn’t come to mind because we encounter people every day.
So, I have to keep a list.” (Care manager 1 – Clinic 1)
Providers have multiple
approaches for identifying
high-risk patients
“we do the best that we can with the resources that we have, but
we don’t have enough resources to thoroughly address the needs
of all the patients and so we triage to figure out people that we
think are super high needs.” (Physician 1 – Clinic 1)
Social and behavioral
determinants of health are
a key component of
monitoring and
prioritization
“ the patients [who] are at highest risk [have] mental health and
substance abuse [and] other factors such as housing
instability...that would predispose someone to be readmitted or
just generally have a hard time managing their disease”
(Physician 2 – Clinic 1)
Theme 2: Care management necessitates matching patient problems to appropriate
interventions
Understanding ‘root
cause’ of patient problems
is necessary
“...even if you have a laundry list of the issues that person has,
it’s still very difficult to nail down what the key levers are that
would create a cascade of positive results.” (Administrator 1 –
Clinic 1)
Identifying appropriate
interventions for patients
is challenging
"I can’t [know] what kind of a person you are from this
conversation, but I can say this was the dynamic, so I think [I
know] how this person might react to this intervention as opposed
to this intervention. Obviously, it’s a best guess.” (Care manager
2 – Clinic 1)
Uncertainty whether
patients with poor
engagement will be
responsive to intervention
“ [patients] just flat out are not interested in, you know, having
someone follow them or having the case manager or anything like
that then they will communicate that, you know, I don’t want to
be called, I don’t want to have home visits.” (Case manager 1 –
Clinic 2)
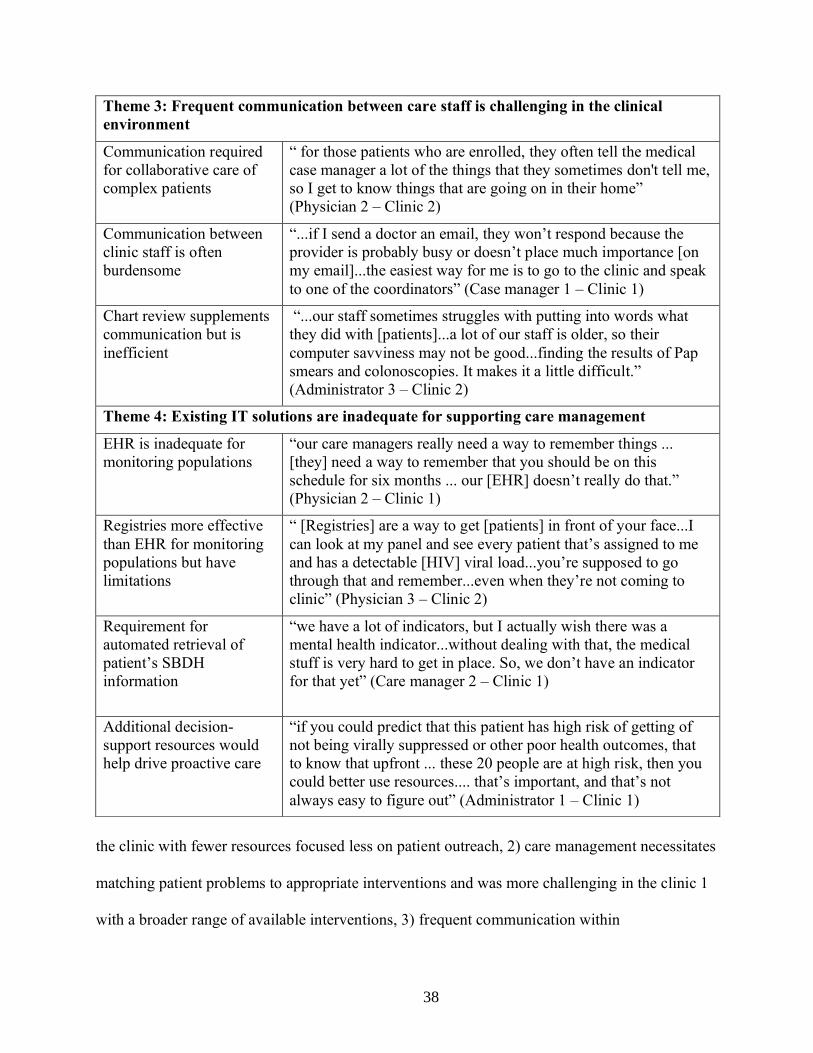
38
the clinic with fewer resources focused less on patient outreach, 2) care management necessitates
matching patient problems to appropriate interventions and was more challenging in the clinic 1
with a broader range of available interventions, 3) frequent communication within
Theme 3: Frequent communication between care staff is challenging in the clinical
environment
Communication required
for collaborative care of
complex patients
“ for those patients who are enrolled, they often tell the medical
case manager a lot of the things that they sometimes don't tell me,
so I get to know things that are going on in their home”
(Physician 2 – Clinic 2)
Communication between
clinic staff is often
burdensome
“...if I send a doctor an email, they won’t respond because the
provider is probably busy or doesn’t place much importance [on
my email]...the easiest way for me is to go to the clinic and speak
to one of the coordinators” (Case manager 1 – Clinic 1)
Chart review supplements
communication but is
inefficient
“...our staff sometimes struggles with putting into words what
they did with [patients]...a lot of our staff is older, so their
computer savviness may not be good...finding the results of Pap
smears and colonoscopies. It makes it a little difficult.”
(Administrator 3 – Clinic 2)
Theme 4: Existing IT solutions are inadequate for supporting care management
EHR is inadequate for
monitoring populations
“our care managers really need a way to remember things ...
[they] need a way to remember that you should be on this
schedule for six months ... our [EHR] doesn’t really do that.”
(Physician 2 – Clinic 1)
Registries more effective
than EHR for monitoring
populations but have
limitations
“ [Registries] are a way to get [patients] in front of your face...I
can look at my panel and see every patient that’s assigned to me
and has a detectable [HIV] viral load...you’re supposed to go
through that and remember...even when they’re not coming to
clinic” (Physician 3 – Clinic 2)
Requirement for
automated retrieval of
patient’s SBDH
information
“we have a lot of indicators, but I actually wish there was a
mental health indicator...without dealing with that, the medical
stuff is very hard to get in place. So, we don’t have an indicator
for that yet” (Care manager 2 – Clinic 1)
Additional decision-
support resources would
help drive proactive care
“if you could predict that this patient has high risk of getting of
not being virally suppressed or other poor health outcomes, that
to know that upfront ... these 20 people are at high risk, then you
could better use resources.... that’s important, and that’s not
always easy to figure out” (Administrator 1 – Clinic 1)

39
multidisciplinary care teams was difficult in both clinics, and 4) existing IT solutions are
inadequate for supporting care management, particularly in regards to identifying and extracting
SBDH. Table 3.2 outlines the salient differences between the two clinics studied herein.
Theme 1: Delivering proactive care requires continuous monitoring of clinic population
and identification of high-risk patients
Overall, participants stated that the provision of proactive care required changes to their
work practices. Despite these strategies, providers were concerned about their ability to provide
adequate care to all patients.
Proactive care is challenging to scale with limited resources and large population
In both clinics, care management entailed contacting patients in response to events
including missed visits and abnormal lab tests. In addition, clinicians also sought to navigate
patients towards services capable of addressing their social and behavioral needs, which if left
unaddressed might prevent successful disease management.
However, study participants felt that high patient volume precluded them from providing
outreach to all patients requiring contact. This was especially true in clinic 2, where physicians
reported that pressing medical and psychosocial needs of patients who come to the clinic take
precedent over proactive outreach.
List-making is a strategy for monitoring patients but is challenging to scale
In order to manage the complexity of providing proactive care to a large group of
patients, individual staff and care teams in both clinics manually curated lists that track the
patients under their care. These lists served as cognitive aids to help providers maintain
awareness of their patients as well as remember to perform necessary actions.

40
These lists were stored in various media, including hospital-owned mobile phones, paper
notebooks, and Excel spreadsheets. While all lists contain at a minimum the names of patients,
most also contained a succinct summary of a patient’s medical status and any relevant SBDH
information. Some providers used these lists as visual aids; one care manager used color-coding
to highlight patients in need of a follow-up based on patient acuity.
The maintenance of lists was perceived as labor-intensive, and several care managers and
social workers reported neglecting to update or add patients to their respective spreadsheets or
paper-based lists. As a result, staff reported that they were likely unaware of patients not included
in their personal lists.
Providers have multiple approaches for identifying high-risk patients
In response to the limited resources available to meet all patient needs, the leadership of
both clinics emphasized the importance of prioritizing high-risk, high-need patients. The
identification of high-risk patients occurred during weekly multidisciplinary care team meetings
and is driven by both patient registries and recall in memory, where clinicians reflect on which
patients require additional care. For example, providers tended to discuss high-risk patients with
whom they had a recent interaction. Other times, the team used registries during the meeting to
stimulate discussion of patients requiring care.
Individual staff members used different criteria to identify high-risk patients. Physicians
perceived their roles to include monitoring medical issues, while care managers focused on
disease management and are most attentive to patients with poor HIV treatment and visit
adherence. Social workers focused on addressing behavioral health disorders and helping
patients obtain supportive services.

41
Interviewees from both clinics perceived that despite efforts to improve care management
at scale, their approach to triage had important limitations. First, clinic staff noted that case
conferences typically discuss only a relatively small number of patients (<10). Second, multiple
staff asserted that additional health IT resources are necessary to alert clinicians to patients with
medical and psychosocial issues who have ‘fallen off the radar’ and aren’t receiving the care they
require.
Social and behavioral determinants of health a key component of monitoring and prioritization
Participants asserted that drug and alcohol abuse, low health literacy, unstable housing
and homelessness, social isolation, and transportation issues all often exert a negative impact on
patient’s ability to effectively managed their disease. As a result, care team meetings in both
clinics often focused considerable attention on patients with unaddressed SBDH. Clinicians also
reported that they often record information on patient SBDH in the spreadsheets used to monitor
their respective patient panels.
Theme 2: Care management necessitates matching patient problems to appropriate
interventions
Clinicians found it challenging to identify patients requiring outreach; furthermore,
selecting appropriate interventions from internal & external programs presented a further
difficulty. This was especially true in clinic 1, which had access to a broader range of specialty
interventions.
Understanding ‘root cause’ of patient problems deemed necessary
Staff in both clinics described various hidden ‘barriers’ that precluded patients from
effective chronic disease self-management. These were often related to SBDH and were

42
hypothesized as potential targets for intervention. For example, one clinician in clinic 1
recounted a recent example where HIV treatment adherence counseling did not impact a patient’s
outcomes because the patient’s housing and substance abuse issues remained unaddressed.
Because patients often had multiple unaddressed SBDH, stakeholders asserted that they
often lacked awareness of which specific issue might preclude effective self-management and
therefore were uncertain which issue be targeted first. For example, 15 minutes during a single
observed team meeting was devoted to discussing possible barriers to medication adherence for a
single patient in clinic 2.
Identifying appropriate interventions for patients is challenging
Furthermore, even when key barriers to HIV management are recognized, identifying
appropriate interventions to address these barriers was perceived as non-trivial. Despite having a
cadre of psychosocial interventions available, clinicians reported sometimes being unsure which
specific intervention would best address a given patient’s barriers. This difficulty was most
pronounced in clinic 1, which collaborated with several community-based organizations (CBOs)
and thus had a relatively large number of disease management interventions available.
Uncertainty over whether patient with poor engagement will benefit from intervention
Finally, the participants from both clinics expressed concern that some patients are
unlikely to benefit from any intervention. This sentiment was typically directed towards patients
who weren’t receptive to past interventions and rejected increased clinic involvement in their
health. This concern was especially prevalent in clinic 2, which had fewer case management staff
compared to clinic 1 and thus attempted to ensure that such limited resources are used

43
effectively. As a result, clinicians in clinic 2 expressed having more reluctance to refer patients to
their medical case management program compared to clinic 1.
Theme #3: Frequent communication between care staff is critical but challenging in the
clinical environment
A critical component of care management is frequent communication between clinicians
on a single care team and with external organizations.
Communication required for collaborative care of complex patients
In both clinics studied herein, many stakeholders contributed to a shared understanding of
individual patients. Case managers in both clinics updated primary care physicians on
developments related to patients’ SBDH during care team meetings, which often led to attempts
to contact these patients and connect them to supportive services. In addition to the briefing of
providers on their patients, care team meetings also served to distribute and coordinate labor
across the care team. Outside of meetings, staff in clinic 1 often used secure health messages to
communicate, while in clinic 2, because staff are collocated, face-to-face interactions were more
common than secure health messages.
Communication between clinic staff is time-intensive and challenging
Staff within both clinics were unable to communicate with colleagues about all patients
requiring outreach, reflecting the time-consuming nature of connecting with colleagues in-person
or via secure health messages. In clinic 1, case managers reported that secure health messages
regarding high-risk patients often went unnoticed by primary care physicians due to competing
priorities, requiring case managers to request that care managers notify clinicians of this
information in-person.

44
An additional challenge was the difficulty associated with identifying each patient’s
respective care provider to collaborate on patient outreach or care planning. The participants
reported that having easier access to this information would increase the efficiency of
collaborative care. In clinic 1, the population health tool stored a list of patients attributed to each
provider, but these lists were often perceived as inaccurate, resulting in limited use. In clinic 2,
such lists were stored in the EHR, a system which non-physician staff used infrequently.
Chart review supplements direct communication but is inefficient
A strategy employed in both clinics to supplement direct communication was chart
review. Because the majority of providers document the extent of their patient interactions in
free-text notes, these documents were considered to provide up-to-date patient information,
though sometimes lacking the requisite detail to be reliable or useful. Further, clinic staff
considered the process of reviewing patient notes to be labor-intensive and thus not practical to
perform regularly.
Case managers within both clinics used a dedicated software separate from the EHR to
document patient interactions; these notes were considered to be rich in detail regarding patient
psychosocial issues. However, a lack of interoperability between these systems and the EHR
precluded providers from accessing these notes. This was considered a major shortcoming of the
tool.
Theme #4: Existing IT solutions are inadequate for supporting care management
As discussed above, clinicians developed novel strategies to manage large clinic
populations. Although Health IT was often an important component of these strategies, the IT
systems used by both clinics only partially supported CM.

45
EHR is inadequate for monitoring populations
There was a perception among participants in clinic 1 that the electronic health record
(EHR) supports information retrieval for individual patients but lacks the ability to provide a
population-level overview of a provider’s panel. Care managers and case managers described the
challenge of using the EHR to review doctor’s notes and laboratory tests on a per-patient basis
when managing large groups of patients. This sentiment was not observed among physicians in
clinic 2, where the EHR had an embedded listing of each provider’s panel that highlighted key
gaps in care. In addition, a lack of interoperability between clinic 1’s visit scheduling system and
EHR required staff to login to an addition system when identifying patients to contact before
scheduled clinic visits to prevent ‘no-shows’. Participants asserted that the EHR could be
improved and include reminders to perform follow-up communication with patients, as well as
enable providers to schedule same-day preventative screenings and consultations for patients
requiring such services.
Registries are more effective than EHR for monitoring populations but have limitations
Both clinics employed patient registries that computed care indicators from an
institutional EHR system and displayed such data for each provider’s respective patients. Staff
asserted that registries increased their awareness of the patients for whom they are responsible,
and this sentiment was shared among both physicians and non-physician staff. Registries are
most frequently used to catalyze actions such as patient outreach and preventative screenings,
and enable simple stratification to prioritize which patients most require care.
However, the tools do not address all needs reported by clinicians. First, registries were
perceived as lacking specificity and potentially grouping together patients who have different
levels of acuity. Second, clinicians reported a common desire to have additional registries added

46
to the population health system. These included, for example, indicators for unmanaged
substance abuse and mental illness. Third, despite requesting additional indicators, staff in clinic
1 reported being overwhelmed by the volume of information across their six distinct patient
registries and requested functionality that could consolidate multiple registries and reduce
information overload. Clinic 2 compiles multiple care indicators into a single registry, which
may have ameliorated such concerns about information overload.
Requirement for automated retrieval of patient’s SBDH information
Despite the fact that SBDH are perceived as critical barriers to successful HIV
management, clinicians said that they were often unaware of patient’s SBDH due to the inability
of their EHR to effectively call attention to this information. A social worker reported that the
volume of information in the EHR precluded her from effectively searching for psychosocial
information because SBDH are recorded in relatively few clinical notes and physician lamented
the fact that clinical notes are challenging to review for this information due to the amount of
‘extraneous verbiage’ unrelated to SBDH. The importance of monitoring patients with significant
a burden of SBDH led one physician in clinic 1 to request that patient registries include care
indicators related to substance abuse and mental health.
Additional decision-support resources would help drive proactive care
The participants explicitly requested the implementation of additional decision-support
resources. Several clinicians in clinic 1 familiar with predictive modeling perceived that the
prediction of adverse events would enable them to provide better care. One social worker
asserted that understanding trends in depression or anxiety severity could help prevent adverse
health outcomes, while multiple physicians reported that predicting outcomes related to HIV
prevention and treatment would help them target resources more efficiently.

47
Table 3.2 Similarities and Differences Between Study Clinics
Similarities Proactive Care
o Individual staff and care teams in both clinics manually curated
spreadsheets and paper-based lists that track the patients under their care
o While both clinics sought to prioritize resource allocation to high-risk,
high-need patients, staff asserted that their approaches to triage had
important limitations
o Social and behavioral determinants are perceived as a critical
component of population monitoring and prioritization
Identifying appropriate interventions
o Staff in both clinics described the importance of addressing
psychosocial factors that precluded patients from effective chronic
disease self-management
o Participants from both clinics expressed concern that some patients are
not likely to benefit from intervention
Communication
o In both clinics many different stakeholders contributed to a shared
understanding of individual patients
o Staff within both clinics were unable to communicate about all patients
requiring outreach, reflecting the time-intensiveness of such discussions
o Chart review was considered an alternative to direct communication
with colleagues in both clinics
Existing IT
o While patient registries were perceived as useful, staff asserted that they
were likely unaware of all patients who might have benefitted from
outreach
o Administrators in both clinics sought to extract information on social
and behavioral determinants from electronic records
Differences Proactive Care
o Clinic 1 had more human resources and emphasized the delivery of
proactive care while clinic 2 focused on urgent patient deterioration
o Clinic 1 had several established criteria for identifying high-risk
patients, while clinic 2 used a more ad-hoc process
Identifying appropriate interventions
o Providers in clinic 1 struggled to select appropriate interventions from
internal & external programs while clinic 2 had access to fewer
interventions and thus did not perceived this as a problem
o Providers in clinic 1 were less hesitant to refer patients with history of
suboptimal adherence to costly interventions, reflecting having more
human resources compared to clinic 2
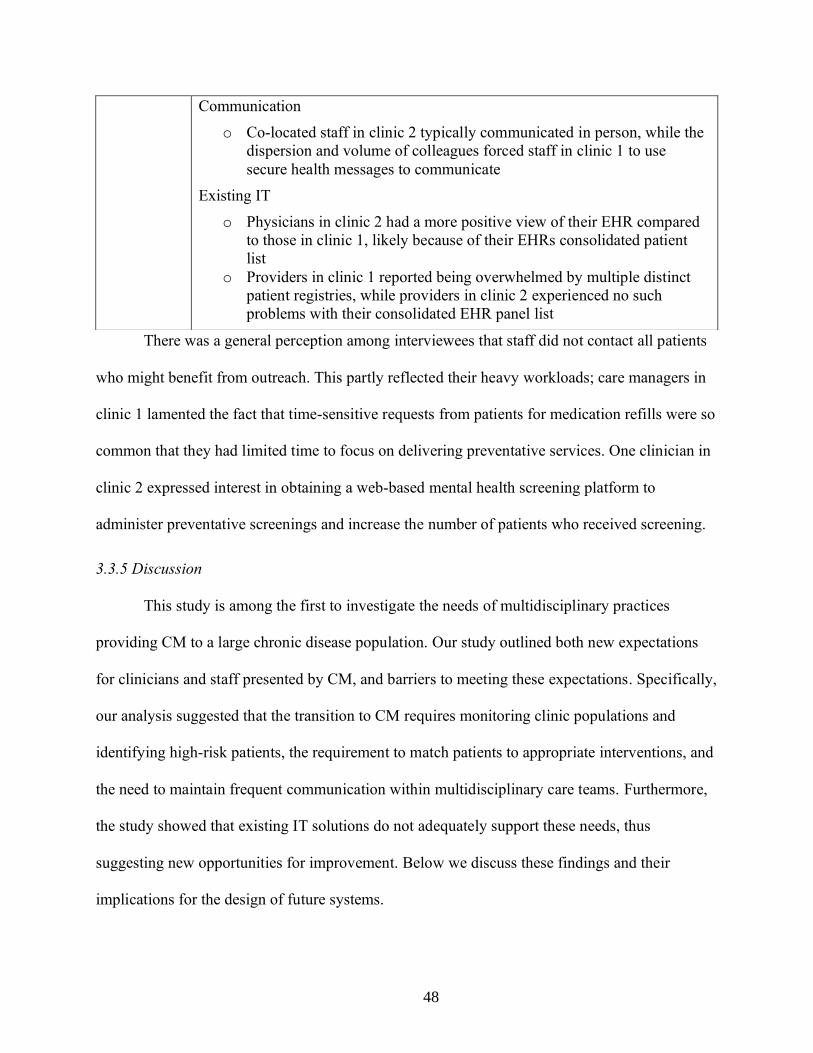
48
There was a general perception among interviewees that staff did not contact all patients
who might benefit from outreach. This partly reflected their heavy workloads; care managers in
clinic 1 lamented the fact that time-sensitive requests from patients for medication refills were so
common that they had limited time to focus on delivering preventative services. One clinician in
clinic 2 expressed interest in obtaining a web-based mental health screening platform to
administer preventative screenings and increase the number of patients who received screening.
3.3.5 Discussion
This study is among the first to investigate the needs of multidisciplinary practices
providing CM to a large chronic disease population. Our study outlined both new expectations
for clinicians and staff presented by CM, and barriers to meeting these expectations. Specifically,
our analysis suggested that the transition to CM requires monitoring clinic populations and
identifying high-risk patients, the requirement to match patients to appropriate interventions, and
the need to maintain frequent communication within multidisciplinary care teams. Furthermore,
the study showed that existing IT solutions do not adequately support these needs, thus
suggesting new opportunities for improvement. Below we discuss these findings and their
implications for the design of future systems.
Communication
o Co-located staff in clinic 2 typically communicated in person, while the
dispersion and volume of colleagues forced staff in clinic 1 to use
secure health messages to communicate
Existing IT
o Physicians in clinic 2 had a more positive view of their EHR compared
to those in clinic 1, likely because of their EHRs consolidated patient
list
o Providers in clinic 1 reported being overwhelmed by multiple distinct
patient registries, while providers in clinic 2 experienced no such
problems with their consolidated EHR panel list

49
First, our findings indicate that proactive care requires continuous monitoring of patients
and the prioritization of a limited number of high-risk, high-need individuals. This strategy was
supported by patient registries, which, unlike commercial EHRs, enabled staff to conduct
population-level surveillance and target care management activities to patients with unmet care
needs.(71,72) However, we corroborated previous studies that have observed patient registries to
be unable to satisfy all clinicians’ needs, which include the need to isolate patients with multiple,
overlapping chronic conditions.(4,19,25) This limitation led staff in both clinics to develop
spreadsheets and paper-based lists that supported monitoring of smaller lists of patients
compared to patient registries. Prior studies have also observed the creation of homegrown
patient monitoring tools such as spreadsheets that enable clinic staff to consolidate information
of patients who they perceive as having high-needs.(22) Despite these strategies, providers felt
that when using this strategy they often lacked awareness of patients requiring care and that
information on patient’s SBDH was not readily available. While previous studies and clinical
thought leaders have described the need for IT systems to utilize information collected in EHRs
to visually reveal high-risk patients, limited research has been conducted in this area (4,7,159)
Second, study participants asserted that it was challenging to match patients to the
appropriate intervention. Care providers asserted that they often struggled to ascertain the ‘root
cause’ of a patient’s failure to engage in self-management; examples of such root causes
included substance abuse and unstable housing. The challenges faced by providers reflected both
their inability to efficiently retrieve information on SBDH and uncertainty of which interventions
might elicit the behavior change required for self-management.(41,160–164) Interactive tools
that enable clinicians to identify these determinants and design evidence-based care pathways
may be useful.(165–168)

50
Third, the study showed that communication within multidisciplinary care teams was
critical for patient-centered care but was challenging. Outside of weekly or bi-weekly case
conferences, staff struggled to maintain adequate communication with colleagues. This partly
reflected the difficulty of identifying a patient’s respective care team. Clinic staff asserted that
having access to an electronic representation of each patient’s providers would ameliorate some
communication challenges, and evidence suggests that this information can be inferred through
the secondary analysis of routinely collected EHR audit log data.(169–171) Future research
should investigate the feasibility of such analyses in ambulatory settings.
In addition to suggesting opportunities to improve the design of existing solutions, this
study identified several directions for novel decision support tools. First, multiple interviewees
reported being unable to identify patients at risk of imminent deterioration, which was required
for effective patient triage. Providers anticipated that predicting future hospitalization and failure
to adhere to medication would enable a more efficient targeting of limited resources. Care
management programs may also benefit from predictive models that target outreach activities to
patients at high-risk.(172–174)
This study has several limitations. First, the majority of the patient population treated in
the clinics studied herein are HIV+ with a high burden of SBDH and both clinics are located in
large urban hospitals, which may limit generalizability to other primary care settings. However,
the care models employed by these clinics is similar to those used by Accountable Care
Organizations and Health Homes.(175,176) In addition, chronic disease treatment programs for
diabetes and COPD and ambulatory oncology programs use multidisciplinary care teams to
proactive address medical issues and thus may also benefit from our findings. Second, interviews
relied on participant’s memory of past events and thus may be susceptible to recall bias.

51
However, a strength of the methodology included triangulation of information from
administrators, physicians, care managers and social workers. Third, the sample size for the
study was relatively small. However, during data collection we reached saturation, suggesting
that a larger sample within the clinics studied herein would not have yielded new findings.
Fourth, we did not observe clinicians during clerical work; observations of clinicians contacting
patients, using health IT tools, or communicating with colleagues would have provided
additional insight into challenges faced by providers.
3.3.6 Conclusion
While the adoption of health IT in primary care practice is variable, systems that facilitate
continuous population monitoring and collaboration between providers are increasingly
recognized as important for improving the care of persons with chronic disease. The main
barriers to effective CM identified in this study were monitoring multiple care indicators among
a high volume of patients, communication within and between interdisciplinary care teams, and
matching patients with the appropriate intervention. The development of IT tools that could
overcome these barriers may positively impact the quality of care for persons with chronic
disease.

52
3.4 Study 2: Situational Awareness in Chronic Disease Care: Requirements for Patient and
Population Monitoring
3.4.1 Background
Health information technology (IT) has been posited as a means to support the delivery of
care management.(7) However, limited research has been conducted on how IT can facilitate
longitudinal monitoring of patient populations. Contemporary systems leverage clinical
registries, which list all empaneled patients in a tabular format and present disease outcomes and
health-related information in one or more columns. While the use of registries is endorsed by the
American Medical Association and are used by the majority of alternative practice organizations
such as Accountable Care Organizations previous studies have observed patient registries to be
unable to satisfy all clinicians’ population management needs.(4,11) Moreover, health IT systems
do not typically represent information on SDOH in a systematic fashion.(177) This precludes
monitoring of SDOH at the population level and deployment of decision support resources for
addressing psychosocial issues. While these are known limitations of existing health IT, it is
unclear how providers work within them and what they need to better support CM.
Conceptual frameworks have been widely used in health informatics research to explain
complex problem domains and incorporate critical human and institutional characteristics into
technology design. With its focus on projection and prediction, situational awareness provides a
useful model for conceptualizing the information needs of healthcare providers within patient-
centered medical homes.(101) For example, nurse care managers with low situation awareness
might not be aware of a critical barrier to care for a patient, do not understand the implications of
that barrier, or that they can’t anticipate the patient’s future outcomes and thus do not perform the
appropriate action. In contrast, a nurse manager that has excellent situation awareness would

53
actively survey risks across multiple domains (e.g. actively monitor patients with poor
medication adherence and flag patients who recently missed clinic visits) and then subsequently
respond with expected actions.
3.4.2 Objective
The purpose of this study was to develop a better understanding of how chronic disease
providers monitor their respective panels by collecting data from two HIV primary care
programs. Towards this end, we develop a conceptual framework of population monitoring in
chronic disease care using the theory of situational awareness.
3.4.3 Methods
We performed a secondary analysis of qualitative data described in section 3.3 using the
theory of situational awareness.
Data Analysis
We performed a secondary directed content analysis using the theory of situational
awareness. First, low-level codes were identified by two coders using the transcripts from the
previous study and the NVivo software. Second, these codes were iteratively analyzed and
organized into categories representing higher level themes. These two steps were performed
independently by two coders (DF, JS) and then discussed and agreed upon in an iterative fashion.
Finally, themes were organized according to the theory of situational awareness. After data
analysis was completed, member-checking was performed with 5 study participants to ensure
validity of our findings.

54
3.4.5 Results
We organized our findings according to the theory of situational awareness. As portrayed in
Figure 3.1, the framework consists of several key factors:
• SA operates at two levels of abstraction; patient- and population-level
• patient-level SA requires perception of relevant care gaps and psychosocial issues,
comprehension of the urgency of a patient’s status, and projection of the impact of a
potential intervention on patient outcomes
• population-level SA requires perception of those patients with care gaps and psychosocial
issues, comprehension of the relative priority of patients within a given population, and
the ability to project which high-priority patients are likely to benefit from intervention
• the importance of goals and goal-directed attention in focusing on specific medical and
psychosocial issues
• the influence of external initiatives on the goals of clinicians
• the role of expectations and mental models in directing attention to relevant information
and comprehending its meaning
• the role of task and system factors that impact SA, including the effectiveness of user
interfaces, the service quality of IT systems, ease of communication with colleagues, and
the adverse impact of workload on SA
• the ubiquitous use of ‘to-do’ lists to ensure that care delivery is completed
A summary of the constructs and themes is presented in Table 3.3 and in the following
paragraphs.

55
Patient-Level Situational Awareness
The most fundamental aspect of situational awareness in chronic disease care concerns
the ability of providers to maintain awareness of each patient on their respective panel. Such
awareness can be conceptualized as involving the three sequential levels of SA; perception,
comprehension, and projection. First, providers maintain perception of each patient’s medical
and psychosocial issues by communicating with colleagues and interacting with available IT
systems. Second, clinicians work to comprehend the urgency of each patient’s aforementioned
issues, leading to a de facto triage of a patient’s care gaps within the larger patient panel. Third,
Figure 3.1 Conceptual framework of patient and population monitoring

56
providers project which of several available interventions could ameliorate the identified
treatment barriers and positively impact patient outcomes.
Perception: Patient Level
Clinicians asserted that they sought to be aware of all medical and psychosocial issues for
their patients; however, the health status of their patients was liable to change, requiring
clinicians to stay current on each patient’s medical and psychosocial status. The primary means
by which providers received updates on patient problems was via direct verbal and
communication with colleagues:
“We speak daily about patients and use secure health messages...[patients] often
tell the medical case manager a lot of the things that they sometimes don't tell
me... I have discussions with social workers and the substance abuse
counselor...so I do know what's going on with [the patients]” (Physician 2, Clinic
2)
In addition to being alerted to emergent patient issues by colleagues, providers also reviewed
patient records in EHR systems. However, the volume of information contained in the patient
record was often considered overwhelming and thus not suitable for clinicians attempting to
familiarize themselves with a large group of patients:
“we don’t have enough time to take those different pieces [of information] and
combine them into unified story, I mean of course a lot of those pieces are
combined in a way in the EMR but not in – you’d have to sort of read this note,
read that note and try to put the pieces together” (Administrator 1, Clinic 1)
Comprehension: Patient Level
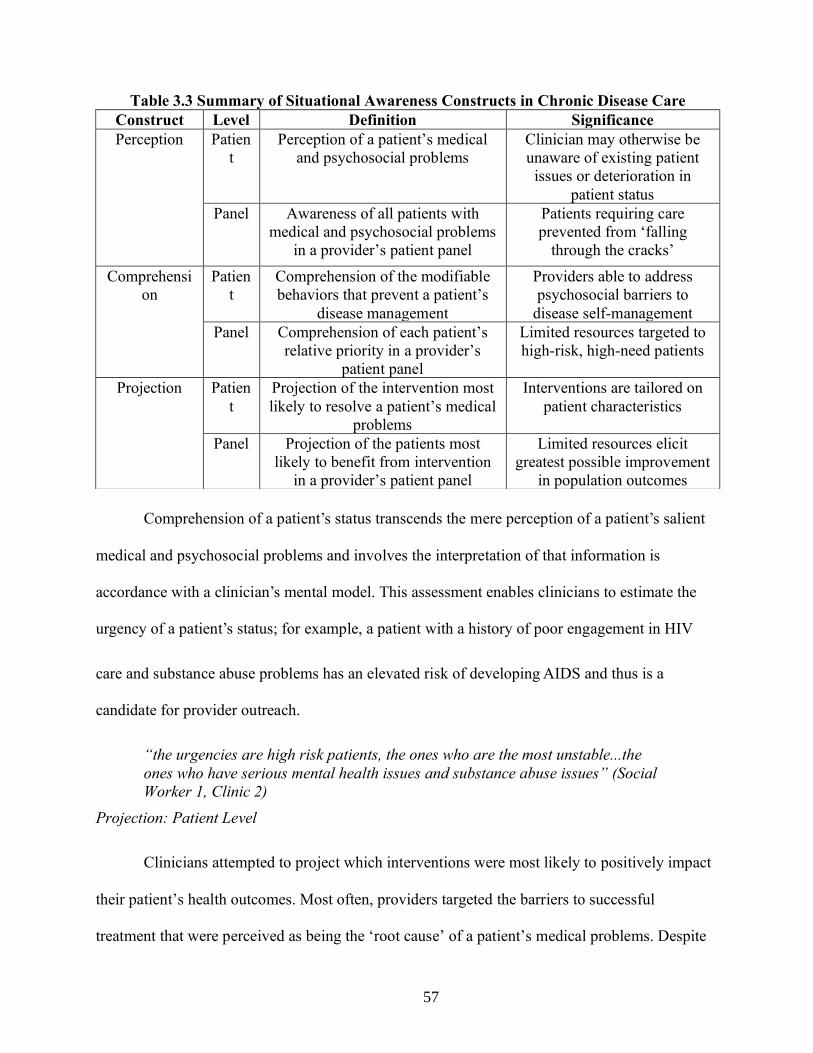
57
Comprehension of a patient’s status transcends the mere perception of a patient’s salient
medical and psychosocial problems and involves the interpretation of that information is
accordance with a clinician’s mental model. This assessment enables clinicians to estimate the
urgency of a patient’s status; for example, a patient with a history of poor engagement in HIV
care and substance abuse problems has an elevated risk of developing AIDS and thus is a
candidate for provider outreach.
“the urgencies are high risk patients, the ones who are the most unstable...the
ones who have serious mental health issues and substance abuse issues” (Social
Worker 1, Clinic 2)
Projection: Patient Level
Clinicians attempted to project which interventions were most likely to positively impact
their patient’s health outcomes. Most often, providers targeted the barriers to successful
treatment that were perceived as being the ‘root cause’ of a patient’s medical problems. Despite
Table 3.3 Summary of Situational Awareness Constructs in Chronic Disease Care
Construct Level Definition Significance
Perception Patien
t
Perception of a patient’s medical
and psychosocial problems
Clinician may otherwise be
unaware of existing patient
issues or deterioration in
patient status
Panel Awareness of all patients with
medical and psychosocial problems
in a provider’s patient panel
Patients requiring care
prevented from ‘falling
through the cracks’
Comprehensi
on
Patien
t
Comprehension of the modifiable
behaviors that prevent a patient’s
disease management
Providers able to address
psychosocial barriers to
disease self-management
Panel Comprehension of each patient’s
relative priority in a provider’s
patient panel
Limited resources targeted to
high-risk, high-need patients
Projection Patien
t
Projection of the intervention most
likely to resolve a patient’s medical
problems
Interventions are tailored on
patient characteristics
Panel Projection of the patients most
likely to benefit from intervention
in a provider’s patient panel
Limited resources elicit
greatest possible improvement
in population outcomes

58
having a cadre of psychosocial interventions available, clinicians reported sometimes being
unsure which specific intervention would be likely to address a given patient problem and often
relied on a ‘best guess’:
"...I will usually will have met with the [patient]...I can say this is was the
dynamic, so I think [I know] how this person might react to this intervention as
opposed to this intervention. Obviously, it’s a best guess.” (Care Coordinator 2 –
Clinic 2)
Population-Level Situational Awareness
Providers asserted that they felt compelled to ensure that all of their patients were
receiving necessary care and that it was especially important to identify and intervene on patients
considered ‘high-risk’ for adverse medical events including hospitalization and mortality. These
concerns were in accord with situational awareness, and the concept of perception can
adequately represent the desire to be aware of all patients requiring care, and comprehension to
understand the relative urgency of a patient’s status in relation to others in the population.
Moreover, providers were also interested in projecting which patients were most likely to benefit
from intervention, due to the fact that they had limited resources that prevented all patients from
receiving intensive medical or psychosocial interventions.
Perception: Population Level
Secondary to being aware of less-than-optimal population outcomes, both clinics
employed patient registries that identified patients requiring care. Staff asserted that registries
successfully increased their awareness of the patients for whom they were responsible, especially
among those patients with which they had no recent interactions.
“Our [patient registries] are a way to get [patients] in front of your face...I can
look at my panel and see every patient that’s assigned to me and has a detectable
[HIV] viral load...you’re supposed to go through that and remember and care for

59
people who aren’t in front of you...even when they’re not coming to clinic”
(Physician 3 – Clinic 2)
While the aforementioned patient registries helped physicians monitor their respective
patients, non-physician staff in the clinics studied lacked access to such a resource even though
they were associated with dedicated patient panels. As a result, staff manually curated lists and
spreadsheets that reference all patients under their care. One social worker in clinic #2
maintained an Excel spreadsheet with every patient she had interacted with, totaling more than
500 patients. These lists often served as cognitive aids to help providers maintain awareness of
their patients:
“I have to develop my own spreadsheets so I have an idea of who [my patients]
are... Imagine if I didn’t have this list – names wouldn’t come to mind because we
encounter people every day. So, I have to keep a list.” (Care Coordinator 1,
Clinic 1)
Comprehension: Population Level
The inability of clinicians to provide intensive care to all of their patients required the use
of prioritization to assign resources to the highest-need patients. This process was performed in
weekly and bi-weekly team meetings, which typically focused on 5 to 10 high-priority patients
who were perceived as requiring immediate attention from their provider.
“we do the best that we can with the resources that we have, but we don’t have
enough resources to thoroughly address the needs of all the patients and so we
triage to figure out people that we think are super high needs.” (Physician 1 –
Clinic 1)
In both clinics, the characteristics that made patients more likely to be considered ‘high-
risk’ included disease-specific biomarkers such as HbA1c or HIV viral load as well as social and
behavioral determinants of health. These characteristics were adjudicated in regard to their
perceived importance, with a patient’s HIV outcomes being perceived as the most important
indicator that a patient was prioritized for enhanced services.

60
“The patients who have been non-adherent to their antiretrovirals, persistently
high HIV, RNA, and also patients who have been lost to follow up, who haven't
been [to clinic] in more than six months if they are in need, those are the
priorities.” (Physician 2 – Clinic 2)
Projection: Population Level
Providers were interested in projecting which patients were most likely to benefit from
intervention. This reflected the fact that the clinic had limited resources, and therefore extending
interventions to patients whose outcomes were unlikely to improve was thought to be inefficient.
“some [patient] problems are intractable and no amount of application or
resources is likely to help and another group will be kind of in between...you’ve
got to triage again because you don’t have endless resources to solve every
problem that every patient has” (Physician 1 – Clinic 1)
Providers asserted that they were often reluctant to use limited resources on patients with
a history of poor care engagement because they were less likely to participate fully in medical or
social interventions compared to patients with more consistent engagement.
“[we] try to strategize who [we] can and can’t see...at times you go to the patient’s home
and maybe you took all this time to go there and the patient is not home...they don’t
necessarily prioritize your coming over...if the patient is engaged it works perfectly. If
they’re not, then it becomes a problem” (Administrator 2 – Clinic 2)
Goals & Goal-Directed Processing
A central tenet of Endsley’s model of SA is that a decision maker’s goals and plans direct
which aspects of the environment are attended to in the development of SA. Goals, as described
by study participants, influenced patient- and population-level perception and concerned the
improvement of population-wide quality metrics such as increased rates of HIV viral load
suppression. Goals were fluid and were impacted by two factors: a) external initiatives from
healthcare payers and public health departments and b) continuous quality measurement within a
given clinic.

61
Study participants asserted that their clinic’s focus on addressing specific certain care
indicators resulted both from economic incentives (i.e. pay-for-performance) sponsored by
healthcare payers including the New York State Medicaid program as well as local initiatives
advanced by the local public health department:
“[the clinic] is supporting the New York State [Medicaid] initiative around two
HIV specific projects... the other driver is in New York state ‘End the Epidemic’
initiative...therefore the two major drivers is the changing landscape of the
incentive structure to be more value-based and caring for whole populations and
then the public health initiatives” (Administrator 1 – Clinic 1)
In addition to external factors, clinicians updated their own self-declared goals by
routinely assessing population-wide outcomes. One clinician noted that once the number of
patients who achieved suppression was below a certain threshold, the provider would take action
to ensure that this outcome improved across her panel:
“I use the [quality measurement dashboard] weekly to check that I’m ‘green’ on
what I see as important. If I see I’m becoming ‘red’ on let say [HIV viral load]
suppression, I’ll click on the [patient registry] and start calling the patients or
sending messages to outreach all of them...but I don’t do it unless I’m in the red.”
(Physician 1, Clinic 2)
Mental Models
The aforementioned goals of each clinician activate a mental model of clinicians that
directs their attention to specific patient medical and psychosocial issues; such goal-activated
mental models are hallmarks of Endsley’s theory of SA. According to Endsley, mental models
engender selective perception, wherein decision-makers may neglect and quickly forget stimuli
that contradict prior beliefs.(102) In the context of patient and population monitoring, this
manifested in providers paying close attention to patients with certain characteristics, such as a
low CD4 count or a high HIV viral load:
“ I would like to have patients that are out of care and the patients with low CD4
and very high viral load at the top [of my EHR]. That would probably be my

62
concern. Usually when we put them in for their HIV care, if they have diabetes or
high blood pressure, that responds also” (Physician 2, Clinic 2)
Another function of provider’s mental models are to explain the relationship between a
patient’s psychosocial factors and treatment outcomes. Once a provider had adequate perception
of social determinants of health such as unstable housing or behavioral health issues, their mental
models enabled them to recognize these factors as barriers to successful disease treatment and
provided swift retrieval of appropriate actions and patient interventions. We observed that while
most participating clinicians focused on mental health and substance abuse problems as barriers
to treatment success, the degree to which other determinants such as unstable housing and
socioeconomic status were considered was variable.
“the majority of our patients I would say have some mental health issues and
that’s everything. I mean without dealing with that, addressing that, the medical
stuff is very hard to get in place.” (Care Coordinator 2, Clinic 1)
System Factors
Interface Design
Staff asserted that they were overwhelmed by the volume of information presented in the
multiple patient registries of their population health tool and requested functionality that could
consolidate multiple registries to reduce information overload. In addition, providers were eager
to obtain functionality that would allow providers to interactively prioritize their patients
according to multiple care indicators.
“There are clinical dashboards but they don’t really get the full picture, housing,
social stress or social isolation, whatever it might be, and all the nuances, that’s a
big important factor. So, I think that comprehensive story is still fragmented,
there is many cases where [providers] are talking and sort of piece that together,
but it’s more on an ad hoc basis.” (Administrator 1 – Clinic 1)
IT Service Quality

63
Clinicians asserted that poor service quality of both the EHR and the population health
module adversely impacted their ability to monitor and address care gaps. One clinician
described how care team meetings were delayed by the unresponsiveness of the population
health module:
“the dashboard...it’s really, really slow and unresponsive and we are sitting in a
meetings and staring at this” (Social Worker 1 – Clinic 1)
Communication with Colleagues
Clinicians in both clinics asserted that they were often alerted to patients requiring care
by their colleagues; this occurred both in weekly care team meetings and in-person
communications throughout the workday. Case managers and RN care managers often alerted
physicians to patient problems via secure health messages; such communications typically
followed direct interactions with patients in the clinic or on the phone. However, there was a
sentiment among clinic administrators that communication was not optimized and thus important
patient issues ‘fell through the cracks’, thereby compromising situational awareness.
“there are gaps in the overall choreography of the workflows...workflows haven't
been fully developed and engrained, so I think good things fall through the cracks
because of it...as new developments happen, everyone [should be] aware of what
those new developments are, so they can respond to it, depending on what their
role is.” (Administrator 1 – Clinic 1)
Workload
Study participants asserted that having responsibility for a high volume of patients can
have an adverse impact on situational awareness.
“It’s the things that happen throughout day that sometimes making a little
challenging to [monitor patients]... our responsibility has increased; we get
secure health messages on patients needing refill, have to make sure [patients
are] virally suppressed, make sure they’ve seen the doctor within the last couple
of weeks or month...imagine having 20, 30 cases that you miss.” (Care Manager 1
– Clinic 1)

64
‘To Do’ lists
A critical adjunct to situational awareness were ‘to do’ lists that ensured clinicians
performed the actions that resulted from situational awareness; these lists were used by the
majority of providers, stored in various media including spreadsheets and notebooks, and
required due to the sheer volume of tasks existing across a large patient panel. Lists were
populated with reminders to perform actions related to preventative and acute care.
“I do keep an excel spreadsheet...it will let me know who has missed an
appointment, who I need to follow-up with, and then I’ll manually put in – if they
Table 3.4 Recommendations to Support Situational Awareness in Chronic Disease Care
Construct Process IT Requirements Data Sources
Perception Providers seek real-time
updates of patient medical
and psychosocial
problems
IT systems that alert
clinicians to critical
events & required
actions without
disrupting
workflow
Colleagues
Electronic Health
Records
Patient Registries
Providers develop
strategies to maintain
perception of patients
with medical and
psychosocial problems
Interactive systems
which visually
reveal patients
requiring care
Comprehension Comprehending
modifiable barriers to
treatment
EHR
summarization tools
that highlight
psychosocial issues
Integrate summarization
tools that highlight
psychosocial issues into
EHRs
Providers prioritize
patients on a range of
medical and non-medical
needs
Interactive systems
that support triage
of populations
Develop interactive
systems that enable
clinicians to triage
patient populations
Projection Providers identify
intervention most likely
to impact patient
outcomes
Prediction of
intervention success
Support clinical decision
making with evidence-
based guidelines with a
focus on psychosocial
issues Interventions are targeted
to patients most likely to
benefit
CDS = Clinical Decision Support. EHR = Electronic Health Record

65
made the appointment, if they miss the appointment, if they need a social work
appointment” (Social Worker 2, Clinic 1)
Reminders included directives to contact patients after missed visits and referrals for patients to
enroll in supportive services. This was perceived as ameliorating the challenge of recalling the
high volume of tasks required when providing proactive care to a large patient population.
“whatever was the follow-up, we document whether it was followed up
on...whether those steps have been completed and there is also a way to do
that...[the spreadsheet] is just like a shorthand version of what we are
documenting in the medical record, so that we can eyeball it very quickly and say,
these patients are due for follow-up.” (Administrator, Clinic 2)
3.4.6 Discussion
We describe how situational awareness can be used as a framework to understand how
clinicians manage populations of chronic disease patients. The principal contribution of this
framework is a comprehensive and coherent means of understanding how providers deliver
chronic disease care. Our study findings also provide a set of design goals for informatics
interventions in chronic disease care. In addition, the framework gives us clear evaluation criteria
for informatics interventions whose objective is to improve provider’s situational awareness.
Our adaptation of situational awareness to chronic disease management provides a
coherent framework for understanding a complex system and can serve to guide future
qualitative studies. In addition, the framework of situational awareness also highlights cognitive
processes implicated in monitoring panels of chronic disease patients. Using the theory of
situational awareness to inform our data analysis led to an unexpected exploration of the
influence of goals and goal-directed processing in patient monitoring. In addition, SA’s
consideration of the role of mental models in decision-making helped our research team
elucidate the process by which clinicians interpret psychosocial information and identify barriers
to successful disease treatment. Such barriers were then used by providers to prioritize patients

66
and plan interventions including programs to address substance abuse disorders and unstable
housing.(40,178,179)
An additional contribution of our framework is providing guidance for the design of IT systems
whose purpose is to improve provider’s situational awareness in chronic disease care. Such
design guidance may be timely as longitudinal patient monitoring (aka ‘population health’) is
becoming increasingly valued by health systems while existing IT systems for this purpose are
perceived as inadequate.(4,159) Perception may be supported by IT systems that can aggregate
and summarize clinical data to reduce cognitive load and improve situational awareness
(159,180), while comprehension could be supported by systems that enable providers to
dynamically arrange patients according to their health status.(4,25) Finally, projection could be
supported by recent research related to decision support in care management; several studies
have observed that it is feasible to use clinical data to predict whether a patient will respond
favorably to care management interventions.(181–183) More recently, a method was developed
that can estimate which care management intervention among several alternatives has the highest
likelihood of success.(184)
The SA framework described herein provides a means of measuring the impact of IT
tools on the ability of clinicians to adequately monitor their patients. Recent research has
demonstrated the limitations of using patient outcomes as the primary criteria for evaluating data
visualizations and visual analytics technologies.(28) We contribute three components of provider
situational awareness that may be evaluated in future research studies; perception,
comprehension, and projection. As a result, established methods of measuring situational
awareness such as freeze probes, post-trial self-rating techniques, and observer-rating techniques

67
can be used to evaluate the efficacy of informatics interventions either in contrived ‘laboratory’
settings or in actual clinical practice.
Our findings have several limitations. First, the clinics studied treated predominately
HIV+ individuals with multiple, co-occurring chronic conditions and social factors. In addition,
due to the intensive nature of HIV primary care, care managers were responsible for 500
patients, which is smaller than a typical primary care panel.(55,57) Results may be different in
other settings. Second, we relied on participant’s memory of past events during interviews and
thus our findings may be susceptible to recall bias. However, all findings were generated via
triangulation of data collected from both interviews and team meeting observations. Third, a
definitive link between provider situational awareness and patient outcomes has not been
established in this setting; future research can be undertaken to do so.
3.4.7 Conclusion
We adapted the theory of situational awareness to advance a conceptual framework for
population monitoring in chronic disease care. This framework provides a detailed and coherent
representation of how population monitoring is performed and can inform the design of IT tools
that support providers caring for populations of chronic disease patients. Future researchers can
use the framework to evaluate the impact of informatics interventions on healthcare providers.

68
Chapter 4: Social and Behavioral Determinants of Sexual
Health in the Patient Record
4.1 Background & Significance
Social and behavioral determinants of health (SBDH) are behavioral, environmental, and
community factors that have been implicated in an array of adverse health outcomes. Because
knowledge of these and other SBDH for specific patients is clinically meaningful and can lead to
tailored care plans, accounting for SBDH has become increasingly recognized in healthcare
delivery. This is especially critical in the management of persons living with HIV. As a result,
there has been increasing momentum for incorporating social determinants into the electronic
health record (EHR). In 2015, the National Academy of Medicine recommended a set of 12
SBDH indicators, part of the Meaningful Use Program. The Office of the National Coordinator
for Health Information Technology (ONC) recently drafted the 2018 guidelines for collection of
8 of the 12 aforementioned indicators, all of which are mapped to standard LOINC codes.
However, efforts to integrate information on SBDH into EHRs have struggled due to the fact that
providers often fail to adequately document their patient’s self-reported SBDH.(17,185–189) In
addition, low adoption rates for clinical screening tools for SBDH in EHRs exist as a barrier to
the collection of this information in a usable format.(177,190) As a result, there has been interest
in automatically inferring social and behavioral determinants from EHR data and empower
healthcare providers with this information during clinical interactions with chronic disease
patients.

69
4.2 Research Questions
Research Question 1: To what extent does EHR documentation of social and behavioral
determinants change between encounters?
Hypothesis: The combination of clinical notes and structured data result in improve performance
against a gold-standard compared to those sources alone
Research Question 2: How to infer from clinical data a range of social & behavioral
determinants from the patient record?
Hypothesis: Not all SBDH factors have equal ability to be inferred; performance is contingent on
the frequency and lexical diversity of the annotated determinant

70
4.3: Study 1: Towards the Inference of Social and Behavioral Determinants
of Sexual Health: Development of a Gold-Standard Corpus with Semi-Supervised Learning
4.3.1 Introduction
Social and behavioral determinants of sexual health have received comparatively less
attention than other SBDH. High-risk sexual activity like infrequent condom use and receptive
anal intercourse is associated with increased risk for human immunodeficiency virus (HIV) and
other sexually transmitted infections (STIs). Transgender persons are also at a higher risk of
acquiring STIs and less likely to achieve desirable chronic-disease outcomes such as HIV viral
load suppression.(188,191) Moreover, sexual orientation may play a role in STI risk. At present,
sexual health SBDH are not collected in SBDH screening instruments such as the PRAPARE or
the Accountable Health Communities Screening (AHCS) tool, nor routinely documented in the
structured part of EHRs.(177,192) This challenges the development of clinical decision support
systems and population-level interventions to reduce the prevalence of HIV and other
STIs.(193,194)
Overall, there are still several research gaps when it comes to automated identification of
SBDH related to sexual health: 1) only a few of the pertinent SBDHs have been examined in the
literature; 2) they have diverse lexical realizations in clinical notes and for many, there might not
even be good coverage in existing terminologies; and 3) documentation of SBDH are rare across
patients (despite their acknowledged importance).
4.3.2 Objectives
We sought to generate a standard set of determinants related to sexual health; we describe
an expert curation of 38 such SBDHs. Using this set of SBDH, we attempted to curate a sizable
annotated corpus using manual review and semi-supervised learning.

71
4.3.3 Materials and Methods
Social and Behavioral Determinants Relevant to Sexual Health
Three physicians (JZ, PG, MY) experienced in the prevention and treatment of STIs
reviewed the biomedical literature and identified six high-level domains of behavioral risk factors
for STIs (gender, sexual orientation, sexual activity, drug use, alcohol use, and homelessness),
along with 32 individual-level SBDH (Table 4.1). These SBDH represent independent risk factors
for the acquisition of STIs and have recently been the focus of targeted HIV prevention efforts.
The domain experts recommended that the six SBDH domain labels should indicate
whether information related to a candidate risk domain was documented. For example, “patient
denies sexual activity” and “patient is sexually active” would both result in a positive label for the
“Sexual Activity” domain. It was hypothesized that these domain-level labels can be used to inform
efforts directed at improving social and sexual history taking by clinicians.
Development of Annotation Guidelines for Sexual Health SBDH
We chose to obtain annotations at the document-level rather than mention-level because of
how social and behavioral determinants are expressed in natural language. Unlike many other
biomedical concepts, SBDH are infrequently expressed as named entities. For example, we
observed the following examples in clinical notes at CUIMC:
“has continued to relapse on crack and beer since starting treatment 3 months ago”
“noted that he used occasional social EtOH (scotch) at church functions”
“Transmitted via heterosexual intercourse”
“3-4 lifetime male unprotected sexual partners”
“HIV/AIDS (Dx 1992 after unprotected sex, RF sex with both men and women”
In addition, we also reasoned that obtaining document-level annotations would be less
labor-intensive than obtaining mention-level annotations, an important consideration given how
infrequently SBDH are mentioned in patient records.

72
We excluded from consideration relational modifiers such as amount (e.g., “5 sexual
partners”), frequency of exposure (e.g., “once a month”), and status (e.g., “current/past/none”)
because this information is not prioritized by clinical interventions addressing sexual health.
However, document-level annotation does not preclude the capture of relevant modifiers such as
the frequency of condom use (e.g., “condom never”, “condom sometimes”, “condom always”).
Annotators were instructed to review the entire length of each clinical note.
Collection of Clinical Notes for Manual Annotation
A corpus of clinical notes was obtained from the clinical data warehouse at Columbia
University Irving Medical Center (CUIMC), a large academic medical center in New York City.
For this study, we obtained all individual notes types associated with 4,000 HIV+ individuals
within the commercial EHR system at CUIMC (e.g., Admission Note, Progress Note). Additional
details on this cohort are described elsewhere. The study described herein was approved by the
Institutional Review Board at CUIMC.
Systematic Annotation of Clinical Notes with Curated SBDH Labels
We recruited one Infectious Disease fellow and two medical students to manually review
clinical notes for the presence of the 38 SBDH labels. To train for annotation, an initial set of three
longitudinal patient records were coded by all three annotators; all discrepant labels were discussed
and resolved by consensus to create a shared understanding of the SBDH concepts. The annotators
utilized the annotation guidelines and iteratively improved on them during that phase.
Subsequent to the initial training, annotators were instructed to systematically review all
notes associated with each patient’s record. After annotating >1,000 notes, we observed that many
notes rarely contained SBDH mentions (e.g. “Nursing Progress Note”). The annotators then

73
isolated their review to select note types written by healthcare providers related to hospital
admission and discharge, outpatient care, and psychiatry consultations.
4.4.2 Semi-Supervised Learning for Corpus Expansion
The scarcity of clinical notes containing explicit SBDH mentions rendered the annotation
process described above extremely labor-intensive. The excessive amount of human effort required
to compile a sizeable annotated corpus exists as a barrier to the use of deep neural networks, which
achieve state-of-the-art performance on a range of NLP tasks. As a result, we employed a technique
leveraging modern distributional semantic techniques to accelerate the manual annotation process
by identifying clinical documents likely to mention SBDH.
Training Word Embeddings for SBDH
We used the popular GloVe software package to train vectors representations of words. We
isolated the social history section of 343,322 randomly selected notes from within our overall
clinical data warehouse (343,322 patients). We extracted Admission, Nursing Adult Admission
History, and Ambulatory Aim Primary Provider notes because these notes often contained relevant
SBDH information and had a Social History section. Prior to training, clinical notes were
preprocessed by removing non-alphanumeric characters, replacing numbers with a special token,
and converting all tokens to lowercase.
We evaluated several different configurations of GloVe by using word vectors of 50, 150,
and 300 dimensions while using a window size of 8 words and 50 iterations of training. 50-
dimensional vectors were chosen because they had similar performance compared to 150 and 300-
dimensional vectors with lower complexity; performance was assessed by evaluation precision at
10 on a held-out testing set of 20% of the notes with 0 patients overlapping between the testing
and training sets. The isolated corpus yielded 33,206,266 tokens and 2,37,072 unique words.

74
Removal of words with fewer than 5 mentions in the corpus were excluded to generate a
vocabulary size of 47,479.
Creation of Centroid Document for each SBDH Label
We then sought to retrieve and rank unannotated clinical notes with regard to similarity to
annotated notes with explicit mentions of our target SBDH. This required the generation of a single
centroid document for each SBDH label. For each SBDH label, we isolated the social history
sections of all notes with valid mentions of the specific SBDH and represented each document
itself as a 50-dimensional vector by averaging the word embeddings associated with the document.
The singular centroid for each SBDH was generated by again averaging the document vectors
associated with the SBDH. We did not construct a centroid for gender-related documentation.
Identification of Unannotated Notes Likely to Contain SBDH Documentation
We then isolated 144,432 clinical notes associated with HIV+ individuals obtained from
the enterprise data warehouse at Columbia University Irving Medical Center. Each note was
represented as a 50-dimensional vector by averaging the individual word embeddings of each note
as described above. For each SBDH label, cosine similarity was used to rank unannotated notes in
order of descending cosine distance to the corresponding SBDH centroid document. This resulted
in a ranking of notes in regards to cosine distance from one or more document centroids. Notes
identified using this methodology are hereafter referred to as candidate SBDH notes.
Annotation of Candidate Clinical Notes
Following the annotation guidelines, two annotators subsequently annotated candidate
SBDH notes corresponding to 5 domain-level SBDH and observed high interrater reliability; a
Kappa statistic of 0.598 was observed across all SBDH labels.

75
4.3.4 Results
Three physicians experienced in the prevention and treatment of STIs reviewed the
biomedical literature and identified six high-level domains of behavioral risk factors for STIs
(gender, sexual orientation, sexual activity, drug use, alcohol use, and homelessness), along with
32 individual-level SBDH (Table 4.1). These SBDH represent independent risk factors for the
acquisition of STIs and have recently been the focus of targeted HIV prevention efforts.
The domain experts recommended that the six SBDH domain labels should indicate whether
information related to a candidate risk domain was documented. For example, “patient denies
sexual activity” and “patient is sexually active” would both result in a positive label for the
“Sexual Activity” domain. It was hypothesized that these domain-level labels can be used to inform
efforts directed at improving social and sexual history taking by clinicians.
Three annotators reviewed every clinical note associated with 32 randomly selected HIV+
individuals to detect the presence of all SBDH labels. 76 notes were double annotated (Kappa
0.736 across all SBDH). 3883 clinical notes were manually annotated and 17.9% (695) had one or
more SBDH label. On average, there were 0.83 SBDH mentions per annotated note. In addition,
we observed a high frequency of redundant text, reflecting the widespread usage of copy-and-paste
at CUIMC.
While our annotation process is underway, we thus far have amassed a corpus of 4,045
annotated clinical notes, overall associated with 105 HIV+ individuals. 19.0% of notes (770)
contained documentation of 1 or more of the six SBDH domains. Among domains, alcohol use
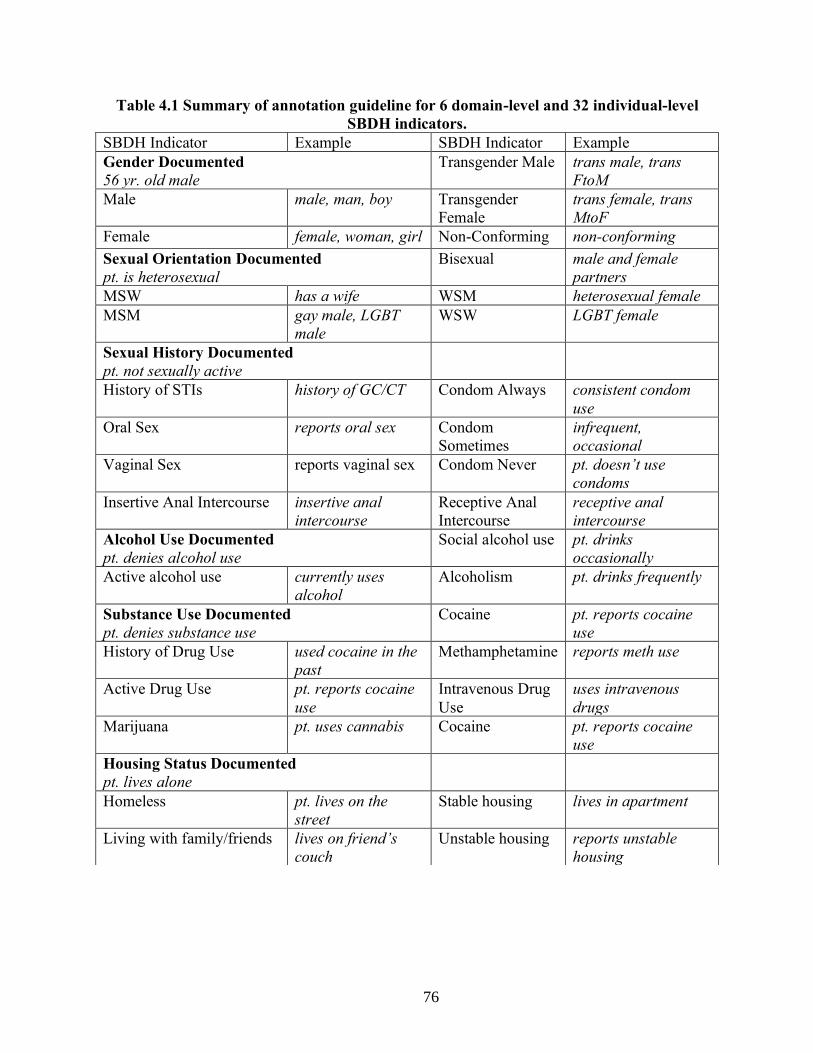
76
Table 4.1 Summary of annotation guideline for 6 domain-level and 32 individual-level
SBDH indicators.
SBDH Indicator Example SBDH Indicator Example
Gender Documented
56 yr. old male
Transgender Male trans male, trans
FtoM
Male male, man, boy Transgender
Female
trans female, trans
MtoF
Female female, woman, girl Non-Conforming non-conforming
Sexual Orientation Documented
pt. is heterosexual
Bisexual male and female
partners
MSW has a wife WSM heterosexual female
MSM gay male, LGBT
male
WSW LGBT female
Sexual History Documented
pt. not sexually active
History of STIs history of GC/CT Condom Always consistent condom
use
Oral Sex reports oral sex Condom
Sometimes
infrequent,
occasional
Vaginal Sex reports vaginal sex Condom Never pt. doesn’t use
condoms
Insertive Anal Intercourse insertive anal
intercourse
Receptive Anal
Intercourse
receptive anal
intercourse
Alcohol Use Documented
pt. denies alcohol use
Social alcohol use pt. drinks
occasionally
Active alcohol use currently uses
alcohol
Alcoholism pt. drinks frequently
Substance Use Documented
pt. denies substance use
Cocaine pt. reports cocaine
use
History of Drug Use used cocaine in the
past
Methamphetamine reports meth use
Active Drug Use pt. reports cocaine
use
Intravenous Drug
Use
uses intravenous
drugs
Marijuana pt. uses cannabis Cocaine pt. reports cocaine
use
Housing Status Documented
pt. lives alone
Homeless pt. lives on the
street
Stable housing lives in apartment
Living with family/friends lives on friend’s
couch
Unstable housing reports unstable
housing
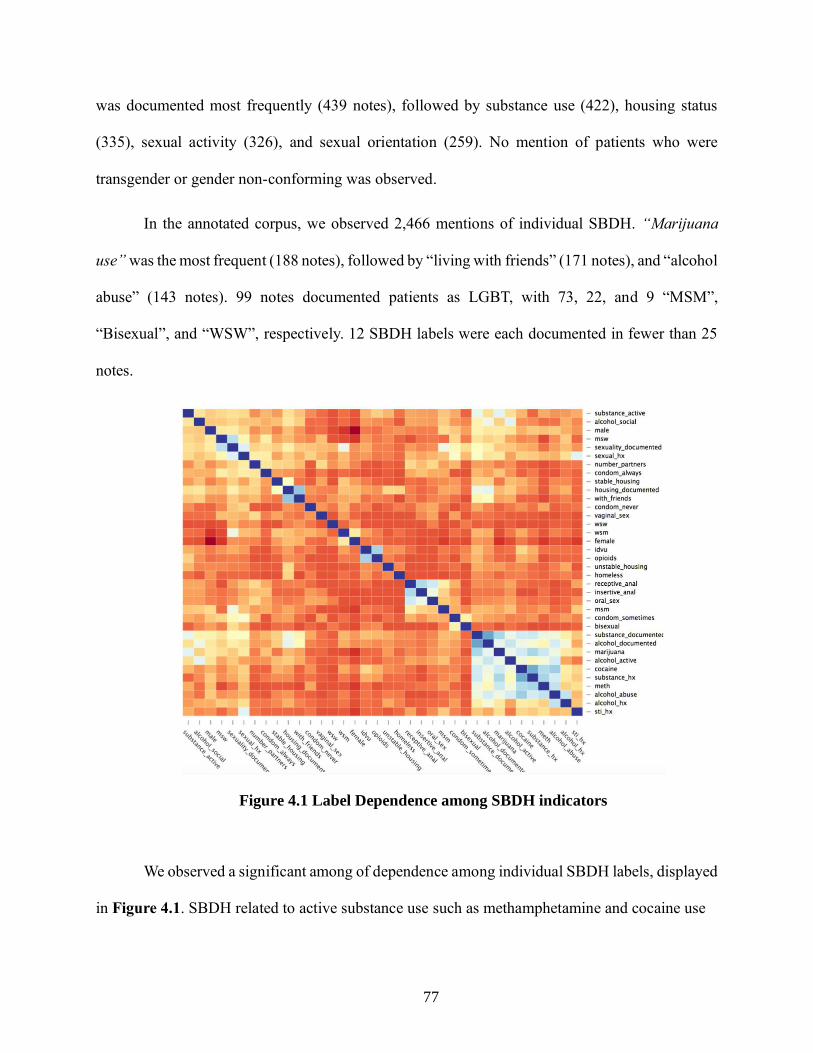
77
was documented most frequently (439 notes), followed by substance use (422), housing status
(335), sexual activity (326), and sexual orientation (259). No mention of patients who were
transgender or gender non-conforming was observed.
In the annotated corpus, we observed 2,466 mentions of individual SBDH. “Marijuana
use” was the most frequent (188 notes), followed by “living with friends” (171 notes), and “alcohol
abuse” (143 notes). 99 notes documented patients as LGBT, with 73, 22, and 9 “MSM”,
“Bisexual”, and “WSW”, respectively. 12 SBDH labels were each documented in fewer than 25
notes.
We observed a significant among of dependence among individual SBDH labels, displayed
in Figure 4.1. SBDH related to active substance use such as methamphetamine and cocaine use
Figure 4.1 Label Dependence among SBDH indicators

78
(correlation coefficient = 0.63) often displayed a strong correlation, as did active alcohol use and
a history of substance abuse (0.39). MSM and receptive anal intercourse (0.35) also displayed a
correlation. However, the correlation matrix suggests that a considerable number of SBDH exhibit
little association with other labels.
Semi-Supervised Learning
We isolated 10 clinical notes within the lowest cosine distance compared to 5 ‘domain-
level’ centroids and computed precision-at-10. Our approached yielded the following precision-at-
10 results: “housing status documented” (100%), “alcohol documented” (90%), “substance use
documented” (90%), “sexuality activity documented” (60%), and “sexual orientation
documented” (60%). Averaged across these, we observed a precision-at-10 of 80%.
118 notes with high similarity to 1 or more SBDH centroids were annotated and 113 notes
(95.7%) contained 1 or more SBDH mentions. On average, there were 8.26 SBDH mentions per
note. This represents an astounding 10-fold increase in the yield of positive SBDH mentions
compared to the systematic review (0.83 vs. 8.26 SBDH per note). In addition, the 118 notes were
associated with 80 HIV+ patients, achieving our goal of diversifying the annotated corpus and
reducing the frequency of redundant text.
4.3.5 Discussion
We posit that our schema of SBDH related to sexual health can serve as a common
foundation on which to build data collection and analysis efforts. Our set of 32 individual-level
SBDH constitute an array of behaviors that have been associated with an increased likelihood of
acquiring syphilis, HIV, and other STIs.(195) In addition, our six domain-level SBDH indicators
may be used to assess the quality of clinical documentation. The annotation guidelines can inform

79
future efforts in corpus curation and computational methods to infer determinants of sexual health
from EHRs (available at github.com/danieljfeller/SBDSH).
We advance a standard for the annotation of clinical notes for social and behavioral
determinants of sexual health. Overall, the SBDH domains were observed infrequently in clinical
notes; alcohol and substance use were the most prevalent individual-level SBDH in our corpus but
were observed in only 4% of annotated notes. Sexual orientation was documented in less than 1%
of notes. SBDH documentation occurred mostly in outpatient notes, admission notes, and
discharge summaries. We are also the first to observe inter-SBDH correlation; several individual-
level SBDH displayed moderate associations with other labels (e.g., “cocaine use” and “alcohol
use”). This label dependence could potentially be leveraged to improve their automated extraction.
Because SBDH documentation is so rare and the requirement of a large gold-standard
corpus to learn from, our approach necessitated the use of computational methods to identify
clinical notes likely to contain SBDH content. Our semi-supervised approach using similarity
based on section-embeddings successfully increased the yield of manual annotation. Annotators
observed 8.26 distinct SBDH mentions per note for the 60 notes closest to the 6 SBDH domain
centroids, compared to 0.83 mentions per note randomly sampled from a cohort of HIV+
individuals. The utility of distributional semantics techniques for modeling the diverse lexical
realizations of SBDH in notes has been established.(196) Our approach allowed our research team
to increase the size and diversity of our annotated corpus. Further, this approach may also enable
the diversity of our corpus in patients and types of lexical realizations of SBDH, thereby ensuring
the extensibility of future SBDH models to various patients and healthcare settings.
The manual annotation confirmed our hypothesis that there is a wide variation in lexical
realizations of SBDH, ranging from word to multi-word expressions to whole sentences. As such

80
our approach to treating annotation as document-level labeling circumvented this phenomenon.
We experimented with using supervised learning to infer SBDH labels for given clinical notes.
The inability to infer the presence of individual-level SBDH likely reflects the limited size of our
annotated corpus, as compared to the training size typical of other document classification systems
for medical concept recognition.(197,198) Moreover, the poor classifier performance may reflect
the UMLS’s lack of coverage for SBDH; 62% of annotated notes with explicit mentions of SBDH
were tagged with no relevant UMLS concepts by our in-house named-entity recognition system.
Only 38% of annotated notes with explicit mentions of SBDH were tagged with 1 or more relevant
UMLS concepts. There are a number of ways to improve on our experiments: (1) multi-label
classification may be improved by accounting for the observed structure of SBDH labels.
Hierarchically structured sets of SVM have demonstrated improved performance compared to
binary relevance for multi-label classification of clinical documents.(199–202) In addition, it may
be possible to leverage the SBDH label dependence exhibited in Figure 1;(203) (2) document-
level SBDH labeling may benefit from document zoning.(204) Long documents like clinical notes
typically contain many words unrelated to the modeling task; in clinical documentation this is
manifested by sections (ie. ‘Review of Systems’) potentially irrelevant to SBDH; (3) structured
elements of the EHR such as laboratory tests and diagnosis codes can improve the inference of
social determinants compared to using notes alone. Future studies should examine whether
laboratory tests for STIs hold prognostic value; and (4) with a larger annotated corpus, a neural
network with attention layer that could provide transparency for classification decisions, may
improve results.
Our study has several limitations. First, document-level annotations lack the granularity of
mention-level annotations and thus systems trained on such data may be inappropriate for some

81
informatics interventions.(205) Second, our semi-supervised learning approach relied on notes
which contained a social history section; not all notes do so. Third, a relatively small sample size
was used for evaluation of the semi-supervised learning approach.
4.3.6 Conclusion
We describe a set of social and behavioral determinants related to sexual health and
report on the curation of a gold-standard corpus of clinical notes documenting such determinants.
Our findings demonstrate that while these SBDH are infrequently documented in clinical notes,
semi-supervised learning can reduce the burden of manual annotation. In addition, our
experiments with supervised learning suggest that existing lexical resources may be inadequate
for extracting SBDH.

82
4.4 Study 2: Longitudinal analysis of social and behavioral determinants of health in the EHR:
exploring the impact of patient trajectories and documentation practices
4.4.1 Introduction
Despite the fact that many previous studies have attempted to automatically infer patient
SBDH status from clinical data, it is unclear how SBDH related to sexual health are expressed in
longitudinal patient records. Walsh and Elhadad used topic modeling to characterize the content
of social history sections and observed more language relevant to sexual history in outpatient
notes compared to inpatient notes.(206) Chen and colleagues reviewed clinical notes across 3
health systems and found that sexual activity and sexual orientation were infrequently
documented; combined these topics were mentioned with less frequency than caffeine use.(207)
Simple textual searches for sexual orientation (e.g., ‘LGBT’, ‘gay’, ‘lesbian’) identified several
thousand records at Vanderbilt University Medical Center.(208) While these studies suggest that
information related to sexual health is sparsely documented in EHR data, they reported neither
the prevalence nor lexical characteristics of specific SBDH related to sexual health in clinical
notes.
Other characteristics of SBDH as expressed in the patient record are unclear, including 1)
to what extent does EHR documentation of social and behavioral determinants change between
encounters, and 2) how do indicators of SBDH manifest in both structured and unstructured data
within the EHR. These questions should be addressed in service of perhaps the most widespread
research question, which is 3) how to infer from clinical data a range of SBDH from the patient
record?
It is unlikely that a patient’s documented SBDH status is invariably consistent with the
patient’s true state. Patients are often hesitant to disclose sensitive information such as sexual

83
orientation and substance use to healthcare providers and may be less likely to share sensitive
information with non-physician providers.(162,209) In addition, the quality of social history
taking by clinicians is variable, and providers are liable to make incorrect assumptions about
their patient’s health.(210,211) As a result, a patient’s SBDH status recorded in the patient record
may reflect inaccuracies attributable to phenomena inherent to clinical docu38–43mentation of
sensitive information. There is little knowledge of how social and behavioral determinants of
health as expressed in patient records change through time. To our knowledge, the only relevant
study was conducted by Bejan et. al. in 2017, which observed cyclic transitions between the at-
risk and homeless categories among homeless patients, and less frequent transitions among
individuals with stable housing.(212)
4.4.2 Objectives
This study sought to advance the understanding of how SBDH are manifest in the patient
record; we performed a longitudinal analysis of how such determinants are manifested across
time in the EHR. We also assessed the degree to which such changes reflected data quality
issues.
4.4.3 Methods
The analysis described herein focused on 4 SBDH; sexual orientation, housing status,
alcohol use and drug use. Encounters with confirmed documentation of SBDH were isolated and
analyzed to examine changes in a patient’s SBDH status. and potential data quality issues. We then
manually reviewed pairs of notes authored on the same-day with conflicting documentation to
identify possible sources of data quality issues related to SBDH.
SBDH Preprocessing

84
A distinct dataset was created for each SBDH of interest and included only notes where the
respective high-level SBDH was documented. For example, to be included in the analysis of ‘drug
use’ status, it was necessary that a note discuss drug use (even if drug use was a negative label, as
in “no history of substance use”). This way, all notes in that SBDH dataset had explicit discussion
of that SBDH and either positive or negative findings for that SBDH. Notes that did not discuss
the SBDH were not included; absence of a certain SBDH in a clinical note most often reflects the
fact that this domain was not discussed by patient and provider, rather than evidence that the patient
is a negative case.28
Survival Analysis
To assess the rate of change in SBDH status, we simply parameterized each annotated
document using sequence time (e.g., visit_time1, visit_time2, etc. where visit_timei represents the
time between the first and ith visit in the longitudinal record of a patient) and estimated the
likelihood that a patient at visitt would transition to a different state (e.g., ‘never used alcohol’ to
‘actively using alcohol’), as documented within the documentation at the next visit. This analysis
was conducted using the corpus generated by a comprehensive annotation of the entire longitudinal
record of the 32 HIV+ individuals in our cohort.
We used survival analysis to analyze the expected duration of time associated with changes
in patient SBDH status. Observation periods were established between adjacent notes in a patient’s
longitudinal history and time was measured in days. An event was defined as any change in SBDH
status observed in the subsequent note. Observations were (right) censored when the subsequent
note was observed with the same SBDH status as observed in the preceding (index) note. A survival
function was estimated for each SBDH using the Kaplan-Meier estimate and can be interpreted as

85
the fraction of clinical notes observed at time T with an observed change in SBDH status
documented in the subsequent note:
where d is the number of notes with subsequent SBDH changes at time t and n is the number notes
not associated with any subsequent SBDH change (and who have not yet been censored) at time t.
Quantitative Analysis of Data Quality
In order to assess data quality in SBDH documentation, we used a larger cohort of patients
who were required only to have multiple notes manually annotated. Using the parameterization of
sequence time described above, we considered illegitimate transitions to be those that were
chronologically impossible; for example, a patient could be documented as having ‘never used
alcohol’ subsequent to being documented as ‘actively using alcohol’.
In addition, we identified same-day conflicts in SBDH documentation by isolating clinical
notes that were written on the same day by distinct providers. Similar to previous analyses, we
required that all notes under consideration have confirmed documentation of the relevant high-
level SBDH domain. Same-day conflicts were defined as observed discrepancies in SBDH status
(e.g., documentation of “no active alcohol use” and “active alcohol use”).
Qualitative Analysis of Data Quality
We manually reviewed 20 note pairs that exhibited same-day conflicts in patient SBDH
status with the goal of developing an understanding of the sources of data quality problems. 5 note
pairs were gathered from each of the four SBDH analyzed herein. The sources of data quality
issues were identified using a set of annotation guidelines we created for this analysis. Data quality

86
issues reflected 1) inappropriate use of copy & paste if content was duplicated across notes of the
same type, 2) an inaccurate problem list if outdated information contained in structured clinical
data was automatically inserted into narrative free-text, 3) variable history taking wherein the note
with positive documentation contained significantly more information regarding SBDH compared
to the note with negative documentation, 4) a patient hesitant to disclose sensitive information
when it was clear that both notes contained a detailed social history but that the patient gave
conflicting answers across the notes, and 5) the use of a standard note template which
automatically inserted negative and formulaic documentation of SBDH status.
Among the 20 manually reviewed note pairs with same-day conflicts in SBDH, 14 (70%)
conflicts reflected variable quality of social history taking by clinicians, wherein the note with
positive documentation contained significantly more detailed information regarding SBDH
compared to the note with negative documentation. 2 note pairs exhibited evidence of an inaccurate
problem list, wherein note content automatically generated from the patient’s EHR problem list
conflicted with information contained in narrative free-text. 2 note pairs exhibited evidence that a
patient was hesitant to disclose SBDH, as it was clear that both notes contained a detailed social
history but that the patient gave conflicting answers across the notes.
4.4.4 Results
Cohort Characteristics
3273 clinical documents associated with 32 HIV+ individuals were manually annotated
and included in the longitudinal corpus. All available clinical notes associated with these patients
was annotated with a range of 11 to 473 notes per patients (median 50, mean 102). The longitudinal
histories of patients in this analysis were of variable lengths and ranged from 196 days to 3146
days; the mean longitudinal history was 997 days and the median was 772 days.

87
75% of individuals were male (24) and the average age was 46 years with a standard deviation of
13.5 years. Race and ethnicity information was missing for a majority of the cohort, but 8 patients
were documented as African American, 7 as Caucasian Hispanic, 2 as Caucasian non-Hispanic,
and 1 as Asian.
The larger cohort used in the data quality analysis included 366 individuals with multiple
annotated notes (4294 notes total). All available clinical notes associated with these patients was
annotated with a range of 2 to 473 notes per patients (median 2, mean 11). The longitudinal
histories of patients in this analysis were of variable lengths and ranged from 0 days to 3146
days; the mean longitudinal history was 469 days and the median was 174 days. 60.3% of
individuals were male (221) and the average age was 53 years with a standard deviation of 12.2
years. Race and ethnicity information was missing for a majority of the cohort, but 71 patients
were documented as African American, 58 as Caucasian Hispanic, 30 as Caucasian non-
Hispanic, and 1 as Asian.
Longitudinal Changes in SBDH
A state diagram illustrating changes of documentation status for alcohol use computed
across the cohort of 366 individuals is presented in Figure 4.3, across 1077 pairs of consecutive
notes.
Many patients in the longitudinal cohort of 32 individuals were observed to have temporal
changes among all SBDH analyzed. Alcohol status was most likely to change across subsequent
notes (23.3%), followed by drug use (10.4%), drug use (8.7%), and sexual orientation (1.1%). A
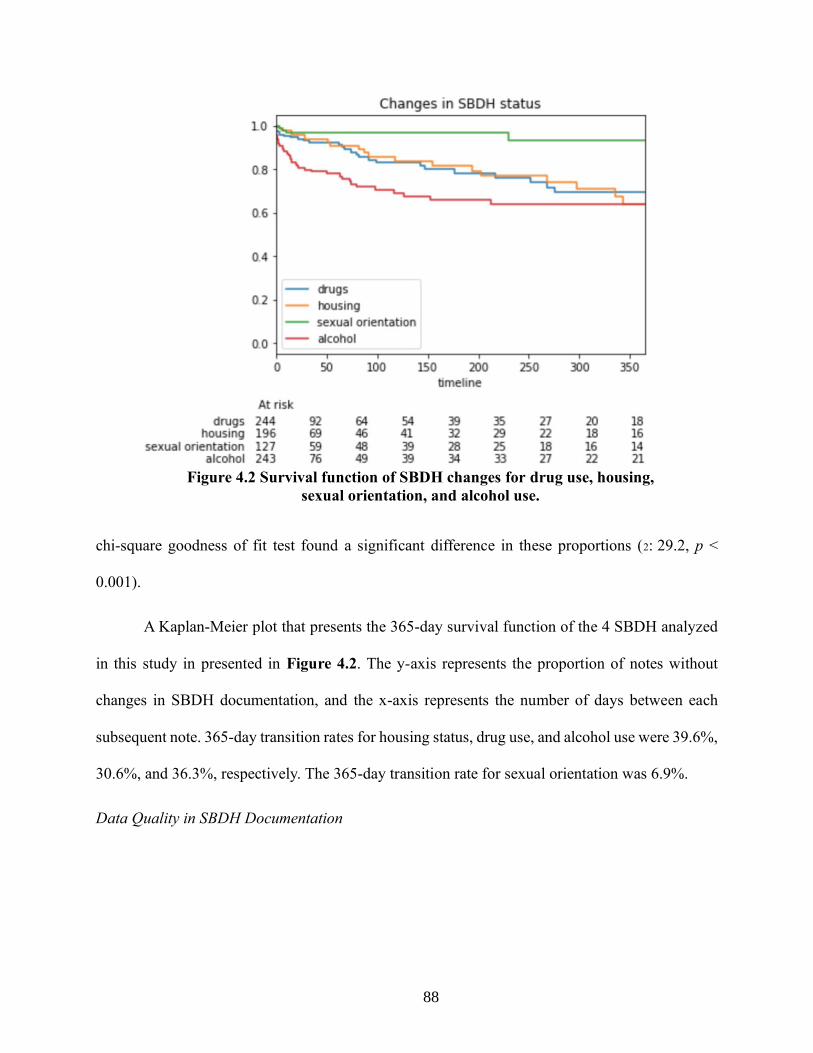
88
chi-square goodness of fit test found a significant difference in these proportions (2: 29.2, p <
0.001).
A Kaplan-Meier plot that presents the 365-day survival function of the 4 SBDH analyzed
in this study in presented in Figure 4.2. The y-axis represents the proportion of notes without
changes in SBDH documentation, and the x-axis represents the number of days between each
subsequent note. 365-day transition rates for housing status, drug use, and alcohol use were 39.6%,
30.6%, and 36.3%, respectively. The 365-day transition rate for sexual orientation was 6.9%.
Data Quality in SBDH Documentation
Figure 4.2 Survival function of SBDH changes for drug use, housing,
sexual orientation, and alcohol use.

89
While most of the transitions in SBDH status looked sensible, we observed illegitimate
transitions in SBDH status as shown in Figure 4.3. Among 353 notes documenting patient SBDH
status as ‘active alcohol use, 43 were followed by documentation of ‘never used alcohol’ (12.2%).
Moreover, among 165 notes documented that the patient had ‘historical alcohol use’, 26 were
followed by documentation of ‘never used alcohol’ (15.7%).
We also observed same-day conflicts in patient SBDH status. For instance, 23.2% of 56
same-day note pairs with alcohol status documented had conflicting indications of alcohol use,
21.2% of 52 same-day note pairs had conflicting indications of substance use, 6.8% of 44 same-
day note pairs had conflicting indications of patient housing status, and 8.0% of 25 same-day note
pairs had conflicting of sexual orientation. We also observed conflicts in SBDH documentation
within a 7-day period. 12.6% of annotated notes associated with the same patient had conflicting
indications of alcohol use (N = 230). In addition, 14.3% of notes describing drug use exhibited the
Figure 4.3. State diagram of changes in documentation of
alcohol use across all patients in the cohort.

90
same changes (N = 265), as did 7.6% of notes describing housing status (N=198). 1.6% of notes
with sexual orientation documentation exhibited same-week conflicts (N = 127).
Manual review of 20 same-day conflicts in SBDH revealed multiple sources of poor data
quality with incomplete social history taking by clinicians being most common. Among the 20
manually reviewed note pairs with same-day conflicts in SBDH, 14 (70%) conflicts reflected
variable quality of social history taking by clinicians, wherein the note with positive
documentation contained significantly more detailed information regarding SBDH compared to
the note with negative documentation. 2 note pairs exhibited evidence of an inaccurate problem
list, wherein note content automatically generated from the patient’s EHR problem list conflicted
with information contained in narrative free-text. 2 note pairs exhibited evidence that a patient was
hesitant to disclose SBDH, as it was clear that both notes contained a detailed social history but
that the patient gave conflicting answers across the notes. 1 note pair conflict reflected the use of
a standard note template, which automatically declared negative SBDH status.
4.4.5 Discussion
The findings of this study provide evidence that social and behavioral determinant of
health as expressed in the patient record exhibit changes over time. Our longitudinal analysis of 4
distinct risk-factors suggests that a patient’s SBDH status should be treated as a shifting, mutable
variable in electronic systems. We provide additional evidence that some changes in SBDH
documentation may reflect data quality issues and not actual changes in the patient state.
We present a longitudinal analysis of multiple SBDH as expressed in patient records.
Four distinct SBDH were examined throughout the course of 32 patient records and exhibited
varying rates of change. A patient’s recorded alcohol status was most likely to change, as 23.3%
of adjacent encounters with documentation of alcohol use contained conflicting information.
91
This may reflect the high prevalence of heavy episodic drinking among persons living with HIV,
which has resulted in calls for repeated assessments of alcohol consumption in this
population.(213,214) While documentation of substance abuse and housing status were less
likely to change compared to alcohol use, these SBDH exhibited changes across as much as 10%
of adjacent encounters. Epidemiological studies suggest that these SBDH are likely to change;
most individuals who are considered with unstable housing experience only transient periods of
homelessness (215), and many HIV+ persons with substance abuse disorder engage in episodic
rather than sustained use.(216,217) These findings suggest that automated approaches to
inferring SBDH should not treat these variables as fixed patient characteristics and thus should
reevaluate a patient’s SBDH status on a regular basis.
In contrast to alcohol use, substance abuse, and housing status, a patient’s recorded
sexual orientation was unlikely to change, as 1.1% of adjacent encounters with documentation of
sexual orientation contained conflicting information. This rate reflects the infrequent changes in
sexual orientation observed among persons experiencing stigma and discrimination.(218) This
findings demonstrate that distinct SBDH may be likely to change at different rates and thus may
be reevaluated on different time scales.
Multiple findings indicated that some changes in patient SBDH status reflected data
quality issues and not legitimate changes in the patient state. We observed a high frequency of
implausible longitudinal changes in patient SBDH status, wherein a patient transitioned from an
active status (e.g. active alcohol use) to having no history of active status (e.g. no history of
alcohol use). In addition, we observed same-day conflicts in patient’s documented SBDH status.
Our manual review of these discrepancies observed that most conflicts reflected the variable
nature of social history taking. It has been established that some healthcare providers are

92
reluctant to discuss sensitive issues with their patients, thereby limiting their ability to take a
comprehensive social history.(219) While our study methodology does not allow us to
hypothesize the cause of the observed data quality issues, the implication of our findings is that
any attempt to characterize a patient’s SBDH status should likely not reflect only the patient’s
most recent documentation. Decision support systems that aggregate multiple instances of SBDH
documentation may provide a more faithful representation of a patient’s SBDH status compared
to data collected during a single encounter. Information retrieval and classification methods
should utilize observation windows that leverage only recent EHR data (220,221), or weight
decay techniques that model the decreasing relevance of data elements to computational
phenotypes.(222,223)
Future research should conduct a more comprehensive analysis by annotating all notes
associated with a large corpus and use techniques such as mutual information to assess how the
predictability of future SBDH status relative to existing documentation changes with time.(224)
Such an analysis would open the possibility for techniques that could accurately model the
relevance of social and behavioral determinants of health documentation.(225,226)
Limitations
First, our findings were generated by analyzing data from a specific patient cohort treated
at a single institution. The high prevalence of SBDH within the study cohort may have resulted
in a higher frequency of SBDH changes. Second, while our annotators achieved a relatively high
inter-rater reliability, there were likely some erroneous annotations and thus some temporal
changes in SBDH status may reflect annotation errors and rather than changes in documented
SBDH status. Third, our methods did not enable us to quantify the proportion of SBDH changes

93
that reflected true changes in the patient state and the proportion that reflected documentation
errors.
4.4.6 Conclusion
We provide evidence that social and behavioral determinant of health as expressed in the
patient record exhibit changes over time. Our longitudinal analysis of 4 distinct risk-factors
suggests that a patient’s SBDH status should be treated as a shifting, mutable variable in
electronic systems. We also provide evidence that some changes in SBDH documentation likely
reflect data quality issues and not actual changes in the patient state.

94
4.5 Study 3: Automated identification of social and behavioral determinants of health with
structured and free-text clinical data
4.5.1 Introduction
Previous work on extracting social determinants of health from clinical data have
typically employed Natural Language Processing (NLP) techniques, hypothesizing that this
information is most reliably documented in clinical notes. NLP approaches, and in particular
information extraction techniques, have been applied to different types of SBDH including
smoking status(227–229), substance abuse(230–232), and homelessness.(14,212) Smoking status
was the focus of the first i2b2 NLP shared task in 2008 and many NLP systems were
subsequently developed to recognize the labels “past smoker”, “current smoker”, “non-smoker”
in clinical text.(227–229) Several recent studies have focused on drug and alcohol abuse and
have extracted status (“current”, “past”, “none”) and relational modifiers including amount, type,
and frequency.(230–232) In addition, the increasing recognition of homelessness as an important
social determinant has catalyzed the development of systems capable of extracting this
information from EHRs.(14,212) Extraction techniques that have been used include regular
expressions, named entity recognition, and more contemporary distributional semantic
techniques. Efforts aimed at using NLP to infer SBDH have generally achieved modest
performance, reflecting the inherent challenges associated with processing clinical notes (e.g.,
lexical and semantic ambiguity) and challenges specific to inferring SBDH.(233,234) Most
significantly, the language used to express SBDH is often institution-specific, limiting the
usefulness of lexicons contained in clinical terminologies like the Unified Medical Language
System (UMLS).(196)
95
While the majority of documentation related to SBDH exists in free-text notes (16),
information on SBDH is also manifest in the structured data elements such as diagnosis codes
and laboratory tests.(207,206,212) Multiple studies have observed that diagnosis codes have high
specificity but poor sensitivity for SBDH including alcohol and drug abuse. Vest and colleagues
recently observed that structured EHR data alone could be used to estimate a patient’s need for
social services. In addition, recent research suggests that there is correlation between SBDH (e.g.
drug abusers more likely to lack stable housing) that could potentially be exploited to improve
classification.(174) Pettey and colleauges used network projects of ICD codes to reveal patterns
prior to documentation of homelessness; alcohol related diagnoses along with economic
circumstances such as unemployment and legal circumstances frequently coincided with
homelessness.(235) Two studies have observed healthcare utilization, behavioral health,
substance abuse, and educational achievement to be important predictors of homelessness in
clinical text.(196,236) Despite the potential utility of structured EHR data in systems for
extracting social and behavioral determinants, no previous study has leveraged such data to
improve the performance of supervised learning models.
4.5.2 Objectives
Our objective was to explore the automated inference of both the presence of SBDH
documentation and individual SBDH risk factors in patient records. In addition, we sought to
compare the relative ability of clinical notes and structured EHR data, such as laboratory
measurements and diagnoses, to support inference.
4.5.3 Methods
For each of the 5 SBDH topics and 11 SBDH risk factors a discrete classifier was trained.
To avoid any potential data leakage between training, validation and testing stages, each patient’s

96
data was included only once in the entire dataset. Their respective status was obtained from a
single annotated clinical note, and the text contained within this note was the only unstructured
input to classification models. A 30-day observation window prior to the annotated note was used
to capture structured EHR data associated with each patient (see Figure 4.4).
Figure 4.4 Prediction Task for SBDH labels
Unstructured Input
Clinical documents were represented as a bag-of-words using term frequency-inverse
document frequency (tf-idf) weights. Preprocessing of documents comprised the following steps:
(i) tokenize all documents, (ii) remove all non-alphabetical characters, (iii) remove general-
domain stop words, and (iv) remove words that were observed fewer than 3 times. These steps
yielded a vocabulary size of approximately 14,000 words.
Structured Input
For each patient, structured EHR data was aggregated from the 30-day period preceding
the date of the patient’s recorded SBDH status. We hypothesized such an extended observation
period was necessary to collect enough structured EHR data to impact model performance.
However, a longer observation period was not used due to the fact that a patient’s SBDH status is
liable to change overtime.
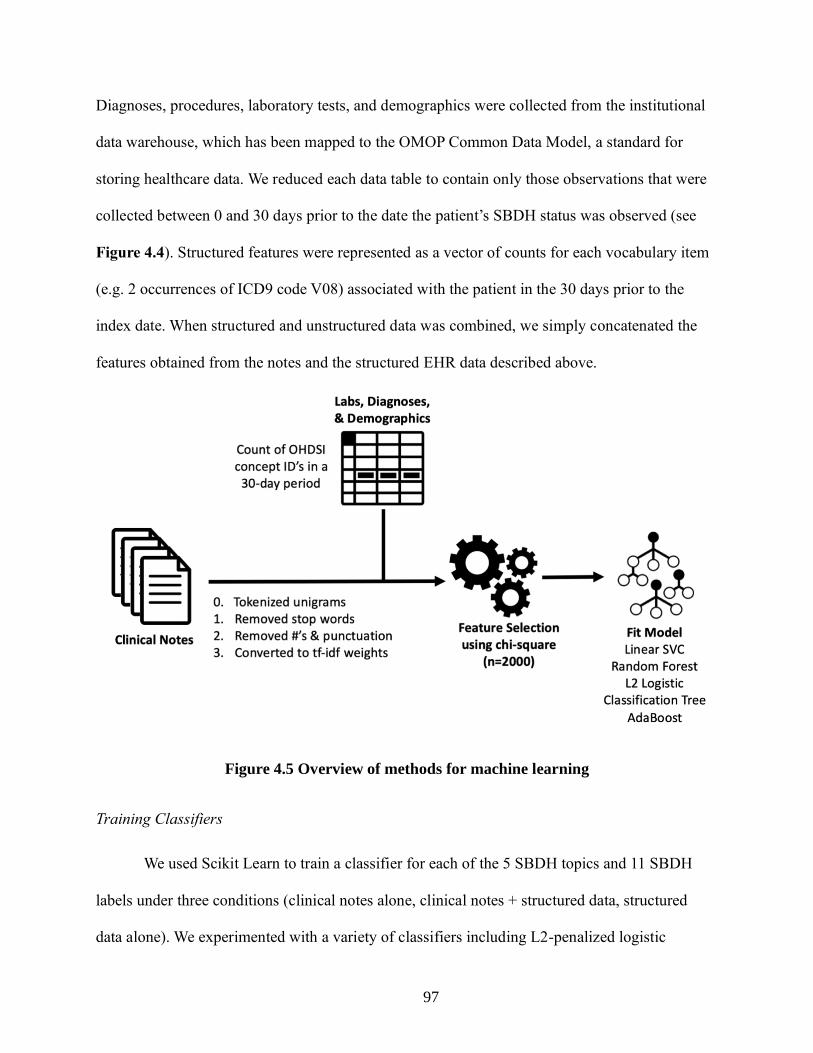
97
Diagnoses, procedures, laboratory tests, and demographics were collected from the institutional
data warehouse, which has been mapped to the OMOP Common Data Model, a standard for
storing healthcare data. We reduced each data table to contain only those observations that were
collected between 0 and 30 days prior to the date the patient’s SBDH status was observed (see
Figure 4.4). Structured features were represented as a vector of counts for each vocabulary item
(e.g. 2 occurrences of ICD9 code V08) associated with the patient in the 30 days prior to the
index date. When structured and unstructured data was combined, we simply concatenated the
features obtained from the notes and the structured EHR data described above.
Figure 4.5 Overview of methods for machine learning
Training Classifiers
We used Scikit Learn to train a classifier for each of the 5 SBDH topics and 11 SBDH
labels under three conditions (clinical notes alone, clinical notes + structured data, structured
data alone). We experimented with a variety of classifiers including L2-penalized logistic

98
regression, support vector machines, Random Forests, CaRT, and AdaBoost. Each model training
leveraged chi-square feature selection, using 2000 features with the strongest univariate
association with the classification target; this step improved performance and reduced model
training time.
We found that in all cases either AdaBoost or CaRT yielded the best performance. In
order to optimize performance of the AdaBoost classifiers, we empirically identified the optimal
number of weak learners (AdaBoost’s primary hyperparameter) and number of features retained
using chi-square feature selection. We evaluated 30, 50, and 100 weak learners with 2000 and
4000 features selected using chi-square on a development set.
We also experimented with several deep learning models that have been previously
shown to successfully leverage both structured and unstructured clinical data for classification
tasks. We fit both feedforward and convolutional neural networks and performed hyperparameter
search over learning rate, number of layers, and batch size. However, all neural networks yielded
worse performance compared to the machine learning approach described above due to the small
size of our training dataset.
Evaluation
Precision, recall, and F1 scores were computed across the SBDH models using 5-fold
cross validation. We estimated the standard deviation associated with each metric by
bootstrapping 200 classifiers for each SBDH on different samples and calculating the standard
deviation of resultant scores. We also estimated feature importance by using the total decrease in
node impurity attributed to a single feature, averaged over all trees in an AdaBoost ensemble
classifier. The effect of label frequency on classification performance was estimated using

99
Spearman rank correlation between a classifier’s F1 score and the number of positive labels
available for model training.
In addition, we conducted an error analysis to gain insight into model performance for
SBDH risk factors. This was performed by reviewing a random sample of 100 incorrectly labeled
patients. First, incorrectly classified patients were labeled as either a true or false error, the latter
being attributable to incorrect annotation. Second, we associated each true error with 1 or more
of the following characteristics: 1) idiosyncratic language used to express SBDH, 2)
unrecognized negation, 3) attribution (e.g. “her mother is homeless”), 4) historical phrases (“he
stopped drinking heavily in 2007 and now drinks approximately 1/month”), 5) syntactic
dependencies, 6) conflicting information, and 7) misspelling.
4.5.4 Results
4,663 notes associated with 1,501 patients treated at a large urban academic medical
center were manually reviewed for mentions of SBDH. 76 notes were double annotated and a
Kappa statistic of 0.736 was observed across all SBDH risk factors. The average age of persons
in this cohort was 52.2 years old (sd. 12.9 years) with 916 males and 585 females. The number of
patients with explicit mentions of specific SBDH ranged from 274 for cocaine abuse (most
prevalent) to 36 for amphetamine abuse (least prevalent, Table 4.3).
Classifier Performance
Classification results inferring the presence of topic-specific SBDH documentation
ranged from F1: 92.7 for substance use to F1: 78.7 for sexual history. While in 3 of 5 cases,
models with text and structured data yielded the best results, these differences were not
statistically significant.

100
The highest performing SBDH risk factor model was the classifier of LGBT status trained using
heterogenous data (F1: 82.7), while the lowest performing model was the classifier for
‘intravenous drug abuse’ using structured data (F1: 28.5). In 10 of 11 cases, training models with
both text and structured data yielded better results than models trained with either of those data
sources alone. In contrast to other models, the classifier for ‘unsafe sex’ achieved best results
Table 4.2 Performance of models inferring presence of SBDH documentation among
1,501 patients using 5-fold cross validation
Documented
(Missing)
Structured EHR
Features
Text Only Structured EHR
+ Text
F1 P R F1 P R F1 P R
Sexual
History
807 (694)
64.6
±1.7
60.4
±2.1
71.6
±2.2
78.6
±1.4
80.3
±1.9
77.1
±2.0
78.7
±1.8
80.0
±2.3
77.4
±1.9
Sexual
Orientation
1059 (442) 65.3
±1.9
74.8
±2.7
73.4
±2.8
85.3
±1.7
86.0
±2.6
84.9
±2.9
86.1
±1.8
86.0
±2.6
86.4
±2.5
Alcohol Use 1192 (309) 88.0
±1.4
80.5
±2.2
96.7
±2.0
91.3
±1.2
88.7
±1.9
94.1
±1.7
90.7
±1.3
89.0
±2.0
92.5
±1.8
Substance
Use
1262 (239) 90.8
±1.3
90.5
±2.0
94.6
±1.7
92.5
±1.0
90.5
±1.7
94.6
±1.5
92.7
±1.1
90.7
±1.8
94.8
±1.6
Housing
Status
1240 (261) 88.7
±1.3
83.0
±2.0
95.5
±2.1
92.6
±1.1
90.0
±1.8
95.5
±1.6
92.2
±1.1
90.0
±1.8
94.5
±1.6
P = precision, R = recall, ± standard deviation estimated using bootstrap method

101
when trained using only text data.
Features Used for SBDH Risk Factor Classification
Table 4.3 Performance of models inferring SBDH labels using 5-fold cross validation
+/- Structured EHR
Features
Text Only Structured EHR +
Text
F1 P R F1 P R F1 P R
Sexual History
LGBT status 263/796 54.4
±5.1
55.9
±4.9
58.1
±5.7
79.2
±4.3
84.8
±5.3
74.7
±5.7
82.7
±4.0
86.1
±4.9
80.0
±5.7
History of STIs 204/603 32.3
±6.4
30.1
±7.5
48.2
±8.0
48.9
±6.3
50.1
±7.7
56.7
±7.7
54.0
±6.7
54.2
±7.9
53.7
±8.0
Unsafe Sex 160/647 21.1
±6.4
21.3
±7.5
35.0
±7.4
43.8
±6.3
52.1
±7.7
38.9
±7.7
38.5
±6.5
46.0
±7.5
35.8
±8.0
Alcohol Use
Social Alcohol
Use
252/940 27.9
±5.6
35.0
±7.3
23.8
±5.3
39.2
±6.7
49.4
±8.8
32.7
±6.7
40.1
±6.5
51.6
±8.6
33.2
±6.7
Alcoholism 165/1027 33.4
±8.6
49.9
±11.5
42.4
±8.3
50.0
±7.9
61.2
±10.3
42.4
±8.3
52.0
±7.9
62.8
±10.3
44.8
±8.5
Substance Use
Marijuana Use 210/1052 29.0
±7.4
52.5
±11.1
21.4
±6.4
49.8
±6.8
51.7
±7.8
49.0
±8.3
56.4
±6.8
57.8
±7.8
55.7
±8.6
Cocaine Abuse 274/988 56.2
±5.6
70.2
±7.3
47.0
±6.3
62.1
±5.5
67.2
±7.3
58.4
±6.3
65.1
±5.1
66.0
±6.2
64.6
±7.0
Opioid Abuse 99/1163 30.9
±9.9
48.8
±16.6
23.2
±8.5
37.9
±10.7
48.7
±15.1
23.2
±10.3
40.0
±11.8
48.3
±14.7
34.4
±12.0
Intravenous
Drug Abuse
65/1197 13.8
±9.6
19.9
±14.2
10.8
±10.0
27.3
±11.5
43.4
±19.6
21.5
±10.2
28.5
±12.3
38.3
±22.0
23.1
±10.1
Amphetamine
Abuse
36/1226 33.6
±16.3
55.4
±36.7
27.5
±17.8
47.0
±19.5
68.4
±31.1
42.5
±18.4
51.1
±17.1
51.4
±19.7
53.5
±21.9
Housing Status
Unstable
Housing
262/978 27.4
±5.6
35.0
±6.0
23.6
±6.4
49.3
±6.4
59.4
±7.8
42.3
±7.5
53.1
±6.4
62.2
±5.8
46.9
±7.2
P = precision, R = recall, ± standard deviation estimated using bootstrap method

102
Textual features used by the classifiers included explicit indicators of SBDH as well as
co-occurring determinants. For example, top features for the cocaine abuse classifiers included
‘cocaine’, ‘psa’ (for polysubstance abuse) and ‘heroin’.
While the majority of top features utilized by the heterogenous models were derived from text,
models also included structured features. The top feature for the alcohol abuse classifier was
SNOMED code 191811004 (‘continuous chronic alcoholism’), while codes 191918009
(‘nondependent cocaine abuse’) and 78267003 (‘cocaine abuse’) were among the top 10 features
used by the cocaine abuse classifier. LOINC code 5393-4 (‘treponema pallidum Antibody test’)
is a test for syphilis infection and was a leading indicator for having a ‘history of STIs’.
Several textual features were institution-specific or regional in nature. For example, the word
‘nicholas’ used in the homelessness classifier likely refers to a homeless shelter in New York
City. In addition, ‘hasa’ represents the HIV/AIDS Services Administration, a governmental
organization in New York that provides housing for persons with HIV.
Label Frequency
We also tested the impact of the prevalence of
each SBDH on the performance of the classification
models (see Figure 4.6). A comparison between the
number of positive cases used to train each classifier
and the resulting performance of that classifier
yielded a correlation coefficient of 0.762 (p =
0.0059). Amphetamine abuse seemingly invalidated the
trend, as the classifier only had 36 positive cases
available but achieved a modest F1 score of 51.1.
Figure 4.6 Relationship
between SBDH prevalence and
classifier performance

103
Error Analysis
Among 100 randomly sampled incorrect classifications, 18 errors were attributed to
historical phrases, such as “hx of cocaine snorting quit 18 years ago”. 17 were attributed to
short- and long-term syntactic dependencies such as “reports very large amounts of alcohol
consumption, iv heroin, and cocaine use”. Unrecognized negation was associated with 15 errors
(e.g., “has not had etoh intake in over twenty years”), and lexical diversity accounted for 13
errors (e.g., “actively smokes crack”) that reflected use of idiosyncratic language by clinicians.
Three errors reflected misspellings (e.g., “former iv cocaine and heroine use”), and two errors
reflected conflicting information in the note (e.g. “his wife was present during the interview...in
private [patient] reported sex with men”). Four errors were in fact correct and attributed to
inaccurate annotations.
4.5.5 Discussion
Our findings suggest that the identification of topic-specific SBDH documentation and
individual SBDH risk factors can be improved by leveraging both structured EHR data and
clinical notes. We also provide evidence that model performance is correlated with the lexical
diversity used by clinicians to document a given SBDH and the prevalence of a given SBDH
within a patient population.
The presence of topic-specific SBDH documentation in the patient record was inferred
using classification models. A 2014 report published by the Institute of Medicine brought
attention to the importance of collecting SBDH information in electronic health records, as well
as the fact that such information is sporadically collected in patient records.(237,238) The
acceptable performance of classification models trained to infer presence of SBDH
documentation suggests that IT systems could alert providers when certain SBDH topics are

104
undocumented in the patient record, thereby supporting the development of quality initiatives to
improve provider’s documentation of SBDH. Such an approach could increase the specificity of
EHR prompts alerting clinicians to collect SBDH information, which have been previously
deployed in clinic settings.(239,240)
The combination of free-text and structured data yielded better performance than either
data source alone when inferring SBDH risk factors. These findings are corroborated by recent
studies that combined textual features with diagnoses and laboratory data and observed improved
phenotyping and prediction compared to using those sources alone. Several of these techniques
have found improved performance by preprocessing textual data with topic modeling(241,242)
and structured data with autoencoders.(243) More recently, deep neural networks have been used
to leverage heterogenous clinical data for prediction, although our findings demonstrate that
these methods require much larger datasets then are currently available in the SBDH
domain.(244,245)
We observed a positive correlation between model performance and the prevalence of
each specific SBDH. This suggests that similar modeling approaches should generate gold-
standard corpora of an adequate size, especially for infrequently documented SBDH such as
those related to sexual activity.(13) However, the ‘amphetamine use’ and ‘LGBT’ classifiers
outperformed SBDH models for labels with similar prevalence, likely reflecting the limited
lexical diversity used to express these SBDH. For example, amphetamine use was often
referenced by ‘meth’ or ‘methamphetamine’ and most LGBT patients in our cohort were gay
men who were characterized as ‘msm’ or ‘men who have sex with men’.
The results of our error analysis suggest several areas for improvement in automated
SBDH inference. The inability of the SBDH classifiers to detect syntactic dependencies and

105
historical phrases is unsurprising given our use of a simple bag-of-words approach to extracting
information from clinical text. In addition, several of the SBDH were associated with high
lexical diversity, suggesting that clinicians lack a standardized way for expressing those SBDH.
While contemporary methods that leverage distributional semantics and use neural networks to
model temporal sequences can overcome such challenges, these methods require very large
datasets that are difficult to curate in the medical domain.(13,246) Transfer learning – which
entails pre-training a neural network on a large, related dataset and subsequently ‘fine-tuning’ the
network on a smaller dataset – has the potential to overcome the aforementioned barriers posed
by the challenge of collecting large annotated corpora.(247,248)
4.5.6 Limitations
First, our SBDH classifiers were trained using data from a single institution. However,
our use of the OMOP Common Data Model enables generalizability of our trained models to
other institutions. Second, our overall modest results may have resulted from data quality issues
in the documentation of SBDH and/or inaccurate annotation. Third, most approaches cast this
problem as a named-entity recognition task but because we approach the problem as a document
labeling task, our experimental setup does not allow for direct comparison to previous work.
Fourth, our model performance may have been improved by considering negation or by
correcting misspellings in text. Fifth, a considerable number of the patients whose records were
used to train the classification models were HIV+ and receive regular healthcare from infectious
disease specialists. The records of these patients likely differ from patients who have not been
tested or HIV or are currently HIV negative, potentially compromising the generalizability of the
classification models. Sixth, we did not use a ‘holdout’ dataset that was never used in model

106
training; we simply did not have the requisite volume of data to create training, validation, and
test sets and thus the observed model performance may be inflated.
4.5.6 Conclusion
We observed that the presence of SBDH documentation can be automatically inferred
from the patient record, motivating the development of EHR prompts to improve the quality of
provider documentation of SBDH. In addition, our findings suggest that while automated
inference of patient SBDH status is challenging, the combination of text and structured EHR data
improves performance compared to either data source alone. The study findings suggest that
SBDH prevalence and the lexical diversity used to express a given determinant have an impact
on the performance of classification algorithms for this purpose. Future studies should explore
computational methods that can effectively learn models using datasets of limited size.

107
Chapter 5: Using Visualization to Improve the Situational
Awareness of Clinicians in Chronic Disease Care
5.1 Background & Significance
A fundamental shift in medical care in the 21st century is the increased responsibility of
healthcare providers for the health outcomes of the patients for whom they are responsible.
Initiatives and incentives from governmental agencies and healthcare payers termed ‘pay-for-
performance’ or ‘value-based care’ have resulted in efforts by providers and health systems to
more actively participate in their patient’s care.(90) As a result, the adoption of innovative care
models wherein clinical staff longitudinally monitor patients has been growing. For example,
contemporary oncology care involves nurses who remotely monitor patients for adverse
reactions to chemotherapy.(249,250) Primary care providers contact patients when they lack
basic preventative care like cancer screening or immunizations. Chronic disease programs
employ legions of case managers who contact patients whenever incomplete medication
adherence endangers their health.(19,23) In an attempt to prevent readmissions, hospitals employ
‘discharge nurses’ to systematically follow-up with patients post-discharge.(251) The
aforementioned care models all require that clinicians maintain continuous awareness of their
patients and their respective health statuses.
The population monitoring process discussed above is most commonly performed using
patient registries, IT tools that list disease outcomes and gaps in preventative care for a defined
patient panel.(11,21) Studies have found that registries do not satisfy all needs related to
population monitoring(25) and that clinicians often invent ‘homegrown’ tools such as paper-
based lists and Excel spreadsheets to supplement patient registries.(4,22–24) As a result, there is

108
a need for the development of tools that can satisfy clinician’s needs related to population
monitoring. The research associated with Aim 3 attempts to design an interactive system capable
of supporting HIV care management, an example of a clinical domain where healthcare
providers must monitor patients to ensure that they are adherent to HIV antiretroviral therapy to
prevent AIDS-related morbidity and mortality.(252)
5.2 Research Questions
Research Question: How can provider awareness of patients within chronic disease populations
be improved?
Hypothesis: Provider awareness of patients within chronic disease populations can be improved
with data visualization and user-controlled prioritization

109
5.3 Study 1: Using interactive visualization to improve population monitoring in chronic disease
care
5.3.1 Introduction
Increasingly, information visualization is being considered as a means to support
healthcare providers who utilize large volumes of clinical data.(26–28) The healthcare settings
that have been shown to from data visualization are quite diverse; examples include Intensive
Care Units, where dashboards which aggregate and visualize data from physiologic monitoring
systems and can ameliorate cognitive load and prevent medical errors.(139,180,253)
Alternatively, hospitals and emergency departments have deployed visual dashboards that
identify hospitalized patients at high-risk of adverse drug events (137,140,254) and disease
exacerbations (138,141), as well as “electronic whiteboards”(133) that visualize all admitted ED
patients and their dispositions but have had limited adoption due to limitations in information
timeliness, quality of data and lack of customization for different user groups.(134,135)
We hypothesize that information visualization applied to a provider’s patient panel can
improve the ability of clinicians to successfully perform tasks related to population monitoring.
Using the theory of situational awareness to illustrate the process of population monitoring, we
design and evaluate an interactive tool that uses visualization to support the identification of
population-wide needs and patients requiring care. Our specific focus is on the management of
persons living with HIV – a clinical setting where providers manage large patient panels and are
required to intervene on patients with complex needs.
5.3.2 Methods
First, we conducted an exploratory study by interviewing and observing more than 22
clinicians (including doctors, nurses, and social workers) to better understand IT needs related to

110
caring for large populations of HIV patients. The data collection process is described in detail in
section 3.3 of this dissertation. Second, we adapted the theory of situational awareness to
develop a conceptual framework of population monitoring that informed user needs, design
requirements, and evaluation criteria. The development of this framework is detailed in section
3.4 of this dissertation. Third, we conducted user-centered design to develop PanelViz. Fourth,
we evaluated the impact of the visualization tool on provider’s situational awareness in a
controlled laboratory experiment.
Participatory Design & Tool Development
The design of PanelViz was informed by the design requirements identified through the
exploratory research and conceptual framework described in sections 3.3 and 3.4, respectively.
Seven physicians with experience in HIV primary care took part in design sessions. During these
sessions, physicians were presented with functioning prototypes that contained synthetic patient
data and were asked to navigate the tool and identify patients they considered to be high-risk.
These sessions continued until the design of the tool was finalized. The development of the tool,
called PanelViz, was achieved using the shiny and DT libraries in R version 3.5.3.
Controlled Experimental Evaluation
We employed a within-subjects study design in a laboratory setting to compare the ability
of PanelViz and patient registries to support the user needs enumerated in Table 5.4. For the
controlled experimental evaluation, the primary evaluation criteria was whether participants
could successfully complete a series of tasks that corresponded to the aforementioned user needs.
Each task was developed by reviewing qualitative data generated through the exploratory
interviews and observations (section 3.3) to identify the clinician’s stated information needs.

111
The secondary evaluation criteria was perceived utility of each interface as assessed by the
Health Information Technology Usability Evaluation Scale (Health-ITUES). Health-ITUES is a
validated survey instrument that assesses whether a user expects that a health IT system will
provide adequate support for performing a given task. Because the survey instrument is
customizable, it was adapted to reflect the specific user needs explored in this study while still
enabling harmonization of findings across studies in disparate application settings.
Qualitative data was also collected to provide a rich description of clinician’s experience with
both PanelViz and the patient registry used in the study. 5-minute semi-structured interviewers
were performed after the conclusion of the study to assess participant’s tool preference and
receive feedback on the perceived utility of tool features.
Participants
All participants were employed by the HIV ambulatory care program at Columbia
University Irving Medical Center (CUIMC) and recruited via the professional network of the
study team. The inclusion criteria for study participants required that participants had at least 1
year experience managing HIV+ patients in a primary care setting. Participating clinicians
received $20 in compensation for the 60 minutes required to complete the study. All participants
provided written consent and study procedures were approved by the Institutional Review Board
of CUIMC.
Figure 1. Study Procedures

112
Procedures
An outline of study procedures is presented in Figure 5.1. All participants first received a
15-minute training in the usage of PanelViz and the baseline system. The training period
consisted of a 5-minute video tutorial on using the interfaces and a subsequent 10-minute period
available for interacting with both tools using a synthetic dataset of randomly generated patient
data. Study staff were available to answer any questions about tool functionality posed by
participants during the training period.
During each of the two study trials, participants had 15 minutes to examine a dataset with
a simulated patient panel containing 500 patients and complete 7 tasks, each of which are listed
in Table 5.1. Each task is reflective of information needs identified in exploratory user research.
The tasks were reviewed by 2 HIV Medical Directors to ensure the ecological validity of the
tasks and remove any unanticipated ambiguities. Participant’s responses varied according to each
task; some tasks required participants to identify one or more patients that met some criteria,
while others asked about the status of a specific care gap or properties of the dataset such as the
proportion of patients who met some criteria. While participants explored different datasets when
using each interface, the tasks performed were identical across the trials.
The order of in which the tools were presented was counter-balanced, which ensured that
exactly half of study participants used the registry interface in their 1st trial, and that the other
half used PanelViz in their 1st trial. Participants were provided with pen and paper and instructed
to record their responses the tasks. Audio and the participant’s screens were recorded for the
duration of each study trial using Quicktime.

113
Following each of the two 15-minute trials, a member of the research team administered the
Health Information Technology Usability Evaluation Scale (Health-ITUES). The adapted
Health-ITUES used for this study is presented in Table 5.3. The survey consisted of 20 items on
a Likert scale with five levels from strongly disagree (1) to strongly agree (5); a higher scale
indicates higher perceived usability. We administered all component subscales of the Health-
Table 5.1 Situational awareness constructs and corresponding study tasks
Construct Definition Task
Patient-Level
Situational
Awareness
Perception Perception of a patient’s medical
and psychosocial problems
Identify all medical and
psychosocial problems for
[randomly selected patient].
Comprehension Comprehension of the modifiable
behaviors that prevent a patient’s
disease management
Identify a patient who exhibits
lack of viral load suppression
together with alcoholism and
drug abuse.
Projection Projection of the intervention most
likely to resolve a patient’s medical
problems
N/A
Population-
Level
Situational
Awareness
Perception Awareness of all patients with
medical and psychosocial problems
in a provider’s patient panel
Which of the following medical
problems is more common:
cardiovascular disease or chronic
kidney disease?
Which of the following is more
common among patients who are
virally unsuppressed: drug use or
alcoholism?
Comprehension Comprehension of each patient’s
relative priority in a provider’s
patient panel
Select 5 or more medical or
psychosocial problems to identify
high priority patients and estimate
the proportion of patients with 3
or more selected problems.
Projection Projection of the patients most
likely to benefit from intervention
in a provider’s patient panel
N/A

114
ITUES, which include (1) quality of work life, (2) perceived usefulness, (3) perceived ease of
use, and (4) user control.
At the conclusion of the second study trial, a member of the study staff conducted a 5-minute
semi-structured interview with each participant. Participant’s verbal statements were audio
recorded and transcribed verbatim. Each participant was asked the following three questions:
1. Do you feel that in your clinical practice you can adequately perform the 5 study tasks?
2. Which of the two software tools did you prefer? Please explain your reasoning.
3. What were the strengths of the visualization tool? What were the weaknesses?
4. What were the strengths of the patient registry tool? What were the weaknesses?
Dataset
We created two datasets that each contained 500 HIV+ patients and 18 care indicators
identified as critical for HIV care management. We first identified a population of 500 actual
HIV+ patients within CUIMC’s electronic health record (EHR) system using the criteria of 2
HIV diagnosis codes accompanying a routine ambulatory visit between 2016 and 2019.(255)
Second, we obtained demographic, diagnosis, laboratory, and procedure data from the EHR to
ascertain each patient’s status of the 18 care indicators listed in Table 5.2 below, which was
distributed to study participants. A unique set of 500 synthetic patient names was created for
each dataset to protect confidentiality.

115
Table 5.2 Data dictionary provided to study participants
Data Dictionary
Behavioral Health (past 12 months)
Alcohol Abuse: diagnosis code for dependent abuse of alcohol
Drug Abuse: diagnosis code for dependent or nondependent abuse of cocaine,
opiates, or amphetamines Depression: diagnosis code for ‘major depression’
Anxiety: diagnosis code for ‘anxiety disorder’
Social Determinants
Unstable Housing: diagnosis code for ‘unstable housing’ or ‘homelessness’
Medical Conditions (past 12 months) New HIV Diagnosis: lab tests & diagnosis codes indicative of recent HIV
diagnosis
Schizophrenia: diagnosis code for schizophrenia or related psychoses
Hypertension: diagnosis code for ‘essential hypertension’
Chronic HCV: diagnosis code for chronic hepatitis C
Cardiovascular Disease: diagnosis codes with congestive heart failure or coronary
artery disease Chronic Kidney Disease: diagnosis code of chronic kidney disease
Diabetes: diagnosis code of diabetes mellitus
Laboratory Tests (most recent result)
Virally Suppressed
Most recent HbA1c value
Most recent CD4 count
Healthcare Utilization (past 12 months)
# Office visits: number of outpatient ‘evaluation & monitoring’ visits
# Em ergency Room visits: number of emergency department visits
# Inpatient adm issions: number of inpatient admissions
The study design required that each dataset have different characteristics so that the
answers to each study task outlined in Table 5.1 were different across the two study conditions.
As a result, the care indicators extracted from the EHR were manipulated so that the prevalence
of each indicator diverged at least 20% across datasets (e.g. 40% drug abuse in dataset 1 vs. 20%
drug abuse in dataset 2). This two-part process; wherein we first obtained authentic EHR data
and then modified each care indicator, was important to ensure that the joint distribution of care

116
gaps was realistic; for example, study participants would have been disoriented if the proportion
of patients achieving HIV viral load suppression was similar in patients with positive and
negative ‘drug abuse’ care indicators, as persons with substance abuse disorders are much less
likely to achieve viral load suppression.(41,160)
In the dataset used for the trials involving PanelViz, the following indicators were
modified: alcohol abuse, depression, unstable housing, schizophrenia, chronic HCV, chronic
kidney disease, viral load suppression, most recent CD4 count, office visits, and inpatient
admissions. Drug abuse, anxiety, new HIV diagnosis, hypertension, cardiovascular disease,
diabetes, HbA1c value, and emergency room visits were modified in the dataset used for the
patient registry trials.
Baseline System
This baseline system simulated a typical patient registry and is presented in Figure 5.2.
This tool is analogous to the patient registries currently used across disease management
programs and displays patients with unmet care needs in a tabular format. Users were able to
select care gaps using the toolbar on the left to add or remove care indicators from the tabular
visualization. Users could also sort the order in which patients are listed by reordering the care
indicators; this was a ‘deterministic sorting’ which sorted the entire table on the first selected
Figure 5.2 Patient Registry ('Baseline')
117
indicator and then used subsequent indicators to further sort while retaining the order imposed by
the first indicator. An example of this sorting can be seen in Figure 5.2. A functioning version of
this interface can be found at https://djf2150.shinyapps.io/consolidated_registry/.
Evaluation
We evaluated the impact of PanelViz on a) the accuracy of participant’s responses, and b)
perceived utility of each interface for population monitoring.
Participant’s responses were considered accurate when the response accurately described
the dataset used by the interface being tested. For task 1, an accurate response consisted of a
complete list of the correct care gaps for the randomly selected patient, while for task 2 an
accurate response was the name of any single patient who was virally unsuppressed and abusing
both drugs and alcohol. For task 3, the correct response was the medical problem with the
highest prevalence among patients in the dataset. For task 4, the correct response was the
whichever substance abuse problem (drug abuse or alcoholism) had the highest prevalence
among patients with unsuppressed viral load in the dataset. An accurate response for task 5, an
accurate response was any estimate within 10% of the correct proportion of patients associated
with 3 or more of the care gaps chosen by the participant. The subject matter experts asserted
that 10% was a reasonable margin of error when estimating the population prevalence of high-

118
priority patients.
The perceived utility of each interface was assessed by each study participant using the
validated Health-ITUES survey instrument. The adapted survey is presented in Table 5.3 and
was adapted to the application of HIV care management using the theoretical framework
described in section 4.3 and user needs described in section 5.3. The overall Health-ITUES score
Table 5.3 Adapted Health-ITUES survey
Item Concept
Quality of Work Life
1 I think PanelViz* will be a positive addition to the delivery of
HIV care.
System impact-career
mission
2 I think PanelViz would improve the quality of care for persons
living with HIV.
System impact-
organizational level
3 PanelViz will become an important part of my clinical practice
related to population monitoring.
System impact-personal
level
Perceived Usefulness
4 Using PanelViz makes it easier to identify high-risk patients
under my care.
Productiveness
5 Using PanelViz enables me to identify high-risk patients under
my care more quickly.
Productiveness
6 Using PanelViz makes it more likely that I will not lack
awareness of high-risk patients under my care.
Productiveness
7 PanelViz is useful for identifying identify high-risk patients
under my care.
General usefulness
8 I think PanelViz presents a more equitable process that will
allow all providers to identify high-risk patients under their
care.
General usefulness
9 I am satisfied with PanelViz for identifying high-risk patients
under my care.
General satisfaction
10 I can identify and address high-risk patients under my care in a
timely manner because of PanelViz.
Performance speed
11 Using PanelViz increases the number high-risk patients under
my care I was aware of.
Productiveness
12 I think that I will be able to identify high-risk patients under
my care whenever I use PanelViz.
Information needs
Perceived Ease of Use (Cronbach α= .95)
13 I am comfortable with my ability to use PanelViz. Competency
14 Learning to operate PanelViz is easy for me. Learnability
15 It is easy for me to become skillful at using PanelViz. Competency
16 I find PanelViz easy to use. Ease of use
17 I can always remember how to log on to and use PanelViz. Memorability
PanelViz was modified to ‘registry’ when administering survey are patient registry trials
119
for each survey was the mean of all survey items with each item weighted equally. Hypothesis
testing was performed using paired t-tests.
The analysis of the interview transcripts was conducting using inductive thematic
analysis using the NVivo software. First, the authors generated initial codes by summarizing the
interview data on a more abstract level. Second, the authors performed axial coding to generate
higher-level themes. Thirds, the authors concluded the analysis by assessing whether the
interview data aligned with the final themes. Study staff were blinded to metadata associated
with each statement.
5.3.3 Results
IT Needs Related to Population Monitoring
22 interviews in 2 HIV primary care programs revealed that monitoring and tracking
patient populations required the development of novel strategies that could only be partially
supported by existing health IT. First, critical patient problems were at times unbeknownst to
clinicians and interviewees, leading multiple staff to conclude that additional health IT could
potentially help surface undetected patient problems. In particular, patient information on mental
health and social behavioral determinants such as unstable housing were perceived as being
important for care delivery but challenging to extract from the patient record. Second, staff
reported being overwhelmed by the volume of information across their six distinct patient
registries and requested functionality that could consolidate multiple registries would reduce
information overload. Third, participants explicitly requested the implementation of additional
decision-support resources. Several clinicians in clinic 1 familiar with predictive modeling
perceived that the prediction of adverse events would enable them to provide better care. One
social worker asserted that understanding trends in depression or anxiety severity could help

120
prevent adverse health outcomes, while multiple physicians reported that predicting outcomes
related to HIV prevention and treatment would help them target resources more efficiently
Participating clinicians disclosed that they attempted to overcome the limitations of
existing health IT by creating homegrown tools that enabled them to monitor large group of
patients. These tools constituted simple patient lists that served as cognitive aids to help
providers maintain awareness of their patients and were stored in various media, including
hospital-owned mobile phones, paper notebooks, and Excel spreadsheets. While all lists
contained at a minimum the names of patients, most also contained a succinct summary of key
medical and psychosocial issues. Some providers used these lists as visual aids; one care
coordinator used color-coding to highlight patients in need of a follow-up based on patient
acuity.
Theoretical Framework
We developed a conceptual framework to inform the design and evaluation of a tool for
monitoring patient populations. Our adaptation of the theory of situational awareness delineates
two levels of abstraction; patient- and population-level situational awareness and is presented in
Figure 3.1. Patient-level SA requires perception of relevant care gaps and psychosocial issues,
comprehension of the urgency of a patient’s status, and projection of the impact of a potential
intervention on patient outcomes. Population-level SA requires perception of those patients with
care gaps and psychosocial issues, comprehension of the relative priority of patients within a
given population, and the ability to project which high-priority patients are likely to benefit from
intervention. Finally, a critical part of the framework is the role of the role of expectations and
mental models in directing attention to relevant information and comprehending its meaning.
User needs as conceptualized using SA are presented in Table 5.4.

121
Using situational awareness in the design process is helpful also because there is a precedent for
using it effectively to inform the development of software interfaces.(105,110,111)
Design Requirements
Table 5.4 Situational awareness constructs, user needs, and design requirements
Construct Definition User Need Design Requirement
Patient-
Level
Situational
Awareness
Perception Perception of a
patient’s medical
and psychosocial
problems
Maintain awareness of
each patient’s medical
and psychosocial
problems
Display each
patient’s medical
and psychosocial
problems
Comprehension Comprehension of
the modifiable
behaviors that
prevent a patient’s
disease management
Identify the modifiable
behaviors that prevent a
patient’s disease
management
Projection Projection of the
intervention most
likely to resolve a
patient’s medical
problems
Identify the intervention
most likely to resolve a
patient’s medical
problems
Recommend
interventions that
will resolve a
patient’s medical
problems
Population-
Level
Situational
Awareness
Perception Awareness of all
patients with
medical and
psychosocial
problems in a
provider’s patient
panel
Identify all patients with
medical and
psychosocial problems
under a user’s care
Present all patients
with medical and
psychosocial
problems under a
user’s care
Comprehension Comprehension of
each patient’s
relative priority in a
provider’s patient
panel
Identify the patients
with highest priority
under a user’s care
Sort patients
according to their
priority as assessed
by the user
Projection Projection of the
patients most likely
to benefit from
intervention in a
provider’s patient
panel
Identify the patients
most likely to benefit
from intervention under
a user’s care
Recommend
patients likely to
benefit from
intervention

122
We enumerate six design requirements that were generated using the conceptual framework
described above and are presented in Table 5.4. We also discuss potential approaches to
satisfying these requirements.
1. Display each patient’s medical and psychosocial problems
Providers monitoring their patients require information on the care required by each patient.
This informs their understanding of the care gaps that must be resolved for a given patient and
their interpretation of the impact of SBDH, which can be perilous for patients with chronic
disease. There are several paradigms for presenting a collection of patient data to clinicians
including extractive summaries56,57 (expert selected variables organized in tables) and abstractive
summaries(258–260) (patient problems inferred from structured & unstructured data).
2. Recommend interventions that will resolve a patient’s medical problems
The clinicians interviewed reported that it was difficult to match patients to the appropriate
intervention; this often reflected a failure to ascertain the ‘root cause’ of a patient’s poor disease
management. IT tools should support efficient retrieval of information on common barriers to
treatment such as SBDH including substance abuse and unstable housing.(41,160–164)
Interactive tools that enable clinicians to design care pathways based on established interventions
for SBDH may be useful.(165–168)
3. Present all patients with medical and psychosocial problems under a user’s care
Healthcare providers have recency biases that may prevent them considering patients with
whom they have had no recent interactions (261), and many providers we interviewed reported
being concerned that patients often ‘fell-off-the-radar’. This may be ameliorated by providing a
visualization of all patients on a clinician’s panel. Zhou et. al.’s Panel Support Tool used tables
to present a provider’s panel and but required users to scroll through many pages to view all

123
patients.(89,262) Although they present data on much fewer individuals, learning analytics
systems use visualizations wherein each student is represented by a marker on a plot, thereby
enabling all students to be presented on a single page.(103,104) Any visual solution in healthcare
would have to be respectful of the graph literacy of healthcare providers, potentially limiting the
possibilities for patient visualization.(142)
4. Recommend patients likely to benefit from intervention
Prioritization of patients who require enhanced attention is a growing need among clinicians
in primary care settings who have 500 or more patients on their panel. In a tabular visualization,
prioritization could be operationalized by enabling users to filter out data to focus only on high-
priority patients or sort the data such that high-priority patients occupy the most immediate
visual space. In other visualization modalities such as heatmaps, users could adjust their field-of-
view to either a detail view (only presenting high-priority patients) or a fisheye view, which
provides both a detail view and overview without obscuring any single patient.
Users must have control over the mechanism by which patients are sorted. This reflects the
fact that clinic staff with distinct patient care responsibilities are required to identify ‘high-
priority’ patients who likely have different characteristics based on whether the user is a
behavioral health provider or an internal medicine physician, for example.(262) In addition,
studies have observed that clinicians are mistrustful of automated stratification and that human
review is a critical aspect of risk stratification.(82,263) By using a ‘doctor-in-the-loop’ approach
to patient prioritization, tools can satisfy both the diverging needs of clinic staff with distinct
patient care responsibilities and clinician’s requirement for controllable risk-stratification. In
addition, the importance of goal-directed processing in situational awareness means that a user’s

124
prioritization criteria may change in response to events such as a clinical quality initiative that
places transient emphasis on specific care indicators.
In the conceptual framework presented in Figure 3.1, providers must understand the relative
proportion of patients considered ‘high-risk’. In the case that a large proportion of patients are
high-risk, the prioritization criteria might be refined so that staff have a manageable workload for
patient outreach, while if too few patients are considered high-risk then the prioritization criteria
will be expanded so that more patients can receive much needed supportive services.
5. Highlight the patients most likely to benefit from intervention
In resource limited settings, providers attempt to target interventions to patients who are most
likely to benefit. Clinicians we spoke with primarily used evidence of suboptimal past
engagement in care as indicators that a patient was unlikely to be receptive or engage fully with a
care management intervention. Tools to support such targeting could provide a succinct
summary of a patient’s past engagement in care. Alternatively, recent studies have demonstrated
the ability of machine learning models to successfully identify a patient’s ‘propensity to succeed’
in a care management intervention.(172–174) As a result, future IT tools could integrate such
predictions.
Architecture of PanelViz

125
10 design sessions were conducted with 7 clinicians with more than 100 years combined
experience managing patients with HIV. The earliest iterations of the PanelViz tool consisted of
a tabular visualization similar to patient registries that used color-coding to draw user’s attention
to care gaps and high-risk patients. However, presenting 500 patients in a tabular visualization
required users to scroll through many pages to view all patients and would require additional
charts to satisfy design requirement #6. When showed a mockup of a colored hexagon, users
found it easy to both identify high-risk patients and quickly estimate the number of high-risk
patients on their panel. Below we describe the architecture of the final prototype.
The PanelViz tool was designed to support visualization of a provider’s entire patient
panel and yields awareness of absolute panel size and the relative number of high-risk patients
(Figure 5.3). A functioning prototype of the tool can be found here:
https://djf2150.shinyapps.io/panelViz/. Each hexagon in the heatmap represents 1 patient and the
color of each hexagon denotes each patient’s priority score; red indicates ‘high risk’ and
Figure 5.3 PanelViz Interface

126
green/blue indicates ‘low risk’. The spatial configuration of the hexagons are arranged in order
of decreasing priority. Users can retrieve patient-level information by hovering the mouse over a
given hexagon; patient-level information on selected care gaps will then appear inside the
information box on the righthand side of the interface.
Users can manipulate the patient prioritization criteria by toggling the dropdown menu
which enables selection and sorting of prioritization criteria. The priority score of each patient
changes dynamically as users manipulate the prioritization criteria. PanelViz uses a linear
equation to incorporate all selected care gaps into a single priority score for each patient. This is
accomplished using the multi-attribute global inference of quality (MAGIQ) technique, which
only requires decision makers to rank their selected decision criteria (care gaps) according to
their perceived importance. These selected rank order of the care gaps are automatically
converted into attribute weights using rank order centroids, a value representing the distance
between adjacent ranks on a normalized scale between 0 and 1.(85) All care gap variables are
then normalized to values between 0 and 1 and multiplied by their corresponding attribute
weight.
The interactive visualization satisfies four of the six aforementioned design requirements.
Requirement #1 is achieved by enabling users to highlight each patient’s medical and
psychosocial status either by searching for the patient in the data table or by moving their mouse
over a hexagon. The hexagon plot satisfies requirement #4 because of its ability to present a
large amount of data in a small visual space; the plot in Figure 5.3 contains approximately 500
patients, which is a typical panel size in HIV primary care. Requirement #5 is achieved by using
color-coding to indicate a patient’s relative priority and interactive prioritization controlled by
users. Users can select and sort prioritization criteria using the dropdown at the left of the
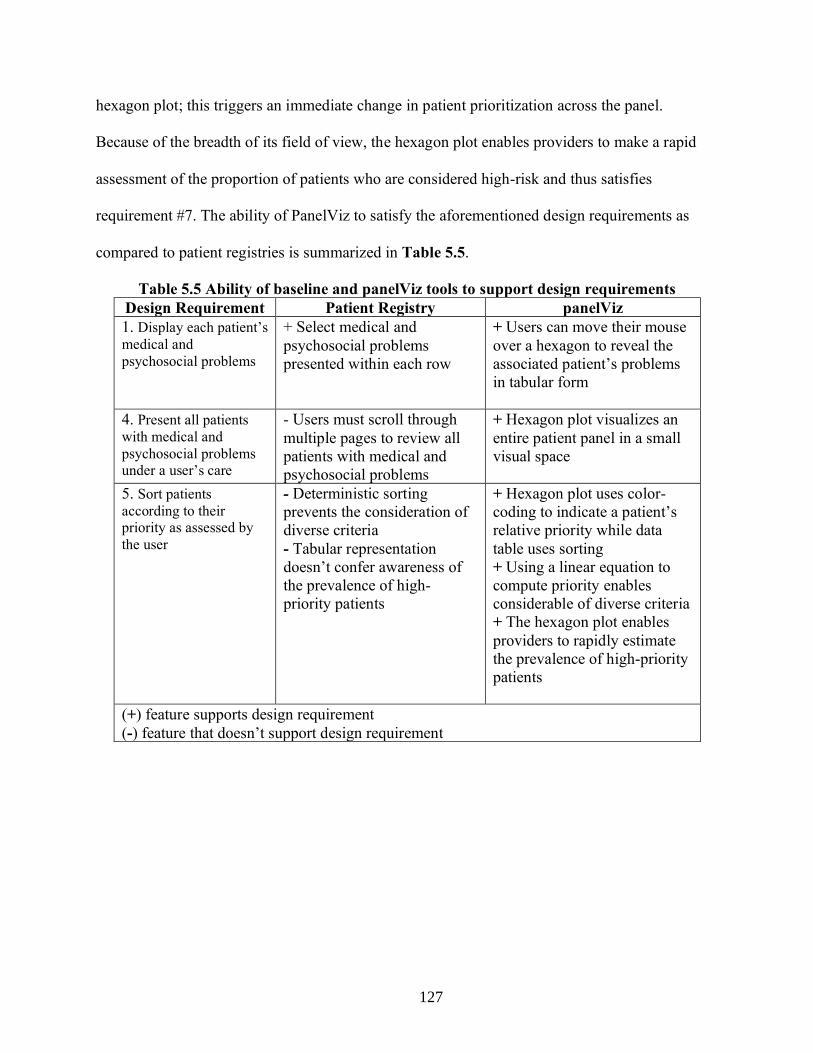
127
hexagon plot; this triggers an immediate change in patient prioritization across the panel.
Because of the breadth of its field of view, the hexagon plot enables providers to make a rapid
assessment of the proportion of patients who are considered high-risk and thus satisfies
requirement #7. The ability of PanelViz to satisfy the aforementioned design requirements as
compared to patient registries is summarized in Table 5.5.
Table 5.5 Ability of baseline and panelViz tools to support design requirements
Design Requirement Patient Registry panelViz
1. Display each patient’s
medical and
psychosocial problems
+ Select medical and
psychosocial problems
presented within each row
+ Users can move their mouse
over a hexagon to reveal the
associated patient’s problems
in tabular form
4. Present all patients
with medical and
psychosocial problems
under a user’s care
- Users must scroll through
multiple pages to review all
patients with medical and
psychosocial problems
+ Hexagon plot visualizes an
entire patient panel in a small
visual space
5. Sort patients
according to their
priority as assessed by
the user
- Deterministic sorting
prevents the consideration of
diverse criteria
- Tabular representation
doesn’t confer awareness of
the prevalence of high-
priority patients
+ Hexagon plot uses color-
coding to indicate a patient’s
relative priority while data
table uses sorting
+ Using a linear equation to
compute priority enables
considerable of diverse criteria
+ The hexagon plot enables
providers to rapidly estimate
the prevalence of high-priority
patients
(+) feature supports design requirement
(-) feature that doesn’t support design requirement
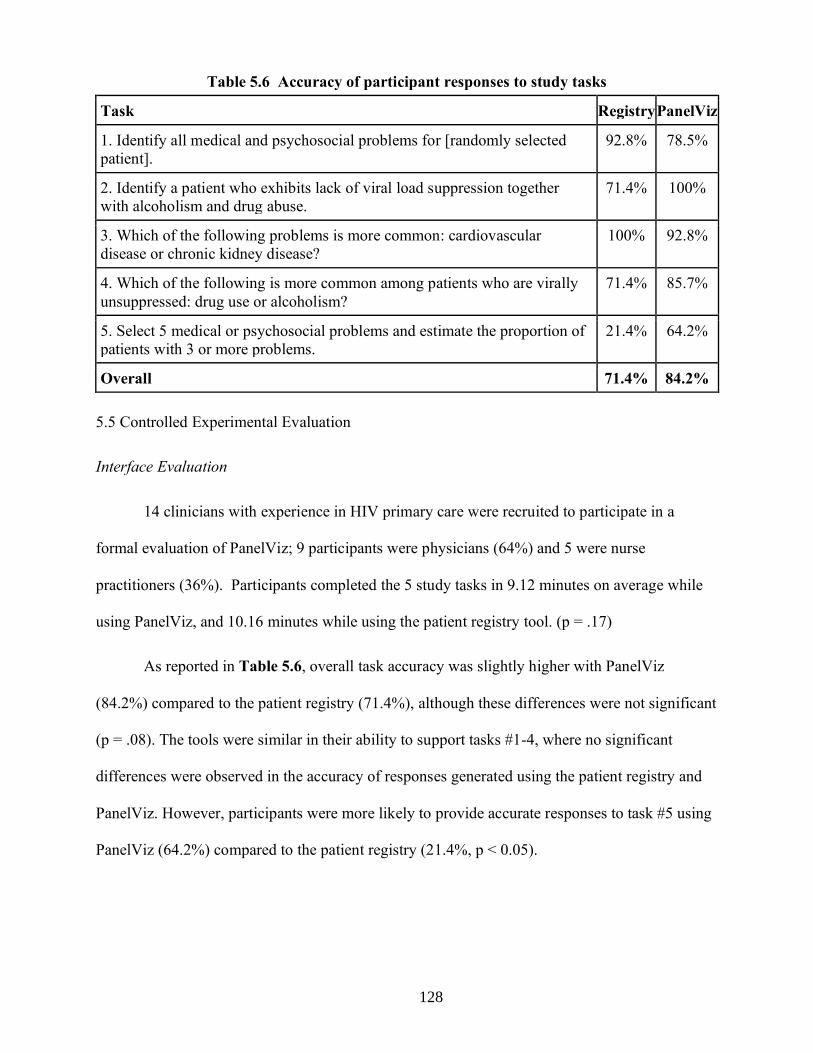
128
5.5 Controlled Experimental Evaluation
Interface Evaluation
14 clinicians with experience in HIV primary care were recruited to participate in a
formal evaluation of PanelViz; 9 participants were physicians (64%) and 5 were nurse
practitioners (36%). Participants completed the 5 study tasks in 9.12 minutes on average while
using PanelViz, and 10.16 minutes while using the patient registry tool. (p = .17)
As reported in Table 5.6, overall task accuracy was slightly higher with PanelViz
(84.2%) compared to the patient registry (71.4%), although these differences were not significant
(p = .08). The tools were similar in their ability to support tasks #1-4, where no significant
differences were observed in the accuracy of responses generated using the patient registry and
PanelViz. However, participants were more likely to provide accurate responses to task #5 using
PanelViz (64.2%) compared to the patient registry (21.4%, p < 0.05).
Table 5.6 Accuracy of participant responses to study tasks
Task Registry PanelViz
1. Identify all medical and psychosocial problems for [randomly selected
patient].
92.8% 78.5%
2. Identify a patient who exhibits lack of viral load suppression together
with alcoholism and drug abuse.
71.4% 100%
3. Which of the following problems is more common: cardiovascular
disease or chronic kidney disease?
100% 92.8%
4. Which of the following is more common among patients who are virally
unsuppressed: drug use or alcoholism?
71.4% 85.7%
5. Select 5 medical or psychosocial problems and estimate the proportion of
patients with 3 or more problems.
21.4% 64.2%
Overall 71.4% 84.2%

129
Compared to the patient registry, PanelViz
was associated with higher overall Health-
ITUES scores (3.70 vs. 4.32, p < .005).
Among all three subscales tested, PanelViz
was associated with more favorable
responses from participants. The ‘perceived
usefulness’ subscale exhibited the largest difference between the patient registry and PanelViz
tool (3.75 vs. 4.49, p < .005) The mean of the overall Health-ITUES score and each component
subscale associated with each interface is presented in Table 5.7.
At the conclusion of the study, participants were asked several questions regarding their overall
impression of the patient registry tool and PanelViz, including significant benefits or limitations
of each interface. We identified the following two themes related to the interfaces used by study
participants:
Theme 1: PanelViz preferred by participants because of user-controlled prioritization and
visualization features
13 out of 14 asserted that they preferred the PanelViz interface compared to the patient
registry. This partly reflected participant’s favorable assessment of the population visualization,
wherein all of the 500 patients on their panel was presented on a single screen and represented by
a color related to their assigned ‘priority score’:
“I liked the [visualization], I think because it was easy the way it was laid out. It was
able to condense a lot of information into a very small physical space...and so you could
use that to visualize 500 patients worth of data in just a very small compact space” (MD
1)
Table 5.7 Health-ITUES scale scores across
study conditions
Scale Patient
Registry
PanelViz p-value
Impact 3.88 4.26 p < .05
Perceived
Usefulness
3.75 4.49 p < .005
Perceived
ease of use
3.50 4.04 p < .05
Overall
Score
3.70 4.32 p < .005

130
For the study tasks requiring estimation of population-level characteristics, clinicians felt
that the visualization enabled them to quickly estimate the proportion of patients with a specific
set of characteristics:
“I preferred the visualization tool...helped reduce the complexity of complex data and
allowed me to more efficiently group variables of interest in a way that was easy to...the
visualization tool was much, much easier and more intuitive, and [the patient registry]
straining my eyes” (MD 6)
The patient prioritization module of PanelViz was mentioned by seven clinicians as being
a useful feature. These participants appreciated the ability to use a multiplicity of priority criteria
in identifying high-priority patients and felt that the ability to sort selected criteria according to
their perceived importance was intuitive. Clinicains felt that a flexible, user-controlled patient
prioritization module would enable them to focus on medical and psychosocial problems that
were especially prevalent on their panels:
“the visualization in particular, let's me prioritize [variables] however I want...I think
viral load suppression is always the first thing we prioritize...but then you can then
prioritize [other indicators] in a variety of different ways. It also depending on who
you're talking to...when I talk to the psychiatrist, I might want to prioritize people with
mental health s that I can have her help me with those patients. If I'm talking about just
patients that I'm prescribing medications for, I might then be focused more on the
patients with physical illness like cardiovascular disease, kidney disease, etc.” (MD 3)
Theme 2: Patient registry useful for simple tasks but does not facilitate understanding of
population characteristics
Study participants asserted that the retrieval of patient information was more
straightforward using the patient registry tool, due to the simplicity of the tool’s tabular format:
“...maybe not easier, but it was maybe a little bit faster to answer the first couple of
questions on the registry tool. Just because you're literally just displaying data...I felt like
it was just a little bit faster to be able to like rank order and in group things, but I don't
know, they kind of seem like they're all rolled into one with the tool.” (MD 4)
Despite facilitating easy retrieval of patient-level information, the patient registry did not
support clinicians in estimating population-level characteristics. Participants often resorted to

131
counting individual cells to accomplish tasks such as estimating the prevalence of specific
medical and psychosocial problems and one participant reported that using this tool causes
significant ‘eye strain’.
“I think it was hard to do things like estimation, because again, it's a lot of information.
Not in a compact space. So it's hard to estimate like a proportion of patients, you know,
with selected problems or, for example, kind of quantifying what's more common
cardiovascular disease or chronic kidney disease. I found it more difficult to estimate...”
(MD 1)
In addition, study participants felt that the patient registry did not enable them to
adequately prioritize complex patients and constrained their selection of priority criteria to only
one or two variables:
“If you were just looking at one or two variables, I think [the registry] was okay. But the
sorting I did not find it terribly easy. So, if it was just like one or two variables, and if you
just wanted to know who was using drugs or who was virally suppressed...but if you
wanted multiple variables, the other tool is much, much better and easier to use.” (NP 4)
5.3.4 Discussion
In this study, we developed and evaluated an interactive visualization tool designed to
help clinicians maintain awareness of patients for whom they are responsible. While most tasks
related to population monitoring could be achieved using either PanelViz or a simulated patient
registry, only by using PanelViz were clinicians able to accurately estimate the proportion of
complex patients on their panels. Moreover, clinicians asserted that the visualization tool had
higher perceived ease of use and perceived usefulness compared to patient registries; this reflects
participant’s favorable assessment of the tool’s user-controlled prioritization module and
population visualization.
Previous studies have observed that large volumes of clinical data can overwhelm
clinicians and lead to worse quality of care (264,265) but our findings suggest that interactive
visualizations like PanelViz may better enable clinicians to draw insight from voluminous data.
Only with PanelViz were clinicians able to accurately estimate the proportion of complex
132
patients – defined as those with 3 or more medical or psychosocial problems. When using the
patient registry to accomplish this task, many participants attempted to review each row and
count complex patients one-by-one, inevitably becoming so frustrated that some participants
simply asserted that they ‘could not perform’ the task. In contrast, PanelViz highlighted
complex patients in red and orange, enabling users to quickly estimate of the proportion of
complex patients. Participants asserted that with the visualization, proportions could be estimated
by comparing the relative size of groups of patients as defined by their respective colors. Color-
coding has been used in visualizations designed for clinicians (88,89) and can effectively focus a
decision-makers attention on important and/or extraordinary aspects of the data. (108,110) Our
findings suggest that future studies should evaluate whether data visualization can help providers
maintain awareness patient populations in other clinical settings and assess how such IT tools
can be integrated into clinical workflows.
The physicians and nurse practitioners who participated in the study overwhelming
preferred PanelViz to the patient registry interface. Our findings that clinicians considered the
registry interface to exhibit only modest usefulness is corroborated by previous studies that have
observed patient registries to be unable to satisfy all clinicians’ needs.(4,19,25) The ability to
identify high-priority patients according to a diverse set of multiple priority criteria is an
established need(85,86) that was also observed in our exploratory studies. In contrast to patient
registries, PanelViz enabled providers to derive a ‘priority score’ for all patients on their panel by
selecting and ranking up to 20 prioritization criteria. Clinicians responded favorably to this
flexible prioritization feature and asserted that it would enable them to focus on medical and
psychosocial problems that were especially prevalent on their panels. Because several studies
have observed that physicians reject patient stratification approaches such as predictive models

133
that are unable to incorporate clinical intuition and had limited interpretability(83,84), user-
controlled prioritization modules similar to PanelViz may engender transparency while also
allowing providers to account for multiple disparate outcomes in patient stratification. Allowing
clinicians to have more control over which patients are prioritized could further the ‘doctor-in-
the-loop’ paradigm wherein intuition is paired with machine supported stratification.(87)
PanelViz was informed by the guidelines for the design of tools for visual analysis. We
leveraged 4 of the 12 principles outlined by Heer and Schneiderman’s taxonomy of interactive
dynamics for visual analysis.(266) Specifically, visualization enabled clinicians to more easily
interact with data that reflects the state of their respective panels; multiple participants reported
difficulty reading the information contained within the patient registry but reported no such
challenges when using the visualization. Sorting enabled clinicians to quickly identify patients
with the highest priority on their respective panels. This was especially useful when providers
attempted to estimate the proportion of specific medical and psychosocial problems, as all
patients with a given problem were isolated at the top of the visualization. Priority scores were
derived by each clinician when they selected a set of priority criteria. Heer and Schneiderman
assert that when users find data to be insufficient, the data can be transformed into new attributes
that satisfy the user’s end goals.(266) Because prioritization is an important goal aspect of care
management and clinicians value different priority criteria, users should have the ability to derive
prioritization scores that align with their assessment of patient priority. Users were able to
navigate the visualization by using their cursors to inspect individual patients and this was often
used to ascertain the groups of patients with the same color (and thus priority score). Novel tools
that support population monitoring should include features that facilitate these four task types.

134
This study has several limitations that should be considered. First, the limited sample size
of our study may have not been sufficient to demonstrate statistical significance. Second, we
used datasets containing 500 patients in study trials, but the actual caseload of providers may
vary given different clinical settings. Third, our visualization tool was a prototype, and we expect
that usability would improve with further refinement. Fourth, the user-centered design and
experimental evaluation was conducted in a simulated HIV primary care setting and thus results
may not be generalizable to other healthcare settings. The components of the interactive solution
may support the management of HIV but not be relevant to the management of other chronic
diseases. Fifth, the experimental evaluation was conducted with dataset of synthetic patients. In
actual practice, clinicians would be familiar with most or all of the patients on their panels and
thus some of the study tasks are more challenging to accomplish in a laboratory setting. Sixth,
users were unable to investigate the EHR data that was aggregated to create the 18 variables
presented in the registry and PanelViz systems. Future systems should feature an aspect of data
provenance, where users can generate confidence in derived data elements by examining raw
data.(267,268)
5.3.5 Conclusion
As care models that require healthcare providers to continuously monitor large patient
groups become more widespread, there is an unmet need for health IT systems that can help
clinicians identify patients with complex care needs. Using a novel visualization tool, physicians
and nurse practitioners were able to accurately identify patient- and population characteristics
across a simulated panel of 500 HIV patients. These findings suggest that data visualizations
may ameliorate the challenge of simultaneously monitoring many complex patients. Future

135
research should identify opportunities to leverage data visualizations in other areas of care
delivery.

136
Chapter 6: Conclusions
6.1 Summary of Work
This dissertation consisted on six distinct studies that used both qualitative and quantitative
methods to explore how computational methods can better support clinicians in care
management settings. I will now provide an overview of these studies and their principal
research findings.
6.1.1 Aim 1
The research conducted in Aim 1 examined the IT needs of healthcare providers
managing large panels of patients living with HIV. Specific lines of inquiry included an
enumeration of the challenges to the delivery of care management and assessment of whether
existing health IT systems satisfy provider’s needs. The first study of Aim 1 consisted of semi-
structured interviews and direct observations conducted in two HIV primary care clinics situated
within large urban hospitals. Inductive thematic analysis was used to generate findings from
qualitative data and compare and contrast the use of health IT in the two clinics. The second
study of Aim 1 leveraged the data generated in the first study to develop a conceptual framework
of population monitoring in chronic disease care by adapting the theory of situational awareness.
The first study of Aim 1 found that the delivery of care management requires the
development of novel strategies to support population monitoring. The strategies included
prioritizing ‘high-priority’ patients and the creation of homegrown tools such as spreadsheets to
help clinicians monitor these patients. We also observed that providers in both clinics struggled
to retrieve information related to social and behavioral determinants and use that information to
target psychosocial interventions to appropriate patients. Finally, despite the fact that team-based

137
care is a hallmark of care management and similar care models, clinicians had difficulty
communicating with colleagues, thereby hindering their ability to maintain awareness high-
priority patients and deliver multidisciplinary interventions. Together these findings suggest that
improvements in health IT may ameliorate many of the challenges currently faced by clinicians
delivering care management to chronic disease populations.
The second study of Aim 1 adapted the theory of situational awareness to conceptualize
the process of population monitoring in chronic disease care. The conceptual framework that
resulted from this adaptation posits several key elements. First, the framework asserts that
situational awareness operates at two levels of abstraction in population monitoring; patient- and
population-levels. Patient-level SA requires perception of each patient’s medical and
psychosocial problems, comprehension of modifiable behaviors, and projection of the impact of
potential intervention on patient outcomes. Population-level SA requires perception of those
patients with medical and psychosocial issues, comprehension of the relative priority of patients
within a given population, and the ability to project which high-priority patients are likely to
benefit from intervention. Second, the framework acknowledges the importance of a clinician’s
goals in directing their attention to specific medical and psychosocial issues among patients on
their panels. The framework also acknowledges the impact of a clinician’s workload on their
ability to maintain awareness of patients on their panel.
6.1.2 Aim 2
The research conducted in Aim 2 examined how information related to social and
behavioral determinants of health is documented in EHRs and was motivated by the fact that this
information is critical for care management. Three studies were conducted in support of Aim 2
and advanced the knowledge required to build a system that can automatically infer patient

138
SBDH status from the patient record. The first study of Aim 2 focused on creating a corpus of
clinical notes to serve as a dataset for analysis in subsequent studies. This involved collaborating
with domain experts to curate a comprehensive list of SBDH relevant to HIV primary care and
subsequently manually annotating a large volume of notes with those SBDH. Because SBDH is
infrequently documented and the annotation process was time-intensive, we were able to use
semi-supervised learning to significantly accelerate the process of creating a gold-standard
corpus. The second study of Aim 2 used the aforementioned dataset to analyze the longitudinal
characteristics of 4 common SBDH as expressed in the patient record and compared the rates of
change among distinct SBDH. In addition, manual review of patient notes was undertaken to
establish whether changes in patient SBDH status reflected legitimate changes in patient status or
rather potential data quality issues. The third study of Aim 2 attempted to 1) automatically infer
the presence of SBDH documentation to support initiatives designed to improve social history
taking by clinicians, and 2) evaluate methods for inferring a patient’s respective SBDH from
electronic health record data. We hypothesized that modeling approaches that leverage both
structured and unstructured data for this task will yield better performance than attempts based
on either data source alone.
The first study of Aim 2 initially involved three clinicians who identified an array of
more than thirty distinct SBDH associated with adverse health outcomes such as hospital
readmission and the acquisition of sexually-transmitted infections. The clinicians classified each
SBDH as belonging to one of five SBDH topics: alcohol use (social alcohol use, alcoholism),
substance abuse (amphetamine, opiates, cannabis, cocaine, intravenous drugs), sexual
orientation (men who have sex with men, men who have sex with women, women who have sex
with men, women who have sex with women, bisexual), sexual activity (history of sexually

139
transmitted infections, condom usage, oral sex, vaginal sex, receptive and insertive anal
intercourse), and housing status (homeless, unstable housing, living with friends). Three
annotators then manually reviewed the entire patient records of 33 HIV+ individuals for
documentation of the 6 SBDH topics and 30 risk factors listed above. Because the scarcity of
clinical notes containing explicit SBDH mentions rendered the annotation process described
above extremely labor-intensive, we employed a technique leveraging modern distributional
semantic techniques to accelerate the manual annotation process by identifying clinical
documents likely to mention SBDH. Our semi-supervised approach using similarity based on
word-embeddings successfully increased the yield of manual annotation. Annotators observed
8.26 distinct SBDH mentions per note for the 60 notes closest to the 6 SBDH domain centroids,
compared to 0.83 mentions per note randomly sampled from a cohort of HIV+ individuals.
The second study of Aim 2 focused on 4 SBDH risk factors; sexual orientation, housing
status, alcohol use and drug use. Encounters with confirmed documentation of SBDH were
isolated and analyzed to examine changes in a patient’s SBDH status. and potential data quality
issues. We then manually reviewed pairs of notes authored on the same-day with conflicting
documentation to identify possible sources of data quality issues related to SBDH. The findings
of the study suggested that social and behavioral determinants of health as expressed in the
patient record exhibit change over time. While some of these changes likely reflect true changes
in the patient state, multiple findings indicated that some changes in patient SBDH status may
reflect data quality issues. We observed a high frequency of implausible longitudinal changes in
patient SBDH status, wherein a patient transitioned from an active status (e.g. active alcohol use)
to having no history of active status (e.g. no history of alcohol use). In addition, we observed
same-day conflicts in patient’s documented SBDH status.

140
The third study of Aim 2 attempted to use supervised learning to infer the presence of
SBDH documentation and individual SBDH risk factors in patient records. Our experimental
results indicate that combining clinical free-text notes and structured data may provide the best
approach to classifying both the presence of SBDH documentation and patient SBDH status.
While the majority of top features utilized by the heterogenous models were derived from text,
models also included structured features. Several textual features were institution-specific or
regional in nature. The performance of the classification models suggested that it is likely
feasible to infer presence of SBDH documentation, but that challenges remain for inferring
patient SBDH status. Inferring patient SBDH status is most challenging among SBDH with low
prevalence and high lexical diversity.
6.1.3 Aim 3
The research of Aim 3 explored whether an interactive visualization can improve
provider’s ability to perform tasks related to population monitoring. User-centered design was
employed to develop a tool featured user-controlled prioritization, which enabled clinicians to
identify high-priority patients according to whichever criteria they considered important. This
interface, named PanelViz, was evaluated using a within-subjects experimental study that
recruited physicians and nurse practitioners to perform several tasks with both the interactive
visualization and a simulated patient registry. This experimental study measured the accuracy of
participant’s task responses and measured perceived usefulness using a validated survey.
The design process demonstrated that clinicians found it difficult to navigate the tabular
data representation typically associated with patient registries, instead preferring a data
visualization that presented the entirety of their patient panels in a compact visual space. The
experimental evaluation demonstrated that the data visualization made it easier to identify

141
patients with complex care needs compared to the patient registry. Only with PanelViz were
clinicians able to accurately estimate the proportion of complex patients – defined as those with
3 or more medical or psychosocial problems. In addition, the prioritization module within
PanelViz, which enabled providers to derive a ‘priority score’ for all patients on their panel by
selecting and ranking up to 20 prioritization criteria, was received favorably. Providers asserted
that systems with user-controlled prioritization would enable them to focus on medical and
psychosocial problems that were especially prevalent on their panels and create distinct groups
of high-priority patients for different intervention types.
6.1.4 Implications for the treatment of COVID-19
The studies associated with this dissertation were completed prior to the emergence of
Severe acute respiratory syndrome coronavirus 2 (SARS-CoV-2) in the United States. However,
the research findings described herein may have implications for the treatment of coronavirus
disease 2019 (COVID-19), which is the condition associated with SARS-CoV-2 infection. First,
our development of a conceptual framework and a prototype tool to support patient monitoring
could inform IT solutions designed around the clinical management of multiple COVID-19
patients. Situational awareness at both the patient- and population-level is likely required by
clinicians managing many patients on overwhelmed inpatient wards. Moreover, the framework’s
focus on the process by which clinicians prioritize patients to receive limited resources may be
indicative of the process by which clinicians adjudicate whether patients should be admitted or
rather discharged from emergency departments. The framework’s assertion that clinician’s may
have distinct prioritization criteria – and the ability of our PanelViz tool to support user-
controlled prioritization – supports the type of decision making that may be required when
minimal evidence about a condition exists and there are few available treatment guidelines.

142
Second, our work advancing the science of inferring social and behavioral determinants of health
may inform the development of systems that can target social services to patients adversely
impacted by the severe economic consequences of the SARS-CoV-2 pandemic. A sharp increase
in unemployment has raised concerns about whether social services can meet the growing need
for food, rent, and utility assistance.(269) IT systems that attempt to identify patients with
housing difficulties can leverage our findings to develop more accurate models to infer this
information. In addition, our insights into the expression and inference of information related to
alcohol and drug abuse may also serve health systems that attempt to identify unmet social needs
and prevent subsequent population health issues.(270,271) The link between unemployment and
greater rates of drug and alcohol abuse has been established.(272,273)
6.2 Contributions
The research presented in this dissertation contributed to biomedical informatics
community in the following three ways; 1) revealed the limitations of existing health IT for care
management, 2) demonstrated how computational methods can be leveraged to infer social and
behavioral determinants of health , and 3) introduced data visualization and user-controlled
prioritization as a means of improving the process of population monitoring.
Our qualitative inquiry conducted in two HIV primary care programs provided evidence
that existing IT systems including EHRs and patient registries may not adequately support care
management. Challenges experienced by providers included the difficulty of monitoring a high
volume of patients, lack of awareness of patient social and behavioral determinants of health,
labor-intensive communication within interdisciplinary care teams, and the inability to match
patients with appropriate intervention. Our findings may motivate the informatics community to
design novel IT solutions that enable clinicians to more easily identify a patient’s social and

143
behavioral determinants of health and recommend evidence-based interventions that may
ameliorate the psychosocial factors that preclude disease management. The conceptual
framework advanced in Aim 1 exists as another contribution that may facilitate specifically the
development of solutions that support monitoring a high volume of patients. The framework will
enable the research community to operate with a more comprehensive understanding of the
population monitoring process, design tools that satisfy provider’s needs, and provide a set of
evaluation criteria for novel IT systems.
The research findings described herein describe previously unknown characteristics of
clinical documentation related to social and behavioral determinants of health and describe
computational approaches that may improve the automated inference of SBDH from patient
records. First, we contribute a set of social and behavioral determinants related to sexual health
that the research community may employ for both content analyses and modeling experiments.
Second, the success of the semi-supervised learning approach described herein can lower the
annotation burden experienced by research teams as they seek to develop their own gold-
standard corpora. Third, the second study of Aim 2 demonstrated that patient SBDH statuses are
subject to change over time, and that data quality issues may be common in SBDH
documentation. These findings have implications for future approaches to automated inference of
SBDH information from clinical data; computational models may benefit from aggregating only
recent historical data when inferring patient SBDH status and performing inference on multiple
data points to minimize the likelihood of misclassification resulting from data quality issues.
Fourth, the experimental results from the third study of Aim 3 suggest that both unstructured and
structured data can be leveraged for automated inference of patient SBDH status, which may

144
reorient the research community’s singular focus on using natural language processing to infer
SBDH.
The conceptual framework of population monitoring and the experimental study we
conducted can inform the development of novel health IT solutions designed to support
population monitoring in chronic disease settings. The framework adapted the theory of
situational awareness to enumerate several design requirements for novel systems that include
the ability to identify all patients requiring care and prioritize patients with complex care needs.
This framework influenced the design of a prototype tool, called PanelViz, which featured an
interactive visualization and was received more favorably by physicians and nurse practitioners
compared to a simulated patient registry. Clinician’s favorable reception of PanelViz’ population
visualization and the interfaces’ ability to support identification of patients with complex care
needs suggests that data visualization may enable providers to better interact with clinical data
and maintain awareness of their patient panels. In addition, the research community can build on
our efforts to empower clinicians with a flexible, user-controlled prioritization module. Similar
approaches could replace automated stratification methods such as predictive models, which
clinicians may be mistrustful of due to their inability to incorporate human review and clinical
intuition.(82–84)
6.3 Limitations
The studies described herein have several limitations which must be considered.
The two clinics selected for the two studies in Aim 1 are both HIV primary care programs
in New York City; the majority of the patient population treated in the clinics studied herein were
HIV+ with a high burden of SBDH and both clinics are located in large urban hospitals, which
145
may limit generalizability to other primary care settings. Although both clinics are focused on
HIV patients, the care models employed by these clinics is similar to those used by Accountable
Care Organizations and Health Homes. Second, interviews relied on participant’s memory of
past events and thus may be susceptible to recall bias. However, a strength of the methodology
included triangulation of information from administrators, physicians, care coordinators and
social workers. Third, the sample size for the study was relatively small. However, during data
collection we reached saturation, suggesting that a larger sample within the clinics studied herein
would not have yielded new findings. Fourth, we did not observe clinicians during clerical work;
observations of clinicians contacting patients, using health IT tools, or communicating with
colleagues would have provided additional insight into challenges faced by providers.
Several limitations of the 3 studies in Aim 2 are related to our creation of a gold-standard
corpus for analysis and experimentation. Document-level annotations lack the granularity of
mention-level annotations and thus systems trained on such data may be inappropriate for some
informatics interventions. Second, our semi-supervised learning approach relied on notes which
contained a social history section; not all notes do so. Third, a relatively small sample size was
used for evaluation of the semi-supervised learning approach.
Our approach to analyzing the longitudinal characteristics of SBDH documentation has
several limitations. First, our findings were generated by analyzing data from a specific patient
cohort treated at a single institution. The high prevalence of SBDH within the study cohort may
have resulted in a higher frequency of SBDH changes. Second, while our annotators achieved a
relatively high inter-rater reliability, there were likely some erroneous annotations and thus some
temporal changes in SBDH status may reflect annotation errors and rather than changes in
documented SBDH status. Third, our methods did not enable us to quantify the proportion of

146
SBDH changes that reflected true changes in the patient state and the proportion that reflected
documentation errors.
Lastly, our approach to performing automated inference of patient SBDH status has
addition limitations. First our SBDH classifiers were trained using data from a single institution
and performance may degrade when applied to distinct healthcare institutions. Second, our
overall modest results may have resulted from data quality issues in the documentation of SBDH
and/or inaccurate annotation. Third, while there has been work in extracting social determinants
of health from clinical notes, most approaches cast this problem as a named-entity recognition
task (i.e., extract particular passages in the notes). Because we approach the problem as a
document labeling task, our experimental setup does not allow for direct comparison to previous
work. Fourth our model performance may have been improved by preprocessing the text by
considering negation and correcting misspellings. In addition, reducing the dimensionality of the
structured EHR features using deep auto-encoders or an algorithm such as Independent
Components Analysis may have also improved performance.
The user-centered design and prototype evaluation described in Aim 3 has several
limitations that should be considered. First, the limited sample size of our study may have not
been sufficient to demonstrate statistical significance. Second, we used datasets containing 500
patients in study trials, but the actual caseload of providers may vary given different clinical
settings. Third, our visualization tool was a prototype, and we expect that usability would
improve with further refinement. Fourth, the user-centered design and experimental evaluation
was conducted in a simulated HIV primary care setting and thus results may not be generalizable
to other healthcare settings. The components of the interactive solution may support the
management of HIV but not be relevant to the management of other chronic diseases. Fifth, the

147
experimental evaluation was conducted with dataset of synthetic patients. In actual practice,
clinicians would be familiar with most or all of the patients on their panels and thus some of the
study tasks are likely more challenging to accomplish in a laboratory setting.
6.4 Future Work
In the first study of Aim 1, we identified several barriers to effective CM that could be
addressed by the development of IT tools that improve on existing systems. Clinic staff also
asserted that having access to an electronic representation of each patient’s providers would
ameliorate some communication challenges, and evidence suggests that this information can be
inferred through the secondary analysis of routinely collected EHR audit log data. Future
research should investigate the feasibility of such analyses in ambulatory settings.
The second study of Aim 1 advanced a conceptual framework of population monitoring
that adapts the theory of situational awareness. Although we hypothesize that a healthcare
provider’s awareness of patients requiring care on their respective panels is likely to impact
patient outcomes, no definitive link between provider situational awareness and patient outcomes
has been established in this setting. Future research should attempt to establish such a link,
thereby enabling the use of the framework as an evaluation metric for future informatics
interventions.
The first study of Aim 2 observed correlations between individual SBDH documented in
patient records; for example, alcoholism and history of substance abuse displayed a strong
correlation, as did sexual orientation and high-risk sexual activity and cocaine use showed a
strong correlation. Future research aimed at automatically inferring SBDH from patient records
should attempt to leverage this dependence using multi-label classification methods.(203) In
addition, future research efforts that rely on gold-standard annotated corpora can leverage our

148
semi-supervised learning approach to significantly decrease the labor required to identify clinical
notes with relevant SBDH mentions.
The second study of Aim 2 analyzed documentation related to SBDH among a sample of
persons with HIV and observed longitudinal changes in patient SBDH status. Future research
should conduct a more comprehensive analysis by annotating all notes associated with a large
corpus and use techniques such as mutual information to assess how the predictability of future
SBDH status relative to existing documentation changes with time.(224) Such an analysis would
open the possibility for techniques that could accurately model the relevance of social and
behavioral determinants of health documentation.(225,226)
The third study of Aim 2 demonstrated that incorporating both structured and
unstructured EHR can improve the ability of classification models to infer patient SBDH status.
Future studies can likely improve on our results by using more sophisticated modeling
approaches: 1) model performance is likely to be improved by considering negation or by
correcting misspellings in text, 2) multi-label classification may be improved by accounting for
the observed structure of SBDH labels. Hierarchically structured sets of SVM have demonstrated
improved performance compared to binary relevance for multi-label classification of clinical
documents (199–202), 3) document-level SBDH labeling may benefit from document
zoning.(204) Long documents like clinical notes typically contain many words unrelated to the
modeling task; in clinical documentation this is manifested by sections (ie. ‘Review of Systems’)
potentially irrelevant to SBDH, and 4) with a larger annotated corpus, a neural network with
attention layer may improve results while providing transparency for classification
decisions.(274)

149
In Aim 3, physicians and nurse practitioners asserted that an interactive visualization of
their patient panel had higher perceived usefulness and ease of use compared to a patient
registry. This finding suggests that future research should evaluate whether interactive tools that
visualize a provider’s entire patient panel can support provider awareness of patients in diverse
clinical settings including other chronic disease treatment programs, family practice settings, or
even ambulatory oncology care. In addition, research is needed to understand how these tools
would be integrated into clinical workflows and whether user-controlled prioritization is
perceived as beneficial by providers in other clinical domains.
6.5 Conclusions
As care models that require healthcare providers to take responsibility for the health
outcomes of their patients become more widespread, there is a need for novel systems that help
clinicians monitor their respective patient panels. This dissertation provides insight into how
computational methods can be used to support this goal. We posit a set of requirements for such
systems through a conceptual framework that adapts the theory of situational awareness. One
such requirement – the availability of patient information related to social and behavioral
determinants of health – can be supported by information retrieval approaches that are informed
by our research findings, which enumerate several important considerations related to the
expression of SBDH in clinical data. This dissertation also suggests that novel systems can
leverage data visualization to satisfy the requirement for providers to maintain awareness of all
patients requiring care. As healthcare providers struggle to deliver all required care to the
increasing number of patients that they are responsible for, future research should identify
opportunities to leverage data visualizations in other areas of care delivery.

150
References
1. Borsky A, Zhan C, Miller T, Ngo-Metzger Q, Bierman AS, Meyers D. Few Americans Receive
All High-Priority, Appropriate Clinical Preventive Services. Health Aff (Millwood). 2018 Jun
1;37(6):925–8.
2. Blumenthal D, Abrams MK. Tailoring Complex Care Management for High-Need, High-Cost
Patients. JAMA. 2016;316(16):1657–8.
3. Dorr DA. Capsule Commentary on Grant et al., Which Complex Patients Should Be Referred for
Intensive Care Management? A Mixed Methods Analysis. J Gen Intern Med. 2018
Sep;33(9):1551–1551.
4. Richardson JE, Vest JR, Green CM, Kern LM, Kaushal R. A needs assessment of health information technology for improving care coordination in three leading patient-centered medical
homes. J Am Med Inform Assoc. 2015 Jul 1;22(4):815–20.
5. Perlin JB. Health Information Technology Interoperability and Use for Better Care and Evidence.
JAMA [Internet]. 2016; Available from:
http://jama.jamanetwork.com/article.aspx?doi=10.1001/jama.2016.12337
6. Hong CS, Abrams MK, Ferris TG. Toward Increased Adoption of Complex Care Management. N
Engl J Med. 2014;371(6):491–3.
7. Bates DW. Health Information Technology and Care Coordination:The Next Big Opportunity for
Informatics? Yearb Med Inform. 2015 Jun 30;10(1):11–4.
8. van Olmen J, Ku GM, Bermejo R, Kegels G, Hermann K, Van Damme W. The growing caseload
of chronic life-long conditions calls for a move towards full self-management in low-income
countries. Glob Health. 2011 Oct 10;7:38.
9. Braillard O, Slama-Chaudhry A, Joly C, Perone N, Beran D. The impact of chronic disease
management on primary care doctors in Switzerland: a qualitative study. BMC Fam Pract
[Internet]. 2018 Sep 11 [cited 2019 Feb 14];19. Available from:
https://www.ncbi.nlm.nih.gov/pmc/articles/PMC6134721/
10. Drawz PE, Miller RT, Singh S, Watts B, Kern E. Impact of a chronic kidney disease registry and
provider education on guideline adherence – a cluster randomized controlled trial. BMC Med
Inform Decis Mak. 2012 Jul 5;12(1):62.
11. Implementing a Point-of-Care Registry [Internet]. [cited 2019 Apr 12]. Available from:
https://edhub.ama-assn.org/steps-forward/module/2702745
12. Altschuler J, Margolius D, Bodenheimer T, Grumbach K. Estimating a reasonable patient panel
size for primary care physicians with team-based task delegation. Ann Fam Med. 2012
Oct;10(5):396–400.
13. Feller DJ, Zucker J, Don’t Walk OB, Srikishan B, Martinez R, Evans H, et al. Towards the
Inference of Social and Behavioral Determinants of Sexual Health: Development of a Gold-

151
Standard Corpus with Semi-Supervised Learning. AMIA Annu Symp Proc AMIA Symp.
2018;2018:422–9.
14. Gundlapalli AV, Carter ME, Palmer M, Ginter T, Redd A, Pickard S, et al. Using natural language
processing on the free text of clinical documents to screen for evidence of homelessness among
US veterans. AMIA Annu Symp Proc AMIA Symp. 2013;2013:537–46.
15. Kim HM, Smith EG, Stano CM, Ganoczy D, Zivin K, Walters H, et al. Validation of key
behaviourally based mental health diagnoses in administrative data: suicide attempt, alcohol abuse,
illicit drug abuse and tobacco use. BMC Health Serv Res. 2012 Jan 23;12(1):18.
16. Navathe AS, Zhong F, Lei VJ, Chang FY, Sordo M, Topaz M, et al. Hospital Readmission and
Social Risk Factors Identified from Physician Notes. Health Serv Res [Internet]. 2017; Available
from: http://www.ncbi.nlm.nih.gov/pubmed/28295260
17. Grasso C, McDowell MJ, Goldhammer H, Keuroghlian AS. Planning and implementing sexual
orientation and gender identity data collection in electronic health records. J Am Med Inform
Assoc. 2019 Jan 1;26(1):66–70.
18. Berry S, Barovechio P, Mabile E, Tran T. Enhancing State Medical Home Capacity through a Care
Coordination Technical Assistance Model. Matern Child Health J. 2017 Oct 1;21(10):1949–60.
19. Alyousef B, Carayon P, Hoonakker P, Hundt AS, Salek D, Tomcavage J. Obstacles Experienced
by Care Managers in Managing Information for the Care of Chronically Ill Patients. Int J Human–
Computer Interact. 2017 Apr 3;33(4):313–21.
20. Goetz Goldberg D, Kuzel AJ, Feng LB, DeShazo JP, Love LE. EHRs in primary care practices:
benefits, challenges, and successful strategies. Am J Manag Care. 2012 Feb 1;18(2):e48-54.
21. Natter MD, Quan J, Ortiz DM, Bousvaros A, Ilowite NT, Inman CJ, et al. An i2b2-based,
generalizable, open source, self-scaling chronic disease registry. J Am Med Inform Assoc. 2013
Jan 1;20(1):172–9.
22. Cifuentes M, Davis M, Fernald D, Gunn R, Dickinson P, Cohen DJ. Electronic Health Record
Challenges, Workarounds, and Solutions Observed in Practices Integrating Behavioral Health and
Primary Care. J Am Board Fam Med. 2015 Sep 1;28(Supplement 1):S63–72.
23. Watts B, Lawrence RH, Drawz P, Carter C, Shumaker AH, Kern EF. Development and
Implementation of Team-Based Panel Management Tools: Filling the Gap between Patient and
Population Information Systems. Popul Health Manag. 2016 Aug;19(4):232–9.
24. Finkelstein J, Barr MS, Kothari PP, Nace DK, Quinn M. Patient-centered medical home
cyberinfrastructure current and future landscape. Am J Prev Med. 2011 May;40(5 Suppl 2):S225-
233.
25. Krist AH, Beasley JW, Crosson JC, Kibbe DC, Klinkman MS, Lehmann CU, et al. Electronic
health record functionality needed to better support primary care. J Am Med Inform Assoc
JAMIA. 2014 Oct;21(5):764–71.
26. Dowding D, Randell R, Gardner P, Fitzpatrick G, Dykes P, Favela J, et al. Dashboards for
improving patient care: Review of the literature. Int J Med Inf. 2015 Feb 1;84(2):87–100.

152
27. Caban JJ, Gotz D. Visual analytics in healthcare--opportunities and research challenges. J Am Med
Inform Assoc JAMIA. 2015;22(2):260–2.
28. Wu DTY, Chen AT, Manning JD, Levy-Fix G, Backonja U, Borland D, et al. Evaluating visual
analytics for health informatics applications: a systematic review from the American Medical
Informatics Association Visual Analytics Working Group Task Force on Evaluation. J Am Med
Inform Assoc. 2019 Apr 1;26(4):314–23.
29. Gottlieb LM, Tirozzi KJ, Manchanda R, Burns AR, Sandel MT. Moving electronic medical
records upstream: incorporating social determinants of health. Am J Prev Med. 2015
Feb;48(2):215–8.
30. Weir CR, Staggers N, Gibson B, Doing-Harris K, Barrus R, Dunlea R. A qualitative evaluation of
the crucial attributes of contextual Information necessary in EHR design to support patient-
centered medical home care. BMC Med Inform Decis Mak [Internet]. 2015 Apr 16 [cited 2018 Oct
15];15. Available from: https://www.ncbi.nlm.nih.gov/pmc/articles/PMC4416274/
31. Cohen MS, Chen YQ, McCauley M, Gamble T, Hosseinipour MC, Kumarasamy N, et al.
Antiretroviral Therapy for the Prevention of HIV-1 Transmission. N Engl J Med. 2016 Sep
1;375(9):830–9.
32. Health Care Spending in the United States and Other High-Income Countries | Health Care Reform
| JAMA | JAMA Network [Internet]. [cited 2019 May 24]. Available from:
https://jamanetwork.com/journals/jama/article-abstract/2674671
33. Papanicolas I, Woskie LR, Jha AK. Health Care Spending in the United States and Other High-
Income Countries. JAMA. 2018 Mar 13;319(10):1024–39.
34. Berwick DM, Nolan TW, Whittington J. The Triple Aim: Care, Health, And Cost. Health Aff
(Millwood). 2008 May 1;27(3):759–69.
35. Meek JA. Affordable Care Act: predictive modeling challenges and opportunities for case
management. Prof Case Manag. 2012;17(1):15–23.
36. Joynt Maddox KE, Epstein AM, Samson LW, Chen LM. Performance And Participation Of
Physicians In Year One Of Medicare’s Value-Based Payment Modifier Program. Health Aff
(Millwood). 2017 Dec 1;36(12):2175–84.
37. Buttorff C, Ruder T, Bauman M. Multiple Chronic Conditions in the United States [Internet].
RAND Corporation; 2017 [cited 2019 Mar 25]. Available from:
http://www.rand.org/pubs/tools/TL221.html
38. Wagner EH, Groves T. Care for chronic diseases. BMJ. 2002 Oct 26;325(7370):913–4.
39. Adler NE, Stead WW. Patients in Context — EHR Capture of Social and Behavioral Determinants
of Health. N Engl J Med. 2015;372(8):698–701.
40. Doran KM, Misa EJ, Shah NR. Housing as Health Care — New York’s Boundary-Crossing
Experiment. N Engl J Med. 2013;369(25):2374–7.

153
41. Hicks PL, Mulvey KP, Chander G, Fleishman JA, Josephs JS, Korthuis PT, et al. The impact of
illicit drug use and substance abuse treatment on adherence to HAART. AIDS Care. 2007 Oct
1;19(9):1134–40.
42. Kangovi S, Barg FK, Carter T, Long JA, Shannon R, Grande D. Understanding why patients of
low socioeconomic status prefer hospitals over ambulatory care. Health Aff Proj Hope. 2013
Jul;32(7):1196–203.
43. Meyers DS. Primary Care: Too Important to Fail. Ann Intern Med. 2009 Feb 17;150(4):272.
44. Margolius D, Bodenheimer T. Transforming primary care: from past practice to the practice of the
future. Health Aff Proj Hope. 2010 May;29(5):779–84.
45. Hong CS, Siegel AL, Ferris TG. Caring for high-need, high-cost patients: what makes for a
successful care management program? Issue Brief Commonw Fund. 2014 Aug;19:1–19.
46. CHCS. Care Management Definition and Framework [Internet]. Center for Health Care Strategies.
2007 [cited 2019 May 25]. Available from: https://www.chcs.org/resource/care-management-
definition-and-framework/
47. Basu S, Phillips RS, Bitton A, Song Z, Landon BE. Medicare Chronic Care Management
Payments and Financial Returns to Primary Care Practices: A Modeling Study. Ann Intern Med.
2015 Oct 20;163(8):580–8.
48. Medicare the USC for, Boulevard MS 7500 S, Baltimore, Baltimore M 21244 7500 SB, Usa M
21244. Comprehensive Primary Care Initiative | Center for Medicare & Medicaid Innovation
[Internet]. [cited 2018 Oct 19]. Available from:
https://innovation.cms.gov/initiatives/comprehensive-primary-care-initiative/
49. Raven MC, Kushel M, Ko MJ, Penko J, Bindman AB. The Effectiveness of Emergency
Department Visit Reduction Programs: A Systematic Review. Ann Emerg Med. 2016;68(4):467-
483.e15.
50. Wesson D, Kitzman H, Halloran KH, Tecson K. Innovative Population Health Model Associated
With Reduced Emergency Department Use And Inpatient Hospitalizations. Health Aff
(Millwood). 2018 Apr 1;37(4):543–50.
51. Paino M, Aletraris L, Roman P. The Relationship Between Client Characteristics and Wraparound
Services in Substance Use Disorder Treatment Centers. J Stud Alcohol Drugs. 2016
Jan;77(1):160–9.
52. Vest JR, Harris LE, Haut DP, Halverson PK, Menachemi N. Indianapolis Provider’s Use Of
Wraparound Services Associated With Reduced Hospitalizations And Emergency Department
Visits. Health Aff (Millwood). 2018 Oct 1;37(10):1555–61.
53. Angstman KB, Horn JL, Bernard ME, Kresin MM, Klavetter EW, Maxson J, et al. Family
Medicine Panel Size with Care Teams: Impact on Quality. J Am Board Fam Med JABFM. 2016
Aug;29(4):444–51.

154
54. Chen EH, Thom DH, Hessler DM, Phengrasamy L, Hammer H, Saba G, et al. Using the Teamlet
Model to improve chronic care in an academic primary care practice. J Gen Intern Med. 2010
Sep;25 Suppl 4:S610-614.
55. Altschuler J, Margolius D, Bodenheimer T, Grumbach K. Estimating a Reasonable Patient Panel
Size for Primary Care Physicians With Team-Based Task Delegation. Ann Fam Med. 2012 Sep
1;10(5):396–400.
56. Panel Size: How Many Patients Can One Doctor Manage? -- FPM [Internet]. [cited 2018 Aug 27].
Available from: https://www.aafp.org/fpm/2007/0400/p44.html
57. Dahrouge S, Hogg W, Younger J, Muggah E, Russell G, Glazier RH. Primary Care Physician
Panel Size and Quality of Care: A Population-Based Study in Ontario, Canada. Ann Fam Med.
2016 Jan 1;14(1):26–33.
58. Tai-Seale M, Downing NL, Jones VG, Milani RV, Zhao B, Clay B, et al. Technology-Enabled
Consumer Engagement: Promising Practices At Four Health Care Delivery Organizations. Health
Aff (Millwood). 2019 Mar 1;38(3):383–90.
59. Hood CM, Gennuso KP, Swain GR, Catlin BB. County Health Rankings: Relationships Between
Determinant Factors and Health Outcomes. Am J Prev Med. 2016 Feb;50(2):129–35.
60. Gundersen C, Ziliak JP. Food Insecurity And Health Outcomes. Health Aff Proj Hope. 2015
Nov;34(11):1830–9.
61. Leigh-Hunt N, Bagguley D, Bash K, Turner V, Turnbull S, Valtorta N, et al. An overview of
systematic reviews on the public health consequences of social isolation and loneliness. Public
Health. 2017 Nov;152:157–71.
62. Capturing Social and Behavioral Domains in Electronic Health Records: Phase 1 [Internet].
Institute of Medicine. [cited 2016 Oct 18]. Available from:
http://www.nationalacademies.org/hmd/Reports/2014/Capturing-Social-and-Behavioral-Domains-
in-Electronic-Health-Records-Phase-1.aspx
63. Feller DJ, Akiyama MJ, Gordon P, Agins BD. Readmissions in HIV-Infected Inpatients: A Large
Cohort Analysis. J Acquir Immune Defic Syndr 1999. 2016 Apr 1;71(4):407–12.
64. Bates DW, Saria S, Ohno-Machado L, Shah A, Escobar G. Big data in health care: using analytics
to identify and manage high-risk and high-cost patients. Health Aff Proj Hope. 2014;33(7):1123–
31.
65. Osborn R, Moulds D, Schneider EC, Doty MM, Squires D, Sarnak DO. Primary Care Physicians
In Ten Countries Report Challenges Caring For Patients With Complex Health Needs. Health Aff
(Millwood). 2015 Dec 1;34(12):2104–12.
66. Ranade-Kharkar P, Weir C, Norlin C, Collins SA, Scarton LA, Baker GB, et al. Information needs
of physicians, care coordinators, and families to support care coordination of children and youth
with special health care needs (CYSHCN). J Am Med Inform Assoc. 2017 Sep 1;24(5):933–41.

155
67. Mamykina L, Jiang S, Collins SA, Twohig B, Hirsh J, Hripcsak G, et al. Revealing structures in
narratives: A mixed-methods approach to studying interdisciplinary handoff in critical care. J
Biomed Inform. 2016 Aug 1;62:117–24.
68. Jiang SY, Murphy A, Heitkemper EM, Hum RS, Kaufman DR, Mamykina L. Impact of an
electronic handoff documentation tool on team shared mental models in pediatric critical care. J
Biomed Inform. 2017;69:24–32.
69. Gordon P, Camhi E, Hesse R, Odlum M, Schnall R, Rodriguez M, et al. Processes and outcomes
of developing a continuity of care document for use as a personal health record by people living
with HIV/AIDS in New York City. Int J Med Inf. 2012 Oct 1;81(10):e63–73.
70. Heisey-Grove DM, Wall HK, Wright JS. Electronic clinical quality measure reporting challenges:
findings from the Medicare EHR Incentive Program’s Controlling High Blood Pressure Measure. J
Am Med Inform Assoc JAMIA. 2018 01;25(2):127–34.
71. Hoque DME, Kumari V, Hoque M, Ruseckaite R, Romero L, Evans SM. Impact of clinical
registries on quality of patient care and clinical outcomes: A systematic review. PLoS ONE
[Internet]. 2017 Sep 8 [cited 2018 Nov 16];12(9). Available from:
https://www.ncbi.nlm.nih.gov/pmc/articles/PMC5591016/
72. Tai B, Hu L, Ghitza UE, Sparenborg S, VanVeldhuisen P, Lindblad R. Patient registries for
substance use disorders. Subst Abuse Rehabil. 2014 Jul 24;5:81–6.
73. Khan L, Mincemoyer S, Gabbay RA. Diabetes registries: where we are and where are we headed?
Diabetes Technol Ther. 2009 Apr;11(4):255–62.
74. Dorr DA, Cohen DJ, Adler-Milstein J. Data-Driven Diffusion Of Innovations: Successes And
Challenges In 3 Large-Scale Innovative Delivery Models. Health Aff (Millwood). 2018 Feb
1;37(2):257–65.
75. Cohen GR, Adler-Milstein J. Meaningful use care coordination criteria: Perceived barriers and
benefits among primary care providers. J Am Med Inform Assoc. 2016 Apr 1;23(e1):e146–51.
76. Meyer GS, Nelson EC, Pryor DB, James B, Swensen SJ, Kaplan GS, et al. More quality measures
versus measuring what matters: a call for balance and parsimony. BMJ Qual Saf. 2012
Nov;21(11):964–8.
77. Peikes D, Dale S, Ghosh A, Taylor EF, Swankoski K, O’Malley AS, et al. The Comprehensive
Primary Care Initiative: Effects On Spending, Quality, Patients, And Physicians. Health Aff
(Millwood). 2018 May 23;37(6):890–9.
78. Clarke A, Adamson J, Watt I, Sheard L, Cairns P, Wright J. The impact of electronic records on
patient safety: a qualitative study. BMC Med Inform Decis Mak. 2016;16:62–62.
79. Gibbons LJ, Stoddart K. “Fast and frugal heuristics”: Clinical decision making in the Emergency
Department. Int Emerg Nurs. 2018 May 2;
80. Grant RW, Ashburner JM, Hong CS, Hong CC, Chang Y, Barry MJ, et al. Defining patient
complexity from the primary care physician’s perspective: a cohort study. Ann Intern Med. 2011
Dec 20;155(12):797–804.

156
81. Zhou H, Della PR, Roberts P, Goh L, Dhaliwal SS. Utility of models to predict 28-day or 30-day
unplanned hospital readmissions: an updated systematic review. BMJ Open. 2016
27;6(6):e011060.
82. Ross RL, Sachdeva B, Wagner J, Ramsey K, Dorr DA. Perceptions of Risk Stratification
Workflows in Primary Care. Healthcare [Internet]. 2017 Oct 21 [cited 2018 Aug 23];5(4).
Available from: https://www.ncbi.nlm.nih.gov/pmc/articles/PMC5746712/
83. Reddy A, Sessums L, Gupta R, Jin J, Day T, Finke B, et al. Risk Stratification Methods and
Provision of Care Management Services in Comprehensive Primary Care Initiative Practices. Ann
Fam Med. 2017 Sep 1;15(5):451–4.
84. Huckel Schneider C, Gillespie JA, Wilson A. Implementing system-wide risk stratification
approaches: A review of critical success and failure factors. Health Serv Manage Res.
2017;30(2):72–84.
85. Dolan JG. Multi-criteria clinical decision support: A primer on the use of multiple criteria decision
making methods to promote evidence-based, patient-centered healthcare. The patient.
2010;3(4):229–48.
86. Ashour OM, Okudan GE. Fuzzy AHP and utility theory based patient sorting in emergency
departments. Int J Collab Enterp. 2010 Jan 1;1(3–4):332–58.
87. Holzinger A. Interactive machine learning for health informatics: when do we need the human-in-
the-loop? Brain Inform. 2016 Jun 1;3(2):119–31.
88. Loo TS, Davis RB, Lipsitz LA, Irish J, Bates CK, Agarwal K, et al. Electronic medical record
reminders and panel management to improve primary care of elderly patients. Arch Intern Med.
2011 Sep 26;171(17):1552–8.
89. Zhou YY, Unitan R, Wang JJ, Garrido T, Chin HL, Turley MC, et al. Improving population care
with an integrated electronic panel support tool. Popul Health Manag. 2011 Feb;14(1):3–9.
90. Schmittdiel JA, Gopalan A, Lin MW, Banerjee S, Chau CV, Adams AS. Population Health
Management for Diabetes: Health Care System-Level Approaches for Improving Quality and
Addressing Disparities. Curr Diab Rep. 2017 May;17(5):31.
91. Beasley JW, Wetterneck TB, Temte J, Lapin JA, Smith P, Rivera-Rodriguez AJ, et al. Information
Chaos in Primary Care: Implications for Physician Performance and Patient Safety. J Am Board
Fam Med. 2011 Nov 1;24(6):745–51.
92. Young HM, Nesbitt TS. Increasing the Capacity of Primary Care Through Enabling Technology. J
Gen Intern Med. 2017 Apr 1;32(4):398–403.
93. Mishuris RG, Yoder J, Wilson D, Mann D. Integrating data from an online diabetes prevention
program into an electronic health record and clinical workflow, a design phase usability study.
BMC Med Inform Decis Mak. 2016 Jul 11;16(1):88.
94. Halverson CA. Activity Theory and Distributed Cognition: Or What Does CSCW Need to DO
with Theories? Comput Support Coop Work CSCW. 2002 Mar 1;11(1):243–67.

157
95. Gray K, Sockolow P. Conceptual Models in Health Informatics Research: A Literature Review
and Suggestions for Development. JMIR Med Inform [Internet]. 2016 Feb 24 [cited 2019 Mar
26];4(1). Available from: https://www.ncbi.nlm.nih.gov/pmc/articles/PMC4785238/
96. Gemert-Pijnen JE van, Nijland N, Limburg M van, Ossebaard HC, Kelders SM, Eysenbach G, et
al. A Holistic Framework to Improve the Uptake and Impact of eHealth Technologies. J Med
Internet Res. 2011;13(4):e111.
97. Gaglio B, Shoup JA, Glasgow RE. The RE-AIM Framework: A Systematic Review of Use Over
Time. Am J Public Health. 2013 Jun;103(6):e38–46.
98. Sittig DF, Singh H. A New Socio-technical Model for Studying Health Information Technology in
Complex Adaptive Healthcare Systems. Qual Saf Health Care. 2010;19(Suppl 3):i68–74.
99. Odlum M, Gordon P, Camhi E, Valdez E, Bakken S. Exploring factors related to the adoption and acceptance of an internet-based electronic personal health management tool (EPHMT) in a low
income, special needs population of people living with HIV and AIDS in New York City. Stud
Health Technol Inform. 2014;201:145–52.
100. Nguyen T, Lim CP, Nguyen ND, Gordon-Brown L, Nahavandi S. A Review of Situation
Awareness Assessment Approaches in Aviation Environments. ArXiv180308067 Cs [Internet].
2018 Mar 6 [cited 2019 Mar 12]; Available from: http://arxiv.org/abs/1803.08067
101. Endsley MR. Situation Awareness Misconceptions and Misunderstandings. J Cogn Eng Decis
Mak. 2015 Mar 1;9(1):4–32.
102. Endsley MR. Toward a Theory of Situation Awareness in Dynamic Systems. Hum Factors. 1995
Mar 1;37(1):32–64.
103. Roberts LD, Howell JA, Seaman K. Give Me a Customizable Dashboard: Personalized Learning
Analytics Dashboards in Higher Education. Technol Knowl Learn. 2017 Oct 1;22(3):317–33.
104. Yoo Y, Lee H, Jo I-H, Park Y. Educational Dashboards for Smart Learning: Review of Case
Studies. In: Chen G, Kumar V, Kinshuk, Huang R, Kong SC, editors. Emerging Issues in Smart
Learning. Berlin, Heidelberg: Springer; 2015. p. 145–55. (Lecture Notes in Educational
Technology).
105. Madey GR, Barabási A-L, Chawla NV, Gonzalez M, Hachen D, Lantz B, et al. Enhanced
Situational Awareness: Application of DDDAS Concepts to Emergency and Disaster
Management. In: Shi Y, van Albada GD, Dongarra J, Sloot PMA, editors. Computational Science
– ICCS 2007. Berlin, Heidelberg: Springer; 2007. p. 1090–7. (Lecture Notes in Computer
Science).
106. Li N, Cartwright S, Shekhar Nittala A, Sharlin E, Costa Sousa M. Flying Frustum: A Spatial
Interface for Enhancing Human-UAV Awareness. In: Proceedings of the 3rd International
Conference on Human-Agent Interaction [Internet]. New York, NY, USA: ACM; 2015 [cited 2019
Dec 18]. p. 27–31. (HAI ’15). Available from: http://doi.acm.org/10.1145/2814940.2814956
107. Yuan X, She M, Li Z, Zhang Y, Wu X. Mutual awareness: Enhanced by interface design and
improving team performance in incident diagnosis under computerized working environment. Int J
Ind Ergon. 2016 Jul 1;54:65–72.

158
108. Zhang G, Sun K, Chen H, Carroll R, Liu Y. Application of synchrophasor measurements for
improving operator situational awareness. In: 2011 IEEE Power and Energy Society General
Meeting. 2011. p. 1–8.
109. Timonen J, Lääperi L, Rummukainen L, Puuska S, Vankka J. Situational awareness and
information collection from critical infrastructure. In: 2014 6th International Conference On Cyber
Conflict (CyCon 2014). 2014. p. 157–73.
110. Kononenko O, Baysal O, Holmes R, Godfrey MW. DASHboards: Enhancing Developer
Situational Awareness. In: Companion Proceedings of the 36th International Conference on
Software Engineering [Internet]. New York, NY, USA: ACM; 2014 [cited 2019 Dec 19]. p. 552–
555. (ICSE Companion 2014). Available from: http://doi.acm.org/10.1145/2591062.2591075
111. Adams B, Suykens F. Astute: Increased Situational Awareness through Proactive Decision
Support and Adaptive Map-Centric User Interfaces. In: 2013 European Intelligence and Security
Informatics Conference. 2013. p. 289–93.
112. Essa A, Ayad H. Student Success System: Risk Analytics and Data Visualization Using Ensembles
of Predictive Models. In: Proceedings of the 2Nd International Conference on Learning Analytics
and Knowledge [Internet]. New York, NY, USA: ACM; 2012 [cited 2019 Dec 19]. p. 158–161.
(LAK ’12). Available from: http://doi.acm.org/10.1145/2330601.2330641
113. Cao Y, Theune M, Nijholt A. Towards Cognitive-Aware Multimodal Presentation: The Modality
Effects in High-Load HCI. In: Harris D, editor. Engineering Psychology and Cognitive
Ergonomics. Berlin, Heidelberg: Springer; 2009. p. 3–12. (Lecture Notes in Computer Science).
114. Heather Gluyas S-JH. Understanding situation awareness and its importance in patient safety
[Internet]. 2015 [cited 2019 Oct 3]. Available from: https://journals.rcni.com/nursing-
standard/understanding-situation-awareness-and-its-importance-in-patient-safety-ns.30.34.50.s47
115. Fore AM, Sculli GL. A concept analysis of situational awareness in nursing. J Adv Nurs. 2013
Dec;69(12):2613–21.
116. Fioratou E, Flin R, Glavin R, Patey R. Beyond monitoring: distributed situation awareness in
anaesthesia. BJA Br J Anaesth. 2010 Jul 1;105(1):83–90.
117. Parush A, Kramer C, Foster-Hunt T, Momtahan K, Hunter A, Sohmer B. Communication and
team situation awareness in the OR: Implications for augmentative information display. J Biomed
Inform. 2011 Jun 1;44(3):477–85.
118. Gillespie BM, Gwinner K, Fairweather N, Chaboyer W. Building shared situational awareness in
surgery through distributed dialog. J Multidiscip Healthc. 2013 Mar 20;6:109–18.
119. Graafland M, Schraagen JMC, Boermeester MA, Bemelman WA, Schijven MP. Training
situational awareness to reduce surgical errors in the operating room. BJS. 2015;102(1):16–23.
120. Engelman D, Higgins TL, Talati R, Grimsman J. Maintaining situational awareness in a cardiac
intensive care unit. J Thorac Cardiovasc Surg. 2014;147(3):1105–6.
121. Reader TW, Flin R, Mearns K, Cuthbertson BH. Team situation awareness and the anticipation of
patient progress during ICU rounds. BMJ Qual Saf. 2011 Dec 1;20(12):1035–42.

159
122. Frankel A, Gardner R, Maynard L, Kelly A. Using the Communication and Teamwork Skills
(CATS) Assessment to Measure Health Care Team Performance. Jt Comm J Qual Patient Saf.
2007 Sep 1;33(9):549–58.
123. Clay-Williams R, Braithwaite J. Determination of health-care teamwork training competencies: a
Delphi study. Int J Qual Health Care. 2009 Dec 1;21(6):433–40.
124. Morgan P, Tregunno D, Brydges R, Pittini R, Tarshis J, Kurrek M, et al. Using a situational
awareness global assessment technique for interprofessional obstetrical team training with high
fidelity simulation. J Interprof Care. 2015 Jan 2;29(1):13–9.
125. Olson D, Mathes R, Paladini M, Konty K. Defining Public Health Situation Awareness –
Outcomes and Metrics for Evaluation. Online J Public Health Inform [Internet]. 2013 [cited 2019
Oct 3];5(1). Available from: https://www.ncbi.nlm.nih.gov/pmc/articles/PMC3692849/
126. Grannis SJ, Stevens KC, Merriwether R. Leveraging Health Information Exchange to Support
Public Health Situational Awareness: The Indiana Experience. Online J Public Health Inform
[Internet]. 2010 Oct 29 [cited 2019 Oct 3];2(2). Available from:
https://www.ncbi.nlm.nih.gov/pmc/articles/PMC3615763/
127. Singh H, Giardina TD, Petersen LA, Smith M, Wilson L, Dismukes K, et al. Exploring Situational
Awareness in Diagnostic Errors in Primary Care. BMJ Qual Saf. 2012;21(1):30–8.
128. Plaisant C, Milash B, Rose A, Widoff S, Shneiderman B. LifeLines: Visualizing Personal
Histories. In: Proceedings of the SIGCHI Conference on Human Factors in Computing Systems
[Internet]. New York, NY, USA: ACM; 1996 [cited 2018 Aug 27]. p. 221–227. (CHI ’96).
Available from: http://doi.acm.org/10.1145/238386.238493
129. Similan [Internet]. [cited 2018 Aug 27]. Available from: http://www.cs.umd.edu/hcil/similan/
130. Manning JD, Marciano BE, Cimino JJ. Visualizing the Data – Using Lifelines2 to Gain Insights
from Data Drawn from a Clinical Data Repository. AMIA Summits Transl Sci Proc.
2013;2013:168–72.
131. Hinum K. Gravi : Interactive Information Visualization to Explore Highly Structured Temporal
Data. J Univers Comput Sci. 2005;11:1792–1805.
132. Project :: TimeRider [Internet]. [cited 2019 Nov 29]. Available from:
http://ieg.ifs.tuwien.ac.at/research/timerider/
133. Franklin A, Gantela S, Shifarraw S, Johnson TR, Robinson DJ, King BR, et al. Dashboard
visualizations: Supporting real-time throughput decision-making. J Biomed Inform. 2017 Jul
1;71:211–21.
134. Tariq A, Baysari M, Pedersen CH, Andersen MV, Larsen MM, Shahi M, et al. Examining barriers
to healthcare providers’ adoption of a hospital-wide electronic patient journey board. Int J Med Inf.
2018 Jun 1;114:18–26.
135. Rasmussen R. Electronic Whiteboards in Emergency Medicine: A Systematic Review. In:
Proceedings of the 2Nd ACM SIGHIT International Health Informatics Symposium [Internet].

160
New York, NY, USA: ACM; 2012 [cited 2018 Aug 22]. p. 483–492. (IHI ’12). Available from:
http://doi.acm.org/10.1145/2110363.2110418
136. Croon RD, Klerkx J, Duval E. Design and Evaluation of an Interactive Proof-of-Concept
Dashboard for General Practitioners. In: 2015 International Conference on Healthcare Informatics.
2015. p. 150–9.
137. Waitman LR, Phillips IE, McCoy AB, Danciu I, Halpenny RM, Nelsen CL, et al. Adopting Real-
Time Surveillance Dashboards as a Component of an Enterprisewide Medication Safety Strategy.
Jt Comm J Qual Patient Saf. 2011 Jul 1;37(7):326-AP4.
138. Alharbey R. Predictive Analytics Dashboard for Monitoring Patients in Advanced Stages of
COPD. In: 2016 49th Hawaii International Conference on System Sciences (HICSS). 2016. p.
3455–61.
139. Badgeley MA, Shameer K, Glicksberg BS, Tomlinson MS, Levin MA, McCormick PJ, et al.
EHDViz: clinical dashboard development using open-source technologies. BMJ Open [Internet].
2016 Mar 24 [cited 2018 Aug 27];6(3). Available from:
https://www.ncbi.nlm.nih.gov/pmc/articles/PMC4809078/
140. Bakos KK, Zimmermann D, Moriconi D. Implementing the Clinical Dashboard at VCUHS. NI
2012 11th Int Congr Nurs Inform June 23-27 2012 Montr Can [Internet]. 2012 Jun 23 [cited 2018
Aug 28];2012. Available from: https://www.ncbi.nlm.nih.gov/pmc/articles/PMC3799105/
141. Tan YM, Hii J, Chan K, Sardual R, Mah B. An electronic dashboard to improve nursing care. Stud
Health Technol Inform. 2013;192:190–4.
142. Dowding D, Merrill JA, Onorato N, Barrón Y, Rosati RJ, Russell D. The impact of home care
nurses’ numeracy and graph literacy on comprehension of visual display information: implications
for dashboard design. J Am Med Inform Assoc. 2018 Feb 1;25(2):175–82.
143. Sittig DF, Wright A, Osheroff JA, Middleton B, Teich JM, Ash JS, et al. Grand challenges in
clinical decision support. J Biomed Inform. 2008;41(2):387–92.
144. Stewart R, Ombler F, Hansen P, Naden R, Hendry A. A new process for creating points systems
for prioritising patients for elective health services. Clin Gov Int J. 2012 Jul 27;17(3):200–9.
145. Kamath PS, Kim WR. The model for end-stage liver disease (MELD). Hepatology. 2007 Mar
1;45(3):797–805.
146. Longaray AA, Ensslin L, Munhoz P, Tondolo V, Quadro R, Dutra A, et al. A Systematic
Literature Review Regarding the Use of Multicriteria Methods towards Development of Decision
Support Systems in Health Management. Procedia Comput Sci. 2016 Jan 1;100:701–10.
147. Adunlin G, Diaby V, Xiao H. Application of multicriteria decision analysis in health care: a
systematic review and bibliometric analysis. Health Expect. 2015 Dec 1;18(6):1894–905.
148. Edwards W, Barron FH. SMARTS and SMARTER: Improved Simple Methods for Multiattribute
Utility Measurement. Organ Behav Hum Decis Process. 1994 Dec 1;60(3):306–25.

161
149. Ashour OM, Okudan Kremer GE. A Simulation Analysis of the Impact of FAHP-MAUT Triage
Algorithm on the Emergency Department Performance Measures. Expert Syst Appl. 2013
Jan;40(1):177–187.
150. Claudio D, Kremer G. Utility function-based patient prioritisation in the emergency department.
Eur J Ind Eng. 2010 Aug 17;4:59–77.
151. Claudio D, Kremer GEO, Bravo-Llerena W, Freivalds A. A dynamic multi-attribute utility theory–
based decision support system for patient prioritization in the emergency department. IIE Trans
Healthc Syst Eng. 2014 Jan 2;4(1):1–15.
152. Wall E, Das S, Chawla R, Kalidindi B, Brown ET, Endert A. Podium: Ranking Data Using Mixed-
Initiative Visual Analytics. IEEE Trans Vis Comput Graph. 2018 Jan;24(1):288–97.
153. Sciascio C di, Sabol V, Veas EE. uRank: Exploring Document Recommendations through an Interactive User-Driven Approach. IntRS RecSys [Internet]. 2015 [cited 2018 Oct 16]; Available
from: https://graz.pure.elsevier.com/de/publications/urank-exploring-document-recommendations-
through-an-interactive-u
154. Dimara E, Valdivia P, Kinkeldey C. DCPAIRS: A Pairs Plot Based Decision Support System. In
2017 [cited 2018 Oct 16]. Available from: https://hal.inria.fr/hal-01516470/document
155. Rao R, Card SK. The Table Lens: Merging Graphical and Symbolic Representations in an
Interactive Focus + Context Visualization for Tabular Information. In: Proceedings of the SIGCHI
Conference on Human Factors in Computing Systems [Internet]. New York, NY, USA: ACM;
1994 [cited 2018 Oct 16]. p. 318–322. (CHI ’94). Available from:
http://doi.acm.org/10.1145/191666.191776
156. Gratzl S, Lex A, Gehlenborg N, Pfister H, Streit M. LineUp: visual analysis of multi-attribute
rankings. IEEE Trans Vis Comput Graph. 2013 Dec;19(12):2277–86.
157. Multiple Chronic Conditions | CDC [Internet]. 2019 [cited 2019 Mar 25]. Available from:
https://www.cdc.gov/chronicdisease/about/multiple-chronic.htm
158. Chapter 3. Care Coordination Measurement Framework | Agency for Health Research and Quality
[Internet]. [cited 2020 Mar 10]. Available from:
https://www.ahrq.gov/ncepcr/care/coordination/atlas/chapter3.html
159. Rudin RS, Bates DW. Let the left hand know what the right is doing: a vision for care coordination
and electronic health records. J Am Med Inform Assoc. 2014 Jan 1;21(1):13–6.
160. Mellins CA, Havens JF, McDonnell C, Lichtenstein C, Uldall K, Chesney M, et al. Adherence to
antiretroviral medications and medical care in HIV-infected adults diagnosed with mental and
substance abuse disorders. AIDS Care. 2009 Feb;21(2):168–77.
161. Irvine MK, Chamberlin SA, Robbins RS, Kulkarni SG, Robertson MM, Nash D. Come as You
Are: Improving Care Engagement and Viral Load Suppression Among HIV Care Coordination
Clients with Lower Mental Health Functioning, Unstable Housing, and Hard Drug Use. AIDS
Behav. 2017 Jun;21(6):1572–9.

162
162. Beach MC, Keruly J, Moore RD. Is the Quality of the Patient-Provider Relationship Associated
with Better Adherence and Health Outcomes for Patients with HIV? J Gen Intern Med.
2006;21(6):661–5.
163. Ghidei L, Simone M, Salow M, Zimmerman K, Paquin AM, Skarf LM, et al. Aging,
Antiretrovirals, and Adherence: A Meta Analysis of Adherence among Older HIV-Infected
Individuals. Drugs Aging [Internet]. 2013 Oct [cited 2018 Oct 25];30(10). Available from:
https://www.ncbi.nlm.nih.gov/pmc/articles/PMC3844933/
164. Shubber Z, Mills EJ, Nachega JB, Vreeman R, Freitas M, Bock P, et al. Patient-Reported Barriers
to Adherence to Antiretroviral Therapy: A Systematic Review and Meta-Analysis. PLOS Med.
2016 Nov 29;13(11):e1002183.
165. Perer A, Gotz D. Data-driven Exploration of Care Plans for Patients. In: CHI ’13 Extended
Abstracts on Human Factors in Computing Systems [Internet]. New York, NY, USA: ACM; 2013
[cited 2018 Aug 27]. p. 439–444. (CHI EA ’13). Available from:
http://doi.acm.org/10.1145/2468356.2468434
166. Gotz D, Wongsuphasawat K. Interactive Intervention Analysis. AMIA Annu Symp Proc. 2012
Nov 3;2012:274–80.
167. Campbell H, Hotchkiss R, Bradshaw N, Porteous M. Integrated care pathways. BMJ. 1998 Jan
10;316(7125):133–7.
168. Schrijvers G, van Hoorn A, Huiskes N. The care pathway: concepts and theories: an introduction.
Int J Integr Care [Internet]. 2012 Sep 18 [cited 2018 Nov 19];12(Special Edition Integrated Care
Pathways). Available from: https://www.ncbi.nlm.nih.gov/pmc/articles/PMC3602959/
169. Vawdrey DK, Wilcox LG, Collins S, Feiner S, Mamykina O, Stein DM, et al. Awareness of the
Care Team in Electronic Health Records. Appl Clin Inform. 2011;2(4):395–405.
170. Dalal AK, Schnipper J, Massaro A, Hanna J, Mlaver E, McNally K, et al. A web-based and mobile
patient-centered ‘“microblog”’ messaging platform to improve care team communication in acute
care. J Am Med Inform Assoc. 2017 Apr 1;24(e1):e178–84.
171. He S, Gurr G, Rea S, Thornton SN. Characterizing the Structure of a Patient’s Care Team through
Electronic Encounter Data Analysis. Stud Health Technol Inform. 2015;216:21–5.
172. Feller DJ, Zucker J, Yin MT, Gordon P, Elhadad N. Using Clinical Notes and Natural Language
Processing for Automated HIV Risk Assessment. J Acquir Immune Defic Syndr 1999 [Internet].
2017; Available from: http://www.ncbi.nlm.nih.gov/pubmed/29084046
173. Kasthurirathne SN, Vest JR, Menachemi N, Halverson PK, Grannis SJ. Assessing the capacity of
social determinants of health data to augment predictive models identifying patients in need of
wraparound social services. J Am Med Inform Assoc. 2018 Jan 1;25(1):47–53.
174. Vest JR, Grannis SJ, Haut DP, Halverson PK, Menachemi N. Using structured and unstructured
data to identify patients’ need for services that address the social determinants of health. Int J Med
Inf. 2017 Nov 1;107:101–6.

163
175. Auerbach DI, Chen PG, Friedberg MW, Reid R, Lau C, Buerhaus PI, et al. Nurse-Managed Health
Centers And Patient-Centered Medical Homes Could Mitigate Expected Primary Care Physician
Shortage. Health Aff (Millwood). 2013;32(11):1933–41.
176. Accountable Health Communities Model | Center for Medicare & Medicaid Innovation [Internet].
[cited 2018 May 7]. Available from: https://innovation.cms.gov/initiatives/ahcm/
177. Cantor MN, Thorpe L. Integrating Data On Social Determinants Of Health Into Electronic Health
Records. Health Aff (Millwood). 2018 Apr 1;37(4):585–90.
178. Prince JD, Akincigil A, Hoover DR, Walkup JT, Bilder S, Crystal S. Substance Abuse and
Hospitalization for Mood Disorder Among Medicaid Beneficiaries. Am J Public Health.
2009;99(1):160–7.
179. Ancker JS, Kim M-H, Zhang Y, Zhang Y, Pathak J. The potential value of social determinants of
health in predicting health outcomes. J Am Med Inform Assoc. 2018 Aug 1;25(8):1109–10.
180. Khairat SS, Dukkipati A, Lauria HA, Bice T, Travers D, Carson SS. The Impact of Visualization
Dashboards on Quality of Care and Clinician Satisfaction: Integrative Literature Review. JMIR
Hum Factors. 2018;5(2):e22.
181. Navratil-strawn JL, Hawkins K, Hartley SK, Wells TS, Ozminkowski RJ, Migliori RJ, et al. Using
Propensity to Succeed Modeling to Increase Utilization and Adherence in a Nurse Healthline
Telephone Triage Program. J Ambulatory Care Manage. 2016;39(3):186–98.
182. Hawkins K, Ozminkowski RJ, Mujahid A, Wells TS, Bhattarai GR, Wang S, et al. Propensity to
Succeed: Prioritizing Individuals Most Likely to Benefit from Care Coordination. Popul Health
Manag. 2015 Dec;18(6):402–11.
183. Mattie H, Reidy P, Bachtiger P, Lindemer E, Jouni M, Panch T. A Framework for Predicting
Impactability of Healthcare Interventions Using Machine Learning Methods, Administrative
Claims, Sociodemographic and App Generated Data. ArXiv190500751 Cs Q-Bio Stat [Internet].
2019 Apr 19 [cited 2019 Oct 9]; Available from: http://arxiv.org/abs/1905.00751
184. Hsueh P-YS, Das S, Maduri C, Kelly K. Learning to Personalize from Practice: A Real World
Evidence Approach of Care Plan Personalization based on Differential Patient Behavioral
Responses in Care Management Records. AMIA Annu Symp Proc. 2018 Dec 5;2018:592–601.
185. Riese A, Tarr EE, Baird J, Alverson B. Documentation of Sexual History in Hospitalized
Adolescents on the General Pediatrics Service. Hosp Pediatr. 2018 Apr 1;8(4):179–86.
186. Siegel J, Coleman DL, James T. Integrating Social Determinants of Health Into Graduate Medical
Education: A Call for Action. Acad Med. 2018 Feb;93(2):159.
187. Andermann A. Screening for social determinants of health in clinical care: moving from the
margins to the mainstream. Public Health Rev. 2018 Jun 22;39(1):19.
188. Dubin SN, Nolan IT, Streed CG, Greene RE, Radix AE, Morrison SD. Transgender health care:
improving medical students’ and residents’ training and awareness. Adv Med Educ Pract. 2018
May 21;9:377–91.

164
189. Hatef E, Rouhizadeh M, Tia I, Lasser E, Hill-Briggs F, Marsteller J, et al. Assessing the
Availability of Data on Social and Behavioral Determinants in Structured and Unstructured
Electronic Health Records: A Retrospective Analysis of a Multilevel Health Care System. JMIR
Med Inform. 2019;7(3):e13802.
190. Gottlieb L, Ackerman S, Wing H, Adler N. Evaluation Activities and Influences at the Intersection
of Medical and Social Services. J Health Care Poor Underserved. 2017 Aug 7;28(3):931–51.
191. Clark H, Babu AS, Wiewel EW, Opoku J, Crepaz N. Diagnosed HIV Infection in Transgender
Adults and Adolescents: Results from the National HIV Surveillance System, 2009-2014. AIDS
Behav. 2017;21(9):2774–83.
192. PRAPARE [Internet]. NACHC. [cited 2018 Jun 27]. Available from:
http://www.nachc.org/research-and-data/prapare/
193. Felsen UR, Bellin EY, Cunningham CO, Zingman BS. Development of an electronic medical
record-based algorithm to identify patients with unknown HIV status. AIDS Care.
2014;26(10):1318–25.
194. Felsen UR, Cunningham CO, Heo M, Futterman DC, Weiss JM, Zingman BS. Expanded HIV
Testing Strategy Leveraging the Electronic Medical Record Uncovers Undiagnosed Infection
Among Hospitalized Patients. J Acquir Immune Defic Syndr 1999. 2017;75(1):27–34.
195. Detailed STD Facts - HIV/AIDS & STDs [Internet]. 2017 [cited 2018 Mar 8]. Available from:
https://www.cdc.gov/std/hiv/stdfact-std-hiv-detailed.htm
196. Bejan CA, Angiolillo J, Conway D, Nash R, Shirey-Rice JK, Lipworth L, et al. Mining 100
million notes to find homelessness and adverse childhood experiences: 2 case studies of rare and
severe social determinants of health in electronic health records. J Am Med Inform Assoc. 2018
Jan 1;25(1):61–71.
197. Bates J, Fodeh SJ, Brandt CA, Womack JA. Classification of radiology reports for falls in an HIV
study cohort. J Am Med Inform Assoc. 2016 Apr 1;23(e1):e113–7.
198. Garla V, Re VL, Dorey-Stein Z, Kidwai F, Scotch M, Womack J, et al. The Yale cTAKES
extensions for document classification: architecture and application. J Am Med Inform Assoc.
2011 Sep 1;18(5):614–20.
199. Perotte A, Pivovarov R, Natarajan K, Weiskopf N, Wood F, Elhadad N. Diagnosis code
assignment: models and evaluation metrics. J Am Med Inform Assoc JAMIA. 2014
Apr;21(2):231–7.
200. Pestian JP, Brew C, Matykiewicz P, Hovermale DJ, Johnson N, Cohen KB, et al. A Shared Task
Involving Multi-label Classification of Clinical Free Text. In: Proceedings of the Workshop on
BioNLP 2007: Biological, Translational, and Clinical Language Processing [Internet].
Stroudsburg, PA, USA: Association for Computational Linguistics; 2007 [cited 2017 Aug 29]. p.
97–104. (BioNLP ’07). Available from: http://dl.acm.org/citation.cfm?id=1572392.1572411
201. Zhang Y. A Hierarchical Approach to Encoding Medical Concepts for Clinical Notes. In:
Proceedings of the 46th Annual Meeting of the Association for Computational Linguistics on
Human Language Technologies: Student Research Workshop [Internet]. Stroudsburg, PA, USA:

165
Association for Computational Linguistics; 2008 [cited 2018 Mar 8]. p. 67–72. (HLT-SRWS ’08).
Available from: http://dl.acm.org/citation.cfm?id=1564154.1564168
202. Zhang K, Ma H, Zhao Y, Zan H, Zhuang L. The Comparative Experimental Study of Multilabel
Classification for Diagnosis Assistant Based on Chinese Obstetric EMRs [Internet]. Journal of
Healthcare Engineering. 2018 [cited 2018 Feb 26]. Available from:
https://www.hindawi.com/journals/jhe/2018/7273451/
203. Gibaja E, Ventura S. A Tutorial on Multilabel Learning. ACM Comput Surv. 2015
Apr;47(3):52:1–52:38.
204. Li Y, Lipsky Gorman S, Elhadad N. Section Classification in Clinical Notes Using Supervised
Hidden Markov Model. In: Proceedings of the 1st ACM International Health Informatics
Symposium [Internet]. New York, NY, USA: ACM; 2010 [cited 2018 Jun 28]. p. 744–750. (IHI
’10). Available from: http://doi.acm.org/10.1145/1882992.1883105
205. Yetisgen M, Pellicer E, Crosslin D, Vanderwende L. Automatic Identification of Lifestyle and
Environmental Factors from Social History in Clinical Text. Microsoft Res [Internet]. 2016 Oct 6
[cited 2017 Jul 24]; Available from: https://www.microsoft.com/en-
us/research/publication/automatic-identification-lifestyle-environmental-factors-social-history-
clinical-text/
206. Walsh C, Elhadad N. Modeling Clinical Context: Rediscovering the Social History and Evaluating
Language from the Clinic to the Wards. AMIA Summits Transl Sci Proc. 2014 Apr 7;2014:224–
31.
207. Chen ES, Manaktala S, Sarkar IN, Melton GB. A Multi-Site Content Analysis of Social History
Information in Clinical Notes. AMIA Annu Symp Proc. 2011;2011:227–36.
208. Ehrenfeld J. Collecting Sexual Orientation and Gender Identifiy Data in Electronic Health
Records: Workshop Summary. Washington (DC): Institute of Medicine Board on the Health of
Select Populations.; 2013.
209. Cunningham SD, Kerrigan DL, Jennings JM, Ellen JM. Relationships between perceived STD-
related stigma, STD-related shame and STD screening among a household sample of adolescents.
Perspect Sex Reprod Health. 2009;41(4):225–30.
210. Behforouz HL, Drain PK, Rhatigan JJ. Rethinking the Social History. N Engl J Med.
2014;371(14):1277–9.
211. Srivastava R. Complicated Lives — Taking the Social History [Internet].
http://dx.doi.org/10.1056/NEJMp1106985. 2011 [cited 2019 Oct 1]. Available from:
https://www.nejm.org/doi/pdf/10.1056/NEJMp1106985
212. Bejan CA, Angiolillo J, Conway D, Nash R, Shirey-Rice JK, Lipworth L, et al. Mining 100
million notes to find homelessness and adverse childhood experiences: 2 case studies of rare and
severe social determinants of health in electronic health records. J Am Med Inform Assoc JAMIA
[Internet]. 2017; Available from: http://www.ncbi.nlm.nih.gov/pubmed/29016793
166
213. Bertholet N, Cheng DM, Samet JH, Quinn E, Saitz R. ALCOHOL CONSUMPTION PATTERNS
IN HIV-INFECTED ADULTS WITH ALCOHOL PROBLEMS. Drug Alcohol Depend. 2010
Nov 1;112(1–2):160–3.
214. Bensley KM, McGinnis KA, Fortney J, Chan KCG, Dombrowski JC, Ornelas I, et al. Patterns of
Alcohol Use Among Patients Living With HIV in Urban, Large Rural, and Small Rural Areas. J
Rural Health Off J Am Rural Health Assoc Natl Rural Health Care Assoc. 2018 Oct 19;
215. Kuhn R, Culhane DP. Applying cluster analysis to test a typology of homelessness by pattern of
shelter utilization: results from the analysis of administrative data. Am J Community Psychol.
1998 Apr;26(2):207–32.
216. Brunet L, Napravnik S, Heine AD, Leone PA, Eron JJ. Longitudinal opioid use among HIV-
infected patients, 2000 to 2014. J Acquir Immune Defic Syndr 1999. 2017 May 1;75(1):77–80.
217. Lauby J, Zhu L, Milnamow M, Batson H, Bond L, Curran-Groome W, et al. Get Real: Evaluation
of a Community-Level HIV Prevention Intervention for Young MSM Who Engage in Episodic
Substance Use. AIDS Educ Prev. 2017 Jun 1;29(3):191–204.
218. Everett B. Sexual Orientation Identity Change and Depressive Symptoms: A Longitudinal
Analysis. J Health Soc Behav [Internet]. 2015 Feb 17 [cited 2019 Mar 5]; Available from:
https://journals.sagepub.com/stoken/rbtfl/Gt7JdVHhmA9B2/full
219. Wimberly YH, Hogben M, Moore-Ruffin J, Moore SE, Fry-Johnson Y. Sexual history-taking
among primary care physicians. J Natl Med Assoc. 2006 Dec;98(12):1924–9.
220. Mo H, Thompson WK, Rasmussen LV, Pacheco JA, Jiang G, Kiefer R, et al. Desiderata for
computable representations of electronic health records-driven phenotype algorithms. J Am Med
Inform Assoc JAMIA. 2015;22(6):1220–30.
221. Rasmussen LV, Thompson WK, Pacheco JA, Kho AN, Carrell DS, Pathak J, et al. Design patterns
for the development of electronic health record-driven phenotype extraction algorithms. J Biomed
Inform. 2014 Oct 1;51:280–6.
222. Zhou J, Wang F, Hu J, Ye J. From Micro to Macro: Data Driven Phenotyping by Densification of
Longitudinal Electronic Medical Records. In: Proceedings of the 20th ACM SIGKDD
International Conference on Knowledge Discovery and Data Mining [Internet]. New York, NY,
USA: ACM; 2014 [cited 2019 Feb 11]. p. 135–144. (KDD ’14). Available from:
http://doi.acm.org/10.1145/2623330.2623711
223. Lipton ZC, Kale DC, Wetzel RC. Phenotyping of Clinical Time Series with LSTM Recurrent
Neural Networks. ArXiv151007641 Cs [Internet]. 2015 Oct 26 [cited 2019 Feb 11]; Available
from: http://arxiv.org/abs/1510.07641
224. Hripcsak G, Albers DJ, Perotte A. Parameterizing time in electronic health record studies. J Am
Med Inform Assoc JAMIA. 2015 Jul;22(4):794–804.
225. Chen JH, Alagappan M, Goldstein MK, Asch SM, Altman RB. Decaying relevance of clinical data
towards future decisions in data-driven inpatient clinical order sets. Int J Med Inf. 2017 Jun
1;102:71–9.

167
226. Dasu T, Weiss G. Mining Data Streams. In: Encyclopedia of Data Warehousing and Mining. 2009.
227. McCormick PJ, Elhadad N, Stetson PD. Use of semantic features to classify patient smoking
status. AMIA Annu Symp Proc AMIA Symp. 2008 Nov 6;450–4.
228. Uzuner Ö, Goldstein I, Luo Y, Kohane I. Identifying Patient Smoking Status from Medical
Discharge Records. J Am Med Inform Assoc JAMIA. 2008;15(1):14–24.
229. Savova GK, Ogren PV, Duffy PH, Buntrock JD, Chute CG. Mayo clinic NLP system for patient
smoking status identification. J Am Med Inform Assoc JAMIA. 2008 Feb;15(1):25–8.
230. Yetisgen M, Vanderwende L. Automatic Identification of Substance Abuse from Social History in
Clinical Text. In: SpringerLink [Internet]. Springer, Cham; 2017 [cited 2017 Jul 24]. p. 171–81.
Available from: https://link-springer-com.ezproxy.cul.columbia.edu/chapter/10.1007/978-3-319-
59758-4_18
231. Carter EW, Sarkar IN, Melton GB, Chen ES. Representation of Drug Use in Biomedical
Standards, Clinical Text, and Research Measures. AMIA Annu Symp Proc AMIA Symp.
2015;2015:376–85.
232. Carrell DS, Cronkite D, Palmer RE, Saunders K, Gross DE, Masters ET, et al. Using natural
language processing to identify problem usage of prescription opioids. Int J Med Inf. 2015
Dec;84(12):1057–64.
233. Cohen R, Elhadad M, Elhadad N. Redundancy in electronic health record corpora: analysis, impact
on text mining performance and mitigation strategies. BMC Bioinformatics. 2013 Jan 16;14:10.
234. Demner-Fushman D, Elhadad N. Aspiring to Unintended Consequences of Natural Language
Processing: A Review of Recent Developments in Clinical and Consumer-Generated Text
Processing. IMIA Yearb. 2016;224–33.
235. Pettey WBP, Toth DJA, Redd A, Carter ME, Samore MH, Gundlapalli AV. Using network
projections to explore co-incidence and context in large clinical datasets: Application to
homelessness among U.S. Veterans. J Biomed Inform. 2016;61:203–13.
236. Automatic address validation and health record review to identify homeless Social Security
disability applicants. J Biomed Inform. 2018 Jun 1;82:41–6.
237. Populations I of M (US) B on the H of S. Clinical Rationale for Collecting Sexual Orientation and
Gender Identity Data [Internet]. National Academies Press (US); 2013. Available from:
https://www.ncbi.nlm.nih.gov/books/NBK154075/
238. Populations I of M (US) B on the H of S. Existing Data Collection Practices in Clinical Settings
[Internet]. National Academies Press (US); 2013. Available from: https://www-ncbi-nlm-nih-
gov.ezproxy.cul.columbia.edu/books/NBK154082/
239. Toward Addressing Social Determinants of Health: A Health Care System Strategy [Internet]. The
Permanente Journal - The Permanente Press - Kaiser Permanente. [cited 2019 Sep 21]. Available
from: http://www.thepermanentejournal.org/issues/2018/volume-22-suppl-issue/6889-social-
determinants-of-healthcare.html

168
240. Taylor LA, Tan AX, Coyle CE, Ndumele C, Rogan E, Canavan M, et al. Leveraging the Social
Determinants of Health: What Works? PLoS ONE [Internet]. 2016;11(8). Available from:
http://www.ncbi.nlm.nih.gov/pmc/articles/PMC4988629/
241. Perotte A, Ranganath R, Hirsch JS, Blei D, Elhadad N. Risk prediction for chronic kidney disease
progression using heterogeneous electronic health record data and time series analysis. J Am Med
Inform Assoc JAMIA. 2015;22(4):872–80.
242. Scheurwegs E, Luyckx K, Luyten L, Daelemans W, Van den Bulcke T. Data integration of
structured and unstructured sources for assigning clinical codes to patient stays. J Am Med Inform
Assoc. 2016 Apr 1;23(e1):e11–9.
243. Miotto R, Li L, Kidd BA, Dudley JT. Deep Patient: An Unsupervised Representation to Predict the
Future of Patients from the Electronic Health Records. Sci Rep. 2016;6:26094–26094.
244. Liu H. Automatic Argumentative-Zoning Using Word2vec. ArXiv170310152 Cs [Internet]. 2017
Mar 29 [cited 2018 Oct 12]; Available from: http://arxiv.org/abs/1703.10152
245. Rajkomar A, Oren E, Chen K, Dai AM, Hajaj N, Hardt M, et al. Scalable and accurate deep
learning with electronic health records. Npj Digit Med [Internet]. 2018 Dec [cited 2018 Aug
5];1(1). Available from: http://www.nature.com/articles/s41746-018-0029-1
246. Halpern Y, Choi Y, Horng S, Sontag D. Using Anchors to Estimate Clinical State without Labeled
Data. AMIA Annu Symp Proc. 2014 Nov 14;2014:606–15.
247. Huang K, Altosaar J, Ranganath R. ClinicalBERT: Modeling Clinical Notes and Predicting
Hospital Readmission. ArXiv190405342 Cs [Internet]. 2019 Apr 10 [cited 2019 May 9]; Available
from: http://arxiv.org/abs/1904.05342
248. Alsentzer E, Murphy JR, Boag W, Weng W-H, Jin D, Naumann T, et al. Publicly Available
Clinical BERT Embeddings. ArXiv190403323 Cs [Internet]. 2019 Apr 5 [cited 2019 May 9];
Available from: http://arxiv.org/abs/1904.03323
249. Mooney KH, Beck SL, Friedman RH, Farzanfar R, Wong B. Automated monitoring of symptoms
during ambulatory chemotherapy and oncology providers’ use of the information: a randomized
controlled clinical trial. Support Care Cancer Off J Multinatl Assoc Support Care Cancer. 2014
Sep;22(9):2343–50.
250. Yap KY-L, Low HX, Koh KS, Un M, Shih V, Chan A. Feasibility and Acceptance of a
Pharmacist-Run Tele-oncology Service for Chemotherapy-Induced Nausea and Vomiting in
Ambulatory Cancer Patients. Telemed E-Health. 2013 Mar 26;19(5):387–95.
251. Emani S. Remote Monitoring to Reduce Heart Failure Readmissions. Curr Heart Fail Rep.
2017;14(1):40–7.
252. Armstrong WS, del Rio C. Editorial Commentary: Falling Through the Cracks and Dying: Missed
Clinic Visits and Mortality Among HIV-Infected Patients in Care. Clin Infect Dis. 2014 Nov
15;59(10):1480–2.
169
253. Koch SH, Weir C, Westenskow D, Gondan M, Agutter J, Haar M, et al. Evaluation of the effect of
information integration in displays for ICU nurses on situation awareness and task completion
time: A prospective randomized controlled study. Int J Med Inf. 2013;82(8):665–75.
254. Falconer N, Nand S, Liow D, Jackson A, Seddon M. Development of an electronic patient
prioritization tool for clinical pharmacist interventions. Am J Health Syst Pharm. 2014 Feb
15;71(4):311–20.
255. Nosyk B, Colley G, Yip B, Chan K, Heath K, Lima VD, et al. Application and validation of case-
finding algorithms for identifying individuals with human immunodeficiency virus from
administrative data in British Columbia, Canada. PloS One. 2013;8(1):e54416–e54416.
256. Lo Y-S, Lee W-S, Chen G-B, Liu C-T. Improving the work efficiency of healthcare-associated
infection surveillance using electronic medical records. Comput Methods Programs Biomed. 2014
Nov;117(2):351–9.
257. Pickering BW, Dong Y, Ahmed A, Giri J, Kilickaya O, Gupta A, et al. The implementation of
clinician designed, human-centered electronic medical record viewer in the intensive care unit: a
pilot step-wedge cluster randomized trial. Int J Med Inf. 2015 May;84(5):299–307.
258. McCoy A. Automated Inference of Patient Problems from Medications using NDF-RT and the
SNOMED-CT CORE Problem List Subset. [cited 2019 Dec 17]; Available from:
https://www.academia.edu/691462/Automated_Inference_of_Patient_Problems_from_Medication
s_using_NDF-RT_and_the_SNOMED-CT_CORE_Problem_List_Subset
259. Meystre S, Haug PJ. Natural language processing to extract medical problems from electronic
clinical documents: performance evaluation. J Biomed Inform. 2006 Dec;39(6):589–99.
260. Wright A, Pang J, Feblowitz JC, Maloney FL, Wilcox AR, Ramelson HZ, et al. A method and
knowledge base for automated inference of patient problems from structured data in an electronic
medical record. J Am Med Inform Assoc JAMIA. 2011 Dec;18(6):859–67.
261. Bartlett EE. Physicians’ cognitive errors and their liability consequences. J Healthc Risk Manag.
1998;18(4):62–9.
262. Feldstein AC, Schneider JL, Unitan R, Perrin NA, Smith DH, Nichols GA, et al. Health Care
Worker Perspectives Inform Optimization of Patient Panel-Support Tools: A Qualitative Study.
Popul Health Manag. 2012 Dec 5;16(2):107–19.
263. Haas LR, Takahashi PY, Shah ND, Stroebel RJ, Bernard ME, Finnie DM, et al. Risk-stratification
methods for identifying patients for care coordination. Am J Manag Care. 2013;19(9):725–32.
264. Pitt MA, Myung IJ, Zhang S. Toward a method of selecting among computational models of
cognition. Psychol Rev. 2002;109(3):472–91.
265. Faiola A, Srinivas P, Duke J. Supporting Clinical Cognition: A Human-Centered Approach to a
Novel ICU Information Visualization Dashboard. AMIA Annu Symp Proc. 2015;2015:560–9.
266. Heer J, Shneiderman B. Interactive Dynamics for Visual Analysis. Commun ACM.
2012;55(4):45–54.

170
267. Psallidas F, Wu E. Provenance for Interactive Visualizations. In: Proceedings of the Workshop on
Human-In-the-Loop Data Analytics [Internet]. Houston, TX, USA: Association for Computing
Machinery; 2018 [cited 2020 Mar 10]. p. 1–8. (HILDA’18). Available from:
https://doi.org/10.1145/3209900.3209904
268. Hirsch JS, Tanenbaum JS, Lipsky Gorman S, Liu C, Schmitz E, Hashorva D, et al. HARVEST, a
longitudinal patient record summarizer. J Am Med Inform Assoc JAMIA. 2015;22(2):263–74.
269. COVID-19 Makes Funding For Health And Social Services Integration Even More Crucial |
Health Affairs [Internet]. [cited 2020 Apr 21]. Available from:
https://www.healthaffairs.org/do/10.1377/hblog20200413.886531/full/?utm_campaign=HAT+4-
14-20&utm_medium=email&utm_content=COVID-
19%3A+Closing+Gaps+In+Surveillance+Data%2C+Funding+For+Health+++Social+Services+Int
egration%2C+Data+Infrastructure%3B+Accountable+Care+And+Payment+Reform&utm_source
=Newsletter&
270. How Can Employers Address Social Determinants of Health Exacerbated by COVID-19?
[Internet]. AJMC. [cited 2020 Apr 21]. Available from: https://www.ajmc.com/newsroom/how-
can-employers-address-social-determinants-of-health-exacerbated-by-covid19
271. Case Study: Getting in Front of COVID-19: Addressing Social Determinants of Health to Save the
Lives of Seniors | AHA [Internet]. [cited 2020 Apr 21]. Available from: https://www.aha.org/case-
studies/2020-04-07-case-study-getting-front-covid-19-addressing-social-determinants-health
272. Popovici I, French MT. Does Unemployment Lead to Greater Alcohol Consumption? Ind Relat.
2013 Apr;52(2):444–66.
273. Henkel D. Unemployment and substance use: a review of the literature (1990-2010). Curr Drug
Abuse Rev. 2011 Mar;4(1):4–27.
274. Baumel T, Nassour-Kassis J, Cohen R, Elhadad M, Elhadad N. Multi-Label Classification of
Patient Notes a Case Study on ICD Code Assignment. ArXiv170909587 Cs [Internet]. 2017;
Available from: http://arxiv.org/abs/1709.09587