The Effects of Vehicle-to-Grid Systems on Wind Power Integration in California
12
WIND ENERGY Wind Energ. (2011) Published online in Wiley Online Library (wileyonlinelibrary.com). DOI: 10.1002/we.520 RESEARCH ARTICLE The effects of vehicle-to-grid systems on wind power integration Bri-Mathias S. Hodge, Shisheng Huang, Aviral Shukla, Joseph F. Pekny, Venkat Venkatasubramanian and Gintaras V. Reklaitis School of Chemical Engineering, Purdue University, 480 Stadium Mall Dr., West Lafayette, IN 47907, USA ABSTRACT Renewable energy portfolio standards have created a large increase in the amount of renewable electricity production, and one technology that has benefited greatly from these standards is wind power. The uncertainty inherent in wind electricity production dictates that additional amounts of conventional generation resources be kept in reserve, should wind electricity output suddenly dip. The introduction of plug-in hybrid electric vehicles into the transportation fleet presents an possi- ble solution to this problem through the concept of vehicle-to-grid power. The ability of vehicle-to-grid power systems to help solve the variability and uncertainty issuess in systems with large amounts of wind power capacity is examined through a multiparadigm simulation model. The problem is examined from the perspectives of three different stakeholders: policy makers, the electricity system operator and plug-in hybrid electric vehicle owners. Additionally, a preliminary eco- nomic analysis of the technology is performed, and a comparison made with generation technologies that perform similar functions. Copyright © 2011 John Wiley & Sons, Ltd. KEYWORDS energy systems modeling; electricity systems; plug-in hybrid electric vehicles; vehicle-to-grid; wind power Correspondence Bri-Mathias S. Hodge, School of Chemical Engineering, Purdue University, 480 Stadium Mall Dr., West Lafayette, IN 47907, USA. E-mail: [email protected] Received 9 January 2011; Revised 23 May 2011; Accepted 20 August 2011 1. INTRODUCTION Renewable energy portfolio standards, mandates and goals set by individual states have helped to drive the recent increases in renewable energy electricity generating capacity within the United States. While a number of energy technologies qual- ify under these standards, including landfill gas, solar thermal and solar photovoltaic, the chief technology to benefit from these programs has been wind power. Many of the mandates dictate that a certain percentage of electricity sales within the state, up to 40%, must be generated from this renewable mixture, that thus far has been dominated by wind. As the amount of wind energy being added to the electricity grid increases the problems associated with wind energy variability and uncertainty become more pronounced. Variability and uncertainty in electricity generation from wind pose problems on the minute, hour and day time scales. Specifically, due to the uncertain nature of wind energy supply larger than normal operating reserves must be kept on standby in areas where wind energy makes up a significant portion of the generating capacity. This is because the uncertainty of wind power make it difficult to schedule production, due to the differences between forecasted wind power and the actual output. Plug-in hybrid electric vehicles (PHEVs), a transportation technology on the cusp of commercial introduction, aim to reduce gasoline consumption by replacing some of the gasoline used as an energy source for personal transportation with electricity. PHEVs possess a battery for electricity storage that allows for an all-electric transportation range, here assumed to be 40 miles, before gasoline is used to power the vehicle. In this work we will consider PHEVs that use a serial engine configuration in which electricity is always used as motive force for the vehicle, with a gasoline generator sustaining the battery at a minimum level when necessary. This subset of PHEVs are often known as extended range electric vehicles, though for the sake of consistency we will refer to the vehicles assumed to be adopted in this study simply as PHEVs. The widespread adoption and insertion of PHEVs into the electricity grid poses many challenges, including the possibility of increasing peak load, but also some very promising possibilities. Copyright © 2011 John Wiley & Sons, Ltd.
Transcript of The Effects of Vehicle-to-Grid Systems on Wind Power Integration in California

WIND ENERGY
Wind Energ. (2011)
Published online in Wiley Online Library (wileyonlinelibrary.com). DOI: 10.1002/we.520
RESEARCH ARTICLE
The effects of vehicle-to-grid systems on windpower integrationBri-Mathias S. Hodge, Shisheng Huang, Aviral Shukla, Joseph F. Pekny,Venkat Venkatasubramanian and Gintaras V. Reklaitis
School of Chemical Engineering, Purdue University, 480 Stadium Mall Dr., West Lafayette, IN 47907, USA
ABSTRACT
Renewable energy portfolio standards have created a large increase in the amount of renewable electricity production, andone technology that has benefited greatly from these standards is wind power. The uncertainty inherent in wind electricityproduction dictates that additional amounts of conventional generation resources be kept in reserve, should wind electricityoutput suddenly dip. The introduction of plug-in hybrid electric vehicles into the transportation fleet presents an possi-ble solution to this problem through the concept of vehicle-to-grid power. The ability of vehicle-to-grid power systemsto help solve the variability and uncertainty issuess in systems with large amounts of wind power capacity is examinedthrough a multiparadigm simulation model. The problem is examined from the perspectives of three different stakeholders:policy makers, the electricity system operator and plug-in hybrid electric vehicle owners. Additionally, a preliminary eco-nomic analysis of the technology is performed, and a comparison made with generation technologies that perform similarfunctions. Copyright © 2011 John Wiley & Sons, Ltd.
KEYWORDS
energy systems modeling; electricity systems; plug-in hybrid electric vehicles; vehicle-to-grid; wind power
Correspondence
Bri-Mathias S. Hodge, School of Chemical Engineering, Purdue University, 480 Stadium Mall Dr., West Lafayette, IN 47907, USA.E-mail: [email protected]
Received 9 January 2011; Revised 23 May 2011; Accepted 20 August 2011
1. INTRODUCTION
Renewable energy portfolio standards, mandates and goals set by individual states have helped to drive the recent increasesin renewable energy electricity generating capacity within the United States. While a number of energy technologies qual-ify under these standards, including landfill gas, solar thermal and solar photovoltaic, the chief technology to benefit fromthese programs has been wind power. Many of the mandates dictate that a certain percentage of electricity sales withinthe state, up to 40%, must be generated from this renewable mixture, that thus far has been dominated by wind. As theamount of wind energy being added to the electricity grid increases the problems associated with wind energy variabilityand uncertainty become more pronounced. Variability and uncertainty in electricity generation from wind pose problemson the minute, hour and day time scales. Specifically, due to the uncertain nature of wind energy supply larger than normaloperating reserves must be kept on standby in areas where wind energy makes up a significant portion of the generatingcapacity. This is because the uncertainty of wind power make it difficult to schedule production, due to the differencesbetween forecasted wind power and the actual output.
Plug-in hybrid electric vehicles (PHEVs), a transportation technology on the cusp of commercial introduction, aim toreduce gasoline consumption by replacing some of the gasoline used as an energy source for personal transportation withelectricity. PHEVs possess a battery for electricity storage that allows for an all-electric transportation range, here assumedto be 40 miles, before gasoline is used to power the vehicle. In this work we will consider PHEVs that use a serial engineconfiguration in which electricity is always used as motive force for the vehicle, with a gasoline generator sustaining thebattery at a minimum level when necessary. This subset of PHEVs are often known as extended range electric vehicles,though for the sake of consistency we will refer to the vehicles assumed to be adopted in this study simply as PHEVs. Thewidespread adoption and insertion of PHEVs into the electricity grid poses many challenges, including the possibility ofincreasing peak load, but also some very promising possibilities.
Copyright © 2011 John Wiley & Sons, Ltd.
Effects of vehicle-to-grid systems on wind power integration global B.-M. S. Hodge et al.
One such possibility is the idea that the PHEV battery be enabled to sell electricity back to the grid when needed. Thisidea, known as vehicle-to-grid (V2G), is significant for wind energy because it suggests the possibility that distributedautomotive batteries could serve as a form of operating reserve for the electricity grid. When variable and uncertain elec-tricity sources are producing more than the current demand, excess electricity could be distributed to charge vehicles thatare plugged in. When a reduction in wind energy production occurs the batteries could be tapped as a temporary reserve tobalance electricity supply and demand until additional generating capacity could be brought online. It is thought that theability of PHEVs to serve as an operating reserve for the electricity grid could lead to significant increases in the percentageof electricity production by renewable sources,1 as the reserve capacity of conventional electricity generators serving asstand-by power could be reduced and electricity produced from wind during periods when supply exceeds demand could beshifted to periods when demand exceeds instantaneous supply. Wind power has two distinct operational differences fromconventional generators: increased variability and increased uncertainty. Variability alone would be an issue for systemoperation, but could at least be considered in the unit commitment and dispatch process, allowing the system to minimizethe additional costs. The uncertainty stems from the fact that the variations in wind power output are difficult to forecast.If wind power went through drastic changes in output, but those changes could be accurately predicted, the impact on thesystem could be reduced through standard scheduling practices. Fast-reacting reserve capacity, such as natural gas plants,could quickly be brought online to replace any declines in the wind power output. Similarly, with only small amounts ofwind power capacity integrated into the system, operating reserves are available to make up any temporary shortfall causedby wind power variability. However when the amount of wind power in the system increases, significant extra reservecapacity must be in place to ensure that the differences between wind forecasts and actual output do not cause systemperformance to suffer. V2G technology has the possibility to contribute to the solution of these issues of variability anduncertainty. Vehicles with V2G capability that are connected to the grid can serve the dual purpose of compensating forany power shortfalls due to over forecasting and can also increase the utilization of extra power wind in the case of underforecasting. The ability of V2G technologies to mitigate the effects of renewable energy variability and uncertainty is theprimary focus of this study.
The idea of using electric vehicles as a source of power, instead of strictly as a load, arose from the realization that thepower capacity of the United States vehicle fleet greatly exceeds the capacity of United States electric utilities.2 Kemptonand Tomic3 performed a cost-benefit analysis for battery-based electric vehicles that showed that the benefits accrued fromenabling electricity regulation services exceed the additional costs to the consumer that would be necessary to make astandard electric vehicle and home charging station V2G-ready. Milligan4 developed a probabilistic reliability model thatdetermines the level of operating reserves necessary for wind energy that was then used as the basis for a calculation of thepercentage of the national vehicle fleet that must be electric and V2G capable in order serve the function of an operatingreserve.1 Peterson et al.5 examine the use of PHEV battery packs as a non-ancillary service grid storage solution fromthe economic point of view of the vehicle owner. They found that the arbitrage opportunities available for household loadshifting in three different U.S. cities would not be sufficient incentive for the vehicle owners to provide the batteries forstorage uses.
Two different mathematical programming models have also been used to estimate the amount of wind energy pene-tration possible with V2G in place and high levels of electric vehicle penetration. A study by Short and Denholm6 usedan electricity capacity optimization model, WinDS, to estimate that the 2050 total wind energy capacity in the UnitedStates would be 110% larger in the case of 50% penetration of PHEVs with an all-electric range of 60 miles than inthe base case scenario without the V2G technology, though still only 16% of total electricity generation. Sioshansi andDenholm7 examined the impact of V2G services on the emissions produced by electricity generating units at low levelsof PHEV penetration with a unit commitment model. Interestingly, they noted that while adding V2G services to normalPHEV adoption could reduce the total CO2 and NOx emissions, the SO2 emissions could instead rise at higher PHEVpenetration rates. This might occur as PHEVs replace natural gas units in their role as load-shifting reserves and electric-ity production is shifted to higher emission base load coal-fired units. A more basic input-output model, EnergyPLAN,was used in a case study for Denmark, the results of which indicate that excess electricity production could be cut inhalf for 50% wind energy production with 100% electric vehicle penetration and V2G participation.8 A critical assump-tion made in these previous studies is that of utility controlled charging of the PHEVs. This assumption has a significantimpact on the timing of PHEV charging and limits the need for a detailed representation of the vehicle travel patterns.We believe that consumers in the United States would be reluctant to allow for utility-controlled charging and there-fore have introduced charging scenarios that represent expected consumer behavior under two different pricing regimes.The multi-paradigm modeling approach used in this work significantly facilitates the use of these more realistic charg-ing scenarios due to its ability to incorporate different time scales and levels of aggregation for the different problemsub-systems. We are able to model the household and PHEV electricity usage at the minute time scale, with electricitysupply at the ten minute timescale, while the previous studies use a minimum of a one hour time scale. Since the V2Gtechnology is expected to be used for balancing the electricity supply and demand at small time scales, and because windpower output can vary significantly on such timescales, we believe that this increased granularity is an important feature ofthe model.
Wind Energ. (2011) © 2011 John Wiley & Sons, Ltd.DOI: 10.1002/we
B.-M. S. Hodge et al. Effects of vehicle-to-grid systems on wind power integration global
2. MODELING APPROACH
A multi-paradigm modeling approach has been used in order to investigate the ability of PHEVs to act as short durationoperating reserves for the electricity grid in the case of high levels of wind power capacity in the generation portfolio.An agent-based framework is used to encapsulate models created using various modeling paradigms and provide clearchannels for communication and time synchronization.9,10 A discrete-event household demand model that incorporatesthe inclusion of PHEVs has been integrated with an agent-based generation assignment model for electricity supply11 inorder to produce a simulation model that can examine the consequences of V2G technology adoption on wind integrationat a number of different levels of model aggregation and timescales. The discrete-event modeling formalism was chosento represent the household demand because as a result of the stochastic choices of turning appliances on and off basedon hourly starting probabilities it is able to provide a more detailed view of a representative household’s electricity usage.By combining the usage for a representative number of households, this approach makes it easy to scale up to generatea view of the entire residential sector’s electricity usage. The agent-based modeling method was chosen for the supplymodel because the representation is seen as a natural fit for systems where individual entities act independently and withspecified goals toward a solution that arises from the actions of all the individuals. The PHEVs themselves are representedusing an agent-based system because of the need to make many independent decisions that are not related to the rest of thehousehold’s decisions.
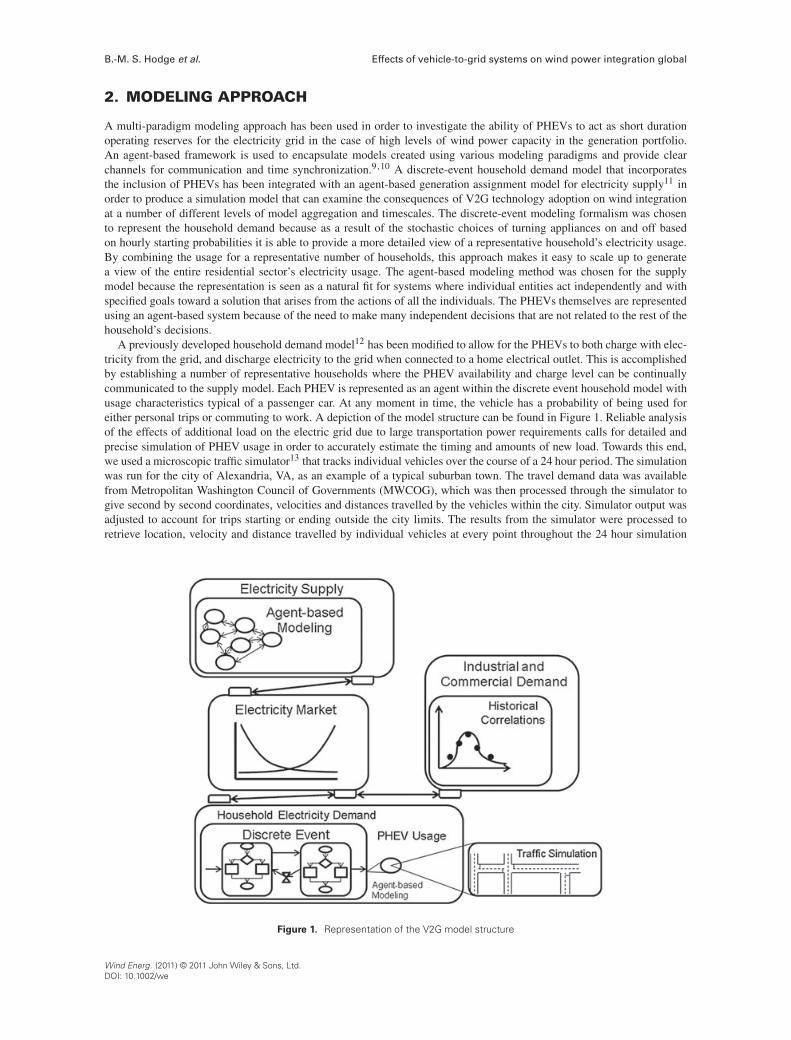
A previously developed household demand model12 has been modified to allow for the PHEVs to both charge with elec-tricity from the grid, and discharge electricity to the grid when connected to a home electrical outlet. This is accomplishedby establishing a number of representative households where the PHEV availability and charge level can be continuallycommunicated to the supply model. Each PHEV is represented as an agent within the discrete event household model withusage characteristics typical of a passenger car. At any moment in time, the vehicle has a probability of being used foreither personal trips or commuting to work. A depiction of the model structure can be found in Figure 1. Reliable analysisof the effects of additional load on the electric grid due to large transportation power requirements calls for detailed andprecise simulation of PHEV usage in order to accurately estimate the timing and amounts of new load. Towards this end,we used a microscopic traffic simulator13 that tracks individual vehicles over the course of a 24 hour period. The simulationwas run for the city of Alexandria, VA, as an example of a typical suburban town. The travel demand data was availablefrom Metropolitan Washington Council of Governments (MWCOG), which was then processed through the simulator togive second by second coordinates, velocities and distances travelled by the vehicles within the city. Simulator output wasadjusted to account for trips starting or ending outside the city limits. The results from the simulator were processed toretrieve location, velocity and distance travelled by individual vehicles at every point throughout the 24 hour simulation
Figure 1. Representation of the V2G model structure
Wind Energ. (2011) © 2011 John Wiley & Sons, Ltd.DOI: 10.1002/we

Effects of vehicle-to-grid systems on wind power integration global B.-M. S. Hodge et al.
period. This output was further aggregated to produce frequency distribution charts that can be sampled to produce PHEVdriving timing and distances.14 The results of the traffic simulation model for Alexandria produce daily vehicle-miles drivendistributions that are very similar to those in the National Household Travel Survey.15 While United States Department ofTransportation statistics show that the vehicle-miles traveled per capita are approximately 14% higher in Virginia than inCalifornia,16 the city of Alexandria has many public transportation options suggesting that the vehicle miles traveled percapita for the city itself is lower than the average of the entire state. Additionally, Alexandria is the type of environment,with above average household income and numerous household owners,17 where early adopters of PHEVs are expected tolive,18 and therefore driving patterns should match up well with those of California first adopters.
In this study, when the vehicle is not in use, and if the PHEV is parked at home with a remaining battery capacityexceeding a certain threshold value, it is plugged in as an operating reserve; ready to supply electricity in the case of ashortfall or to absorb any surge in variable electricity production. Once the battery charge level drops below the minimumcharging level capacity, the vehicle is taken offline and charged again until full, subject to its pricing regime restrictions.This charging pattern, whereby any vehicle is charged as it returns home, is meant to better replicate anticipated consumerbehavior in a flat-rate electricity tariff environment, instead of the utility controlled charging patterns commonly assumedin previous PHEV studies. Additionally, a time-of-use (TOU) electricity pricing scheme, such as that which California con-sumers may already decide to utilize, is also included in the analysis to represent the ability of currently available policiesto shift consumer PHEV demand toward the desired times without requiring utility controlled charging. In this work weuse an idealized assumption that the TOU rates are high enough to shift all PHEV demand to off-peak, without actuallyspecifying the TOU rates. This has the same effect as using a smart meter on the PHEV charger to prevent charging duringthe peak period. As can be seen in Figure 2, the addition of a PHEV to a household significantly changes the total amountof electricity usage while the pricing regime in use significantly affects the timing of the vehicle electricity usage. Theelectricity usage profile was generated by taking the hourly average electricity usage for 100 households that have a PHEVand the error bars indicate one standard deviation in household electricity usage.
At any point in time, vehicles have the option of being at any one of three locations: Home, Work or Out. Home is wherethe vehicle starts off at the beginning of each run, and for the purpose of this paper, it is the only location where the vehiclecan charge or discharge. Work is the location where the owner of the vehicle works. In this simulation, it is assumed thatvehicles are used to go to work only on weekdays. Out indicates when an owner uses the vehicle for other functions, likeshopping trips, meals, etc. At any instance, the vehicle has a probability of making a trip associated with the current timeof day. The nature of the trip is dependent on the current location. When the vehicle is at home, it has the possibility ofmaking a trip to work or out. Similarly if at work, it can go home or out and when it is out it can either go home or go towork. The time based probabilities and distances for each of these types of trips have all been extracted from the detailedTRANSIMS simulation described previously.
In the V2G system envisioned in this study, there is a central controller which determines whether PHEVs are requiredto absorb excess electricity or alleviate shortfall. This role could be fulfilled by utilities or independent system operators
Figure 2. Household electricity usage without PHEVs and with PHEVs with both flat rate and TOU charging patterns
Wind Energ. (2011) © 2011 John Wiley & Sons, Ltd.DOI: 10.1002/we

B.-M. S. Hodge et al. Effects of vehicle-to-grid systems on wind power integration global
in the current electricity system structure. At the start of each commitment period, this controller queries all PHEVs inthe system on their availability to perform V2G tasks. Based on that availability, the controller assigns a “burden” to eachavailable vehicle; this burden could be a wind generation surplus or a forecast shortfall. The only location where V2Gactivities can occur in this simulation is when the vehicle is at home and when a vehicle is home it is assumed to be gridconnected. At home, a PHEV can only be considered plugged into the grid and perform V2G duties if it fulfills two condi-tions: the battery level of the PHEV is above a minimum level of charge and the vehicle is not scheduled to be used withinthe next commitment period. In this work it is assumed that the V2G commitment period per vehicle is 10 minutes. If thevehicle is not tasked to be committed to the grid and its battery is less than full, it has a possibility of charging using powerfrom the grid. This possibility is determined by the pricing regime that the household uses. A household with a flat rateelectricity price would charge as and when the vehicle is available for charging. However, if the household adopts a timeof use pricing scheme, the PHEV would only charge when the price of electricity is non-peak, avoiding periods where theprice of electricity is at the highest level.
The PHEVs used in this simulation are modeled after the Chevrolet Volt, the first PHEV available in the United States.The Volt is advertised as having an all-electric range of 40 miles, with a battery capacity of 16 kWh and a usable capacityof 8.8 kWh. Once the battery power has been exhausted, a serial gasoline engine is used to power the vehicle in chargesustaining mode, with an estimated 50 miles per gallon efficiency. All charging is assumed to take place on standardhousehold 120 V lines, leading to a full charge time of approximately eight hours for an exhausted battery. The Volt isanticipated to utilize a lithium-ion battery as opposed to the nickel-metal hydride batteries commonly used in most parallelhybrid vehicles.
The supply model assigns an availability status to each generator for each hourly period using generator type availabilitypercentages. In this model we do not consider the effects of unanticipated outages or availability forecasting errors, exceptin the case of wind power production. Within each hour timeframe spot markets are held at ten minute intervals to ensurethat demand does not exceed supply at any particular instant. In the United States there are generally two types of electricitymarkets: day-ahead and spot markets. Day-ahead markets are used to ensure there is enough generation capacity availableto supply the forecast demand while the spot markets handle any differences between the actual supply or demand and theforecast amounts. The electricity supply model consists of over 700 electricity generation units that individually determinetheir availability for every time step, as well as a market agent that chooses from among the available units in order toensure that electricity supply is sufficient to meet demand. The market model selects available units on the basis of theirbid marginal cost of production, with each unit being assigned an individual cost assigned from within a set range for itsparticular technology type. The high levels of wind generation in the scenario suggest that the assignment agent shouldoperate in a fashion so as to minimize the risk of supply shortages when wind output falls below forecasted levels. For thisreason baseload generation modes, here defined as coal, nuclear and geothermal, are given low marginal costs, and henceare often scheduled first if available. The long ramp-up times needed for these generators preclude their use as reservesassigned within the ten minute intra-hour periods. Forecasted wind capacity has a slightly higher marginal cost, with aprevious period’s output serving as a crude estimate of the wind power available in the next time step. This technique iscommonly known as the persistence method in the forecasting field and serves as a lower bound benchmark that forecastingmethods must outperform in order to be considered for use. While naïve, the persistence method performs reasonably wellfor wind forecasting, with advanced statistical techniques often only marginally besting the heuristic.19 In this work weexamine the effect of the length of the forecast period for the persistence method, using a one hour period as the standardand examining scenarios where the period is as small as ten minutes. Subsequent generation technologies that may act asquick-starting reserve capacity are added to the schedule based on estimated marginal cost until the forecast supply is equalto the forecast demand. This ordering is used as it would likely be the ordering in a generation pool bid system where windpower would have a near zero marginal cost bid for its forecasted capacity, but is not is not suitable for peaking or reserveuse due to its fluctuating availability. The PHEVs with V2G capability act as short-term, or spinning, reserves in order tofulfill supply shortages, here caused by inaccuracies in wind forecasting, for one ten minute interval while replacementreserves such as hydroelectric or natural gas generation may be brought online in the spot market.
3. CALIFORNIA CASE STUDY
Scenario analysis has been used to examine the effect of V2G power systems on the amount of wind energy capacityneeded to reach the California mandate. The fulfillment of California’s renewable portfolio standard by substantial addi-tions of wind generating capacity, both with and without V2G capability, is examined in order to gauge the technology’simpact on integrating variable power into the electricity grid. The adoption of PHEVs is assumed in both cases so that elec-tricity demand levels may be held constant between the two scenarios as PHEV usage could cause a significant increasein electricity requirements that must be accounted for in both scenarios to ensure a fair comparison. Electricity usage fromnon-transportation sources is assumed to remain constant in California for the period from 2007 until 2020. Historically,overall electricity usage in the state has grown at approximately 1.13% per year for the period from 1990 until 2007.20
Wind Energ. (2011) © 2011 John Wiley & Sons, Ltd.DOI: 10.1002/we

Effects of vehicle-to-grid systems on wind power integration global B.-M. S. Hodge et al.
However, the state’s renewable portfolio standard will be costly and difficult to reach even without additional growth, soconservation efforts are assumed to offset growth in this scenario. Another simplifying assumption made is that all newinstalled generation capacity added is in the form of wind power. This is justified by the fact that wind power is currentlythe cheapest of the qualifying renewable technologies. While it is acknowledged that a mixture of renewable generatingtechnologies will be required to meet the standards set, wind power is likely to be the dominant technology and, thus, isthe focus of this study. Retiring generation capacity from sources other than wind is assumed to be replaced by a newplant from the same source with equivalent capacity. Finally, while California currently imports approximately 20% of itselectricity usage,20 in this study we assume that all generation will occur in-state by 2020, a change that could currently beaccomplished with existing generation capacity, though perhaps not with current emissions regulations.
Wind data used in the analysis comes from the Wind Integration Dataset produced by the National Renewable EnergyLaboratory.21 The dataset consists of simulated wind speed and power output for a particular location sampled every 10minutes for the years 2004, 2005 and 2006. Each location is assumed to contain 10 Vestas V90 3 MW wind turbines with ahub height 100 meters above ground level. The datasets includes over 2,800 possible onshore sites in California that wouldallow the installation of over 86 GW of capacity. Since the full amount of potential capacity is not needed in the study,sites were chosen based on their simulated capacity factor. Those sites with higher capacity factors were assumed to bechosen before lower capacity factor sites. The 650 sites with the highest average capacity factors over the years 2004-2006were used in the study, thus with 30 MW per site a total of 19.5 GW is assumed to be added to the system by 2020 inthe scenario we consider here. The NREL simulated wind data for the year 2006, using the month of June, is used torepresent the output of wind generation capacity additions made to fulfill the renewable energy mandate. This addition ofwind generation capacity greatly increases the state’s total generating capacity. The nameplate capacity of all the generationunits considered without the addition of new wind capacity is nearly 67 GW. Thus the addition of 19.5 GW of wind powercapacity would represent a nearly 22% increase in the total generation capacity within the state.
Electricity supply and demand have been simulated over the course of a one month summer peak period in orderto determine the amount of wind generation capacity that would need to be added in order to fulfill the Californiarenewable energy mandate of 33% by 2020. The simulation was performed for the cases of PHEVs both with andwithout V2G capabilities for a number of wind and PHEV penetration rates. A number of different PHEV penetra-tion levels, in line with and exceeding current industry projections,22,23 are used for the 2020 scenario. We define thehousehold penetration rate as the percentage of households having a single PHEV and consider household penetrationrates between zero and thirty five percent. For example, we consider the adoption of one PHEV in 10% and 20% ofCalifornia households by 2020 as reasonable and optimistic projections respectively. Since California has approximately1.8 cars per household these penetration rates correspond to approximately 5.5% and 11% of total California light-dutyvehicles. These latter numbers correspond to the vehicle penetration rates, which is the standard measure used in theindustry. While this may seem like a large fraction of the total vehicle stock, it must be considered that there is a tenyear timeframe in which the vehicles may be absorbed into the mixture and that even those sold at the beginning ofthe timeframe should still be in use during the period under study. Additionally, California has historically been anearly adopter of similar technologies, with approximately 25% of hybrid vehicles sales in the United States occurringin California.
4. RESULTS
In this study we focus only on the role that V2G can play in helping to solve the variability and uncertainty issues ofrenewable energy sources. While other uses for PHEVs in general have been suggested, such as demand leveling,24 webelieve that these conflict with the needs and desires of consumers to a degree that would make them infeasible, sincethey require completely utility controlled charging. We have chosen to examine only the integration of wind power aswind power is currently the largest supplier of variable renewable electricity. This was accomplished in the simulationmodel described in the previous section by only making V2G capabilities available when there is a difference betweenthe amount of wind power forecast and the actual power output. Kempton and Tomic1 suggest that this storage andbackup of renewable electricity could be the most important role for the V2G technology, as it provides a much largerpotential market than ancillary services such as voltage regulation. Thus the ultimate adoption or rejection of the V2Gtechnology could largely depend on its ability to provide benefits to all the different stakeholders involved in the tech-nology’s use as a means of incorporating renewable energy into the electricity grid. We have examined the effects of theV2G capabilities over a range of possible parameter values, the most significant of which is the vehicle penetration rate.Most base case industry projections for new electric vehicles sales are on the order of five percent of all sales by 2020,22
though some industry members have forecast new electric vehicle purchase rates of up to 10% in the next ten years.23
These correspond to total electric vehicle penetration rates on the order of 2-5% for the year 2020, though we have alsoincluded much higher penetration rates in order to examine how the proposed benefits of the V2G technology scale withincreasing acceptance.
Wind Energ. (2011) © 2011 John Wiley & Sons, Ltd.DOI: 10.1002/we

B.-M. S. Hodge et al. Effects of vehicle-to-grid systems on wind power integration global
4.1. Perspective 1: policy maker
One of the main criticisms of incorporating large amounts of wind power into the electricity grid is that the peak periodsof electricity demand and wind power production do not align well. Peak demand periods typically occur in the afternoonsand evenings while wind power is more consistently at high levels during the night. This mismatch, combined with theneed for large baseload plants to produce fairly consistent outputs, can lead to the situation where wind power is produced,but not utilized during the night. This is expected to occur in systems where wind power comprises a significant portion ofthe generating capacity. This problem can present a significant issue for regions that have renewable electricity mandates.This wasted wind power does not count toward the renewable energy mandate and further overcapacity is needed in orderto reach the renewable production goals. This is one area where V2G capabilities can in principle have a significant effect.As can be seen in Figure 3, V2G capabilities can reduce the amount of wind power that is not utilized by the system. Thewind not utilized is the amount of wind power that would have been produced had there been sufficient demand at thetime of production to necessitate its supply into the system. Each combination of vehicle penetration rate, V2G usage andelectricity pricing scheme was simulated ten times, for a total of approximately 300 simulations, and the error bars indicateone standard deviation. More simulations were conducted on a single case that showed that there was not a significantchange in the variability of the measured data when using more than ten simulations. As a point of comparison: a typicalCalifornia system-wide peak demand for a summer day is approximately 40 GW while a typical system low demand isapproximately 22 GW. Therefore if the entire 19.5 GW of new wind capacity added in our scenario was being producedat the daily demand nadir, it is easy to imagine a case where scheduled baseload capacity plus the wind power productioncould exceed demand. The values shown are the amount of wind power not utilized over the course of one summer month.For example, the difference in the amount of wind power utilized for the flat rate pricing at five percent household penetra-tion rate (2.8% vehicle penetration rate) using V2G versus no V2G capabilities is equivalent to running an approximately43 MW generator constantly for the entire month. For the California electricity system this corresponds to an approximateincrease of 0.23% in the amount of electricity produced from renewable sources. Additionally, the amount of wind powersavings for the flat rate pricing increases by approximately a 3.3 MW generator running constantly for every one percentincrease in the vehicle penetration rate. Moreover, the effect of the V2G capability is much more pronounced than the effectof a change in the pricing structure. At a typical point, with a vehicle penetration rate of 11%, the difference between thewind not utilized for flat rate pricing and TOU pricing is equivalent to a 17.6 MW generator. When V2G capabilities areenabled the differences between the two pricing regimes are not statistically significant. The average difference betweenthe two pricing regimes, over all penetration rates, without V2G is a 22.6 MW capacity while with V2G it is only 12.9 MW.This difference arises from the fact that the TOU case shifts more demand to the morning hours when more wind wouldotherwise be curtailed. When V2G is in use some of the vehicles that would otherwise be fully charged in the no V2Gcase have been slightly depleted from supply V2G services, and so have room to absorb wind power that would otherwisebe curtailed. From these results it appears that the V2G technology can make a measureable difference on the renewable
Figure 3. Wind power available but not utilized for varying levels of PHEV penetration under different pricing regimes with andwithout V2G capabilities for a one month summer period
Wind Energ. (2011) © 2011 John Wiley & Sons, Ltd.DOI: 10.1002/we
Effects of vehicle-to-grid systems on wind power integration global B.-M. S. Hodge et al.
energy production level. Additionally, the choice of pricing regime to utilize with V2G is less important than the choice toactually utilize the technology.
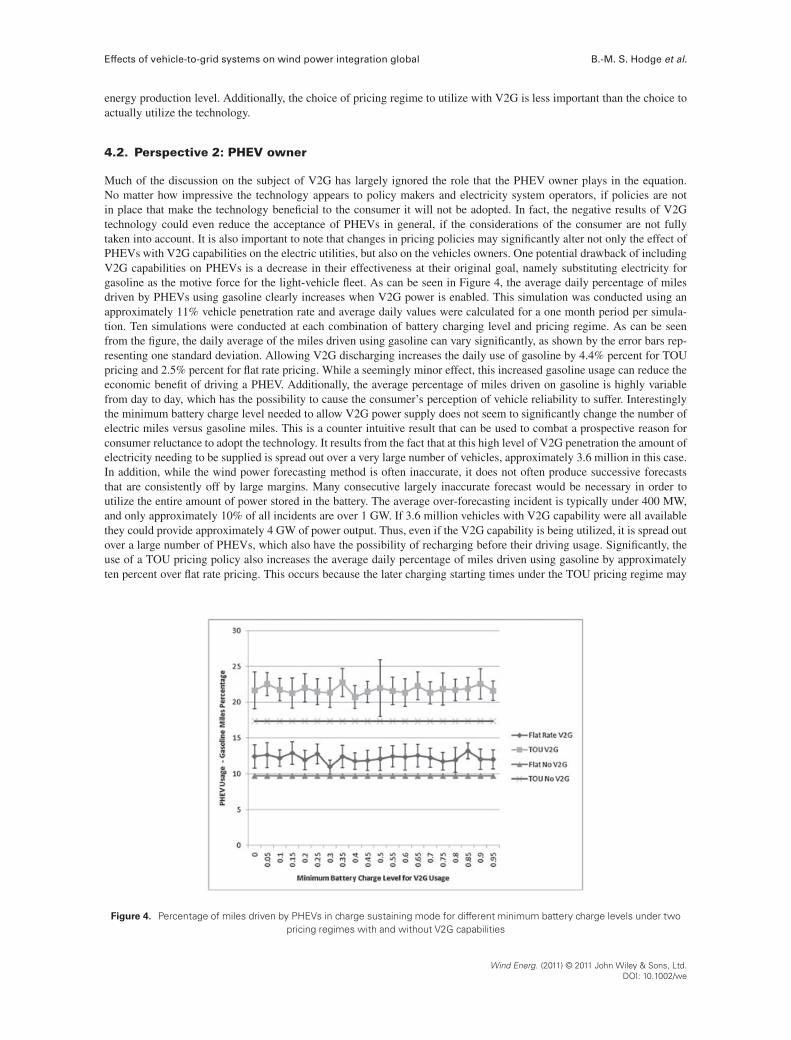
4.2. Perspective 2: PHEV owner
Much of the discussion on the subject of V2G has largely ignored the role that the PHEV owner plays in the equation.No matter how impressive the technology appears to policy makers and electricity system operators, if policies are notin place that make the technology beneficial to the consumer it will not be adopted. In fact, the negative results of V2Gtechnology could even reduce the acceptance of PHEVs in general, if the considerations of the consumer are not fullytaken into account. It is also important to note that changes in pricing policies may significantly alter not only the effect ofPHEVs with V2G capabilities on the electric utilities, but also on the vehicles owners. One potential drawback of includingV2G capabilities on PHEVs is a decrease in their effectiveness at their original goal, namely substituting electricity forgasoline as the motive force for the light-vehicle fleet. As can be seen in Figure 4, the average daily percentage of milesdriven by PHEVs using gasoline clearly increases when V2G power is enabled. This simulation was conducted using anapproximately 11% vehicle penetration rate and average daily values were calculated for a one month period per simula-tion. Ten simulations were conducted at each combination of battery charging level and pricing regime. As can be seenfrom the figure, the daily average of the miles driven using gasoline can vary significantly, as shown by the error bars rep-resenting one standard deviation. Allowing V2G discharging increases the daily use of gasoline by 4.4% percent for TOUpricing and 2.5% percent for flat rate pricing. While a seemingly minor effect, this increased gasoline usage can reduce theeconomic benefit of driving a PHEV. Additionally, the average percentage of miles driven on gasoline is highly variablefrom day to day, which has the possibility to cause the consumer’s perception of vehicle reliability to suffer. Interestinglythe minimum battery charge level needed to allow V2G power supply does not seem to significantly change the number ofelectric miles versus gasoline miles. This is a counter intuitive result that can be used to combat a prospective reason forconsumer reluctance to adopt the technology. It results from the fact that at this high level of V2G penetration the amount ofelectricity needing to be supplied is spread out over a very large number of vehicles, approximately 3.6 million in this case.In addition, while the wind power forecasting method is often inaccurate, it does not often produce successive forecaststhat are consistently off by large margins. Many consecutive largely inaccurate forecast would be necessary in order toutilize the entire amount of power stored in the battery. The average over-forecasting incident is typically under 400 MW,and only approximately 10% of all incidents are over 1 GW. If 3.6 million vehicles with V2G capability were all availablethey could provide approximately 4 GW of power output. Thus, even if the V2G capability is being utilized, it is spread outover a large number of PHEVs, which also have the possibility of recharging before their driving usage. Significantly, theuse of a TOU pricing policy also increases the average daily percentage of miles driven using gasoline by approximatelyten percent over flat rate pricing. This occurs because the later charging starting times under the TOU pricing regime may
Figure 4. Percentage of miles driven by PHEVs in charge sustaining mode for different minimum battery charge levels under twopricing regimes with and without V2G capabilities
Wind Energ. (2011) © 2011 John Wiley & Sons, Ltd.DOI: 10.1002/we

B.-M. S. Hodge et al. Effects of vehicle-to-grid systems on wind power integration global
not always allow a full charge to be attained before the vehicle is needed again in the morning. Additionally, since windpower output tends to follow a diurnal pattern, with declining output in the morning hours, the times when overforecasting(and hence V2G usage) are most common is also just before most vehicles will leave for the day. Thus on a day when thewind power output is decreasing just before the morning commute a number of vehicles will leave with a less than fullbattery charge. This is an important consideration when pricing policies are being determined. While the benefits for theelectricity supply sector and the economic well-being of the consumer12 may make TOU pricing the more attractive option,they can also create a disincentive that may prevent further PHEV adoption if the effect of the technology does not meetthe expectations of the consumer.
4.3. Perspective 3: system operator
Another important consideration is whether there is another method, perhaps a less costly technique, to produce the ben-efits of V2G. The amount of power needed to account for the wind power forecasting error decreases dramatically as theforecasting methods improve. As is seen in Figure 5, the amount of power supplied under TOU pricing when there is apersistence forecasting lag of one hour is five times that needed for a ten minute lag, for the case of nearly 10% vehiclepenetration. The TOU pricing regime enables the supply of more V2G power for longer forecasting lag times, but the dif-ference is reduced as the lag time shrinks. While a 10% vehicle penetration rate may not seem large, the size of the state ofCalifornia light vehicle fleet must be considered, as this represents approximately 3.6 million vehicles. So while for TOUpricing with a one hour lag time V2G supplies the equivalent electricity of a 350 MW generator producing constantly, theaverage PHEV (assuming an approximately 11% vehicle penetration rate) would only be supplying V2G power for 5.5minutes per day. However, it must be noted that while the total generation is not particularly large, it is variable like thewind output. For a more modest 2.8% vehicle penetration rate the capacity factor for the total V2G capability averaged 15%capacity factor over a one month period, with instances of peak output of nearly the total V2G capacity of approximately1 GW. From the system operator’s perspective the V2G technology provides additional flexibility due to the large capacityprovided without the need to achieve high usage rates. Typically plants that are able to provide large capacities for verylow amounts of usage tend to have low capital costs and very high variable costs. The V2G technology is expected to havethe opposite cost structure and thus an examination of the economic situation is warranted.
4.4. Economic analysis
In order to provide an economic comparison between the V2G technology and other technologies that could fulfill thesame role, the levelized energy cost for the V2G technology have been computed. The levelized energy cost is a financialcalculation that includes both capital and operating costs to establish a cost for the technology on a per unit energy basis, sothat technologies with different cost structures may be more accurately compared. The formula used for the calculations isas follows:
Figure 5. Amount of V2G power supplied with increasingly accurate wind forecasting
Wind Energ. (2011) © 2011 John Wiley & Sons, Ltd.DOI: 10.1002/we

Effects of vehicle-to-grid systems on wind power integration global B.-M. S. Hodge et al.
LEC DXn
tD1
.It C Mt C Ft /
.1 C r/t=
Xn
tD1
Et
.1 C r/t
where LEC is the average lifetime levelized electricity cost, It is the investment in the year t, Mt is the operations andmaintenance expenses in year t, Ft is the fuel costs in year t, Et is the electricity generated in year t and r is the discountrate.25
The calculations that follow assume a 2.8% vehicle penetration rate, a one hour forward persistence forecast, 50%minimum battery charge, TOU pricing, 100% debt financing and a 4.35% discount rate. The capital costs for the powercomponents necessary for 120 volt V2G systems are assumed to be $550 per vehicle,26 and the components are assumed tohave a 10 year lifetime. These pricing assumptions are for the installation of the V2G components in a household setting,matching the simulation assumption of only household charging. If it is assumed that there are no additional costs afterthe initial investment the levelized cost of the V2G electricity produced is $136.99/MWh�1 , and if the extra wind powerabsorbed into the system is included the levelized cost drops to $116.41/MWh�1 . However, the levelized cost is verysensitive to the assumed maintenance costs: a yearly maintenance costs of 5% of the initial investment raises the costs to$193.98/MWh and $164.82/MWh�1 for the cases without and with the extra wind power absorbed included, respectively.
The most appropriate technologies with which to compare the V2G technology are natural gas fired turbines, whichare also used as operating reserves due to their fast response times. The comparable levelized costs for California27 arecomputed assuming a 60% capacity factor for combined cycle plants, while simple cycle plants are assumed to have 5%capacity factors, a number more in line with the capacity factors of the V2G maximum output typically found in our sim-ulation. The levelized electricity costs are very sensitive to the ratio of debt and equity used to build the plant, as well asthe costs of debt and equity. The California Energy Commission report uses three different scenarios of financing to giveestimates for different debt/equity ratios and costs. Merchant plants are commercial facilities with high costs of equity,independently owned utilities (IOU) have a higher level of debt and slightly lower financing costs while municipal utilitiesare financed solely through debt at a rate of 4.35%, as well as having additional tax advantages. The V2G levelized costsare most comparable to the Municipal values due to the same financing assumptions used, while the percentage increasesfor IOU and Merchant financing for a single technology with high initial capital costs would be comparable for the V2Gcase. The levelized costs for a combined cycle gas plant are estimated as follows:27 Merchant $101.35/MWh�1 , IOU$93.97/MWh�1 and Municipal $87.79/MWh�1 . The costs for advanced simple cycle gas plants are estimated to be:27
Merchant $479.40/MWh�1 , IOU $376.17/MWh�1 and Municipal $248.52/MWh�1 . As a point of comparison, Municipallevelized costs for baseload plants such as advanced nuclear plants are estimated to be $67.01/MWh�1 and for IGCC are$74.70/MWh�1 , though these assume very high utilization rates. Due to the low capacity factors of the V2G capability, theadvanced simple cycle gas plants can be considered the most accurate comparison. The V2G technology has a levelizedcost advantage over this technology, though given the uncertainty in the assumptions the exact advantage is very difficultto quantify. However, since the levelized cost of the V2G with the no maintenance assumption and wind power included isless than half of the comparable cost of the advanced combined cycle gas plant further analysis seems warranted.
Although the levelized costs of V2G under the different assumptions outlined in Table I suggest that the technology hasa chance to be economically competitive, from the electricity supply perspective, with traditional peaking technologies, thisdoes not seem to also be the case from the PHEV owner’s perspective. As seen in Figure 3, the owner of the vehicle willhave to drive, on average, more miles per day on gasoline if the V2G technology is adopted. This will also result in addi-tional expenses for the vehicle owner, approximately 4.3 cents per day for flat rate pricing and 7.7 cents per day for TOUpricing, figures that do not include the monetary effects of battery degradation because of additional charging and discharg-ing. Since for an approximately 11% vehicle penetration rate each vehicle will only discharge to the grid for approximately5.5 minutes per day, each battery will only supply 0.1 kWh per day to the grid. Using a battery degradation cost of $0.042per kWh,5 the average annual degradation cost per vehicle is actually very small, only $1.53 per year, and has virtuallyno effect on the levelized cost calculations. This cost calculation highlights the best potential use for the V2G technology,namely to serve as a high capacity but short duration form of operating reserve. Even with fairly low penetration rates thesheer number of vehicles dictates that there is a large reserve capacity that requires only a small percentage of the capablevehicles to supply power at any point in time. In order to compensate for the additional gasoline usage, assumed to cost
Table I. Levelized costs for various technologies with municipalfinancing assumptions.
V2G – no maintenance costs (MWh�1) $136.99V2G with wind – no maintenance costs (MWh�1) $116.41V2G – with maintenance costs (MWh�1) $193.98V2G with wind – with maintenance costs (MWh�1) $164.82Combined cycle natural gas plant (MWh�1) $87.7927
Advanced simple cycle natural gas plant (MWh�1) $248.5227
Wind Energ. (2011) © 2011 John Wiley & Sons, Ltd.DOI: 10.1002/we

B.-M. S. Hodge et al. Effects of vehicle-to-grid systems on wind power integration global
$3.50 per gallon, the V2G power payback tariffs will have to be equal to $0.43/kWh�1 for flat rate and $0.76/kWh�1 forTOU pricing for the PHEV owner to break even. This analysis shows the importance of designing policies that considertheir impact on all stakeholders as the economics of the PHEVs can ill afford additional uncompensated expenses if theyare to be competitive with conventional vehicles.12 This is an expense that owners must be compensated for and is just forthe additional gasoline they will use in their vehicles if the PHEV is connected to the grid, it does not begin to cover theoriginal capital costs necessary to make the vehicle V2G capable. Additionally, while adding V2G capabilities may seemto make economic sense from a electricity generator’s perspective, the situation can be very different for the consumer, afact that could hinder the levels of adoption necessary to make V2G a practical option. This further illustrates the necessityof examining proposed policies from the perspective of each of the stakeholders in order to ensure their effectiveness.
5. CONCLUSIONS
A multi-paradigm model of the California electricity system has been used to examine if the adoption of plug-in hybrid elec-tric vehicles with vehicle-to-grid power system capability would aid in integrating large amounts of wind energy into thegenerating portfolio. The results of the simulation indicate that the benefits could differ widely for the different stakehold-ers involved with the technology. With wind generation capacity levels of approximately 20% and consumer determinedvehicle charging patterns for realistic PHEV penetration rates the effect of V2G capabilities on wind usage rates is quitesmall. The model also highlights some of the unexamined costs that PHEV owners will experience if they adopt the V2Gtechnology. Additionally, advanced wind forecasting methods could help to eliminate one of the most compelling cases forthe adoption of the V2G technology.
This rather limited role for V2G occurs despite the fact that the scenario examined would require adding the equivalentof the current California wind generation capacity every year until the mandate deadline. These results appear to painta rather more pessimistic view of the future for the V2G technology when compared to previous results reported in theliterature. However, it must be noted that much of the previous work was done using rudimentary calculation techniquesbased upon optimistic assumptions, in order to set an upper-bound on the potential of the technology. There are importantdifferences between the current work and previous studies in the assumed vehicle usage patterns and the use of utilitycontrolled charging of the vehicles. In this study we have used advanced modeling and simulation techniques under a set ofassumptions that we consider to be more realistic, most notably allowing charging when a vehicle returns home instead ofutility controlled vehicle charging, in an attempt to gauge the true usefulness of the technology. However, the persistencemodel for wind output estimation is likely to be at least slightly less accurate than the physical models typically used indispatching, which could lead to decreased V2G power supply in practice.
Although the wind generation rates used in this study are much higher than has yet been seen in any large market in theUnited States, it is important to note that Denmark currently has similar levels of wind power penetration, nearly 20% ofelectricity production28 without subsequent electricity storage additions, and has not as yet experienced reliability issuesdue to its transmission connections to neighboring European nations. California is in a similar situation in that it currentlyimports electricity and could expect to continue electricity imports if necessary in the short-term. However, the scale of theproblem must also be recognized. Denmark has a total installed wind capacity of just over 3GW while California currentlyhas approximately 2.3 GW of wind capacity and would have over 20 GW of capacity with the additions discussed in thisstudy. So if there were a sustained period of wind power downtime in the envisioned scenario the electricity shortfall wouldbe much more difficult to replace with imports or peaking units than in the Danish example. Additionally, the majority ofCalifornia electricity imports come from baseload power plants such as coal-fired generators that cannot respond to windpower production variations on timescales under an hour. So while battery storage techniques, or more specifically V2Gtechnologies, are not yet critical for wind penetration levels on the order of 20%, they may still be required should evenhigher levels of variable and uncertain electricity production be desired.
REFERENCES
1. Kempton W, Tomic J. Journal of Power Sources 2005; 144: 280–294.2. Kempton W, Letendre S. Transportation Research Part D 1997; 2: 157–175.3. Kempton W, Tomic J. Journal of Power Sources 2005; 144: 268–279.4. Milligan M. A chronological reliability model to assess operating reserve allocation to wind power plants. In European
Wind Energy Conference: Copenhagen, Denmark, 2001, available at http://www.nrel.gov/docs/fy02osti/32210.pdf.5. Peterson S, Whitacre J, Apt J. Journal of Power Sources 2010; 195: 2377–2384.6. Short W, Denholm P. A Preliminary Assessment of Plug-In Hybrid Electric Vehicles on Wind Energy Markets. NREL:
Golden, CO, 2006.7. Sioshansi R, Denholm P. Environmental Science and Technology 2009; 43: 1199–1204.
Wind Energ. (2011) © 2011 John Wiley & Sons, Ltd.DOI: 10.1002/we
Effects of vehicle-to-grid systems on wind power integration global B.-M. S. Hodge et al.
8. Lund H, Kempton W. Energy Policy 2008; 36: 3578–3587.9. Hodge B-M, Pekny J, Reklaitis G. A Multi-Paradigm Energy Model for Liquid Natural Gas Analysis. In 1st Annual
Gas Processing Symposium, Alfadala H, Reklaitis G, El-Hawagi M (eds). Elsevier: Doha, Qatar, 2009.10. Hodge B-M, Shukla A, Huang S, Reklaitis G, Venkatasubramanian V, Pekny J. Industrial & Engineering
Chemistry Research 2011; 50(9): 5191–5203. In Press.11. Huang S, Hodge B-M, Pekny J, Reklaitis GV. The Impact of PHEV Adoption on Natural Gas Demand in Electricity
Generation. In 2nd Annual Gas Processing Symposium, Alfadala H, Reklaitis GVR, El-Halwagi MM (eds). Elsevier:Qatar, 2010.
12. Huang S, Hodge B-M, Taheripour F, Pekny J, Tyner W, Reklaitis GVR. Energy Policy 2011; 39: 1552–1561.13. TRANSIMS. TRANSIMS Open Source. In TRANSIMS Open Source:, Vol. 2009, 2009.14. Hodge B-M, Shukla A, Huang S, Reklaitis GVR, Venkatasubramanian V, Pekny J. Industrial & Engineering Chemistry
Research 2011; 50(9): 5191–5203. In Press.15. BTS. Highlights of the 2001 National Household Travel Survey. US Department of Transportation: Washington, DC,
2001.16. Highway Vehicle-Miles Traveled (VMT). In Research and Innovative Technology Administration. Bureau of Trans-
portation Statistics: Washington, DC, 2010. Vol. 2010.17. Income in the Past 12 months, Alexandria city, Virginia. In American FactFinder. US Census Bureau: Washington,
DC, 2008.18. Curtin R, Shrago Y, Mikkelsen J. Plug-in Hybrid Electric Vehicles. University of Michigan: Ann Arbor, MI, 2009.19. Milligan M, Schwartz M, Wan Y. Statistical Wind Power Forecasting Models: Results for U.S. Wind Farms. In
WINDPOWER 2003: Austin, TX, 2003, available at http://www.nrel.gov/docs/fy03osti/33956.pdf.20. EIA, Electric Power Annual 2007. In Energy Information Administration, 2009.21. NREL, Wind Integration Datasets–Western Wind Dataset 2009.22. Book M, Groll M, Mosquet X, Rizoulis D, Sticher G. The Comeback of the Electric Car? How Real, How Soon, and
What Must Happen Next. In Boston Consulting Group, 2009.23. Lee D. Nissan-Renault head Carlos Ghosn’s zero emission goal. In BBC News: London, UK, 2010, available at
http://news.bbc.co.uk/2/hi/business/8501348.stm.24. Kintner-Meyer M, Schneider K, Pratt R. Impacts Assessment of Plug-In Hybrid Vehicles on Electric Utilities and
Regional U.S Power Grids Part 1: Technical Analysis. In Pacific Northwest National Laboratory, 2007.25. Projected Costs of Generating Electricity. In Nuclear Energy Agency / International Energy Agency / Organisation for
Economic Co-operation and Development: Paris, France, 2005.26. Tomic J, Kempton W. Journal of Power Sources 2007; 168: 459–468.27. Klein J, Rednam A. Comparitive Costs of California Central Station Electricity Generation Technologies. In California
Energy Commission, 2007.28. Energy Statistics 2008. In Danish Energy Agency, 2009.
Wind Energ. (2011) © 2011 John Wiley & Sons, Ltd.DOI: 10.1002/we