The effects of package materials in combination with food ...
56
1 The effects of package materials in combination with food labels on consumers’ product perception Rosan Nijkamp (s1500856) Faculty of Behavioural, Management and Social Sciences Master Thesis - Marketing Communication Enschede, 20 December 2017 University of Twente First supervisor: Dr. T.J.L. van Rompay Second supervisor: S.R. Jansma
-
Upload
khangminh22 -
Category
Documents
-
view
0 -
download
0
Transcript of The effects of package materials in combination with food ...

1
The effects of package materials in
combination with food labels on
consumers’ product perception
Rosan Nijkamp (s1500856)
Faculty of Behavioural, Management and Social Sciences
Master Thesis - Marketing Communication
Enschede, 20 December 2017
University of Twente
First supervisor: Dr. T.J.L. van Rompay
Second supervisor: S.R. Jansma

2
Abstract
Different studies have found that product packaging can influence the consumers’ overall
perception of the product. Therefore, the packaging of the product is an important
communication tool for the manufacturers to communicate with the consumer. In this study,
the influences of different package materials in combination with food labels on consumers’
product expectations and product perception of coffee and coffee beans are investigated.
While most of the researches are focused on the visual cues, in this research also the influence
of tactile cues are measured. In a 2 (package material: a rough and matt surface versus a
smooth and glossy surface) x 3 (food label: a eco-friendly label versus a quality label versus a
basic label) design, 180 respondents evaluated a package of coffee beans and the coffee in a
taste experiment. The respondents were afterwards split up in two groups: high involved
consumers and low involved consumers. The attractiveness of the packaging, the perceived
quality, the perceived eco-friendliness, the sensory attractiveness, taste intensity, taste liking,
the product experience, the price expectation, and the purchase intension are in this research
the dependent variables. It is found that consumers perceived the rough and matt packaging as
more eco-friendly and are more positive about the taste when they saw and touched the rough
and matt packaging. The food labels have a strong positive influence on the product
expectations and product experience of the consumer as well. What is interesting, is that in
many cases it was not important what kind of food label was presented on the packages, but
that there was a food label presented. There is also an interaction effect found that show that
congruence between the package material and the food label is important when it comes to the
perceived quality. Finally, it was found in the rough and matt condition that the high involved
consumers were considerably more positive about the product as compared to the low
involved consumer.
Keywords: Package Material, Food Labels, Sensory Influences, Product Perception

3
Contents
1. Introduction 4
2. Theoretical framework 7
2.1 Package material surface 7
2.2 Food labels 8
2.3 Congruence 10
2.4 High and low involved consumers 11
2.5 Research model 13
3. Method 13
3.1 Pre-test 1 13
3.1.1 Respondents 13
3.1.2 Stimuli 13
3.1.3 Procedure 14
3.1.4 Results pre-test 1 14
3.2 Pre-test 2 16
3.1.1 Respondents 16
3.1.2 Stimuli 16
3.1.3 Procedure 17
3.1.4 Results pre-test 2 17
3.3 Main study 19
3.3.1 Respondents 20
3.3.2 Stimuli 20
3.3.3 Instrument 21
3.3.4 Procedure 26
4. Results 26
4.1 Attractiveness of the packaging 27
4.2 Perceived quality 28
4.3 Perceived eco-friendliness 30
4.4 Sensory attractiveness 32
4.5 Taste intensity 33
4.6 Taste liking 34
4.7 Product experience 34
4.8 Price expectation 36
4.9 Purchase intention 37
4.10 Overview Univariate Analyses 38
4.11 Confirmation of the hypotheses 39
5. Discussion 41
5.1 General discussion 41
5.2 Theoretical implications 44
5.3 Practical implications 44
5.4 Research limitations and future research 45
5.5 Conclusion 46
6. References 48
Appendix A: Questionnaire pre-test 1 53
Appendix B: Questionnaire pre-test 2 54
Appendix C: Questionnaire main study 55

4
1. Introduction
Going to the supermarket and buying the product you need is for the most people every day
routine. Nevertheless, the consumer in the supermarket is facing thousands of different
products from which a choice must be made. 73 percent of the purchasing decisions are taken
at the point of sale itself (Rentie & Brewer, 2000). This means that consumers make the most
of their purchasing decisions by comparing different products within a product category and
making a choice in the store itself. Therefore, the packaging of the product is an important
communication tool for the manufacturers to communicate with the consumer. Many
consumers expect that they make a thoughtful and conscious decision in a supermarket, but
this is often not the case. Consumers often make unconscious decisions when it comes to low
involvement products, like the most products in a supermarket (Dijksterhuis et al., 2005). In
this study, the influences of package material and design elements on the product perception
of the consumer are investigated. The product that is tested is a package of coffee beans. For
many consumers is this a low involvement product, but for some consumers it can become a
more high involved product. Coffee beans come in many price ranges, quality difference, and
have varied origin. People have different motives to buy a specific product. For example,
people would like to have a product that is fair-trade, from high quality, or just buy the
product with the lowest price.
In most cases, packaging plays a major role at the moment of purchase. The role of
the visual aspects in packaging on product expectations and product experience has been
extensively explored during the past decades. Visual elements such as colour, shape, and size
were the most used elements in package design for a long time. For example, how a surface
reflects light is important to a products’ overall perceived qualities (Chen et al, 2009). How a
product looks, has in almost all cases influence on the consumers’ product perception.
Therefore, visual elements are a part of this study. Even though the role of visual elements in
packages has been extensively explored, it remains an important aspect of influencing the
consumers’ product perception.
But, consumers generally judge products through more than one sense. Therefore
another sensory element is taken in this study, namely the role of tactile cues. In contrast to
the many studies that explored the role of visual cues on product perception, there are only a
few studies that explored the role of tactile cues - while tactile cues play an increasing role in
package design. Touch is one of the senses through which consumers’ judge different
products (Chen et al, 2009). Increasingly, marketers, and designers are coming to realize the

5
importance of the sense of touch to attract the attention of consumers and create a rich product
experience to the consumer (Jansson-Boyd, 2011; Spence & Gallace, 2011). An example of
the influence of tactile cues is noted in a study by Piqueras-Fiszman and Spence (2012). They
did research into the surface texture (rough/granular versus smooth) of packaging. In this
research, participants tasted biscuits and yoghurt samples from pots with different surface
textures. Piqueras-Fiszman and Spence found in their study that the texture of the package
influenced peoples ratings of certain of the texture attributes being assessed, namely the most
related ones. This research underlines the importance of tactile cues in the perception of food
products.
In this study, the focus is on the combination between tactile and visual aspects. There
is looked at the packaging material that draws expectations about the content of the package,
but that is not directly related to the content. People obtain information from packaging
features such as materials, shape or colours to create expectations toward a specific product. It
is important to note that such usage of information should not be considered a conscious
process, but should be seen as an implicit process in which the consumer used implicit
schemata. With this schemata the consumer derived impressions from one or more sources
and shape expectations for subsequent product expectations and experience (Pinson, 1986).
Beside the implicit factors that influence the consumers’ product expectations and
experience, there is another factor taken in this study - namely food labels on the packages.
This elements affects the consumer in a more explicit way when it comes to creating product
expectations. Food labels are increasingly used and have become an important factor in
package design. Producers communicate through the use of package labels with de consumer
at the point of sale. Producers of food and beverages should be responding to consumer
behavioural trends and will have to distinguish themselves from competitors to be successful
in de food business. For example, people are more consciously working on a responsible and
healthy lifestyle. They want to consume qualitative, organic and also tasty food products.
Many food producers respond to this move and seek the consumers’ attention with different
communication strategies, including the use of the product packaging. For instance, food
labels communicate to consumers that a specific product is ethically responsible, high in
quality or a healthy choice. This element in package design is often an explicit factor. The
consumer links the information on the labels directly to the product. This in contrast to the
tactile information obtained by package material. In this study, there is an eco-friendly food
label, a quality label, and a basic label. The basic label served as a control group in this study.

6
There is looked at the influence of this information labels on the product expectations and
experience of the consumer.
The last factor in this research is the level of involvement. The respondents are
categorized in two groups, namely high involved consumers and low involved consumers.
This is included in the research to discover the difference between this two groups when it
comes to the effect of implicit and explicit influences. There are many studies that described
how consumers make a purchase decision, but not how the level of involvement has influence
on the perception of a product.
The combination of these three factors makes this research innovative. Firstly, because
the influence of material surface patterns on food and beverage evaluation is limited. Tactile
properties of the product and/or the packaging are important aspects in influencing the
consumer, they are seen as highly important sensory input (Schifferstein & Cleiren, 2005).
However, there are less studies about the influence of tactile aspects in packages and products
on consumer responses. Also the combination with different food labels will give new
insights in the consumers’ reactions on food products. There is looked at the congruence
between package materials and food labels and how this has an effect on product expectations
and experience. There is looked at the interaction between these two factors and how they
influence consumers with different levels of product involvement.
Finally, a short summery of how this concept is tested. The product that is used in this
study are coffee beans. Two different package materials were used: a rough and matt material
and a smooth and glossy material. The package materials are combined with three food labels:
an eco-friendly label, a quality label, and a basic label. At last, the level of the product
involvement of the consumer is taken in this research through divided the respondents in two
groups: low and high involved consumers. With this information, the following research
question is formulated:
“What are the effects of different package materials in combination with food labels on
consumers’ product expectations and product experience of coffee and coffee beans to low
and high involved consumers?”

7
2. Theoretical framework
2.1 Package material surface
The way how a package feels, is an import element to create specific ideas and feelings about
a product. Touch plays an important role in consumers’ product evaluation and product
appreciation (Gallace & Spence, 2009; Gallace & Spence, 2008). Consumers’ tactile
experience of a product can be manipulated by changing the way its surface feels. The texture
of a package surface is a design element that consists of physical attributes created by a
variety of materials and surface finishes. People perceive and predict characteristics of the
surface corresponding to physical attributes through sensory information (Chen et al., 2009).
These package properties are likely to be important in terms of their potential influence on a
consumers’ final multisensory product evaluation (Gallace & Spence, 2008; Spence &
Gallace, 2009).
Different researchers have looked at how materials influence the consumers’
evaluation of food and beverages. For example, an old study showed that the crisp sound of a
wrapper increased the perceived freshness of bread (Brown, 1958). A more recent study
showed that when people touch a flimsy cup, the perceived quality of the content that is
served in the cup decreases (Krishna & Morrin, 2008). Biggs, Juravle and Spence (2016)
showed in their study that biscuits taste sweeter when the participant takes a sample of a
smooth plate, as opposed to a rough plate. Another study shows us that perceived bitterness
and taste intensity increases when people drink from a cup with an angular surface pattern,
whereas a rounded surface pattern induces a sweeter taste evaluation and a less intense taste
experience (van Rompay, Finger, Saakes & Fenko, 2016). Also the study mentioned in the
introduction of Piqueras-Fiszmana and Spence (2012) shows us that the texture of packaging
influences people’s ratings of certain texture attributes being assessed.
All these researches underline the importance of tactile cues in the perception of food
products. With the information above and the findings that the usage of packages can enhance
the perceived taste, the following hypotheses can be formulated:
Hypothesis 1: The perceived taste intensity of the product will be higher if the package has a
rough/matt surface as compared to a smooth/glossy surface.
Beside the taste, also the perceived naturalness can be influenced by the package
surface textures. Materials perceived as being rough when touched and have a matt look,
generates the highest expected naturalness and eco-friendliness (Labbe, Pineau & Martin,

8
2013). Natural products are related to the absence of human intervention by opposition to
non-natural entities which are widely transformed by human intervention (Rozin et al., 2004;
Rozin, 2005). Rough materials might be related to imperfection and close to nature, this in
contrast to smooth and rigid materials. Smooth materials are often more processed and
consequently non-natural materials such as plastic based materials (Labbe, Pineau & Martin,
2013). Therefore, the following hypotheses is formulated:
Hypothesis 2: The perceived eco-friendliness of the product will be higher if the package has
a rough/matt surface as compared to smooth/glossy surface.
The opposite of the rough and matt package surface, is the smooth and glossy package.
Glossiness is seen as an important feature of attraction. It is a deep-rooted and very human
preference (Meert, Pandelaere & Patrick, 2014). Cloonan and Briand Decré (2015) found
strong support that individual preferences for glossiness affects product liking and therefore
this can be a useful feature for package designs. A glossy packaging surface has also an
affective and cognitive impact towards the perception on the attractiveness, level cost, and
quality of product. Glossy packages are often perceived as higher quality and luxurious than
packages with a matt surface (Chind & Sahachaisaeree, 2012). Based on this information, the
following hypotheses are formulated:
Hypothesis 3 The attractiveness of the product will be higher if the package has a
smooth/glossy surface as compared to a rough/matt surface.
Hypothesis 4: The perceived quality of the product will be higher if the package has a
smooth/glossy surface as compared to a rough/matt surface
2.2 Food labels
The use of food labels has become increasingly important in the last decades. A reason for
this is the increasing consumer demand for safer, healthier, and more environmentally
friendly products (Loureiro, McCluskey & Mittelhammer, 2001). The use for food labels in
general is to provide consumers with information, so they are able to choose products that
match their individual preferences. For example, some consumers are looking specifically for
ethical products, but ethical attributes are credence goods and cannot be checked by the
consumer. In this case labelling is especially qualified to raise standards of ethical values and
to allow consumers to match products to their individual preferences (Annunziata, Ianuario &
9
Pascale, 2011).
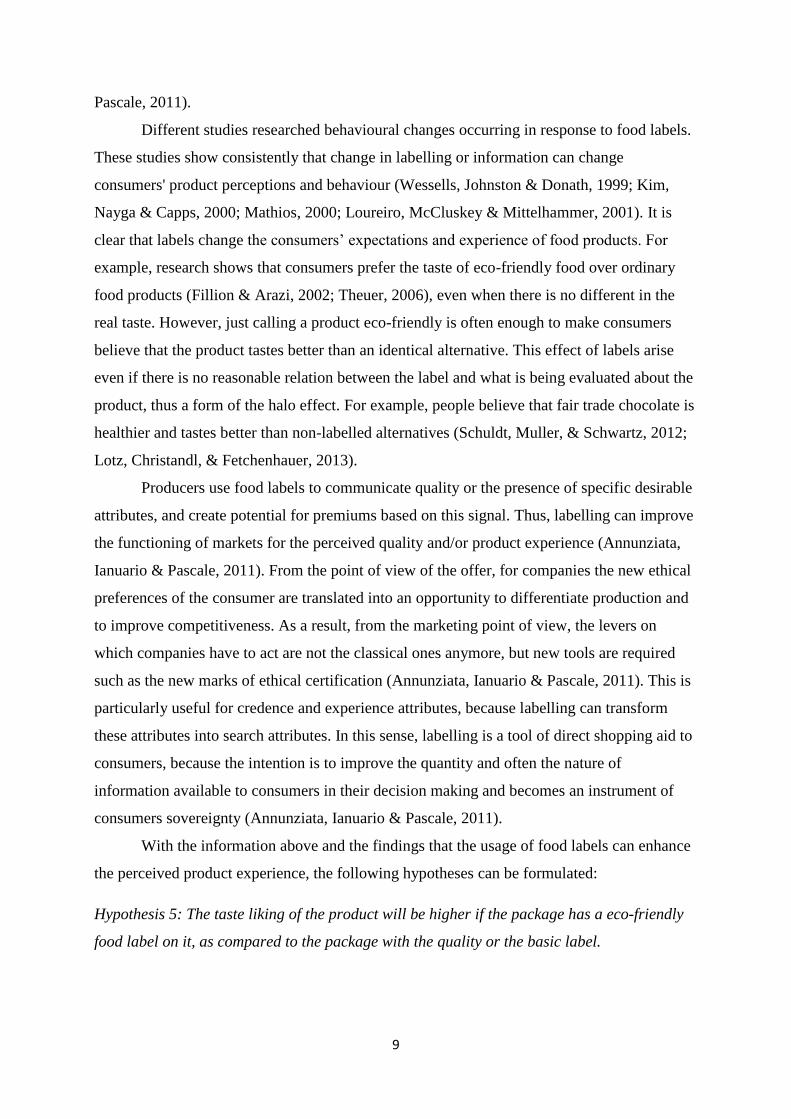
Different studies researched behavioural changes occurring in response to food labels.
These studies show consistently that change in labelling or information can change
consumers' product perceptions and behaviour (Wessells, Johnston & Donath, 1999; Kim,
Nayga & Capps, 2000; Mathios, 2000; Loureiro, McCluskey & Mittelhammer, 2001). It is
clear that labels change the consumers’ expectations and experience of food products. For
example, research shows that consumers prefer the taste of eco-friendly food over ordinary
food products (Fillion & Arazi, 2002; Theuer, 2006), even when there is no different in the
real taste. However, just calling a product eco-friendly is often enough to make consumers
believe that the product tastes better than an identical alternative. This effect of labels arise
even if there is no reasonable relation between the label and what is being evaluated about the
product, thus a form of the halo effect. For example, people believe that fair trade chocolate is
healthier and tastes better than non-labelled alternatives (Schuldt, Muller, & Schwartz, 2012;
Lotz, Christandl, & Fetchenhauer, 2013).
Producers use food labels to communicate quality or the presence of specific desirable
attributes, and create potential for premiums based on this signal. Thus, labelling can improve
the functioning of markets for the perceived quality and/or product experience (Annunziata,
Ianuario & Pascale, 2011). From the point of view of the offer, for companies the new ethical
preferences of the consumer are translated into an opportunity to differentiate production and
to improve competitiveness. As a result, from the marketing point of view, the levers on
which companies have to act are not the classical ones anymore, but new tools are required
such as the new marks of ethical certification (Annunziata, Ianuario & Pascale, 2011). This is
particularly useful for credence and experience attributes, because labelling can transform
these attributes into search attributes. In this sense, labelling is a tool of direct shopping aid to
consumers, because the intention is to improve the quantity and often the nature of
information available to consumers in their decision making and becomes an instrument of
consumers sovereignty (Annunziata, Ianuario & Pascale, 2011).
With the information above and the findings that the usage of food labels can enhance
the perceived product experience, the following hypotheses can be formulated:
Hypothesis 5: The taste liking of the product will be higher if the package has a eco-friendly
food label on it, as compared to the package with the quality or the basic label.

10
Hypothesis 6: The perceived eco-friendliness of the product will be higher if the package has
an eco-friendly food label on it, as compared to a package with the quality label or the basic
label.
Hypothesis 7: The perceived quality of the product will be higher if the package has a quality
food label on it, as compared to the package with the eco-friendly label or the basic label.
2.3 Congruence
The findings mentioned above show us that consumers rely on packing features to draw
conclusions about the content of the package, even when the package is not directly related
and has no direct influence on its content. An interesting phenomenon and in line with this
notions, is the effect of congruence. This is an important effect when it comes to intrinsic and
unconsciously influencing the consumers’ expectations and especially product attractiveness.
Different studies show that congruence may have a positive affect to consumer responses
when it comes to the perceived product value, product impressions, and product experience
(Bottomley & Doyle, 2006; Erdem & Swait, 2004). When consumers are confronted with a
product and its packaging, they have to integrate all the meanings of the exposed elements
and create an overall product impression. Mixed signals in a package design may create
ambiguity with respect to the perceived product identity and also a negative influence
affecting subsequent product evaluations (Reber, Schwarz & Winkielman, 2004).
When the design elements and information on packages are congruence, they may
have a positive influence on the consumer (Reber, Schwarz & Winkielman, 2004).
Congruence between stimuli leads to a fluent process of information. When people process
stimuli fluently, they see this as an important aspect of attractiveness (Cho & Schwarz, 2010).
Processing fluency is the subjective experience of how easy and how fast the incoming
stimuli are processed (Reber, Winkielman & Schwarz, 1998). People use processing fluency
as a cue to indicate how benign the stimuli are (Winkielman et al. 2006). A fluency signal is
seen as hedonic, such that high fluency provokes a positive affective reaction. While people
do not have a reasonable explanation for this positive reaction, they connect the fluency to the
stimuli and associate this with greater attractiveness (Schwarz, 2004).
In this case, the package material should be congruence with the food label on the
package. According to recent studies, the package with a rough and matt surface will
congruence with the eco-friendly label. When people touch and see the rough martials, they
generated the highest expected naturalness and eco-friendliness (Labbe, Pineau, Martin,

11
2013). On the other hand, the package with a smooth and glossy surface will be congruence
with the quality label, because people associate glossiness with high quality (Chind &
Sahachaisaeree, 2012). With this information about congruence and fluency, the next
hypothesis can be formulated:
Hypothesis 8: The overall product liking will be higher with the packages where the material
and the food label (rough/matt & eco-friendly and smooth/glossy & quality label) are
congruence as opposed to the packages where the material and the food label are
incongruence.
2.4 High and low involved consumers
To understand the choices of the consumer and apply this into a package design, it should be
clear how consumers make choices and how they process information. There are a couple of
theories about dual processing. A dual process theory provides a description of how a
phenomenon can occur in two different ways, or as a result of two different processes. Often,
the two processes consist of an implicit (automatic), unconscious process and an explicit
(controlled), conscious process.
One of these theories is the Elaboration Likelihood Model of Petty and Cacioppo
(1986). This theory provides a guideline describing how consumers process information at the
point of purchase. According to their theory, there are two different routes to persuasion at the
moment people make decisions. At first the central route, this takes place when the consumer
is thinking carefully about the product, elaborating on the information they are given, and
based on this information- creating an argument to buy a product or not. This route occurs
when the motivation and the ability of the consumer is high. For example, people who are
specifically looking for organic products or products without specific ingredients should use
this central route more than people who do not look for specific product characteristics. The
second route is the peripheral route and this takes place when the consumer is not thinking
carefully about a product and uses shortcuts to make judgments and decisions. This route
occurs when the motivation or ability of the consumer is low (Petty & Cacioppo, 1986).
Research shows that in everyday life consumer behaviour is often effortless and
automatic and relies on the peripheral route (Chen & Bargh, 1997; Bargh &Chartrand, 1999;
Kahneman, 2003). Especially when small choices must be made - as in the supermarket - the
peripheral route will prevail (Bargh, 2002; Dijksterhuis et al., 2005). Food and beverage
producers respond often to this phenomenon of decision making through the packaging of

12
their products. Different studies have found that product packaging can influence the
consumers’ overall perception of the product (Spence, Harrar & Piqueras-Fiszman, 2012)
especially when it comes to low involved consumers. The packaging is often designed in a
way that the consumer unconsciously creates some expectations of a product without actually
having experience with this specific product. These unconscious expectations may be
stimulated by various aspects of the package, such as colour, shape, design, and also - like in
this study - the material of the packaging. But, a part of the consumers make a higher effort
and have higher awareness when making a choice for a product. For example, when
consumers look specifically for a high quality food product or a product that is ethically
responsible. When this is the case, consumers should also use the central route.
For this research, there is looked if the respondents are relatively high or low involved
when it comes to making decisions in the supermarket. Of course, when people buy things
with bigger consequences, like a car, the involvement will be much higher than when people
buy a package of coffee beans. But there will be differences between people in how they
make decisions and therefore the terms high and low involved consumers are used in a
relative manner. So, the respondents are categorized in the two groups of consumers
mentioned in the introduction. The first group are low involved consumers, thus people who
make fast and unconscious purchase decisions. The second groups are the high involved
consumers who think carefully about the product, elaborating on the information they are
given, and based on this - creating an argument to make a decision. Low involved consumers,
according to studies, are more sensitive to design elements to which they are exposed
(Dijksterhuis et al., 2005). On the other hand, the high involved consumers should be more
influenced by information on the package. Therefore, the following hypotheses is formulated:
Hypothesis 9: The low involved consumers are more sensitive for intrinsic influences (the
package material), as compared to high involved consumers.
Hypothesis 10: The high involved consumers are more sensitive for extrinsic influences (food
labels), as compared to low involved consumers.

13
2.5 Research model
To test the ten formulated hypotheses, the research model depicted in Figure 1 is used.
Figure 1: Research model
3. Method
3.1 Pre-test 1
The aim of the first pre-test was to select two food labels for the main study. This pre-test was
conducted to find what associations people have when they see one of the two food labels.
The first food label should radiate more eco-friendliness, while the second food label should
radiate high quality. This are also two main constructs that are measured: quality and eco-
friendliness.
3.1.1 Respondents
A sample of twenty participants were recruited via e-mail, social media, and face-to-face to
participate the pre-test.
3.1.2 Stimuli
The food labels that were used are showed in figure 2 and figure 3. To make sure that
respondents are not affected by colour or design, only the text in the two labels is different.

14
Figure 2: Eco-friendly label Figure 3: Quality label
3.1.3 Procedure
In an online survey, the respondents were shown one of the labels first. While they are
looking at the label, they get twelve statements to answer with a 5-point Likert scale from
totally disagree to totally agree (Appendix A). The construct Quality consists of three items
and the construct Eco-friendliness consists of four items. Beside this, the attractiveness and
how realistic the two labels are, were also measured with one item for both.
Before analysing the results, the Cronbach’s Alpha of the two main constructs were
analysed to see if the internal consistency of the items was at least 0.7, which is seen as a
satisfactory value. After deleting the item ‘cheap’ in the construct Quality, the Cronbach’s
Alpha of this construct had a value of 0.73. In the construct Eco-friendliness is also one item
deleted to get a higher value, namely the item ‘healthy’. Without this item, the Cronbach’s
Alpha had a value of 0.87. For the constructs Attractiveness and Realistic were just one item
and so no Cronbach’s Alpha.
3.1.4 Results pre-test 1
The collected data of the pre-test was analysed in SPSS. The means and the standard
deviation for the different constructs were measured. The outcomes confirm that the quality
label is perceived as higher quality in contrast with the eco-friendly label. The mean scores
and standard deviation of the dependent variables are shown in table 1.

15
5-point Likert scale (1=disagree / 5=agree)
The second construct was the perceived eco-friendliness. In this construct, the outcomes
confirm that the eco-friendly label is perceived as more eco-friendly in contrast with the
quality label. An overview of this results is given in table 2.
Beside the two mean constructs, also the attractiveness was measured. The results of the pre-
test shows that the quality label is perceived as more attractive than the eco-friendly label. An
overview of this results is given in table 3.
5-point Likert scale (1=disagree / 5=agree)
Table 1: Quality
Label N Mean SD
Quality 10 3.76 0.69
Eco-friendly 10 2.93 0.58
Total 20 3.35 0.72
Table 2: Eco-friendliness
Label N Mean SD
Quality 10 2,78 0.54
Eco-friendly 10 3.76 0.74
Total 20 3.45 0.93
5-point Likert scale (1=disagree / 5=agree)
Table 3: Attractive
Label N Mean SD
Quality 10 3.80 0.78
Eco-friendly 10 3.20 1.03
Total 20 3.50 0.94

16
The last construct that was measured, is how realistic the two labels are. The results show that
the quality label is a bit more realistic than the eco-friendly label, but both are perceived as
generally realistic. An overview of this results can be found in table 4.
5-point Likert scale (1=disagree / 5=agree)
3.2 Pre-test 2
The aim of the second pre-test was to select two package materials for the main study. This
pre-test was conducted to find associations that people had when they touched and saw the
different package materials. When we looked at the findings in previous studies – the smooth
and glossy package should radiate high quality, while the rough and matt package should
radiate more naturalness and eco-friendliness. These are also the two main constructs: quality
and eco-friendliness.
3.2.1 Respondents
A sample of twenty other participants than in pre-test 1 were recruited via face-to-face contact
to participate the pre-test.
3.2.2 Stimuli
The packages that were used are shown in figure 4 and figure 5.
Table 4: Realistic
Label N Mean SD
Quality 10 3.90 0.87
Eco-friendly 10 3.60 0.96
Total 20 3.75 0.91

17
Figure 4: Rough and matt package Figure 5: Smooth and glossy package
3.2.3 Procedure
The respondents were shown one of packages. While they looked at the package and touched
the package, they got a questionnaire with twelve statements to answer with a 5-point Likert
scale from totally disagree to totally agree (Appendix B). The construct quality consists of
three items and the construct eco-friendliness consists of four items. In this pre-test the
attractiveness and how realistic the two packages are were also measured with one item.
Before analysing the results, the Cronbach’s Alpha of the two main constructs was
analysed to find out the internal consistency of the items was at least 0.7. After deleting one
item in the construct Quality, again the item ‘cheap’, the Cronbach’s Alpha of this construct
had a value of 0.81. In the construct Eco-friendliness is also one item deleted to get a higher
value, namely the item ‘healthy’ and in this case the Cronbach’s Alpha had a value of 0.90.
For the constructs Attractiveness and Realistic was only one question and so no Cronbach’s
Alpha.
3.2.4 Results pre-test 2
The collected data of the pre-test was analysed in SPSS. The means for the different
constructs were measured. The outcomes confirm that the smooth and glossy package is

18
perceived as higher quality in contrast with the rough and matt. The mean scores and standard
deviation of the dependent variables can be found in table 5.
5-point Likert scale (1=disagree / 5=agree)
The second construct was the perceived eco-friendliness. In this construct, the outcomes
confirm that the rough and matt package is perceived as more eco-friendly in contrast to the
smooth and glossy package. An overview of this results is given in table 6.
5-point Likert scale (1=disagree / 5=agree)
Also in pre-test 2, the attractiveness of the packages was measured. The results shows that the
smooth and glossy is perceived as more attractive than the rough and matt package. An
overview of this results are shown table 7.
5-point Likert scale (1=disagree / 5=agree)
Table 5: Quality
Package N Mean SD
Smooth and glossy 10 3.86 0.54
Rough and matt 10 2.76 0.60
Total 20 3.31 0.79
Table 6: Eco-friendliness
Package N Mean SD
Smooth and glossy 10 2.08 0.37
Rough and matt 10 3.98 0.54
Total 20 3.03 1.07
Table 7: Attractive
Package N Mean SD
Smooth and glossy 10 3.30 0.67
Rough and matt 10 2.90 0.73
Total 20 3.10 0.71

19
Finally the construct realistic was measured. The results show that both packages are seen as
realistic. An overview of these results is given in table 8.
5-point Likert scale (1=disagree / 5=agree)
3.3 Main study
The aim of the study was to investigate the effects of different package materials in
combination with food labels on consumers’ product expectations and product experience of
coffee and coffee beans. This study utilizes a 2 (package material: rough and matt versus
smooth and glossy) x 3 (food label: quality versus eco-friendly versus basic) between-subjects
design, creating six conditions (table 9). The level of involvement is beside the package
material and the food labels also an independent variable. The respondents are split up in two
groups: high involved consumers and low involved consumers. The attractiveness of the
packaging, the perceived quality, the perceived eco-friendliness, the sensory attractiveness,
taste intensity, taste liking, the product experience, the price expectation, and the purchase
intension are in this research the dependent variables.
Table 9: Conditions
Condition Material Food label
1 Rough and matt Eco-friendly
2 Rough and matt Quality
3 Rough and matt Basic label
4 Smooth and glossy Eco-friendly
5 Smooth and glossy Quality
6 Smooth and glossy Basic label
Table 8: Realistic
Package N Mean SD
Smooth and glossy 10 4.10 0.73
Rough and matt 10 4.30 0.67
Total 20 4.20 0.69

20
3.3.1 Respondents
For the main study, a sample of 180 Dutch respondents was recruited via face-to-face contact
to participate in the research. All respondents participated completely voluntarily while they
were asked to participate a taste test for a new coffee brand. The participants were between 18
and 84 years old (M = 33.40, SD = 19.46). From the 180 respondents there were 105 female,
61 male, and 14 respondents did not fill in the gender. The respondents participate randomly
to one of the stimulus conditions.
3.3.2 Stimuli
The same package materials and food labels from the pre-tests were used to create for each
condition a unique package (figure 6 till figure 11). However, a basic label was designed to
make the packages more realistic. On this basic label, the food labels of the pre-test were
integrated. In the control conditions, only the basic label was used.
Coffee beans and coffee were needed for looking, smelling, and tasting during the
research. It was important that the coffee and the coffee beans were always the same.
Therefore, one type of coffee beans is used – namely regular coffee beans from HEMA. Also
the coffee that the respondents have tasted was always the same regular HEMA coffee mixed
with the regular coffee from Douwe Egberts. By mixing the two coffees, the respondents will
not recognize a specific taste of a coffee they may be familiar with. Also the strength of the
coffee was always the same – namely 100 gram of coffee per 1.7 liter.
Figure 6: Figure 7: Figure 8:
Rough and matt + Rough and matt + Rough and matt +
Eco-friendly label Quality label Basic label
21
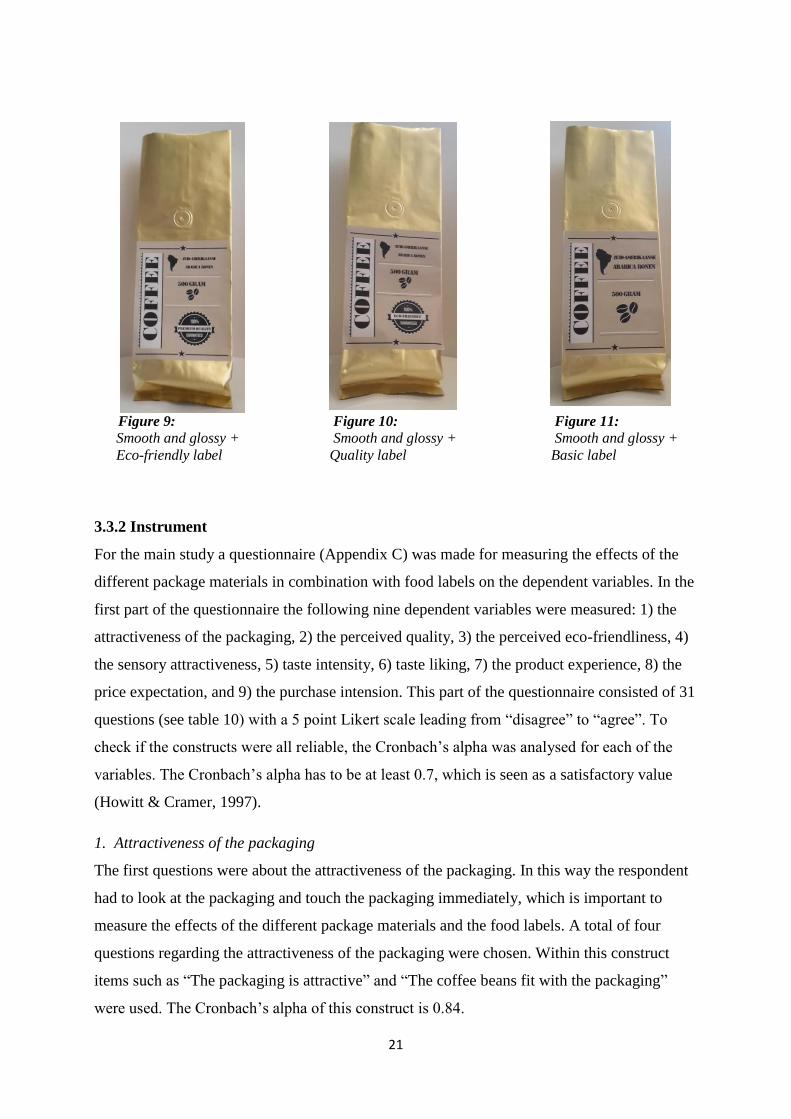
Figure 9: Figure 10: Figure 11:
Smooth and glossy + Smooth and glossy + Smooth and glossy +
Eco-friendly label Quality label Basic label
3.3.2 Instrument
For the main study a questionnaire (Appendix C) was made for measuring the effects of the
different package materials in combination with food labels on the dependent variables. In the
first part of the questionnaire the following nine dependent variables were measured: 1) the
attractiveness of the packaging, 2) the perceived quality, 3) the perceived eco-friendliness, 4)
the sensory attractiveness, 5) taste intensity, 6) taste liking, 7) the product experience, 8) the
price expectation, and 9) the purchase intension. This part of the questionnaire consisted of 31
questions (see table 10) with a 5 point Likert scale leading from “disagree” to “agree”. To
check if the constructs were all reliable, the Cronbach’s alpha was analysed for each of the
variables. The Cronbach’s alpha has to be at least 0.7, which is seen as a satisfactory value
(Howitt & Cramer, 1997).
1. Attractiveness of the packaging
The first questions were about the attractiveness of the packaging. In this way the respondent
had to look at the packaging and touch the packaging immediately, which is important to
measure the effects of the different package materials and the food labels. A total of four
questions regarding the attractiveness of the packaging were chosen. Within this construct
items such as “The packaging is attractive” and “The coffee beans fit with the packaging”
were used. The Cronbach’s alpha of this construct is 0.84.

22
2. Perceived quality
For the construct perceived quality a total of three items were asked. Items such as “I expect
the coffee beans to be of high quality ” and “The product seems to me like a luxury product”
were asked. The Cronbach’s alpha of this construct was 0.59. This value showed us that the
construct is not reliable, therefore one items is deleted what increased the Cronbach’s alpha to
0.71 (table 10).
3. Perceived eco-friendliness
A total of three questions regarding the perceived eco-friendliness were chosen based on
previous survey questions from the Food Choice Questionnaire (Steptoe, Pollard & Wardle,
1995). Examples of items in this construct are “I expect the product to be fair-trade” and “I
expect the coffee beans to be organic”. The Cronbach’s alpha of this construct is 0.92.
4. Sensory attractiveness
The sensory attractiveness was measured with the help of a previous survey from the Food
Choice Questionnaire as well (Steptoe, Pollard & Wardle, 1995). The questions were slightly
changed to match the present research more. A total of four questions were asked to measure
the sensory attractiveness. Items such as “The coffee beans have a nice smell” and “The
coffee has a pleasant aroma” were asked. The Cronbach’s alpha of this construct is 0.79.
5. Taste intensity
A total of four questions regarding the taste intensity of the coffee were asked. Examples of
items in this construct are “The coffee has a powerful taste” and “The coffee has a mild taste”.
The Cronbach’s alpha of this construct is 0.82.
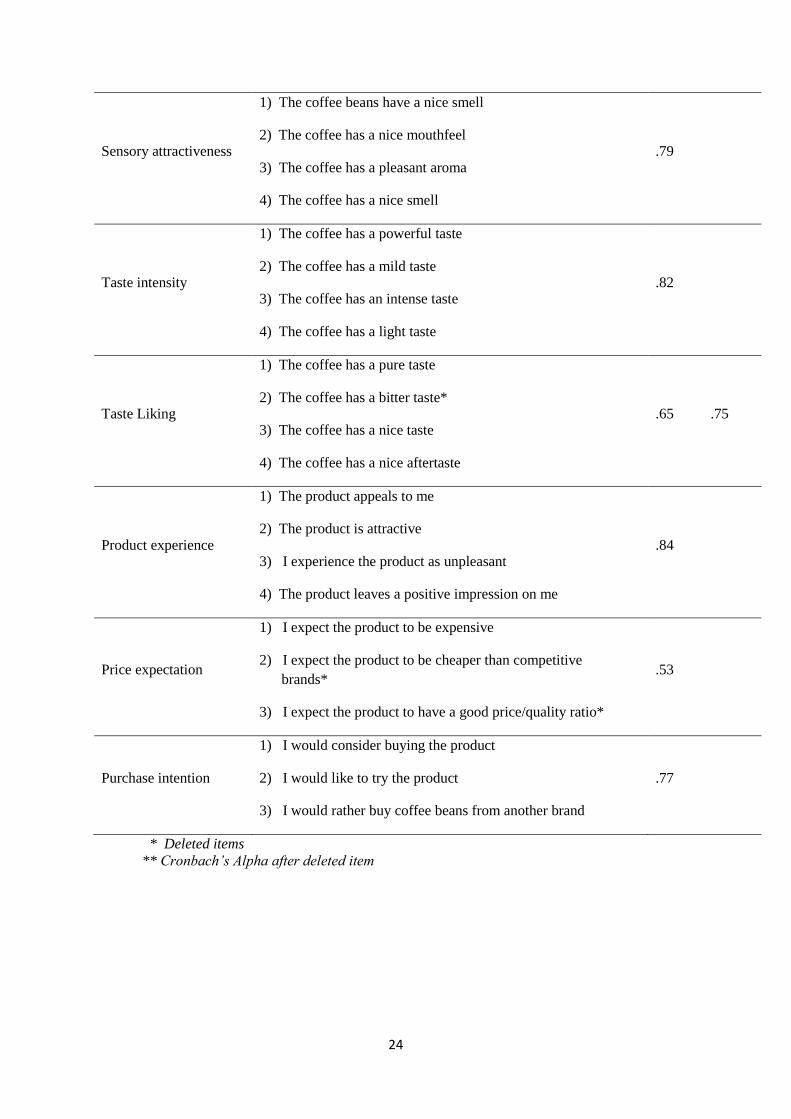
6. Taste Liking
For the construct Taste Liking a total of four items were asked. Items such as “I like the taste
of the coffee” and “The coffee has a nice aftertaste” were asked. The Cronbach’s alpha of this
construct was 0.65. This value shows us that the construct is not reliable, therefore one items
is deleted what increased the Cronbach’s alpha to 0.75.
7. Product experience
The product experience is measured based on a previous survey from Hirschman & Solomon
(1984). The questions were slightly changed to make them fit in the present research. A total
of four questions were asked for the product experience. Within this construct items such as

23
“The product is attractive” and “The product appeals to me” were used. The Cronbach’s alpha
of this construct was 0.84.
8 Price expectation
A total of three questions regarding the price expectation of the coffee beans were chosen
based on a previous survey questions from the Food Choice Questionnaire (Steptoe, Pollard &
Wardle, 1995). Examples of items in this construct are “I expect the product to be expensive”
and “I expect the product to be cheaper than competitive brands”. The Cronbach’s alpha of
this construct is 0.53. This value shows us that the construct is not reliable, therefore one
items is deleted what increased the Cronbach’s alpha to 0.62 – which is still too low to be
reliable. Therefore the choice was made to do the analyses with only the item “I expect the
product to be expensive”.
9. Purchase intention
The last dependent variable is the purchase intention. Three items based on the scale from
Dodds, Monroe & Grewal (1991) were used. Examples of questions in this construct are “I
would like to try this product “ and “I would consider buying this product”. The Cronbach’s
alpha of purchase intention was 0.77.
Table 10: Cronbach’s Alpha per construct (1)
Construct Item 𝜶 𝜶**
Attractiveness of the
packaging
1) The coffee beans fits with the packaging
2) The packaging is attractive
3) The packaging appeals to me
.84
Perceived quality
1) I expect the coffee beans to be of high quality
2) The product comes to me like a luxury product*
3) I expect competitive brands to be of better quality
.59 .71
Perceived eco-
friendliness
1) I expect the coffee beans to be organic
2) I expect the coffee beans to be produced in an
ecologically responsible way
3) I expect the product to be fair-trade
.92
24
Sensory attractiveness
1) The coffee beans have a nice smell
2) The coffee has a nice mouthfeel
3) The coffee has a pleasant aroma
4) The coffee has a nice smell
.79
Taste intensity
1) The coffee has a powerful taste
2) The coffee has a mild taste
3) The coffee has an intense taste
4) The coffee has a light taste
.82
Taste Liking
1) The coffee has a pure taste
2) The coffee has a bitter taste*
3) The coffee has a nice taste
4) The coffee has a nice aftertaste
.65 .75
Product experience
1) The product appeals to me
2) The product is attractive
3) I experience the product as unpleasant
4) The product leaves a positive impression on me
.84
Price expectation
1) I expect the product to be expensive
2) I expect the product to be cheaper than competitive
brands*
3) I expect the product to have a good price/quality ratio*
.53
Purchase intention
1) I would consider buying the product
2) I would like to try the product
3) I would rather buy coffee beans from another brand
.77
* Deleted items
** Cronbach’s Alpha after deleted item

25
The second part of the questionnaire was made for measuring the level of involvement of the
consumer. This involvement level was divided into two constructs: eco-friendliness focused
and the level of involvement during daily shopping. This part consist seven questions (table
11) with a 5 point Likert scale leading from “disagree” to “agree”.
1. Eco-friendliness focused
For the construct eco-friendliness focused a total of four items were asked. Items such as “I
buy as many products as possible in an ecologically responsible way” and “ I am willing to
pay more for a product that is ecologically responsible” were asked. The Cronbach’s alpha of
this construct was 0.88.
2. The level of involvement during daily shopping
A total of three questions regarding the consumers involvement in general to shopping
behaviour in supermarkets. Items such as “I read and review the label of a product well before
I will buy it” and “In the supermarket, I often compare products of the same category” were
asked. The Cronbach’s alpha of this construct was 0.79.
Only one construct is included in the results, namely the level of involvement during daily
shopping. This because within this construct the most significant interaction effect is found
and in the construct Eco-friendly focused are no significant results found. The respondents are
divided into two groups (high- and low involved) by means of a median split in SPSS.
Table 11: Cronbach’s Alpha per construct (2)
Construct Item 𝜶
Eco-friendliness
focused
1) For me it is important that a product is organic*
2) For me it important that a product is fair-trade*
3) I buy as many products as possible on an ecologically
responsible way are produced*
4) I am willing to pay more for a product that is eco-friendly*
.88
The level of
involvement
1) I read and review the label of a product well before I
buy it .79

26
2) In the supermarket, I often compare products of the
same category
3) I always make an well-considered decision when I buy
a product
*Deleted items
3.3.4 Procedure
Participants were approached individually at a local market or in a canteen and asked to
participate a taste test for a new brand of coffee. At the moment they agreed to participate the
research, the researcher gave a short explanation of what was expected of them. The
researcher first handed the questionnaire and one of the packages, so the respondents could
see and touch the packaging. Subsequently, they received a taste sample of the coffee. The
taste samples were identical in all conditions. While the respondents completing the
questionnaire, the researcher stayed around for questions or comments from the respondents.
After completion the questionnaire, the participants were thanked for their cooperation.
4. Results
The results of the main study are described in this section. To investigate the effects of the
independent variables, analyses of variance were conducted with package material (matt and
rough or glossy and smooth) and food label type (eco-friendly, quality or a basic label) as
independent variables, and the product expectations and product evaluation measured as
dependent variables. A third independent variable is added, namely the level of involvement
during daily shopping of the participants. This third variable is only described in the results
when there are (marginal) significant interaction effects were found. Analyses of univariate
analyse (ANOVA) with Bonferroni corrections were used to investigate if there were
significant interaction effects. The significance level that is used is 0.05 or 0.10 for marginally
significantly differences. In all constructs a 5-point Likert scale (1 = disagree / 5 = agree) is
used.

27
4.1 Attractiveness of the packaging
To see whether the package material and the food label enhances the attractiveness of the
package, an ANOVA was made. A main effect of the food label (F(1,172) = 5,879; p = 0.003)
was found. Pairwise comparisons analysis with Bonferroni corrections showed that the
packages with a food label are more attractive, both for the eco-friendly label (M = 3.77; SD
= 0.97) and the quality label (M = 3.73; SD = 0.85), than the package with the basic label (M
= 3.28; SD = 0.75). An overview of all the mean scores of the independent variables on the
attractiveness of the packaging are shown in table 12.
Table 12: Attractiveness of the packaging
Condition N Mean SD
Rough and matt & Eco-friendly label 30 3.90 1.03
Rough and matt & Quality label 30 3.72 0.90
Rough and matt & Basic label 30 3.28 0.66
Total 90 3.61 0.91
Smooth and glossy & Eco-friendly label 30 3.64 0.91
Smooth and glossy & Quality label 30 3.75 0.81
Smooth and glossy & Basic label 30 3.33 0.83
Total 90 3.57 0.86
There is also a significant interaction effect found between the level of involvement and the
package material (F(1,172) = 5,89; p = 0.016). This interaction effect onto the attractiveness
of the packaging show that the highest result for this construct can be found in the high
involved group when the package is rough and matt (M = 3.84; SD = 0.85). As shown in
figure 12, within the rough and matt package condition, the high involved group as opposed
the low involved group (p = 0.004) sees the packaging as more attractive. Within the smooth
and glossy condition, there are no significant (p = 0.60) differences.

28
Figure 12: Interaction effect of package material and the level of involvement into the
attractiveness of the packages
4.2 Perceived quality
While analysing the perceived quality, no significant main effect was found for the package
material (p = 0.44). For the food label a marginal effect was found (F(1,172) = 2,75; p =
0.06). Pairwise comparisons analysis with Bonferroni corrections showed that the packages
with a eco-friendly food label (M = 3.81; SD = 0.81) and the package with a quality label (M
= 3.75; SD 0.95) are perceived as a higher quality product than the package with the basic
label (M = 3.46; SD = 0.89). Furthermore, there was a significant interaction effect found
between the food labels and the package material (F(1,172) = 5,276; p = 0.006). This
interaction effect onto perceived quality shows that the highest result for this construct can be
found when the rough and matt package is combined with a eco-friendly label (M = 4.05; SD
= 0.86) or when the smooth and glossy package is combined with a quality label (M = 3.96;
SD = 0.91). As shown in figure 13, within the rough and matt package condition, the eco-
friendly label as opposed the basic label (p = 0.001) and the quality label (p = 0.027)
increased the perceived quality. This in contrast to the smooth and glossy condition, where the
eco-friendly label decreased the perceived quality opposed to the quality label (p = 0.06).
Furthermore, within the smooth and glossy condition, the basic labels did not lead to

29
significant differences in the construct perceived quality (p = 0.66). An overview of the mean
scores of the independent variables on the perceived quality are shown in table 13.
Figure 13: Interaction effect of package material and food labels onto perceived quality
Table 13 – Perceived quality
Condition N Mean SD
Rough and matt & Eco-friendly label 30 4.05 0.87
Rough and matt & Quality label 30 3.55 0.95
Rough and matt & Basic label 30 3.46 0.89
Total 90 3.62 0.94
Smooth and glossy & Eco-friendly label 30 3.55 0.68
Smooth and glossy & Quality label 30 3.97 0.92
Smooth and glossy & Basic label 30 3.65 0.92
Total 90 3.72 0.86
There was also a significant interaction effect found between the level of involvement and the
package material (F(1,172) = 4,927; p = 0.028). This interaction effect shows that the highest
result for this construct can be found in the high involved group when the package is rough
and matt (M = 3.82; SD = 0.87). As shown in figure 14, within the rough and matt package
condition, the high involved group as opposed to the low involved group (p = 0.015) estimate

30
the product as a higher quality product. Within the smooth and glossy condition, there are no
significant (p = 0.50) differences.
Figure 14: Interaction effect of package material and the level of involvement into the perceived
quality
4.3 Perceived eco-friendliness
The ANAVO for perceived eco-friendliness show a main effect of package material
(F(1,172) = 34,433; p < 0.005) and of the food label (F(1,172) = 15,752; p < 0.005). Pairwise
comparisons analysis with Bonferroni corrections shows that the packages with a eco-friendly
food label are perceived as a more eco-friendly product (M = 4.23; SD = 0.81) than the
package with a quality label (M = 3.37; SD 1.31) or the basic label (M = 3.25; SD = 1.25).
Also it was found within pairwise comparisons analysis that the rough and matt package is
perceived as a more eco-friendly product (M = 4.07; SD = 1.02) than the product with a
smooth and glossy package (M = 3.16; SD = 1.23). Furthermore, there was a significant
interaction effect found between food label and package material (F(1,172) = 6,051; p =
0.003). This interaction effect onto perceived eco-friendliness shows that the highest result for
this construct can be found when the rough and matt package is combined with a eco-friendly
label (M = 4.31; SD = 0.94). As shown in figure 15, within the smooth and glossy package
condition, the eco-friendly label as opposed to the basic label (p = 0.00) and the quality label
(p = 0.00) increased the perceived eco-friendliness. In the rough and matt condition, the eco-
friendly label shows only a marginally significant differences with the basic label (p = 0.067).
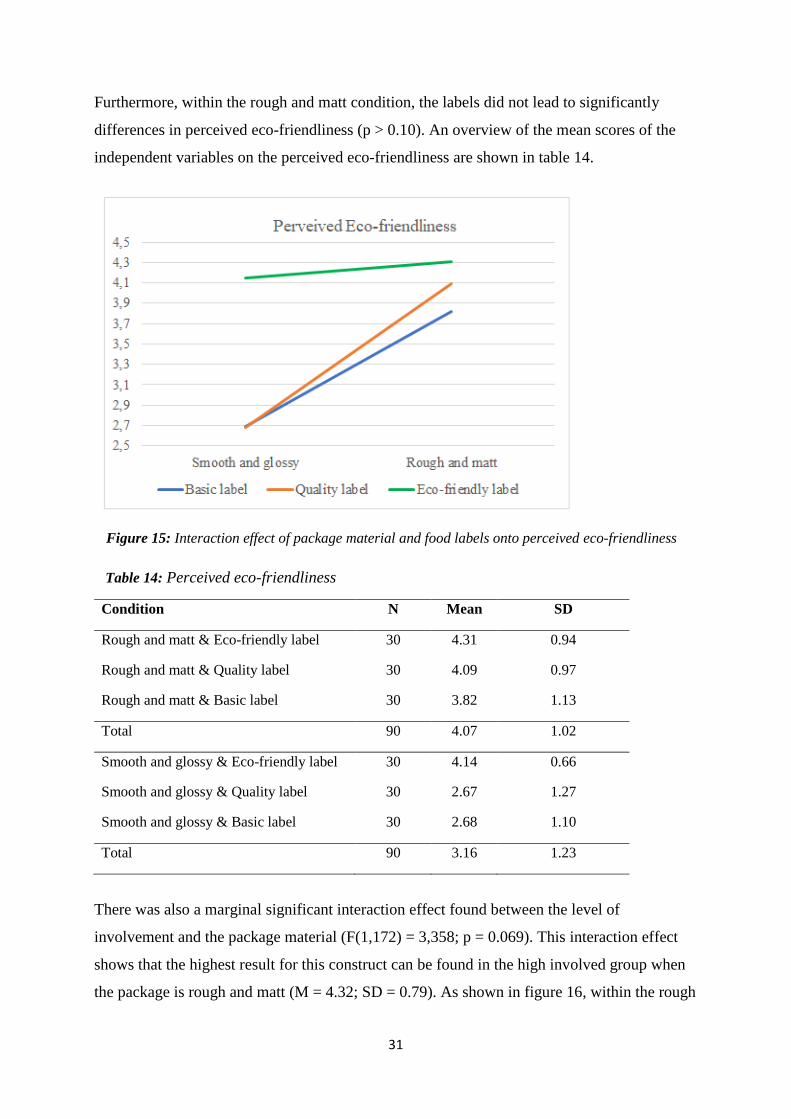
31
Furthermore, within the rough and matt condition, the labels did not lead to significantly
differences in perceived eco-friendliness (p > 0.10). An overview of the mean scores of the
independent variables on the perceived eco-friendliness are shown in table 14.
Figure 15: Interaction effect of package material and food labels onto perceived eco-friendliness
Table 14: Perceived eco-friendliness
Condition N Mean SD
Rough and matt & Eco-friendly label 30 4.31 0.94
Rough and matt & Quality label 30 4.09 0.97
Rough and matt & Basic label 30 3.82 1.13
Total 90 4.07 1.02
Smooth and glossy & Eco-friendly label 30 4.14 0.66
Smooth and glossy & Quality label 30 2.67 1.27
Smooth and glossy & Basic label 30 2.68 1.10
Total 90 3.16 1.23
There was also a marginal significant interaction effect found between the level of
involvement and the package material (F(1,172) = 3,358; p = 0.069). This interaction effect
shows that the highest result for this construct can be found in the high involved group when
the package is rough and matt (M = 4.32; SD = 0.79). As shown in figure 16, within the rough

32
and matt package condition, the high involved group as opposed to the low involved group (p
= 0.013) estimates the product as a more eco-friendly product. Within the smooth and glossy
condition, there are no significant (p = 0.95) differences.
Figure 16: Interaction effect of package material and the level of involvement into perceived eco-
friendliness
4.4 Sensory attractiveness
There were no significant main effects of the package material (F(1,172) = 0,537; p = 0.46)
and the food labels (F(1,172) = 1,558; p = 0.21) on the sensory attractiveness. There was also
no statistically significant interaction effect between this two depend variables (F(1,172) =
1,772; p = 0.17). Mean scores of the dependent variables on the sensory attractiveness are
shown in table 15
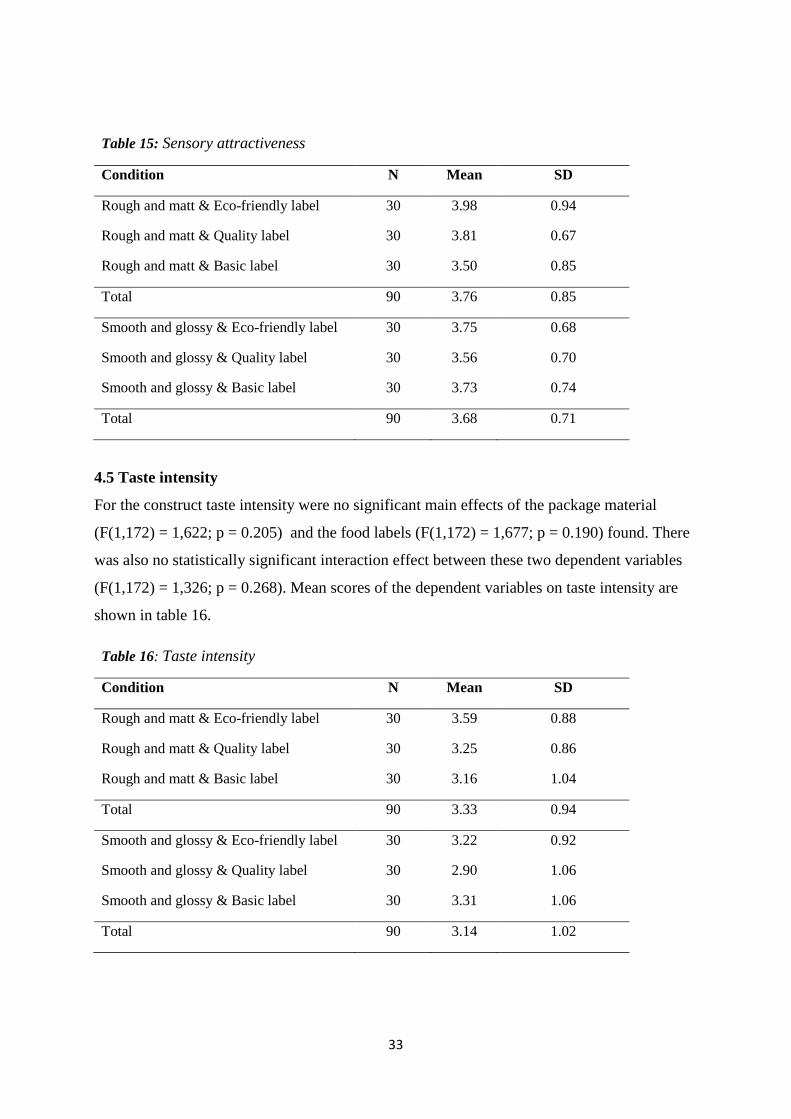
33
Table 15: Sensory attractiveness
Condition N Mean SD
Rough and matt & Eco-friendly label 30 3.98 0.94
Rough and matt & Quality label 30 3.81 0.67
Rough and matt & Basic label 30 3.50 0.85
Total 90 3.76 0.85
Smooth and glossy & Eco-friendly label 30 3.75 0.68
Smooth and glossy & Quality label 30 3.56 0.70
Smooth and glossy & Basic label 30 3.73 0.74
Total 90 3.68 0.71
4.5 Taste intensity
For the construct taste intensity were no significant main effects of the package material
(F(1,172) = 1,622; p = 0.205) and the food labels (F(1,172) = 1,677; p = 0.190) found. There
was also no statistically significant interaction effect between these two dependent variables
(F(1,172) = 1,326; p = 0.268). Mean scores of the dependent variables on taste intensity are
shown in table 16.
Table 16: Taste intensity
Condition N Mean SD
Rough and matt & Eco-friendly label 30 3.59 0.88
Rough and matt & Quality label 30 3.25 0.86
Rough and matt & Basic label 30 3.16 1.04
Total 90 3.33 0.94
Smooth and glossy & Eco-friendly label 30 3.22 0.92
Smooth and glossy & Quality label 30 2.90 1.06
Smooth and glossy & Basic label 30 3.31 1.06
Total 90 3.14 1.02

34
4.6 Taste liking
The ANAVO for taste liking shows a main effect of package material (F(1,172) = 9,403; p =
0.003) and a marginal significant main effect of the food labels (F(1,172) = 2,779; p = 0.06).
Pairwise comparisons analysis with Bonferroni corrections shows that the coffee in
combination with the rough and matt surface is rated higher (M = 3.66; SD = 0.78) than in
combination with the smooth and glossy surface (M = 3.33; SD 0.69). The other main effect
shows that the packages with a eco-friendly food label (M = 3.57; SD = 0.79) and the package
with a quality label (M = 3.60; SD 0.76) are higher rated on taste liking than the packages
with the basic label (M = 3.32; SD = 0.68). There was no statistically significant interaction
effect between this two depend variables (F(1,172) = 2,227; p = 0.106). Mean scores of the
dependent variables on the taste liking are shown in table 17.
Table 17: Taste liking
Condition N Mean SD
Rough and matt & Eco-friendly label 30 3.78 0.85
Rough and matt & Quality label 30 3.82 0.71
Rough and matt & Basic label 30 3.31 0.53
Total 90 3.63 0.74
Smooth and glossy & Eco-friendly label 30 3.27 0.58
Smooth and glossy & Quality label 30 3.37 0.71
Smooth and glossy & Basic label 30 3.23 0.75
Total 90 3.29 0.68
4.7 Product experience
The ANOVA output of the independent variables for product experience shows a significant
main effect of the food labels (F(1,172) = 4,283; p = 0.015). Within the pairwise comparisons
analysis with Bonferroni corrections it was found that the product experience were more
positive to the packages with a eco-friendly food label (M = 3.80; SD = 0.81) and with the
quality label (M = 3.75; SD = 0.79) than the package with basic label (M = 3.40; SD = 0.86).
Mean scores of the dependent variables on product experience are shown in table 18.

35
Table 18: Product experience
Condition N Mean SD
Rough and matt & Eco-friendly label 30 4.04 0.89
Rough and matt & Quality label 30 3.87 0.71
Rough and matt & Basic label 30 3.39 0.93
Total 90 3.76 0.89
Smooth and glossy & Eco-friendly label 30 3.58 0.67
Smooth and glossy & Quality label 30 3.64 0.86
Smooth and glossy & Basic label 30 3.42 0.79
Total 90 3.55 0.77
There is also a significant interaction effect found between the level of involvement and the
package material (F(1,172) = 5,21; p = 0.024). This interaction effect onto the product
experience shows that the highest result for this construct can be found in the high involved
group when the package is rough and matt (M = 3.93; SD = 0.82). As shown in figure 17,
within the rough and matt package condition, the high involved group as opposed to the low
involved group (p = 0.018) experience the product as more positive. Within the smooth and
glossy condition, there are no significant (p = 0.41) differences.
Figure 17: Interaction effect of package material and the product involvement onto product
experience

36
4.8 Price expectation
There were no significant main effects of the package material (F(1,172) = 2,62; p = 0.11)
and the food labels (F(1,172) = 0,913; p = 0.40) on the expected price. But, there is a marginal
significant interaction effect found. This interaction effect onto price expectation shows that
the highest result for this result for this construct can be found when the rough and matt
package is combined with a eco-friendly label (M = 3.87; SD = 0.94). As shown in figure 18,
within the rough and matt package condition, the eco-friendly label as opposed to the quality
label (p = 0.012) increased the expected price. As opposed to the basic label, there is no
significant difference (p=0.12). Within the smooth and glossy package condition, there are no
significant differences (p > 0.10). Mean scores of the dependent variables on price expectation
are shown in table 19.
Figure 18: Interaction effect of package material and food labels onto price expectation

37
Table 19: Price expectation
Condition N Mean SD
Rough and matt & Eco-friendly label 30 3.87 0.93
Rough and matt & Quality label 30 3.20 0.96
Rough and matt & Basic label 30 3.47 1.17
Total 90 3.51 1.05
Smooth and glossy & Eco-friendly label 30 3.17 0.79
Smooth and glossy & Quality label 30 3.33 1.15
Smooth and glossy & Basic label 30 3.30 1,02
Total 90 3.27 0.99
4.9 Purchase intention
To see whether the package material and the food label enhances the purchase intention, an
ANOVA was made. A main effect of the package material (F(1,172) = 4,975; p = 0.027) and
on the food label (F(1,172) = 8,940; p < 0.001) was found. Pairwise comparisons analysis
with Bonferroni corrections shows that for rough and matt surfaced package the purchase
intention was higher (M = 3.40; SD = 0.80) than for the smooth and glossy surfaced package
(M = 3.10; SD = 1.01). Within pairwise comparisons analysis was found that the purchase
intention was higher with the packages with a eco-friendly food label (M = 3.58; SD = 0.89)
than with the quality label (M = 3.25; SD = 0.92) and the package with the basic label (M =
2.91; SD = 0.82). No significant interaction effects were found for this variable. Mean scores
of the dependent variables on the purchase intention are shown in table 20.

38
Table 20: Purchase intention
Condition N Mean SD
Rough and matt & Eco-friendly label 30 3.88 0.95
Rough and matt & Quality label 30 3.32 1.01
Rough and matt & Basic label 30 2.98 0.83
Total 90 3.40 1.01
Smooth and glossy & Eco-friendly label 30 3.28 0.67
Smooth and glossy & Quality label 30 3.18 0.85
Smooth and glossy & Basic label 30 2.84 0.82
Total 90 3.10 0.80
4.10 Overview Univariate Analyses
An overview of the results of the univariate analyses (ANOVA) with Bonferroni corrections
are shown in table 21.
Table 21: Overview outcomes AVONA
Dependent variable Independent variable F-value P
Attractiveness
of the package
Package material
Food label
Package material * label
Package material * Level of involvement
0.099
5.879
0.702
5.894
.753
.003
.497
.016
Perceived quality
Package material
Food label
Package material * Food label
Package material * Level of involvement
0.598
2.752
5.276
4.927
.440
.067
.006
.028
Perceived
Eco-friendliness
Package material
Food label
Package material * Food label
Package material * Level of involvement
34.433
15.752
6.376
3.358
.000
.000
.003
.069

39
Sensory attractiveness
Package material
Food label
Package material * Food label
Package material * Level of involvement
0.537
1.558
1.772
1.018
.465
.214
.173
.314
Taste intensity
Package material
Food label
Package material * Food label
Package material * Level of involvement
1.622
1.677
1.326
0.041
.205
.190
.268
.840
Taste liking
Package material
Food label
Package material * Food label
Package material * Level of involvement
9.403
2.779
2.277
1.135
.003
.065
.106
.288
Product experience
Package material
Food label
Package material * Food label
Package material * Level of involvement
3.189
4.283
1.352
5.209
.076
.015
.262
.024
Price expectation
Package material
Food label
Package material * Food label
Package material * Level of involvement
2.616
0.913
2.600
0.007
.108
.403
.077
.933
Purchase intention
Package material
Food label
Package material * Food label
Package material * Level of involvement
4.975
8.940
1.393
2.617
.027
.000
.251
.108
4.11 Confirmation of the hypotheses
The aim of this study was to get insight into the effects of tactile/sight characteristics of the
package and food labels on packages. By using different package materials in combination
with food labels, the product expectations and product experience of coffee and coffee beans
of the consumers with different levels of product involvement were measured. After analysing
the data, the mentioned hypothesis can be confirmed or rejected by the results (table 22).

40
Table 22: Overview of the hypotheses
Hypothesis Confirmed
H1: The perceived taste intensity of the product will be higher if the package has a
rough/matt surface as compared to a smooth/glossy surface.
H2: The perceived eco-friendliness of the product will be higher if the package has a
rough/matt surface as compared to smooth/glossy surface.
H3: The attractiveness of the product will be higher if the package has a smooth/glossy
surface as compared to a rough/matt surface.
H4: The perceived quality of the product will be higher if the package has a
smooth/glossy surface as compared to a rough/matt surface.
H5: The taste liking of the product will be higher if the package has a eco-friendly
food label on it, as compared to the package with the quality or the basic label.
H6: The perceived eco-friendliness of the product will be higher if the package has an
eco-friendly food label on it, as compared to a package with the quality label or the
basic label.
H7: The perceived quality of the product will be higher if the package has a quality
food label on it, as compared to the package with the eco-friendly label or the basic
label.
H8: The overall product liking will be higher with the packages where the material and
the food label (rough/matt & eco-friendly and smooth/glossy & quality label) are
congruence as opposed to the packages where the material and the food label are
incongruence.
H9: The low involved consumers are more sensitive for intrinsic influences (the
package material), as compared to high involved consumers.
H10: The high involved consumers are more sensitive for extrinsic influences (food
labels), as compared to low involved consumers.
No
No
No
Yes
No/Yes
Yes
No/Yes
No
No
No

41
5. Discussion
5.1 General discussion
A lot of the formulated hypotheses cannot be confirmed, but there are multiple significant
results found - indicating unexpected results and new insights.
Effects of the package material
The findings show that the package material may have an influence when it comes to
perceived eco-friendliness. As expected, the rough and matt package is perceived as a more
eco-friendly product. This is in line with the study of Labbe, Pineau and Martin (2013). In
their study was said that materials perceived as being rough when touched and have a matt
look, generates the highest expected naturalness. Furthermore, the package material have
influence on the product experience. Previous studies show that rough packages increase the
taste intensity or bitterness of a product, but there is no significant evidence for this in this
study. However, there is an significant effect found on taste liking. Within this construct
people were more positive about the taste when the coffee beans were presented in the rough
and matt package, while it was exactly the same product. Finally, there was found that the
purchase intention is higher when the product has a rough and matt package. Looking at all
the results, this is a logical outcome. In almost every construct, the results where more
positive in the conditions with the rough and matt package. An possible explanation for this
could be the behavioural change of the last years that people buy more organic and ethical
responsible products. Such as the results shows us, people associate the rough and matt
package more with eco-friendliness and in this way it will fit better in peoples preferences.
However, this is just an assumption. To confirm this additional research is needed.
Effects of the food labels
The findings presented clearly show that food labels may have an influence on the product
expectations and the product experience of the consumer. When looking at the construct
attractiveness of the packaging, the results show that the packages with a food label are
significant more attractive as compared to the packages with the basic label. These findings
underline the previous study of Schuldt, Muller and Schwartz (2012) and the study of Lotz,
Christandl, and Fetchenhauer (2013) where food labels are seen as a form of the halo effect.
But not only the attractiveness of a product will be higher with a food label, also the perceived
quality and eco-friendliness increases. While analysing the construct perceived quality, a

42
marginally significant effect was found on the variable food labels. These results show that
the packages with a food label are perceived as a higher quality product as opposed to the
packages with a basic label. That the perceived quality is higher in the condition with the
quality label could be seen as obvious. But also the eco-friendly label is linked to high quality.
Perhaps this is also partially due to the halo effect. However, this does not apply to the
perceived eco-friendliness. Within this construct the quality label has no effect, but as
expected - the eco-friendly label leads to a higher perceived eco-friendliness.
Not only the product expectations were influenced by the food labels, also the product
experiences. The construct taste liking shows that the packages with a eco-friendly food label
or the package with a quality label are higher rated on taste liking than the packages with the
basic label. This is in line with the study that shows that consumers prefer the taste of eco-
friendly food over ordinary food products (Fillion & Arazi, 2002; Theuer, 2006), even when
there is no difference in the real taste. However, just calling a product eco-friendly or high
quality is often enough to make consumers believe that the product tastes better than an
identical alternative, like in this case the coffee with the basic label.
All these constructs together lead to a product experience in the same line. Within this
construct it was found that the product experience was more positive with the packages with a
eco-friendly food label or with a quality label than compared to the package with the basic
label. In conclusion, the food labels certainly have an effect on the consumers’ product
expectations and product experiences. But the effects between the two food labels is minimal,
more important is that there is a label presented on the packaging.
Interaction effects food label and package material
Furthermore, there are interesting significant interaction effects found between the food labels
and the package material. Congruency of the package material and the food label turned out to
be important when in becomes to the perceived quality. The perceived quality is rated higher
when the package material and the food label are in congruence to each other. Not only the
quality label in combination with the smooth and glossy package increased the perceived
quality, also the combination with the eco-friendly label and the rough and matt package
increased the perceived quality. This result is in line with studies about fluent information
processing. These studies say that correspondence between stimuli leads to fluent information
processing. A fluency signal is seen as hedonic, such that high fluency provokes a more
positive reaction (Cho & Schwarz, 2010; Schwarz, 2004).

43
But when it comes to the perceived eco-friendliness, the congruency between the
package material and the food label is less important. Within the smooth and glossy package
condition, the eco-friendly label as opposed the basic label and the quality label increased the
perceived eco-friendliness. So, in this case the food label is very important for the perceived
eco-friendliness. In the rough and matt condition, the food labels are less important. The
perceived eco-friendliness is already higher in the rough and matt condition.
The last interaction effect between the package material and the food labels is found in
the construct price expectation. This interaction effect onto price expectation shows that the
highest result for this construct can be found when the rough and matt package is combined
with a eco-friendly label. Consumers probably think that eco-friendly products are more
expensive comparing to general products. However, this is just an assumption. To confirm
this additional research is needed.
Interaction effect package material and level of involvement
Besides the interaction effects that are found between the food labels and the package
materials, there is another interesting interaction effect found between the package material
and the level of involved during daily shopping. Resulting in the constructs attractiveness of
the packaging, perceived quality, perceived eco-friendliness, and product experience is the
interaction effect retrievable. What is interesting, is that there were only significant
differences within the rough and matt package condition found, and not once in the smooth
and glossy conditions. High involved consumers were in all constructs more positive about
the product when it was presented in a rough and matt package as compared to the low
involved consumers. Also the high involved consumers rated the product as more eco-friendly
and as higher quality as compared to the low involved consumer.
Where these effects come from is not entirely clear, but this research confirms the
previous study that says that the product packaging can influence the consumers’ overall
perception of the product and that there is a difference between a high and low involved
consumers (Spence, Harrar & Piqueras-Fiszman, 2012). Probably, high involved consumers
looked more carefully at the package and elaborated on the information they were given.
Also, it is possible that high involved consumers in general buy more organic and ethical
responsible products. What becomes clear in this research is that consumers associate the
rough and matt package with eco-friendliness and in this way it fits better in possible

44
preferences of the high involved consumer. A future research could be focus on the specific
differences between high and low involved consumers and test these assumptions.
5.2 Theoretical implications
The present research gave interesting results about the use of package materials and food
labels and how they are influencing consumers’ product expectations and experience.
Previous research showed already that food labels can change consumers' perceptions of
quality or eco-friendliness, but this research shows that the congruency with the rest of the
package has an important influence on the perceived quality of a product. Another addition to
the literature is the influence of the attractiveness of the package. Previous researches appoint
the increasing taste liking and quality attributes to there being a food label present on the
package. This study shows that the attractiveness of the packaging, so not immediately the
content of the packaging, is higher when there is a food label present as well. When we
looked at the product by means of the taste liking and a the product experience, this study
underlines previous studies that states the positive impact of food labels on the consumer.
Furthermore, the results show that the package with the rough and matt surface provokes a
more positive reaction in general as compared to the package with the smooth and glossy
surface. Finally, this study gave new insights into the differences between high and low
involved consumers. High involved consumers are more positive about the product and have
higher expectations about the quality and eco-friendliness, but this only within the condition
with the rough and matt packaging.
5.3 Practical implications
The results of this research can be relevant for food producers. Because of the fact that
consumers make the most of their purchasing decisions by comparing different products
within a product category and making a choice in the store itself, it is important to know what
appeals to the consumer and how to stand out on the shelf. For an overall higher positive
product experience, it helps to add a food label on the package and so distinguish the product
from competitors. When the aim is to want especially emit quality, it is important that there is
congruency within the package when it becomes to verbal and non-verbal communication
elements. In this case, the consumer sees the product as a higher quality product when the
package material and the food label are congruence. Another result that is practically relevant,
is that the packages that look eco-friendly are seen as more positive. It looks like consumers
are more and more attracted to naturalness and eco-friendly products. Food producers can
45
response to this trend to offer more products within this category and especially ensure that
the packaging fits with the product by means of package material and food labels.
5.4 Research limitations and future research
One of the goals of this research was to investigate the influence of tactile aspects in package
designs. The role of this element is difficult to describe because we cannot exactly say that the
results came from the tactile influence, the visual elements or a combination of this two
elements. According to the theoretical framework, it should be a combination of the two
elements that makes this results. But how big the influence of the visual elements are and how
big the influence of the tactile element is, is not clear. Perhaps, this can be found out in future
research. For example, if the respondents split up into two groups, one group only sees the
package and the other group also feels the package.
Another future research proposal and at the same time a limitation from this research,
is to make the setting more realistic. It has been tried to make the package as realistic and
professional as possible within in the available time, skills, and budget. Still it looks quite
different than packages in the supermarket. Also the research was taken at a local market and
a canteen, this are normally not places were coffee beans are sold. For a more realistic setting,
the research could be done in a supermarket.
In this research we looked mainly to eco-friendliness and quality. For future research it
could be considered to do research for other types of products attributes, such as the perceived
healthiness of a product. There might be a link between a natural looking package and the
perceived healthiness of a product. It could also be interesting to test other products than
coffee and coffee beans. For example tea or chocolate. This are also products that are
available in many price ranges, quality differences, and have varied origin – such as organic
or fair trade. But it is also interesting to investigate tactile elements in combination with visual
elements in a total other category, like nutritional supplement or dairy products. Consumers
should have total other expectations of this kind of product, which can create new insights in
this field of research.
Another new insight within this study, but what needs to be researched more are the
differences between high and low involved consumers when it comes to the influences of
package attributes. The results show that the high involved consumers see the product as more
positive compared to the low involved consumers. Possible explanations as to where these
results come from are described in this discussion, but there is not a clear explanation. Future

46
research can focus on the differences between these two groups of consumers when it comes
to the influence of sensory elements in packages.
5.5 Conclusion
With the findings it is possible to give an answer to the research question:
“What are the effects of different package materials in combination with food labels on
consumers’ product expectations and product experience of coffee and coffee beans to low
and high involved consumers?”
The present study shows that the package materials have a strong influence on the product
expectations and experience. Consumers perceived the rough and matt packaging clearly as
more eco-friendly. More interesting is that people are more positive about the taste when they
saw and touched the rough and matt packaging. Concluding, the consumers were overall more
positive about the product when it was presented in the rough and matt packaging.
Beside the package material, the food labels have a strong influence on the product
expectations and experience of the consumer as well. The food labels itself lead to a positive
effect on attractiveness of the package, the perceived quality, the perceived eco-friendliness,
the taste liking, and the product experience. What is interesting, is that in many cases it was
not important what kind of food label was presented on the packages. What was important
was that there was a food label presented on the package in the first place. Namely - the
biggest differences within the constructs concerning the labels are found between the basic
label and the other two labels and not between the quality label and the eco-friendly label.
This does not apply for the perceived eco-friendliness, where the eco-friendly label leads to a
higher perceived eco-friendliness.
Also, there were interaction effects found between this two independent variables.
These interaction effects show that congruence between the package material and the food
label is important when it comes to the perceived quality. This congruence resulted in a higher
perceived quality. But when it comes to the perceived eco-friendliness, the congruency
between the package material and the food label looks less important. For the expected price,
was also an interaction effect found. People think that a product is more expensive when the
variables are congruent to each other.
Finally the differences between the high and low involved consumers give surprising
results. There is an interesting interaction effect between the package material and the level of

47
involvement in the rough and matt condition. The high involved consumers were in the
constructs the attractiveness of packaging and the product experience considerably more
positive about the product as compared to the low involved consumer. Also the high involved
group sees the product as a higher quality product and as more eco-friendly.

48
6. References
Annunziata, A., Ianuario, S., & Pascale, P. (2011). Consumers' attitudes toward labelling of
ethical products: The case of organic and Fair Trade products. Journal of Food
Products Marketing, 17(5), 518-535.
Bargh, J. A., & Chartrand, T. L. (1999). The unbearable automaticity of being. American
psychologist, 54(7), 462.
Bargh, J. A. (2002). Losing consciousness: Automatic influences on consumer judgment,
behavior, and motivation. Journal of consumer research, 29(2), 280-285.
Biggs, L., Juravle, G., & Spence, C. (2016). Haptic exploration of plateware alters the
perceived texture and taste of food. Food Quality and Preference, 50, 129-134.
Bottomley, P. A., & Doyle, J. R. (2006). The interactive effects of colors and products on
perceptions of brand logo appropriateness. Marketing Theory, 6(1), 63-83.
Brown, R. L. (1958). Wrapper influence on the perception of freshness in bread. Journal of
Applied Psychology, 42(4), 257.
Chen, M., & Bargh, J. A. (1997). Nonconscious behavioral confirmation processes: The self-
fulfilling consequences of automatic stereotype activation. Journal of Experimental
Social Psychology, 33(5), 541-560.
Chen, X., Shao, F., Barnes, C., Childs, T., & Henson, B. (2009). Exploring relationships
between touch perception and surface physical properties. International Journal of
Design, 3(2), 67-76.
Chind, K., & Sahachaisaeree, N. (2012). Purchasers’ Perception on Packaging Formal Design:
A Comparative Case Study on Luxury Goods Merchandizing. Procedia-Social and
Behavioral Sciences, 42, 436-442.
Cho, H., & Schwarz, N. (2010). I like those glasses on you, but not in the mirror: Fluency,
preference, and virtual mirrors. Journal of Consumer Psychology, 20(4), 471-475.
Cloonan, C., & Briand Decré, G. (2015). The Cross-Modal Effects of Packaging Glossiness
on Haptic Perception. ACR Asia-Pacific Advances.

49
Deliza, R., & MacFie, H. (2001). Product packaging and branding. In Food, people and
society (pp. 55-72). Springer Berlin Heidelberg.
Dijksterhuis, A., Smith, P. K., Van Baaren, R. B., & Wigboldus, D. H. (2005). The
unconscious consumer: Effects of environment on consumer behavior. Journal of
Consumer Psychology, 15(3), 193-202.
Dodds, W. B., Monroe, K. B., & Grewal, D. (1991). Effects of price, brand, and store
information on buyers' product evaluations. Journal of marketing research, 307-319.
Erdem, T., & Swait, J. (2004). Brand credibility, brand consideration, and choice. Journal of
consumer research, 31(1), 191-198.
Fillion, L., & Arazi, S. (2002). Does organic food taste better? A claim substantiation
approach. Nutrition & Food Science, 32(4), 153-157.
Gallace, A., & Spence, C. (2008). The cognitive and neural correlates of “tactile
consciousness”: A multisensory perspective. Consciousness and cognition, 17(1), 370-
407.
Gallace, A., & Spence, C. (2009). The cognitive and neural correlates of tactile
memory. Psychological bulletin, 135(3), 380.
Hirschman, E. C., & Solomon, M. R. (1984). Utilitarian, aesthetic, and familiarity responses
to verbal versus visual advertisements. ACR North American Advances.
Howitt, D., & Cramer, D. (1997). A guide to computing statistics with SPSS for Windows.
Simon & Schuster.
Jansson-Boyd, C. V. (2011). Touch matters: exploring the relationship between consumption
and tactile interaction. Social Semiotics, 21(4), 531-546.
Kahneman, D. (2011). Thinking, fast and slow. New York: Farrar, Straus and Giroux.
Kim, S. Y., Nayga Jr, R. M., & Capps Jr, O. (2000). The effect of food label use on nutrient
intakes: an endogenous switching regression analysis. Journal of Agricultural and
resource Economics, 215-231.
Kotler, P. (1991). Principles of Marketing, [by] Philip Kotler, Gary Armstrong: Instructor's
Resource Manual. Prentice Hall.

50
Krishna, A., & Morrin, M. (2008). Does touch affect taste? The perceptual transfer of product
container haptic cues. Journal of Consumer Research, 34(6), 807-818.
Labbe, D., Pineau, N., & Martin, N. (2013). Food expected naturalness: Impact of visual,
tactile and auditory packaging material properties and role of perceptual
interactions. Food Quality and Preference, 27(2), 170-178.
Lotz, S., Christandl, F., & Fetchenhauer, D. (2013). What is fair is good: Evidence of
consumers’ taste for fairness. Food quality and preference, 30(2), 139-144.
Loureiro, M. L., McCluskey, J. J., & Mittelhammer, R. C. (2001). Assessing consumer
preferences for organic, eco-labeled, and regular apples. Journal of agricultural and
resource economics, 404-416.
Mathios, A. D. (2000). The impact of mandatory disclosure laws on product choices: An
analysis of the salad dressing market. The Journal of Law and Economics, 43(2), 651-
678.
Meert, K., Pandelaere, M., & Patrick, V. M. (2014). Taking a shine to it: How the preference
for glossy stems from an innate need for water. Journal of Consumer
Psychology, 24(2), 195-206.
Petty, R. E., & Cacioppo, J. T. (1986). The elaboration likelihood model of
persuasion. Advances in experimental social psychology, 19, 123-205.
Pinson, C. (1986). An implicit product theory approach to consumers' inferential judgments
about products. International Journal of Research in Marketing, 3(1), 19-38.
Piqueras-Fiszman, B., & Spence, C. (2012). The influence of the feel of product packaging on
the perception of the oral-somatosensory texture of food. Food Quality and
Preference, 26(1), 67-73.
Reber, R., Schwarz, N., & Winkielman, P. (2004). Processing fluency and aesthetic pleasure:
Is beauty in the perceiver's processing experience?. Personality and social psychology
review, 8(4), 364-382.
Reber, R., Winkielman, P., & Schwarz, N. (1998). Effects of perceptual fluency on affective
judgments. Psychological science, 9(1), 45-48.

51
Rettie, R., & Brewer, C. (2000). The verbal and visual components of package
design. Journal of product & brand management, 9(1), 56-70.
Rozin, P., Spranca, M., Krieger, Z., Neuhaus, R., Surillo, D., Swerdlin, A., & Wood, K.
(2004). Preference for natural: instrumental and ideational/moral motivations, and the
contrast between foods and medicines. Appetite, 43(2), 147-154.
Rozin, P. (2005). The meaning of “natural” process more important than
content. Psychological science, 16(8), 652-658.
Schifferstein, H. N., & Cleiren, M. P. (2005). Capturing product experiences: a split-modality
approach. Acta psychologica, 118(3), 293-318.
Schifferstein, H. N. J., & Spence, C. (2008). Multisensory product experience. In H. N. J.
Schifferstein & P. P. M. Hekkert (Eds.), Product experience (pp. 133–161). Amsterdam:
Elsevier.
Schwarz, N. (2004). Metacognitive experiences in consumer judgment and decision
making. Journal of Consumer Psychology, 14(4), 332-348.
Schuldt, J. P., Muller, D., & Schwarz, N. (2012). The “fair trade” effect: Health halos from
social ethics claims. Social Psychological and Personality Science, 3(5), 581-589.
Spence, C., & Gallace, A. (2011). Multisensory design: Reaching out to touch the
consumer. Psychology & Marketing, 28(3), 267-308.
Spence, C., Harrar, V., & Piqueras-Fiszman, B. (2012). Assessing the impact of the tableware
and other contextual variables on multisensory flavour perception. Flavour, 1(1), 7.
Steptoe, A., Pollard, T. M., & Wardle, J. (1995). Development of a measure of the motives
underlying the selection of food: the food choice questionnaire. Appetite, 25(3), 267-
284.
Theuer, R. C. (2006). Do organic fruits and vegetables taste better than conventional fruits
and vegetables?. State of Science Review, The Organic Center, 50.
van Rompay, T. J., Finger, F., Saakes, D., & Fenko, A. (2017). “See me, feel me”: Effects of
3D-printed surface patterns on beverage evaluation. Food quality and preference, 62,
332-339.

52
Wessells, C. R., Johnston, R. J., & Donath, H. (1999). Assessing consumer preferences for
ecolabeled seafood: the influence of species, certifier, and household
attributes. American Journal of Agricultural Economics, 81(5), 1084-1089.
Winkielman, P., Halberstadt, J., Fazendeiro, T., & Catty, S. (2006). Prototypes are attractive
because they are easy on the mind. Psychological science, 17(9), 799-806.

53
Hel
emaa
l mee
on
een
s
Mee
on
een
s
Neu
traa
l
Mee
een
s
Hel
emaa
l mee
een
s
Appendix A: Questionnaire pre-test 1
Ik associeer de afbeelding met…
Natuurlijk O O O O O
Fairtrade O O O O O
Hoge kwaliteit O O O O O
Goedkoop O O O O O
Gezond O O O O O
Onnatuurlijk O O O O O
Biologisch O O O O O
Duur O O O O O
Realistisch O O O O O
Aantrekkelijk O O O O O
Puur O O O O O
Luxueus O O O O O

54
Hel
emaa
l mee
on
een
s
Mee
on
een
s
Neu
traa
l
Mee
een
s
Hel
emaa
l mee
een
s
Appendix B: Questionnaire pre-test 2
Ik associeer de verpakking met…
Natuurlijk O O O O O
Fairtrade O O O O O
Hoge kwaliteit O O O O O
Goedkoop O O O O O
Gezond O O O O O
Onnatuurlijk O O O O O
Biologisch O O O O O
Duur O O O O O
Realistisch O O O O O
Aantrekkelijk O O O O O
Puur O O O O O
Luxueus O O O O O

55
Appendix C: Questionnaire main study
Geslacht: Man O Vrouw O Leeftijd: ____
1 = Mee oneens `
2 = Een beetje mee oneens
3 = Neutraal
4 = Een beetje mee eens
5 = Mee eens
Stellingen over de koffie en koffiebonen 1 2 3 4 5
Ik vind de verpakking passen bij koffiebonen O O O O O
Ik vind de verpakking aantrekkelijk O O O O O
De verpakking spreekt mij aan O O O O O
Ik verwacht dat de koffiebonen van hoge kwaliteit zijn O O O O O
Het product komt op mij over als een luxueus product O O O O O
Ik verwacht dat concurrerende merken van betere kwaliteit zijn O O O O O
Ik verwacht dat de koffiebonen biologisch zijn O O O O O
Ik verwacht dat de koffiebonen op een ecologisch verantwoorde manier zijn geproduceerd O O O O O
Ik verwacht dat het product fair-trade is O O O O O
Ik vind de koffiebonen een aangename geur hebben O O O O O
Ik vind de koffie krachtig van smaak O O O O O
Ik vind de koffie mild van smaak O O O O O
Ik vind de koffie intens van smaak O O O O O
Ik vind de koffie licht van smaak O O O O O
Ik vind de koffie puur van smaak O O O O O
De koffie heeft een bittere smaak O O O O O
Ik vind de koffie lekker van smaak O O O O O
De koffie heeft aan fijn mondgevoel O O O O O
De koffie heeft een aangenaam aroma O O O O O
De koffie heeft een lekkere geur O O O O O
De koffie heeft een lekkere nasmaak O O O O O
Het product spreekt mij aan O O O O O
Ik vind het product aantrekkelijk O O O O O
Ik ervaar het product als onaangenaam O O O O O
Het product laat een positieve indruk op mij achter O O O O O
Ik verwacht dat het product duur is O O O O O
Ik verwacht dat het product goedkoper is dan concurrerende merken O O O O O
Ik verwacht dat het product een goede prijs-kwaliteitsverhouding heeft O O O O O
Ik zou het product overwegen te kopen O O O O O
Ik zou het product een keer willen proberen O O O O O
Ik zou eerder koffiebonen kopen van een ander merk O O O O O
Z.O.Z.

56
1 = Mee oneens `
2 = Een beetje mee oneens
3 = Neutraal
4 = Een beetje mee eens
5 = Mee eens
Stellingen over aankopen in het algemeen 1 2 3 4 5
Ik vind het belangrijk dat een product biologisch is O O O O O
Ik vind het belangrijk dat een product fair-trade is O O O O O
Ik koop zoveel mogelijk producten die op een ecologisch verantwoorde
manier zijn geproduceerd O O O O O
Ik ben bereid om meer te betalen voor een product dat ecologisch verantwoord is O O O O O
Ik lees en bekijk het etiket van een product goed voordat ik het koop O O O O O
In de supermarkt vergelijk ik producten van dezelfde categorie vaak met elkaar O O O O O
Ik maak altijd een weloverwogen beslissing als ik een product koop O O O O O