The effects of drift and displacement motion on Dynamic Visual Acuity
15
Psicológica (2005), 26, 105-119. The effects of drift and displacement motion on Dynamic Visual Acuity J.Antonio Aznar-Casanova †* ; Lluïsa Quevedo ‡ and Scott Sinnett † † Universitat de Barcelona. ‡ Universitat Politècnica de Catalunya (Spain) Dynamic Visual Acuity (DVA) can be measured from two types of equivalently considered movement referred to as drifting-motion and displacement-motion. Displacement motion can be best described as the horizontal displacement of a stimulus, thus implying pursuit eye movements, and involves moving the stimulus from the fixation point of gaze towards the periphery. The drifting motion of a Gabor patch, for example, avoids pursuit eye movements, since the gaze is fixed in a point of the patch. Our data shows that in both types of movement visual acuity (VA), expressed in terms of spatial frequency, diminished as the velocity of the target increased. However, the slope of the regression equation indicated that this impairment is more than two-fold in the case of drifting-motion when compared to displacement motion. As the greater impairment took place when pursuit eye movements did not exist, our data suggests that these two types of motions correct differently for retinal slip. Retinal slip appears to be less efficiently compensated for in the case of drifting motion having adverse consequences on VA, while retinal slip has a higher tolerance in the case of displacement motion exhibited by the performance in VA. Detecting the movement of an object is essential, and at times, even a life or death matter. For instance, many animals must be able to rapidly detect movement or otherwise risk being prey. It is important to be able to estimate the velocity, direction, and if possible, identify all types of approaching stimuli, especially in situations when such stimuli are quickly approaching and may be dangerous. Thus, identifying the shape and other details of stimuli is essential in order to avoid imminent dangers. However, little effort has been spent emphasizing the relationship among spatial and temporal frequency, velocity, types of movement and eye movements. In this paper we investigate resolution acuity, sometimes called the “minimum separable” acuity, for two types of moving stimuli. * This research was supported by grants from the Spanish Ministerio de Ciencia y Tecnologia” (Ref. No. BSO2001-3639). Address: J.Antonio Aznar-Casanova. Grupo Neurociencia Cognitiva. Departament de Psicologia Bàsica. Facultat de Psicologia. Universitat de Barcelona. Passeig de la Vall d’Hebron, 171. 08035-Barcelona. E-mail: [email protected]
Transcript of The effects of drift and displacement motion on Dynamic Visual Acuity
Psicológica (2005), 26, 105-119.
The effects of drift and displacement motion onDynamic Visual Acuity
J.Antonio Aznar-Casanova† *; Lluïsa Quevedo‡ and Scott Sinnett†
† Universitat de Barcelona. ‡ Universitat Politècnica de Catalunya (Spain)
Dynamic Visual Acuity (DVA) can be measured from two types ofequivalently considered movement referred to as drifting-motion anddisplacement-motion. Displacement motion can be best described as thehorizontal displacement of a stimulus, thus implying pursuit eyemovements, and involves moving the stimulus from the fixation point ofgaze towards the periphery. The drifting motion of a Gabor patch, forexample, avoids pursuit eye movements, since the gaze is fixed in a point ofthe patch. Our data shows that in both types of movement visual acuity(VA), expressed in terms of spatial frequency, diminished as the velocity ofthe target increased. However, the slope of the regression equation indicatedthat this impairment is more than two-fold in the case of drifting-motionwhen compared to displacement motion. As the greater impairment tookplace when pursuit eye movements did not exist, our data suggests that thesetwo types of motions correct differently for retinal slip. Retinal slip appearsto be less efficiently compensated for in the case of drifting motion havingadverse consequences on VA, while retinal slip has a higher tolerance in thecase of displacement motion exhibited by the performance in VA.
Detecting the movement of an object is essential, and at times, even a lifeor death matter. For instance, many animals must be able to rapidly detectmovement or otherwise risk being prey. It is important to be able to estimatethe velocity, direction, and if possible, identify all types of approaching stimuli,especially in situations when such stimuli are quickly approaching and may bedangerous. Thus, identifying the shape and other details of stimuli is essentialin order to avoid imminent dangers. However, little effort has been spentemphasizing the relationship among spatial and temporal frequency, velocity,types of movement and eye movements. In this paper we investigateresolution acuity, sometimes called the “minimum separable” acuity, for twotypes of moving stimuli. * This research was supported by grants from the Spanish Ministerio de Ciencia yTecnologia” (Ref. No. BSO2001-3639). Address: J.Antonio Aznar-Casanova. GrupoNeurociencia Cognitiva. Departament de Psicologia Bàsica. Facultat de Psicologia.Universitat de Barcelona. Passeig de la Vall d’Hebron, 171. 08035-Barcelona. E-mail:[email protected]
J.A. Aznar-Casanova, et al.106
Acuity is defined as the ability to detect a separation or gap betweensmall details. Visual Acuity (VA) is a measure of the smallest detail (highestspatial frequency) that the visual system can resolve. In our case, VA ismeasured by the spatial frequency of the sine wave contained in a Gaborpatch. However, when acuity relates to moving targets it is referred to asDynamic Visual Acuity (DVA) in order to distinguish it from acuity measureswith stationary targets (SVA). It has been known [see Hoffman, Rouse andRyan (1981) for a review] that VA for a moving target diminishes as targetvelocity increases (Ludvigh and Miller, 1958; Miller, 1958; Morrison, 1980;Prestrude, 1987; Long and Zavod,, 2002).
Nevertheless, agreement has yet to be achieved regarding factors thatexplain this relationship. Murphy (1978) pointed out that when our eyes domanage to keep up with a moving target, visual resolution is not impaired.Ludvigh and Miller (1958) verified that DVA can be improved by practice,although, there were important individual differences of this capability.However, it is possible that this improvement reflects the fitting of the speedof pursuit eye movements to the speed of the target’s movement. Also,Mayyasi, Beals, Templeton, and Hale (1971) and Brown (1972) reported thatas the contrast of the stimulus decreased, DVA deteriorated. From anotherpoint of view, and based on Miller’s research (1958), DVA appears todegrade similarly when stationary observers viewed vertically or horizontallymoving stimuli.
Spatial acuity, defined as the highest visible spatial frequency one candistinguish, is roughly 40-50 cycles/deg for human foveal vision with gratingsof high contrast (Bruce, Green, and Georgeson, 1996). Temporal acuity,defined as the fastest distinguishable visible flicker rate, is around 40-50 Hzfor human vision. Also, Robson (1966) and Kelly (1979) have shown thatcontrast sensitivity for grating depends on both spatial and temporalfrequency. They found that sensitivity is greatest at roughly 5 c/deg and 5 Hzrespectively. Kelly (1983, 1984), more accurately controlling the temporalfrequencies by means of a modern retinal stabilization technique, foundsimilar values. In brief, as temporal frequency increases, sensitivity to highspatial frequencies slightly decreases (a low-pass filter), while sensitivity tolow spatial frequencies increases (a band-pass filter). On the other hand, atvery low temporal frequencies the low spatial frequency attenuation is greater.
Research performed during the last few decades includes using severaltypes of moving stimuli in order to investigate motion vision; such as driftinggrating, flickering, flashing and displacement patches. These stimuli requirethe use of many different discrimination tasks: direction of motion, speed ofmotion, rate of flicker, spatial frequency discrimination, and others.Researchers choose which form of moving stimuli to utilize depending ontheir experimental objectives. As the aim of this study was to investigate DVA,drifting-motion and displacement-motion appear to be the most suitablestimuli.
Drift vs. displacement motion in DVA 107
The type of motion labelled drifting gratings consists of a temporalchange in the phase of every pixel of a pattern. The rate that the spatial phasechanges specifies drift velocity. The effect of such a variation is that theperceived pattern (the bars of the grating) appears to move continuously in acertain direction through an aperture. Hence, here we will use the expression,drift motion, to indicate a particular type of drifting, that is, to refer to the driftof the grating contained inside the Gabor patch. (aperture).
On the other hand, the displacement motion of an object consists of acontinuous change in the spatial position of the object through time. Anexample of displacement motion could be a stimulus moving in a horizontalpath along a fronto-parallel plane. The goal of our research was to verify ifthese two movements (drifting motion and displacement motion) areequivalent when measuring DVA, or, on the contrary, produce differentresults.
Currently, it is not clear as to which factors produce diminishments inVA, or for what reasons they operate in this way. In fact, it is known that as aconsequence of the temporal integration that occurs in vision (Barlow, 1958;Legge, 1978; Gorea and Tyler, 1983; Georgeson, 1987), moving stimulishould appear more blurred than stationary stimuli.
As previously mentioned, drifting-motion and displacement motion willbe used for our investigation of DVA. Using drifting-motion as a movingstimulus offers the researcher an advantage in that pursuit eye and headmovements, which are difficult to control for, are not likely to occur (Tatlerand Wade, 2003). However, it is possible that this motion promotes retinalslip. The idea of retinal slip will be further discussed below. Moreover, iffixation is maintained on a point in the centre of the Gabor patch, a resultingstimulus moving with afferent motion occurs. On the other hand, withdisplacement motion, the entire Gabor patch moves across a stationarybackground, promoting pursuit eye movements (Rashbass, 1961 andRobinson, 1965). By smooth pursuit eye movement keeping the moving targetrelatively stable on the fovea we are able to discriminate and thus obtain highvisual acuities. For instance, Rashbass, (1961) and Robinson (1965) foundthat for targets moving at constant velocities of less than 30 deg/sec, eyemovements are able to pursue the target successfully through the use ofpursuit eye movements. That is, adjusting the gain, or ratio, between eyevelocity and target velocity, to a value close to one.
The function of the vestibulo-ocular reflex (VOR) is to stabilize theretinal image by making eye rotations that counterbalance head rotations.When VOR fails, the image slips over the retina during head rotation, that is, aretinal slip is produced. The oculomotor system is characterized by theinteraction between peripheral reflexes and central motor commands of visualorigin. The neural control of gaze in natural conditions requires the interactionbetween different strategies of oculomotor control e.g., Krauzlis, 2004).According to De Brouwer, Missal and Lefèvre (2001) the visual tracking ofmoving targets requires the combination of smooth pursuit eye movementswith catch-up saccades. Pursuit eye movements attempt to minimize retinal
J.A. Aznar-Casanova, et al.108
image motion or retinal slip (e.g., Krauzlis and Lisberger, 1994). In order totrack a moving target, the visual system uses two sources of information, oneabout position error of the target while the other would be retinal slip.However, when we use drift motion the Gabor patch is stationary (only theinner grating is moving), therefore it is not necessary to verify the position ofthe patch on the screen..
As the two types of motion we use differ in their movement, differingin the displacement or the immobility of the patch, it is important to investigatewhat possible effects they will have on measurements of DVA. Certainly, inboth displacement and drift motion retinal slip is produced, but in the first(displacement), an additional positional error could contribute to diminish VAto greater levels than in the second (drift motion).
METHODParticipants. Four participants (APH, LQJ, SCS and JAA), three of
which were authors and the other a naïve student, participated in theexperiment. All subjects had normal or corrected to normal visual acuity andalso a normal sensitivity to contrast.
Equipment: hardware and software. Motion visual stimuli werepresented on a Sony GDM-F520 television monitor. Stimuli were controlledby a Cambridge Research System VSG 2/5 graphic board with a spatialresolution of 1024x768 pixels (dot pitch = 0.22 mm) and a frame rate of 120Hz non-interlaced.
The stimuli, Gabor patches differing in spatial frequency, temporalfrequency and contrast, were generated by VSG Software Library (VSL)version 6.1. The programs (software) used to obtain measurements (DVA)and manage the experimental sequence were written in Delphi language(Borland).
Gamma correction was performed independently for each colour(RGB) by ColorCal (CRS) and the mean luminance of the stimuli wasmeasured by a Minolta LS100 luminometer. A CB6 response box (CRS) wasused to register responses producing a tone from an internal buzzer informingthe participant that a response had been made. A chin-rest was used in orderto ensure the distance between the participant and the monitor.
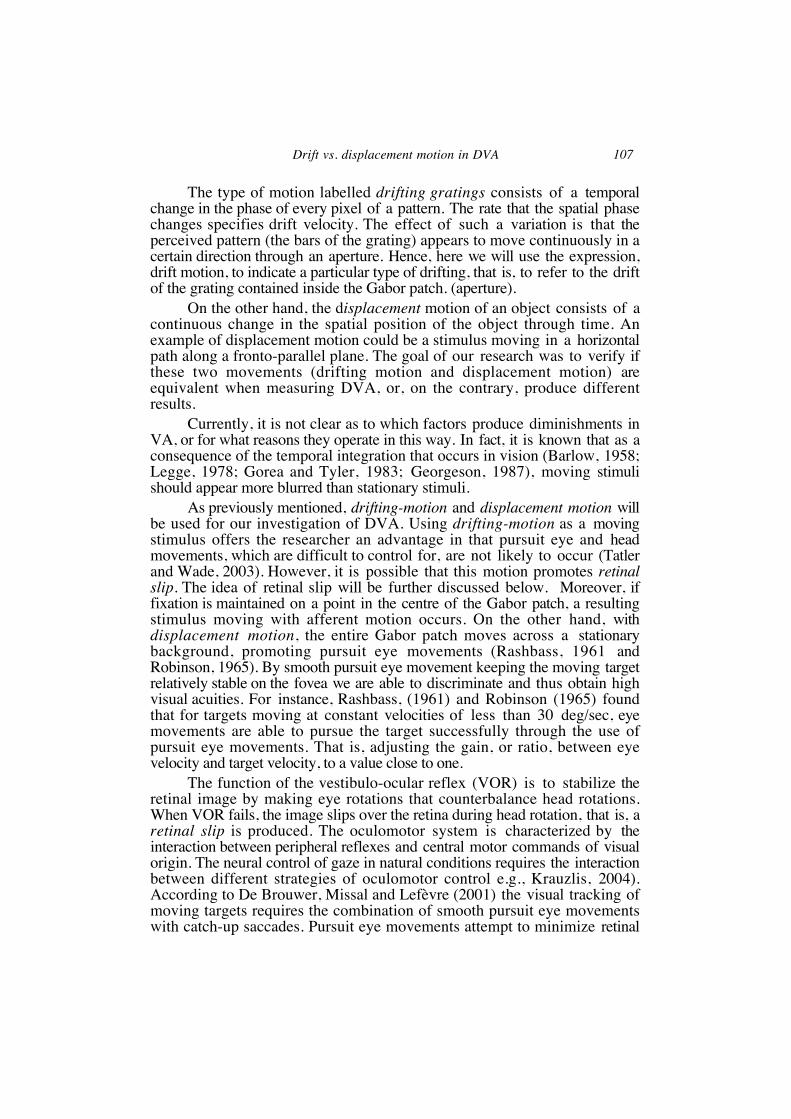
Stimuli. Gabor patches were used in two different tests. The Gaborpatches varied in both spatial frequency and velocity (or temporal frequency).Figure 1 shows an example of a Gabor patch (orientation 135 deg) and itsluminance profile. In the first test the Gabor patch was displaced in aunidirectional horizontal path (left to right), varying the velocity(displacement-motion). Meanwhile, in the second test the Gabor patch wasshown in the centre of the screen with a pre-determined drift velocity (drifting-motion) also presented in only one direction (aperture).

Drift vs. displacement motion in DVA 109
FIGURE 1. An illustration of the Gabor patch used as a stimulus withan orientation of 135 degrees. The luminance of the background isequal to the mean luminance of the Gabor function. Left panel: greylevel representation of the 2-D Gabor function. Central panel: profileof the luminance corresponding to a line orthogonal to the variation ofluminance of the Gabor function. Right panel: an isometrical 3-Drepresentation of the 2-D Gabor function.
In the first test visual acuity was measured for a wide range of velocities(0.5, 1, 2, 5, 10, 20, 30, 40, 50 deg/sec) in addition to stationary visual acuity(SVA). With such a variation in velocities we adapted the test to four differentviewing distances (6 m for SVA; 3 m for velocities of less than 5 deg/sec; 2 mfor velocities of 10 and 20 deg/sec and 1.2 m for velocities of 30, 40 and 50deg/sec). According to the viewing distance, the visual angle (0.57 deg)subtended for the Gabor patch was kept constant. For this reason, the size ofthe Gabor patch was adapted for each distance. DVA was measured usingthree different levels of contrasts, low (m= 0.20; minimum luminance orLmin= 10.4 cd/m2 and maximum luminance or Lmax= 15.6 cd/m2), middle(m= 0.50; Lmin= 16.25 cd/m2; Lmax= 48.75 cd/m2) and high (m= 0.80;Lmin= 10.4 cd/m2; Lmax= 93.6 cd/m2). The luminance of the screenbackground was equal to the mean luminance of the Gabor function used ineach trial. Displacement-motion was implemented by using X and Y motionvector tables. In each trial the Gabor patch was moved to the specified (XPos,YPos) in the table on the next video frame. This algorithm works by scanningthrough two arrays of positions, one for the X axis and one for Y axis.Nevertheless, as there was only a horizontal movement the Y value was keptconstant. For each frame, the data for the next item was read from the twoarrays, thus repositioning the video region accordingly. The value ofhorizontal displacement was varied in order to control the speed with whichthe system moves through the X table. A value of n will cause the system toadvance by n pixels every video refresh.
J.A. Aznar-Casanova, et al.110
In the second test the spatial frequencies tested were approximately theupper limits of discrimination determined in the first test (displacement-motion) for different velocities. Only a middle contrast was fixated (Lmean=32.5 cd/m2) from a viewing distance of 2 meters. Orientations of the patternof the Gabor patch could be 45 or 135 degrees. In this test we used Gaborpatches with a size of 90 pixels (diameter of patch) and a deviation of 15pixels which subtended a visual angle of 0.57 deg. The patches werepresented in the middle of the screen (coordinates: 0, 0). The luminance of thescreen background was also the mean luminance of the Gabor function usedin each trial.
The spatial phase of the Gabor patch was increased at a particular rate inorder to vary the drift velocity. The effect of such a variation consists of thepattern seemingly moving continually. The rate of change of the spatial phasecontroller was measured in cycles of spatial waveforms per second (c/sec),that is to say, drift velocity was the temporal frequency. In brief, this parameterallowed us to move (drift) the pattern (grating) contained in the Gabor patch ata particular velocity. However, the upper limit in temporal frequency that canbe presented depends on the frame rate of the graphic system (120 Hz in ourcase) and the size of the envelope gaussian of the Gabor patch. Therefore, aswe have fixed the patch for the second test with a size of 90 pixels, and giventhat the inner grating (in the Gabor patch) is a periodic stimulus, then driftvelocities (temporal frequencies) higher than 30 c/sec would be constant. Thusimplying that we can not use, in this test, temporal frequencies above 30 c/sec.
Procedure. We measured DVA of the participants in two tests, each ofthem based on a different type of motion. Test one was designed to measureDVA in terms of determining the upper spatial frequency that participantscould successfully discriminate for different velocities of Gabor patches. Testtwo was designed to measure DVA for a narrow range of spatial frequencies(6, 7, 8, 9, 10, 12, 14, 16, 18 c/sec.) in terms of the upper temporal frequencyfor a particular spatial frequency that participants could successfullydiscriminate the orientation of that pattern. Both tests were conducted in thedarkness, so that only light coming from the screen (background and patch)was used.
Test One: In order to measure the highest spatial frequency that can beseen for a particular velocity (DVA), in the first test (displacement-motion) wevaried (by increasing or decreasing) the spatial frequency from trial to trial insmall steps (0.5 c/deg) according to six interleaved staircases. Ten blocks(sessions), each for a particular velocity (0, 0.5, 1, 2, 5, 10, 20, 30, 40, 50deg/sec) were given to the participants. We used two of these staircases foreach particular contrast (0.20, 0.50 and 0.80), one according to an ascendingseries and another according to a descending series. The upper limit for eachstaircase was determined from the mean of the last eight (of ten) reversalpoints of that staircase (at which the observers’ responses changed). The firsttwo reversals were considered as training. The upper limit of spatial frequency
Drift vs. displacement motion in DVA 111
for each of these velocities and contrasts was estimated by averaging the twoupper limits in spatial frequencies obtained in the two correspondingstaircases. Participants had to indicate the orientation of the Gabor patch (45or 135 deg.) by pressing one of two buttons on a response box. Feedbackwas not given.
The orientation of the Gabor patch was randomly generated for eachtrial. Participants were instructed not to guess the orientation; rather, a thirdresponse key was available for occasions when the orientation was notconfidently known (3 AFC paradigm). Two successive failures or successeswere required in order to reverse the direction of the staircase in a run, that is,to decrease or increase the spatial frequency in 0.5 c/deg steps for the nexttrial. Therefore, the duration for each session depended on the responses bythe participant. On average a session lasted approximately eight minutes.Therefore, as DVA was measured for ten velocities, ten blocks were given toeach participant distributed over three sessions.
Each trial began with a tone (1000 Hz, 100 msec), indicating the onsetof the trial, followed by a moving Gabor patch which crossed the screen with aunidirectional horizontal movement. Each patch had a particular velocity(depending on the block), specific spatial frequency (controlled by thestaircase procedure) and contrast (according to a particular staircase), and arandom orientation of pattern (45 or 135 deg). The moving stimulus crossedthe screen only once, covering a distance of 390 mm. Therefore, as thehorizontal spatial resolution of the screen was 1024 pixels and the frame ratewas 120 Hz, the minimum time needed to cross the screen was 274 msec(highest velocity) and the maximum was 14.8 seconds (slowest velocity).However, participants could respond before the trial was completed, that is,when they had discriminated the orientation of the pattern.
Test Two: The second test explored the effects of drift motion on DVA.In order to measure DVA in this test (drift-motion) for a particular spatialfrequency (with the upper limits found in the first test) we varied (byincreasing or decreasing) the temporal frequency (drift velocity) from trial totrial in small steps (0.25 Hz) according to two interleaved staircasescomposing each session. It is important to note that in this case the Gaborpatch did not move in the horizontal direction, rather, it remained in the centreof the computer screen ‘drifting’ as previously described. Only a middlecontrast (m = 0.50; Michelson) was used in this test as we did not want tosurpass the maximum temporal frequency that could be applied. The range ofspatial frequencies studied here in order to obtain the highest temporalfrequency was 6, 7, 8, 9, 10, 12, 14, 16, and 18 c/degree. Equivalent to the firsttest, participants also had to indicate the orientation, randomly generated, ofthe Gabor patch (45 or 135 deg) by pressing one of three buttons on theresponse box, once again, without trying to guess the response (the same thirdresponse key was available for occasions of uncertainty). Stimuluspresentation was limited to 700 msec for each trial. All other details for thestaircase were identical to those described above (test one).

J.A. Aznar-Casanova, et al.112
The value of the upper limit of temporal frequencies obtained for eachspatial frequency was used to calculate the velocity (in deg/sec) of the driftingGabor patch. As v= ft / fs (where v is velocity, fs is spatial frequency and ft istemporal frequency) we can derive a new measure for velocity from the rate offt / fs. In this way, the visual acuity (upper limit in spatial frequency) for anarrow range of velocities (less than 5 deg/sec) was obtained. In other wordsanother measurement of DVA from drifting-motion was generated in order tocompare with values obtained from displacement motion (test one).
RESULTSAll results are expressed in terms of the upper limit in spatial frequency
that participants could successfully discriminate the orientation of the Gaborpatch for each particular velocity. Similarly, previous research has measuredDVA in unities of Visual Acuity (VA), that is, as a fraction expressing theinverse of the visual angle (in min. arc) resolved by subjects. We prefer to usecycles/degree as units as areas in V1, V2 and V3 also analyse the stimuli interms of spatial frequency (Maffei and Fiorentini, 1973).
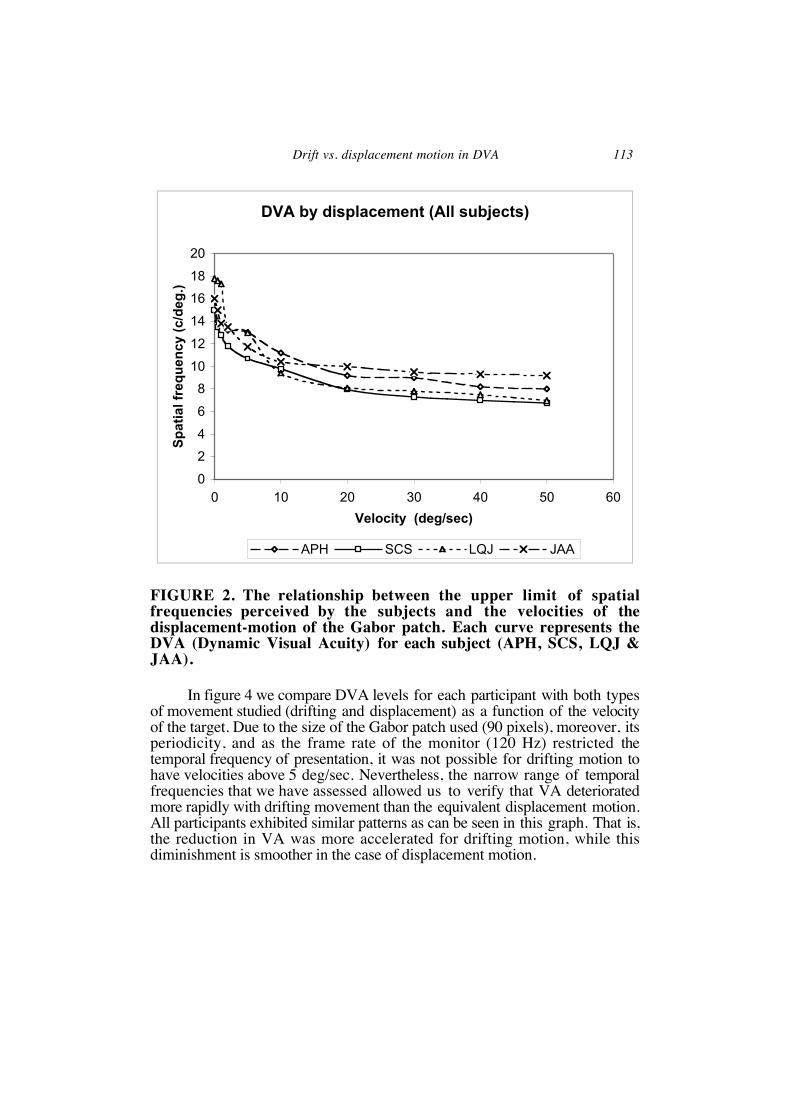
Figure 2 shows the results in DVA obtained in test 1 (displacementmotion) for each participant. The data (upper limit of spatial frequencies) areplotted as a function of the velocity of the target (DVA) separately for eachparticipant. All data corresponds to a contrast of m= 0.80 (Michelson terms)in the inner pattern of the Gabor patch. This measurement confirmed that thehighest discriminable spatial frequency used in a stationary Gabor patch(SVA) diminished dramatically until the target moved at a velocity around 20deg/sec. For the highest velocities (until 50 deg/sec) this upper limitcontinued to diminish until it had been reduced in half. In other words, from aspatial frequency of 16-18 c/deg, in the case of stationary VA, the value ofDVA progressively decreased as the velocity increased. This trend wasespecially evident for velocities greater than 20 deg/sec. For instance, avelocity of 50 deg/sec yielded values of 7-8 c/deg. It is important to highlightthat nearly half of the impairment in VA occurred in the range of velocitiesbetween 0.5 and 20 deg/sec. For velocities more than 30 deg/sec VA appearsto stabilize.
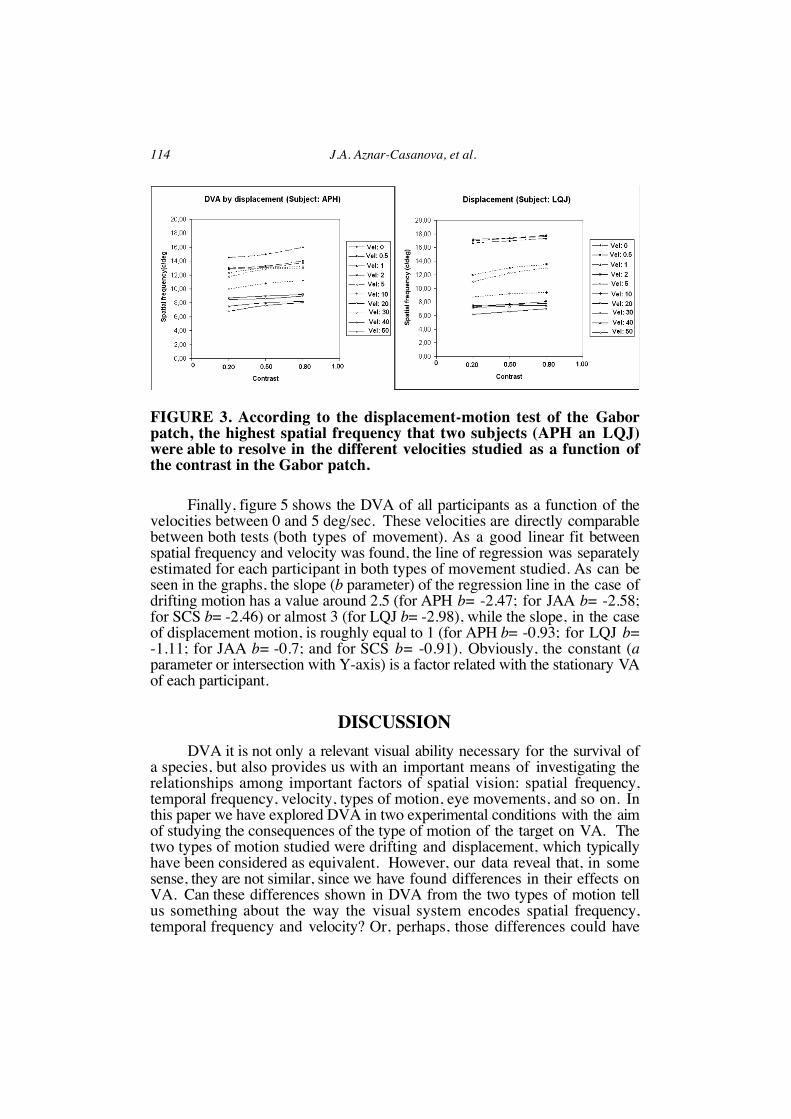
Figure 3 shows the same values of upper limit in spatial frequency fortwo participants (APH and LQJ) as a function of the contrast of the Gaborpatch separately for each velocity. This graph shows that as contrast increases,a slight increment in DVA can be seen, indicating that contrast is a relevantfactor in the measurement of VA. Data from the other two participants followa similar pattern of results with regard to the relationship between DVA,velocity and contrast. Additionally, this figure tells us how contrast canmodulate VA capability for each particular velocity in an independent way. Inother terms, contrast and velocity do not interact on VA, but, on the contrary,have an additive effect on VA.
Drift vs. displacement motion in DVA 113
DVA by displacement (All subjects)
0
2
4
6
8
10
12
14
16
18
20
0 10 20 30 40 50 60
Velocity (deg/sec)
Sp
atia
l fre
qu
ency
(c/
deg
.)
APH SCS LQJ JAA
FIGURE 2. The relationship between the upper limit of spatialfrequencies perceived by the subjects and the velocities of thedisplacement-motion of the Gabor patch. Each curve represents theDVA (Dynamic Visual Acuity) for each subject (APH, SCS, LQJ &JAA).
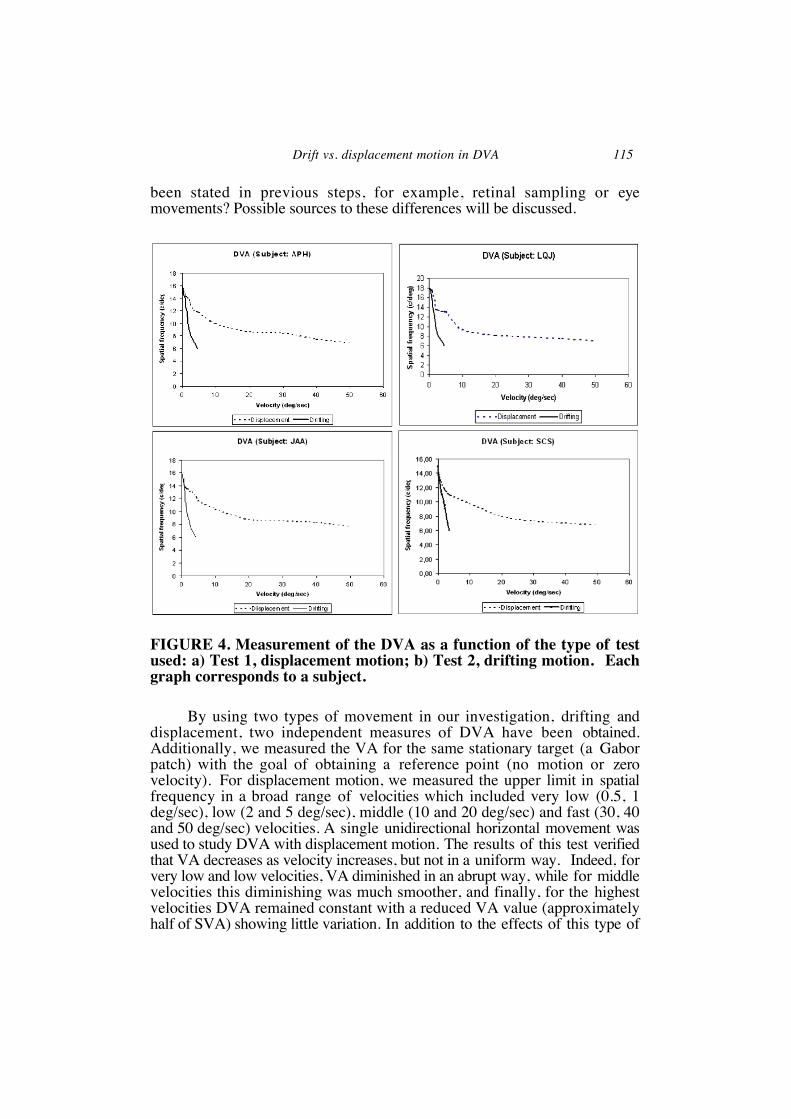
In figure 4 we compare DVA levels for each participant with both typesof movement studied (drifting and displacement) as a function of the velocityof the target. Due to the size of the Gabor patch used (90 pixels), moreover, itsperiodicity, and as the frame rate of the monitor (120 Hz) restricted thetemporal frequency of presentation, it was not possible for drifting motion tohave velocities above 5 deg/sec. Nevertheless, the narrow range of temporalfrequencies that we have assessed allowed us to verify that VA deterioratedmore rapidly with drifting movement than the equivalent displacement motion.All participants exhibited similar patterns as can be seen in this graph. That is,the reduction in VA was more accelerated for drifting motion, while thisdiminishment is smoother in the case of displacement motion.
J.A. Aznar-Casanova, et al.114
FIGURE 3. According to the displacement-motion test of the Gaborpatch, the highest spatial frequency that two subjects (APH an LQJ)were able to resolve in the different velocities studied as a function ofthe contrast in the Gabor patch.
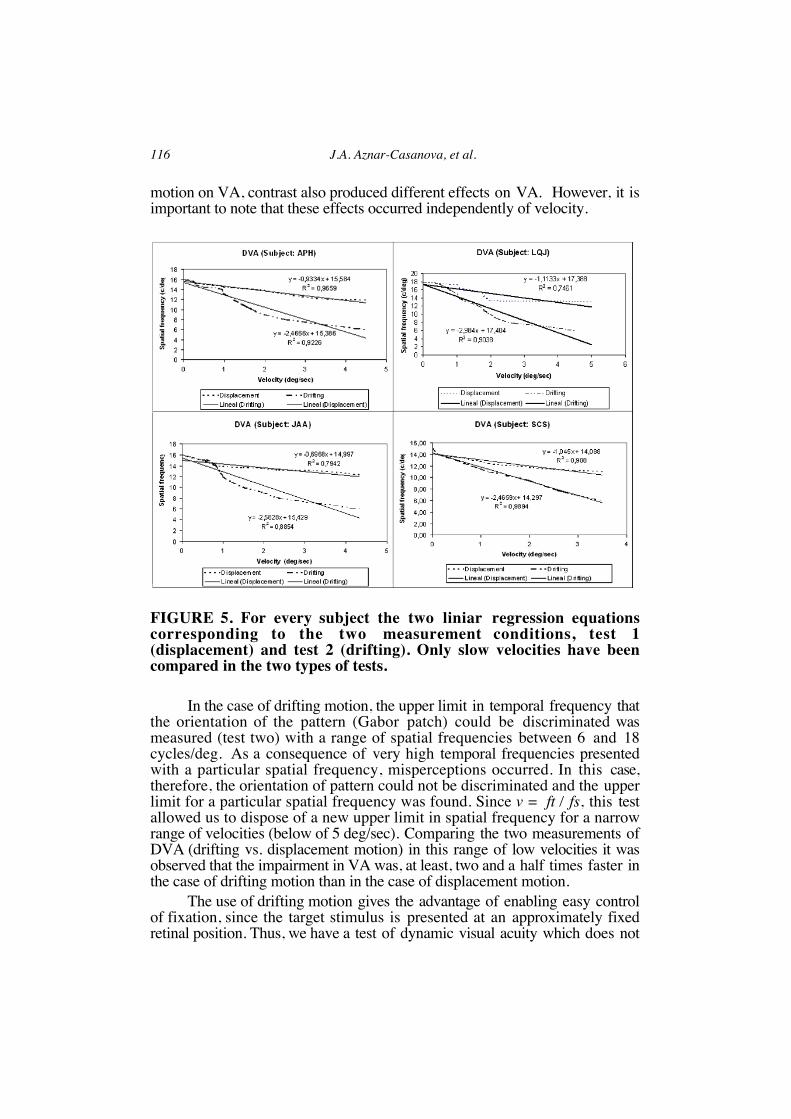
Finally, figure 5 shows the DVA of all participants as a function of thevelocities between 0 and 5 deg/sec. These velocities are directly comparablebetween both tests (both types of movement). As a good linear fit betweenspatial frequency and velocity was found, the line of regression was separatelyestimated for each participant in both types of movement studied. As can beseen in the graphs, the slope (b parameter) of the regression line in the case ofdrifting motion has a value around 2.5 (for APH b= -2.47; for JAA b= -2.58;for SCS b= -2.46) or almost 3 (for LQJ b= -2.98), while the slope, in the caseof displacement motion, is roughly equal to 1 (for APH b= -0.93; for LQJ b=-1.11; for JAA b= -0.7; and for SCS b= -0.91). Obviously, the constant (aparameter or intersection with Y-axis) is a factor related with the stationary VAof each participant.
DISCUSSIONDVA it is not only a relevant visual ability necessary for the survival of
a species, but also provides us with an important means of investigating therelationships among important factors of spatial vision: spatial frequency,temporal frequency, velocity, types of motion, eye movements, and so on. Inthis paper we have explored DVA in two experimental conditions with the aimof studying the consequences of the type of motion of the target on VA. Thetwo types of motion studied were drifting and displacement, which typicallyhave been considered as equivalent. However, our data reveal that, in somesense, they are not similar, since we have found differences in their effects onVA. Can these differences shown in DVA from the two types of motion tellus something about the way the visual system encodes spatial frequency,temporal frequency and velocity? Or, perhaps, those differences could have
Drift vs. displacement motion in DVA 115
been stated in previous steps, for example, retinal sampling or eyemovements? Possible sources to these differences will be discussed.
FIGURE 4. Measurement of the DVA as a function of the type of testused: a) Test 1, displacement motion; b) Test 2, drifting motion. Eachgraph corresponds to a subject.
By using two types of movement in our investigation, drifting anddisplacement, two independent measures of DVA have been obtained.Additionally, we measured the VA for the same stationary target (a Gaborpatch) with the goal of obtaining a reference point (no motion or zerovelocity). For displacement motion, we measured the upper limit in spatialfrequency in a broad range of velocities which included very low (0.5, 1deg/sec), low (2 and 5 deg/sec), middle (10 and 20 deg/sec) and fast (30, 40and 50 deg/sec) velocities. A single unidirectional horizontal movement wasused to study DVA with displacement motion. The results of this test verifiedthat VA decreases as velocity increases, but not in a uniform way. Indeed, forvery low and low velocities, VA diminished in an abrupt way, while for middlevelocities this diminishing was much smoother, and finally, for the highestvelocities DVA remained constant with a reduced VA value (approximatelyhalf of SVA) showing little variation. In addition to the effects of this type of
J.A. Aznar-Casanova, et al.116
motion on VA, contrast also produced different effects on VA. However, it isimportant to note that these effects occurred independently of velocity.
FIGURE 5. For every subject the two liniar regression equationscorresponding to the two measurement conditions, test 1(displacement) and test 2 (drifting). Only slow velocities have beencompared in the two types of tests.
In the case of drifting motion, the upper limit in temporal frequency thatthe orientation of the pattern (Gabor patch) could be discriminated wasmeasured (test two) with a range of spatial frequencies between 6 and 18cycles/deg. As a consequence of very high temporal frequencies presentedwith a particular spatial frequency, misperceptions occurred. In this case,therefore, the orientation of pattern could not be discriminated and the upperlimit for a particular spatial frequency was found. Since v = ft / fs, this testallowed us to dispose of a new upper limit in spatial frequency for a narrowrange of velocities (below of 5 deg/sec). Comparing the two measurements ofDVA (drifting vs. displacement motion) in this range of low velocities it wasobserved that the impairment in VA was, at least, two and a half times faster inthe case of drifting motion than in the case of displacement motion.
The use of drifting motion gives the advantage of enabling easy controlof fixation, since the target stimulus is presented at an approximately fixedretinal position. Thus, we have a test of dynamic visual acuity which does not
Drift vs. displacement motion in DVA 117
require pursuit movements of the eye, although, drifting motion also produceretinal slip. Conversely, the use of displacement motion to measure DVArequires pursuit eye movements, which can affect the VA of the participants.
The data demonstrates some dependence of the spatial frequency on thetemporal frequency or, alternatively, on the velocity. These factors are notindependent, but on the contrary, narrowly interlinked. Indeed, contrary to therelationship between contrast and velocity, which has been shown to modulateVA in independent ways, the relationship between spatial frequency andtemporal frequency, in the case of lower velocities, depends on the type ofmotion. Certainly, in the case of drifting motion (test two) the consequencesof increasing the temporal frequency was to produce higher levels ofmisperception of the Gabor patch than in the case of displacement motion(test one) at the same velocity. Therefore, our data reveal that the impairmentin VA specifically occurs when pursuit eye movements did not occur.
In the case of displacement motion, our data is consistent with Demer,Honrubia and Baloh (1994). Demer et al. (1994) reported that human VA cantolerate retinal motion up to 2-4 deg/sec, but rapidly deteriorates for higherretinal slip velocities. Nevertheless, only displacement motion was used inorder to clinically measure DVA. However, in the case of drift motion, VAtolerance begins to diminish from velocities as low as 0.5 deg/s. These datareveal that, for a stationary patch, retinal slip is not as efficient as in case ofmoving patch.
Grossman, Leigh, Bruce, Huebner and Lanska, (1989) found thatretinal image slip was below 4 deg/sec while standing and walking, but about9 deg/sec while running for targets at optical infinity. Hence, for observermovement, instead of object (patch) movement, the efficacy of the retinal slipgrew as the velocity of the participants increased. Also, Crane and Demer(1997) reported that retinal slip for head rotations along the vertical axis istypically below 2 deg/sec for targets at 1 m. However, retinal slip couldincrease up to 5 deg/sec for temporal frequencies around 1.5 Hz when themoving target is as near as 20 cm.
Recently, Gielen, Gabel and Duysens (2004) have reported thatparticipant performance improves in the visual perception of 3-D shape duringactive head movement when comparted to a passive condition (the stimulusmoves, but participants are stationary). They suggest that the cause of theimprovement (in gaze stabilization) is a compensation applied as aconsequence of the retinal slip, which is considerably smaller for activeobservers than for passives ones.
When trying to explain the impairment on VA when pursuit eyemovements are required, or not, that is, considering the two types of motionstudied, we find surprising results. Indeed, the correction of position (of themoving patch) is a source of error only possible when pursuit eye movementsare elicited for displacement motion. Therefore, we postulated that thisadditional source of error should be a responsible factor for the greaterdecrease in VA in the case of displacement motion. However, the data showedthe contrary, that is, VA is more impaired in the case of drift, at least for
J.A. Aznar-Casanova, et al.118
velocities up to 5 deg/sec. How is it possible that the greater impairment inperformance occurs precisely when pursuit eye movements are not elicited?
To summarize, the differences in DVA found between drift anddisplacement motion can be better interpreted as a result of a correction of theretinal slip, applied as a consequence of the eye movements; rather than aseffects derived from the encoding of both frequencies (spatial and temporal)and velocity. Thus, this data suggests that these two types of motion promotedifferent corrections of retinal slip, which impair VA to different levels.Drifting motion seems to cause a less efficient compensation of the retinalslip, with adverse consequences on VA, while for displacement motion, withits inherent pursuit eye movements, an increase in the tolerance of the retinalslip is seen, thus having less detrimental effects on VA.
REFERENCESBarlow, H.B. (1958). Temporal and Spatial Summation in Human Vision at Different
Background Intensities. Journal of Physiology-London 141 (2):337-350.Brown, B. (1972a). Dynamic Visual acuity, eye movements and peripheral acuity for
moving targets. Vision Research, 12: 305-321.Brown, B. (1972b). The effect of target contrast variation on dynamic visual acuity and eye
movements. Vision Research, 12: 1213-1224.Bruce, V.; Green, P R and Georgeson, M. (Editors) (1996). Visual Perception: Physiology,
Psychology and Ecology (3rd Edition). East Sussex: Psychology Press. !!Committee on Vision of the National Research Council. (1985). Emergent Techniques for
Assessment of Visual Performance. Washington: National Academy Press.Crane, BT and Demer, JL (1997). Human gaze stabilization during natural activities:
Translation, rotation, magnification, and target distance effects. Journal ofNeurophysiology 78 (4):2129-2144.
De Brouwer, S, Missal, M, Lefèvre, P (2001). Role of retinal slip in the prediction oftarget motion during smooth and saccadic pursuit. Journal of Neurophysiology, 86,550-558.
Demer, J. L, Honrubia, V and Baloh, R W (1994). Dynamic Visual-Acuity - A Test forOscillopsia and Vestibuloocular Reflex Function. American Journal of Otology 15(3):340-347, 1994.
Georgeson, M.A. (1987). Temporal Properties of Spatial Contrast Vision. Vision Research27 (5):765-780.
Gielen, C.C.A.M., Gabel, S.F. and Duysens, J. (2004). Retinal Slip during active headmotion and stimulus motion. Experimental Brain Research, 155, 211-219.
Gorea, A. and Tyler, C. W. (1983). Bloch Law for Contrast in Fovea and Periphery.Journal of the Optical Society of America 73 (12):1872.
Grossman, GE, Leigh, RJ, Bruce, Huebner, WP and Lanska, DJ (1989). Performance of theHuman Vestibuloocular Reflex During Locomotion. Journal of Neurophysiology 62(1):264-272, 1989.
Hoffman, LG., Rouse, M. y Ryan, JB. (1981). Dynamic Visual acuity: A review. Journalof the American Optometric Association, 52, 883-87.
Kelly, D.H. (1979). Motion and Vision II. Stabilized spatio-temporal threshold surface.Journal of the Optical Society of America, 69, 1340-1349.
Kelly, D.H. (1983). Spatiotemporal Variation of Chromatic and Achromatic ContrastThresholds. Journal of the Optical Society of America, 73, 6, 742-750.
Drift vs. displacement motion in DVA 119
Kelly, D.H. (1984). Retinal Inhomogeneity .1. Spatiotemporal Contrast Sensitivity.Journal of the Optical Society of America A-Optics Image Science and Vision, 1, 1,107-113.
Krauzlis, R.J. (2004). Recasting the smooth pursuit eye movement system. Journal ofNeurophysiology 91, (2), 591-603.
Krauzlis, RJ and Lisberger, SG (1994). A model of visually-guided smooth pursuit eyemovements based on behavioral observations. Journal of Computer Neuroscience, 1,265-283.
Legge, L.E. (1978). Sustained and Transient Mechanisms in Human-Vision - Temporal andSpatial Properties. Vision Research 18 (1):69-81.
Long, GM. and Zavod, MJ. (2002). Contrast sensitivity in a dynamic environment: Effectsof target conditions and visual impairment. Human Factors, 1, (44), 120-131.
Ludvigh, E. and Miller, JW. (1958). Study of visual acuity during the ocular pursuit ofmoving test objects. I Introduction. Journal of the Optical Society of America, 48,799-802.
Mayyasi, AM., Beals, RP., Templeton, AE. and Hale, PN. (1971). The effects of ambientillumination and contrast on dynamic visual acuity. American Journal of Optometryand Archives of American Academy of Optometry, 48 (10), 844-48.
Miller, JW. (1958). Study of visual acuity during the ocular pursuit of moving test objects.II: Effects of direction of movement, relative movement and illumination. J Opt SocAm, 48 (11), 803-8.
Morrison, TR. (1980). A review of dynamic visual acuity. NAMRL Monograph-28.Pensacola, FL: Naval Aerospace Medical Research Laboratory.
Murphy, BL (1978). Pattern thresholds for moving and stationary gratings during smootheye movement. Vision Research, 18, 512-530.
Prestrude, AM. (1987). Dynamic Visual acuity in the selection of the aviator. In: R Jensen(Ed) Proceedings of the Fourth International Symposium on Aviation Psychology.Columbus, OH: Ohio State University Press.
Rashbass, C. (1961). Relationship Between Saccadic and Smooth Tracking EyeMovements. Journal of Physiology-London 159 (2):326-338.
Robinson, D.A. (1965). The mechanics of human smooth pursuit eye movement. Journalof Physiology, 180, 569-591.
Robson, J.G., (1966). Spatial and temporal contrast-sensitivity functions for the visualsystem. Journal of the Optical Society of America, 56, 1141-1142.
Tatler, B. W. and Wade, N. J. (2003). On nystagmus, saccades, and fixations. Perception32 (2):167-184.
(Manuscript received: 13 May 2004; accepted: 13 October 2004)