The effects of assisted and resisted plyometric training on ...
9
Full Terms & Conditions of access and use can be found at https://www.tandfonline.com/action/journalInformation?journalCode=tejs20 European Journal of Sport Science ISSN: (Print) (Online) Journal homepage: https://www.tandfonline.com/loi/tejs20 The effects of assisted and resisted plyometric training on jump height and sprint performance among physically active females Morten Strate, Nicolay Stien, Atle Hole Saeterbakken & Vidar Andersen To cite this article: Morten Strate, Nicolay Stien, Atle Hole Saeterbakken & Vidar Andersen (2021): The effects of assisted and resisted plyometric training on jump height and sprint performance among physically active females, European Journal of Sport Science, DOI: 10.1080/17461391.2021.1968503 To link to this article: https://doi.org/10.1080/17461391.2021.1968503 © 2021 The Author(s). Published by Informa UK Limited, trading as Taylor & Francis Group View supplementary material Published online: 06 Sep 2021. Submit your article to this journal Article views: 250 View related articles View Crossmark data
-
Upload
khangminh22 -
Category
Documents
-
view
1 -
download
0
Transcript of The effects of assisted and resisted plyometric training on ...

Full Terms & Conditions of access and use can be found athttps://www.tandfonline.com/action/journalInformation?journalCode=tejs20
European Journal of Sport Science
ISSN: (Print) (Online) Journal homepage: https://www.tandfonline.com/loi/tejs20
The effects of assisted and resisted plyometrictraining on jump height and sprint performanceamong physically active females
Morten Strate, Nicolay Stien, Atle Hole Saeterbakken & Vidar Andersen
To cite this article: Morten Strate, Nicolay Stien, Atle Hole Saeterbakken & Vidar Andersen(2021): The effects of assisted and resisted plyometric training on jump height and sprintperformance among physically active females, European Journal of Sport Science, DOI:10.1080/17461391.2021.1968503
To link to this article: https://doi.org/10.1080/17461391.2021.1968503
© 2021 The Author(s). Published by InformaUK Limited, trading as Taylor & FrancisGroup
View supplementary material
Published online: 06 Sep 2021. Submit your article to this journal
Article views: 250 View related articles
View Crossmark data

The effects of assisted and resisted plyometric training on jump height and sprintperformance among physically active femalesMorten Stratea, Nicolay Stienb, Atle Hole Saeterbakkenb and Vidar Andersenb
aFaculty of Sport Science and Physical Education, University of Agder, Kristiansand, Norway; bFaculty of Education, Arts and Sports, WesternNorway University of Applied Sciences, Sogndal, Norway
ABSTRACTThe aim of the present study was to compare the effects of assisted and resisted plyometric jumptraining on jump height, sprint performance (acceleration (0–20m), maximum speed (30–40m) and40m sprint time) among physically active females. Fifty-six participants (age: 21.1 ± 1.7 years; bodymass: 64.2 ± 7.0 kg; height: 168.0 ± 5.6 cm) were randomly allocated to either an assisted (n = 16) orresisted training group (n = 17), or a control group (n = 14). Nine participants dropped out duringthe intervention. The training sessions consisted of three different plyometric jump exercises overan eight-week period, while the control group continued their normal training routine. The resultsrevealed a significant between-group difference in jump height and maximal speed. The resistedtraining group achieved a significantly greater improvement in jump height compared to theactive control group (p = .04, ES=1.06), and a significantly greater improvement in maximalspeed (p = .02, ES = 0.93) when compared to the assisted training group. No other groupdifferences were observed for jump height, acceleration or in maximal speed (p = .31–.53). Theresisted training group improved jump height (p = .01, ES = 0.62) and maximum speed (p = .03,ES = 0.48) from pre- to post-test, while the control group improved maximal speed (p = .04, ES =0.37) and acceleration (p = .01, ES = 0.68). All three groups improved their 40m sprint time frompre- to post-test (p = .01–.04, ES = 0.38–0.45). In conclusion, resisted plyometric training wasmore effective than assisted plyometric training for improving the maximal speed and moreeffective than the active control condition for increasing jump height.
KEYWORDSCountermovement jump;acceleration; maximalrunning velocity; overspeed;overload
Introduction
Optimizing jumping qualities, acceleration and maximalspeed is considered fundamental for successful perform-ance in many sports (Bobbert, 1990; Matavulj et al., 2001;Nealer et al., 2017). These qualities are influenced byforce production and contraction velocity, where theproduct of force and velocity is defined as poweroutput (Knuttgen & Kraemer, 1987). Several researchershave stated that plyometric training is the preferredtraining method for enhancing power output in thelower extremities (Ebben & Blackard, 2001; Ebben,Carroll, & Simenz, 2004; Markovic et al., 2007). Plyometrictraining is synonymous with exercises involving thestretch-shortening cycle (SSC) which is defined as thetransition between high velocity eccentric muscleaction, immediately followed by a powerful concentricmuscle contraction (Komi, 1984; Kubo, Kawakami, &Fukunaga, 1999). Plyometric training programmes
typically includes bilateral jumping movements (verticaland horizontal) (Argus, Gill, Keogh, Blazevich, & Hopkins,2011; Harris, Cronin, Hopkins, & Hansen, 2008; Markovic,Mirkov, Knezevic, & Jaric, 2013; Markovic, Vuk, & Jaric,2011; McBride et al., 2002). Furthermore, it has beendemonstrated that plyometric training with bodyweight can enhance sprint performance through neuro-logical as well as mechanical factors such as changes inmuscle activity (McBride et al., 2002), increased rate offorce-development (RFD) (Häkkinen et al., 1990; Winche-ster et al., 2008), maximal power output (Harris et al.,2008; McBride et al., 2002) and elastic tendon properties(Davies, Riemann, & Manske, 2015).
More recently, plyometric training with assistance(reduced load) or resistance (increased load) havegained increased interest (Argus et al., 2011; Khodaei,Mohammadi, & Badri, 2017; Markovic et al., 2011; Marko-vic et al., 2013; Stien, Strate, Andersen, & Saeterbakken,
© 2021 The Author(s). Published by Informa UK Limited, trading as Taylor & Francis GroupThis is an Open Access article distributed under the terms of the Creative Commons Attribution-NonCommercial-NoDerivatives License (http://creativecommons.org/licenses/by-nc-nd/4.0/), which permits non-commercial re-use, distribution, and reproduction in any medium, provided the original work is properly cited, and is not altered, transformed, or builtupon in any way.
CONTACT Morten Strate [email protected] Faculty of Sport Science and Physical Education, University of Agder, Post Box 422, 4604 Kris-tiansand, Norway
Supplemental data for this article can be accessed at https://doi.org/10.1080/17461391.2021.1968503.
EUROPEAN JOURNAL OF SPORT SCIENCEhttps://doi.org/10.1080/17461391.2021.1968503

2020). Theoretically, by adding assistance or resistanceto the athletes’ body mass, faster muscle contractionsor a greater initial force than normally can be achieved(Markovic et al., 2011; Sheppard et al., 2011). Assistedplyometric training could therefore lead to greater per-formance on high velocity movements, while resistedplyometric training primarily enhances performancethrough increased muscle force for lower velocity move-ments (Argus et al., 2011; Sheppard et al., 2011). Previousstudies comparing the two modalities have focused onjump performance and reported similar effects (Arguset al., 2011; Markovic et al., 2011; Markovic et al., 2013).However, one study, Khodaei et al. (2017), examinedon sprint performance after four weeks of either assistedor resisted plyometric training. Both modalitiesimproved more than common plyometric exercises(control) on 10–20m and 20–30m sprint time. Further-more, the resisted group improved more than theassisted group on 0–10m and 0–30m sprint time. Impor-tantly, all of the abovementioned studies only includedvertical exercises (and not combined both vertical andhorizontal PT exercises). To the authors’ best knowledge,only one study has compared both training approachesin the same study using both vertical and horizontalexercises (Stien et al., 2020). Stien et al (2020) comparedthe effect of assisted and resisted plyometric training onjump height and showed no difference between thegroups. Importantly, jump height was measured usingthe squat jump which is less specific to both sportspecific movement and plyometric training.
The present study aimed to investigate the effects fol-lowing eight weeks of assisted or resisted plyometricjump training on counter movement jump (CMJ) per-formance, sprint performance in the acceleration phase(0–20 m) and in the maximum speed phase (30–40 m).Training effects in the intervention groups were com-pared with changes in a control group who continuedtheir usual training routines. Based on earlier studies(Argus et al., 2011; Markovic et al., 2011; Rimmer & Slei-vert, 2000), it was hypothesized that; (A) both plyometrictraining groups would increase CMJ performance, butthe assisted training group will achieve greater changethan the resisted group, (B) comparing the training
groups, the resisted training group would achieve agreater improvement in the acceleration phasewhereas the assisted group would achieve a greaterimprovement in maximum speed phase, and (C) bothplyometric training groups would achieve greaterimprovements in CMJ, acceleration and maximumspeed phases of a sprint than the control group.
Methods
Experimental design
To determine the potential differences between assistedor resisted plyometric training on CMJ, acceleration andmaximum speed, a randomized controlled trial wasconducted. The tests used in this study included anthro-pometric measurements, CMJ and 40 m sprint perf-ormance. After all pre-tests were completed, theparticipants were randomly allocated to either an assistedor a resisted training group, or to a control group (Table 1).Participants in the two training groups were scheduled tocomplete twenty training sessions over eight weeks.
Participants
A total of 56 physically active female students between19 and 26 years volunteered to participate in thestudy. The included subjects were either physical edu-cation students who participated in various physicalactivities throughout their academic curriculum, activewithin individual training, fitness or team sports, or acombination of these. The following inclusion criteriawere met; all participants (A) were regularly physicallyactive and were familiar with jumping and sprinting,(B) did not suffer from any medical conditions thatcould influence the training or test-results, (C) did notpractice any systematic plyometric training or sprinttraining in the last six months and (D) had to be ableto sprint 40 m in less than seven seconds. Due toethical reasons, the last inclusion criterion was notgiven to participants. Instead, participants who did notmeet these criteria completed the intervention butwere excluded from the analyses.
All participants (including the active control group)were instructed to continue their regular training rou-tines during the intervention. As none of the participantsperformed any systematic plyometric or sprint trainingin their regular training routines before participating,they were instructed to refrain from this during the inter-vention. The participants’ estimated weekly trainingvolume, outside the intervention, was controlled via aquestionnaire at pre- and post-test. Data from nine par-ticipants was excluded due to one of the following
Table 1. Subject characteristics and estimated weekly trainingvolume at pre-test.
Assisted(N = 16)
Resisted(N = 17)
Control(N = 14) p
Age (years) 21.3 ± 1.3 20.9 ± 1.9 21.1 ± 1.8 .77Height (cm) 168.2 ± 6.5 167.1 ± 5.5 168.6 ± 4.8 .75Body mass (kg) 62.1 ± 7.1 63.3 ± 6.1 67.5 ± 7.1 .09Training (h) 5.5 ± 3.6 6.3 ± 4.8 8.3 ± 5.6 .27
Results are given as mean ± SD. h, hours estimated weekly training volume;p, p-value between groups.
2 M. STRATE ET AL.

reasons; (A) injuries not related to the study (2), (B) failedto achieve the required number (> 80%) of training ses-sions (3), (C) personal reasons (2), (D) or failed to perform40 m sprint in less than seven seconds (2). This left a totalof forty-seven participants to be included in the analysis.
Prior to the commencement of the study, all partici-pants were fully informed orally and in writing, of thenature of the testing as well as the potential risks andbenefits. A written consent form was signed by each par-ticipant before the pre-test. The study was approved bythe Norwegian Centre for Research Data (56489/3/HJT)and the research was conducted ethically according tothe standards described by the European Journal ofSport Science and the latest version of the HelsinkiDeclaration.
Procedures
Before the commencement of the study, all participantswere instructed not to perform any leg training two daysbefore testing. Pre-test took place over three separatedays and was separated by a minimum of 48 hours.Day one included anthropometric measurements,while day two consisted of CMJ measurement. Daythree involved a 40 m sprint with split-time on anindoor running track. As the subjects were physicallyactive and had previous experience with activitieswhich involves both jumping and running, no familiariz-ation session was performed. Instead, a minimum ofthree attempts for CMJ and 40 m sprint was given toensure that their maximum performance was achieved.If the third attempt was the best, additional attemptswere given until the performance stagnated. The resultfrom the best attempt was used for further analysis.Post-tests were conducted identical to the pre-test pro-tocol as described above.
Measurements
CMJ height was measured on a force plate (ErgotestInnovation A/S, Porsgrunn, Norway) connected to a PCwith the software Musclelab (v. 10.4.37.4073, ErgotestInnovation A/S, Porsgrunn, Norway). Calibration of theforce plate was done according to the manufacturer’sspecifications before each test day. A standardizedwarm-up routine consisting of two series with five CMJand five squat jumps (SJ) with maximal effort wascarried out prior to testing (Andrade et al., 2015). Partici-pants performed the CMJ with approximately 90degrees knee angle during the testing. All participantswere instructed to perform the jumps with maximumeffort and their hands placed akimbo throughout theentire jump phase. The jump was disallowed if the
hands left the hip at any point. The participants weregiven a 90-second rest period between each test trial.
The warm-up protocol in advance of the 40 m sprinttest consisted of 400 metres of jogging, 4 × 40 mrunning drills (inward rotation, outward rotation, highknees, back kicks) and 2 × 40 m sprints gradually acceler-ating to maximal effort. The information about partici-pants’ split times was collected at 0, 20, 30 and 40metres using four pairs of photocells (Ergotest Inno-vation A/S, Porsgrunn, Norway) connected to a PC withthe software Musclelab (v. 10.4.37.4073, Ergotest Inno-vation A/S, Porsgrunn, Norway). The acceleration phasewas defined as the time between 0 and 20 m (m/s),while the maximal speed phase was defined as thetime between 30 and 40 m (m/s). To avoid accidentaltimer activation or reaction time as a factor in theinitial start, a 30 cm flying start was used to activatethe first photocell, and the participants could thereforeinitiate the start when they were ready (Loturco et al.,2018). Between each test trial, an active rest periodbetween four and five minutes was given and all partici-pants were instructed to run with maximum effortthroughout the race.
Training
Before each training session, a standardized warm-uproutine was completed. The routine consisted of twosets of ten body weight squats followed by two sets offive CMJ performed with maximal effort separated byone-minute rest in between the sets (Argus et al.,2011). During the eight-week training intervention,rubber bands were used to provide either assistance orresistance to the participants (Figure 1).
The training consisted of three different exercises:vertical jumps, Bulgarian squat jumps, and broadjumps for both experimental groups (Figure 1). All verti-cal jumps within one set were performed consecutivelywithout rest between the repetitions. For the broadjumps, the participants immediately had to move backto their starting position after landing to perform theirnext repetition with as little rest as possible betweenrepetitions. The rest-period between each set was aminimum of three minutes (Argus et al., 2011), and allparticipants were instructed to perform all exerciseswith maximal effort and as explosively as possible. Armswing was allowed in the broad jump-exercise.
To simulate an increase or decrease of the partici-pants body mass for the vertical jumps, rubber bandswere attached to a chain above the subjects in theassisted group and below the subjects in the resistedgroup. For the assisted group, the rubber bands wereplaced under the participants arms during the vertical
EUROPEAN JOURNAL OF SPORT SCIENCE 3
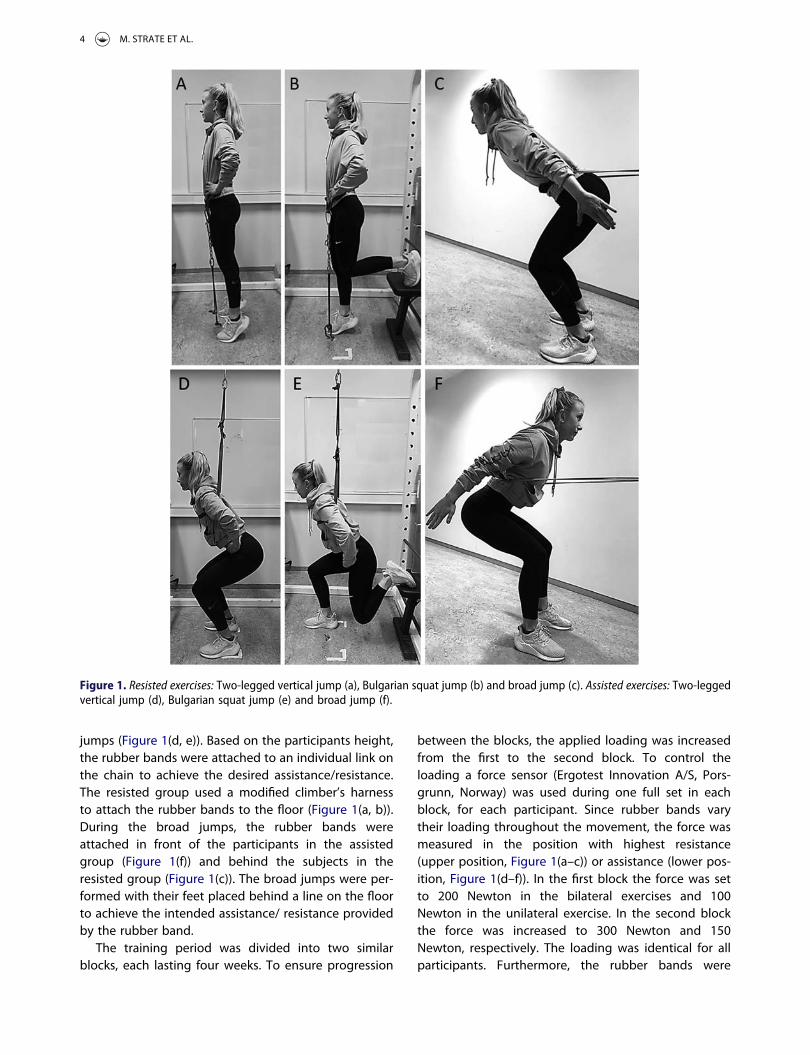
jumps (Figure 1(d, e)). Based on the participants height,the rubber bands were attached to an individual link onthe chain to achieve the desired assistance/resistance.The resisted group used a modified climber’s harnessto attach the rubber bands to the floor (Figure 1(a, b)).During the broad jumps, the rubber bands wereattached in front of the participants in the assistedgroup (Figure 1(f)) and behind the subjects in theresisted group (Figure 1(c)). The broad jumps were per-formed with their feet placed behind a line on the floorto achieve the intended assistance/ resistance providedby the rubber band.
The training period was divided into two similarblocks, each lasting four weeks. To ensure progression
between the blocks, the applied loading was increasedfrom the first to the second block. To control theloading a force sensor (Ergotest Innovation A/S, Pors-grunn, Norway) was used during one full set in eachblock, for each participant. Since rubber bands varytheir loading throughout the movement, the force wasmeasured in the position with highest resistance(upper position, Figure 1(a–c)) or assistance (lower pos-ition, Figure 1(d–f)). In the first block the force was setto 200 Newton in the bilateral exercises and 100Newton in the unilateral exercise. In the second blockthe force was increased to 300 Newton and 150Newton, respectively. The loading was identical for allparticipants. Furthermore, the rubber bands were
Figure 1. Resisted exercises: Two-legged vertical jump (a), Bulgarian squat jump (b) and broad jump (c). Assisted exercises: Two-leggedvertical jump (d), Bulgarian squat jump (e) and broad jump (f).
4 M. STRATE ET AL.

measured daily and replaced if they did not provide thecorrect loading at the correct length. To ensure pro-gression within each block the training volume wasincreased between the second and third week (Table 2).
Statistical analyses
Visual inspection of Q-Q plots revealed no violations ofnormality between groups. To identify potential differ-ences between groups, the pre-post change was ana-lysed using one-way analysis of variance (ANOVA) withTukey post hoc tests. Significant differences betweenpre- and post-values within each group were identifiedby performing paired sample t-tests. Cohen`s d wasused to determine effect size (ES) if differences wereobserved. An ES of < 0.2, 0.2–0.5, 0.5–0.8 and > 0.8were considered as trivial, small, moderate, and largeeffects, respectively (Cohen, 1988). The criterion alphalevel was set at p≤ .05, and all statistical analyses wereperformed using the statistical software SPSS (Version25, SPSS, Inc., Chicago, Illinois, USA). All analysed dataare presented as means ± 95% confidence intervalswhile descriptive data are presented as means ± stan-dard deviation.
Results
Baseline data
There were no significant differences in any of the per-formance variables between the groups at pre-test (p= .08–.58). A mean training attendance of 90% wasreached for both training groups.
Effects of training intervention
Counter movement jumpA significant difference in change between the groupswas observed for jump height (F = 3.256, p = .05). Posthoc comparisons demonstrated that the resisted train-ing group achieved greater improvement in jumpheight compared to the active control group (p = .04,ES = 1.06; table 3), while no other differences werefound between groups (p = .31–.53). From pre to post,the resisted group achieved a significant mean improve-ment of 3.58 cm (p = .01, supplementary Figure 1), while
no significant changes occurred for the assisted group(p = .10) or the control group (p = .94).
Sprint performanceA significant difference between the groups was foundfor the maximal speed phase (F = 4.053, p = .02), butnot for the acceleration phase (F = 1.120, p = .34) or thetotal sprint time (F = 0.912, p = .41). While the resistedtraining group improved their maximal speed by 0.30m/s (p = .03, supplementary figure 2), the assistedgroup demonstrated a non-significant decline by −0.10m/s (p = .29) from pre- to post test. The control groupsignificantly improved their maximal speed by 0.21 m/s (p = .04). Post hoc comparisons demonstrated thatthe resisted training group achieved a greater improve-ment in the maximum speed phase compared to theassisted training group (p = .02, ES = 0.93), while noother differences were found between groups (p= .39–.42).
None of the intervention groups increased theiracceleration phase from pre- to post-test (p = .09–.11,supplementary figure 3). However, the control groupincreased their speed in the acceleration phase by 0.17m/s (p = .01). All groups reduced their total 40m sprinttime from the start to the end of the intervention (p= .01–.04, supplementary figure 4).
Other trainingNone of the groups changes their estimated weeklytraining volume significantly during the intervention (Δresisted; 0.4 ± 3.1 hours, Δ assisted; −0.6 ± 2.5 hours, Δcontrol; −0.3 ± 2.8 hours, p = .34–.67) and there was nosignificant difference in change between the groups (F= 0.591, p = .56).
Discussion
The main findings of the present study were thatresisted plyometric training improved the maximalspeed phase more than assisted plyometric trainingand jump height more than the active control group.Furthermore, the resisted training group improvedjump height and maximum speed phase from pre- topost-test, while the control group improved theirmaximal speed phase and acceleration phase. All threegroups improved their 40m sprint time from pre- topost-test.
In contrast to the hypothesis, a large between-groupeffect (ES = 0.97) was found in the maximum speedphase between the resisted and assisted traininggroup, favouring the resisted group. This opposes thebelief that training with an emphasis on the velocityaspect of the movements (assisted training) would be
Table 2. Training progression, and volume characteristics.Block 1 Block 2
Week 1–2 3–4 5–6 7–8Sessions per week 2 3 2 3Sets × reps 4 × 5 5 × 5 4 × 5 5 × 5Exercises 3 3 3 3Training volume (reps per session) 60 75 60 75
EUROPEAN JOURNAL OF SPORT SCIENCE 5
more beneficial for improving maximal velocity byincreasing stride length and/or stride rate during highspeed running (Bartolini et al., 2011). Importantly, sincethe velocity during the plyometric training was notmeasured, we cannot be certain that the participantsin the assisted training group were able to jump witha higher velocity than possible without the assistance.Also, although well trained participants have been ableto utilize the assistance to produce a higher velocity(Argus et al., 2011), the same might not be true for thepresent, less trained population. Further, since usingrubber bands as assistance will unload the participants’body mass, the overall load will be reduced. If thereduced load is not compensated by increased accelera-tion, the force (i.e. training stimuli) on the lower extremi-ties would be sub-optimal. Furthermore, a reduced bodymass would also induce a reduced training volume.Therefore, the increased training volume and loadingmay have led to an increased ability to produce forcein the resisted group which have been shown to beimportant for explosive parameters (Komi, 1984; Marko-vic et al., 2007).
Only the resisted plyometric training group increasedjump performance more than the active control group,which is also in contrast to our hypothesis. Importantly,the reported p-value was at the borderline of the alpha-level (p = .05) and the results should therefore be inter-preted with caution. Although there was no differencein change between the two interventions, only theresisted group improved from pre to post-test and theeffect size of the change is distinctly greater than forthe resisted (ES = 0.62) compared to the assisted group(ES = 0.32). This could be explained by the aforemen-tioned arguments, suggesting that the resisted plyo-metric training produces a more potent stimuluscompared to the assisted plyometric training in thepresent population.
There were no differences in change between thegroups in the acceleration phase and 40 m sprint time.The lack of difference was in contrast to our hypothesisand literature stating that resisted plyometric trainingwould be more beneficial for the acceleration phasethan the other groups, due to the similar ground
reaction forces between resisted plyometric trainingand the acceleration phase of a sprint (Rimmer & Slei-vert, 2000). Resisted plyometric training emphasizesthe force aspects of the movements and thereby con-tribute to increased force applied to the ground perstride resulting in a greater acceleration (Bartoliniet al., 2011; Murray et al., 2005). However, due to thelow training status of the participants in this study(only familiar with running and sprinting) it is possiblethat although jumping resembles the eccentric-con-centric contraction pattern of sprinting, the biomechani-cal specificity of the training may not be specific enoughfor individuals without considerable sprinting experi-ence (Sale & MacDougall, 1981). It could therefore bespeculated that assisted or resisted plyometric trainingis more transferable to the acceleration phase amongwell trained athletes who are highly familiar with sprint-ing and have a well developed running technique.
The lack of a clear pattern favouring the interventiongroups compared to the control group could beexplained by several factors. Since the control groupwas instructed to continue their normal training rou-tines, it is also possible that this activity contributed toimprovements in these parameters. The control grouphad a non-significant higher average weekly trainingvolume compared to the intervention groups at bothpre- and post-test (pre-test; 2.0–2.8 hours per week,post-test; 1.3–3.1 hours per week). Although not reach-ing significance, it is possible that this difference overtime might have affected the between-group results.Further, we can`t exclude the possibility that membersof the control group changed their behaviour as aresult of being randomized to the control group (JohnHenry-effect), although all participants were told exclu-sively to continue their normal training routines. Also,the lack of difference between the intervention groupsand the control group could be attributed to the popu-lation. Although the participants in this study were reg-ularly physical active, they were not experienced withsystematic plyometric training. The effects of plyometrictraining have been suggested to be more relevant forindividuals who already have obtained high levels ofstrength but lack the ability to utilize their power
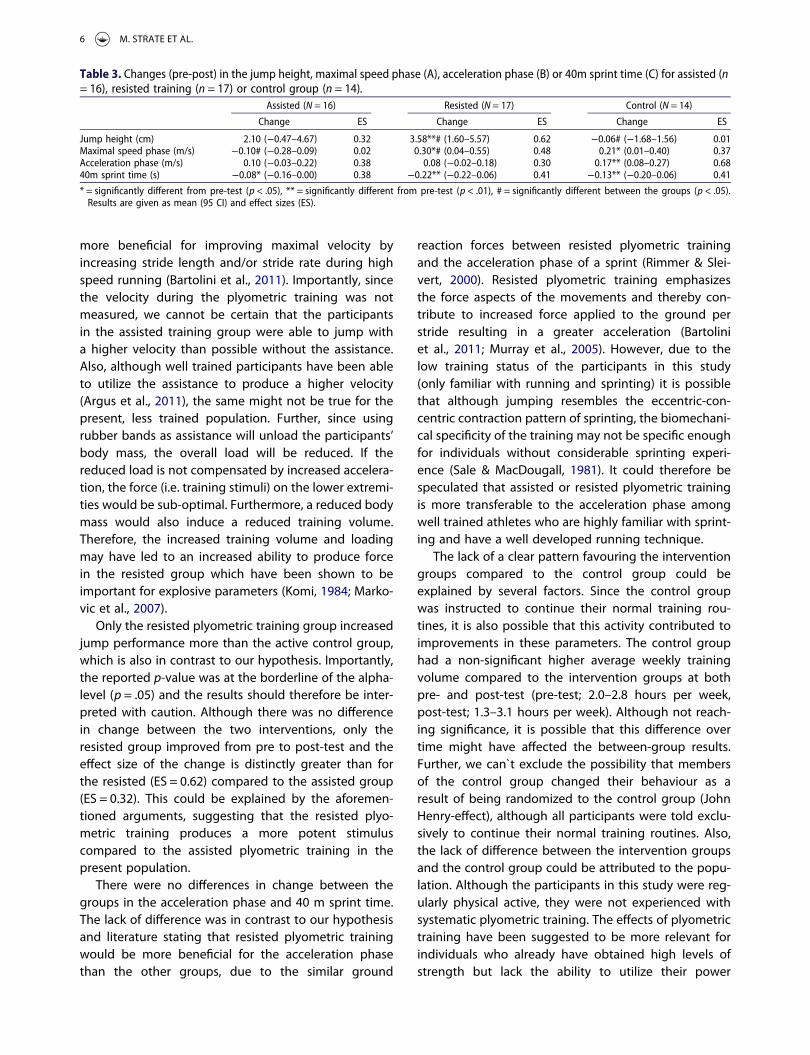
Table 3. Changes (pre-post) in the jump height, maximal speed phase (A), acceleration phase (B) or 40m sprint time (C) for assisted (n= 16), resisted training (n = 17) or control group (n = 14).
Assisted (N = 16) Resisted (N = 17) Control (N = 14)
Change ES Change ES Change ES
Jump height (cm) 2.10 (−0.47–4.67) 0.32 3.58**# (1.60–5.57) 0.62 −0.06# (−1.68–1.56) 0.01Maximal speed phase (m/s) −0.10# (−0.28–0.09) 0.02 0.30*# (0.04–0.55) 0.48 0.21* (0.01–0.40) 0.37Acceleration phase (m/s) 0.10 (−0.03–0.22) 0.38 0.08 (−0.02–0.18) 0.30 0.17** (0.08–0.27) 0.6840m sprint time (s) −0.08* (−0.16–0.00) 0.38 −0.22** (−0.22–0.06) 0.41 −0.13** (−0.20–0.06) 0.41
* = significantly different from pre-test (p < .05), ** = significantly different from pre-test (p < .01), # = significantly different between the groups (p < .05).Results are given as mean (95 CI) and effect sizes (ES).
6 M. STRATE ET AL.

output or movement velocity (Argus et al., 2011; Shep-pard et al., 2011). It is therefore possible that the popu-lation included in the present study lacked sufficientlevels of strength to optimally utilize the trainingstimuli from the plyometric training.
The present study is, to the authors’ knowledge, thefirst to compare the effects of assisted or resisted plyo-metric training on jump and sprint performance in thesame study. Comparable studies (Davies et al., 2015;Häkkinen et al., 1990; Stien et al., 2020; Winchesteret al., 2008) have only included bilateral vertical jumpsin their training protocol or only measured jump per-formance. In accordance with the present study noneof these abovementioned studies reported differencein change in jump height between assisted and resistedplyometric training.
Although a strong study design was used to comparethe effects of assisted or resisted plyometric training,there are some limitations that may be considered.The relatively short intervention period and smallsample size could lead to a lower statistical power.Further, the present study aimed to investigate thesetraining methods with only the external loading as theindependent factor and therefore both training groupsperformed the same number of jumps per trainingsession. The resisted training group therefore achieveda greater training volume than the assisted group,since unloading the participants body mass reducesthe overall training volume. Training outside the inter-vention may have influenced the results of the study.The participants were instructed to continue theirregular training routines, which was controlled for by aquestionnaire at pre- and post-test. However, the partici-pants only reported the weekly training volume in hoursper week without specifying the type of training. A morespecified questionnaire may have brought more insightinto the results. Finally, since only physically activefemales were included in this study, the findingscannot be generalized to other populations.
In conclusion, although both interventions might bebeneficial for improving jump and sprint performance,this study indicates that resisted plyometric trainingcan improve the maximal speed phase to a greaterextent compared to assisted plyometric trainingamong physically active females. Further, the resistedplyometric training seems like a more potent stimulusfor improving jump performance than to continue rec-reational training. Future research should include welltrained individuals with extensive sprinting or jumpingexperience, and a larger sample size over a longer inter-vention period to provide a greater understanding of thepotential differences between the two training methods.
Disclosure statement
No potential conflict of interest was reported by the author(s).
References
Andrade, D., Henriquez-Olguin, C., Beltran, A., Ramirez, M.,Labarca, C., Cornejo, M.,… Ramirez-Campillo, R. (2015).Effects of general, specific and combined warm-up onexplosive muscular performance. Biology of Sport, 32(2),123–128.
Argus, C. K., Gill, N. D., Keogh, J. W., Blazevich, A. J., & Hopkins,W. G. (2011). Kinetic and training comparisons betweenassisted, resisted, and free countermovement jumps.Journal of Strength and Conditioning Research, 25(8), 2219–2227.
Bartolini, J. A., Brown, L. E., Coburn, J. W., Judelson, D. A.,Spiering, B. A., Aguirre, N. W.,… Harris, K. B. (2011).Optimal elastic cord assistance for sprinting in collegiatewomen soccer players. Journal of Strength andConditioning Research, 25(5), 1263–1270.
Bobbert, M. F. (1990). Drop jumping as a training method forjumping ability. Sports Medicine, 9(1), 7–22.
Cohen, J. (1988). Statistical power analysis for the behavioralsciences. Vol. 2. Hillsdale: Lawrence Earlbaum Associates.
Davies, G., Riemann, B. L., & Manske, R. (2015). Current conceptsof plyometric exercise. International Journal of SportsPhysical Therapy, 10(6), 760–786.
Ebben, W. P., & Blackard, D. O. (2001). Strength and condition-ing practices of National Football League strength and con-ditioning coaches. Journal of Strength and ConditioningResearch, 15(1), 48–58.
Ebben, W. P., Carroll, R. M., & Simenz, C. J. (2004). Strength andconditioning practices of National Hockey League strengthand conditioning coaches. Journal of Strength andConditioning Research, 18(4), 889–897.
Häkkinen, K., Pakarinen, A., Kyröläinen, H., Cheng, S., Kim, D., &Komi, P. (1990). Neuromuscular adaptations and serum hor-mones in females during prolonged power training.International Journal of Sports Medicine, 11(2), 91–98.
Harris, N. K., Cronin, J. B., Hopkins, W. G., & Hansen, K. T. (2008).Squat jump training at maximal power loads vs. Heavyloads: Effect on sprint ability. Journal of Strength andConditioning Research, 22(6), 1742–1749.
Khodaei, K., Mohammadi, A., & Badri, N. (2017). A comparisonof assisted, resisted, and common plyometric trainingmodes to enhance sprint and agility performance. TheJournal of Sports Medicine and Physical Fitness, 57(10),1237–1244.
Knuttgen, H., & Kraemer, W. (1987). Terminology and measure-ment in exercise performance. Journal of Strength andConditioning Research, 1, 1–10.
Komi, P. V. (1984). Physiological and biomechanical correlatesof muscle function: Effects of muscle structure and stretch-shortening cycle on force and speed. Exercise and SportScience Reviews, 12, 81–121.
Kubo, K., Kawakami, Y., & Fukunaga, T. (1999). Influence ofelastic properties of tendon structures on jump performancein humans. Journal of Applied Physiology, 87(6), 2090–2096.
Loturco, I., Contreras, B., Kobal, R., Fernandes, V., Moura, N.,Siqueira, F.,… Rogan, S. (2018). Vertically and horizontally
EUROPEAN JOURNAL OF SPORT SCIENCE 7
directed muscle power exercises: Relationships with top-level sprint performance. PLoS One, 13(7), e0201475–13.
Markovic, G., et al. (2007). Effects of sprint and plyometrictraining on muscle function and athletic performance.Journal of Strength and Conditioning Research, 21(2),543–549.
Markovic, G., Vuk, S., & Jaric, S. (2011). Effects of jump trainingwith negative versus positive loading on jumping mech-anics. International Journal of Sports Medicine, 32(5),365–372.
Markovic, S., Mirkov, D. M., Knezevic, O. M., & Jaric, S. (2013).Jump training with different loads: Effects on jumping per-formance and power output. European Journal of AppliedPhysiology, 113(10), 2511–2521.
Matavulj, D., et al. (2001). Effects of plyometric training onjumping performance in junior basketball players. TheJournal of Sports Medicine and Physical Fitness, 41(2),159–164.
McBride, J. M., et al. (2002). The effect of heavy- vs. Light-loadjump squats on the development of strength, power, andspeed. Journal of Strength and Conditioning Research, 16(1),75–82.
Murray, A., Aitchison, T. C., Ross, G., Sutherland, K., Watt, I.,McLean, D., & Grant, S. (2005). The effect of towing arange of relative resistances on sprint performance.Journal of Sports Sciences, 23(9), 927–935.
Nealer, A. L., Dunnick, D. D., Malyszek, K. K., Wong, M. A., Costa,P. B., Coburn, J. W., & Brown, L. E. (2017). Influence of restintervals after assisted sprinting on bodyweight sprinttimes in female collegiate soccer players. Journal ofStrength and Conditioning Research, 31(1), 88–94.
Rimmer, E., & Sleivert, G. (2000). Effects of a plyometrics inter-vention program on sprint performance. Journal of Strengthand Conditioning Research, 14(3), 295–301.
Sale, D., & MacDougall, D. (1981). Specificity in strength train-ing: A review for the coach and athlete. Canadian Journalof Applied Sport Sciences, 6(2), 87–92.
Sheppard, J. M., Dingley, A. A., Janssen, I., Spratford, W.,Chapman, D. W., & Newton, R. U. (2011). The effect ofassisted jumping on vertical jump height in high-perform-ance volleyball players. Journal of Science and Medicine inSport, 14(1), 85–89.
Stien, N., Strate, M., Andersen, V., & Saeterbakken, A. H. (2020).Effects of overspeed or overload plyometric training onjump height and lifting velocity. Sports MedicineInternational Open, 4(02), E32–E38.
Winchester, J. B., McBride, J. M., Maher, M. A., Mikat, R. P., Allen,B. K., Kline, D. E., & McGuigan, M. R. (2008). Eight weeks ofballistic exercise improves power independently ofchanges in strength and muscle fiber type expression.Journal of Strength and Conditioning Research, 22, 1728–1734.
8 M. STRATE ET AL.