The effective temperature scale of FGK stars. I. Determination of temperatures and angular diameters...
17
arXiv:astro-ph/0503108v1 4 Mar 2005 To Appear in ApJ Preprint typeset using L A T E X style emulateapj v. 6/22/04 THE EFFECTIVE TEMPERATURE SCALE OF FGK STARS. I. DETERMINATION OF TEMPERATURES AND ANGULAR DIAMETERS WITH THE INFRARED FLUX METHOD Iv´ an Ram´ ırez 1 Department of Astronomy, University of Texas at Austin, RLM 15.306, TX 78712-1083 and Jorge Mel´ endez 1 Department of Astronomy, California Institute of Technology, MC 105–24, Pasadena, CA 91125 Preprint version February 2, 2008 ABSTRACT The infrared flux method (IRFM) has been applied to a sample of 135 dwarf and 36 giant stars covering the following regions of the atmospheric parameters space: 1) the metal-rich ([Fe/H] 0) end (consisting mostly of planet-hosting stars), 2) the cool (T eff 5000 K) metal-poor (-1 [Fe/H] -3) dwarf region, and 3) the very metal-poor ([Fe/H] -2.5) end. These stars were especially selected to cover gaps in previous works on T eff vs. color relations, particularly the IRFM T eff scale of A. Alonso and collaborators. Our IRFM implementation was largely based on the Alonso et al. study (absolute infrared flux calibration, bolometric flux calibration, etc.) with the aim of extending the ranges of applicability of their T eff vs. color calibrations. In addition, in order to improve the internal accuracy of the IRFM T eff scale, we recomputed the temperatures of almost all stars from the Alonso et al. work using updated input data. The updated temperatures do not significantly differ from the original ones, with few exceptions, leaving the T eff scale of Alonso et al. mostly unchanged. Including the stars with updated temperatures, a large sample of 580 dwarf and 470 giant stars (in the field and in clusters), which cover the ranges: 3600 K T eff 8000 K, -4.0 [Fe/H] +0.5, have T eff homogeneously determined with the IRFM. The mean uncertainty of the temperatures derived is 75 K for dwarfs and 60 K for giants, which is about 1.3% at solar temperature and 4500 K, respectively. It is shown that the IRFM temperatures are reliable in an absolute scale given the consistency of the angular diameters resulting from the IRFM with those measured by long-baseline interferometry, lunar occultation and transit observations. Using the measured angular diameters and bolometric fluxes, a comparison is made between IRFM and direct temperatures, which shows excellent agreement, with the mean difference being less than 10 K for giants and about 20 K for dwarf stars (the IRFM temperatures being larger in both cases). This result was obtained for giants in the ranges: 3800 K<T eff < 5000 K, -0.7 < [Fe/H] < 0.2; and dwarfs in the ranges: 4000 K<T eff < 6500 K, -0.55 < [Fe/H] < 0.25; and thus the zero point of the IRFM T eff scale is essentially the absolute one (that derived from angular diameters and bolometric fluxes) within these limits. The influence of the bolometric flux calibration adopted is explored and it is shown that its effect on the T eff scale, although systematic, is conservatively no larger than 50 K. Finally, a comparison with temperatures derived with other techniques is made. Agreement is found with the temperatures from Balmer line-profile fitting and the surface-brightness technique. The temperatures derived from the spectroscopic equilibrium of Fe I lines are differentially consistent with the IRFM but a systematic difference of about 100 K and 65 K (the IRFM temperatures being lower) is observed in the metal-rich dwarf and metal-poor giant T eff scales, respectively. Subject headings: stars: atmospheres — stars: fundamental parameters — infrared: stars 1. INTRODUCTION The effective temperature (T eff ) is one of the funda- mental properties of a star. In principle, it may be de- termined from the stellar angular diameter θ and the bolometric flux f bol according to: f bol = θ 2 4 σT 4 eff , (1) where σ is the Stefan-Boltzmann constant. In practice, however, the difficulties and limitations that arise when measuring angular diameters restrict the direct deter- mination of temperatures to a relatively low number of 1 Affiliated with the Seminario Permanente de Astronom´ ıa y Ciencias Espaciales of the Universidad Nacional Mayor de San Mar- cos, Peru stars. The problem is worse for main sequence stars al- though interferometric (see e.g. Kervella et al. 2004) and transit (Brown et al. 2001) observations have been recently performed. Even though there are alternative ways to determine effective temperatures, all of them require the introduc- tion of models, which makes the results somewhat de- pendent on the models adopted. In the range of spec- tral types F0-K5, the effective temperature may be de- termined from the spectroscopic conditions of excita- tion and ionization equilibrium of Fe lines (e.g. Takeda et al. 2002a, hereafter T02a), synthetic photometry (e.g. Bessell et al. 1998, hereafter B98; Houdashelt et al. 2000), fitting of the Balmer line-profiles (e.g. Fuhrmann 1998, hereafter F98; Barklem et al. 2002), and line- depth ratios (e.g. Gray 1994; Kovtyukh et al. 2003,
Transcript of The effective temperature scale of FGK stars. I. Determination of temperatures and angular diameters...
arX
iv:a
stro
-ph/
0503
108v
1 4
Mar
200
5To Appear in ApJPreprint typeset using LATEX style emulateapj v. 6/22/04
THE EFFECTIVE TEMPERATURE SCALE OF FGK STARS. I. DETERMINATION OF TEMPERATURESAND ANGULAR DIAMETERS WITH THE INFRARED FLUX METHOD
Ivan Ramırez1
Department of Astronomy, University of Texas at Austin, RLM 15.306, TX 78712-1083
and
Jorge Melendez1
Department of Astronomy, California Institute of Technology, MC 105–24, Pasadena, CA 91125Preprint version February 2, 2008
ABSTRACT
The infrared flux method (IRFM) has been applied to a sample of 135 dwarf and 36 giant starscovering the following regions of the atmospheric parameters space: 1) the metal-rich ([Fe/H] & 0) end(consisting mostly of planet-hosting stars), 2) the cool (Teff . 5000 K) metal-poor (−1 . [Fe/H] . −3)dwarf region, and 3) the very metal-poor ([Fe/H] . −2.5) end. These stars were especially selected tocover gaps in previous works on Teff vs. color relations, particularly the IRFM Teff scale of A. Alonsoand collaborators. Our IRFM implementation was largely based on the Alonso et al. study (absoluteinfrared flux calibration, bolometric flux calibration, etc.) with the aim of extending the ranges ofapplicability of their Teff vs. color calibrations. In addition, in order to improve the internal accuracyof the IRFM Teff scale, we recomputed the temperatures of almost all stars from the Alonso et al. workusing updated input data. The updated temperatures do not significantly differ from the original ones,with few exceptions, leaving the Teff scale of Alonso et al. mostly unchanged. Including the stars withupdated temperatures, a large sample of 580 dwarf and 470 giant stars (in the field and in clusters),which cover the ranges: 3600 K. Teff . 8000 K, −4.0 . [Fe/H] . +0.5, have Teff homogeneouslydetermined with the IRFM. The mean uncertainty of the temperatures derived is 75 K for dwarfs and60 K for giants, which is about 1.3% at solar temperature and 4500 K, respectively. It is shown thatthe IRFM temperatures are reliable in an absolute scale given the consistency of the angular diametersresulting from the IRFM with those measured by long-baseline interferometry, lunar occultation andtransit observations. Using the measured angular diameters and bolometric fluxes, a comparisonis made between IRFM and direct temperatures, which shows excellent agreement, with the meandifference being less than 10 K for giants and about 20 K for dwarf stars (the IRFM temperaturesbeing larger in both cases). This result was obtained for giants in the ranges: 3800 K< Teff < 5000 K,−0.7 < [Fe/H] < 0.2; and dwarfs in the ranges: 4000 K< Teff < 6500 K, −0.55 < [Fe/H] < 0.25;and thus the zero point of the IRFM Teff scale is essentially the absolute one (that derived fromangular diameters and bolometric fluxes) within these limits. The influence of the bolometric fluxcalibration adopted is explored and it is shown that its effect on the Teff scale, although systematic,is conservatively no larger than 50 K. Finally, a comparison with temperatures derived with othertechniques is made. Agreement is found with the temperatures from Balmer line-profile fitting andthe surface-brightness technique. The temperatures derived from the spectroscopic equilibrium of Fe I
lines are differentially consistent with the IRFM but a systematic difference of about 100 K and 65 K(the IRFM temperatures being lower) is observed in the metal-rich dwarf and metal-poor giant Teff
scales, respectively.
Subject headings: stars: atmospheres — stars: fundamental parameters — infrared: stars
1. INTRODUCTION
The effective temperature (Teff) is one of the funda-mental properties of a star. In principle, it may be de-termined from the stellar angular diameter θ and thebolometric flux fbol according to:
fbol =θ2
4σT 4
eff , (1)
where σ is the Stefan-Boltzmann constant. In practice,however, the difficulties and limitations that arise whenmeasuring angular diameters restrict the direct deter-mination of temperatures to a relatively low number of
1 Affiliated with the Seminario Permanente de Astronomıa yCiencias Espaciales of the Universidad Nacional Mayor de San Mar-cos, Peru
stars. The problem is worse for main sequence stars al-though interferometric (see e.g. Kervella et al. 2004)and transit (Brown et al. 2001) observations have beenrecently performed.
Even though there are alternative ways to determineeffective temperatures, all of them require the introduc-tion of models, which makes the results somewhat de-pendent on the models adopted. In the range of spec-tral types F0-K5, the effective temperature may be de-termined from the spectroscopic conditions of excita-tion and ionization equilibrium of Fe lines (e.g. Takedaet al. 2002a, hereafter T02a), synthetic photometry (e.g.Bessell et al. 1998, hereafter B98; Houdashelt et al.2000), fitting of the Balmer line-profiles (e.g. Fuhrmann1998, hereafter F98; Barklem et al. 2002), and line-depth ratios (e.g. Gray 1994; Kovtyukh et al. 2003,

2 Ramırez & Melendez
hereafter K03). Our approach is the use of the infraredflux method (IRFM), which will be described in §2 andcompared to the other methods in §5.
In purely spectroscopic methods, the temperature isdetermined by constraining its value in such a way thatthe abundance of Fe I does not depend on the excitationpotential of the lower level of the lines used and that theaverage abundance of Fe derived from Fe I and Fe II linesare equal (see e.g. T02a). This actually sets a constrainton both Teff and log g (surface gravity) so degeneratesolutions may be found. The technique has been ap-plied to a wide variety of samples: stars in the thin andthick disks of the Galaxy (Bensby et al. 2003, hereafterB03), planet-hosting stars (Santos et al. 2004, hereafterSIM04), globular cluster stars (Sneden et al. 2004), andso on. Evidence is being collected, however, towards thefact that the spectroscopic method has systematic errorscaused by model uncertainties, such as non-LTE effects(note also that most spectroscopic studies use 1D-LTEclassical model atmospheres). For instance, the spectro-scopic temperatures are ∼ 100 K higher than those deter-mined with the IRFM for planet-hosting stars (Ramırez& Melendez 2004b, hereafter RM04b; SIM04), surfacegravities are ∼ 0.1 dex higher than those derived fromHipparcos parallaxes for [Fe/H] > −0.7 (Allende Prietoet al. 1999, SIM04), and ionization equilibrium of Fe isnot reproduced by classical model atmospheres neitherin the Hyades cool dwarfs (Yong et al. 2004) nor in thefield metal-rich K dwarfs (Allende Prieto et al. 2004,hereafter AP04).
Synthetic spectra and filter transmission functionshave been used to generate grids of colors in the Teff ,[Fe/H], log g space using both Kurucz (1979) ATLASmodels (B98) and Gustafsson et al. (1975) MARCS mod-els (Houdashelt et al. 2000). Synthetic colors are oftenput into the observational systems with samples of fieldstars (usually with metallicities near solar) with reliabletemperatures or calibrated color-temperature relations.Zero point corrections are finally applied until the Teff
scale resembles the absolute one.2 Since this is madewith field stars of solar metallicity, the zero point cor-rections are strictly valid only for synthetic colors with[Fe/H] ∼ 0, and its validity for other metallicities re-lies on the capability of models to reproduce real stellarspectra. Although observations and temperatures de-rived with other methods are involved in the procedure,the synthetic Teff scales retain the basic properties of themodel atmospheres adopted and are thus useful to testthem.
The strength of the hydrogen Balmer lines is very sen-sitive to the effective temperature below 8000 K and it isonly weakly affected by the surface gravity. Profile fittingis the best approach to an estimate of Teff with Balmerlines, normally within 110 K of random error. Barklemet al. (2002) found 5730 ± 70 K for the Sun with up-to-date line opacities and a reasonable agreement betweentheir temperatures and those obtained with the IRFM forTeff > 5800 K. Castelli et al. (1997), however, show thatthe results from Balmer line-profile fitting are stronglydependent on the models and the details of the convec-
2 We refer to the Teff scale obtained with direct temperatures(i.e. stellar angular diameter and bolometric flux measurements)as the absolute Teff scale.
tion treatment. To satisfactorily reproduce the profilesin the solar spectrum using ATLAS9 models with over-shoot, for example, the temperature of the Sun has to beincreased up to 5900 K.
With the line-depth ratio technique (Gray & Johans-son 1991, Gray 1994) very small internal errors (∼ 10 K)for individual stars may be achieved if several calibratedline-depth ratios are used. Even though the temperaturescale derived with this technique may be less accuratedue to systematic errors, the line-depth ratios may beused to look for very small time dependent Teff variations,like those produced by photospheric inhomogeneities andstarspots. The solar temperature with this method re-sults to be 44 K below the standard value of 5777 K andan empirical correction of 44 K has to be applied (K03).Since nothing guarantees that this correction is applica-ble to the whole range of atmospheric parameters, thesystematics, if present, are not removed.
The aim of this work is to extend and improvethe internal accuracy of the best available empiri-cal temperature-color calibrations based on the IRFM,namely, those given by Alonso et al. (1996b, here-after AAM96b; 1999b, hereafter AAM99b)3 for the(UBV RI)J(JHK)TCS and Stromgren uvby-β systems.Melendez & Ramırez (2003) and Ramırez and Melendez(2004a, hereafter RM04a) extensions to the Vilnius,Geneva, RI(C) and DDO systems will also be revised.In this paper we describe our IRFM implementationand test our results. The calibration of the metallicity-dependent Teff vs. color relations is the subject of a com-panion paper (hereafter referred to as Part II).
This paper is distributed as follows: in §2 the IRFMand its present implementation are explained, the sam-ple and input data adopted as well as their effects on thetemperatures to be derived are described in §3. The cal-culation of the final temperatures and angular diametersis given in §4 while the fundamental tests (e.g. compar-ison with measured angular diameters) and comparisonwith other methods are presented in §5. Conclusions aresummarized in §6.
2. THE IRFM AND ITS PRESENT IMPLEMENTATION
The IRFM was first introduced by Blackwell & Shallis(1977) as a mean to simultaneously determine the effec-tive temperature and angular diameter of a star. The ba-sic idea of the method is to use the emergent monochro-matic flux predicted by models (ψλ) and, similarly toEq. (1), given by
fλ =θ2
4ψλ(Teff , [Fe/H], log g) , (2)
where fλ is the corresponding flux as measured on Earth,to solve the system of equations (1) and (2) for the un-knowns Teff and θ. The IRFM thus requires fbol, [Fe/H],log g and fλ to be known a priori. The use of the infraredis due to the relatively low dependence of ψλ on Teff inthis region of the spectrum (see e.g. Fig. 1 in Blackwellet al. 1979).
A more practical approach to the IRFM was givenby Blackwell et al. (1980), who defined the R-factorsas the quotients between the total and monochromatic
3 Hereafter, the series of papers by A. Alonso and collaboratorsare referred to as AAM.

The effective temperature scale of FGK stars. I. 3
fluxes. The comparison of the observational R-factor(Robs = fbol/fλ) with a grid of theoretical R-factors(Rtheo = σT 4
eff/ψλ, note that Rtheo is a grid in the Teff ,[Fe/H], log g space at a given wavelength) allows to easilyautomatize the method.
The IRFM is often applied using more than one in-frared wavelength (λ), and a different Teff is obtained foreach λ. A critical ingredient of the IRFM is the abso-lute flux calibration of the standard star from which thefλ fluxes of the problem stars are calculated. If f cal
λ arethe absolute monochromatic fluxes for the standard star,then
fλ = qλ × f calλ 10−0.4(m−mcal) , (3)
where m is the observed magnitude in a given band forwhich λ is, for example, the mean wavelength of the filter.The qλ (∼ 1) factors are required since the filters havefinite widths and are not usually narrow in the infrared.It would be ideal to calculate the qλ factors from spec-trophotometric observations but in practice models areadopted (see the appendix in AAM94a for a discussionon this particular point).
For the IRFM, the absolute flux calibration for thestandard star must be done in such a way that the tem-peratures obtained in different wavelengths are close toeach other and, when properly averaged, consistent withthe direct temperatures. A calibration of this kind is thatof AAM94a and is the one we have used in our work.Even though it was derived using direct temperaturesof giant stars, this calibration provides good tempera-tures for dwarf stars as well, as it was shown in RM04b,where the comparison of IRFM angular diameters withmeasured ones for 7 main sequence stars showed goodagreement (see also §5.1 for an update).
The models we have adopted for the ψλ fluxes are Ku-rucz SEDs (Spectral Energy Distributions) as given inthe library of theoretical spectra by Lejeune et al. (1997).From them and the response functions of the J , H , Kand L filters of the TCS system (AAM94b, AAM98) wecalculated grids of qλ and Rtheo factors in the ranges3500 K< Teff < 9000 K, −3.5 < [Fe/H] < +0.5, and0.0 < log g < 5.0, where Kurucz models are available.Figure 1 illustrates the dependence of the temperatureindicator in the IRFM (the qλ ×Rtheo factors, see §4) asa function of atmospheric parameters and filter.
In the ranges of most interest to us (Teff > 3800 K forgiants, Teff > 4500 K for dwarfs), the use of more sophis-ticated models will not have a substantial effect on theIRFM given that the model dependence of the method isrelatively small. Also, unlike the UV and optical regionsof the spectrum, the density of lines in the infrared isrelatively low. The SEDs we took from Lejeune et al.(1997) are originally from Kurucz (1992). They weresynthesized with Kurucz multi-million line list and at-mosphere models with scaled solar abundances and anapproximate treatment of convective overshooting. Themodels were computed with a microturbulent velocity of2 km s−1.
The use of classical model atmospheres may not be abig issue for the IRFM. It is remarkable that the three-dimensional hydrodynamical simulations suggest thatthe effective temperature scale derived with the IRFMusing one-dimensional hydrostatic models is the same asthe one obtained with hydrodynamical models for turn-
off stars with −3 < [Fe/H] < 0, and that for stars inthe same metallicity range and approximately solar tem-perature the difference is only about 20 K (Asplund &Garcıa Perez 2001).
3. SAMPLE, PHOTOMETRY AND ATMOSPHERICPARAMETERS ADOPTED
Our sample consists of stars in the ranges of atmo-spheric parameters for which few data points were avail-able in AAM work, like the metal-poor and metal-richextremes of the regions around Teff ∼ 5800 K and be-low 5000 K. The planet-hosting star sample is a metal-rich one given the well stated metallicity-enhancement ofstars with planets (see e.g. Gonzalez et al. 2001, SIM04).Other metal-rich stars were taken from Castro et al.(1997) and Pompeia et al. (2002). The very metal-poorstars added are mainly from Ryan et al. (1991, 1996),Norris et al. (2001, mostly hot FG unevolved stars),and McWilliam et al. (1995); while the metal-poor cooldwarfs are from Yong & Lambert (2003a, 2003b).
The distribution of our sample stars in the Teff vs.[Fe/H] plane is given in Fig. 2.
The distribution of the combined sample (i.e. includingAAM stars) in Teff and [Fe/H] is shown in Fig. 3. The to-tal sample is shown with the solid histogram, the dottedhistogram is the AAM sample. Some of the peaks in thegiant [Fe/H] distribution correspond to giants in clustersincluded in AAM work while those at [Fe/H] = 0.0,−1.0,and −1.5 in the dwarf [Fe/H] distribution are the starswith kinematic metallicity assignment (see §3.2). Notehow the dwarf metal-rich extreme is now much more pop-ulated, mainly with the planet-hosting stars. The verymetal-poor end of both dwarfs and giants is also bet-ter represented, although still in small numbers. Somehot stars (Teff > 7500 K) are also included but they arealmost in the limit of applicability of the IRFM.
3.1. Photometry and reddening corrections
The infrared photometry for the AAM sample wastaken from AAM94b and AAM98. This photometry isgiven in the TCS system and has a mean accuracy of 0.02mag. For our sample, Johnson and 2MASS photometrywas adopted and transformed into the TCS system bymeans of the transformation equations of AAM94b andAAM98 (Johnson to TCS) and the following transfor-mation equations (2MASS to TCS) we derived for bothdwarfs:
JTCS =J2MASS + 0.001 − 0.049(J −K)2MASS , (4)
HTCS =H2MASS − 0.018 + 0.003(J −K)2MASS , (5)
KTCS =K2MASS − 0.014 + 0.034(J −K)2MASS , (6)
with standard deviations of σ = 0.038 (N = 104), σ =0.039 (N = 103) and σ = 0.035 (N = 107), respectively(N is the number of stars in every fit); and giants:
JTCS =J2MASS + 0.012 − 0.063(J −K)2MASS , (7)
HTCS =H2MASS − 0.013 − 0.009(J −K)2MASS , (8)
KTCS =K2MASS − 0.014 + 0.027(J −K)2MASS , (9)
with standard deviations of σ = 0.036 (N = 43), σ =0.038 (N = 40) and σ = 0.027 (N = 43), respectively.
The V magnitudes were mostly obtained from the dif-ferent catalogs included in the General Catalogue of Pho-tometric Data (Mermilliod et al. 1997, hereafter GCPD).

4 Ramırez & Melendez
Fig. 1.— Theoretical qR factors adopted as a function of effective temperature for typical atmospheric parameters of dwarf (log g = 4.5),giant (log g = 2.5), metal-rich ([Fe/H] = 0.0), and metal-poor ([Fe/H] = −2.0) stars; and filter. The units of Rtheo are A for log g = 2.5.For log g = 4.5 the lines have been shifted by −2.0 dex. A rough estimate leads to qR ∝ T 2.7
eff, almost independently of the band.
Fig. 2.— Distribution of our sample stars in the Teff vs. [Fe/H]plane, open circles: dwarf stars; filled circles: giant stars.
For the globular and open clusters we adopted the red-dening corrections given by Kraft & Ivans (2003) andAAM99a, respectively. For the field stars in AAM sam-ple, their E(B − V ) values were adopted, while for oursample stars the reddening was estimated as explainedbelow.
We estimated E(B − V ) values from the maps ofSchlegel et al. (1998) and Burstein & Heiles (1982), sev-eral extinction surveys included in Hakkila et al. (1997)code, and empirical laws by Bond (1980) and Chen et al.(1998). For stars closer than 75 pc, E(B − V ) = 0 wasadopted. The Arenou et al. (1992) extinction model in-cluded in Hakkila et al. code seems to systematicallyoverestimate the reddening of stars with d < 0.5 kpc,
TABLE 1Extinction Ratios Adopted, k = E(color)/E(B − V ) or
Aband/E(B − V ).
Color or band k (mag)
(V − KTCS) 2.74(V − KJ) 2.72
JTCS 0.84HTCS 0.56KTCS 0.36
KJ 0.38LTCS 0.15
and so we have given a lower weight to the E(B − V )values obtained from Arenou et al. map for stars closerthan 500 pc. A latitude-dependent weight was adoptedfor the reddening obtained from the Schlegel et al. andBurstein & Heiles maps, in such a way that the high lat-itude objects (|l| > 50) had a larger weight and the lowlatitude objects (|l| < 30) a weight that was close to zero.
There is evidence that the E(B − V ) values obtainedfrom the Schlegel et al. map, which is based on dust mapsby DIRBE/COBE observations, overestimates the red-dening, so we have multiplied the Schlegel et al. E(B−V )values by 0.8 (Arce & Goodman 1999; Chen et al. 1999;Beers et al. 2002; Dutra et al. 2002, 2003).
The extinction ratios k = E(color)/E(B − V ), or k =Aband/E(B − V ) given in Table 1 were obtained fromSchlegel et al. (1998), using the appropriate effectivewavelengths of the filters.
3.2. Metallicities
Our basic reference for the [Fe/H] values is the Cayrelde Strobel et al. (2001) catalog. We have updatedthe catalog with recent spectroscopic determinations,the most important of them being Mishenina & Kov-tyukh (2001), Santos et al. (2001), Heiter & Luck

The effective temperature scale of FGK stars. I. 5
Fig. 3.— Distribution of the AAM (dotted lines) and combined (AAM and this work, solid lines) giant (top panels) and dwarf (bottompanels) samples in [Fe/H] and Teff . N is the number of stars in 0.1 dex bins in [Fe/H] or 200 K bins in Teff .
(2003), Stephens & Boesgaard (2002), Takada-Hidayet al. (2002), and Yong & Lambert (2003a). From nowon, we will refer to this updated catalog as C03.
For the stars with as many or more than four entries inthe catalog, the standard deviation of the different mea-surements was adopted as the error bar for [Fe/H], whichwas assumed to be the average of the values reported inC03. For those with less than four entries a mean errorof 0.15 dex was adopted.
Based on the C03 catalog and Stromgren photometry,we were able to calculate the metallicities of ∼20% ofthe sample dwarf stars from the following photometriccalibration:For 0.19 ≤ (b− y) < 0.35, with σ = 0.17 dex:
[Fe/H]=−4.29 − 66.0m1 + 444.2m1(b − y)
−782.4m1(b− y)2 (10)
+(0.966 − 37.8m1 − 1.707c1) log η ,
where η = m1 − [0.40 − 3.0(b− y) + 5.6(b− y)2].For 0.35 ≤ (b− y) < 0.50, with σ = 0.13 dex:
[Fe/H]=−3.864 + 48.6m1 − 108.5m21
−85.2m1(b− y) + 190.6m21(b− y) (11)
+[15.7m1 − 11.1c1 + 17.7(b− y)]c1 .
For 0.50 ≤ (b− y)0 ≤ 0.80, with σ = 0.15 dex:
[Fe/H]=−2.63 + 26.0m1 − 41.3m21 − 45.4m1(b− y)
+74.0m21(b − y) + 17.0m1c1 . (12)
A mean error of 0.2 dex was adopted for these pho-tometric metallicities. These formulae follow Schuster& Nissen (1989) parameterization, but our relations arebased on a much larger number of stars (∼ 800) and
they extend to late K stars. The formulae are valid forlog g > 3.4 and −2.5 < [Fe/H] < 0.4. For F dwarfs theyextend to [Fe/H] ∼ −3.5. The major part of the disper-sion comes from the metal-poor stars, for [Fe/H] > −1.5the standard deviations reduce to 0.1 dex.
The metallicities derived by SIM04 were found consis-tent with C03 and were thus adopted for the sample ofplanet-hosting stars. Although the temperatures fromthe IRFM and those derived from a purely spectroscopicapproach differ by 100 K the metallicities are not severelyaffected if another Teff scale is adopted (J. Melendez &I. Ramırez 2005, in preparation).
The photometric metallicities derived by AAM96a andAAM99a were also adopted, when necessary, and a meanerror of 0.25 dex was assumed. Kinematic metallicitieswere assigned as a last resource. For these stars (∼ 10%of the dwarf and field giant samples) a mean error of0.5 dex in [Fe/H] was adopted. The criteria was [Fe/H] =0.0 for thin disk stars, [Fe/H] = −1.0 for thick disk stars,and [Fe/H] = −1.5 for halo stars. The temperatures forthese stars are very unreliable and should be taken onlyas rough estimates.
Most of the metallicites for the giant stars in clustershave been taken from Kraft & Ivans (2003). For theclusters not included in Kraft & Ivans work, AAM99avalues were adopted (see AAM99a for the references).
3.3. Surface gravities
As we did with the metallicities, we adopted the meanvalues from the C03 catalog when as many or more thanfour entries were available. These include both spectro-scopic and Hipparcos gravities and even though it hasbeen suggested that a systematic difference of the orderof 0.1 dex exists between them, it has almost no effect
6 Ramırez & Melendez
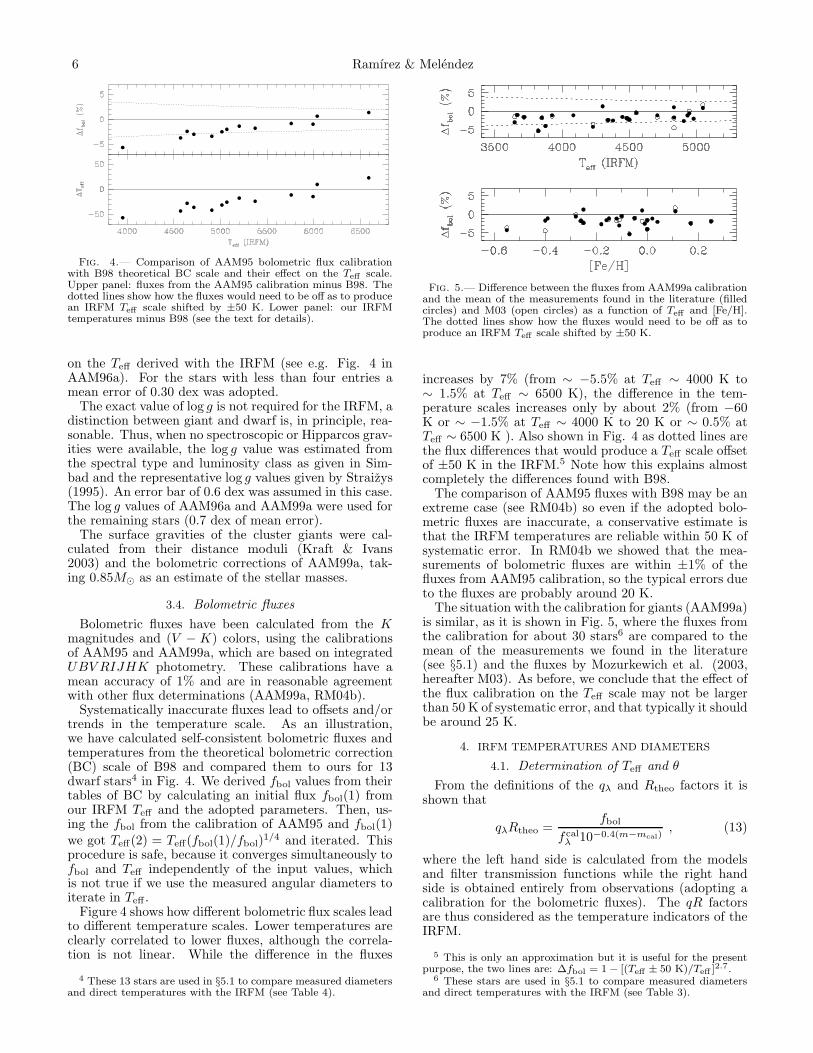
Fig. 4.— Comparison of AAM95 bolometric flux calibrationwith B98 theoretical BC scale and their effect on the Teff scale.Upper panel: fluxes from the AAM95 calibration minus B98. Thedotted lines show how the fluxes would need to be off as to producean IRFM Teff scale shifted by ±50 K. Lower panel: our IRFMtemperatures minus B98 (see the text for details).
on the Teff derived with the IRFM (see e.g. Fig. 4 inAAM96a). For the stars with less than four entries amean error of 0.30 dex was adopted.
The exact value of log g is not required for the IRFM, adistinction between giant and dwarf is, in principle, rea-sonable. Thus, when no spectroscopic or Hipparcos grav-ities were available, the log g value was estimated fromthe spectral type and luminosity class as given in Sim-bad and the representative log g values given by Straizys(1995). An error bar of 0.6 dex was assumed in this case.The log g values of AAM96a and AAM99a were used forthe remaining stars (0.7 dex of mean error).
The surface gravities of the cluster giants were cal-culated from their distance moduli (Kraft & Ivans2003) and the bolometric corrections of AAM99a, tak-ing 0.85M⊙ as an estimate of the stellar masses.
3.4. Bolometric fluxes
Bolometric fluxes have been calculated from the Kmagnitudes and (V − K) colors, using the calibrationsof AAM95 and AAM99a, which are based on integratedUBV RIJHK photometry. These calibrations have amean accuracy of 1% and are in reasonable agreementwith other flux determinations (AAM99a, RM04b).
Systematically inaccurate fluxes lead to offsets and/ortrends in the temperature scale. As an illustration,we have calculated self-consistent bolometric fluxes andtemperatures from the theoretical bolometric correction(BC) scale of B98 and compared them to ours for 13dwarf stars4 in Fig. 4. We derived fbol values from theirtables of BC by calculating an initial flux fbol(1) fromour IRFM Teff and the adopted parameters. Then, us-ing the fbol from the calibration of AAM95 and fbol(1)we got Teff(2) = Teff(fbol(1)/fbol)
1/4 and iterated. Thisprocedure is safe, because it converges simultaneously tofbol and Teff independently of the input values, whichis not true if we use the measured angular diameters toiterate in Teff .
Figure 4 shows how different bolometric flux scales leadto different temperature scales. Lower temperatures areclearly correlated to lower fluxes, although the correla-tion is not linear. While the difference in the fluxes
4 These 13 stars are used in §5.1 to compare measured diametersand direct temperatures with the IRFM (see Table 4).
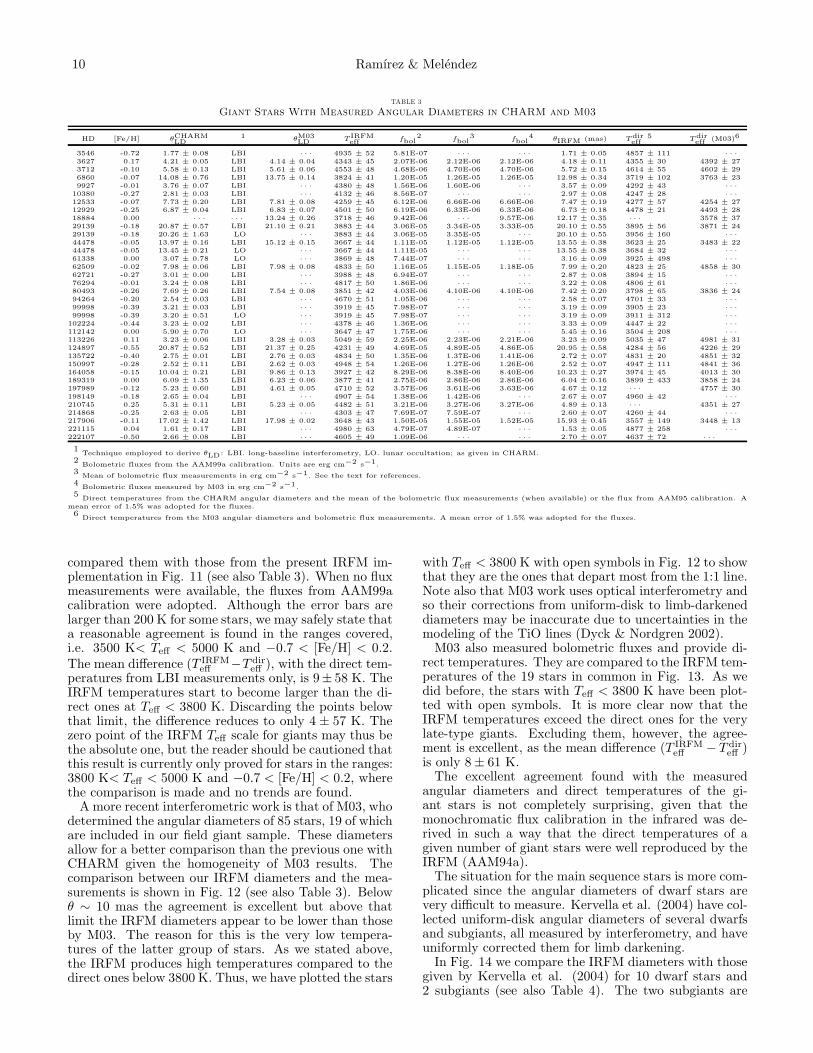
Fig. 5.— Difference between the fluxes from AAM99a calibrationand the mean of the measurements found in the literature (filledcircles) and M03 (open circles) as a function of Teff and [Fe/H].The dotted lines show how the fluxes would need to be off as toproduce an IRFM Teff scale shifted by ±50 K.
increases by 7% (from ∼ −5.5% at Teff ∼ 4000 K to∼ 1.5% at Teff ∼ 6500 K), the difference in the tem-perature scales increases only by about 2% (from −60K or ∼ −1.5% at Teff ∼ 4000 K to 20 K or ∼ 0.5% atTeff ∼ 6500 K ). Also shown in Fig. 4 as dotted lines arethe flux differences that would produce a Teff scale offsetof ±50 K in the IRFM.5 Note how this explains almostcompletely the differences found with B98.
The comparison of AAM95 fluxes with B98 may be anextreme case (see RM04b) so even if the adopted bolo-metric fluxes are inaccurate, a conservative estimate isthat the IRFM temperatures are reliable within 50 K ofsystematic error. In RM04b we showed that the mea-surements of bolometric fluxes are within ±1% of thefluxes from AAM95 calibration, so the typical errors dueto the fluxes are probably around 20 K.
The situation with the calibration for giants (AAM99a)is similar, as it is shown in Fig. 5, where the fluxes fromthe calibration for about 30 stars6 are compared to themean of the measurements we found in the literature(see §5.1) and the fluxes by Mozurkewich et al. (2003,hereafter M03). As before, we conclude that the effect ofthe flux calibration on the Teff scale may not be largerthan 50 K of systematic error, and that typically it shouldbe around 25 K.
4. IRFM TEMPERATURES AND DIAMETERS
4.1. Determination of Teff and θ
From the definitions of the qλ and Rtheo factors it isshown that
qλRtheo =fbol
f calλ 10−0.4(m−mcal)
, (13)
where the left hand side is calculated from the modelsand filter transmission functions while the right handside is obtained entirely from observations (adopting acalibration for the bolometric fluxes). The qR factorsare thus considered as the temperature indicators of theIRFM.
5 This is only an approximation but it is useful for the presentpurpose, the two lines are: ∆fbol = 1 − [(Teff ± 50 K)/Teff ]2.7.
6 These stars are used in §5.1 to compare measured diametersand direct temperatures with the IRFM (see Table 3).

The effective temperature scale of FGK stars. I. 7
Fig. 6.— ∆(qR)% is the error in the qR factors due to meanphotometric uncertainties of 0.02 mag in (V −K) and 0.03 mag in(m − K), where m = J, H, K, L (see Eq. 14). ∆(qR)%/2.7 is anestimate of the corresponding error in Teff . Solid line: [Fe/H] = 0.0,dotted line: [Fe/H] = −1.0, dashed line: [Fe/H] = −2.0. The set oflines in the bottom are for giant stars. The lines at top and thosethat diverge are for dwarfs.
In this work, the bolometric flux calibration adoptedhas the functional form fbol = 10−0.4KΦ(V −K). Then,from Eq. (13) we deduce the relative error in the ob-served qR factor:
∆(qR)
(qR)=
{
[0.921∆(m−K)]2
+
(
∆Φ
Φ
)2}1/2
. (14)
Note that ∆Φ is a function of (V − K) and its error∆(V −K). Then, adopting mean errors of ∆(V −K) =0.02 and ∆(m−K) = 0.03 we obtained the approximateuncertainties ∆(qR)% plotted in Fig. 6.
Since, roughly, qR ∝ T 2.7 independently of the band(Fig. 1), the ∆(qR)%/2.7 given in Fig. 6 is a reasonableestimate of the uncertainty in Teff introduced by photo-metric errors. Thus, in our implementation of the IRFMwe have adopted a mean error of 3% in qR as the errordue to the photometry.
The errors introduced by the atmospheric parameters[Fe/H] and log g were explicitly considered since theirupdated values are a major improvement to AAM work.
In the best cases four temperatures were derived, onefor each of the bands: J , H , K, and L. Only the firstthree of them were available in the dwarf sample. Thesensitivity of (qR)J (the qR factors in the J band) toTeff decreases for T < 5000 K for both dwarf and giants(Fig. 1) and thus no TJ (temperature derived from theJ band) below 5000 K was used to get the final Teff . Thesame reason restricted the use of TH to TH > 4200 K forthe dwarf sample. Also, not all the giant stars have Lmagnitudes measured and so not all of them have a TL.
Figure 7 shows that, for our sample stars, the temper-atures derived in the different bands are consistent. Thedispersion is larger for the dwarf sample but no trendsare observed. The same result is obtained when the up-dated temperatures for the AAM stars are included.
The adopted IRFM effective temperature and its error
was obtained from:
Teff =
∑
i[Ti(∆Ti)−1]
∑
i(∆Ti)−1, ∆Teff =
N∑
i(∆Ti)−1,
(15)where i = J,H,K,L; and N is the number of tempera-tures available.
The angular diameters were calculated from Eq. (1)using the adopted bolometric fluxes (from AAM95 orAAM99a calibrations) and the IRFM temperatures.Their errors were estimated by propagating a mean errorof 1.5 % in the bolometric fluxes and the errors in Teff .
Table 2 contains our sample stars, their adopted at-mospheric parameters log g, [Fe/H], fluxes from AAM95or AAM99a calibrations, reddening corrections, (V −K)colors in the TCS system (transformed from either John-son or 2MASS photometry), IRFM temperatures andtheir errors, and angular diameters and their errors. Thetable has been ordered alpha-numerically by the starstandard names: HD numbers have been preferred, thenBD and then G numbers. Stars with other nomencla-tures have also been ordered alpha-numerically. A moredetailed version of this table as well as tables for thecombined sample, including the updated Teff and atmo-spheric parameters of the AAM stars, are available uponrequest.
4.2. The Alonso et al. stars
By comparing the effective temperatures we derived forthe AAM sample with the AAM96a and AAM99a tem-peratures (Fig. 8) we find good agreement (within errorbars) and thus show that the present Teff scale is consis-tent with that by AAM within the ranges in common. Acloser inspection of Fig. 8 reveals very small systematicdifferences of about 40 K (0.7% at solar temperature) fordwarf stars and 25 K (0.6% at 4500 K) for giants, whichare, however, well within the uncertainties of our results(1.3%). The scatter is due to the random nature of thedifferences between our input data and that adopted byAAM, and the extreme cases can be easily identified bycomparing the two sets of input data. Less than 9 %(20 %) of the giant (dwarf) stars in Fig. 8 exhibit differ-ences larger than our mean uncertainty of 60 K (75 K).If we take into account the uncertainties in AAM tem-peratures these numbers are even smaller.
4.3. The need for improvement and extension
One important improvement to the IRFM Teff scaleis the use of more accurate input parameters. Eventhough individually the temperature differences betweenthe temperatures we obtained and those by AAM are rel-atively small, overall they greately help to reduce the dis-persion in the Teff : color : [Fe/H] relations (Part II), thusallowing to separate real effects from random errors. Therevised IRFM temperature scale may then have a betterinternal accuracy, which is a very useful improvement,particularly in the light of the need to reduce (or evenbetter, recognize) the sources of uncertainty in chemi-cal abundance studies. With the internal uncertaintyreduced, the systematics can be better quantified.
Also important is the effort to include stars represen-tative of regions of particular interest in the atmosphericparameters space, like the metal-rich (e.g. for planetary-host star studies) and metal-poor (e.g. for globular clus-ter and halo star studies) extremes. As an example of

8 Ramırez & Melendez
Fig. 7.— Left panel: temperatures obtained from the J and L bands (TJ , TL) compared to those obtained from the K band (TK); opensymbols: dwarfs, filled symbols: giants. Right panel: as in the left panel for TH vs. TK .
TABLE 2Input Data Adopted, Effective Temperatures and Angular Diameters Derived in This Work.
ID log g [Fe/H] fbol E(B − V ) (V − K) Teff (K) σ(Teff ) θ (mas) σ(θ)
BD -09 1261 4.00 -0.93 2.034E-09 0.000 2.923 3967 148 0.157 0.012BD -10 3166 4.41 0.45 2.764E-09 0.010 1.953 5228 67 0.105 0.003BD -13 3442 3.92 -2.95 2.381E-09 0.000 1.226 6442 80 0.064 0.002BPS CS 16085-0050 1.00 -3.10 4.759E-10 0.010 2.225 4876 55 0.050 0.001BPS CS 22166-0030 4.00 -3.36 1.239E-10 0.033 1.461 6209 78 0.016 0.000· · · · · · · · · · · · · · · · · · · · · · · · · · · · · ·
the importance of these selected regions we show in Fig.9 the Teff vs. (V − K) relation defined by our samplestars as well as AAM96b relations for [Fe/H] = 0 and[Fe/H] = −3 (photometry sources and reddening correc-tions employed are discussed in detail in Part II). TheAAM96b relation for metal-poor cool dwarfs seems tobe in agreement with ours (even if the AAM96b relationis slightly extrapolated) but the corresponding AAM96brelation for hot metal-poor stars differs from ours. The‘redder’ points near 6500 K on the dwarf Teff vs. (V −K)plane are all very metal-poor stars ([Fe/H] ∼ −3). Thisis the place where our results show the most significantdeviations with respect to AAM temperatures. In Part IIwe show that the synthetic Teff scales based on bothMARCS and Kurucz models for metal-poor stars are con-sistent with our temperatures but not with AAM96b inthis region. The inclusion of these stars allows to betterdefine the trends of the IRFM temperature scale in thatregion, which has proven to be of fundamental impor-tance, for example, in the controversy of the primordiallithium abundance (Melendez & Ramırez 2004).
5. THE IRFM COMPARED WITH OTHER METHODS
Since we have shown that our stars effective tempera-tures are essentially consistent with the AAM Teff scale,in the comparisons below, the stars with IRFM tem-peratures are those for the whole sample (including theAAM stars), for which we have homogeneously calcu-lated IRFM temperatures.
5.1. Angular diameter measurements
The IRFM was explicitly developed to solve for bothTeff and θ simultaneously from the observed and theo-retical data. One of the fundamental tests of validity ofthe IRFM is thus the comparison with measured angulardiameters.
Richichi & Percheron (2002, hereafter CHARM) havecollected most of the published stellar angular diametersto date, measured mainly with lunar occultation (LO)and long-baseline interferometry (LBI) techniques. Alarge number of giant stars constitute the major partof the catalog and only a small fraction of main sequencestars is included.
We have compared the angular diameters that re-sult from our IRFM implementation with those givenin CHARM in Fig. 10 (see also Table 3). The starsin CHARM have been grouped according to the tech-nique employed to derive their angular diameters. First,a comparison is made with the indirect (IND) diametersof Cohen et al. (1999), then with LBI, and finally withLO diameters.
The IND diameters are in excellent agreement with theIRFM for θ < 8 mas, where stars in common are found.These are diameters derived from absolutely calibratedstellar spectra in the infrared, which is the main reasonfor the good agreement. These are not direct measure-ments and will not be used to derive direct temperaturesin the comparisons below.

The effective temperature scale of FGK stars. I. 9
Fig. 8.— Difference between the temperatures derived in this work (TW) and those given by AAM96a and AAM99a as a function ofour Teff values and adopted [Fe/H] for both dwarf (open circles) and giant (filled circles) stars. The dotted lines are the mean errors in ourTeff values (75 K for dwarf and 60 K for giant stars.).
Fig. 9.— Teff vs. (V − K) relation for dwarfs as given by oursample stars (filled circles: [Fe/H] < −1.5; open circles: [Fe/H] >−1.5) and according to AAM96b temperature scale for [Fe/H] = 0(solid line) and [Fe/H] = −3 (dotted line).
The LBI technique uses the interference of the wave-fronts from the starlight entering the telescope to resolvesmaller angular sizes. For the stars with large diameters,more than one LBI entry is often found in CHARM. Themean value of those entries and its standard deviationfor each star were adopted for the comparison (hence thelarge error bars of some points in Fig. 10), otherwise thesingle value and its internal error were used. Comparisonwith the IRFM for 29 stars shows agreement within 1.5mas for θ > 10 mas and better than 0.5 mas below thatvalue.
Less measurements with LO are available due to thelimited sky coverage of the Moon (∼ 10%) and other ob-servational difficulties. Nevertheless, the LO diametersare reliable and have been shown to be well scaled to theLBI ones. When compared to the IRFM, a very goodagreement is also found. The differences with the fiveLO measurements (average in some cases) are less than0.5 mas in the range 3 < θ < 20 mas.
From the CHARM angular diameters and the bolomet-ric flux measurements of Blackwell et al. (1979, 1990),Blackwell & Lynas-Gray (1994, 1998), Leggett et al.(1986), and M03; we obtained the direct temperaturesof the stars in common with our field giant sample and
10 Ramırez & Melendez
TABLE 3
Giant Stars With Measured Angular Diameters in CHARM and M03
HD [Fe/H] θCHARMLD
1 θM03LD T IRFM
eff fbol2 fbol
3 fbol4 θIRFM (mas) Tdir
eff5 Tdir
eff (M03)6
3546 -0.72 1.77 ± 0.08 LBI · · · 4935 ± 52 5.81E-07 · · · · · · 1.71 ± 0.05 4857 ± 111 · · ·
3627 0.17 4.21 ± 0.05 LBI 4.14 ± 0.04 4343 ± 45 2.07E-06 2.12E-06 2.12E-06 4.18 ± 0.11 4355 ± 30 4392 ± 273712 -0.10 5.58 ± 0.13 LBI 5.61 ± 0.06 4553 ± 48 4.68E-06 4.70E-06 4.70E-06 5.72 ± 0.15 4614 ± 55 4602 ± 296860 -0.07 14.08 ± 0.76 LBI 13.75 ± 0.14 3824 ± 41 1.20E-05 1.26E-05 1.26E-05 12.98 ± 0.34 3719 ± 102 3763 ± 239927 -0.01 3.76 ± 0.07 LBI · · · 4380 ± 48 1.56E-06 1.60E-06 · · · 3.57 ± 0.09 4292 ± 43 · · ·
10380 -0.27 2.81 ± 0.03 LBI · · · 4132 ± 46 8.56E-07 · · · · · · 2.97 ± 0.08 4247 ± 28 · · ·
12533 -0.07 7.73 ± 0.20 LBI 7.81 ± 0.08 4259 ± 45 6.12E-06 6.66E-06 6.66E-06 7.47 ± 0.19 4277 ± 57 4254 ± 2712929 -0.25 6.87 ± 0.04 LBI 6.83 ± 0.07 4501 ± 50 6.19E-06 6.33E-06 6.33E-06 6.73 ± 0.18 4478 ± 21 4493 ± 2818884 0.00 · · · · · · 13.24 ± 0.26 3718 ± 46 9.42E-06 · · · 9.57E-06 12.17 ± 0.35 · · · 3578 ± 3729139 -0.18 20.87 ± 0.57 LBI 21.10 ± 0.21 3883 ± 44 3.06E-05 3.34E-05 3.33E-05 20.10 ± 0.55 3895 ± 56 3871 ± 2429139 -0.18 20.26 ± 1.63 LO · · · 3883 ± 44 3.06E-05 3.35E-05 · · · 20.10 ± 0.55 3956 ± 160 · · ·
44478 -0.05 13.97 ± 0.16 LBI 15.12 ± 0.15 3667 ± 44 1.11E-05 1.12E-05 1.12E-05 13.55 ± 0.38 3623 ± 25 3483 ± 2244478 -0.05 13.45 ± 0.21 LO · · · 3667 ± 44 1.11E-05 · · · · · · 13.55 ± 0.38 3684 ± 32 · · ·
61338 0.00 3.07 ± 0.78 LO · · · 3869 ± 48 7.44E-07 · · · · · · 3.16 ± 0.09 3925 ± 498 · · ·
62509 -0.02 7.98 ± 0.06 LBI 7.98 ± 0.08 4833 ± 50 1.16E-05 1.15E-05 1.18E-05 7.99 ± 0.20 4823 ± 25 4858 ± 3062721 -0.27 3.01 ± 0.00 LBI · · · 3988 ± 48 6.94E-07 · · · · · · 2.87 ± 0.08 3894 ± 15 · · ·
76294 -0.01 3.24 ± 0.08 LBI · · · 4817 ± 50 1.86E-06 · · · · · · 3.22 ± 0.08 4806 ± 61 · · ·
80493 -0.26 7.69 ± 0.26 LBI 7.54 ± 0.08 3851 ± 42 4.03E-06 4.10E-06 4.10E-06 7.42 ± 0.20 3798 ± 65 3836 ± 2494264 -0.20 2.54 ± 0.03 LBI · · · 4670 ± 51 1.05E-06 · · · · · · 2.58 ± 0.07 4701 ± 33 · · ·
99998 -0.39 3.21 ± 0.03 LBI · · · 3919 ± 45 7.98E-07 · · · · · · 3.19 ± 0.09 3905 ± 23 · · ·
99998 -0.39 3.20 ± 0.51 LO · · · 3919 ± 45 7.98E-07 · · · · · · 3.19 ± 0.09 3911 ± 312 · · ·
102224 -0.44 3.23 ± 0.02 LBI · · · 4378 ± 46 1.36E-06 · · · · · · 3.33 ± 0.09 4447 ± 22 · · ·
112142 0.00 5.90 ± 0.70 LO · · · 3647 ± 47 1.75E-06 · · · · · · 5.45 ± 0.16 3504 ± 208 · · ·
113226 0.11 3.23 ± 0.06 LBI 3.28 ± 0.03 5049 ± 59 2.25E-06 2.23E-06 2.21E-06 3.23 ± 0.09 5035 ± 47 4981 ± 31124897 -0.55 20.87 ± 0.52 LBI 21.37 ± 0.25 4231 ± 49 4.69E-05 4.89E-05 4.86E-05 20.95 ± 0.58 4284 ± 56 4226 ± 29135722 -0.40 2.75 ± 0.01 LBI 2.76 ± 0.03 4834 ± 50 1.35E-06 1.37E-06 1.41E-06 2.72 ± 0.07 4831 ± 20 4851 ± 32150997 -0.28 2.52 ± 0.11 LBI 2.62 ± 0.03 4948 ± 54 1.26E-06 1.27E-06 1.26E-06 2.52 ± 0.07 4947 ± 111 4841 ± 36164058 -0.15 10.04 ± 0.21 LBI 9.86 ± 0.13 3927 ± 42 8.29E-06 8.38E-06 8.40E-06 10.23 ± 0.27 3974 ± 45 4013 ± 30189319 0.00 6.09 ± 1.35 LBI 6.23 ± 0.06 3877 ± 41 2.75E-06 2.86E-06 2.86E-06 6.04 ± 0.16 3899 ± 433 3858 ± 24197989 -0.12 5.23 ± 0.60 LBI 4.61 ± 0.05 4710 ± 52 3.57E-06 3.61E-06 3.63E-06 4.67 ± 0.12 · · · 4757 ± 30198149 -0.18 2.65 ± 0.04 LBI · · · 4907 ± 54 1.38E-06 1.42E-06 · · · 2.67 ± 0.07 4960 ± 42 · · ·
210745 0.25 5.31 ± 0.11 LBI 5.23 ± 0.05 4482 ± 51 3.21E-06 3.27E-06 3.27E-06 4.89 ± 0.13 · · · 4351 ± 27214868 -0.25 2.63 ± 0.05 LBI · · · 4303 ± 47 7.69E-07 7.59E-07 · · · 2.60 ± 0.07 4260 ± 44 · · ·
217906 -0.11 17.02 ± 1.42 LBI 17.98 ± 0.02 3648 ± 43 1.50E-05 1.55E-05 1.52E-05 15.93 ± 0.45 3557 ± 149 3448 ± 13221115 0.04 1.61 ± 0.17 LBI · · · 4980 ± 63 4.79E-07 4.89E-07 · · · 1.53 ± 0.05 4877 ± 258 · · ·
222107 -0.50 2.66 ± 0.08 LBI · · · 4605 ± 49 1.09E-06 · · · · · · 2.70 ± 0.07 4637 ± 72 · · ·
1Technique employed to derive θLD: LBI. long-baseline interferometry, LO. lunar occultation; as given in CHARM.
2Bolometric fluxes from the AAM99a calibration. Units are erg cm−2 s−1.
3Mean of bolometric flux measurements in erg cm−2 s−1. See the text for references.
4Bolometric fluxes measured by M03 in erg cm−2 s−1.
5Direct temperatures from the CHARM angular diameters and the mean of the bolometric flux measurements (when available) or the flux from AAM95 calibration. A
mean error of 1.5% was adopted for the fluxes.6
Direct temperatures from the M03 angular diameters and bolometric flux measurements. A mean error of 1.5% was adopted for the fluxes.
compared them with those from the present IRFM im-plementation in Fig. 11 (see also Table 3). When no fluxmeasurements were available, the fluxes from AAM99acalibration were adopted. Although the error bars arelarger than 200 K for some stars, we may safely state thata reasonable agreement is found in the ranges covered,i.e. 3500 K< Teff < 5000 K and −0.7 < [Fe/H] < 0.2.The mean difference (T IRFM
eff −T direff ), with the direct tem-
peratures from LBI measurements only, is 9± 58 K. TheIRFM temperatures start to become larger than the di-rect ones at Teff < 3800 K. Discarding the points belowthat limit, the difference reduces to only 4 ± 57 K. Thezero point of the IRFM Teff scale for giants may thus bethe absolute one, but the reader should be cautioned thatthis result is currently only proved for stars in the ranges:3800 K< Teff < 5000 K and −0.7 < [Fe/H] < 0.2, wherethe comparison is made and no trends are found.
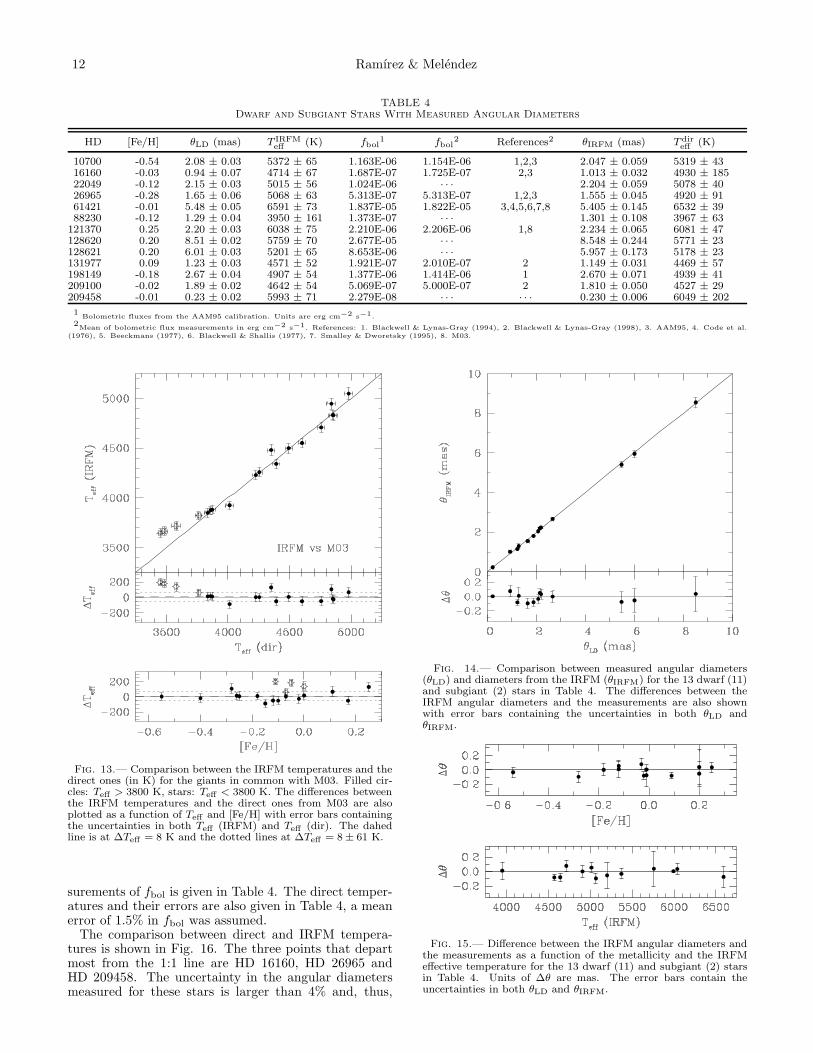
A more recent interferometric work is that of M03, whodetermined the angular diameters of 85 stars, 19 of whichare included in our field giant sample. These diametersallow for a better comparison than the previous one withCHARM given the homogeneity of M03 results. Thecomparison between our IRFM diameters and the mea-surements is shown in Fig. 12 (see also Table 3). Belowθ ∼ 10 mas the agreement is excellent but above thatlimit the IRFM diameters appear to be lower than thoseby M03. The reason for this is the very low tempera-tures of the latter group of stars. As we stated above,the IRFM produces high temperatures compared to thedirect ones below 3800 K. Thus, we have plotted the stars
with Teff < 3800 K with open symbols in Fig. 12 to showthat they are the ones that depart most from the 1:1 line.Note also that M03 work uses optical interferometry andso their corrections from uniform-disk to limb-darkeneddiameters may be inaccurate due to uncertainties in themodeling of the TiO lines (Dyck & Nordgren 2002).
M03 also measured bolometric fluxes and provide di-rect temperatures. They are compared to the IRFM tem-peratures of the 19 stars in common in Fig. 13. As wedid before, the stars with Teff < 3800 K have been plot-ted with open symbols. It is more clear now that theIRFM temperatures exceed the direct ones for the verylate-type giants. Excluding them, however, the agree-ment is excellent, as the mean difference (T IRFM
eff − T direff )
is only 8 ± 61 K.The excellent agreement found with the measured
angular diameters and direct temperatures of the gi-ant stars is not completely surprising, given that themonochromatic flux calibration in the infrared was de-rived in such a way that the direct temperatures of agiven number of giant stars were well reproduced by theIRFM (AAM94a).
The situation for the main sequence stars is more com-plicated since the angular diameters of dwarf stars arevery difficult to measure. Kervella et al. (2004) have col-lected uniform-disk angular diameters of several dwarfsand subgiants, all measured by interferometry, and haveuniformly corrected them for limb darkening.
In Fig. 14 we compare the IRFM diameters with thosegiven by Kervella et al. (2004) for 10 dwarf stars and2 subgiants (see also Table 4). The two subgiants are

The effective temperature scale of FGK stars. I. 11
Fig. 10.— Comparison between the angular diameters fromCHARM (θLD) and the diameters from the IRFM (θIRFM) forgiant stars. Open circles: indirect (IND) diameters from Cohenet al. (1999) for 55 stars; filled circles: diameters from long base-line interferometry (LBI) for 29 stars; stars: lunar occultation (LO)measurements for 5 stars. Error bars are individual uncertaintiesor standard deviations, the latter when more than one measure-ment was available. The differences between the IRFM angulardiameters and the IND diameters, LBI, and LO measurements arealso shown with error bars containing the uncertainties in both θLD
and θIRFM.
HD 121370 and HD 198149. The original sources for themeasured angular diameters include Lane et al. (2001),Kervella et al. (2003), Nordgren et al. (1999, 2001),and M03; as well as some other papers in preparation(see Kervella et al. 2004). For Procyon (HD 61421) andHD 121370 more than one value is given by Kervella et al.(2004); only the more accurate VLTI measurement wasconsidered. Also shown in Fig. 14 and Table 4 is thecomparison of the IRFM results with the transit obser-vations of Brown et al. (2001) for the planet-hosting starHD 209458.
The comparison shows that the IRFM diameters arein excellent agreement with the measurements, to bet-ter than 0.2 mas in θ. Also, this result seems to bevalid for the wide temperature range from 4000 K to6500 K, although it is restricted to almost solar metal-licity (Fig. 15). The stars in Table 4 span the metallicityrange from −0.54 to 0.25 dex.
Table 4 also contains the bolometric fluxes fromAAM95 calibration and those measured by several au-thors. When a measured fbol was available, the directtemperature was derived from it and the measured an-gular diameter using Eq. (1), otherwise the flux fromAAM95 calibration was adopted. The mean of the mea-
Fig. 11.— Comparison between the IRFM temperatures andthe direct ones (in K) for the giants in common with CHARM.Filled circles: LBI measurements, stars: LO measurements. Thedifferences between the IRFM temperatures and the direct onesfrom CHARM are also plotted as a function of Teff and [Fe/H]with error bars containing the uncertainties in both Teff (IRFM)and Teff (dir). The dashed line is at ∆Teff = 4 K and the dottedlines at ∆Teff = 4 ± 57 K.
Fig. 12.— Comparison between the angular diameters from M03(θLD) and the diameters from the IRFM (θIRFM) for 19 giant stars.Filled circles: Teff > 3800 K, stars: Teff < 3800 K. The differencesbetween the IRFM angular diameters and those by M03 are alsoshown with error bars containing the uncertainties in both θLD andθIRFM.
12 Ramırez & Melendez
TABLE 4Dwarf and Subgiant Stars With Measured Angular Diameters
HD [Fe/H] θLD (mas) T IRFM
eff(K) fbol
1 fbol2 References2 θIRFM (mas) Tdir
eff(K)
10700 -0.54 2.08 ± 0.03 5372 ± 65 1.163E-06 1.154E-06 1,2,3 2.047 ± 0.059 5319 ± 4316160 -0.03 0.94 ± 0.07 4714 ± 67 1.687E-07 1.725E-07 2,3 1.013 ± 0.032 4930 ± 18522049 -0.12 2.15 ± 0.03 5015 ± 56 1.024E-06 · · · 2.204 ± 0.059 5078 ± 4026965 -0.28 1.65 ± 0.06 5068 ± 63 5.313E-07 5.313E-07 1,2,3 1.555 ± 0.045 4920 ± 9161421 -0.01 5.48 ± 0.05 6591 ± 73 1.837E-05 1.822E-05 3,4,5,6,7,8 5.405 ± 0.145 6532 ± 3988230 -0.12 1.29 ± 0.04 3950 ± 161 1.373E-07 · · · 1.301 ± 0.108 3967 ± 63
121370 0.25 2.20 ± 0.03 6038 ± 75 2.210E-06 2.206E-06 1,8 2.234 ± 0.065 6081 ± 47128620 0.20 8.51 ± 0.02 5759 ± 70 2.677E-05 · · · 8.548 ± 0.244 5771 ± 23128621 0.20 6.01 ± 0.03 5201 ± 65 8.653E-06 · · · 5.957 ± 0.173 5178 ± 23131977 0.09 1.23 ± 0.03 4571 ± 52 1.921E-07 2.010E-07 2 1.149 ± 0.031 4469 ± 57198149 -0.18 2.67 ± 0.04 4907 ± 54 1.377E-06 1.414E-06 1 2.670 ± 0.071 4939 ± 41209100 -0.02 1.89 ± 0.02 4642 ± 54 5.069E-07 5.000E-07 2 1.810 ± 0.050 4527 ± 29209458 -0.01 0.23 ± 0.02 5993 ± 71 2.279E-08 · · · · · · 0.230 ± 0.006 6049 ± 202
1Bolometric fluxes from the AAM95 calibration. Units are erg cm−2 s−1.
2Mean of bolometric flux measurements in erg cm−2 s−1. References: 1. Blackwell & Lynas-Gray (1994), 2. Blackwell & Lynas-Gray (1998), 3. AAM95, 4. Code et al.
(1976), 5. Beeckmans (1977), 6. Blackwell & Shallis (1977), 7. Smalley & Dworetsky (1995), 8. M03.
Fig. 13.— Comparison between the IRFM temperatures and thedirect ones (in K) for the giants in common with M03. Filled cir-cles: Teff > 3800 K, stars: Teff < 3800 K. The differences betweenthe IRFM temperatures and the direct ones from M03 are alsoplotted as a function of Teff and [Fe/H] with error bars containingthe uncertainties in both Teff (IRFM) and Teff (dir). The dahedline is at ∆Teff = 8 K and the dotted lines at ∆Teff = 8 ± 61 K.
surements of fbol is given in Table 4. The direct temper-atures and their errors are also given in Table 4, a meanerror of 1.5% in fbol was assumed.
The comparison between direct and IRFM tempera-tures is shown in Fig. 16. The three points that departmost from the 1:1 line are HD 16160, HD 26965 andHD 209458. The uncertainty in the angular diametersmeasured for these stars is larger than 4% and, thus,
Fig. 14.— Comparison between measured angular diameters(θLD) and diameters from the IRFM (θIRFM) for the 13 dwarf (11)and subgiant (2) stars in Table 4. The differences between theIRFM angular diameters and the measurements are also shownwith error bars containing the uncertainties in both θLD andθIRFM.
Fig. 15.— Difference between the IRFM angular diameters andthe measurements as a function of the metallicity and the IRFMeffective temperature for the 13 dwarf (11) and subgiant (2) starsin Table 4. Units of ∆θ are mas. The error bars contain theuncertainties in both θLD and θIRFM.

The effective temperature scale of FGK stars. I. 13
Fig. 16.— Comparison between the IRFM temperatures and thedirect ones (in K) for the 13 dwarf (11) and subgiant (2) stars inTable 4. The three open symbols are HD 16160, HD 26965, andHD 209458; they are not plotted in the residuals. The differencesbetween the IRFM temperatures and the direct ones as a functionof Teff and [Fe/H] are also shown with error bars containing theuncertainties in both Teff (IRFM) and Teff (dir). The dahed lineis at ∆Teff = 18 K and the dotted lines at ∆Teff = 18 ± 62 K.
they are not useful to constraint any Teff scale within200 K. Excluding these three points, the mean differenceT IRFM
eff −T direff is 18±62 K. Consequently, the zero point of
the IRFM Teff scale for dwarfs is also in good agreementwith the direct Teff scale, given that the 18±62 K differ-ence is well within the average uncertainty of the IRFMtemperatures (∼ 75 K), at least for stars with temper-atures between 4000 K and 6500 K and metallicities inthe range −0.55 < [Fe/H] < 0.25.
5.2. The Sun, Procyon, and Arcturus
The temperatures of these three stars are very welldocumented, although no general agreement concerningtheir exact values (the Sun being the exception) has beenachieved, and should be used to test any Teff scale.
Using the photometry given by AAM94a, the presentIRFM temperature of the Sun results in 5756 ± 71 Kwhich is 21 K lower than the standard value. AAM96aobtained 5763 ± 90 K and thus the difference with oursolar Teff may only be attributed to the details of thecalculations. The fact that the IRFM does not exactlyreproduce the solar temperature has been suggested toimply that the zero point of the IRFM Teff scale is offby some amount. This is by no means conclusive, as thephotometry of the Sun is very uncertain and the errors inthe observed magnitudes and colors are easily propagatedto the temperature derived with this method.
Procyon (HD 61421), whose spectral type, as given
in SIMBAD, is F5IV-V, has an IRFM temperature of6591± 73 K. AAM96a obtained 6579± 100 K, the differ-ence is mainly due to a slightly different set of [Fe/H]and log g values adopted. Its direct temperature is6532± 39 K, as given in Table 4. These different resultsmay be consistent, considering the size of the error bars.Being a bright star, the photometry has a considerableuncertainty and may be the reason for the discrepancy,if any. Using the spectroscopic method, Takeda et al.(2002b, hereafter T02b) obtained 6576 K; Edvardssonet al. (1993, hereafter E93), on the other hand, ob-tained 6704 K from a theoretical calibration of the (b−y)color. A fit to spectrophotometric data by Castelli et al.(1997) resulted in Teff = 6650 K. Fitting of the Balmerline-profiles in the spectrum of Procyon leads to 6667 K,6470 K, and 6507 K according to Castelli et al. (1997),F98 and AP04, respectively.
For the giant star Arcturus (HD 124897), the presentIRFM implementation gives 4231 ± 49 K. That ofAAM99a was 4233 ± 55 K. Its direct temperature, asgiven by Griffin & Lynas-Gray (1999) is 4290 ± 28 K;the value we derived for this star in Table 3 from severalangular diameter and bolometric flux measurements is4284± 56 K, in perfect agreement with Griffin & Lynas-Gray result. M03 also derived a direct temperature forArcturus, which is slightly lower (4226 K), but in betteragreement with the IRFM.
Although the IRFM temperature of Arcturus is lowerby about 60 K, the temperature derived from severaltemperature-color calibrations based on the IRFM iscloser to the direct one (4296 K, RM04a). Thus, theuse of several of these calibrations allows to get rid oferrors in single IRFM temperatures, which are mainlybased on infrared magnitudes alone. We will come backto this point in Part II of this work.
5.3. Other semi-direct methods
In §1 we discussed some of the other methods devel-oped to derive Teff . As it is the case with the IRFM,they all introduce models to complement the availableobservations and so the differences that we will describebelow are partly due to the different models adopted, al-though the observational input parameters may also bethe reason of the discrepancies, if any.
The comparison with the spectroscopic temperaturesderived by three different groups is given in Fig. 17.In this and the next two figures the filled circles aredwarf stars, the open circles are field giants and the opensquares are giants in clusters.
T02b applied spectroscopic equilibrium to obtain thetemperatures of 32 F-K dwarfs and subgiants, 23 of whichare included in our dwarf sample. The comparison showsthat the IRFM temperatures are higher by about 35 Kbut the dispersion is large (∼ 100 K), mainly due to ametallicity effect. Below solar metallicity, T02b temper-atures are systematically lower; excluding the stars with[Fe/H] < 0, the mean difference reduces to 10 K, butthen a clear trend with temperature is observed.
Comparison with B03 spectroscopic temperatures of asample of thin and thick disk stars suggests a mean dif-ference of −110±90 K, in which the dispersion is, again,mainly due to a trend of the differences with metal-licity. It seems that the differences reduce to zero at[Fe/H] ∼ 0.25 and the B03 temperatures become sys-

14 Ramırez & Melendez
Fig. 17.— Comparison of the IRFM temperatures with thosederived by other authors. The figures show the IRFM temperaturesminus those given by T02b, B03, and LT as a function of the IRFMTeff and our adopted values of [Fe/H]. Filled circles: dwarfs; opencircles: field giants; open squares: giants in clusters.
tematically higher by 110 K as lower metallicities arereached. A similar difference was found in RM04b be-tween the IRFM temperatures and the spectroscopicones of SIM04 for the planet-hosting stars but that onedid not show any trend with metallicity, and only a slighttrend with temperature, probably due to non-LTE effectsand/or the bolometric fluxes adopted for the IRFM.
In Fig. 17 is also shown a comparison of the IRFMtemperatures of 21 metal-poor field giants (−2.74 <[Fe/H] < −0.55) and 14 giants in the globular clustersM3 ([Fe/H] ∼ −1.5), M71 ([Fe/H] ∼ −0.8) and M92([Fe/H] ∼ −2.4) with those derived spectroscopically bySneden et al. (1991), Kraft et al. (1992), and Shetrone(1996), which we refer jointly as LT (Lick-Texas group).The differences have a mean value of −65 ± 50 K, theyshow no large trends with Teff nor [Fe/H], and it is alsoindependent of the population, i.e. it is basically thesame for the giants in the field and in the three clusters.Thus, besides an offset of 65 K, the spectroscopic Teff
scale of the metal-poor (−2.5 < [Fe/H] < −0.5) giants isdifferentially consistent with the IRFM.
Using spectra synthesized from MARCS models, thefilter transmission functions of the uvby-β system, and aset of stars to fix the zero point; E93 calculated a gridof synthetic colors from which the temperatures of theirsample stars were determined. We found 50 stars (1 gi-ant) in common with our sample. The comparison withthe IRFM is shown in Fig. 18 where a mean differenceof −75 ± 85 K is observed. No trend is apparent withmetallicity, and probably a slight trend with temperature
Fig. 18.— As in Fig. 17 for E93, F98, and AP04.
is present, in the sense that the IRFM temperatures andthose by E93 may be in agreement for Teff > 6500 K butwith a decreasing difference for lower temperatures.
Two sets of temperatures based on the fitting of theBalmer line-profiles are shown in Fig. 18. Note how eventhough F98 and AP04 temperatures were derived usingthe same principle, the theoretical prescriptions adoptedhave an important effect on the final results. F98 tem-peratures are higher by about 100 K below 5800 K butslightly lower than the IRFM ones above 6000 K. There isapparent agreement at solar metallicity but disagreementboth above and below [Fe/H] ∼ 0. The solar tempera-ture is thus well reproduced by both the IRFM and F98.On the other hand, AP04 temperatures show very goodagreement with ours in the wide temperature range from4800 K to 6600 K and it is likely that they are close tothe IRFM ones even at low metallicites ([Fe/H] ∼ −0.8).
Note that the zero point of the E93 theoretical calibra-tion was set using a sample of stars with temperaturesderived from Balmer line-profile fitting (Cayrel de Stro-bel 1990) and so the similarity between the differencesfound with E93 and F98 may be due to the same basictechnique employed. We recall, however, that this tech-nique is very model dependent, as shown by the mostrecent and improved results of AP04, and that it is verylikely that the results from the IRFM are in good agree-ment with those from the modeling of hydrogen lines.
A method that was not discussed in §1 is the onethat uses surface brightness vs. color relations based onmeasurements of stellar angular diameters (di Benedetto1998, hereafter dB98). Since the IRFM is also based onmeasured angular diameters, the zero points of both the

The effective temperature scale of FGK stars. I. 15
Fig. 19.— As in Fig. 17 for dB98 and K03.
IRFM and the dB98 Teff scales should be the same. Thisis actually shown in Fig. 19, where the temperaturesof 25 stars (12 giants) in common with our sample arecompared to those given by dB98. The mean differenceis −1 ± 53 K, as expected, and the dispersion is fullyconsistent with the mean errors of the IRFM and dB98temperatures. The good agreement of the zero point isalso true if dwarfs and giants are considered separately.Note, however, that the comparison with dB98 results islimited to [Fe/H] > −0.6, although the only point be-low −0.6 dex, a giant star with [Fe/H] = −1.64, shows adB98 temperature consistent with the IRFM.
Finally, the line-depth ratio technique has been appliedto 181 dwarfs by K03, 44 of them are included in our sam-ple. It is claimed that very small errors, of the order of10 K or less, may be achieved with this technique if sev-eral calibrated ratios are used. The comparison with ourIRFM temperatures, however, shows a dispersion that islarger than the one expected by the combination of theerrors in the IRFM temperatures (∼ 75 K) with thosesuggested by K03, which will be essentially equal to theuncertainty from the IRFM. It is true that very small in-dividual uncertainties (that is, for a single star) may beachieved with the line-depth ratio technique, but somesystematic effects may enlarge the dispersion in the Teff
scale derived with this technique, which is, however, po-tentially useful for studying intrinsic temperature fluc-tuations. K03 adjusted their Teff scale to reproducethe solar temperature, hence the good agreement withthe IRFM around 5800 K and solar metallicity. From5500 K to 6200 K, however, K03 temperatures becomelower than the IRFM ones. From 4500 K to 5500 K, amean difference of about −90 K is observed, and it seemsto go to zero again at lower temperatures.
6. CONCLUSIONS
Effective temperatures with a mean accuracy of about1.3% have been determined with the infrared flux methodfor a selected sample of stars as well as for the Alonsoet al. (AAM) sample with the aim of calibrating the
metallicity-dependent temperature vs. color relations ina companion publication. The status of this particularIRFM implementation is revised and it is shown that theIRFM temperatures are well scaled to the direct ones formain sequence stars. The case for giant stars was provedin the past and the present work confirms the good agree-ment. The present work improves the IRFM Teff scaleby the use of up-to-date spectroscopic atmospheric pa-rameters and the inclusion of stars in the ranges wherefew or no data were previously studied. Our IRFM ap-proach, however, is largely based on the AAM study,and a comparison of our updated to AAM temperaturesshows agreement within error bars.
We point out that the influence of the bolometric fluxcalibrations adopted on our IRFM temperatures is im-portant because they may introduce systematic trendsin the resulting Teff scale. However, we have also shownthat the systematic trends may not be larger than 50 K,and so, if differences larger than 50 K are found withother Teff scales, they should not be attributed solely tothe fluxes adopted in the IRFM. This number (50 K) is aconservative estimate, and thus even smaller differencesmay not be totally due to errors in the bolometric fluxes.
Comparison of the stellar angular diameters from theIRFM with those measured by interferometry, lunar oc-cultation or transit observations shows good agreement.This work thus provides accurate stellar angular diam-eters, which are essential to calibrate extremely high-resolution long-baseline interferometric observations (e.g.VLT and CHARA interferometers).
When combined with bolometric flux measurements,the interferometric angular diameters produce a temper-ature scale with a zero point that is only 10 K belowthat derived with the IRFM for the giant stars with[Fe/H] > −0.7 and temperatures above 3800 K and be-low 5000 K. The corresponding zero points of the dwarfTeff scales differ by only about 20 K (the IRFM beinglarger), and it is valid for [Fe/H] > −0.55 and temper-atures between 4000 K and 6500 K. No stars outsidethose ranges were available for comparison, and we can-not guarantee that the zero point of the IRFM Teff scaleis essentially the absolute one everywhere in the atmo-spheric parameters space, as it is the case in the rangesmentioned above.
The IRFM temperature of the Sun is only about 20 Kbelow the standard value, and those of the well studiedstars Procyon and Arcturus are consistent with the di-rect ones and those derived with other methods withinthe error bars. No perfect agreement is expected for thesebright stars because the photometric uncertainties asso-ciated are large and easily propagated in the IRFM. Con-sequently, no empirical shifts to reproduce the tempera-ture of the Sun or other well studied stars were applied.
The comparison with the temperatures obtained withother methods shows that the temperature scale of thelower main sequence is still unreliable at the 100 K levelbecause larger discrepancies are found. Although con-sistent with the temperatures from Balmer line-profilefitting, the IRFM produces temperatures that are about100 K lower that those derived from the excitation equi-librium of Fe I, but exceptions are found. The temper-ature scale of giant stars is better defined, probably toa 50 K level or even better. The spectroscopic temper-atures of the metal-poor giants, both in the field and

16 Ramırez & Melendez
in clusters, are about 65 K higher that those from theIRFM, but otherwise differentially consistent with them.
With the IRFM temperatures described in this paperand the atmospheric parameters adopted, we will cali-brate a set of homogeneous temperature vs. color re-lations (Part II). The fact that the input parametersare somewhat inhomogeneous (several sources have beenconsidered) will not have a significant effect on these re-lations but they may have some effect on the IRFM tem-peratures.
We thank A. Alonso for early discussions on this workand for providing some of his published data in electronicformat, and P. S. Barklem for providing the temperaturesfrom Balmer lines used in AP04. JM thanks partial sup-port from NSF grant AST-0205951 to J. G. Cohen. Thispublication makes use of data products from 2MASS,which is a joint project of the University of Massachusettsand IPAC/Caltech, funded by NASA and the NationalScience Foundation; and the SIMBAD database, oper-ated at CDS, Strasbourg, France.
REFERENCES
Allende Prieto, C., Garcıa Lopez, R., Lambert, D. L., &Gustafsson, B. 1999, ApJ, 527, 879
Allende Prieto, C., Barklem, P. S., Lambert, D. L., & Cunha, K.2004, A&A, 420, 183 (AP04)
Alonso, A., Arribas, S., & Martınez-Roger, C. 1994a, A&A, 282,684 (AAM94a)
Alonso, A., Arribas, S., & Martınez-Roger, C. 1994b, A&AS, 107,365 (AAM94b)
Alonso, A., Arribas, S., & Martınez-Roger C. 1995, A&A, 297, 197(AAM95)
Alonso, A., Arribas, S., & Martınez-Roger, C. 1996a, A&AS, 117,227 (AAM96a)
Alonso, A., Arribas, S., & Martınez-Roger, C. 1996b, A&A, 313,873 (AAM96b)
Alonso, A., Arribas, S., & Martınez-Roger, C. 1998, A&AS, 131,209 (AAM98)
Alonso, A., Arribas, S., & Martınez-Roger, C. 1999a, A&AS, 139,335 (AAM99a)
Alonso, A., Arribas, S., & Martınez-Roger, C. 1999b, A&AS, 140,261 (AAM99b)
Arce, H. G., & Goodman, A. A. 1999, ApJ, 512, L135Arenou, F., Grenon, M., & Gomez, A. 1992, A&A, 258, 104Asplund, M., & Garcıa Perez, A. E. 2001, A&A, 372, 601Barklem, P. S., Stempels, H. C., Allende Prieto, C., et al. 2002,
A&A, 385, 951Beeckmans, F. 1977, A&A, 60, 1Beers, T. C., Drilling, J. S., Rossi, S., et al. 2002, AJ, 124, 931Bensby, T., Feltzing, S., & Lundstrom, I. 2003, A&A, 410, 527
(B03)Bessell, M. S., Castelli, F., & Plez, B. 1998, A&A, 333, 231 (B98)Blackwell, D. E., & Shallis, M. J. 1977, MNRAS, 180, 177Blackwell, D. E., Shallis, M. J., & Selby, M. J. 1979, MNRAS, 188,
847Blackwell, D. E., Petford, A. D., & Shallis, M. J. 1980, A&A, 82,
249Blackwell, D. E., Petford, A. D., Arribas, S., et al. 1990, A&A, 232,
396Blackwell, D. E., & Lynas-Gray, A. E. 1994, A&A, 282, 899Blackwell, D. E., & Lynas-Gray, A. E. 1998, A&AS, 129, 505Bond, H. E. 1980, ApJS, 44, 517Brown, T. M., Charbonneau, D., Gilliland, R. L., et al. 2001, AJ,
552, 699Burstein, D., & Heiles, C. 1982, AJ, 87, 1165Castelli, F., Gratton, R. G., & Kurucz, R. 1997, A&A, 318, 841Castro, S., Rich, R. M., Grenon, M., et al. 1997, AJ, 114, 376Cayrel de Strobel, G. 1990, in: XI IAU EAM, New Windows on
the Universe, eds. F. Sanches and M. Vazquez, 195Cayrel de Strobel, G., Soubiran, C., & Ralite, N. 2001, A&A, 373,
159Chen, B., Vergely, J. L., Valette, B., & Carraro, G. 1998, A&A,
336, 137Chen, B., Figueras, F., Torra, J. et al. 1999, A&A, 352, 459Code, A. D., Bless, R. C., Davis, J., & Brown, R. H. 1976, ApJ,
203, 417Cohen, M., Walker, R., Carter, B., et al. 1999, AJ, 117, 1864di Benedetto, G. P. 1998, A&A, 339, 858 (dB98)Dyck, H. M., & Nordgren, T. E. 2002, AJ, 124, 541Dutra, C. M., Santiago, B. X., & Bica, E. L. D. 2002, A&A, 381,
219Dutra, C. M., Santiago, B. X., Bica, E. L. D., & Barbuy, B. 2003,
MNRAS, 338, 253Edvardsson, B., Andersen, J., Gustafsson, B., et al. 1993, A&A,
275, 101 (E93)
Fuhrmann, K. 1998, A&A, 338, 161 (F98)Gonzalez, G., Laws, C., Tyagi, S., & Reddy, B. E. 2001, AJ, 121,
432Gray, D. F. 1994, PASP, 106, 1248Gray, D. F., & Johanson, H. 1991, PASP, 103, 439Griffin, R. E. M., & Lynas-Gray, A. E. 1999, AJ, 117, 2998Gustafsson, B., Bell, R. A., Eriksson, K., & Nordlund, A. 1975,
A&A, 42, 407Hakkila, J., Myers, J. M., Stidham, B. J., & Hartmann, D. H. 1997,
AJ, 114, 2043Heiter, U., & Luck, R. E. 2003, Abundance analysis of planetary
host stars. In proceedings of IAU Symp. 210, “Modelling ofStellar Atmospheres”, ed. N. Piskunov, W.W. Weiss, & D.F.Gray, ASP Conference Series
Houdashelt, M. L., Bell, R. A., & Sweigart, A. V. 2000, AJ, 119,1448
Kervella, P., Thevenin, F., Segransan, D., et al. 2003, A&A, 404,1087
Kervella, P., Thevenin, F., Di Folco, E., & Segransan, D. 2004,A&A, 426, 297
Kovtyukh, V. V., Soubiran, C., Belik, S. I., & Gorlova, N. I. 2003,A&A, 411, 559 (K03)
Kraft, R. P., Sneden, C., Langer, G. E., & Prosser, C. F. 1992, AJ,104, 645 (LT)
Kraft, R., & Ivans, I. 2003, PASP, 115, 143Kurucz, R. L. 1979, ApJS, 40, 1Kurucz, R. L. 1992, in: The Stellar Populations of Galaxies,
Barbuy, B., Renzini, A. (eds.). IAU Symp. 149, Dordrecht,Kluwer, p. 225
Lane, B. F., Boden, A. F., & Kulkarni, S. R. 2001, ApJ, 551, L81Leggett, S. K., Mountain, C. M., Selby, M. J., et al. 1986, A&A,
159, 217Lejeune, Th., Cuisinier, F., & Buser, R. 1997, A&AS, 125, 229McWilliam, A., Preston, G. W., Sneden, C., & Searle, L. 1995, AJ,
109, 2757Melendez, J., & Ramırez, I. 2003, A&A, 398, 705Melendez, J., & Ramırez, I. 2004, ApJ, 615, L33Mermilliod, J. C., Mermilliod, M., & Hauck, B. 1997, A&AS, 124,
349 (GCPD)Mishenina, T. V., & Kovtyukh V. V. 2001, A&A, 370, 951Mozurkewich, D., Armstrong, J. T., Hindsley, R. B., et al. 2003,
AJ, 126, 2502 (M03)Nordgren, T. E., Germain, M. E., Benson, J. A., et al. 1999, AJ,
118, 3032Nordgren, T. E., Sudol, J. J., & Mozurkewich, D. 2001, AJ, 112,
2707Norris, J. E., Ryan, S. G., & Beers, T. C. 2001, ApJ, 561, 1034Pompeia, L., Barbuy, B., & Grenon, M. 2002, ApJ, 566, 845Ramırez, I., & Melendez, J. 2004a, A&A, 417, 301 (RM04a)Ramırez, I., & Melendez, J. 2004b, ApJ, 609, 417 (RM04b)Richichi, A., & Percheron, I. 2002, A&A, 386, 492 (CHARM)Ryan, S. G., Norris, J. E., & Bessell, M. S. 1991, AJ, 102, 303Ryan, S. G., Norris, J. E., & Beers, T. C. 1996, ApJ, 471, 254Santos, N. C., Israelian, G., & Mayor, M. 2001, A&A, 373, 1019Santos, N. C., Israelian, G., & Mayor, M. 2004, A&A, 415, 1153
(SIM04)Schlegel, D. J., Finkbeiner, D. P., & Davis, M. 1998, ApJ, 500, 525Schuster, W. J., & Nissen, P. E. 1989, A&A, 221, 65Shetrone, M. D. 1996, AJ, 112, 1517 (LT)Smalley, B., & Dworetsky, M. M. 1995, A&A, 293, 446Sneden, C., Kraft, R. P., Prosser, C. F., & Langer, G. E. 1991, AJ,
102, 2001 (LT)

The effective temperature scale of FGK stars. I. 17
Sneden, C., Kraft, R. P., Guhathakurta, P., et al. 2004, AJ, 127,2162
Stephens, A., & Boesgaard, A. M. 2002, AJ, 123, 1647Straizys, V. 1995, Multicolor Stellar Photometry (Pachart
Publishing House)Takada-Hiday, M., Takeda, Y., Sato, S., et al. 2002, ApJ, 573, 614Takeda, Y., Ohkubo, M., & Sadakane, K. 2002a, PASJ, 54, 451
(T02a)
Takeda, Y., Sato, B., Kambe, E., et al. 2002b, PASJ, 54, 1041(T02b)
Yong, D., & Lambert, D. L. 2003a, PASP, 115, 22Yong, D., & Lambert, D. L. 2003b, PASP, 115, 796Yong, D., & Lambert, D. L., Allende Prieto, C., & Paulson, D.
2004, ApJ, 603, 697