The effect of TQM on bulky good - DiVA-Portal
126
The effect of TQM on Bulky MASTER’S DEGREE THESIS WITHIN: MSc International logistics and supply chain management NUMBER OF CREDITS: 30 PROGRAMME OF STUDY: MSC AUTHORS: Raza.Wasel and Maqsood.Tayyab. An implication at a firm which acts as a logistics solutions provider
-
Upload
khangminh22 -
Category
Documents
-
view
0 -
download
0
Transcript of The effect of TQM on bulky good - DiVA-Portal

The effect of
TQM on Bulky
Goods
MASTER’S DEGREE
THESIS WITHIN: MSc International logistics and supply
chain management
NUMBER OF CREDITS: 30
PROGRAMME OF STUDY: MSC
AUTHORS: Raza.Wasel and Maqsood.Tayyab.
JÖNKÖPING 05, 2018
An implication at a firm which acts as a logistics
solutions provider

Master Thesis, Degree Project in Business
(Msc international logistics and supply chain management)
Title: The effect of TQM on bulky goods
Authors: Raza.Wasel and Maqsood.Tayyab
Tutor: Daniel Pittino
Date: 2018.05.21
Key terms:
Production: a department that caters for a regular client.
KPI: key performance indicator.
SCM: supply chain management.
JIT: just in time production technique.
Bulky goods: a department which caters for consignments that appear in all possible shapes and
sizes, a mover of unusual items.

1
TABLE OF CONTENTS
List of Tables .............................................................................................................................. 4
List of figures .............................................................................................................................. 7
Chapter 1: Introduction ............................................................................................................. 10
1.1 Problem Statement ......................................................................................................... 13
1.2 Purpose of the Study ...................................................................................................... 16
1.3 Research Questions ........................................................................................................ 16
1 Literature Review.................................................................................................................. 18
1.1 Total Quality Management............................................................................................. 18
1.1.1 Concept of TQM ..................................................................................................... 18
1.1.2 TQM Activities and Quality Performance .............................................................. 19
1.1.3 TQM and Its Impact on Stakeholders ..................................................................... 20
1.1.4 TQM and Organizational Performance ................................................................... 21
1.2 Supply Chain Management ............................................................................................ 21
1.2.1 Supply Chain Strategy ............................................................................................ 22
1.2.2 Theories of SCM ..................................................................................................... 23
1.3 Relationship of TQM and Supply Chain Management .................................................. 23
Chapter 2: TQM Techniques .................................................................................................... 26
2.1 Quality Circle ................................................................................................................. 26
2.2 Statistical Process Control .............................................................................................. 27
2.3 Total Quality Control Approach .................................................................................... 28

2
2.4 Robust Design ................................................................................................................ 29
2.5 Quality Function Deployment ........................................................................................ 30
2.6 Comparison .................................................................................................................... 30
Chapter 3: Methodology ........................................................................................................... 32
3.1 Research Strategy ........................................................................................................... 32
3.2 Research Process ............................................................................................................ 34
3.2.1 Problem Statement .................................................................................................. 34
3.2.2 Literature Analysis .................................................................................................. 35
3.2.3 Theoretical Framework Model ............................................................................... 36
3.2.4 Hypothesis............................................................................................................... 36
3.2.5 Research Design...................................................................................................... 37
3.2.6 Data Collection ....................................................................................................... 37
3.2.7 Data Analysis .......................................................................................................... 37
3.3 Ethical Consideration ..................................................................................................... 38
3.4 Action and Results ......................................................................................................... 38
3.5 Data Collection and Analysis ......................................................................................... 39
3.5.1 Data Analysis .......................................................................................................... 40
3.6 Research Quality Verification ........................................................................................ 42
3.6.1 Validity ................................................................................................................... 42
3.6.2 Reliability ................................................................................................................ 42
Chapter 4: Data Analysis .......................................................................................................... 43
1.4 Frequency Analysis ........................................................................................................ 43

3
1.5 Approach Analysis ......................................................................................................... 79
1.6 Correlation Analysis ....................................................................................................... 84
1.7 Regression Analysis ....................................................................................................... 86
Chapter 5: Quality Circle Implementation ............................................................................... 91
5.1 Advantages of Quality Circle Implementation to Organization..................................... 92
5.2 Results, Improvements and identified problems: ........................................................... 94
5.3 Risk Factor ................................................................................................................... 100
5.4 Risk Analysis................................................................................................................ 102
5.5 Key Drivers of Quality Matrix ..................................................................................... 102
5.6 Suggestions................................................................................................................... 104
Chapter 6: Conclusion ............................................................................................................ 106
References ................................................................................................................................... 109
Chapter 7: Appendix ............................................................................................................... 120
7.1 Questionnaire ............................................................................................................... 120
7.2 Part 1: Personal Information ........................................................................................ 120
7.3 Part 2: Instructions ....................................................................................................... 120
7.3.1 Section A: Total Quality Management ................................................................. 121
7.3.2 Section B: Supply Chain Management ................................................................. 121
7.3.3 Section C: Operational Processes ........................................................................ 122
7.3.4 Section D: Organizational Performance ............................................................... 123
7.4 Interviews ..................................................................................................................... 124

4
List of Tables
Table 4-1 Reliability Statistics ...................................................................................................... 42
Table 5-1 Gender .......................................................................................................................... 43
Table 5-2 Age ............................................................................................................................... 44
Table 5-3 Job Position .................................................................................................................. 45
Table 5-4 Production..................................................................................................................... 46
Table 5-5 Top management (senior executives and supervisors) view improvement in service
quality leading to increase profits ................................................................................................. 47
Table 5-6 top management has objectives for quality performance ............................................. 48
Table 5-7 top management evaluates organizational performance through provision of quality
services .......................................................................................................................................... 50
Table 5-8 TQM assists in alignment of company’s goals as well as individual goals ................. 51
Table 5-9 There is an uplift in the stature of the organization and the morale of employees through
quality measures............................................................................................................................ 52
Table 5-10 In case of deviances in processes, solutions are drafted out in the best feasible way 53
Table 5-11 Uncertainty avoidance measures are taken into consideration ................................... 54
Table 5-12 With the provision of precise and concise information, the best result could be extracted
....................................................................................................................................................... 55
Table 5-13 The Supply Chain Management is completely based on the integration of quality-based
processes ....................................................................................................................................... 56
Table 5-14 The clients have an effective system to ensure quality of the services ...................... 57
Table 5-15 We emphasize on quality and delivery performance rather than price in selecting clients
....................................................................................................................................................... 58
Table 5-16 The clients are involved in our quality training .......................................................... 59
Table 5-17 We work closely with clients to improve each other’s processes .............................. 60
Table 5-18 the clients are actively involved in our new product development process ............... 61

5
Table 5-19 Employee involvement and suggestions are highly valued and taken under
consideration, as they have a closer look with the hand held operations ..................................... 62
Table 5-20 Quality and Reliability of our services are high ......................................................... 64
Table 5-21 There is increased transparency in the communication amongst productions ........... 65
Table 5-22 We deliver our services on time to customers ............................................................ 66
Table 5-23 We design processes in our firm to be “mistake-proof” to minimize the changes of
errors ............................................................................................................................................. 67
Table 5-24 We make extensive use of statistical techniques to reduce variation in processes .... 68
Table 5-25 We give clear, comprehensive, and standardized documentations and instructions about
work methods and process instructions to employees .................................................................. 69
Table 5-26 Crew members have the right to contribute to the think tank, in order to achieve
continuous improvement ............................................................................................................... 71
Table 5-27 the firm has an effective performance measurement system to track overall
organizational performance .......................................................................................................... 72
Table 5-28 Quality data (error rates, defect rates, scrap, defects, rework rates, cost of quality, etc.)
are available .................................................................................................................................. 73
Table 5-29 Timely firm performance data is always available ..................................................... 74
Table 5-30 Quality of the products and services enhances the organizational performance, as it
leads towards strengthening the relationship with the client ........................................................ 75
Table 5-31 Implementation of total quality management enhances the organizational performance
....................................................................................................................................................... 76
Table 5-32 Due to quality circle processes are aligned in a better manner .................................. 77
Table 5-33 There is increased accuracy of the information which is processed and circulated
through the productions due to the implementation ..................................................................... 78
Table 5-34 Sending ....................................................................................................................... 82
Table 5-35 Labour Hours .............................................................................................................. 83
Table 5-36 KPI .............................................................................................................................. 84

6
Table 5-37 Correlations ................................................................................................................ 85
Table 5-38 Model Summary ......................................................................................................... 86
Table 5-39 Model Summary ......................................................................................................... 86
Table 5-40 Coefficients................................................................................................................. 87
Table 5-41 Residuals Statistics ..................................................................................................... 88

7
List of figures
Figure 2-1 Framework .................................................................................................................. 25
Figure 5-1 Gender ......................................................................................................................... 43
Figure 5-2 Age .............................................................................................................................. 44
Figure 5-3 Job Position ................................................................................................................. 45
Figure 5-4 Production ................................................................................................................... 46
Figure 5-5 Top management (senior executives and supervisors) view improvement in service
quality leading to increase profits ................................................................................................. 47
Figure 5-6 top management has objectives for quality performance ............................................ 48
Figure 5-7 top management evaluates organizational performance through provision of quality
services .......................................................................................................................................... 50
Figure 5-8 TQM assists in alignment of company’s goals as well as individual goals ................ 51
Figure 5-9 There is an uplift in the stature of the organization and the morale of employees through
quality measures............................................................................................................................ 52
Figure 5-10 In case of deviances in processes, solutions are drafted out in the best feasible way53
Figure 5-11 Uncertainty avoidance measures are taken into consideration ................................. 54
Figure 5-12 With the provision of precise and concise information, the best result could be
extracted ........................................................................................................................................ 55
Figure 5-13 The Supply Chain Management is completely based on the integration of quality-
based processes ............................................................................................................................. 56
Figure 5-14 The clients have an effective system to ensure quality of the services ..................... 57
Figure 5-15 We emphasize on quality and delivery performance rather than price in selecting
clients ............................................................................................................................................ 58
Figure 5-16 The clients are involved in our quality training ........................................................ 59
Figure 5-17 We work closely with clients to improve each other’s processes ............................. 60
Figure 5-18 the clients are actively involved in our new product development process .............. 61

8
Figure 5-19 Employee involvement and suggestions are highly valued and taken under
consideration, as they have a closer look with the hand held operations ..................................... 62
Figure 5-20 Quality and Reliability of our services are high........................................................ 64
Figure 5-21 There is increased transparency in the communication amongst productions .......... 65
Figure 5-22 We deliver our services on time to customers .......................................................... 66
Figure 5-23 We design processes in our firm to be “mistake-proof” to minimize the changes of
errors ............................................................................................................................................. 67
Figure 5-24 We make extensive use of statistical techniques to reduce variation in processes ... 68
Figure 5-25 We give clear, comprehensive, and standardized documentations and instructions
about work methods and process instructions to employees ........................................................ 69
Figure 5-26 Crew members have the right to contribute to the think tank, in order to achieve
continuous improvement ............................................................................................................... 71
Figure 5-27 the firm has an effective performance measurement system to track overall
organizational performance .......................................................................................................... 72
Figure 5-28 Quality data (error rates, defect rates, scrap, defects, rework rates, cost of quality, etc.)
are available .................................................................................................................................. 73
Figure 5-29 Timely firm performance data is always available ................................................... 74
Figure 5-30 Quality of the products and services enhances the organizational performance, as it
leads towards strengthening the relationship with the client ........................................................ 75
Figure 5-31 Implementation of total quality management enhances the organizational performance
....................................................................................................................................................... 76
Figure 5-32 Due to quality circle processes are aligned in a better manner ................................. 77
Figure 5-33 There is increased accuracy of the information which is processed and circulated
through the productions due to the implementation ..................................................................... 78
Figure 5-34 Before Deployment ................................................................................................... 79
Figure 5-35 After Deployment...................................................................................................... 80
Figure 5-36 Customer Sendings Analysis..................................................................................... 81

9
Figure 5-37 Labour Hours ............................................................................................................ 82
Figure 5-38 KPI ............................................................................................................................ 83
Figure 5-39 Analysis Performance ............................................................................................... 89
Figure 5-40 Scatter Plot ................................................................................................................ 90

10
CHAPTER 1: INTRODUCTION
In the contemporary business world, the level of competition amongst organizations is fierce and
sky high, where majority of them are seeking ways to achieve competitive advantage over others
and enhance organizational performance to the optimum level.
Company XYZ is one of the renowned logistics companies that runs its’ operations in the Nordic
region. It has a good hold in the Nordic region, as well has arteries stretching in the global
environment. Bring provides logistics services to every sort of segments in the market, be it a
business to business or business to customer. Bring serves in every way possible, be it mails, goods,
packages, bids etc. It takes customer service quite seriously, taking the example of a washing
machine or any other white ware product, they transport it from point A to point B, carry it inside,
and even install it if you require additional services, depending upon particular customer needs.
The company has a hefty amount of customer base, which keeps increasing by every passing day,
due to the service excellence. One of the productions of company XYZ is located at Torsvik is
Bulky goods which as the name suggests means heavy items. In this study we aim to conclude as
to what is the effect of Total Quality Management on Bulky goods.
One Study provides six criterions for Total Quality Management: Leadership, information and
analysis, strategic quality, planning, human resource development and management, management
of process quality, customer focus and satisfaction. There is a different impact of Total Quality
Management on different processes and firms. (Wilson and Collier, 2000, as quoted in E, T, and
D.J, 2007)
The main goal of Total Quality Management is to competitively meet and exceed customer’s needs
by improving quality of the organization’s product or service. (Gunasekaran and McGaughey,
2003, as cited in F., Z., and Qureshi, 2011, p. 269). Enhancing customer satisfaction is the main
focus of Total Quality Management. (Gunasekaran and McGaughey, 2003, as cited in F., Z., and
Qureshi, 2011, p. 269). Customer satisfaction will increase naturally as we increase the efficiency

11
and timeliness of the delivery of bulky goods. Additionally, TQM is a systematic approach
working horizontally across different functional departments while involving all employees on all
levels, where as it extends back and forth to incorporate the supply chain and customer chain.
(Kanji and Wong, 1999, as cited in F., Z., and Qureshi, 2011, p. 269).
Process variance is reduced significantly by the application of TQM. Supply chain performance
measures such as cycle time, and delivery dependability are directly impacted by reduced process
variance. (Flynn et al, 1995, as cited in F., Z., and Qureshi, 2011, p. 269).
Quality management is seen to bring improvements in the organization’s productivity and profits,
as suggested by empirical evidence. (Hendricks & Singhal, 1997; Douglas & Judge, 2001, as cited
in K.H, G., and Cheng, 2004).
Total Quality Management practices such as top-management commitment, customer focus,
training and education of crew members, continuous improvement and innovation, supplier
management, and employee involvement have many benefits to the organization. Successful
implementation of these practices results in a boost in the business performance, customer
satisfaction and customer responsiveness. They also equip the managers to improve their
leadership ability and to reduce cost. The successful implementation of TQM practices also brings
benefits such as increase in quality of goods and services, employee empowerment, supplier-
customer relationship, improved enterprise resource planning partnership, teamwork, reduction of
wastage, on-time delivery, JIT, reduced cycle time, improved internal and external relationship,
improved efficiency on information processing, improved security, and improved market share.
(F., Z., and Qureshi, 2011)
Many leading organizations in the world are using Total Quality Management (TQM) practices as
the essential features of business strategy to gain competitive advantage and success. Internal
integration of logistics companies benefits from the use of technology and Total Quality

12
Management practices. Information technology can be used to gain further internal and external
integration of logistics companies. (S.A, Lim, and H, 2006)
Total Quality management (TQM) plays a significant role in improving the performance of
logistics companies. Organizations that use Total Quality Management practices are seen to
perform significantly better than their competitors who do not use TQM practices. (S.A, Lim, and
H, 2006)
Managers in all organizations should be aware that Total Quality Management (TQM) practices
bring about positive effects on employee’s work-related attitudes such as job commitment, job
involvement, job satisfaction, and career satisfaction. TQM practices such as training and
education positively impact job involvement, job satisfaction, and organizational commitment. Job
involvement, job satisfaction, career satisfaction, and organizational commitment are all
significantly enhanced by Empowerment and Teamwork (TQM Practices). Job satisfaction and
organizational commitment both are also increased by continuous improvement and problem
prevention which are also two of the very key Total Quality Management (TQM) practices. (N,
Asaari, and M, 2006)
There is a direct link between the organizational performance and supply chain management, if
the processes are clear enough everything would go smooth on a regular basis keeping the
deviances in mind and how to deal with them if they tend to occur, contingency plans are always
given immense importance.
Operational and business performance, employee relations and customer satisfaction are positively
affected by the implementation of Total Quality Management (TQM) practices. The benefits of
TQM may be different and vary depending on the size of the organization. (M, Samson, and D,
1999)

13
In one study a structural equation model was used to test the effect of quality management on
potential, process and outcome quality. The results were seen to be positive for all factors except
outcome quality. (W and J, 2010).
1.1 Problem Statement
Organisations, enterprises, business institutes etc. are always concerned about their performances
and every year the companies, business institutes etc. throughout the world increasing the
allocation of the particular spending of their budget in improving and enhancing their
performances (Boxall, Guthrie, & Paauwe, 2016).Today, most of the companies have adopted
information and communication technology to streamline their business, functional and
operational processes as mentioned in (Alfalla-Luque, Marin-Garcia, & Medina-Lopez, 2015).
Moreover, with the advancements of technology, tools and approaches, companies are now
incredibly focused on the provision of standardized quality-based products and services to their
clients and customers.
Based on the existing researches (Bal & Dorenbosch, 2015) (Su, Baird, & Schoch, 2015), it is
considered that the companies throughout the globe are facing number of challenges such as data
security and privacy problem, lack of techniques skills, project management and many other. In
accordance to the consideration, they are identified as critical and time-consuming problems that
can only be resolved through the integration of appropriate approaches, models or techniques.
However, to obtain or deploy any sort of solutions, in-depth investigations and analysis need to be
conducted.
Quality is defined as one of the key standards that are usually used to measure against the other
kind of observations. Most of the organisations emphasize on analysing the problem or technique
that can help them in sorting out the problem related to quality or supply chain management.
In context of this research, we have investigated the problem to be related to the supply chain
management of the company that mostly relates to the flow of administrative goods, setting

14
relationship with the customer, transportation management and checking their information,
handling of goods, generation of invoices and sendings to the client, setting the agreement with
the customer or partners and involved in many sort of task that we need to carry out. However,
during the analysis, we have indicated that overall the company performance has been impacted
and the keys stakeholders that are linked within the context of supply chain management cycle
have emphasized that these processes need to be improved so that better outcomes and results can
be extracted.
There are different sorts of aspects that can overall help the company to improve their
performances and streamline their processes that are linked within the context of supply chain
management. For instance, in terms of the logistics, most of the companies face the problem of
sustaining the relationship with their clients, since uncertainties exist and tend to tamper the
relationship. The focus of the research is laid on finding out the effects of implementing the Total
Quality Management practices on bulky goods. Bulky goods is a production of company XYZ,
where sorting, order processing, and dispatching of the way bills is carried out. Bulky goods as the
name suggests directs towards goods which come in different sizes and shapes and are dealt
accordingly. During the analysis, it has been highlighted that there are some of the key problems
that are faced in the context of bulky goods and other productions. It is identified that these
problems overall impact the performance.
Cost is defined as one of the key factors while having any organisation or any sort of project in
mind. Every organization tends to ponder upon it in a way to align its processes in a manner that
there is efficient usage of resources and keeping the frame transparent enough. However, it is
considered that if the high labour hours can lead the key stakeholder to think and analyse how this
cost can be tackled and used in a way that its being utilized in an optimum manner. The labour
costs are one of the main operational costs of bulky goods, if they are lowered, a positive effect
can be extracted out of it. However, in the context of this research, we have found the solution to
these problems and have overall applied the TQM (Total Quality Management) and the actions

15
research so that the continuous benefit can be obtained through the utilization of the proposed
solution.
It can be summarized that we aim to enhance the performance of the production by decreasing the
number of working hours of employees as we have integrated the TQM based management system
on the principle that every member of staff must be committed to maintain high standards at work
in every aspect of a company's operations.
This research also focuses on managing and looking forward for the generation of a mechanism
which would align the processes, intended to refine and align them in such a manner that they are
carried out and more focused towards continuous improvement and executing tasks in the most
efficient way which would lead towards decreasing the number of labour hours being vested in the
production, which in turn would bring down the operational costs as well as improve the processes.
Taking the example being more thoughtful of the uncertainty avoidance measures, fixing the
truck/trailer arrival times so there are lesser discrepancies in the processes, and there is efficient
allocation of resources. As the trailers don’t arrive on the expected arrival time, they create a
divergence in the process, the labour hours designed for bulky goods is located to be useful to
other productions e.g whiteaway, millna, city mail etc. the divergence can prolong the hours and
create a state of urgency for varied situations. Another example would be the scanning and
transmission of the order process, its 2018 and most of the processes still require paper work,
which prolongs and complicates the situation e.g if the driver forgot to bring the waybill papers
along the dispatch area the good cant be produced and dispatched from the hub. Since the approach
being used is just in time, all goods have to be dispatched to their prior DIP’s, if there is a deviance
it would tend to bring an effect on the performance and the goodwill of the company. This states
that human error results in deviances, if it is more digitalized and more transparency is brought in
the processes, it could result in more fruitful outcomes. Thus, if the key problem is resolved, there
is a high probability that company would be able to extract better benefits in terms of costs, the

16
overall operations and business processes that are linked within the context of logistics and supply
chain management.
1.2 Purpose of the Study
The key principles and scope of this research is to sort out the key problems and issues that are
currently faced by the company and how TQM can play an important role in sorting out these
problems. However, in the initial phases, TQM can be implemented in the production that would
be aimed towards continuous improvement. It is more focused towards business process
improvement (BPI), since there is no urgency in rapidly changing the processes but to tamper them
and make it improve. Since there is a focus of management practices, rather than work to be
carried out on determining which information system to be applied. Decreasing the number of
labour hours is a desired outcome, whereas dealing with increasing amounts of waybills with the
same number of resources to be allocated is a task to be done as well. Operational excellence is
demanded, which could be proved through key performance indicators.
1.3 Research Questions
The following are the key research questions that we will be considered which would be answering
in the context of the research being carried out:
1. What are the key effects of Total Quality Management on Bulky goods and how it can play
a role in streamlining business, functional and operational processes?
2. What are the key principles that will be considered within the context of system of
management, maintaining high standards?
3. What current methods tend to exist while measuring performance in the context of supply
chain?
In this research, we will be answering the above questions which would draft out a way to
improve the processes of bulky goods while showing positive effects of the implication of

17
TQM in an organization. There is a high probability when we come to think of and speculate
the desired outcomes to define out part of these research questions are properly answered or
addressed.

18
1 LITERATURE REVIEW
1.1 Total Quality Management
1.1.1 Concept of TQM
Quality tends to play a vital role in todays era, be it regarding a product or a service, companies
are judged and analyzed by the level of quality services/products they tend to provide. The
significance of the quality of products and services in an existing competitive and complex
marketplace cannot be avoided in any instance as mentioned in (Jasti & Kodali, 2015). Quality is
considered as one of the elements that the consumers are looking forward too when purchasing the
product/service. Since the last couple of years, the concept of total quality management has
immensely evolved. (Mangla, Govindan, & Luthra, 2016) defined total quality management as a
holistic quality improving approach that is focused on bringing improvement in the performance
of the products/services in the context of both, innovation and quality. It has been founded by
(Pisani, et al., 2016) that organisations who have utilized TQM generate numerous advantages that
include high quality-based products, increase customer satisfaction, cutting down of costs,
improvement in the financial position of the firm, innovation and quality performance and overall
bringing improvement in the employee satisfaction. Moreover, research (Yusr, 2016) considered
that if the TQM is well-implemented, it does assist the organisation to gain a competitive advantage
over the competitors.
Since the last couple of years, numerous researches have been conducted on TQM, because of its
increasingly growing acceptance and diffusion in the business globe. (Zehir, Ertosun, Zehir, &
M{\"u}celdilli, 2012) considered TQM as one of the increasingly durable and popular
management concepts. (Mann & Kehoe, 1994) referred TQM as quality gurus. Similarly, in
accordance to (Prajogo & Sohal, 2003) TQM is considered as a management approach that has
been utilized by the organisations to enhance their organisational performance which encompasses
of numerous behavioural and technical topics. Furthermore, (Anvari, Ismail, Hojjati, & others,

19
2011) defined TQM as a philosophy of holistic management that increasingly strives for the
continuous improvement in organisation’s functions.
TQM is highlighted as one of the multidimensional constructs. TQM comprises of a variety of
activities and tasks that includes management leadership, training, quality data, employee
relations, reporting, and design of product service, information technology, people management,
customer focus, strategic planning and many others. As mentioned in (Prajogo & Sohal, 2003)
TQM as a team concept of the organisation’s management, where forehead needs of the customer
and overall aims of the integration of organisational units are incredibly considered. It emphasizes
the nature of the cooperation amongst the employees of all the standards of enterprises in all the
enterprises.
1.1.2 TQM Activities and Quality Performance
Numerous researches have been conducted in the context of examining and investigation
relationship between TQM and the performance, scholars that have utilized different types of
performance measures such as the level of innovation, quality, financial perspective and
operational performance (Tan, Kannan, & Handfield, 1998). Although, the impacts of TQM on
the several types of performance are quality, an inconsistent performance that generally indicates
a positive and strong relationship. As mentioned in (Mudiyanselage & Herath, 2014) that TQM
implementation results in the generation of high quality-based products/services.
In accordance with (Rahman & Bullock, 2005) quality is determined as the principal element of
the success in the existence of competitive environments. It is considered that quality management
appropriate is immensely highly profiled activities for the firms and has been associated with the
aspect to gain a competitive advantage against the competitors.
(Mann & Kehoe, 1994) revealed that the quality performance is associated with the TQM. Total
Quality Management practices enhance the promotion of quality performance. Main indicators for
the quality performance identified by (Kannan & Tan, 2005) are the productivity, rework, product

20
or service performance, cost of the scrap, and many others. It has been reflected that TQM
activities aim is to involve the employees in promoting human aspects of a quality system for
becoming adaptive in the changing environment. It needs to be considered as mentioned in
(Rahman & Bullock, 2005) that the main components of the quality represent the customer focus
and extensive process management.
It has been founded by (Berman, Wicks, Kotha, & Jones, 1999) that total quality management
positively impacts on the innovation performance. This is mainly because; the complete focus is
laid on enhancing the quality of the products and being customer focus. This means that the
company looks for new needs and changing demands of the customers and accordingly integrates
them in the form of product, while highly considering maintaining of quality.
1.1.3 TQM and Its Impact on Stakeholders
Earlier research works of (Berman, Wicks, Kotha, & Jones, 1999) (Rahman & Bullock, 2005) have
reflected that the quality management does not always enhance the firm's sustainability. This is
mainly due to lack of the involvement of the top managers, implementation of the isolated tools
and just in time tools without the proper adoption of TQM philosophy. It is really important to
consider that the significance of selecting and properly implementing TQM in the existing business
processes really cannot be neglected in any instance. Moreover, rather the research argued that if
TQM is not properly adopted and implemented, then it would not be able to accomplish the
organizational quality goals and objectives, moreover, it would be negatively impacting on the
needs and wants of the stakeholders (Benavides-Velasco, Quintana-Garc{\'\i}a, & Marchante-
Lara, 2014).
In context to (Mann & Kehoe, 1994) it is considered that the excellent organizations increasingly
value the employees and tend to create a culture that appreciates the mutual beneficial
accomplishment of the organizational and personal goals (Rahman & Bullock, 2005). Basically, it
is considered that implementation of TQM overall requires that the organisations can develop the

21
capabilities amongst the employees through providing them training, and stimulation of
empowerment. Moreover, the work is given to the teams that promote innovation, participation,
and creativity in the improvement activities (Benavides-Velasco, Quintana-Garc{\'\i}a, &
Marchante-Lara, 2014). It is considered that ensuring the coordination and effectiveness of TQM's
implementation, integration of appropriate communication leads to the good progress providing
positive outcomes.
1.1.4 TQM and Organizational Performance
It has been considered that organizational performance since the last couple of years has been
increasingly attracted by the researchers and academics. Numerous researches have been
conducted in context to the domain of identifying the factors and elements that can enhance the
organizational performance.
One of the major element that has been identified by (Gharakhani, Rahmati, Farrokhi, &
Farahmandian, 2013) immensely impacts on the organization’s performance is the quality of
products/services. Quality is the major aspect that the consumers, stakeholders are looking forward
to, and relate their experiences with. As argued by (Rahman & Bullock, 2005), it is considered that
total quality management approaches focus on enhancing and improving the quality of the products
that in turn leads to the effective organizational performance. Furthermore, it is considered that
many successful organizations have gained a competitive advantage over the competitors in terms
of their organizational performance (Anvari, Ismail, Hojjati, & others, 2011).
1.2 Supply Chain Management
Supply chain management (SCM) is highlighted as active and effective management of the
activities involved in the supply chain in maximizing of the customer value and accomplishing
competitive advantage sustainably as mentioned in [ (Burke & Vakharia, 2002). It overall
represents the conscious efforts by the firm's supply chain for the aspect of developing and running
supply chains in efficient and effective ways. The activities of the supply chain as argued by

22
(Vickery, Jayaram, Droge, & Calantone, 2003) covers product developing, production, sourcing,
logistics and information system that is needed in coordinating all these activities.
It is considered as mentioned in (Gil, Gangopadhyay, Zhou, Gordon, & Nayak, 2010) enterprise
SCM and controls completely refers to complete integration of the supply chain system for the
planning, operating, coordinating, and optimizing the processes and activities. Its major goal is
correcting the products that are required by the customers at right time in right quantity with the
right quality. It is considered to be of immense importance that every process and activity in the
supply chain management is well-performed so that overall finish product is well produced and
considered.
In management process, focus on core business revolves around the requirement of the good
control in the two major aspects, that includes, to accomplish information flow of company, control
of capital flow, logistics, whereas, the second aspect is making of the sales purchases of the raw
material, sale continuous management tasks and activities (Zhang & Wu, 2013).
1.2.1 Supply Chain Strategy
New waves of change have taken steady hold in the field of the supply chain management in
numerous businesses (Vickery, Jayaram, Droge, & Calantone, 2003). This has been viewed as the
development of strategic management of supply chain. It is considered that in context to the
traditional viewpoint where the complete focus has been laid on the operations of SCM, however,
since last few years, SCM has acquired strategic function that contributes directly to business
success, while at the same time; it is becoming really immanent and central part of the business.
Most of the researchers (Burke & Vakharia, 2002) (Zhang & Wu, 2013)have identified and
considered that Supply chain strategies bear’s incredible importance, and it does directly as well
as indirectly assists in the ensuring of smooth operations.

23
1.2.2 Theories of SCM
SCM is considered as one of the fasting growing areas of attention to the both, business
management and academic practitioners. SCM is increasingly enriched with theoretical aspects of
economics, logistics, organizational behaviour and marketing. In context of the Transaction cost
approach (TCA), it has been based on the idea that firm exists mainly due to the marketing costs.
The theory has been criticizing neoclassical theory. TCA is based on the four main concepts that
consider the marketing mechanism fails due to the bounded rationality, opportunism, uncertainty
and asset specificity (Mudiyanselage & Herath, 2014).
Similarly, Resource-based View (RBV) has accounted for how the firms can be increasingly
independent of the opportunism. RBV beliefs that the firms, organizations, and companies are
capable of creating the specific benefits that are unavailable in the market in forms of the
transactions. RBV hold viewpoint of the capabilities and resources of the firm are highly elastic in
supply. Moreover, the theory recognizes numerous factors of the production (Braun & Guston,
2003).
Furthermore, agency theory (AT) is also one of the theories that have been conducted from the
perspective of the SCM. It is the theory that has been primarily based on relations between the two
parties; one party is principal that requires another party in undertaking actions, referred as an
agent, on principals’ behalf. The dyadic relationship overall ensures that agent acts in the best
interest of principal (Braun & Guston, 2003).
1.3 Relationship of TQM and Supply Chain Management
Over the last couple of years, competition between the enterprises has been incredibly increasing
in terms of its supply chain. Every organization wants their supply chain to be agile in nature, and
respond to every sort of situation that may occur in the future. This brings a great focus on
uncertainty avoidance measures, Thus, in accordance with (Chang, 2009) total quality
management implementation in the supply chain has become the really exquisite premise for

24
ensuring firm’s survival. The research (Zhu & Sarkis, 2004) discussed applications of eight
modern TQM policies and principles of the ISO 9000 in the supply chain quality management that
includes customer focus, people involvement, system management, process management, a
continuous improvement considering of decision making through factual approach and mutual
supplier relationships.
Research (Siddiqui, Haleem, & Wadhwa, 2009)presented ongoing integration procedure of the
aforesaid philosophies in existing flexible system, supply chain and total quality management have
highlighted through the considering of the qualitative researchers. Most of the researches in past
literature has carried out and several categories, that includes total quality management has in-
detailed has been studied and analysed. The research has been founded that the total quality
management in the context of the supply chain management bears immense importance and it’s
considered in the every process and activity carries high importance.
Lean manufacturing rises from Toyota Production Systems as presented in (Kannan & Tan, 2005).
Variants of the lean manufacturing that includes TQM that had been originally founded in
automotive industry Japan but the evolution was carried practically in West. The research (Anvari,
Ismail, Hojjati, & others, 2011)aimed at producing the comparative study between the total quality
management and the lean manufacturing with integrating of lean thinking approaches. Basically,
research founded that TQM is enhancement approach that results in creating synergy in
introducing high competitive advantage amongst companies.
In accordance to (Cooper & Ellram, 1993)it has been considered that SCM entails an effective
configuration and coordination of process that is increasingly necessary for making the products
available in reproducible, satisfactory and timely condition. It has been considered that the SCM
characteristics can be accomplished by identification and making the use of the SCM practices in
the systematic and organized way. Basically, it needs to be considered that SCM practices engage
the set of the activities and tasks that are undertaken by the organisation for the promoting of
supply chain management effectively (Zhang & Wu, 2013). Through the integration of TQM

25
approaches, overall processes of the SCM and all the activities that are involved in the chain
enhance and productive outcomes in terms of the quality are achieved.
Figure 1-1 Framework

26
CHAPTER 2: TQM TECHNIQUES
Significance of the total quality management in enhancing the credibility of organization in terms
of the quality cannot be neglected at any instance (Mystica, Bai, & SUGANTHI, 2015). Over the
last couple of years, numerous researches have been conducted on identifying and examining
different TQM approaches and their impacts on the overall organizations, with the aim of resolving
related problems and issues.
Below you may find a couple of TQM approaches, which were found to be quite useful and were
brought under consideration to implement at bulky goods.
2.1 Quality Circle
Nowadays, organizations are focused on adoption of new and innovative total quality management
approaches, as the traditional approaches have not remained really effective in provision of new
solutions to new problems and issues (Rohilla & Chaudhary, 2016). One such tool is the quality
circle. Basically, quality circle is a voluntary group that comprises of the members who meet to
overall talk about the workplace, focus of improvements in service and making of the presentations
of ideas to management.
As mentioned in (Seo, Lee, & Moon, 2016) quality circle has been widely adopted and
implemented in the organization’s, especially in Japanese manufacturing and production
engineering companies, such as Samsung, Kenwood and many others in the logistic departments.
It had been considered that during last past few years, Samsung company had been facing the
increased scrap and increased defects. Thus, it was noted that through the implementation of
Quality Circle, the defects were overall prevented, and it minimized the production of the scrap to
high extent, overall benefiting the organization (Moore, Herst, & Louwe, 2018).
In context to (Satonkar, et al., 2017)this approach had several benefits, such as it increases the
quality awareness of company, enhances product’s quality, improves managements approaches
and techniques to deal with everyday situations, and incredibly improves the customer relations.

27
However, it has been considered that this approach as mentioned in (Kumar & Mittal, 2015)also
has several drawbacks as well, that includes, that approach might not be really effective as it might
be wastage of time, due to lot of meetings, and moreover, it would be complete disaster, if the
meeting is not held by the total quality expertise (Bosch, CABANOS, & Aucejo, 2016).
In context to the consideration, to some extent, it can be applied to the existing case study, as it
would incredibly enhance the service quality, improving and enhancing the managerial functions
and operations.
2.2 Statistical Process Control
Since last couple of years, traditional approaches have been dynamically switched to advanced
approaches due to their increase effectiveness, and good management. One of the methods that
have been used by the companies in terms of controlling its quality is the statistical process control.
It employees the statistical methods for monitoring and controlling process, and ensures process,
produces increase specifications conforming product (Mystica, Bai, & SUGANTHI, 2015).
It has been identified that SPC has been integrated in numerous small scale enterprises in Malaysia.
Moreover, SPC has also been implemented in the Wood Industry of United States. The approach
has been widely recognized as one of the quality improvement practice that the companies employ
for ensuring reliability of the products, and overall increasing the satisfaction of the customers (Ab
Rahman, Zain, Alias, & Nopiah, 2015). It has been indicated that the major issues that companies
were facing was the management of data and data security. It had been investigated that the issue
was well-resolved by the implementation of SPC approach. SPC systems were really practical for
the effective management of data and conducting data analysis, and were considered to be really
beneficial for the manual SPC.
It is considered that there are several benefits of SPC. Firstly, it overall impacts on the production,
it is noticed that the production is less affected and there is low probability of the occurrence of
process slowdowns and less interruption. Furthermore, the systems are completely relied on the

28
flow charts and experiments that do positively impacts on the statistical analysis. However, it does
has some drawbacks as well, that includes, that it might be highly time consuming, costs
implementation is really high as there is a need of hiring processional consultant team, and possibly
lack of the cooperation.
Existing case might also consider the integrating and implementing of SPC, as it would definitely
impact the company performance, providing security to the company’s data as mentioned in
(Shamsuzzaman, Jasim, & Alsyouf, 2016).
2.3 Total Quality Control Approach
Considering of controlling the quality in the process bears incredible importance. It is identified
as the process-oriented technique that assists in the management of quality control (Aquilani,
Silvestri, Ruggieri, & Gatti, 2017). It has been reflected that numerous companies in worldwide
such as DHL, Nestle, Mitchell’s Fruit and many others have been adopted and implemented the
approach and technique of total quality control. This is mainly because this approaches focuses on
resolving the issue of controlling quantity and other parameters. It has been investigated that in
past, the Nestle Company has been facing lot of issues on controlling their costs, pricing and
quantity of stocks and production. As mentioned in (Zhu & Azar, 2015), it have been really
effective in controlling the both, quality and quantity parameters. This approach was mainly
applied in the logistic department, in order to overall measure and control the cost, raw material
and other related aspects.
There are various benefits of total quality control that includes increase emphasis on process and
the continual process improvement, engages participation of the employees so that they can
generate innovative ideas, enhances flexibility and really good for the changing market (Jimenez-
Jimenez, Martinez-Costa, Martinez-Lorente, & Rabeh, 2015). However, adopting and
implementing of this approach has several drawbacks as well, that includes, at times, when the
focus is increasingly laid on the process, employees lose their actual sight of the project as argued

29
in (Jin, Jeong, & Yoon, 2015), the approach might be costly, as there is a need of the requirement
of professional consultants.
2.4 Robust Design
It is considered that the major focus of the companies in today’s existing environment is the
maximization of the revenue, productivity and profitability (Lei, Wang, Zhu, Guo, & Wang, 2015).
However, as it sounds easy, it is not really easy. In order to obtain high revenues, profitability’s
and productivity, it is entirely important for the companies to integrate and adopt new approaches.
One of the total quality approaches is robust design. It has been argued by the (Fang, Gao, Sun,
Xu, & Li, 2015) that such method enhances and improves engineering productivity and ensures
the satisfaction of the customers. Engineering Companies of United States and Dell have adopted
and implemented Robust Design as it enhances functions of process or product, thus, assisting in
the facilitating of the flexible designs and engineering (Guo, Zhao, Zhang, Yan, & Sun, 2015).
It has been pointed that E-Kalsoft Company was facing the issue of high error rate in the
transmission of date. A group of the engineers were working on design of the radio receiver for
the ground to the aircraft communication that required high reliability. Building prototype series
had been really expensive for the resolving of the problem, similarly, on other hand, the computer
simulation efforts for the evaluation of the single design had been considered to be really expensive
and time consuming. After the in-depth analysis and discussions, robust design approach was
adopted as it focused on the increasing the reliability and was really cost effective (Blaabjerg &
Pecht, 2015).
Major advantages of implementing robust design approach and technique is that it reduces the
product cost, improves quality and reduces the developmental interval as mentioned and examined
in (Jiang, 2015). However, on the other hand, it has been indicated that the major disadvantage of

30
the robust design is that it considers the noise factors as independent factors which might create
lot of issues when setting up experiment (Ahmad Shamsuddin, Chew, & Shin, 2015).
2.5 Quality Function Deployment
Quality has been one of the most important aspects that has attained the attention of numerous
practitioners and researcher. It is considered that major approach of the total quality management
is the quality function deployment as it primarily focuses on the identification of the critical and
important customer attitudes and creates an effective link between the design parameter and
customer attributes (Sahney, 2015).
In accordance to consideration and analyzing that the approach assists in making decisions, and in
terms of the logistics it resolves the issue of considering each and every important parameter
needed for the execution and integration of supply chain. In terms of the considerations, it was
identified that Aesop Cosmetics was entirely facing the issue of bringing quality in its supply chain
(Jin, Jeong, & Yoon, 2015). However, the problem was adequately resolved and adjusted through
the integration of quality function deployment. It has been considered that the major advantage of
the quality function deployment is that it overall enhances the customer satisfaction through
completely considering the quality perspectives of the customers as argued in (Yan & Ma, 2015).
The major drawbacks include risks of customer focus, as the effective conduction of QFD overall
requires the accurate analysis of data.
2.6 Comparison
In context to the analysis and consideration, it has been identified that the role of almost all of the
total quality management techniques and approaches have been really immense in terms of the
growth of the organization to the accomplishment of the organization goals in context to the quality
of customers. However, it has been realized that the organization should be really good enough to
adopt and implement right TQM approach in terms of its working environment.

31
It has been considered that logistics is a complex department, and most of the approaches that
have been presented are really focused on the meeting of the qualities, through the advanced
informational technological approaches.
After pondering a lot, we chose to head with the quality circle after successful agreement with the
production manager. If the crew members tend to engage in discussions, more and more problems
can be identified and highlighted, and hence could be worked upon accordingly. There is a high
need of transparency of communication as the manager mentioned, once the meetings are held, the
problem areas could be worked upon and made functional. The people who deal with the day to
day tasks have a deeper insight of how things go about, so they can provide highly valuable and
first-hand information regarding issues, and they can propose the best possible solution to it, as
their observations are far stretched due to the daily interaction. A good fusion can occur due to the
quality circle, indulging all the actors in the chain to work towards the betterment of the production,
and owning problems as a team.

32
CHAPTER 3: METHODOLOGY
In this chapter, there is a detailed discussion on the research strategy that has been applied in the
context of the research. This chapter also covers the discussion that how the data collection in this
research has been carried out and the research process is portrayed as it has to be lead. However,
it comprises of a section where it explains how the collected through the research would be
analyzed.
Methodology is always considered as the center of attention (Lewis, 2015). It is highlighted that
the whole concept of the research and the execution path in any sort of domain is executed
according to the method (Vaioleti, 2016). There are several types of methodologies that are
currently available and brought under consideration in various research works, each varying from
the other in its own manner. The key foundation of both the methodologies is based on the
quantitative and qualitative method (McCusker & Gunaydin, 2015). There are diverse types of
methodologies available and to some extent it is quite impossible of the key stakeholder or the
researcher to identify and analyze that best methodology that according to the scenario of
researches supporting argument from (Starr, 2014).
However, if the right methodology is chosen, there is a high probability that better results can be
extracted out of it. Due to the methodology the project or research would be completed within the
specific duration, cost and resources as intended and speculated. So, it has been indicated that
before the selection of any sort of research, a deep analysis should be done on the available and
pertaining research that is available for the writer to design the context (Palinkas, Horwitz, Green,
Wisdom, Duan, & Hoagwood, 2015).
3.1 Research Strategy
Research Strategy is always considered and defined as the backbone of the research and it is
indicated that the research methodology needs to be selected according to the research project
being conducted as different strategies are more appropriate than others (Marean, et al., 2015).

33
During the analysis it is perceived that most common way of separating the methodology or the
research strategies are considered as quantitative and qualitative methods. It is considered that both
of these methods are targeting the different aspect of the research or research project (Newbert,
2007).
In the quantitative research, the problem is resolved through the analysis of numerical data or data.
The numerical data is transformed in to statistical data so that the results can be calculated.
However, that on the other side the qualitative method is utilized for the underlying reasons,
opinions, and motivations (McCusker & Gunaydin, 2015). During the analysis, the qualitative
method is mostly executed by the help of the secondary data. According to our analysis based on
the existing researches that selection of the right research methodology is defined as one of the
most critical problem. However, it is also indicated that we are able to find and select the right
methodology there is a high chance that the key problem associated with the thesis would be
resolved and the right solution can be drafted out.
It is highlighted and identified that in the aspect of this research work we have investigated the
effect of Total Quality Management on Bulky goods and has centered the focus on how to improve
the processes and to enhance the performance of the. Based on our researches (Jimenez-Jimenez,
Martinez-Costa, Martinez-Lorente, & Rabeh, 2015) (Jimenez-Jimenez, Martinez-Costa, Martinez-
Lorente, & Rabeh, 2015), there are different types of strategies that can fit best in order to simulate
or execute this research. In this research, the quantitative research method has been utilized as we
are going to focus on analyzing the impact of Total Quality Management on Bulky goods.
In several stages, in order to accurately calculate the effect, there is a need of statistical analysis
so that the correlation and the relationship between the variable can be defined and has been
discussion in the previous framework developed under the umbrella of this research. It has been
witnessed that there are different sorts of parameters that are involved overall in the context of this
research such as performances, Performance measurements, Performance Measurement systems
and many other.

34
In this research both primary and secondary data have been utilized so that the better results can
be sought and each parameter that is linked in the context of research can be measured and
assessed. We have collected the data from the company, as when TQM measures were not implied
as yet, and we intend to take a trace of the measure after the implementation of the approach as
well which would make us highlight the obvious changes. We would be able to identify and
analyze that key problems would the occurring or which are to be faced and to draft out the best
possible solutions to the identified problem areas as mentioned in (Sadikoglu & Olcay, 2014).
3.2 Research Process
Action research has been adopted in this research, due to the nature of it. As it is designed to work
on a current situation a company is indulged in. there are various types of processes that are
involved in the context of this research. This chapter explains how the various parts contribute to
the project and how they were performed.
3.2.1 Problem Statement
Problem Statement is defined as the initial phase of the research and in this phase, we have defined
and analyzed the key problem statement. In the problem definition there are different types of key
areas which comprise of Logistics, supply chain management, management of bulky goods, and
many areas that need to be improved. However, if these areas are improved through the
deployment of the TQM it can be considered that overall the performance have improved, and
better outcome can be obtained.
Based on the problem statement analysis it is identified that the company has been facing different
sort of problem within the context of supply chain management lifecycle. Based on the researches
(Boxall, Guthrie, & Paauwe, 2016) (Guerra-Santin & Tweed, 2015) through the integration of the
TQM and its related principle we have analysed that how the performance can be improved or
enhanced. During the analysis, it is analysed that the employees also need to work more but still
the KPI that overall has been set by the company has not been achieved.

35
3.2.2 Literature Analysis
Analysis of the literature is considered as one of the research phase in any context of research as
mentioned in (Kaynak, 2003). This is defined as the second phase of the research and in this phase,
there is detailed discussion in the perspective of existing literature that has has been carried out.
However, in the action research we have divided the phase into two more phases that are presented
as followed:
3.2.2.1 Review Concept and Theories
In this step we have analyzed the entire key concept and theories that are linked within the concept
of supply chain management, supply chain management lifecycle, Logistics, bulky goods and
many other. Through the execution of this phase we are able to analyse what are the key theories
and concepts are available for the research. According to our knowledge and understanding we
can develop the basic concept and the theories that we have needed in this research. However, it
is considered that if these theories are properly investigated there is a high chance that the problem
area of the organization would be eradicated due to implied approaches and mechanisms.
Based on our understanding and scenario we think that the most difficult part is the analysing the
existing solution that can helps us to sort out the problem supporting argument from (Boxall,
Guthrie, & Paauwe, 2016). It can be summarized that supply chain management is a large area and
it is witnessed that in order to find the best fit theory or solution, it takes ample amount of but still
it investigations are still longing to find something to conform to conform to. In the context of this
phase the basic as well as the advanced principles relating to total quality management have also
been reviewed.
3.2.2.2 Reviewing Previous Research Findings
Performance is always considered as most researched and debated topic (Su, Baird, & Schoch,
2015). There are different sort of researches (Psomas & Antony, 2015) (Tyanova, et al., 2016) that
are conducted to analyse and identify that how the performance can be improved in terms of an

36
organisation. However, there are different types of methods that are utilized for improving the
performance. In this phase we have carried out the discussion in terms of previous researches that
are conducted in scenarios of Logistics management, supply chain management, operations
management etc.
By the help of this phase we have pondered over the previous research findings. based on the
previous findings, we are on the verge of trying to draft out a solution where as it can address and
highlight the current problem that is being focused upon in the company in the context of the
effects of implementing Total Quality Management practices on bulky goods and analyzing the
performance of the production by decreasing the number of working hours of employees and other
key related parameters.
3.2.3 Theoretical Framework Model
There is a need for the investigation of variables, and for them to be analyzed in order to measure
and identify any sort of impact. To measure the effects of implementing Total Quality Management
practices on bulky goods there are different sort of parameters or variables that need to be
considered. In this phase based on the literature analysis we have developed the dependent and
independent variable that can be utilized to find out the effect of implementing Total Quality
Management practices on bulky goods. It is considered that the framework has been completely
developed on the structure of dependent and independent variable structure. According to our
analysis and understanding this is defined as one of the key phase and the theoretical framework
model for the research has been developed in the context of this research.
3.2.4 Hypothesis
To test and validate the framework, according to the key variables that are involved in the context
of this research we have formulated the hypothesis. In context of this phase the hypothesis are
formulated and testing can be carried out. Each of the variables that we have presented in context
of this research are inter-linked and associated with the key variable.

37
3.2.5 Research Design
The design of the research is one of the vital parts, interview and questionnaires would prove to
be quite useful according to the nature of the research. Through in-depth interview with the
supervising staff, e.g. production manager, many useful insights could be gained, and an outline
could be drafted out how to work with it once cross questioning is done. Questionnaires would
simply comply to the reactions of the respondents.
3.2.6 Data Collection
There are various techniques that can be utilized for the data collection and it is considered that if
the data collection is properly conducted there is a high probability that research quality can be
ensured. However, it is identified that in this phase we have used both, the primary and secondary
data for the collection (Orkin, 2014).
According to our understanding it is considered that if the data collection has been collected from
different productions that are working under the scenario of the company. It is considered that this
is the key phase and according to our understanding based on the existing researches (Guerra-
Santin & Tweed, 2015) (Krokhin, Ezzati, & Spicer, 2017) around about 30% of the project
lifecycle time has been simulated on the context of this research.
3.2.7 Data Analysis
Once the data is collection phase is completed, this phase is executed, and the data analysis has
been being carried out (Plesa & Dekker, 2015). (Lewis, 2015) Identified that there are different
types of analysis that can be utilized in context of this research. However, key analysis that have
been considered in context of this research work would be demography analysis, correlation
analysis, regression analysis and has also conducted some of the interview analysis technique that
would be aims at revealing themes, concepts and/or hypothesis. It is also considered and defined
as one of the key phase in the context of this research as mentioned in (Jirojwong, Johnson, &
Welch, 2014).

38
3.3 Ethical Consideration
Any research process cannot be well conducted and well concluded if the ethical code of conduct
during the process is not maintained. It has been considered that in the existing research, in the
practical domain, the complete focus had been laid on the maintaining of the ethical code of
conduct, in both, qualitative and quantitative means. In the quantitative aspect, we had adopted
and used the questionnaire instrument for the collection of the data. However, during the collection
of the data, focus had been laid on the maintaining of their confidential information, and every
participant and respondent had been ensured that their information will only be used for the
research purpose and wouldn’t be made a source of discussion in public by pinpointing anyone.
And moreover, before the filling of the questionnaire, it was focused and emphasized that the
consent of the participant was highly considered and deemed to be of immense importance for this
research.
The data collected through considering of the past researches and theories had been completely
considered that it is being well sourced and moreover, it was focused that the information collected
is not modified rather it is interpreted the way it was.
3.4 Action and Results
This can be denoted as one of the key phases of the research methodology and once the data
analysis phase is completed, this phase can be practically executed. Through the analysis, we have
analyzed and identified that what are the key problems that are faced by the company. Through
the execution of this phase, we have so far identified and analyzed the key aspects that need
improvement and have been transforming the input in to the outcome. The outcome has been
considered in the umbrella of results.
According to our analysis in the transformation process we have analyzed and identified the
continuous action process. Each of the productions that are linked within the context of this

39
research would be linked within the context of the prior production and based on the research the
following are the key actions that would be taken in account
1. Learning processes
2. Action Planning
3. Action Steps
It can be summarized that the feedback technique in the context of solution. So that we have the
loops and in accordance to analysis, by the help of loopback technique that changing in the
organization or the company where this solution would be improved can be obtained. This research
strategy overall has provide us the positive results and in accordance to analysis by help of this
strategy the problem and the other issues that has been identified by the company easily be
resolved. In the next section the detail discussion in context of data collection and the data analysis
technique has been presented.
3.5 Data Collection and Analysis
According to (Jirojwong, Johnson, & Welch, 2014) there are numerous types of different tools and
techniques that can be utilized for quantitative and qualitative methods such as questionnaires,
interviews, focus groups and observations. In this research we have used the qualitative data and
the selective methods that have been utilized for the collection are questionnaires and interviews.
There are different productions that are working under the umbrella of the company and most of
the productions are linked within the context of supply chain management. Interviews are
considered a useful method and might deliver data that is not available or found in performance
records (Tyanova, et al., 2016). However, on the other side the questionnaires have helped in
finding the key results and information that are linked in context of different productions that are
to some extent linked within the context of Bulky goods. By the help of this research, we are able
to analyse the effect of Total Quality Management on Bulky goods.

40
Communication is defined as the key barrier, while during investigation is being held it is
considered that proper communication and collaboration between the key stakeholders and the
department of the company needs to be focused upon. So, it can be considered that if the proper
communication is established there is a high probability that we would able to collect the right
data. Most of the interviews that have been conducted in the context of this research are semi
structured and the key purpose of conducting the interview is to find out the problem that is faced
by the production, and what do they think the cure of it could be, and how to make it better?
The questionnaires have been distributed between the employees that are working in different
productions. It is detected that questionnaires have helped us to measure the impact of each
variable that have been considered so far. To some extent it can be considered and highlighted that
if these questionnaires and interviews are properly held, better results can be obtained.
Interview Questionnaire
Semi Structured
Analyzing what are the key problems and
issues that are current faced within the context
of the company. All the questions have been
based in accordance to analyze the effect of
Total Quality Management on Bulky goods
1. All the questions have been developed
according to the framework
2. Sample Technique
a. purposive Sampling
3. Sample Size
a. 20
3.5.1 Data Analysis
The key aim of the data analysis it is to test the framework. The data collection and the analysis
were planned in regard to the different steps in the framework. It is considered that if the proper
technique is applied, there is a high chance that we would be able to analyses the key effect of the
effect of total quality management on bulky goods.

41
All the data that has been collected from the questionnaire is processed, and the process is
performed through the utilization of the Microsoft excel and SPSS. The key tests that have been
applied on the data perceived from the questionnaires are demography analysis, correlation
analysis, regression analysis and have integrated some of the interview analysis technique that
aims at revealing themes, concepts and/or hypothesis.
There are three key qualitative data analysis that are considered in context of this research
including data reduction’, data display, and ‘conclusion drawing or verification’ as mentioned in
(Ghauri & Gronhaug, 2005). In the table below, the key phases considered and executed during
the analysis.
Data
Reduction
During the conduction of interviews and the handing out of questionnaires
there are different parameters that we have collected. Some of the data needs
to be refined so that the accuracy of the data can be improved. However, this
is overall a time-consuming phase and in the context of this phase we have
analyzed the reducing and refining of the collected data.
Data display In this phase of the data, we have performed the analysis and through the help
of the chart and graph the collected data is represented.
Conclusion
drawing or
verification
This phase is based on the data display, while the analysis is presented which
caters for the analysis of the conclusion. We have performed the verification in
this phase.
In the end it can be summarized that in the next chapter we have followed the above-mentioned
phases for this research. Based on the above phase the key outcome can be extracted and we have
proposed the solution to sort out these problems.

42
3.6 Research Quality Verification
Research Quality Verification is one of the most complex tasks and the research quality must be
verified (Ghauri & Gronhaug, 2005). It is identified that in context of this research (Rennie &
Frommer, 2015) two quality verifications are brought under consideration, which are Reliability
and Validity. This section presents the detailed discussion within the perspective that how actually
the research quality verification is carried out.
3.6.1 Validity
According to Yin (2014) it is identified that the validity has been divided into three categories
which comprise of, internal, external and construct validity. However, based on the existing
researches (Gulati & Sytch, 2008) (Newbert, 2007)in context of this research we have considered
the Cronbach's alpha that is utilized to measure the internal consistency. The test of Cronbach's
alpha is conducted, and the key results of the test are identified as below:
Reliability Statistics
Cronbach's Alpha N of Items
0.75 10
Table 3-1 Reliability Statistics
3.6.2 Reliability
Reliability carries high importance. It is considered that to increase the performance, past key
researches that are conducted within the context of same domain are conducted. However, through
these researches, we have designed and developed the research framework model. However, in the
context of this research we have considered the researches that have been conducted with the time
span of last ten years and are published in recognized journal or conferences.

43
CHAPTER 4: DATA ANALYSIS
1.4 Frequency Analysis
Some of the important frequency analysis is to determine and regulate the impact of total quality
management and organization performance is assumed below:
Gender
Figure 4-1 Gender
Frequency Percent Valid Percent Cumulative Percent
Valid Male 20 100.0 100.0 100.0
Table 4-1 Gender
The result of gender is playing an active role for analyzing the real image of total quality
management that lead towards organizational performance. The result shows that male
contribution for conduction of this study is 100%.

44
Age
Figure 4-2 Age
Frequency Percent Valid Percent Cumulative Percent
Valid 17-25 4 20.0 20.0 20.0
26-34 14 70.0 70.0 90.0
35-44 2 10.0 10.0 100.0
Total 20 100.0 100.0
Table 4-2 Age
Age is a vital demographic information about the respondents. In accordance to the results, it has
been critically considered that age is composed of various components. These age components are
in procedural of 17 to 25 years having a percentage of 20%, 26 to 34 years having a percentage of
70%, 35 to 44 years having a percentage of 10% participated for conduction of the study.

45
Job Position
Figure 4-3 Job Position
Frequency Percent Valid Percent Cumulative
Percent
Valid Manager 1 5.0 5.0 5.0
Team leader 1 5.0 5.0 10.0
Coordinator 3 15.0 15.0 25.0
Crew member 15 75.0 75.0 100.0
Total 20 100.0 100.0
Table 4-3 Job Position
Job position is an important demographic information about the respondents. In accordance to the
results, it has been critically considered that job position is composed of various components.
These job position components are in procedural of manager having percentage of 5%, team leader
having a percentage of 5%, Coordinators having a percentage of 15% and crew members having
a percentage of 75% participated for conduction of the study.

46
Production
Figure 4-4 Production
Frequency Percent Valid Percent Cumulative
Percent
Valid Bulky goods 4 20.0 20.0 20.0
White away 3 15.0 15.0 35.0
City mail 3 15.0 15.0 50.0
Other productions 10 50.0 50.0 100.0
Total 20 100.0 100.0
Table 4-4 Production

47
Since all the productions and their process somehow coincide, they tend to play an active role for
determining the company’s quality-oriented services in market to meet consumer obligations. In
accordance to the results, it has been critically considered that production is composed of various
components. These production components are in procedural of Bulky goods having a percentage
of 20%, white away having a percentage of 15%, City mail having a percentage of 15% and other
productions having a percentage of 50% participated for conduction of the study.
Top management (senior executives and supervisors) view improvement in service quality leading to
increase profits
Figure 4-5 Top management (senior executives and supervisors) view improvement in service quality leading to
increase profits
Frequency Percent Valid Percent Cumulative
Percent
Valid Strongly Agree(SA) 11 55.0 55.0 55.0
Agree (A) 6 30.0 30.0 85.0
Neutral (N) 3 15.0 15.0 100.0
Total 20 100.0 100.0
Table 4-5 Top management (senior executives and supervisors) view improvement in service quality leading to increase
profits

48
The result shows that top management (senior executives and supervisors) view improvement in
service quality leading to increase profits is composed of various components. These result
components are in procedural of strongly agree having a percentage of 55%, agree having a
percentage of 30%, and neutral having a percentage of 15% participated for conduction of the
study.
top management has objectives for quality performance
Figure 4-6 top management has objectives for quality performance
Frequency Percent Valid Percent Cumulative
Percent
Valid Strongly Agree(SA) 4 20.0 20.0 20.0
Agree (A) 15 75.0 75.0 95.0
Neutral (N) 1 5.0 5.0 100.0
Total 20 100.0 100.0
Table 4-6 top management has objectives for quality performance
The result shows that top management have objectives for quality performance is composed of
various components. These result components are in procedural of strongly agree having a

49
percentage of 20%, agree having a percentage of 75%, and neutral having a percentage of 5%
participated for conduction of the study.

50
top management evaluates organizational performance through provision of quality services
Figure 4-7 top management evaluates organizational performance through provision of quality services
Frequency Percent Valid Percent Cumulative
Percent
Valid Strongly Agree(SA) 4 20.0 20.0 20.0
Agree (A) 14 70.0 70.0 90.0
Neutral (N) 2 10.0 10.0 100.0
Total 20 100.0 100.0
Table 4-7 top management evaluates organizational performance through provision of quality services
The result shows that top management evaluates organizational performance through provision of
quality services is composed of various components. These result components are in procedural of
strongly agree having a percentage of 20%, agree having a percentage of 70%, and neutral having
a percentage of 10% participated for conduction of the study.

51
TQM assists in alignment of company’s goals as well as individual goals
Figure 4-8 TQM assists in alignment of company’s goals as well as individual goals
Frequency Percent Valid Percent Cumulative
Percent
Valid Strongly Agree(SA) 4 20.0 20.0 20.0
Agree (A) 11 55.0 55.0 75.0
Neutral (N) 5 25.0 25.0 100.0
Total 20 100.0 100.0
Table 4-8 TQM assists in alignment of company’s goals as well as individual goals
The result shows that TQM assists in alignment of company’s goals as well as individual goals are
composed of various components. These result components are in procedural of strongly agree
having a percentage of 20%, agree having a percentage of 55%, and neutral having a percentage
of 25% participated for conduction of the study.

52
There is an uplift in the stature of the organization and the morale of employees through quality
measures
Figure 4-9 There is an uplift in the stature of the organization and the morale of employees through quality measures
Frequency Percent Valid Percent Cumulative
Percent
Valid Strongly Agree(SA) 10 50.0 50.0 50.0
Agree (A) 10 50.0 50.0 100.0
Total 20 100.0 100.0
Table 4-9 There is an uplift in the stature of the organization and the morale of employees through quality measures
The result shows that there is uplift in the stature of the organization and the morale of employees
through quality measures are composed of various components. These result components are in
procedural of strongly agree having a percentage of 50% and agree having a percentage of 50%
participated for conduction of the study.

53
In case of deviances in processes, solutions are drafted out in the best feasible way
Figure 4-10 In case of deviances in processes, solutions are drafted out in the best feasible way
Frequency Percent Valid Percent Cumulative
Percent
Valid Strongly Agree(SA) 8 40.0 40.0 40.0
Agree (A) 11 55.0 55.0 95.0
Neutral (N) 1 5.0 5.0 100.0
Total 20 100.0 100.0
Table 4-10 In case of deviances in processes, solutions are drafted out in the best feasible way
The result shows that are in case of deviances in processes, solutions are drafted out in the best
feasible way are composed of various components. These result components are in procedural of
strongly agree having a percentage of 40%, agree having a percentage of 55% and neutral having
a percentage of 5% participated for conduction of the study.

54
Uncertainty avoidance measures are taken into consideration
Figure 4-11 Uncertainty avoidance measures are taken into consideration
Frequency Percent Valid Percent Cumulative
Percent
Valid Strongly Agree(SA) 3 15.0 15.0 15.0
Agree (A) 13 65.0 65.0 80.0
Neutral (N) 4 20.0 20.0 100.0
Total 20 100.0 100.0
Table 4-11 Uncertainty avoidance measures are taken into consideration
The result shows that are in case of uncertainty avoidance measures are taken into consideration
are composed of various components. These result components are in procedural of strongly agree
having a percentage of 15%, agree having a percentage of 65% and neutral having a percentage of
20% participated for conduction of the study.

55
With the provision of precise and concise information, the best result could be extracted
Figure 4-12 With the provision of precise and concise information, the best result could be extracted
Frequency Percent Valid Percent Cumulative
Percent
Valid Strongly Agree(SA) 9 45.0 45.0 45.0
Agree (A) 8 40.0 40.0 85.0
Neutral (N) 3 15.0 15.0 100.0
Total 20 100.0 100.0
Table 4-12 With the provision of precise and concise information, the best result could be extracted
The result shows that are with the provision of precise and concise information, the best result
could be extracted are composed of various components. These result components are in
procedural of strongly agree having a percentage of 45%, agree having a percentage of 40% and
neutral having a percentage of 15% participated for conduction of the study.

56
The Supply Chain Management is completely based on the integration of quality-based processes
Figure 4-13 The Supply Chain Management is completely based on the integration of quality-based processes
Frequency Percent Valid Percent Cumulative
Percent
Valid Strongly Agree(SA) 6 30.0 30.0 30.0
Agree (A) 9 45.0 45.0 75.0
Neutral (N) 5 25.0 25.0 100.0
Total 20 100.0 100.0
Table 4-13 The Supply Chain Management is completely based on the integration of quality-based processes
The result shows that are the supply chain management is completely based on the integration of
quality-based processes are composed of various components. These result components are in
procedural of strongly agree having a percentage of 30%, agree having a percentage of 45% and
neutral having a percentage of 25% participated for conduction of the study.

57
The clients have an effective system to ensure quality of the services
Figure 4-14 The clients have an effective system to ensure quality of the services
Frequency Percent Valid Percent Cumulative
Percent
Valid Strongly Agree(SA) 6 30.0 30.0 30.0
Agree (A) 8 40.0 40.0 70.0
Neutral (N) 3 15.0 15.0 85.0
Disagree (D) 3 15.0 15.0 100.0
Total 20 100.0 100.0
Table 4-14 The clients have an effective system to ensure quality of the services
The result shows that the clients have an effective system to ensure quality of the services is
composed of various components. These result components are in procedural of strongly agree
having a percentage of 30%, agree having a percentage of 40%, neutral having a percentage of
15% and disagree having a percentage of 15% participated for conduction of the study.

58
We emphasize on quality and delivery performance rather than price in selecting clients
Figure 4-15 We emphasize on quality and delivery performance rather than price in selecting clients
Frequency Percent Valid Percent Cumulative
Percent
Valid Strongly Agree(SA) 11 55.0 55.0 55.0
Agree (A) 6 30.0 30.0 85.0
Neutral (N) 3 15.0 15.0 100.0
Total 20 100.0 100.0
Table 4-15 We emphasize on quality and delivery performance rather than price in selecting clients
The result shows that we emphasize on quality and delivery performance rather than price in
selecting clients is composed of various components. These result components are in procedural
of strongly agree having a percentage of 55%, agree having a percentage of 30% and neutral having
a percentage of 15% participated for conduction of the study.

59
The clients are involved in our quality training
Figure 4-16 The clients are involved in our quality training
Frequency Percent Valid Percent Cumulative
Percent
Valid Strongly Agree(SA) 3 15.0 15.0 15.0
Agree (A) 11 55.0 55.0 70.0
Neutral (N) 4 20.0 20.0 90.0
Disagree (D) 2 10.0 10.0 100.0
Total 20 100.0 100.0
Table 4-16 The clients are involved in our quality training
The result shows that clients are involved in our quality training is composed of various
components. These result components are in procedural of strongly agree having a percentage of
15%, agree having a percentage of 55%, neutral having a percentage of 20% and disagree having
a percentage of 10% participated for conduction of the study.

60
We work closely with clients to improve each other’s processes
Figure 4-17 We work closely with clients to improve each other’s processes
Frequency Percent Valid Percent Cumulative
Percent
Valid Strongly Agree(SA) 5 25.0 25.0 25.0
Agree (A) 10 50.0 50.0 75.0
Neutral (N) 4 20.0 20.0 95.0
Disagree (D) 1 5.0 5.0 100.0
Total 20 100.0 100.0
Table 4-17 We work closely with clients to improve each other’s processes
The result shows that we work closely with clients to improve each other’s processes is composed
of various components. These result components are in procedural of strongly agree having a
percentage of 25%, agree having a percentage of 50%, neutral having a percentage of 20% and
disagree having a percentage of 5% participated for conduction of the study.

61
the clients are actively involved in our new product development process
Figure 4-18 the clients are actively involved in our new product development process
Frequency Percent Valid Percent Cumulative
Percent
Valid Strongly Agree(SA) 7 35.0 35.0 35.0
Agree (A) 6 30.0 30.0 65.0
Neutral (N) 5 25.0 25.0 90.0
Disagree (D) 2 10.0 10.0 100.0
Total 20 100.0 100.0
Table 4-18 the clients are actively involved in our new product development process
The result shows that the clients are actively involved in our new product development process is
composed of various components. These result components are in procedural of strongly agree
having a percentage of 35%, agree having a percentage of 30%, neutral having a percentage of
25% and disagree having a percentage of 10% participated for conduction of the study.

62
Employee involvement and suggestions are highly valued and taken under consideration, as they have a
closer look with the hand held operations
Figure 4-19 Employee involvement and suggestions are highly valued and taken under consideration, as they have a
closer look with the hand held operations
Frequency Percent Valid Percent Cumulative
Percent
Valid Strongly Agree(SA) 10 50.0 50.0 50.0
Agree (A) 8 40.0 40.0 90.0
Neutral (N) 2 10.0 10.0 100.0
Total 20 100.0 100.0
Table 4-19 Employee involvement and suggestions are highly valued and taken under consideration, as they have a closer
look with the hand held operations
The result shows that employee involvement and suggestions are highly valued and taken under
consideration, as they have a closer look with the hand-held operations is composed of various
components. These result components are in procedural of strongly agree having a percentage of

63
50%, agree having a percentage of 40% and neutral having a percentage of 10% participated for
conduction of the study.

64
Quality and Reliability of our services are high
Figure 4-20 Quality and Reliability of our services are high
Frequency Percent Valid Percent Cumulative
Percent
Valid Strongly Agree(SA) 12 60.0 60.0 60.0
Agree (A) 5 25.0 25.0 85.0
Neutral (N) 3 15.0 15.0 100.0
Total 20 100.0 100.0
Table 4-20 Quality and Reliability of our services are high
The result shows that quality and reliability of our services are high is composed of various
components. These result components are in procedural of strongly agree having a percentage of
60%, agree having a percentage of 25% and neutral having a percentage of 15% participated for
conduction of the study.

65
There is increased transparency in the communication amongst productions
Figure 4-21 There is increased transparency in the communication amongst productions
Frequency Percent Valid Percent Cumulative
Percent
Valid Strongly Agree(SA) 5 25.0 25.0 25.0
Agree (A) 12 60.0 60.0 85.0
Neutral (N) 3 15.0 15.0 100.0
Total 20 100.0 100.0
Table 4-21 There is increased transparency in the communication amongst productions
The result shows that there is increased transparency in the communication amongst productions
is composed of various components. These result components are in procedural of strongly agree
having a percentage of 25%, agree having a percentage of 60% and neutral having a percentage of
15% participated for conduction of the study.

66
We deliver our services on time to customers
Figure 4-22 We deliver our services on time to customers
Frequency Percent Valid Percent Cumulative
Percent
Valid Strongly Agree(SA) 7 35.0 35.0 35.0
Agree (A) 11 55.0 55.0 90.0
Neutral (N) 2 10.0 10.0 100.0
Total 20 100.0 100.0
Table 4-22 We deliver our services on time to customers
The result shows that we deliver our services on time to customers is composed of various
components. These result components are in procedural of strongly agree having a percentage of
35%, agree having a percentage of 55% and neutral having a percentage of 10% participated for
conduction of the study.

67
We design processes in our firm to be “mistake-proof” to minimize the changes of errors
Figure 4-23 We design processes in our firm to be “mistake-proof” to minimize the changes of errors
Frequency Percent Valid Percent Cumulative
Percent
Valid Strongly Agree(SA) 7 35.0 35.0 35.0
Agree (A) 10 50.0 50.0 85.0
Neutral (N) 3 15.0 15.0 100.0
Total 20 100.0 100.0
Table 4-23 We design processes in our firm to be “mistake-proof” to minimize the changes of errors
The result shows that we design processes in our firm to be “mistake-proof” to minimize the
changes of errors is composed of various components. These result components are in procedural
of strongly agree having a percentage of 35%, agree having a percentage of 50% and neutral having
a percentage of 15% participated for conduction of the study.

68
We make extensive use of statistical techniques to reduce variation in processes
Figure 4-24 We make extensive use of statistical techniques to reduce variation in processes
Frequency Percent Valid Percent Cumulative
Percent
Valid Strongly Agree(SA) 6 30.0 30.0 30.0
Agree (A) 11 55.0 55.0 85.0
Neutral (N) 3 15.0 15.0 100.0
Total 20 100.0 100.0
Table 4-24 We make extensive use of statistical techniques to reduce variation in processes
The result shows that we make extensive use of statistical techniques to reduce variation in
processes is composed of various components. These result components are in procedural of
strongly agree having a percentage of 30%, agree having a percentage of 55% and neutral having
a percentage of 15% participated for conduction of the study.

69
We give clear, comprehensive, and standardized documentations and instructions about work methods
and process instructions to employees
Figure 4-25 We give clear, comprehensive, and standardized documentations and instructions about work methods
and process instructions to employees
Frequency Percent Valid Percent Cumulative
Percent
Valid Strongly Agree(SA) 11 55.0 55.0 55.0
Agree (A) 6 30.0 30.0 85.0
Neutral (N) 2 10.0 10.0 95.0
Strongly Disagree(SD) 1 5.0 5.0 100.0
Total 20 100.0 100.0
Table 4-25 We give clear, comprehensive, and standardized documentations and instructions about work methods and
process instructions to employees
The result shows that we give clear, comprehensive, and standardized documentations and
instructions about work methods and process instructions to employees is composed of various
components. These result components are in procedural of strongly agree having a percentage of

70
55%, agree having a percentage of 30%, neutral having a percentage of 10% and strongly disagree
having a percentage of 5% participated for conduction of the study.

71
Crew members have the right to contribute to the think tank, in order to achieve continuous improvement
Figure 4-26 Crew members have the right to contribute to the think tank, in order to achieve continuous improvement
Frequency Percent Valid Percent Cumulative
Percent
Valid Strongly Agree(SA) 13 65.0 65.0 65.0
Agree (A) 6 30.0 30.0 95.0
Neutral (N) 1 5.0 5.0 100.0
Total 20 100.0 100.0
Table 4-26 Crew members have the right to contribute to the think tank, in order to achieve continuous improvement
The result shows that crew members have the right to contribute to the think tank; in order to
achieve continuous improvement s is composed of various components. These result components
are in procedural of strongly agree having a percentage of 65%, agree having a percentage of 30%,
and neutral having a percentage of 5% participated for conduction of the study.

72
the firm has an effective performance measurement system to track overall organizational performance
Figure 4-27 the firm has an effective performance measurement system to track overall organizational performance
Frequency Percent Valid Percent Cumulative
Percent
Valid Strongly Agree(SA) 8 40.0 40.0 40.0
Agree (A) 7 35.0 35.0 75.0
Neutral (N) 5 25.0 25.0 100.0
Total 20 100.0 100.0
Table 4-27 the firm has an effective performance measurement system to track overall organizational performance
The result shows that the firm has an effective performance measurement system to track overall
organizational performance is composed of various components. These result components are in
procedural of strongly agree having a percentage of 40%, agree having a percentage of 35%, and
neutral having a percentage of 25% participated for conduction of the study.

73
Quality data (error rates, defect rates, scrap, defects, rework rates, cost of quality, etc.) are available
Figure 4-28 Quality data (error rates, defect rates, scrap, defects, rework rates, cost of quality, etc.) are available
Frequency Percent Valid Percent Cumulative
Percent
Valid Strongly Agree(SA) 2 10.0 10.0 10.0
Agree (A) 10 50.0 50.0 60.0
Neutral (N) 7 35.0 35.0 95.0
Disagree (D) 1 5.0 5.0 100.0
Total 20 100.0 100.0
Table 4-28 Quality data (error rates, defect rates, scrap, defects, rework rates, cost of quality, etc.) are available
The result shows that quality data (error rates, defect rates, scrap, defects, rework rates, cost of
quality, etc.) are available is composed of various components. These result components are in
procedural of strongly agree having a percentage of 10%, agree having a percentage of 50%,
neutral having percentage of 35% and disagree having a percentage of 5% participated for
conduction of the study.

74
Timely firm performance data is always available
Figure 4-29 Timely firm performance data is always available
Frequency Percent Valid Percent Cumulative
Percent
Valid Strongly Agree(SA) 2 10.0 10.0 10.0
Agree (A) 10 50.0 50.0 60.0
Neutral (N) 8 40.0 40.0 100.0
Total 20 100.0 100.0
Table 4-29 Timely firm performance data is always available
The result shows that timely firm performance data is always available is composed of various
components. These result components are in procedural of strongly agree having a percentage of
10%, agree having a percentage of 50% and neutral having percentage of 40% participated for
conduction of the study.

75
Quality of the products and services enhances the organizational performance, as it leads towards
strengthening the relationship with the client
Figure 4-30 Quality of the products and services enhances the organizational performance, as it leads towards
strengthening the relationship with the client
Frequency Percent Valid Percent Cumulative
Percent
Valid Strongly Agree(SA) 8 40.0 40.0 40.0
Agree (A) 7 35.0 35.0 75.0
Neutral (N) 5 25.0 25.0 100.0
Total 20 100.0 100.0
Table 4-30 Quality of the products and services enhances the organizational performance, as it leads towards strengthening
the relationship with the client
The result shows that quality of the products and services enhances the organizational
performance, as it leads towards strengthening the relationship with the client is composed of
various components. These result components are in procedural of strongly agree having a
percentage of 40%, agree having a percentage of 35% and neutral having a percentage of 25%
participated for conduction of the study.

76
Implementation of total quality management enhances the organizational performance.
Figure 4-31 Implementation of total quality management enhances the organizational performance
Frequency Percent Valid Percent Cumulative
Percent
Valid Strongly Agree(SA) 5 25.0 25.0 25.0
Agree (A) 13 65.0 65.0 90.0
Neutral (N) 2 10.0 10.0 100.0
Total 20 100.0 100.0
Table 4-31 Implementation of total quality management enhances the organizational performance
The result shows that Implementation of total quality management enhances the organizational
performance is composed of various components. These result components are in procedural of
strongly agree having a percentage of 25%, agree having a percentage of 65% and neutral having
percentage of 10% participated for conduction of the study.

77
Due to quality circle processes are aligned in a better manner
Figure 4-32 Due to quality circle processes are aligned in a better manner
Frequency Percent Valid Percent Cumulative
Percent
Valid Strongly Agree(SA) 9 45.0 45.0 45.0
Agree (A) 7 35.0 35.0 80.0
Neutral (N) 4 20.0 20.0 100.0
Total 20 100.0 100.0
Table 4-32 Due to quality circle processes are aligned in a better manner
The result shows that Due to quality circle processes are aligned in a better manner is composed
of various components. These result components are in procedural of strongly agree having a
percentage of 45%, agree having a percentage of 35% and neutral having a percentage of 20%
participated for conduction of the study.

78
There is increased accuracy of the information which is processed and circulated through the
productions due to the implementation
Figure 4-33 There is increased accuracy of the information which is processed and circulated through the productions
due to the implementation
Frequency Percent Valid Percent Cumulative
Percent
Valid Strongly Agree(SA) 9 45.0 45.0 45.0
Agree (A) 9 45.0 45.0 90.0
Neutral (N) 1 5.0 5.0 95.0
Disagree (D) 1 5.0 5.0 100.0
Total 20 100.0 100.0
Table 4-33 There is increased accuracy of the information which is processed and circulated through the productions due
to the implementation
The result shows that there is increased accuracy of the information which is processed and
circulated through the productions due to the implementation is composed of various components.
These result components are in procedural of strongly agree having a percentage of 45%, agree

79
having a percentage of 45% and natural having a percentage of 5% and disagree having percentage
of 5% participated for conduction of the study.
1.5 Approach Analysis
Finding out the best fit approach is always considered as the complex and time-consuming process.
During the analysis it is observed that there are different types of techniques that have been
suggested to respond to the problem. There are different sorts of parameters that are associated
within the context of this researches and in the aspect of this approach and its measurement we
considered the sending’s, labor hours and KPI (key performance indicator). Based on our analysis
and understanding this considered as one of the most complex task to find out that which of the
methodology or approach fit best in responding to the problem. In this section of the effect of TQM
on bulky goods, the comparison and the response time of the approaches that we utilized in the
company have been presented.
Figure 4-34 Before Deployment
In the figure above, you can witness that the labor hours are ranging from 20-30 hours, whereas
the waybills are ranging from 115 to 115 at an average, whereas the KPI as an outcome results
around 5.5 to 6.5. In the context of the proposed scenario we considered five days of the proposed

80
solution and the current deployed solution. During the analysis it is observed that three of the
parameters has been considered and based on the real-time results it is observed that overall the
improvement has been set in the context of the system. During the analysis it is indicated that the
key parameters that are overall improved in the context of this research work are sending, labor
hours and KPI (key performance indicator.
Jan-18 Sending’s/waybills Labor Hours KPI
15th-Jan 116 20.25 5.7
16th-Jan 140 26 5.3
17th-Jan 137 25 5.5
18th-Jan 145 22.5 6.4
19th-Jan 147 22.45 6.5
Figure 4-35 After Deployment
As you can witness the figure above, which is after the implementation of TQM, it can be easily
identified that the labour hours have been brought down to as low as 8 hours, with a maximum of
9 hours, the number of waybills averaging between 145 and 155, and comes with a resultant of
KPI averaging between 15-19.5. its not hard to notice that the KPI has been shooting high due to
less number of labour hours that are deployed for the production. This is a very noticeable and

81
positive change, as the goal KPI set by the management for bulky goods is 12, and it is over
achieving after the implementation of TQM.
Jan-18 Sending’s/waybills Labor Hours KPI
22th-Jan 146 8.5 17.1
23th-Jan 152 10 15.2
24th-Jan 138 9.5 14.5
25th-Jan 158 9.5 16.6
26th-Jan 155 8 19.375
Figure 4-36 Customer Sendings Analysis
It is indicated that the analysis has been carried out in the context of the proposed solution and
through the help of the analysis the comparison between the Customer Sendings Analysis before
and after the deployment of the system or methodology. This graphical presentation shows the
number of customer sendings before and after the deployment. The number of sendings has slightly
increased as you can see, but as predicted by the management they were supposed to reach up to
250-350, however that was a tentative count. But, certainly a positive change is easily identifiable.
Sendings (Before Deployment) Sendings (After Deployment)
116 146
140 152

82
137 138
145 158
147 155 Table 4-34 Sending
Figure 4-37 Labour Hours
It is indicated that the analysis has been carried out in the context of the proposed solution and
through the help of the analysis the comparison between the labor hours before and after the
deployment of the system.
After having a view at the figure above, it can be witnessed that the labor hours have dropped
considerably, which is one of the main reasons for the increase in KPI. Earlier there were three
people working full time, I.e. an eight-hour shift daily. But slight changes were brought to the
production lately according to need. The number of people deployed at bulky goods was decreased
to two, as another person wasn’t needed any longer as the processes were aligned in a manner.
Meanwhile, the second person wasn’t required anymore due to further changes in the processes
and only the coordinator of bulky goods, who has been working there for more than two years was
permanently deployed there and catered for everything himself. And the outcome is quite visible,
the KPI is way higher than the desired goal.

83
Currently there is only one person working at bulky goods, as per the earlier SOP, bulky goods
can be allotted with personnel from parcel i.e. south side. So, the manager is making a good
utilization of resources, and having one person helping the coordinator making things go smoother
and more convenient for the production.
Labor Hours (Before Deployment) Labor Hours (After Deployment)
20.25 8.5
26 10
25 9.5
22.5 9.5
22.45 8 Table 4-35 Labor Hours
It is indicated that the analysis has been carried out in the context of the proposed solution and
through the help of the analysis the comparison between the KPI before and after the deployment
of the system.
Figure 4-38 KPI
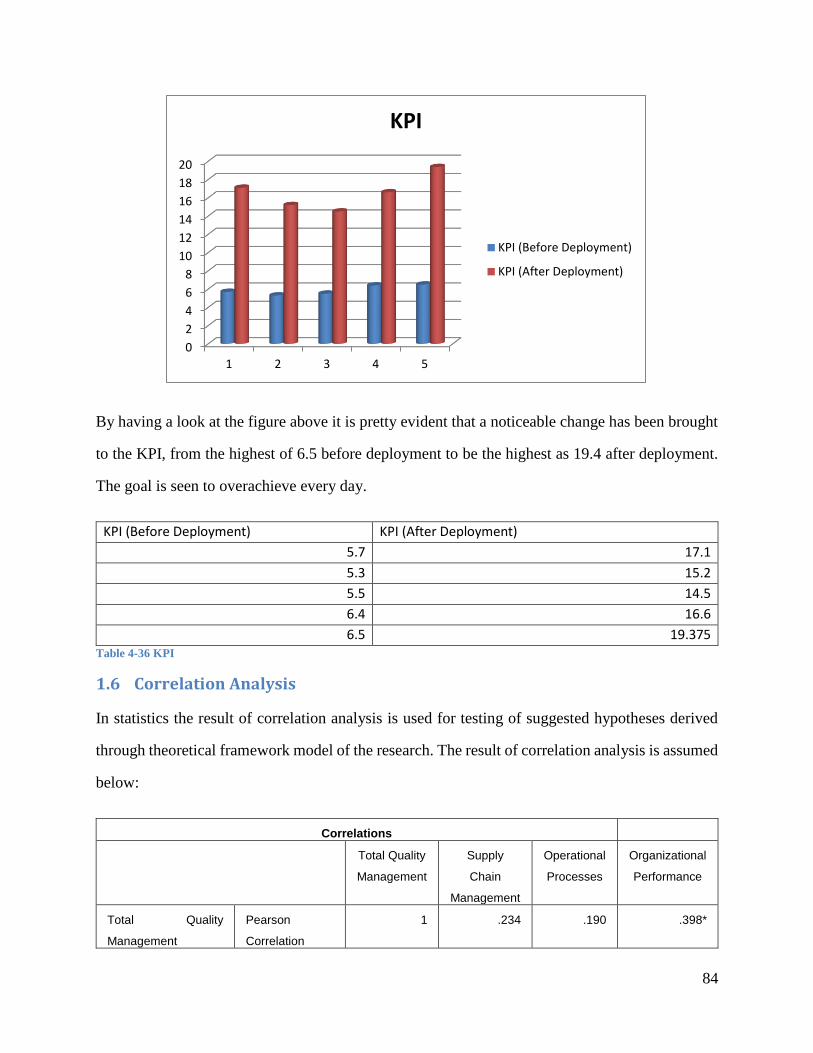
84
By having a look at the figure above it is pretty evident that a noticeable change has been brought
to the KPI, from the highest of 6.5 before deployment to be the highest as 19.4 after deployment.
The goal is seen to overachieve every day.
KPI (Before Deployment) KPI (After Deployment)
5.7 17.1
5.3 15.2
5.5 14.5
6.4 16.6
6.5 19.375 Table 4-36 KPI
1.6 Correlation Analysis
In statistics the result of correlation analysis is used for testing of suggested hypotheses derived
through theoretical framework model of the research. The result of correlation analysis is assumed
below:
Correlations
Total Quality
Management
Supply
Chain
Management
Operational
Processes
Organizational
Performance
Total Quality
Management
Pearson
Correlation
1 .234 .190 .398*
0
2
4
6
8
10
12
14
16
18
20
1 2 3 4 5
KPI
KPI (Before Deployment)
KPI (After Deployment)

85
Sig. (2-tailed) .321 .422 .000
N 20 20 20 20
Supply Chain
Management
Pearson
Correlation
.234 1 .537* .323**
Sig. (2-tailed) .321 .015 .000
N 20 20 20 20
Operational
Processes
Pearson
Correlation
.190 .537* 1 .215*
Sig. (2-tailed) .422 .015 .363
N 20 20 20 20
Organizational
Performance
Pearson
Correlation
.398* .323** .215* 1
Sig. (2-tailed) .000 .000 .000
N 20 20 20 20
*. Correlation is significant at the 0.05 level (2-tailed).
Table 4-37 Correlations
The key operative function activity of correlation analysis is used for testing of suggested
hypotheses derived by research model. First research hypothesis is about total quality management
which is positively associated with organizational performance. Correlation value of total quality
management and organizational performance is .398*, which shows a positive relationship, level
of significance is .000 and sample size n is 20.
Second research hypothesis is about supply chain management is positively associated with
organizational performance. Correlation value of supply chain management and organizational
performance is .323**, shows positive relationship, level of significance is .000 and sample size n
is 20.
Third research hypothesis is about operational process is positively associated with organizational
performance. Correlation value of operational process and organizational performance is .215*,
shows a positive relationship, level of significance is .000 and sample size n is 20. Hence, these
all hypotheses are approved and support research framework model of the study.

86
1.7 Regression Analysis
Regression analysis is recognized as the duration of statistical. Regression analysis plays a vital
role for the regulation and examining the impact of all the independent variables on dependent
variable. The result of regression analysis model is as follows:
Model Summary
Model R R Square Adjusted R Square Std. Error of the
Estimate
1 .375a .141 -.021 .82596
a. Predictors: (Constant), Operational Processes, Total Quality Management, Supply Chain Management
b. Dependent Variable: Organizational Performance
Table 4-38 Model Summary
The key predictors of model summary are in procedural of operational processes, total quality
management and supply chain management that leads towards organizational performance. In
accordance to the results, it has been critically considered that regression is denoted by R i-e
37.5%, the value of R square is 14.1%, Adjusted R square is 2.1% and the standard error of
estimation is .82596. Hence these values are considered as good for further proceeding of the
study. The result of ANOVA analysis is assumed below:
ANOVAb
Model Sum of Squares df Mean Square F Sig.
1 Regression 1.785 3 .595 8.72 .000a
Residual 10.915 16 .682
Total 12.700 19
a. Predictors: (Constant), Operational Processes, Total Quality Management, Supply Chain Management
b. Dependent Variable: Organizational Performance
Table 4-39 Model Summary
The operative function activities of ANOVA analysis are to examine the variance in research
model by using frequency analysis. In accordance to the results, it has been analyzed that frequency
is denoted by F I-e 8.72% shows variance in the model, and the level of significance is .000. Further
details of this table are associated with the values of regression and residual evaluated in terms of
sum of squares and df i-e (1.785,10.915 and 3, 16), and the value of mean square is (.595 and

87
.682). Hence these values are considered as good for further proceeding of the study. The result of
coefficient analysis is assumed below:
Coefficients
Model Unstandardized
Coefficients
Standardized
Coefficients
Beta
T Sig.
B Std. Error 2.830 .012
1 (Constant) 2.380 .841 .792 .000
Total Quality
Management
.197 .249 .189 1.176 .000
Supply Chain
Management
.228 .194 .327 .273 .000
Operational
Processes
.056 .206 .075 2.830 .000
Table 4-40 Coefficients
The result of coefficient analysis is derived by using multiple regression analysis model. The key
operative function activity of coefficient analysis is to examine the best predictors from research
model. This coefficient analysis is composed of two key aspects. These key aspects are in
procedural of unstandardized coefficient and standardized coefficient. For finding best predictor
from research model, we use standardized coefficient associated with beta value. The result shows
that first best predictor is supply chain management, having a beta value of .327, second predictor
is total quality management, having a beta value of .189, level of significant is .000 and third
predicator is operational process having beta value is .075, level of significance is .000. Hence
these values are considered as good for further proceeding of the study. The result of residual
statistics is assumed below:

88
Residuals Statistics
Minimum Maximum Mean Std. Deviation N
Predicted Value 2.1569 3.3617 2.7000 .30647 20
Std. Predicted Value -1.772 2.159 .000 1.000 20
Standard Error of Predicted
Value
.200 .547 .355 .106 20
Adjusted Predicted Value 2.0947 3.7659 2.7611 .41424 20
Residual -1.39747 1.51532 .00000 .75796 20
Std. Residual -1.692 1.835 .000 .918 20
Stud. Residual -2.154 2.057 -.031 1.048 20
Deleted Residual -2.26595 1.90535 -.06108 1.00067 20
Stud. Deleted Residual -2.476 2.323 -.036 1.124 20
Mahal. Distance .166 7.392 2.850 2.197 20
Cook's Distance .000 .721 .089 .168 20
Cantered Leverage Value .009 .389 .150 .116 20
a. Dependent Variable: Organizational Performance
Table 4-41 Residuals Statistics
The results of residual statistics are composed of various components. These residual statistical
components are in procedural of minimum and maximum, mean and standard deviation. In
accordance to the results it has been critically considered and analyzed that predicted value i-e (2.1
to 3.3), mean square is 2.700 and standard deviation is .30647, whereas standard predicted value
is in procedural of (1.772 to 2.15), mean is .000 and std deviation is 1.00. Hence all the important
residual statistics tests are measured as good for further proceeding of the study. In the following
experiment the analysis in aspect of the organizational performance has been carried out.

89
Figure 4-39 Analysis Performance

90
Figure 4-40 Scatter Plot

91
CHAPTER 5: QUALITY CIRCLE IMPLEMENTATION
Over the years organizations are becoming really active and vigilant in trying to engage grass roots
employees in the process of the continuous improvement. It is considered that involving of the
grass root employees in the process increases effectiveness, efficiency and productivity while
enhances the activities, with the development of teams and creation of the environment that needs
to be developed through which they can incredibly participate while improving and enhancing
their product and service performance.
The main philosophy behind the quality circle is that it builds the people. Circle members and
leaders are well trained in the simple resolving of the problem techniques and tools that identifies
the development and causes of the solutions (Rerup Schlichter & Kraemmergaard, 2010). At
appropriate time, the presentation is made by quality circles to management who decides of
whether in accepting, modifying and declining proposals.
It has been considered that the significance of the quality circle in improving the employee
participation tools and methods cannot be neglected at any instance, that it implies development
of the capabilities, creativity and confidence of people through the cumulative educational,
training, participation and work experience process (Dasgupta, 2014).
In accordance to the considerations, it has been marked that the case study organization is facing
lot of complex problems in terms of the appropriate delivery of quality in the products and services.
To resolve the issue of quality delivery and development in the products and services, it has been
analyzed that the adoption and integration of the quality circle is considered to be one of the good
options. This is mainly because, as mentioned in (Salimi, Hadjali, & Sorooshian, 2012) quality
circle completely revolves around the involvement of people, which is really important. It is
considered that when the people in organization are engaged, the focus on the innovation, creativity
and maintaining as well as enhancing of the quality of the product and services.

92
Furthermore, it has been highlighted that the quality circle also considers and highlights the
continuous improvement, which has become the major need of the organization and its
significance in the real time scenario cannot be avoided at any instance. As mentioned in (Paul,
Smith, & Blumberg, 2012) continuous improvement assists the organization to meet their
profitability goals and maintain their superior performance and reputation in the environment.
Involvement of the organizational people the stakeholders have always remained center of the
attention by the numerous successful organizations, as they believe that involvement and
engagement of the people assists in making the right decisions and opting for the right opportunity
within the right time span (Grove, Meredith, Macintyre, Angelis, & Neailey, 2010). It has been
really necessary for the organization to adopt such total quality management technique and tool
that not only focuses on the quality improvement but also to enhance the involvement of the
people.
Similarly, on the other hand, it has been realized and identified that the case study organization is
also facing the issue of the production. It is considered that the production wastages and efficiency
of the process is very minimum, due to which overall productivity of the company is highly
impacted and affected as considered in (Bosa, 2010).
5.1 Advantages of Quality Circle Implementation to Organization
It has been considered that numerous research works (Ngambi & Nkemkiafu, 2015) (Lieder &
Rashid, 2016) have been conducted in context of the highlighting and identifying the benefits of
implementing the quality circle to the organization. Quality Circles carries immense importance,
not only in enhancing the quality of the products and services delivered to the consumers, but also
focuses on continuous improvement as mentioned in (Mohiuddin, Rahman, & Jabar, 2015).
Research (Sahel, DeBrouwere, Dujardin, Kegels, Belkaab, & Alaoui Belghiti, 2015) identified that
through the implementation of the quality circle in the organization, the probability of improving
relationship amongst the employee’s increases. The internal relationship within the organization

93
carries immense importance and in context of an organization, most of the issues are resolved, as
when the relationship is strengthened, then communication barriers are bridged and accordingly,
productive outcomes are generated. It has been indicated in (Ragunath, Velmourougan,
Davachelvan, Kayalvizhi, & Ravimohan, 2010) that internal personal relationship assists the
organization to gain competitive advantage against the competitors.
Secondly, it has been analyzed that one of the main benefit of the implementing quality circle is
that it increases the self-confidence amongst the employees that assists in the resolving of the
complex problems and issues in context to the production as mentioned in (Bosa, 2010). In
accordance to the analysis and considerations, it has been reflected that the most of the complex
problems occur within organization and might negatively impact on the overall working
environment. Furthermore, if the right solution is not opted for the resolving of the problem, then
it might directly as well as indirectly weaken the firm, and make it difficult and challenging to
accomplish goals and objectives.
One of the key advantages to the implementation of the Quality Circle is that it enhances and
increases the good team work as considered in (Rerup Schlichter & Kraemmergaard, 2010). It has
been reflected that the good teamwork overall improves the credibility of the organization, and as
the traditional working environment dynamically transforms into the digitalized and complex
working environment, individual work is increasingly replaced by the team work. Thus, it is really
important that such quality circle is implemented that overall improves the teamwork.
Fourthly, it is indicated that the main advantage of the Quality Circle Implementation to the
organization is that it minimizes the material wastage as the result the organization gains the heavy
monetary benefits. In accordance to the considerations, it has been reflected that most of the
financial losses occur mainly because of the increase wastage and due to which lot of the inventory
either scratches or is misused as considered in (Grove, Meredith, Macintyre, Angelis, & Neailey,
2010). Moreover, it is considered that the quality circles are focused on controlling the inventory,
development and design of the codification and vendors.

94
Productivity enhancement, service improvement, reduction of wastages and quality enhancement
as mentioned in (Mohiuddin, Rahman, & Jabar, 2015) reflects incredible importance. It is
considered that quality circle really improves in the attending of breakdown as well as considering
of the preventative maintenance, reduces the downtime for the searching of techniques and
updating of drawing.
5.2 Results, Improvements and identified problems:
Significance of the integrating and adopting quality circle technique technically needs high
consideration. Numerous research studies (Alfalla-Luque, Marin-Garcia, & Medina-Lopez, 2015)
(Bal & Dorenbosch, 2015) (Fang, Gao, Sun, Xu, & Li, 2015) has been conducted within the
perspective of reflecting whether the implying of the quality circles would be impacting on overall
growth and improvement in the existing organization’s or not. The specific had been laid on the
increasing or enhancing of the product’s quality or service. In accordance to (Ahmad Shamsuddin,
Chew, & Shin, 2015) it has been reflected that if a really good and appropriated training and
development had been provided to the employees that the outcomes of the integrating quality circle
technique would be really different from the aspect or situation where the employees are not
provided good level of training.
It has been summarized that the role of training and adequacy of the training in terms of the
integration of quality circle technique in improving the overall quality of the product needs
immense importance. It has been reflected that the organization’s would gain productive outcome
who have well trained their employees about the quality circle and have increasingly focus on
training and developing the employees of how the productive outcomes through the
implementation of the quality circle technique can be gained.
❖ How does Quality circle improve the production?
By enabling the quality circle various positive changes have appeared in the production, there
is a better circulation of information amongst the productions. Daily meetings are held at 17:45

95
where the appearance of all the crew members is mandatory. The meeting is held by the
production manager, where he lays out the agenda for the day, and gives every inch of details
and deviations about the production to the crew members so that everyone is on the same page
and well informed to avoid any sort of errors. The communication pattern is kept precise and
concise,
❖ transparency of information:
this causes the Chinese whisper to diminish. For example, if the Malmo goods are to be taken to
the south side directly is announced, the prior crew member would know before hand and there
would be no loss of time as they would be taking it to the usual place first, and then taking it to the
south side, which leads to time saving as commuting from express to south side could consume up
to 2 mins approximately. If the driving time is reduced, it directs towards the efficient usage of
resources, hence more tasks are allotted to the south side of the terminal, where immense
coordination leads to saving time, and making the processes more convenient. If there are a lot of
Stockholm pallets at the designated drop off point, the trailer could be parked to the loading points
at the north hall, the driver itself loads the trailers or either staff from south hall do it to clear the
space and carry out dispatch orders for the prior destinations.
❖ Eradication of bottlenecks:
The working shift for the production used to be 19:45, and until that time the goods would
have been unloaded and kept for processing and so on, but that used to cause a situation of
bottleneck, as the goods must be scanned first, the papers had to be checked, stamped, copies
had to be made, and then driven away to their prior destinations. But until all that was done,
another trailer would appear, and there wouldn’t be much space, which would cause more
delays due to lack of space.

96
There’s a slight change in how things work now, to make everything more convenient. Now
the coordinator appears at 19:00, and proceeds with scanning and handling of papers goods, so
that there is ample space to accommodate more for the expected incoming goods. One person
does the handling of goods, whereas the other person drives them to their designated
destination point. Most of the times, a quite sufficient part of the trailer is taken by the goods
for parcel side i.e. south hall. Earlier they were driven out by the bulky goods department,
where as now swift communication is enabled through the usage of walkie talkies. The notion
of “being useful to other productions” is quite efficient as exterior help always speeds up the
processes.
Uncertainty avoidance measures:
Due to the shrinking of labor hours there is a quite noticeable change in the KPI. To deal with
deviances, back up personnel were trained to cope up with the situation when a crew member gets
sick or doesn’t appear at work due to any reasons. They were deployed for one month where they
learned about all the processes to carry out the production in the most convenient conceivable way.
They’re hired through bemanning companies and are respondent to unusual/unscheduled work.
Due to this, the production is more flexible and adaptive to change in nature. The manager keeps
a good track of how to delegate tasks, to make the processes as smooth as possible. When a huge
volume of a customer named BSH arrives, extra personnel used to be scheduled for that prior
working day earlier, but now help is seeked from other productions i.e. white away, as they tend
to specialize with the handling of white ware products om a daily basis, so they tend to pace up
the production process while bulky goods personnel align the rest of the processes to ensure a good
flow being agile enough.
Bigger think tank:
When the daily meetings are carried out, each and every member of various productions from the
north hall i.e. express, appear and indulge in discussions to deal with the daily flow in the best

97
possible manner, and how to cope up with the daily schedules depending upon the ETA of the
incoming trailers. One of the crew members came up with a very good idea which was
implemented right away, the destinations which have been dispatched from the north side should
be driven to the south side as there are trailers to be loaded till a later departure trailer. A note was
pasted on half pallets and put right in front of the destination drop off points, which states that the
pallets should be driven to the south side straight away. This lead to a decrease in the truck driving
time allotted to the productions, which implied to all the prevailing productions, and the south side
crew was informed about the dispatches and a great collaboration was initiated through the help
of the coordinators of each side. This allowed to encourage the ideas of each and every crew
member, turning to boost the sense of belongingness with the work place, a perfect example of
good managerial leadership. Every day challenges and opportunities were accessed and
highlighted the next day of the production, this was a good initiative as the crew members were
on their toes and receptive to every sort of situation, having a clear sense of the processes. It was
lately announced at one of the meetings that the coordinators would be swapped amongst
productions so that they have the ability to ensure being useful at other productions as good as the
one they are currently operating at. This allows the adaptability factor to kick in.
Ability to track and sustain performance level:
The KPI of earlier day was being brought in the context at every meeting, and it was assessed and
contrasted with the correspondent results. The challenges and the opportunities started to be
pondered upon, which tends to allow a great learning for the crew members, tasks which shouldn’t
be repeated are sought and made clear how to respond to certain situations. The KPI was highly
transformed after the implementation of the quality circle, as the hours were minimized to a level
which in turn resulted in reaching beyond the target, the goal being 12. Whereas bulky goods was
at the highest KPI of 19.6 as recorded, and averaging 16 if taken on a weekly track of it. The
deployment of one personnel from south side was the perfect example of efficient usage of
resources, as the regular crew members were downsized and there was only one coordinator

98
working there, who had the most experience, and could delegate tasks in the best possible manner
to get a get extract out of the production. It was tested and proved to give highly fruitful outcome.
Similarly, research (Gharakhani, Rahmati, Farrokhi, & Farahmandian, 2013) emphasized and
indicated that the organization needs to be really well aware of what is the main purpose of
implementing the quality circle technique. It has been indicated and reflected that the main purpose
of the primary purpose of implementing the Quality Circles had been to enhance the quality and
minimize the number of the working hours and focus on business process improvement, . It has
been analyzed that increase productive as well as good perception of the company and management
has been rated jointly to be one of the second important purposes of the Quality Circles. It has been
indicated that the productive results can be only obtained if the employees and the organization is
well aware of its primary purpose. The research (Gulati & Sytch, 2008) has indicated that
numerous issues had occurred when the organization or corporates were not aware of the major
purpose, most of the failures in the implementation occurred when focus had been laid on
controlling the quality, rather than improving it.
Moreover, (Guo, Zhao, Zhang, Yan, & Sun, 2015) focused on highlighting and indicating that the
employee’s communication and collaboration in increasing the probability of the organizational
outcomes within the context of the integrating and adopting the quality circle technique in their
existing scenario had been really important. It has been analysed that if an organization has
increasingly good level of the communication and collaboration between the employees that lot of
productive outcomes can be extracted.
Appropriate adoption of the quality circle technique with the suitable consideration of the specified
strategies and policies has an immense importance as mentioned in (Grove, Meredith, Macintyre,
Angelis, & Neailey, 2010). It has been considered that the organization needs to significantly
change the strategy when implying the quality circles technique in the organization. For instance,

99
it has been considered as putting forward (Jasti & Kodali, 2015) that the increasingly productive
outcomes can be gained if the organization focuses on the putting of the similar strategies might
not productively work.
The identified problems are listed as follows:
❖ The late arrival of trucks lead to planning issues as well as underutilization of resources. The
trucks don’t appear on time as they are dispatched late from the DIPS due some odd reasons
or delays probably, or either they get stuck in traffic due to road accidents. As the trucks arrive
late, the crew members are utilized and made helpful at other productions e.g. south side and
driving pallets or helping in wrapping or scanning of goods at white away production. This
surely helps in organizational performance, but the hours are allotted for bulky goods, so it
brings down the KPI. If the trucks arrive after 01,30am they are not produced at all, and left
for the next day. There have been instances when the truck arrived as late as 03,30am, when it
was only unloaded.
❖ Goods appearing without papers create a lot of problem. Since they are deprived of all the
necessary information, they cannot be produced. One alternative to it is to go in the system,
and find the papers manually, get them printed and attach them, this is quite a time taking
process which may lead to bottlenecks. Why do they appear without the papers? It usually
human error, which can be pointed towards the workers from the DIP, or the drivers who forget
to bring them along. Bulky goods is a production which works on just in time production, if
the papers are not fixed they have to be produced the next day, or placed in UFO area, where
the morning shift works on the tracking and dispatching of the goods. Earlier, about 30-40
goods used to appear without waybills, which would lead to allotting time for arranging the

100
documents in order to produce them or dispatch them the next day, but now after the
implementation of TQM, its getting better every day as compared to earlier.
❖ There are various problems related with BSH, a customer which indulges in the provision of
whiteware products. It arrives late normally, with missing papers. Without the prior
information it can’t be produced. Or either the labels are not pasted at the right place, they must
be handled differently which take a lot of time while scanning and carrying out other processes.
If that’s fixed, a lot of time can be saved.
❖ There is a lot of paperwork involved in the processes, its 2018 and yet again, all the processes
are carried out manually which is highly time taking and carries the room for human error. the
goods vary in size, at times they appear to be long logs for fences, at times engines etc., so they
must be measured in every dimension, as the customers are charged according to the space
they occupy in the trailer, it’s quite time taking and could be quite effective if there was an
automated system for all this.
❖ at times, drivers putting pallets at wrong destination points create problem as well, as the bulky
goods crew members must put them at the right destination then, which can be time consuming.
The same amount of time could be allotted for other tasks.
5.3 Risk Factor
Risks are the major part of the implementation as mentioned in (Lieder & Rashid, 2016). There
might be numerous risks that an organization faces during the implementation and execution of
the quality circles. However, one of the most important aspects is to look beyond these risks and
focus on how the occurrence of the risks and the consequences of the risks can be minimized and
decreased. It is indicated that number of the risks can be faced during execution of the risks and
there are also several factors that might lead to the increasing the probability of the occurrence of

101
the risks. In this section of the report, we have focused on discussing the several risk factors that
can be posed by the integration and implementation of the quality circles.
It has been considered and identified that one of the major risk factor that might increase the
probability of the failure of the quality circle technique is the weak strategic planning, as identified
as (Kannan & Tan, 2005). It has been mentioned by (Aquilani, Silvestri, Ruggieri, & Gatti, 2017)
that the strategic planning bears incredible importance. Basically, the strategic planning is highly
imperative, and it assists in the providing of the appropriated framework for the proactive decision
making in evaluating the performance that continuously and also assists in the assessment of what
might go wrong, raising the probability of the risk occurrence. In context to strategies and the
concerns of the evaluations, the environmental targets and goals need to align with the corporate
goals and needs to be systematic deployment. It is considered that the strategies need to be
developed and designed in the positive aspect.
Similarly, it is considered that the one of the major risk factor that might occur in the continuously
in the existing process is the weak research and development. It has been really important to
consider that if the organization does not consider the strong research and development, than there
are the great number of the chances the productive outcomes cannot be generated. It needs to be
considered that most of the risk of the failure mainly occurs in context to the implementation of
the quality circles when the proper and appropriated research is not conducted. Accordingly, the
issues of the failure occur.
Managerial Risk can occur in the organization as mentioned in (Lei, Wang, Zhu, Guo, & Wang,
2015). It has been indicated and highlighted that if the proper and effective management is not
considered than there is the high probability that the risk of failure might occur. For instance, it
includes that the management is not really strong, focused and committed in the integration and
implementation of the quality circle. Furthermore, if an organization lacks the integration of
appropriate skills that are needed for the implementation of the quality circles, than more risks
would occur. In accordance to the (Prajogo & Sohal, 2003) it has been indicated that the weak

102
implementation skills that are needed for the deployment of the quality circle, if they are not
present, then they might overall contribute to significance and major risk factors.
5.4 Risk Analysis
Risk analysis carries incredible important (Cooper & Ellram, 1993). In context to the
consideration, it has been indicated and reflected that the proper analysis of risk can play a very
important role in increasing the probability of making the success factors in implementing the
quality circle. Analyzing the risk and accordingly developing and implementing the strategies that
can decrease the probability of the risk occurrence should be highly considered. Uncertainty
avoidance measures are pondered upon. During the implementation of the risks, it has been
considered that there are variety of the risks that might be posed, whether on the quality of the
product or within the process. However, it has been considered and analyzed that if all of these
risks are accordingly analyzed and accordingly focused that lot of effective outcomes can be
generated. Conforming to the situation,
.
Simply, in the existence of dynamically complex and competitive environment, the integration of
the advancements in information and communication technologies have made it really easy for the
organizations to minimize the probability or even consequences of the risk occurrence. Main risks
assessments need to be highly considered and the focus needs to be laid on the overall developing
and integrating good technological based system that align the risk and accordingly minimize
them.
5.5 Key Drivers of Quality Matrix
Today, most of the experts firstly develop the design, theoretical framework model; proper
channels explain the origin and ending points of goods and services which, they delivered to their
consumers. According to Markman & Krause, (2014) Supply chain should be to maximize to
overall value generated is the difference between the final products is worth to the consumers and

103
cost effective incurs in the filling of customers request (Markman & Krause, 2014). It is observed
that various key drivers of quality matrix such as facilities, effectively managing the inventory
related to company production, provide best transportation system through the use of latest
information technology, effectively managing the information and communication within and
outside of the company, set sourcing and pricing of products and service leading towards the
success of the company.
The supply chain operation department of the companies take decisions through centralized and
decentralized decision-making skills. The process of centralized and decentralized decisions
making skills are also very important to run the system of supply chain smoothly and control all
the flow of the products, information, and funds are considered as the success of supply chain
(Arndt & Holger, 2012). Most of these decisions are based on the supply chain strategy, supply
chain planning, supply chain operations, processes of supply chain in term of consumers order,
replenishment cycle, manufacturing cycle and procurement cycle that leads towards the
accomplished logistic network optimization (Markman & Krause, 2014). Another important aspect
is the network design in the supply chain is composed on the facility role, facility location, capacity
allocation, use effective transportation network for promoting the market about offering products,
brands due to supply allocation that influences the network design decision for betterment of the
system.
The innovation behind the concept of conducting this research study is to identify and analyzed
the improving supply chain management process with key drivers of quality matrix (Bughin, Chui
, & Manyika , 2010). The project is to identify that how the issues of SCM can be addressed and
improved in the organization and how the process of SCM can be automated by the help of
different computing software’s. The attentions in this project have been provided on the root
optimization and logistics network. The process of quality matrix are exercised through different
computer software’s are used for promoting the concept of supply chain in the organization.

104
These businesses promoting computing software’s is considered as new paradigm in the area of
computing integration of information technologies. These processes business computing
software’s have gained much attentions due to the resources sharing, security, communication and
coordination and many other features which are not available in the traditional computing
environment (Vouk, 2008).
In these days, Cloud providers make sure that application offered over the cloud is more secure
and reliable. There are number of different researches which are conducted at the different level
to make the cloud more secure (Rimal, Admela, Dimitrios, & Yves, 2011). During the code’s life
cycle there should be some procedures taken in application security to stop the flaws in the security
policy of those systems that are lie under their administration. Physical server are powerful so
multiple virtual machine instance run on virtual servers, so providers does not depend on the secure
data on virtual machine level, they provide user level security how they can proper handle these,
when they use cloud services (Kontaxis, Polychronakis, & Keromytis, 2014). One of the most
important aspect of supply chain is based on cloud computing. In simple words, cloud computing
is considering as the general term for delivering the hosted services through internet. key drivers
of quality matrix works through the use of computing information technologies has number of
different feature which always attracts the enterprise customer including on-demand computing,
Resources Sharing, No infrastructure deployed On-Premises, storage solution etc. (Okuhara,
Tetsuo, & Takuya, 2010). Once of the main feature which is provided by the IT security is the
protection of information system or solution from the unauthorized access. The organization
policies can be implemented on the solution according through the utilization of the IT security
(Buyya, Chee, & Srikumar, 2008).
5.6 Suggestions
The overall view of the implementation was quite clear about the far stretched benefits the quality
circle has on bulky goods. Some of the important suggestions that have being provided to the
organization, especially the case scenario is presented and indicated as follows:

105
The focus should be on increasing the communication and collaboration between the two flanks
of the warehouse, since their operations coincide when they operate together, and effective
information sharing makes the processes go quite swift.
It has been indicated that the significance of effective communication and effective collaboration
between the departments cannot be avoided at any instance. In accordance to several researches
(Newbert, 2007) (Ahmad Shamsuddin, Chew, & Shin, 2015) it has been indicated and analyzed
that if good communication is integrated than lot of the productive outcomes can be generated in
terms of the integrating and implying the quality circle technique. In simple terms, if the cross-
production communication is increased, then every crew member would be aware of the major
aim of the day and all the processes would be held without any possible deviances and implying
the quality circle due to which, every employee would be working to the success of the quality
circle.
The main suggestion is that the case organization should be really focused on its effective strategic
planning. From the significant course of the action to the understanding of the strategic goals and
reasoning of the implementation, everything needs to be very clear and intensely focused upon. It
has been indicated that if the good focus is not considered than the productive outcomes cannot be
extracted. It has been realized the strategic planning before and after the implementation of the
quality circles needs increase consideration. Moreover, it has been considered and suggested that
for effective outcomes, six to eight months of the good strategic planning are needed.
If there is an addition of a great system support, it could pave ways which lead to higher goals.
There is a lot of paperwork that must be carried out, and honestly it is pretty time taking, if these
processes are replaced with more digitalization, it could lead to a swifter process, with the
eradication of human error as well. The coordinator of bulky goods mentioned in the interview
that if the trailers arrive on time, things could be wrapped up earlier than expected, and lesser hours
would be vested in the production. If there is enhanced cross communication with the line haul

106
and the sending parties, precise ETA would be generated and therefore timely execution of tasks
would be planned.
The production manager mentioned during the interview that they are looking for ways to decrease
the time and effort vested on the scanning and processing of goods, the consent has been taken to
the higher management, and they’re thinking of some production belt which would assist with
lifting as well as scanning the goods by itself. That would lessen human intervention and human
error.
There is a varied probability of the integration and implementation of the good risk assessment
system. Risk assessment system can play a very important role in the success of the quality circle.
It has been considered and in accordance to putting forward the argument by (Jirojwong, Johnson,
& Welch, 2014) it is really important that the focus is on the integrating of the good risk assessment
system that effectively assesses the risk and accordingly indicates the management of minimizing
the risk occurrence consequences.
CHAPTER 6: CONCLUSION
Total quality management is one of the major concerns of organizations who tend to adapt with
changing market trends. It has been realized that whether the organizations are big, small or
medium, each one of them is increasingly focused on improving and enhancing their performance
and does looks forward to TQM. During the research analysis and discussions, there were several
total quality management tools and techniques that were brought under consideration and highly
discussed to develop further understanding. With the presence of the variety of tools and
techniques, the best possible TQM approach was implemented which had a very fruitful terminal
outcome, leaving the management with green numbers.

107
In accordance to the results and outcomes, it has been concluded the impact of the total quality
management on the bulky goods cannot be neglected at any instance. It has been considered and
evaluated that the processing, handling and delivery of the bulky goods is incredibly difficult to
bring adjacent to with what the management requires out of the production. thus, it is important
that the effective TQM approach and tools are integrated, so that the quality of the bulky goods
can be improved and is continuous in nature. In accordance to the existing problem that the current
real time company had being facing was issues was due to jumbled up processes, taking the
example of the time when the trailers don’t arrive in time and the crew members have to be useful
in other productions in order to have organizational performance in the loop at least. The decision
of downsizing the personnel from three to one was quite an efficient and effective move, earlier
all the three scheduled personnel would be present for eight hours, but later on only the coordinator
was working. This was a wise move since the work being done by three people was being done by
one person, who has a hefty amount of experience due to the course of time deployed there. His
work being to report directly to the production manager, the daily challenges and strong points
were discussed, and contingency plans were drafted out. The number of labor hours had been
high, which brought down the productivity of the production straight away. earlier the KPI used
to be 5-6, but after the implementation, it raised up to an average of 16, the highest being 19.6, this
reflects on a fabulous change as the goal set by the management was 12. Over achieving of goals
is always a desire for an organization. Here was an underutilization of resources earlier, as the
trailer doesn’t arrive on time, the labor is made helpful to other productions, it leads towards
organizational performance, but we had bulky goods under the spot light. Increased focus was
levied on the communication and collaboration with he south side to enable timely dispatch of
goods, and to have capacity utilization. This overall results in a spike in the efficiency and
productivity of the production. In accordance to the outcomes obtained and findings reflected that
lot of the improvement in the case scenario of the company was brought.

108
The approach of TQM is not foreign to the organizations, as continuous improvement is an
intriguing factor . However, during the research process, it was founded that the companies had
lot of difficulties in the appropriate selection and integration of the adequate and suitable TQM
approach. It was considered that if the approach fails, overall organizational performance doesn’t
go in favor. Because one of the main disadvantages is the loss of time. However, we are saving
the labor hours in our case, which is vice versa. Thus, in the case scenario, the major issue was
identified and highlighted, in accordance to that Quality Circle was recommended to the manager
and was hence implemented which in turn assisted in deriving positive and productive outcomes.
In the upcoming times, we would be highly obliged to work on TQM again in order to come across
with other approaches and situations to have an in-depth insight of the study and the industry
closely, in return to assist the organization in their growth, development and to chase the quest of
enhancing the performance.

109
REFERENCES
Ab Rahman, M. N., Zain, R. M., Alias, A. M., & Nopiah, Z. M. (2015). Statistical process control:
Best practices in small and medium enterprises. Maejo International Journal of Science
and Technology, 9, 193-208.
Ahmad Shamsuddin, D. M., Chew, B. C., & Shin, L. H. (2015). QUALITY FUNCTION
DEPLOYMENT FOR BIO PLASTICS ADOPTION IN MALAYSIAN INDUSTRY.
Journal of Technology Management and Business, 2.
Alfalla-Luque, R., Marin-Garcia, J. A., & Medina-Lopez, C. (2015). An analysis of the direct and
mediated effects of employee commitment and supply chain integration on organisational
performance. International Journal of Production Economics, 162, 242-257.
Anvari, A., Ismail, Y., Hojjati, S. M., & others. (2011). A study on total quality management and
lean manufacturing: through lean thinking approach. World applied sciences journal, 12,
1585-1596.
Aquilani, B., Silvestri, C., Ruggieri, A., & Gatti, C. (2017). A systematic literature review on total
quality management critical success factors and the identification of new avenues of
research. The TQM Journal, 29, 184-213.
Arndt, & Holger. (2012). Supply Chain Management. Wiesbaden: Gabler Verlag Springer
Fachmedien Wiesbaden GmbH.
Bal, P. M., & Dorenbosch, L. (2015). Age-related differences in the relations between
individualised HRM and organisational performance: A large-scale employer survey.
Human Resource Management Journal, 25, 41-61.
Benavides-Velasco, C. A., Quintana-Garc{\'\i}a, C., & Marchante-Lara, M. (2014). Total quality
management, corporate social responsibility and performance in the hotel industry.
International Journal of Hospitality Management, 41, 77-87.

110
Berman, S. L., Wicks, A. C., Kotha, S., & Jones, T. M. (1999). Does stakeholder orientation
matter? The relationship between stakeholder management models and firm financial
performance. Academy of Management journal, 42, 488-506.
Blaabjerg, F., & Pecht, M. M. (2015). Special Issue on Robust Design and Reliability of Power
Electronics, IEEE Transactions on Power Electronics, May 2015. IEEE Transactions on
Power Electronics, 30, 2373-2374.
Bosa, I. M. (2010). Ethical budgets: a critical success factor in implementing new public
management accountability in health care. Health services management research, 23, 76-
83.
Bosch, V. G., CABANOS, M. A., & Aucejo, A. M. (2016). On the use of Statistical Process
Control in Monitoring Mortality. An Application to European Countries. Estad{\'\i}stica
Espa{\~n}ola, 58, pp. 265-275.
Boxall, P., Guthrie, J. P., & Paauwe, J. (2016). Editorial introduction: progressing our
understanding of the mediating variables linking HRM, employee well-being and
organisational performance. Human Resource Management Journal, 26, 103-111.
Braun, D., & Guston, D. H. (2003). Principal-agent theory and research policy: an introduction.
Science and public policy, 30, 302-308.
Bughin, J., Chui , M., & Manyika , J. (2010). Big data, and smart assets: ten techenabled business
trends to watch. McKinsey Quarterly. McKinsey Global Institute.
Burke, G. J., & Vakharia, A. J. (2002). Supply chain management. The internet encyclopedia.
Buyya, R., Chee, S. Y., & Srikumar, V. (2008, Sept 25-27 ). Market-oriented cloud computing:
Vision, hype, and reality for delivering it services as computing utilities. High Performance

111
Computing and Communications, 2008. HPCC'08. 10th IEEE International Conference
on. Ieee, 5 - 13.
Chang, G. (2009). Total quality management in supply chain. International Business Research, 2,
82.
Cooper, M. C., & Ellram, L. M. (1993). Characteristics of supply chain management and the
implications for purchasing and logistics strategy. The international journal of logistics
management, 4, 13-24.
Dasgupta, R. (2014). Successful implementation of quality circles in an Indian Maharatna Unit:
the driving factors. Decision, 41, 33-50.
Fang, J., Gao, Y., Sun, G., Xu, C., & Li, Q. (2015). Multiobjective robust design optimization of
fatigue life for a truck cab. Reliability Engineering \& System Safety, 135, 1-8.
Gharakhani, D., Rahmati, H., Farrokhi, M. R., & Farahmandian, A. (2013). Total quality
management and organizational performance. American Journal of Industrial Engineering,
1, 46-50.
Ghauri, P. N., & Gronhaug, K. (2005). Research methods in business studies: A practical guide.
Pearson Education.
Gil, R., Gangopadhyay, D., Zhou, J., Gordon, S., & Nayak, S. (2010, 7). Supply chain
management. Google Patents.
Grove, A. L., Meredith, J. O., Macintyre, M., Angelis, J., & Neailey, K. (2010). UK health visiting:
challenges faced during lean implementation. Leadership in Health Services, 23, 204-218.
Guerra-Santin, O., & Tweed, C. A. (2015). In-use monitoring of buildings: An overview of data
collection methods. Energy and Buildings, 93, 189-207.

112
Gulati, R., & Sytch, M. (2008). Does familiarity breed trust? Revisiting the antecedents of trust.
Managerial and Decision Economics, 29, 165-190.
Guo, X., Zhao, X., Zhang, W., Yan, J., & Sun, G. (2015). Multi-scale robust design and
optimization considering load uncertainties. Computer Methods in Applied Mechanics and
Engineering, 283, 994-1009.
Jasti, N. V., & Kodali, R. (2015). Lean production: literature review and trends. International
Journal of Production Research, 53, 867-885.
Jiang, R. (2015). Statistical process control. In Introduction to Quality and Reliability Engineering
(pp. 251-266). Springer.
Jimenez-Jimenez, D., Martinez-Costa, M., Martinez-Lorente, A. R., & Rabeh, H. A. (2015). Total
quality management performance in multinational companies: A learning perspective. The
TQM Journal, 27, 328-340.
Jin, G., Jeong, Y., & Yoon, B. (2015). Technology-driven roadmaps for identifying new
product/market opportunities: Use of text mining and quality function deployment.
Advanced Engineering Informatics, 29, 126-138.
Jirojwong, S., Johnson, M., & Welch, A. J. (2014). Research methods in nursing and midwifery
pathways to evidence based practice.
Kannan, V. R., & Tan, K. C. (2005). Just in time, total quality management, and supply chain
management: understanding their linkages and impact on business performance. Omega,
33, 153-162.
Kaynak, H. (2003). The relationship between total quality management practices and their effects
on firm performance. Journal of operations management, 21, 405-435.

113
Kontaxis, G., Polychronakis, M., & Keromytis, A. D. (2014). Computational Decoys for Cloud
Security. In Secure Cloud Computing (pp. 261-270). Springer.
Krokhin, O. V., Ezzati, P., & Spicer, V. (2017). Peptide retention time prediction in hydrophilic
interaction liquid chromatography: data collection methods and features of additive and
sequence-specific models. Analytical chemistry, 89, 5526-5533.
Kumar, N., & Mittal, V. (2015). Quality Circle Implementation In Industry in India--A Case Study.
International Journal of Current Engineering and Technology, 5, 2-277.
Lei, G., Wang, T., Zhu, J., Guo, Y., & Wang, S. (2015). System-level design optimization method
for electrical drive systems_Robust approach. IEEE Transactions on Industrial
Electronics, 62, 4702-4713.
Levitt, H. M., Bamberg, M., Creswell, J. W., Frost, D. M., Josselson, R., & Suarez-Orozco, C.
(2018). Journal article reporting standards for qualitative primary, qualitative meta-
analytic, and mixed methods research in psychology: The APA Publications and
Communications Board task force report. American Psychologist, 73, 26.
Lewis, S. (2015). Qualitative inquiry and research design: Choosing among five approaches.
Health promotion practice, 16, 473-475.
Lieder, M., & Rashid, A. (2016). Towards circular economy implementation: a comprehensive
review in context of manufacturing industry. Journal of Cleaner Production, 115, 36-51.
Mangla, S. K., Govindan, K., & Luthra, S. (2016). Critical success factors for reverse logistics in
Indian industries: a structural model. Journal of Cleaner Production, 129, 608-621.
Mann, R., & Kehoe, D. (1994). An evaluation of the effects of quality improvement activities on
business performance. International Journal of Quality \& Reliability Management, 11,
29-44.

114
Marean, C. W., Anderson, R. J., Bar-Matthews, M., Braun, K., Cawthra, H. C., Cowling, R. M.,
et al. (2015). A new research strategy for integrating studies of paleoclimate,
paleoenvironment, and paleoanthropology. Evolutionary Anthropology: Issues, News, and
Reviews, 24, 62-72.
Markman, G., & Krause, D. (2014). Special Topic Forum on Theory Building Surrounding
Sustainable Supply Chain Management. Journal of Supply Chain Management, 50(2), i--
ii.
McCusker, K., & Gunaydin, S. (2015). Research using qualitative, quantitative or mixed methods
and choice based on the research. Perfusion, 30, 537-542.
Mohiuddin, A. K., Rahman, M. A., & Jabar, J. B. (2015). ADOPTION AND ADAPTATION OF
JAPANESE MANUFACTURING MANAGEMENT IN AN AUTOMOTIVE
COMPANY OF MALAYSIA. Advanced Materials Research, 1115.
Moore, S. J., Herst, P. M., & Louwe, R. J. (2018). Review of the patient positioning reproducibility
in head-and-neck radiotherapy using Statistical Process Control. Radiotherapy and
Oncology.
Mudiyanselage, H., & Herath, R. P. (2014). The strategic importance of supply chain management
in small and medium sized enterprises: A case study of the garment industry in Sri Lanka.
Mystica, A., Bai, J., & SUGANTHI, M. A. (2015). STATISTICAL PROCESS CONTROL.
CLEAR International Journal of Research in Commerce \& Management, 6.
Newbert, S. L. (2007). Empirical research on the resource-based view of the firm: an assessment
and suggestions for future research. Strategic management journal, 28, 121-146.
Ngambi, M. T., & Nkemkiafu, A. G. (2015). The impact of total quality management on firm's
organizational performance. American Journal of Management, 15, 69.

115
Okuhara, M., Tetsuo, S., & Takuya, S. (2010). Security architecture for cloud computing. Fujitsu
Sci. Tech. J, 46(4), 397-402.
Orkin, K. (2014). Data Collection Methods. Encyclopedia of Quality of Life and Well-Being
Research, 1430-1432.
Palinkas, L. A., Horwitz, S. M., Green, C. A., Wisdom, J. P., Duan, N., & Hoagwood, K. (2015).
Purposeful sampling for qualitative data collection and analysis in mixed method
implementation research. Administration and Policy in Mental Health and Mental Health
Services Research, 42, 533-544.
Paul, S., Smith, P. K., & Blumberg, H. H. (2012). Revisiting cyberbullying in schools using the
quality circle approach. School Psychology International, 33, 492-504.
Pisani, P., Renna, M. D., Conversano, F., Casciaro, E., Di Paola, M., Quarta, E., et al. (2016).
Major osteoporotic fragility fractures: Risk factor updates and societal impact. World
journal of orthopedics, 7, 171.
Plesa, C., & Dekker, C. (2015). Data analysis methods for solid-state nanopores. Nanotechnology,
26, 084003.
Prajogo, D. I., & Sohal, A. S. (2003). The relationship between TQM practices, quality
performance, and innovation performance: An empirical examination. International
journal of quality \& reliability management, 20, 901-918.
Psomas, E., & Antony, J. (2015). The effectiveness of the ISO 9001 quality management system
and its influential critical factors in Greek manufacturing companies. International Journal
of Production Research, 53, 2089-2099.
116
Ragunath, P. K., Velmourougan, S., Davachelvan, P., Kayalvizhi, S., & Ravimohan, R. (2010).
Evolving a new model (SDLC Model-2010) for software development life cycle (SDLC).
International Journal of Computer Science and Network Security, 10, 112-119.
Rahman, S.-u., & Bullock, P. (2005). Soft TQM, hard TQM, and organisational performance
relationships: an empirical investigation. Omega, 33, 73-83.
Rennie, D. L., & Frommer, J. (2015). Applications of qualitative and mixed-methods counseling
and psychotherapy research. In Psychotherapy Research (pp. 429-454). Springer.
Rerup Schlichter, B., & Kraemmergaard, P. (2010). A comprehensive literature review of the ERP
research field over a decade. Journal of Enterprise Information Management, 23, 486-520.
Rimal, B. P., Admela, J., Dimitrios, K., & Yves, G. (2011). Architectural requirements for cloud
computing systems: an enterprise cloud approach. Journal of Grid Computing, 9(1), 3-26.
Rohilla, S., & Chaudhary, R. (2016). Quality Circle in Organization and its Implementation.
Sadikoglu, E., & Olcay, H. (2014). The effects of total quality management practices on
performance and the reasons of and the barriers to TQM practices in Turkey. Advances in
Decision Sciences, 2014.
Sahel, A., DeBrouwere, V., Dujardin, B., Kegels, G., Belkaab, N., & Alaoui Belghiti, A. (2015).
Implementing a nationwide quality improvement approach in health services: The
Moroccan _Quality Contest_ experience. Leadership in Health Services, 28, 24-34.
Sahney, S. (2015). Critical success factors in online retail--an application of quality function
deployment and interpretive structural modeling. International Journal of Business and
Information, 3.

117
Salimi, M., Hadjali, H. R., & Sorooshian, S. (2012). A lean production framework for Malaysian
automotive and heavy machinery industry. Journal of Applied Sciences(Faisalabad), 12,
1402-1407.
Satonkar, N., Ghatage, P., Kavade, G., Patil, P., Gaikwad, A., Desai, S., et al. (2017).
Strengthening Industry Institute Interaction (III) for improvement in campus placement and
industry Tie-up of Automobile Engineering Department in RIT: A Quality Circle
Approach. Journal of Engineering Education Transformations, 30, 53-57.
Seo, Y., Lee, C., & Moon, H. (2016). An organisational learning perspective of knowledge creation
and the activities of the quality circle. Total Quality Management \& Business Excellence,
27, 432-446.
Shamsuzzaman, M., Jasim, E., & Alsyouf, I. (2016). Application of statistical process control chart
for monitoring electric power losses through transmission and distribution system: A case
study. Proceedings of the International Conference on Industrial Engineering and
Operations Management, (pp. 524-530).
Siddiqui, F., Haleem, A., & Wadhwa, S. (2009). Role of supply chain management in context of
total quality management in flexible systems: a state-of the-art literature review. Global
Journal of Flexible Systems Management, 10, 1-14.
Starr, M. A. (2014). Qualitative and mixed-methods research in economics: surprising growth,
promising future. Journal of Economic Surveys, 28, 238-264.
Su, S., Baird, K., & Schoch, H. (2015). The moderating effect of organisational life cycle stages
on the association between the interactive and diagnostic approaches to using controls with
organisational performance. Management Accounting Research, 26, 40-53.
Tan, K. C., Kannan, V. R., & Handfield, R. B. (1998). Supply chain management: supplier
performance and firm performance. Journal of Supply Chain Management, 34, 2.

118
Tyanova, S., Temu, T., Sinitcyn, P., Carlson, A., Hein, M. Y., Geiger, T., et al. (2016). The Perseus
computational platform for comprehensive analysis of (prote) omics data. Nature methods,
13, 731.
Vaioleti, T. M. (2016). Talanoa research methodology: A developing position on Pacific research.
Waikato Journal of Education, 12.
Vickery, S. K., Jayaram, J., Droge, C., & Calantone, R. (2003). The effects of an integrative supply
chain strategy on customer service and financial performance: an analysis of direct versus
indirect relationships. Journal of operations management, 21, 523-539.
Vouk, M. (2008). Cloud Computing-Issues, Research and Implementation. In Proceedings of 30th
International Conference on Information Technology Interfaces Dubrovnik.
Yan, H.-B., & Ma, T. (2015). A group decision-making approach to uncertain quality function
deployment based on fuzzy preference relation and fuzzy majority. European Journal of
Operational Research, 241, 815-829.
Yusr, M. M. (2016). Innovation capability and its role in enhancing the relationship between TQM
practices and innovation performance. Journal of Open Innovation: Technology, Market,
and Complexity, 2, 6.
Zehir, C., Ertosun, {. G., Zehir, S., & M{\"u}celdilli, B. (2012). Total quality management
practices_ effects on quality performance and innovative performance. Procedia-Social
and Behavioral Sciences, 41, 273-280.
Zhang, W., & Wu, X. (2013). The importance of supply chain management. International Journal
of Business and Social Science, 4.
Zhu, Q., & Azar, A. T. (2015). Complex system modelling and control through intelligent soft
computations. Springer.

119
Zhu, Q., & Sarkis, J. (2004). Relationships between operational practices and performance among
early adopters of green supply chain management practices in Chinese manufacturing
enterprises. Journal of operations management, 22, 265-289.

120
CHAPTER 7: APPENDIX
Variables Entered/Removedb
Model Variables Entered Variables Removed Method
1 Operational Processes, Total
Quality Management, Supply
Chain Management
. Enter
a. All requested variables entered.
b. Dependent Variable: Organisational Performance
7.1 Questionnaire
7.2 Part 1: Personal Information
Gender
Male Female
Age
17-25 26-34 35-44 44 or above
Job Position
Manager Team leader coordinator Crew member
Production
Bulky goods White away City mail Other
productions
7.3 Part 2: Instructions
Please read each of the following items carefully and fill in the answer that best corresponds to
your agreement or disagreement.
Strongly Agree(SA)
Agree (A) Neutral (N) Disagree (D) Strongly Disagree(SD)

121
1 2 3 4 5
7.3.1 Section A: Total Quality Management
S/N SA A N D SD
1 top management (senior executives and supervisors) view
improvement in service quality leading to increase profits
1 2 3 4 5
2 top management has objectives for quality performance 1 2 3 4 5
3 top management evaluates organizational performance through
provision of quality services
1 2 3 4 5
4 TQM assists in alignment of company’s goals as well as
individual goals
1 2 3 4 5
5 There is an uplift in the stature of the organization and the morale
of employees through quality measures
1 2 3 4 5
6 In case of deviances in processes, solutions are drafted out in the
best feasible way
1 2 3 4 5
7 Uncertainty avoidance measures are taken into consideration 1 2 3 4 5
8 With the provision of precise and concise information, the best
result could be extracted
1 2 3 4 5
7.3.2 Section B: Supply Chain Management
S/N SA A N D SD
1 The Supply Chain Management is completely based on the
integration of quality-based processes
1 2 3 4 5
2 The clients have an effective system to ensure quality of the
services
1 2 3 4 5

122
3 We emphasize on quality and delivery performance rather than
price in selecting clients
1 2 3 4 5
4 The clients are involved in our quality training 1 2 3 4 5
5 We work closely with clients to improve each other’s processes 1 2 3 4 5
6 the clients are actively involved in our new product development
process
1 2 3 4 5
7 Employee involvement and suggestions are highly valued and
taken under consideration, as they have a closer look with the
hand held operations
1 2 3 4 5
7.3.3 Section C: Operational Processes
S/N SA A N D SD
1 Quality and Reliability of our services are high 1 2 3 4 5
2 There is increased transparency in the communication amongst
productions
1 2 3 4 5
3 We deliver our services on time to customers 1 2 3 4 5
4 We design processes in our firm to be “mistake-proof” to
minimize the changes of errors
1 2 3 4 5
5 We make extensive use of statistical techniques to reduce
variation in processes
1 2 3 4 5
6 We give clear, comprehensive, and standardized documentations
and instructions about work methods and process instructions to
employees
1 2 3 4 5
7 Crew members have the right to contribute to the think tank, in
order to achieve continuous improvement
1 2 3 4 5

123
7.3.4 Section D: Organizational Performance
S/N SA A N D SD
1 the firm has an effective performance measurement system to
track overall organizational performance
1 2 3 4 5
2 Quality data (error rates, defect rates, scrap, defects, rework
rates, cost of quality, etc.) are available
1 2 3 4 5
3 Timely firm performance data is always available 1 2 3 4 5
4 Quality of the products and services enhances the organizational
performance, as it leads towards strengthening the relationship
with the client
1 2 3 4 5
5 Implementation of total quality management enhances the
organizational performance.
1 2 3 4 5
6 Due to quality circle processes are aligned in a better manner 1 2 3 4 5
7 There is increased accuracy of the information which is
processed and circulated through the productions due to the
implementation
1 2 3 4 5

124
7.4 Interviews
1. What is your viewpoint of total quality management and its implementation in the
organization?
2. Do you think that employee training and development enhances the performance of the
organization?
3. The accuracy and timely availability of information deems to be an integral part while
carrying out SOP?
4. Do you focus on uncertainty avoidance measures? How?
5. While deviances occur in between certain processes, how do you cope up with that?
6. Do you have a well drafted solution for dealing with returns?
7. Do you think that your organization is able to well endorse the total quality management
and what is the role of executives and top management regarding the implementation of
TQM?
8. Do your team members and employees consider the significance of the implementation of
TQM?
9. To what extent does the organization endorse and integrates TQM in supply chain
processes?
10. How many complaints you have obtained from the consumers regarding the quality of
product?
11. What initiatives do you think that the organization should implement in context to the
total quality management?