The Effect of the Surface Area of Carbon Black Grades ... - MDPI
20
polymers Article The Effect of the Surface Area of Carbon Black Grades on HNBR in Harsh Environments Winoj Balasooriya 1, *, Bernd Schrittesser 1 , Gerald Pinter 2 , Thomas Schwarz 3 and Lucia Conzatti 4 1 Polymer Competence Center Leoben GmbH, Roseggerstrasse 12, 8700 Leoben, Austria; [email protected] 2 Department of Polymer Engineering and Science, Montanuniversitaet Leoben, Otto Glöckeltrasse 2, 8700 Leoben, Austria; [email protected] 3 SKF Sealing Solutions Austria GmbH, Gabelhoferstrasse 25, 8750 Judenburg, Austria; [email protected] 4 National Research Council, ISMAC Genova, Via De Marini 6, 16149 Genova, Italy; [email protected] * Correspondence: [email protected]; Tel.: +43-3842-429-6232 Received: 5 December 2018; Accepted: 28 December 2018; Published: 4 January 2019 Abstract: Concerning the still rising demand for oil and gas products, the development of new reliable materials to guarantee the facility safety at extreme operating conditions is an utmost necessity. The present study mainly deals with the influence of different carbon black (CB) filled hydrogenated nitrile butadiene rubber (HNBR), which is a material usually used in sealing applications, on the rapid gas decompression (RGD) resistance in harsh environments. Therefore, RGD component level tests were conducted in an autoclave. The supporting mechanical and dynamic mechanical property analysis, the microscopic level investigations on the material and failure analysis were conducted and are discussed in this work. Under the tested conditions, the samples filled with smaller CB primary particles showed a slightly lower volume increase during the compression and decompression phases; however, they steered to a significantly lower resistance to RGD. Transmission electron micrographs revealed that the samples filled with smaller CB particles formed larger structures as well as densified filler networks including larger agglomerates and as a consequence a decrease effective matrix component around the CB particles. Apparently, at higher loading conditions, which already deliver a certain level of mechanical stresses and strains, the densified filler network, and especially a lower amount of effective matrix material composition, adversely affect the RGD resistance. SEM-based fracture analysis did not identify any influence of the CB grades tested on the crack initiation site; however, it revealed that the cracks initiated from existing voids, hard particles, or low strength matrix sites and propagated to the outer surface. Keywords: oil and gas; elastomers; HNBR; carbon black; rapid gas decompression 1. Introduction The durability and the performance of elastomers are greatly affected by the working environment. Especially in harsh conditions, for example, elastomeric materials are exposed to high pressure, high temperature, and different media, and as a result, their properties deteriorate significantly and even component failure occurs [1]. Therefore improving the material properties to face the challenges in use are of utmost interest among materials scientists. The specific catastrophic failure phenomenon, the rapid gas decompression (RGD), which occurs in almost every fluid-handling elastomeric component as a result of sudden pressure release, is well-known, but is still under Polymers 2019, 11, 61; doi:10.3390/polym11010061 www.mdpi.com/journal/polymers
-
Upload
khangminh22 -
Category
Documents
-
view
3 -
download
0
Transcript of The Effect of the Surface Area of Carbon Black Grades ... - MDPI

polymers
Article
The Effect of the Surface Area of Carbon BlackGrades on HNBR in Harsh Environments
Winoj Balasooriya 1,*, Bernd Schrittesser 1 , Gerald Pinter 2, Thomas Schwarz 3 andLucia Conzatti 4
1 Polymer Competence Center Leoben GmbH, Roseggerstrasse 12, 8700 Leoben, Austria;[email protected]
2 Department of Polymer Engineering and Science, Montanuniversitaet Leoben, Otto Glöckeltrasse 2,8700 Leoben, Austria; [email protected]
3 SKF Sealing Solutions Austria GmbH, Gabelhoferstrasse 25, 8750 Judenburg, Austria;[email protected]
4 National Research Council, ISMAC Genova, Via De Marini 6, 16149 Genova, Italy;[email protected]
* Correspondence: [email protected]; Tel.: +43-3842-429-6232
Received: 5 December 2018; Accepted: 28 December 2018; Published: 4 January 2019�����������������
Abstract: Concerning the still rising demand for oil and gas products, the development of new reliablematerials to guarantee the facility safety at extreme operating conditions is an utmost necessity. Thepresent study mainly deals with the influence of different carbon black (CB) filled hydrogenatednitrile butadiene rubber (HNBR), which is a material usually used in sealing applications, on therapid gas decompression (RGD) resistance in harsh environments. Therefore, RGD component leveltests were conducted in an autoclave. The supporting mechanical and dynamic mechanical propertyanalysis, the microscopic level investigations on the material and failure analysis were conducted andare discussed in this work. Under the tested conditions, the samples filled with smaller CB primaryparticles showed a slightly lower volume increase during the compression and decompression phases;however, they steered to a significantly lower resistance to RGD. Transmission electron micrographsrevealed that the samples filled with smaller CB particles formed larger structures as well as densifiedfiller networks including larger agglomerates and as a consequence a decrease effective matrixcomponent around the CB particles. Apparently, at higher loading conditions, which already delivera certain level of mechanical stresses and strains, the densified filler network, and especially a loweramount of effective matrix material composition, adversely affect the RGD resistance. SEM-basedfracture analysis did not identify any influence of the CB grades tested on the crack initiation site;however, it revealed that the cracks initiated from existing voids, hard particles, or low strengthmatrix sites and propagated to the outer surface.
Keywords: oil and gas; elastomers; HNBR; carbon black; rapid gas decompression
1. Introduction
The durability and the performance of elastomers are greatly affected by the working environment.Especially in harsh conditions, for example, elastomeric materials are exposed to high pressure,high temperature, and different media, and as a result, their properties deteriorate significantlyand even component failure occurs [1]. Therefore improving the material properties to face thechallenges in use are of utmost interest among materials scientists. The specific catastrophic failurephenomenon, the rapid gas decompression (RGD), which occurs in almost every fluid-handlingelastomeric component as a result of sudden pressure release, is well-known, but is still under
Polymers 2019, 11, 61; doi:10.3390/polym11010061 www.mdpi.com/journal/polymers

Polymers 2019, 11, 61 2 of 20
discussion even after decades [2–9]. This failure leads to high volume increase, crack initiation,crack growth, and the complete destruction of the component. The whole process can be dividedinto the pressurization and the depressurization phases. The first occurs due to the penetrationof different media (mainly in gas conditions) at high-pressure and high-temperature atmospheres;it leads to a volume increase, strongly depending on the temperature, the pressure, and the mediaused [6,9,10]. The latter is a highly complex phase, where a high volume change of the component dueto the pressure reduction occurs at ambient conditions. A stress-state change is expected in nominalstresses from compression to tension during the decompression cycle. The high volume change of gasleads to a three-dimensional pneumatic tension state in the material and it creates an additional andcomplementary assumed uniform body stress in the sample [2,6,11]. The compressed gas nucleatesat voids or loosely bonded filler/rigid inclusion surfaces during rapid gas decompression; the voidsinflate resulting in tensile stresses or strains in the void walls. This can lead to surface blisters orcleavage cracks, according to the permeability of gases into the material and induced stress levels [2,12].
Furthermore, during the compression phase, with high-pressure gas exposure, mainly two effectscan be expected: (i) the plasticization of the polymer matrix leading to increased free volume andsubsequent backbone movement and (ii) the compression of the polymer matrix. The first occursmainly with highly soluble gases with a high boiling point (e.g., CO2) and the second mainly withgases with lower boiling points (e.g., N2). The nature of the gas and the applied pressure define thedominance of these opposite effects in the material and lead to a change of the mechanical and thermalproperties [4]. Therefore, the permeation and solubility of gas strongly influences the material behavior.Additionally, the interacting media has a significant effect as well. Many previous research efforts couldbe found in the literature dealing with the media and permeation processes [8,13,14]. Especially, carbondioxide (CO2) can become a supercritical fluid and therefore a good solvent at relatively moderatepressure and temperature [15]. This concerns the elastomeric components in use when CO2 is present.Especially in the oil and gas fields, the existence of a moderate amount of CO2 in the reservoir caninduce a failure in elastomeric seals that otherwise perform well in high-pressure gases [15]. Thisis because carbon dioxide has a small, permanent dipole with uneven charge distributions and itis capable of multiple types of associations, especially with polar elastomers. For example, in CO2,the swelling is higher for fluoroelastomer (FKM) and hydrogenated nitrile butadiene rubber (HNBR)compared with ethylene propylene diene monomer (EPDM) [4,10,16].
The RGD phenomenon of elastomers is common in harsh environments and this rather complexprocess is seemingly a combination of many factors. Several authors have made efforts to identify theRGD behavior in different aspects dealing with the influence of testing parameters, fracture mechanicalapproaches and simulation models [2–11]. However, it is still of prime interest to identify the influenceof the material composition, especially of the reinforcing fillers. Carbon black (CB) is an essentialingredient of most rubber formulations and has a considerable influence on the performance of thefinal product. This is especially true for RGD behavior, including the high probability of crack initiationin rubber matrix–filler interface, and considering the space between particles where the matrix ishighly constrained [3]. Hence, it is vital to understand how the RGD and the related performance ofthe materials are affected by the nature of the CB grades used. Therefore, the aim of this research workis to consider mainly the RGD performance of HNBR filled with different CB grades in contact withCO2 in conditions near the service level and to delve more deeply into the reinforcement mechanismof the CB filler system.
The use of CB in elastomers is common to achieve a reasonable range of mechanical propertiesrequired for a great variety of modern applications. It increases stiffness, modulus, rupture energy,tear strength, tensile strength, cracking resistance, fatigue resistance and abrasion resistance [17–19].At the beginning of the 19th century, CB was accidentally identified as a substance to eliminate theinherent stickiness of rubber after zinc oxide had long been used [20]. CB as a reinforcing filler alsoreduces the cost of the end product and modifies the electrical and optical properties of the polymermatrix and is one of the most stable chemicals [17,19,20].

Polymers 2019, 11, 61 3 of 20
Considering CB as a reinforcing media, it relies on several factors, i.e., the primary particlesize (specific surface area), the structure (the degree of irregularity of the filler unit) and the surfaceactivity [18–20]. These factors evolve from the source or processing characteristics, and they arenamed accordingly; for example, furnace black, lampblack, thermal black, acetylene black, and channelblack [20,21]. ASTM nomenclature uses the letter “N” to indicate a normal curing rate of typicalfurnace black which has had no special modification to alter the influence of the curing rate of rubber,followed by three numbers indicating the reinforcing character [20,22]. The first number refers tothe average typical size of the elementary particle size. Therefore, a lower number refers to a lowerparticle diameter and higher surface area, for example N550 has a higher primary particle size anda lower surface area compared with N330 or N110 [21]. The last two digits of the number refer thestructure of the aggregate and its reinforcing character, for example, N340 is a better reinforcing gradecompared with N327 while in the same primary particle size diameter range [21,22]. The primaryparticles do not exist as separate particles, but they are fused together to form aggregates and thisthree-dimensional arrangement designates the “structure” of the CB grade [20–22]. A high degreeof branching or clustering of the aggregates characterizes a “high structure”, and vice versa [20,23].Additionally, the branched aggregates create porous structures and a higher surface area comparedwith the compact dense spherical particle structures. This creates additional filler surfaces available tointeract with rubber and results in better reinforcing capabilities [21,23,24].
With regards to the particle size, particles up to 100 nm diameter are responsible for thereinforcement, irrespective of the particle structure [22]. However, particles larger than 103 nm arehardly responsible for reinforcing effects but used to increase viscosity by a hydrodynamic effect [23].A smaller particle size, which gives higher surface area, manages to create a higher degree of cross-linkswith the elastomer and has a positive effect on the tensile strength, elastic modulus, the hardness ofthe elastomers as well as the compression set [19,23,24]. Mainly the filler–rubber cross-links are of aphysical nature (physisorption), but the surface chemistry of CB has an effect on the vulcanizationbehavior of filled compounds [18]. Therefore, it is generally accepted that the surface area has asignificant effect on increasing vulcanization reactions and mechanical properties [17,19].
The anisometric nature of the aggregate has a progressive influence on creating the entanglementsof rubber molecules with the CB and their attachment (mechanical interlocking) [19]. Furthermore,the primary particle size correlates to the structure, for example, smaller primary particle size CBgrades tend to create higher structural CB aggregates and vice versa [23]. A low structure may containless than 20 primary particles per aggregate; a high structure may consist of up to 200 particles [21].The aggregate is the smallest form of a given CB grade because they flocculate together to formweak, giant secondary aggregates called agglomerates [22,23]. There are two models to explain theseloosely bound filler networks: (i) the filler–filler physical van der Waals interactions [18] and (ii) theattachment through a polymer layer, which is in nanometer-scale, in between two attractive fillersurfaces [25]. In the latter, the polymer chains, which are in confinement, are strongly immobilized andthese bonds create glassy-like bridges between the filler aggregates and transmit the stresses along thefiller network [26].
When an uncured elastomer is blended well with a CB grade for a period, the elastomer chainsare bound to the carbon black aggregates through different mechanisms, i.e., chemical/physical bonds,immobilized chains creating glassy-like bridges in-between fillers or the mechanical inter-locking ofelastomer chains around/through the filler surfaces. This creates highly immobilized and localizedrubber chains forming a rubber shell surrounding the CB aggregates [19]. This highly restricted rubberlayer is no longer a part of the elastically active rubber matrix, but a part of the filler network and itincreases the effective filler volume [19,24].
In Figure 1, certain models explaining the filler–rubber interaction are summarized. Figure 1ashows the stronger bonding of rubber around the filler aggregates to form a rubber shell on the surface,the so-called “bound rubber”, with increasing stiffness when it is closer to the CB and vice versa. Whenirregular filler structures exist, the rubber occludes between the inner voids of irregular contours and

Polymers 2019, 11, 61 4 of 20
forms an outer layer called “occluded rubber” as shown in Figure 1b. It is not strongly bound like therubber shell, but experiences reduced mobility. As shown in Figure 1c, this bound rubber is stronglyattached to the CB closer to the surface; away from the surface, the mobility of rubber is increased.Figure 1d shows a possible cluster mode of fillers, creating filler agglomerates, which trap some rubberexcluding from the rest of the matrix. This is called “trapped rubber” and it becomes ‘free’ once theaggregate structure breaks apart during the deformation [17,24]. The bound rubber and the occludedrubber content depend on several factors, i.e., CB loading, CB surface area, structure, temperature,and the dwell time of CB in the rubber before curing [24]. A model to explain the filler–filler bonds tocreate filler agglomerates is illustrated in Figure 1e, where some rubber molecules remained in-betweenfiller particles and these behave like glassy-like polymer bridges.
Polymers 2019, 11, x FOR PEER REVIEW 4 of 20
rubber is strongly attached to the CB closer to the surface; away from the surface, the mobility of rubber is increased. Figure 1d shows a possible cluster mode of fillers, creating filler agglomerates, which trap some rubber excluding from the rest of the matrix. This is called “trapped rubber” and it becomes ‘free’ once the aggregate structure breaks apart during the deformation [17,24]. The bound rubber and the occluded rubber content depend on several factors, i.e., CB loading, CB surface area, structure, temperature, and the dwell time of CB in the rubber before curing [24]. A model to explain the filler–filler bonds to create filler agglomerates is illustrated in Figure 1e, where some rubber molecules remained in-between filler particles and these behave like glassy-like polymer bridges.
Figure 1. Models of filler–rubber interaction mechanisms and behavior of rubber: (a) strongly bound rubber around the carbon black; (b) occluded rubber around the rubber shell; (c) bound rubber near the carbon black (CB), transition layer, and then the mobile rubber far from the CB surface; (d) CB agglomerate and trapped rubber in between the aggregates; (e) filler aggregates are bound through glassy-like polymer bridges [18,19,24].
The filler aggregates and agglomerates in CB grades are responsible for the unique characteristics of filled elastomers. However, when CB is mixed with a rubber in a mill, the encountered shear forces could damage the aggregates and agglomerates reducing their sizes and structures [26]. In addition, many researchers assumed the well-known elastomeric phenomenon, Mullin’s effect and Payne’s effect, a result of the breakdown and re-aggregation of softer filler agglomerations [17,27,28]. According to these models, the tension and relaxation in a cyclic loading condition lead the dynamic breakdown and the re-aggregation of filler–filler bonds, especially the glassy-like polymer bridges between filler aggregates. The damage to the bonds is structurally reversible, but the re-aggregation of filler particles takes place resulting in hysteretic effects because the re-aggregated polymer bridges do not recover to the same strength as unbroken bridges, leading to a softening of the filler–filler bonds [25]. Furthermore, some researchers discussed the effects of CB in rubber materials; for example, Zhang et al. [29] investigated the effect of the particle size distribution of CB on the mechanical properties, and did microanalysis of the fractured sample of vulcanized NR with high abrasion furnace (HAF). They observed a better particle distribution with increasing emulsifiers in the material and enhanced mechanical properties with higher filler dispersion in the rubber matrix due to the better interaction of carbon black and rubber matrix [29].
Figure 1. Models of filler–rubber interaction mechanisms and behavior of rubber: (a) strongly boundrubber around the carbon black; (b) occluded rubber around the rubber shell; (c) bound rubber nearthe carbon black (CB), transition layer, and then the mobile rubber far from the CB surface; (d) CBagglomerate and trapped rubber in between the aggregates; (e) filler aggregates are bound throughglassy-like polymer bridges [18,19,24].
The filler aggregates and agglomerates in CB grades are responsible for the unique characteristicsof filled elastomers. However, when CB is mixed with a rubber in a mill, the encountered shear forcescould damage the aggregates and agglomerates reducing their sizes and structures [26]. In addition,many researchers assumed the well-known elastomeric phenomenon, Mullin’s effect and Payne’s effect,a result of the breakdown and re-aggregation of softer filler agglomerations [17,27,28]. According tothese models, the tension and relaxation in a cyclic loading condition lead the dynamic breakdownand the re-aggregation of filler–filler bonds, especially the glassy-like polymer bridges between filleraggregates. The damage to the bonds is structurally reversible, but the re-aggregation of filler particlestakes place resulting in hysteretic effects because the re-aggregated polymer bridges do not recover tothe same strength as unbroken bridges, leading to a softening of the filler–filler bonds [25]. Furthermore,some researchers discussed the effects of CB in rubber materials; for example, Zhang et al. [29]investigated the effect of the particle size distribution of CB on the mechanical properties, and didmicroanalysis of the fractured sample of vulcanized NR with high abrasion furnace (HAF). Theyobserved a better particle distribution with increasing emulsifiers in the material and enhanced
Polymers 2019, 11, 61 5 of 20
mechanical properties with higher filler dispersion in the rubber matrix due to the better interaction ofcarbon black and rubber matrix [29].
2. Materials and Methods
The influence of CB grades in HNBR on the RGD resistance was tested at componentlevel. The macroscopic and microscopic aspects of the material behavior were observed. Thematerial compositions, the testing methods, and the specific settings are described below in thefollowing section.
2.1. Materials
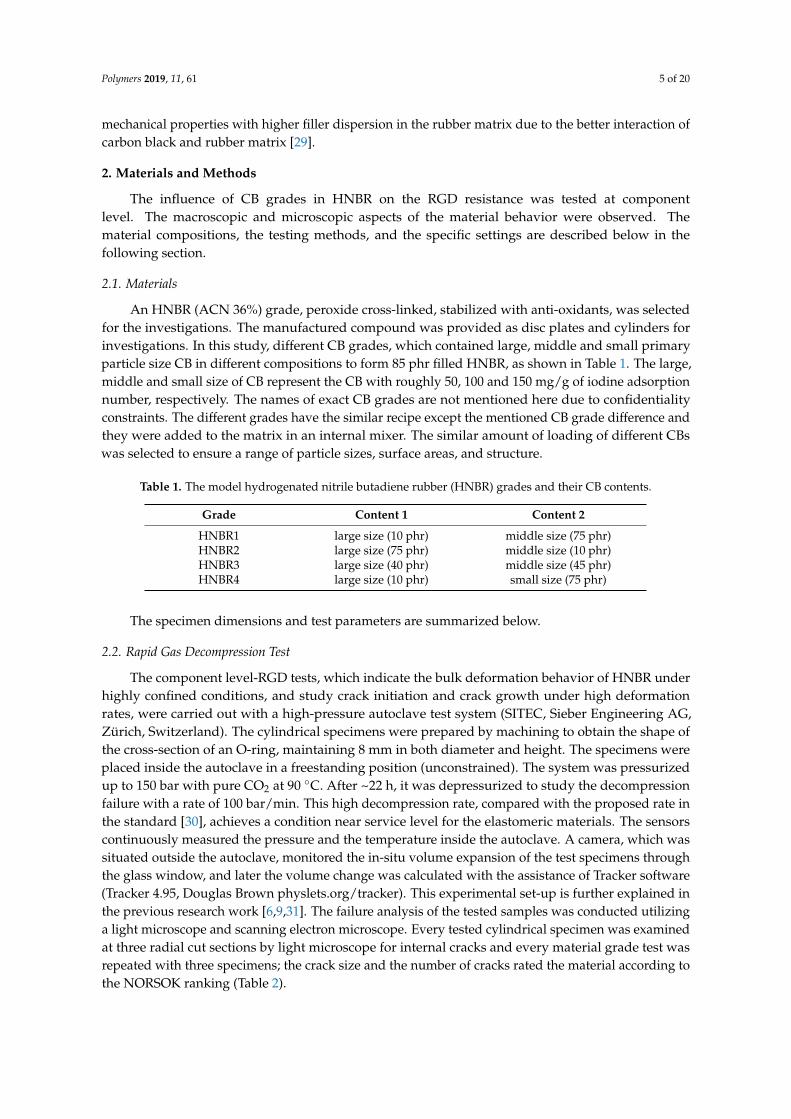
An HNBR (ACN 36%) grade, peroxide cross-linked, stabilized with anti-oxidants, was selectedfor the investigations. The manufactured compound was provided as disc plates and cylinders forinvestigations. In this study, different CB grades, which contained large, middle and small primaryparticle size CB in different compositions to form 85 phr filled HNBR, as shown in Table 1. The large,middle and small size of CB represent the CB with roughly 50, 100 and 150 mg/g of iodine adsorptionnumber, respectively. The names of exact CB grades are not mentioned here due to confidentialityconstraints. The different grades have the similar recipe except the mentioned CB grade difference andthey were added to the matrix in an internal mixer. The similar amount of loading of different CBswas selected to ensure a range of particle sizes, surface areas, and structure.
Table 1. The model hydrogenated nitrile butadiene rubber (HNBR) grades and their CB contents.
Grade Content 1 Content 2
HNBR1 large size (10 phr) middle size (75 phr)HNBR2 large size (75 phr) middle size (10 phr)HNBR3 large size (40 phr) middle size (45 phr)HNBR4 large size (10 phr) small size (75 phr)
The specimen dimensions and test parameters are summarized below.
2.2. Rapid Gas Decompression Test
The component level-RGD tests, which indicate the bulk deformation behavior of HNBR underhighly confined conditions, and study crack initiation and crack growth under high deformationrates, were carried out with a high-pressure autoclave test system (SITEC, Sieber Engineering AG,Zürich, Switzerland). The cylindrical specimens were prepared by machining to obtain the shape ofthe cross-section of an O-ring, maintaining 8 mm in both diameter and height. The specimens wereplaced inside the autoclave in a freestanding position (unconstrained). The system was pressurizedup to 150 bar with pure CO2 at 90 ◦C. After ~22 h, it was depressurized to study the decompressionfailure with a rate of 100 bar/min. This high decompression rate, compared with the proposed rate inthe standard [30], achieves a condition near service level for the elastomeric materials. The sensorscontinuously measured the pressure and the temperature inside the autoclave. A camera, which wassituated outside the autoclave, monitored the in-situ volume expansion of the test specimens throughthe glass window, and later the volume change was calculated with the assistance of Tracker software(Tracker 4.95, Douglas Brown physlets.org/tracker). This experimental set-up is further explained inthe previous research work [6,9,31]. The failure analysis of the tested samples was conducted utilizinga light microscope and scanning electron microscope. Every tested cylindrical specimen was examinedat three radial cut sections by light microscope for internal cracks and every material grade test wasrepeated with three specimens; the crack size and the number of cracks rated the material according tothe NORSOK ranking (Table 2).
Polymers 2019, 11, 61 6 of 20
Table 2. The seal-failure rating criteria according to NORSOK testing standard [30].
Description Rating
No internal cracks, holes, or blisters of any size. 0
Less than 4 internal cracks, each shorter than 50% of the cross-section,with a total crack length less than the cross-section 1
Less than 6 internal cracks, each shorter than 50% of the cross-section,with a total crack length of fewer than 2.5 times the cross-section. 2
Less than 9 internal cracks of which max. 2 cracks can have a lengthbetween 50% and 80% of the cross-section. 3
More than 8 internal cracks, or one or more cracks longer than 80% ofthe cross-section. 4
Crack(s) going through the entire cross-section or complete separationof the seal into fragments. 5
2.3. Tensile Test
The tension tests on dumbbell-shape specimens (S2) were carried out according to the DIN 53504standard. The specimens were punched out from the ~2 mm thick plates maintaining a width of 4 mmbetween the shoulders. All tests were performed with a Zwick universal testing machine (Zwick Roell,Test expert, Ulm, Germany) using a 1 kN load cell, at a constant crosshead speed of 200 mm/minwith an initial gauge length of 43 mm. Five specimens of each grade were investigated to ensurethe reproducibility.
2.4. Dynamic Mechanical Analysis
The microstructures of differently filled HNBR were investigated using DMA measurementsand the experiments were conducted with a DMA 861/40N testing device (Mettler Toledo GmbH,Schwerzenbach, Switzerland). All tests were carried out within the temperature range of −50 ◦C to100 ◦C using liquid nitrogen as a cooling agent with a frequency of 2 Hz and a heating rate of 2 K/min.The parallel parts between the shoulders of the dumbbell specimens (thickness of 2 mm and width of4 mm) were used as the specimens in tension mode with a clamping distance of 19.5 mm.
2.5. Scanning Electron Microscope (SEM) Analysis
The fracture surfaces of RGD tested samples were observed utilizing an SEM (Tescan VEGA-II,Brno, Czech Republic). The broad and magnified views of surfaces helped to identify the crackinitiation and propagation in different material grades and different fracture behaviors based ondifferent CB compositions.
2.6. Transmission Electron Microscope (TEM) Analysis
The TEM micrographs analysis was performed for all four material grades utilizing a Zeiss EM900 microscope (Carl Zeiss AG, Oberkochen, Germany) with an accelerating voltage of 80 kV. Ultrathinsections (~50 nm thick) were prepared by using a Leica EM FCS cryo-ultramicrotome at −100 ◦C.
3. Results and Discussion
In the following section, the influence on the RGD behavior of HNBR samples filled with differentCB grade compositions is compared. It is vital to understand this complex phenomenon by theinfluence on macroscopic properties and the micro/nano level observations from different CB grades.Therefore, the CB primary particle/aggregate sizes and their distribution are investigated with TEMmicrographs. The monotonic loading tensile properties and dynamic mechanical properties arecharacterized identifying the macroscopic behavior. The possible microstructural morphologiesinvolved with the RGD damage mechanisms based on the SEM images are discussed as well.
Polymers 2019, 11, 61 7 of 20
3.1. Morphological Investigations of CB Filled Samples by TEM
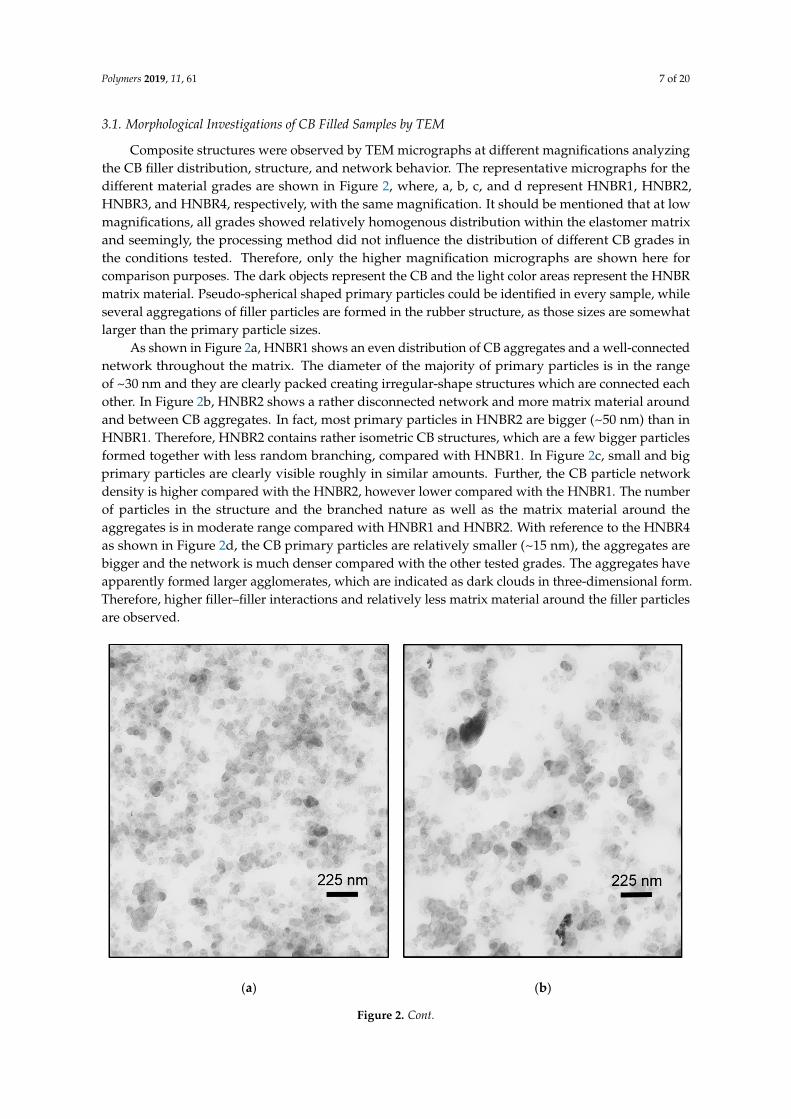
Composite structures were observed by TEM micrographs at different magnifications analyzingthe CB filler distribution, structure, and network behavior. The representative micrographs for thedifferent material grades are shown in Figure 2, where, a, b, c, and d represent HNBR1, HNBR2,HNBR3, and HNBR4, respectively, with the same magnification. It should be mentioned that at lowmagnifications, all grades showed relatively homogenous distribution within the elastomer matrixand seemingly, the processing method did not influence the distribution of different CB grades inthe conditions tested. Therefore, only the higher magnification micrographs are shown here forcomparison purposes. The dark objects represent the CB and the light color areas represent the HNBRmatrix material. Pseudo-spherical shaped primary particles could be identified in every sample, whileseveral aggregations of filler particles are formed in the rubber structure, as those sizes are somewhatlarger than the primary particle sizes.
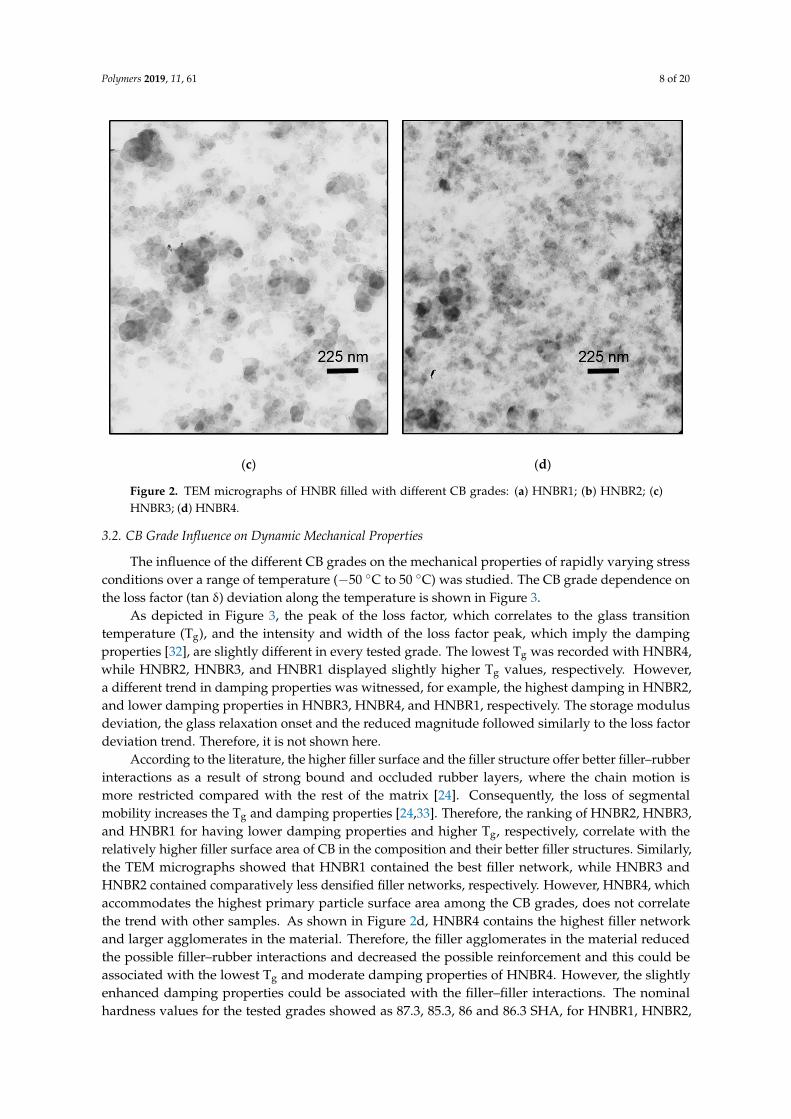
As shown in Figure 2a, HNBR1 shows an even distribution of CB aggregates and a well-connectednetwork throughout the matrix. The diameter of the majority of primary particles is in the rangeof ~30 nm and they are clearly packed creating irregular-shape structures which are connected eachother. In Figure 2b, HNBR2 shows a rather disconnected network and more matrix material aroundand between CB aggregates. In fact, most primary particles in HNBR2 are bigger (~50 nm) than inHNBR1. Therefore, HNBR2 contains rather isometric CB structures, which are a few bigger particlesformed together with less random branching, compared with HNBR1. In Figure 2c, small and bigprimary particles are clearly visible roughly in similar amounts. Further, the CB particle networkdensity is higher compared with the HNBR2, however lower compared with the HNBR1. The numberof particles in the structure and the branched nature as well as the matrix material around theaggregates is in moderate range compared with HNBR1 and HNBR2. With reference to the HNBR4as shown in Figure 2d, the CB primary particles are relatively smaller (~15 nm), the aggregates arebigger and the network is much denser compared with the other tested grades. The aggregates haveapparently formed larger agglomerates, which are indicated as dark clouds in three-dimensional form.Therefore, higher filler–filler interactions and relatively less matrix material around the filler particlesare observed.
Polymers 2019, 11, x FOR PEER REVIEW 7 of 20
3.1. Morphological Investigations of CB Filled Samples by TEM
Composite structures were observed by TEM micrographs at different magnifications analyzing the CB filler distribution, structure, and network behavior. The representative micrographs for the different material grades are shown in Figure 2, where, a, b, c, and d represent HNBR1, HNBR2, HNBR3, and HNBR4, respectively, with the same magnification. It should be mentioned that at low magnifications, all grades showed relatively homogenous distribution within the elastomer matrix and seemingly, the processing method did not influence the distribution of different CB grades in the conditions tested. Therefore, only the higher magnification micrographs are shown here for comparison purposes. The dark objects represent the CB and the light color areas represent the HNBR matrix material. Pseudo-spherical shaped primary particles could be identified in every sample, while several aggregations of filler particles are formed in the rubber structure, as those sizes are somewhat larger than the primary particle sizes.
(a) (b)
Figure 2. Cont.
Polymers 2019, 11, 61 8 of 20Polymers 2019, 11, x FOR PEER REVIEW 8 of 20
(c) (d)
Figure 2. TEM micrographs of HNBR filled with different CB grades: (a) HNBR1; (b) HNBR2; (c) HNBR3; (d) HNBR4.
As shown in Figure 2a, HNBR1 shows an even distribution of CB aggregates and a well-connected network throughout the matrix. The diameter of the majority of primary particles is in the range of ~30 nm and they are clearly packed creating irregular-shape structures which are connected each other. In Figure 2b, HNBR2 shows a rather disconnected network and more matrix material around and between CB aggregates. In fact, most primary particles in HNBR2 are bigger (~50 nm) than in HNBR1. Therefore, HNBR2 contains rather isometric CB structures, which are a few bigger particles formed together with less random branching, compared with HNBR1. In Figure 2c, small and big primary particles are clearly visible roughly in similar amounts. Further, the CB particle network density is higher compared with the HNBR2, however lower compared with the HNBR1. The number of particles in the structure and the branched nature as well as the matrix material around the aggregates is in moderate range compared with HNBR1 and HNBR2. With reference to the HNBR4 as shown in Figure 2d, the CB primary particles are relatively smaller (~15 nm), the aggregates are bigger and the network is much denser compared with the other tested grades. The aggregates have apparently formed larger agglomerates, which are indicated as dark clouds in three-dimensional form. Therefore, higher filler–filler interactions and relatively less matrix material around the filler particles are observed.
3.2. CB Grade Influence on Dynamic Mechanical Properties
The influence of the different CB grades on the mechanical properties of rapidly varying stress conditions over a range of temperature (−50 °C to 50 °C) was studied. The CB grade dependence on the loss factor (tan δ) deviation along the temperature is shown in Figure 3.
As depicted in Figure 3, the peak of the loss factor, which correlates to the glass transition temperature (Tg), and the intensity and width of the loss factor peak, which imply the damping properties [32], are slightly different in every tested grade. The lowest Tg was recorded with HNBR4, while HNBR2, HNBR3, and HNBR1 displayed slightly higher Tg values, respectively. However, a different trend in damping properties was witnessed, for example, the highest damping in HNBR2, and lower damping properties in HNBR3, HNBR4, and HNBR1, respectively. The storage modulus
Figure 2. TEM micrographs of HNBR filled with different CB grades: (a) HNBR1; (b) HNBR2; (c)HNBR3; (d) HNBR4.
3.2. CB Grade Influence on Dynamic Mechanical Properties
The influence of the different CB grades on the mechanical properties of rapidly varying stressconditions over a range of temperature (−50 ◦C to 50 ◦C) was studied. The CB grade dependence onthe loss factor (tan δ) deviation along the temperature is shown in Figure 3.
As depicted in Figure 3, the peak of the loss factor, which correlates to the glass transitiontemperature (Tg), and the intensity and width of the loss factor peak, which imply the dampingproperties [32], are slightly different in every tested grade. The lowest Tg was recorded with HNBR4,while HNBR2, HNBR3, and HNBR1 displayed slightly higher Tg values, respectively. However,a different trend in damping properties was witnessed, for example, the highest damping in HNBR2,and lower damping properties in HNBR3, HNBR4, and HNBR1, respectively. The storage modulusdeviation, the glass relaxation onset and the reduced magnitude followed similarly to the loss factordeviation trend. Therefore, it is not shown here.
According to the literature, the higher filler surface and the filler structure offer better filler–rubberinteractions as a result of strong bound and occluded rubber layers, where the chain motion ismore restricted compared with the rest of the matrix [24]. Consequently, the loss of segmentalmobility increases the Tg and damping properties [24,33]. Therefore, the ranking of HNBR2, HNBR3,and HNBR1 for having lower damping properties and higher Tg, respectively, correlate with therelatively higher filler surface area of CB in the composition and their better filler structures. Similarly,the TEM micrographs showed that HNBR1 contained the best filler network, while HNBR3 andHNBR2 contained comparatively less densified filler networks, respectively. However, HNBR4, whichaccommodates the highest primary particle surface area among the CB grades, does not correlatethe trend with other samples. As shown in Figure 2d, HNBR4 contains the highest filler networkand larger agglomerates in the material. Therefore, the filler agglomerates in the material reducedthe possible filler–rubber interactions and decreased the possible reinforcement and this could beassociated with the lowest Tg and moderate damping properties of HNBR4. However, the slightlyenhanced damping properties could be associated with the filler–filler interactions. The nominalhardness values for the tested grades showed as 87.3, 85.3, 86 and 86.3 SHA, for HNBR1, HNBR2,

Polymers 2019, 11, 61 9 of 20
HNBR3, and HNBR4, respectively, and it is also in good agreement with the damping propertiesrevealed in DMA. Theoretically, the rigid rubber shell due to the higher surface and better filler–rubberinteractions enhances the hardness of the total composite [19].
Polymers 2019, 11, x FOR PEER REVIEW 9 of 20
deviation, the glass relaxation onset and the reduced magnitude followed similarly to the loss factor deviation trend. Therefore, it is not shown here.
Figure 3. The temperature dependence of different CB grade compositions in HNBR on DMA analysis: the loss factor tan δ.
According to the literature, the higher filler surface and the filler structure offer better filler–rubber interactions as a result of strong bound and occluded rubber layers, where the chain motion is more restricted compared with the rest of the matrix [24]. Consequently, the loss of segmental mobility increases the Tg and damping properties [24,33]. Therefore, the ranking of HNBR2, HNBR3, and HNBR1 for having lower damping properties and higher Tg, respectively, correlate with the relatively higher filler surface area of CB in the composition and their better filler structures. Similarly, the TEM micrographs showed that HNBR1 contained the best filler network, while HNBR3 and HNBR2 contained comparatively less densified filler networks, respectively. However, HNBR4, which accommodates the highest primary particle surface area among the CB grades, does not correlate the trend with other samples. As shown in Figure 2d, HNBR4 contains the highest filler network and larger agglomerates in the material. Therefore, the filler agglomerates in the material reduced the possible filler–rubber interactions and decreased the possible reinforcement and this could be associated with the lowest Tg and moderate damping properties of HNBR4. However, the slightly enhanced damping properties could be associated with the filler–filler interactions. The nominal hardness values for the tested grades showed as 87.3, 85.3, 86 and 86.3 SHA, for HNBR1, HNBR2, HNBR3, and HNBR4, respectively, and it is also in good agreement with the damping properties revealed in DMA. Theoretically, the rigid rubber shell due to the higher surface and better filler–rubber interactions enhances the hardness of the total composite [19].
3.3. CB Grade Influence on Tensile Properties
The influence of the filled CB grades in HNBR in monotonic loading conditions is compared in Figure 4, where the stress–strain deviation, the tensile strength (σR) and the strain at break (εR), the stress at 10% (σ10%) and 50% strain (σ50%) deviation in different samples are shown in Figure 4a–c, respectively.
Figure 3. The temperature dependence of different CB grade compositions in HNBR on DMA analysis:the loss factor tan δ.
3.3. CB Grade Influence on Tensile Properties
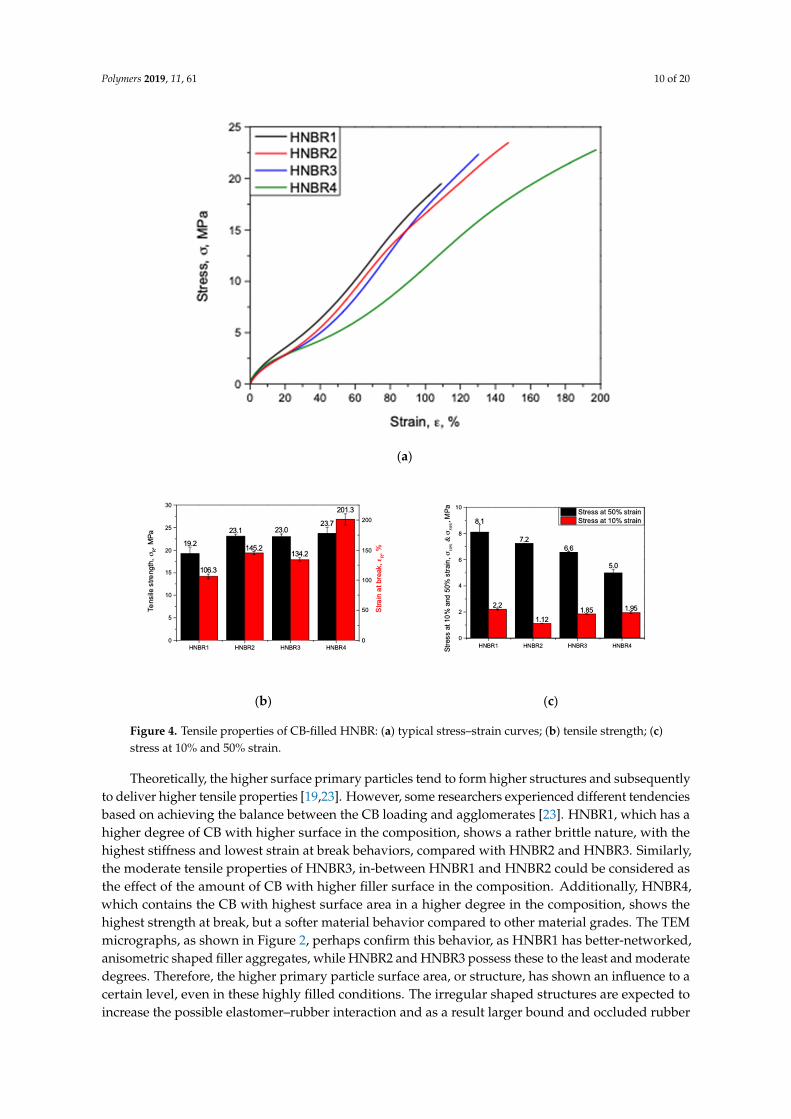
The influence of the filled CB grades in HNBR in monotonic loading conditions is comparedin Figure 4, where the stress–strain deviation, the tensile strength (σR) and the strain at break(εR), the stress at 10% (σ10%) and 50% strain (σ50%) deviation in different samples are shown inFigure 4a–c, respectively.
As shown in Figure 4a, a unique stress–strain behavior for the differently filled HNBR wasapparent. Especially, HNBR1 shows higher stresses from the beginning of the tests; however,the HNBR2 and HNBR3 deviate with slightly lower values, but in a similar range of properties.HNBR4 behaves differently from the rest, with rather high stresses at the beginning of the test,but showing rather softer material properties thereafter ~10–15% of strain. As depicted in Figure 4b,HNBR1 shows the lowest σR, and HNBR2 reveals relatively higher σR, while HNBR3 lies in betweenthem. Additionally, the HNBR4 samples demonstrate the highest σR values among the tested samples.The trend was similar for the strain at break, εR. A relatively different behavior for the σ10% and σ50%
was observed, as shown in Figure 4c, where, HNBR1 shows the highest stress levels in 10% strain,HNBR2 has the lowest σ10% and HNBR3 remains in-between them, while HNBR4 owns the secondbest σ10% after HNBR1. However, σ50% reveals a different trend, where HNBR1 has the highest valuesand HNBR2, HNBR3 and HNBR4 have lower values, respectively.
Polymers 2019, 11, 61 10 of 20Polymers 2019, 11, x FOR PEER REVIEW 10 of 20
(a)
(b) (c)
Figure 4. Tensile properties of CB-filled HNBR: (a) typical stress–strain curves; (b) tensile strength; (c) stress at 10% and 50% strain.
As shown in Figure 4a, a unique stress–strain behavior for the differently filled HNBR was apparent. Especially, HNBR1 shows higher stresses from the beginning of the tests; however, the HNBR2 and HNBR3 deviate with slightly lower values, but in a similar range of properties. HNBR4 behaves differently from the rest, with rather high stresses at the beginning of the test, but showing rather softer material properties thereafter ~10–15% of strain. As depicted in Figure 4b, HNBR1 shows the lowest σR, and HNBR2 reveals relatively higher σR, while HNBR3 lies in between them. Additionally, the HNBR4 samples demonstrate the highest σR values among the tested samples. The trend was similar for the strain at break, εR. A relatively different behavior for the σ10% and σ50% was observed, as shown in Figure 4c, where, HNBR1 shows the highest stress levels in 10% strain, HNBR2 has the lowest σ10% and HNBR3 remains in-between them, while HNBR4 owns the second best σ10% after HNBR1. However, σ50% reveals a different trend, where HNBR1 has the highest values and HNBR2, HNBR3 and HNBR4 have lower values, respectively.
Theoretically, the higher surface primary particles tend to form higher structures and subsequently to deliver higher tensile properties [19,23]. However, some researchers experienced
Figure 4. Tensile properties of CB-filled HNBR: (a) typical stress–strain curves; (b) tensile strength; (c)stress at 10% and 50% strain.
Theoretically, the higher surface primary particles tend to form higher structures and subsequentlyto deliver higher tensile properties [19,23]. However, some researchers experienced different tendenciesbased on achieving the balance between the CB loading and agglomerates [23]. HNBR1, which has ahigher degree of CB with higher surface in the composition, shows a rather brittle nature, with thehighest stiffness and lowest strain at break behaviors, compared with HNBR2 and HNBR3. Similarly,the moderate tensile properties of HNBR3, in-between HNBR1 and HNBR2 could be considered asthe effect of the amount of CB with higher filler surface in the composition. Additionally, HNBR4,which contains the CB with highest surface area in a higher degree in the composition, shows thehighest strength at break, but a softer material behavior compared to other material grades. The TEMmicrographs, as shown in Figure 2, perhaps confirm this behavior, as HNBR1 has better-networked,anisometric shaped filler aggregates, while HNBR2 and HNBR3 possess these to the least and moderatedegrees. Therefore, the higher primary particle surface area, or structure, has shown an influence to acertain level, even in these highly filled conditions. The irregular shaped structures are expected toincrease the possible elastomer–rubber interaction and as a result larger bound and occluded rubber
Polymers 2019, 11, 61 11 of 20
layers around filler. These layers are assumed to be partially restrained from deformation, and thisconsequently increases the effective filler concentration [18,19,24,33]. Therefore, the whole compositehas increased stiffness, owing to the decreased segmental mobility of polymer chains and consequentlya reduction of the flexibility of the rubber matrix [18,33]. However, in HNBR4, which contains a higheramount of highest surface area CB, apparently form aggregates and larger agglomerates (as Figure 2drevealed). As shown in Figure 1, these can probably create more filler–filler interactions and decreasethe matrix material around the particles. By applied external loading, the weakly bonded filler–filleragglomerates tend to collapse and expose the trapped rubber it may contain. Additionally, at higherstresses, the broken filler agglomerates slightly restrict the free movement of elastomeric chains [18,33].Therefore, at lower strain levels, relatively higher stress values but at higher strain levels, a softermaterial behavior and relatively higher strain at break values can be expected in HNBR4.
3.4. CB Effect on Rapid Gas Decompression
The RGD test data from the autoclave tests were reduced to two specific values; the maximumobserved volume change during the compression phase (the difference of volume at saturation phaseto initial volume) (∆VC), and the maximum observed volume change during the decompression phase(volume expansion compared with initial volume) (∆VD). The behavior of ∆VC and ∆VD for differentmaterial grades is as summarized in Figure 5a. The optical microscope pictures for the observed cracksin the cylindrical specimens of the different material grades are shown in Figure 5b. The numbers inthe microscope picture indicate the NORSOK rating, measuring the number of cracks and intensity ofcracks, of the implemented measurements for every material grade.
As depicted in Figure 5a, tested samples reveal slightly different volume increases to each otherduring the compression phase; HNBR2 and HNBR4 possess the comparatively highest and lowestvolume increase in this small range, respectively. Considering the decompression phase, HNBR1and HNBR4 demonstrate a lower volume change (~40%), while HNBR2 reveals the highest volumechange (~60%), and HNBR3 (~54%) shows a moderate increase. However, it should be mentionedthat all tested specimens for HNBR4 fell from view from the observation window of the autoclaveafter a certain time during the decompression phase with a fast crack growth from the inside to theoutside of the specimen. All other specimens remained in their freestanding position with only slightmovements. Therefore, ∆VD of HNBR4 samples may not indicate the precise values or hold highscattering. Despite a certain tendency in the ∆VC and ∆VD, the microscope observation and theNORSOK ranking indicate a different behavior. A higher number of cracks were apparent on thecross-sections of HNBR1 and HNBR4; they were considerably more than 80% of the cross-section.Therefore, the lower resistance to RGD was observed with HNBR1 (4, 3, 3) and HNBR4 (3, 2, 3). WhileHNBR3 (0, 1, 3) and HNBR2 (0, 1, 0) revealed only a few and minor cracks in the cylindrical specimens,respectively, and consequently a better resistance to RGD failure.
As depicted in Figure 5a, the ∆VD follows a trend similar to ∆VC, but in a greater magnitude.The volume increase during the high-pressure CO2 exposure could be explained as a parameter ofsolubility of the gas into the material and the dissolved gas in the material as responsible for volumeexpansion during the decompression phase. In the tested conditions, the CB grades with the differentsurface area have seemingly influenced the solubility of the gas. For example, in HNBR1, HNBR2,and HNBR3, the ∆VC and ∆VD show a correlation with the CB grade, where a higher degree ofmiddle range primary particles in the composition has caused a comparatively lower volume increase.Similarly, HNBR4 has the lowest volume change during compression among the tested samples, wherehigher degree of small particles are contained. In general, higher gas solubility and a lower rate ofdiffusion in elastomers tend to deliver a lower RGD resistance in the material [9,34], however, a clearlyimproved RGD resistance in HNBR2 and HNBR3 was observed compared with the other two materials,irrespective the higher compression and decompression volume increases.

Polymers 2019, 11, 61 12 of 20Polymers 2019, 11, x FOR PEER REVIEW 13 of 21
(a)
HNBR1 HNBR2
HNBR3 HNBR4
(b)
Figure 5. Influence of CB grades composition on rapid gas decompression (RGD) performance of HNBR: (a) volume increase during compression (ΔVC) and decompression (ΔVD); (b) visual observation of cylindrical specimens and the NORSOK material ranking (every number on the right represents a different measurement).
At high-pressure exposure, gas permeates into the elastomers and dissolves in the matrix material at small imperfections or filler–matrix interfaces, if the filler–matrix interaction is poor, until saturation [4,6,9,31]. In the tested conditions, where the samples contained the same filler loading, the HNBR with lower surface CB showed a slightly higher volume increase in the compression phase,
4
3
3
0
1
0
0
1
3
3
2
3
Figure 5. Influence of CB grades composition on rapid gas decompression (RGD) performanceof HNBR: (a) volume increase during compression (∆VC) and decompression (∆VD); (b) visualobservation of cylindrical specimens and the NORSOK material ranking (every number on the rightrepresents a different measurement).
At high-pressure exposure, gas permeates into the elastomers and dissolves in the matrixmaterial at small imperfections or filler–matrix interfaces, if the filler–matrix interaction is poor,until saturation [4,6,9,31]. In the tested conditions, where the samples contained the same filler loading,

Polymers 2019, 11, 61 13 of 20
the HNBR with lower surface CB showed a slightly higher volume increase in the compression phase,∆VC. Briscoe et al. [4], explained the addition of filler into matrix alter the sorption properties basedon the quality of the filler–rubber interaction. If the interface is strong, it significantly reduces thegas sorption compared with unfilled and vice versa. This is attributed as the filler–rubber interactioncreates strong rubber layers around the filler and it decreases the effective matrix amount, which canpossibly dissolve the gas. On the other hand, filler inclusion improves the mechanical properties of thematrix and it reduces the entering gas into the material [4]. Similarly, Jamabe et al. [7] explained, thatgas solubility of filled rubber is influenced by surface area of the filler as well as the interface structureof filler–rubber interaction. However, in their experiments with CB filled EPDM in high-pressure(10 MPa) hydrogen atmosphere, they observed that, at lower filler loading levels (25 phr), CB gradeswith smaller primary particles had a higher solubility, but at higher loading levels (50 phr), they did notfind a clear trend [7]. Under the tested conditions, higher surface CB tends to create complex structures(also visible in TEM micrographs in Figure 2); it could deliver better filler–rubber interactions, enhancethe effective filler concentration through possible restricted matrix movements (Occluded and boundrubber layers), and consequently, reduce the elastically effective matrix material component. Thiscan be a plausible interpretation for the ∆VC trend. Further, the mechanical properties, especiallythe trend of σ10% of the quasi-static tensile test results (Figure 4c), have a possible influence on thesame trend of ∆VC. The volume increase in compression and decompression phases (∆VC and ∆VD)deviate in less than 10 percent of strain levels (<10%, ε), therefore σ10% is in good agreement with ∆VCand ∆VD. Similarly, the DMA damping properties deviated in a similar order. Therefore, apparentlythe solubility of gas is slightly decreased due to decreased effective matrix content and increasedmechanical properties in higher filler surface conditions.
During the decompression phase, the accumulated gas in the material is subjected to nucleateat expansion-forming micrometer-sized bubbles. Initially, they do not form cracks so long as thematerial deforms elastically without inhibition [2,4,12]. If no crack was initiated, the dissolvedgas becomes extinct desorbing them without any visible traces [8]. However, if the high rate ofelastic expansion meets a low strength matrix or hard body inclusions where the stress concentrates,crack initiation and propagation take place in the elastomer bulk as well as in the hard body-matrixinterfaces [6,35]. In the tested conditions, the volume increase during the decompression, ∆VD,(Figure 5a) seemed to follow the same trend of ∆VC and it is probably correlated to the stiffnessof the different grades and the degree of dissolved gas in the saturated state. Additionally, ∆VDcould be reduced by possible cracks propagated during the decompression phase. It is generallyaccepted that the resistance to RGD of elastomers is increased if the gas sorption into the materialis lower and the physical properties (stiffness, tensile strength, tear resistance, etc.) of the materialare higher [6–9,31,35]. However, NORSOK ranking of tested samples revealed otherwise: whereHNBR1 and HNBR4 have the lowest RGD resistance, while HNBR3 and HNBR2 reveal a significantlybetter resistance to RGD. The RGD phenomenon of elastomers is a rather complex process with acombination of many factors. However, in this test series, the samples are highly filled, consequentlyan enhanced filler network and agglomerates as well as reduced matrix component are expected. Asrevealed in TEM micrographs (Figure 2), the networks of CB in all four material grades are clearlyinfluenced by the higher particle surface. The higher CB structures, which were formed due to highersurface area, tend to form thick rubber layers around them, which enhance the effective filler amountand decrease the active matrix component. However, HNBR4, which contains CB with the highestsurface area, apparently creates larger filler agglomerates and less matrix material around fillers.In these highly filled conditions, the higher surface area CB is adversely effective in RGD resistance;HNBR2, which has the lowest structure and CB network density, reveals the best RGD resistance,while HNBR3 and HNBR1 disclose relatively lower RGD resistance. HNBR3 and HNBR1 containcomparatively higher CB structures and networks in the materials, respectively. Therefore, it couldbe assumed that if there were a sufficient amount of elastically active matrix material in the material,the bubbles nucleation and growth during the decompression phase would be assisted. However,

Polymers 2019, 11, 61 14 of 20
when the filler network is densified or effective CB volume increased due to the rigid matrix aroundthe CB, subsequently the active matrix composition is decreased and the possible bubble growth inmatrix hinders during decompression phase. This concentrates stresses around the rigid inclusionsand tends to initiate cracks.
HNBR4 at lower strain levels maintains relatively higher stress values due to filler–fillerinteractions. However, above a certain strain level, the agglomerates tend to break and steer toa softer material behavior. Therefore, the lower ∆VC values were observed and at the same time,a lower RGD resistance was experienced. This material grade even fell from sight from the observationwindow during the autoclave test: the sample, which was in a freestanding position on the grounddisplaced, as a result of faster crack growths in the material. The stress concentrations during thedecompression volume expansion probably tend to break the CB agglomerates and once the crackinitiates, it grows faster through the rather soft material.
CB loading and CB surface area improve the mechanical properties in elastomeric composite,which are essential for RGD resistance. However, apparently, after a certain level of CB loading, it isbetter to have lower CB surface/bigger primary particles in the material in terms of RGD resistance.
3.5. SEM Based Fractography
In the following section, the fracture surfaces of RGD tested cylindrical specimens, which wereexamined using SEM, are displayed for understanding the crack initiation, the modes of crackpropagations and the morphology of rubber/CB of differently filled samples. Figure 6 shows theSEM images of a fracture surface of HNBR1 on a more global scale (a) and the magnified view of thecrack initiation (b). The point where many small tearing lines converge, as highlighted in Figure 6a byarrows, can identify the crack origin. The crack growth lines seem to create a microscopically roughsurface. Therefore, the fracture surface texture of the HNBR1 suggests that it contains pits/cavities as aresult of reinforcing CB agglomerates coming out of the matrix surface. As shown in Figure 6b, no realpre-existing cracks or defects were apparent in the vicinity of the initiation point, but only a roughsurface as a result of loosened agglomerate detachment. The literature suggests that the loosenedagglomerates, due to the inhomogeneous cross-link density, can act as stress raisers and offer a pathfor the tear to follow [7,12]. However, this seems like a stable crack growth as the fracture surface hasa similarly rough texture along the crack growth.Polymers 2019, 11, x FOR PEER REVIEW 15 of 20
(a) (b)
Figure 6. SEM images of a typical fracture surface of HNBR1 in different magnifications: (a) fracture initiation and propagation; (b) magnified view of fracture initiation.
Figure 7 shows a fracture surface of HNBR2 in different magnifications. A crack initiation and propagation sight are indicated in Figure 7a, while Figure 7b focuses on the initiation point. Similar to Figure 6, the crack initiation is clearly visible in Figure 7a, where many small tear lines spread out from one place. As visible in the magnified view in Figure 7b, the crack initiated from a rather flat surface of ~15 μm, which is not an extrinsic defect, but seemingly a low strength matrix area. This could have been introduced to the material by poor CB networks as confirmed by TEM micrographs (Figure 3b). However, a rough fracture surface is visible indicating a slow crack growth throughout the crack propagation.
(a) (b)
Figure 7. SEM images of a typical fracture surface of HNBR2 in different magnifications: (a) fracture initiation and propagation; (b) magnified view of fracture initiation from a low strength site.
SEM images of a fracture surface for HNBR3 are shown in Figure 8, where the crack initiated from a large cluster and as a result of the fracture (Figure 8a). The cluster was exfoliated from the surface creating a large pit on the surface and it could be a large CB agglomerate covered by the matrix or formed by other additives in the compound with a defect size ~150 μm. The Figure 8b
Figure 6. SEM images of a typical fracture surface of HNBR1 in different magnifications: (a) fractureinitiation and propagation; (b) magnified view of fracture initiation.

Polymers 2019, 11, 61 15 of 20
Figure 7 shows a fracture surface of HNBR2 in different magnifications. A crack initiation andpropagation sight are indicated in Figure 7a, while Figure 7b focuses on the initiation point. Similarto Figure 6, the crack initiation is clearly visible in Figure 7a, where many small tear lines spread outfrom one place. As visible in the magnified view in Figure 7b, the crack initiated from a rather flatsurface of ~15 µm, which is not an extrinsic defect, but seemingly a low strength matrix area. Thiscould have been introduced to the material by poor CB networks as confirmed by TEM micrographs(Figure 3b). However, a rough fracture surface is visible indicating a slow crack growth throughoutthe crack propagation.
Polymers 2019, 11, x FOR PEER REVIEW 15 of 20
(a) (b)
Figure 6. SEM images of a typical fracture surface of HNBR1 in different magnifications: (a) fracture initiation and propagation; (b) magnified view of fracture initiation.
Figure 7 shows a fracture surface of HNBR2 in different magnifications. A crack initiation and propagation sight are indicated in Figure 7a, while Figure 7b focuses on the initiation point. Similar to Figure 6, the crack initiation is clearly visible in Figure 7a, where many small tear lines spread out from one place. As visible in the magnified view in Figure 7b, the crack initiated from a rather flat surface of ~15 μm, which is not an extrinsic defect, but seemingly a low strength matrix area. This could have been introduced to the material by poor CB networks as confirmed by TEM micrographs (Figure 3b). However, a rough fracture surface is visible indicating a slow crack growth throughout the crack propagation.
(a) (b)
Figure 7. SEM images of a typical fracture surface of HNBR2 in different magnifications: (a) fracture initiation and propagation; (b) magnified view of fracture initiation from a low strength site.
SEM images of a fracture surface for HNBR3 are shown in Figure 8, where the crack initiated from a large cluster and as a result of the fracture (Figure 8a). The cluster was exfoliated from the surface creating a large pit on the surface and it could be a large CB agglomerate covered by the matrix or formed by other additives in the compound with a defect size ~150 μm. The Figure 8b
Figure 7. SEM images of a typical fracture surface of HNBR2 in different magnifications: (a) fractureinitiation and propagation; (b) magnified view of fracture initiation from a low strength site.
SEM images of a fracture surface for HNBR3 are shown in Figure 8, where the crack initiated froma large cluster and as a result of the fracture (Figure 8a). The cluster was exfoliated from the surfacecreating a large pit on the surface and it could be a large CB agglomerate covered by the matrix orformed by other additives in the compound with a defect size ~150 µm. The Figure 8b magnifies theedge of the pit and the vicinity of the initiation point. Inside the pit, it seems that the matrix has failedaround the large cluster, which was loosely bound. The vicinity of the initiation point was a rough andlamellar structure, which apparently indicates a stable crack growth. Therefore, it could be assumedthat the gas is accumulated near the rigid inclusion during gas compression and upon decompression,the expansion of gas volume encounters the crack initiation and propagation through low-strengthsites. The large inclusions behave as if they were smaller voids causing gas to accumulate, which helpsa crack to grow and inflate under depressurization [34].
Figures 9 and 10 show two fracture surfaces of HNBR4 in different magnifications, which containdifferent crack initiation and propagation morphologies. Figure 9a displays an initiated crack insidethe cylinder propagating to the outer surface, while Figure 9b magnifies the origin of the crack.As indicated by the arrows, the cracks were pronounced in the material in the fracture initiation region.This could be an indication that the fracture propagated from cavities, which were initiated as a resultof inherent voids in the material. It can be assumed that the small voids in the material nucleated thegas during the pressurization, while during depressurization, they rupture, creating cavities in thematerial. These open cavities could act as stress raisers and offer an easy path to propagate flaws withcracks perpendicular to the cavities to a fatal fracture as many were observed in this material grade.

Polymers 2019, 11, 61 16 of 20
Polymers 2019, 11, x FOR PEER REVIEW 16 of 20
magnifies the edge of the pit and the vicinity of the initiation point. Inside the pit, it seems that the matrix has failed around the large cluster, which was loosely bound. The vicinity of the initiation point was a rough and lamellar structure, which apparently indicates a stable crack growth. Therefore, it could be assumed that the gas is accumulated near the rigid inclusion during gas compression and upon decompression, the expansion of gas volume encounters the crack initiation and propagation through low-strength sites. The large inclusions behave as if they were smaller voids causing gas to accumulate, which helps a crack to grow and inflate under depressurization [34].
(a) (b)
Figure 8. SEM images of a fracture surface of HNBR3 in different magnifications: (a) fracture initiation from a rigid body; (b) magnified view of fracture initiation and propagation.
Figures 9 and 10 show two fracture surfaces of HNBR4 in different magnifications, which contain different crack initiation and propagation morphologies. Figure 9a displays an initiated crack inside the cylinder propagating to the outer surface, while Figure 9b magnifies the origin of the crack. As indicated by the arrows, the cracks were pronounced in the material in the fracture initiation region. This could be an indication that the fracture propagated from cavities, which were initiated as a result of inherent voids in the material. It can be assumed that the small voids in the material nucleated the gas during the pressurization, while during depressurization, they rupture, creating cavities in the material. These open cavities could act as stress raisers and offer an easy path to propagate flaws with cracks perpendicular to the cavities to a fatal fracture as many were observed in this material grade.
Figure 8. SEM images of a fracture surface of HNBR3 in different magnifications: (a) fracture initiationfrom a rigid body; (b) magnified view of fracture initiation and propagation.
As shown in Figure 10, the initiation point (square highlighted) did not occur at a rigid inclusionor a cavity, but a flat surface, seemingly a low strength matrix surface. The crack propagation isdifferent from other observed morphologies of the previous SEM images. As indicated in Figure 10aby arrows, there are hackle lines, which are formed by converging the small tearing lines to create alarge crack. After the hackle lines, the crack propagation mode seemingly transitions from slow crackpropagation to a stable fast crack. Therefore, a fast crack growth region is apparent with a rather flat,smooth surface compared with the slow crack propagation region. During the autoclave test, everyHNBR4 specimen fell from the standing position and disappeared from the observation window dueto this high-speed crack growth similar to a bursting behavior. The cracks were even visible to thenaked eye on the outer surface of the tested cylindrical specimen.
Polymers 2019, 11, x FOR PEER REVIEW 17 of 21
Figure 8. SEM images of a fracture surface of HNBR3 in different magnifications: (a) fracture initiation from a rigid body; (b) magnified view of fracture initiation and propagation.
Figures 9 and 10 show two fracture surfaces of HNBR4 in different magnifications, which contain different crack initiation and propagation morphologies. Figure 9a displays an initiated crack inside the cylinder propagating to the outer surface, while Figure 9b magnifies the origin of the crack. As indicated by the arrows, the cracks were pronounced in the material in the fracture initiation region. This could be an indication that the fracture propagated from cavities, which were initiated as a result of inherent voids in the material. It can be assumed that the small voids in the material nucleated the gas during the pressurization, while during depressurization, they rupture, creating cavities in the material. These open cavities could act as stress raisers and offer an easy path to propagate flaws with cracks perpendicular to the cavities to a fatal fracture as many were observed in this material grade.
(a) (b)
Figure 9. SEM images of a fracture surface starting from inherent voids of HNBR4 in different magnifications: (a) fracture initiation and propagation; (b) magnified view of fracture initiation and cracks into the material.
As shown in Figure 10, the initiation point (square highlighted) did not occur at a rigid inclusion or a cavity, but a flat surface, seemingly a low strength matrix surface. The crack propagation is different from other observed morphologies of the previous SEM images. As indicated in Figure 10a by arrows, there are hackle lines, which are formed by converging the small tearing lines to create a large crack. After the hackle lines, the crack propagation mode seemingly transitions from slow crack propagation to a stable fast crack. Therefore, a fast crack growth region is apparent with a rather flat, smooth surface compared with the slow crack propagation region. During the autoclave test, every HNBR4 specimen fell from the standing position and disappeared from the observation window due to this high-speed crack growth similar to a bursting behavior. The cracks were even visible to the naked eye on the outer surface of the tested cylindrical specimen.
The SEM analyses of the fracture surfaces of RGD tested samples revealed that the cracks initiated in the center region of the cylinder and propagated towards the circumference. The cracks were apparently initiated at the existing voids, hard body inclusions (particle agglomerate), or a low strength matrix site. Similar observations were reported in the literature for the RGD fracture initiation [3,6,7,12]. The small voids or hard inclusions are hard to avoid during processing [34], the low strength matrix sites are a result of lower filler distribution, uneven cross-link density or trapped rubber between large CB agglomerates which becomes ‘free’ once the aggregate structure breaks apart [7,12,24]. It was challenging to correlate the SEM fractography observations to the CB grade or
Figure 9. SEM images of a fracture surface starting from inherent voids of HNBR4 in differentmagnifications: (a) fracture initiation and propagation; (b) magnified view of fracture initiation andcracks into the material.

Polymers 2019, 11, 61 17 of 20
Polymers 2019, 11, x FOR PEER REVIEW 17 of 20
(a) (b)
Figure 9. SEM images of a fracture surface starting from inherent voids of HNBR4 in different magnifications: (a) fracture initiation and propagation; (b) magnified view of fracture initiation and cracks into the material.
As shown in Figure 10, the initiation point (square highlighted) did not occur at a rigid inclusion or a cavity, but a flat surface, seemingly a low strength matrix surface. The crack propagation is different from other observed morphologies of the previous SEM images. As indicated in Figure 10a by arrows, there are hackle lines, which are formed by converging the small tearing lines to create a large crack. After the hackle lines, the crack propagation mode seemingly transitions from slow crack propagation to a stable fast crack. Therefore, a fast crack growth region is apparent with a rather flat, smooth surface compared with the slow crack propagation region. During the autoclave test, every HNBR4 specimen fell from the standing position and disappeared from the observation window due to this high-speed crack growth similar to a bursting behavior. The cracks were even visible to the naked eye on the outer surface of the tested cylindrical specimen.
The SEM analyses of the fracture surfaces of RGD tested samples revealed that the cracks initiated in the center region of the cylinder and propagated towards the circumference. The cracks were apparently initiated at the existing voids, hard body inclusions (particle agglomerate), or a low strength matrix site. Similar observations were reported in the literature for the RGD fracture initiation [3,6,7,12]. The small voids or hard inclusions are hard to avoid during processing [34], the low strength matrix sites are a result of lower filler distribution, uneven cross-link density or trapped rubber between large CB agglomerates which becomes ‘free’ once the aggregate structure breaks apart [7,12,24]. It was challenging to correlate the SEM fractography observations to the CB grade or size of the primary particles or agglomerates in different materials. However, HNBR1, HNBR2, and HNBR3 showed coarse surfaces, which contained small pits on the fracture surface, and it can be assumed to be traces of reinforcing agglomerates detached from the matrix. In HNBR4, a slow crack growth was transformed into rapid crack propagation to a catastrophic failure after the initial cracks converged into a critical size crack (hackle).
Figure 10. SEM image of a fracture surface starting from low-strength matrix site and a propagation in slow and subsequently fast stable crack growth for HNBR4.
4. Summary and Conclusions
Figure 10. SEM image of a fracture surface starting from low-strength matrix site and a propagation inslow and subsequently fast stable crack growth for HNBR4.
The SEM analyses of the fracture surfaces of RGD tested samples revealed that the cracks initiatedin the center region of the cylinder and propagated towards the circumference. The cracks wereapparently initiated at the existing voids, hard body inclusions (particle agglomerate), or a low strengthmatrix site. Similar observations were reported in the literature for the RGD fracture initiation [3,6,7,12].The small voids or hard inclusions are hard to avoid during processing [34], the low strength matrixsites are a result of lower filler distribution, uneven cross-link density or trapped rubber betweenlarge CB agglomerates which becomes ‘free’ once the aggregate structure breaks apart [7,12,24]. It waschallenging to correlate the SEM fractography observations to the CB grade or size of the primaryparticles or agglomerates in different materials. However, HNBR1, HNBR2, and HNBR3 showedcoarse surfaces, which contained small pits on the fracture surface, and it can be assumed to be traces ofreinforcing agglomerates detached from the matrix. In HNBR4, a slow crack growth was transformedinto rapid crack propagation to a catastrophic failure after the initial cracks converged into a criticalsize crack (hackle).
4. Summary and Conclusions
This work focused on the influence on rapid gas decompression failure of different grades of CB,which had different surface areas, filled in HNBR. Regarding the RGD test results, the trend of thevolume increase of cylindrical specimens during the compression phase, which is a measurement ofgas solubility into the material, evidently followed the component of CB with a lower surface area inthe material. In general, filler loading reduces the elastically effective matrix component, increasesmechanical properties of matrix, and decreases the gas sorption into elastomers. However, a poorfiller–rubber interaction can trap the gas and increase sorption. In these highly filled conditions, the CBsurface area has slightly influenced the solubility (assumed by compression phase volume increase)by reducing the effective matrix component and the increased mechanical properties. The tensileand DMA results proved the slight improvements in the mechanical properties based on higher CBsurface area. However, HNBR4, which contained a greater amount of relatively higher surface areaCB, revealed a rather different behavior compared with the other three grades. In addition, from theTEM micrographs, it can be assumed that HNBR4 contained bigger CB agglomerates and filler–fillernetworks. Therefore, a relatively higher stiffness at lower strain levels and softer material behavior at

Polymers 2019, 11, 61 18 of 20
higher strain levels could be associated with the breakage of loosely bonded CB agglomerates andconsequently, a rather free movement of molecules at higher strains. The volume increase in thedecompression phase followed the same trend in compression phase in RGD tests, as a consequence ofmechanical properties and the amount of saturated gas in the material, but NORSOK ranking showeda different rating. The initiated cracks can also possibly be responsible for some extent of lower volumeincrease during decompression phase. The TEM micrographs disclosed higher anisometric structuresand better networks in samples with higher surface CB and relatively lower matrix componentsaround them. HNBR2 showed the best RGD resistance next to HNBR3, where they retained lowerCB structures as well as relatively greater matrix components around the CB structures. HNBR4and HNBR1 disclosed relatively larger and higher number of cracks on the cross-sections after RGD.The greater filler structure discourages movement of rubber molecules around them from formingbound rubber and occluded rubber and it decreases effective matrix components. Therefore, HNBR1lacks matrix material around the hard inclusions, which can elastically deform and assist the possiblebubble nucleation and growth during the decompression phase. However, HNBR4, which containsa greater amount of CB agglomerates, eases crack growth after loosely bonded filler–filler bondrupture. Apparently, a minimum amount of matrix component around the CB grades is necessaryto maintain the RGD resistance, along with other highly relevant parameters, as discussed above,for example, higher stiffness, tear, and tensile strength, lower gas solubility, etc. Therefore, in highlyfilled conditions, the size of the CB primary particles influences the properties in harsh environmentutilization. The smaller CB particles tend to create denser filler networks and greater amount ofagglomerates, which reduce the effective matrix component in the composite. Apparently, this isadversely effective in RGD resistance. SEM-based fractography did not influence the crack initiationbased on different CB grades. However, it revealed that the cracks initiated from possible low strengthmatrix areas, hard inclusions or existing voids propagated to the outer surface.
Author Contributions: W.B. conducted the tests and L.C. obtained the TEM micrographs; W.B. and B.S. analyzedthe data and discussed the results; T.S. contributed the materials; G.P. and T.S. consulted on the research work andheld scientific discussions; W.B. conducted the literature research and wrote the paper.
Funding: This research was funded under one of the projects (grant number: 854178) by the Austrian ResearchPromotion Agency (FFG).
Acknowledgments: The research work was performed at the Polymer Competence Center Leoben GmbH(PCCL, Austria) within the framework of the COMET-program of the Austrian Federal Ministry for Transport,Innovation and Technology (BMVIT), the Austrian Federal Ministry of Digital and Economic Affairs (BMDW)with contributions from the material science and testing of polymers of the Montanuniversität Leoben and SKFSealing Solutions Austria GmbH. The PCCL is funded by the Austrian Government and the State Governments ofStyria, Lower Austria and Upper Austria.
Conflicts of Interest: The authors declare no conflict of interest.
References
1. Hofmann, W. Rubber Technology Handbook, 2nd ed.; Hanser Publishers: Munich, Germany; Vienna, Austria;New York, NY, USA, 1989.
2. Briscoe, B.J.; Zakaria, S. Gas-induced damage in elastomeric composites. J. Mater. Sci. 1990, 25, 3017–3023.[CrossRef]
3. Major, Z.; Lang, R.W. Characterization of the fracture behavior of NBR and FKM grade elastomers for oilfieldapplications. Eng. Fail. Anal. 2010, 17, 701–711. [CrossRef]
4. Briscoe, B.J.; Savvas, T.; Kelly, C.T. “Explosive Decompression Failure” of Rubbers: A Review of the Originsof Pneumatic Stress Induced Rupture in Elastomers. Rubber Chem. Technol. 1994, 67, 384–416. [CrossRef]
5. Ho, E. Elastomeric Seals for Rapid Gas Decompression Applications in High-Pressure Services. In BHRGroup Limited Research Report 485 for the Health; BHR Group Limited for the Health and Safety Executive:Sudbury, UK, 2006.
Polymers 2019, 11, 61 19 of 20
6. Major, Z.; Lederer, K.; Moitzi, M.; Mitterhuber, M.; Schwarz, T.; Lang, R.W. Development of a Test and FailureAnalysis Methodology for Elastomeric Seals Exposed to Explosive Decompression. Eng. Struct. Integr. Res.Dev. Appl. 2006, 2, 754–757.
7. Yamabe, J.; Nishimura, S. Influence of carbon black on decompression failure and hydrogen permeationproperties of filled ethylene-propylene-diene-methylene rubbers exposed to high-pressure hydrogen gas.J. Appl. Polym. Sci. 2011, 122, 3172–3187. [CrossRef]
8. Yamabe, J.; Nishimura, S. Influence of fillers on hydrogen penetration properties and blister fracture ofrubber composites for O-ring exposed to high-pressure hydrogen gas. Int. J. Hydrogen Energy 2009, 34,1977–1989. [CrossRef]
9. Schrittesser, B.; Pinter, G.; Schwarz, T.; Kadar, Z.; Nagy, T. Rapid gas decompression performance ofelastomers—A study of influencing testing parameters. Procedia Struct. Integr. 2016, 2, 1746–1754. [CrossRef]
10. Embury, P. High-pressure gas testing of elastomer seals and a practical approach to designing for explosivedecompression service. Seal. Technol. 2004, 2004, 6–11. [CrossRef]
11. Schrittesser, B.; Pinter, G.; Schwarz, T.; Nagy, T.; Urbán, M. Fracture and Fatigue Behavior of ElastomersUsed in the Oil and Gas Industry. In Proceedings of the High Performance for Oil and Gas, Oil and GasPolymer Engineering Texas Conference, Houston, TX, USA, 10–12 April 2013.
12. Mbwadzawo, T.; Hodzic, A. Scanning Electron Microscopy Analysis of Elastomeric O-Rings and SpringSeals Fractured during Rapid Gas Decompression. In Proceedings of the 16th European Conference onComposite Materials (ECCM16), Seville, Spain, 22–26 June 2014.
13. Vorotnikov, D.A. Dissipative solutions for equations of viscoelastic diffusion in polymers. J. Math. Anal. Appl.2008, 339, 876–888. [CrossRef]
14. Comyn, J. Polymer Permeability; Springer: Dordrecht, The Netherlands, 1985.15. Hertz, D.L. Elastomers in CO2. In Proceedings of the High Performance Elastomers & Polymers for Oil &
Gas 2012 International Conference, Aberdeen, UK, 20–21 April 2012.16. Daou, F.; de Miranda, C.R.; de Oliveira, J.L.; Engelke, B.; Borman, C.; Le Roy-Delage, S.; Lungwitz, B.
Swelling of Elastomers in CO2 Environment: Testing Methodology and Experimental Data. In Proceedingsof the SPE International SPE Latin America and Caribbean Petroleum Engineering Conference, Maracaibo,Venezuela, 21 May 2014.
17. Heinrich, G.; Klüppel, M.; Vilgis, T.A. Reinforcement of elastomers. Curr. Opin. Solid State Mater. Sci. 2002, 6,195–203. [CrossRef]
18. Fröhlich, J.; Niedermeier, W.; Luginsland, H.-D. The effect of filler–filler and filler–elastomer interaction onrubber reinforcement. Compos. Part A Appl. Sci. Manuf. 2005, 36, 449–460. [CrossRef]
19. Li, Z.H.; Zhang, J.; Chen, S.J. Effects of carbon blacks with various structures on vulcanization andreinforcement of filled ethylene-propylene-diene rubber. Express Polym. Lett. 2008, 2, 695–704. [CrossRef]
20. Orion Engineered Carbons GmbH. What Is Carbon Black? Luxembourg, Germany, 2015; Available online:https://www.thecarycompany.com/media/pdf/specs/orion-what-is-carbon-black.pdf (accessed on 28February 2018).
21. Carbon Black. Available online: https://monographs.iarc.fr/ENG/Monographs/vol93/mono93-6.pdf(accessed on 12 March 2018).
22. Leblanc, J. Rubber–filler interactions and rheological properties in filled compounds. Prog. Polym. Sci. 2002,27, 627–687. [CrossRef]
23. Savetlana, S.; Zulhendri; Sukmana, I.; Saputra, F.A. The effect of carbon black loading and structure ontensile property of natural rubber composite. IOP Conf. Ser. Mater. Sci. Eng. 2017, 223, 12009. [CrossRef]
24. Kohls, D.J.; Beaucage, G. Rational design of reinforced rubber. Curr. Opin. Solid State Mater. Sci. 2002, 6,183–194. [CrossRef]
25. Stübler, N.; Fritzsche, J.; Klüppel, M. Mechanical and electrical analysis of carbon black networking inelastomers under strain. Polym. Eng. Sci. 2011, 51, 1206–1217. [CrossRef]
26. Jha, V. Carbon Black Filler Reinforcement of Elastomers. Ph.D. Thesis, University of London, Queen Mary,UK, October 2008.
27. Gent, A.N.; Lindley, P.B. Internal Rupture of Bonded Rubber Cylinders in Tension. Proc. R. Soc. A Math. Phys.Eng. Sci. 1959, 249, 195–205. [CrossRef]
28. Harwood, J.A.C.; Mullins, L.; Payne, A.R. Stress Softening in Natural Rubber Vulcanizates. Part II. StressSoftening Effects in Pure Gum and Filler Loaded Rubbers. Rubber Chem. Technol. 1966, 39, 814–822. [CrossRef]

Polymers 2019, 11, 61 20 of 20
29. Zhang, A.; Wang, L.; Lin, Y.; Mi, X. Carbon black filled powdered natural rubber: Preparation, particle sizedistribution, mechanical properties, and structures. J. Appl. Polym. Sci. 2006, 101, 1763–1774. [CrossRef]
30. NORSOK. Qualification of Non-Metallic Sealing Materials and Manufacturers, 1st ed.; (NORSOK M-710);Norwegian Technology Center: Trondheim, Norway, 1994; Available online: http://www.standard.no/pagefiles/1152/m-cr-710r1.pdf (accessed on 22 March 2018).
31. Balasooriya, W.; Schrittesser, B.; Pinter, G.; Schwarz, T. Induced material degradation of elastomers in harshenvironments. Polym. Test. 2018, 69, 107–115. [CrossRef]
32. Balasooriya, W.; Schrittesser, B.; Karunakaran, S.; Schlögl, S.; Pinter, G.; Schwarz, T.; Kadar, Z. Influenceof Thermo-Oxidative Ageing of HNBR in Oil Field Applications. Macromol. Symp. 2017, 373, 1600093.[CrossRef]
33. Bokobza, L. Multiwall carbon nanotube elastomeric composites: A review. Polymer 2007, 48, 4907–4920.[CrossRef]
34. Monaghan, K.J.; Newlands, C.; Ho, E. Specification of Elastomeric Materials for Rapid Gas DecompressionApplications. In Proceedings of the Oilfield Engineering with Polymers Conference: 5th International MERLConference, London, UK, 29–30 March 2006.
35. Achten, D. Next Generation HNBR Grades—New Materials for Oilfield Application. In Proceedings of theOilfield Engineering with Polymers Conference: 5th International MERL Conference, London, UK, 29–30March 2006.
© 2019 by the authors. Licensee MDPI, Basel, Switzerland. This article is an open accessarticle distributed under the terms and conditions of the Creative Commons Attribution(CC BY) license (http://creativecommons.org/licenses/by/4.0/).