The effect of substitution of Mn by Fe and Cr on the martensitic transition in the Ni50Mn34In16...
12
This content has been downloaded from IOPscience. Please scroll down to see the full text. Download details: IP Address: 163.118.172.206 This content was downloaded on 22/08/2014 at 17:18 Please note that terms and conditions apply. The effect of substitution of Mn by Fe and Cr on the martensitic transition in the Ni 50 Mn 34 In 16 alloy View the table of contents for this issue, or go to the journal homepage for more 2010 J. Phys.: Condens. Matter 22 486007 (http://iopscience.iop.org/0953-8984/22/48/486007) Home Search Collections Journals About Contact us My IOPscience
-
Upload
independent -
Category
Documents
-
view
1 -
download
0
Transcript of The effect of substitution of Mn by Fe and Cr on the martensitic transition in the Ni50Mn34In16...

This content has been downloaded from IOPscience. Please scroll down to see the full text.
Download details:
IP Address: 163.118.172.206
This content was downloaded on 22/08/2014 at 17:18
Please note that terms and conditions apply.
The effect of substitution of Mn by Fe and Cr on the martensitic transition in the
Ni50Mn34In16 alloy
View the table of contents for this issue, or go to the journal homepage for more
2010 J. Phys.: Condens. Matter 22 486007
(http://iopscience.iop.org/0953-8984/22/48/486007)
Home Search Collections Journals About Contact us My IOPscience

IOP PUBLISHING JOURNAL OF PHYSICS: CONDENSED MATTER
J. Phys.: Condens. Matter 22 (2010) 486007 (11pp) doi:10.1088/0953-8984/22/48/486007
The effect of substitution of Mn by Fe andCr on the martensitic transition in theNi50Mn34In16 alloyV K Sharma1, M K Chattopadhyay1, S K Nath1, K J S Sokhey1,R Kumar2, P Tiwari3 and S B Roy1
1 Magnetic and Superconducting Materials Section, Raja Ramanna Centre for AdvancedTechnology, Indore 452013, India2 Semiconductor Laser Section, Raja Ramanna Centre for Advanced Technology,Indore 452013, India3 Indus Synchrotrons Utilization Division, Raja Ramanna Centre for Advanced Technology,Indore 452013, India
Received 27 September 2010, in final form 21 October 2010Published 17 November 2010Online at stacks.iop.org/JPhysCM/22/486007
AbstractThe potential shape memory alloy Ni50Mn34In16 is studied with partial substitution of Mn withFe and Cr to investigate the effect of such substitution on the martensitic transition in theNi–Mn–In alloy system. The results of ac susceptibility, magnetization and electrical resistivitymeasurements show that while the substitution with Cr increases the martensitic transitiontemperature, the substitution with Fe decreases it. Possible reasons for this shift in martensitictransition are discussed. Evidence of kinetic arrest of the austenite to martensite phase transitionin the Fe substituted alloys is also presented. Unlike the kinetic arrest of the austenite tomartensite phase transition in the parent Ni50Mn34In16 alloy which takes place in the presenceof high external magnetic field, the kinetic arrest of the austenite to martensite phase transitionin the Fe doped alloy occurs even in zero magnetic field. The Cr substituted alloys, on the otherhand, show no signature of kinetic arrest of this phase transition.
(Some figures in this article are in colour only in the electronic version)
1. Introduction
The Ni50Mn(50−x)Inx off-stoichiometric Heusler alloys haveattracted considerable attention due to their potential asmaterials exhibiting the ferromagnetic shape memory ef-fect [1–4]. Among these alloys, the x = 16 alloy is reportedto have interesting multifunctional properties, namely largemagnetoresistance [5, 6], large magnetocaloric effect [7–10]and large magnetic field induced strain [4, 8]. Recently anew functionality, namely the barocaloric effect, has also beenreported in the Ni–Mn–In alloys [11]. The Ni50Mn34In16
alloy undergoes a paramagnetic–ferromagnetic transition near305 K during cooling, which is the Curie temperature ofthe austenite phase (TCA). On further cooling, the alloyundergoes a martensitic transition around 220 K [1, 4, 5].The martensite (MST) to austenite (AST) phase transition inthis alloy can be induced both by temperature and magneticfield [1–9], and the multifunctionality of the alloy is related
to this isothermal magnetic field induced MST to AST phasetransition. The functionality of the alloy will have moretechnological importance if the temperature range of themartensitic transition can be shifted towards room temperature.There are two reported mechanisms affecting the martensitictransition temperature in the Ni–Mn–X (X = In, Sn, etc)alloys [10]: (i) number of valence electrons per atom (e/a)taken as the concentration weighted sum of s, p and d electronsand (ii) atomic volume effect. Accordingly, two methods arereported in the literature to increase the martensitic transitiontemperature in the Ni–Mn–X (X = In, Sn etc) alloys.
(i) Increasing the e/a ratio by varying the relative composi-tions of Ni, Mn, and X [12].
(ii) Applying external pressure [13].
The effect of applying pressure can be simulated bysubstituting the atoms in Ni–Mn–X alloy by some smalleratom. The chemical pressure so generated is equivalent to
0953-8984/10/486007+11$30.00 © 2010 IOP Publishing Ltd Printed in the UK & the USA1

J. Phys.: Condens. Matter 22 (2010) 486007 V K Sharma et al
externally applied physical pressure. Therefore the substitutionof an atom in Ni–Mn–X alloy by a relatively smaller atom isexpected to shift the martensitic transition towards the highertemperature side. Further if the substituted and substituentatoms are not isoelectronic, the e/a ratio will also change.We have chosen to substitute Mn in Ni50Mn34In16 alloy withits periodic table neighbours Cr and Fe. We have substituted1% and 2% (nominal) of Mn by Cr, and 1% and 3% ofMn by Fe to form Ni50(Mn, x%Cr)34In16 (x = 1, 2) andNi50(Mn, y%Fe)34In16 (y = 1, 3) alloys. Both Cr and Fehave comparatively smaller atomic radii as compared to thatof Mn [14]. However, the Cr atom has one electron less,and the Fe atom has one electron more as compared to theMn atom (Cr, Mn and Fe have outer electronic configurationsof 3d54s1, 3d54s2 and 3d64s2 respectively). Through thesubstitutions described above, we study the combined effectof chemical pressure and change in e/a ratio on the martensitictransition in these alloys through ac susceptibility, electricalresistivity and magnetization measurements. We find thatwhile the martensitic transition temperature increases with Crsubstitution (in the Ni50(Mn, x%Cr)34In16 (x = 1, 2) alloys),it decreases with Fe substitution (in the Ni50(Mn, y%Fe)34In16
(y = 1, 3) alloys) as compared to the parent Ni50Mn34In16
alloy.In an earlier study we showed that the transition from the
high magnetization AST phase to the low magnetization MSTphase in the Ni50Mn34In16 alloy gets kinetically arrested inthe presence of high applied magnetic field (>40 kOe) [15].This kinetic arrest of the AST to MST transition gives rise to a‘magnetic glass’ state [15]. We show here that the substitutionof Mn by Fe actually favours the kinetic arrest of the AST toMST phase transition. In Ni50(Mn, 1%Fe)34In16 alloy a partialkinetic arrest of the AST to MST transition takes place even inthe absence of any applied magnetic field. We show that theAST to MST phase transition in this Ni50(Mn, 1%Fe)34In16
alloy can be totally arrested with the application of externalmagnetic field. On the other hand Ni50(Mn, x%Cr)34In16 (x =1, 2) alloys show no signature of kinetic arrest of the AST toMST transition.
2. Experimental details
The nominal alloy compositions Ni50(Mn, 1%Cr)34In16,Ni50(Mn, 2%Cr)34In16, Ni50(Mn, 1%Fe)34In16 and Ni50(Mn,
3%Fe)34In16 were prepared by melting the required amountof pure elements in an arc melting furnace under inertargon atmosphere. The sample ingots were flipped and re-melted several times to ensure homogeneity. The sampleswere then sealed in quartz ampoules in argon atmosphereand were annealed at 900 ◦C for 24 h for homogeniza-tion and were subsequently quenched in ice water. Thesamples were characterized through x-ray diffraction (XRD)(performed with a PANalytical X-’Pert PRO MRD machine)and energy dispersive x-ray (EDX) analysis performed (usinga Philips XL-30pc machine) at nearly twenty locations onthe samples to estimate the average composition. Thesamples are found to be homogeneous down to the lengthscale of 30 μm. EDX analysis determined the com-positions of Ni50(Mn, 1%Cr)34In16, Ni50(Mn, 2%Cr)34In16,
Ni50(Mn, 1%Fe)34In16 and Ni50(Mn, 3%Fe)34In16 alloys to beNi49.2Mn33.8Cr0.6In16.4, Ni48.5Mn34.4Cr1.2In16.0, Ni48.6Mn33.1
Fe1.5In16.8 and Ni47.2Mn34.2Fe1.8In16.8 respectively. Henceforththe Ni49.2Mn33.8Cr0.6In16.4, Ni48.5Mn34.4Cr1.2In16.0,Ni48.6Mn33.1Fe1.5In16.8, Ni47.2Mn34.2Fe1.8In16.8 and earlierstudied Ni50Mn34In16 [16] alloys will be denoted as Ni(Mn,0.6%Cr)In, Ni(Mn, 1.2%Cr)In, Ni(Mn, 1.5%Fe)In, Ni(Mn,1.8%Fe)In and NiMnIn respectively. The temperature depen-dence of dc resistivity (ρ) of Ni(Mn, x%Cr)In (x = 0.6,1.2) was measured in the temperature range 78–350 K, in ahomemade liquid nitrogen cryostat and the ρ measurements onNi(Mn, y%Fe)In (y = 1.5, 1.8) were made in the temperaturerange 30–350 K using a homemade closed cycle refrigeratorbased setup. Temperature dependent ac susceptibility (χac)measurements were also made in the temperature range 30–350 K using a homemade closed cycle refrigerator basedsetup. The magnetization (M) measurements as a functionof temperature (T ) and magnetic field (H ) were performedin commercial magnetometers (VSM, Quantum Design, USAand SQUID magnetometer MPMS-XL, Quantum Design,USA). The M versus T measurements on the Ni(Mn,1.5%Fe)In and Ni(Mn, 0.6%Cr)In alloys in various H weredone in three different protocols: zero field cooled (ZFC), fieldcooled cooling (FCC) and field cooled warming (FCW). In theZFC protocol the sample was cooled in zero field from 300 Kto the lowest temperature of measurement, H was switchedon at this lowest temperature and M was measured whilewarming up the sample. In the FCC protocol H was applied at300 K and M was measured while cooling down to the lowesttemperature of measurement. After the FCC measurements, Mwas measured while warming up the sample in the presence ofthe same applied H and this protocol is called the FCW.
3. Results and discussion
3.1. Structural analysis
Figure 1 shows XRD patterns for the alloys near 290 K. Similarto NiMnIn alloy [16], the XRD patterns of Ni(Mn, y%Fe)In(y = 1.5, 1.8) alloys can be indexed to L21 structure witha lattice constant of 6.01 ± 0.02 A indicating the austenitephase of the alloys at 290 K. The XRD patterns of Ni(Mn,x%Cr)In (x = 0.6, 1.2) alloys can also be indexed to L21
structure with a lattice constant of 6.01 ± 0.02 A. However,there are some extra peaks in the XRD patterns of Ni(Mn,x%Cr)In (x = 0.6, 1.2) alloys, which can be indexed toan orthorhombic structure. It will be discussed later in thispaper that this second phase with orthorhombic structure isactually the martensite phase of these alloys. The latticeconstants of the orthorhombic phase of Ni(Mn, 0.6%Cr)Inalloy are a = 18.16 A, b = 10.78 A and c = 4.55 Arespectively with an error bar of 0.02 A. The lattice constantsof the orthorhombic phase of Ni(Mn, 1.2%Cr)In alloy area = 18.16 A, b = 10.78 A and c = 4.52 A respectivelywith an error bar of 0.02 A. The lattice constants of Ni(Mn,x%Cr)In (x = 0.6, 1.2) and Ni(Mn, y%Fe)In (y = 1.5, 1.8)alloys in the austenite phase are comparable to those of NiMnInalloy [16]. Peaks corresponding to the orthorhombic structureare more prominent in the XRD pattern of Ni(Mn, 1.2%Cr)In
2

J. Phys.: Condens. Matter 22 (2010) 486007 V K Sharma et al
Figure 1. X-ray diffraction (XRD) patterns of (a) Ni50(Mn, 0.6%Cr)34In16, (b) Ni50(Mn, 1.2%Cr)34In16, (c) Ni50(Mn, 1.5%Fe)34In16 and(d) Ni50(Mn, 1.8%Fe)34In16 alloys near 290 K. The XRD peaks are indexed to the L21 structure. The XRD peaks of Ni50(Mn, 0.6%Cr)34In16
and Ni50(Mn, 1.2%Cr)34In16 alloys with subscript ‘Orth’ are indexed to the orthorhombic structure of the martensite phase of the alloys. Seetext for details.
as compared to that of Ni(Mn, 0.6%Cr)In. This suggests thepresence of a relatively larger amount of orthorhombic phase at290 K in Ni(Mn, 1.2%Cr)In alloy as compared that in Ni(Mn,0.6%Cr)In alloy.
3.2. The ac susceptibility, resistivity and magnetization ofNi(Mn, x%Cr)In (x=0.6, 1.2) alloys
Figures 2(a) and (b) present the temperature dependence ofboth ac susceptibility and resistivity of the Ni(Mn, 0.6%Cr)In
and Ni(Mn, 1.2%Cr)In alloys. In the Ni(Mn, 0.6%Cr)In(Ni(Mn, 1.2%Cr)In) alloy, with decreasing temperature, thereis a sharp rise in χac near 305 K (300 K) indicating the TCA
in the alloy. The TCA estimated from the inflection point ofχac(T ) is 303 K (296 K) approximately. With further decreasein temperature, the χac(T ) of the Ni(Mn, 0.6%Cr)In alloy firstdecreases near 300 K and then increases slowly again. Itthen shows a large drop near 275 K and then becomes almostflat. This is in sharp contrast with the Ni(Mn, 1.2%Cr)Inalloy where χac(T ) exhibits a large drop near 295 K (below
3

J. Phys.: Condens. Matter 22 (2010) 486007 V K Sharma et al
Figure 2. Temperature (T ) dependence of ac susceptibility (χac) and dc resistivity (ρ) for (a) Ni50(Mn, 0.6%Cr)34In16,(b) Ni50(Mn, 1.2%Cr)34In16, (c) Ni50(Mn, 1.5%Fe)34In16 and (d) Ni50(Mn, 1.8%Fe)34In16 alloys. ρ is normalized to its value at 300 K.
TCA) and then becomes flat with further lowering of T . AsT is decreased to still lower values, the χac(T ) of the Ni(Mn,0.6%Cr)In (Ni(Mn, 1.2%Cr)In) alloy rises again around 240 Kand forms a shoulder near 230 K (210 K) and a peak near210 K (195 K). Upon warming, a distinct thermal hysteresisis observed in χac near 275 K (290 K).
In the Ni(Mn, 0.6%Cr)In alloy, ρ(T ) also shows thesignature of TCA in the form of a change of slope in ρ(T )
near 305 K. However in Ni(Mn, 1.2%Cr)In alloy, ρ(T ) showsno signature corresponding to the paramagnetic–ferromagnetictransition in this alloy. In the Ni(Mn, 0.6%Cr)In (Ni(Mn,1.2%Cr)In) alloy, there is a sharp rise in ρ(T ) near 275 K(295 K) with decreasing temperature. ρ(T ) shows a broad
hump around 210 K (195 K) and then decreases withdecreasing temperature. During the temperature increasingcycle, there is a distinct thermal hysteresis near 275 K (290 K)in ρ(T ) as well.
The χac(T ) and ρ(T ) of Ni(Mn, 0.6%Cr)In exhibitfeatures very similar to those observed earlier in the NiMnInalloy [5, 16] in a slightly different temperature range. Thehysteresis in χac(T ) and ρ(T ) of the Ni(Mn, 0.6%Cr)Inalloy can be attributed to the first order nature of themartensitic transition in this alloy system [5, 16]. The peakin χac(T ) of Ni(Mn, 0.6%Cr)In near 210 K denotes theparamagnetic–ferromagnetic transition in the martensite phaseof the alloy [16, 17]. The hump in ρ(T ) near 210 K can thus
4
J. Phys.: Condens. Matter 22 (2010) 486007 V K Sharma et al
be related with this paramagnetic–ferromagnetic transition inthe martensite phase of the alloy. Similarly in the Ni(Mn,1.2%Cr)In alloy, the thermal hysteresis in χac(T ) and ρ(T )
near 290 K can be attributed to the martensitic transition in thisalloy. The signature of paramagnetic–ferromagnetic transition(295 K) in ρ(T ) of this alloy is probably masked by the muchlarger change in ρ associated with the onset of the martensitictransition in the temperature regime immediately below. Thepeak in χac(T ) and the hump in ρ(T ) near 195 K in the Ni(Mn,1.2%Cr)In alloy indicates the paramagnetic–ferromagnetictransition in the martensite phase of the alloy [16, 17]. Thesmall shoulder in χac(T ) near 230 K in Ni(Mn, 0.6%Cr)Inand near 210 K in Ni(Mn, 1.2%Cr)In, might be due to thepresence of a small amount of the second magnetic phasewhich goes undetected in resistivity and XRD. Moreover, itcan be noted from χac(T ) and ρ(T ) of Ni(Mn, x%Cr)In (x =0.6, 1.2) alloys that the hysteresis due to the MST to ASTtransition extends nearly up to 290 K in Ni(Mn, 0.6%Cr)Inalloy, and this temperature lies amid the temperature regimeof martensitic transition in Ni(Mn, 1.2%Cr)In alloy. Thissuggests the presence of some amount of martensite phase nearthis temperature in these alloys. The MST phase of Ni–Mn–Inalloys is reported to have orthorhombic structure [18]. Thusthe orthorhombic second phase indicated in the XRD patternsof the Ni(Mn, x%Cr)In (x = 0.6, 1.2) alloys is due to thepresence of the MST phase of the alloys at 290 K. This issupported by the observation in the XRD pattern of Ni(Mn,1.2%Cr)In alloy that suggests the presence of a relatively largeramount of orthorhombic phase as compared to that in Ni(Mn,0.6%Cr)In alloy, and that is because the temperature 290 K lieswell within the temperature regime of AST–MST transition inthe Ni(Mn, 1.2%Cr)In alloy.
The main panel of figure 3 shows a comparison of thetemperature dependence of dc resistivity of Ni(Mn, 0.6%Cr)Inand Ni(Mn, 1.2%Cr)In with that of the parent NiMnInalloy highlighting the martensitic transition. In the Ni(Mn,0.6%Cr)In alloy the martensitic transition temperature isincreased nearly by 35 K as compared to that of the NiMnInalloy. In the Ni(Mn, 1.2%Cr)In alloy the martensitic transitionfurther increases by nearly 20 K. The inset to figure 3 showscomparison of χac(T ) near the TCA of the three alloys. TheTCA of the NiMnIn alloy determined from the inflection pointof χac(T ) is approximately 308 K. The comparison of TCA
of the three alloys (see inset to figure 3) indicates that thereis a small decrease in TCA with substitution of Mn by Cr inthe NiMnIn system. In the Ni–Mn–Sn alloy, substituting Mnby Cr causes the martensitic transition to shift towards lowertemperature [18]. Thus the direction of shift in the martensitictransition temperature of the Ni(Mn, x%Cr)In (x = 0.6, 1.2)alloys is opposite to that observed for substitution of Mn byCr in the Ni–Mn–Sn alloy [18]. It is also observed thatthe shift in TCA is much smaller as compared to the shift inmartensitic transition in the present system of alloys. This is inaccordance with the report in the literature which suggests thatin the Ni–Mn–X alloys TCA is not as sensitive to the change incomposition as the martensitic transition [1].
To compare the magnetization in the Ni(Mn, x%Cr)In(x = 0.6, 1.2) alloys with that of the NiMnIn alloy, the
Figure 3. Comparison of temperature (T ) dependence of dcresistivity (ρ) of Ni50(Mn, 0.6%Cr)34In16 andNi50(Mn, 1.2%Cr)34In16 alloys with that of Ni50Mn34In16 alloyaround the martensitic transition. ρ is normalized to its value at300 K. The inset shows comparison of the T dependence of acsusceptibility (χac) of the three alloys near the Curie temperature ofthe austenite phase.
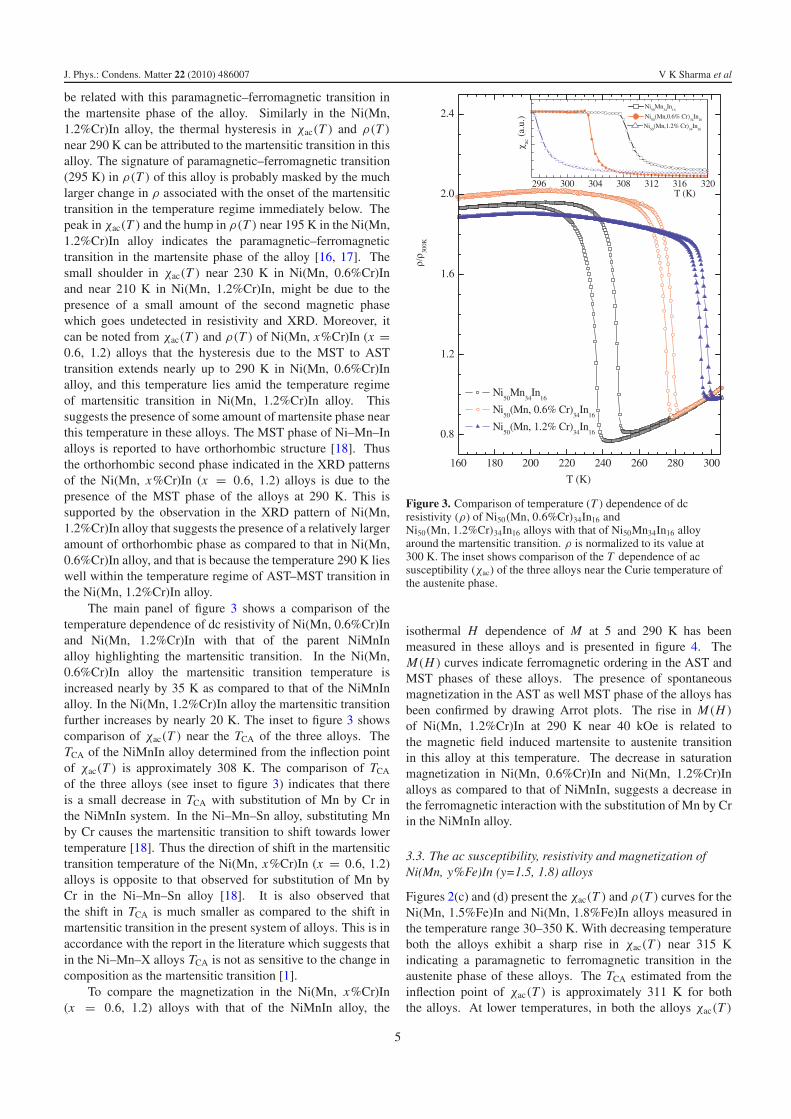
isothermal H dependence of M at 5 and 290 K has beenmeasured in these alloys and is presented in figure 4. TheM(H ) curves indicate ferromagnetic ordering in the AST andMST phases of these alloys. The presence of spontaneousmagnetization in the AST as well MST phase of the alloys hasbeen confirmed by drawing Arrot plots. The rise in M(H )
of Ni(Mn, 1.2%Cr)In at 290 K near 40 kOe is related tothe magnetic field induced martensite to austenite transitionin this alloy at this temperature. The decrease in saturationmagnetization in Ni(Mn, 0.6%Cr)In and Ni(Mn, 1.2%Cr)Inalloys as compared to that of NiMnIn, suggests a decrease inthe ferromagnetic interaction with the substitution of Mn by Crin the NiMnIn alloy.
3.3. The ac susceptibility, resistivity and magnetization ofNi(Mn, y%Fe)In (y=1.5, 1.8) alloys
Figures 2(c) and (d) present the χac(T ) and ρ(T ) curves for theNi(Mn, 1.5%Fe)In and Ni(Mn, 1.8%Fe)In alloys measured inthe temperature range 30–350 K. With decreasing temperatureboth the alloys exhibit a sharp rise in χac(T ) near 315 Kindicating a paramagnetic to ferromagnetic transition in theaustenite phase of these alloys. The TCA estimated from theinflection point of χac(T ) is approximately 311 K for boththe alloys. At lower temperatures, in both the alloys χac(T )
5
J. Phys.: Condens. Matter 22 (2010) 486007 V K Sharma et al
Figure 4. Comparison of magnetic field (H ) dependence ofmagnetization (M) of Ni50(Mn, 0.6%Cr)34In16 andNi50(Mn, 1.2%Cr)34In16 alloys with that of Ni50Mn34In16 alloy at(a) 5 K and (b) 290 K.
decreases slowly with decreasing temperature. In Ni(Mn,1.5%Fe)In (Ni(Mn, 1.8%Fe)In) alloy, χac(T ) shows a changein slope near 140 K (90 K) and decreases with further decreasein temperature. It is observed that χac show a distinct thermalhysteresis in the temperature range 75–160 K (50–130 K) inNi(Mn, 1.5%Fe)In (Ni(Mn, 1.8%Fe)In) alloy. Both the alloysexhibit a change in slope in ρ(T ) near 311 K indicating theparamagnetic to ferromagnetic transition in these alloys. Withdecreasing temperature, ρ(T ) for the Ni(Mn, 1.5%Fe)In alloyshows a change in slope around 140 K which is associated witha distinct thermal hysteresis in the same temperature regimeas the thermal hysteresis in χac(T ). The change in slope ofχac(T ) and ρ(T ) near 140 K, and the hysteretic behaviour inχac(T ) and ρ(T ) can be related to the martensitic transition inNi(Mn, 1.5%Fe)In alloy. The Ni(Mn, 1.8%Fe)In alloy alsoexhibits qualitatively similar behaviour of ρ(T ) and χac(T )
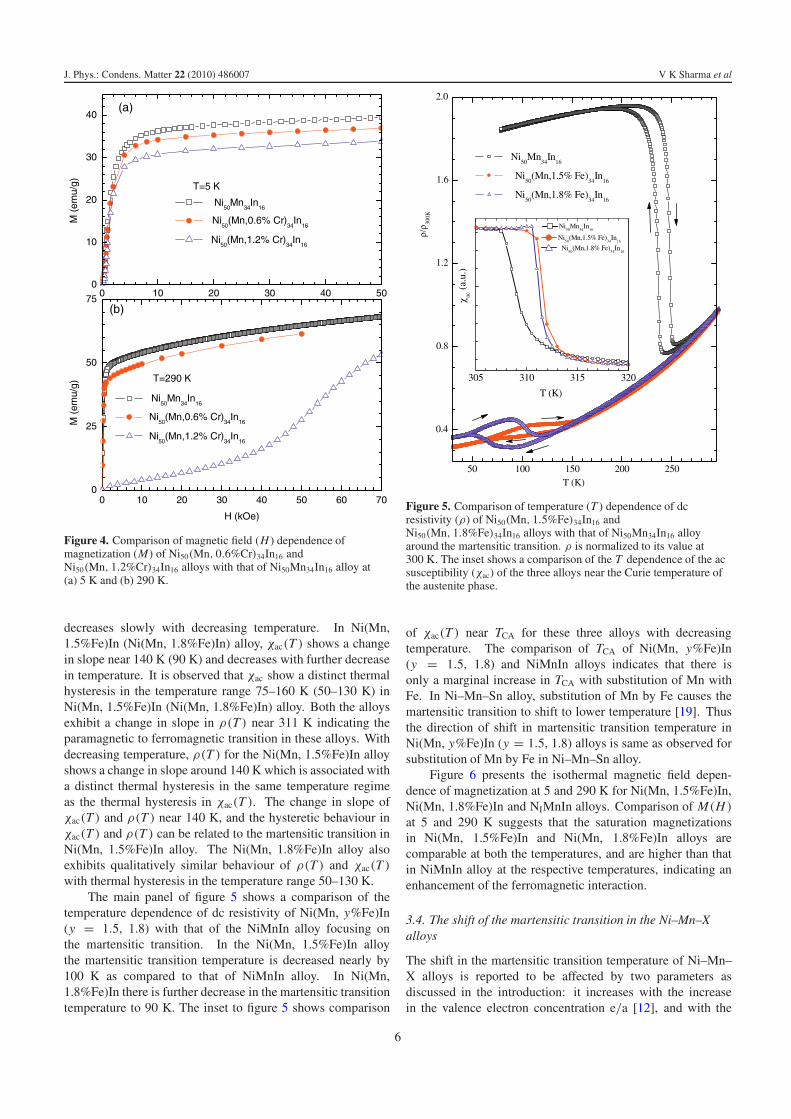
with thermal hysteresis in the temperature range 50–130 K.The main panel of figure 5 shows a comparison of the
temperature dependence of dc resistivity of Ni(Mn, y%Fe)In(y = 1.5, 1.8) with that of the NiMnIn alloy focusing onthe martensitic transition. In the Ni(Mn, 1.5%Fe)In alloythe martensitic transition temperature is decreased nearly by100 K as compared to that of NiMnIn alloy. In Ni(Mn,1.8%Fe)In there is further decrease in the martensitic transitiontemperature to 90 K. The inset to figure 5 shows comparison
Figure 5. Comparison of temperature (T ) dependence of dcresistivity (ρ) of Ni50(Mn, 1.5%Fe)34In16 andNi50(Mn, 1.8%Fe)34In16 alloys with that of Ni50Mn34In16 alloyaround the martensitic transition. ρ is normalized to its value at300 K. The inset shows a comparison of the T dependence of the acsusceptibility (χac) of the three alloys near the Curie temperature ofthe austenite phase.
of χac(T ) near TCA for these three alloys with decreasingtemperature. The comparison of TCA of Ni(Mn, y%Fe)In(y = 1.5, 1.8) and NiMnIn alloys indicates that there isonly a marginal increase in TCA with substitution of Mn withFe. In Ni–Mn–Sn alloy, substitution of Mn by Fe causes themartensitic transition to shift to lower temperature [19]. Thusthe direction of shift in martensitic transition temperature inNi(Mn, y%Fe)In (y = 1.5, 1.8) alloys is same as observed forsubstitution of Mn by Fe in Ni–Mn–Sn alloy.
Figure 6 presents the isothermal magnetic field depen-dence of magnetization at 5 and 290 K for Ni(Mn, 1.5%Fe)In,Ni(Mn, 1.8%Fe)In and NIMnIn alloys. Comparison of M(H )
at 5 and 290 K suggests that the saturation magnetizationsin Ni(Mn, 1.5%Fe)In and Ni(Mn, 1.8%Fe)In alloys arecomparable at both the temperatures, and are higher than thatin NiMnIn alloy at the respective temperatures, indicating anenhancement of the ferromagnetic interaction.
3.4. The shift of the martensitic transition in the Ni–Mn–Xalloys
The shift in the martensitic transition temperature of Ni–Mn–X alloys is reported to be affected by two parameters asdiscussed in the introduction: it increases with the increasein the valence electron concentration e/a [12], and with the
6

J. Phys.: Condens. Matter 22 (2010) 486007 V K Sharma et al
Figure 6. Comparison of magnetic field (H ) dependence ofmagnetization of Ni50(Mn, 1.5%Fe)34In16 andNi50(Mn, 1.8%Fe)34In16 alloys with that of Ni50Mn34In16 alloy at(a) 5 K and (b) 290 K.
increase of external pressure [13]. Moreover, magnetism inthe Ni–Mn–X alloys is predominantly due to the magneticmoment of the Mn sub-lattice. In the stoichiometric Ni–Mn–X Heusler alloys there is a ferromagnetic couplingbetween the Mn atoms. In the off-stoichiometric Ni–Mn–X Heusler alloys (like Ni50Mn34In16), the extra Mnatoms partially occupy the sites which otherwise wouldhave been occupied by the X atoms [8, 20]. An incipientantiferromagnetic coupling between these extra Mn atomsand those occupying sites corresponding to the stoichiometriccomposition has been suggested, which might strengthen inthe martensite phase [8, 20]. Note that there still existsferromagnetic coupling between the Mn atoms occupying sitescorresponding to stoichiometric composition, resulting in anoverall ferromagnetic character of the martensite phase [21].
The atomic radii of Cr and Fe are smaller as compared tothat of Mn [14]. Substitution of Mn by Cr or Fe is equivalentto positive external pressure. This should cause an increase inthe martensitic transition temperature in the Ni(Mn, x%Cr)In(x = 0.6, 1.2) and Ni(Mn, y%Fe)In (y = 1.5, 1.8) alloysas per the observed pressure dependence of this transitiontemperature [13]. Further the e/a ratio calculated as per thecomposition determined with EDAX is 7.81, 7.80, 7.79, 7.76and 7.83 for Ni(Mn, 0.6%Cr)In, Ni(Mn, 1.2%Cr)In, Ni(Mn,1.5%Fe), Ni(Mn, 1.8%Fe)In and NiMnIn alloys respectively.
Thus the e/a ratios of both the Ni(Mn, x%Cr)In (x = 0.6,1.2) and Ni(Mn, y%Fe)In (y = 1.5, 1.8) systems of alloys aresmaller than that of the NiMnIn alloy. Hence the martensitictransition should shift towards lower temperature in thesealloys as compared to that in the NiMnIn alloy [12]. Onthe other hand, the substitution of Mn by Cr or Fe in theoff-stoichiometric NiMnIn alloy will result in occupation ofsome of the Mn sites and some In sites (corresponding tothe stoichiometric composition) also, by Cr or Fe. Thiswill result in the decrease in Mn–Mn distance owing to thesmaller size of Cr and Fe atoms as compared to Mn and Inatoms. This can strengthen the incipient antiferromagneticcoupling between the Mn atoms occupying In sites and thoseoccupying proper sites in the MST phase. The same effectmay also decrease the ferromagnetic coupling between theMn atoms occupying sites corresponding to stoichiometriccomposition [22] in the Ni(Mn, x%Cr)In (x = 0.6, 1.2) andNi(Mn, y%Fe)In (y = 1.5, 1.8) alloys. Now, our earlierstudy of NiMnIn alloy [16, 21] showed that the martensitictransition in NiMnIn alloy is suppressed by magnetic field,which suggests that ferromagnetism helps to stabilize theaustenite phase in NiMnIn alloys. This observation along withthe M(H ) curves (see figures 4 and 6) provides a plausibleexplanation for the shift in martensitic transition in Ni(Mn,x%Cr)In (x = 0.6, 1.2) and Ni(Mn, y%Fe)In (y = 1.5, 1.8)alloys as compared to that of NiMnIn alloy as follows. TheM(H ) curves of Ni(Mn, x%Cr)In (x = 0.6, 1.2) alloys takenat 290 and 5 K (see figure 4) indicate lower saturation magneticmoment in these alloys as compared to that in NiMnIn alloy.This suggests that the ferromagnetic interaction is reduced inNi(Mn, x%Cr)In (x = 0.6, 1.2) alloys as compared to NiMnInalloys. Hence, the MST phase is stabilized as compared to theAST phase and the martensitic transition shifts to the highertemperature side. The M(H ) curves of Ni(Mn, y%Fe)In(y = 1.5, 1.8) alloys at 290 and 5 K are indicative ofhigher saturation magnetic moment in these alloys as comparedto that in NiMnIn. This suggests increased ferromagneticinteraction in these alloys as compared to NiMnIn alloy whichcauses a decrease in the martensitic transition temperature inthese alloys. The increase in ferromagnetic interaction inthe Ni(Mn, y%Fe)In (y = 1.5, 1.8) alloys as compared toNiMnIn might also be related to the larger magnetic momentof Fe as compared to Mn [19]. Another important aspectrelated to the substitution of Mn in the off-stoichiometric alloyNi50Mn34In16 by Fe/Cr is that substitution is likely to resultin a random distribution of Fe/Cr at Mn sites as well as Insites (corresponding to stoichiometric composition). Such arandom distribution of atoms can also affect the martensitictransition in Ni–Mn–In alloys very significantly [23]. Anotherperspective of the martensitic transition in Ni–Mn–Sn alloyhas been revealed by a recent photoelectron spectroscopy studyand first principle calculations of electronic structure [24]. Anabrupt decrease in peak associated with the Ni 3d eg states hasbeen observed across the martensitic transition. Further, theenergy shift in Ni minority spin eg states was argued to beoriginating from hybridization of Ni 3d states with 3d statesof antiferromagnetically coupled Mn atoms occupying Sn sitesdue to off-stoichiometry [24]. The spatial extension of the 3d
7

J. Phys.: Condens. Matter 22 (2010) 486007 V K Sharma et al
Figure 7. Temperature (T ) dependence of magnetization (M) of Ni50(Mn, 1.5%Fe)34In16 alloy in various applied magnetic fields (H ). ASTand MST denote austenite and martensite phases. See text for details.
orbitals in the Cr atom is larger than that of the 3d orbitals ofthe Mn atom and the spatial extension of the 3d orbital of theFe atom is smaller than that of the 3d orbitals in Mn [25]. Thusthe substitution of Mn by Cr and Fe is expected to affect thehybridization of 3d states of Ni states in the opposite sense ascompared to that in NiMnIn, and thus to shift the martensitictransition in the alloy in the opposite direction of temperature.It will be interesting to probe the effect of substitution of Mnby Cr and Fe in NiMnIn alloy with photoelectron spectroscopy.
3.5. Kinetic arrest of the austenite to martensite phasetransition in Ni(Mn, 1.5%Fe)In alloy
Figure 7 shows M versus T curves for the present alloyin H = 100 Oe, 1 kOe, 10 kOe and 50 kOe in thetemperature range 2 K � T � 300 K. Along the FCCpath in the 100 Oe field (figure 7(a)), M increases withdecreasing temperature below 300 K. Results of dc resistivityand ac susceptibility measurements (see section 3.2) showthat there is a paramagnetic to ferromagnetic transition near310 K in the present alloy. With further decrease intemperature M almost flattens out and then starts decreasingnear 170 K. Magnetization starts increasing again withdecreasing temperature below nearly 50 K. M(T ) showssimilar temperature dependence in the FCW mode as well.However, there is a distinct thermal hysteresis in thetemperature regime where M decreases with decreasingtemperature. This drop in M and the associated thermal
hysteresis may be attributed to a first order AST to MSTtransition in Ni50(Mn, 1.5%Fe)34In16 alloy, in concurrencewith the previous studies on the Ni50Mn34In16 alloy [15].The magnitude and nature of temperature dependence of Mabove and below the hysteretic region indicate that bothaustenite and martensite phases have ferromagnetic character(it was also suggested by χac(T ), see figure 2(c)). In highermagnetic field the austenite to martensite transition shifts tolower temperature (see figures 7(b) and (c)). Further themagnitude of M in MST and AST phases clearly indicates thatMST has lower magnetization as compared to that of AST.It is worth noticing here that in all fields there is a distinctdifference between MZFC and MFCW at low temperatures.In a ferromagnetic system the difference between MZFC andMFCW is related to the hindrance to domain motion at lowtemperatures and this thermomagnetic irreversibility decreaseswith the increase in the applied magnetic field. In such acase, for fields greater than that required for saturation ofmagnetization, MZFC and MFCW are expected to merge. Inthe present case, however, the difference between MZFC(T )
and MFCW(T ) increases in higher applied magnetic fields (seefigures 7(a)–(d)). So the difference between MZFC and MFCW
in the present case is not due to the hindrance to domainmotion. In the parent Ni50Mn34In16 alloy, such a differencebetween MZFC and MFCW, which increases with applied fieldand was observed only in the field range H > 40 kOe, wasshown to be due to kinetic arrest of the AST to MST transitionfor H > 40 kOe [15]. In the same argument we suggest that
8
J. Phys.: Condens. Matter 22 (2010) 486007 V K Sharma et al
the (partial) kinetic arrest of the AST to MST transition in thepresent Ni50(Mn, 1.5%Fe)34In16 alloy takes place even in thepresence of an applied magnetic field as low as 100 Oe.
With the increase in the applied field to 50 kOe, the M–Tcurve does not show any signature of the AST–MST transitionin the FCC and FCW measurement protocol at least down to2 K (see figure 7(d)). This behaviour suggests a complete arrestof the AST to MST transition in the present alloy in a field of50 kOe. This is in contrast with the results obtained earlierin Ni50Mn34In16 alloy where the kinetic arrest of the AST toMST transition was possible only with applied H > 40 kOe,and that kinetic arrest too was only partial even in an appliedH of 80 kOe.
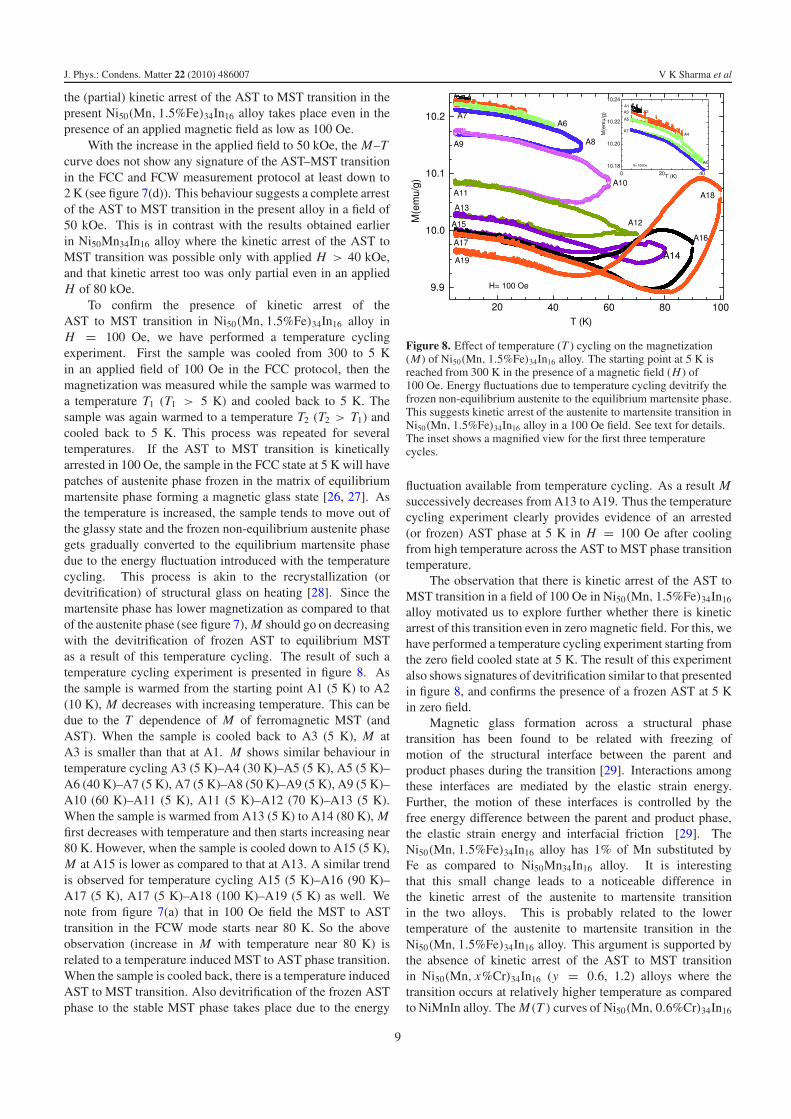
To confirm the presence of kinetic arrest of theAST to MST transition in Ni50(Mn, 1.5%Fe)34In16 alloy inH = 100 Oe, we have performed a temperature cyclingexperiment. First the sample was cooled from 300 to 5 Kin an applied field of 100 Oe in the FCC protocol, then themagnetization was measured while the sample was warmed toa temperature T1 (T1 > 5 K) and cooled back to 5 K. Thesample was again warmed to a temperature T2 (T2 > T1) andcooled back to 5 K. This process was repeated for severaltemperatures. If the AST to MST transition is kineticallyarrested in 100 Oe, the sample in the FCC state at 5 K will havepatches of austenite phase frozen in the matrix of equilibriummartensite phase forming a magnetic glass state [26, 27]. Asthe temperature is increased, the sample tends to move out ofthe glassy state and the frozen non-equilibrium austenite phasegets gradually converted to the equilibrium martensite phasedue to the energy fluctuation introduced with the temperaturecycling. This process is akin to the recrystallization (ordevitrification) of structural glass on heating [28]. Since themartensite phase has lower magnetization as compared to thatof the austenite phase (see figure 7), M should go on decreasingwith the devitrification of frozen AST to equilibrium MSTas a result of this temperature cycling. The result of such atemperature cycling experiment is presented in figure 8. Asthe sample is warmed from the starting point A1 (5 K) to A2(10 K), M decreases with increasing temperature. This can bedue to the T dependence of M of ferromagnetic MST (andAST). When the sample is cooled back to A3 (5 K), M atA3 is smaller than that at A1. M shows similar behaviour intemperature cycling A3 (5 K)–A4 (30 K)–A5 (5 K), A5 (5 K)–A6 (40 K)–A7 (5 K), A7 (5 K)–A8 (50 K)–A9 (5 K), A9 (5 K)–A10 (60 K)–A11 (5 K), A11 (5 K)–A12 (70 K)–A13 (5 K).When the sample is warmed from A13 (5 K) to A14 (80 K), Mfirst decreases with temperature and then starts increasing near80 K. However, when the sample is cooled down to A15 (5 K),M at A15 is lower as compared to that at A13. A similar trendis observed for temperature cycling A15 (5 K)–A16 (90 K)–A17 (5 K), A17 (5 K)–A18 (100 K)–A19 (5 K) as well. Wenote from figure 7(a) that in 100 Oe field the MST to ASTtransition in the FCW mode starts near 80 K. So the aboveobservation (increase in M with temperature near 80 K) isrelated to a temperature induced MST to AST phase transition.When the sample is cooled back, there is a temperature inducedAST to MST transition. Also devitrification of the frozen ASTphase to the stable MST phase takes place due to the energy
Figure 8. Effect of temperature (T ) cycling on the magnetization(M) of Ni50(Mn, 1.5%Fe)34In16 alloy. The starting point at 5 K isreached from 300 K in the presence of a magnetic field (H ) of100 Oe. Energy fluctuations due to temperature cycling devitrify thefrozen non-equilibrium austenite to the equilibrium martensite phase.This suggests kinetic arrest of the austenite to martensite transition inNi50(Mn, 1.5%Fe)34In16 alloy in a 100 Oe field. See text for details.The inset shows a magnified view for the first three temperaturecycles.
fluctuation available from temperature cycling. As a result Msuccessively decreases from A13 to A19. Thus the temperaturecycling experiment clearly provides evidence of an arrested(or frozen) AST phase at 5 K in H = 100 Oe after coolingfrom high temperature across the AST to MST phase transitiontemperature.
The observation that there is kinetic arrest of the AST toMST transition in a field of 100 Oe in Ni50(Mn, 1.5%Fe)34In16
alloy motivated us to explore further whether there is kineticarrest of this transition even in zero magnetic field. For this, wehave performed a temperature cycling experiment starting fromthe zero field cooled state at 5 K. The result of this experimentalso shows signatures of devitrification similar to that presentedin figure 8, and confirms the presence of a frozen AST at 5 Kin zero field.
Magnetic glass formation across a structural phasetransition has been found to be related with freezing ofmotion of the structural interface between the parent andproduct phases during the transition [29]. Interactions amongthese interfaces are mediated by the elastic strain energy.Further, the motion of these interfaces is controlled by thefree energy difference between the parent and product phase,the elastic strain energy and interfacial friction [29]. TheNi50(Mn, 1.5%Fe)34In16 alloy has 1% of Mn substituted byFe as compared to Ni50Mn34In16 alloy. It is interestingthat this small change leads to a noticeable difference inthe kinetic arrest of the austenite to martensite transitionin the two alloys. This is probably related to the lowertemperature of the austenite to martensite transition in theNi50(Mn, 1.5%Fe)34In16 alloy. This argument is supported bythe absence of kinetic arrest of the AST to MST transitionin Ni50(Mn, x%Cr)34In16 (y = 0.6, 1.2) alloys where thetransition occurs at relatively higher temperature as comparedto NiMnIn alloy. The M(T ) curves of Ni50(Mn, 0.6%Cr)34In16
9

J. Phys.: Condens. Matter 22 (2010) 486007 V K Sharma et al
Figure 9. Temperature (T ) dependence of magnetization (M) of Ni50(Mn, 0.6%Cr)34In16 alloy in various applied magnetic fields (H ).
alloy in various magnetic fields are presented in figure 9. Thesharp drop in M near 270 K and associated thermal hysteresisare related with the first order AST–MST phase transitionin this alloy. With increasing magnetic field, MZFC mergeswith MFCW in H = 10 kOe and there is no signature ofbifurcation of MZFC and MFCW up to H = 70 kOe. Thusthere is no kinetic arrest of the AST to MST transition inNi50(Mn, 0.6%Cr)34In16 alloy up to H = 70 kOe. The lowtemperature of the AST to MST phase transition probablymakes the structural interface more prone to freezing. Kineticarrest in zero magnetic field is also reported in the AF–FM transition in Gd5Ge4 [27]. However in Gd5Ge4 thereis no kinetic arrest in higher magnetic field, whereas in thepresent case there is complete kinetic arrest of the first orderphase transition in higher magnetic field. This is because inGd5Ge4 the equilibrium or ground state (ferromagnetic) hashigher magnetization as compared to the high temperaturephase (antiferromagnetic), so that the field favours the lowtemperature phase. It is worthwhile to mention here that thesignature of kinetic arrest of the AST to MST transition hasbeen observed in Ni50(Mn, 1.8%Fe)34In16 alloy as well. Theseresults are not presented here for the sake of conciseness.
3.5.1. Relaxation in the kinetically arrested state. Tofurther explore the kinetic arrest of the austenite to martensitetransition in Ni50(Mn, 1.5%Fe)34In16 alloy, the magnetizationrelaxation was measured at various temperatures along theFCC path. For these measurements the temperature of interest
was approached unidirectionally from 300 K in the presenceof H = 1 kOe without undershooting the target temperature.After stabilizing the temperature isothermal M was measuredas a function of time. The main panel of figure 10 showsmagnetization relaxation data at selective temperatures. Mis normalized to its value at zero time. The magnetizationrelaxation data can be fitted with the Kohlrausch–Williams–Watt (KWW) stretched exponential function �(t) ∝ e[−( t
τ)]β ,
where τ is the characteristic relaxation time, and β is a shapeparameter (varies between 0.8 and 0.9 in the present case).The solid lines in figure 10 represent the KWW function. Thetemperature dependence of the relaxation time is shown in theinset to figure 10. The solid line in the inset shows a linear fitto the ln τ versus 1/T data indicating that the relaxation timeincreases with decreasing temperature following an Arrheniustype of relationship. This is similar to the characteristic of astrong glass former like silica [30].
4. Conclusion
Summarizing, the martensitic transition was studied in Ni50
(Mn, x%Cr)34In16 (x = 0.6, 1.2) and Ni50(Mn, y%Fe)34In16
(y = 1.5, 1.8) alloys prepared by substituting Mn inNi50Mn34In16 alloy by Cr and Fe. The partial substitutionof Mn by Cr is found to increase the martensitic transitiontemperature as compared to that in Ni50Mn34In16 alloy. Onthe other hand, with substitution of Mn by Fe in the samealloy the martensitic transition temperature is found to be
10

J. Phys.: Condens. Matter 22 (2010) 486007 V K Sharma et al
Figure 10. Isothermal magnetization (M) versus time curves forNi50(Mn, 1.5%Fe)34In16 alloy at some representative temperatures.Each temperature is reached from 300 K in a field of 1 kOe and thetime dependence of M is measured in the presence of the same field.M is normalized to its value at zero time. Points representexperimental data and solid lines are curves fitted with theKohlrausch–Williams–Watt (KWW) stretched exponential function.The inset shows the temperature (T ) dependence of the characteristicrelaxation time τ (obtained from fitting the KWW function to therelaxation data). See text for details.
decreased. The increase in martensitic transition temperaturein Cr substituted alloys can be related with the decrease inferromagnetic interaction in these alloys. In the Fe substitutedalloys, the decrease in martensitic transition temperature can berelated with the increase in ferromagnetic interaction in thesealloys. Further, while there is no signature of kinetic arrest ofthe austenite to martensite transition in Ni50(Mn, x%Cr)34In16
(x = 0.6, 1.2) alloys, the austenite to martensite transition inNi50(Mn, y%Fe)34In16 (y = 1.5, 1.8) alloys is found to bekinetically arrested. In fact, in the Ni50(Mn, 1.5%Fe)34In16
alloy, the transition is found to be partially arrested even inzero applied field. The process of transition in this alloy iscompletely arrested in a field of 50 kOe. This is in contrast withthe parent Ni50Mn34In16 alloy, where the transition is arrestedonly in fields greater than 40 kOe and the arrest is partial evenin a field of 80 kOe. The lower temperature of the austenite tomartensite transition in the Ni50(Mn, y%Fe)34In16 (y = 1.5,1.8) alloys appears to make the structural interfaces (formedduring the phase transition) less mobile, and thus easier tofreeze.
Acknowledgments
The authors acknowledge the help of R K Meena in samplepreparation, Dr L S Sharath Chandra in annealing the samples,Dr T Ganguli in XRD measurements, and A Chouhan inannealing the samples and measurement of resistivity and acsusceptibility.
References
[1] Sutou Y, Imano Y, Koeda N, Omori T, Kainuma R,Ishida K and Oikawa K 2004 Appl. Phys. Lett. 85 4358
[2] Oikawa K, Ito W, Imano Y, Sutou Y, Kainuma R, Ishida K,Okamoto S, Kitakami O and Kanomata T 2006 Appl. Phys.Lett. 88 122507
[3] Krenke T, Acet M, Wassermann E F, Moya X, Manosa L andPlanes A 2006 Phys. Rev. B 73 174413
[4] Sharma V K, Chattopadhyay M K, Chouhan A and Roy S B2009 J. Phys. D: Appl. Phys. 42 185005
[5] Sharma V K, Chattopadhyay M K, Shaeb K H B,Chouhan A and Roy S B 2006 Appl. Phys. Lett. 89 222509
[6] Yu S Y, Liu Z H, Liu G D, Chen J L, Cao Z X, Wu G H,Zhang B and Zhang X 2006 Appl. Phys. Lett. 89 162503
[7] Sharma V K, Chattopadhyay M K and Roy S B 2007 J. Phys.D: Appl. Phys. 40 1869
[8] Krenke T, Duman E, Acet M, Wassermann E F, Moya X,Manosa L, Planes A, Suard E and Ouladdiaf B 2007 Phys.Rev. B 75 104414
[9] Moya X, Manosa L, Planes A, Aksoy S, Acet M,Wassermann E F and Krenke T 2007 Phys. Rev. B75 184412
[10] Planes A, Manosa L and Acet M 2009 J. Phys.: Condens.Matter 21 233201
[11] Manosa L, Gonzalez-Alonso D, Planes A, Bonnot E, Barrio M,Tamarit J L, Aksoy S and Acet M 2010 Nat. Mater. 9 478
[12] Krenke T, Moya X, Aksoy S, Acet M, Entel P, Manosa L,Planes A, Elerman Y, Yucel A and Wassermann E F 2007J. Magn. Magn. Mater. 310 2788
[13] Manosa L, Moya X, Planes A, Gutfleisch O, Lyubina J,Barrio M, Tamarit J L, Aksoy S, Krenke T and Acet M 2008Appl. Phys. Lett. 92 012515
[14] Poole C P 2004 Encyclopaedic Dictionary of CondensedMatter Physics (San Diego, CA: Academic)
[15] Sharma V K, Chattopadhyay M K and Roy S B 2007 Phys. Rev.B 76 140401(R)
[16] Sharma V K, Chattopadhyay M K, Kumar R, Ganguli T,Tiwari P and Roy S B 2007 J. Phys.: Condens. Matter19 496207
[17] Aksoy S, Krenke T, Acet M, Wassermann E F, Moya X,Manosa L and Planes A 2007 Appl. Phys. Lett. 91 241916
[18] Zhang C L, Zou W Q, Xuan H C, Han Z D, Wang D H, Gu B Xand Du Y W 2007 J. Phys. D: Appl. Phys. 40 7287
[19] Passamani E C, Xavier F, Favre-Nicolin E, Larica C,Takeuchi A Y, Castro I L and Proveti J R 2009 J. Appl. Phys.105 033919
[20] Brown P J, Gandy A P, Ishida K, Kainuma R, Kanomata T,Neumann K U, Oikawa K, Ouladdiaf B and Ziebeck K R A2006 J. Phys.: Condens. Matter 18 2249
[21] Sharma V K, Chattopadhyay M K and Roy S B 2008 J. Phys.:Condens. Matter 20 425210
[22] Khovaylo V V, Kanomata T, Tanaka T, Nakashima M,Amako Y, Kainuma R, Umetsu R U, Morito H andMiki H 2009 Phys. Rev. B 80 144409
[23] Chattopadhyay M K, Manekar M A, Sharma V K, Arora P,Tiwari P, Tiwari M K and Roy S B 2010 J. Appl. Phys.108 073909
[24] Ye M et al 2010 Phys. Rev. Lett. 104 176401[25] Harrison W A 1999 Elementary Electronic Structure
(Singapore: World Scientific)[26] Chattopadhyay M K, Roy S B and Chaddah P 2005 Phys. Rev.
B 72 180401(R)[27] Roy S B, Chattopadhyay M K, Chaddah P, Moore J D,
Perkins G K, Cohen L F, Gschneidner K A Jr andPecharsky V K 2006 Phys. Rev. B 74 012403
[28] Brawer S 1985 Relaxation in Viscous Liquids and Glasses(Columbus, OH: The American Ceramic Society Inc.)
[29] Sharma P A, El-Khatib S, Mihut I, Betts J B, Migliori A,Kim S B, Guha S and Cheong S W 2008 Phys. Rev. B78 134205
[30] Debenedetti P G and Stillinger F H 2001 Nature 410 259
11