The Effect of Service Quality, Physical Environment and ...
14
SIJDEB, 3(3), 2019, 243-256 p-ISSN: 2581-2904, e-ISSN: 2581-2912 DOI: https://doi.org/10.29259/sijdeb.v3i3.243-256 Received: 7 September 2019; Accepted: 3 October 2019 SRIWIJAYA INTERNATIONAL JOURNAL OF DYNAMIC ECONOMICS AND BUSINESS The Effect of Service Quality, Physical Environment and Restaurant Images on Consumer Satisfaction through Perception of Value Jalaludin Sayuti 1 and Heri Setiawan 2 1,2 Politeknik Negeri Sriwijaya 1 [email protected]; 2 [email protected] Abstract: This research uses a quantitative approach using numbers, starting from data collection, data interpretation, and discussion of the results of the analysis. This type of research is causal research, which is research that shows the causal relationship between independent variables on the dependent variable in addition to measuring the strength of the relationship between these variables through hypothesis testing. The research method used in this study is a survey method. The population in this study are consumers who have enjoyed food in local restaurants in Palembang. The type of sampling used is purposive sampling. To meet the minimum requirements for a path analysis tool, 240 study respondents were taken with the provisions of the selection of consumers who have enjoyed food at a local restaurant in Palembang with certain considerations. The results show that service quality and restaurant image, both have a linear relationship with perceived value, while physical environment is found to have no effect on perceived value. It is also found that service quality, physical environment, restaurant image and perceived value, all have a significant effect on consumer satisfaction. Keywords: Service Quality; Physical Environment; Restaurant Image; Value Perception; Consumer Satisfaction Introduction Cultural and ethnic diversity in Palembang has led to a variety of local restaurants that offer typical food and drinks of various regions in South Sumatra. Particularly, because of the good taste and in accordance with the people's taste and the perception of consumer value related to price, the popularity of local cuisine has grown rapidly. In Palembang, there are currently around 37 local restaurants offering a variety of traditional cuisine menus from 1 Corresponding author
-
Upload
khangminh22 -
Category
Documents
-
view
2 -
download
0
Transcript of The Effect of Service Quality, Physical Environment and ...

SIJDEB, 3(3), 2019, 243-256 p-ISSN: 2581-2904, e-ISSN: 2581-2912 DOI: https://doi.org/10.29259/sijdeb.v3i3.243-256 Received: 7 September 2019; Accepted: 3 October 2019
SRIWIJAYA INTERNATIONAL JOURNAL OF DYNAMIC ECONOMICS AND BUSINESS
The Effect of Service Quality, Physical Environment and Restaurant Images on Consumer Satisfaction through
Perception of Value
Jalaludin Sayuti1 and Heri Setiawan2 1,2Politeknik Negeri Sriwijaya
[email protected]; [email protected]
Abstract: This research uses a quantitative approach using numbers, starting from data collection, data interpretation, and discussion of the results of the analysis. This type of research is causal research, which is research that shows the causal relationship between independent variables on the dependent variable in addition to measuring the strength of the relationship between these variables through hypothesis testing. The research method used in this study is a survey method. The population in this study are consumers who have enjoyed food in local restaurants in Palembang. The type of sampling used is purposive sampling. To meet the minimum requirements for a path analysis tool, 240 study respondents were taken with the provisions of the selection of consumers who have enjoyed food at a local restaurant in Palembang with certain considerations. The results show that service quality and restaurant image, both have a linear relationship with perceived value, while physical environment is found to have no effect on perceived value. It is also found that service quality, physical environment, restaurant image and perceived value, all have a significant effect on consumer satisfaction.
Keywords: Service Quality; Physical Environment; Restaurant Image; Value Perception;
Consumer Satisfaction
Introduction Cultural and ethnic diversity in Palembang has led to a variety of local restaurants that offer typical food and drinks of various regions in South Sumatra. Particularly, because of the good taste and in accordance with the people's taste and the perception of consumer value related to price, the popularity of local cuisine has grown rapidly. In Palembang, there are currently around 37 local restaurants offering a variety of traditional cuisine menus from
1 Corresponding author
Sayuti and Setiawan/ SIJDEB, 3(3), 2019, 243-256
244
various regions in South Sumatra. At present, local restaurants in Palembang face increasing competition from other restaurants (KFC, McDonalds, chinese restaurant). Besides that, consumers in Palembang have become more careful in choosing foods, more familiar with ethnic cuisine, and more selective in choosing the desired food. Therefore, local restaurants can no longer only rely on good menu offerings or low prices to be able to attract consumers. At this time customers are more sensitive and will not be willing to sacrifice time to enjoy food with poor service or an uncomfortable eating environment. A pleasant dining experience through a delicious food menu, comfortable atmosphere and high quality service must be the top priority for local restaurant managers achieved to meet their satisfaction. Service quality and customer satisfaction has become a marketing priority because part of the prerequisites of customer loyalty, repeat sales and mouth to mouth promotion (Han & Ryu, 2009; Liu & Jang, 2009). In today's highly competitive market, it is generally assumed that the key to get profit lies in providing high quality services that will make customers feel satisfied (Han & Ryu, 2007). Particularly, in the restaurant business, customers usually consider food, physical environment, and employee services as a key component of evaluating restaurant food experience (Chow et al., 2007; Namkung & Jang, 2008; Ryu, Han, & Kim, 2008). The right combination of various important attributes will result in restaurant customer perceptions about high service quality, which will increase customer satisfaction and loyalty. Various studies have been conducted to investigate the effect of several components of restaurant service quality on variables such as restaurant image and consumer value perception. Several studies have examined the effect of organizational image on consumer behavior, especially on consumer loyalty in the service sector (Andreassen & Lindestad, 1998). Some previous studies found that perceived quality from the physical environment (Baker et al., 1994; Nguyen & Leblanc, 2002) or service quality (Lai et al., 2009) can significantly affect the company's image. This image can affect customer and satisfaction perceived value and will affect consumer loyalty (Lai et al., 2009; Patterson & Spreng, 1997; Prendergast & Man, 2002; Ryu, Han, & Kim, 2008). Then, several studies have been carried out to identify the antecedents and consequences of the image, especially the image of the restaurant in relation to the restaurant experience. Although businesses in the restaurant sector, especially local restaurants, have experienced rapid growth, the research in this area has not received much attention. Although the service quality in the restaurant sector has developed well, but academician and managers have not yet understand well about how the quality of restaurant services (physical environment, food, and service) will have an impact on the restaurant image, the perception of consumer value and customer satisfaction which will ultimately affect the consumer behavior. This study aims to develop an integrated model that explicitly measures the effect of the physical environment, service quality and restaurant image on the perception of consumer value and customer satisfaction of local restaurants in Palembang. Literature Review Service Quality

Sayuti and Setiawan/ SIJDEB, 3(3), 2019, 243-256
245
Service can be defined as any activity offered by one party to another party, which is intangible and does not result in ownership of something (Kotler & Armstrong, 2009). According to Lovelock & Wirtz (2007) service quality can affect customer satisfaction and customer trust directly, in which customer satisfaction will be able to make loyal customers. Izogo & Ogba (2015) suggested that service quality leads to increased customer satisfaction and loyalty as a result of several factors.
Physical Environment The physical environment is another aspect that companies can use to build competitive advantage. The physical environment consists of all tangible and intangible elements inside and outside a restaurant. To improve the physical environment, restaurant managers must invest thoroughly in interior design; decoration, clean floors, and other accessories, because spending is the most important investment to attract customers (Azim et al., 2014). In addition, the surrounding environment includes intangible background features that have a significant influence on consumers' perceptions and responses relative to the environment of the service provider (Nguyen & Leblanc, 2002). Restaurant Image Low & Lamb (2000) defines image as the reason or emotional perception of consumers in associating a particular brand. In addition, Homer (2008) defines brand image as a higher level of association with the perception of product quality which is a lower order type of association that can be more easily changed (for example through verified product design efforts). In this study, the image of a restaurant refers to the number of perceptions, ideas, or symbolic attitudes that customers associate with restaurants. Perceived Value Customer value is the overall customer assessment of the utility of a product based on the perception of what is received and what is given (Zeithaml et al., 2006). The perception of customer value is influenced by the gap between monetary costs, non-monetary costs, customer tastes, and customer characteristics. High external service value leads to customer satisfaction, which ultimately leads to loyalty. Customer Satisfaction According to Sabir et al., (2014), customer satisfaction has become the most significant in the business field, because satisfied customers have a significant impact on business profits. Lee (2004) added that customer satisfaction is a key indicator of company performance and long-term commitment. That is, customers who are satisfied with the product brand tend to buy products from the same brand and recommend them to others (Reichheld & Teal, 1996). Hypothes is Deve lopment
Relationship of Service Quality and Perceived Value
Existing literature shows that product quality and service quality work as predictors of customer perceived value Bolton & Drew, 1991; Chen & Hu, 2010; Lai et al., 2009; Zeithaml, 1988. Eggert & Ulaga (2002) highlight that service quality features (for example, tangibles, empathy, reliability, and responsiveness) are positively related to the perceived value of consumers. For the best of our knowledge there is a dearth of research that investigates the direct effect of food quality as a latent variable on perceived value. Ryu,

Sayuti and Setiawan/ SIJDEB, 3(3), 2019, 243-256
246
Han, & Kim (2008) study seems to be the only empirical evidence showing that food quality significantly affects perceived value. However, given the fact that perceived product quality affects perceived value and food quality is well accepted as one of the key elements of perceived product quality in the context of restaurants, it is logical to propose a relationship between food quality and perceived value.
H1: Allegedly the service quality has a positive and significant effect on the perception of consumer value
Relationship of Physical Environment and Perceived Value
Bitner (1992) argues that corporate services have a direct relationship with cognitive responses, such as customer trust and perception. In the context of restaurants, the physical environment, such as decoration, room conditions, and comfortable seating, provides the customer's first visit with a gesture which provides services that are expected to offer a perception of customer value (Nguyen & Leblanc, 2002). Mattila (1999) shows that hotel service coverage is an important booster of the holiday business perceived by tourists. Han & Ryu (2009) show a positive relationship between the three elements of the restaurant's physical environment (i.e. decoration and artifacts, spatial planning, and ambient conditions) and customer perceptions of perceived value. Among the three dimensions, decor and artifacts were found to be the most influential drivers of consumer price perception. Liu & Jang (2009b) examined the relationship between atmospheric dining, emotional responses, customer perceived value, and behavioral intentions in context of Chinese restaurants. The results showed that eating atmospherics had a significant effect on the value which customers saw. In addition, the perceived value of customers is also affected by post-meal behavioral intentions of customers.
H2: Allegedly the physical environment has a positive and significant effect on the perception of consumer value
The Relationship between Restaurant Image and Perceived Value
Previous research shows that brand image has a significant effect on customer value perceptions, satisfaction, and intention to visit again (Andreassen & Lindestad, 1998; Bloemer & Reyter, 1998; Cretu & Brodie, 2007; Lai et al., 2009; Patterson & Spreng, 1997; Ryu, Han, & Kim, 2008). Thus, maintaining a distinguished restaurant image compared to competition is an important task of restaurant operators. Managing consistent and different restaurant image is an important marketing strategy component for restaurant managers, which in turn has an effect on customers' perceived value and satisfaction. Patterson and Spreng (1997) examined the role of perceived customer value in explaining consumer behavior in the service context and found the perceived value that the customer was a positive and direct customer satisfaction. Andreassen and Lindestad (1998) empirically examine the relationship between store / company image and customer value perception in the service context. Their findings imply that while corporate image affects on other outcome variables, such as perceived quality and satisfaction, there is no significant relationship between image and perceived value of customers. Although the image has no direct effect on value, it has an indirect effect through perceived quality.
H3: Allegedly the restaurant's image has a positive and significant effect on the perception of consumer value
Relationship of Service Quality and Consumer Satisfaction
Sayuti and Setiawan/ SIJDEB, 3(3), 2019, 243-256
247
Malik (2012) measures the gap between service expectations and customer perceptions service in relation to services delivered by four service industries (banking, transportation, couriers and telecommunications) and examines their effect on satisfaction. His findings confirm that service quality has a positive effect on customer satisfaction. Ummasyroh & Setiawan (2018) examined the role of service quality as a driver for customer satisfaction and found service quality as a predictor of customer satisfaction. Ahmad et al., (2010) found a significant and positive relationship between the four dimensions of service quality (tangibles, reliability, responsiveness and assurance) and customer satisfaction. In their study, empathy showed a significant but negative relationship with customer satisfaction. Naik, Gantasala & Prabhakar (2010) used SERVQUAL to analyze the gap between the expectations and perceptions of retail customers to explore the factors that affect their satisfaction. Their results indicate that service quality has a positive and significant effect on customer satisfaction.
H4: Allegedly the service quality has a positive and significant effect on customer satisfaction
Relationship of Physical Environment and Consumer Satisfaction
The importance of building a physical environment has been the center of attention of several researchers and restaurant managers who consider it as an important factor for strengthening and increasing customer satisfaction in the hospitality industry (Ryu & Han, 2010). Previous research found that the physical quality of a restaurant's environment has a positive effect on customer satisfaction (Nasir et al., 2014). According to Canny (2014) the physical environment is a key marketing factor to differentiate restaurants by giving customers an extraordinary experience with a pleasant and comfortable atmosphere. Therefore, the physical environment has a greater effect on retaining existing customers as well as attracting new ones. In addition, a well-designed physical environment is considered important to affect consumer decisions and post-purchase behavior and evaluate their satisfaction with the quality of products and services from service providers (Bitner, 1992).
H5: Allegedly the physical environment has a positive and significant effect on customer satisfaction
Relationship between Restaurant Image and Consumer Satisfaction
Ryu, Han, & Kim (2008) examined the relationship between overall restaurant image, customer value perception, customer satisfaction, and behavioral intentions in the fast food restaurant industry. They found that overall the image of fast food restaurants was a significant determinant of customer value perception and customer satisfaction. Lai et al., (2009) revealed that company image affects the perception of customer value and customer satisfaction where the perception of customer value is the most important predictor of loyalty. Lai et al., (2009) further found that the perception of customer value and customer satisfaction is mediated by the service quality and company image of customer loyalty.
H6: Allegedly the restaurant's image has a positive and significant effect on customer satisfaction
Relationship of Perceived Value and Consumer Satisfaction
Previous research confirms that customer value perception has been accepted as a reliable predictor of customer satisfaction and consumer purchase behavior intentions (Andreassen & Lindestad, 1998; Chiou, 2004; McDougall & Levesque, 2000 ; Ryu et al., 2010). Chiou, (2004) shows that customer value perception is an important driver of customer
Sayuti and Setiawan/ SIJDEB, 3(3), 2019, 243-256
248
satisfaction on internet service providers. According to Andreassen & Lindestad (1998), perceived customer value is positively related to customer satisfaction in the service industry. Patterson & Spreng (1997) also confirmed that the perception of customer value has a positive and direct relationship with customer satisfaction. McDougall & Levesque, (2000) reported that service quality perception and customer value perception are the two most prominent precursors of customer satisfaction in four service industries: restaurants, auto services, hairdressers, and dentist services.
H7: Allegedly the perception of consumer value has a positive and significant effect on customer satisfaction
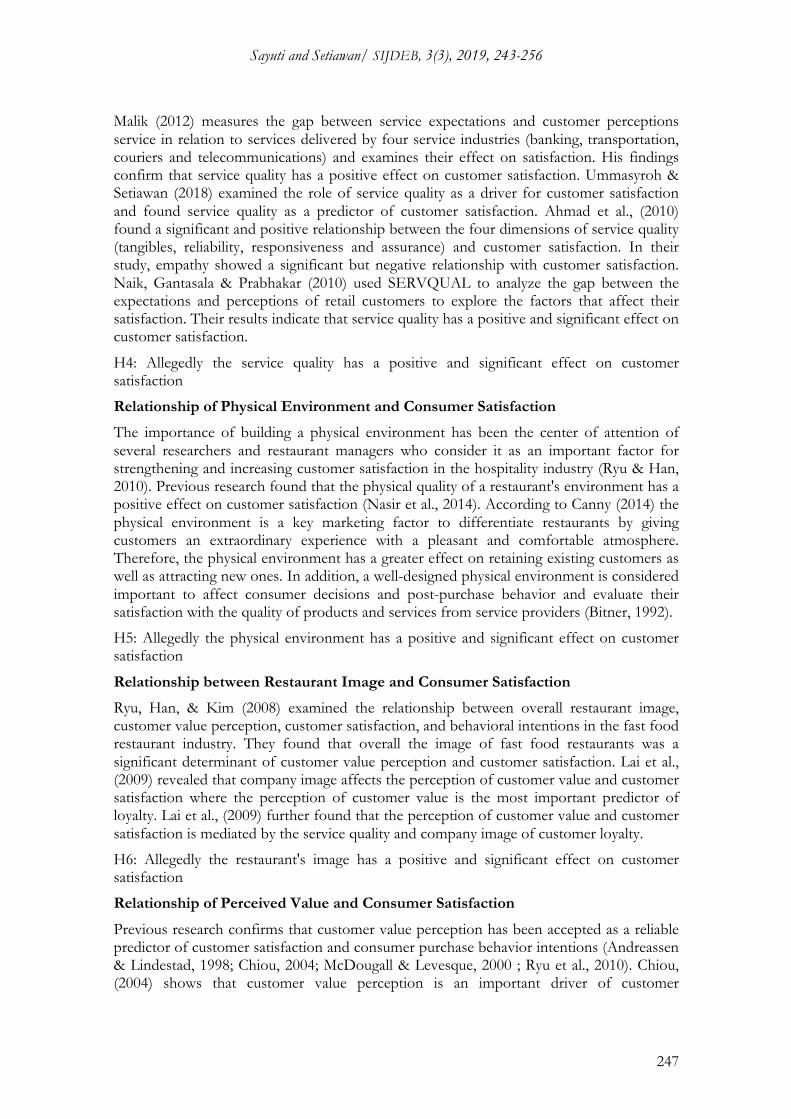
Conceptual Framework
Based on a literature review and previous research, an analysis is used to determine the causality relationship between the variables studied. The research conceptual framework can be explained in the following figure.
Figure 1. Conceptual Framework
Methods
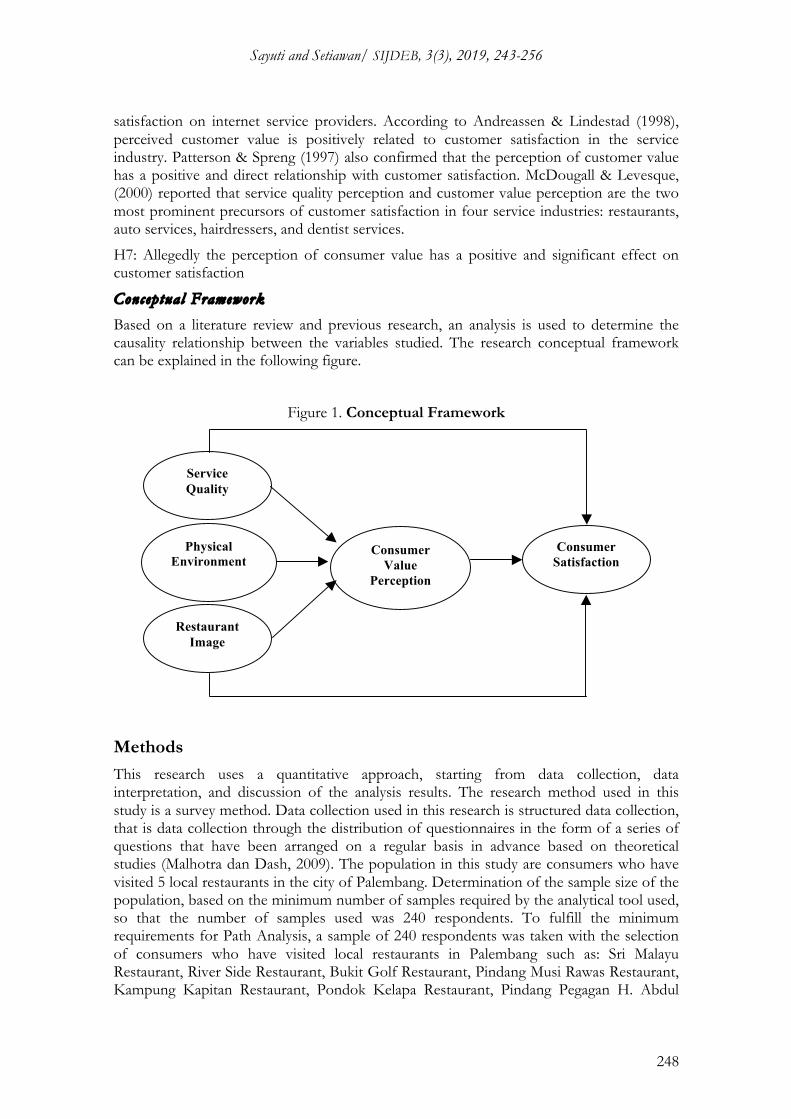
This research uses a quantitative approach, starting from data collection, data interpretation, and discussion of the analysis results. The research method used in this study is a survey method. Data collection used in this research is structured data collection, that is data collection through the distribution of questionnaires in the form of a series of questions that have been arranged on a regular basis in advance based on theoretical studies (Malhotra dan Dash, 2009). The population in this study are consumers who have visited 5 local restaurants in the city of Palembang. Determination of the sample size of the population, based on the minimum number of samples required by the analytical tool used, so that the number of samples used was 240 respondents. To fulfill the minimum requirements for Path Analysis, a sample of 240 respondents was taken with the selection of consumers who have visited local restaurants in Palembang such as: Sri Malayu Restaurant, River Side Restaurant, Bukit Golf Restaurant, Pindang Musi Rawas Restaurant, Kampung Kapitan Restaurant, Pondok Kelapa Restaurant, Pindang Pegagan H. Abdul
Service Quality
Restaurant Image
Consumer Value
Perception
Consumer Satisfaction
Physical Environment

Sayuti and Setiawan/ SIJDEB, 3(3), 2019, 243-256
249
Halim with certain considerations. These restaurants are chosen as they are considered to be famous restaurants with many visitors, both from local consumers or domestic tourists. Research Variable The variables used in this study consisted of two, namely the independent variable and the dependent variable. The independent variable consists of: Service Quality (X1), Physical Environment (X2) and Image of the Restaurant (X3) while the dependent variable consists of: perception value (Y1) and customer satisfaction (Y2). The measurement scale used in this study is a Likert scale. The measurement of each variable uses a Likert scale of 1 to 5, each of which has the following meanings:
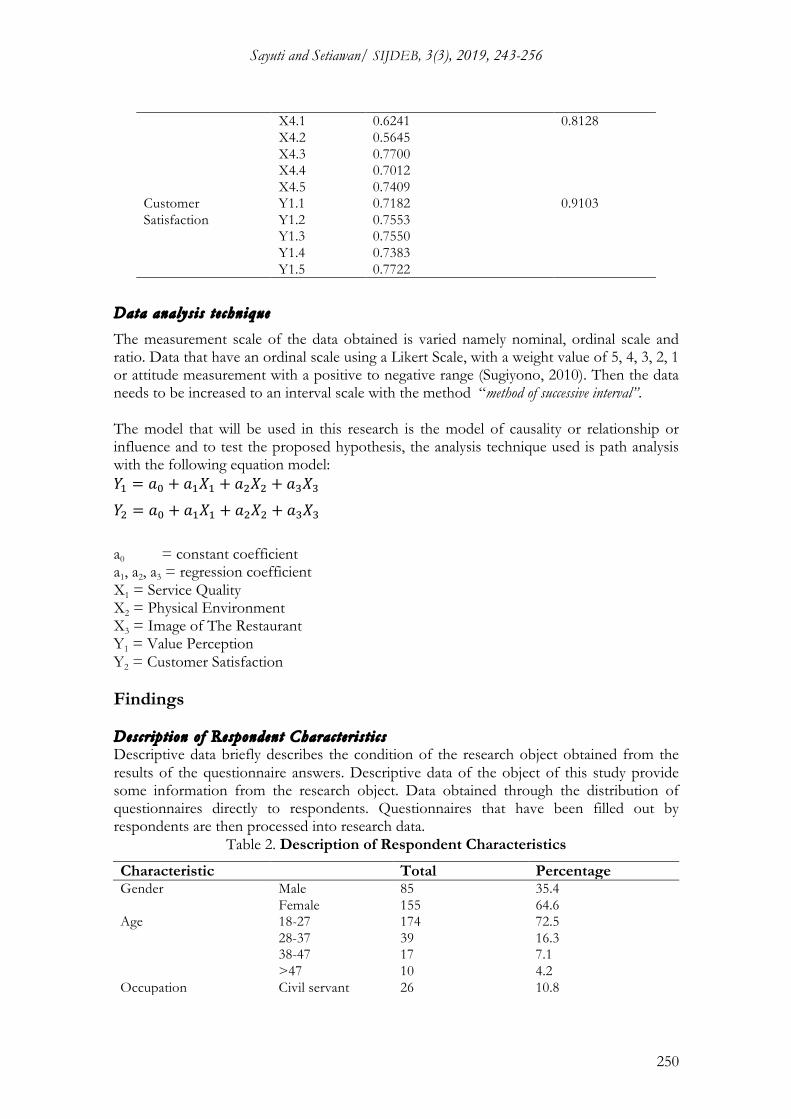
1 = strongly disagree 2 = disagree 3 = not agree 4 = agree 5 = strongly agree The question items are used to measure the construct and confirm the validity of the content adapted from previous research. Service quality was measured using five items adapted from Cronin et al., (1997). Customer satisfaction is measured using 5 items adopted from the study of the American Customer Satisfaction Index (NQRC, 1995) and Feick et al., (2001). Validi ty Test and Rel iabi l i ty Test Validity test is a test conducted to determine the quality of the questionnaire. Decision criteria used by comparing the corrected item total correlation value with the value of r table with a level (�) 0.05 that is equal to 0.1234. If the corrected item total correlation value is greater than r table, then the indicator used in the questionnaire is declared good (Ghozali, 2005). Then, the next step is the reliability test to determine the accuracy of the data from the questionnaire based on the standard alpha coefficient of 0.60. Research variables or indicators are said to be reliable if they have alpha values above 0.60 (Ghozali, 2005). Based on the results of calculations with the help of the SPSS program can be explained the results of testing the validity and reliability in Table 1 below.
Table 1. Validity and Reliability Test Results
Variable Item (indicator)
Correc ted Item - Total Corre lat ion
Reliability
Service Quality X1.1 0.6949 0.9184 X1.2 0.8524 X1.3 0.8243 X1.4 0.7945 X1.5 0.7286
Physical Environment
X2.1 0.5781 0.9425 X2.2 0.7353 X2.3 0.7224 X2.4 0.7948 X2.5 0.7663
Image of the Restaurant
X3.1 0.8059 0.7138 X3.2 0.7749 X3.3 0.6954 X3.4 0.7683 X3.5 0.7452
Sayuti and Setiawan/ SIJDEB, 3(3), 2019, 243-256
250
X4.1 0.6241 0.8128 X4.2 0.5645 X4.3 0.7700 X4.4 0.7012 X4.5 0.7409
Customer Satisfaction
Y1.1 0.7182 0.9103 Y1.2 0.7553 Y1.3 0.7550 Y1.4 0.7383 Y1.5 0.7722
Data analys is t e chnique
The measurement scale of the data obtained is varied namely nominal, ordinal scale and ratio. Data that have an ordinal scale using a Likert Scale, with a weight value of 5, 4, 3, 2, 1 or attitude measurement with a positive to negative range (Sugiyono, 2010). Then the data needs to be increased to an interval scale with the method “method of successive interval”. The model that will be used in this research is the model of causality or relationship or influence and to test the proposed hypothesis, the analysis technique used is path analysis with the following equation model: 𝑌! = 𝑎! + 𝑎!𝑋! + 𝑎!𝑋! + 𝑎!𝑋!
𝑌! = 𝑎! + 𝑎!𝑋! + 𝑎!𝑋! + 𝑎!𝑋!
a0 = constant coefficient a1, a2, a3 = regression coefficient X1 = Service Quality X2 = Physical Environment X3 = Image of The Restaurant Y1 = Value Perception Y2 = Customer Satisfaction Findings Descr ipt ion o f Respondent Character i s t i c s Descriptive data briefly describes the condition of the research object obtained from the results of the questionnaire answers. Descriptive data of the object of this study provide some information from the research object. Data obtained through the distribution of questionnaires directly to respondents. Questionnaires that have been filled out by respondents are then processed into research data.
Table 2. Description of Respondent Characteristics
Characteristic Total Percentage Gender Male
Female 85 155
35.4 64.6
Age 18-27 28-37 38-47 >47
174 39 17 10
72.5 16.3 7.1 4.2
Occupation Civil servant 26 10.8
Sayuti and Setiawan/ SIJDEB, 3(3), 2019, 243-256
251
Employee Entrepreneurs Others
31 34 149
12.9 14.2 62.1
Education High school Vocational Undergraduate Post graduate
102 78 53 7
42.5 32.5 22.1 2.9
Restaurant Riverside Sri Melayu Bukit Golf Pindang Ang 45 Others
62 49 35 31 63
25.8 20.4 14.6 12.9 26.3
Table 2 explains that respondents who are male are 85 people or 35.4% and female are 155 people or 64.6%. This shows that consumers who have visited 5 local restaurants in the city of Palembang are mostly female.
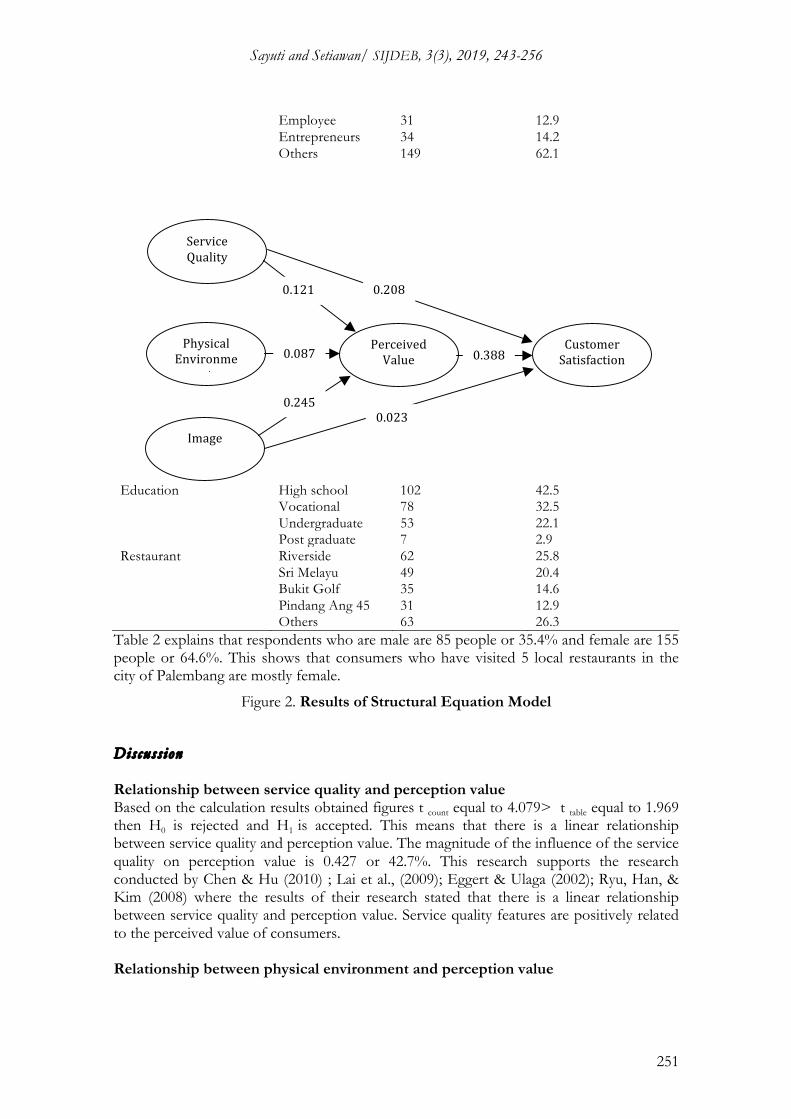
Figure 2. Results of Structural Equation Model
Discuss ion Relationship between service quality and perception value Based on the calculation results obtained figures t count equal to 4.079> t table equal to 1.969 then H0 is rejected and H1 is accepted. This means that there is a linear relationship between service quality and perception value. The magnitude of the influence of the service quality on perception value is 0.427 or 42.7%. This research supports the research conducted by Chen & Hu (2010) ; Lai et al., (2009); Eggert & Ulaga (2002); Ryu, Han, & Kim (2008) where the results of their research stated that there is a linear relationship between service quality and perception value. Service quality features are positively related to the perceived value of consumers. Relationship between physical environment and perception value
0.208
0.023
PhysicalEnvironme
nt
Image
PerceivedValue
ServiceQuality
CustomerSatisfaction0.388
0.121
0.087
0.245

Sayuti and Setiawan/ SIJDEB, 3(3), 2019, 243-256
252
Based on the calculation results obtained figures t count equal to 0.608< t table equal to 1.969 then H0 accepted and H1 rejected. This means that there is no linear relationship between physical environment and perception value. The magnitude of the influence of physical environment and perception value is 0.068 or 6.8%. This research is different from the research done by Mattila (1999); Nguyen & Leblanc (2002); Han & Ryu (2009); Liu & Jang (2009b) where the results of the study are there is a linear relationship between physical environment and perception value while in this study there is no linear relationship between physical environment and perception value. Relationship between restaurant image and perception value Based on the calculation results obtained figures t count equal to 6.628 > t table equal to 1.969 then H0 rejected and H1 accepted. This means that there is a linear relationship between restaurant image and perception value. The magnitude of the effect of partial restaurant image and perception value is 0.452 or 45.2%. This research supports the research conducted by Andreassen & Lindestad (1998); Cretu & Brodie (2007); Lai et al., 2009; Ryu, Han, & Kim (2008) where the results of the study are there is a linear relationship between restaurant image and perception value Relationship between service quality and consumer satisfaction Based on the calculation results obtained figures t count equal to 3.604 > t table equal to 1.969 then H0 rejected and H1 accepted. This means that there is a linear relationship between service quality and consumer satisfaction. The magnitude of the effect of service quality on consumer satisfaction is 0.305or 30.5%. This research supports the research conducted by Malik (2012); Ummasyroh & Setiawan (2018); Ahmed et al., (2010); Naik, Gantasala & Prabhakar (2010) where the results of the study are that there is a linear relationship between service quality and consumer satisfaction. Relationship between physical environment and consumer satisfaction Based on the calculation results obtained figures t count equal to 3.207> t table equal to 1.969 then H0 rejected and H1 accepted. This means that there is a linear relationship between physical environment and consumer satisfaction. The magnitude of the influence of the physical environment on consumer satisfaction is 0.282 or 28.2%. This research supports research conducted by Ryu & Han (2010); Nasir et al., (2014); Canny (2014); Bitner (1992) which states that there is a positive and strong relationship between physical environment and consumer satisfaction. Relationship between restaurant image and consumer satisfaction Based on the calculation results obtained figures t count equal to 2.359 < t table equal to 1.969 then H0 rejected and H1 accepted. This means that there is linear relationship between restaurant image and consumer satisfaction. The magnitude of the effect of partial restaurant image and consumer satisfaction is 0.137 or 13.7%. This research supports the research conducted by Ryu, Han, & Kim (2008); Lai et al., (2009); Ummasyroh & Setiawan (2018) where the results of research are there is a linear relationship between restaurant image and consumer satisfaction. Relationship between perception value and consumer satisfaction Based on the calculation results obtained figures t count equal to 8.316> t table equal to 1.969 then H0 rejected and H1 accepted. This means that there is a linear relationship between perception value and consumer satisfaction. The magnitude of the influence of perception

Sayuti and Setiawan/ SIJDEB, 3(3), 2019, 243-256
253
value and consumer satisfaction is 0.388 or 38.8%. This research supports the research conducted by Andreassen & Lindestad (1998; Chiou (2004); McDougall & Levesque (2000); Ryu et al., (2010) where the results of the study stated there is a linear relationship between the perception value and consumer satisfaction. The higher effect of perception value, the higher level of consumer satisfaction. Conclusion The results of research on the influence of destination images, tourist motivation, service quality and perceived value of tourist satisfaction and loyalty can be developed into a tourist destination marketing strategy in the city of Palembang. This research contributes to various competent parties (stakeholders) with tourism activities in Palembang to work together to develop various attractions to be more attractive to tourists both locally and from various regions in Indonesia and foreign tourists. This study also has limitations in terms of the number of respondents used,there is local tourists and the number of attractions used as research objects. Therefore, it is hoped for further research to be able to use more respondents not only local tourists but also tourists from outside Palembang and foreign tourists. In addition, more research objects can be bought only 4 objects but all attractions in Palembang.
References Ahmad, Z., Ahmed, I., Nawaz, M., Shaukat, M., & Ahmad, N. (2010), “Impact of Service
Quality of Short Messaging Service on Customers Retention; An Empirical Study of Cellular Companies of Pakistan”. International Journal of Business and Management, Vol. 5 No. 6, pp.154-160.
Azim, A., Shah, N. A., Mehmood, Z., Mehmood, S., & Bagram, M. M. M. (2014). Factors effecting the customer‟s selection of restaurants in Pakistan. International Review of Management and Business Research, 3(2), 1003-1013.
Andreassen, T.W. & Lindestad, B. (1998), “Customer loyalty and complex services: the impact of corporate image on quality, customer satisfaction and loyalty for customers with varying degrees of service expertise”, International Journal of Service Industry Management, Vol. 9 No. 1, pp. 7-23.
Baker, J., Grewal, D. & Parasuraman, A. (1994), “The influence of the store environment on quality inferences and store image”, Journal of the Academy of Marketing Science, Vol. 22, pp. 328-39.
Bitner, M.J. (1992), “Servicescapes: the impact of physical surroundings on customers and employees”, Journal of Marketing, Vol. 56, pp. 57-71.
Bloemer, J. & Reyter, K. (1998), “On the relationship between store image, store satisfaction and store loyalty”, European Journal of Marketing, Vol. 32 No. 5, pp. 10-16.
Bolton, R.N. & Drew, J.H. (1991), “A multistage model of customers’ assessments of service quality and value”, Journal of Consumer Research, Vol. 17, pp. 375-84.
Canny, I. U. (2014), “Measuring the mediating role of dining experience attributes on customer satisfaction and its impact on behavioral intentions of casual dining restaurant in Jakarta”. International Journal of Innovation, Management and Technology, Vol. 5 No. 1, pp. 25-29.
Sayuti and Setiawan/ SIJDEB, 3(3), 2019, 243-256
254
Chen, P.T. & Hu, H.H. (2010), “How determinant attributes of service quality influence customer-perceived value: an empirical investigation of the Australian coffee outlet industry”, International Journal of Contemporary Hospitality Management, Vol. 22 No. 4, pp. 535-51.
Chiou, J.S. (2004), “The antecedents of consumers’ loyalty toward internet service providers”, Information and Management, Vol. 41 No. 6, pp. 685-95.
Chow, I.H., Lau, V.P., Lo, T.Y., Sha, Z. & Yun, H. (2007), “Service quality in restaurant operations in China: decision- and experiential-oriented perspectives”, International Journal of Hospitality Management, Vol. 26 No. 3, pp. 698-710.
Cretu, A.E. & Brodie, R.J. (2007), “The influence of brand image and company reputation where manufacturers market to small firms: a customer value perspective”, Industrial Marketing Management, Vol. 36 No. 2, pp. 230-240.
Eggert, A. & Ulaga, W. (2002), “Customer perceived value: a substitute for satisfaction in business markets”, The Journal of Business & Industrial Marketing, Vol. 17 No. 2/3, pp. 107-118.
Ghozali, Imam. (2005), “Aplikasi Analisis Multivariate dengan SPSS”. Semarang: Badan Penerbit UNDIP.
Han, H. & Ryu, K. (2009), “The roles of the physical environment, price perception, and
customer satisfaction in determining customer loyalty in the restaurant industry”, Journal of Hospitality and Tourism Research, Vol. 33 No. 4, pp. 487-510.
Han, H. & Ryu, K. (2007), “Moderating role of personal characteristics in forming restaurant customers’ behavioral intentions – an upscale restaurant setting”, Journal of Hospitality & Leisure Marketing, Vol. 15 No. 4, pp. 25-54.
Homer, P.M. (2008), “Perceived quality and image: when all is not rosy”, Journal of Business Research, Vol. 61 No. 7, pp. 715-723.
Izogo, E. E., & Ogba, I. E. (2015). Service Quality, Customer Satisfaction and Loyalty in Automobile Repair Services Sector. International Journal of Quality & Reliability Management, 32(3), 250-269. http://dx.doi.org/ 10.1108/IJQRM-05-2013-0075
Kotler, P. & Armstrong, G., 2009. Marketing, an introduction. New Jersey. Prentice Hall. Lai, F., Griffin, M. & Babin, B.J. (2009), “How quality, value, image, and satisfaction create
loyalty at a Chinese telecom”, Journal of Business Research, Vol. 62 No. 10, pp. 980-986.
Lee, S. (2004). College student's perception and preference of brand name foodservices in university dining operations. Unpublished master's thesis, Oklahoma State University, Stillwater.
Liu, Y.H. & Jang, S. (2009b), “The effects of dining atmospherics: an extended Mehrabian-Russell model”, International Journal of Hospitality Management, Vol. 28 No. 4, pp. 494-503.
Lovelock, C. & Wirtz, J. 2007. Service Marketing. United States of America. Pearson Prentice Hall.
Low, G.S. and Lamb, C.W. (2000), “The measurement and dimensionality of brand association”, Journal of Product & Brand Management, Vol. 9 No. 6, pp. 350-68.
Malhotra, Naresh K. & Satyabhushan, Dash. (2009). Marketing Research: An Applied Orientation. Fifth Edition. New Delhi: Dorling Kindersley (India) Pvt. Ltd. License of Pearson Education in South Asia.
Malik, S. (2012), “Customer Satisfaction, Perceived Service Quality and Mediating Role of Perceived Value”. International Journal of Marketing Studies, Vol. 4 No. 1, pp.68-76.
Mattila, A. (1999), “Consumers’ value judgments”, Cornell Hospitality Quarterly, Vol. 40 No. 1, pp. 40-46.

Sayuti and Setiawan/ SIJDEB, 3(3), 2019, 243-256
255
McDougall, G & Levesque, T (2000), “Customer Satisfaction with Services: Putting Perceived Value into the Equation”, Journal of Services Marketing, Vol.14 No. 5, pp.392-410.
Naik, C. N., Gantasala, S. B., & Prabhakar, G. V. (2010), “Service Quality (Servqual) and Its Effect on Customer Satisfaction in Retailing”. European Journal of Social Sciences, Vol. 16 No. 2, pp.239-251.
Namkung, Y. & Jang, S. (2008), “Are highly satisfied restaurant customers really different? A quality perception perspective”, International Journal of Contemporary Hospitality Management, Vol. 20 No. 2, pp. 142-155.
Nguyen, N. & Leblanc, G. (2002), “Contact personnel, physical environment and the perceived corporate image of intangible services by new clients”, International Journal of Service Industry Management, Vol. 13 No. 3, pp. 242-262.
Patterson, P.G. & Spreng, R.A. (1997), “Modeling the relationship between perceived value, satisfaction and repurchase intentions in a business-to-business, services context: an empirical examination”, International Journal of Service Industry Management, Vol. 8 No. 5, pp. 414-434.
Prendergast, G. & Man, H.W. (2002), “The influence of store image on store loyalty in Hong Kong’s quick service restaurant industry”, Journal of Foodservice Business Research, Vol. 5 No. 1, pp. 45-59.
Reichheld, F. F., & Teal, T. (1996). The loyalty effect, Harvard business school press. Boston, MA.
Ryu, K., Han, H. & Kim, T.H. (2008), “The relationships among overall quick-casual restaurant image, perceived value, customer satisfaction, and behavioral intentions”, International Journal of Hospitality Management, Vol. 27 No. 3, pp. 459-469.
Ryu, K., Han, H. & Jang, S. (2010), “The effect of hedonic and utilitarian values on customers’ satisfaction and behavioral intention in the fast-casual restaurant industry”, International Journal of Contemporary Hospitality Management, Vol. 22 No. 3, pp. 416-432.
Sabir, R. I., Ghafoor, O., Hafeez, I., Akhtar, N., & Rehman, A. U. (2014). Factors affecting customer‟s satisfaction in restaurants industry in Pakistan. International Review of Management and Business Research, 3(2), 869-876.
Sugiyono. (2010). Metode Penelitian Bisnis. Bandung: CV. Alpha Beta Ummasyroh & Setiawan, H. (2018), “Effects of Destination Image, Tourist Motivation,
Service Quality and Perceived Value on Tourist Satisfaction and Loyalty”. Sriwijaya International Journal of Dynamic Economics and Business. Vol.2 No.3, pp. 225-236.
Zeithaml, V.A. (1988), “Consumer Perceptions of Price, Qualty and Value: A Means-End Model and Synthesis of Evidence”. Journal of Marketing. Vol. 52, No. 3, pp. 2-22.

Sayuti and Setiawan/ SIJDEB, 3(3), 2019, 243-256
256