
The effect of input data transformations on object-based image analysis
10
This article was downloaded by: [West Virginia University] On: 08 August 2011, At: 10:03 Publisher: Taylor & Francis Informa Ltd Registered in England and Wales Registered Number: 1072954 Registered office: Mortimer House, 37-41 Mortimer Street, London W1T 3JH, UK Remote Sensing Letters Publication details, including instructions for authors and subscription information: http://www.tandfonline.com/loi/trsl20 The effect of input data transformations on object-based image analysis Christopher D. Lippitt a , Lloyd L. Coulter a , Mary Freeman a , Jeffrey Lamantia-Bishop a , Wyson Pang a & Douglas A. Stow a a Department of Geography, San Diego State University, San Diego, CA, 92182, USA Available online: 24 Mar 2011 To cite this article: Christopher D. Lippitt, Lloyd L. Coulter, Mary Freeman, Jeffrey Lamantia- Bishop, Wyson Pang & Douglas A. Stow (2011): The effect of input data transformations on object- based image analysis, Remote Sensing Letters, 3:1, 21-29 To link to this article: http://dx.doi.org/10.1080/01431161.2010.531059 PLEASE SCROLL DOWN FOR ARTICLE Full terms and conditions of use: http://www.tandfonline.com/page/terms-and- conditions This article may be used for research, teaching and private study purposes. Any substantial or systematic reproduction, re-distribution, re-selling, loan, sub-licensing, systematic supply or distribution in any form to anyone is expressly forbidden. The publisher does not give any warranty express or implied or make any representation that the contents will be complete or accurate or up to date. The accuracy of any instructions, formulae and drug doses should be independently verified with primary sources. The publisher shall not be liable for any loss, actions, claims, proceedings, demand or costs or damages whatsoever or howsoever caused arising directly or indirectly in connection with or arising out of the use of this material.
Transcript of The effect of input data transformations on object-based image analysis

This article was downloaded by: [West Virginia University]On: 08 August 2011, At: 10:03Publisher: Taylor & FrancisInforma Ltd Registered in England and Wales Registered Number: 1072954 Registeredoffice: Mortimer House, 37-41 Mortimer Street, London W1T 3JH, UK
Remote Sensing LettersPublication details, including instructions for authors andsubscription information:http://www.tandfonline.com/loi/trsl20
The effect of input datatransformations on object-based imageanalysisChristopher D. Lippitt a , Lloyd L. Coulter a , Mary Freeman a ,Jeffrey Lamantia-Bishop a , Wyson Pang a & Douglas A. Stow aa Department of Geography, San Diego State University, San Diego,CA, 92182, USA
Available online: 24 Mar 2011
To cite this article: Christopher D. Lippitt, Lloyd L. Coulter, Mary Freeman, Jeffrey Lamantia-Bishop, Wyson Pang & Douglas A. Stow (2011): The effect of input data transformations on object-based image analysis, Remote Sensing Letters, 3:1, 21-29
To link to this article: http://dx.doi.org/10.1080/01431161.2010.531059
PLEASE SCROLL DOWN FOR ARTICLE
Full terms and conditions of use: http://www.tandfonline.com/page/terms-and-conditions
This article may be used for research, teaching and private study purposes. Anysubstantial or systematic reproduction, re-distribution, re-selling, loan, sub-licensing,systematic supply or distribution in any form to anyone is expressly forbidden.
The publisher does not give any warranty express or implied or make any representationthat the contents will be complete or accurate or up to date. The accuracy of anyinstructions, formulae and drug doses should be independently verified with primarysources. The publisher shall not be liable for any loss, actions, claims, proceedings,demand or costs or damages whatsoever or howsoever caused arising directly orindirectly in connection with or arising out of the use of this material.

The effect of input data transformations on object-based image analysis
CHRISTOPHER D. LIPPITT*, LLOYD L. COULTER, MARY FREEMAN,
JEFFREY LAMANTIA-BISHOP, WYSON PANG and DOUGLAS A. STOW
Department of Geography, San Diego State University, San Diego, CA 92182, USA
(Received 9 June 2010; in final form 4 October 2010)
The effect of using spectral transform images as input data on segmentation
quality and its potential effect on products generated by object-based image
analysis are explored in the context of land cover classification in Accra, Ghana.
Five image data transformations are compared to untransformed spectral bands in
terms of their effect on segmentation quality and final product accuracy. The
relationship between segmentation quality and product accuracy is also briefly
explored. Results suggest that input data transformations can aid in the delinea-
tion of landscape objects by image segmentation, but the effect is idiosyncratic to
the transformation and object of interest.
1. Introduction
In response to the broad availability of high spatial resolution remote sensing data and
the subsequent evocation of the ‘H’ resolution scene model (Strahler et al. 1986), object-
based image analysis (OBIA) is becoming more prevalent than at any other time in its
greater than 30-year history (Rosenfeld and Davis 1979, Woodcock and Harward 1992,Blaschke and Strobl 2001, Benz et al. 2004, Blaschke et al. 2008). Although a variety of
techniques and software have been presented as OBIA (see Blaschke et al. (2008) for
review), the regionalization (i.e. segmentation) of image data is a principal step to
OBIA, typically followed by classification and generalization operations (Rosenfeld
and Davis 1979). Segmentation determines the spatial units, and subsequently the scale
at which image analyses are conducted, and therefore has the potential to affect the
accuracy of all subsequent analysis and final products (Openshaw 1984, Addink et al.
2007). Image segmentation is the foundation to most OBIA; the effect of segmentationquality on the potential OBIA product accuracy has recently been noted by several
authors (e.g. Addink et al. 2007, Kim et al. 2009, Liu and Xia 2010).
This study investigates the effect of incorporating spectral transform images on the
accuracy of segmentation (i.e. how well segmentation boundaries reflect the bound-
aries of objects of interest in the scene) and final product accuracy. We hypothesize
that spectral transformations (e.g. principal components, vegetation indices, material
fractions derived through spectral mixture analysis) can improve segmentation accu-
racy, and subsequently final product accuracy, when compared to spectral data alone.To test this hypothesis, we compare segmentations of QuickBird multispectral ima-
gery of Accra, Ghana, in the context of mapping urban land cover objects. Several
data transformations commonly used to enhance landscape object discrimination in
*Corresponding author. Email: [email protected]
Remote Sensing LettersISSN 2150-704X print/ISSN 2150-7058 online # 2012 Taylor & Francis
http://www.tandf.co.uk/journalsDOI: 10.1080/01431161.2010.531059
Remote Sensing Letters
Vol. 3, No. 1, January 2012, 21–29
Dow
nloa
ded
by [
Wes
t Vir
gini
a U
nive
rsity
] at
10:
03 0
8 A
ugus
t 201
1
remote sensing data are explored: principal component analysis (PCA), spectral
mixture analysis (SMA) (Adams et al. 1986) of vegetation, impervious and soil
fractions and two common vegetation indices – normalized difference vegetation
index (NDVI) and visible atmospherically resistant index (VARI) (Gitelson et al.
2002). To permit quantitative comparison of segmentation results, we validate thesegmentation quality using an area-based error analysis in a manner proposed by
Zhan et al. (2005). The relationship between segmentation accuracy and final product
accuracy is preliminarily assessed using least squares regression. Collectively, this
research explores the effect of varying input data on segmentation quality and,
subsequently, classification products generated using OBIA techniques.
This study was conducted within the context of a larger effort to assess the feasibility
of mapping health indicators in Accra, Ghana, using remote sensing data. Specifically,
the study is motivated by the need to accurately delineate the relative proportion oftrees and buildings within neighbourhoods of the Accra metropolitan area for use as
indicators of social phenomena relating to health outcomes (Stow et al. 2010).
2. Background
OBIA offers profound advantages over traditional pixel-based classification meth-
ods, particularly for high spatial resolution image data. It permits the use of image
information beyond ‘colour’, ‘tone’ and ‘time’ (e.g. shape, pattern, shadow, associa-tion/site) (Benz et al. 2004), represents an explicit implementation of the H-resolution
scene model (Strahler et al. 1986) and has been shown to offer improved classification
accuracies over pixel-based approaches in many applications (Neubert and Meinel
2003, Bocka et al. 2005).
Most OBIA techniques rely on image segmentation to delineate image regions, on
which all subsequent analyses are performed (Abkar et al. 2000, Baatz and Schape
2000, Blaschke and Strobl 2001, Hay et al. 2003, Benz et al. 2004). The segments
define the unit of analysis and therefore affect not only the accuracy of classificationresults (Addink et al. 2007), but according to modifiable area unit problem (MAUP),
can determine the results (Openshaw 1984). There have been attempts to identify the
‘intrinsic scale’ of image objects (Hay et al. 2003, p. 328), but most research has relied
on trial and error to set parameters that delineate regions corresponding to landscape
objects of a given minimum mapping unit (Benz et al. 2004, Moller et al. 2007).
Definiens multi-resolution (Baatz and Schape 2000, Benz et al. 2004) segmentation
results are affected by both user specified constraint parameters (i.e. scale factor H,
shape vs. colour weighting, and compactness vs. smoothness weighting) and the dataon which segmentation is based. The multi-resolution image segmentation algorithm
within Definiens employs a region-based, local mutual best fitting approach (see
Baatz and Schape (2000) for details). Several authors have investigated the effect of
the Definiens multi-resolution user parameters on segmentation and classification
accuracy (Lucieer and Stein 2002, Neubert and Meinel 2003, Moller et al. 2007), but
research interrogating the utility of spectral transformations for image segmentation
is rare (Trias-Sanz et al. 2008).
Segmentation is typically performed on panchromatic or multi-spectral wavebandinputs (Definiens 2003, Hay et al. 2003, Benz et al. 2004), but there is evidence that
spectral transform inputs may yield more reliable image segmentation results
(Trias-Sanz et al. 2008). Given this, and the established ability of input transforma-
tions to improve image classification (Pereira 1999), change detection (Rogan et al.
22 C.D. Lippitt et al.
Dow
nloa
ded
by [
Wes
t Vir
gini
a U
nive
rsity
] at
10:
03 0
8 A
ugus
t 201
1
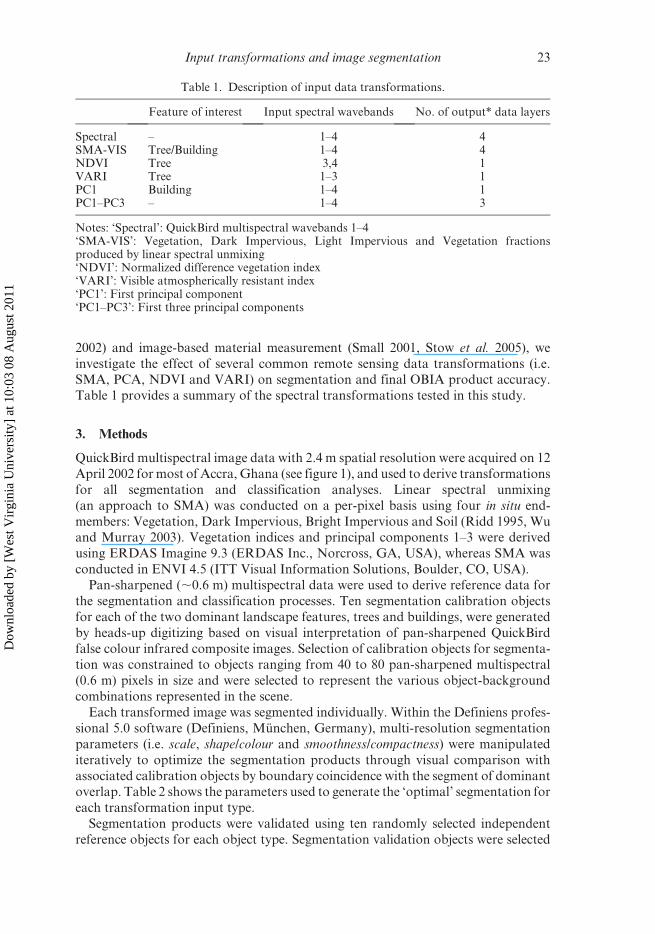
2002) and image-based material measurement (Small 2001, Stow et al. 2005), we
investigate the effect of several common remote sensing data transformations (i.e.SMA, PCA, NDVI and VARI) on segmentation and final OBIA product accuracy.
Table 1 provides a summary of the spectral transformations tested in this study.
3. Methods
QuickBird multispectral image data with 2.4 m spatial resolution were acquired on 12
April 2002 for most of Accra, Ghana (see figure 1), and used to derive transformations
for all segmentation and classification analyses. Linear spectral unmixing
(an approach to SMA) was conducted on a per-pixel basis using four in situ end-
members: Vegetation, Dark Impervious, Bright Impervious and Soil (Ridd 1995, Wuand Murray 2003). Vegetation indices and principal components 1–3 were derived
using ERDAS Imagine 9.3 (ERDAS Inc., Norcross, GA, USA), whereas SMA was
conducted in ENVI 4.5 (ITT Visual Information Solutions, Boulder, CO, USA).
Pan-sharpened (,0.6 m) multispectral data were used to derive reference data for
the segmentation and classification processes. Ten segmentation calibration objects
for each of the two dominant landscape features, trees and buildings, were generated
by heads-up digitizing based on visual interpretation of pan-sharpened QuickBird
false colour infrared composite images. Selection of calibration objects for segmenta-tion was constrained to objects ranging from 40 to 80 pan-sharpened multispectral
(0.6 m) pixels in size and were selected to represent the various object-background
combinations represented in the scene.
Each transformed image was segmented individually. Within the Definiens profes-
sional 5.0 software (Definiens, Munchen, Germany), multi-resolution segmentation
parameters (i.e. scale, shape/colour and smoothness/compactness) were manipulated
iteratively to optimize the segmentation products through visual comparison with
associated calibration objects by boundary coincidence with the segment of dominantoverlap. Table 2 shows the parameters used to generate the ‘optimal’ segmentation for
each transformation input type.
Segmentation products were validated using ten randomly selected independent
reference objects for each object type. Segmentation validation objects were selected
Table 1. Description of input data transformations.
Feature of interest Input spectral wavebands No. of output* data layers
Spectral – 1–4 4SMA-VIS Tree/Building 1–4 4NDVI Tree 3,4 1VARI Tree 1–3 1PC1 Building 1–4 1PC1–PC3 – 1–4 3
Notes: ‘Spectral’: QuickBird multispectral wavebands 1–4‘SMA-VIS’: Vegetation, Dark Impervious, Light Impervious and Vegetation fractionsproduced by linear spectral unmixing‘NDVI’: Normalized difference vegetation index‘VARI’: Visible atmospherically resistant index‘PC1’: First principal component‘PC1–PC3’: First three principal components
Input transformations and image segmentation 23
Dow
nloa
ded
by [
Wes
t Vir
gini
a U
nive
rsity
] at
10:
03 0
8 A
ugus
t 201
1

Table 2. Definiens segmentation parameters for each spectraltransformation input type.
Scale Shape Compactness
Spectral 13 0.5 0.3SMA-VIS 1 0.1 0.2NDVI 10 0.1 0.5VARI 10 0.1 0.5PC1 7 0.1 0.2PC1–PC3 5 0.1 0.2
Note: Refer table 1 for variable definitions.
Figure 1. QuickBird panchromatic waveband of the study region of Accra, Ghana.
24 C.D. Lippitt et al.
Dow
nloa
ded
by [
Wes
t Vir
gini
a U
nive
rsity
] at
10:
03 0
8 A
ugus
t 201
1
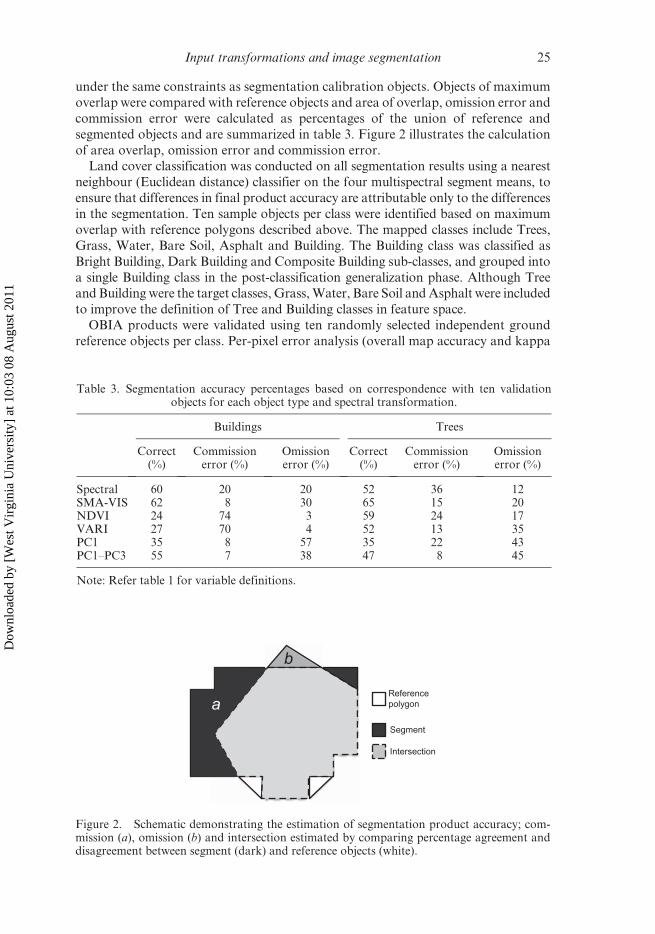
under the same constraints as segmentation calibration objects. Objects of maximum
overlap were compared with reference objects and area of overlap, omission error and
commission error were calculated as percentages of the union of reference and
segmented objects and are summarized in table 3. Figure 2 illustrates the calculation
of area overlap, omission error and commission error.Land cover classification was conducted on all segmentation results using a nearest
neighbour (Euclidean distance) classifier on the four multispectral segment means, to
ensure that differences in final product accuracy are attributable only to the differences
in the segmentation. Ten sample objects per class were identified based on maximum
overlap with reference polygons described above. The mapped classes include Trees,
Grass, Water, Bare Soil, Asphalt and Building. The Building class was classified as
Bright Building, Dark Building and Composite Building sub-classes, and grouped into
a single Building class in the post-classification generalization phase. Although Treeand Building were the target classes, Grass, Water, Bare Soil and Asphalt were included
to improve the definition of Tree and Building classes in feature space.
OBIA products were validated using ten randomly selected independent ground
reference objects per class. Per-pixel error analysis (overall map accuracy and kappa
Table 3. Segmentation accuracy percentages based on correspondence with ten validationobjects for each object type and spectral transformation.
Buildings Trees
Correct(%)
Commissionerror (%)
Omissionerror (%)
Correct(%)
Commissionerror (%)
Omissionerror (%)
Spectral 60 20 20 52 36 12SMA-VIS 62 8 30 65 15 20NDVI 24 74 3 59 24 17VARI 27 70 4 52 13 35PC1 35 8 57 35 22 43PC1–PC3 55 7 38 47 8 45
Note: Refer table 1 for variable definitions.
b
Referencepolygon
Segment
Intersection
a
Figure 2. Schematic demonstrating the estimation of segmentation product accuracy; com-mission (a), omission (b) and intersection estimated by comparing percentage agreement anddisagreement between segment (dark) and reference objects (white).
Input transformations and image segmentation 25
Dow
nloa
ded
by [
Wes
t Vir
gini
a U
nive
rsity
] at
10:
03 0
8 A
ugus
t 201
1

index of agreement) was conducted for all classes. Given that the desired information
product is the relative proportion of Trees and Buildings per neighbourhood and not
an exact representation of the size or shape of these objects, pixel-based accuracy
assessment is appropriate. Segmentation ‘accuracy’ was then related to classification
accuracy and kappa index of agreement for the Tree and Building classes throughleast squares linear regression.
4. Results
Segmentation accuracy results for the Tree and Building classes are presented in
table 3. Overall classification accuracy results and results for Tree and Building classes
are summarized in table 4. Spectral transform images yielded higher segmentation
accuracy compared with multispectral data inputs, but the effect is dependent on the
object and class of interest. Most transform inputs achieved higher accuracy for either
tree or building segmentation at the expense of the other.Vegetation indices resulted in relatively high tree object segmentation accuracies
(NDVI ¼ 59%, VARI ¼ 52%) compared with building objects (24% and 27%,
respectively), whereas principal component transformations resulted in higher build-
ing object segmentation accuracies compared with trees (table 3). Relative to spectral
bands, only SMA feature inputs yielded higher segmentation accuracies for buildings,
whereas SMA and NDVI resulted in higher segmentation accuracies for trees. This
suggests that transformations developed to enhance the discrimination of landscape
features using pixel-based techniques can aid in the delineation of those features usingOBIA techniques.
Objects segmented using spectral data showed the highest overall classification
accuracy and kappa (table 4). VARI yielded higher tree class kappa values than
spectral data (0.95 and 0.90 respectively). Products generated through segmentation
of the first three principal components had a higher building class kappa value (0.94)
than the other transformations (0.75–0.81).
Least squares trends between segmentation accuracy and overall kappa classifica-
tions suggest that there is a positive relationship between segmentation and classifica-tion accuracy, but more samples would be required to test the significance of that
relationship. Positive trend lines for both the Tree and Building classes support the
hypothesis that final product accuracies are dependent on segmentation quality,
supporting the findings of other recent research (e.g. Addink et al. 2007, Liu and
Xia 2010).
Table 4. Classification accuracy statistics.
5-Class overall(%)
5-Class kappaindex
Trees kappaindex
Buildings kappaindex
Spectral 94 0.92 0.90 1.00SMA-VIS 85 0.81 0.86 0.81NDVI 85 0.80 0.90 0.75VARI 86 0.82 0.95 0.77PC1 81 0.76 0.87 0.81PC1–PC3 87 0.83 0.75 0.94
Note: Refer Table 1 for variable definitions.
26 C.D. Lippitt et al.
Dow
nloa
ded
by [
Wes
t Vir
gini
a U
nive
rsity
] at
10:
03 0
8 A
ugus
t 201
1

5. Discussion and Conclusions
In summary, spectral transformations can improve segmentation accuracy but the
improvement seems to be idiosyncratic to the object of interest and the type of
transformation. The identification of image transformations appropriate for the
delineation of specific landscape objects seems particularly promising; further inves-
tigation into the use of image transformations to improve segmentation quality is
warranted. Segmentation accuracy can have an effect on classification accuracy,
highlighting the need to explore the quantification of segmentation quality and to
define rigorous procedures for optimizing image segmentation based on the objectsand scale of interest.
The correlation between segmentation accuracy and kappa for the final OBIA
product is weaker than one would reasonably expect (Addink et al. 2007), particularly
for the tree class; in one case (i.e. PC1, trees) a segmentation accuracy of 34%
produced a kappa of 0.87. At first glance this would seem to refute the logical
conclusion that product accuracy is dependent on segmentation quality (Addink
et al. 2007). Note, however, that segments may have been, and in many cases were,
smaller than the reference object they were compared with, resulting in high omissionerror (e.g. PC1 and PC1-3). For segmentations that are finer scale than the objects of
interest, however, there is not necessarily a loss in classification accuracy (Liu and Xia
2010), suggesting that a commission error-only accuracy metric may be more appro-
priate for assessing the relationship between segmentation quality and final product
accuracy.
Acknowledgement
This research was funded partially by grant number R21 HD046612-01 from the
National Institute of Child Health and Human Development.
References
ABKAR, A.-A., SHARIFI, M.A. and MULDER, N.J., 2000, Likelihood-based image segmentation
and classification: a framework for the integration of expert knowledge in image
classification procedures. International Journal of Applied Earth Observation and
Geoinformation, 2, pp. 104–119.
ADAMS, J.B., SMITH, M.O. and JOHNSTON, P.E., 1986, Spectral mixture modeling: a new analysis of
rock and soil types at the viking lander site. Journal of Geophysical Research, 91, p. 14.
ADDINK, E.A., DE JONG, S.M. and PEBESMA, E.J., 2007, The importance of scale in object-based
mapping of vegetation parameters with hyperspectral imagery. Photogrammetric
Engineering & Remote Sensing, 73, pp. 905–912.
BAATZ, M. and SCHAPE, A., 2000, Multiresolution segmentation – an optimization approach for
high quality multi-scale image segmentation. In Angewandte Geographische Informationsv-
erarbeitung, XII, pp. 12–23.
BENZ, U.C., HOFFMAN, P., WILLHAUCK, G., LINGENFELDER, I. and HEYNEN, M., 2004, Multi-
resolution, object-oriented fuzzy analysis of remote sensing data for GIS-ready infor-
mation. ISPRS Journal of Photogrammetry & Remote Sensing, 58, p. 19.
BLASCHKE, T., LANG, S. and HAY, G.J., 2008, Object-based image analysis: spatial concepts for
knowledge-driven remote sensing applications. In Lecture Notes in Geoinformation and
Cartography, p. 818, (London: Springer).
BLASCHKE, T. and STROBL, J., 2001, What’s wrong with pixels? Some recent developments
interfacing remote sensing and GIS. GIS – Zeitschrift fur Geoinformationssysteme, 14,
pp. 12–17.
Input transformations and image segmentation 27
Dow
nloa
ded
by [
Wes
t Vir
gini
a U
nive
rsity
] at
10:
03 0
8 A
ugus
t 201
1

BOCKA, M., XOFISB, P., MITCHLEYB, J., ROSSNERC, G. and WISSENC, M., 2005, Object-oriented
methods for habitat mapping at multiple scales – case studies from Northern Germany
and Wye Downs, UK. Journal for Nature Conservation, 13, p. 14.
DEFINIENS, 2003, Definiens User Guide 4.0 (Munich, Germany: Definiens).
GITELSON, A.A., STARK, R., GRITS, U., RUNDQUIST, D., KAUFMAN, Y. and DERRY, D., 2002,
Vegetation and soil lines in visible spectral space: a concept and technique for remote
estimation of vegetation fraction. International Journal of Remote Sensing, 23, pp.
2537–2562.
HAY, G.J., BLASCHKE, T., MARCEAU, D.J. and BOUCHARD, A., 2003, A comparison of three
image-object methods for the multiscale analysis of landscape structure. ISPRS Journal
of Photogrammetry and Remote Sensing, 57, pp. 327–345.
KIM, M., MADDEN, M. and WARNER, T.A., 2009, Forest type mapping using object-specific
texture measures from multispectral Ikonos imagery: segmentation quality and image
classification issues. Photogrammetric Engineering & Remote Sensing, 75, pp. 819–829.
LIU, D. and XIA, F., 2010, Assessing object-based classification: advantages and limitations.
Remote Sensing Letters, 1, pp. 187–194.
LUCIEER, A. and STEIN, A., 2002, Existential uncertainty of spatial objects segmented from
satellite sensor imagery. IEEE Transactions on Geoscience and Remote Sensing, 40, pp.
2518–2521.
MOLLER, M., LYMBURNER, L. and VOLK, M., 2007, The comparison index: a tool for assessing
the accuracy of image segmentation. International Journal of Applied Earth Observation
and Geoinformation, 9, pp. 311–321.
NEUBERT, M. and MEINEL, G., 2003, Evaluation of segmentation programs for high resolution
remote sensing applications. In Proceedings of the Joint ISPRS/EARSeL Workshop ‘High
Resolution Mapping from Space 2003’, 6–8 October 2003, Hannover, Germany, p. 8.
OPENSHAW, S., 1984, Ecological fallacies and the analysis of areal census-data. Environment and
Planning A, 16, pp. 17–31.
PEREIRA, J.M.C., 1999, A comparative evaluation of NOAA/AVHRR vegetation indexes for
burned surface detection and mapping. IEEE Transactions on Geoscience and Remote
Sensing, 37, pp. 217–226.
RIDD, M.K., 1995, Exploring a V–I–S (vegetation–impervious–surface-soil) model for urban
ecosystem analysis through remote sensing: comparative anatomy for cities.
International Journal of Remote Sensing, 16, pp. 2165–2185.
ROGAN, J., FRANKLIN, J. and ROBERTS, D.A., 2002, A comparison of methods for monitoring
multitemporal vegetation change using Thematic Mapper imagery. Remote Sensing of
Environment, 80, pp. 143–156.
ROSENFELD, A. and DAVIS, L.A., 1979, Image segmentation and image models. Proceedings of
the IEEE, 67, p. 8.
SMALL, C., 2001, Estimation of urban vegetation abundance by spectral mixture analysis.
International Journal of Remote Sensing, 22, p. 29.
STOW, D., LIPPITT, C.D. and WEEKS, J., 2010, Delineation of neighborhoods of Accra, Ghana
based on Quickbird satellite data. Photogrammetric Engineering & Remote Sensing, 76,
pp. 907–914.
STOW, D., NIPHADKAR, M. and KAISER, J., 2005, MODIS-derived visible atmospherically
resistant index for monitoring chaparral moisture content. International Journal of
Remote Sensing, 26, pp. 3867–3873.
STRAHLER, A.H., WOODCOCK, C.E. and SMITH, J.A., 1986, On the nature of models in remote-
sensing. Remote Sensing of Environment, 20, pp. 121–139.
TRIAS-SANZ, R., STAMON, G. and LOUCHET, J., 2008, Using colour, texture, and hierarchial
segmentation for high-resolution remote sensing. ISPRS Journal of Photogrammetry
and Remote Sensing, 63, pp. 156–168.
28 C.D. Lippitt et al.
Dow
nloa
ded
by [
Wes
t Vir
gini
a U
nive
rsity
] at
10:
03 0
8 A
ugus
t 201
1

WOODCOCK, C. and HARWARD, V.J., 1992, Nested-hierarchical scene models and image segmen-
tation. International Journal of Remote Sensing, 13, pp. 3167–3187.
WU, C. and MURRAY, A.T., 2003, Estimating impervious surface distribution by spectral
mixture analysis. Remote Sensing of Environment, 84, pp. 493–505.
ZHAN, Q.M., MOLENAAR, M., TEMPFLI, K. and SHI, W.Z., 2005, Quality assessment for
geo-spatial objects derived from remotely sensed data. International Journal of
Remote Sensing, 26, pp. 2953–2974.
Input transformations and image segmentation 29
Dow
nloa
ded
by [
Wes
t Vir
gini
a U
nive
rsity
] at
10:
03 0
8 A
ugus
t 201
1