1. Giới thiệu chung 1.1 Giới thiệu về Lean Manufacturing Lean ...
Upload
khangminh22Category
view
0download
0
BU
RC
U K
UR
T
ÖZ
DE
N
THE EFFECT OF GAME-BASED
LEARNING IN LEAN PRODUCTION AND
LEAN SIX SIGMA TRAINING
A THESIS
SUBMITTED TO THE DEPARTMENT OF
INDUSTRIAL ENGINEERING
AND THE GRADUATE SCHOOL OF ENGINEERING AND SCIENCE
OF ABDULLAH GUL UNIVERSITY
IN PARTIAL FULFILLMENT OF THE REQUIREMENTS
FOR THE DEGREE OF
MASTER OF SCIENCE
By
Burcu KURT ÖZDEN
August 2019
TH
E E
FF
EC
T O
F G
AM
E-B
AS
ED
LE
AR
NIN
G IN
LE
AN
PR
OD
UC
TIO
N A
ND
LE
AN
SIX
SIG
MA
TR
AIN
ING
S
AG
U
2019

THE EFFECT OF GAME-BASED LEARNING IN
LEAN PRODUCTION AND LEAN SIX SIGMA
TRAINING
A THESIS
SUBMITTED TO THE DEPARTMENT OF
INDUSTRIAL ENGINEERING
AND THE GRADUATE SCHOOL OF ENGINEERING AND SCIENCE OF
ABDULLAH GUL UNIVERSITY
IN PARTIAL FULFILLMENT OF THE REQUIREMENTS
FOR THE DEGREE OF
MASTER OF SCIENCE
By
Burcu KURT ÖZDEN
August 2019

SCIENTIFIC ETHICS COMPLIANCE
I hereby declare that all information in this document has been obtained in accordance
with academic rules and ethical conduct. I also declare that, as required by these rules and
conduct, I have fully cited and referenced all materials and results that are not original to
this work.
Name-Surname: Burcu KURT ÖZDEN
Signature:

REGULATORY COMPLIANCE
M.Sc. Thesis titled “The Effect of Game-Based Learning in Lean Production and Lean
Six Sigma Training “has been prepared in accordance with the Thesis Writing Guidelines
of the Abdullah Gül University, Graduate School of Engineering & Science.
Prepared By Advisor
Burcu KURT ÖZDEN Dr. Muhammed SÜTÇÜ Dr. Elif BENGÜ
Head of the Industrial Engineering
Prof.Dr.İbrahim AKGÜN

ACCEPTANCE AND APPROVAL
M.Sc. thesis titled “The Effect of Game-Based Learning in Lean Production and Lean Six
Sigma Training” and prepared by Burcu KURT ÖZDEN has been accepted by the jury in
the Industrial Engineering Graduate Program at Abdullah Gül University, Graduate
School of Engineering & Science.
05 /08 / 2019
(Thesis Defense Exam Date)
JURY:
Advisor : Dr. Muhammed SÜTÇÜ
Advisor : Dr. Elif BENGÜ
Member : Assoc. Prof. Dr. Sinem KULLUK
Member : Assoc. Prof. Dr. Adem GÖLEÇ
Member : Dr. Selçuk GÖREN
APPROVAL:
The acceptance of this M.Sc.thesis has been approved by the decision of the Abdullah
Gül University, Graduate School of Engineering & Science, Executive Board dated …..
/….. / ……….. and numbered .…………..……. .
……….. /……….. / ………..
(Date)
Graduate School Dean
Name-Surname, Signature

i
THE EFFECT OF GAME-BASED LEARNING IN LEAN
PRODUCTION AND LEAN SIX SIGMA TRAINING
Burcu Kurt Özden
MSc. in 2019
Supervisor: Dr. Muhammed SÜTÇÜ
Dr. Elif BENGÜ
August 2019
Nowadays, business leaders and managers are highly concerned about the
sustainability of their success. In the business world, there are many leaders, companies,
products, and even industrial areas that have a short-term reputation.
What is the key to be at the top constantly and to keep the competition ability at a
high level in such an environment? Most small and big companies try to find answers to
this question. For this reason, they try to implement different strategies and innovations
to improve their process and standards. Accordingly, we face the Lean Production
System, Six Sigma, and Lean Six Sigma concepts.
Japanese employees of Toyota Company developed the Lean Production system
after the Second World War. It is a methodology “that is based on the elimination of all
wastage in the enterprise and respect for human,”
The leading position of Japanese companies with their works has attracted the
attention of American companies in particular. The Six Sigma method, which includes
quality improvements to meet the expectations of the customer, was implemented under
the leadership of Motorola, which was an American Company. In the 2000s, the Lean Six
Sigma management system, which simultaneously used Lean Production techniques with
Six Sigma techniques, has emerged. Lean Six Sigma is a management philosophy that
aims to reduce waste, increase productivity, and improve product quality in line with
customer demands and expectations.
One of the most critical elements in Lean Production and Lean Six Sigma systems
is to respect human beings and to value people. For Lean Production and Lean Six Sigma
systems to be successful, when these techniques are no longer mandatory and become a
company culture, success is sustainable, the right techniques should be provided with the
ii
right training for these systems to be able to become the culture. Since companies
implementing Lean Production and Lean Six Sigma system cannot make the right choice
in training and cannot make their employees adapt to this culture, new improvement
systems can cause misfortune of the companies. This study, which aims to solve the
difficulties of the companies in the selection of training with a technical point of view,
will contribute to both the applications in the production facilities and the academic
literature.
In this study, the Lean Production System, Six Sigma Method, Lean Six Sigma
Method are explained in general, new lean game is designed and the effect of using game-
based learning techniques on Lean Production and Lean Six Sigma training is discussed.
The aim of this thesis is:
1. To analyze the effects of game-based learning in training that use Lean
Production and Lean Six Sigma management system on learning and
2. To guide the companies on selecting the right training techniques.
Key Words: Lean Six Sigma, Training, Game-Based Learning, Lean Game, Gamification

iii
ÖZET
YALIN ÜRETİM VE YALIN ALTI SİGMA EĞİTİMLERİNDE
OYUN TABANLI ÖĞRENMENİN ETKİSİ
Burcu KURT ÖZDEN
Endüstri Mühendisliği Yüksek Lisans
Tez Yöneticisi: Dr. Öğr. Üyesi Muhammed SÜTÇÜ
Dr. Öğr. Üyesi Elif BENGÜ
Ağustos-2019
Günümüzde iş dünyası liderlerinin ve yöneticilerinin en çok endişe ettiği konu
başarının sürdürülebilirliği konusudur. İş dünyasında şöhreti çok kısa süren birçok lider,
şirket, ürün ve hatta sanayi alanları bulunmaktadır.
Böyle bir ortamda sürekli zirvede kalmanın ve rekabet yeteneğini üst seviyede
tutmanın anahtarı nedir? sorusu büyük ya da küçük ölçekli tüm işletmelerin cevabını
aradığı sorudur. Bu nedenle firmalar süreçlerini iyileştirmek için farklı stratejileri ve
yenilikleri uygulamaya çalışmaktadırlar. Bu doğrultuda karşımıza Yalın Üretim, Altı
Sigma ve Yalın Altı Sigma kavramları çıkmaktadır.
Yalın Üretim Sistemi, ana hatlarıyla, II. Dünya Savaşı sonrası Japonların ve
özellikle Toyata çalışanlarının geliştirdikleri, işletmedeki tüm israfların ortadan
kaldırılması ve insana saygıyı temel alan bir metodolojiler bütünüdür.
Japon firmalarının çalışmaları ile lider konuma gelmeleri, özellikle Amerikan
firmalarının dikkatini çekmiştir. Bu doğrultuda müşterinin beklentilerini karşılayacak
kalite iyileştirmelerini içeren Altı Sigma yöntemi, bir Amerikan Şirketi olan Motorola’nın
liderliğinde, uygulanmaya başlamıştır. 2000’li yıllarda Altı Sigma teknikleri ile eş
zamanlı olarak Yalın Üretim tekniklerinin de kullanıldığı “Yalın Altı Sigma” kavramı
ortaya çıkmıştır. Yalın Altı Sigma, müşteri talep ve beklentileri doğrultusunda, israfı
azaltmayı, verimliliği arttırmayı ve kaliteyi artırmayı amaçlayan yönetim sistemidir.
Yalın Üretim ve Yalın Altı Sigma sistemlerinde en önemli unsurlardan biri insana
saygı ve insana değer vermektir. Yalın Üretim ve Yalın Altı Sigma sistemleri zorunluluk
olmaktan çıkıp firma kültürü haline geldiğinde başarı, sürdürülebilir olmaktadır. Bu

iv
sistemlerin kültür haline gelebilmesi için doğru teknikler ile doğru eğitimlerin verilmesi
gerekmektedir.
Yalın Üretim ve Yalın Altı Sigma sistemini uygulayan firmalar eğitim seçiminde
doğru tercihi yapamadıkları ve çalışanları bu kültüre adapte edemedikleri için yeni
iyileştirme sistemleri firmaların felaketine sebep olabilmektedir. Firmaların eğitim
seçiminde yaşadıkları zorlukları teknik bir bakış açısı ile çözümlemeyi hedefleyen bu
çalışma hem üretim tesislerindeki uygulamalara hem de akademik literatüre katkıda
bulunacak niteliktedir.
Bu çalışmada Yalın Üretim Sistemi, Altı Sigma Yöntemi, Yalın Altı Sigma
Yöntemi genel hatlarıyla anlatılmıştır, yeni bir yalın oyun tasarlanmıştır ve Yalın Üretim
ve Yalın Altı Sigma eğitimlerinde oyun temelli öğrenme tekniklerinden biri olan yalın
oyunların kullanılmasının öğrenmeye etkisi analiz edilmiştir.
Bu tezin amacı:
1. Yalın Üretim ve Yalın Altı Sigma yönetim sistemini kullanan işletmelerde oyun
temelli öğrenmenin etkilerini analiz etmek ve
2. Firmaları doğru eğitim tekniklerini seçme konusunda yönlendirmektir.
Anahtar Kelimeler: Yalın Altı Sigma, Eğitim, Oyun Temelli Öğrenme, Yalın Oyun,
Oyunlaştırma

v
Acknowledgements
I would like to express my endless thanks to my advisor, Dr. Muhammad SÜTÇÜ,
for his interest and support in planning, execution, and formation of my thesis, for
allocating his precious time and patiently helping me when I consulted him, and for his
vast knowledge and experience.
I would like to extend my thanks to my advisor, Dr. Elif BENGÜ, for shaping my
thesis in the light of educational sciences with her guidance and enlightenment and for
her encouragement and and sincerity.
I would like to express my gratitude to my department chair Prof. Dr. İbrahim
AKGÜN and faculty member Dr. Selçuk GÖREN for their contributions to my career
and my future endovers with their knowledge, experience, and working discipline.
I would like to express my endless thanks to Assoc. Prof. Dr. Adem GÖLEÇ who
introduced me to Lean Production during my university years and enlightened me with
his perspective and scientific contributions, and to Assoc. Prof. Dr. Sinem KULLUK who
has always guide with her knowledge and experience, from whom I have learned a lot
and I hope to continue learning from now on.
And lastly, I would like to express my endless thanks to my friends who have helped
me with their ideas and encouraged me at every stage of my thesis, to my dearest husband,
Ferhat Özden, who have supported me with all the difficulties during my master program,
and to my family, my greatest chance in this life, who raised me to know the meanings of
the words of love and respect.
vi
Table of Contents
1. INTRODUCTION ..................................................................................................... 1
1.1 PURPOSE OF THE STUDY .......................................................................... 1
1.2 SIGNIFICANCE OF THE STUDY ............................................................... 2
1.3 MOTIVATION FOR THE STUDY ............................................................... 2
2. LITERATURE RESEARCH ................................................................................... 4
2.1 LEAN PRODUCTION ................................................................................... 4
2.1.1 Principles of Lean Production ............................................................................. 7
2.1.2 Lean Production techniques ................................................................................. 8
2.1.2.1 5S ....................................................................................................... 8
2.1.2.2 Just in time production ...................................................................... 10
2.1.2.3 One-piece flow .................................................................................. 10
2.1.2.4 Kanban ............................................................................................. 11
2.1.2.5 Heijunka ........................................................................................... 11
2.1.2.6 Value stream mapping (VSM) ........................................................... 12
2.1.2.7 Makigami .......................................................................................... 13
2.1.2.8 Poka yoke ......................................................................................... 13
2.1.2.9 Jidoka ............................................................................................... 14
2.1.2.10 Total preventive maintenance (TPM) .............................................. 15
2.1.2.11 SMED (Single minute exchange of dies) .......................................... 15
2.1.2.12 KAIZEN .......................................................................................... 16
2.2 SIX SIGMA .................................................................................................. 18
2.2.1 Six Sigma principles .......................................................................................... 21
2.2.2 Six Sigma methods ............................................................................................. 22
2.2.2.1 DMAIC ............................................................................................. 22
2.2.2.2 DFSS (Design for Six Sigma) ............................................................ 24
2.2.3 Six Sigma organizational structure .................................................................... 25
2.3 LEAN SIX SIGMA ...................................................................................... 26
2.4 LEAN PRODUCTION AND LEAN SIX SIGMA TRAINING .................. 29
2.5 GAME-BASED LEARNING ....................................................................... 35

vii
3. IMPLEMENTATION OF LEAN PRODUCTION TRAINING AND DESIGN
OF THE EDUCATIONAL GAME ............................................................................. 44
3.1 COMPANY AND TRAINING OVERVIEW .............................................. 44
3.2 DESIGN OF THE EDUCATIONAL GAME .............................................. 48
3.3 APPLICATION OF LEAN PRODUCTION TRAINING ........................... 54
3.3.1 Methodology ...................................................................................................... 54
3.3.2 The key performance indicators of Kaizen Word Game ...................................... 57
4. IMPLEMENTATION OF TRAINING AND EVALUATION OF RESULTS ... 59
4.1 IMPLEMENTATION OF TRAINING ........................................................ 59
4.1.1 Demographic structure of the training ............................................................... 59
4.1.2 The results of achievement test ........................................................................... 61
4.1.3 The results of end-of-training outcomes ............................................................. 76
4.1.4 General training evaluation results .................................................................... 82
4.1.5 Analysis of training outputs ............................................................................... 85
4.2 EFFECT OF LEAN PRODUCTION TRAINING ON KPI IN KAIZEN
WORD GAME ................................................................................................... 87
5. CONCLUSIONS AND FUTURE PROSPECTS ................................................... 94
5.1 CONCLUSIONS .......................................................................................... 94
5.2 FUTURE PROSPECTS ................................................................................ 96
BIBLIOGRAPHY ......................................................................................................... 96
APPENDIX .................................................................................................................. 118
viii
List of Figures
Figure 2.2.3.1 Roles of the leader .................................................................................. 25
Figure 2.3.1 The basic keys of Lean Six Sigma ............................................................. 27
Figure 2.5.1 Learning pyramid . ..................................................................................... 41
Figure 2.5.2 The experimental learning cycle of Kolb ................................................... 41
Figure 3.1.1 Example of Ball Game cycle ...................................................................... 47
Figure 3.2.1 Fish Bone Diagram ..................................................................................... 50
Figure 3.2.2 PDCA cycle example ................................................................................. 53
Figure 4.1.5.1 Group 1 training output graph ................................................................. 86
Figure 4.1.5.2 Group 2 training output graph ................................................................. 87
Figure 4.1.5.3 Group 3-group 4 training output graph ................................................... 87
Figure 4.2.1 Completion time graph ............................................................................... 89
Figure 4.2.2 Net completion time graph ......................................................................... 89
Figure 4.2.3 Number of orange card ............................................................................... 90
Figure 4.2.4 Cycle time ................................................................................................... 91
Figure 4.2.5 Graph of number of quality errors .............................................................. 92
ix
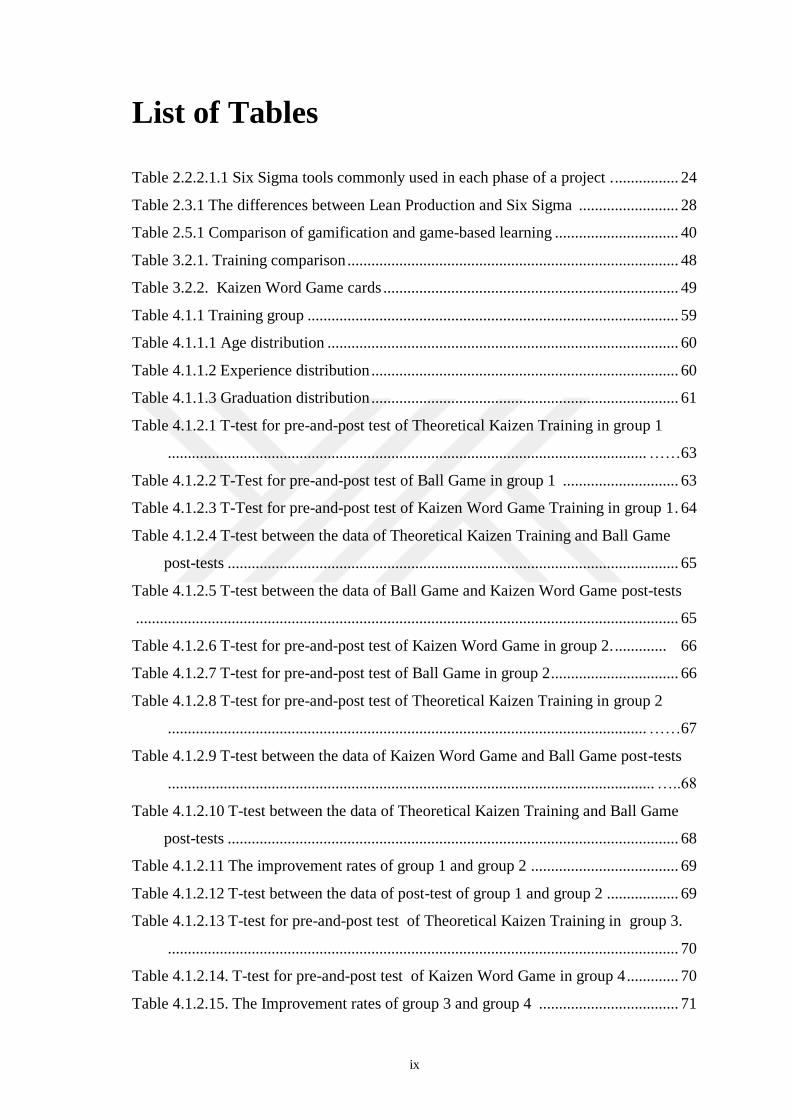
List of Tables
Table 2.2.2.1.1 Six Sigma tools commonly used in each phase of a project . ................ 24
Table 2.3.1 The differences between Lean Production and Six Sigma ......................... 28
Table 2.5.1 Comparison of gamification and game-based learning ............................... 40
Table 3.2.1. Training comparison ................................................................................... 48
Table 3.2.2. Kaizen Word Game cards .......................................................................... 49
Table 4.1.1 Training group ............................................................................................. 59
Table 4.1.1.1 Age distribution ........................................................................................ 60
Table 4.1.1.2 Experience distribution ............................................................................. 60
Table 4.1.1.3 Graduation distribution ............................................................................. 61
Table 4.1.2.1 T-test for pre-and-post test of Theoretical Kaizen Training in group 1
........................................................................................................................ ……63
Table 4.1.2.2 T-Test for pre-and-post test of Ball Game in group 1 ............................. 63
Table 4.1.2.3 T-Test for pre-and-post test of Kaizen Word Game Training in group 1 . 64
Table 4.1.2.4 T-test between the data of Theoretical Kaizen Training and Ball Game
post-tests ................................................................................................................. 65
Table 4.1.2.5 T-test between the data of Ball Game and Kaizen Word Game post-tests
........................................................................................................................................ 65
Table 4.1.2.6 T-test for pre-and-post test of Kaizen Word Game in group 2. ............. 66
Table 4.1.2.7 T-test for pre-and-post test of Ball Game in group 2 ................................ 66
Table 4.1.2.8 T-test for pre-and-post test of Theoretical Kaizen Training in group 2
........................................................................................................................ ……67
Table 4.1.2.9 T-test between the data of Kaizen Word Game and Ball Game post-tests
.......................................................................................................................... …..68
Table 4.1.2.10 T-test between the data of Theoretical Kaizen Training and Ball Game
post-tests ................................................................................................................. 68
Table 4.1.2.11 The improvement rates of group 1 and group 2 ..................................... 69
Table 4.1.2.12 T-test between the data of post-test of group 1 and group 2 .................. 69
Table 4.1.2.13 T-test for pre-and-post test of Theoretical Kaizen Training in group 3.
................................................................................................................................ 70
Table 4.1.2.14. T-test for pre-and-post test of Kaizen Word Game in group 4 ............. 70
Table 4.1.2.15. The Improvement rates of group 3 and group 4 ................................... 71

x
Table 4.1.2.16 T-test between the data of post-test of group 3 and 4 ............................. 71
Table 4.1.2.17 Question-based analysis .......................................................................... 72
Table 4.1.2.18 Improvement rates among the group ...................................................... 72
Table 4.1.2.19 Levene's test of equality of error variances ............................................ 73
Table 4.1.2.20 The result of the ANCOVA .................................................................... 73
Table 4.1.2.21 The results of the Bonferroni test ........................................................... 74
Table 4.1.2.22 The results of ANOVA test of pre-test ................................................... 75
Table 4.1.2.23 The results of multiple regression analysis of pre-test ........................... 75
Table 4.1.2.24 Model summary of pre-test ..................................................................... 75
Table 4.1.2.25 The results of ANOVA test for post-test ................................................ 76
Table 4.1.2.26 The results of multiple regression analysis of post- test ......................... 76
Table 4.1.2.27 Model summary of post-test ................................................................... 76
Table 4.1.3.1 End-of-training outcomes ......................................................................... 77
Table 4.1.3.2 T-test for outcomes of Theoretical Kaizen Training and Ball Game
of group 1 ................................................................................................................ 78
Table 4.1.3.3 T-test for outcomes of Ball Game and Kaizen Word Game of group 1 .. 78
Table 4.1.3.4 T-test for outcomes of Kaizen Word Game and Ball Game of group 2 .. 79
Table 4.1.3.5 T-test for outcomes of Ball Game and Theoritical Kaizen Training
of group 2 ................................................................................................................ 80
Table 4.1.3.6 T-test for the end-of-training outcomes of group 1 and group 2 .............. 80
Table 4.1.3.7 T-test for the end-of-training outcomes of group 3 and group 4 .............. 81
Table 4.1.3.8 The mean of the criteria for end-of-training outcomes of group 3 and
group 4 .................................................................................................................. 81
Table 4.1.4.1 T-test for general training evaluations of Theoretical Kaizen Training and
Ball Game of group 1 .............................................................................................. 82
Table 4.1.4.2 T-test for general evaluations of Ball Game and Kaizen Word Game of
group 1 .................................................................................................................... 83
Table 4.1.4.3 T-test for general evaluations of Ball Game and Kaizen Word Game of
group 2 .................................................................................................................... 83
Table 4.1.4.4 T-test for general training evaluations of Ball Game and Theoretical
Kaizen Training of group 2 ..................................................................................... 84
Table 4.1.4.5 T-test for the general training evaluations of group 1 and group 2 .......... 84
Table 4.1.4.6 T-test for the general training evaluations of group 3 and group 4 .......... 85
Table 4.1.5.1 The words in training output groups ......................................................... 85

xi
Table 4.2.1 T-test for net completion time ..................................................................... 90
Table 4.2.2 Coefficient of variations (cv) of cycle time for in phases 1 and 2 ............... 91
Table 4.2.3 T-test of coefficient of variations(cv) of cycle time for section 1 and 2 ..... 92
Table 4.2.4 T-Test for the number of quality errors ....................................................... 93

xii
To My Family

1
Chapter 1
Introduction
1.1 Purpose of the Study
Lean Production and Lean Six Sigma systems are based on respecting human and
respecting opinions. For Lean Production and Lean Six Sigma systems to be successful,
these techniques should not be implemented as an obligation. When these improvement
systems become a company culture, success will be sustainable. It has to become the
company culture out of obligation for Lean Production and Lean Six Sigma system to be
successful. To make this possible, appropriate training should be given with appropriate
techniques.
Many firms have difficulty in selecting training techniques and have difficulty in
measuring the learning outcomes of their employees [1]. Instead of checking the quality
of the training methods or the method of delivery, companies usually put the blame on
Lean Production and Lean Six Sigma management systems for the the reason of the
failure.
One of the aims of this study is to analyze the effects of lean games which are
actively used in Lean Production and Lean Six Sigma management system training on
learning. This study also aims to help firms to make the right decisions in the selection of
the training.
The study focused on the following research questions:
1. How do the choice of Lean Production and Lean Six Sigma training affect
learning?
a) How do the standard training in Lean Production and Lean Six Sigma affect
learning?
b) How do lean games in Lean Production and Lean Six Sigma training affect
learning?
c) How does new designed interactive Lean Game in Lean Production and Lean Six
Sigma training affect learning?

2
2. How do key performance indicators of new designed interactive Lean Game
change?
1.2 Significance of the Study
Lean Production and Lean Six Sigma management systems are the systems that
have been successful throughout the years, and that aimed at continuous improvement in
both production and service sectors.
By providing the same Lean Production and Lean Six Sigma training to the
employees who have different backgrounds, characteristics, and abilities, we should not
expect the achievement of success in building the philosophy of continuous improvement.
Companies provide different kinds of training called improvement, but they do not
improve training content. They contradict themselves. Training cannot be improved if it
is not measured or evaluated. Companies that realize the continuous improvement of their
trainings can step forward.
This study focuses not only on the effects of the training techniques on learning but
also the facilitation of the decision-making process when selecting a training techniques
to apply Lean Production and Lean Six Sigma results for the improvement of the training.
1.3 Motivation for the Study
During my university studies, we had a chance to visit Toyota factory in Turkey.
During that technical visit, I learned about Toyota Production System, which is one of the
most advanced Lean Production systems in the world. Since then, I have started to
research about this management philosophy, which is based on respecting human and
waste disposal.
The university lectures and the projects we worked on during the courses
strengthened my knowledge more on Lean Production. However, something was missing.
I couldn’t have found the missing part until I took the training titled “Learning from
Kaizen Master” by K. Ozawa Sensei, who once worked in Toyota companies, and talked
about how to create a Lean Production culture beyond the classic Kaizen approach and
how to ensure the employees' sincere participation in Kaizen's work. In the last part of
3
the training, game-based training was given. Over time, I discovered the impact of
learning Lean Production by a lean game, which is also the game-based learning
technique that was used in the last part of the training. After this discovery, I continued
to study and research the lean games.
I started providing Lean Production and Lean Six Sigma training when I graduated
and started working as a Lean Office Engineer at a private company in Turkey. The
methods I used to measure the improvement of the trainings were insufficient to measure
the impact of the trainings.
I needed to measure whether the lean games, one of the game-based learning
techniques, had any benefit and effect on learning. Because if we could not measure the
effectiveness of training on employees, the improvement systems could have failed.
Thesis subject of this study has been determined as a result of practice and training
given for years. In order to overcome the faults and disadvanteges in other trainings, new
lean game has been designed.
The focus of this thesis is to demonstrate the positive outcomes of lean game
training, one of the game-based learning techniques, for on learning. Game-based
learning also includes entertainment elements and can create dynamism at work.
Moreover, the study will be carried out to assist companies and researchers that
implement or will start to implement Lean Production and Lean Six Sigma management
systems, in the process of selection of the training and its improvement.
4
Chapter 2
Literature Research
2.1 Lean Production
Lean Production is not a new phenomenon. The origin of Lean Production belongs
to Japan, specifically to the Toyota Motor Company [2]. Lean thinking has long history
and is contributed by different cultures. It is derived from the Toyota Production System,
Henry Martin Ford, and other predecessors [2].
Starting in 1910, Henry M. Ford and Charles E. Sorensen set up the first
comprehensive production strategy [3]. Henry M. Ford and his right-hand man Charles
E. Sorensen used all the elements of the productions system and arranged them in a
continuous system for manufacturing the Model T automobile. Ford has been very
successful with the black Model T and line production system. The production time of an
automobile was reduced from 13 hours in 1912 to 1.5 hours in 1914 with the assembly
line designed by Ford [4]. This success has quickly made him one of the richest men in
the world. Ford is considered by many to be the first implementer of just-in-time and Lean
Production.
In his book “Today and Tomorrow,” which belongs to Henry M. Ford, “The
industry's last point is to save the human mind and body from the hardship and exhaustion
of their tough working conditions and to produce good products at low cost.”[5].This
shows that Ford and his team had no goals in true sense of making workers work more
and making them slaves of the machine [3, 5 and 6]. When the competition conditions
began to change, Ford's famous system began to breakdown [7]. The words show that
Ford is not open to change “Any customer can have a car painted any color that he wants
so long as it is black” [4, 8].
At General Motors, Alfred P. Sloan took more pragmatic approach. He developed
business and manufacturing strategies for managing huge enterprises and dealing with a
variety [9, 10]. General Motor's model diversity was more interesting than Ford's black-
colored car. By the mid-1930s, General Motors passed Ford in the domination of the

5
automotive market [10] .General Motor's color, type, and model diversity were
prominent. The rise of General Motors brought diversity to car models [3, 10].
While the American automotive industry was developing rapidly, Sakichi Toyoda
put the foundations of The Toyota Group in Japan. [11] He was working on weaving
looms. He developed important concepts like five whys, Jidoka, automation [11]. He
succeeded tremendously by, improving both productivity and work efficiency. Toyoda’s
loom with jidoka became very popular in Japanese weaving companies [11]. In 1910,
Sakichi Toyoda visited the United States. The automotive sector attracted his attention
during this visit. So, The Toyoda family took the first step into the automobile industry.
He encouraged his son Kiichiro Toyoda to enter into the automobile industry [12, 13, and
14].
Kiichiro Toyoda was the founder of the Toyota Motor Corporation in 1937 [6]. He
applied the philosophy of “Just in Time” in automotive production. By practicing the
philosophies of "Daily Improvements" and "Good Thinking, Good Products," the Toyota
Production System has evolved into a world-renowned production system. Kiichiro's
greatest supporter was Taiichi Ohno.
In 1945, Taiichi Ohno became the head of the production department of Toyota
Motor Company [15]. Taiichi Ohno was the architect of The Toyota Production system
and a symbol of Japan's manufacturing resurgence after the Second World War.
Toyota had to produce military vehicles during the Second World War. After the
war, Toyota started working to produce its own automobile and to increase its efficiency.
After the war, Sakichi’s son, Eiji Toyoda and Taiichi Ohno went to America, and with
the philosophy of Genchi Genbutsu, they adapted his observations to the automotive
industry [3, 12, and 16]. The aim of Genchi Genbutsu was “going to the source and to
find the facts” [3] .Taiichi Ohno was capable of creating a system linking the two pillars
of the TPS (Jidoka and Just-in-time) with the Ford assembly line [16]. Under these
conditions, the goal of the Japanese was not to imitate Fordist production. They intended
to build a better system.
Toyota does not deny that much has been learned from the American automobile
empire [3]. Japan has been successful in importing and implementing improvement
practices [3]. Instead of making too much production, Toyota aimed to produce more
flexible, better quality, and less costly production. The three most essential elements of
production are labor, capital, and land. There was very little capital in Japan because of
the war. The land was limited. There was only one thing open to healing, and that was the

6
labor. The important thing was to use the workforce properly [17]. As a result, Toyota
has always given importance to human respect. Toyota soon discovered that factory
workers had far more to contribute than just muscle power. Thus, quality circles and
Kaizen principles began [14].
Zambanini reported that “application of statistical control came later as a result of
World War production methods, and were advanced from the work done by W. Edwards
Deming, and Dr. Joseph M. Juran” [18]. They have worked on total quality management.
At the beginning, these statisticians won several transformations in the United States.
Zambanini reported that “However, managers in Japan embraced their ideas
enthusiastically.” [18]. Zambanini reported that “General Douglas MacArthur, the
Supreme Commander of the Allied Powers, invited Deming to Japan in 1947 to assist in
preparing the 1951 census, a census that had, as one of its functions, to determine the
destruction caused by World War II.“ [18]. The Japanese Union of Scientists and
Engineers (JUSE) sought out statistical process control (SPC) experts. That same year,
they brought Deming to help them train hundreds of Japanese managers [18]. JUSE also
introduced the Deming Prize in 1950, an indication of the importance with which the
Japanese saw Deming’s teachings [18, 19]. Deming saw quality management as a
process, and it has brought the PDCA (Plan-Do-Check-Act) cycle into a philosophy of
quality [20]. Deming’s PDCA was used in the improvement of the Toyota Production
System. Taichi Ohno reported that “Ishikawa is one of the leaders contributing to total
quality management, Deming, and Juran all made major contributions to the quality
movement.” It culminated in team development and cellular manufacturing [12].
Toyota was developing rapidly with the Toyota Production System and was the
created the Lean Production System in 1973, when the oil crisis entered the world's
agenda [16]. Japan survived the 1973 oil crisis quickly. Due to the oil crisis, fuel prices
increased, and customers preferred Japanese cars which had not been preferred before.
The definition of “Lean Production” was first made by John Krafcick, a researcher
at Harvard University [21]. The reason why Krafcick used the lean term was that the new
system used fewer resources than Fordist production [15, 21]. In their book “The Machine
That Changed the World” Womack, Jones and Roos, combined a comparative study of
Japanese, American, and European automotive assembly plants and came up with a new
phrase lean. “Lean Production” was new phase in their book [14]. This study is one of the
most important works of Lean Production. In this study, Lean Production is defined as
the production system where the elements like error, cost, stock, labor, etc. are minimized,

7
and waste is destroyed [14]. The key to success in Lean Production is to eliminate waste.
[22] Taiichi Ohno defined waste as “an activity that consumes resources, but non-value-
added” [12]. Henry M. Ford defined waste as “everything that does not add value” [23,
24, and 25]. Ohno, Womack and Jones primarily describe seven wastes of Lean
Production. [3, 12, 24, and 26].
The Seven Wastes of Lean Production are [3, 27 and, 28];
● Transport
● Inventory
● Motion
● Waiting
● Over-Processing
● Overproduction
● Defects
2.1.1 Principles of Lean Production
Lean Production is to simplify production in accordance with some principles. In
line with these principles, continuous improvement activities are becoming standard.
The basic principles of Lean Production are given below; [26, 29].
Define Value
Value Stream
Create Flow
Establish Pull
Seek Perfection
Define Value: Value is what the customer is willing to pay for [26, 29, and 30].
Value Stream: The value Stream is to define all activities that contribute to these values
by considering the value defined by the customer [31].
Create Flow: value interrupted throughout all processes the flow and the elimination of
wastes [3, 26].
Establish Pull: Production in accordance with the demand of the customer [24].
Seek Perfection: Continuous improvement of this value should be provided. It is
impossible to achieve perfection, but it is possible to approach perfection [24, 32].
8
2.1.2 Lean Production Techniques
2.1.2.1 5S
5S, which is the basis of Lean Production techniques, is a workplace arrangement
technique. At first, it is simple, but in fact, it is a difficult technique.
5S consists of 5 steps starting with the letter ‘S’ [33]. These steps are listed below.
Sort (Seiro)
Set in order (Seiton)
Shine (Seiso)
Standardize (Seiketsu)
Sustain (Shitsuke)
1. Sort (Seiro): It is the first step of 5S systematics. In this step, the materials are
classified as necessary and unnecessary [33]. The aim is to remove unnecessary materials
in the work areas. Cards, which are called red tags, are applied to unnecessary materials
and inappropriate situations [34, 35]. Red tags can be hung on unnecessary materials, and
also can be hung on sources of pollution, oil leaks, or damaged machine parts [34].
Materials with a red card are moved to the red area. The red area is the name given to the
5S collection area in 5S systematic. Materials in the red area are removed in a short time.
2. Set in order (Seiro): This step is the step in which the required materials are classified
according to the frequency of use in the work area where there are no unnecessary
materials. Suzuki reported that there should be 'a place for everything and everything in
its place' is the notion that everything should have somewhere to be stored and material
should return when not in use [24]. In this step, hourly, daily, weekly, or annual usage,
amounts of materials are examined. Materials that are frequently used according to the
frequency of use are placed in close areas. Less commonly used materials are placed in
slightly more remote areas. At the same time, inventory quantities are determined. In this
step, it is aimed to reduce material search time and eliminate waste of motion.
3. Shine (Seiso): 5S systematics are generally perceived as cleaning. Cleaning is a result
when 5S studies are successful. At the beginning of the 5S operation, only a large cleaning
operation is performed. Then the root causes of the sources of pollution are detected, and
the source of pollution is destroyed [24, 34]. The aim is to keep the work areas clean
without contamination, without the need for large cleaning preparations are made for

9
visual cleaning forms and cleaning checklists to suit the working areas and the machine
park.
4. Standardize (Seiketsu): After the first three steps of 5S are completed, this step is
started. Standardization is the establishment of standards, improvements, and control
methods to ensure the sustainability of achievements in the first three steps [24]. Taiichi
Ohno once noted, “Without standards, there can be no Kaizen.” [3, 36]. After 5S, one
cannot imagine how anyone can do Kaizen without standards. In this step, studies are
carried out to help standardization such as visual cleaning charts, work order, periodic
check charts, addressing, labeling, and color standardization.
5. Sustain (Shitsuke): Sustaining, is the step of turning the system into a habit,
developing activities, and ensure one's continuity. Everyone should supervise their own
work area and equipment. Controls and inspections should be short and standard.
However, in the Toyota system, the last step is not used as standard jobs are audited [33].
The 5S system only succeeds with the adoption of 5S by employees. In this step, the
studies are conducted on the appraisal systems and employee training.
Many studies have been done on the application of the 5S system, success factors,
and methods.
Warwood and Knowles, in their study; examined the 5S applications of enterprises
in England [37]. In this study, it is mentioned that the 5S system contributes positively to
occupational health and safety. They stated that the key to success in the 5S systematics
is the harmony between theoretical knowledge and implementation [37]. Rahman et al.
conducted surveys on two firms that applied 5S system. As a result of this study, they
stated that 5S barrier was communication and employee training [38]. 5S work is an
essential factor in ensuring the communication of 5S teams. Creating 5S teams and
creating synergy simplifies the solution of problems [39]. Too much work is required to
ensure the success of the 5S systematic because the change of working principles is very
difficult. However, these studies will result in benefits like quality, safety, and increase
of motivation [40]. According to the findings of Ho, the 5S systematics in Hong Kong
developments in the quality of products have been observed in many companies [40].
As a result of the studies and implementations, 5S does not only mean cleaning. It
is a system that provides benefits in many areas, such as quality, cost, and occupational
health and safety. In order for the 5S systematics to be successful, it is necessary to have
sustainability, good communication, and good training.

10
2.1.2.2 Just in Time Production
Just in time (JIT) is the ability to produce a product with the requested features at
the desired time and the desired amount [26]. It is also a production system that affects
all departments and ensures increasing of productivity [41, 42].
Just in Time Production, which was selected by Kiichiro Toyoda as a way of
differentiation from the American automotive industry in the 1930s was implemented by
Taiichi Ohno in the 1950s [3]. In this system, after receiving the customer request, these
demands are leveled, continuous flow is created, and production is done according to the
takt time [43, 44, and 45]. “Takt time" is a German word, which means tempo created by
the orchestra manager with the baton [46]. Just in Time Production system, on the other
hand, is a measure for linking the speed of production or service provided with the
demand of a customer. Since takt time is linked to demand, practically the customer
determines the takt time. Therefore, customer demand has great importance in the
calculation of takt time [47].
Just in Time Production aims stockless work and makes problems visible [48, 49].
There are many different definitions for Just in Time Production. In general, it is defined
as stockless production. However, Just in Time Production is a more comprehensive Lean
Production System. Just in Time Production, in addition to stockless work, continuous
improvement is made by taking into consideration the quality, customer satisfaction,
flexibility, low resource utilization, and the shortest time [50]. Just in Time Production
can be summarized as “sell first, then produce with stockless production just in time and
in good quality.” [51, 52].
2.1.2.3 One-Piece Flow
In Lean Production, one-piece flow is that each workstation produces a product in
takt time and moves it to the next workstation [21]. One-piece flow has various benefits
[53, 54]. With one-piece flow, line imbalances, wastes, and bottlenecks are made visible.
Waiting time, transportation time, and production time are reduced [53]. Thus, the
solution of visible problems becomes easier. Companies that also apply one-piece flow
used takt time rather than fast production [55].According to Garlicky, one-piece flow is
to ensure continuous flow at the forefront of productivity without transportation times in
the production stages [56]. One-piece flow is closely related to just in time production

11
[49, 57]. In Lean Production, one-piece flow is to move from small batches to the whole
with efficiency and continuous improvement at the forefront.
2.1.2.4 Kanban
The purpose of the company's operational excellence is to reduce stocks,
operational costs, and to ensure flow [58, 59]. So, Kanban, which is one of the Lean
Production techniques, is used for this purpose. Kanban, a Japanese word, is a
combination of words “Kan” which means card and “Ban” which means signal. Kanban
is a technique that tells what, when, and how much they will produce and where to send
them during production phases [60].
In this system, cards called “Kanban” are used. Kanban cards are in the visual
control tools [61]. Kanban cards contain the quantity of the parts that are placed on the
parts produced in the production processes. When all parts are used, the card returns to
its starting point and create new demand [62]. Kanban controls material flow during
production stages, but also regulates the purchase of materials from suppliers.
Taiichi Ohno set up the Kanban system based on the supermarkets which he
observed during his trip to the United States [3]. It has been successfully implemented as
part of the Toyota Production System [49]. Kanban is an important Lean Production
technique to control the amount of stock [49, 57]. With Kanban, visualization is made,
and problems become visible through visualization. However, the purpose of Kanban is
not just visualization. The main objective of Kanban is to create a system which can
perform just in time production with the pull mechanism [63].
In the current process, the pull system should be used instead of the push system
[64]. The most important advantage of using the pull system is the reduction of stocks
[65]. Kanban systems also include activated communication, preventive maintenance and
repair, and other techniques [66]. There is no need for separate stock management when
Kanban is applied. Kanban ensures that excess production and waste is minimized.
2.1.2.5 Heijunka
Heijunka is the leveling of the production line following the type and the amount
of production in a certain time period [21]. From top management to the bottom, everyone
plan the production resources [67].
12
In order to respond to customer demands, production lines need to be flexible and
produce quality products on a timely basis. These can be achieved with Heijunka. The
bottlenecks should be identified correctly, and routing should be executed. While
Heijunka eliminates large batch production to meet customer demands, it prevents
wastage [14]. With Heijunka, stocks, costs, labor, and flow time are reduced [22, 68].
It is an actively applied technique in the Lean Production System, which is the most
advanced version of the Toyota Production System. Toyota uses Heijunka in its hiring
policy as well as using it in its production lines [69].
2.1.2.6 Value Stream Mapping (VSM)
One of the principles of Lean Production is the concept of “value” [26, 29]. Value
is defined as what the customer is willing to pay for [26]. In an enterprise, analysis of all
stages and representation of them with the symbols of the value stream, from the
procurement process to the delivery to the customer, is called “Value Stream Mapping
(VSM)” [70, 71].
Shook and Rother added value stream mapping to the Lean Production literature
with their books titled “Learning to see” [72]. Thanks to them, this technique has gained
a reputation. The value stream is expressed, by Rother and Shook, as a whole of the
activities that create and do not create added value [72]. VSM aims to remove non-value-
added operations from processes and ensures continuous flow [72].A value stream
mapping application is an easy-to-implement technique [73]. What needs to be done is to
monitor the production passage of the product and draw it with symbols, and then draw
the future situation showing the continuous flow [70]. Solding and Gullander said that the
Value Stream Mapping technique's ability to analyze the process from a wide perspective,
and being easy to implement is an important advantage [73].
In the VSM, Deming's PDCA (Plan-Do-Check-Act) cycle is actively used [22, 69].
Mapping is done for the current situation and for the future situation in VSM [70]. In
determining the current situation, studies such as time studies and stock monitoring are
conducted to take the pre-work photograph [70, 72, and 74]. In the future situation,
besides the analysis methods, Lean Production techniques are used for improvements [76,
74].
Value Stream mapping technique ensures, [27, 70, and 72].
● To visualize all processes of the enterprise
13
● To detect waste sources
● To solve the problem easily
● To see the whole
● To enable production processes to speak the same language.
Birgun et al. applied this in a tractor production enterprise and stated that, when the
Lean Production System proposed as a result of the studies implemented, 21 days of
product procurement period could be reduced to 3.5 days [24]. Abdulmalek and Rajgopal,
on the other hand, reduced the time of product procurement period from 48 days to 15
days by applying the Value Stream Mapping technique in a large-scale iron and steel plant
[51]. These studies and their results reveal the benefit of the value stream mapping
technique.
2.1.2.7 Makigami
Makigami, which means paper roll in Japanese, is a method similar to the value
stream mapping method [70]. It can be used in similar cases with Value Stream Mapping.
However, the use of Makigami for the service sector is more practical [70]. Because
Value Stream Mapping may lose its importance when used in the service sector [70].
Makigami, in the service sector, provides easy results in a short time [70].
In Makigami, the green sticker is used for works that create value-added, and the
red sticker is used for works that create non-value-added [70]. Makigami is more visual,
faster, and easier to understand than other process analysis methods.
2.1.2.8 Poka Yoke
The concept of Poka Yoke, coined in Japan for the first time in 1986 by Shigeo
Shingo who worked as an engineer in Toyota, aims to eliminate mistakes caused by
human, machine or design through simple, inexpensive methods [75]. The critical point
in Poka Yoke is to detect and to eliminate human defect and faulty products before they
happen [75, 76]. According to Shingo, in order to prevent mistakes, two types of Poka
Yoke can be used [75]:
Poka Yoke as Prevention Device: This is Poka Yoke that prevents the occurrence of an
error, halts the process in case of an error and prevents it from continuing. Poka Yoke as
Prevention Device is to make the error occurrence impossible.
14
Poka Yoke as a Detection Device: This is Poka Yoke, in which visual or auditory stimuli
are activated in case of an error, warns employees. Despite stimuli, mistakes can be made.
It only gives information and reduces the risk of making mistakes.
Poka Yoke as prevention device is considered to be the most effective method in
many cases. Poka Yoke method is an important Lean Production technique which is used
for elimination and prevention of mistakes. However, because of the presence of
signalizations, sensors or warning assemblies, it is seen as an expensive technique.
However, successful Poka Yoke applications can be carried out with very simple
visualization management and low-cost hardware [40].
In literature, many studies have been carried out on the method of Poka Yoke.
Miralles et al. argue that Poka Yoke applications improve employee performance and
make things easier [77]. Patil et al. define Poka Yoke as a system that resolves defects at
its source [78]. Poka Yoke applications are implemented in different business branches.
Grout and Tossaint conducted a study about the reduction of medical defects with Poka
Yoke applications in the health sector [79]. Robinson, on the other hand, shows the
application areas of Poka Yoke in the information sector [80].
2.1.2.9 Jidoka
The Jidoka concept was born when Sakichi Toyoda, the founder of the Toyota
Group, invented a textile loom that would automatically stop when any thread was broken
[6, 11, and 12]. Toyoda’s invention made it possible for an operator to control many
machines. “Jidoka” is a word created by Toyota, “Ji” refers to employees. If there is a
fault condition, it must shut down the line or machine. “Do” refers to work. “Ka,” on the
other hand, refers to “action”. Jidoka, in Toyota, is described as the combination of human
and automation. Jidoka means that employees have the authority to halt the production
process when abnormalities are detected [81]. In Toyota, andon, a light or audible
warning system, is used to halt the line or make the abnormality apparent [69]. In Toyota,
if one of the employees detects a problem, he/she halts the line. For the solution to the
problem, it pulls the andon string or presses the button which informs teams. Thus, the
problem is solved easily without continuing [33, 69]. If it is not solved easily, he/she
receives help from support teams [33, 69].
With Jidoka, the cause of the problem is analyzed and solved in a way that it will
never happen again [69]. Jidoka is based on the principle of “Revealing Problems”. It
15
should not be confused with Poka Yoke [63]. The jidoka application area is completely
in the workflow. Poka Yoke is a method that is applied before the mistake happens [69].
2.1.2.10 Total Preventive Maintenance (TPM)
In 1970s a new maintenance strategy that is used in automotive technology began
to arise in Japan. In 1970, J.I.P.M. (Japan Institute of Plant Maintenance) called this new
maintenance strategy, aiming at improving quality and efficiency, as “Total Preventive
Maintenance” (TPM) [82]. Total preventive maintenance is a technique that includes
works oriented to increase the productivity or effectiveness of equipment which aims at
zero failure and minimum production loss [22].
TPM aims to eliminate losses such as failure, waiting, defective manufacturing, re-
processing and productivity losses that may occur in production processes [83]. The most
distinctive feature that distinguishes TPM from other maintenances is the autonomous
maintenance performed by employees. In order to be successful in TPM applications,
employees must contribute and constantly examine all steps [84]. It has been applied in
many companies and has been subject to many academic studies.
Blanchard, has assured an increase in equipment productivity and a decrease in
costs by developing a method in his study on TPM [85]. Wang and Lee emphasized the
importance of TPM for continuous improvement [86]. In their study Rodrigues and
Hatakeyama, on the other hand, emphasize the support of top management and emphasize
that TPM should be adopted by all employees [87].
2.1.2.11 SMED (Single Minute Exchange of Dies)
SMED is a Lean Production technique that was initially developed by famous
Japanese Engineer, Shigeo Shingo, aiming to exchange of patterns at a single minute [88].
Shingo has studied on SMED for many years to meet the small lot and flexible production
needs. According to Shingo, SMED is a feasible approach to any machine in any factory
[88]. The exchange of pattern time, which is tried to be reduced to single minutes is time
between the last product of the last batch and the first quality product of the new batch
[89].
Shingo applies the SMED technique in 3 steps [88]. These steps are;
1. The distinction of internal preparation and external preparation

16
2. Transformation of internal preparations into external preparations
3. Shortening of internal preparation and external preparation separately.
Internal preparation is the activity that needs to be done by shutting down the
machine and the external preparation, on the other hand, is the activity that can be carried
out while the machine is running [88].
In order to simplify and standardize the setup during SMED application, tools such
as method studies, value stream mapping, cause and effect analysis, Pareto analysis,
spaghetti diagram, Kaizen can be used [90, 91, and 92]. The SMED technique has not
only been a new technique but also a new thought system that makes an impact. Shingo
has applied the SMED technique in many companies and has been successful [88]. It
mainly has been used and developed by the Japanese. It is still a technique that is applied
successfully [93].
Joshi and Naik implemented SMED technique with using the Pareto analysis in a
company operating in the automotive industry. At the end of the implementation, it has
resulted in a 30% of cost savings and 95 seconds reduction of the setup time [90].
Priyanka and Shilpa reduced setup times from 57.98 minutes to 30.1 minute with Kaizen
and SMED implementations [91]. Gavali, Chavan, and Dongre reduced setup time by
18.03% in the press line with a capacity of 1000 tons by implementing 5S, Visual
Management, Kaizen, Standard Operating and SMED methods [92]. Simoes and Tenera
reduced the setup time by 47.5% in their study on improving the exchange of pattern time
at the press line [94]. Ani and Shafei, who used the SMED technique in their studies to
increase production, productivity, increased resource utilization efficiency by 95.6% by
eliminating quality defects [95].
2.1.2.12 KAIZEN
Kaizen, a Japanese word, is derived from the words “Kai” which means change and
“Zen” which means better [96]. Kaizen is the continuous improvement of the standard
operating method by eliminating wastes [97]. The purpose of Kaizen studies is to
eliminate waste in production processes. Kaizen increases quality and work safety and
reduces costs as well [98]. In his book, “Lean Thinking,” Womack expressed the
following words about continuous improvement: “Neither Toyota nor any company
performing Lean Production is perfect. The important thing is to pursue perfection.” [26].
He emphasized that Kaizen always aims for better.

17
Kaizen is a process of making improvements by using small steps, and each small
improvement made up of several levels [24]. Kaizen is implemented with the participation
of everyone from the cleaning team to the top management [99]. Kaizen relies on making
changes wherever improvements can be made [100]. Kaizen applications can usually be
initiated by top management and sometimes can be initiated by the influence of external
factors [69]. No matter how Kaizen applications begin, the main element is to systematize
the production processes and ensure continuous improvement with participation of
everyone [69].
Lean Production System is a system that respects employees’ ideas, employees, and
employees that contribute to the system through Kaizen applications [101]. Kaizen
studies are carried out in line with the company objectives shared with employees [102].
In order to realize Kaizen studies on the reduction of costs, all employees should be cost-
conscious [103]. While reducing costs in Kaizen studies, losses should be identified and
eliminated primarily [104]. At this point, seven basic wastes described by Ohno come
into play [3]. Kaizen is implemented to eliminate or reduce seven basic wastes [26].
Kaizen, which is also aiming to eliminate waste and just-in-time production system
are two Lean Production techniques that are related to each other [105]. Kaizen
philosophy says that continuous improvement should be made not only in production
processes but also in social relations, in family life and business life, ultimately, in every
field [106].
Imai has divided improvement into two parts as Kaizen and innovation. Kaizen is
to provide significant improvement using small steps with minimum cost. Innovation, on
the other hand, is the fundamental change in the current situation as a result of large
investments to the new technology and tools [106]. Womack and Jones have also divided
improvements into two parts as radical change (Kaikaku) and continuous improvement
(Kaizen). Radical change, in other words leaping Kaizen studies are called “Kaikaku”
[26].
In Imai’s book, ‘The Key to Japan's Competitive Success, Kaizen’;
“When quality is mentioned, the first thing that comes to mind is usually the product
quality. However, this is not true. Human quality comes first. A company that can engrave
the quality into its employees is already halfway through its high-quality production
path.”

18
Moreover, after Imai says “engraving quality into people’s memory means helping
them gain Kaizen consciousness,” and, implies that Kaizen and quality is a twin brother,
and on the other hand emphasizes respect for human beings [106].
Imai, who emphasizes that employees should be trained on the use of problem-
solving tools and ensured to solve the problems they have identified by using these tools,
says that
“Once the problem has been solved, the achieved results should be standardized to
prevent further repetition. The person, in this continuous improvement cycle, acquires
Kaizen consciousness and establishes his/her discipline to achieve Kaizen in his/her
work.” and adds;
“The Kaizen strategy is a constant challenge to the current standards. The standards
for Kaizen are only for being changed with better standards.” [106].
According to Imai; there are similar and dissimilar techniques in Kaizen umbrella,
from ‘Customer Orientation’ to ‘Commissioning of New Product’, from ‘Robot Usage’
to ‘Autonomation’, from ‘5S’ to ‘TPM’, from ‘Suggestion System’ to ‘Productivity
Improvement’, from ‘Discipline at Workplace’ to ‘Employee-Management Cooperation’,
from ‘QC circles’ to ‘Small Group Activities’, from ‘JIT’ to ‘Kanban’, form ‘Total
Quality Control’ to ‘Zero Error’ [106]. Kaizen has contributed to the development of
production systems [107]. Kaizen is vital in today's competitive conditions [108]. There
are many studies in literature related to Kaizen.
Wickens explains the contribution of team spirit in Kaizen studies [109
]. Teian states that Kaizen is more than a tool. Because he stated that daily struggles
are overcome with Kaizen, and it can be implemented in every field [110]. Hammer et al.
emphasize that it needs process-driven thinking in Kaizen applications [111]. Deming
reports that managers have adopted kaizen in continuously developing and changing
competitive conditions [112,113].Vineet Kumar, in his study, states that the Kaizen
philosophy should be a way of life in our working life and social life [114].
2.2 Six Sigma
In industry, seeking for differences has come into question with variable customer
needs and changing competition conditions. While one consequence of these seeks is the
Lean Production management system, the other is the Six Sigma management system.

19
The sigma (σ), a letter in the Greek alphabet, represents the standard deviation,
which is the measure of variability in statistics. Sigma value is a unit of measurement in
business and production processes and measures the performance of the processes [115].
Six Sigma is a method used to improve quality and productivity [116]. Six Sigma is a
management philosophy which aims at customer satisfaction by basically eliminating
quality defects. Six Sigma is a unique way to improve business processes through a close
understanding of customer needs, and with data analysis and statistical analysis methods
[117]. Defect is defined as “Anything that does not meet customer expectations.” [118].
Kwak and Anbari define Six Sigma as a management system that is used to increase
efficiency and productivity in order to meet customer expectations [119]. In Six Sigma,
waste determination and improvement work are handled with a statistical point of view
[120]. Six Sigma has many processes and steps; these steps are not the only tool in Six
Sigma. These steps also include many statistical measurements.
In order to analyze the complexities and defects in the processes, the standard of
Six Sigma, which refers to 3.4 errors in 1 million probabilities, has emerged [117, 121].
The criteria to be taken into consideration in the Six Sigma management system in which
provides cost reduction as a result of the reduction of defects are: “Number of Defects
Per Million,” “Net Cost Reduction,” and “Cost of Low Quality” [122].
Lurgio and Hays define the significant elements of Six Sigma, as given below [123].
Trust and support of top management
Focus on customer satisfaction
Rely on numerical data instead of assumptions
Use systematic problem-solving techniques
Provide continuous improvement.
So, how did the story of Six Sigma begin? The story of Six Sigma began with the
introduction of normal distribution curve by Carl Frederick Gauss. Six Sigma was
initially developed as measurement system [124]. In the following period, in 1992, W.
Shewart accepted 3 sigma deviations in the output as a limit in the process variation. He
stated that when the output exceeds the limit, the production process should be intervened
[125].
In the 1980s, Motorola began its Six Sigma studies to capture the high-quality level
which Japan had achieved thanks to the philosophy of Lean Production that attracts
attention all over the world [126]. Mikel Harry, one of the employees at Motorola, began
20
to work on variability and deviations in the process to improve nonproductiveness caused
by quality defects. Mikel Harry, established that the deviations in the processes caused
customer dissatisfaction [116]. In 1986, one of the Motorola engineers, Bill Smith, began
to work on a method to improve production processes and standardize error measurement
for Motorola. Motorola was looking for the answer to this question: “How will we keep
our success in business?” Bill Smith developed a 4-phase MAIC (Measure, Analyze,
Improve, Control) cycle to reduce errors.Many improvement cycles are used in
production processes. The improvement cycle formed by Bill Smith is similar to
Deming’s PDCA cycle [117]. Motorola, commissioned Black and Master Black Belts,
selected their statistical abilities as the baseline, and changed their management skills to
work on projects with complex problems and an unidentified root cause [117].
Following Motorola, AlliedSignal Company implemented the Six Sigma
management system. In 1995, many American organizations were participating this
movement [126]. At the end of 1995, General Electric became one of the companies
which implemented Six Sigma [127]. Under the leadership of Jack Welch, General
Electric CEO, after applying Six Sigma improvement methods, at the journey that started
at the sigma level of 3.4, it reached 5.7 sigma level [137]. If the Sigma level is high, the
production or service process takes place with fewer errors, on the contrary, if the sigma
level is low, the number of errors increases. At the end of Six Sigma applications, GE's
reaching the level of 5.7 Sigma means that it reduces defects [128]. Jack Welch, who
successfully implemented Six Sigma management systems, has identified Six Sigma as
the essential business strategy for his companies [128]. Jack Welch and his colleagues
popularized Six Sigma concept, and even Six Sigma used by the US government in
counter terrorism [129].
Hahn et al. (1999), stated that employees that are applying Six Sigma into their
work are carried out to higher levels professionally. [130]. Pande et al. (2003) presented
a roadmap for implementing Six Sigma with step-by-step guidance and application
guidelines [117]. Calcutt (2001), in his study, emphasized that how large companies such
as Motorola, General Electric improve their performance positively and Six Sigma
applications are part of their corporate culture [131].
By the end of the 20th century, Six Sigma has spread the whole world like wildfire
[125]. Six Sigma offers companies the opportunity to achieve positive outcomes such as
profitability, productivity, and market share growth. Six Sigma is not an ad-hoc fashion
for a period, but it is a flexible management system that cares about customer satisfaction,

21
pays attention to employees' training and aims to improve performance significantly
[117]. After the successful implementation of Six Sigma in the production sector,
Motorola implemented Six Sigma in its support processes and realized significant gains
[132]. Six Sigma can also be successfully implemented in the service sector as well as in
the production sector [133].
Six Sigma may initially seem costly for a company that is going to start
implementing this to its management system. Before the startup phase, a cost-benefit
analysis should be made. Net benefit varies from company to company. The training
costs, which comprise most of the Six Sigma costs, are nearly $ 1300-30000 per person
[123]. The companies that commence Six Sigma studies by sacrificing the high costs have
made significant progress in product quality, product reliability, and customer satisfaction
[122]. Six Sigma has helped the US production industry develop and communicate with
its customers [134]. However, Brue stated that managers are hesitant for Six Sigma
applications, often due to costs, which include consulting costs, training costs, and
improvement costs [120,135]. Along with the companies that implement Six Sigma
applications successfully, many companies that do not implement Six Sigma due to high
investment costs adopt and use measurement activities at 3 sigma levels [123].
In summary, Six Sigma is a philosophy, a business strategy that implies not to work
harder, but to work smarter [125, 127].
2.2.1 Six Sigma Principles
The most important objective of the Six Sigma management system is to minimize
quality errors. In this system, 3 factors, including customer, process, and employee, are
taken into consideration. Six Sigma principles of which focal point is customer, process,
and employee are summarized in 6 titles. These are [117];
Customer orientation: Customer's expectations and needs should be satisfied. Future
state estimation should be done in line with competition conditions.
Data-Driven and fact-driven method: In the Six Sigma management system, the
collection of complex data and statistical analysis should be done.
Focus on process, management, and improvement: In Six Sigma, processes are places
where value is created, and improvements should be done to eliminate defects.

22
Proactive management: Objectives should be identified and monitored in Six Sigma.
Management should be ensured with goals.
Unlimited cooperation: A detailed analysis of end-user customers and business
processes should be made and understood.
Orientation to perfection, tolerance for failure: Companies that implement Six Sigma
management system should adopt the philosophy of continuous improvement and show
tolerance for failure.
2.2.2 Six Sigma Methods
Six Sigma has two methods. These are; [119]
DMAIC
DFSS
The commonly used one is to Define, Measure, Analyze, Improve, and Control
(DMAIC). The methods of Six Sigma are not standard, and there are different approaches
[120]. Systematically, the DFSS method is to design new products and processes at Six
Sigma quality levels [119].
2.2.2.1 DMAIC
In each of the DMAIC steps, process optimization is carried out by applying tools
following the specific objectives. Each Six Sigma project goes through these five phases,
because, after each phase, organizations are one step closer to their Sigma level target
[126,136].
The main steps of the DMAIC methodology are summarized below [137].
Define: Customers' priorities and needs are defined [137]. Basic Steps are;
1. Definition of the problem by numerical data
2. Identification of the customer with problem analysis
3. Identification of the current process visually
4. Determination of specific project topics for the purpose of project scope, usage
of problem-solving techniques such as problem reporting, and brainstorming.
Measure: At this phase, the Six Sigma team analyzes the current performance according
to data. Basic steps are [137]:

23
1. Sources, causes, effects and measurement of variations and identification of its
diversity
2. Identification of the required data types for the process
3. Development of data collection plan
4. Analysis of graphical measurement system
5. Data collection to find the base cause of the problem
Analyze: It is the third phase of DMAIC. It is implemented to determine the main reasons
for errors. Basic steps are [137]:
1. Performing skill analysis to maintain basic competence
2. Performing selection analysis to determine which tools to be used by Six Sigma
teams
3. Application of graphical analysis tools
4. Definition of variation sources using statistical tools
Improve: This phase is for designing, implementing and approving the improvements.
Basic steps are [137]:
1. Production of improvement alternatives
2. Creation of a process map that includes the best improvement opportunities
3. Performing FMEA (Failure Mode and Effects Analysis) to take measures before
failure
4. Performing cost-benefit analysis
5. Performing the pilot scheme
6. Comparison of sigma values before and after the improvement phase
Control: The last phase of DMAIC is the control phase. At this phase, the control method
is determined and the control plan is formed. Basic steps are [137]:
1. Elimination of error probability
2. Performing analysis of long-term measurement system analysis
3. Appropriate and feasible graphs (Statistical Process Control)
4. Performing a detailed plan to control problems and measures
5. Preparation of new and revised standard operating procedures
Table 2.2.2.1.1 shows Six Sigma tools that can be used in basic steps.

24
Project Phase Candidate Six Sigma Tools
Define Project charter
Voice of the customer (VOC) tools (surveys, focus groups, letters,
comment cards)
Process map
Quality Function Deployment (QFD) Supplier Input Process Output Customer Chart (SIPOC)
Benchmarking
Project planning and management tools
Pareto analysis
Measure Measurement systems analysis
Process behavior charts (SPC)
Exploratory data analysis
Descriptive statistics
Data mining
Run charts
Pareto analysis
Analyze Cause and effect diagrams
Tree diagrams
Brainstorming
Process behavior charts (SPC)
Process maps
Design of experiments
Enumerative statistics (hypothesis tests)
Inferential statistics
Simulation
Improve Force field diagrams
Failure Mode and Effects Analysis (FMEA)
7M tools (Affinity Diagrams, Tree Diagrams, Interrelationship
diagraph, Process Decision Program charts (PDPC), Matrix
diagrams, Prioritization matrices, Activity Network diagram
Project planning and management tools
Prototype and pilot studies
Simulations
Control Process behavior charts (SPC)
Failure Mode and Effects Analysis (FMEA)
ISO 900x
Change budgets, bit models, cost estimating models
Reporting system
Table 2.2.2.1.1 Six Sigma tools commonly used in each phase of a project [130].
2.2.2.2 DFSS (Design for Six Sigma)
In the current state, if there are errors in the design of products or processes,
DMAIC methods cannot be successful. However, DFSS may be successful in achieving
improvements that meet the quality expectations in the design of products and processes

25
[138, 139]. If the process is new, DFSS is required. DFSS consists of various approaches
for production, process, and service design. These approaches are:
ICOV (Identify, Characterize, Optimize, and Verify) [128].
CDOV (Concept, Design, Optimize, Verify) [140].
DMADV (Define, Measure, Analyze, Design, Verify) [141].
PIDOV (Plan, Identify, Design, Optimize, and Validate) [141].
The tools in the DFSS methodology are different from the DMAIC methodology.
DFSS includes innovative tools such as creative problem-solving theory, axiom design,
and quality function spread, but the DMAIC does not include these tools [125].
2.2.3 Six Sigma Organizational Structure
In order to implement the Six Sigma management system effectively, studies should
be done convenient for the organizational structure. Six Sigma studies are managed by an
organization including “generations” at various levels. The general organizational
structure is shown in Figure 2.2.3.1. Moreover it is not a standard structure, there are
alternative organizational structures in Six Sigma.
Figure 2.2.3.1 Roles of the leader [125,142]
LEADERSHIP
TEAM
SIX SIGMA
COUNCIL MASTER BLACK
BELT
PROCESS OWNERS –
FUNCTIONAL
MANAGERS
PROJECT
CHAMPION
GREEN BELT
BLACK BELT
and TEAM
SIX SIGMA
CHAMPION
THE TOP
MANAGER
CEO/CFO/COO

26
The roles in the Six Sigma organization can be summarized herein below [143]:
Top management: The person who is the pioneer of change, and has material and moral
support.
Champion: It is the person who is Six Sigma leader, and is communicator and
disseminator.
Project owner: It is the person who leads the Six Sigma teams and is responsible for the
success of the project.
Master black belt: It is the person who produces Six Sigma projects, implements
projects, supports championship and management, and educates green belts.
Black belt: It is the person who takes part in Six Sigma projects and guides the green
belts. Their training lasts for 5 months.
Green belt: It is the person who makes the change and implements the projects. Their
training lasts for 7 weeks.
2.3 Lean Six Sigma
Lean Six Sigma is a management system formed by integrating the” Lean” and “Six
Sigma” methods which are different concepts. It is aiming at reducing waste while
providing standardization in quality [144]. Lean Six Sigma is a management system that
gathers Six Sigma quality defects and reduction of processes variability under a single
roof by reducing non-value-added businesses and ensuring the flow [145, 146, and 147].
George states that two methods are generally considered competitors, but he states that a
merger between Lean and Six Sigma is needed because Lean does not provide statistical
control to a process and Six Sigma does not radically improve the processing speed [145].
Lean Six Sigma aims to continuous improvement at the speed, cost, and quality by
integrating the positive aspects of these two management systems [147].
Lean Six Sigma follows the steps of DMAIC that are the traditional Six Sigma
steps. George et al. argue that the DMAIC method is an effective problem-solving
technique because it contains actions such as;
Defining the structure and scope of the problem,
Identifying the base causes of problems,
Finding solutions that depend on reasons following tangible data,

27
Making solutions as procedures for sustainability when the project is
completed [148].
The reason for the success of Lean Six Sigma is that the processes that have been
improved by Lean Production methods are being made perfect with statistical methods of
Six Sigma. The focus of Lean Production is to improve flow and speed of the process.
The focus of Six Sigma, on the other hand, is quality rather than speed, which makes Lean
Six Sigma as a powerful and successful tool for improvement is the integration of these
two features [148]. Lean Six Sigma is used at Xerox, General Electric, Caterpiller,
Johnson & Johnson, and Dell [149, 150]. Lean Six Sigma's four keys to success are to
ensure customer satisfaction, improve processes, teamwork, and data-driven decisions
[148]. Figure 2.3.1 given below illustrates the basic keys of Lean Six Sigma [148].
Figure 2.3.1 The basic keys of Lean Six Sigma [148]
At European Organization for Quality seminar held in Hungary in 2011, Dr.
Nemeth Balazs summarizes common points and principles of Lean and Six Sigma
management systems that form Lean Six Sigma system as follows [151];
Process Thinking
Customer Oriented
Continuous Improvement and Problem Solving
Fact, Data-Driven Management
Full Participation of Company Management
Teamwork
Lean Six Sigma
Customer Satisfaction Improve Processes
Team
Work Quality Process
Flow Speed
Changes
and
Defects
Data and Facts

28
Training program
The following table summarizes the differences between Lean Production and Six
Sigma [147]:
Lean Six Sigma
Goal Creative flow and eliminate waste Improve process capability
and eliminate variation
Application Primarily manufacturing processes All business processes
Approach
Teaching principles and “cookbook
style” implementation based on best
practice
Teaching a generic problem-
solving approach relying on
statistics
Project
Selection Driven by value stream map Various approaches
Length of
Projects 1 week to 3 months 2 to 6 months
Infrastructure Mostly ad-hoc, no or little formal
training
Dedicate resources, broad-
based training
Training Learning by doing Learning by doing
Table 2.3.1 The differences between Lean Production and Six Sigma [147]
Lean Management and Six Sigma can only cover up each other's deficiencies when
used together. Lean Six Sigma involves considering the similarities and the differences
between two management systems and taking advantages of them effectively [147].
Companies that decide to implement Lean Six Sigma should expand their employee
perfection and provide appropriate training [148]. In Lean Six Sigma applications,
training on brainstorming and decision-making process are given for having team spirit
[148].
The Lean Six Sigma improvement process involves the creation of a value stream
mapping and the creation of Lean Production principles primarily to increase speed, and
the emergence of the Six Sigma method when more complex problems occur [147,148].
The Integration of Lean Production and Six Sigma principles began in the late 1990s and
spread rapidly.
The study of Sheridan (2000), one of the first examples, was carried out at the BAE
Systems Controls, an aircraft engine control company, in India [127,152]. Lean
Production techniques were used in the company with Six Sigma techniques in the
application that began in 1997 [152]. In the BAE systems control, productivity was

29
increased by 112% in five years, and product reliability was increased by 300% with Lean
Six Sigma applications [127, 152].
One of the first Lean Six Sigma applications was made at Maytag Corporation. In
1999, they put Lean Six Sigma into practice, but the study was published in 2003
[127,153]. In the application, a new production line was designed by using Lean Six
Sigma [127,153]. Maytag reduced production costs by 55%. Lean Six Sigma applications
helped Maytag save millions of dollars [153].
Bossert and Walker (2002), in their studies, suggest that the Lean Six Sigma
management system, which is generally implemented in the production sector, can be
applied in non-manufacturing sectors such as software development, call centers,
training, new product development [127, 154].
Sharma (2003), in his improvement works at a battery factory, reduced the
inventory cost from $20 million to $2 million in six months by integrating lean techniques
(such as pull system, Kanban, TPM, SMED, Poka Yoke, standard work documents) with
Six Sigma method, increased the company's annual revenue by 17% and increased
customer satisfaction [127,155]. Carnell, 2006, states that Lean Production and Six Sigma
management systems cannot be used interchangeably and should be used together with
consideration of human factors [156].
In his study, Chand (2011) used Lean Six Sigma to reduce the non-value-added
times in health system. As a result of the studies, it was observed that non-value-added
time was decreased by 64% [157]. Mandahawi et al. (2012) used a lean Six Sigma
management system to evaluate the performance of cutting and printing machines in a
paper production factory. It was observed that 48, 45% increase for cutting machines and
21, 6% increase for printing machines were made in equipment activities. [158]
2.4 Lean Production and Lean Six Sigma Training
The companies that are successful in the journey of change and development
oppose to the resistance which is against the cultural change only with communication,
motivation, teamwork, and training. In Lean Six Sigma, training is a communication tool
that tells people principles and techniques of the management system. [159].
In Lean Production and Lean Six Sigma applications, teamwork is of great
importance [3, 144]. While cultural change is taking place, the concept of “We” is
30
emphasized instead of “I” In teamwork, employees can easily express their ideas in all
phases and manage themselves [160]. Creating team spirit and teamwork is not as easy
as it seems. Many studies should be done on this subject. Employees should be
encouraged to be successful in the Lean Production and Lean Six Sigma management
system by providing perfection to employees. Thus, employees can become solution
producers in Kaizen applications or Six Sigma projects. If employees feel that they are
valued, they do not hesitate to take responsibility for the team [160]. Teamwork aims to
ensure everyone's participation in continuous improvement activities by company goals.
Companies that implement these management systems should have flexible
production systems; it is also important to create flexible human resources, as well [3].
Flexible human resources can be realized by teamwork, training, and increased
perfection. The difference that distinguishes Lean Production from other management
systems is that the human factor takes an important place in improvement efforts. In
Japanese philosophy, human beings come first [17]. In teamwork, team members express
their ideas freely, support each other, make joint decisions and share the decision phase
[161]. Consequently, earnings in Lean Production applications are achieved not by
increased physical efforts, but by increased teamwork [162]. The key to success in
management systems such as Lean Production and Lean Six Sigma is that there should
be employees who are willing to implement these methods, are highly motivated, and
embrace the system [14].
Employees need to motivate themselves and produce new ideas in order to adapt
and support improvement efforts [69]. Morita's statement: “no matter how successful,
intelligent or skillful you are, the future of your business is in the hands of people you
employ.” emphasizes the importance of employees for sustainable success with a
different perspective [163]. Kohei Goshi’s, one of the founders of the Japanese
Productivity Center, statement, “Management requires not only technical but
humanitarian qualities. We should address the people's hearts.” motives the managers to
value the employees [106].
In Lean Production System, the results of the training, namely the realization of
learning, are as important as training. In Lean production, learning is based on receiving
the transferred information, implementing it, and transferring it to other employees [161].
In Lean Production and Lean Six Sigma management systems, the training on all subjects
is provided to all employees [164,165]. In the nature of these management systems, it lies
to train competent and skilled people. To sum up, if there are no competent, qualified,
31
systematic employees, then Lean Production cannot be implemented, and if Lean
Production is not available, competence cannot be provided to the employees [165]. Tom
Peters expresses the contribution of Lean management system to the human approach
with the following words. “In 1962, it was thought that enterprises did not offer warm
and happy environments, the human approach was nonsense, and numbers set the rules.
We owe gratitude to Toyota, Honda, and Sony for their contribution to the destruction of
this perception.” [166].
Driskell states that the type of training, the content of training, and the experience
of training equally affects the outcomes of training. Success depends on the content of
training and the form of training [167]. Engetou proves that, according to the analysis of
surveys conducted in his study, if the programs are designed and executed in order to
define the training needs and fulfill these needs, it takes long time to improve not only
the performance of employees but also the performance of the organization [168].
Training is often used to close the gap between current performance and expected
performance. Gordon defines training as follows: they are the activities in which
employees develop their knowledge, skills, and perfections as a result of learning
behavior. That is, the gap between the current performance and the expected performance
can be filled with the realization of learning [169].
In order to increase sustainability and struggle in competitive conditions, raising
qualified employees has been accepted by all [170]. Therefore, more attention is paid to
blue-collar employees. As a result of the change in working conditions, employees are
now doing work based on the less physical labor force, more information, and teamwork.
As a result of this, in order for innovation to become a culture in humans, the training
needs to be maintained continuously [170].
Thanks to the provision of the right vocational training, product quality is increased,
wastes are eliminated, and most importantly, job satisfaction is ensured because the
employee performs his job willingly [171]. The industry needs a new generation of
knowledgeable workers who are skilled in production dynamics [172].
In many studies on blue-collar training, the priority of training is also carried out
by considering certain factors. These factors appear as race, gender, experience, culture,
and privilege [173,174,175]. However, in all studies, experience, gender, and education
background are common factors. However, in Lean Production studies, training is given
to everyone without making any distinction [3, 69].
32
In the Lean Production and Lean Six Sigma Management system, training is offered
in every field. Many studies have been conducted on these training and their outcomes.
In Lean Production and Lean Six Sigma training, game-based and practice-based training
are also provided besides traditional theoretical training. In Lean Production training, in
order to assist industry and students, they are included in a training factory with technical
simulations or a model factory with a realistic training environment.
A taught technique is sometimes understood better with a classroom activity. For
example, the “Beer Game” developed by System Dynamics Group in MIT helps
explaining system dynamics and the principles of supply chain behavior [176]. Rowlands
(2005), in his study, states that Lean concepts can be explained through games [177].
Ozelkan and Galambosi (2007), in their study, present a new game called
“Lampshade Game,” which is used to teach the concepts of Lean Production to
undergraduate and graduate students. They point out that advantages and disadvantages
of the Lean Production techniques are seen during the implementation phase of this game,
and it is useful for teaching [178].
Friblick et al. (2007) conducted a study investigating the use of lean games and their
effects in Lean Production training. They state that a lean game itself is not a process that
accelerates teaching, it takes time to learn, theory and practice should be related to each
other. They emphasized that Lean Games have an impact on learning; however, if they
are supported by other implementations, such as simulations they increased the level of
learning. [179]. Black (2008) said that the best teaching practice in Lean Production is to
learn and do. He also states that training participants can convert what they see and hear
into action [180]. Therefore, the principles of learning and doing are the most
recommended principles in Lean Production training [181].
Ncube (2009), in his study, discusses the impacts of games and simulations on
learning processes, mainly their functions as an experiential learning methodology. He
states that explaining Lean Production techniques with “the Lemonade Tycoon” game
has a positive impact on learning [182].
Badurdeen et al. (2010) made a critical assessment of the simulations which are
used to teach Lean Production techniques. These studies are classified according to their
importance by reviewing the literature. Four gaps are found in existing simulation
designs: lack of stress on soft skills, a mistaken focus on “linear lean,” misunderstanding
of the key role of the facilitator, and lack of realism [183]. In this study in which they
evaluate the use of simulation and games to teach Lean Production techniques, they

33
emphasize that the use of the game is effective in learning Lean Production concepts
[183].
Elbadawi et al. (2010), in a study for undergraduate students, used a paper plane in
a simulation game. They state that simulation game used for the explanation of Lean
Production concepts increase the knowledge of students significantly [184].
Pourabdollahiana et al. (2012) have studied the method of learning that is called a
“Serious Game” in production areas. The serious game is a game, used in production and
engineering training that aims at learning rather than pure entertainment. In a serious
game, it is stated that the participants make complex decisions apart from real practices.
Furthermore, the efficiency of serious games on cognitive and affective learning
outcomes in the field of production has been studied. A serious game is not a well-defined
term, and in the literature, there are different terms related to this term, such as simulation
games, game-based learning, and educational game [172].
Tisch et al. (2013) conducted multi-level research focusing on design and use of
learning factories. Learning Factories are implementation areas that offer opportunities
for practical research and training. They state that learning with learning factories can be
improved continuously [185].
In a study conducted by Yukselen (2014), an educational game simulating the
assembly line was designed, and its game sections were analyzed with KPIs (Key
Performance Indicators). In this game in which LEGO® parts were used and participants
from different sectors attended, it was determined that the lean techniques applied on the
assembly line improve the line performance by the statistical analysis of the results [186].
Veza et al. (2015), in their study, examine the Lean Learning Factory in FESB
(Faculty of Electrical Engineering, Mechanical Engineering and Naval Architecture in
Split). Veza reported that “The Lean Learning Factory at FESB is based on a didactic
concept that emphasizes experimental and problem-based learning with using tools and
methods” [187]. In this study, it is stated that learning with using Lean Production tools
and methods has an important role in regional development [187].
Briosoa (2015), in his study, states that Lean Production training, which is prepared
by using materials such as paper, post-it, and stickers, which require low investment, is
understandable. The workshop in training emphasizes the usefulness of creating
simulations and discussion environment [188]. Ozelkan et al. (2016), in their study, state
that simulation games used in Lean Six Sigma management system training improve
student learning through active and experimental learning [189].

34
Blochl and Schneider (2016) examine a learning factory, which is operated by
PuLL® Competence Center and performs applications and training in the field of Lean
Production. With the didactic approach of simulation games, a simulation game that is
integrated with Industry 4.0 has been developed for students and companies [190].
In their study, Vin et al. (2017), discuss the Karlstad Lean Factory, which is game-
based and realistically simulates a factory environment. In this factory model, game-
based Lean Production training is provided. They stated that, in this factory, model
industrial workers learn by making mistakes and perform Lean Production techniques
without giving up [191].
In their study, Veza et al. (2017), examined the development of two assembly lines
designed for training and lifelong learning according to the lean learning factory concept.
It is reported that these assembly lines are useful for training of students at the University
of Split [192].
Messaadia et al. (2017), utilized “Muscle Car” serious game in Lean Production
training. Feedbacks that were received after training showed that participants had good
understanding of Lean Production by discussions between the participants and the survey
results. They also refer to the positive effects of the game on the interest and motivation
of the participants [193].
In their study, Leal et al. (2017), developed a game to teach Lean philosophy and
analyze the impacts of the game. Learning outcomes and student motivation are taken
into consideration in the design of the game. They state that all groups show a significant
improvement in the assessment of learning at the end of the training and a satisfactory
degree of motivation is achieved over 85% in the evaluation of motivation [194].
In their research, Aqlan, and Walter (2017) discuss the teaching of Lean Production
principles to high school students and undergraduate levels. For each Lean activity,
qualitative and quantitative data were collected and analyzed to evaluate the results of
simulations, projects, and workshops. As a result of the analysis, they found that the
simulations are effective for the understanding of Lean concepts [195].
In the study performed by Makumbe et al. (2018), Lean Production training given
to the mining industry in the learning factory are examined, and they determine that the
training is effective according to the survey results [196]. In their study, Yang et al.
(2018), investigated the impact of integrating Lean Line Design training with industry
4.0. They indicated that the training assessment score from 20 trainees is 4.5 over 5 and
that a better result is obtained than the other training [197].

35
Morton and Burgess evaluate the outcomes of a class exercise on Lean Production.
They presented that the applied Spot Dot Company simulation game was well-received
by students [198]. Darling et al. argued that learning “by doing” in a game environment
is a successful method. They expressed that when using game-based learning in the
understanding of engineering systems, students' motivation is increased, and knowledge
sharing becomes easier [199].
In their study, Vin et al. (2018), examined the game-based Lean Production
training. They stated that it is important to use the appropriate training environment for
the training purpose. They stated that game-based Lean Production training is appropriate
training for industrial workers [200]. In their study, González et al., analyzed the
outcomes by implementing a simulation game prepared by using Lego. The outcomes
were obtained through surveys conducted before and after training, and it is determined
that the concepts of Lean Production are better understood at the 25% improvement rate.
Analysis results show that simulation helps to learn [201].
In all these studies, Lean Production and Lean Six Sigma management system
trainings were carried out by using the implementation, simulation, serious game, and
game-based learning techniques apart from theoretical training. In order to teach the
principles of Lean Production, a large number of lean games have been developed in the
academic world and the industry. In a few of the studies, the effects of lean games on
learning were analyzed with tangible data. At the same time, the number of studies
comparing lean games with theoretical training is not enough.
2.5 Game-Based Learning
With the game-based learning, we come across with play, game, and gamification
concepts. According to Brown the starting point of play in life begins between mother
and baby, through play, interaction between the mother and the baby improves [202].
Play is an action that has no rules and purpose. Play that we encounter when we are infants
is an activity that exists not only in leisure times but also in every phase of human life.
According to Brown, play is a biological need like sleep and dreams [202].
Brown, one of the authors of the book titled “Play”, says that play is the next step
after evolution and he describes play as a kind of magic [202]. If we don't allocate time
to play, we will face a cheerless life without creativity. The opposite of play is perceived

36
as work; however, according to Brown, the opposite of play is depression [202]. Brown
says that employees who have the concept of play in their lives, and who can reflect this
concept to their lives, may be more successful in their jobs compared to others [202].
Nowadays, play and game-oriented studies have attracted the attention of the
business world, and play has become a required qualification for employees. As an
example, Cal Tech's Jet Propulsion Laboratory (JPL) made changes to their recruitment
policy. JPL is an aeronautical research facility that is fully responsible for imagining,
building, and operating complex projects such as space studies and robotic vehicles which
landed to Mars and examine the surface of the planet [202]. The JPL, which had been
successful for many years, in the late 1990s said that they have a problem. [202]. JPL,
which many employees had been retired, had difficulty in finding qualified employees to
replace retired employees'. Although JPL hired people who had graduated from top
engineering schools such as MIT, Stanford and Cal Tech, they found that newly hired
employees were not good at problem-solving techniques which was a critical factor for
their business [202]. Experienced managers observed that young engineers had difficulty
in transferring a complex project from theory to practice and solving a problem [202].
This problem led JPL to look for a solution. As expected from good engineers, JPL
management analyzed the problem and began to seek for solutions.
JPL added two people to its team during solution seeking process [202]. One of
them is Frank Wilson, who is neurologist, the owner of the book, “The Hand”; the other
is Nate Jones, a mechanical technician who specializes in precision racing and Formula
1 tires. Jones realized that many of the new employees that are working at his machinery
shop could not solve specific problems, and he wondered why. After questioning new and
experienced employees, Jones found out that the employees who have been working with
their fingers to build things as a child and growing up could easily find and solve the
problem. This finding caught the JPL management’s attention [202]. Based on this
finding, JPL managers examined retired engineers and checked how they worked on a
problem. JPL managers found that retired employees had been working with their fingers
and hands to build things in their past. The engineers whom JPL found so ingenious were
the ones who had play in their lives and constructing buildings and stereos by using their
hands when they were young [202]. JPL managers decided that those young engineers
who have been practicing using their hands and have been playing games are skillful in
problem-solving, and these are the kind of employees that administration is looking for
[202]. Young engineers who have not been practicing using their hands and did not have

37
the concept of play in their lives are generally not good at problem-solving, even they
graduated from top tier schools. From this point on, play becomes an important criterion
for the hiring process, JPL starts to ask additional questions to prospective employees
about their experience with the concept of play [202].
With the support of Brown and his team, a course named, “From Play to
Innovation” was created at Stanford Design School. In this course, students are working
on design projects with real-life partners. Throughout this course, students are given the
opportunity to have different experiences with the concept of play [202].
When people learn what game adds to their lives and how, when they can connect
play with their working lives, they get a sense of excitement and adventure. As a result
of that, they become fully connected to the world. Play is what makes life alive [202].
According to Brown, whether we are an adult or a child, if we think of a life without play,
we should know that this would be a life without humor and excitement [202]. As adults,
we begin to lose the concept of play both culturally and in other respects. Adults can only
prevent this loss if they give play a place in their lives [202]. Playing plenty of games in
childhood makes us happy and intelligent adults; keeping it up, no matter how old we are,
can make us smarter, creative, and successful [202].
Thanks to his ongoing research and interviews with 8.000 people about their play
profile, Brown concluded that people who play games in their lives are usually more
successful, social and happy when compared to the people that are lacking play in their
lives [202]. Many studies have been done on the effects of play on the brain, which is
found out that play sends a pre-warning to the brain and helps improving contextual
memory [202].
While a play is an action to pass the time with no purpose and to have fun [202],
the game is the action with the specific purpose whose rule is set up in advance or during
the game playing [203]. Game is a complex system in which the player performs tasks
bound to a series of rules [204].
According to Prensky, a game is the most exciting pastime for humanity in history.
Humanity has used games to have good time and have fun [203]. For example,
hieroglyphs and remains that belong to a game called “Senet” dating back to 5000 years,
played with 2 people were found in Egypt [205].
Jane McGonigal, an academician and game designer, in his well-known TED
speech “Gaming Can Make a Better World,” and in his book “Reality is Broken” suggests
that games can change the world by making us better people [206]. Furthermore, Byron

38
Reeves and J. Leighton Read, in their book “Total Engagement: How Games and Virtual
Worlds Are Changing the Way People Work, and Businesses Compete” added that games
influence not only people but also the business world [207].
Prensky, in his work, defines the characteristics of game as follows [203].
1. Games are fun.
2. Games provide intense and passionate participation.
3. Games have rules.
4. Games have goals. They increase motivation.
5. Games are interactive.
6. Games are adaptable.
7. Games have results and feedback and provide learning.
8. The sense of winning in games gives ego satisfaction.
9. In games, there is conflict / competition / challenge / opposition
10. Games provide adrenaline.
10. In games, there is problem solving which triggers creativity.
11. Games provide a place for teamwork.
12. Games have representation, story and emotional side of it.
Nothing else can provide all of this at once. Some of these features may take place
in books and movies, but none of them has interactivity.
According to Prensky, the basic elements which make game a game are; [203]
1. Rules
2. Target
3. Outputs and feedback
4. Conflict / competition / struggle / opposition
5. Interaction
6. Representation or story.
When we look at the use of games in training, Gee, in his study states that games
increase students’ competence on problem-solving techniques by motivating students
with the way it is designed [208]. Kapp, in his study, argues that games are based on the
philosophy of playing for learning rather than based on the philosophy of learning for
playing [209]. In recent years, the concept of gamification, as well as the game, has
become a widely accepted pedagogical approach [210,211].
The gamification, in non-gaming systems, is the use of video game components to
enhance the user experience or to enable the user to connect to the environment

39
. These components can be listed as; participation points, badges, award, and fame
systems in which leader boards are placed with levels [212]. According to Kapp,
gamification is a technique used for playful thinking, bringing people together, providing
motivation, and solving problems [209].
Although the concept of gamification has been on the agenda for many years as a
concept, it was first voiced by Nick Pelling in 2002 [213]. However, it was mentioned in
the literature for the first time when it was used by Andrzej Marczewski in 2010 [213].
The term gamification is in use since 2008, and its popularity has been increasing with
the impact of conferences and players [214]. Dan Hunter and Kevin Werbach, argue that
putting a surprise toy into the popcorn boxes by a company named Cracker Jack in 1912
was the first example of gamification in their book “For the Win: How Game Thinking
Can Revolutionize Your Business” [215]. According to Oprescu, Jones, and Katsikitis
(2014), studies aimed at understanding the use of gamification in business life are not
enough yet [216].
The main purpose of gamification is to encourage the engagement of persons
further and to help people create more rich experiences in daily life events while having
fun [217]. Gamification aims at increasing engagement of people and supporting certain
behaviors [218].
When we look at the definitions of game and gamification, it becomes clear that
they are different concepts. To explain this difference by an example, it can be thought
that the game is a noun, and gamification is a verb [219]. In addition to confusion between
game and gamification, game-based learning is also confused with gamification in
education. However, there is a significant difference between game-based learning and
gamification [220]. This difference is their effects on learning. Kim, Park, and Baek
(2009) stated that game-based learning enables students to achieve their educational goals
by playing games [221]. Game-based learning is defined as playing games that are
oriented to the learning outcomes or achievements [222]. In game-based learning, games
provide pre-learning or replace learning. However, gamification occurs outside the
context of the game; in other words, it does not replace learning. It focuses on overcoming
a number of challenges when students are learning occasionally with tools such as badges
and awards [220].
Steve Isaacs, an educator, and video designer compare gamification and game-
based learning in his blog post, as in the following table [223]

40
Gamification Game-Based Learning
Items inspired by the game are added to
the lesson
Games which meet the targeted learning
outcomes are used
In order to encourage behavior, game
mechanics are added to a non-game
environment
Learning occurs through game
Typically, Badges, Awards, Achievement
Levels are used
It can be achieved through commercial
or training-oriented games
Experience Points can be used instead of
Traditional Scores
It supports critical thinking and
problem-solving skills
Items inspired by the game are added to
the lesson
Digital or non-digital games can be
used
It can provide students with options for
learning directions and methods
Simulations can be used for students to
experience the subject
Table 2.5.1 Comparison of gamification and game-based learning [223]
When we look at studies on learning which differentiates gamification and game-
based learning, we can see that at the beginning of 1960s NTL’s Bethel and Maine
campus “Practical Behavioral Sciences National Education Laboratory” and “Learning
Pyramid” was formed and used [224]. According to the learning pyramid (Figure 2.5.1),
one of the best ways to learn is practicing by doing [224].
In 1954, Dale presented a similar pyramid in his book, Audiovisual Methods in
teaching [225]. In this study, Dale examined the learning pyramid and found that
memorability of the information increases by 90% when active participation in the form
of “practice-make” happens. Dale stated that effective learning takes place as a result of
rich experiences such as seeing, hearing, tasting, touching, and trying [225].
In their study, Robbins and Jugge described learning as a change in behavior.
Studies on learning pyramid support that changes in behavior happen when the notion of
experience takes place [226].

41
Kolb demonstrates a different perspective on experimental learning and educational
games by suggesting experimental learning theory. He described four different phases of
experimental learning [227,228].
Figure 2.5.1 Learning pyramid [224]
Figure 2.5.2 The experimental learning cycle of Kolb [229,230]
Concrete Experience (Doing/having an experince)
Reflective Observation (Reviewing/reflecting on
the experience)
Abstract Conceptualisation (Concluding/learning from
the experience)
Active Experimentation (Planning/trying out what you
have learned)
42
Keys and Wolfe investigated the use of games in training in their studies. They
indicated that the use of games in training had a positive effect on learning. In addition to
that, games are supporting the experimental learning cycle, which was proposed by Kolb
[229]. Teamwork and feedback are also contributing to the learning process [230]. Studies
show that the use of games in training accelerates the learning process and increases
motivation [231]. Katrinli and Alev stated that the games used in training should be
implemented in a way to support and follow up the theoretical knowledge. When the
game is played after the theoretical knowledge, learners will be able to support their new
experiences with old ones.
Through game-based learning (GBL), students learn by trial and error. In the
experimental learning cycle, this is thought to be an effective method in learning [232].
The characteristics of GBL are given below [233, 234, 235, 236, 237, and 238].
• Motivational.
• It requires active participation.
• It provides the opportunity for interaction.
• Objectives are achieved by giving information through the story.
• Feedback is received.
• It allows a large number of students to learn at the same time.
• Provides students to learn according to their learning speed.
Game-based learning has been used in various fields such as mathematics,
engineering, statistics, biology, and computer science, psychology [233, 234, 235, 236,
237, and 238]. With game-based learning, students or players develop their knowledge
and skills and gain experience in problem-solving techniques [204, 239]. Game-based
learning also influences success, positive attitudes, and subject achievements, student
preferences, participants, and age factors [234, 237, 238, 240, and 241].
Traditional training practices often prevents creativity. Since only one correct
answer is imposed on traditional training, the success rate in traditional training is low
[242]. Teachers and students’ cooperation in GLB environments positively affect
academic achievement [243].
In his study, Adams analyzed the effect of the GBL method. He found out that GBL
effects the memorability of knowledge ten times more than conventional and theoretical
methods [244]. Successful GBL not only offers students a game to play but also increases
the motivation and knowledge acquisition [216]. Qian and Clark also discussed the GBL
in their study. When they analyzed the results of GBL studies, they found out that GBL

43
has a positive impact on behavior and attitude at a rate of 42% and the cognitive gain at
a rate of 38%. In their study, they reported that the most commonly used game type (50%)
is educational game (as an example, serious games, and simulations) [245].
When considered from this point of view, it can be said that lean games aiming at
facilitating the learning of Lean Production techniques, creating practical opportunities,
and educational games related to Lean Production are the main arguments of game-based
learning activities.
In the light of the literature review, we can say that game-based learning can be
used as a method for lean games to facilitate learning of lean production techniques.

44
Chapter 3
Implementation of Lean Production
Training and Design of the Educational
Game
3.1 Training Overview of the Company
The study was carried out at a textile company's production facility in Kayseri. The
company's field of activity is the production of 100% cotton jean apparel fabrics,
especially denim. Production facilities of this textile company, of which corporate office
is located in Istanbul, are located in Kayseri and Bahrain. The total number of employees
is 2000, and the production capacity is 60 million meters per year.
With the change of competition conditions, the production facilities aim to make
productions with fewer resources, increase production volume, and reduce costs. The
customers have expectations of excellent products and perfect production. In order to
meet these expectations, new systems and concepts have emerged each passing day. The
companies that can meet the expectations mostly can survive. In order to meet these
expectations, management systems were evaluated by the company, and in 2015 Lean
Office was established as a result of the acceleration of improvement of works, the
difficulty of execution and management, and the increase of importance of improvement
works in changing competition conditions.
Lean Office is the department that conducts improvement for the company,
coordinates projects for improvement, and manages the Individual Suggestion system,
implement Lean Production techniques and provides training on Lean Production
techniques.
So far 5S, Before/After Kaizen, Kobetsu Kaizen (Focused Improvement), Poka
Yoke (mistake-proofing), One Point Lesson, TPM, SMED, FMEA studies at R&D
Department has been conducted in the company. For improvement brainstorming,

45
fishbone diagram and quality gurus in problem-solving techniques and the PDCA cycle
developed by W. Edwards Deming are actively implemented. In Kaizen studies, PDCA
cycles are being functioned at every phase to ensure that the studies are done have not
retreated, and the improvements are sustainable. “Individual Suggestion System” has
been actively implemented since 2017 in order to increase improvement in the company,
support the employees, and increase employees morale and motivation.
In the company, trainings of Lean Production techniques is provided by Lean
Office. In order to increase the motivation of Lean Production techniques training, which
initially started as theoretical training, and to ensure easy understanding of the techniques,
Lean Office added new interactive training. Lean Office classifies the trainings as
theoretical and interactive training.
Theoretical training is the training in which theoretical information about Lean
Production techniques is given. Training takes place in 1 to 3 hours, and number of
participants is between 5 and 100. In theoretical training, handbooks with PowerPoint
presentations and theoretical information are used as training materials. The theoretical
training aims to use the theoretical knowledge given in the implementation phase.
Interactive training, on the other hand, is the training in which hands-on activities
performed and participants actively participate, in addition to brief theoretical
information that is given on Lean Production techniques. The number of people in this
kind of training is between 5 and 35. The duration of the interactive training applied in
the company is 1 hour on average. This training includes field applications and lean
educational games.
The purpose of this training is to enable participants to learn by doing. 5S, Poka
Yoke, One Point Lesson, and Problem-Solving Techniques has been given using
interactive training technique in the company. As an example, theory of 5S training is
given for an hour before the application of 5S training. After the theory part, a pilot region
is selected in the company for the application of 5S, and the work is carried out to adapt
5S to the selected pilot region in the next hour of 5S training.
In the company, theoretical training is usually given before the applied training and
lean educational games. The Marshmallow Challenge and Ball Game can be given as an
example of the lean educational games that are implemented in the company. The
Marshmallow Challenge is implemented to teach the PDCA (Plan-Do-Check-Act) cycle,
which is actively used in Kaizen applications and is one of the problem-solving
techniques. Ball Game is used for the training of Kaizen which have an essential place by

46
the company and again to apply the PDCA cycle. Ball Game, which is used as a lean
game, is adapted by the Lean Office to be used as part of the Kaizen training.
Before Ball Game, theoretical training is given as in other interactive training.
Theoretical training is given for an hour in 2 weeks prior to Ball Game. In order to
continue the training with the same training group, the company which has employees
working in shifts, the training is given in 2-week intervals. Ball Game is implemented in
4 steps. In other words, the participants have four chances to reach the goal. In steps 1
and 2, each member of the team must touch the tennis ball with all fingers of both hands.
In steps 3 and 4, this rule is modified and replaced with the two-handed touch rule to
allow team members to make Kaizen. After 1st and 2nd steps are played, the new rules are
announced by the moderator. The other steps are played right after the new rule is
announced. Apart from that, the other rules are the same in every 4 steps.
Ball Game materials are;
Tennis balls (one per team)
Stopwatch for moderator
Whiteboard or flipchart for moderator
Timelines for recording the times of teams.
Ball Game general rules;
The team member must throw the tennis ball in the order of the specified process.
(The order of the team members, the process sequence, etc. is determined by the
moderator.)
The single round begins with the throwing of a tennis ball from process 1 to
process 2 and ends up with the arrival of the tennis ball to process 4 (Figure 3.1.1).
Teams cannot change the sequence of the process
A team member cannot throw the tennis ball to a teammate that is standing on
his/her right and left side.
The tennis ball must be in contact with both hands of the team members.
Teams must consist of 3 or 4 persons.
The game must be played standing.
Teams cannot use auxiliary materials such as a table, board, paper, etc.
One product is formed at the end of the 8-round movement according to the
sequence of the process

47
The product is considered of poor quality when team members do not act by the
sequence of the process as an example when the ball falls to the ground, and the ball does
not touch the right hand and the left hand.
The objectives of the Ball Game are;
Minimizing the cycle time in which the tennis ball moves with an 8-round rule
Producing one product with high quality in 1 second at the end of the 8-round
moves
Understanding the Kaizen methodology of Lean Production Techniques
Understanding the PDCA cycle by practicing
Increasing the motivation of participants for Kaizen
Increasing teamwork and team spirit
Respecting a human being and their opinions
After the Ball Game is applied, participants’ feedbacks on teamwork and
improvements on their work were collected. A discussion environment created to collect
the opinions of the team members. Reminders and information about Kaizen and PDCA
concepts are given through examples by the moderator.
Figure 3.1.1 Example of Ball Game cycle
Process 1
(Team Member 1)
Process 2
(Team Member 2)
Process 3
(Team Member 3)
Process 4
(Team Member 4)
Cycle 1 Cycle 2
Goal
8 Cycles

48
3.2 Design of the Educational Game
Training and outcomes of the training were analyzed in the company.
At the end of the Lean Production techniques training given, feedbacks from the
participants is received verbally. At the end of the Lean Production Techniques, the end-
of-training evaluation form that was created by the company used is also filled out by the
participants. Limited information about the training environment, the trainer and the
training are received from the participants. When the company analyzes end-of-training
evaluations, it is hard to make a definite conclusion that the learning outcome is achieved.
The company does not use pre-and-post test. In this respect, the knowledge level of
employees cannot be measured as a result of the Lean Production techniques training.
Besides, there is no tangible data about whether performed interactive training
increased motivation and learning, or lean games are effective in learning. If the pilot area
has become successful for Lean Production techniques as a result of implemented
training, it is accepted that the training is successful. The company also evaluates the
results of interactive training by observing the performance of employees.
As a result of the conducted studies with Lean Office, advantages and disadvantages
have been determined, particularly in Kaizen training performed currently. The
disadvantages of the training performed currently are;
Table 3.2.1 Training comparison
Theoretical Kaizen Training
• Excessive theoretical knowledge
• Insufficient education materials
• Lack of teamwork
• Non-use of improvement forms
• Boring
• Excessive training time for participants
• Lack of practicing
• The excessive number of participants
• Lack of interaction
• Lack of communication
Kaizen Training with Ball Game
• Failure to learn concepts
• Not able to establish a link between theoretical knowledge and practice
• Participants focus on duration
• Insufficient training period
• Confusing the concepts
• Non-use of the PDCA cycle form
• Non-use of Before-After Kaizen form
• Failure to make changes during the game process

49
Results from the brainstorming of the Lean Office were analyzed, and the fishbone
diagram was created. A cause and effect diagram, often called “fishbone” diagram. It
helped to identify possible causes of faults in training and sort ideas into useful categories.
Fish Bone Diagram is given in Figure 3.2.1. Since there is not training that can eliminate
the reasons in the fishbone diagram, it was decided to design training that will eliminate
the causes of the problem. In order to overcome the faults in training, new lean game has
been designed.
The designed lean game was named “Kaizen Word Game”. The purposes of the
game are,
• To ensure participants learn Lean Production concepts
• To increase memorability of Lean Production techniques
• To ensure an understanding of connections between concepts
• To ensure the use of Kaizen and PDCA forms which is not used in other training.
• To increase employees’ motivation
• To increase communication among employees
• To create team spirit
• To ensure participants to learn the Kaizen and PDCA cycle by hands on
experience.
Table 3.2.2 Kaizen Word Game cards
Red Card: Its difficulty
level is 1 with the concepts
related to Lean Production
techniques. Red Cards are
the easiest cards.
Green Card: Its difficulty
level is 2 with the concepts
related to Kaizen and
Problem Solving
Techniques.
Orange Card: Its
difficulty level is 3 with
the concepts related to
Lean Production
Techniques.
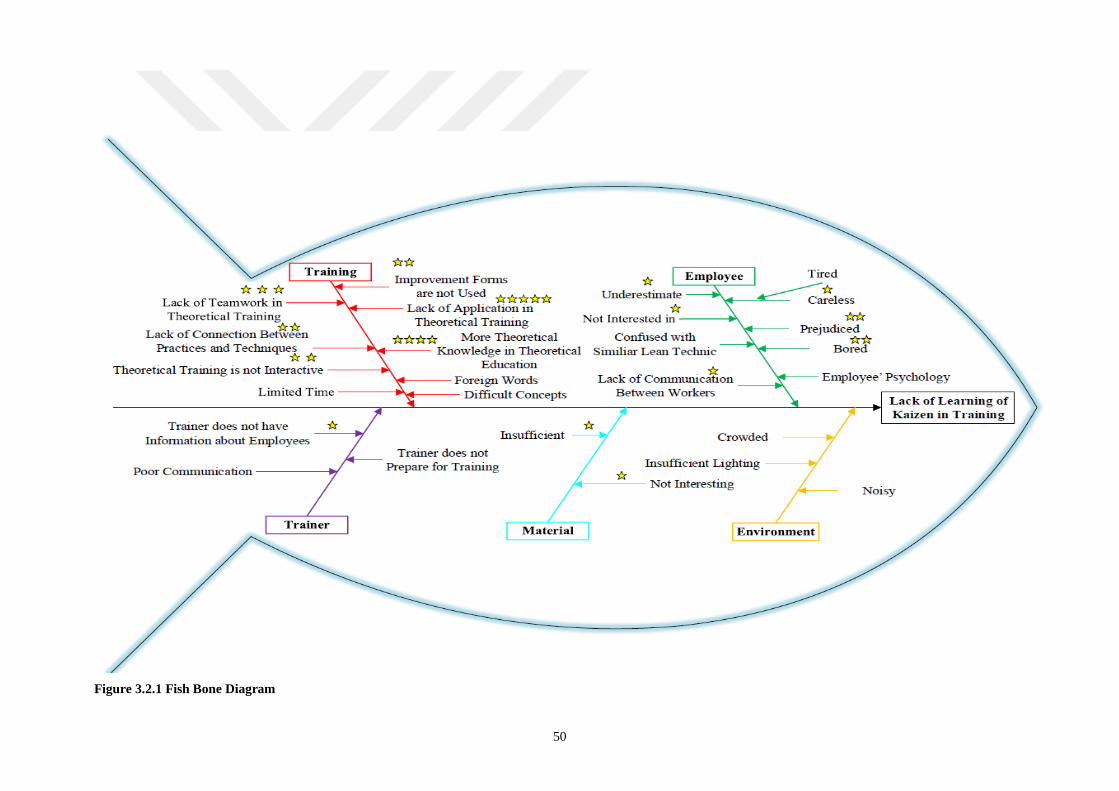
50
Figure 3.2.1 Fish Bone Diagram

51
The word that the participant will explain to his/her teammates is placed at the top
of the card. The participant must explain the word at the top without saying the banned
words in the middle of the card. The definitions of Lean Production Concepts are given
at the lower part of the cards to facilitate participant’s learning the Lean Production
concepts. Three kinds of cards are designed for Kaizen Word Game in Table 3.2.2.
Materials used in the game;
1. Kaizen Word Game cards
2. Whiteboard or flipchart
3. Data collection form (Appendix 1)
4. PDCA cycle form (Appendix 2)
5. Before-After Kaizen form (Appendix 3)
6. Stopwatch
In the Kaizen Word Game, the phase of explaining the cards is linked to the
production phase. Each team member represents a production process. A product is
formed when a team member’s explaining 4 of the cards in compliance with rules, and if
other team members guess them correctly. Customer demand is to explain 12 cards or 3
products. Kaizen Word Game is designed to be implemented in 60 minutes, because the
company devotes 60 minutes to each training on the Lean Production techniques. The
game was originally designed as 4 sections. In section 1, the game is played without
giving Lean Production Techniques. At the end of section 1, a 10-minute training period
with brief theoretical knowledge on Lean Production techniques is carried out. In section
2, section 3 and section 4, on the other hand, participants are expected to perform
improvement works using Lean Production techniques. However, at the pilot schemes,
because required time for the implementation for Section 4 was not sufficient and the
outputs of Section 4 were the same as the Section 3 ones, Section 4 was removed from
the game. In Kaizen Word Game, the goal is defined to participants as explaining the
cards and knowing them in accordance with customer demand. Thus, participants are
given the opportunity to practice the PDCA cycle and Kaizen while learning the concepts
of Lean Production.
The rules of Kaizen Word Game;
The word on Kaizen Word Game card must be explained without saying the
banned (taboo) words.
52
Teams must consist of 3 or 4 persons.
One product is achieved as a result of 4 cards being explained and guessed right.
The goal is to guess 12 cards right, and to achieve 3 products, by the team
members.
The team members must explain the cards according to order of production
process.
The right to say pass is unlimited.
When saying pass, the turn is passed to the other team member.
One team member can explain one card only when it is his/her turn.
Cards are given randomly.
When one orange card is explained, 30 seconds are saved from total time
(because it is difficulty level is 3).
The orange card could not be explained after demand of the customer (12 cards)
is completed.
The team that explains 12 cards in the shortest time wins the game.
The content of Kaizen Word Game;
1. Descriptions of the game
2. Implementation of Section 1
3. Training for informing
4. Discussion of the results and recommendations
5. Implementation of Section 2
6. Having team meetings
7. Implementation of Section 3
8. Discussion of the results, question, and answer
The sections of Kaizen Word Game;
Section 1: Section 1 is implemented without giving information on Lean Production
techniques and Kaizen training. In section 1, the goal is to guess correctly 6 red and 6
green cards. Explanation of orange cards are left to the decision of the team members. In
Section 1, a total of 12 cards, that means 3 quality products must be achieved. All the
team members play the game during the scheduled process by the facilitator. At the end
of Section 1, theoretical information on Lean Production techniques and Kaizen concepts
are given. (Duration: 10 min.)

53
Section 2: Before beginning the game, the session for a meeting is scheduled for the
PDCA cycle and Kaizen applications. At the beginning PDCA cycle forms and pre-post
Kaizen forms that will be used in Kaizen applications are given to the teams. The goal is
to guess correctly 6 Red and 6 Green cards. The customer request is 12 cards that means
3 quality products and is the same as the demand in Section 1. All team members play the
game during the scheduled process by the facilitator. During the game, the facilitator
provides information to reinforce the concepts of Lean Production. In this section, the use
of Lean Production concepts to reduce the completion time is expected. Orange cards are
expected to be used for Kaizen.
Section 3: Before beginning the game, the meeting session is scheduled for the teams the
goal of the teams in Section 3 is to guess correctly 4 Red and 8 Green cards as soon as
possible. In this section, the customer demands 12 cards, but this time the type of the card
is changed. In order to learn the concepts of Kaizen and problem-solving techniques, the
number of green cards is increased. In Section 3, the teams are able to play the game
during the process determined by them. In order to complete it, the team members are
expected to perform new Kaizen and PDCA Cycle as soon as possible.
The facilitator collects the PDCA cycle and the Before-After Kaizen forms at the
end of the training. At the beginning of the game, it is checked whether the actions taken
for PDCA cycle phases are successful with team members. PDCA Cycle example is given
in Figure 3.2.2.
Figure 3.2.2 PDCA cycle example
Plan• In section 2 team meeting, Team A decided to explain the orange cards
and reducing the number of passes.
Do• In section 2, orange cards are tried to be explained until the customer
demand is completed.
Check• In section 3 team meeting, Team A checked completion time. Completion
time did not decrease as expected.
Act
• In section 3, Team A decided to explain some of the orange cards. They also made changes during the process scheduled. At the end of the game the team achieved successful results.

54
At the end of the training the facilitator share her/his comments about the team
members’ performances. The results are discussed with the team members. The team that
finishes it in the shortest time is specified, and their accomplishment celebrated with other
teams.
3.3 Implementation of Lean Production Training
3.3.1 Methodology
The aim of this thesis is to help firms make the right decisions in the selection of
the trainings and analyze the effects of new designed lean game which is actively used in
Lean Production and Lean Six Sigma management system trainings.
The study focused on the following research questions:
1. How do the choice of Lean Production and Lean Six Sigma training affect
learning?
a) How do the standard training in Lean Production and Lean Six Sigma affect
learning?
b) How do lean games in Lean Production and Lean Six Sigma training affect
learning?
c) How does new designed interactive Lean Game in Lean Production and Lean Six
Sigma training affect learning?
2. How do the key performance indicators of new designed interactive Lean Game
change?
In this study, answers for the research questions will be sought. The company where
study is carried out has not been evaluating the outcomes of their trainings. Also,
achievement tests are not carried out for Lean Production trainings. On the other hand,
there are collecting data at the end of the trainings, however, they provide limited results
regarding the training outcomes and learning objectives. To gather information about the
outcomes of the training, participant views collected through evaluation surveys, open
ended questionnaires and achievement tests which are applied at the beginning and at the
end of the trainings were used [246].

55
In the 1960s, Stake conducted studies on evaluation. He emphasized the differences
between regular and irregular evaluation. He has carried out his studies and aimed at the
dissemination of regular evaluation [247]. Irregular evaluation is not based on tangible
data and is conducted with ordinary observations, intuitive and subjective judgments
[247]. In the company where the study is carried out, irregular evaluation is conducted
currently with evaluation forms and observations. Regular evaluation, on the other hand,
is based on structured observations, checklists, questionnaires, evaluation forms, and
standardized achievement tests [247]. When the irregular evaluation is carried out at a
training, it is emphasized that commenting on the impact and effectiveness of the training
may be misleading [248].
In addition to observation, achievement test is prepared to be implemented before
and after the Kaizen training in order to implement a regular evaluation. Theoretical and
interactive training documents used to compile the achievement test. First five questions
of the 10-question achievement test are related to the general structure of Lean Production
Techniques. Other 5 questions of the achievement test are related to the Kaizen technique.
The questions of achievement tests include the concepts that are asked to be given to
participants in Kaizen training. Employees receiving Kaizen Training are expected to
respond correctly to all questions of a 10-question achievement test. The achievement test
has been applied before and after the training. An achievement test (Pre-Test) is given in
Appendix 4.
At the end of the training, training evaluation is added to the achievement test (Post-
Test) to make a regular evaluation. In the training evaluation, the employees are asked to
evaluate their end-of-training achievement within the range of 5 to 1 points. Point 1 means
“Very unsatisfied,” and point 5 means “Very satisfied.” Employees can also evaluate the
training generally in the range of 5 to 1. The control of whether the main outputs of the
training are transferred to the employees can be checked by taking the outcomes of the
end-of-training with the evaluation form. The opinions of the employees about the
training are taken with the part of your opinions and suggestions in training evaluation.
In the Lean Production management system, which is a friend of respect to people,
receiving and implementing the ideas of the employees is an important element for the
improvement works to become a company culture. In order to avoid the contradiction
between the improvement (Kaizen) training given to employees and the concept which is
desired to be given, the ideas of the employees should be valued and improvements should
be made by the ideas of the employees. In the achievement test (Post-Test) performed at
56
the end of the training, employees are expected to respond correctly to all questions of a
10-question achievement test. The evaluation form is given in Appendix 5.
Training groups are formed in the company where the study is carried out. While
forming training groups, employees, who do not receive Kaizen training and similar
training, are preferred. Currently, the company gives Theoretical Kaizen Training before
implementing Ball Game which is interactive Kaizen training. However, it is not able to
measure the effectiveness of this training on learning. The effect of Kaizen training on
learning will be analyzed with the achievement tests and training evaluations. The first
training group and the order of the training given are prepared by taking into consideration
the order of training currently used by the company. Theoretical training, the Ball Game
and the newly designed Kaizen Word Game were given to 35 blue-collar employees in
the 1st training group at 2-week intervals. Achievement tests and training evaluations were
performed at the beginning and end of this training. In this training group, the effects of
Theoretical Kaizen Training on learning and the effects of lean games, performed after
Theoretical Kaizen Training, on learning were analyzed.
Training content and implementation order of 1st training group are;
1. Theoretical Kaizen Training
2. Ball Game
3. Kaizen Word Game.
In order to analyze whether the training orders of the 1st training group, which began
with the theoretical training, affect the learning, 3 trainings were given to 16 blue-collar
employees in a 2nd training group with 2-week interval by creating the reverse cycle. In
this training group, the effects of Kaizen Word Game, which would be applied for the
first time to the employees who had not previously received Kaizen training, on learning
and key performance indicators were analyzed. If the company implements 3 trainings in
Kaizen training, the company can easily decide on whether it will begin with theoretical
training or with lean game after the analysis of the effects of 1st and 2nd training groups
on learning. Thus, the intuitively chosen training and training evaluation will not be
misleading.
Training content and implementation order of 2nd training group are;
1. Kaizen Word Game
2. Ball Game
3. Theoretical Kaizen Training.
57
3rd Training Group was formed considering the possibility of improvement on the
number of training or the duration of training when the company, which conducted the
Lean Production management system that aims to eliminate wastes, knows the effects of
training and implementation order on learning. 34 blue-collar employees, who were from
the 3rd training group and had not previously received Kaizen training, were given only
Theoretical Kaizen Training. Training achievement tests and training evaluations were
conducted. Here, it was aimed to analyze the effects of theoretical Kaizen education on
learning and compare it with the work groups who had received 3 trainings.
Training content of 3rd Training group is;
1. Theoretical Kaizen Training
4th Training group was formed to analyze the effects of Kaizen Word Game on
learning, to analyze game KPIs, and to compare with other training groups. In the 4 th
Training Group, 34 blue-collar employees had not previously received Kaizen training.
Training content of the 4th Training group is;
1. Kaizen Word Game.
3.3.2 The Key Performance Indicators of Kaizen Word Game
Some Key Performance Indicators (KPIs) are needed to see the effect of Kaizen
Word Game, which is designed to overcome the Kaizen training deficiencies which were
determined as a result of training analysis in the company.
In the 1st section, of the game implemented without Lean Production techniques
training. The outputs of the team members’ collaboration indicate the individual
performances of the team members. Section 2 and Section 3, on the other hand, provide
information about the effectiveness of the game.
The outputs of Kaizen Word Game were recorded with data collection form, which
is one of the materials used in the game. There are 3 outputs of the game and KPIs’ to
evaluate performances. Game outputs are cycle time (the time of 4 cards), completion
time (delivery time of 12 cards, 3 products) and the number of quality errors. The number
of quality errors are the total number of passes and errors in Kaizen Word Game. KPIs
are calculated from game outputs which are coefficient of variation of cycle times, rate
of improvement at completion time and number of quality errors.
The outputs of Kaizen Word Game are;

58
Cycle time: Cycle time is described as how often a part or a product is completed by the
process time as timed by facilitator [21,186]. Cycle time indicates the importance of
production rate and standard business efficiency in Lean Production. Therefore, it is one
of the critical output of the Kaizen Word Game.
Completion time: According to Lean Production, what the customer takes the risk to pay
money is ‘value’. For customer satisfaction, the value should reach to the customer as
soon as possible [26, 186]. Therefore, the completion time is a critical performance.
Quality errors: The producer must produce the product requested by the customer at
once [6, 234]. The quality element, which is an important criterion in Lean Production
techniques, is checked and recorded during the game.
KPIs are used not only for performance evaluation but also for measuring the
effectiveness of the game [186]. KPIs of Kaizen Word Game are;
Coefficient of variation of cycle times: The coefficient of variation of cycle times
demonstrates the determination of participants in the understanding of Lean Production
techniques [186].
Net completion time: The net completion times are the completion times of 12 cards.
The completion times of all teams have been taken for 3 sections of the game. The goal
is that each team's completion time is on a decreasing slope.
The number of quality errors: The quality error in the Kaizen Word Game is to misread,
mislead, or pass a card. The number of errors is the sum of the number of Pass and Error.
Kaizen Word Game, designed by Burcu Kurt Özden with a game-based learning
technique, was implemented to 85 blue-collar employees at the specified company as
Kaizen training. For KPI analyze, the data that was collected from the group of 50 blue-
collar employees who had not previously received Kaizen training in group 2 and group
4 were used. Achievement tests and training evaluations of the training were conducted
at the beginning and the end of the Kaizen Word Game Training.

59
Chapter 4
Implementation of Training and
Evaluation of Results
4.1 Implementation of Training
In the content of the study, 119 employees are given Theoretical Kaizen Training,
Ball Game and Kaizen Word Game about Kaizen technique which is one of the Lean
Production Techniques in four different training group. This study was conducted with
118 male employees and 1 female employee. The table of training groups is given in
Table 4.1.1.
Table 4.1.1 Training group
4.1.1 Demographic Structure of the Training
In this chapter, the findings of the demographic structure of the groups and the
results of the analysis for the purposes of the research will be given. Also, analysis of the
employees’ age, level of education, and experience will be given.
In the first group, a total of 35 employees were given three trainings with
Theoretical Kaizen Training, Ball Game, and Kaizen Word Game. In the second group,
total of 16 employees were given three trainings respectively Kaizen World Game, Ball
Game, and Theoretical Kaizen Training. In the third group, a total of 34 employees were
Group 1 Group 2 Group 3 Group 4
Number of People 35 16 34 34
Number of Training 3 3 1 1
Training Theoretical
Kaizen
Training
Kaizen
Word Game
Theoretical
Kaizen
Training
Kaizen Word
Game
Ball Game Ball Game
Kaizen
Word Game
Theoretical
Kaizen
Training

60
given only Theoretical Kaizen Training. In the fourth training, a total of 34 employees
were given only Kaizen World Game.
The ages of employees that were participated in the given training, were grouped
as 20-30, 30-40, and 40-50. The distribution of the age groups of the participants
according to the training groups are given in Table 4.1.1.1. When the ages of the
participant groups were analyzed, it was observed that the general participant profile was
usually in the 30-40 age group.
Age Group G1 G2 G3 G4
20-30 17,1% 12,5% 11,8% 14,7%
30-40 77,1% 62,5% 67,6% 70,6%
40-50 5,7% 25,0% 20,6% 14,7%
Table 4.1.1.1 Age distribution
Employees who have received training, work experienced ones were grouped as 0-
5, 5-10, 10-15, 15-20 and 20-25 years. The distribution of the experience of the
participants are given in Table 4.1.1.2. When the experiences of the participant were
analyzed, it was observed that the employees who received the training usually have 5-
10 years of work experience.
Experience Group G1 G2 G3 G4
0-5 22,9% 62,5% 20,6% 38,2%
5-10 74,3% 25,0% 44,1% 29,4%
10-15 2,9% 6,3% 8,8% 14,7%
15-20 17,6% 8,8%
20-25 6,3% 8,8% 8,8%
Table 4.1.1.2 Experience distribution
The distribution of the education level of the participants according to the groups
are given in Table 4.1.1.3. When the graduation level of the participant was analyzed, it
was observed that the employees who received the training are generally high school
graduates.

61
Graduation G1 G2 G3 G4
Primary School 5,7% 6,3% 2,9% 2,9%
Secondary School 10,5% 43,8% 5,9% 17,6%
High School 75,2% 37,5% 79,4% 67,6%
Associate Degree 8,6% 12,5% 11,8% 11,8%
Table 4.1.1.3 Graduation distribution
4.1.2 The Results of Achievement Test
In this study, the achievement test was implemented in order to analyze the effects
of the training on learning. First five questions of the 10-question achievement test are
prepared in terms of the general structure of Lean Production Techniques. Other 5
questions of the achievement test are from the Kaizen technique. Questions of
achievement tests include the concepts that are given to participants in Kaizen training.
Employees receiving Kaizen Training are expected to answer correctly to all questions of
the achievement test (10 questions). The achievement test has been implemented before
and after the training.
Pre-post achievement tests were analyzed statistically. Each participant's answers
were uploaded to the SPSS program. 2210 data including 221 rows and 10 columns were
analyzed. The example of data set is included in Appendix 6. In this study, descriptive
statistics (percentage and frequency), Paired Samples T-Test, Independent Samples T-
Test, Analysis of Covariance (ANCOVA), Multiple Regression Analysis were used.
The purpose of the paired samples test is to determine whether there is statistically
evidence that the mean difference between paired observations on a particular outcome
is significantly different from zero. The paired sample t-test has four main assumptions:
The dependent variable must be continuous (interval/ratio).
The observations are independent of one another.
The dependent variable should be approximately normally distributed.
The dependent variable should not contain any outliers.
The assumptions were checked and for the paired samples t-test were met. Paired
Samples T-Test was use to analyze that pre-and-post tests’ results. Also, paired samples
t-test was used to determine if there is a significant difference between the means for
trainings implemented in group 1 and group 2. The correct numbers of the training groups
with different individuals were analyzed by Independent Samples T-Test. Normality,

62
homogeneity of variance and random independent samples of assumptions are required
for independent t-test. In addition, independent t- test requires the following additional
assumptions:
Dependent variable that is continuous (i.e., interval or ratio level),
Independent variable that is categorical (i.e., two or more groups),
Cases that have values on both the dependent and independent variables,
Independent samples/groups (i.e., independence of observations).
The assumptions were checked and were met for independent samples t-test
.Independent samples t-test can be used to determine whether there is a statistically
significant difference between the means of two independent samples.
Analysis of covariance (ANCOVA) was used to analyze if there was any significant
difference between groups according to pre-and-post test results. Normality, homogeneity
of variance and random independent samples of assumptions are required for ANCOVA.
In addition, ANCOVA requires the following additional assumptions:
For each independent variable, the relationship between the dependent variable
(y) and the covariate (x) is linear,
The lines expressing these linear relationships are all parallel (homogeneity of
regression slopes),
The covariate is independent of the treatment effects (i.e. the covariant and
independent variables are independent.
All assumptions were checked and were met. In ANCOVA, it is analyzed that
training groups that are independent variables’ effect post-test correct answers that are
dependent variables, it is also analyzed that effects of another dependent variable which
is pre-test correct number (covariate) affects dependent variable.
Multiple regression analysis is done to analyze the relation between post-test correct
number and age, experience and graduation status. Multiple linear regression analysis
makes several key assumptions:
Linear Relationship,
Multivariate Normality,
No Multicollinearity,
Homoscedasticity.
The assumptions were checked and were met. Hypothesis tests are formed in the
analysis.

63
H0: = 0 There is no statistically significant difference between the pre-and-post
test of the Theoretical Kaizen Training implemented in group 1.
H1: ≠ 0 There is statistically significant difference between the pre-and-post test
of the Theoretical Kaizen Training implemented in group 1.
Table 4.1.2.1 includes the paired samples t-test for the correct answers of pre-post
test of the Theoretical Kaizen Training implemented to the training group 1. According
to the results of the t-test, there is no statistically significant difference between the pre
and post-test of the Theoretical Kaizen Training implemented in the 1st group (t: -1,172;
p> 0, 05). The hypothesis H0 is accepted and the hypothesis H1 is rejected.
Group 1 N Mean SD t p
Theoretical Kaizen Training
Pre-test 35 7,23 1,767 -1,172 0,249
Post-test 35 7,57 1,632
Table 4.1.2.1 T-test for pre-and post-test of Theoretical Kaizen Training in group 1
H0: = 0 There is no statistically significant difference between the pre-and-post
test of the Ball Game implemented in group 1.
H1: ≠ 0 There is statistically significant difference between the pre-and-post test
of the Ball Game implemented in group 1.
Table 4.1.2.2 includes the paired samples t-test for the correct answers of pre-and-
post test of the Ball Game which is implemented in the training of group 1 as the second
training. According to the results of the t-test, there is significant difference between the
correct answers of pre-and-post test of the Ball Game (t: -2,347; p <0,05). The hypothesis
H0 is rejected and the hypothesis H1 is accepted.
Group 1 N Mean SD t p
Ball Game
Pre-test 35 7,71 1,840 -2,347 0,025
Post-test 35 8,29 1,226
Table 4.1.2.2 T-Test for pre-and-post test of Ball Game in group 1

64
H0: = 0 There is no statistically significant difference between the pre-and-post
test of the Kaizen Word Game implemented in group 1.
H1: ≠ 0 There is statistically significant difference between the pre-and-post test
of the Kaizen Word Game implemented in group 1.
Table 4.1.2.3 includes the paired samples t-test for the correct answers of pre-and-
post test of Kaizen Word Game in the training group 1 as the last training. According to
the results of the t-test, there is statistically significant difference between the correct
answers of pre-and-post test of Kaizen Word Game (t: -4,552; p<0,05). The hypothesis
H0 is rejected and the hypothesis H1 is accepted.
Group 1 N Mean SD t p
Kaizen Word Game Pre-test 35 8,80 1,256 -4,552 0,000
Post-test 35 9,57 ,884
Table 4.1.2.3 T-Test for pre-and-post test of Kaizen Word Game in group 1
After Kaizen Word Game implemented into the training, it was observed that the
mean of correct answers obtained by the participants increased significantly. When this
increase analyzed, it was found that Kaizen Word Game which was performed as a third
training has the highest increase rate. It is also seen that there is no fading between the
training carried out in connections with each other in the first training group.
With the data of post-test correct answers to the training implemented in the first
training group, the analysis was made among themselves. Theoretical Kaizen, the Ball
Game and Kaizen Word Game were analyzed in pairs.
H0: = 0 There is no statistically significant difference between the number of
correct answers of Theoretical Kaizen Training and Ball Game post-tests.
H1: ≠ 0 There is statistically significant difference between the number of correct
answers of Theoretical Kaizen Training and Ball Game post-tests.
Paired samples t-test conducted between the number of correct answers of
Theoretical Kaizen Training and Ball Game post-tests are shown in Table 4.1.2.4.
According to the results of the t-test, there is a statistically significant difference between
the number of correct answers of Theoretical Kaizen Training and Ball Game post-tests
(t:-1,205; p<0,05).The hypothesis H0 is rejected and the hypothesis H1 is accepted.

65
Table 4.1.2.4 T-test between the data of Theoretical Kaizen Training and Ball Game post-tests
H0: = 0 There is no statistically significant difference between the number of
correct answers of Ball Game and Kaizen Word Game post-tests.
H1: ≠ 0 There is statistically significant difference between the number of correct
answers of Ball Game and Kaizen Word Game post-tests.
In Table 4.1.2.5, t-test carried out between the correct answers of post-tests of Ball
Game and Kaizen Word Game performed in the 1st group were given. According to the
results of the t-test, there is a statistically significant difference between the number of
correct answers of Ball Game and Kaizen Word Game post-tests in the 1st group (t: -
5,767; p <0,05). The hypothesis H0 is rejected and the hypothesis H1 is accepted.
Group 1 N Mean SD t p
Ball Game 35 8,29 1,226 -5,767 0,000
Kaizen Word Game 35 9,57 ,884
Table 4.1.2.5 T-test between the data of Ball Game and Kaizen Word Game post-tests
In the first group, it is seen that the mean of the correct answers of the game-based
learning techniques (lean game, Ball Game and Kaizen Word Game) are higher than the
Theoretical Kaizen Training correct answers. When the paired samples t-test of Ball
Game and the Kaizen Word Game results is analyzed, it is observed that the mean of
correct answers of the end-of-training of Kaizen Word Game is higher and there is a
statistically significant difference between two trainings.
H0: = 0 There is no statistically significant difference between the pre-and-post
test of Kaizen Word Game implemented in group 2.
H1: ≠ 0 There is statistically significant difference between the pre-and-post test
of Kaizen Word Game implemented in group 2.
Group 1 N Mean SD t p
Theoretical Kaizen Training 35 7,57 1,632 -1,205 0,008
Ball Game 35 8,29 1,226

66
The training given in group 1 was given to group 2 in the reverse cycle. In Group
2, Kaizen training was started with Kaizen Word Game. In Table 4.1.2.6, the number of
correct answers of group 2’s Kaizen Word Game pre-and-post tests, and paired samples
t-test are given. According to the results of t-test, there is statistically significant
difference between the correct answers of pre-and-post test of Kaizen Word Game in
group 2 (t: -3,180; p <0,05). After Kaizen Word Game implemented into the training, it
is seen that the mean of correct answers increased significantly. The hypothesis H0 is
rejected and the hypothesis H1 is accepted.
Group 2 N Mean SD t p
Kaizen Word Game Pre-test 16 6,38 2,029 -3,180 0,006
Post-test 16 7,94 1,652
Table 4.1.2.6 T-test for pre-and post-test of Kaizen Word Game in group 2
H0: = 0 There is no statistically significant difference between the pre-and-post
test of Ball Game implemented in group 2.
H1: ≠ 0 There is statistically significant difference between the pre-and post-test
of Ball Game implemented in group 2.
In group 2, Ball Game was given to employees in the second training. T-test of the
analysis of correct answers of this trainings’ pre-and-post-tests presented in Table 4.1.2.7.
According to the results of the t-test, there is statistically significant difference between
the correct answers of group 2 Ball Game pre-and-post test (t: -2,959; p <0,05). After Ball
Game implemented into the training, it is observed that the mean of correct answers
increased significantly. The hypothesis H0 is rejected and the hypothesis H1 is accepted.
Group 2 N Mean SD t p
Ball Game
Pre-test 16 7,63 1,258 -2,959 0,010
Post-test 16 8,89 1,014
Table 4.1.2.7 T-test for pre-and post-test of Ball Game in group 2
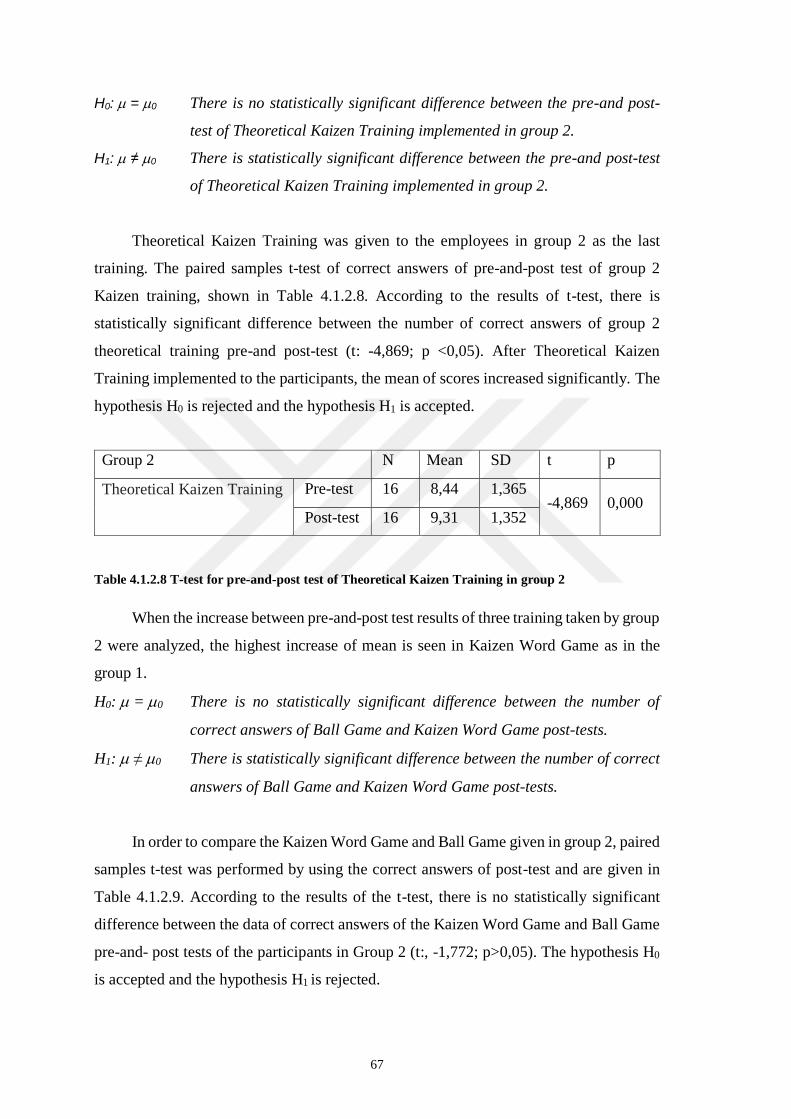
67
H0: = 0 There is no statistically significant difference between the pre-and post-
test of Theoretical Kaizen Training implemented in group 2.
H1: ≠ 0 There is statistically significant difference between the pre-and post-test
of Theoretical Kaizen Training implemented in group 2.
Theoretical Kaizen Training was given to the employees in group 2 as the last
training. The paired samples t-test of correct answers of pre-and-post test of group 2
Kaizen training, shown in Table 4.1.2.8. According to the results of t-test, there is
statistically significant difference between the number of correct answers of group 2
theoretical training pre-and post-test (t: -4,869; p <0,05). After Theoretical Kaizen
Training implemented to the participants, the mean of scores increased significantly. The
hypothesis H0 is rejected and the hypothesis H1 is accepted.
Table 4.1.2.8 T-test for pre-and-post test of Theoretical Kaizen Training in group 2
When the increase between pre-and-post test results of three training taken by group
2 were analyzed, the highest increase of mean is seen in Kaizen Word Game as in the
group 1.
H0: = 0 There is no statistically significant difference between the number of
correct answers of Ball Game and Kaizen Word Game post-tests.
H1: ≠ 0 There is statistically significant difference between the number of correct
answers of Ball Game and Kaizen Word Game post-tests.
In order to compare the Kaizen Word Game and Ball Game given in group 2, paired
samples t-test was performed by using the correct answers of post-test and are given in
Table 4.1.2.9. According to the results of the t-test, there is no statistically significant
difference between the data of correct answers of the Kaizen Word Game and Ball Game
pre-and- post tests of the participants in Group 2 (t:, -1,772; p>0,05). The hypothesis H0
is accepted and the hypothesis H1 is rejected.
Group 2 N Mean SD t p
Theoretical Kaizen Training
Pre-test 16 8,44 1,365 -4,869 0,000
Post-test 16 9,31 1,352

68
Group 2 N Mean SD t p
Kaizen Word Game 16 7,94 1,652 -1,772 0,097
Ball Game Training 16 8,69 1,014
Table 4.1.2.9 T-test between the data of Kaizen Word Game and Ball Game post-tests
H0: = 0 There is no statistically significant difference between the number of
correct answers of Theoretical Kaizen Training and Ball Game post-tests.
H1: ≠ 0 There is statistically significant difference between the number of correct
answers of Theoretical Kaizen Training and Ball Game post-tests.
Paired samples t-test was also performed with the data of correct answers of Ball
Game and Theoretical Kaizen Training post-test in group 2 and is given in table 4.1.2.10.
According to the results of the t-test, there is not any statistically significant difference
between the data of correct answers of Ball Game and Theoretical Kaizen Training post-
tests in group 2 (t: -1,619; p>0,05). The hypothesis H0 is accepted and the hypothesis H1
is rejected.
Group 2 N Mean SD t p
Ball Game Training 16 8,69 1,014 -1,619 0,126
Theoretical Kaizen Training 16 9,31 1,352
Table 4.1.2.10 T-test between the data of Theoretical Kaizen Training and Ball Game post-tests
The improvement rates of the number of correct answers of group 1 and group 2
trainings are shown in Table 4.1.2.11. Kaizen Word Game has the best improvement rate
in Group 1 and 2. Theoretical Kaizen Training, on the other hand, has the lowest
improvement rate.

69
Group 1 Pre-Test
Mean
Post-Test
Mean
Difference Improvement
Rate (%)
Theoretical Kaizen Training 7,23 7,57 0,34 5%
Ball Game 7,71 8,29 0,58 7%
Kaizen Word Game 8,80 9,57 0,77 8%
Group 2
Kaizen Word Game 6,38 7,94 1,56 20%
Ball Game 7,63 8,69 1,06 12%
Theoretical Kaizen Training 8,44 9,31 0,87 9%
Table 4.1.2.11 The improvement rates of group 1 and group 2
H0: = 0 There is no statistically significant difference between the number of
correct answers of group 1 and group 2 post-tests.
H1: ≠ 0 There is statistically significant difference between the number of correct
answers of group 1 and group 2 post-tests.
Table 4.1.2.12 includes the independent samples t-test performed with correct
answers of Group 1 and 2 post-tests. According to the results of the t-test, there is not any
statistically significant difference between the data of correct answers of Group 1 and 2
post-tests and the groups (t: 0,817; p> 0,05). The hypothesis H0 is accepted and the
hypothesis H1 is rejected.
N Mean SD t p
Group 1 35 9,57 0,884 0,817 0,418
Group 2 16 9,31 1,352
Table 4.1.2.12 T-test between the data of post-test of group 1 and group 2
H0: = 0 There is no statistically significant difference between the pre-and-post
test of the Theoretical Kaizen Training implemented in group 3.
H1: ≠ 0 There is statistically significant difference between the pre-and-post test
of the Theoretical Kaizen Training implemented in group 3.

70
The data of the Theoretical Kaizen Training pre-and-post test were analyzed with
paired samples t-test (Table 4.1.2.13). According to the results of the t-test, there is
statistically significant difference between the pre-and-post test scores of theoretical
training given to Group 3 participants (t: -3,112; p <0,05).The hypothesis H0 is rejected
and the hypothesis H1 is accepted.
Group 3 N Mean SD t p
Theoretical Kaizen Training
Pre-test 34 6,15 1,909 -3,112 0,004
Post-test 34 6,68 1,701
Table 4.1.2.13 T-test for pre-and-post test of Theoretical Kaizen Training in group 3
H0: = 0 There is no statistically significant difference between the pre-and-post
test of the Kaizen Word Game implemented in group 4.
H1: ≠ 0 There is statistically significant difference between the pre-and-post test
of the Kaizen Word Game implemented in group 4.
Only the Kaizen Word Game was given to the employees in Group 4. (Table
4.1.2.14) According to the results of the paired samples t-test, there is statistically
significant difference between the correct answers of Group 4 Kaizen Word Game pre-
and-post test (t: -6,758; p <0,05). After Kaizen Word Game implemented to the
participants, it is observed that the mean of scores increased significantly. The hypothesis
H0 is rejected and the hypothesis H1 is accepted.
Group 4 N Mean SD t p
Kaizen Word Game
Pre-test 34 6,71 1,801 -6,758 0,000
Post-test 34 8,91 1,055
Table 4.1.2.14 T-test for pre-and-post test of Kaizen Word Game in group 4
The improvement rates of the number of correct answers in Group 3 and Group 4
training are presented in Table 4.1.2.15. When examining the improvement rates of Group
3 and 4, the Kaizen Word Game seems to have the best improvement rate.

71
Table 4.1.2.15 The Improvement Rates of Group 3 and Group 4
H0: = 0 There is no statistically significant difference between the number of
correct answers of Theoretical Kaizen Training and Kaizen Word Game
post-tests.
H1: ≠ 0 Tthere is statistically significant difference between the number of correct
answers of Theoretical Kaizen Training and Kaizen Word Game post-
tests.
In Table 4.1.2.16, the data of the 3rd Group and 4th Group post-tests, and the data of
independent samples t-test are given. According to the t-test results, statistically
significant difference seen between the data of correct answers of Group 3 and 4 post-
tests and the groups (t: -6,513; p <0,05). There is statistically significant difference
between the post-test of theoretical training implemented to the 3rd Group, and the post-
test of word game training implemented to the 4th Group. The hypothesis H0 is rejected
and the hypothesis H1 is accepted.
N Mean SD t p
Group 3 34 6,68 1,701 -6,513 0,000
Group 4 34 8,91 1,055
Table 4.1.2.16 T-test between the data of post-test of group 3 and 4
When the results of the group 3 and 4 achievement test are analyzed, it is confirmed
that the rate of the correct answers for the questions that include the basic concepts is
higher in Kaizen Word Game training than the Theoretical Kaizen Training. The
questions of achievement tests have also been analyzed. (Table 4.1.2.17) The first 5
questions in the achievement test are related to Lean Production techniques. When the
Group Pre-Test
Mean
Post-Test
Mean
Improvement
Rate (%)
Theoretical Kaizen Training 3 6,15 6,68 8%
Kaizen Word Game 4 6,71 8,91 25%

72
correct answers’ rate of the post-test of the first 5 questions is analyzed, it is seen that the
rate of correct answers that was given by the employees in Group 4 is higher. The last 5
questions of the test questions are about the Kaizen technique.
When Kaizen questions are analyzed, it is seen that the rate of the correct answers
in Kaizen Word Game is higher than the Theoretical Kaizen Training. For example, the
definition of kaizen is asked in question 9 and the rate of correct answers is 91% in Kaizen
Word Game. The rate of correct answer indicates that theoretical or difficult words have
been learned in the Kaizen Word Game. However, in the second question in which 7 basic
wastes are asked, the rate of correct answers to this question in Kaizen Word Game is
better than the theoretical training. But not sufficient because the rate of giving the correct
answers to all questions is expected to be 100%.
Training/Question Q1
(%)
Q2
(%)
Q3
(%)
Q4
(%)
Q5
(%)
Q6
(%)
Q7
(%)
Q8
(%)
Q9
(%)
Q10
(%)
Kaizen Word Game 100 62 91 100 88 97 88 76 91 97
Theoretical Kaizen
Training
100 38 82 85 74 76 74 53 29 56
Table 4.1.2.17 Question-based analysis
Table 4.1.2.18, which consists of improvement rates, is established for comparison
of training groups. When the groups are compared in terms of improvement rates, Group
2 and Group 4 shows high improvement rate, Group 3 to which the Theoretical Kaizen
Training was given has the lowest improvement rate.
Pre-Test Mean Post-Test Mean Improvement Rate (%)
Group 1 7,23 9,57 24%
Group 2 6,38 9,31 32%
Group 3 6,15 6,68 8%
Group 4 6,71 8,91 25%
Table 4.1.2.18 Improvement rates among the group

73
The pre-and-post test correct numbers of the groups were analyzed with analysis of
covariance (ANCOVA). ANCOVA is an extended version of variance analysis and
allows the evaluation of differences between groups while keeping the covariate variable
under control statistically. In this analysis, independent variable is groups, dependent
variable is post-test and covariate variable is pre-test correct number. ANCOVA was used
to analyze whether there was a significant difference between pre-test correct numbers
and corrected post-test correct numbers.
H0: = 0 There is no statistically significant difference between post-tests of groups.
H1: ≠ 0 There is statistically significant difference between post-tests of groups.
ANCOVA assumptions were checked for pre-and-post test. The groups are
independent from each other. The variances of the groups were equal so that the
homogeneity of the variances was achieved (Table 4.1.3.19). In-group regression
coefficients are equal. According to ANCOVA results in Table 4.1.3.20, there is
significant difference between the post-tests corrected according to the pre-tests. (F:
37,748; p<0,05). The hypothesis H0 is rejected and the hypothesis H1 is accepted.
Table 4.1.2.19 Levene's test of equality of error variances
Source
Type III Sum of
Squares df
Mean
Square F Sig.
Partial Eta
Squared
Corrected Model 223,657a 4 55,914 48,275 0,000 0,629
Intercept 317,107 1 317,107 273,781 0,000 0,706
Pre-Test 54,145 1 54,145 46,747 0,000 0,291
Group 131,164 3 43,721 37,748 0,000 0,498
Error 132,041 114 1,158
Total 8996,000 119
Corrected Total 355,697 118
a. R Squared = ,629 (Adjusted R Squared = ,616)
Table 4.1.2.20 The result of the ANCOVA
When the results of the Bonferroni test in Table 4.1.3.21 are analyzed, it is seen that
group 2s’ post-test correct numbers are higher than the other groups. In addition, the
F df1 df2 Sig.
1,427 3 115 0,238
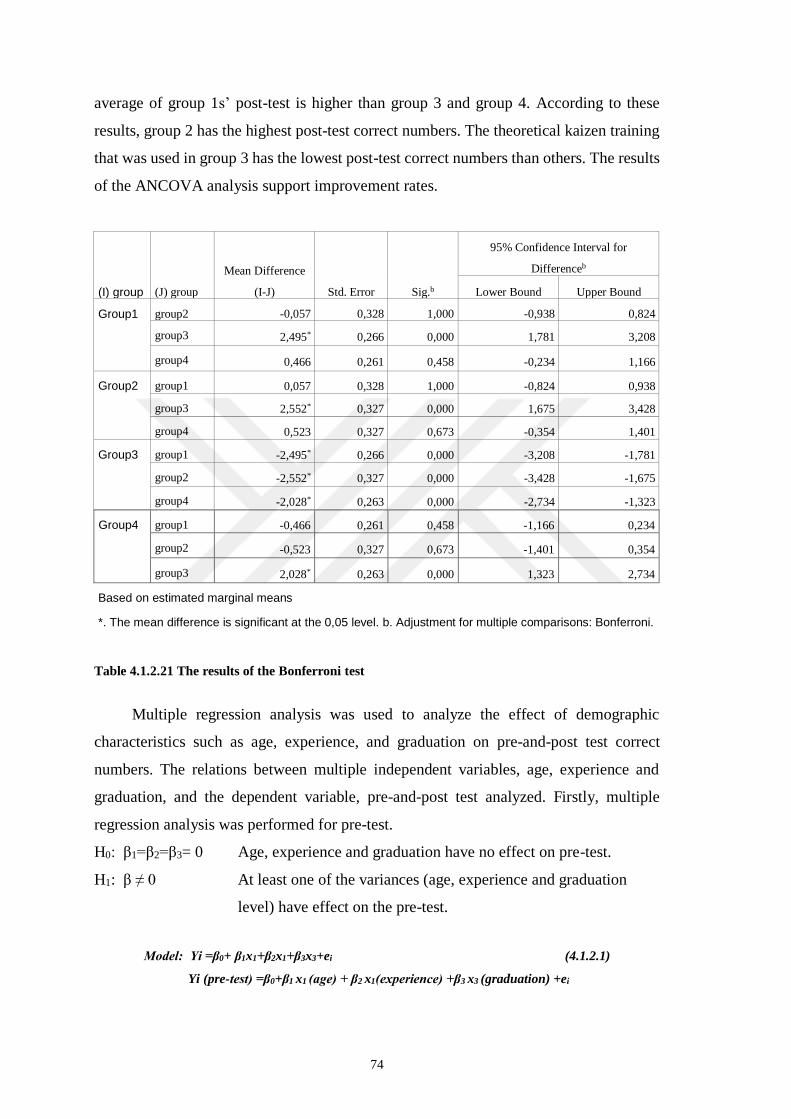
74
average of group 1s’ post-test is higher than group 3 and group 4. According to these
results, group 2 has the highest post-test correct numbers. The theoretical kaizen training
that was used in group 3 has the lowest post-test correct numbers than others. The results
of the ANCOVA analysis support improvement rates.
(I) group (J) group
Mean Difference
(I-J) Std. Error Sig.b
95% Confidence Interval for
Differenceb
Lower Bound Upper Bound
Group1 group2 -0,057 0,328 1,000 -0,938 0,824
group3 2,495* 0,266 0,000 1,781 3,208
group4 0,466 0,261 0,458 -0,234 1,166
Group2 group1 0,057 0,328 1,000 -0,824 0,938
group3 2,552* 0,327 0,000 1,675 3,428
group4 0,523 0,327 0,673 -0,354 1,401
Group3 group1 -2,495* 0,266 0,000 -3,208 -1,781
group2 -2,552* 0,327 0,000 -3,428 -1,675
group4 -2,028* 0,263 0,000 -2,734 -1,323
Group4 group1 -0,466 0,261 0,458 -1,166 0,234
group2 -0,523 0,327 0,673 -1,401 0,354
group3 2,028* 0,263 0,000 1,323 2,734
Based on estimated marginal means
*. The mean difference is significant at the 0,05 level. b. Adjustment for multiple comparisons: Bonferroni.
Table 4.1.2.21 The results of the Bonferroni test
Multiple regression analysis was used to analyze the effect of demographic
characteristics such as age, experience, and graduation on pre-and-post test correct
numbers. The relations between multiple independent variables, age, experience and
graduation, and the dependent variable, pre-and-post test analyzed. Firstly, multiple
regression analysis was performed for pre-test.
H0: β1=β2=β3= 0 Age, experience and graduation have no effect on pre-test.
H1: β ≠ 0 At least one of the variances (age, experience and graduation
level) have effect on the pre-test.
Model: Yi =β0+ β1x1+β2x1+β3x3+ei (4.1.2.1)
Yi (pre-test) =β0+β1 x1 (age) + β2 x1(experience) +β3 x3 (graduation) +ei
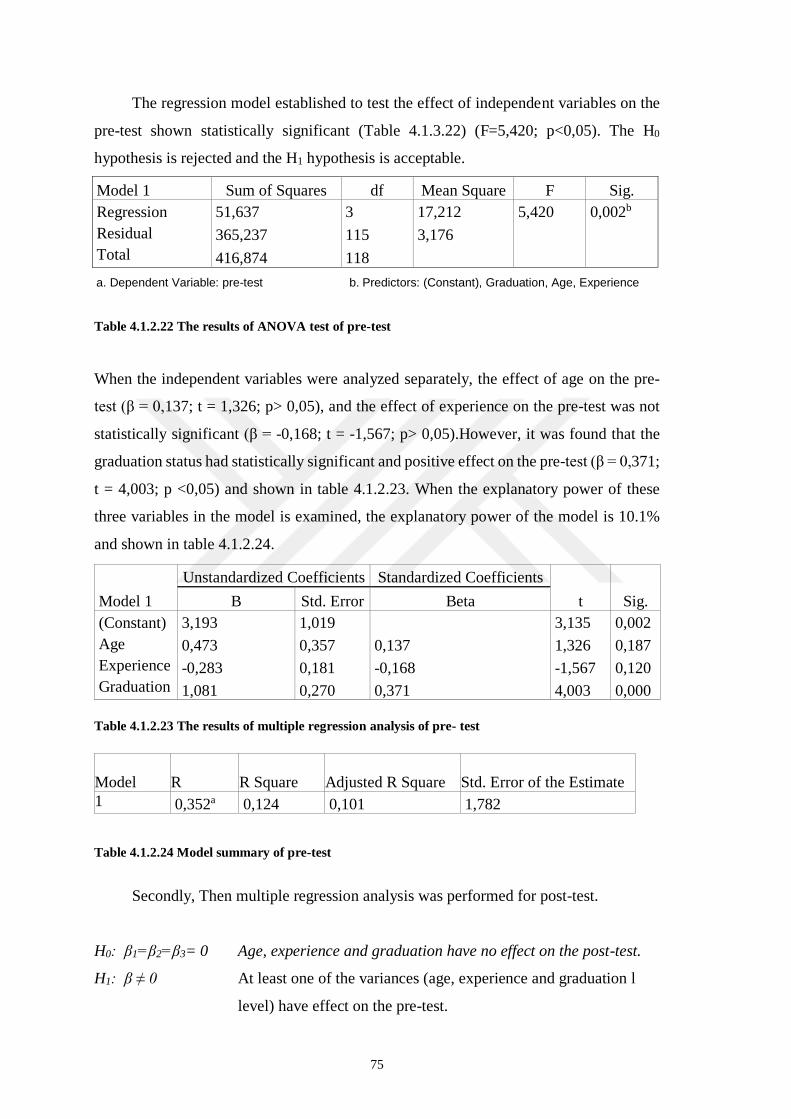
75
The regression model established to test the effect of independent variables on the
pre-test shown statistically significant (Table 4.1.3.22) (F=5,420; p<0,05). The H0
hypothesis is rejected and the H1 hypothesis is acceptable.
Model 1 Sum of Squares df Mean Square F Sig.
Regression
Residual
Total
51,637 3 17,212 5,420 0,002b
365,237 115 3,176
416,874 118
a. Dependent Variable: pre-test b. Predictors: (Constant), Graduation, Age, Experience
Table 4.1.2.22 The results of ANOVA test of pre-test
When the independent variables were analyzed separately, the effect of age on the pre-
test (β = 0,137; t = 1,326; p> 0,05), and the effect of experience on the pre-test was not
statistically significant (β = -0,168; t = -1,567; p> 0,05).However, it was found that the
graduation status had statistically significant and positive effect on the pre-test (β = 0,371;
t = 4,003; p <0,05) and shown in table 4.1.2.23. When the explanatory power of these
three variables in the model is examined, the explanatory power of the model is 10.1%
and shown in table 4.1.2.24.
Table 4.1.2.23 The results of multiple regression analysis of pre- test
Table 4.1.2.24 Model summary of pre-test
Secondly, Then multiple regression analysis was performed for post-test.
H0: β1=β2=β3= 0 Age, experience and graduation have no effect on the post-test.
H1: β ≠ 0 At least one of the variances (age, experience and graduation l
level) have effect on the pre-test.
Model 1
Unstandardized Coefficients Standardized Coefficients
t Sig. B Std. Error Beta
(Constant)
Age
Experience
Graduation
3,193 1,019 3,135 0,002
0,473 0,357 0,137 1,326 0,187
-0,283 0,181 -0,168 -1,567 0,120
1,081 0,270 0,371 4,003 0,000
Model R R Square Adjusted R Square Std. Error of the Estimate
1 0,352a 0,124 0,101 1,782

76
Model: Yi =β0+ β1x1+β2x1+β3x3+ei (4.1.2.2)
Yi (post-test) =β0+β1 x1 (age) + β2 x1(experience) +β3 x3 (graduation) +ei
As a result of multiple regression analysis, it was found that independent variables had a
statistically significant relationship with the posttest and are shown in table 4.1.2.25
(F=3,742; p<0,05). Since the significance value is less than 0.05, the H0 is rejected and it
is concluded that the independent variable (s) allows to estimate the Y variable
remarkably and H1 is accepted.
Model 1 Sum of Squares df Mean Square F Sig.
Regression
Residual
Total
31,634 3 10,545 3,742 0,013b
324,063 115 2,818
355,697 118
a. Dependent Variable: post-test b. Predictors: (Constant), Graduation, Age, Experience
Table 4.1.2.25 The results of ANOVA test of post-test
On the other hand, when the individual significance tests were examined, it was found
that age has no affect on post-test and was not statistically significant (β = 0,013; t =
0,123; p> 0.05), the experience had statistically significant and negative effect on the
post-test (β = -0,315; t = -2,888; p <0,05) and lastly, it was found that graduation status
has no affect on post-test and it was not statistically significant (β = 0,060; t = 0,633;
p>0,05) and shown in table 4.1.2.26. When the explanatory power of these three variables
is examined, the explanatory power of the model is 6.5% and shown in table 4.1.2.27.
Table 4.1.2.26 The results of multiple regression analysis of post- test
Table 4.1.2.27 Model summary of post-test
Model1
Unstandardized Coefficients Standardized Coefficients
t Sig. B Std. Error Beta
(Constant)
Age
Experience
Graduation
9,005 0,959 9,386 0,000
0,041 0,336 0,013 0,123 0,902
-0,492 0,170 -0,315 -2,888 0,005
0,161 0,254 0,060 0,633 0,528
Model R R Square Adjusted R Square Std. Error of the Estimate
1 0,298a 0,089 0,065 1,679

77
4.1.3 The Results of End-of-Training Outcomes
The employees, who received training, evaluate the trainings at the end with Likert
Scale (range of 5, very satisfied to 1, very unsatisfied). There is a training achievement
test in section A and there are end-of-training outcomes in section B of the evaluation
form. An evaluation can be made on the outcomes of training, which are gained by
receiving the end-of-training outcomes. End-of-training outcomes are given in Table
4.1.3.1.
B. End-of-Training Outcomes
The training provided positive contributions to my professional
development. 5 □ 4□ 3□ 2□ 1□
The training provided positive contributions to my personal
development. 5 □ 4□ 3□ 2□ 1□
The training helped me gain new information and skills. 5 □ 4□ 3□ 2□ 1□
The training increased my motivation. 5 □ 4□ 3□ 2□ 1□
The training helped me gain new information and skills that I
can apply in my institution. 5 □ 4□ 3□ 2□ 1□
The training helped me gain professional information and skills
that I can share with my colleagues. 5 □ 4□ 3□ 2□ 1□
The training increased my interest in the subject. 5 □ 4□ 3□ 2□ 1□
Table 4.1.3.1 End-of-training outcomes
In all of the groups, the end-of-training outcomes are received from the participants
after the training. The mean scores of the seven criteria was used to analyze the quality
of the training.
End-of-training outcomes were analyzed statistically and the data has normal
distribution. Paired samples t-test and independent samples t-test were used in statistically
analysis.
H0: = 0 There is no statistically significant difference between the Theoretical
Kaizen Training and Ball Game outcomes in group1.

78
H1: ≠ 0 There is statistically significant difference between the Theoretical Kaizen
Training and Ball Game outcomes in group 1.
The training outcomes of the training carried out in Group 1 were analyzed between
themselves. In Table 4.1.3.2, there is paired samples t-test that is prepared with the data
of the training outcomes of Theoretical Kaizen Training and Ball Game performed in
Group 1. According to the results of the t-test, there is statistically significant difference
between end-of-training outcomes of the Theoretical Kaizen Training and Ball Game (t:
-2,580; p >0,05). The hypothesis H0 is rejected and the hypothesis H1 is accepted.
Group 1 N Mean SD t p
Theoretical Kaizen Training 35 4,58 ,510 -2,580 0,014
Ball Game 35 4,79 ,444
Table 4.1.3.2 T-test for outcomes of Theoretical Kaizen Training and Ball Game of group 1
H0: = 0 There is no statistically significant difference between the Ball Game and
Kaizen Word Game outcomes in group 1.
H1: ≠ 0 There is statistically significant difference between the Ball Game and
Kaizen Word Game outcomes in group 1.
Table 4.1.3.3 includes the t-test for end-of-training outcomes of Ball Game and
Kaizen Word Game in Group 1. According to the results of the t-test, there is no
statistically significant difference between end-of-training outcomes of Ball Game and
Kaizen Word Game (t: 0,211; p >0,05). The hypothesis H0 is accepted and the hypothesis
H1 is rejected.
Group 1 N Mean SD t p
Ball Game 35 4,79 ,444 0,211 0,834
Kaizen Word Game 35 4,78 ,449
Table 4.1.3.3 T-test for outcomes of Ball Game and Kaizen Word Game of group 1

79
When we evaluate the mean of the training outcomes in Group 1, it is seen that the
mean of scores of the training, which include lean games, is higher than the Theoretical
Kaizen Training outcomes.
H0: = 0 There is no statistically significant difference between Kaizen Word Game
and Ball Game outcomes in group 2.
H1: ≠ 0 There is statistically significant difference between Kaizen Word Game
and Ball Game outcomes in group 2.
In Table 4.1.3.4, paired samples t-test for Group 2 training outcomes of the Kaizen
Word Game and Ball Game is given. According to the results of t-test, there was no
statistically significant difference between the end-of-training outcomes of Ball Game
and the Kaizen Word Game in group 2 (t: -0,686; p> 0,05). The hypothesis H0 is accepted
and the hypothesis H1 is rejected
Group 2 N Mean SD t p
Kaizen Word Game 16 4,69 0,393 -0,686 0,503
Ball Game 16 4,57 0,541
Table 4.1.3.4 T-test for outcomes of Kaizen Word Game and Ball Game of group 2
H0: = 0 There is no statistically significant difference between Ball Game and
Theoretical Kaizen Training outcomes in group 2.
H1: ≠ 0 There is statistically significant difference between Ball Game and
Theoretical Kaizen Training outcomes in group 2.
Paired samples t-test for training outcomes of the group 2 Ball Game and
Theoretical Kaizen Trainings are shown in Table 4.1.3.5. According to the results of the
t-test, there is no statistically significant difference between the end-of-training outcomes
of Ball Game and Theoretical Kaizen Trainings (t: 0,727; p>0,05). The hypothesis H0 is
accepted and the hypothesis H1 is rejected.

80
Group 2 N Mean SD t p
Ball Game 16 4,57 0,541 0,727 0,479
Theoretical Kaizen Training 16 4,68 0,366
Table 4.1.3.5 T-test for outcomes of Ball Game and Theoretical Kaizen Training of group 2
H0: = 0 There is no statistically significant difference between end-of-training
outcomes of Group 1 and Group 2.
H1: ≠ 0 There is statistically significant difference between end-of-training
outcomes of Group 1 and Group 2.
In order to compare the training groups, the end-of-training outcomes between-
groups were analyzed. Independent samples t-test for the end-of-training outcomes of
group 1 and group 2 are presented in Table 4.1.3.6. According to the results of the t-test,
there is no statistically significant difference between end-of-training outcomes of Group
1 and Group 2 (t: 0,752; p> 0,05). The hypothesis H0 is accepted and the hypothesis H1
is rejected.
N Mean SD t p
Group 1 35 4,784 0,449 0,752 0,456
Group 2 16 4,688 0,367
Table 4.1.3.6 T-test for the end-of-training outcomes of group 1 and group 2
H0: = 0 There is no statistically significant difference between end-of-training
outcomes of Group 3 and Group 4.
H1: ≠ 0 There is statistically significant difference between end-of-training
outcomes of Group 3 and Group 4.
Table 4.1.3.7 shows the independent samples t-test for the end-of-training outcomes
of Group 3 and 4. According to the results of the t-test, there is statistically significant
difference between the end-of-training outcomes of Group 3 and 4 (t: -2,832; p <0,05).
At the same time, it can be said that the training outcomes of Kaizen Word Game in Group
4 are remarkably higher than the Theoretical Kaizen Training outcomes in Group 3. The
hypothesis H0 is rejected and the hypothesis H1 is accepted.

81
N Mean SD t p
Group 3 34 4,42 0,546 -2,832 0,006
Group 4 34 4,77 0,452
Table 4.1.3.7 T-test for the end-of-training outcomes of group 3 and group 4
According to the results of the t-test, there is no significant difference between the
end-of-training outcomes of Group 1 and Group 2, but there is significant difference
between the end-of-training outcomes of Group 3 and Group 4. The end-of-training
outcomes were evaluated by the participants in seven criteria. Detailed analysis of the
criteria was carried out for Group 3 and Group 4. Since the training outcomes in each of
the dependent training given in Group 1 and Group 2 were affected by each other, the
analysis of criterion-based end-of-training outcomes was performed for Group 3 and
Group 4. The mean of scores that were given according to the criteria of end-of-training
outcomes by participants in Group 3 and Group 4 was calculated. The mean of the criteria
for end-of-training outcomes of Group 3 and Group 4 are given in Table 4.3.1.8. When
comparing it by Group 3 and Group 4 end-of-training outcomes criteria, Kaizen Word
Game in Group 4 is better in terms of end-of-training outcomes.
End-of-Training Outcomes Group 3 Group 4
1. The training provided positive contributions to my
professional development.
4,50 4,79
2. The training provided positive contributions to my personal
development.
4,38 4,76
3. The training helped me gain new information and skills. 4,35 4,76
4. The training increased my motivation. 4,41 4,82
5. The training helped me gain new information and skills that
I can apply in my institution.
4,06 4,74
6. The training helped me gain new professional information
and skills that I can share with my colleagues.
4,18 4,68
7. The training increased my interest in the subject. 4,50 4,85
Table 4.3.1.8 The mean of the criteria for end-of-training outcomes of group 3 and group 4
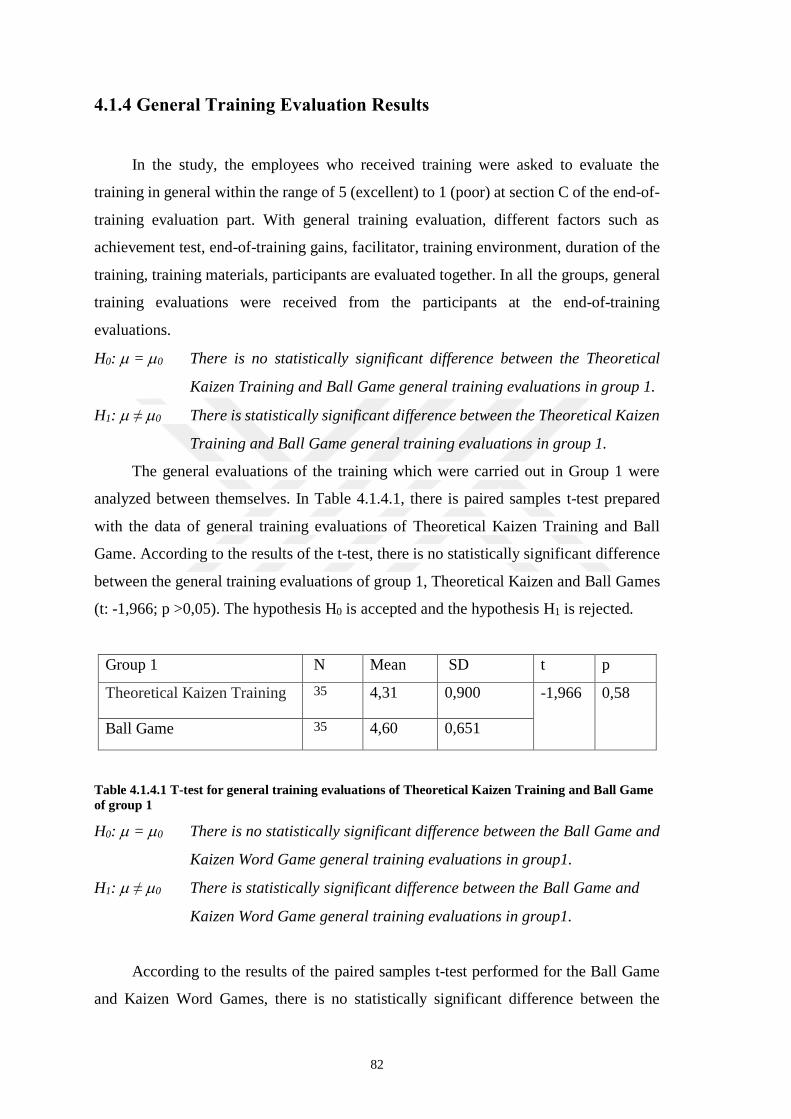
82
4.1.4 General Training Evaluation Results
In the study, the employees who received training were asked to evaluate the
training in general within the range of 5 (excellent) to 1 (poor) at section C of the end-of-
training evaluation part. With general training evaluation, different factors such as
achievement test, end-of-training gains, facilitator, training environment, duration of the
training, training materials, participants are evaluated together. In all the groups, general
training evaluations were received from the participants at the end-of-training
evaluations.
H0: = 0 There is no statistically significant difference between the Theoretical
Kaizen Training and Ball Game general training evaluations in group 1.
H1: ≠ 0 There is statistically significant difference between the Theoretical Kaizen
Training and Ball Game general training evaluations in group 1.
The general evaluations of the training which were carried out in Group 1 were
analyzed between themselves. In Table 4.1.4.1, there is paired samples t-test prepared
with the data of general training evaluations of Theoretical Kaizen Training and Ball
Game. According to the results of the t-test, there is no statistically significant difference
between the general training evaluations of group 1, Theoretical Kaizen and Ball Games
(t: -1,966; p >0,05). The hypothesis H0 is accepted and the hypothesis H1 is rejected.
Group 1 N Mean SD t p
Theoretical Kaizen Training 35 4,31 0,900 -1,966 0,58
Ball Game 35 4,60 0,651
Table 4.1.4.1 T-test for general training evaluations of Theoretical Kaizen Training and Ball Game
of group 1
H0: = 0 There is no statistically significant difference between the Ball Game and
Kaizen Word Game general training evaluations in group1.
H1: ≠ 0 There is statistically significant difference between the Ball Game and
Kaizen Word Game general training evaluations in group1.
According to the results of the paired samples t-test performed for the Ball Game
and Kaizen Word Games, there is no statistically significant difference between the

83
general evaluations of Ball Game and Kaizen Word Game of Group 1 (t: 1,152; p >0,05).
The hypothesis H0 is accepted and the hypothesis H1 is rejected.
Group 1 N Mean SD t p
Ball Game 35 4,60 0,651 1,152 0,257
Kaizen Word Game 35 4,74 0,505
Table 4.1.4.2 T-test for general evaluations of Ball Game and Kaizen Word Game of group 1
H0: = 0 There is no statistically significant difference between the Ball Game and
Kaizen Word Game general training evaluations in group 2.
H1: ≠ 0 There is statistically significant difference between the Ball Game and
Kaizen Word Game general training evaluations in group 2.
Paired samples t-test for the general training evaluations of the Kaizen Word Game
and Ball Game in Group 2 are given in Table 4.1.4.3. According to the results of the t-
test, there is no statistically significant difference between general evaluations of Ball
Game and Kaizen Word Game (t: 1,775; p> 0,05). The hypothesis H0 is accepted and the
hypothesis H1 is rejected.
Group 2 N Mean SD t p
Kaizen Word Game 16 4,69 0,505 1,775 0,096
Ball Game 16 4,38 0,619
Table 4.1.4.3 T-test for general evaluations of Ball Game and Kaizen Word Game of group 2
H0: = 0 There is no statistically significant difference between the Ball Game and
Theoretical Kaizen Training general training evaluations in group 2.
H1: ≠ 0 There is statistically significant difference between the Ball Game and
Kaizen Word Game general training evaluations in group 2.
Paired samples t-test for the general training evaluations of Ball Game and
Theoretical Kaizen Training performed in Group 2 are presented in Table 4.1.4.4.
According to the results of the t-test, there is no statistically significant difference between
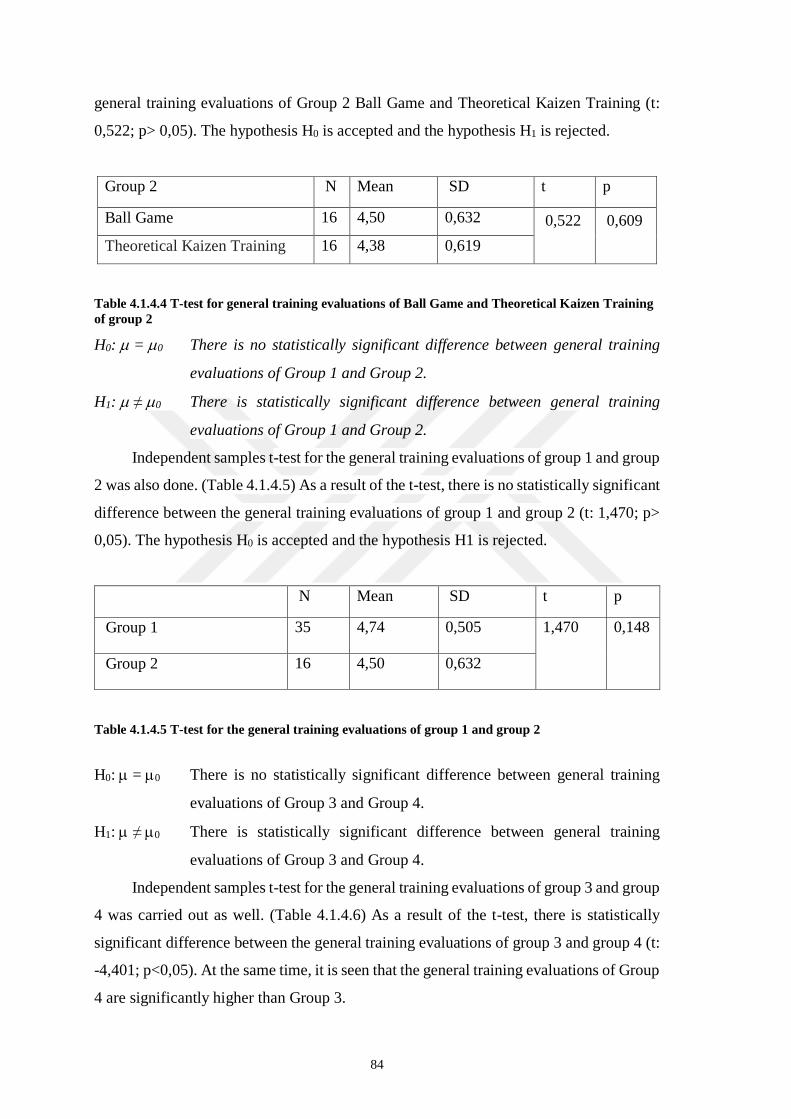
84
general training evaluations of Group 2 Ball Game and Theoretical Kaizen Training (t:
0,522; p> 0,05). The hypothesis H0 is accepted and the hypothesis H1 is rejected.
Group 2 N Mean SD t p
Ball Game 16 4,50 0,632 0,522 0,609
Theoretical Kaizen Training 16 4,38 0,619
Table 4.1.4.4 T-test for general training evaluations of Ball Game and Theoretical Kaizen Training
of group 2
H0: = 0 There is no statistically significant difference between general training
evaluations of Group 1 and Group 2.
H1: ≠ 0 There is statistically significant difference between general training
evaluations of Group 1 and Group 2.
Independent samples t-test for the general training evaluations of group 1 and group
2 was also done. (Table 4.1.4.5) As a result of the t-test, there is no statistically significant
difference between the general training evaluations of group 1 and group 2 (t: 1,470; p>
0,05). The hypothesis H0 is accepted and the hypothesis H1 is rejected.
N Mean SD t p
Group 1 35 4,74 0,505 1,470 0,148
Group 2 16 4,50 0,632
Table 4.1.4.5 T-test for the general training evaluations of group 1 and group 2
H0: = 0 There is no statistically significant difference between general training
evaluations of Group 3 and Group 4.
H1: ≠ 0 There is statistically significant difference between general training
evaluations of Group 3 and Group 4.
Independent samples t-test for the general training evaluations of group 3 and group
4 was carried out as well. (Table 4.1.4.6) As a result of the t-test, there is statistically
significant difference between the general training evaluations of group 3 and group 4 (t:
-4,401; p<0,05). At the same time, it is seen that the general training evaluations of Group
4 are significantly higher than Group 3.

85
N Mean SD t p
Group 3 34 3,94 0,814 -4,401 0,000
Group 4 34 4,68 0,535
Table 4.1.4.6 T-test for the general training evaluations of group 3 and group 4
4.1.5 Analysis of Training Outputs
At section D of the end-of-training evaluation part, the question of “Can you
describe the output of the training in one word?” was asked to the employees who
received training. These words written by the employees at the end of the training are the
data that can be used to analyze whether the training has reached its purpose or what the
employees have understood from the training. Employees wrote one or more words as
output. The words written by the employees were analyzed and grouped. The words
written by the employees who received training were grouped under the titles,
“Educational and Instructional, Fun and Educational, Kaizen, Respect for Human,
Teamwork”. While creating groups, words that were similar or related to the titles are
brought together under the same title. For example; Words such as “Improvement, Waste,
Kaizen, Sustainability, Development, and Productivity” were listed under the title of
Kaizen. Examples of the words in the training output groups are given in Table 4.1.5.1.
Group of Training Outputs
Kaizen Teamwork Fun and
Educational
Educational and
Instructional
Respect For
Human
Improvement Compatible Fun and
Instructional
Useful Human
Waste Team Idea Very good Educational Respect
Sustainability Teamwork Excellent Descriptive Value
Development Team spirit Fun and
Educational
Contributive Respect For
Human
Productivity To be “We” Excellent
game
Instructional Idea
Table 4.1.5.1 The words in training output groups

86
In the end-of-training evaluation, the field of training output is not required to be
filled out. Therefore, not all employees wrote training output, and some employees left
section D of the training evaluation blank. For example, while 17 employees wrote
training output in Theoretical Kaizen Training given to 34 employees in group 3, 22
employees wrote training output in Kaizen Word Game given to 34 employees in group
4. In this respect, the output groups of the employees who gave a reflection were analyzed
in percentages.
In Figure 4.1.5.1, the outputs of the training carried out in Group 1 are given in
percentages. When Group 1 reflection were analyzed, 45% of the employees in
Theoretical Kaizen Training find the training as Education and Instructional. On the other
hand, in Ball Game and Kaizen Word Game, which are game-based learning techniques
employees reflect the training as Fun and Educational. At the same time, in Group 1, it is
seen that the Kaizen Word Game Training reflection word is Teamwork at a rate of 22%.
Figure 4.1.5.1 Group 1 training output graph
In Figure 4.1.5.2, the outputs of the training carried out in group 2 are given in
percentages. Fun and Educational, Kaizen and Team Work training output come into
prominence in Kaizen Word Game of group 2. In Ball Game, Educational and
Instructional and Kaizen outputs are seen to have a higher rate than others. When we
analyze the Theoretical Kaizen Training, on the other hand, we see that Kaizen and
Respect for Human output come into prominence. In the content of Theoretical Kaizen,
the Lean Production management system is explained in general, and respect for Human
is emphasized. Therefore, Respect for Human is the expected output in Theoretical
Kaizen Training.
Educationaland
Instructional
Fun andEducational
KaizenRespect for
HumanTeamwork
Teorical Training 45% 5% 36% 9% 5%
Ball Game 24% 45% 7% 17% 7%
Kaizen World Game 26% 39% 13% 0% 22%
45%
5%
36%
9%5%
24%
45%
7%
17%
7%
26%
39%
13%
0%
22%
0%5%
10%15%20%25%30%35%40%45%50%
Group 1 Training Output

87
Figure 4.1.5.2 Group 2 training output graph
In Figure 4.1.5.3, group 3, and group 4 training output s are presented. In the
evaluation performed at the end of the Theoretical Kaizen Training given in Group 3, it
is seen that 47% of the employees who wrote the training output gave the answer as
Kaizen and 29% gave the answer as Respect for Human. In Kaizen Word Game given in
Group 4, it is seen that the Fun and Educational training output group has a higher rate
than other groups. In this respect, it can be said that Kaizen Word Game is found to be
fun and educational by employees.
Figure 4.1.5.3 Group 3-group 4 training output graph
When the training outputs are analyzed in general, the words of Kaizen and Respect
for Human were given as an output for the theoretical training; the words of fun,
educational and instructive were given as an output for the Ball Game. The training
outputs of Kaizen Word Game, on the other hand, are fun, educational, and teamwork.
Educationaland
Instructional
Fun andEducational
KaizenRespect for
HumanTeamwork
Kaizen World Game 8% 33% 33% 0% 25%
Ball Game 36% 9% 27% 9% 18%
Teorical Training 23% 8% 31% 31% 8%
8%
33% 33%
0%
25%
36%
9%
27%
9%18%
23%
8%
31% 31%
8%
0%5%
10%15%20%25%30%35%40%
Group 2 Training Output
Educational andInstructional
Fun andEducational
KaizenRespect for
HumanTeamwork
G3 24% 0% 47% 29% 0%
G4 5% 59% 18% 0% 18%
24%
0%
47%
29%
0%5%
59%
18%
0%
18%
0%10%20%30%40%50%60%70%
Group 3-4 Training Output

88
4.2 Effect of Lean Production Training on KPI in
Kaizen Word Game
“Kaizen Word Game”, which was designed within the scope of the study, was
implemented to 50 blue-collar employees in 13 teams. There are 3 employees in 2 teams
and 4 employees in 11 teams. The KPI (Key Performance Indicator) data were obtained
from employees who were in the training groups and had not previously received kaizen
training. Accordingly, KPI (key performance Indicator) data were collected during the
training from the employees who took Kaizen Word Game in training group 2 and
training group 4 by using data gathering forms. 1216 data were analyzed. The example
of data set is included in Appendix 7.
KPI analysis is performed to see the effect of Lean Production techniques and to
measure the performance of the game. There are 3 game outputs and KPI. Game outputs
are cycle time (guessing the time of 4 cards), completion time (delivery time of 12 cards,
namely, 3 products) and the number of quality errors. KPIs calculated from Kaizen Word
Game outputs are net completion time, the coefficient of variation of cycle times, and the
number of quality errors.
In section 1 of the Kaizen Word Game designed within the scope of the study,
employees implemented Kaizen Word Game by their competencies. At the end of the 1st
section, training for brief information about Lean Production techniques and kaizen was
given. Kaizen Word Game's 2nd and 3rd sections were implemented after training for brief
information about Lean Production techniques and Kaizen. The section 1 and 2 of Kaizen
Word Game compared in KPI analysis. The completion time of teams in each section is
shown in Figure 4.2.1. As seen in Figure 4.2.1, time to complete the products for teams
were shortened in the sections after taking Lean Production techniques. Low completion
time does not always mean that the process is well [186]. Therefore, other factors
affecting training performance will be analyzed.

89
Figure 4.2.1 Completion time graph
The goal in Kaizen Word Game is to guess the right 12 cards as soon as possible.
To improve completion time, teams explained orange cards that are level 3 difficulty
level. When one of the orange Cards is guessed correctly, the team gains 30 seconds. The
advantage time of orange card is reflected in the Kaizen Word Game outputs of the teams
who explain the orange card. Figure 4.2.2 shows the completion time, which was
shortened by 30 seconds because of the orange cards. In case of the orange cards are
guessed correctly, their completion time is further shortened. In Figure 4.2.3, the number
of known orange cards is given. After Lean Production techniques, the improvements in
section 2 and section 3 and the usage of orange cards are increased.
Figure 4.2.2 Net completion time graph
31
8
23
0 24
8
45
7
26
2
22
5
33
2
15
6
21
0
38
9
29
3
41
6
35
2
17
7 19
5
27
0
27
4
21
6
18
1
12
0 15
7
20
8
14
2
14
7
27
1
25
9
19
8
12
1
10
0
17
2
16
7
14
8
92 1
17
18
0 20
2
12
1
18
2
19
5
T 1 T 2 T 3 T 4 T 5 T 6 T 7 T 8 T 9 T 1 0 T 1 1 T 1 2 T 1 3
Completion Time (Sec.)
Section 1 Section 2 Section 3
28
8
23
0
24
8
45
7
26
2
22
5
30
2
15
6 18
0
38
9
26
3
38
6
29
2
14
7 19
5
90
24
4
18
6
12
1
12
0
97
88
14
2
27 31
16
9
13
8
12
1
40
82
47
28
-28 -4
12
0
-8
61
-28
19
5
T 1 T 2 T 3 T 4 T 5 T 6 T 7 T 8 T 9 T 1 0 T 1 1 T 1 2 T 1 3
Net Completion Time (Sec.)
Section 1 Section 2 Section 3
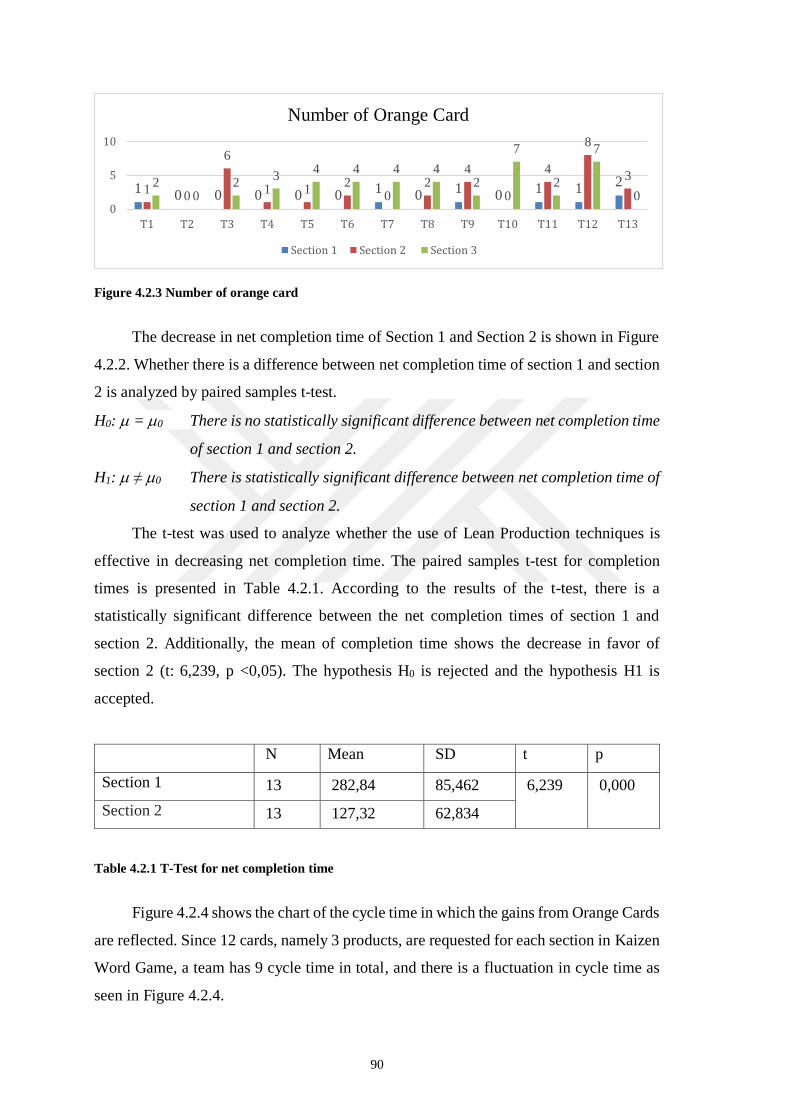
90
Figure 4.2.3 Number of orange card
The decrease in net completion time of Section 1 and Section 2 is shown in Figure
4.2.2. Whether there is a difference between net completion time of section 1 and section
2 is analyzed by paired samples t-test.
H0: = 0 There is no statistically significant difference between net completion time
of section 1 and section 2.
H1: ≠ 0 There is statistically significant difference between net completion time of
section 1 and section 2.
The t-test was used to analyze whether the use of Lean Production techniques is
effective in decreasing net completion time. The paired samples t-test for completion
times is presented in Table 4.2.1. According to the results of the t-test, there is a
statistically significant difference between the net completion times of section 1 and
section 2. Additionally, the mean of completion time shows the decrease in favor of
section 2 (t: 6,239, p <0,05). The hypothesis H0 is rejected and the hypothesis H1 is
accepted.
N Mean SD t p
Section 1 13 282,84 85,462 6,239 0,000
Section 2 13 127,32 62,834
Table 4.2.1 T-Test for net completion time
Figure 4.2.4 shows the chart of the cycle time in which the gains from Orange Cards
are reflected. Since 12 cards, namely 3 products, are requested for each section in Kaizen
Word Game, a team has 9 cycle time in total, and there is a fluctuation in cycle time as
seen in Figure 4.2.4.
10 0 0 0 0
10
10
1 12
10
6
1 12
02
4
0
4
8
32
02
34 4 4 4
2
7
2
7
00
5
10
T1 T2 T3 T4 T5 T6 T7 T8 T9 T10 T11 T12 T13
Number of Orange Card
Section 1 Section 2 Section 3
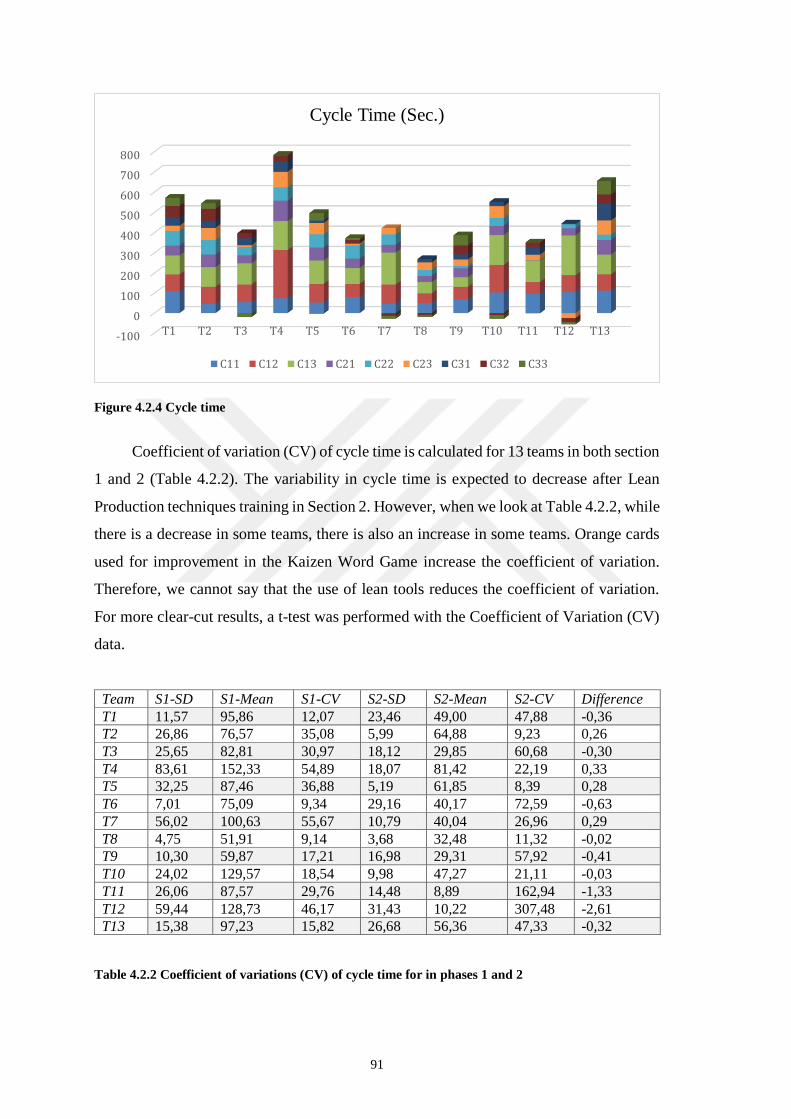
91
Figure 4.2.4 Cycle time
Coefficient of variation (CV) of cycle time is calculated for 13 teams in both section
1 and 2 (Table 4.2.2). The variability in cycle time is expected to decrease after Lean
Production techniques training in Section 2. However, when we look at Table 4.2.2, while
there is a decrease in some teams, there is also an increase in some teams. Orange cards
used for improvement in the Kaizen Word Game increase the coefficient of variation.
Therefore, we cannot say that the use of lean tools reduces the coefficient of variation.
For more clear-cut results, a t-test was performed with the Coefficient of Variation (CV)
data.
Team S1-SD S1-Mean S1-CV S2-SD S2-Mean S2-CV Difference
T1 11,57 95,86 12,07 23,46 49,00 47,88 -0,36
T2 26,86 76,57 35,08 5,99 64,88 9,23 0,26
T3 25,65 82,81 30,97 18,12 29,85 60,68 -0,30
T4 83,61 152,33 54,89 18,07 81,42 22,19 0,33
T5 32,25 87,46 36,88 5,19 61,85 8,39 0,28
T6 7,01 75,09 9,34 29,16 40,17 72,59 -0,63
T7 56,02 100,63 55,67 10,79 40,04 26,96 0,29
T8 4,75 51,91 9,14 3,68 32,48 11,32 -0,02
T9 10,30 59,87 17,21 16,98 29,31 57,92 -0,41
T10 24,02 129,57 18,54 9,98 47,27 21,11 -0,03
T11 26,06 87,57 29,76 14,48 8,89 162,94 -1,33
T12 59,44 128,73 46,17 31,43 10,22 307,48 -2,61
T13 15,38 97,23 15,82 26,68 56,36 47,33 -0,32
Table 4.2.2 Coefficient of variations (CV) of cycle time for in phases 1 and 2
-100
0
100
200
300
400
500
600
700
800
T1 T2 T3 T4 T5 T6 T7 T8 T9 T10 T11 T12 T13
Cycle Time (Sec.)
C11 C12 C13 C21 C22 C23 C31 C32 C33
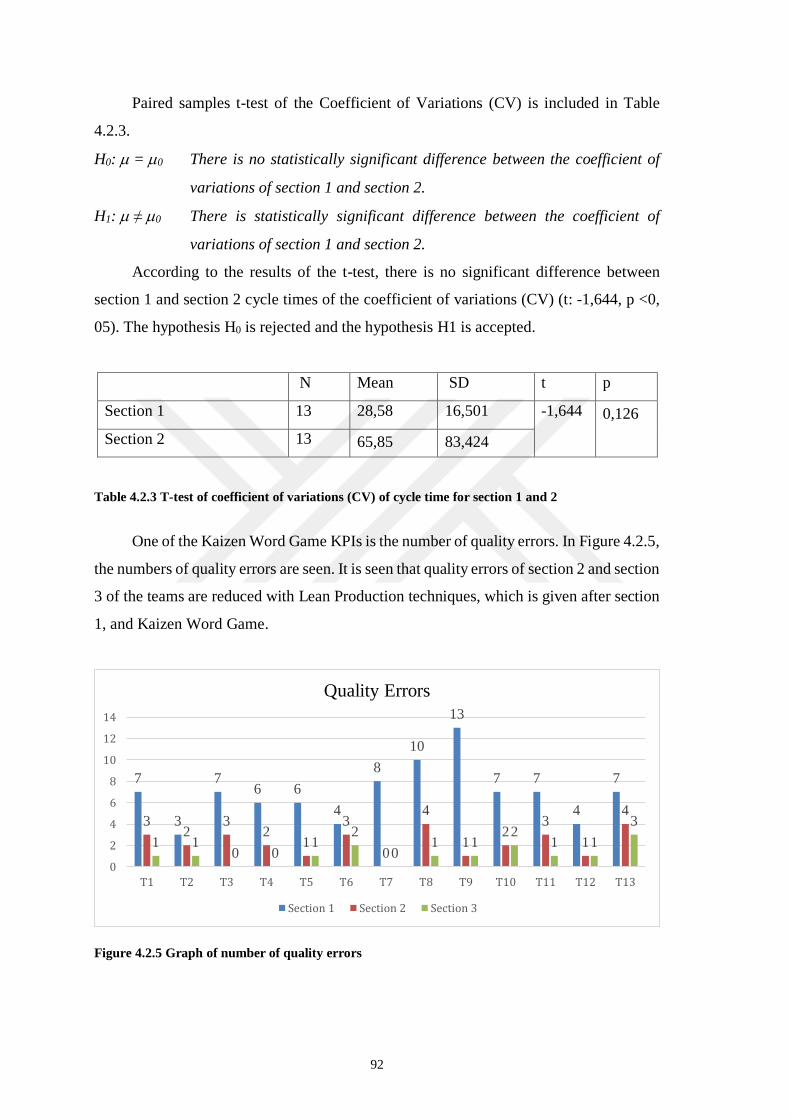
92
Paired samples t-test of the Coefficient of Variations (CV) is included in Table
4.2.3.
H0: = 0 There is no statistically significant difference between the coefficient of
variations of section 1 and section 2.
H1: ≠ 0 There is statistically significant difference between the coefficient of
variations of section 1 and section 2.
According to the results of the t-test, there is no significant difference between
section 1 and section 2 cycle times of the coefficient of variations (CV) (t: -1,644, p <0,
05). The hypothesis H0 is rejected and the hypothesis H1 is accepted.
N Mean SD t p
Section 1 13 28,58 16,501 -1,644 0,126
Section 2 13 65,85 83,424
Table 4.2.3 T-test of coefficient of variations (CV) of cycle time for section 1 and 2
One of the Kaizen Word Game KPIs is the number of quality errors. In Figure 4.2.5,
the numbers of quality errors are seen. It is seen that quality errors of section 2 and section
3 of the teams are reduced with Lean Production techniques, which is given after section
1, and Kaizen Word Game.
Figure 4.2.5 Graph of number of quality errors
7
3
76 6
4
8
10
13
7 7
4
7
32
32
1
3
0
4
12
3
1
4
1 10 0
12
01 1
21 1
3
0
2
4
6
8
10
12
14
T1 T2 T3 T4 T5 T6 T7 T8 T9 T10 T11 T12 T13
Quality Errors
Section 1 Section 2 Section 3

93
This graph in Figure 4.2.5 may not provide a final result, and the number of quality
errors should be analyzed statistically. For this reason, t-test was performed for quality
errors. Paired samples t-test for the number of quality errors is given in Table 4.2.4.
H0: = 0 There is no statistically significant difference between the quality errors
of section 1 and section 2.
H1: ≠ 0 There is statistically significant difference between the number of quality
errors of Section 1 and Section 2.
According to the results of the t-test, there is a statistically significant difference
between the number of quality errors in section 1 and section 2. (t: 5,734, p <0,05). The
mean of the number of quality errors is less in section 2. The hypothesis H0 is rejected
and the hypothesis H1 is accepted.
N Mean SD t p
Section 1 13 6,85 2,609
5,734
0,000 Section 2 13 2,23 1,235
Table 4.2.4 T-Test for the number of quality errors
In accordance with the KPI analysis, we see better results in section 2 and section
3. The completion time and the number of quality errors in section 2 and section 3 are
decreased. During training, teams tried to detect and eliminate wastes which are the
enemy of Lean Production techniques. The teams used the before-after kaizen forms and
the PDCA cycle in training. In Kaizen Word Game, teams performed kaizen applications
such as orange card usage and, process sequence change.

94
Chapter 5
Conclusions and Future Prospects
5.1 Conclusions
Within the scope of this study to facilitate the selection of Lean Production and
Lean Six Sigma training and to analyze the effects on learning, the training was
implemented in four training groups with different employees. In these training groups,
Theoretical Kaizen Training, Ball Game and Kaizen Word Game were used. At the end
of these trainings the results were analyzed by taking into consideration that the
employees received the Kaizen training for the first time.
When the achievement tests of the training were analyzed, it was seen that the
Theoretical Kaizen Training provided 5% improvement in Group 1 and 8% in Group 3.
Furthermore, it was confirmed that the percentage of employees answering the questions
on Lean Production concepts correctly was low. If we look at the Theoretical Kaizen
Training from the view point of educational outcome, it is seen that the outcome of
Theoretical Kaizen Training is less than the other training.
It is also seen that the general training evaluations of the Theoretical Kaizen
Training are lower when it is compared with the general training evaluations of the other
trainings. When the training outputs were analyzed, the words of Kaizen and Respect for
Human are predominant for the training outputs of Theoretical Kaizen Training.
When we look at the training in which lean games, game-based learning techniques
such as Ball Game and Kaizen Word Game, are used, it is observed that this training has
better outcomes than Theoretical Kaizen Training. In the achievement test of Ball Game
Training, there is 7% improvement rate in Group 1 and 12% in Group 2. The mean of
end-of-training outcome and general training evaluations of Ball Game Training is better
than the Theoretical Kaizen Training. However, since Theoretical Kaizen Training was
given before Ball Game Training in Group 1, and since Kaizen Word Game was given in
Group 2, there might be an impact of these trainings. The comparison of the outcomes of

95
the Theoretical Kaizen Training given in Group 3 and the Kaizen Word Game given in
Group 4 gives more explicit results concerning lean games. Also, Ball Game Training
outcomes include fun, educational, and instructive words. So, this means that employees
find the Ball Game as a lean game, fun and educational.
When the improvement rates of Group 3 and Group 4 achievement tests are
examined, Kaizen Word Game with 25% improvement rate seems to have a better
improvement rate than Theoretical Kaizen Training. At the same time, we see a better
result in favor of Kaizen Word Game when we look at the post-test of the Theoretical
Kaizen Training implemented in Group 3, and the post-test of the Kaizen Word Game
implemented in Group 4. The percentage of answering correctly to the questions about
Lean Production techniques and Kaizen who received Kaizen Word Game is higher than
the percentage of Theoretical Kaizen Training. According to the results of the t-test of
Group 3 and Group 4 end-of-training outcome and general training evaluation, it can be
said that the Kaizen Word Game are remarkably higher than training outcomes and
general training evaluation of Theoretical Kaizen Training. The results of the end-of-
training outcomes indicate that Kaizen Word Game increases motivation. In Kaizen Word
Game outcomes, participants used the words fun, educational, and teamwork to describe
their experience. The outcomes show that it is possible to learn while having fun with
Kaizen word game.
As a result of multiple regression analysis, it was found that the graduation status
of an employee had statistically significant and positive effect on the pre-test. Also, pre-
training experience had a statistically significant and negative effect on the post-test.
Group 2 gives the best results with 32% improvement rate compared to other groups
according to outcomes of the training. Also, when the results of the ANCOVA test in are
analyzed, it is seen that group 2 post-test correct numbers are higher than the other groups.
If the company gives 3 training in 180 minutes for Kaizen training, it will be more useful
to give the training sequence that Group 2 received. If the company will allocate 60
minutes to Kaizen training and give one training, it will be more appropriate to implement
the Kaizen Word Game with a 25% improvement rate. As a result of the study, the
company decided to perform 3 training and to implement them with the sequence of
Group 2 training in the form of Kaizen Word Game, Ball Game, and Theoretical Kaizen
Training.
Improvement of KPIs was achieved after Lean Production and Kaizen World Game
training was given. In section 2, net completion time, and the number of quality errors

96
decrease. In trainings, one of the aims of the teams were to detect and eliminate waste,
which is the enemy of Lean Production techniques. For that teams used Before-After
Kaizen forms and the PDCA cycle. Employees also had the opportunity to use
improvement forms. In Kaizen Word Game, teams performed Kaizen implementations
such as orange card usage and process sequence change. These below results show that
Kaizen Word Game is an effective tool to use for applying Lean Production technique
and Lean Games.
5.2 Future Prospects
Nowadays, companies need management systems such as Lean Production and
Lean Six Sigma in order to survive in competitive conditions. The success of Lean
Production and Lean Six Sigma management systems can be achieved if these
management systems become companies’ culture.
Employees of the companies are the most important factor for Lean Production and
Lean Six Sigma to become the company culture. To increase the ownership of the
employees we have to value their thoughts and actions by providing tools to increase their
competencies. For this reason, the training of employees is an essential element for Lean
Production and Lean Six Sigma management system. If the company provides the right
kind of training for its employees, then Lean Production and Lean Six Sigma can become
a company culture.
In this study, Kaizen Training was performed and analyzed. For Kaizen training,
Kaizen Word Game was designed by using game-based learning techniques. Results
showed that Lean Games are open for improvement and Kaizen Word Game will continue
to be revised and may be adapted to DMAIC, 5S, SMED.
Trainings that are using game-based learning techniques for Lean Production and
Lean Six Sigma systems should continue to be developed, and studies should be carried
out to add the magical world of game in to work life.

97
BIBLIOGRAPHY
[1] G. McVay, F. Kennedy, R. Fullerton, “Accounting in the Lean Enterprise:
Providing Simple, Practical, and Decision-Relevant Information,” Productivity
Press, New York (2013).
[2] D.A. Chandler, “The Visible Hand: The Managerial Revolution in American
Business,” Cambridge: Harvard University Press. (1977).
[3] T. Ohno, “Toyota Ruhu–Toyota Üretim Sisteminin Doğuşu ve Evrimi,” C.Feyyat
(Transl.), Scala Yayıncılık, İstabul (1996).
[4] A. Freeman, “Liderlik Dehası ve Alfred P. Sloan” M. F. İmre (Transl.), Türkiye
İş Bankası Kültür Yayınları, İstanbul (2005).
[5] H. Ford, “Today and Tomorrow,” Doubleday, New York (1926).
[6] J.K. Liker, “The Toyota way: 14 management principles from the world's greatest
manufacturer,” McGraw-Hill, New York (2004).
[7] E.C. Sorensen, “My Forty Years with Ford,” W.W. Norton, New York (1956).
[8] H. M. Ford, S. Crowther, “My Life and Work,” Doubleday, New York (1922).
[9] M. V. IUGA, C. V. KIFOR “Lean manufacturing: The when, The where, The
who,” Revista Academiei Fortelor Terestre (2013).
[10] J. Krafcik, “Triumph of the Lean Production System,” Sloan Management
Review, 30(1), 41, Cambridge (1998).
[11] K.C. Vyas, “Toyota Production System,” Master Thesis, The University of Texas
at Austin, Austin (2011).
[12] T. Ohno, “The Toyota Production System: Beyond Large-Scale Production,”
Productivity Press, Portland (1988).
[13] K. Wada, “Kiichiro Toyoda and the Birth of the Japanese Automobile Industry:
Reconsideration of Toyoda-Platt Agreement,” Center for Internatiional Research
on the Japanese Economy, CIRJE-F-288 (2004).

98
[14] J. Womack, D. Jones and D. Roos, “The Machine That Change The World,”
Rawson Associates, New York (1990).
[15] M. Witzel, “Fifty Key Figures in Management” Routledge, London (2003).
[16] Ł. Dekier, “The Origins and Evolution of Lean Management System,” Journal of
International Studies, 5(1), 46-51 (2012).
[17] H. Özçelikel, “Bir Personel Yöneticisinin Gözüyle Japon Yönetim Sistemleri,”
MESS Yayını, İstanbul (1994).
[18] R.A. Zambanini, “The Application of Taguchi's Method of Parameter Design to
the Design of Mechanical Systems,” Master Thesis, Pennsylvania (1992).
[19] T. Pyzdek, “What Every Engineer Should Know About Quality Control,” Marcel
Dekker, Inc., New York (1989).
[20] W.E. Deming, “Out of the Crisis,” MIT Press, Cambridge (1986).
[21] C. Marchwinski, J. Shook, A. Schroeder “Lean Lexicon. Illustrated Dictionary of
Lean Management” Wydawnictwo Lean Enterprise Institute Polska, Wroclaw
(2010)
[22] A. Serdaroğlu Okur, “Yalın Üretim,” Söz Yayın (1997).
[23] L. Wilson, “How to İmplement Lean Manufacturing,” McGraw-Hill Professional
(2009).
[24] K. Suzaki, “The New Manufacturing Challenge” Free Press, New York (1987).
[25] S. Birgün, K. Gülen, and K. Özkan, “Yalın Üretime Geçiş Sürecinde Değer Akışı
Haritalama Tekniğinin Kullanılması: İmalat Sektöründe Bir Uygulama,” İstanbul
Ticaret Üniversitesi Fen Bilimleri Dergisi, 5(9), 47-59 (2006).
[26] J. P. Womack, and D. T. Jones, “Lean Thinking: Banish Waste and Create Wealth
in Your Corporation,” Simon & Schuster, London (2003).
[27] P. Hines, and N. Rich, “The Seven Value Stream Mapping Tools,” International
Journal of Operations & Production Management, 17(1),46-64 (1997).
[28] J. B. Hicks, “Lean Information Management Understanding and Eleminating
Waste,” International Journal of Information Management, 27, 233-249 (2007).

99
[29] J. P. Womack and D.T. Jones, “Lean Solutions: How Companies and Customers
Can Create Value and Wealth Together,” Free Press, New York (2005)
[30] Y. Thangarajoo, and A.Smith, “Lean Thinking: an over View,” Industrial
Engineering & Management, 04(02) (2015)
[31] J. Adams, “Stop Wasting Time, Effort, Money!,” Supply House Tims, 48(11), 26-
27 (2006).
[32] M. Rother, R. Harris, “Creating Continuous Flow: An Action Guide for Managers,
Engineers & Production Associates,” The Lean Enterprise Institute, Brookline
(2001).
[33] D. Meier and J. K. Liker, “The Toyota Way Fieldbook a Practical Guide for
Implementing Toyota’s 4Ps,” New York: McGraw-Hill Companies (2006).
[34] H. Hiroyuki, “5 Pillars of The Visual Workplace. The Sourcebook for 5S
Implementation,” Productivity Press, Portland (1995).
[35] T. G. Zidel, “A Lean Guide To Transforming Healthcare How to Implement Lean
Principles in Hospitals, Medical Offices, Clinics, and Other Healthcare
Organizations American Society for Quality,” Quality Press, Milwaukee, (2006).
[36] D. Willis, “Process Implementation through 5S Laying the Foundation for Lean,”
Productivity Press, New York (2017).
[37] S. J. Warwood, G. Knowles, “An Investigation into Japanese 5-S Practice in UK
Industry”, The TQM Magazine, 16(5), 347-353 (2004).
[38] M. N. Ab. Rahman, N. K. Khamis, R. M. Zin, B. Md. Deros, W. H. W. Mahmood,
“Implementation of 5S Practices in Manufacturing Companies-A Case Study,”
American Journal of Applied Sciences, 7(8), 1182-1189 (2010).
[39] A.M.N. Rose, B. Md. Deros, M. N. Ab. Rahman, and N. Nordin, “Lean
manufacturing best practices in SMEs,” Proceedings of the 2011 International
Conference on Industrial Engineering and Operations Management, 22-24 (2011).
[40] S. K. M. Ho, “The 5S auditing,” Managerial Auditing Journal, 14(6), 294-301
(1999).

100
[41] A. M. Johnderembse, A. Mark, and G. P. White, “Operations Management,” West
Publishing Company, New York (1991).
[42] K. M. Crawford, and J.F. Cox, “Addressing Manufacturing Problems through the
Implementation of Just-In-Time” Production and Inventory Management Journal,
32(1), 33-36 (1991).
[43] R. Fullerton and C. McWatters, “The role of performance measures and incentive
systems in relation to the degree of JIT implementation,” Accounting,
Organizations and Society, 27, 11–735 (2002).
[44] S. Mueller, “Lean Management,” Operations and Human Factors, Business
Processes and Innovation, 1-11 (1998).
[45] L. E. Richmond, and J.H. Blackstone “Just-In-Time in The Plastic Processing
Industry” International Journal of Production, 26(1), 27-34 (1988).
[46] J. Duanmu, and K. Taaffe,”Measuring Manufacturing Throughput Using Takt
Time Analysis and Simulation,” In Proceedings of the 39th Conference on Winter
Simulation: 40 years! The best is yet to come, 1633-1640, IEEE Press (2007).
[47] Y. Monden, “Toyota Production System,” Norcross: Industrial Engineering and
Management Press (1983).
[48] S. Shingo, “A study of the Toyota Production System,” Productivity Press, New
York (1989).
[49] M. Ikonen, “Lean Thinking Ten Software Development: Impacts of Kanban on
Project,” PhD Thesis, University of Helsinki (2011).
[50] S. Orhan, “Tam Zamanında Üretim Sisteminin Gerektirdiği Maliyet
Muhasebesinin Temel Nitelikleri” Erciyes Üniversitesi İİBF Dergisi, 20 (2003).
[51] F.A. Abdulmalek, and J. Rajgopal, “Analyzing The Benefits of Lean
Manufacturing And Value Stream Mapping Via Simulation: A Process Sector
Case Study,”International Journal of Production Economics, 107, 223-236 (2007).
[52] A. Atkinson, R. D. Banker, R.S. Kaplan, R.S., and M.S. Young, “Management
Accounting,” Upper Saddle River, N.J Pearson (2012).

101
[53] J. Miltenburg “U-Shaped Production Lines: A Review of Theory and Practice,”
International Journal of Production Economics, 70, 201-214 (2001).
[54] R. Quintana “Recursive Linear Control of Order Release to Manufacturing Cells
with Random Yield,” IIE Transactions, 34, 489-500 (2002).
[55] S. G. Li, Y. L., Rong, “The Reliable Design of One-Piece Flow Production
System Using Fuzzy Ant Colony Optimization,” Computers & Operations
Research, 36, 1656-1663 (2009).
[56] B. Gornicki, “A better way of production: small-batch and one-piece-flow,"
Industrial Heating, 82(6) 35 (2014).
[57] A. Shalloway, G. Beaver, and J.R. Trott, “Lean-agile software development:
Achieving enterprise agility,” Pearson Education, Essex (2014).
[58] E. ldratt,”The Haystack Syndrome: Sifting Information out of the Data Ocean,”
North River Press, New York (1990).
[59] E. Goldratt, “The Goal: A Process of Ongoing Improvement,” North River Press,
New York (1986).
[60] B.Gecü,”İç Lojistik Sistemlerinin Yalın Üretim Bakış Açısıyla Yeniden
Tasarlanması Ve Otomotiv Sektöründe Örnek Bir Uygulama,” Yüksek Lisans
Tezi, İstanbul Teknik Üniversitesi (2018).
[61] Y. Monden, “Toyota Production System-An Integrated Approach to Just-in-
Time,” Engineering Management Press, Georgiai (1993).
[62] M. İmai, “Kaizen,” Random House Business Division, New York (1986).
[63] F. T. S. Chan, "Effect of kanban size on just-in-time manufacturing
systems,"Journal of Materials Processing Technology 116(2), 146-160 (2001).
[64] L. Apilioğulları, “Yalın Dönüşüm,” Sistem Yayıncılık, Istanbul (2010).
[65] S. C. Kumar, and R. Panneerselvam,”Literature review of Jit-Kanban system,”
International Journal of Advanced Manufacturing Technology, 32, 393–408
(2007).
[66] D. Fisher,”The Just-in-Time Self-Test: Success through Assessment and
Implementation,” Richard D. Irwin Inc. (1995).

102
[67] B.J. Coleman, and M.R. Vaghefi, “Heijunka (?): A Key to the Toyota Production
System,” Production and Inventory Management Journal, 35(4), 31-35 (1994).
[68] R. E. Swanson, “A Generalized Approach to Demand Buffering and Production
Leveling for JIT Make-To-Stock Application,” Canadian Journal of Chemical
Engineering, 86(5), 859-868 (2008).
[69] J. K. Liker, and M. Hoseus, “Toyota Kültürü, Toyota Tarzının Ruhu” Optimist
Yayınları, A. Soydan (transl.) (2010).
[70] A. Chiarini, “Lean Organization: from the Tools of the Toyota Production System
to Lean Office,” Springer, Milan (2013).
[71] J. Enke, M. Tisch, J. Metternich."Learning Factory Requirements Analysis –
Requirements of Learning Factory Stakeholders on Learning Factories", Procedia
CIRP, 224-229 (2016).
[72] M. Rother, J. Shook, “Learning to See: Value stream mapping to create value and
eliminate muda,” The Lean Enterprise Institute Inc. (2003).
[73] P. Solding, and P. Gullander, “Concepts for simulation based value stream
mapping,” Proceedings of the 2009 Winter Simulation Conference (2009).
[74] K. Martin, M. Osterling, “Value stream mapping: how to visualize work and align
leadership for organizational transformation,” McGraw-Hill (2014).
[75] S. Shingo, “Zero Quality Control: Source Inspection and the Poka-Yoke System,”
Productivity Press (1986).
[76] N. Bodek, “Improving Quality by Preventing Defect,” Productivity Press,
Portland, 1-28 (1988).
[77] C. Miralles, R. Holt, J. Garcia ve L. Daros, “Universal design of workplaces
through the use of Poka-Yokes: Case Study and implications,” Journal of
Industrial Engineering and Management, 4(3), 436-452 (2011).
[78] P. Patil, S. Parit ve Y. Burali, “Poka Yoke: The Revolutionary Idea in Total
Productive Management,” International Journal of Engineering and Science, 2(4),
19-24 (2013).

103
[79] J. Grout and J. Toussaint, “Mistake-proofing healthcare: why stopping processes
may be a good start,” Original Research Article Business Horizons, 53(2), 149-
156 (2010).
[80] H. Robinson, “Using Poka-Yoke Techniques for Early Defect Detection,” Sixth
International Conference on Software Testing Analysis and Review (1997).
[81] Ö. F. Efe, “Hizmet işletmelerinde Yalın Üretim ve Yönetim Felsefesi,” Yüksek
Lisans Tezi, Selçuk Üniversitesi, Konya, (2009).
[82] W. S. Chaneski, “Total Productive Maintenance-An Effective Technique”,
Modern Machine Shop, 75, 46-47 (2002).
[83] Ross & Associates Environmental Consulting, Ltd. “Lean Manufacturing and the
Environment: Research on Advanced Manufacturing Systems and the
Environment and Recommendations for Leveraging Better Environmental
Performance,” Environmental Protection Agency (2003).
84] A. Bingöl, “Toplam Üretken Bakım (TPM) Yönetim Sisteminin Örgüt Kültürü
Üzerindeki Etkileri ve Bir Üretim İşletmesinde Uygulama,” Yüksek Lisans Tezi,
Eskişehir Osmangazi Üniversitesi, Eskişehir (2012).
[85] B. S. Blanchard, “An Enhanced Approach for Implementing Total Productive
Maintenance in The Manufacturing Environment”, Journal of Quality in
Maintenance Engineering, 3(2), 69-80 (1997).
[86] F. K. Wang, and W. Lee, “Learning Curve Analysis in Total Productive
Maintenance”, Omega, 29, 491-499 (2001).
[87] M. Rodrigues, and R. Hatakeyama, “Analysis of The Fall of TPM in Companies,”
Journal of Materials Processing Technology, 179, 276-279 (2006).
[88] S. Shingo, “A Revolution in Manufacturing: the SMED System,” Productivity
Press, Cambridge (1985).
[89] P. A. Gade, R. G. Chavan, and D. N. Bhavsar “Reduction in Setup Time by Single
Minute Exchange of Dies (SMED) Methodology,” International Journal of
Scientific and Techology Research, 5(6), 364-366 (2016).

104
[90] R. R. Joshi, and G. R. Naik, “Application of SMED Methodology- A Case Study
in Small Scale Industry,” International Journal of Scientific and Research
Publications, 2(8), 1-4 (2012).
[91] S. D. Priyanka, and M.Shilpa, “Single minute exchange of die in coil
manufacturing unit,” International Journal of Science, Engineering and
Technology Research, 4(6), 2174-2178 (2015).
[92] R.Gavali, S. Chavan, and G. G. Dongre, “Set-up Time Reduction of a
Manufacturing Line using SMED Technique,” International Research Journal of
Engineering and Technology, 3(7), 1748-1750 (2016).
[93] The Productivity Press Development Team, Change over For Operators: The
SMED System, Productivity Press. New York (1996).
[94] A. Simões, and A. Tenera, “Improving setup time in a Press Line – Application
of the SMED methodology,” Management and Control of Production Logistics,
8, 297-302, Portugal (2010).
[95] M. N. C. Ani, and M. S. S. Shafei, “The Effectiveness of the Single Minute
Exchange of Die (SMED) Technique for the Productivity Improvement,”
International Journal of Sciences: Basic and Applied Research (IJSBAR), 5(1), 9-
13 (2012).
[96] V. S. Palmer “Inventory Management Kaizen,” Proceedings of 2nd International
Workshop on Engineering Management for Applied Technology, 55-56, Austin
(2001).
[97] J. C. Chen, J. Dugger and B.Hammer, “A Kaizen Based Approach for Cellular
Manufacturing Design: A Case Study,” The Journal of Technology Studies, 27(2),
19-27 (2000).
[98] N. J. Sayer, and B. Williams, “Lean For Dummies,” Wiley Publishing (2007).
[99] I. A. Khan, “Kaizen: The Japanese Strategy for Continuous Improvement,” VSRD
International Journal of Business & Management Research, 1(3), 177-184 (2011).

105
[100] G. Wittenberg “Kaizen-The many Ways of Getting Better,” Assembly
Automation, 14(4), 12- 17 (1994).
[101] J. Bessant, S. Caffyn, M. Gallagher, “An evolutionary model of continuous
improvement behaviour”, Technovation, 21 (2), 67-77 (2001).
[102] B. Modarress, A. Ansari, A. and D.L. Lockwood, “Kaizen Costing for Lean
Manufacturing: A Case Study”, International Journal of Production Research,
43(9), 1751-1760 (2005).
[103] Y. Monden, and K. Hamada, “Target Costing and Kaizen Costing in Japanese
Automobile Companies”, Journal of Management Accounting Research, 3, 16-34
(1991)
[104] L. M. Rof, “Kaizen Costing Method and Its Role in The Management Of An
Entity”, The Young Economists Journal, 104-109 (2011).
[105] M. Imai, “Gemba Kaizen,” McGraw-Hill, New York (1997).
[106] M. Imai, “Kaizen: The Key to Japan‘s Competitive Success,” McGraw-Hill, New
York (1986).
[107] C. Ashmore,”Kaizen and the Art of Motorcycle Manufacture,” Manufacturing
Engineer, 80(5), 220-222 (2001).
[108] A. Robinson “America‘s Most Successful Export to Japan: Continuous
Improvement Programs,” Sloan Management Review, 3, 67 (1991).
[109] P. D. Wickens, “Production Management: Japanese and British Approaches,” IEE
Proceedings Science, Measurement and Technology, 137(1), 52-54 (1990).
[110] K. Teian, “Guiding Continuous Improvement through Employee
Suggestions,”Productivity Press, Portland (1992).
[111] M. Hammer, J. Champy and R. L. Tathan, Reengineering the Corporation: A
Manifesto for Business Revolution, Harper Collins, New York (1993).
[112] W. E. Deming, “The New Economics for Industry Government and Education,”
MIT Press, Cambridge (1995).
[113] J. Singh and H. Singh, “Kaizen Philosophy: A Review of Literature” IUP Journal
of Operations Management, 8(2), 51–72 (2009).
106
[114] V. Kumar, “An Overview of Kaizen Concept,” VSRD International Journal of
Mechanical, Automobile & Production Engineering, 1(3), 120-125 (2011).
[115] A.K. Bergbauer, “Six Sigma in der Praxis: Das Programm für nachhaltige
Prozessverbesserungen und Ertragssteigerungen,” Expert Verlag. Renningen,
2(3), 47 (2008).
[116] G. Eckes, “Six Sigma for Everyone,” John Wiley&Sons Inc.,13-14, Hoboken
(2003).
[117] P. S. Pande, R. P. Neuman, R. Cavanagh, “Six Sigma Way,” McGraw-Hill (2003).
[118] J. Antony, “Six Sigma in the UK service organisations: Results from a pilot
survey,” Managerial Auditing Journal, 19(8), 1006-1013 (2004).
[119] Y. H. Kwak, and F. T Anbari, “Benefits, obstacles, and future of Six Sigma
approach,” Technovation, 26(5), 708–715 (2004).
[120] G. Brue, “Six Sigma for Managers 24 Lessons to Understand and Apply Six
Sigma Principles in Any Organization” McGraw-Hill, New York (2005).
[121] T. Pyzdek,” The Six Sigma Handbook,” McGraw-Hill, New York (2003).
[122] M. Harry, and R. Schroeder, “Six Sigma: The Breakthrough Management
Strategy Revolutionising the World’s Top Corporations”, Doubleday, New York
(2000).
[123] S. Lurgio, and F. Hays, “Using Six Sigma to improve credit and financial
management competitiveness,” Credit & Financial Management Review (2004).
[124] A. Cherrafi, S. Elfezazi, A. Chiarini, A. Mokhlis, K. Benhida. “The integration of
lean manufacturing, Six Sigma and sustainability: A literature review and future
research directions for developing a specific model,” Journal of Cleaner
Production, 139, 828-846 (2016).
[125] A. Chakrabarty, and K.C. Tan, “The current state of Six Sigma application in
services,” Managing Service Quality, 17(2), 194-200 (2007).
[126] K. Magnusson, D. Kroslid, B. Bergmann, “Six Sigma umsetzen: Die neue
Qualitӓtsstrategie für Unternehmen,” Hanser Fachbuch Verlag. München, 9-46
(2004).
107
[127] E. Atmaca and S. Ş. Girenes, “Literatür Araştırması: Yalın Altı Sigma
Metodolojisi,” Journal of the Faculty of Engineering and Architecture of Gazi
University, 24(4), 605-612 (2009).
[128] K. Yang, B. El-Haik, “Design for Six Sigma: A Roadmap for Product
Development,” McGraw-Hill, New York (2009).
[129] R. T. Dirgo, “Beyond Lean and Six Sigma”, Aircraft Braking Systems
Corporation (2006).
[130] G. J. Hahn, R. W. Hill, S. A. Zinkgraf, “The Impact of Six Sigma Improvement –
A Glimpse into the Future of Statistics”, American Statistician, 9, 208-215 (1999).
[131] R. Calcutt, “Why is Six Sigma Successful?” Journal of Applied Statistics, 301-
306 (2001).
[132] P. S. Goel, P. Gupta, R. Jain and R. K. Tyagi, “Six Sigma for Transactions and
Service,” New York, McGraw-Hill (2005).
[133] J. Antony, F. J. Antony, M. Kumar, and B. R .Cho, “Six Sigma in service
organizations: Benefits, challenges and difficulties, common myths, empirical
observations and success factors,” International Journal of Quality & Reliability
Management, 24, 294-311 (2007).
[134] M. Harry, and D. Crawford, “Six Sigma-the Next Generation,” Machine Design,
77(4), 126-131 (2005).
[135] M. A. Al Kindi, “Normatıve Perspectıves In Manufacturıng,” PhD Thesis,
University Of Illinois At Urbana, Champaign (2010).
[136] B. B. Oymak, “Altı Sigma Yönteminin Zeytinyağı Sektöründe Bir Uygulaması,”
Yüksek Lisans Tezi, Adnan Menderes Üniversitesi, Aydın (2015).
[137] D. H. Stamatis, “Six Sigma fundamentals: a complete guide to the system,
methods and tools,” Productivity Press (2003).
[138] A. Sleeper, “Design for Six Sigma Statistics,” McGraw-Hill, New York (2005).
[139] J. Antony, R. B. Coronado, “Design for Six Sigma,” Manufacturing Engineer,
IET (2002).

108
[140] C. M. Creveling, J. Slutsky, and D. Antis, “Design for Six Sigma in technology
and product development, “Prentice Hall (2003).
[141] G. Brue, and R. G Launsby, “Design for Six Sigma,” McGraw-Hill, New York
(2003).
[142] R. D. Snee and R. W. Hoerl, “Leading With Six Sigma,” Pearson Education
(2003).
[143] R. Basu, and J. N. Wright, “Quality beyond Six Sigma,” Butterworth-Heinemann,
(2003).
[144] J. D. Polk, “Lean Six Sigma, Innovation, and The Change Acceleration Process
Can Work Together”, American College of Physician Executives. 37(1), 38-42
(2011)
[145] M. L. George, “Lean Six Sigma for Service,” McGraw-Hill, New York (2003).
[146] H. De. Koning, R. J. M. M. Does, S. Bisgaard, “Lean Six Sigma in Financial
Services,” Int. J. Six Sigma and Competitive Advantage, 4(1), 1-17 (2008).
[147] T. Bertels, “Integrating Lean and Six Sigma,”https://www.isixsigma.com/
methodology/lean-methodology/integrating-lean-and-six-sigma/ (02.03.2019).
[148] M. George, D. Rowlands and B. Kastle, “What is Lean Six Sigma,” McGraw-Hill,
New York (2003)
[149] B.Smith, “Lean/Six Sigma-Either, Neither, or Both?” The Voice of Michagen
Industry (2004).
[150] C. Brett, P. Queen, “Streamlining Enterprise Records Managements with Lean
Six Sigma: process created by manufacturing can be applied to records
management with substantial results, “The Information Management Journal,
39(6), 58-62 (2005).
[151] N. Balazs, “Critical Success Factors of Lean and Six Sigma Projects: Differences
and Commonalities”, Budapest, 55th EQO Congress World Quality Congress
Notes (2011).
[152] J. Sheridan, “Aircraft-controls Firm Combines Strategies to Improve Speed,”
Flexibility and Quality, 22, 120-125 (2000).

109
[153] Dubai Quality Group, “The Birth of Lean Sigma,” The Manage Mentor, Dubai, 3,
11-38 (2003).
[154] J. Bossert, R. Walker, “Total Quality Management and Performance, an
Evaluation of the Evidence and Lessons for Research on Public Organizations,”
Public Performance & Management Review Journal, 26, 111-131 (2002).
[155] U. Sharma, “Implementing Lean Principles with the Six Sigma Advantage: How
A Battery Company Realized Significant Improvements,” Journal of
Organizational Excellence, 22(3), 43-52 (2003).
[156] M. Carnell, “Put the Pieces Together,” Quality Progress, 39, 66-67 (2006).
[157] D. V. Chand, “Observational Study Using The Tools of Lean Six Sigma To
Improve The Efficiency of The Resident Rounding Process,” Journal of Graduate
Medical Education, 3(2), 144-150 (2011).
[158] N. Mandahawi, R. H. Fowad, S. Obeidat, “An Application of Customized Lean
Six Sigma to Enhance Productivity at A Paper Manufacturing Company”, Jordan
Journal of Mechanical and Industrial Engineering, 6(1), 103-109 (2012).
[159] J. Antony, R. Banuelas, A. Kumar, “World Class Applications of Six Sigma,”
Elsevier Prints (2006)
[160] P. West, “Organisational Learning in the Automotive Sector,” Routledge, London
(2000).
[161] J. M. Morgan and J. K. Liker, “Toyota Product Development System,”
Productivity Press, New York (2006).
[162] W. G. Ouchi, “Theory Z: How American Business Can Meet the Japanese
Challenge,” Avon Books, New York (1982).
[163] A. Morita, “Bir Japon Mucizesi Sony,” Y.Güneri (Transl.), İlgi Yayıncılık,
İstanbul (1989).
[164] M. Ichimura, S. Arunachalam, T. Page, “An Emerging Training Model for
Successful Lean Manufacturing - An Empirical Study, ” i-Manager's Journal on
Management, 2(4), 29-40 (2008).
[165] D. P. Meier and J. K. Liker, “Toyota Talent,” McGraw-Hill, New York (2005).

110
[166] T. Peters, “İş Hayatında Mükemmeli Yakalamak,” N. Miler (Transl.), Boyner
Yayıncılık, İstanbul (2005).
[167] J. E. Driskell, “Effectiveness of Different Detection Training: A Meta-Analysis,”
Psychology, Crime and Law, 10, 1-19 (2011).
[168] E. Engetou, “The Impact Of Training And Development On Organizational
Performance,” Master Thesis, Centria University of Applied Sciences (2017).
[169] B. Gordon, “Are Canadian firms under investing in training?,” Canadian Business
Economics, 1(1), 25–33 (1992).
[170] R. Curtain, “Participation in, and Barriers to, Training: The Experience of Older
Adults,” Australasian Journal on Ageing, 19(4), 172-179 (2000).
[171] L. Sels, “More is not necessarily better': the relationship between the quantity and
quality of training efforts,”International Journal of Human Resource
Management, 13(8), 1279-1298 (2002).
[172] B. Pourabdollahiana, M. Taischa, E. Kergaa,”Serious Games in Manufacturing
Education: Evaluation of Learnes’ Engagement,” Procedia Computer Science, 15,
256-265 (2012).
[173] J. G.Altonji, and J. R. Spletzer, “Worker characteristics, job characteristics and
the receipt of on-the-job-training” Industrial and Labor Relations Review, 45(1),
58-79 (1991).
[174] G. J. Duncan, S. Hoffman, “On-The-Job Training and Earnings Differences by
Race and Sex,” The Review of Economics and Statistics, 69, 594-603 (1979).
[175] A. B. Royalty, “The Effects of Job Turnover on the Training of Men and Women,”
Industrial and Labor Relations Review, 49, 506-521 (1996).
[176] J. D. Sterman, “System Dynamics Modeling: Tools for Learning in a Complex
World,” California Management Review, 43(4), 8-25 (2001).
[177] C. Rowlands, “Let the games begin,” Works Management, 58(6), 31-35 (2005).
[178] E. Ozelkan, A.Galambosi “Lampshade Game for Teaching Lean Manufacturing,”
American Society for Engineering Education, 385-402 (2007).

111
[179] F. Friblick, A. Åkesson and A. Leigard “Learning Lean through Lean Game – A
Case from the Infrastructure Industry,” Proceedings IGLC-15, 475-483, Michigan
(2007).
[180] J. Black “Lean Production: Implementing a world-class system,” New York:
Industrial Press, Inc. (2008)
[181] J.Kadarova, M. Demeckoa, “New approaches in Lean Management,” Procedia
Economics and Finance, 39, 11-16 (2016).
[182] L. B. Ncube “A Simulation of Lean Manufacturing: The Lean Lemonade Tycoon
2,” Simulation Gaming, 41, 568 (2009).
[183] F. Badurdeen, P. Marksberry, A. Hall, and B. Gregory, “Teaching Lean
Manufacturing with Simulations and Games: A Survey and Future Directions,
“Simulation & Gaming, 41(4), 465-786 (2010).
[184] I. Elbadawi, D. L. McWilliams, and E. G. Tetteh, “Enhancing Lean
Manufacturing Learning Experience Through Hands-On Simulation,” Simulation
& Gaming, 41(4), 537-552 (2010).
[185] M. Tisch, C. Hertle, J. Cachay, E. Abele, J. Metternich, R. Tenberg “A systematic
approach on developing action-oriented, competencybased Learning Factories”
Procedia CIRP, 7, 580-585 (2013).
[186] C. Yükselen, “Design and Evaluation of an Educational Game for Assembly Line
Balancing Using Lean Consepts,” Master Thesis, Galatasaray University, İstanbul
(2014)
[187] I. Veza, N. Gjeldum, M. Mladineo, “Lean Learning Factory at FESB,” University
of Split Procedia CIRP, 32, 132-137 (2015).
[188] X. Briosoa, “Teaching Lean Construction: Pontifical Catholic University of Peru
Training Course in Lean Project & Construction Management,” Procedia
Engineering, 123, 85-93 (2015).
[189] E. Ozelkan, A. Galambosi, “How to Design Lean Six Sigma Simulation Games
for Online Learning,” 123rd American Society for Engineering Education Annual
Conference and Exposition, 20, 1-12, New Orleans (2016).

112
[190] S. J. Blöchl, M. Schneider, “Simulation Game for Intelligent Production
Logistics-The PuLL® Learning Factory,” Procedia CIRP, 54, 130-135 (2016).
[191] L. J. De Vin, L. Jacobsson, J. Odhe, A. Wickberg, “ Lean Production Training for
the Manufacturing Industry: Experiences from Karlstad Lean Factory,” Procedia
Manufacturing, 11, 1019-1026 (2017).
[192] I. Veza, N. Gjeldum, M. Mladineo, S. Celar, I. Peko, M. Cotica, P. Ljumovic, Z.
Stojkic, “Development of Assembly Systems in Lean Learning Factory at the
University of Split,” Procedia Manufacturing, 9, 49-56 (2017).
[193] M. Messaadia, A. Bufardi, J. Le Duigou, H. Szigeti, B. Eynard, D. Kiritsis,
“Applying Serious Games in Lean Manufacturing Training,” IFIP International
Conference on Advances in Production Management Systems, 1, 558-565 (2012).
[194] F. Leal, P. C. Martins, A. F. Torres, J. A. Queiroz, and J. A. B. Montevechi,
“Learning lean with lego: developing and evaluating the efficacy of a serious
game,” Production, 27 (2017).
[195] F. Aqlan, E. G. Walters, “Teaching Lean Principles through Simulation Games,”
Proceedings of the 2017 American Society of Engineering Education Conference,
Columbus, Ohio, 1-13 (2017).
[196] S. Makumbe, T. Hattingh, N. Plint, and D. Esterhuizen, “Effectiveness of using
learning factories to impart lean principles in mining employees,” Procedia
Manufacturing, 23, 69–74 (2018).
[197] S. Yang, K. Hamann, B. Haefner, C. Wu, G. Lanza, “A Method for Improving
Production Management Training by Integrating an Industry 4.0 Innovation
Center in China,” Procedia Manufacturing, 23, 213-218 (2018).
[198] A. R. Morton, and R. H. Burgess, “Seeing Spots: An Effective Classroom Exercise
For Lean,” Bill & Vieve Gore School of Business, Westminster College Scheller
College of Business, Georgia Institute of Technology (2013).
[199] J. Darling, B. Drew, R. Joiner, I. Lacovides, C. Gavin, “GameBased Learning in
Engineering Education,” International Conference on Innovation, Good Practice
and Research in Engineering Education, 1-11 (2008).
113
[200] L, J. de Vin, L. Jacobsson, J. Odhe, “Game- Based Lean Production training of
university students and industriel employees,” Procedia Manufacturing, 25, 578-
585 (2018).
[201] V. A. González, B, Senior, F. Orozco, L. F. Alarcon, J. Ingle and A. Best,
“Simulating Lean Production Principles in Construction: A Last Planner-Driven
Game,” Proceedings IGLC-22, (2014).
[202] S. Brown, and C. Vaughan, “Play: How It Shapes Your Brain, Opens the
Imagination, and Invigorates the Soul,” New York: Penguin Group (2010).
[203] M. Prensky, “Digital Game-Based Learning,” McGraw-Hill, New York (2001).
[204] A. Domínguez, J. Saenz-de-Navarrete, L. De-Marcos, L. Fernández-Sanz, C.
Pagés, and J. J. Martínez-Herráiz, “Gamifying learning experiences: Practical
implications and outcomes,” Computers & Education, 63, 380-392 (2013).
[205] P. A. Piccione, “In search of the meaning of Senet,” Archaeological Institute of
America (1980).
[206] J. McGonigal, “Reality is Broken: Why Games Make Us Better and How They
Can Change the World,” The Penguin Press, New York (2011).
[207] B. Reeves, and JL. Read,”Total engagement: How games and virtual worlds are
changing the way people work and businesses compete,” Harvard Business Press,
(2009).
[208] J. Gee, “What video games have to teach us about learning and literacy,” Palgrave
Macmillan, Houndmills (2003).
[209] K. M. Kapp, “The gamification of learning and instruction: game-based methods
and strategies for training and education,” John Wiley & Sons, New York (2012).
[210] D. Dicheva, C. Dichev, G. Agre, and G.Angelova, “Gamification in education: a
systematic mapping study,” Educational Technology & Society, 18(3), 1-14
(2015).
[211] K. Seaborn, and D. I. Fels, “Gamification in theory and action: A survey,”
International Journal of Human-Computer Studies, 74, 14-31 (2015).
114
[212] S. Deterding, M. Sicart, L. Nacke, K. O. Hara, and D.Dixon, “Gamification: Using
game-design elements in nongaming contexts,” Proc. CHI EA ‘11, ACM Press,
2425-2428 (2011).
[213] A. Marczewski, “Gamification: A simple introduction & a bit more,” (2013).
[214] S. Deterding, D. Dixon, R. Khaled, and L. Nacke, “From game design elements
to gamefulness: defining gamification”, In Proceedings of the 15th International
Academic MindTrek Conference: Envisioning Future Media Environments, 9-15
(2011).
[215] K. Werbach, D. Hunter, “For the Win: How Game Thinking Can Revolutionize
Your Busines,” Wharton Digital Press, Pennsylvani (2012).
[216] F. Oprescu, C. Jones, and M. Katsikitis. “I PLAY AT WORK—ten principles for
transforming work processes through gamification,” Frontiers in psychology, 5,
14 (2014).
[217] J. T. Kim, and W. H. Lee, “Dynamical model for gamification of learning
(DMGL),” Multimedia Tools and Applications, 74(19), 8483-8493 (2015).
[218] J. Simões, R. D. Redondo, and A. F. Vilas, “A social gamification framework for
a K-6 learning platform,” Computers in Human Behavior, 29(2), 345–353 (2013).
[219] B. J. Avolio, J. J. Sosik, S. S. Kahai, and B. Baker, “E-leadership: Re-examining
transformations in leadership source and transmission,” The Leadership
Quarterly, 25, 105–131 (2014).
[220] D. Codish, and G. Ravid, “Personality Based Gamification-Educational
Gamification for Extroverts and Introverts,” Proceedings of the 9th Chais
Conference for the Study of Innovation and Learning Technologies: Learning in
the Technological Era (2014).
[221] K. Bokyeong, P. Hyungsung and B. Youngkyun, “Not just fun, but serious
strategies: Using metacognitive strategies in game-based learning,” Computers &
Education, 52, 800-810 (2009).
[222] D. W. Shaffer, R. Halverson, K. R. Squire, and J. P. Gee, “Video games and the
future of learning,” Wisconsin Center for Education Research (NJ1), 4 (2005).
115
[223] Gamification, https://www.healthysimulation.com/6977/the-difference-between-
gamification-and-game-based-learning/ (10.04.2019).
[224] J. P. Lalley, and R. H. Miller, “The learning pyramid: Does it point teachers in the
right direction?,” Education, 128(1), 64–80 (2007).
[225] E. Dale, “Audiovisual methods in teaching (Revised ed.),” Dryden Press, New
York (1954).
[226] S.P. Robbins, and T.A. Judge, “Organizational Behavior,” Prentice Hall, New
Jersey (2009).
[227] D.A. Kolb, “Experiential Learning: experience as the source of learning and
development,” Prentice Hall, Englewood Cliffs (1984).
[228] I. Smeureanu and N. Isăilă “Innovative Educational Scenarios in Game Based
Teaching and Learning,” Amfiteatru Economic Journal, 19(46), 890-901 (2017)
[229] B. Keys, and J. Wolfe, “The Role of Management Games and Simulations in
Education and Research,” Journal of Management, 16(2), 307-336 (1990).
[230] D. A. Kolb, “The kolb learning style inventory,” Hay Resources Direct, Boston
(1999).
[231] S. Freitas, and S. Jarvis, “Serious Games-Engaging Training Solutions: A
Research and Development Project for Supporting Training Needs,” British
Journal of Educational Technology, 38(3), 523-525 (2007).
[232] M. P. Chen, and L. C. Wang, “The effects of type of interactivity in experiential
game-based learning,” International Conference on Technologies for E-Learning
and Digital Entertainment, 273-282 (2009).
[233] E. A. Boyle, E. W. MacArthur, T. M. Connolly, T. Hainey, M. Manea, A. K€arki,
et al. “A narrative literature review of games, animations and simulations to teach
research methods and statistics,” Computers & Education, 74, 1-14 (2014).
[234] T. M. Connolly, E. A. Boyle, E. MacArthur, T. Hainey, and J. M. Boyle, “A
systematic literature review of empirical evidence on computer games and serious
games,” Computers & Education, 59(2), 661-686 (2012).

116
[235] C. E. Emes, “Is Mr. Pac Man eating our children? A review of the effect of video
games on children,” Canadian Journal of Psychiatry, 42, 409-414 (1997).
[236] J. M. Randel, B. A. Morris, C. D. Wetzel, and B. V. Whitehill, “The effectiveness
of games for educational purposes: a review of recent research,” Simulation &
gaming, 23(3), 261-276 (1992).
[237] J. J. Vogel, D. S. Vogel, J. Cannon-Bowers, C. A. Bowers, K. Muse, and M.
Wright, “Computer gaming and interactive simulations for learning: a meta-
analysis,” Journal of Educational Computing Research, 34(3), 229-243 (2006).
[238] J. Wolfe, “The effectiveness of business games in strategic management course
work,” Simulation & Gaming, 28(4), 360-376 (1997).
[239] J. Kirriemuir, and A. McFarlane, “Literature Review in Games and Learning,”
Futurelab Series, 8, 1-34 (2004).
[240] R. T. Hays, “The effectiveness of instructional games: A literature review and
discussion,” Naval Air Warfare Center Training Systems Division, Orlando
(2005).
[241] M. F. Young, S. Slota, A. B. Cutter, G. Jalette, G. Mullin, B. Lai, et al. “Our
princess is in another castle: a review of trends in serious gaming for education,”
Review of Educational Research, 82, 61-89 (2012).
[242] J. A. Plucker, and M. C. Makel, “Assessment of creativity,” Cambridge handbook
of creativity, New York (2010).
[243] B. Van Oers, “Learning resources in the context of play: Promoting effective
learning in early childhood, “European Early Childhood Education Research
Journal 11(1), 7–26 (2003).
[244] B. L. Adams, “Using game-based learning to raise the ethical awareness of
accounting students,” Business Education Innovation Journal, 2(2), 86-93 (2010).
[245] M. Qian and K. R. Clark, “Game-based learning and 21st century skills: a review
of recent research,” Computers in Human Behavior, 63, 53 (2016).
[246] J. J. Bellon, and R.J. Handler “Curriculum development and evaluation: A design
for improvement,” Kendall/Hunt Publishing Company, Dubuque (1982).

117
[247] R. Stake, “The countenance of educational evaluation,” Teachers College Record,
68,523-540 (1967).
[248] A. C. Ornstein, “Curriculum foundations, principles and issues,” Prentice Hall,
Englewood Cliffs (1988).

118
APPENDIX
Appendix 1 Data Collection Form
Data Collection Form
Team Name: Section 1 Section 2 Section 3 Section 4
Team
Members
Name
Card
Color
Card
Color
Card
Color
Card
Color
Pass
Error
1
2
3
4
5
6
7
8
9
10
11
12
13
14

119
Appendix 2 PDCA Cycle Form
PDCA Cycle Form
EXPLANATION SOLUTION IDEA OWNER PDCA STATUS NOT
1
2
Plan
Do
Check
Act
Plan
Do
Check
Act
Plan
Do
Check
Act

120
Appendix 3 Before-After Kaizen Form

121
Appendix 4 Achievement Test
EĞİTİM BAŞLANGIÇ TESTİ
Eğitimin Adı: Tarih:
Katılımcının Adı Soyadı: Bölümü/Unvanı:
A. Eğitim Testi
1. “Daha iyi, daha hızlı ve daha ucuz; israfları
ortadan kaldıran ve insana saygıyı benimseyen
yönetim sistemidir.” tanımı aşağıdakilerden
hangisidir?
A) Yalın Üretim
B) Six Sigma
C) Yalın Six Sigma
D) Toplam Kalite Yönetimi
E) İş Sağlığı ve Güvenliği
6.Aşağıdakilerden hangisi dünyanın en fakir
kaynaklarına sahip ülkelerinden bir tanesi olan
Japonya’nın II. Dünya savaşı gibi yıkıcı bir
savaştan sonra kendisini toplamak için kullanmış
olduğu tekniklerden biridir?
A) Kaizen
B) Stok
C) Bekleme
D) Hatalı Üretim
E) Gereksiz İşlem
2.Aşağıdakilerden hangisi Yalın Üretim'in
düşmanı olan 7 temel israfdan biri değildir?
A) Hata
B) Fazla Üretim
C) Gereksiz Hareket
D) Emniyet Stoğu
E) Bekleme
7.Aşağıdakilerden hangisi Kaizen‘in faydalarından
biridir?
A) İsrafların Artması
B) İşlem Süresinin Artması
C) Kalitenin Artması
D) İş Kazasının Artması
E) Stokların Artması
3."Yalın Üretim Sisteminin temelinde, israfları
yok etme ve ……………… bulunmaktadır."
Boşluğa aşağıdakilerden hangisi gelir?
A) Ücret
B) Six Sigma
C) İnsana Saygı
D) Suçlama
E) Yalın Six Sigma
8.Aşağıdakilerden hangisi Kaizen prensiplerinden
biridir?
A)Herkesin Katılımı
B)Az Harcayıp, Kat Kat Çok Kazanım
C)Küçük Adımlarla İyileştirme
D)Bilginin Paylaşılması
E)Hepsi
4.Aşağıdakilerden hangisi Yalın Üretim'in temel
unsurlarından biri değildir?
A) Ekip Çalışması
B) Sürekli İyileştirme
C) İnsana Saygı
D) İsrafları Azaltma
E) Stok Tutma
9. “Veri toplanmasına ve analizine gerek olmadan
tecrübeye dayalı olarak kısa sürede yapılan
iyileştirmelerdir.“ tanımı aşağıdakilerden
hangisidir?
A) Tek Nokta Dersi
B) Otonom Bakım
C) Six Sigma
D) Yalın Six Sigma
E) Önce-Sonra Kaizen
5. i) Küçük Adımlarla İyileştirme
ii) İnsana Saygı
iii) İsrafları Yok Etme
iv) Sürekli İyileştirme
Yukarıdakilerden hangileri Yalın Üretim'in temel
unsurları arasındadır?
A) i, ii
B) i, iv
C) ii, iiii, iv
D) Hepsi
E) Hiçbiri
10) i)Teslim süresini azaltma
ii) Taşıma sürelerini azaltma
iii)Stokları azaltma
iv) Fireleri azaltma
Yukarıdakilerden hangileri ile ilgili Kaizen
yapılabilir?
A) i, ii
B) i, iv
C) ii, iiii, iv
D) Hepsi
E) Hiçbiri

122
Appendix 5 Evaluation Form
EĞİTİM DEĞERLENDİRME
Eğitimin Adı: Tarih:
Katılımcının Adı Soyadı: Bölümü/Unvanı:
A. Eğitim Testi
1. “Daha iyi, daha hızlı ve daha ucuz; israfları
ortadan kaldıran ve insana saygıyı benimseyen
yönetim sistemidir.” tanımı aşağıdakilerden
hangisidir?
A) Yalın Üretim
B) Six Sigma
C) Yalın Six Sigma
D) Toplam Kalite Yönetimi
E) İş Sağlığı ve Güvenliği
6.Aşağıdakilerden hangisi dünyanın en fakir
kaynaklarına sahip ülkelerinden bir tanesi olan
Japonya’nın II. Dünya savaşı gibi yıkıcı bir
savaştan sonra kendisini toplamak için kullanmış
olduğu tekniklerden biridir?
A) Kaizen
B) Stok
C) Bekleme
D) Hatalı Üretim
E) Gereksiz İşlem
2.Aşağıdakilerden hangisi Yalın Üretim'in
düşmanı olan 7 temel israfdan biri değildir?
A) Hata
B) Fazla Üretim
C) Gereksiz Hareket
D) Emniyet Stoğu
E) Bekleme
7.Aşağıdakilerden hangisi Kaizen‘in faydalarından
biridir?
A) İsrafların Artması
B) İşlem Süresinin Artması
C) Kalitenin Artması
D) İş Kazasının Artması
E) Stokların Artması
3."Yalın Üretim Sisteminin temelinde, israfları
yok etme ve ……………… bulunmaktadır."
Boşluğa aşağıdakilerden hangisi gelir?
A) Ücret
B) Six Sigma
C) İnsana Saygı
D) Suçlama
E) Yalın Six Sigma
8.Aşağıdakilerden hangisi Kaizen prensiplerinden
biridir?
A)Herkesin Katılımı
B)Az Harcayıp, Kat Kat Çok Kazanım
C)Küçük Adımlarla İyileştirme
D)Bilginin Paylaşılması
E)Hepsi
4.Aşağıdakilerden hangisi Yalın Üretim'in temel
unsurlarından biri değildir?
A) Ekip Çalışması
B) Sürekli İyileştirme
C) İnsana Saygı
D) İsrafları Azaltma
E) Stok Tutma
9. “Veri toplanmasına ve analizine gerek olmadan
tecrübeye dayalı olarak kısa sürede yapılan
iyileştirmelerdir.“ tanımı aşağıdakilerden
hangisidir?
A) Tek Nokta Dersi
B) Otonom Bakım
C) Six Sigma
D) Yalın Six Sigma
E) Önce-Sonra Kaizen
5. i) Küçük Adımlarla İyileştirme
ii) İnsana Saygı
iii) İsrafları Yok Etme
iv) Sürekli İyileştirme
Yukarıdakilerden hangileri Yalın Üretim'in temel
unsurları arasındadır?
A) i, ii
B) i, iv
C) ii, iiii, iv
D) Hepsi
E) Hiçbiri
10) i)Teslim süresini azaltma
ii) Taşıma sürelerini azaltma
iii)Stokları azaltma
iv) Fireleri azaltma
Yukarıdakilerden hangileri ile ilgili Kaizen
yapılabilir?
A) i, ii
B) i, iv
C) ii, iiii, iv
D) Hepsi
E) Hiçbiri

123
***Değerlendirmelerinizi size en uygun seçeneği 5 ile 1 arasında işaretleyerek yapınız.
5 - çok iyi 4 – iyi 3 – orta 2 - iyi değil 1 - hiç iyi değil
B. Eğitim Sonu Kazanımlar
Eğitim mesleki gelişimime olumlu katkılar
sağladı. 5 □ 4□ 3□ 2□ 1□
Eğitim kişisel gelişimime olumlu katkılar sağladı. 5 □ 4□ 3□ 2□ 1□
Eğitim, yeni bilgi ve beceriler kazandırdı. 5 □ 4□ 3□ 2□ 1□
Eğitim, motivasyonumu arttırdı. 5 □ 4□ 3□ 2□ 1□
Eğitim kurumumda uygulayabileceğim yeni bilgi
ve beceriler kazandırdı. 5 □ 4□ 3□ 2□ 1□
Eğitim, meslektaşlarımla paylaşabileceğim yeni
mesleki bilgi ve beceriler kazandırdı. 5 □ 4□ 3□ 2□ 1□
Eğitim, konuya olan ilgimi arttırdı. 5 □ 4□ 3□ 2□ 1□
C. Eğitimi genel olarak nasıl değerlendirirsiniz?
___Mükemmel ___ Çok İyi ___İyi __Orta ___ Zayıf
D. Eğitimin çıktısını 1 kelime ile tanımlar mısınız?
Görüş ve Önerileriniz

124
Appendix 6 Example of Training Data

125
Appendix 7 Example of KPI Data
Copyright © 2022 FDOKUMEN