The Effect of Early Marriages and Early Childbearing on Women’s Nutritional Status in India
19
1 23 Maternal and Child Health Journal ISSN 1092-7875 Matern Child Health J DOI 10.1007/s10995-015-1700-7 The Effect of Early Marriages and Early Childbearing on Women’s Nutritional Status in India Srinivas Goli, Anu Rammohan & Deepti Singh
Transcript of The Effect of Early Marriages and Early Childbearing on Women’s Nutritional Status in India

1 23
Maternal and Child Health Journal ISSN 1092-7875 Matern Child Health JDOI 10.1007/s10995-015-1700-7
The Effect of Early Marriages and EarlyChildbearing on Women’s NutritionalStatus in India
Srinivas Goli, Anu Rammohan & DeeptiSingh
1 23
Your article is protected by copyright and all
rights are held exclusively by Springer Science
+Business Media New York. This e-offprint is
for personal use only and shall not be self-
archived in electronic repositories. If you wish
to self-archive your article, please use the
accepted manuscript version for posting on
your own website. You may further deposit
the accepted manuscript version in any
repository, provided it is only made publicly
available 12 months after official publication
or later and provided acknowledgement is
given to the original source of publication
and a link is inserted to the published article
on Springer's website. The link must be
accompanied by the following text: "The final
publication is available at link.springer.com”.
The Effect of Early Marriages and Early Childbearingon Women’s Nutritional Status in India
Srinivas Goli • Anu Rammohan • Deepti Singh
� Springer Science+Business Media New York 2015
Abstract The consequences of early childbearing on the
growth and nutritional status of women in India has not been
quantified in previous studies. Our study aimed to fill this gap
by analysing the association between early marriage and early
childbearing on nutritional status of Indian women, with a
focus on Bihar and Andhra Pradesh, the two states accounting
for the highest proportion of women marrying and giving first
birth before 18 years of age. Our findings revealed that a
substantial number of women were married before 18 years
and thereby exposed to early pregnancy. Furthermore, a sig-
nificantly higher proportion of women in the ‘thin’ category
were married before 18 years, both in the Indian sample
(33 %, p \ 0.001) and in the selected states, Andhra Pradesh
(31 %, p \ 0.001) and Bihar (43 %, p \ 0.001), compared to
those women married at higher ages. Similarly, across all our
samples women whose first birth was before age 18 years also
had a significantly higher probability of being in the ‘thin’
category across all our samples. This pattern was also
observed for associations between early childbirth and ane-
mia levels. We conclude that the net effect of the early age at
marriage and age at first birth on nutritional status is signifi-
cant. Our results underline the need for preventing early
marriages and the consequent high adolescent pregnancies in
India, particularly in high prevalence states. This will help to
improve nutritional status and health care utilisation among
women, thereby, prevent maternal and child mortality and
thus, achieve the MDGs 4–5.
Keywords Early marriage � Early childbearing �Nutritional status � Women � India
Introduction
Adolescent childbearing and nutritional wellbeing are
increasingly attracting global attention. Approximately 16
million adolescent women between 15 and 19 years of age
give birth each year. Children delivered to young mothers
accounted for roughly 11 % of all births worldwide, with
95 % taking place in developing countries [1, 2]. Early
marriage, followed by early pregnancy is a serious public
health concern due to its potential implications on maternal
and child health [1–7]. Adolescent pregnancy at a time,
when women are not biologically mature increases the risk
of damaging the reproductive tract, pregnancy-related
complications, such as anemia, pregnancy-induced hyper-
tension, preterm labour, cephalopelvic disproportion,
maternal mortality, perinatal and neonatal mortality, and
low birth weight [5–7].
Adolescents who are undergoing rapid growth and
development are a nutritionally vulnerable group which is
often overlooked. Adolescents gain 30 % of their adult
Electronic supplementary material The online version of thisarticle (doi:10.1007/s10995-015-1700-7) contains supplementarymaterial, which is available to authorized users.
S. Goli (&)
Population Studies, Centre for the Study of Regional
Development (CSRD), School of Social Sciences (SSS),
Jawaharlal Nehru University (JNU), New Mehrauli Road,
New Delhi 110067, DE, India
e-mail: [email protected]
A. Rammohan
Department of Economics, The University of Western Australia
(M251), 35 Stirling Highway, Crawley, WA 6009, Australia
e-mail: [email protected]
D. Singh
International Institute for Population Sciences, Govandi Station
Road, Deonar, Mumbai 400088, Maharashtra, India
e-mail: [email protected]
123
Matern Child Health J
DOI 10.1007/s10995-015-1700-7
Author's personal copy
weight and more than 20 % of their adult height between
10 and 19 years. In women, physiological conditions such
as pregnancy and lactation increase the likelihood of
nutritional risk. With the onset of menstruation, girls in this
age group are vulnerable to anemia and its associated
adverse consequences. Undernutrition, anemia and poor
childbearing practices in adolescent girls will increase their
susceptibility to infections, leaving them with fewer
reserves to recover from illness, and contributing to the
morbidity and Undernutrition in the infants [8–10].
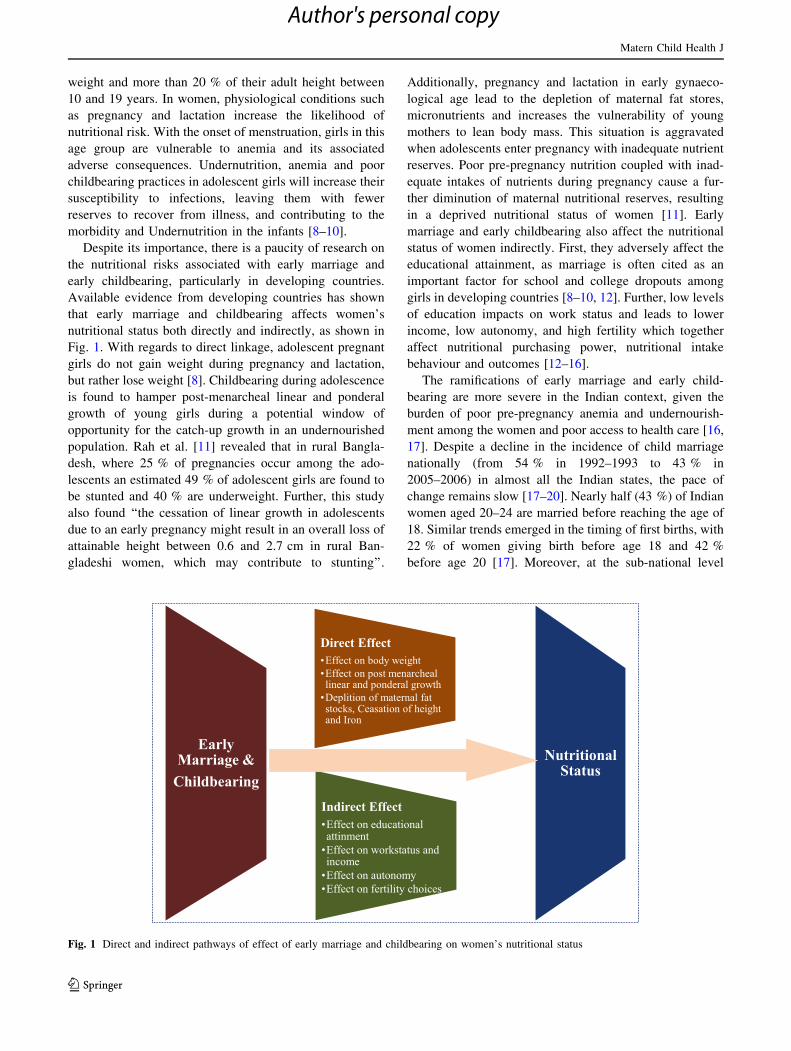
Despite its importance, there is a paucity of research on
the nutritional risks associated with early marriage and
early childbearing, particularly in developing countries.
Available evidence from developing countries has shown
that early marriage and childbearing affects women’s
nutritional status both directly and indirectly, as shown in
Fig. 1. With regards to direct linkage, adolescent pregnant
girls do not gain weight during pregnancy and lactation,
but rather lose weight [8]. Childbearing during adolescence
is found to hamper post-menarcheal linear and ponderal
growth of young girls during a potential window of
opportunity for the catch-up growth in an undernourished
population. Rah et al. [11] revealed that in rural Bangla-
desh, where 25 % of pregnancies occur among the ado-
lescents an estimated 49 % of adolescent girls are found to
be stunted and 40 % are underweight. Further, this study
also found ‘‘the cessation of linear growth in adolescents
due to an early pregnancy might result in an overall loss of
attainable height between 0.6 and 2.7 cm in rural Ban-
gladeshi women, which may contribute to stunting’’.
Additionally, pregnancy and lactation in early gynaeco-
logical age lead to the depletion of maternal fat stores,
micronutrients and increases the vulnerability of young
mothers to lean body mass. This situation is aggravated
when adolescents enter pregnancy with inadequate nutrient
reserves. Poor pre-pregnancy nutrition coupled with inad-
equate intakes of nutrients during pregnancy cause a fur-
ther diminution of maternal nutritional reserves, resulting
in a deprived nutritional status of women [11]. Early
marriage and early childbearing also affect the nutritional
status of women indirectly. First, they adversely affect the
educational attainment, as marriage is often cited as an
important factor for school and college dropouts among
girls in developing countries [8–10, 12]. Further, low levels
of education impacts on work status and leads to lower
income, low autonomy, and high fertility which together
affect nutritional purchasing power, nutritional intake
behaviour and outcomes [12–16].
The ramifications of early marriage and early child-
bearing are more severe in the Indian context, given the
burden of poor pre-pregnancy anemia and undernourish-
ment among the women and poor access to health care [16,
17]. Despite a decline in the incidence of child marriage
nationally (from 54 % in 1992–1993 to 43 % in
2005–2006) in almost all the Indian states, the pace of
change remains slow [17–20]. Nearly half (43 %) of Indian
women aged 20–24 are married before reaching the age of
18. Similar trends emerged in the timing of first births, with
22 % of women giving birth before age 18 and 42 %
before age 20 [17]. Moreover, at the sub-national level
Early Marriage &
Childbearing
Direct Effect•Effect on body weight•Effect on post menarcheal linear and ponderal growth
•Deplition of maternal fat stocks, Ceasation of height and Iron
Indirect Effect•Effect on educational attinment
•Effect on workstatus and income
•Effect on autonomy•Effect on fertility choices
Nutritional Status
Fig. 1 Direct and indirect pathways of effect of early marriage and childbearing on women’s nutritional status
Matern Child Health J
123
Author's personal copy
some states show patterns that are worse than the all-India
average. Large states like Bihar and Andhra Pradesh have
amongst the lowest age at marriage and age at first birth,
and poor nutritional indicators in India [16].
However, previous literature and policies in India have
overlooked this important research question. They have
largely focused on the implications of early marriage and
early childbearing on maternal and child health [19–27].
The consequences of premature childbearing on the nutri-
tional status of women in India have not been quantified.
Our study aims to fill this gap by analysing the association
between early marriage and early childbearing on the
nutritional status of Indian women. Moreover, in the view
of sub-national variations in prevalence of early marriage
and childbearing and nutritional status of women, we
conduct separate analyses for Bihar and Andhra Pradesh,
the two states accounting for the highest proportion of
women marrying and giving first birth before 18 years
[14].
Methods and Materials
Data
We used data from the third round of National Family
Health Survey (NFHS) carried out in India during
2005–2006. The NFHS is a large-scale, multi-round survey
conducted in a representative sample of households
throughout India. The third round of the NFHS, conducted
in 2005–2006 was the outcome of collaborative efforts of
many organisations, including the International Institute for
Population Sciences (IIPS), Macro-International, and the U
S Agency for International Development (USAID),
Department for International Development, the Bill and
Melinda Gates Foundation, United Nation Children’s Fund
(UNICEF), United Nation Population Fund (UNDP) and
Ministry of Health and Family Welfare (MoHFW). The
survey covered a representative sample of 109,041 house-
holds, 124,385 women aged 15–49 years and 74,369 men
aged 15–54 years. However, the analyses of this study only
focus on currently married women. The principal objective
of NFHS-3 was to provide national and state level esti-
mates on important aspects of nuptiality, fertility, mortal-
ity, family planning and nutrition, health status and health
care as well as data on various socioeconomic indicators.
Ethical approval for the survey was provided by the IIPS,
Mumbai, India.
The survey adopted a two-stage sample design in most
rural areas and a three-stage sample design in most urban
areas. In rural areas, the villages were selected at the first
stage using a Probability Proportional to Size (PPS)
sampling scheme. The required number of households
was selected at the second stage using systematic sam-
pling. In urban areas, blocks were selected at the first
stage, Census Enumeration Blocks (CEB) containing
approximately 150–200 households was selected at the
second stage, and the required number of households was
selected at the third stage using systematic sampling
technique. To account for the multi-stage sampling design
adopted in NFHS-3, we used appropriate weights in the
analysis. The details of the sampling weights are given in
the NFHS report [13].
Variables
Dependent Variables
Our dependent variables are the nutritional status and
anemia levels of women. Nutritional status of women was
measured using the Body Mass Index (BMI) a simple index
of weight-for-height in adults. World Health Organization
(WHO) defined BMI as weight in kilograms divided by
height in meters squared (kg/m2). BMI is commonly used
to classify thin, normal and obese. Thin refers to a BMI
below 18.5, Normal refers to a BMI of 18.5–24.9, and
Obese refers to BMI greater than 25. The anemia level is
measured as the amount (grams) of hemoglobin level in
decilitre blood. Three levels of severity of anemia were
distinguished in non-pregnant women: Mild anemia
(10.0–11.9 g/dl), Moderate anemia (7.0–9.9 g/dl), and
Severe anemia (\7.0 g/dl) [14, 25, 26].
Independent Variables
Early age at marriage and early childbearing were the key
independent variables used in this study. Early age at
marriage is defined as a formal marriage before 18 years of
age [26]. Similarly, early childbearing is defined as a
woman giving birth to a child before 18 years of age [13,
22, 23]. The study used a number of other socioeconomic
factors as control factors. These include age (the age-group
classified as 15–24, 25–34 and 35–49 years), Children Ever
Born (CEB), place of residence (rural or urban), Caste
(which includes the following categories- Scheduled caste,
Scheduled tribe, Other backward class). The educational
status of the respondent and her partner (categorized as
Uneducated, Primary education, Secondary education, and
Higher education). Religion was categorized into Hindu,
Muslims, Christian, Sikhs and Others. The household’s
economic status was measured using five wealth quintiles
(categorized as Lower, Second, Middle, Richer and Rich-
est). The wealth quintiles were constructed using 33
household assets. Each of the household assets were
assigned a weight (factor score) generated through Princi-
ple Component Analysis (PCA). The resulting asset scores
Matern Child Health J
123
Author's personal copy
were standardized in relation to a normal distribution with
the mean of zero and standard deviation of one. Moreover,
keeping in the view of sub-national variation in prevalence
of early marriage and childbearing and nutritional status of
women, we have carried separate analyses for Bihar and
Andhra Pradesh, the two states accounting for the highest
proportion of women marrying and giving first birth before
18 years [14].
Statistical Analysis
We performed the statistical analyses in two steps: in the
first step, bivariate analysis was carried out to estimate
differential in nutritional status of women by age at mar-
riage and age at first births. Pearson Chi square test was
used to test the significance of differentials. In the second
step, through multinomial regression, coefficients of three
categories (Thin, Normal and Obese) of BMI of women
were estimated by age at marriage and age at first birth
after controlling for relevant socioeconomic factors.
Although, Multinomial logistic regression has been the
standard statistical tool often used in nutritional studies, for
simplicity in the interpretation of results, the coefficients of
multinomial logistic regression were converted into
adjusted percentages by using Multiple Classification
Analysis (MCA) conversion model. The advantage of the
MCA convergence model was that we can estimate the
values of reference category of the dependent variable
which was not possible in simple Multinomial regression
analyses.
The mathematical form of these two models are written
as
Z1 ¼ LogP1
P3
� �¼ a1 þ
Xb1j � Xj
Z2 ¼ LogP2
P3
� �¼ a2 þ
Xb2j � Xj
P1 þ P2 þ P3
where,ai i=1,2 : constants; bij i=1,2; j=1,2….n : multinomial
regression coefficient; P1 = Estimated probability of
women being thin BMI; P2 = Estimated probability of
women being normal BMI; P3 = (obese BMI) was refer-
ence category of the model.
The MCA conversion model procedure consists of fol-
lowing steps:By using regression coefficient and mean
values of independent variables, the predicted probabilities
were computed as:Pi ¼ expðziÞ1þP
expðziÞf g, i = 2, 3, and P3 ¼
1� P1 þ P2 where Z was the estimated value of response
for all the categories of each variables.
Further, the predicted probabilities were converted to
percentages.
All analyses of this study were carried out using STATA
13 (Stata crop LP, College Station, Texas, USA).
Results
Early Marriage and Early Childbearing in India
The levels of early marriage and early childbearing are
calculated at the All-India level and for individual states
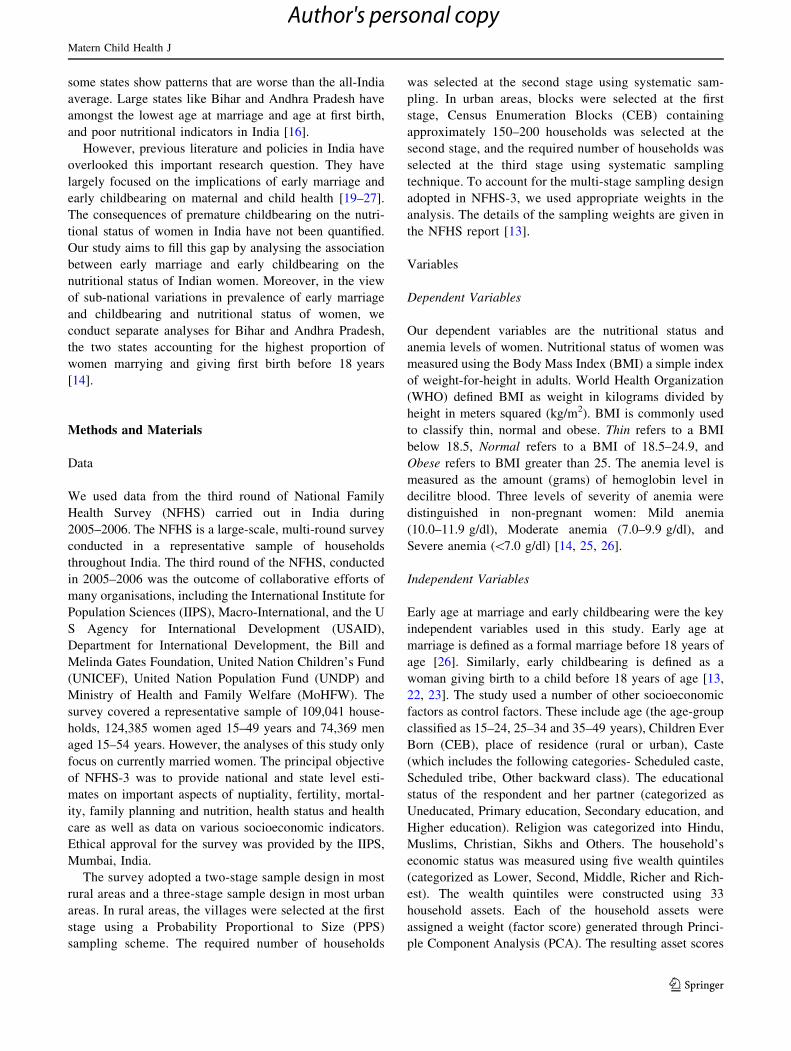
and presented in the form of figures. Figure 2 shows the
percentage of women married before 18 years of age by
states of India. The results reveal that 60 % of currently
married women aged 15–49 years, were married before
18 years of age in India. Accounting for statewide distri-
bution, early marriages were highest in Bihar (76 %) and
Andhra Pradesh (73 %), and lowest in Goa (19 %). In
approximately half of the states (i.e. 15 out of 29) more
than 50 % of the currently married women were married
before the age of 18. The range of variation of early
marriages across the major states was 26 % between
Assam (50 %) and Bihar (76 %).
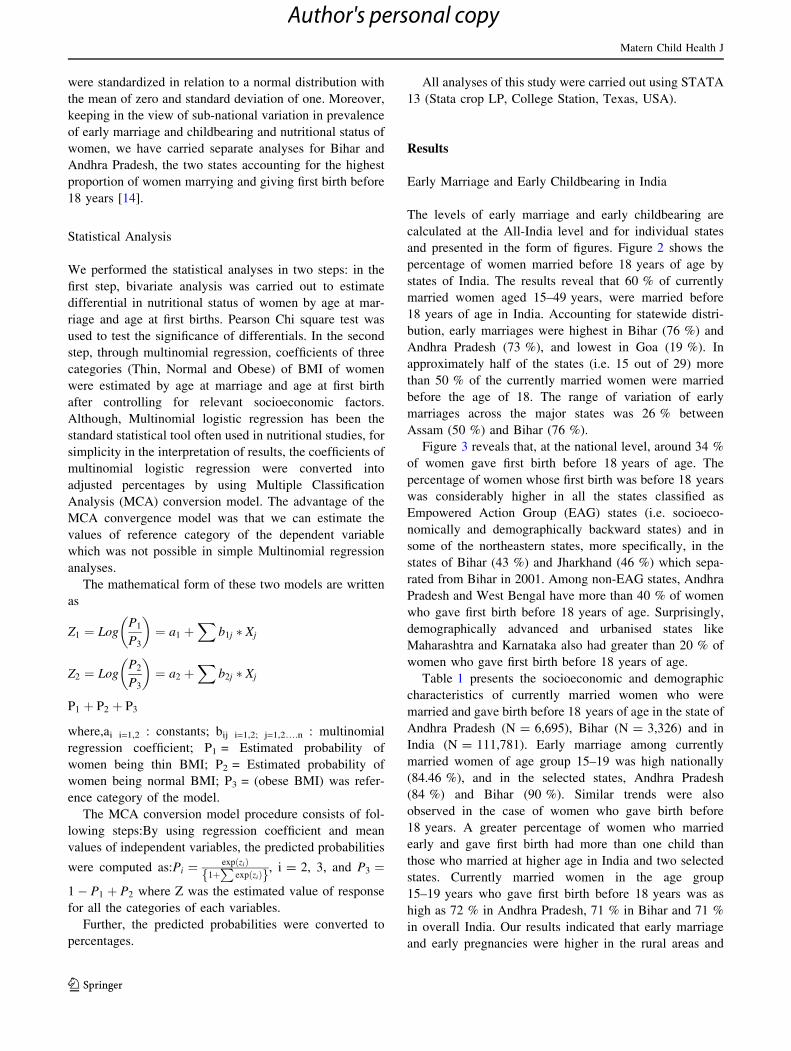
Figure 3 reveals that, at the national level, around 34 %
of women gave first birth before 18 years of age. The
percentage of women whose first birth was before 18 years
was considerably higher in all the states classified as
Empowered Action Group (EAG) states (i.e. socioeco-
nomically and demographically backward states) and in
some of the northeastern states, more specifically, in the
states of Bihar (43 %) and Jharkhand (46 %) which sepa-
rated from Bihar in 2001. Among non-EAG states, Andhra
Pradesh and West Bengal have more than 40 % of women
who gave first birth before 18 years of age. Surprisingly,
demographically advanced and urbanised states like
Maharashtra and Karnataka also had greater than 20 % of
women who gave first birth before 18 years of age.
Table 1 presents the socioeconomic and demographic
characteristics of currently married women who were
married and gave birth before 18 years of age in the state of
Andhra Pradesh (N = 6,695), Bihar (N = 3,326) and in
India (N = 111,781). Early marriage among currently
married women of age group 15–19 was high nationally
(84.46 %), and in the selected states, Andhra Pradesh
(84 %) and Bihar (90 %). Similar trends were also
observed in the case of women who gave birth before
18 years. A greater percentage of women who married
early and gave first birth had more than one child than
those who married at higher age in India and two selected
states. Currently married women in the age group
15–19 years who gave first birth before 18 years was as
high as 72 % in Andhra Pradesh, 71 % in Bihar and 71 %
in overall India. Our results indicated that early marriage
and early pregnancies were higher in the rural areas and
Matern Child Health J
123
Author's personal copy

among socially disadvantaged groups such as SCs, STs and
OBCs, relative to the upper castes. The incidence of early
marriage and early births was almost equal among Hindu
and Muslim women, whereas both the prevalence of early
marriages and births were higher among women from poor
and middle income households. On the other hand, the
incidence of early marriage and early childbirth was rela-
tively lower among women in the top two wealth quintiles,
among higher educated women, and among women whose
husband had the education of ‘higher secondary and
above’. This indicated that early marriage and early age at
childbirth in general is the characteristics of women from
low socioeconomic status.
In Table 2, we present the nutritional status of women
by the age at first marriage and age at first birth, for India
and for the states of Andhra Pradesh and Bihar. Women
were classified into three categories (i.e. less 18 years,
18–24, 25 and above) based on their reporting of age at first
marriage and age at first birth. The percentages of women
in the each nutritional status category (i.e. Thin, Normal
and Obese) were estimated for each of the age at marriage
categories. The results showed that a significantly higher
percentage of women married before 18 years were in the
‘thin’ category in India (35 %, p \ 0.001) and in the
selected states, Andhra Pradesh (31 %, p \ 0.001) and
Bihar (43 %, p \ 0.001), compared to women married at
38.5
33.635.5
48.055.0
39.0
70.766.3
76.4
39.6
57.1
36.8
27.227.8
54.7
37.6
51.0
65.371.6
57.4
69.1 67.8
48.556.2
72.5
55.5
18.926.5
40.5
60.1
0
10
20
30
40
50
60
70
80
90
100
Jam
mu
and
Kas
hmir
Him
acha
l Pra
desh
Punj
ab
Utta
ranc
hal
Har
yana
Del
hi
Raj
asth
an
Utta
r Pr
ades
h
Bih
ar
Sikk
im
Aru
nach
al P
rade
sh
Nag
alan
d
Man
ipur
Miz
oram
Tri
pura
Meg
hala
ya
Ass
am
Wes
t Ben
gal
Jhar
khan
d
Ori
ssa
Chh
attis
garh
Mad
hya
Prad
esh
Guj
arat
Mah
aras
htra
And
hra
Prad
esh
Kar
nata
ka
Goa
Ker
ala
Tam
il N
adu
Indi
a
Age at marriage (Less than 18 years)
Fig. 2 Percentage of women who married before 18 years of age in different states, India, 2005–2006
23.2
15.517.0
23.125.1
18.1
33.1
35.3
43.0
22.9
41.0
24.2
15.517.1
31.8
23.8
34.8
42.7
46.3
31.3
41.9
35.2
21.5
32.6
44.7
37.3
11.914.0
23.9
34.1
0
5
10
15
20
25
30
35
40
45
50
Jam
mu
and
Kas
hmir
Him
acha
l Pra
desh
Punj
ab
Utta
ranc
hal
Har
yana
Del
hi
Raj
asth
an
Utta
r Pr
ades
h
Bih
ar
Sikk
im
Aru
nach
al P
rade
sh
Nag
alan
d
Man
ipur
Miz
oram
Tri
pura
Meg
hala
ya
Ass
am
Wes
t Ben
gal
Jhar
khan
d
Ori
ssa
Chh
attis
garh
Mad
hya
Prad
esh
Guj
arat
Mah
aras
htra
And
hra
Prad
esh
Kar
nata
ka
Goa
Ker
ala
Tam
il N
adu
Indi
a
Age at first Birth (Less than 18 years)
Fig. 3 Percentage of women who gave birth before 18 years of age in different states, India, 2005–2006
Matern Child Health J
123
Author's personal copy
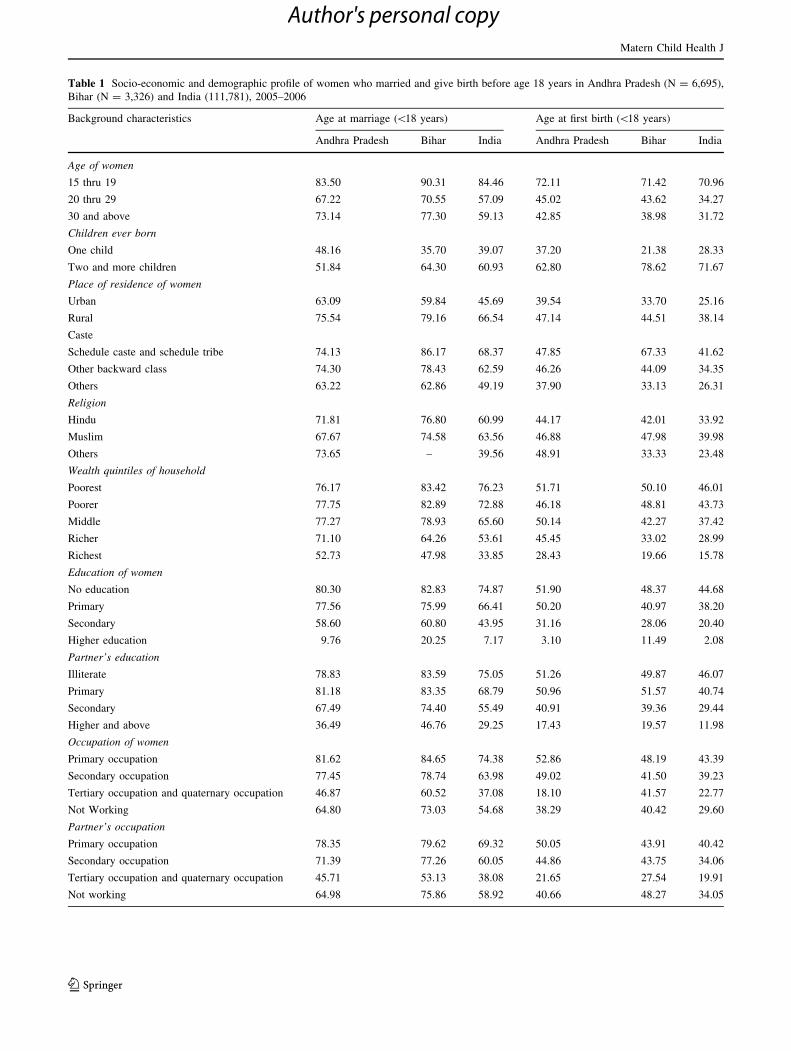
Table 1 Socio-economic and demographic profile of women who married and give birth before age 18 years in Andhra Pradesh (N = 6,695),
Bihar (N = 3,326) and India (111,781), 2005–2006
Background characteristics Age at marriage (\18 years) Age at first birth (\18 years)
Andhra Pradesh Bihar India Andhra Pradesh Bihar India
Age of women
15 thru 19 83.50 90.31 84.46 72.11 71.42 70.96
20 thru 29 67.22 70.55 57.09 45.02 43.62 34.27
30 and above 73.14 77.30 59.13 42.85 38.98 31.72
Children ever born
One child 48.16 35.70 39.07 37.20 21.38 28.33
Two and more children 51.84 64.30 60.93 62.80 78.62 71.67
Place of residence of women
Urban 63.09 59.84 45.69 39.54 33.70 25.16
Rural 75.54 79.16 66.54 47.14 44.51 38.14
Caste
Schedule caste and schedule tribe 74.13 86.17 68.37 47.85 67.33 41.62
Other backward class 74.30 78.43 62.59 46.26 44.09 34.35
Others 63.22 62.86 49.19 37.90 33.13 26.31
Religion
Hindu 71.81 76.80 60.99 44.17 42.01 33.92
Muslim 67.67 74.58 63.56 46.88 47.98 39.98
Others 73.65 – 39.56 48.91 33.33 23.48
Wealth quintiles of household
Poorest 76.17 83.42 76.23 51.71 50.10 46.01
Poorer 77.75 82.89 72.88 46.18 48.81 43.73
Middle 77.27 78.93 65.60 50.14 42.27 37.42
Richer 71.10 64.26 53.61 45.45 33.02 28.99
Richest 52.73 47.98 33.85 28.43 19.66 15.78
Education of women
No education 80.30 82.83 74.87 51.90 48.37 44.68
Primary 77.56 75.99 66.41 50.20 40.97 38.20
Secondary 58.60 60.80 43.95 31.16 28.06 20.40
Higher education 9.76 20.25 7.17 3.10 11.49 2.08
Partner’s education
Illiterate 78.83 83.59 75.05 51.26 49.87 46.07
Primary 81.18 83.35 68.79 50.96 51.57 40.74
Secondary 67.49 74.40 55.49 40.91 39.36 29.44
Higher and above 36.49 46.76 29.25 17.43 19.57 11.98
Occupation of women
Primary occupation 81.62 84.65 74.38 52.86 48.19 43.39
Secondary occupation 77.45 78.74 63.98 49.02 41.50 39.23
Tertiary occupation and quaternary occupation 46.87 60.52 37.08 18.10 41.57 22.77
Not Working 64.80 73.03 54.68 38.29 40.42 29.60
Partner’s occupation
Primary occupation 78.35 79.62 69.32 50.05 43.91 40.42
Secondary occupation 71.39 77.26 60.05 44.86 43.75 34.06
Tertiary occupation and quaternary occupation 45.71 53.13 38.08 21.65 27.54 19.91
Not working 64.98 75.86 58.92 40.66 48.27 34.05
Matern Child Health J
123
Author's personal copy
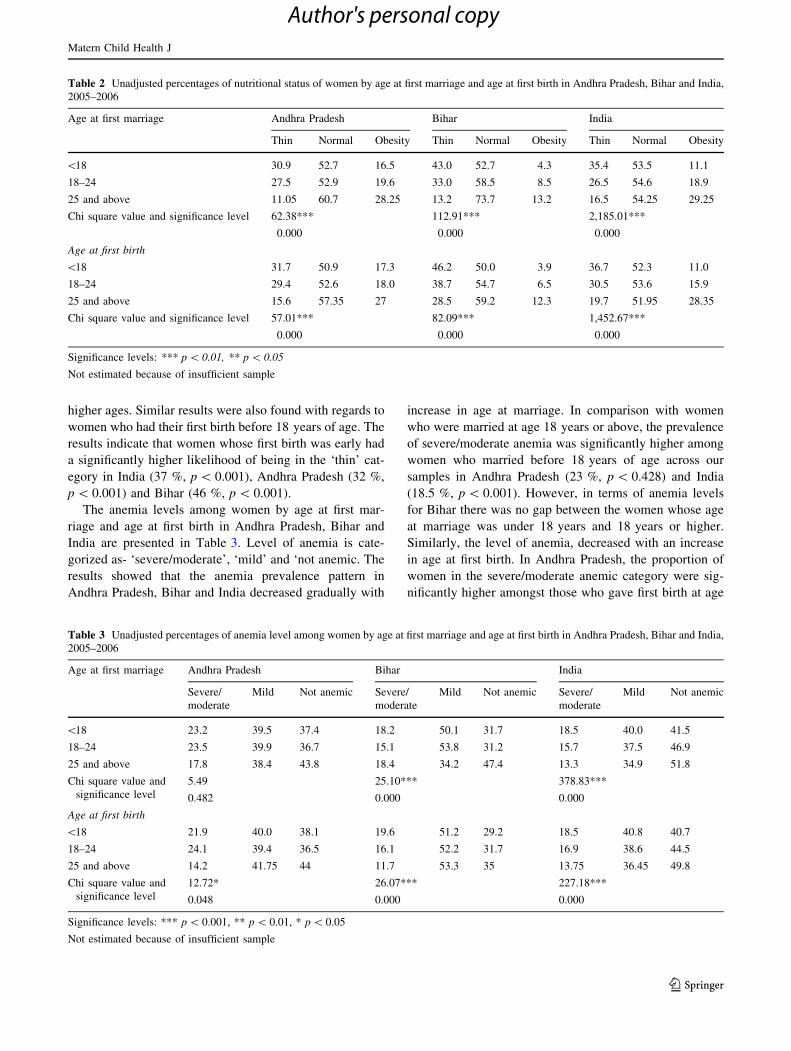
higher ages. Similar results were also found with regards to
women who had their first birth before 18 years of age. The
results indicate that women whose first birth was early had
a significantly higher likelihood of being in the ‘thin’ cat-
egory in India (37 %, p \ 0.001), Andhra Pradesh (32 %,
p \ 0.001) and Bihar (46 %, p \ 0.001).
The anemia levels among women by age at first mar-
riage and age at first birth in Andhra Pradesh, Bihar and
India are presented in Table 3. Level of anemia is cate-
gorized as- ‘severe/moderate’, ‘mild’ and ‘not anemic. The
results showed that the anemia prevalence pattern in
Andhra Pradesh, Bihar and India decreased gradually with
increase in age at marriage. In comparison with women
who were married at age 18 years or above, the prevalence
of severe/moderate anemia was significantly higher among
women who married before 18 years of age across our
samples in Andhra Pradesh (23 %, p \ 0.428) and India
(18.5 %, p \ 0.001). However, in terms of anemia levels
for Bihar there was no gap between the women whose age
at marriage was under 18 years and 18 years or higher.
Similarly, the level of anemia, decreased with an increase
in age at first birth. In Andhra Pradesh, the proportion of
women in the severe/moderate anemic category were sig-
nificantly higher amongst those who gave first birth at age
Table 2 Unadjusted percentages of nutritional status of women by age at first marriage and age at first birth in Andhra Pradesh, Bihar and India,
2005–2006
Age at first marriage Andhra Pradesh Bihar India
Thin Normal Obesity Thin Normal Obesity Thin Normal Obesity
\18 30.9 52.7 16.5 43.0 52.7 4.3 35.4 53.5 11.1
18–24 27.5 52.9 19.6 33.0 58.5 8.5 26.5 54.6 18.9
25 and above 11.05 60.7 28.25 13.2 73.7 13.2 16.5 54.25 29.25
Chi square value and significance level 62.38*** 112.91*** 2,185.01***
0.000 0.000 0.000
Age at first birth
\18 31.7 50.9 17.3 46.2 50.0 3.9 36.7 52.3 11.0
18–24 29.4 52.6 18.0 38.7 54.7 6.5 30.5 53.6 15.9
25 and above 15.6 57.35 27 28.5 59.2 12.3 19.7 51.95 28.35
Chi square value and significance level 57.01*** 82.09*** 1,452.67***
0.000 0.000 0.000
Significance levels: *** p \ 0.01, ** p \ 0.05
Not estimated because of insufficient sample
Table 3 Unadjusted percentages of anemia level among women by age at first marriage and age at first birth in Andhra Pradesh, Bihar and India,
2005–2006
Age at first marriage Andhra Pradesh Bihar India
Severe/
moderate
Mild Not anemic Severe/
moderate
Mild Not anemic Severe/
moderate
Mild Not anemic
\18 23.2 39.5 37.4 18.2 50.1 31.7 18.5 40.0 41.5
18–24 23.5 39.9 36.7 15.1 53.8 31.2 15.7 37.5 46.9
25 and above 17.8 38.4 43.8 18.4 34.2 47.4 13.3 34.9 51.8
Chi square value and
significance level
5.49 25.10*** 378.83***
0.482 0.000 0.000
Age at first birth
\18 21.9 40.0 38.1 19.6 51.2 29.2 18.5 40.8 40.7
18–24 24.1 39.4 36.5 16.1 52.2 31.7 16.9 38.6 44.5
25 and above 14.2 41.75 44 11.7 53.3 35 13.75 36.45 49.8
Chi square value and
significance level
12.72* 26.07*** 227.18***
0.048 0.000 0.000
Significance levels: *** p \ 0.001, ** p \ 0.01, * p \ 0.05
Not estimated because of insufficient sample
Matern Child Health J
123
Author's personal copy
before 18 years (22 %, p \ 0.05) and in the category of
18–24 years (24 %, p \ 0.05) than those who gave first
birth at higher age groups (14 %, p \ 0.05). Similar results
were also observed in Bihar, the proportion of anemic
(severe/moderate) women were considerably greater
among those who gave first birth at age \18 years (20 %,
p \ 0.001) than women who gave first birth in higher age
groups (12 %, p \ 0.001). The prevalence of severe/mod-
erate anemia gap between the women whose age at first
birth was\18 years and 18 years or more was around 5 %
at all India level and this difference was statistically sig-
nificant with p \ 0.001.
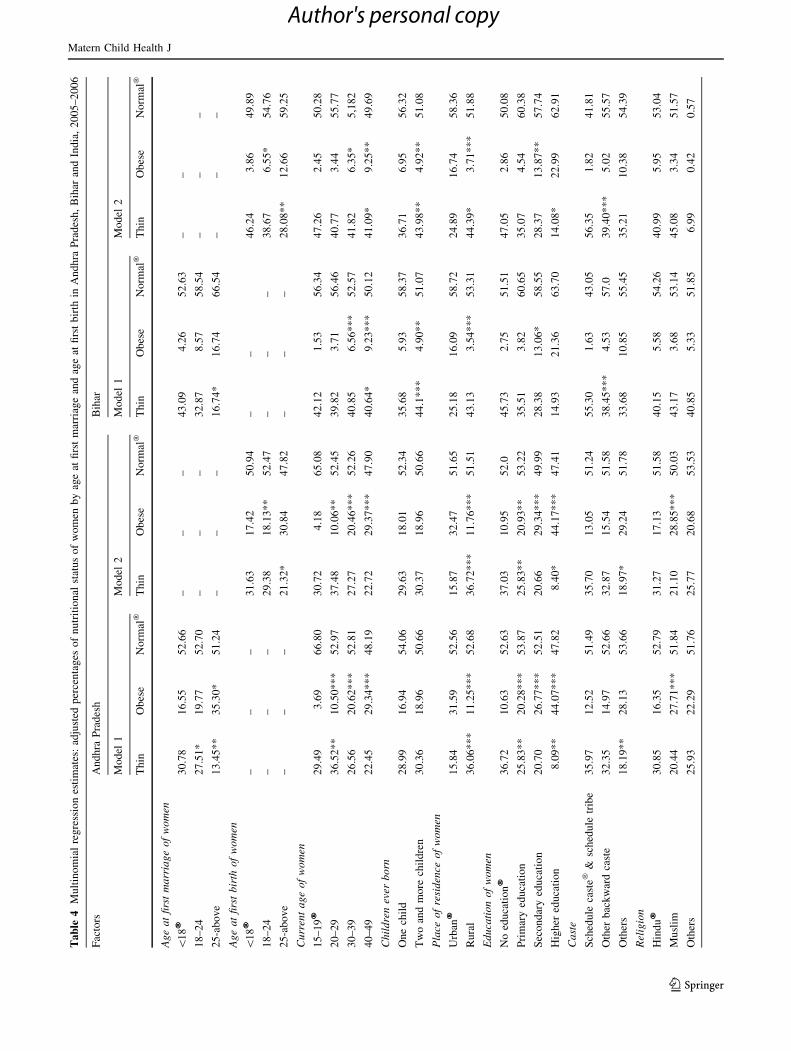
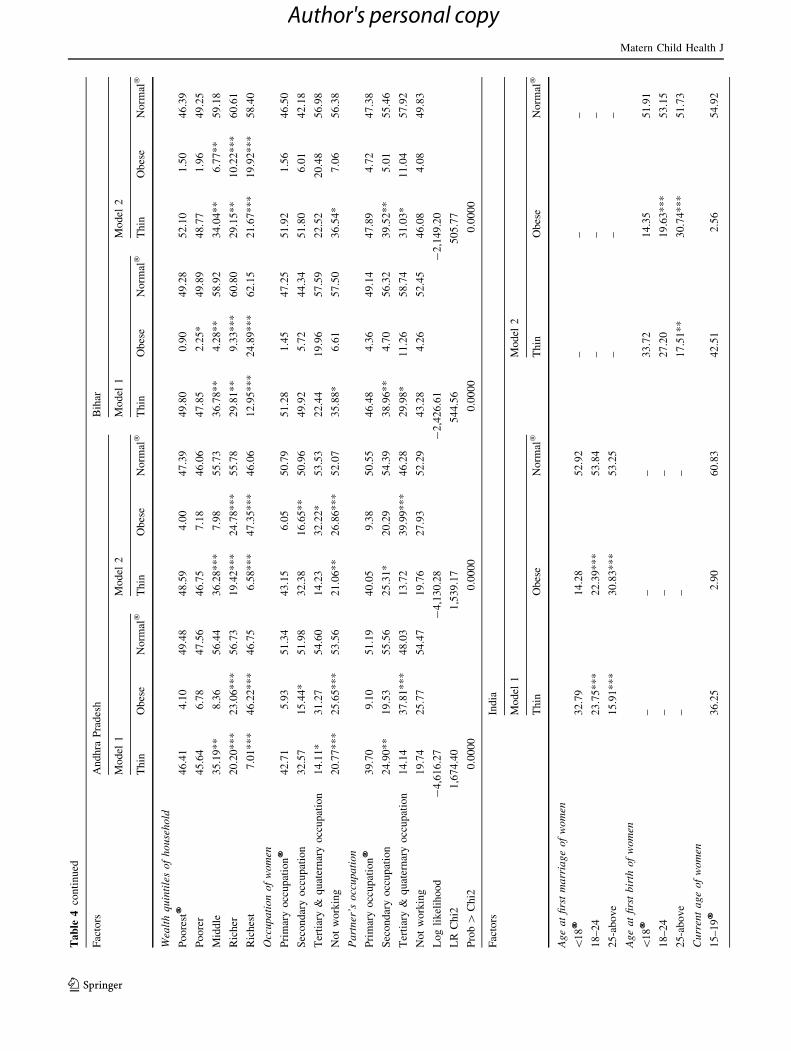
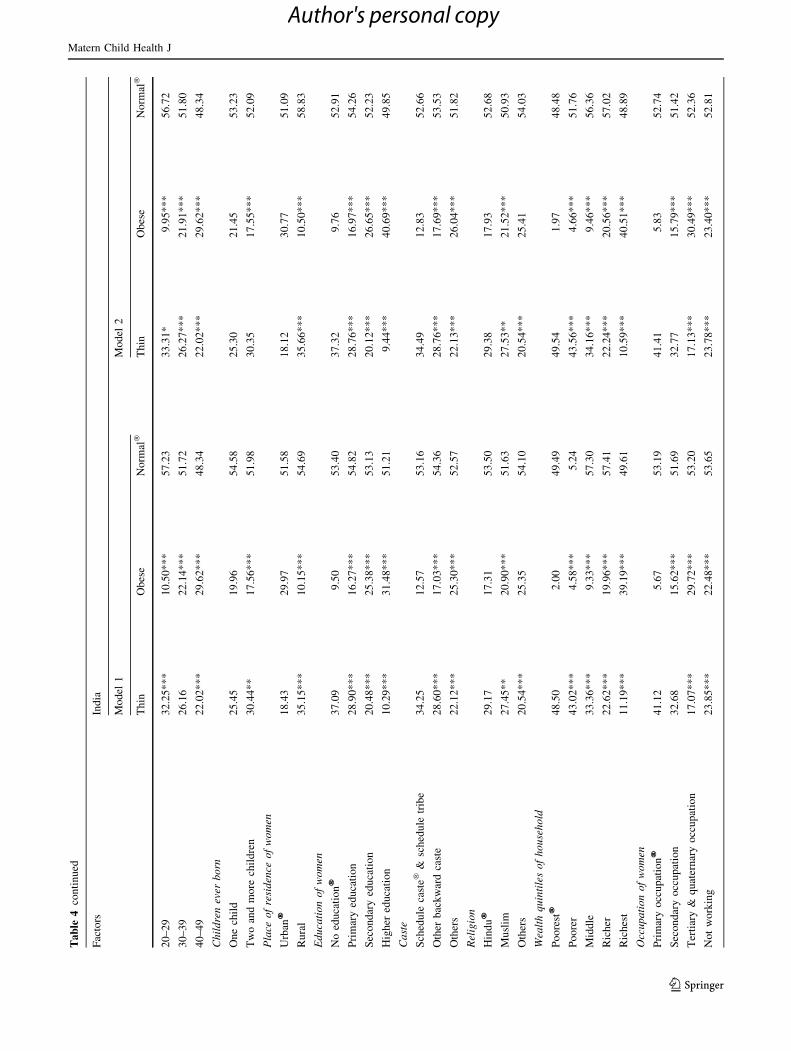
Table 4 presents the adjusted percentage of nutritional
status of the currently married women by age at marriage
and age at first birth estimated from multinomial regression
and MCA table. To avoid collinearity between the vari-
ables—age at first marriage and age at first birth, we pre-
sented estimates in two models. In model 1, we have
included only age at marriage as predictor along with other
respondents’ socioeconomic characteristics as control
variables. In model 2, we have included age at first birth as
predictor along with other background characteristics as
control variables. The results in model 1 indicated that
even after adjusting for socioeconomic background,
women who married below the age of 18 years were more
likely to be found in the ‘thin category’ across all our
samples, Andhra Pradesh (31 %), Bihar (43 %) and in
India (33 %), relative to those who were married at later
ages. The percent gap in terms of undernourishment among
women married before 18 years compared to women
married at age 25 years and above was nearly 2.5 times
(p \ 0.01) higher in Andhra Pradesh and Bihar, and 2
times (p \ 0.01) higher in India. Similarly, the results
presented in model 2 revealed that after controlling for
socioeconomic factors, women whose first birth was before
18 years of age showed considerably high undernourish-
ment in Andhra Pradesh (32 %), Bihar (46 %) and India
(34 %) in comparison with women married in higher age
groups. The proportion of thin women were significantly
lower in the age group 25 and above in the selected states,
Andhra Pradesh (21 %, p \ 0.05) and Bihar (26.8 %,
p \ 0.01) and in India (20.3 %, p \ 0.01). Among other
socioeconomic predictors, no or low levels of education of
women, poor economic status and rural place of residence
emerged as significant factors associated with poor nutri-
tional status in women.
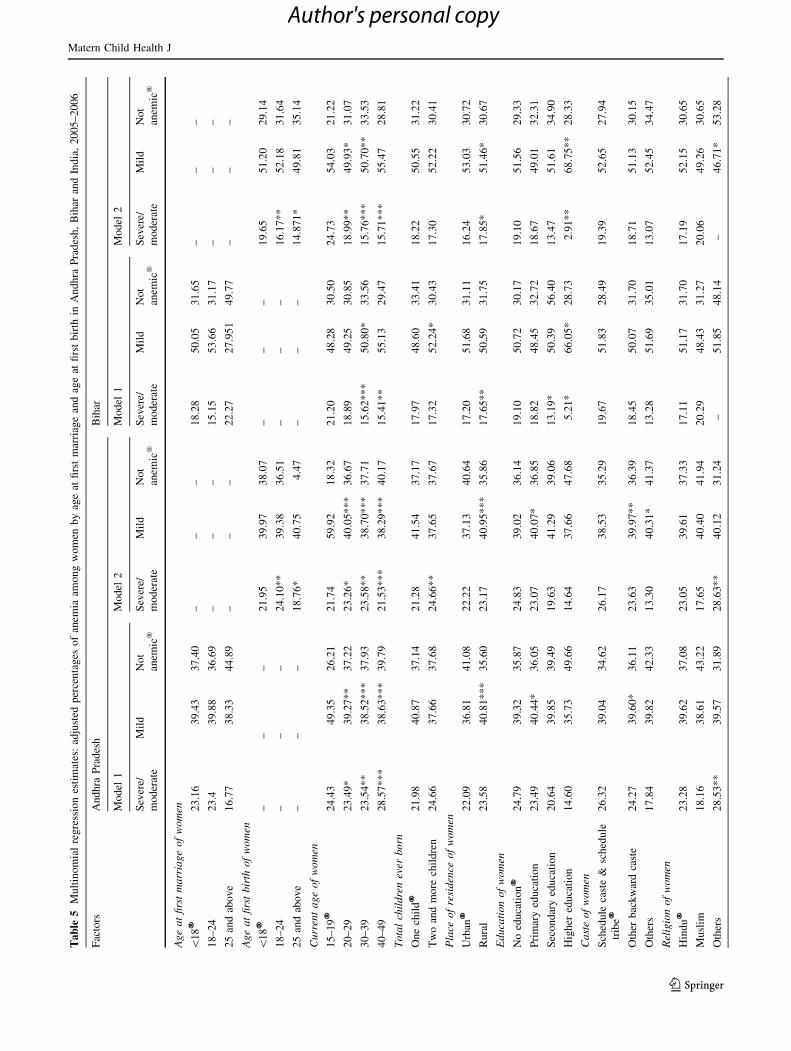
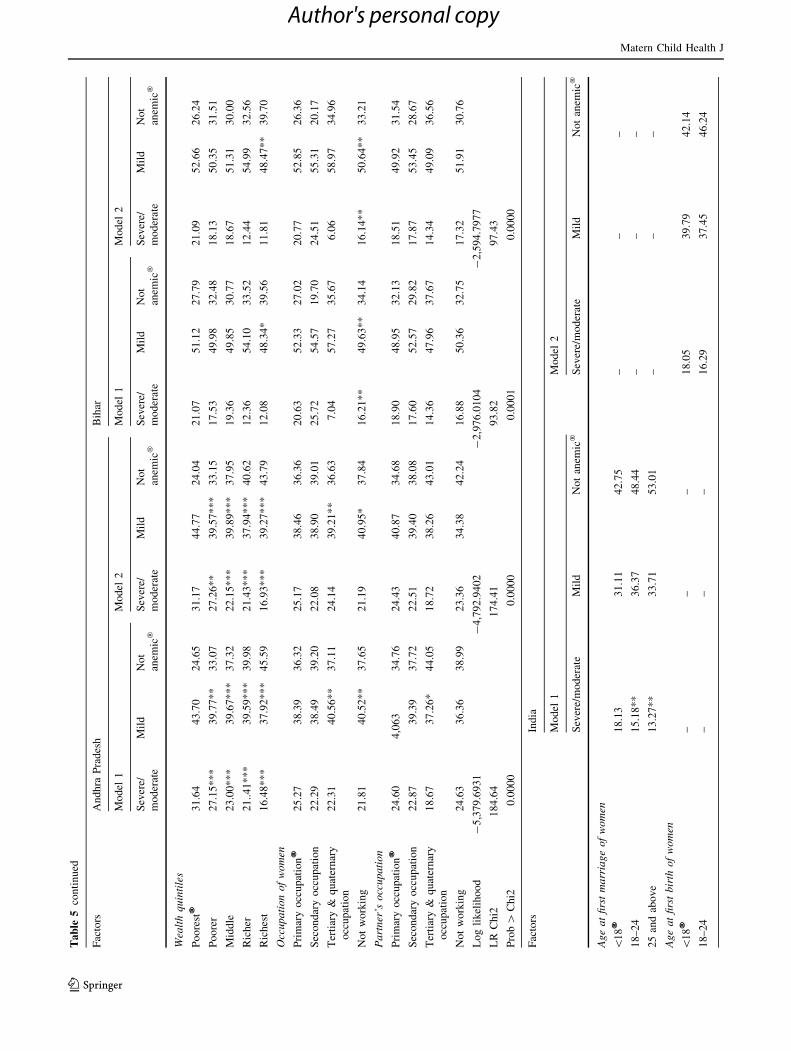
Table 5 presents the adjusted percentages of anemia
levels among currently married women by age at marriage
and age at first birth. The results showed that after con-
trolling for other factors the net prevalence of severe/
moderate anemia was higher among women whose age at
marriage was \18 years in Andhra Pradesh (23 %), Bihar
(20 %) and overall India (18 %) than women married in
higher age groups. The pattern of the likelihood of a
woman being severe/moderate anemia showed a consistent
decrease with an increase in age at marriage in all three
sample population but it was statistically significant only in
Bihar and India. Furthermore, Table 5 showed the net
effect of the women’s age at first birth on anemia level
after controlling for other factors. The results revealed that
in comparison with women whose first birth was in higher
age groups, those who had their first birth at age below
18 years have significantly higher percentages of severe/
moderate anemia in Andhra Pradesh (21 %), Bihar (20 %)
and in India (18 %). In Andhra Pradesh, Bihar and India,
there was a consistent decline in the level of severe/mod-
erate anemia with an increase in age at first birth and such
pattern was statistically significant across the three sample
population. In case of anemia, age at first birth shows
greater effect than age at first marriage. Apart from age at
first marriage and age at first birth, economic status and
current age were the significant predictors of women’s
anemic status in India and two selected states.
Discussion
Our study made a comprehensive analytical assessment of
the role of early marriage and early childbirth on the
nutritional status of women in India, with a particular focus
on the two states Andhra Pradesh and Bihar, which account
for the lowest age at marriage and age at first birth in India.
Our findings revealed that although the legal age at mar-
riage (18 years) for girls was institutionalized six decades
back, a substantial number of women were married before
18 years and thereby exposed to early pregnancy. Our
results suggest a large adverse effect of early marriages and
early childbearing on the nutritional status of women in
India and for our selected states. A large proportion of
women who were married before the legal at age at mar-
riage and consequently exposed to early pregnancy, were
found to be undernourished (thin) relative to women who
were married at later ages. The analyses also show that
across all our models, women who married at 25 years and
above had the highest likelihood of having normal nutri-
tional status. Similar results were also found with regards
to the prevalence of anemia among women both for the
All-India sample and for two selected states. In particular,
women who married and gave birth in higher age groups
had better nutritional and hemoglobin status. Consistent
with other studies [6, 9–12, 30] which documented the
effect of socioeconomic status on nutritional status of
women, this study also suggests that undernourished (thin)
women and anemia varies considerably by current age,
place of residence, level of education and economic status
of the household. Thin and anemic women are typically
Matern Child Health J
123
Author's personal copy
Ta
ble
4M
ult
ino
mia
lre
gre
ssio
nes
tim
ates
:ad
just
edp
erce
nta
ges
of
nu
trit
ion
alst
atu
so
fw
om
enb
yag
eat
firs
tm
arri
age
and
age
atfi
rst
bir
thin
An
dh
raP
rad
esh,
Bih
aran
dIn
dia
,2
00
5–
20
06
Fac
tors
An
dh
raP
rad
esh
Bih
ar
Mo
del
1M
od
el2
Mo
del
1M
od
el2
Th
inO
bes
eN
orm
al�
Th
inO
bes
eN
orm
al�
Th
inO
bes
eN
orm
al�
Th
inO
bes
eN
orm
al�
Ag
ea
tfi
rst
ma
rria
ge
of
wo
men
\1
8�
30
.78
16
.55
52
.66
––
–4
3.0
94
.26
52
.63
––
18
–2
42
7.5
1*
19
.77
52
.70
––
–3
2.8
78
.57
58
.54
––
–
25
-ab
ov
e1
3.4
5*
*3
5.3
0*
51
.24
––
–1
6.7
4*
16
.74
66
.54
––
–
Ag
ea
tfi
rst
bir
tho
fw
om
en
\1
8�
––
–3
1.6
31
7.4
25
0.9
4–
–4
6.2
43
.86
49
.89
18
–2
4–
––
29
.38
18
.13
**
52
.47
––
–3
8.6
76
.55
*5
4.7
6
25
-ab
ov
e–
––
21
.32
*3
0.8
44
7.8
2–
––
28
.08
**
12
.66
59
.25
Cu
rren
ta
ge
of
wo
men
15
–1
9�
29
.49
3.6
96
6.8
03
0.7
24
.18
65
.08
42
.12
1.5
35
6.3
44
7.2
62
.45
50
.28
20
–2
93
6.5
2*
*1
0.5
0*
**
52
.97
37
.48
10
.06
**
52
.45
39
.82
3.7
15
6.4
64
0.7
73
.44
55
.77
30
–3
92
6.5
62
0.6
2*
**
52
.81
27
.27
20
.46
**
*5
2.2
64
0.8
56
.56
**
*5
2.5
74
1.8
26
.35
*5
,18
2
40
–4
92
2.4
52
9.3
4*
**
48
.19
22
.72
29
.37
**
*4
7.9
04
0.6
4*
9.2
3*
**
50
.12
41
.09
*9
.25
**
49
.69
Ch
ild
ren
ever
bo
rn
On
ech
ild
28
.99
16
.94
54
.06
29
.63
18
.01
52
.34
35
.68
5.9
35
8.3
73
6.7
16
.95
56
.32
Tw
oan
dm
ore
chil
dre
n3
0.3
61
8.9
65
0.6
63
0.3
71
8.9
65
0.6
64
4.1
**
*4
.90
**
51
.07
43
.98
**
4.9
2*
*5
1.0
8
Pla
ceo
fre
sid
ence
of
wo
men
Urb
an�
15
.84
31
.59
52
.56
15
.87
32
.47
51
.65
25
.18
16
.09
58
.72
24
.89
16
.74
58
.36
Ru
ral
36
.06
**
*1
1.2
5*
**
52
.68
36
.72
**
*1
1.7
6*
**
51
.51
43
.13
3.5
4*
**
53
.31
44
.39
*3
.71
**
*5
1.8
8
Ed
uca
tio
no
fw
om
en
No
edu
cati
on
�3
6.7
21
0.6
35
2.6
33
7.0
31
0.9
55
2.0
45
.73
2.7
55
1.5
14
7.0
52
.86
50
.08
Pri
mar
yed
uca
tio
n2
5.8
3*
*2
0.2
8*
**
53
.87
25
.83
**
20
.93
**
53
.22
35
.51
3.8
26
0.6
53
5.0
74
.54
60
.38
Sec
on
dar
yed
uca
tio
n2
0.7
02
6.7
7*
**
52
.51
20
.66
29
.34
**
*4
9.9
92
8.3
81
3.0
6*
58
.55
28
.37
13
.87
**
57
.74
Hig
her
edu
cati
on
8.0
9*
*4
4.0
7*
**
47
.82
8.4
0*
44
.17
**
*4
7.4
11
4.9
32
1.3
66
3.7
01
4.0
8*
22
.99
62
.91
Ca
ste
Sch
edu
leca
ste�
&sc
hed
ule
trib
e3
5.9
71
2.5
25
1.4
93
5.7
01
3.0
55
1.2
45
5.3
01
.63
43
.05
56
.35
1.8
24
1.8
1
Oth
erb
ack
war
dca
ste
32
.35
14
.97
52
.66
32
.87
15
.54
51
.58
38
.45
**
*4
.53
57
.03
9.4
0*
**
5.0
25
5.5
7
Oth
ers
18
.19
**
28
.13
53
.66
18
.97
*2
9.2
45
1.7
83
3.6
81
0.8
55
5.4
53
5.2
11
0.3
85
4.3
9
Rel
igio
n
Hin
du
�3
0.8
51
6.3
55
2.7
93
1.2
71
7.1
35
1.5
84
0.1
55
.58
54
.26
40
.99
5.9
55
3.0
4
Mu
slim
20
.44
27
.71
**
*5
1.8
42
1.1
02
8.8
5*
**
50
.03
43
.17
3.6
85
3.1
44
5.0
83
.34
51
.57
Oth
ers
25
.93
22
.29
51
.76
25
.77
20
.68
53
.53
40
.85
5.3
35
1.8
56
.99
0.4
20
.57
Matern Child Health J
123
Author's personal copy
Ta
ble
4co
nti
nu
ed
Fac
tors
An
dh
raP
rad
esh
Bih
ar
Mo
del
1M
od
el2
Mo
del
1M
od
el2
Th
inO
bes
eN
orm
al�
Th
inO
bes
eN
orm
al�
Th
inO
bes
eN
orm
al�
Th
inO
bes
eN
orm
al�
Wea
lth
qu
inti
les
of
ho
use
ho
ld
Po
ore
st�
46
.41
4.1
04
9.4
84
8.5
94
.00
47
.39
49
.80
0.9
04
9.2
85
2.1
01
.50
46
.39
Po
ore
r4
5.6
46
.78
47
.56
46
.75
7.1
84
6.0
64
7.8
52
.25
*4
9.8
94
8.7
71
.96
49
.25
Mid
dle
35
.19
**
8.3
65
6.4
43
6.2
8*
**
7.9
85
5.7
33
6.7
8*
*4
.28
**
58
.92
34
.04
**
6.7
7*
*5
9.1
8
Ric
her
20
.20
**
*2
3.0
6*
**
56
.73
19
.42
**
*2
4.7
8*
**
55
.78
29
.81
**
9.3
3*
**
60
.80
29
.15
**
10
.22
**
*6
0.6
1
Ric
hes
t7
.01
**
*4
6.2
2*
**
46
.75
6.5
8*
**
47
.35
**
*4
6.0
61
2.9
5*
**
24
.89
**
*6
2.1
52
1.6
7*
**
19
.92
**
*5
8.4
0
Occ
up
ati
on
of
wo
men
Pri
mar
yo
ccu
pat
ion
�4
2.7
15
.93
51
.34
43
.15
6.0
55
0.7
95
1.2
81
.45
47
.25
51
.92
1.5
64
6.5
0
Sec
on
dar
yo
ccu
pat
ion
32
.57
15
.44
*5
1.9
83
2.3
81
6.6
5*
*5
0.9
64
9.9
25
.72
44
.34
51
.80
6.0
14
2.1
8
Ter
tiar
y&
qu
ater
nar
yo
ccu
pat
ion
14
.11
*3
1.2
75
4.6
01
4.2
33
2.2
2*
53
.53
22
.44
19
.96
57
.59
22
.52
20
.48
56
.98
No
tw
ork
ing
20
.77
**
*2
5.6
5*
**
53
.56
21
.06
**
26
.86
**
*5
2.0
73
5.8
8*
6.6
15
7.5
03
6.5
4*
7.0
65
6.3
8
Pa
rtn
er’s
occ
up
ati
on
Pri
mar
yo
ccu
pat
ion
�3
9.7
09
.10
51
.19
40
.05
9.3
85
0.5
54
6.4
84
.36
49
.14
47
.89
4.7
24
7.3
8
Sec
on
dar
yo
ccu
pat
ion
24
.90
**
19
.53
55
.56
25
.31
*2
0.2
95
4.3
93
8.9
6*
*4
.70
56
.32
39
.52
**
5.0
15
5.4
6
Ter
tiar
y&
qu
ater
nar
yo
ccu
pat
ion
14
.14
37
.81
**
*4
8.0
31
3.7
23
9.9
9*
**
46
.28
29
.98
*1
1.2
65
8.7
43
1.0
3*
11
.04
57
.92
No
tw
ork
ing
19
.74
25
.77
54
.47
19
.76
27
.93
52
.29
43
.28
4.2
65
2.4
54
6.0
84
.08
49
.83
Lo
gli
kel
iho
od
-4
,61
6.2
7-
4,1
30
.28
-2
,42
6.6
1-
2,1
49
.20
LR
Ch
i21
,67
4.4
01
,53
9.1
75
44
.56
50
5.7
7
Pro
b[
Ch
i20
.00
00
0.0
00
00
.00
00
0.0
00
0
Fac
tors
Ind
ia
Mo
del
1M
od
el2
Th
inO
bes
eN
orm
al�
Th
inO
bes
eN
orm
al�
Ag
ea
tfi
rst
ma
rria
ge
of
wo
men
\1
8�
32
.79
14
.28
52
.92
––
–
18
–2
42
3.7
5*
**
22
.39
**
*5
3.8
4–
––
25
-ab
ov
e1
5.9
1*
**
30
.83
**
*5
3.2
5–
––
Ag
ea
tfi
rst
bir
tho
fw
om
en
\1
8�
––
–3
3.7
21
4.3
55
1.9
1
18
–2
4–
––
27
.20
19
.63
**
*5
3.1
5
25
-ab
ov
e–
––
17
.51
**
30
.74
**
*5
1.7
3
Cu
rren
ta
ge
of
wo
men
15
–1
9�
36
.25
2.9
06
0.8
34
2.5
12
.56
54
.92
Matern Child Health J
123
Author's personal copy
Ta
ble
4co
nti
nu
ed
Fac
tors
Ind
ia
Mo
del
1M
od
el2
Th
inO
bes
eN
orm
al�
Th
inO
bes
eN
orm
al�
20
–2
93
2.2
5*
**
10
.50
**
*5
7.2
33
3.3
1*
9.9
5*
**
56
.72
30
–3
92
6.1
62
2.1
4*
**
51
.72
26
.27
**
*2
1.9
1*
**
51
.80
40
–4
92
2.0
2*
**
29
.62
**
*4
8.3
42
2.0
2*
**
29
.62
**
*4
8.3
4
Ch
ild
ren
ever
bo
rn
On
ech
ild
25
.45
19
.96
54
.58
25
.30
21
.45
53
.23
Tw
oan
dm
ore
chil
dre
n3
0.4
4*
*1
7.5
6*
**
51
.98
30
.35
17
.55
**
*5
2.0
9
Pla
ceo
fre
sid
ence
of
wo
men
Urb
an�
18
.43
29
.97
51
.58
18
.12
30
.77
51
.09
Ru
ral
35
.15
**
*1
0.1
5*
**
54
.69
35
.66
**
*1
0.5
0*
**
58
.83
Ed
uca
tio
no
fw
om
en
No
edu
cati
on
�3
7.0
99
.50
53
.40
37
.32
9.7
65
2.9
1
Pri
mar
yed
uca
tio
n2
8.9
0*
**
16
.27
**
*5
4.8
22
8.7
6*
**
16
.97
**
*5
4.2
6
Sec
on
dar
yed
uca
tio
n2
0.4
8*
**
25
.38
**
*5
3.1
32
0.1
2*
**
26
.65
**
*5
2.2
3
Hig
her
edu
cati
on
10
.29
**
*3
1.4
8*
**
51
.21
9.4
4*
**
40
.69
**
*4
9.8
5
Ca
ste
Sch
edu
leca
ste�
&sc
hed
ule
trib
e3
4.2
51
2.5
75
3.1
63
4.4
91
2.8
35
2.6
6
Oth
erb
ack
war
dca
ste
28
.60
**
*1
7.0
3*
**
54
.36
28
.76
**
*1
7.6
9*
**
53
.53
Oth
ers
22
.12
**
*2
5.3
0*
**
52
.57
22
.13
**
*2
6.0
4*
**
51
.82
Rel
igio
n
Hin
du
�2
9.1
71
7.3
15
3.5
02
9.3
81
7.9
35
2.6
8
Mu
slim
27
.45
**
20
.90
**
*5
1.6
32
7.5
3*
*2
1.5
2*
**
50
.93
Oth
ers
20
.54
**
*2
5.3
55
4.1
02
0.5
4*
**
25
.41
54
.03
Wea
lth
qu
inti
les
of
ho
use
ho
ld
Po
ore
st�
48
.50
2.0
04
9.4
94
9.5
41
.97
48
.48
Po
ore
r4
3.0
2*
**
4.5
8*
**
5.2
44
3.5
6*
**
4.6
6*
**
51
.76
Mid
dle
33
.36
**
*9
.33
**
*5
7.3
03
4.1
6*
**
9.4
6*
**
56
.36
Ric
her
22
.62
**
*1
9.9
6*
**
57
.41
22
.24
**
*2
0.5
6*
**
57
.02
Ric
hes
t1
1.1
9*
**
39
.19
**
*4
9.6
11
0.5
9*
**
40
.51
**
*4
8.8
9
Occ
up
ati
on
of
wo
men
Pri
mar
yo
ccu
pat
ion
�4
1.1
25
.67
53
.19
41
.41
5.8
35
2.7
4
Sec
on
dar
yo
ccu
pat
ion
32
.68
15
.62
**
*5
1.6
93
2.7
71
5.7
9*
**
51
.42
Ter
tiar
y&
qu
ater
nar
yo
ccu
pat
ion
17
.07
**
*2
9.7
2*
**
53
.20
17
.13
**
*3
0.4
9*
**
52
.36
No
tw
ork
ing
23
.85
**
*2
2.4
8*
**
53
.65
23
.78
**
*2
3.4
0*
**
52
.81
Matern Child Health J
123
Author's personal copy

from rural areas, illiterate and from poor economic status
households.
In conclusion, we found that despite a rapid decline in
fertility, a substantial proportion of women continue to
marry and have a first birth at ages below 18. This indi-
cates no major transition in age at marriage and age at first
birth in India. Even, in the state like Andhra Pradesh,
where the TFR (1.7 per women) is well below the
replacement level [12], a high prevalence of early mar-
riages and early childbearing persists. As expected, in high
fertility states like Bihar, the age at marriage and age at
first birth is very low. This pattern of marriage and
childbearing in India poses adverse consequences for
women’s nutritional status and anemia.
From a policy perspective, akin to the previous studies
[17–23, 27] which suggested shifting of age at marriage
and childbearing to ideal or peak ages (18–29 years) is
important for reproductive and child health benefits, we
suggest that it is even more important for improvement of
maternal and child nutrition status. A growing number of
studies documented that India has one of the highest rates
of prevalence of undernourishment and one of the lower
health care utilisation among adolescent women [28–42].
Further, if this effect is combined with the burden of
early marriage and childbirth, it makes the situation more
complex and worsens the progress in maternal and child
health [32, 33]. Thus, major steps need to be taken both
at the national level and in states to stop early marriages
and the consequent high adolescent pregnancies. In rec-
ognition of the scale of the problem, the Government of
India and state governments with technical support from
UNICEF and partners have been implementing for over a
decade the adolescent girls anemia control programme.
However, India needs to strengthen its multi-sectoral
program to address maternal undernutrition. Along with
ongoing direct and indirect flagship social welfare,
women and child welfare and nutritional and health
programmes [viz. public distribution system (PDS), Mid-
Day Meal (MDM), Total Sanitation Campaign (TSC),
National Nutrition Mission (NNM), National Policy for
Women Empowerment, the National Health Mission
(NHM), Mahatma Gandhi National Rural Employment
Guarantee Scheme (MGNREGA)], targeted interventions
to tackle the early marriages, adolescent pregnancies and
nutritional problems of adolescents girls to improve
nutritional status and health care utilisation among
women is critical. Strengthening of ongoing conditional
cash transfers programs to girl children and prevention of
leakages in it will help to improve their status in many
ways. Experiences from various countries (Brazil,
Columbia, Mexico and Nicaragua) illustrate that the
conditional cash transfer programmes were successful in
increasing enrolment in school and raising girl childTa
ble
4co
nti
nu
ed
Fac
tors
Ind
ia
Mo
del
1M
od
el2
Th
inO
bes
eN
orm
al�
Th
inO
bes
eN
orm
al�
Pa
rtn
er’s
occ
up
ati
on
Pri
mar
yo
ccu
pat
ion
�3
7.9
88
.46
53
.55
38
.45
8.7
05
2.8
4
Sec
on
dar
yo
ccu
pat
ion
27
.67
18
.62
**
*5
3.6
92
7.7
51
9.1
9*
**
53
.05
Ter
tiar
y&
qu
ater
nar
yo
ccu
pat
ion
16
.62
**
*3
1.0
0*
**
52
.37
16
.31
**
*3
2.0
3*
*5
1.6
5
No
tw
ork
ing
25
.61
21
.28
53
.09
25
.70
22
.40
51
.89
Lo
gli
kel
iho
od
-7
8,0
57
.4-
70
,74
0.9
2
LR
Ch
i22
1,2
96
.65
19
,92
5.1
7
Pro
b[
Ch
i20
.00
00
0.0
00
0
Sig
nifi
can
cele
vel
s:*
**
p\
0.0
01
,*
*p\
0.0
1,
*p\
0.0
5�
-Ref
eren
ceca
teg
ory
Matern Child Health J
123
Author's personal copy
Ta
ble
5M
ult
ino
mia
lre
gre
ssio
nes
tim
ates
:ad
just
edp
erce
nta
ges
of
anem
iaam
on
gw
om
enb
yag
eat
firs
tm
arri
age
and
age
atfi
rst
bir
thin
An
dh
raP
rad
esh
,B
ihar
and
Ind
ia,
20
05
–2
00
6
Fac
tors
An
dh
raP
rad
esh
Bih
ar
Mo
del
1M
od
el2
Mo
del
1M
od
el2
Sev
ere/
mo
der
ate
Mil
dN
ot
anem
ic�
Sev
ere/
mo
der
ate
Mil
dN
ot
anem
ic�
Sev
ere/
mo
der
ate
Mil
dN
ot
anem
ic�
Sev
ere/
mo
der
ate
Mil
dN
ot
anem
ic�
Ag
ea
tfi
rst
ma
rria
ge
of
wo
men
\1
8�
23
.16
39
.43
37
.40
––
–1
8.2
85
0.0
53
1.6
5–
––
18
–2
42
3.4
39
.88
36
.69
––
–1
5.1
55
3.6
63
1.1
7–
––
25
and
abo
ve
16
.77
38
.33
44
.89
––
–2
2.2
72
7.9
51
49
.77
––
–
Ag
ea
tfi
rst
bir
tho
fw
om
en
\1
8�
––
–2
1.9
53
9.9
73
8.0
7–
––
19
.65
51
.20
29
.14
18
–2
4–
––
24
.10
**
39
.38
36
.51
––
–1
6.1
7*
*5
2.1
83
1.6
4
25
and
abo
ve
––
–1
8.7
6*
40
.75
4.4
7–
––
14
.87
1*
49
.81
35
.14
Cu
rren
ta
ge
of
wo
men
15
–1
9�
24
.43
49
.35
26
.21
21
.74
59
.92
18
.32
21
.20
48
.28
30
.50
24
.73
54
.03
21
.22
20
–2
92
3.4
9*
39
.27
**
37
.22
23
.26
*4
0.0
5*
**
36
.67
18
.89
49
.25
30
.85
18
.99
**
49
.93
*3
1.0
7
30
–3
92
3.5
4*
*3
8.5
2*
**
37
.93
23
.58
**
38
.70
**
*3
7.7
11
5.6
2*
**
50
.80
*3
3.5
61
5.7
6*
**
50
.70
**
33
.53
40
–4
92
8.5
7*
**
38
.63
**
*3
9.7
92
1.5
3*
**
38
.29
**
*4
0.1
71
5.4
1*
*5
5.1
32
9.4
71
5.7
1*
**
55
.47
28
.81
To
tal
chil
dre
nev
erb
orn
On
ech
ild
�2
1.9
84
0.8
73
7.1
42
1.2
84
1.5
43
7.1
71
7.9
74
8.6
03
3.4
11
8.2
25
0.5
53
1.2
2
Tw
oan
dm
ore
chil
dre
n2
4.6
63
7.6
63
7.6
82
4.6
6*
*3
7.6
53
7.6
71
7.3
25
2.2
4*
30
.43
17
.30
52
.22
30
.41
Pla
ceo
fre
sid
ence
of
wo
men
Urb
an�
22
.09
36
.81
41
.08
22
.22
37
.13
40
.64
17
.20
51
.68
31
.11
16
.24
53
.03
30
.72
Ru
ral
23
.58
40
.81
**
*3
5.6
02
3.1
74
0.9
5*
**
35
.86
17
.65
**
50
.59
31
.75
17
.85
*5
1.4
6*
30
.67
Ed
uca
tio
no
fw
om
en
No
edu
cati
on
�2
4.7
93
9.3
23
5.8
72
4.8
33
9.0
23
6.1
41
9.1
05
0.7
23
0.1
71
9.1
05
1.5
62
9.3
3
Pri
mar
yed
uca
tio
n2
3.4
94
0.4
4*
36
.05
23
.07
40
.07
*3
6.8
51
8.8
24
8.4
53
2.7
21
8.6
74
9.0
13
2.3
1
Sec
on
dar
yed
uca
tio
n2
0.6
43
9.8
53
9.4
91
9.6
34
1.2
93
9.0
61
3.1
9*
50
.39
56
.40
13
.47
51
.61
34
.90
Hig
her
edu
cati
on
14
.60
35
.73
49
.66
14
.64
37
.66
47
.68
5.2
1*
66
.05
*2
8.7
32
.91
**
68
.75
**
28
.33
Ca
ste
of
wo
men
Sch
edu
leca
ste
&sc
hed
ule
trib
e�2
6.3
23
9.0
43
4.6
22
6.1
73
8.5
33
5.2
91
9.6
75
1.8
32
8.4
91
9.3
95
2.6
52
7.9
4
Oth
erb
ack
war
dca
ste
24
.27
39
.60
*3
6.1
12
3.6
33
9.9
7*
*3
6.3
91
8.4
55
0.0
73
1.7
01
8.7
15
1.1
33
0.1
5
Oth
ers
17
.84
39
.82
42
.33
13
.30
40
.31
*4
1.3
71
3.2
85
1.6
93
5.0
11
3.0
75
2.4
53
4.4
7
Rel
igio
no
fw
om
en
Hin
du
�2
3.2
83
9.6
23
7.0
82
3.0
53
9.6
13
7.3
31
7.1
15
1.1
73
1.7
01
7.1
95
2.1
53
0.6
5
Mu
slim
18
.16
38
.61
43
.22
17
.65
40
.40
41
.94
20
.29
48
.43
31
.27
20
.06
49
.26
30
.65
Oth
ers
28
.53
**
39
.57
31
.89
28
.63
**
40
.12
31
.24
–5
1.8
54
8.1
4–
46
.71
*5
3.2
8
Matern Child Health J
123
Author's personal copy
Ta
ble
5co
nti
nu
ed
Fac
tors
An
dh
raP
rad
esh
Bih
ar
Mo
del
1M
od
el2
Mo
del
1M
od
el2
Sev
ere/
mo
der
ate
Mil
dN
ot
anem
ic�
Sev
ere/
mo
der
ate
Mil
dN
ot
anem
ic�
Sev
ere/
mo
der
ate
Mil
dN
ot
anem
ic�
Sev
ere/
mo
der
ate
Mil
dN
ot
anem
ic�
Wea
lth
qu
inti
les
Po
ore
st�
31
.64
43
.70
24
.65
31
.17
44
.77
24
.04
21
.07
51
.12
27
.79
21
.09
52
.66
26
.24
Po
ore
r2
7.1
5*
**
39
.77
**
33
.07
27
.26
**
39
.57
**
*3
3.1
51
7.5
34
9.9
83
2.4
81
8.1
35
0.3
53
1.5
1
Mid
dle
23
.00
**
*3
9.6
7*
**
37
.32
22
.15
**
*3
9.8
9*
**
37
.95
19
.36
49
.85
30
.77
18
.67
51
.31
30
.00
Ric
her
21
..4
1*
**
39
.59
**
*3
9.9
82
1.4
3*
**
37
.94
**
*4
0.6
21
2.3
65
4.1
03
3.5
21
2.4
45
4.9
93
2.5
6
Ric
hes
t1
6.4
8*
**
37
.92
**
*4
5.5
91
6.9
3*
**
39
.27
**
*4
3.7
91
2.0
84
8.3
4*
39
.56
11
.81
48
.47
**
39
.70
Occ
up
ati
on
of
wo
men
Pri
mar
yo
ccu
pat
ion
�2
5.2
73
8.3
93
6.3
22
5.1
73
8.4
63
6.3
62
0.6
35
2.3
32
7.0
22
0.7
75
2.8
52
6.3
6
Sec
on
dar
yo
ccu
pat
ion
22
.29
38
.49
39
.20
22
.08
38
.90
39
.01
25
.72
54
.57
19
.70
24
.51
55
.31
20
.17
Ter
tiar
y&
qu
ater
nar
y
occ
up
atio
n
22
.31
40
.56
**
37
.11
24
.14
39
.21
**
36
.63
7.0
45
7.2
73
5.6
76
.06
58
.97
34
.96
No
tw
ork
ing
21
.81
40
.52
**
37
.65
21
.19
40
.95
*3
7.8
41
6.2
1*
*4
9.6
3*
*3
4.1
41
6.1
4*
*5
0.6
4*
*3
3.2
1
Pa
rtn
er’s
occ
up
ati
on
Pri
mar
yo
ccu
pat
ion
�2
4.6
04
,06
33
4.7
62
4.4
34
0.8
73
4.6
81
8.9
04
8.9
53
2.1
31
8.5
14
9.9
23
1.5
4
Sec
on
dar
yo
ccu
pat
ion
22
.87
39
.39
37
.72
22
.51
39
.40
38
.08
17
.60
52
.57
29
.82
17
.87
53
.45
28
.67
Ter
tiar
y&
qu
ater
nar
y
occ
up
atio
n
18
.67
37
.26
*4
4.0
51
8.7
23
8.2
64
3.0
11
4.3
64
7.9
63
7.6
71
4.3
44
9.0
93
6.5
6
No
tw
ork
ing
24
.63
36
.36
38
.99
23
.36
34
.38
42
.24
16
.88
50
.36
32
.75
17
.32
51
.91
30
.76
Lo
gli
kel
iho
od
-5
,37
9.6
93
1-
4,7
92
.94
02
-2
,97
6.0
10
4-
2,5
94
.79
77
LR
Ch
i21
84
.64
17
4.4
19
3.8
29
7.4
3
Pro
b[
Ch
i20
.00
00
0.0
00
00
.00
01
0.0
00
0
Fac
tors
Ind
ia
Mo
del
1M
od
el2
Sev
ere/
mo
der
ate
Mil
dN
ot
anem
ic�
Sev
ere/
mo
der
ate
Mil
dN
ot
anem
ic�
Ag
ea
tfi
rst
ma
rria
ge
of
wo
men
\1
8�
18
.13
31
.11
42
.75
––
–
18
–2
41
5.1
8*
*3
6.3
74
8.4
4–
––
25
and
abo
ve
13
.27
**
33
.71
53
.01
––
–
Ag
ea
tfi
rst
bir
tho
fw
om
en
\1
8�
––
–1
8.0
53
9.7
94
2.1
4
18
–2
4–
––
16
.29
37
.45
46
.24
Matern Child Health J
123
Author's personal copy

Ta
ble
5co
nti
nu
ed
Fac
tors
Ind
ia
Mo
del
1M
od
el2
Sev
ere/
mo
der
ate
Mil
dN
ot
anem
ic�
Sev
ere/
mo
der
ate
Mil
dN
ot
anem
ic�
25
and
abo
ve
––
–1
3.3
0*
*3
5.1
55
1.5
3
Cu
rren
ta
ge
of
wo
men
15
–1
9�
21
.41
40
.81
37
.76
23
.89
44
.92
31
.11
20
–2
91
7.8
4*
**
38
.01
**
*4
4.1
41
8.0
3*
**
38
.64
**
*4
3.3
4
30
–3
91
5.3
6*
**
36
.74
**
*4
7.9
01
5.3
0*
**
36
.92
**
*4
7.7
7
40
–4
91
5.3
8*
**
37
.53
**
*4
7.0
81
5.4
1*
**
37
.52
**
*4
7.0
5
To
tal
chil
dre
nev
erb
orn
On
ech
ild
�1
6.2
33
6.4
54
7.3
11
5.9
63
6.8
04
7.2
3
Tw
oan
dm
ore
chil
dre
n1
6.9
13
8.8
4*
**
44
.24
16
.91
*3
8.8
0*
**
44
.27
Pla
ceo
fre
sid
ence
of
wo
men
Urb
an�
15
.17
35
.49
49
.33
15
.03
35
.75
49
.21
Ru
ral
17
.63
**
*3
9.2
2*
*4
3.1
31
7.5
7*
39
.51
*4
2.9
0
Ed
uca
tio
no
fw
om
en
No
edu
cati
on
�1
9.0
64
0.0
54
0.8
71
8.9
64
0.0
94
0.9
3
Pri
mar
yed
uca
tio
n1
7.5
93
7.8
14
4.5
91
7.2
53
7.9
44
4.7
9
Sec
on
dar
yed
uca
tio
n1
5.1
1*
**
35
.84
**
49
.04
14
.86
36
.09
49
.04
Hig
her
edu
cati
on
9.2
7*
**
33
.31
**
*5
7.4
09
.33
34
.23
56
.42
Ca
ste
of
wo
men
Sch
edu
leca
ste
&sc
hed
ule
trib
e�1
9.7
93
9.0
74
1.1
31
9.5
73
9.0
84
1.3
3
Oth
erb
ack
war
dca
ste
16
.33
**
*3
7.6
6*
**
46
.00
16
.25
**
*3
7.9
6*
**
45
.78
Oth
ers
14
.21
**
*3
6.3
6*
**
49
.41
14
.18
**
*3
6.8
2*
**
48
.98
Rel
igio
no
fw
om
en
Hin
du
�1
6.5
33
8.4
54
5.0
11
6.4
23
8.7
24
4.8
5
Mu
slim
16
.65
*3
7.5
4*
**
45
.79
16
.57
38
.02
**
45
.39
Oth
ers
16
.64
**
*3
2.6
8*
**
50
.67
16
.59
**
*3
2.9
0*
**
50
.50
Wea
lth
qu
inti
les
Po
ore
st�
21
.53
43
.41
35
.04
21
.35
43
.96
34
.85
Po
ore
r1
9.5
3*
**
41
.20
**
*3
9.6
51
9.5
2*
**
41
.35
**
*3
9.1
2
Mid
dle
18
.23
**
*3
8.3
0*
**
43
.45
18
.17
**
*3
8.6
0*
**
43
.21
Ric
her
15
.88
**
*3
6.4
4*
**
47
.67
15
.68
**
*3
6.6
1*
**
47
.70
Ric
hes
t1
2.2
2*
**
33
.56
**
*5
4.2
11
2.1
8*
**
33
.85
**
*5
3.9
6
Occ
up
ati
on
of
wo
men
Pri
mar
yo
ccu
pat
ion
�1
9.4
13
9.2
14
1.3
71
9.1
73
9.4
04
1.4
2
Matern Child Health J
123
Author's personal copy
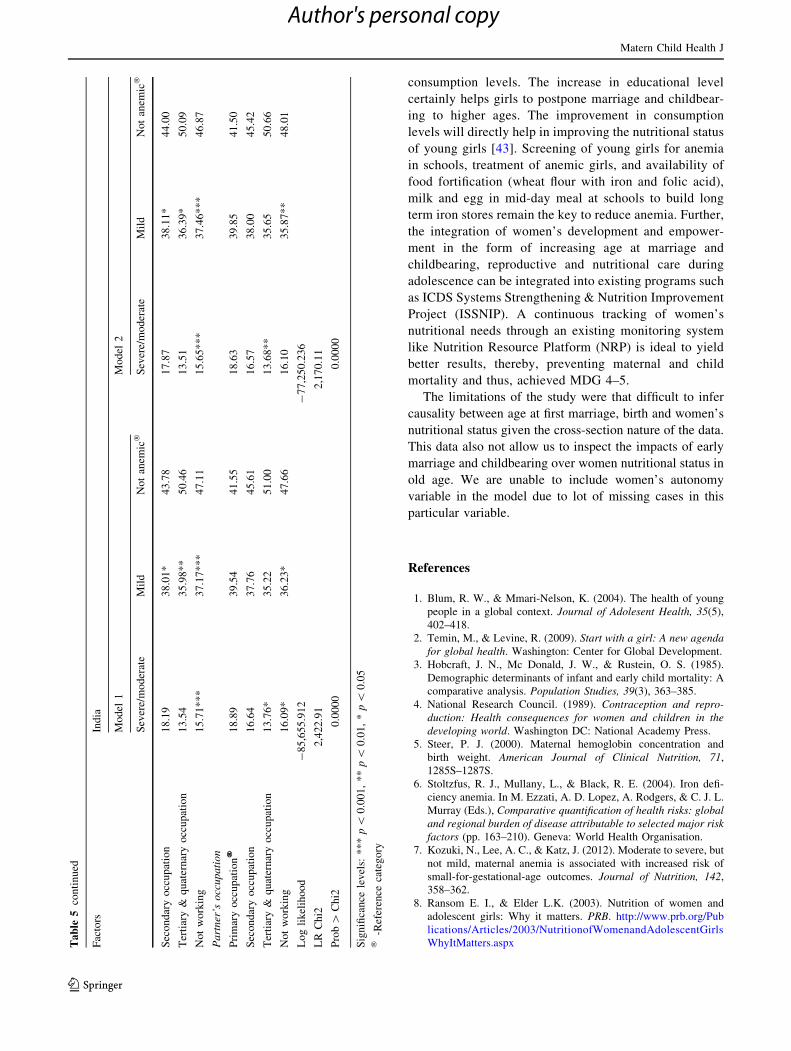
consumption levels. The increase in educational level
certainly helps girls to postpone marriage and childbear-
ing to higher ages. The improvement in consumption
levels will directly help in improving the nutritional status
of young girls [43]. Screening of young girls for anemia
in schools, treatment of anemic girls, and availability of
food fortification (wheat flour with iron and folic acid),
milk and egg in mid-day meal at schools to build long
term iron stores remain the key to reduce anemia. Further,
the integration of women’s development and empower-
ment in the form of increasing age at marriage and
childbearing, reproductive and nutritional care during
adolescence can be integrated into existing programs such
as ICDS Systems Strengthening & Nutrition Improvement
Project (ISSNIP). A continuous tracking of women’s
nutritional needs through an existing monitoring system
like Nutrition Resource Platform (NRP) is ideal to yield
better results, thereby, preventing maternal and child
mortality and thus, achieved MDG 4–5.
The limitations of the study were that difficult to infer
causality between age at first marriage, birth and women’s
nutritional status given the cross-section nature of the data.
This data also not allow us to inspect the impacts of early
marriage and childbearing over women nutritional status in
old age. We are unable to include women’s autonomy
variable in the model due to lot of missing cases in this
particular variable.
References
1. Blum, R. W., & Mmari-Nelson, K. (2004). The health of young
people in a global context. Journal of Adolesent Health, 35(5),
402–418.
2. Temin, M., & Levine, R. (2009). Start with a girl: A new agenda
for global health. Washington: Center for Global Development.
3. Hobcraft, J. N., Mc Donald, J. W., & Rustein, O. S. (1985).
Demographic determinants of infant and early child mortality: A
comparative analysis. Population Studies, 39(3), 363–385.
4. National Research Council. (1989). Contraception and repro-
duction: Health consequences for women and children in the
developing world. Washington DC: National Academy Press.
5. Steer, P. J. (2000). Maternal hemoglobin concentration and
birth weight. American Journal of Clinical Nutrition, 71,
1285S–1287S.
6. Stoltzfus, R. J., Mullany, L., & Black, R. E. (2004). Iron defi-
ciency anemia. In M. Ezzati, A. D. Lopez, A. Rodgers, & C. J. L.
Murray (Eds.), Comparative quantification of health risks: global
and regional burden of disease attributable to selected major risk
factors (pp. 163–210). Geneva: World Health Organisation.
7. Kozuki, N., Lee, A. C., & Katz, J. (2012). Moderate to severe, but
not mild, maternal anemia is associated with increased risk of
small-for-gestational-age outcomes. Journal of Nutrition, 142,
358–362.
8. Ransom E. I., & Elder L.K. (2003). Nutrition of women and
adolescent girls: Why it matters. PRB. http://www.prb.org/Pub
lications/Articles/2003/NutritionofWomenandAdolescentGirls
WhyItMatters.aspxTa
ble
5co
nti
nu
ed
Fac
tors
Ind
ia
Mo
del
1M
od
el2
Sev
ere/
mo
der
ate
Mil
dN
ot
anem
ic�
Sev
ere/
mo
der
ate
Mil
dN
ot
anem
ic�
Sec
on
dar
yo
ccu
pat
ion
18
.19
38
.01
*4
3.7
81
7.8
73
8.1
1*
44
.00
Ter
tiar
y&
qu
ater
nar
yo
ccu
pat
ion
13
.54
35
.98
**
50
.46
13
.51
36
.39
*5
0.0
9
No
tw
ork
ing
15
.71
**
*3
7.1
7*
**
47
.11
15
.65
**
*3
7.4
6*
**
46
.87
Pa
rtn
er’s
occ
up
ati
on
Pri
mar
yo
ccu
pat
ion
�1
8.8
93
9.5
44
1.5
51
8.6
33
9.8
54
1.5
0
Sec
on
dar
yo
ccu
pat
ion
16
.64
37
.76
45
.61
16
.57
38
.00
45
.42
Ter
tiar
y&
qu
ater
nar
yo
ccu
pat
ion
13
.76
*3
5.2
25
1.0
01
3.6
8*
*3
5.6
55
0.6
6
No
tw
ork
ing
16
.09
*3
6.2
3*
47
.66
16
.10
35
.87
**
48
.01
Lo
gli
kel
iho
od
-8
5,6
55
.91
2-
77
,25
0.2
36
LR
Ch
i22
,42
2.9
12
,17
0.1
1
Pro
b[
Ch
i20
.00
00
0.0
00
0
Sig
nifi
can
cele
vel
s:*
**
p\
0.0
01
,*
*p\
0.0
1,
*p\
0.0
5�
-Ref
eren
ceca
teg
ory
Matern Child Health J
123
Author's personal copy
9. Rao, S., Yajnik, C. S., Kanade, A., Fall, C. H., Margetts, B. M.,
Jackson, A. A., et al. (2001). Intake of micronutrient-rich foods in
rural indian mothers is associated with the size of their babies at
birth: Pune maternal nutrition study. Journal of Nutrition, 131(4),
1217–1224.
10. Scholl, T. O., & Hediger, M. L. (1993). A review of the epide-
miology of nutrition and adolescent pregnancy: Maternal growth
during pregnancy and its effect on the fetes. Journal of American
College of Nutrition, 12, 101–107.
11. Rah, J. H., Christian, P., Shamim, A. A., Arju, U. T., et al. (2008).
Pregnancy and lactation hinder growth and nutritional status of
adolescent girls in rural Bangladesh. Journal of Nutrition, 138,
1505–1511.
12. Rah, J. H. (2013). Adolesent pregnancy, its impact on the growth
and nutritional status of young mothers: What does evidence say?
Sight and Life, 27(3), 37–38.
13. Geronimus, A. T., & Korenman, S. (1992). The Socioeconomic
consequences of teen childbearing reconsidered. Quarterly
Journal of Economics, 107(4), 1187–1214.
14. Lenders, C. M., McElrath, T. F., & Scholl, T. O. (2000). Nutrition
in adolescent pregnancy. Current Opinion in Pediatrics, 12,
291–296.
15. Buvinic, M. (1998). The costs of adolescent childbearing: Evi-
dence from Chile, Barbados, Guatemala, and Mexico. Studies in
Family Planning, 29(2), 201–209.
16. Rao, S. (2001). Nutritional status of the Indian population.
Journal of Biosciences, 26(4), 481–489.
17. International Institute for Population Sciences and Macro Inter-
nationals. Key findings from National family health survey
(NFHS 3). Mumbai, India: International Institute for Population
Sciences, 2007. (http://www.nfhsindia.org/factsheet.html)
18. Sen, S., & Sengupta, N. (2012). Marriage, work and education
among domestic workers in Kolkata. Economic & Political
Weekly, XLVII, 43, 67–77.
19. Moore, A. M., Singh, S., Ram, U., Remez, L., & Audam, S.
(2009). Adolescent marriage and childbearing in India: Current
situation and recent trends. New York: Guttmacher Institute.
20. Ministry of Health and Family Welfare. (2000). National Popu-
lation Policy 2000. New Delhi: Government of India.
21. Santhya, K. G., Jejeebhoy, S. J., & Ghosh, S. (2008). Early
marriage and sexual and reproductive health risks: Experiences
of young women and men in Andhra Pradesh and Madhya Pra-
desh, India. New Delhi: Population Council.
22. Santhya, K. G., Ram, U., Acharya, R., Jejeebhoy, J. S., Ram, F.,
& Singh, A. (2010). Associations between early marriage and
young women’s marital and reproductive health outcomes: Evi-
dence from India. International Perspectives on Sexual and
Reproductive Health, 36(3), 132–139.
23. Prakash, R., Singh, A., Pathak, K. P., & Parasuraman, S. (2011).
Early marriage, poor reproductive health status of mother and
child well-being in India. Journal of Family Planning Repro-
ductive Health Care, 37(3), 136–145.
24. Jejeebhoy, S. J. (1998). Adolescent sexual and reproductive
behavior: A review of the evidence from India. Social Science
and Medicine, 46(10), 1275–1290.
25. Barua, A., & Kurz, K. (2001). Reproductive health-seeking by
married adolescent girls in Maharashtra India. Reproductive
Health Matters, 9(17), 53–62.
26. Santhya, K. G., & Jejeebhoy, J. S. (2003). Sexual and repro-
ductive health needs of married adolescent girls. Economic and
Political Weekly, 38(41), 4370–4377.
27. Santhya, K. G., & Jejeebhoy J. S. (2007). Young people’s sexual
and reproductive health in India: Policies, programmes and
realities. Regional Working Paper No. 19, New Delhi, Population
Council.
28. Garn, S. M. (1986). Family-line and socioeconomic factors in
fatness and obesity. Nutrition Review, 44, 381–386.
29. Bouchard, C., Perusse, L., Leblanc, C., Tremblay, A., & The-
riault, G. (1988). Inheritance of the amount and distribution of
human body fat. International Journal of Obesity, 12, 205–215.
30. UNICEF. (2010). Child protection from violence, exploitation
and abuse. http://www.childinfo.org/
31. Makinson, C. (1985). The health consequences of teenage fer-
tility. Family Planning Perspective, 17, 132–139.
32. World Health Organisation. (2007). Adolescent pregnancy:
Unmet needs and undone deeds. Geneva: World Health
Organisation.
33. Rao, S., Gokhale, M., Joshi, S., & Kanade, A. (2010). Early life
under nutrition and adolescent pregnancy outcome in rural India.
Annals of Human Biology, 37(4), 475–487.
34. Toteja, G. S., Singh, P., Dhillon, B. S., Saxena, B. N., Ahmed, F.
U., et al. (2006). Prevalence of anemia among pregnant women
and adolescent girls in 16 districts of India. Food and Nutrition
Bulletin, 27(4), 311–315.
35. Bentley, M. E., & Griffiths, P. L. (2003). The burden of anemia
among women in India. European Journal of Clinical Nutrition,
57(1), 52–60.
36. Ramachandran, P. (1989). Nutrition in pregnancy. In C. Gopalan
& S. Kaur (Eds.), Women and nutrition in India. New Delhi:
Nutrition Foundation of India.
37. Krasovec, K., & Anderson, A. M. (1991). Maternal nutrition and
pregnancy outcomes: Anthropometric assessment. Washington
DC: Pan American Health Organisation.
38. Deaton, A., & Dreze, J. (2009). Food and nutrition in India: Facts
and interpretations. Economic and Political Weekly, 44(7),
42–65.
39. Sen, Amartya K. (1988). Family and food: Sex bias in poverty. In
T. N. Srinivasan & K. P. Bardhan (Eds.), Rural poverty in South
Asia (pp. 453–472). New York: Columbia University Press.
40. Dreze, J. (1993). Review: Nutrition and health in rural India.
Economic and Political Weekly, 28(7), 276–277.
41. Dreze, J., & Sen, A. K. (2013). An uncertain glory, India and its
contradictions. New Delhi: Penguin.
42. Prichard, B., Rammohan, A., Sekhar, M., Parasuraman, S., &
Choithani, C. (2013). Feeding India: Livelihoods, entitlement and
capabilities. London and New York: Routledge Taylor and
Francis.
43. Fajth, G., & Vinay, C. (2010). Conditional cash transfers: A
global perspective, MDG Insights, Issue No. 1, February.
Matern Child Health J
123
Author's personal copy