The Effect of DER, PER and EPS on the Share Price of Food ...
10
The Effect of DER, PER and EPS on the Share Price of Food and Beverage Companies on the Indonesia Stock Exchange Dian Indah Sari 1* , Slamet Maryoso 2 1,2 Universitas Bina Sarana Informatika, Jakarta, Indonesia * Corresponding Author. Email : [email protected] ABSTRACT This study aims to analyze the effect of DER, PER and EPS on share prices of food and beverage companies in the Indonesia Stock Exchange. This research is quantitative descriptive. The data collection method is literature study. This study took samples from food and beverage industry companies listed on the Indonesia Stock Exchange for the period 2016-2019. Multiple Linear Regression analysis test and Classical Assumption test were used for data analysis techniques. The conclusions of this study are as follows: first, the variable (DER) has no significant and positive effect on share prices of food and beverage industry companies. Second, the variable (PER) has a significant and positive effect on share prices of food and beverage industry companies. Third, the variable (EPS) has a significant and positive effect on share prices of food and beverage industry companies. Fourth, the variables (DR), (PER) and (EPS) simultaneously have a significant and positive effect on the share prices of food and beverage industry companies listed on the Indonesia Stock Exchange for the period 2016 - 2019. Keywords: DER, PER, EPS, stock prices. 1. INTRODUCTION The rapid development of the Digital world led to economic competition. New entrepreneurs offer innovations that make it easier to carry out activities such as online motorcycle taxis, travel and e-commerce that enliven the digital economy in Indonesia. The business economy is currently entering an era of VUCA short for volatility, uncertainty, complexity and ambiguity. The Vuca era describes complex economic circumstances, rapid turmoil of change and obscurity. The fast-moving tide of change has made it difficult for businesspeople to anticipate what will happen next. The company is faced by unknown business challenges, business uncertainties, complex problems, difficulty making decisions. Companies should focus on efficiency to achieve performance goals. Leaders must have a long-term vision but can be adapted in the short term. The challenges faced by business entrepreneurs in the VUCA era include market uncertainty, digital disruption, more automated processes, product optimization and improved life expectancy, Business and education must have strategies to face the VUCA era. Strategies for dealing with VUCA include continuous learning, adapting to existing circumstances, strategic thinking skills and daring to take risks. The stock market is the market where the stock trades and where the company issues its shares. The stock market in Indonesia is known as the Indonesia Stock Exchange. The stock market shows the economic condition of a country. In developed countries, many companies are listed on the stock exchange. To see the economic condition of a country can be seen from the stock transactions in the country's stock market. A share price is a price formed by demand and stock offerings in the capital market. The stock market price is determined by the capital market participants who trade stocks. A high share price will encourage investors to sell their shares. The high share price is formed due to the high demand for the company's shares in the capital market because the company performs well and has the potential to improve the quality of the company. The low share price is due to the lack of demand for the company's shares due to the company's poor performance and large business risks. The share price is used by investors to invest in the capital market in the form of purchasing ownership of the company. There are three types of value in the stock price valuation, namely book value, market value and intrinsic value [1]. A book value is a value calculated based on the publisher's bookkeeping, the market value is the value of the stock in the market, and the intrinsic value is the true value of the stock. Based on the Indonesia Stock Exchange, companies engaged in the food and beverage sector in Indonesia recorded good growth until the end of 2019. PT Sariguna Primatirta Tbk (CLEO) recorded an Advances in Economics, Business and Management Research, volume 179 Proceedings of the Sixth Padang International Conference On Economics Education, Economics, Business and Management, Accounting and Entrepreneurship (PICEEBA 2020) Copyright © 2021 The Authors. Published by Atlantis Press B.V. This is an open access article distributed under the CC BY-NC 4.0 license -http://creativecommons.org/licenses/by-nc/4.0/. 56
-
Upload
khangminh22 -
Category
Documents
-
view
1 -
download
0
Transcript of The Effect of DER, PER and EPS on the Share Price of Food ...
The Effect of DER, PER and EPS on the Share Price of
Food and Beverage Companies on the Indonesia Stock
Exchange
Dian Indah Sari1*, Slamet Maryoso2
1,2 Universitas Bina Sarana Informatika, Jakarta, Indonesia *Corresponding Author. Email : [email protected]
ABSTRACT
This study aims to analyze the effect of DER, PER and EPS on share prices of food and beverage companies in the
Indonesia Stock Exchange. This research is quantitative descriptive. The data collection method is literature study. This
study took samples from food and beverage industry companies listed on the Indonesia Stock Exchange for the period
2016-2019. Multiple Linear Regression analysis test and Classical Assumption test were used for data analysis
techniques. The conclusions of this study are as follows: first, the variable (DER) has no significant and positive effect
on share prices of food and beverage industry companies. Second, the variable (PER) has a significant and positive effect
on share prices of food and beverage industry companies. Third, the variable (EPS) has a significant and positive effect
on share prices of food and beverage industry companies. Fourth, the variables (DR), (PER) and (EPS) simultaneously
have a significant and positive effect on the share prices of food and beverage industry companies listed on the Indonesia
Stock Exchange for the period 2016 - 2019.
Keywords: DER, PER, EPS, stock prices.
1. INTRODUCTION
The rapid development of the Digital world led to
economic competition. New entrepreneurs offer
innovations that make it easier to carry out activities
such as online motorcycle taxis, travel and e-commerce
that enliven the digital economy in Indonesia. The
business economy is currently entering an era of VUCA
short for volatility, uncertainty, complexity and
ambiguity. The Vuca era describes complex economic
circumstances, rapid turmoil of change and obscurity.
The fast-moving tide of change has made it difficult for
businesspeople to anticipate what will happen next. The
company is faced by unknown business challenges,
business uncertainties, complex problems, difficulty
making decisions. Companies should focus on
efficiency to achieve performance goals. Leaders must
have a long-term vision but can be adapted in the short
term.
The challenges faced by business entrepreneurs in
the VUCA era include market uncertainty, digital
disruption, more automated processes, product
optimization and improved life expectancy, Business
and education must have strategies to face the VUCA
era. Strategies for dealing with VUCA include
continuous learning, adapting to existing circumstances,
strategic thinking skills and daring to take risks.
The stock market is the market where the stock
trades and where the company issues its shares. The
stock market in Indonesia is known as the Indonesia
Stock Exchange. The stock market shows the economic
condition of a country. In developed countries, many
companies are listed on the stock exchange. To see the
economic condition of a country can be seen from the
stock transactions in the country's stock market.
A share price is a price formed by demand and stock
offerings in the capital market. The stock market price
is determined by the capital market participants who
trade stocks. A high share price will encourage
investors to sell their shares. The high share price is
formed due to the high demand for the company's
shares in the capital market because the company
performs well and has the potential to improve the
quality of the company. The low share price is due to
the lack of demand for the company's shares due to the
company's poor performance and large business risks.
The share price is used by investors to invest in the
capital market in the form of purchasing ownership of
the company. There are three types of value in the stock
price valuation, namely book value, market value and
intrinsic value [1]. A book value is a value calculated
based on the publisher's bookkeeping, the market value
is the value of the stock in the market, and the intrinsic
value is the true value of the stock.
Based on the Indonesia Stock Exchange,
companies engaged in the food and beverage sector in
Indonesia recorded good growth until the end of 2019.
PT Sariguna Primatirta Tbk (CLEO) recorded an
Advances in Economics, Business and Management Research, volume 179
Proceedings of the Sixth Padang International Conference On Economics Education,
Economics, Business and Management, Accounting and Entrepreneurship (PICEEBA 2020)
Copyright © 2021 The Authors. Published by Atlantis Press B.V.This is an open access article distributed under the CC BY-NC 4.0 license -http://creativecommons.org/licenses/by-nc/4.0/. 56

increase in revenue and net profit during 2019. CLEO's
revenue increased 30.64% from Rp 593.76 billion to Rp
775.69 billion, while net profit doubled from last year
to Rp 94.02 billion. PT Mayor Indah Tbk (MYOR)
with net sales of 3.52% from Rp 17.35 trillion to Rp
17.96 trillion. Sales to the domestic market as a major
contributor amounted to Rp 9.91 trillion or 55.19% then
export sales of Rp 9.06 trillion while returns amounted
to Rp 9.43 billion. PT Nippon Indosari Corpindo Tbk
(ROTI) recorded net sales of 24.05% from Rp 1.98
trillion to Rp 2.46 trillion. In addition, current period
profit increased 151.93% from Rp 70.2 billion to Rp
176.85 billion.
The study used indicators such as DER, PER, EPS
and stock prices. DER is a ratio that demonstrates a
company's ability to meet its obligations using equity.
DER is a measure of the debt-to-debt ratio shared by the
company's equity. DER is used to measure the health of
the company. DER is often used as an indicator for
making investment decisions. The high der indicates
that the income level of the company to pay the
company's debt is classified as low. Meanwhile, the low
DER indicates that the level of profit earned by the
company is very low.
PER is a ratio that compares the share price with
earnings per share. Per is a number used as a
fundamental analysis of the company's finances. PER is
used to predict stock price developments. PER is
derived from the divided share price of Earnings Per
Share (EPS). The higher PER shows that the higher the
market's view of the future of the economy. The lower
PER suggests that markets are increasingly pessimistic
about the future of the economy.
.EPS is a ratio that compares net income with the
number of shares outstanding. According to [2] the EPS
ratio is the ratio used to indicate the amount of money
generated from each common share. EPS shows the
amount of net income that is ready to be distributed to
shareholders. The higher the EPS value means the
greater the profit distributed to shareholders. EPS is a
ratio that indicates the amount of income or income
earned from each share. EPS is the first important
component in analyzing a company. EPS information
shows how much net profit is shared with all
shareholders of the company. One indicator of the
company's performance success is EPS. High EPS
indicates that the better the company's performance, but
there is no guarantee the share price will increase.
Previous research examining the influence of DER
on the share price [3] states that partially variable DER
has a significant effect on the share price. The results of
research [4] state that DER has a significant effect on
the share price. Previous researchers who conducted
research on the effect of per on the share price [5]
concluded in his study that per had a significant effect
on the share price. The results of research conducted by
[6] state that per variables have a positive and
significant effect on the share price. Previous research
examining the influence of EPS on the share price [5]
concluded in his research that EPS had a significant
effect on the share price. Research conducted by [7]
states that variable EPS has a positive effect on the
share price.
Based on the results of some of the above studies,
the authors formulated problems in this study among
others (1) is the significant influence between der, PER
and EPS variables simultaneously on the share prices of
food and beverage companies on the Indonesia Stock
Exchange. (2) Is there a significant influence between
DER, PER and EPS variables partially on the share
prices of food and beverage companies on the Indonesia
Stock Exchange. This research aims to analyze the
influence of DER, PER and EPS on the Share Price of
Food and Beverage Companies on the Indonesia Stock
Exchange.
2. LITERATURE REVIEW
2.1. Definition of DER
One of the measuring tools for calculating leverage
ratios by using DER. Debt To Equity Ratio is the ratio
used to assess debt to equity [8]. This ratio is sought by
comparing all debt, including current debt, with total
equity. This ratio is used to determine the amount of
funds given by borrowers (creditors) and owners of
companies. In other words, this ratio is used to
determine each rupiah of its own capital used as
collateral for debt [8]. The value of the company will
decrease if the company uses more debt than its own
capital according to [9]. It can be concluded that DER
shows the amount of each rupiah of the company's own
capital used as debt collateral. Higher DER indicates
that the funds taken from outside are getting bigger.
Formula for calculating DER according to [10].
Debt to Equity Ratio = Total Liabilities
Total Equity
2.2. Definition of PER
According to [1] PER is a ratio that shows the price
of every one rupiah that investors must pay to get a
company income of one rupiah. According to [11]
companies that are expected to grow with a high growth
rate (meaning have good prospects), usually have a high
PER. Conversely, companies that are expected to have
low growth will also have a low PER. Per describes the
market appreciation of the company's ability to generate
profit [12]. PER shows the ratio of share price to
earnings. PER shows how much investors rate a stock's
price against multiples of earnings. A high PER
Advances in Economics, Business and Management Research, volume 179
57
indicates that investors are willing to pay at a premium
share price or a price above the market price [13].
Calculation formula PER by [1].
PER = Share Price
Earning Per Share
2.3. Definition of EPS
Comparison between the amount of income (in this
case the net income ready to be distributed to
shareholders) and the number of shares of the company
to be acquired the Earning Per Share (EPS) component
according to [1]. For investors, EPS information is
considered the most basic and useful information
because it can describe the company's future earnings
prospects according to [1]. EPS is a ratio that indicates
the share share of the yield. The Company may provide
a high level of profit to shareholders indicated by high
EPS. In contrast, lower EPS provides lower returns to
shareholders. The increase in EPS will encourage
investors to increase the amount of capital invested in
the company, resulting in increased demand for the
stock resulting in an increase in the share price
according to him [12]. Formula calculates EPS
According to [1].
EPS = Net Income
Number of shares outstanding
2.4. Definition of Share Price
Shares are securities traded on the Indonesian
equity market according to [1]. The share price is the
price that occurs on the exchange at a certain time
determined by the market participants according to [14].
The share price is distinguished into three nominal
price, starting price and market price according to [15].
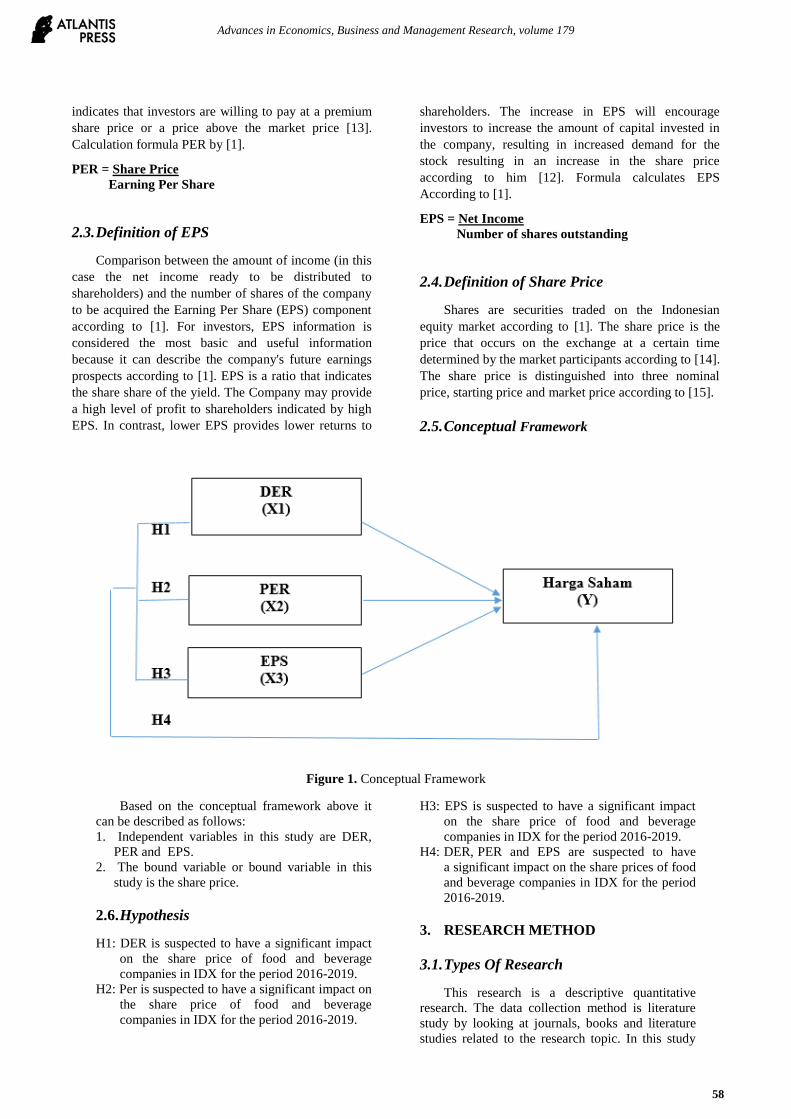
2.5. Conceptual Framework
Figure 1. Conceptual Framework
Based on the conceptual framework above it
can be described as follows:
1. Independent variables in this study are DER,
PER and EPS.
2. The bound variable or bound variable in this
study is the share price.
2.6. Hypothesis
H1: DER is suspected to have a significant impact
on the share price of food and beverage
companies in IDX for the period 2016-2019.
H2: Per is suspected to have a significant impact on
the share price of food and beverage
companies in IDX for the period 2016-2019.
H3: EPS is suspected to have a significant impact
on the share price of food and beverage
companies in IDX for the period 2016-2019.
H4: DER, PER and EPS are suspected to have
a significant impact on the share prices of food
and beverage companies in IDX for the period
2016-2019.
3. RESEARCH METHOD
3.1. Types Of Research
This research is a descriptive quantitative
research. The data collection method is literature
study by looking at journals, books and literature
studies related to the research topic. In this study
Advances in Economics, Business and Management Research, volume 179
58
the data were obtained by looking at the website of
the Indonesia Stock Exchange. This study took
samples from food and beverage industry
companies listed on the Indonesia Stock Exchange
for the period 2016-2019.
3.2. Population and Sampling Techniques
The company that sampled the research was a
Food and Beverage industry company listed on the
Indonesia Stock Exchange for the period 2016 -
2019. Sampling is done by purposive sampling
method.
The sampling criteria in this study are as
follows:
1. Food and beverage industry companies recorded
consecutively in IDX for the period 2016-2019.
2. Food and beverage industry companies that have
published full and consecutive financial
statements from the period 2016 - 2019.
3. Food and beverage industry companies that have
financial data according to der, per and EPS
research variables.
4. Food and beverage industry companies that have
logical data.
The number of food and beverage industry
companies that meet the criteria of this research is
as many as 15 companies. Food and beverage
companies listed on the Indonesia Stock Exchange
include PT Tiga Pilar Sejahtera Food, PT Tri
Banyan Tirta, PT Wilmar Cahaya Indonesia, PT
Mayora Indah, PT Prasidha Aneka Niaga, PT
Nippon Indosari Corpindo, PT Ultrajaya Milk
Industry, PT Campina Industri Ice Cream, PT
Garudafood Putra Putri Jaya, PT Sentra Food
Indonesia, PT Wahana Interfood Nusantara, PT Era
Mandiri Cemerlang , PT Diamond Food Indonesia,
PT Pratma Abadi Nusa Industri, PT Sariguna
Primatirta.
3.3. Data Analysis Techniques
The data analysis techniques in this study used
SPSS version 24, including:
1. Classic Assumption Test
Normality Test, Heteroskedastity Test,
Multicholineral Test and Autocorcord Test are
used in classic assumption tests.
2. Multiple Linear Regression Analysis Test
Consists of statistical test t and coefficient
determination test.
4. RESULTS AND DISCUSSION
4.1. Classic Assumption Test
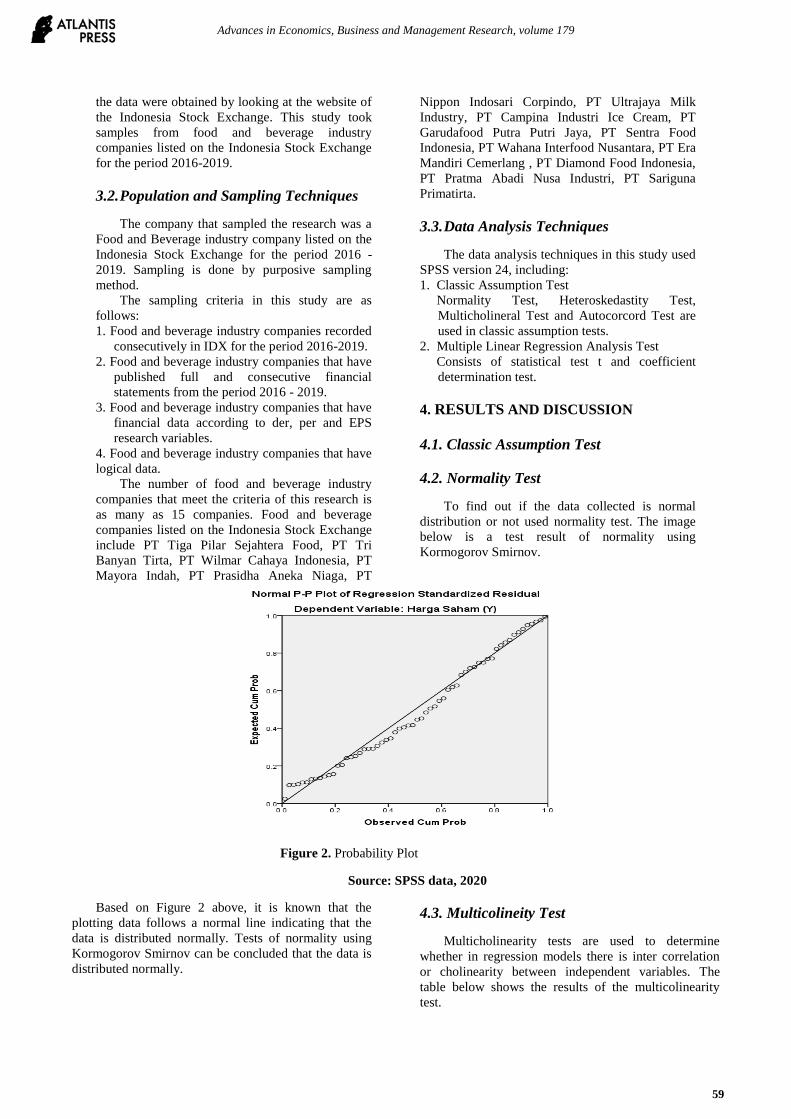
4.2. Normality Test
To find out if the data collected is normal
distribution or not used normality test. The image
below is a test result of normality using
Kormogorov Smirnov.
Figure 2. Probability Plot
Source: SPSS data, 2020
Based on Figure 2 above, it is known that the
plotting data follows a normal line indicating that the
data is distributed normally. Tests of normality using
Kormogorov Smirnov can be concluded that the data is
distributed normally.
4.3. Multicolineity Test
Multicholinearity tests are used to determine
whether in regression models there is inter correlation
or cholinearity between independent variables. The
table below shows the results of the multicolinearity
test.
Advances in Economics, Business and Management Research, volume 179
59

Table 1. The results of the multicolinearity test
Coefficientsa
Model
Unstandardized
Coefficients
Standardized
Coefficients
T Sig.
Collinearity
Statistics
B Std. Error Beta Tolerance VIF
1 (Constant) -7709.211 1293.857 -5.958 .000
DR (X1) 873.145 579.335 .181 1.507 .137 .448 2.230
PER (X2) 304.028 68.255 .498 4.454 .000 .518 1.931
EPS (X3) 443.751 95.190 .427 4.662 .000 .771 1.298
a. Dependent Variable: Harga Saham (Y)
Source: SPSS data, 2020
Based on table 1 it appears that each variable has a
VIF value of less than 10, where dr obtains a VIF value
of 2,230, PER 1,931 and EPS of 1,298. As for tolerance
values for all independent variables there is no tolerance
value smaller than 0.10, where DR is obtained a
tolerance value of 0.448, PER 0.518 and EPS of 0.771.
Thus, it can be concluded that the data does not
experience symptoms of multicholinearity because it
has a tolerance value> 0.10 and a VIF value of <10.
4.4 Heteroskedastisity Test
Heteroskedastisity tests are used to see if there are
residual inequalities for all observations on linear
regression models. Testing using heteroskedastisity test
can be seen in the image below.
Figure 3. Scatterplot
Source: SPSS data, 2020
Based on Figure 3 above it is noticeable that the
point spreads above the number 0, the point not only
gathers above and below, the point does not form a
wavy, widening or narrowing pattern and the spread of
the data point is not patterned. Of these, there are no
symptoms of heteroskedastisity in variable DR, PER,
EPS and share prices.
4.5 Auto Correlation Test
Auto correlation tests are used to determine if there
is a correlation between variables in the prediction
model and time changes. Test results with auto
correlation test can be seen in the table below.
Advances in Economics, Business and Management Research, volume 179
60

Table 2. Autocorrelation Test
Model R R Square
Adjusted R
Square
Std. Error of the
Estimate Durbin-Watson
1 .798a .637 .618 2015.292 1.151
Source: SPSS data, 2020
Based on table 2 it appears that durbin watson
value is 1,151 which in this test obtained results dL =
1.2437 and dU = 1.6505. So durbin watson's value lies
in the dU range <d <4 - dU which is 1.6505 <1.671
<2.3495, this indicates that Durbin Watson is in the test
area and can be concluded that the data has no
symptoms of auto correlation.
4.6. Multiple Linear Regression Analysis
Multiple linear regression analysis is used to find
out if there is an influence between free variables and
bound variables expressed in the regression equation.
Tests with multiple linear regression analysis can be
found in the table below.
Table 3. Multiple Linear Regression
Model
Unstandardized Coefficients
Standardized
Coefficients
t Sig. B Std. Error Beta
1 (Constant) -7709.211 1293.857 -5.958 .000
DR (X1) 873.145 579.335 .181 1.507 .137
PER (X2) 304.028 68.255 .498 4.454 .000
EPS (X3) 443.751 95.190 .427 4.662 .000
Source: SPSS data, 2020
Y = -7709,211 + 873,145DR + 304,028PER +
443,751EPS + e
The above equations can be interpreted as follows:
1. α = -7709,211, meaning that if all independent
variables are zero, then the share price variable (Y)
is worth -7709,211.
2. β1 = 873.145, meaning that if DR rises 1%, then the
variable share price (Y) will rise by 873,145
assuming other variables are considered constant.
The coefficient is relatively positive which means
there is a positive relationship between DR and the
share price.
3. β2 = 304,028, meaning that if PER rises 1% then the
variable share price will drop by 304,028 assuming
other variables are considered constant. A positively
marked coefficient means there is a positive
relationship between PER and the share price.
4. β3 = 443,751, meaning that if EPS rises 1% then the
variable share price will rise by 443,751 assuming
other variables are considered constant. The
coefficient is considered positive meaning there is a
positive relationship between EPS and the share
price.
4.7. Coefficient of Determination (R2)
The determination coefficient (R2) is used to
determine how much the contribution of independent
variables contributes simultaneously to dependent
variables. The results of the determination coefficient
(R2) test can be seen in the table below.
Table 4. Determination Coefficient
Odel R R Square Adjusted R Square
Std. Error of the
Estimate
1 .832a .693 .673 2024.694
Source : SPSS data, 2020
Based on table 4 it appears that the Adjusted R2
value is 0.693. This data shows that variable share
prices are affected by 69.3% by variables (DR), (PER)
and (EPS). Meanwhile, the remaining 30.7% was
influenced by other variables outside the variables in
the study.
4.8. Hypothesis Testing
4.8.1. T Test (Partial)
The t test is used to determine the influence of each
individual independent variable on dependent variables.
Advances in Economics, Business and Management Research, volume 179
61
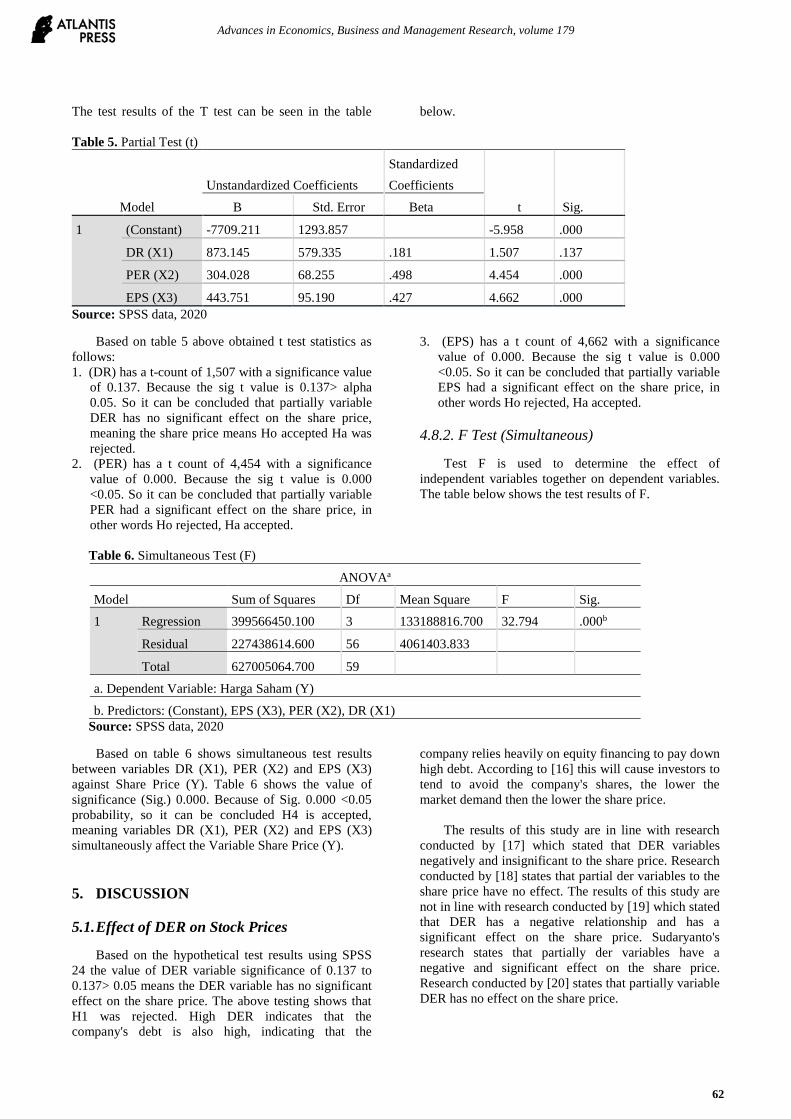
The test results of the T test can be seen in the table below.
Table 5. Partial Test (t)
Model
Unstandardized Coefficients
Standardized
Coefficients
t Sig. B Std. Error Beta
1 (Constant) -7709.211 1293.857 -5.958 .000
DR (X1) 873.145 579.335 .181 1.507 .137
PER (X2) 304.028 68.255 .498 4.454 .000
EPS (X3) 443.751 95.190 .427 4.662 .000
Source: SPSS data, 2020
Based on table 5 above obtained t test statistics as
follows:
1. (DR) has a t-count of 1,507 with a significance value
of 0.137. Because the sig t value is 0.137> alpha
0.05. So it can be concluded that partially variable
DER has no significant effect on the share price,
meaning the share price means Ho accepted Ha was
rejected.
2. (PER) has a t count of 4,454 with a significance
value of 0.000. Because the sig t value is 0.000
<0.05. So it can be concluded that partially variable
PER had a significant effect on the share price, in
other words Ho rejected, Ha accepted.
3. (EPS) has a t count of 4,662 with a significance
value of 0.000. Because the sig t value is 0.000
<0.05. So it can be concluded that partially variable
EPS had a significant effect on the share price, in
other words Ho rejected, Ha accepted.
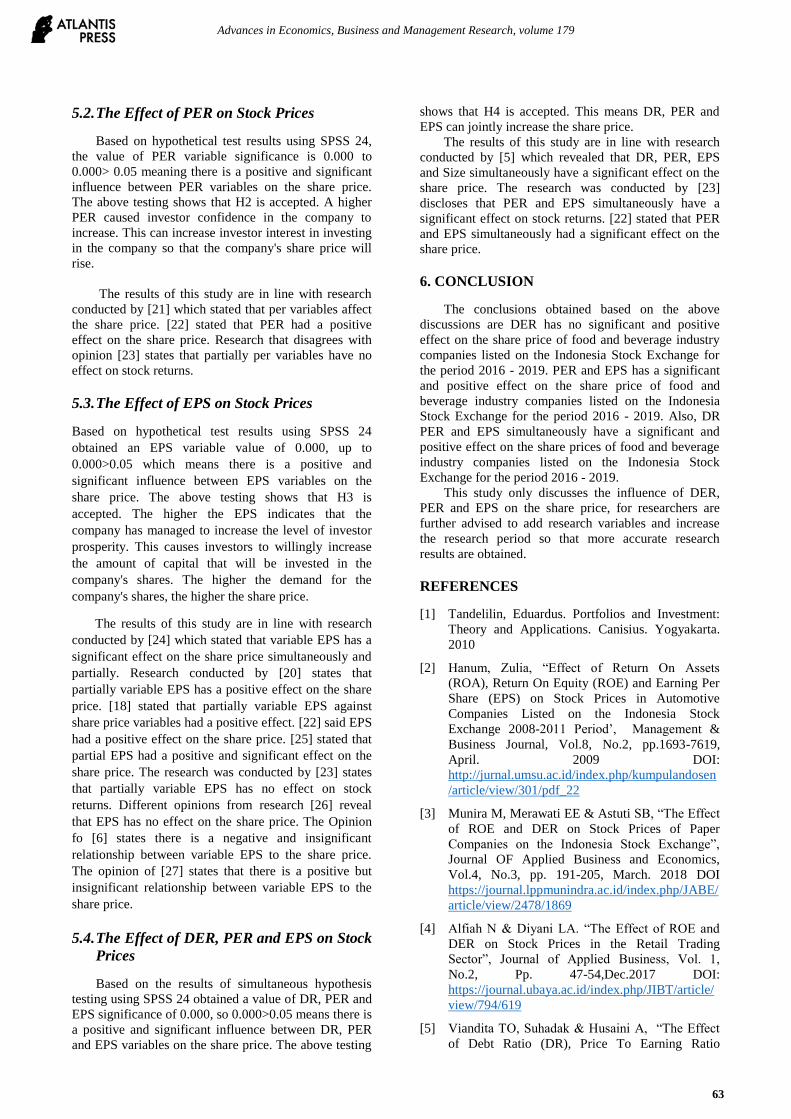
4.8.2. F Test (Simultaneous)
Test F is used to determine the effect of
independent variables together on dependent variables.
The table below shows the test results of F.
Table 6. Simultaneous Test (F)
ANOVAa
Model Sum of Squares Df Mean Square F Sig.
1 Regression 399566450.100 3 133188816.700 32.794 .000b
Residual 227438614.600 56 4061403.833
Total 627005064.700 59
a. Dependent Variable: Harga Saham (Y)
b. Predictors: (Constant), EPS (X3), PER (X2), DR (X1)
Source: SPSS data, 2020
Based on table 6 shows simultaneous test results
between variables DR (X1), PER (X2) and EPS (X3)
against Share Price (Y). Table 6 shows the value of
significance (Sig.) 0.000. Because of Sig. 0.000 <0.05
probability, so it can be concluded H4 is accepted,
meaning variables DR (X1), PER (X2) and EPS (X3)
simultaneously affect the Variable Share Price (Y).
5. DISCUSSION
5.1. Effect of DER on Stock Prices
Based on the hypothetical test results using SPSS
24 the value of DER variable significance of 0.137 to
0.137> 0.05 means the DER variable has no significant
effect on the share price. The above testing shows that
H1 was rejected. High DER indicates that the
company's debt is also high, indicating that the
company relies heavily on equity financing to pay down
high debt. According to [16] this will cause investors to
tend to avoid the company's shares, the lower the
market demand then the lower the share price.
The results of this study are in line with research
conducted by [17] which stated that DER variables
negatively and insignificant to the share price. Research
conducted by [18] states that partial der variables to the
share price have no effect. The results of this study are
not in line with research conducted by [19] which stated
that DER has a negative relationship and has a
significant effect on the share price. Sudaryanto's
research states that partially der variables have a
negative and significant effect on the share price.
Research conducted by [20] states that partially variable
DER has no effect on the share price.
Advances in Economics, Business and Management Research, volume 179
62
5.2. The Effect of PER on Stock Prices
Based on hypothetical test results using SPSS 24,
the value of PER variable significance is 0.000 to
0.000> 0.05 meaning there is a positive and significant
influence between PER variables on the share price.
The above testing shows that H2 is accepted. A higher
PER caused investor confidence in the company to
increase. This can increase investor interest in investing
in the company so that the company's share price will
rise.
The results of this study are in line with research
conducted by [21] which stated that per variables affect
the share price. [22] stated that PER had a positive
effect on the share price. Research that disagrees with
opinion [23] states that partially per variables have no
effect on stock returns.
5.3. The Effect of EPS on Stock Prices
Based on hypothetical test results using SPSS 24
obtained an EPS variable value of 0.000, up to
0.000>0.05 which means there is a positive and
significant influence between EPS variables on the
share price. The above testing shows that H3 is
accepted. The higher the EPS indicates that the
company has managed to increase the level of investor
prosperity. This causes investors to willingly increase
the amount of capital that will be invested in the
company's shares. The higher the demand for the
company's shares, the higher the share price.
The results of this study are in line with research
conducted by [24] which stated that variable EPS has a
significant effect on the share price simultaneously and
partially. Research conducted by [20] states that
partially variable EPS has a positive effect on the share
price. [18] stated that partially variable EPS against
share price variables had a positive effect. [22] said EPS
had a positive effect on the share price. [25] stated that
partial EPS had a positive and significant effect on the
share price. The research was conducted by [23] states
that partially variable EPS has no effect on stock
returns. Different opinions from research [26] reveal
that EPS has no effect on the share price. The Opinion
fo [6] states there is a negative and insignificant
relationship between variable EPS to the share price.
The opinion of [27] states that there is a positive but
insignificant relationship between variable EPS to the
share price.
5.4. The Effect of DER, PER and EPS on Stock
Prices
Based on the results of simultaneous hypothesis
testing using SPSS 24 obtained a value of DR, PER and
EPS significance of 0.000, so 0.000>0.05 means there is
a positive and significant influence between DR, PER
and EPS variables on the share price. The above testing
shows that H4 is accepted. This means DR, PER and
EPS can jointly increase the share price.
The results of this study are in line with research
conducted by [5] which revealed that DR, PER, EPS
and Size simultaneously have a significant effect on the
share price. The research was conducted by [23]
discloses that PER and EPS simultaneously have a
significant effect on stock returns. [22] stated that PER
and EPS simultaneously had a significant effect on the
share price.
6. CONCLUSION
The conclusions obtained based on the above
discussions are DER has no significant and positive
effect on the share price of food and beverage industry
companies listed on the Indonesia Stock Exchange for
the period 2016 - 2019. PER and EPS has a significant
and positive effect on the share price of food and
beverage industry companies listed on the Indonesia
Stock Exchange for the period 2016 - 2019. Also, DR
PER and EPS simultaneously have a significant and
positive effect on the share prices of food and beverage
industry companies listed on the Indonesia Stock
Exchange for the period 2016 - 2019.
This study only discusses the influence of DER,
PER and EPS on the share price, for researchers are
further advised to add research variables and increase
the research period so that more accurate research
results are obtained.
REFERENCES
[1] Tandelilin, Eduardus. Portfolios and Investment:
Theory and Applications. Canisius. Yogyakarta.
2010
[2] Hanum, Zulia, “Effect of Return On Assets
(ROA), Return On Equity (ROE) and Earning Per
Share (EPS) on Stock Prices in Automotive
Companies Listed on the Indonesia Stock
Exchange 2008-2011 Period’, Management &
Business Journal, Vol.8, No.2, pp.1693-7619,
April. 2009 DOI:
http://jurnal.umsu.ac.id/index.php/kumpulandosen
/article/view/301/pdf_22
[3] Munira M, Merawati EE & Astuti SB, “The Effect
of ROE and DER on Stock Prices of Paper
Companies on the Indonesia Stock Exchange”,
Journal OF Applied Business and Economics,
Vol.4, No.3, pp. 191-205, March. 2018 DOI
https://journal.lppmunindra.ac.id/index.php/JABE/
article/view/2478/1869
[4] Alfiah N & Diyani LA. “The Effect of ROE and
DER on Stock Prices in the Retail Trading
Sector”, Journal of Applied Business, Vol. 1,
No.2, Pp. 47-54,Dec.2017 DOI:
https://journal.ubaya.ac.id/index.php/JIBT/article/
view/794/619
[5] Viandita TO, Suhadak & Husaini A, “The Effect
of Debt Ratio (DR), Price To Earning Ratio
Advances in Economics, Business and Management Research, volume 179
63

(PER), Earning Per Share (EPS) and Size on Share
Prices (Studies on Industrial Companies Listed on
the Indonesian Stock Exchange’, Journal of
Business Administration, Vol.1, No.2, pp. 113-
121, 2013 DOI :
http://administrasibisnis.studentjournal.ub.ac.id/in
dex.php/jab/article/view/47/1595
[6] Rahmadewi PW and Abundanti N, “Effect of EPS,
PER, CS and ROE on Stock Prices on the
Indonesia Stock Exchange’, E-Journal of
Management of Udayana University, Vol.7, No. 4,
pp. 2106-2133, 2018 DOI :
https://www.neliti.com/publications/254641/penga
ruh-eps-per-cr-dan-roe-terhadap-harga-saham-di-
bursa-efek-indonesia
[7] Badruzaman J, “Effect of Earning Per Share on
Stock Prices”, Accounting journal, Vol. 12, No. 1,
pp.102-110,2017 DOI:
http://jurnal.unsil.ac.id/index.php/jak/article/view/
298/210
[8] Kasmir. Financial Statement Analysis. First
Edition. Jakarta. : PT. Rajagrafindo Persada. 2014.
[9] Sudana, I Made. Corporate Financial Management
Theory and Practice. Jakarta : Erlangga. 2011
[10] Fahmi, Irham. Introduction to Financial
Management. Bandung : Alfabeta. 2014
[11] Hanafi, Mamduh M. Financial Management.
Yogyakarta : BPFE. 2010.
[12] Darmaji, Tjiptono and Fakhrudddin, Capital
Market in Indonesia. Third Edition. Jakarta : Four
Salemba. 2012
[13] Jogiyanto. Portfolio Theory and Investment
Analysis. Fifth Edition. Yogyakarta: BPFE. 2010.
[14] Hartono, Jogiyanto. Portfolio Theory and
Investment Analysis. Ninth Edition. Yogyakarta :
BPFE. 2013
[15] Sunnariyah. Capital Market Knowledge.
Yogyakarta : UPP STIM YKPN. 2013
[16] Ratih D, Apriatni & Saryadi, “The Effect of EPS,
PER, DER and ROE on Share Prices in Mining
Companies Listed on the Indonesia Stock
Exchange (BEI) 2010-2012”, Diponegoro Journal
of Social and Politic, pp.1-12, 2014 DOI:
https://www.neliti.com/publications/103211/penga
ruh-eps-per-der-roe-terhadap-harga-saham-pada-
perusahaan-sektor-pertambanga
[17] Sari, DI, “The Effect of CR and DER on Stock
Prices of Automotive Companies’, JAD-
Dewantara Accounting Research Journal, Vol. 4
No.1,pp.66-77, April. 2020 DOI:
https://ejournal.stiedewantara.ac.id/index.php/JAD
/article/view/522/296
[18] Utami MR & Darmawan A, “Effect of DER,
ROA, ROE, EPS and MVA on Stock Prices on the
Indonesian Sharia Stock Index’, Journal of
Applied Of Applied Managerial Accounting,
Vol.2, No.2, pp.206-218,Sept.2018 DOI:
https://jurnal.polibatam.ac.id/index.php/JAMA/arti
cle/view/910/571
[19] Nugraha RD & Sudaryanto B, “Analysis of the
Effect of DPR, DER, ROE and TATO on Stock
Prices (Case Study of Basic Industry and
Chemical Companies Listed on the Indonesia
Stock Exchange”, Diponegoro Journal of
Management, Vol.5, No.4, pp. 1-12, 2016 DOI
https://ejournal3.undip.ac.id/index.php/djom/articl
e/view/17873/16946
[20] Alipudin A & Oktaviani R. “Effect of EPS, ROE,
ROA and DER on Stock Prices in Cement Sector
Companies Listed on the IDX”, JIAFE, Vol. 2,
No.1,pp.1-22,2016 DOI:
https://journal.unpak.ac.id/index.php/jiafe/article/v
iew/521/431
[21] Beliani MMI & Budiantara M, “The Effect of
Price Earning Ratio and Price To Book Value on
Stock Prices of Insurance Companies Listed on the
Indonesia Stock Exchange in 2009-2012”,
JRAMB, Vol.1, No.1, pp. 77-86, May. 2015 DOI:
https://ejurnal.mercubuana-
yogya.ac.id/index.php/akuntansi/article/view/12
[22] Aletheari IDM and Jati IK. “The Effect of Earning
Per Share, Price Earning Ratio, and Book Value
Per Share on Stock Prices”, Udayana University
Accounting E-Journal. Vol. 17, No.2, pp. 1254-
1282,Nov.2016 DOI:
https://ojs.unud.ac.id/index.php/Akuntansi/article/
view/21667/16032
[23] Sodikin S & Wuldani N, “The Effect of Price
Earning Ratio (PER) and Earning Per Share (EPS)
on Stock Returns (Study at PT Unilever Indonesia
Tbk)”, Journal of Management Economics, Vol. 2
No.1,pp.18-25,May.2016 DOI:
http://jurnal.unsil.ac.id/index.php/jem/article/view/
309/221
[24] Cahyaningrum YW & Antikasari TW, “The Effect
of Earning Per Share, Price To Book Value,
Return On Assets and Return On Equity Against
Stock Prices in the Financial Sector”, Journal of
Economia” Vol.13, No.2, pp. 191-200, Oct. 2017
DOI:
https://journal.uny.ac.id/index.php/economia/articl
e/view/13961/pdf
[25] Mahadewi & Candraningrat,”The Effect of Return
On Asset, Earning Per Share and Debt Ratio on
Stock Prices at LQ-45 Index Companies in the
Indonesia Stock Exchange” Management E-
Journal, Vol.3, No.12, pp. 3558-3577, 2014 DOI :
https://ojs.unud.ac.id/index.php/Manajemen/article
/view/9975/7912
[26] Khairani I, “The Effect of Earning Per Share
(EPS) and Dividend Per Share on Share Prices of
Mining Companies Listed on the Indonesia Stock
Advances in Economics, Business and Management Research, volume 179
64

Exchange (BEI) 2011-2013”, Journal of
Management and Finance, Vol.5, No.1, pp. 566-
572,May.2016 DOI:
https://ejurnalunsam.id/index.php/jmk/article/view
/75/48
[27] Ginsu FFG, Saerang IS & Roring F, “Effect of
Earning Per Share (EPS) and Return On Equity
(ROE) on Stock Prices (Case Study in the Food
and Beverage Industry Listed on the Indonesia
Stock Exchange for the period 2013-2015”,
Journal of EMBA, Vol.5, No.2, pp. 1327-1336,
June. 2017 DOI:
https://ejournal.unsrat.ac.id/index.php/emba/article
/view/16162/15667
Advances in Economics, Business and Management Research, volume 179
65