THE EFFECT OF CROSS-LISTING ON TRADING VOLUME: REDUCING SEGMENTATION VERSUS SIGNALING INVESTOR...
39
1 The Effect of Cross-Listing on Trading Volume: Reducing Segmentation versus Signaling Investor Protection Abed Al-Nasser Abdallah * Assistant Professor of Accounting at the American University of Sharjah, Sharjah, P.O.Box: 26666, email: [email protected] Wissam Abdallah Assistant Professor of Finance at the Lebanese American University, Business School, P.O. Box 13-5053, Chouran Beirut 1102 2801, Lebanon; email: [email protected] Mohsen Saad Assistant Professor of Finance at the American University of Sharjah, Sharjah, P.O.Box: 26666, email: [email protected] * Corresponding author: Abed Al-Nasser Abdallah, Assistant Professor of Accounting at the American University of Sharjah, Sharjah, P.O.Box: 26666. Tel: +971 6 5152594, email: [email protected]. The authors would like to thank the Institutional Brokers Estimate System (I/B/E/S) for providing analyst following data.
-
Upload
independent -
Category
Documents
-
view
3 -
download
0
Transcript of THE EFFECT OF CROSS-LISTING ON TRADING VOLUME: REDUCING SEGMENTATION VERSUS SIGNALING INVESTOR...

1
The Effect of Cross-Listing on Trading Volume: Reducing Segmentation versus Signaling Investor Protection
Abed Al-Nasser Abdallah∗
Assistant Professor of Accounting at the American University of Sharjah, Sharjah, P.O.Box: 26666, email: [email protected]
Wissam Abdallah
Assistant Professor of Finance at the Lebanese American University, Business School, P.O. Box 13-5053, Chouran Beirut 1102 2801, Lebanon; email:
Mohsen Saad
Assistant Professor of Finance at the American University of Sharjah, Sharjah, P.O.Box: 26666, email: [email protected]
∗ Corresponding author: Abed Al-Nasser Abdallah, Assistant Professor of Accounting at the American University of Sharjah, Sharjah, P.O.Box: 26666. Tel: +971 6 5152594, email: [email protected]. The authors would like to thank the Institutional Brokers Estimate System (I/B/E/S) for providing analyst following data.
2
The Effect of Cross-Listing on Trading Volume: Reducing Segmentation versus Signaling Investor Protection
Abstract
This paper investigates the relationship between cross-listing and trading volume, using a
sample of 668 foreign firms from 44 countries, which have cross-listed on the US and UK
regulated and unregulated exchanges. Evidence shows an increase in the level of trading
volume for 67% of cross-listed firms as a result of reducing segmentation, but not
signaling investor protection. Results show that market trading volume, number of
analysts and their forecast accuracy are the major determinants of such an increase. The
results hold for both regulated and unregulated foreign listings and for firms from poor
and good corporate governance countries. Moreover, the findings show that US investors
trade foreign securities based on the risk of the foreign firm, its number of analysts, and
not on the level of investor protection in the firm’s home market.
JEL classification: G14, G15, G18, G32 Keywords: Cross-listing, investor protection, analysts following, forecast error, trading volume, liquidity, civil law, common law, emerging market, developed market
3
1. Introduction
This paper investigates the theoretical reasoning underlying cross-listing, by focusing on
its effect on the level of trading volume of cross-listed firms. Mittoo (1992) surveyed 78
managers from Canadian firms listed on different stock exchanges around the world and
reports that increasing liquidity through trading volume is regarded as the most targeted
benefit from cross-listing. As cross-listing facilitates access to foreign shares, the interest
of investors in holding these shares is increasing over time. For example, according to the
World Federation of Exchanges, the average trading volume for all foreign shares around
the world has increased from 25,346.2 million shares with a value of $1,141,896.9 million
by the end of 2000, to 63,806.5 million shares with a value of $2,521,499.2 million by the
end of 2007, representing a 151.74% increase in the number of foreign shares traded
internationally, and a 120.82% increase in the value of these shares. As for the firm’s
home investors, cross-listing provides a positive signal of the firm’s ability to meet the
international listing requirements. However, whether such a signal is due to the firm’s
commitment to increase the level of investor protection or the event of cross-listing per
se, is an open question. Stated differently, given the shift in the focus of the cross-listing
research from reducing segmentation to increasing the level of investor protection, it is
not clear as to which of these the increase in trading volume of the cross-listed firm can
be related, and what determines such an increase in home as well as foreign markets. The
limited scope of previous work that tested cross-listing and trading volume, focused on
segmentation, and considered a set of cross-listed firms drawn from one population, e.g.,
Japan (Barclay et al., 1990), Canada (e.g. Foerster and Karolyi, 1993, 1998; Mittoo,
1997), Mexico (Domowitz et al., 1998), Chile (Jayakumer, 2002), and Malaysia (Lau and
4
McInish, 2002). In addition to the fact that the results of these studies are not
generalisable, they also proved to be inconclusive, providing an opportunity for this paper
to emerge. Using a sample of 668 foreign firms from 44 countries, listed on regulated and
unregulated exchanges in the US and UK, the evidence suggests an increase in the level
of trading volume for cross-listed firms as the result of reducing segmentation, and hence
cross-border listing, but not signaling investor protection.
This paper contributes to the existing cross-listing literature in major ways. As for
the focus, all of the previous work focuses on reducing segmentation, and hence dual
market trading, as the major effect on trading volume. This paper is the first to test the
relationship between trading volume and signaling investor protection through cross-
listing. More specifically, the paper aims to test whether the market perceives cross-
listing on an exchange with higher regulations as a signaling mechanism for the cross-
listed firm’s commitment to increase the level of investor protection. Also, it is the first to
test whether the level of corporate governance in the cross-listed firm’s home market
matters for foreign investors. As for the sample, while previous studies focus on cross-
listing on the US-regulated exchanges by a set of firms drawn from one population, this
paper is the first to consider foreign firms from 44 countries, which have cross-listed on
regulated and unregulated exchanges in the US and UK. Also, this paper is the first to
explore what determines the home, as well as foreign trading volume activities for cross-
listed firms. By doing so, the paper questions the bonding hypothesis, and accordingly,
adds support to the previous studies that undertook different research but reach a slightly
similar conclusion (e.g. Ammer et al., 2006). The rest of the paper is organised as
follows. Section 2 discusses the background and develops the hypotheses, and section 3
5
explains the research design. Section 4 discusses the empirical results, section 5 presents
some robustness checks, and section 6 concludes.
2. Background and Hypotheses Development
2.1. Cross-listing of Shares in the US and UK
Cross-listing in the US can be conducted in the form of ordinary shares such as Canadian
shares, or in the form of American Depositary Receipts (ADRs). ADRs were established
in 1927 by J P Morgan to aid US investors who wanted to purchase shares of non-US
firms. An ADR is a negotiable certificate representing ownership of shares in a foreign
company. Each ADR denotes depositary shares (DSs) that represent a certain number of
the underlying shares (usually up to 6% of the total number of shares of the cross-listed
firm) remaining on deposit in the depositary bank in the issuer’s home market (e.g. The
Bank of New York). ADR levels 2 and 3 are traded on the US-regulated exchanges such
as Amex, NYSE, and NASDAQ, whereas ADRs level 1 and R144A are traded on
unregulated exchanges such as OTC and PORTAL, respectively.1 According to the Bank
of New York, ADR level 1 and R144A are less liquid than ADR levels 2 and 3, since the
former are traded on unregulated exchanges.
On the contrary, the majority of foreign listings (more than 70%) in the UK, on
the London Stock Exchange (LSE), are conducted in the form of ordinary shares, whereas
listing depositary receipts, which was only introduced in 1994 by the London Stock
Exchange (LSE), represents only about 10%. Those remaining are warrants and fixed
interest securities, representing about 20% of the foreign listings.
1 OTC is the National Quotation Bureau (NQB), an inter-dealer quotation system that publishes a daily listing of equities traded Over-The-Counter (OTC), called the “Pink Sheet”. On the other hand, PORTAL (Private Offerings,
6
2.2. The Effects of Reducing Segmentation through Cross-listing on Trading Volume
Increasing trading volume in order to increase liquidity is seen as one of the main
motivations for firms to cross-list. The theory suggests that before cross-listing, the firm
is tied with the liquidity available in its home market, which may not satisfy the firm’s
need for external financing. But, cross-listing that reduces segmentation (ownership
restriction) enables that firm to improve its level of trading volume, and thus liquidity, by
extending its shareholder base, and accordingly raising funds on more than one market,
especially if the firm cross lists on a more liquid market relative to its domestic market.2
Furthermore, because the trading hours between the foreign and domestic markets
may differ, the cross-listed firm has the opportunity to extend the trading hours in its
stocks and thus increase trading volume and provide alternative trading locations for its
stock. Besides, as argued by Alexander et al. (1988), cross-listing provides home
investors with a positive signal regarding whether the firm is able to meet the
requirements of the international listing.
Empirically, Mittoo (1992), and Fatemi and Rad (1996), found that increasing
trading volume has been perceived as a net benefit of cross-listing. Mittoo (1997), in this
respect, reports a significant post-cross-listing increase in the trading volume and stock
turnover of about 29% and 80%, respectively, for her sample of Canadian stock listed in
the US. Similarly, Foerster and Karolyi (1993, 1998) found an increase in trading volume
Resales and Trading through Automated Linkages) is NASDAQ’s quotation system, a private market that is operated by Qualified Institutional Buyers (QIBs). 2 The removal of ownership restrictions may induce large foreign institutional investors to trade the home shares of the cross-listed firm instead of the foreign shares. For example, the shares of foreign firms that are listed on PORTAL are traded privately by large American institutional investors. Also, the way ADRs are traded affects the trading volume in the home market. For instance, to buy or sell ADRs, US investors ask a US broker to buy (sell) ADRS. The US broker contacts the firm’s home broker and asks him to buy (sell) an equivalent number of underlying shares in the home market of the cross-listed firm.

7
and liquidity after cross-listing, for a sample of 34 and 53 Canadian stocks listed on the
NYSE, respectively. Other studies such as those of Hargis and Ramanlal (1998),
Domowitz et al. (1998), Hargis (2000), Lau and McInish (2002), and Halling et al.
(2006), also report a positive effect of cross-listing on the firm’s home market trading,
while Jayakumar (2002) and Levine and Schmukler (2007) report a concentrated trading
volume in the ADR market. Hence, it is expected, due to this multi-market trading effect,
that both regulated and unregulated foreign firms will experience an increase in trading
volume following cross-listing.
H1: Cross-listing increases the level of trading volume of firms.
2.3. The impact of the legal bonding on trading volume
The relationship between private benefits of control, which company managers enjoy, and
the value of the firm has attracted much attention in capital market research. Jensen’s and
Meckling’s (1976) theory of agency costs suggests that the more the private benefits of
control, the lower the value of the firm, and hence, the higher the cost of external
financing. La Porta et al. (2000), in this regard, argue that managers in a country with low
investor protection regulations are more able to expropriate minority shareholders by, for
example, stealing the profits, selling the output or assets or additional stocks in the firm
they control to another firm that they own, at below market prices. Such an expropriation
will increase the risk to investors and lead them to require a higher rate of return on their
investment. Stutz (1999) suggests that improving corporate governance through cross-
listing will reduce the cost of external financing. Similarly, Coffee (1999, 2002) discusses
the effect of legal bonding by arguing that to reduce the cost of external financing,
8
managers of firms will commit themselves to improve the level of investor protection
through cross-listing on an exchange with better regulations, which will bond them from
taking private benefits of control. Studies by La Porta et al. (2000, 2002), Lombardo and
Pagano (1999a, 1999b), and Reese and Weisbach (2002) offer theoretical and empirical
support for the bonding argument. However, the possible explanation for the decision by
an owner manager to lose some of the private benefits through cross-listing is based
primarily on the gain from having access to external financing, and the increase in the
public value of the firm’s shares. Reese and Weisbach (2002) and Benos and Weisbach
(2004) regard the latter to be relatively larger than the size of private benefits of control.
This explanation suggests that the bonding mechanism is used as a way of
signaling to outside investors, the firm’s intention or commitment to protect investors.
Accordingly, as home investors perceive cross-listing on an exchange with better
regulations as a positive signal, they update their belief about the future performance of
the firm and the way its control group acts. This will persuade investors to trade in the
firm’s shares, and as a consequence, the firm’s trading volume will increase.3 Brockman
and Chung (2003) argue that a market with a good investor protection system reduces
investor uncertainty as it reduces information asymmetry, which in turn, as stated by La
Porta et al. (2000), encourages the development and growth in capital markets.
Empirically, Brockman and Chung (2003) find a positive relation between firms’ liquidity
(measured as the bid-ask spread and depth) and the quality of the investor protection
environment in the firm’s home market.4 However, since both regulated and unregulated
3 Yadav (1992) argues that the change in trading volume is seen as an indication of the change in investors’ beliefs and expectations about the firm. 4 Nonetheless, Brockman’s and Chung’s (2003) study is limited to comparing the cost of liquidity between firms traded in Hong Kong with good investor protection, and firms traded in China with poor investor protection, and find that firms traded in Hong Kong have a higher depth and lower bid-ask spread. This study is entirely different in terms of focus and methodology, as will be explained later.

9
exchanges will be subject to multi-market trading as the result of cross-listing, both
groups may experience an increase in trading volume, but the magnitude of such an
increase is expected to be higher for regulated exchanges due to the effects of strong
corporate governance regulations. This leads to the following two hypotheses:
H2: Cross-listing on foreign regulated exchanges with better investor protection
regulations should be associated with a higher increase in the firm’s trading
volume than cross-listing on unregulated exchanges.
H3: The increase in trading volume for firms from poor investor protection
environments cross-listed on regulated exchanges is higher than that of firms
from good investor protection environments.
3. Research Design
3.1. Statistical tests
Yadav (1992) discusses several models used by previous studies in conducting event-
studies trading volume.5 He argues that in the absence of a widely-accepted trading
volume-based event studies model, a general multiple regression model with suitable
control and dummy variables is most appropriate for trading volume. Following this, we
employed a modified version of the international assets pricing model, and test the change
5 For example Beaver (1968) and Morse (1981) used a trading volume market model similar to the price market model, whereas Lakonishok and Vermaelin (1986) used the mean-adjusted model.

10
in trading volume after cross-listing, after controlling for several factors that affect
trading volume. The model is:
)1.(EqINDUSTRYDEVDPOSTFEAFRETSTDDMKVOSIZETV
i
iiiiiiiiti
++++++++=
TV refers to the cross-listed firm’s trading volume, which is the average pre (-250, -1)
and the average post (+1, 250) cross-listing periods for firm i. The analysis uses two
measures of trading volume employed by previous studies such as Mittoo (1997), which
are trading volume (VO), and stock turnover (TO).6 VO is the number of daily traded
shares, measured by the natural logarithm of trading volume to account for non-linearity
in trading volume data. TO is calculated as VO divided by the number of shares
outstanding. 7 TO is employed in this study to control for the effects of change in the
number of shares outstanding, as suggested by Mittoo (1997).8 As VO and TO are
different in nature, they will be interpreted separately. Size is the market value of firm i at
day 60 before cross-listing. A firm size is controlled for, although the direction of its
effects on trading volume is yet not clear. Mittoo (1997) found size to be negatively
related to the firm’s level of trading volume, whereas Halling et al. (2006) report the
opposite. DMKVO is the total trading volume of all firms in the cross-listed firm’s home
market. It is positively related to the firm’s trading volume, as suggested by studies
discussed before.
6 For more information on other studies that used these two measures, see Yadav (1992), page 173. 7 Previous studies that used the natural log transformation include, but are not limited to, Morse (1980), Pincus (1983), Halling et al. (2006), and in addition, Ajinkya and Jain (1989) found that the natural log transformation of trading volume is approximately normally distributed. 8 Mittoo (1997) argues that the change in number of shares outstanding (NOSH) can be significant and needs to be controlled for. She found a significant increase in the number of outstanding shares after cross-listing by 13% and 38% for Toronto Stock Exchange, and Vancouver Stock Exchange firms, respectively. In addition, Datar et al. (1998) argue that “the number of traded shares in itself is not a sufficient statistic measure for the liquidity of a stock since it does not take into account the differences in the number of shares outstanding or the shareholder base” (p.205).
11
Stock return (RET) and volatility (STD) are the absolute value of the average daily
returns and standard deviation of firm i. Yadav (1992) refers to a firm stock return as a
measure of the change or the arrival of information about a firm.9 Datar et al. (1998), in
this regard, find it to be negatively related to stock turnover. Similarly, Richardson et al.
(1986) use the stock abnormal return along with its volatility, in their trading volume
model as a measure of information related to clientele adjustments in response to change
in dividend policy announcement. Halling et al. (2006), on the other hand, find stock
volatility to be positive and significant in the foreign to domestic trading ratio regression,
but insignificant in the domestic trading regression. However, most previous studies
mentioned in Yadav’s (1992) paper on trading volume, find empirical support for the
volatility-volume positive relationship. Moreover, AF represents the number of analysts
following, which is interpreted as the level of information dissemination. AF is accounted
for since Rajan and Servaes (1997) report more analysts’ activities around IPO trading.
Halling et al. (2006) report a positive and significant relation between the number of
analysts and the firm’s domestic trading.
Given that the number of analysts does not reflect the quantity of information that
an analyst gathers about a firm, analysts’ forecast errors (FE) is introduced into the
regression. FE is calculated as the absolute value of the difference between the forecasted
earnings per share and actual earnings per share, scaled by stock price at the date of the
forecast.10 Data for all control variables are obtained for the period (-250, +250). DPOST
is a dummy variable that takes the value of 1 in the post-cross-listing period and 0
9 Yadav (1992) argues that information impacts trading volume where the arrival of information will result in a change in expectations for a sub-set of investors, and thus create incentives to trade. 10 One may argue that stock return may also reflects the same information reflected in analysts’ forecasts. However, information is not equally known by all investors, given the existence of informed and liquidity traders. The use of analysts’ forecast errors along with stock return and volatility, accounts for all private and public information available
12
otherwise. It captures the average change in the level of trading volume in the post-cross-
listing period. DEV is a dummy variable that equals 1 if the firm is from a developed
country and 0 otherwise. Trading volume differs between developed and emerging
markets, as suggested by Halling et al. (2006), given the difference in regulations, market
development, and size between the two groups. INDUSTRY represents Datastream’s level
3 major industries, which are industrial, financial, consumer goods, services, information
technology, resources, and utilities. DPOST is the interest of the analysis, which is
expected to be positive and significant.
Moreover, in order to explain what derives the change in the firm trading volume
after cross-listing, a similar regression to Eq. 1, but using the change in trading volume
between the pre- and post-cross-listing periods as the dependent variable, is conducted.
The changes in each of the control variables specified in Eq. 1 are used as the explanatory
variables. The regression is:
)2.(** EqINDUSTRYIPMEASUREREGDEVREGDIFFEDIFAFDIFRETDIFSTDDIFMKVODIFSIZEDIFTV
iii
iiiiiii
++
++++++=
DIF represents the difference between the post- and pre-cross-listing period for each of
the variables highlighted in Eq. 2. TV stands for trading volume variables, VO and TO.
REG is a dummy variable that takes the value of 1 if the firm has cross-listed on the
regulated exchanges, AMEX, NASDAQ, NYSE, and LSE, and 0 if it has cross-listed on
the unregulated exchanges OTC and PORTAL. IPMEASURE is the level of investor
protection in the firm’s home country, and is based on La Porta et al.’s measures (1997,
about a firm, which also includes press news and other types of information. Nonetheless, in order to test for the multi-colinearity problem among the control variables, a correlation test is conducted and reported in Table 2.
13
1998) of a country’s level of corporate governance, and these are (i) whether the firm is
from a civil (France, Germany, and Scandinavian) or a common law country, (ii)
accounting standards index, (iii) rule of law index, and (iv) anti-director rights index.11
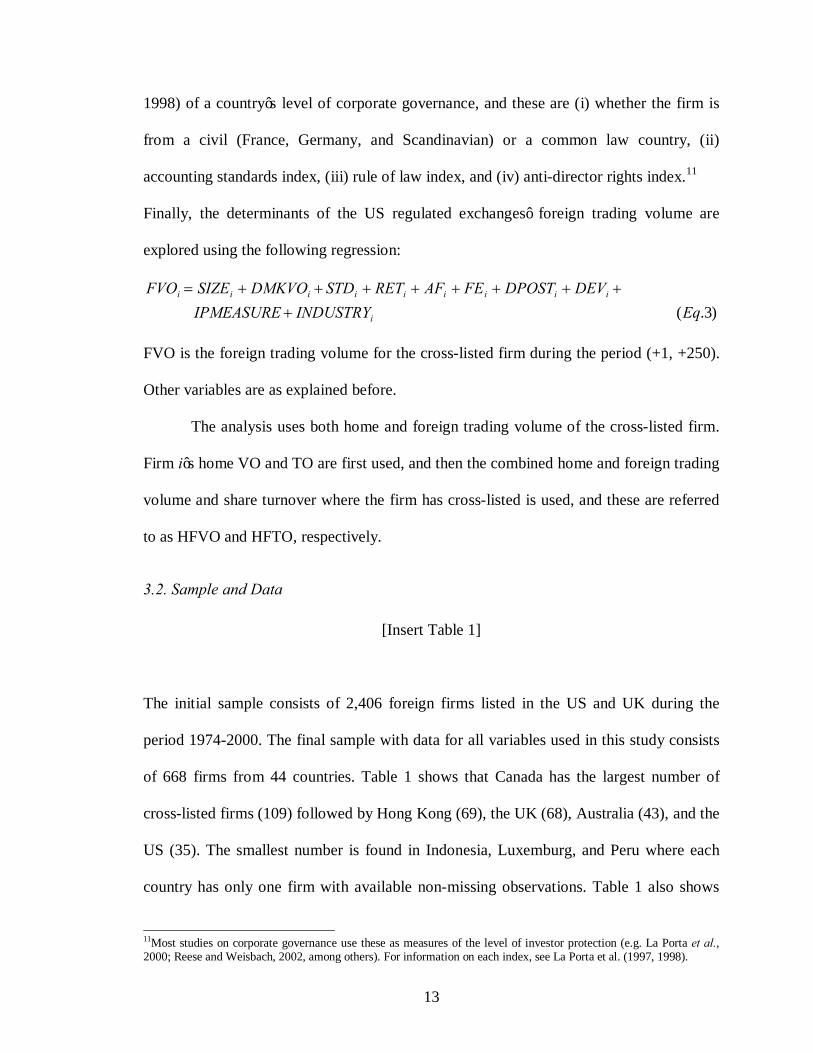
Finally, the determinants of the US regulated exchanges’ foreign trading volume are
explored using the following regression:
)3.(EqINDUSTRYIPMEASUREDEVDPOSTFEAFRETSTDDMKVOSIZEFVO
i
iiiiiiiii
+++++++++=
FVO is the foreign trading volume for the cross-listed firm during the period (+1, +250).
Other variables are as explained before.
The analysis uses both home and foreign trading volume of the cross-listed firm.
Firm i’s home VO and TO are first used, and then the combined home and foreign trading
volume and share turnover where the firm has cross-listed is used, and these are referred
to as HFVO and HFTO, respectively.
3.2. Sample and Data
[Insert Table 1]
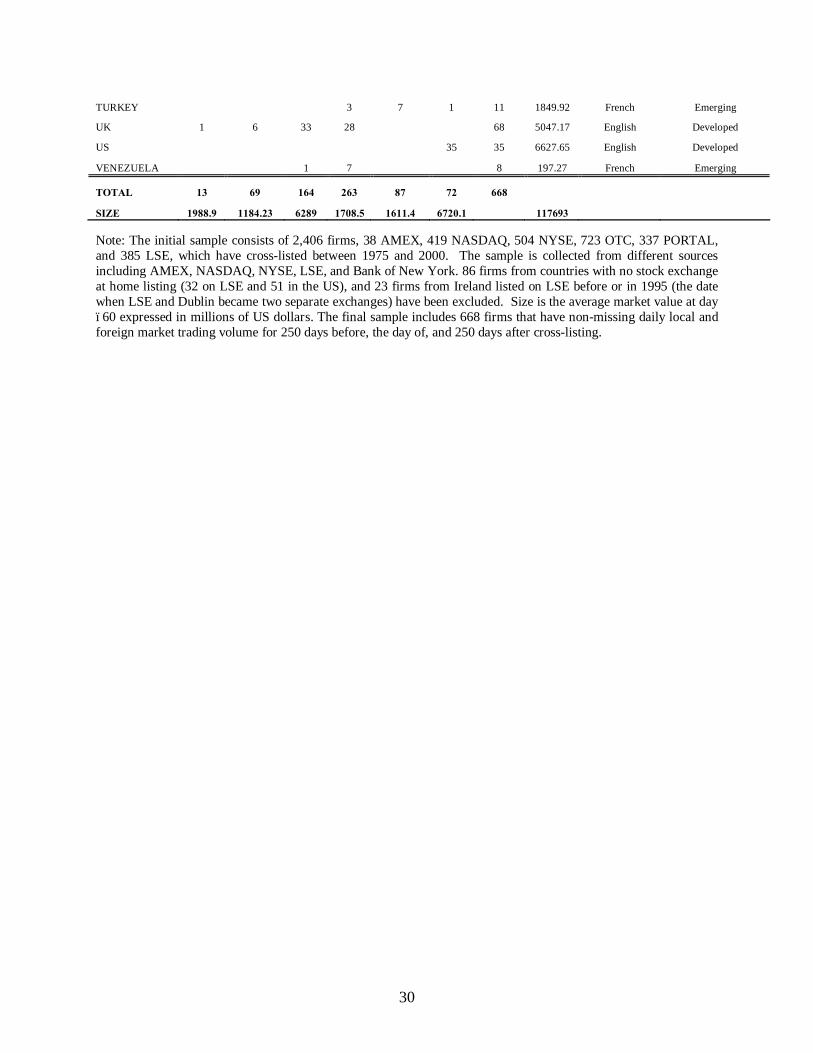
The initial sample consists of 2,406 foreign firms listed in the US and UK during the
period 1974-2000. The final sample with data for all variables used in this study consists
of 668 firms from 44 countries. Table 1 shows that Canada has the largest number of
cross-listed firms (109) followed by Hong Kong (69), the UK (68), Australia (43), and the
US (35). The smallest number is found in Indonesia, Luxemburg, and Peru where each
country has only one firm with available non-missing observations. Table 1 also shows
11Most studies on corporate governance use these as measures of the level of investor protection (e.g. La Porta et al., 2000; Reese and Weisbach, 2002, among others). For information on each index, see La Porta et al. (1997, 1998).
14
that OTC attracts most of the cross-listing firms, 263 firms compared to 164 for NYSE,
87 for PORTAL, 72 for LSE, 69 for NASDAQ, and 13 for AMEX.
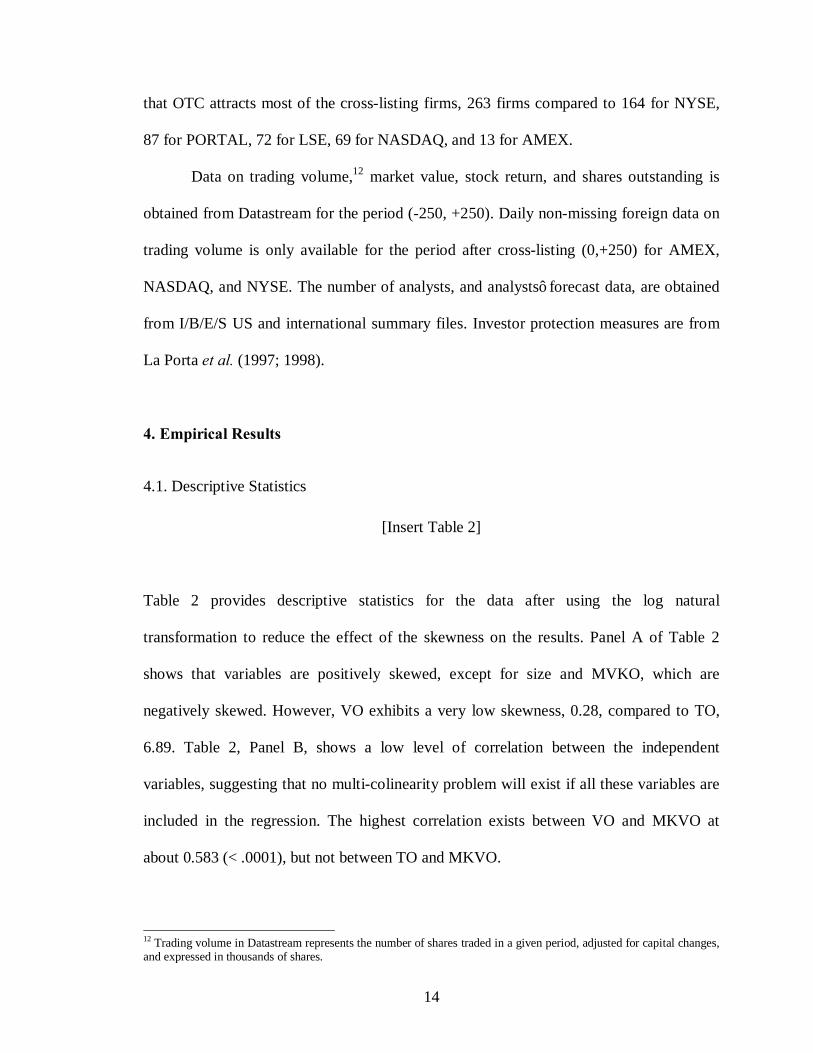
Data on trading volume,12 market value, stock return, and shares outstanding is
obtained from Datastream for the period (-250, +250). Daily non-missing foreign data on
trading volume is only available for the period after cross-listing (0,+250) for AMEX,
NASDAQ, and NYSE. The number of analysts, and analysts’ forecast data, are obtained
from I/B/E/S US and international summary files. Investor protection measures are from
La Porta et al. (1997; 1998).
4. Empirical Results
4.1. Descriptive Statistics
[Insert Table 2]
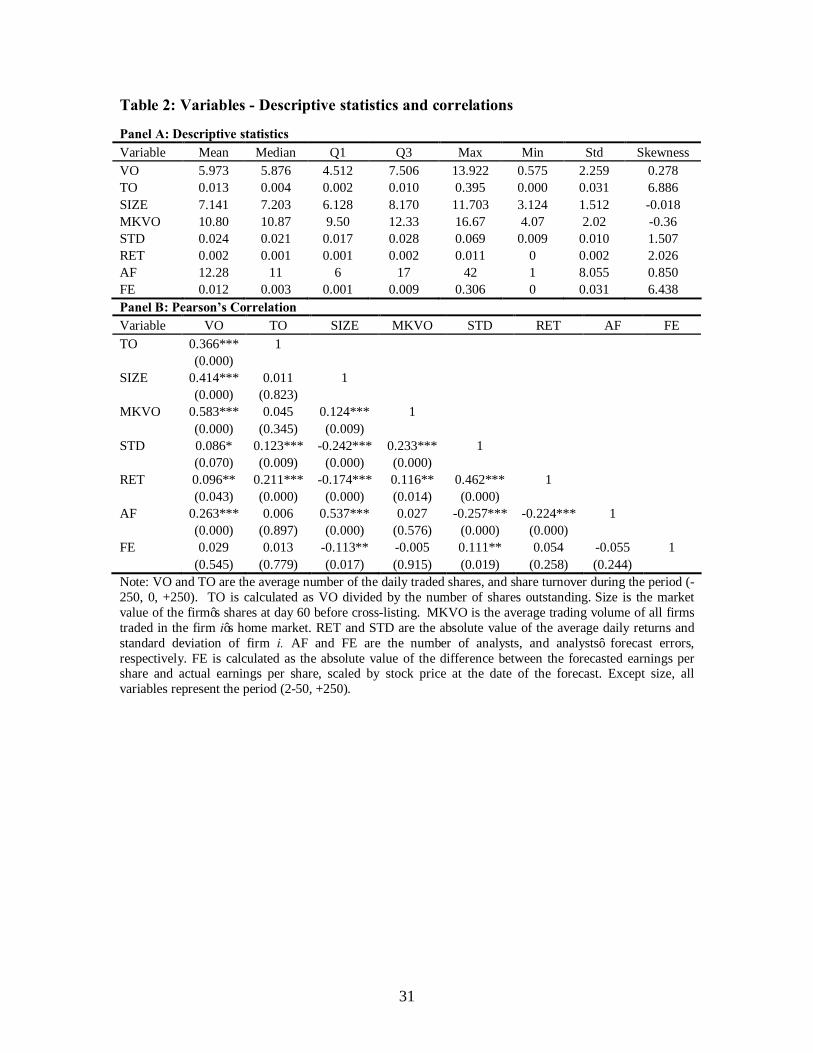
Table 2 provides descriptive statistics for the data after using the log natural
transformation to reduce the effect of the skewness on the results. Panel A of Table 2
shows that variables are positively skewed, except for size and MVKO, which are
negatively skewed. However, VO exhibits a very low skewness, 0.28, compared to TO,
6.89. Table 2, Panel B, shows a low level of correlation between the independent
variables, suggesting that no multi-colinearity problem will exist if all these variables are
included in the regression. The highest correlation exists between VO and MKVO at
about 0.583 (< .0001), but not between TO and MKVO.
12 Trading volume in Datastream represents the number of shares traded in a given period, adjusted for capital changes, and expressed in thousands of shares.
15
4.2. Univariate Analysis
4.2.1. Testing H1 and H2
[Insert Table 3]
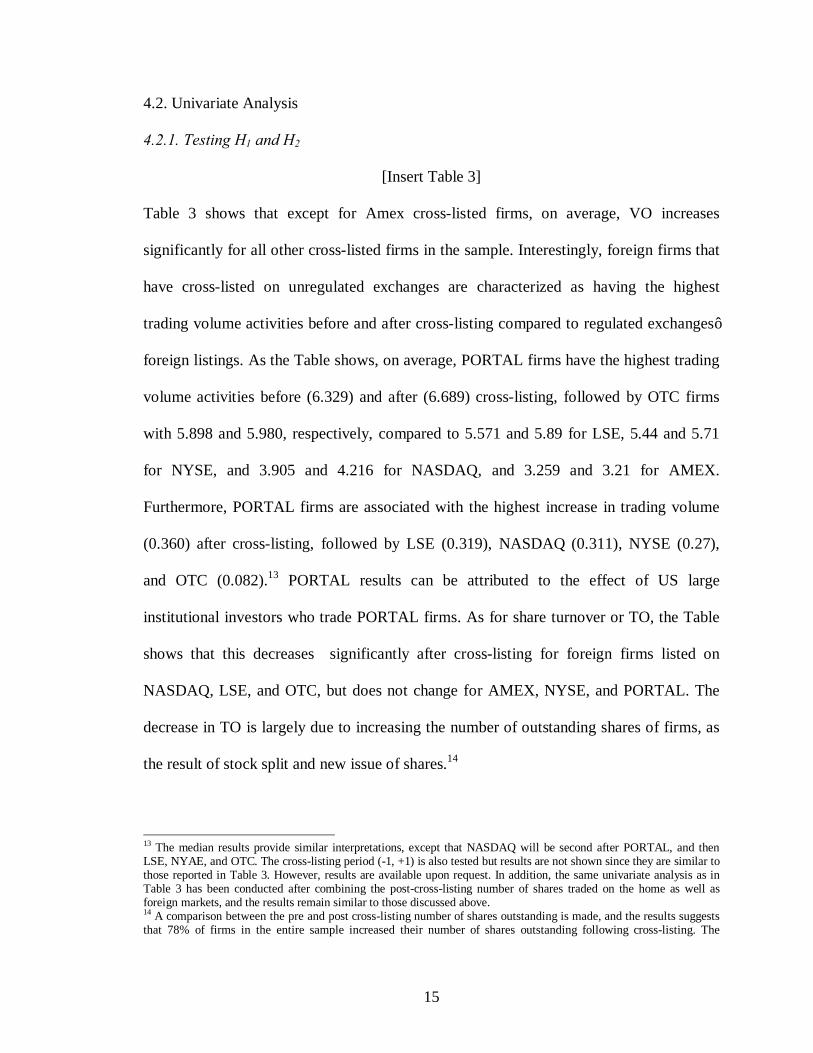
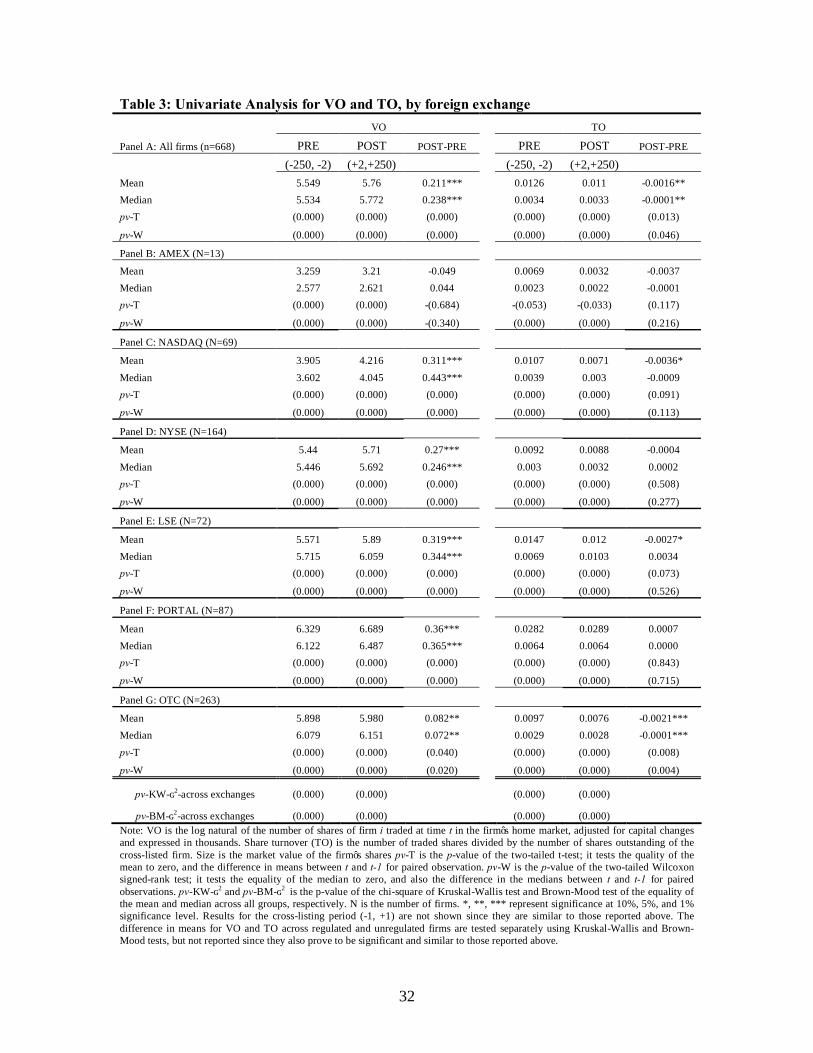
Table 3 shows that except for Amex cross-listed firms, on average, VO increases
significantly for all other cross-listed firms in the sample. Interestingly, foreign firms that
have cross-listed on unregulated exchanges are characterized as having the highest
trading volume activities before and after cross-listing compared to regulated exchanges’
foreign listings. As the Table shows, on average, PORTAL firms have the highest trading
volume activities before (6.329) and after (6.689) cross-listing, followed by OTC firms
with 5.898 and 5.980, respectively, compared to 5.571 and 5.89 for LSE, 5.44 and 5.71
for NYSE, and 3.905 and 4.216 for NASDAQ, and 3.259 and 3.21 for AMEX.
Furthermore, PORTAL firms are associated with the highest increase in trading volume
(0.360) after cross-listing, followed by LSE (0.319), NASDAQ (0.311), NYSE (0.27),
and OTC (0.082).13 PORTAL results can be attributed to the effect of US large
institutional investors who trade PORTAL firms. As for share turnover or TO, the Table
shows that this decreases significantly after cross-listing for foreign firms listed on
NASDAQ, LSE, and OTC, but does not change for AMEX, NYSE, and PORTAL. The
decrease in TO is largely due to increasing the number of outstanding shares of firms, as
the result of stock split and new issue of shares.14
13 The median results provide similar interpretations, except that NASDAQ will be second after PORTAL, and then LSE, NYAE, and OTC. The cross-listing period (-1, +1) is also tested but results are not shown since they are similar to those reported in Table 3. However, results are available upon request. In addition, the same univariate analysis as in Table 3 has been conducted after combining the post-cross-listing number of shares traded on the home as well as foreign markets, and the results remain similar to those discussed above. 14 A comparison between the pre and post cross-listing number of shares outstanding is made, and the results suggests that 78% of firms in the entire sample increased their number of shares outstanding following cross-listing. The
16
Testing H3
[Insert Table 4]
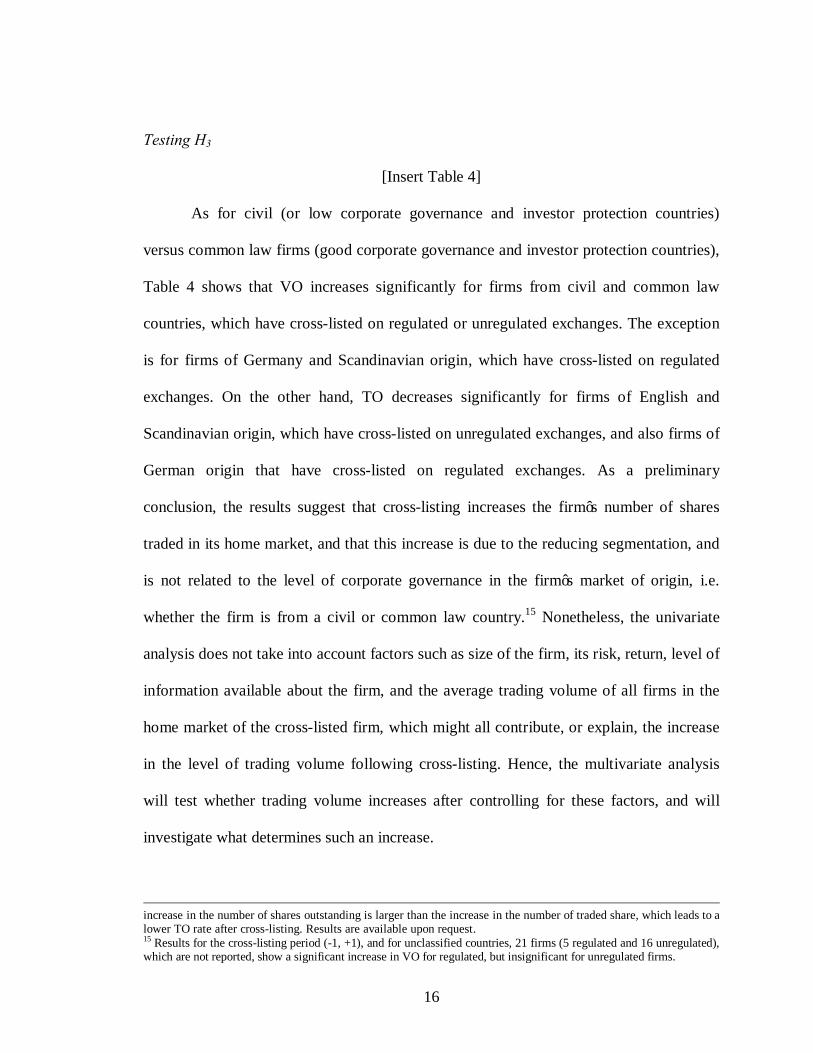
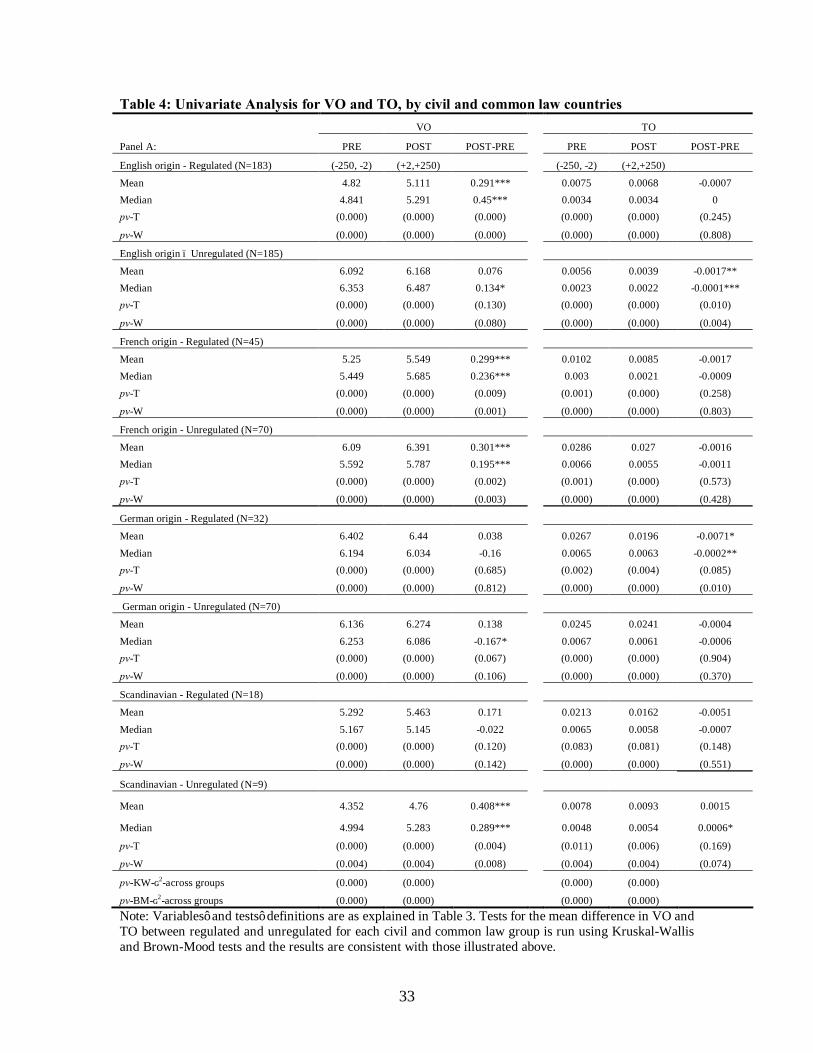
As for civil (or low corporate governance and investor protection countries)
versus common law firms (good corporate governance and investor protection countries),
Table 4 shows that VO increases significantly for firms from civil and common law
countries, which have cross-listed on regulated or unregulated exchanges. The exception
is for firms of Germany and Scandinavian origin, which have cross-listed on regulated
exchanges. On the other hand, TO decreases significantly for firms of English and
Scandinavian origin, which have cross-listed on unregulated exchanges, and also firms of
German origin that have cross-listed on regulated exchanges. As a preliminary
conclusion, the results suggest that cross-listing increases the firm’s number of shares
traded in its home market, and that this increase is due to the reducing segmentation, and
is not related to the level of corporate governance in the firm’s market of origin, i.e.
whether the firm is from a civil or common law country.15 Nonetheless, the univariate
analysis does not take into account factors such as size of the firm, its risk, return, level of
information available about the firm, and the average trading volume of all firms in the
home market of the cross-listed firm, which might all contribute, or explain, the increase
in the level of trading volume following cross-listing. Hence, the multivariate analysis
will test whether trading volume increases after controlling for these factors, and will
investigate what determines such an increase.
increase in the number of shares outstanding is larger than the increase in the number of traded share, which leads to a lower TO rate after cross-listing. Results are available upon request. 15 Results for the cross-listing period (-1, +1), and for unclassified countries, 21 firms (5 regulated and 16 unregulated), which are not reported, show a significant increase in VO for regulated, but insignificant for unregulated firms.
17
4.3. Multivariate Analysis
4.3.1 Testing H1 and H2
[Insert Table5]
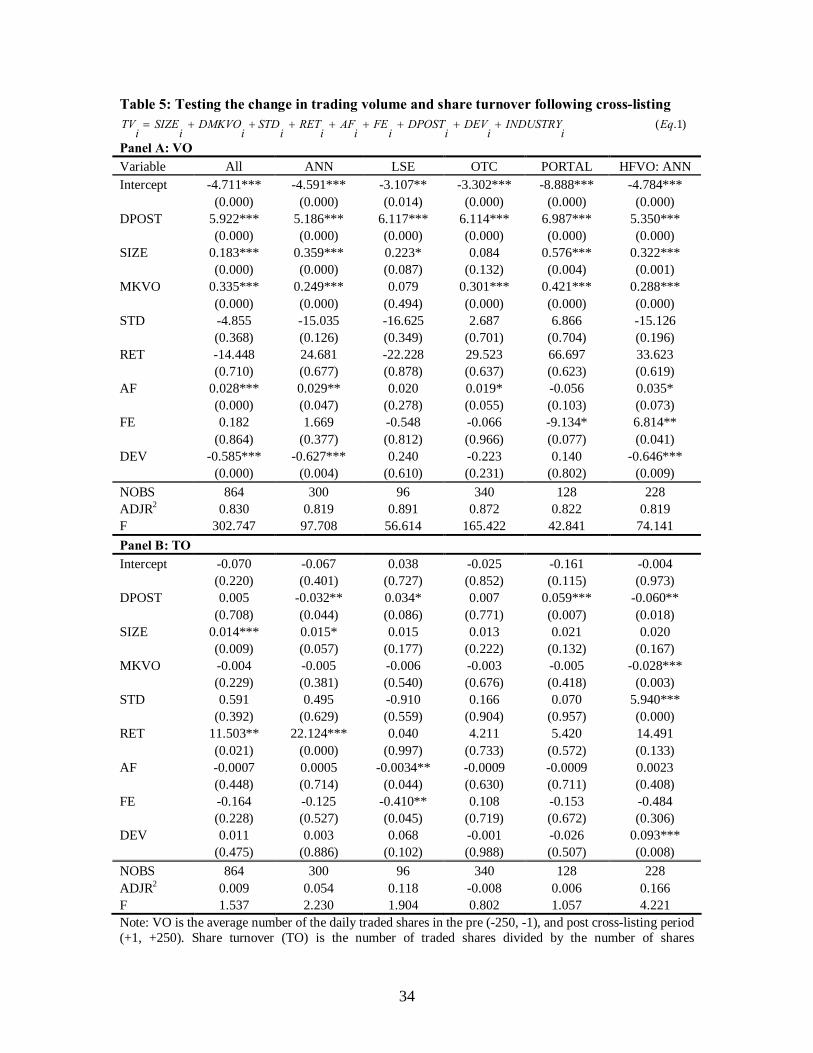
Table 5 shows the results of estimating Eq.1.16 As can be seen from Panel A, for the
entire sample and for both regulated and unregulated exchanges, DPOST is highly
significant at the 1% significance level, suggesting an increase in the level of the home
trading volume of cross-listed firms, which is consistent with H1. Surprisingly, and
inconsistent with H2, firms traded privately on PORTAL by big institutional investors
experienced the highest increase in their trading volume (6.987). This indicates an
increase in the interest of those investors to trade unregulated shares. This is followed by
LSE (6.117), OTC (6.114) and ANN: AMEX, NASDAQ, and NYSE (5.186). The change
in VO for ANN firms is increased further by 3.16%, from 5.186 to 5.350 once we include
the foreign trading. For the US market, Size and MKVO variables are highly significant
and have the highest coefficients compared to other explanatory variables, suggesting that
size and market trading volume explain much of the movement in the trading volume of
cross-listed firms.
It appears, however, that the size of the firm and its home market trading volume are
more important for PORTAL investors than they are for other exchanges in the US. The
opposite case prevails for LSE, where size is the only significant explanatory variable
(0.223; <.087), indicating this as the only important factor that derives trading volume on
LSE. The panel also suggests that stock return and volatility are not significant in any of
16 The use of either pre- or post-cross-listing observations for the control variables provides similar results, except for analyst following, in which the coefficient on the pre-cross-listing number of analyst variables is not significant,
18
the regressions. However, there is evidence to suggest that it is the number of analysts,
and not forecast error, which influences the firm’s level of trading volume. The exception
is for PORTAL firms in which AF is insignificant, but FE is negative and significant.
This means that big institutional investors in the US rely more on information provided
by home market analysts of the foreign firms, given the fact that these firms are not
required reconciling to US GAAP and reporting to the SEC any financial information.17
The lower the forecast error, and thus more information available to PORTAL investors,
the higher the trade in the firm’s shares. Also, foreign firms from developed markets
listed in the US-regulated exchanges are traded less than those from emerging markets.18
Adjusted high-squared (ADJR2) is very high in all regressions, ranging from 81.9% for
ANN to 89.10% for LSE. These results are inconsistent with the order flow diversion that
suggests that cross-listing will decrease home trading volume.19
The results for TO are to some extent, similar to those discussed before. Panel B
of Table 5 shows that cross-listed firms on US-regulated exchanges experienced a
decrease in their level of share turnover (TO= -0.032, <.044; HFTO = -0.060, <.018)
compared to LSE and PORTAL firms, which experienced an increase of 0.034 (<.086)
and 0.059 (<.007), respectively. OTC firms experienced an insignificant increase of
0.007. All explanatory variables are insignificant, except for size and return in ANN, and
MKVO (-0.028; <.003), STD, and DEV (0.093; <.008), with different signs to the one
presented in the VO models. However, the ADJR2 is very low compared to that of VO,
whereas that on the post-cross-listing is significant, and hence, we report the model with observations from the post-cross-listing period. 17 Because these firms are traded privately by institutional investors, and thus, are exempt from the disclosure and reporting requirements that face foreign firms that are listed on AMEX, NASDAQ, NYSE, and to some extent OTC. 18 A univariate analysis has been conducted for developed versus emerging markets and the results are consistent with those discussed above. 19 Another regression of the VO model is run after controlling for the number of shares outstanding, and the results remain the same.
19
ranging between -0.8% for OTC to 16.6% for AMEX, NASDAQ, and NYSE (ANN)’s
HFVO. This suggests that it is either the skewness of the TO data, or the inclusion of the
number of outstanding shares that affect the significant of the variables. Nonetheless,
given the difference in ADJR2 between VO and TO, the VO model seems to be more
appropriate for use in testing the change in trading volume in the market.
4.3.2. Testing H3
[Insert Table 6]
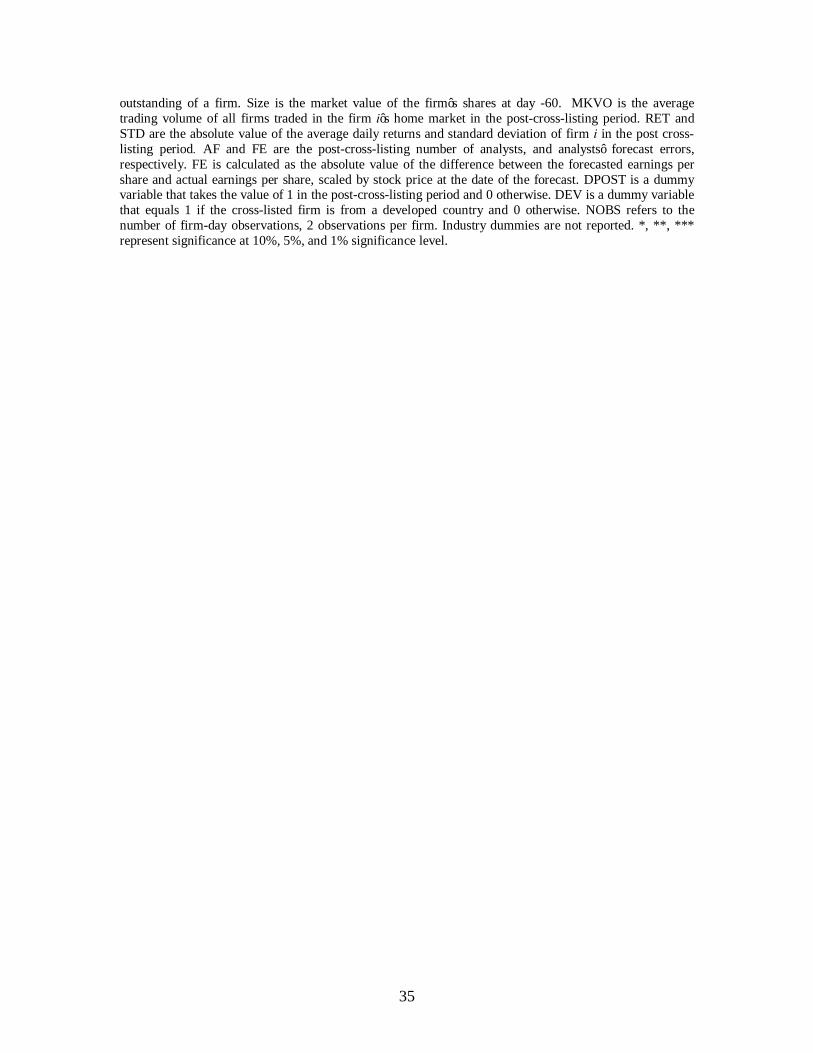
Table 6 presents the results of Eq.2. Panel A shows the results of the home trading
volume, VO and TO, whereas Panel B exhibits the results of the combined home and
foreign trading volume.
Inconsistent with H3, Panel A of Table 6 shows that in all regressions, none of
investor protection variables’ coefficients are significant, indicating no significant
difference in the change in the home trading volume between firms from low and high
levels of investor protection environments. The exception is for REGG, which is
significant but negative, suggesting that firms from the German system cross-listed on
regulated exchanges are traded less than other firms in the sample.20 In contrast, there is
evidence to suggest that firms from developed markets listed on regulated exchanges
experienced a higher increase in their home trading volume than other firms in the
sample. Furthermore, the coefficient on the change in the average market trading volume
(DIFMKVO) is positive and significant in all DIFVO regressions, suggesting that the
average trading volume for cross-listed firms increases (decreases) with respect to the
increase (decrease) in the average trading volume in the market. However, the change in

20
the firm’s level of trading volume is negatively related to size. This suggests that the
positive (negative) change, i.e. increase (decrease) in the firm’s home trading volume
following cross-listing, is higher (lower) for small firms than it is for large firms. The
Panel also shows that the positive change in trading volume is related to the firm’s level
of information; the coefficients of stock return and the number of analysts (forecast
errors) is positive (negative) and significant. Splitting the sample between positive and
negative change demonstrates that not all investors perceive cross-listing as good news.
Out of 432 firms, 290 firms (67%) experience a positive change in VO,21 or increase in
trading volume after cross-listing, and 208 in TO compared to 142 and 208 firms who
showed a negative change, i.e. a decrease in trading volume, respectively. Irrespective of
the sign of the change, and after controlling for factors that affect trading volume, the
intercepts of positive and negative VO, and positive TO regressions are significant,
indicating that cross-listing per se, signals some news to the market.
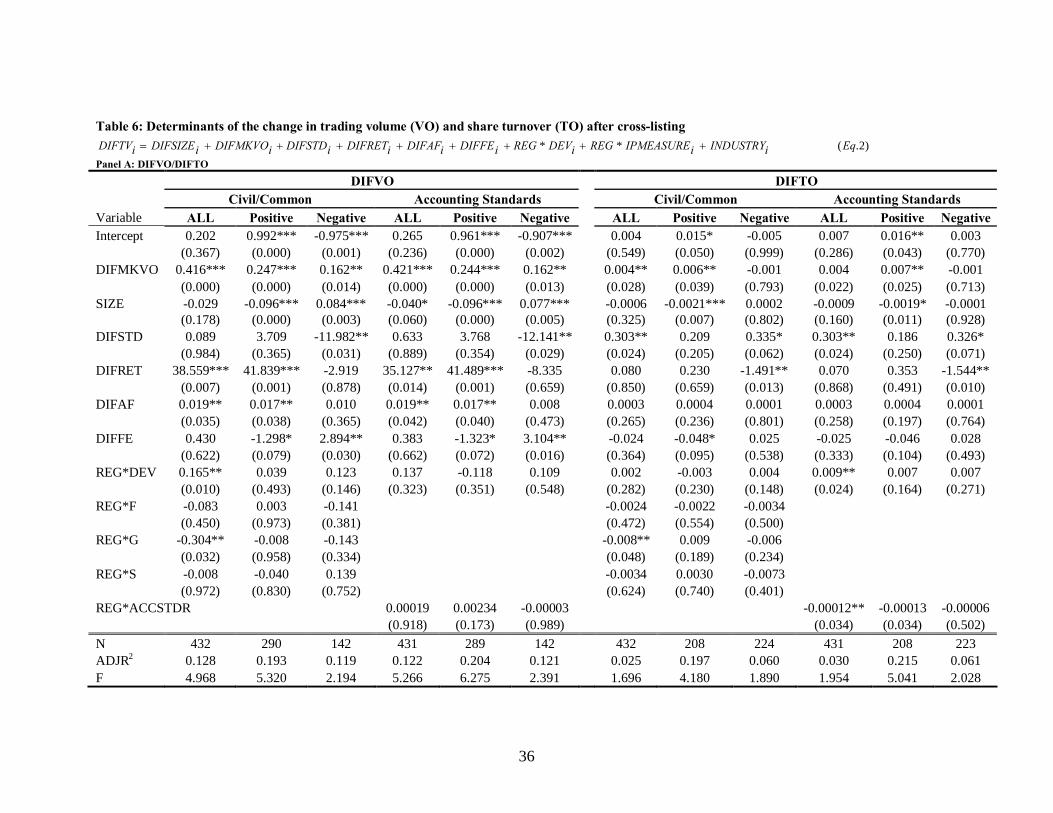
As for the change in the combined home and foreign trading volume, DIFHFVO,
and share turnover, DIFHFTO, Panel B provides similar results to those in Panel A with
respect to investor protection measures, the number of analysts, and some control
variables. The coefficient of market trading volume, size, and volatility variables is
positive and significant in the entire sample and negative change regressions. The change
in the FE variable is positive and significant in the firms with negative change regression,
which is the only regression that has a significant intercept. Overall, the findings
discussed so far suggest that cross-listing affects the level of trading volume of firms.
However, the effects vary across firms and markets, but are not related to the bounding
20 The results of the rule of Law and anti-director rights measures provide exactly similar interpretations to that of civil law, common law, and accounting standards regressions, and hence, they are not reported.
21
mechanism. Despite that, it is evident that cross-listing provides investors with a positive
signal of the future quality and growth of cross-listed firms.
[Insert Table 7]
H3 is further tested using foreign trading volume (FVO) of cross-listed firms, in
order to explain what determines it. Table 7 presents the results of regressing FVO over
control and dummy variables used in Eq. 1, with observations from the post-cross-listing
period (+1; +250) only. Except for firms from the Scandinavian system, none of the
investor protection measures is significant. The Scandinavian coefficient is significant but
negative, which suggests that this group is traded by US investors less than other firms in
the sample. Similarly, and inconsistent with previous findings, firms from developed
markets are traded in the US less than firms from emerging markets. Moreover, the
results suggest that volatility and the number of analysts are positively related to the
foreign trading volume of firms, suggesting the important role of analysts in increasing
the level of foreign trading volume. Other control variables are not significant, and
ADJR2 ranges between 38.9% and 39.9%.
5. Robustness Checks
Following Mittoo (1997), the market-adjusted trading volume (MVO), measured
as the daily trading volume for each firm divided by its home market trading for the same
day is used, and the pre-cross-listing period is compared the post cross-listing period. The
results are consistent with those presented before. A univariate analysis for developed
versus emerging markets is also conducted and finds the latter to have a higher increase in
21 181 firms from common law countries, e.g. UK, US, Singapore, etc, 60 from the French system, 38 from the German
22
trading volume after cross-listing. Additionally, a univariate analysis is conducted after
taking 5% off the top and bottom data in order to reduce the presence of outliers, and to
check whether this affects the overall results reported earlier, but they remain unchanged.
As for the multivariate analysis, return on assets is employed instead of stock return in the
regressions, and the results are similar; the return on assets’ coefficient is not significant.
Also, Eq.1 is run with observations for the explanatory variables from the pre cross-
listing period, but with no change in the findings. The number of shares outstanding is
controlled for in Eq. 1, the results remain unchanged, and although the coefficient on
number of shares outstanding variable is significant, its very small, about 0.000002.
Furthermore, an additional analysis is performed to test whether home VO explains
foreign VO, and hence, FVO is regressed over home VO and size. The home VO
coefficient is not significant. Also, instead of controlling for the overall level of trading in
the cross-listed firm’s home market, the percentage of the firm’s trading from the overall
market trading, measured as VO/MKVO, is taken into account, with no change in the
results. Finally, to detect the effect of cross-listing on trading volume in an event time, a
volume event study analysis is carried out, employing the following methods as used by
Beneish and Gardner (1995):
)5.()52,52()4.()52,52(
,,
,,
EqtTOMEANTOATOEqtVOMEANVOAVO
titi
titi
+−=−=
+−=−=
AVO and ATO are the weekly abnormal trading volume and the weekly abnormal shares
turnover, respectively, for firm i at time t, VO and TO are the weekly trading volume and
the weekly shares turnover for firm i at time t during the prediction period (-20, +52).
MEANVO and MEANTO are the mean trading volume and the mean shares turnover for
system, and 11 from the Scandinavian system.

23
firm i during the estimation period (-52, -21). To obtain the cumulative average VO
(CVO) or TO (CTO) for each week, the weekly AVO and ATO is accumulated for each
firm over the prediction period weeks (-20, +52), and then averaged across all securities.
Weekly data instead of daily data were used to perform the analysis, as the latter is not
available on a daily basis. The results remain the same.22
6. Conclusion
This paper explores the effect of cross-listing on the level of trading volume of cross-
listed firms, using two conventional theoretical explanations: reducing segmentation, and
signaling the increase in the level of investor protection. Using daily and weekly trading
volume data from both home and foreign markets and employing a univariate, cross-
sectional, and event study analysis, this paper uncovers several new findings. Firstly, the
paper hypothesizes that cross-listed firms will experience an increase in the level of
trading volume after cross-listing. The results suggest that the post-cross-listing trading
volume, VO, increases for 67% of firms, and decreases for 33%. The results are similar
when the number of shares traded on the host market where the firm chose to cross-list is
accounted for. Nonetheless, when dividing VO by the number shares outstanding to
calculate share turnover or TO, the findings show a decreased TO for 52% of firms and
an increase for 48%. Further analysis shows that, for firms that experience a positive
change in the level of trading volume, the total number of shares traded on the firm’s
home market along with share price return and the number of analysts and the accuracy of
analysts’ forecasted earnings per share, are the major determinants of this increase in
trading volume. Besides, there is evidence to suggest that firms from developed markets
cross-listed on regulated exchanges experience a higher increase in the number of shares
22 Results for robustness tests are available from the author upon request.

24
traded in their home markets. Although the results hold for both regulated and
unregulated foreign exchanges, both the univariate and multivariate analyses show that
PORTAL firms, which are traded privately by big institutional investors in the US, have
the highest trading activities followed by LSE and OTC compared to AMEX, NYSE, and
NASDAQ firms, a result which is inconsistent with Hypothesis Two. This suggests that
signaling the increase in the level of investor protection has no effect on trading volume
in the firm’s home market.
Moreover, the evidence rejects the third hypothesis that firms from poor investor
protection environments are associated with a higher increase in trading volume
compared to firms from good investor protection environments. This coupled with further
evidence on US foreign trading, which shows that foreign firms with a high risk, number
of analysts and coming from emerging markets, are traded more than other foreign firms
in the US. The coefficients on investor protection dummy variables are insignificant,
suggesting that US investors do not trade according to the level of corporate governance
in the firm’s home country, but rather on the factors discussed before.
Overall, this study finds that reducing segmentation through cross-listing,
broadens the cross-listed firm’s shareholder base, and as a result increases its trading
volume leading to an increase in liquidity. However, we failed to find any supportive
evidence of the relation between signaling the increase in the level of investor protection
and the firm’s trading volume. This study is the first to test the relation between signaling
investor protection through cross-listing and home and foreign trading. The evidence is in
contrast to previous studies that support the existence of the bonding hypothesis (e.g.
Coffee [1999]; Rees and Weisbach [2002]; Doidge et al. [2003]), and therefore, it casts
doubt on the validity of such a hypothesis.
25
References Alexander, G. J., C.S. Eun, and S. Janakiramanan (1988), “International listings of stock returns: Some empirical evidence”, Journal of Financial and Quantitative Analysis, Vol. 23, No. 2, pp. 134-151. Ajinkya, B. B. and P.C. Jain (1989), “The behaviour of daily stock market trading volume”, Journal of Accounting and Economics, Vol. 11, pp. 331-359. Ammer, J. M., S. B. Holland, D. C. Smith, and F. E. Warnock (2006), "Look at MeNow: What Attracts U.S. Shareholders?", Working paper No. 12500 (National Bureau of Economic Research, Inc, NBER, available at SSRN: http://ssrn.com/abstract=556208). Beaver, W., (1968) “The information content of annual earnings announcements”, Empirical Research in Accounting: Selected studies, Supplement to Journal of Accounting Research, Vol. 6, pp. 67-92. Barclay, M. J., R. H. Litzenberger, and J.B. Warner, (1990), “Private information trading volume, and stock-return variances”, Review of Financial Studies, Vol. 3, No. 2, pp. 233-253. Beneish, M. D. and J.C. Gardner (1995), “Information costs and liquidity effects from changes in the Dow Jones industrial average”, Journal of Financial and Quantitative Analysis, Vol. 30, No. 1, pp. 135-157. Benos, E. and M. Weisbach (2004), “Private benefits and cross-listings in the United States”, Emerging Markets Review, Vol. 5, No. 2, pp. 217-240. Brockman, P. and D.Y. Chung (2003), “Investor protection and firm liquidity”, The Journal of Finance, Vol. 58, No. 2, pp. 921-937. Coffee, J. (1999), “The future as history: the prospects of global convergence in corporate governance and its implications”, Northwestern Law Review, Vol. 93, pp. 641-708. Coffee, J. (2002), “Racing towards the top? The impact of cross-listings and stock market competition on international corporate governance”, Columbia Law School, Vol. 102, pp. 1757-1831. Datar, V. T., N.Y. Naik, and R. Radcliffe (1998), “Liquidity and stock returns: An alternative test”, Journal of Financial Markets, Vol. 1, pp. 203-219. Domowitz, I., J. Glen, and A. Madhavan, (1998), “International cross-listing and order flow migration: Evidence from an emerging market”, Journal of Finance, Vol. 53, No.6, pp. 2001-27.
26
Foerster, S. R., and G. A. Karolyi (1993), “International Listings of stocks: The case of Canada and The U.S.”, Journal of International Business Studies, Vol. 24, No. 4 (4th Qtr), pp. 763-784. Foerster, S. R., and G.A. Karolyi (1998), “Multimarket trading and liquidity: A transaction data analysis of Canada-US interlistings”, Journal of international Financial Markets, Institutions and Money, Vol. 8, pp. 393-412. Fatemi, A., and A.T. Rad (1996), “Determinants of Cross-Border Listings: The Dutch Evidence”, in M. Levis (editor), Empirical Issues in Raising Equity Capital (Netherlands: Elsevier). Halling, M., M. Pagano, O. Randl, and J., Zechner. (2006), “Where is the market? Evidence from cross-listings”, Working paper (SSRN: http://ssrn.com/abstract=890308). Hargis, K. (2000), “International cross-listing and stock market development in emerging economies”, International Review of Economics and Finance, Vol.9, No.2, pp.101–22. Hargis, K., and P. Ramanlal (1998), “When does internationalization enhance the development of domestic stock markets?” Journal of Financial Intermediation, Vol.7, pp. 263–92. Jensen, M.C., and W.H. Meckling (1976), “Theory of the firm: Managerial behavior, agency costs and ownership structure”, Journal of Financial Economics, Vol. 13, pp. 305-360. Jayakumer, V. (2002), “Impact of international cross-listing on local exchanges: Evidence from Chile”, International Review Journal, Vol. 3, No. 4, pp. 189-211. La Porta, R., F. Lopes-de-Silanes, A. Shleifer, and R. Vishny (1997), “Legal determinants of external finance”, Journal of Finance, Vol. 52, pp. 1131-1150. La Porta, R., F. Lopes-de-Silanes, A. Shleifer, , and R. Vishny (1998), “Law and Finance”, Journal of Political Economy, Vol. 106, pp. 1113-1155. La Porta, R., F. Lopes-de-Silanes, A. Shleifer, , and R. Vishny (2000), “Investor protection and corporate governance”, Journal of Finance and Economics, Vol. 58, pp. 3-27. La Porta, R., F. Lopes-de-Silanes, A. Shleifer, , and R. Vishny (2002), “Investor protection and corporate valuation”, Journal of Finance, Vol. 57, No. 2, pp. 1147-1170. Lakonishok, J., and T. Vermaelin (1986), “Tax-induced trading around ex-dividend days”, Journal of Financial Economics, Vol. 16, pp. 287-319.
27
Lau, S. T., and T. H. McInish (2002), “Cross-listing and home market trading volume: the case of Malaysia and Singapore”, Journal of Financial Research, Vol. 25, No. 4, pp. 477-484. Levine, R., and S. L. Schmukler (2007), “Migration, spillovers, and trade diversion: The impact of internationalization on domestic stock market activity”, Journal of Banking and Finance, Vol. 31, No. 6 (June), pp. 1595-1612. Lombardo, D., and M. Pagano (1999a), “Legal determinants of the return on equity”, Working paper No.24 (Centre for Studies in Economics and Finance). Lombardo, D., and M. Pagano (1999b), “Law and equity market: a simple model”, Working paper No.25 (Centre for Studies in Economics and Finance).
Mittoo, U., 1992. “Managerial perceptions of the net benefits of foreign listing: Canadian evidence”, Journal of International Financial Management and Accounting, Vol. 4, No. 1, pp. 40-62. Mittoo, U., 1997. “Cross-country listing and trading volume: Evidence from the Toronto and Vancouver stock exchanges”, Journal of International Financial Management and Accounting, Vol. 8, No. 3, pp. 147-74. Morse, D., 1980.” Asymmetrical information in securities markets and trading volume”, Journal of Financial and Quantitative Analysis, Vol. 15, pp. 1129-1148. Morse, D., 1981. “Price and trading volume reaction surrounding earnings announcements: a closer examination”, Journal of Accounting Research, Vol. 19, pp. 374-383. Pincus, M., 1983. “Information characteristics of earnings announcements and stock market behaviour”, Journal of Accounting Research, Vol. 21, pp. 155-183. Reese, W.A., and M.S. Weisbach (2002), “Protection of minority shareholder interests, cross-listings in the United States, and subsequent equity offerings”, Journal of Financial Economics, Vol. 66, pp. 65-104. Richardson, G., S. F. Sefcik, and R. Thompson (1986), “A test of dividend irrelevance using volume reactions to a change in dividend policy”, Journal of Financial Economics, Vol. 17, pp. 313-333. Rajan, R., and H. Servaes, (1997), “Analyst following of initial public offerings”, Journal of Finance, Vol. 52, No. 2, pp. 507-529. Stulz, R.M. (1999), “Globalization, corporate finance, and the cost of capital”, Journal of Applied Corporate Finance, Vol. 12, pp. 8-25.

28
Yadav, P. (1992), “Event studies based on volatility of returns and trading volume: A review”, British Accounting Review, Vol. 24, pp. 157-184.

29
Table 1: Sample descriptive statistics
CTRY AMEX NASDAQ NYSE OTC PORTAL LSE TOTAL SIZE Civil/Common Developed/Emerging
market
ARGENTINA 2 2 4 1910.17 French Emerging
AUSTRALIA 4 7 28 1 3 43 1045.15 English Developed
AUSTRIA 7 7 982.2 German Developed
BELGUIM 1 2 1 4 4317.06 French Developed
BRAZIL 1 1 2 544.82 French Emerging
CANADA 12 35 59 3 109 1048.76 English Developed
CHILE 10 1 11 1034.84 French Emerging
CHINA 4 4 210.53 Unclassified Emerging
COLOMBIA 2 2 263.59 French Emerging
CZECH REP 2 2 4 1320.95 Unclassified Emerging
FINLAND 4 4 2279.54 Scandinavian Developed
FRANCE 1 9 8 1 19 5621.8 French Developed
GERMANY 2 1 6 1 10 6727.64 German Developed
GREECE 2 1 2 5 2615.58 French Developed
HONK KONG 2 67 69 1550.91 English Developed
HUNGARY 1 3 4 362.83 Unclassified Emerging
INDIA 1 4 1 12 1 19 1056.31 English Emerging
INDONESIA 1 1 898.55 French Emerging
ISRAEL 3 2 1 1 7 706.3 English Emerging
ITALY 1 3 1 4 9 2891.87 French Developed
JAPAN 1 3 15 7 26 4420.77 German Developed
KOREA 2 2 12 1 17 2948.34 German Emerging
LUXEMBURG 1 1 7517.73 French Developed
MALAYSIA 6 6 2115.08 English Emerging
MEXICO 3 9 3 15 878.14 French Emerging
NETHERLAND 1 1 5 2 9 5224.04 French Developed NEW ZEALAND 2 2 488.37 English Developed
NORWAY 4 4 1 2 11 824.31 Scandinavian Developed
PERU 1 1 70.83 French Emerging
PHILIPPINES 1 4 2 7 852.74 French Emerging
POLAND 1 1 2 139.36 Unclassified Emerging
PORTUGAL 1 1 2 1046.17 French Developed
RUSSIA 1 4 1 1 7 3208.49 Unclassified Emerging
SINGAPORE 14 14 2611.26 English Developed SOUTH AFRICA 2 1 12 3 3 21 1187.11 English Emerging
SPAIN 1 2 1 4 2438.52 French Developed
SWEDEN 4 2 4 2 12 4447.96 Scandinavian Developed
SWITZERLAND 1 5 3 2 1 12 21815.94 German Developed
TAIWAN 1 3 25 1 30 3726.81 German Emerging
THAILAND 10 10 619.16 English Emerging
30
TURKEY 3 7 1 11 1849.92 French Emerging
UK 1 6 33 28 68 5047.17 English Developed
US 35 35 6627.65 English Developed
VENEZUELA 1 7 8 197.27 French Emerging
TOTAL 13 69 164 263 87 72 668
SIZE 1988.9 1184.23 6289 1708.5 1611.4 6720.1 117693 Note: The initial sample consists of 2,406 firms, 38 AMEX, 419 NASDAQ, 504 NYSE, 723 OTC, 337 PORTAL, and 385 LSE, which have cross-listed between 1975 and 2000. The sample is collected from different sources including AMEX, NASDAQ, NYSE, LSE, and Bank of New York. 86 firms from countries with no stock exchange at home listing (32 on LSE and 51 in the US), and 23 firms from Ireland listed on LSE before or in 1995 (the date when LSE and Dublin became two separate exchanges) have been excluded. Size is the average market value at day –60 expressed in millions of US dollars. The final sample includes 668 firms that have non-missing daily local and foreign market trading volume for 250 days before, the day of, and 250 days after cross-listing.
31
Table 2: Variables - Descriptive statistics and correlations Panel A: Descriptive statistics Variable Mean Median Q1 Q3 Max Min Std Skewness VO 5.973 5.876 4.512 7.506 13.922 0.575 2.259 0.278 TO 0.013 0.004 0.002 0.010 0.395 0.000 0.031 6.886 SIZE 7.141 7.203 6.128 8.170 11.703 3.124 1.512 -0.018 MKVO 10.80 10.87 9.50 12.33 16.67 4.07 2.02 -0.36 STD 0.024 0.021 0.017 0.028 0.069 0.009 0.010 1.507 RET 0.002 0.001 0.001 0.002 0.011 0 0.002 2.026 AF 12.28 11 6 17 42 1 8.055 0.850 FE 0.012 0.003 0.001 0.009 0.306 0 0.031 6.438 Panel B: Pearson’s Correlation Variable VO TO SIZE MKVO STD RET AF FE TO 0.366*** 1 (0.000) SIZE 0.414*** 0.011 1 (0.000) (0.823) MKVO 0.583*** 0.045 0.124*** 1 (0.000) (0.345) (0.009) STD 0.086* 0.123*** -0.242*** 0.233*** 1 (0.070) (0.009) (0.000) (0.000) RET 0.096** 0.211*** -0.174*** 0.116** 0.462*** 1 (0.043) (0.000) (0.000) (0.014) (0.000) AF 0.263*** 0.006 0.537*** 0.027 -0.257*** -0.224*** 1 (0.000) (0.897) (0.000) (0.576) (0.000) (0.000) FE 0.029 0.013 -0.113** -0.005 0.111** 0.054 -0.055 1 (0.545) (0.779) (0.017) (0.915) (0.019) (0.258) (0.244) Note: VO and TO are the average number of the daily traded shares, and share turnover during the period (-250, 0, +250). TO is calculated as VO divided by the number of shares outstanding. Size is the market value of the firm’s shares at day 60 before cross-listing. MKVO is the average trading volume of all firms traded in the firm i’s home market. RET and STD are the absolute value of the average daily returns and standard deviation of firm i. AF and FE are the number of analysts, and analysts’ forecast errors, respectively. FE is calculated as the absolute value of the difference between the forecasted earnings per share and actual earnings per share, scaled by stock price at the date of the forecast. Except size, all variables represent the period (2-50, +250).
32
Table 3: Univariate Analysis for VO and TO, by foreign exchange VO TO
Panel A: All firms (n=668) PRE POST POST-PRE PRE POST POST-PRE
(-250, -2) (+2,+250) (-250, -2) (+2,+250)
Mean 5.549 5.76 0.211*** 0.0126 0.011 -0.0016** Median 5.534 5.772 0.238*** 0.0034 0.0033 -0.0001** pv-T (0.000) (0.000) (0.000) (0.000) (0.000) (0.013)
pv-W (0.000) (0.000) (0.000) (0.000) (0.000) (0.046)
Panel B: AMEX (N=13)
Mean 3.259 3.21 -0.049 0.0069 0.0032 -0.0037 Median 2.577 2.621 0.044 0.0023 0.0022 -0.0001 pv-T (0.000) (0.000) -(0.684) -(0.053) -(0.033) (0.117)
pv-W (0.000) (0.000) -(0.340) (0.000) (0.000) (0.216)
Panel C: NASDAQ (N=69)
Mean 3.905 4.216 0.311*** 0.0107 0.0071 -0.0036* Median 3.602 4.045 0.443*** 0.0039 0.003 -0.0009 pv-T (0.000) (0.000) (0.000) (0.000) (0.000) (0.091)
pv-W (0.000) (0.000) (0.000) (0.000) (0.000) (0.113)
Panel D: NYSE (N=164)
Mean 5.44 5.71 0.27*** 0.0092 0.0088 -0.0004 Median 5.446 5.692 0.246*** 0.003 0.0032 0.0002 pv-T (0.000) (0.000) (0.000) (0.000) (0.000) (0.508)
pv-W (0.000) (0.000) (0.000) (0.000) (0.000) (0.277)
Panel E: LSE (N=72)
Mean 5.571 5.89 0.319*** 0.0147 0.012 -0.0027* Median 5.715 6.059 0.344*** 0.0069 0.0103 0.0034 pv-T (0.000) (0.000) (0.000) (0.000) (0.000) (0.073)
pv-W (0.000) (0.000) (0.000) (0.000) (0.000) (0.526)
Panel F: PORTAL (N=87)
Mean 6.329 6.689 0.36*** 0.0282 0.0289 0.0007 Median 6.122 6.487 0.365*** 0.0064 0.0064 0.0000 pv-T (0.000) (0.000) (0.000) (0.000) (0.000) (0.843)
pv-W (0.000) (0.000) (0.000) (0.000) (0.000) (0.715)
Panel G: OTC (N=263)
Mean 5.898 5.980 0.082** 0.0097 0.0076 -0.0021*** Median 6.079 6.151 0.072** 0.0029 0.0028 -0.0001*** pv-T (0.000) (0.000) (0.040) (0.000) (0.000) (0.008)
pv-W (0.000) (0.000) (0.020) (0.000) (0.000) (0.004)
pv-KW-χ2-across exchanges (0.000) (0.000) (0.000) (0.000)
pv-BM-χ2-across exchanges (0.000) (0.000) (0.000) (0.000) Note: VO is the log natural of the number of shares of firm i traded at time t in the firm’s home market, adjusted for capital changes and expressed in thousands. Share turnover (TO) is the number of traded shares divided by the number of shares outstanding of the cross-listed firm. Size is the market value of the firm’s shares pv-T is the p-value of the two-tailed t-test; it tests the quality of the mean to zero, and the difference in means between t and t-1 for paired observation. pv-W is the p-value of the two-tailed Wilcoxon signed-rank test; it tests the equality of the median to zero, and also the difference in the medians between t and t-1 for paired observations. pv-KW-χ2 and pv-BM-χ2 is the p-value of the chi-square of Kruskal-Wallis test and Brown-Mood test of the equality of the mean and median across all groups, respectively. N is the number of firms. *, **, *** represent significance at 10%, 5%, and 1% significance level. Results for the cross-listing period (-1, +1) are not shown since they are similar to those reported above. The difference in means for VO and TO across regulated and unregulated firms are tested separately using Kruskal-Wallis and Brown-Mood tests, but not reported since they also prove to be significant and similar to those reported above.
33
Table 4: Univariate Analysis for VO and TO, by civil and common law countries VO TO
Panel A: PRE POST POST-PRE PRE POST POST-PRE
English origin - Regulated (N=183) (-250, -2) (+2,+250) (-250, -2) (+2,+250)
Mean 4.82 5.111 0.291*** 0.0075 0.0068 -0.0007 Median 4.841 5.291 0.45*** 0.0034 0.0034 0 pv-T (0.000) (0.000) (0.000) (0.000) (0.000) (0.245)
pv-W (0.000) (0.000) (0.000) (0.000) (0.000) (0.808)
English origin – Unregulated (N=185)
Mean 6.092 6.168 0.076 0.0056 0.0039 -0.0017** Median 6.353 6.487 0.134* 0.0023 0.0022 -0.0001*** pv-T (0.000) (0.000) (0.130) (0.000) (0.000) (0.010)
pv-W (0.000) (0.000) (0.080) (0.000) (0.000) (0.004)
French origin - Regulated (N=45)
Mean 5.25 5.549 0.299*** 0.0102 0.0085 -0.0017 Median 5.449 5.685 0.236*** 0.003 0.0021 -0.0009 pv-T (0.000) (0.000) (0.009) (0.001) (0.000) (0.258)
pv-W (0.000) (0.000) (0.001) (0.000) (0.000) (0.803)
French origin - Unregulated (N=70) Mean 6.09 6.391 0.301*** 0.0286 0.027 -0.0016 Median 5.592 5.787 0.195*** 0.0066 0.0055 -0.0011 pv-T (0.000) (0.000) (0.002) (0.001) (0.000) (0.573)
pv-W (0.000) (0.000) (0.003) (0.000) (0.000) (0.428)
German origin - Regulated (N=32)
Mean 6.402 6.44 0.038 0.0267 0.0196 -0.0071* Median 6.194 6.034 -0.16 0.0065 0.0063 -0.0002** pv-T (0.000) (0.000) (0.685) (0.002) (0.004) (0.085)
pv-W (0.000) (0.000) (0.812) (0.000) (0.000) (0.010)
German origin - Unregulated (N=70)
Mean 6.136 6.274 0.138 0.0245 0.0241 -0.0004 Median 6.253 6.086 -0.167* 0.0067 0.0061 -0.0006 pv-T (0.000) (0.000) (0.067) (0.000) (0.000) (0.904)
pv-W (0.000) (0.000) (0.106) (0.000) (0.000) (0.370)
Scandinavian - Regulated (N=18)
Mean 5.292 5.463 0.171 0.0213 0.0162 -0.0051 Median 5.167 5.145 -0.022 0.0065 0.0058 -0.0007 pv-T (0.000) (0.000) (0.120) (0.083) (0.081) (0.148)
pv-W (0.000) (0.000) (0.142) (0.000) (0.000) (0.551)
Scandinavian - Unregulated (N=9)
Mean 4.352 4.76 0.408*** 0.0078 0.0093 0.0015
Median 4.994 5.283 0.289*** 0.0048 0.0054 0.0006*
pv-T (0.000) (0.000) (0.004) (0.011) (0.006) (0.169)
pv-W (0.004) (0.004) (0.008) (0.004) (0.004) (0.074)
pv-KW-χ2-across groups (0.000) (0.000) (0.000) (0.000)
pv-BM-χ2-across groups (0.000) (0.000) (0.000) (0.000) Note: Variables’ and tests’ definitions are as explained in Table 3. Tests for the mean difference in VO and TO between regulated and unregulated for each civil and common law group is run using Kruskal-Wallis and Brown-Mood tests and the results are consistent with those illustrated above.
34
Table 5: Testing the change in trading volume and share turnover following cross-listing )1.(Eq
iINDUSTRY
iDEV
iDPOST
iFE
iAF
iRET
iSTD
iDMKVO
iSIZE
iTV ++++++++=
Panel A: VO Variable All ANN LSE OTC PORTAL HFVO: ANN Intercept -4.711*** -4.591*** -3.107** -3.302*** -8.888*** -4.784*** (0.000) (0.000) (0.014) (0.000) (0.000) (0.000) DPOST 5.922*** 5.186*** 6.117*** 6.114*** 6.987*** 5.350*** (0.000) (0.000) (0.000) (0.000) (0.000) (0.000) SIZE 0.183*** 0.359*** 0.223* 0.084 0.576*** 0.322*** (0.000) (0.000) (0.087) (0.132) (0.004) (0.001) MKVO 0.335*** 0.249*** 0.079 0.301*** 0.421*** 0.288*** (0.000) (0.000) (0.494) (0.000) (0.000) (0.000) STD -4.855 -15.035 -16.625 2.687 6.866 -15.126 (0.368) (0.126) (0.349) (0.701) (0.704) (0.196) RET -14.448 24.681 -22.228 29.523 66.697 33.623 (0.710) (0.677) (0.878) (0.637) (0.623) (0.619) AF 0.028*** 0.029** 0.020 0.019* -0.056 0.035* (0.000) (0.047) (0.278) (0.055) (0.103) (0.073) FE 0.182 1.669 -0.548 -0.066 -9.134* 6.814** (0.864) (0.377) (0.812) (0.966) (0.077) (0.041) DEV -0.585*** -0.627*** 0.240 -0.223 0.140 -0.646*** (0.000) (0.004) (0.610) (0.231) (0.802) (0.009) NOBS 864 300 96 340 128 228 ADJR2 0.830 0.819 0.891 0.872 0.822 0.819 F 302.747 97.708 56.614 165.422 42.841 74.141 Panel B: TO Intercept -0.070 -0.067 0.038 -0.025 -0.161 -0.004 (0.220) (0.401) (0.727) (0.852) (0.115) (0.973) DPOST 0.005 -0.032** 0.034* 0.007 0.059*** -0.060** (0.708) (0.044) (0.086) (0.771) (0.007) (0.018) SIZE 0.014*** 0.015* 0.015 0.013 0.021 0.020 (0.009) (0.057) (0.177) (0.222) (0.132) (0.167) MKVO -0.004 -0.005 -0.006 -0.003 -0.005 -0.028*** (0.229) (0.381) (0.540) (0.676) (0.418) (0.003) STD 0.591 0.495 -0.910 0.166 0.070 5.940*** (0.392) (0.629) (0.559) (0.904) (0.957) (0.000) RET 11.503** 22.124*** 0.040 4.211 5.420 14.491 (0.021) (0.000) (0.997) (0.733) (0.572) (0.133) AF -0.0007 0.0005 -0.0034** -0.0009 -0.0009 0.0023 (0.448) (0.714) (0.044) (0.630) (0.711) (0.408) FE -0.164 -0.125 -0.410** 0.108 -0.153 -0.484 (0.228) (0.527) (0.045) (0.719) (0.672) (0.306) DEV 0.011 0.003 0.068 -0.001 -0.026 0.093*** (0.475) (0.886) (0.102) (0.988) (0.507) (0.008) NOBS 864 300 96 340 128 228 ADJR2 0.009 0.054 0.118 -0.008 0.006 0.166 F 1.537 2.230 1.904 0.802 1.057 4.221 Note: VO is the average number of the daily traded shares in the pre (-250, -1), and post cross-listing period (+1, +250). Share turnover (TO) is the number of traded shares divided by the number of shares
35
outstanding of a firm. Size is the market value of the firm’s shares at day -60. MKVO is the average trading volume of all firms traded in the firm i’s home market in the post-cross-listing period. RET and STD are the absolute value of the average daily returns and standard deviation of firm i in the post cross-listing period. AF and FE are the post-cross-listing number of analysts, and analysts’ forecast errors, respectively. FE is calculated as the absolute value of the difference between the forecasted earnings per share and actual earnings per share, scaled by stock price at the date of the forecast. DPOST is a dummy variable that takes the value of 1 in the post-cross-listing period and 0 otherwise. DEV is a dummy variable that equals 1 if the cross-listed firm is from a developed country and 0 otherwise. NOBS refers to the number of firm-day observations, 2 observations per firm. Industry dummies are not reported. *, **, *** represent significance at 10%, 5%, and 1% significance level.
36
Table 6: Determinants of the change in trading volume (VO) and share turnover (TO) after cross-listing )2.(** EqiINDUSTRYiIPMEASUREREGiDEVREGiDIFFEiDIFAFiDIFRETiDIFSTDiDIFMKVOiDIFSIZEiDIFTV ++++++++=
Panel A: DIFVO/DIFTO
DIFVO DIFTO Civil/Common Accounting Standards Civil/Common Accounting Standards Variable ALL Positive Negative ALL Positive Negative ALL Positive Negative ALL Positive Negative Intercept 0.202 0.992*** -0.975*** 0.265 0.961*** -0.907*** 0.004 0.015* -0.005 0.007 0.016** 0.003 (0.367) (0.000) (0.001) (0.236) (0.000) (0.002) (0.549) (0.050) (0.999) (0.286) (0.043) (0.770) DIFMKVO 0.416*** 0.247*** 0.162** 0.421*** 0.244*** 0.162** 0.004** 0.006** -0.001 0.004 0.007** -0.001 (0.000) (0.000) (0.014) (0.000) (0.000) (0.013) (0.028) (0.039) (0.793) (0.022) (0.025) (0.713) SIZE -0.029 -0.096*** 0.084*** -0.040* -0.096*** 0.077*** -0.0006 -0.0021*** 0.0002 -0.0009 -0.0019* -0.0001 (0.178) (0.000) (0.003) (0.060) (0.000) (0.005) (0.325) (0.007) (0.802) (0.160) (0.011) (0.928) DIFSTD 0.089 3.709 -11.982** 0.633 3.768 -12.141** 0.303** 0.209 0.335* 0.303** 0.186 0.326* (0.984) (0.365) (0.031) (0.889) (0.354) (0.029) (0.024) (0.205) (0.062) (0.024) (0.250) (0.071) DIFRET 38.559*** 41.839*** -2.919 35.127** 41.489*** -8.335 0.080 0.230 -1.491** 0.070 0.353 -1.544** (0.007) (0.001) (0.878) (0.014) (0.001) (0.659) (0.850) (0.659) (0.013) (0.868) (0.491) (0.010) DIFAF 0.019** 0.017** 0.010 0.019** 0.017** 0.008 0.0003 0.0004 0.0001 0.0003 0.0004 0.0001 (0.035) (0.038) (0.365) (0.042) (0.040) (0.473) (0.265) (0.236) (0.801) (0.258) (0.197) (0.764) DIFFE 0.430 -1.298* 2.894** 0.383 -1.323* 3.104** -0.024 -0.048* 0.025 -0.025 -0.046 0.028 (0.622) (0.079) (0.030) (0.662) (0.072) (0.016) (0.364) (0.095) (0.538) (0.333) (0.104) (0.493) REG*DEV 0.165** 0.039 0.123 0.137 -0.118 0.109 0.002 -0.003 0.004 0.009** 0.007 0.007 (0.010) (0.493) (0.146) (0.323) (0.351) (0.548) (0.282) (0.230) (0.148) (0.024) (0.164) (0.271) REG*F -0.083 0.003 -0.141 -0.0024 -0.0022 -0.0034 (0.450) (0.973) (0.381) (0.472) (0.554) (0.500) REG*G -0.304** -0.008 -0.143 -0.008** 0.009 -0.006 (0.032) (0.958) (0.334) (0.048) (0.189) (0.234) REG*S -0.008 -0.040 0.139 -0.0034 0.0030 -0.0073 (0.972) (0.830) (0.752) (0.624) (0.740) (0.401) REG*ACCSTDR 0.00019 0.00234 -0.00003 -0.00012** -0.00013 -0.00006 (0.918) (0.173) (0.989) (0.034) (0.034) (0.502) N 432 290 142 431 289 142 432 208 224 431 208 223 ADJR2 0.128 0.193 0.119 0.122 0.204 0.121 0.025 0.197 0.060 0.030 0.215 0.061 F 4.968 5.320 2.194 5.266 6.275 2.391 1.696 4.180 1.890 1.954 5.041 2.028
37
Panel B: DIFHFVO/DIFHFTO DIFHFVO DIFHFTO Civil/Common Accounting Standards Civil/Common Accounting Standards Variable ALL Positive Negative ALL Positive Negative ALL Positive Negative ALL Positive Negative Intercept 0.535 0.837 -1.690*** 0.947 0.944 -0.536 0.001 -0.007 -0.023 0.023 0.007 -0.019 (0.264) (0.114) (0.007) (0.331) (0.392) (0.582) (0.906) (0.231) (0.213) (0.286) (0.722) (0.624) DIFMKVO 0.417** 0.094 0.656** 0.421** 0.106 0.810*** 0.004 0.003 -0.004 0.003 0.004 -0.005 (0.017) (0.590) (0.024) (0.014) (0.563) (0.005) (0.309) (0.211) (0.554) (0.366) (0.222) (0.430) SIZE -0.109** -0.082 0.085* -0.136*** -0.081 0.045 -0.0004 0.0003 0.0030 -0.0005 0.0014 0.0012 (0.041) (0.136) (0.079) (0.005) (0.137) (0.318) (0.735) (0.637) (0.138) (0.624) (0.196) (0.460) DIFSTD 24.92** 16.60 45.08** 27.23** 10.56 29.40 0.410 0.113 1.008** 0.437 -0.165 0.917** (0.039) (0.184) (0.014) (0.023) (0.412) (0.112) (0.132) (0.466) (0.011) (0.100) (0.538) (0.019) DIFRET 4.80 16.48 -14.64 6.10 27.52 -45.31 -1.470** 0.432 -4.778*** -1.380** 0.978* -5.247*** (0.860) (0.558) (0.626) (0.821) (0.345) (0.173) (0.018) (0.211) (0.000) (0.023) (0.090) (0.000) DIFAF 0.043*** 0.037** 0.586 0.040*** 0.032* 0.016 0.00013 0.00041** 0.00163 0.00390 0.00035 -0.0004 (0.003) (0.025) (0.128) (0.006) (0.062) (0.115) (0.674) (0.015) (0.840) (0.992) (0.245) (0.429) DIFFE 2.00 0.43 0.02** 1.99 0.35 4.77*** -0.012 0.006 -0.001 -0.008 0.003 -0.034 (0.273) (0.824) (0.028) (0.271) (0.865) (0.008) (0.769) (0.770) (0.324) (0.847) (0.993) (0.661) REG*DEV 0.135 -0.125 6.595*** 0.329 0.030 0.311 0.005 0.004 -0.040 0.012* 0.012* 0.007 (0.494) (0.542) (0.003) (0.256) (0.931) (0.507) (0.258) (0.113) (0.629) (0.071) (0.075) (0.539) REG*F -0.128 -0.135 0.380 -0.0016 0.0017 -0.0076 (0.486) (0.452) (0.219) (0.701) (0.428) (0.363) REG*G -0.294 1.22*** -0.012 0.0004 0.050*** -0.0116 (0.263) (0.009) (0.952) (0.953) (0.000) (0.157) REG*S -0.403 -0.213 -0.446* -0.007 -0.002 -0.012 (0.413) (0.734) (0.073) (0.550) (0.809) (0.400) REG*ACCSTDR -0.006 -0.003 -0.007 -0.00038 -0.00040 0.00008 (0.692) (0.830) (0.674) (0.241) (0.220) (0.880) N 114 84 30 114 84 30 114 67 47 114 67 47 ADJR2 0.244 0.210 0.810 0.246 0.136 0.736 -0.010 0.694 0.506 0.018 0.096 0.494 F 3.277 2.382 8.723 3.627 1.931 6.771 0.927 10.364 3.947 1.151 1.503 4.205 Note: DIF stands for the difference between post- and pre-cross-listing periods for VO, TO, HFVO, HFTO, STD, RET, AF, and FE. VO is the number of the daily traded shares in the pre (-250, -1), and post (+1, +250) cross-listing period. TO is share turnover, which is calculated as the number of traded shares divided
38
by the number of shares outstanding of firm i. HFVO is the combined home and foreign number of shares. HFTO is calculated as HFVO divided by the number of shares outstanding of firm i. MKVO is the average trading volume of all firms traded in the firm i’s home market. RET and STD are the absolute value of the average daily returns and standard deviation of firm i. AF and FE are the number of analysts and analysts’ forecast errors, respectively. FE is calculated as the absolute value of the difference between the forecasted earnings per share and actual earnings per share, scaled by stock price at the date of the forecast. DPOST is a dummy variable that takes the value of 1 in the post-cross-listing period and 0 otherwise. DEV is a dummy variable that equals 1 if the firm is from a developed country and 0 otherwise. Industry dummies are not reported. REG is a dummy variables that is equal to 1 if the firm has cross-listed on regulated exchanges such as AMEX, NASDAQ, NYSE, and LSE, and if firm has cross-listed on unregulated exchanges such as OTC and PORTAL. F, G, and S represent 3 dummy variables, which equals 1 if the cross-listed firm is from the French, the German, or the Scandinavian law system, respectively. ACCSTDR is the index of accounting standards from La Porta et al. (1998). N is the number of cross-listed firms, and *, **, *** represent significance at 10%, 5%, and 1% significance level.

39
Table 7: Explaining the determinants of the US foreign trading volume, FVO )3..(EqiINDUSTRYIPMEASURECVCMiDEViFEiAFiRETiSTDiDMKVOiSIZEiFVO +++++++++=
Intercept 1.274 0.850 0.188 0.791 (0.287) (0.616) (0.903) (0.540) SIZE 0.144 0.133 0.155 0.159 (0.288) (0.316) (0.238) (0.234) MKVO -0.094 -0.090 -0.066 -0.091 (0.276) (0.335) (0.433) (0.287) STD 37.09** 37.49** 38.11** 36.95** (0.013) (0.014) (0.011) (0.014) RET 47.15 36.30 42.37 33.69 (0.574) (0.666) (0.612) (0.688) AF 0.054** 0.063** 0.061** 0.065** (0.041) (0.019) (0.017) (0.014) FE -4.530 -5.128 -5.034 -4.821 (0.269) (0.218) (0.221) (0.243) DEV -0.944*** -1.229** -1.542*** -1.157*** (0.009) (0.029) (0.006) (0.000) French origin 0.192 (0.573) German origin 0.082 (0.859) Scandinavian origin -1.592* (0.069) Accounting standards 0.009 (0.766) Rule of law 0.123 (0.325) Director rights 0.084 (0.476) N 111 111 111 111 ADJR2 0.399 0.386 0.392 0.389 F 5.555 5.941 6.059 5.997 Chi-square (χ2) 93.45 83.25 85.83 85.25 pv (χ 2) (0.762) (0.800) (0.739) (0.753) Durbin-Watson 2.024 1.891 1.924 1.900 1st order autocorrelation -0.023 0.043 0.023 0.037 Note: FVO is the average number of the daily traded shares in the post-cross-listing period (+1, +250) for firms that have cross-listed on AMEX, NASDAQ, and NYSE. Size is the market value of the firm’s shares. MKVO is the average trading volume of all firms traded in the firm i’s home market in the post-cross-listing period. RET and STD are the absolute value of the average daily returns and standard deviation of firm i in the post cross-listing period. AF and FE are the post-cross-listing number of analysts, and analysts’ forecast errors, respectively. FE is calculated as the absolute value of the difference between the forecasted earnings per share and actual earnings per share, scaled by stock price at the date of the forecast. DEV is a dummy variable that equals 1 if the firm is from a developed country and 0 otherwise. IPMEASURE stands for the investor protection proxies in the cross-listed firm’s home market, which are taken from La Porta et al. (1997, 1998). These are (1) whether the firm is from civil (French, German, and Scandinavian origin) or common (English) law countries, (2) Accounting standards index, (3) Rule of law index, and (4) director rights index. French, German, and Scandinavian origins are dummy variables, which each equals 1 if the cross-listed firm is from French, German, or Scandinavian law system, respectively, and 0 otherwise. N is the number of cross-listed firms. Industry dummies are not reported. *, **, *** represent significance at 10%, 5%, and 1% significance level.