The Effect of Continuous Trapezoidal Straight Spoiler Plates ...
19
Citation: Li, Z.; Zhang, T.; Chen, Y.; Wang, Z. The Effect of Continuous Trapezoidal Straight Spoiler Plates on the Vortex-Induced Vibration of Wind Turbine Towers. Atmosphere 2022, 13, 447. https://doi.org/10.3390/ atmos13030447 Academic Editors: Teng Wu, Reda Snaiki and Haifeng Wang Received: 20 January 2022 Accepted: 7 March 2022 Published: 9 March 2022 Publisher’s Note: MDPI stays neutral with regard to jurisdictional claims in published maps and institutional affil- iations. Copyright: © 2022 by the authors. Licensee MDPI, Basel, Switzerland. This article is an open access article distributed under the terms and conditions of the Creative Commons Attribution (CC BY) license (https:// creativecommons.org/licenses/by/ 4.0/). atmosphere Article The Effect of Continuous Trapezoidal Straight Spoiler Plates on the Vortex-Induced Vibration of Wind Turbine Towers Zheng Li 1, * , Tianhe Zhang 1, *, Yang Chen 2 and Ziqi Wang 3 1 School of Naval Architecture and Marine Engineering, Dalian Maritime University, Dalian 116026, China 2 The Fourth Research Department, Dalian Scientific Test and Control Technology Institute, Dalian 116013, China; [email protected] 3 Technical Office, Huludao Building Engineering and Construction Vocabulary Service Centre, Huludao 125004, China; [email protected] * Correspondence: [email protected] (Z.L.); [email protected] (T.Z.); Tel.: +86-15-142408282 (Z.L.); +86-13-342230615 (T.Z.) Abstract: This paper proposes a method of controlling the vortex-induced vibration (VIV) of wind turbine towers by adding continuous trapezoidal straight spoiler plates (TS) onto their outer surface: a fluid–solid coupling model was constructed to simulate the processes of Karman vortex generation and shedding on the different surfaces of an original tower (O–tower) and a tower with TS (TS–tower) with assumed and actual Re, while the VIV frequencies were also calculated and compared; the effects of the TS geometry parameters on the VIV frequency of towers were studied to investigate the recommended size; a modal analysis was carried out to research the effects of TS on the vortex- induced resonance risk of towers; and the simulation results as well as relevant research conclusions were validated by an analogical wind tunnel test. Keywords: wind turbine towers; VIV; trapezoidal straight spoiler plates; VIV frequency; wind tunnel testing 1. Introduction A wind turbine tower is the vital support component connecting the nacelle and platform. The main function of a tower is supporting the rotor system and absorbing the vibration derived from the wind load. With the rapid development of wind turbines and the increasing demand for electricity, the towers are becoming taller, but, because of cost limitations, they are also becoming thinner, which makes the influence of wind- induced vibration more and more obvious [1]. Kang L [2] found that large structures with a slenderness ratio greater than five or an eigenfrequency less than 0.2 Hz are prone to large-scale vibration. P. Mendis [3] et al., proposed that the lateral vibration of high tower occurs easily, which is caused by VIV. Wind turbine towers are usually tall, cylindrical structures with a smooth surface, and their length-to-diameter ratio is generally 20–50, which is destined to be easily affected by VIV. Figure 1 indicates the mechanism of VIV generation by towers. If the wind flows through the surface of a tower at particular regimes (i.e., lower speeds, laminar), the airflow will generate periodic vortices on both sides of the tower; consequently, the fluid pressure will be varied when the vortices are shedding from a tower’s surface, and the extra load excitation derived from such differential pressure causes a tower to vibrate periodically. Ulrik [4] found that when the excitation frequency of wind is close to or even coincides with the natural frequency of a wind turbine tower, the tower will produce huge vibration and even collapse directly. A. Chizfahm et al. [5] applied Euler–Bernoulli beam theory and the Galerkin method to establish a nonlinear parameter model of a bladeless wind turbine, and applied this model to study the influence of wind speed on the dynamic characteristics of a wind turbine. It was found that, if the frequency of vortex shedding was Atmosphere 2022, 13, 447. https://doi.org/10.3390/atmos13030447 https://www.mdpi.com/journal/atmosphere
-
Upload
khangminh22 -
Category
Documents
-
view
0 -
download
0
Transcript of The Effect of Continuous Trapezoidal Straight Spoiler Plates ...
�����������������
Citation: Li, Z.; Zhang, T.; Chen, Y.;
Wang, Z. The Effect of Continuous
Trapezoidal Straight Spoiler Plates on
the Vortex-Induced Vibration of Wind
Turbine Towers. Atmosphere 2022, 13,
447. https://doi.org/10.3390/
atmos13030447
Academic Editors: Teng Wu,
Reda Snaiki and Haifeng Wang
Received: 20 January 2022
Accepted: 7 March 2022
Published: 9 March 2022
Publisher’s Note: MDPI stays neutral
with regard to jurisdictional claims in
published maps and institutional affil-
iations.
Copyright: © 2022 by the authors.
Licensee MDPI, Basel, Switzerland.
This article is an open access article
distributed under the terms and
conditions of the Creative Commons
Attribution (CC BY) license (https://
creativecommons.org/licenses/by/
4.0/).
atmosphere
Article
The Effect of Continuous Trapezoidal Straight Spoiler Plates onthe Vortex-Induced Vibration of Wind Turbine TowersZheng Li 1,* , Tianhe Zhang 1,*, Yang Chen 2 and Ziqi Wang 3
1 School of Naval Architecture and Marine Engineering, Dalian Maritime University, Dalian 116026, China2 The Fourth Research Department, Dalian Scientific Test and Control Technology Institute,
Dalian 116013, China; [email protected] Technical Office, Huludao Building Engineering and Construction Vocabulary Service Centre,
Huludao 125004, China; [email protected]* Correspondence: [email protected] (Z.L.); [email protected] (T.Z.);
Tel.: +86-15-142408282 (Z.L.); +86-13-342230615 (T.Z.)
Abstract: This paper proposes a method of controlling the vortex-induced vibration (VIV) of windturbine towers by adding continuous trapezoidal straight spoiler plates (TS) onto their outer surface:a fluid–solid coupling model was constructed to simulate the processes of Karman vortex generationand shedding on the different surfaces of an original tower (O–tower) and a tower with TS (TS–tower)with assumed and actual Re, while the VIV frequencies were also calculated and compared; theeffects of the TS geometry parameters on the VIV frequency of towers were studied to investigatethe recommended size; a modal analysis was carried out to research the effects of TS on the vortex-induced resonance risk of towers; and the simulation results as well as relevant research conclusionswere validated by an analogical wind tunnel test.
Keywords: wind turbine towers; VIV; trapezoidal straight spoiler plates; VIV frequency; windtunnel testing
1. Introduction
A wind turbine tower is the vital support component connecting the nacelle andplatform. The main function of a tower is supporting the rotor system and absorbingthe vibration derived from the wind load. With the rapid development of wind turbinesand the increasing demand for electricity, the towers are becoming taller, but, becauseof cost limitations, they are also becoming thinner, which makes the influence of wind-induced vibration more and more obvious [1]. Kang L [2] found that large structures witha slenderness ratio greater than five or an eigenfrequency less than 0.2 Hz are prone tolarge-scale vibration. P. Mendis [3] et al., proposed that the lateral vibration of high toweroccurs easily, which is caused by VIV. Wind turbine towers are usually tall, cylindricalstructures with a smooth surface, and their length-to-diameter ratio is generally 20–50,which is destined to be easily affected by VIV.
Figure 1 indicates the mechanism of VIV generation by towers. If the wind flowsthrough the surface of a tower at particular regimes (i.e., lower speeds, laminar), the airflowwill generate periodic vortices on both sides of the tower; consequently, the fluid pressurewill be varied when the vortices are shedding from a tower’s surface, and the extra loadexcitation derived from such differential pressure causes a tower to vibrate periodically.Ulrik [4] found that when the excitation frequency of wind is close to or even coincideswith the natural frequency of a wind turbine tower, the tower will produce huge vibrationand even collapse directly. A. Chizfahm et al. [5] applied Euler–Bernoulli beam theoryand the Galerkin method to establish a nonlinear parameter model of a bladeless windturbine, and applied this model to study the influence of wind speed on the dynamiccharacteristics of a wind turbine. It was found that, if the frequency of vortex shedding was
Atmosphere 2022, 13, 447. https://doi.org/10.3390/atmos13030447 https://www.mdpi.com/journal/atmosphere

Atmosphere 2022, 13, 447 2 of 19
synchronized with the eigenfrequency of a wind turbine tower, the vibration amplitudewould increase significantly, which indicated “vortex-induced resonance” harmful to thereliability of a wind turbine. N. Khodaie et al. [6–9] proposed that structures with highflexibility, low damping, and a large aspect ratio are easily affected by VIV, resulting in thefatigue damage of structures. Chou [10] et al. analyzed the failure mode of wind turbinetowers and concluded that VIV is the main cause of tower structural damage. The failureof the Ferrybridge power plant in 1960 in Yorkshire, England and the Tacoma Bridge in1940 in Washington, WA, the United States are examples of resonance failure due to vortex-induced vibration that cannot be ignored [11]. Considering the great influence of VIV onthe structural safety of wind turbine towers, it is seriously significant to investigate effectivesolutions for reducing VIV. In reality, wind turbine towers very much resemble chimneysand industrial stacks, and some of the literature and international standards have providedcertain methodologies for resolving VIV issues of similar structures. Generally speaking,there are three common methods to reduce the influence of VIV on large structures:
Figure 1. The mechanism of VIV generation.
Structural modification: The modification of the size of a large structure can changethe eigenfrequency and keep it away from the possible VIV frequency. However, due to thelarge size of wind turbine towers, the method of structural modification is very difficultand will increase construction costs. Therefore, great attention has been paid in engineeringto the two methods of auxiliary dampers and aerodynamic shape modification [12].
Active and passive dampers: Active dampers regulate the damping and stiffness ofstructures through hydraulic and electromechanical systems, thereby suppressing the VIVof structures. One of the most representative of these is an active mass damper (AMD); theessence of passive dampers is mass–spring–damper systems, which can reduce vibrationby changing the resonance characteristics of structures, among which a tuned mass damper(TMD) is the most widely used. Researchers have found that the reasonable configuration ofan AMD [13–15] and a TMD [16–18] can reduce the vortex-induced response of the structureand reduce the occurrence of instability. However, the design of auxiliary dampers mustmatch the mass and stiffness of structures themselves, otherwise it will aggravate thevibration of structures, the auxiliary dampers will not weaken the existing vortex-inducedload, and the fatigue damage problem of structures will not be effectively solved.
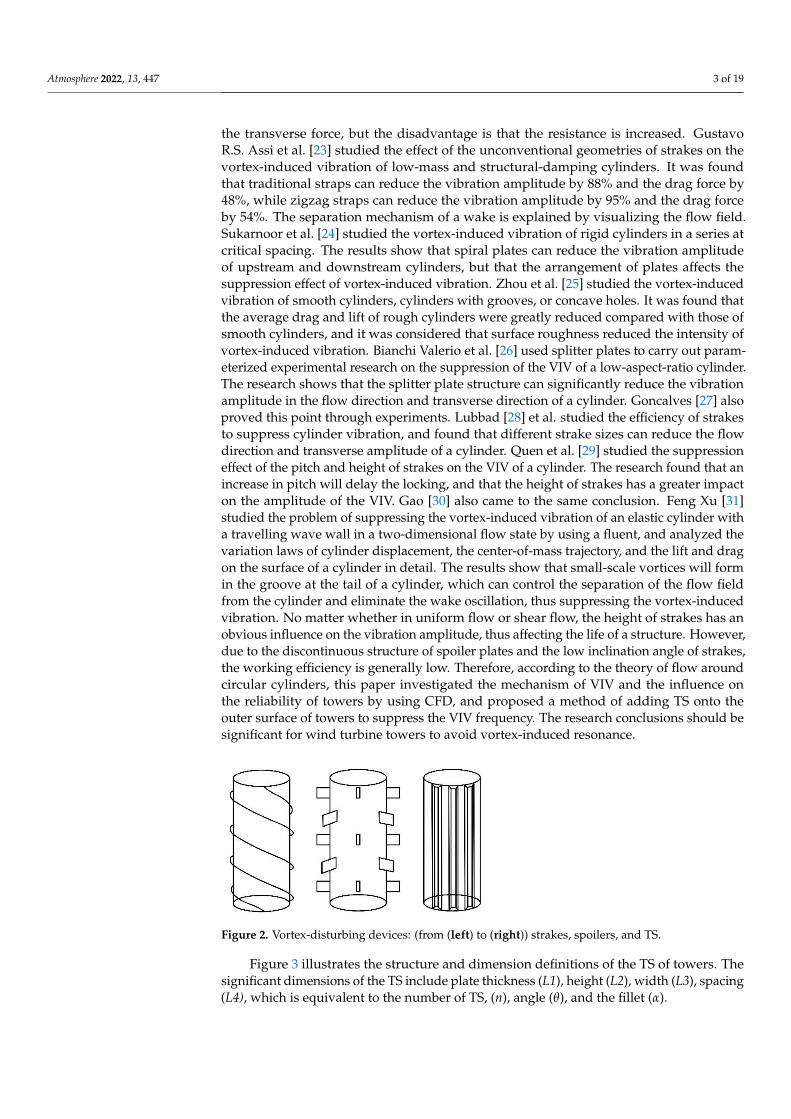
Aerodynamic shape modification: At present, the most-studied method of reduc-ing vibration is aerodynamic shape modification. The common principle is to changethe flow field around structures by adding vortex-disturbing devices on the surface ofstructures; these devices can destroy the formation and shedding of a vortex in a waketo increase the stability of fluid flow. Figure 2 shows several vortex-disturbing devices,such as strakes, spoilers and TS, etc. [19–21]. Vegard Holland et al. [22] used CFD tostudy the hydrodynamic performance of strakes on full-scale offshore platforms. Thecalculation results show that the strakes reduce the vorticity behind the platform and
Atmosphere 2022, 13, 447 3 of 19
the transverse force, but the disadvantage is that the resistance is increased. GustavoR.S. Assi et al. [23] studied the effect of the unconventional geometries of strakes on thevortex-induced vibration of low-mass and structural-damping cylinders. It was foundthat traditional straps can reduce the vibration amplitude by 88% and the drag force by48%, while zigzag straps can reduce the vibration amplitude by 95% and the drag forceby 54%. The separation mechanism of a wake is explained by visualizing the flow field.Sukarnoor et al. [24] studied the vortex-induced vibration of rigid cylinders in a series atcritical spacing. The results show that spiral plates can reduce the vibration amplitudeof upstream and downstream cylinders, but that the arrangement of plates affects thesuppression effect of vortex-induced vibration. Zhou et al. [25] studied the vortex-inducedvibration of smooth cylinders, cylinders with grooves, or concave holes. It was found thatthe average drag and lift of rough cylinders were greatly reduced compared with those ofsmooth cylinders, and it was considered that surface roughness reduced the intensity ofvortex-induced vibration. Bianchi Valerio et al. [26] used splitter plates to carry out param-eterized experimental research on the suppression of the VIV of a low-aspect-ratio cylinder.The research shows that the splitter plate structure can significantly reduce the vibrationamplitude in the flow direction and transverse direction of a cylinder. Goncalves [27] alsoproved this point through experiments. Lubbad [28] et al. studied the efficiency of strakesto suppress cylinder vibration, and found that different strake sizes can reduce the flowdirection and transverse amplitude of a cylinder. Quen et al. [29] studied the suppressioneffect of the pitch and height of strakes on the VIV of a cylinder. The research found that anincrease in pitch will delay the locking, and that the height of strakes has a greater impacton the amplitude of the VIV. Gao [30] also came to the same conclusion. Feng Xu [31]studied the problem of suppressing the vortex-induced vibration of an elastic cylinder witha travelling wave wall in a two-dimensional flow state by using a fluent, and analyzed thevariation laws of cylinder displacement, the center-of-mass trajectory, and the lift and dragon the surface of a cylinder in detail. The results show that small-scale vortices will formin the groove at the tail of a cylinder, which can control the separation of the flow fieldfrom the cylinder and eliminate the wake oscillation, thus suppressing the vortex-inducedvibration. No matter whether in uniform flow or shear flow, the height of strakes has anobvious influence on the vibration amplitude, thus affecting the life of a structure. However,due to the discontinuous structure of spoiler plates and the low inclination angle of strakes,the working efficiency is generally low. Therefore, according to the theory of flow aroundcircular cylinders, this paper investigated the mechanism of VIV and the influence onthe reliability of towers by using CFD, and proposed a method of adding TS onto theouter surface of towers to suppress the VIV frequency. The research conclusions should besignificant for wind turbine towers to avoid vortex-induced resonance.
Figure 2. Vortex-disturbing devices: (from (left) to (right)) strakes, spoilers, and TS.
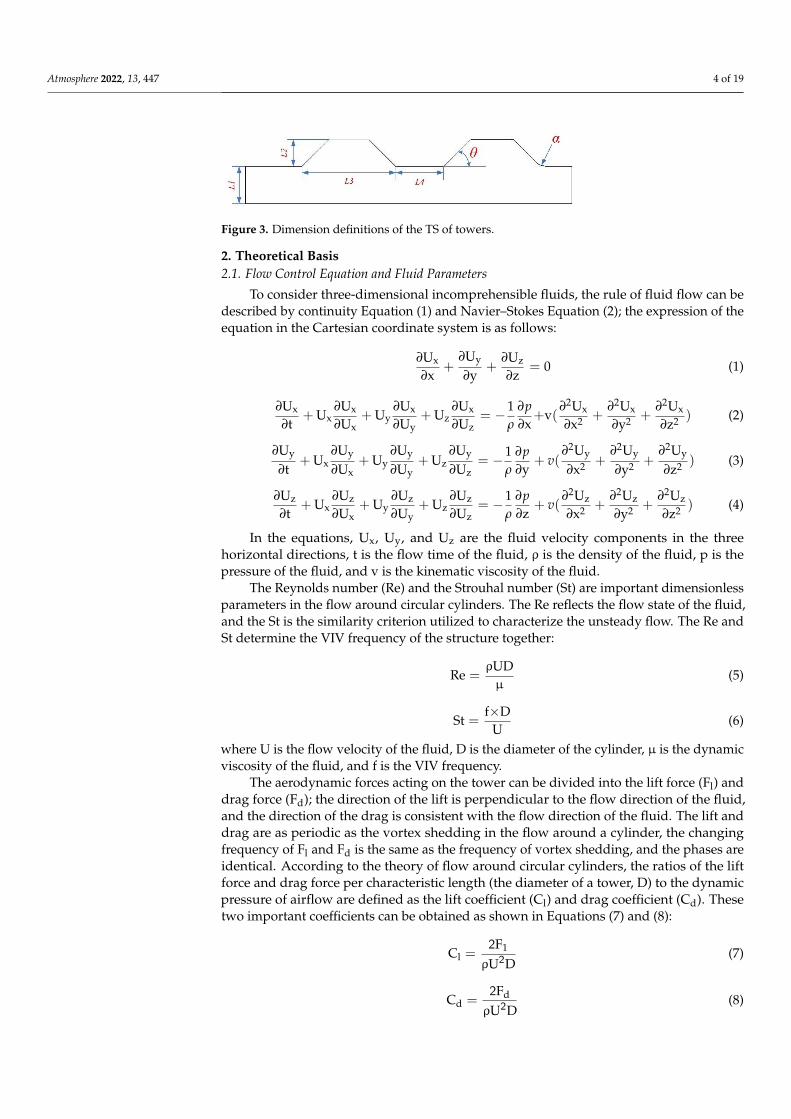
Figure 3 illustrates the structure and dimension definitions of the TS of towers. Thesignificant dimensions of the TS include plate thickness (L1), height (L2), width (L3), spacing(L4), which is equivalent to the number of TS, (n), angle (θ), and the fillet (α).
Atmosphere 2022, 13, 447 4 of 19
Figure 3. Dimension definitions of the TS of towers.
2. Theoretical Basis2.1. Flow Control Equation and Fluid Parameters
To consider three-dimensional incomprehensible fluids, the rule of fluid flow can bedescribed by continuity Equation (1) and Navier–Stokes Equation (2); the expression of theequation in the Cartesian coordinate system is as follows:
∂Ux
∂x+
∂Uy
∂y+
∂Uz
∂z= 0 (1)
∂Ux
∂t+ Ux
∂Ux
∂Ux+ Uy
∂Ux
∂Uy+ Uz
∂Ux
∂Uz= −1
ρ
∂p∂x
+v(∂2Ux
∂x2 +∂2Ux
∂y2 +∂2Ux
∂z2 ) (2)
∂Uy
∂t+ Ux
∂Uy
∂Ux+ Uy
∂Uy
∂Uy+ Uz
∂Uy
∂Uz= −1
ρ
∂p∂y
+ v(∂2Uy
∂x2 +∂2Uy
∂y2 +∂2Uy
∂z2 ) (3)
∂Uz
∂t+ Ux
∂Uz
∂Ux+ Uy
∂Uz
∂Uy+ Uz
∂Uz
∂Uz= −1
ρ
∂p∂z
+ v(∂2Uz
∂x2 +∂2Uz
∂y2 +∂2Uz
∂z2 ) (4)
In the equations, Ux, Uy, and Uz are the fluid velocity components in the threehorizontal directions, t is the flow time of the fluid, ρ is the density of the fluid, p is thepressure of the fluid, and v is the kinematic viscosity of the fluid.
The Reynolds number (Re) and the Strouhal number (St) are important dimensionlessparameters in the flow around circular cylinders. The Re reflects the flow state of the fluid,and the St is the similarity criterion utilized to characterize the unsteady flow. The Re andSt determine the VIV frequency of the structure together:
Re =ρUDµ
(5)
St =f×D
U(6)
where U is the flow velocity of the fluid, D is the diameter of the cylinder, µ is the dynamicviscosity of the fluid, and f is the VIV frequency.
The aerodynamic forces acting on the tower can be divided into the lift force (Fl) anddrag force (Fd); the direction of the lift is perpendicular to the flow direction of the fluid,and the direction of the drag is consistent with the flow direction of the fluid. The lift anddrag are as periodic as the vortex shedding in the flow around a cylinder, the changingfrequency of Fl and Fd is the same as the frequency of vortex shedding, and the phases areidentical. According to the theory of flow around circular cylinders, the ratios of the liftforce and drag force per characteristic length (the diameter of a tower, D) to the dynamicpressure of airflow are defined as the lift coefficient (Cl) and drag coefficient (Cd). Thesetwo important coefficients can be obtained as shown in Equations (7) and (8):
Cl =2F1
ρU2D(7)
Cd =2Fd
ρU2D(8)
Atmosphere 2022, 13, 447 5 of 19
2.2. Control Equations of Cylindrical Vibration
The vibration of structures, induced by fluid flow, can be regarded as a mass–spring–damper system, so the control equations of a forced vibration system can be expressed as:
[M]( ..x)+[C]
( .x)+[K](x) = (F) (9)
where [M], [C], and [K] are the mass matrix, damping matrix, and stiffness of components;(F) is the external excitation matrix; and (x) is the displacement vector, and can be expressedas a simple harmonic function:
(x) = (A) sin(ωt +ϕ) (10)
When the component is vibrating without any extra exciting load, the external excita-tion matrix (F) should be 0. In this situation and according to Equation (10), the controlequations can be written as follows:
(A)([K]−ω2[M] +ω[C]
)= 0 (11)
where (A) is the vibration amplitude matrix of the components and must be nonzero. Thisimplies that Equation (11) can be established, as long as:(
[K]−ω2[M] +ω[C])= 0 (12)
To solve Equation (12), the eigensolutionsω1,ω2 · · ·ωn are eigenfrequencies of eachmode of the system; the mode shapes can also be obtained by substituting the eigensolutionsinto Equation (11). In general, eigenfrequencies and mode shapes are inherent propertiesof mechanical structures; they are only related to mass distribution and constraint type,so any external load (such as the wind load on blades and VIV excitation) does not makesense to the modal characteristics of wind turbine systems.
3. Computational Model and Verification3.1. Computational Fluid Domain
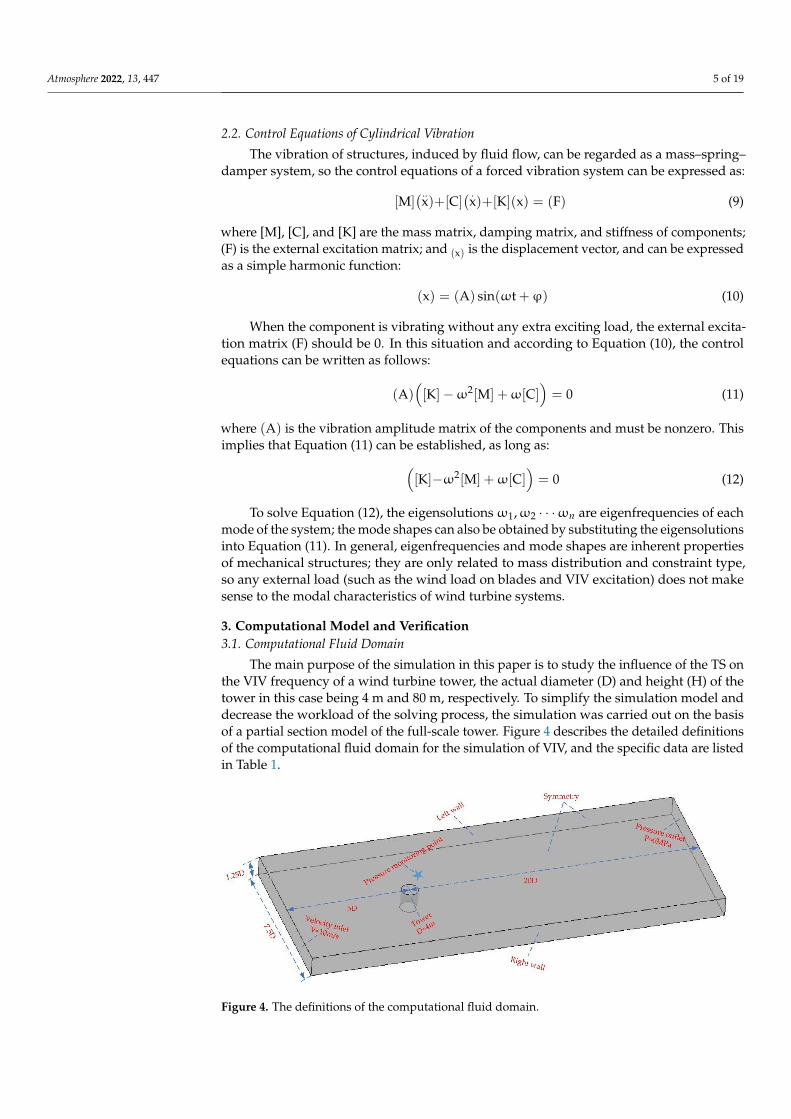
The main purpose of the simulation in this paper is to study the influence of the TS onthe VIV frequency of a wind turbine tower, the actual diameter (D) and height (H) of thetower in this case being 4 m and 80 m, respectively. To simplify the simulation model anddecrease the workload of the solving process, the simulation was carried out on the basisof a partial section model of the full-scale tower. Figure 4 describes the detailed definitionsof the computational fluid domain for the simulation of VIV, and the specific data are listedin Table 1.
Figure 4. The definitions of the computational fluid domain.
Atmosphere 2022, 13, 447 6 of 19
Table 1. Boundary conditions of the computational fluid domain.
Diameter of tower (D) 4 m Inlet velocity 10 m/sHeight of fluid domain 1.25 D Outlet static pressure 0 MPaLength of fluid domain 20 D Solving time 100 s
Wide of inlet/outlet 7.5 D Time step 0.1 s
To obtain the VIV frequency of the tower, which is derived from a vortex, a pressure-monitoring point is defined on a position close to the tower (as shown in Figure 4); thepressure variation of this point is monitored to obtain the frequency of vortex generationand shedding through FFT, so vortex generation is the most important condition for in-vestigating VIV. In reality, it is difficult to simulate the processes of vortex generation andshedding from a tower surface accurately under the fluid state with a large Re (or turbu-lence), but the processes must be more obvious in laminar flow conditions. Consequently,the Re is set to 100 for assumption to clarify the vortex generation and shedding processes inthe simulation, and the influence of TS on the VIV frequency can be investigated definitely.Furthermore, some specific simulation settings of the CFD model are considered as follows:
• Computing algorithm: laminar;• Transient scheme: second-order backward Euler;• Convergence criteria: the residual type is RMS, and the residual target is 0.001;• To simulate the fluid state around the towers, the partial fluid domain which contains
the monitor point is meshed as a boundary layer;• The computational fluid domain is initialized with velocity–pressure conditions.
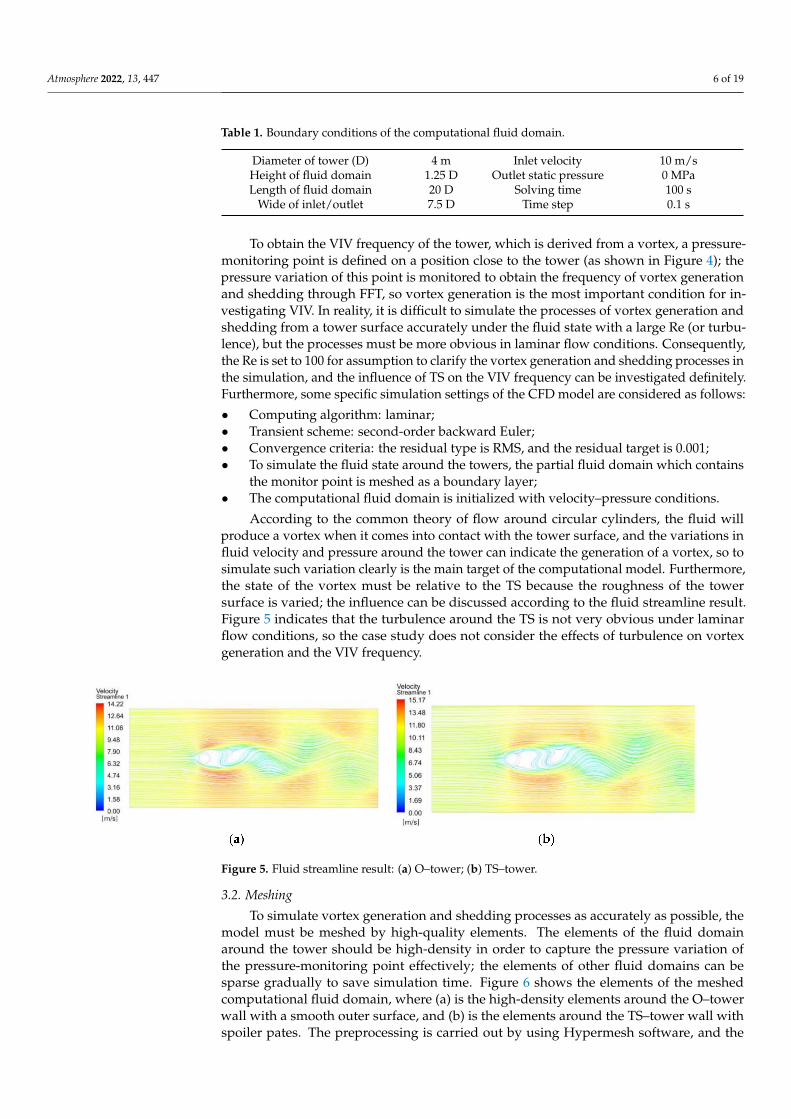
According to the common theory of flow around circular cylinders, the fluid willproduce a vortex when it comes into contact with the tower surface, and the variations influid velocity and pressure around the tower can indicate the generation of a vortex, so tosimulate such variation clearly is the main target of the computational model. Furthermore,the state of the vortex must be relative to the TS because the roughness of the towersurface is varied; the influence can be discussed according to the fluid streamline result.Figure 5 indicates that the turbulence around the TS is not very obvious under laminarflow conditions, so the case study does not consider the effects of turbulence on vortexgeneration and the VIV frequency.
Figure 5. Fluid streamline result: (a) O–tower; (b) TS–tower.
3.2. Meshing
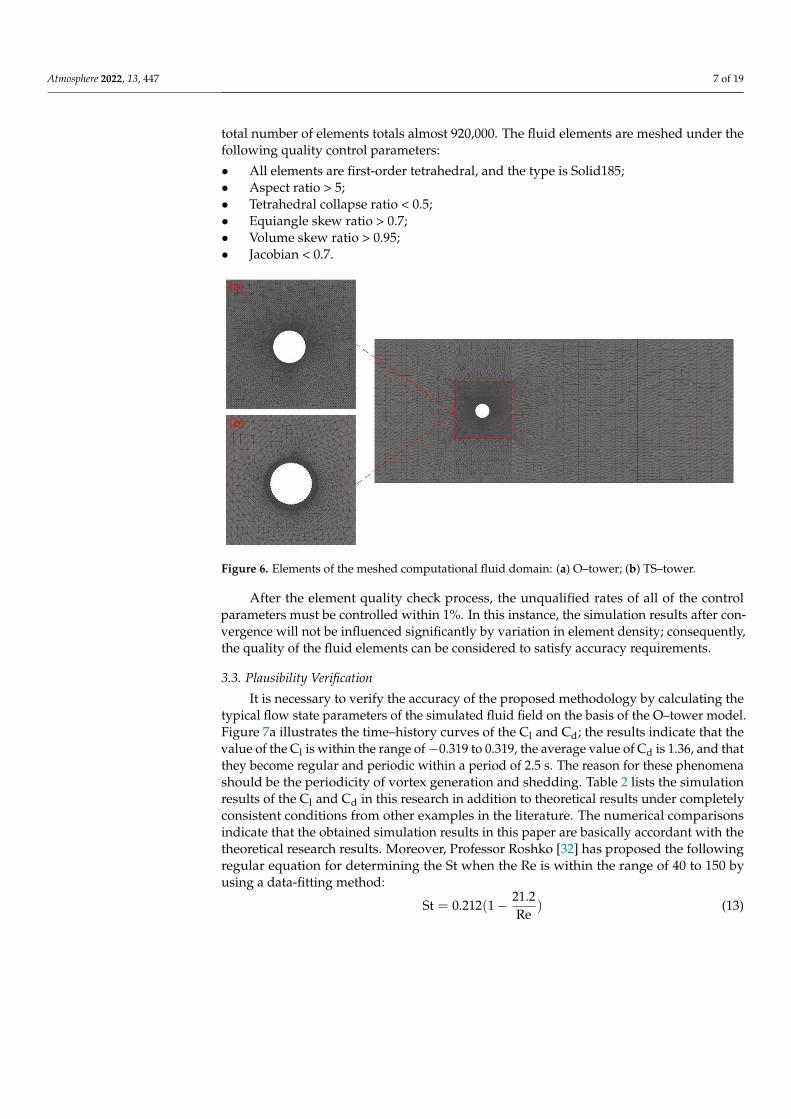
To simulate vortex generation and shedding processes as accurately as possible, themodel must be meshed by high-quality elements. The elements of the fluid domainaround the tower should be high-density in order to capture the pressure variation ofthe pressure-monitoring point effectively; the elements of other fluid domains can besparse gradually to save simulation time. Figure 6 shows the elements of the meshedcomputational fluid domain, where (a) is the high-density elements around the O–towerwall with a smooth outer surface, and (b) is the elements around the TS–tower wall withspoiler pates. The preprocessing is carried out by using Hypermesh software, and the
Atmosphere 2022, 13, 447 7 of 19
total number of elements totals almost 920,000. The fluid elements are meshed under thefollowing quality control parameters:
• All elements are first-order tetrahedral, and the type is Solid185;• Aspect ratio > 5;• Tetrahedral collapse ratio < 0.5;• Equiangle skew ratio > 0.7;• Volume skew ratio > 0.95;• Jacobian < 0.7.
Figure 6. Elements of the meshed computational fluid domain: (a) O–tower; (b) TS–tower.
After the element quality check process, the unqualified rates of all of the controlparameters must be controlled within 1%. In this instance, the simulation results after con-vergence will not be influenced significantly by variation in element density; consequently,the quality of the fluid elements can be considered to satisfy accuracy requirements.
3.3. Plausibility Verification
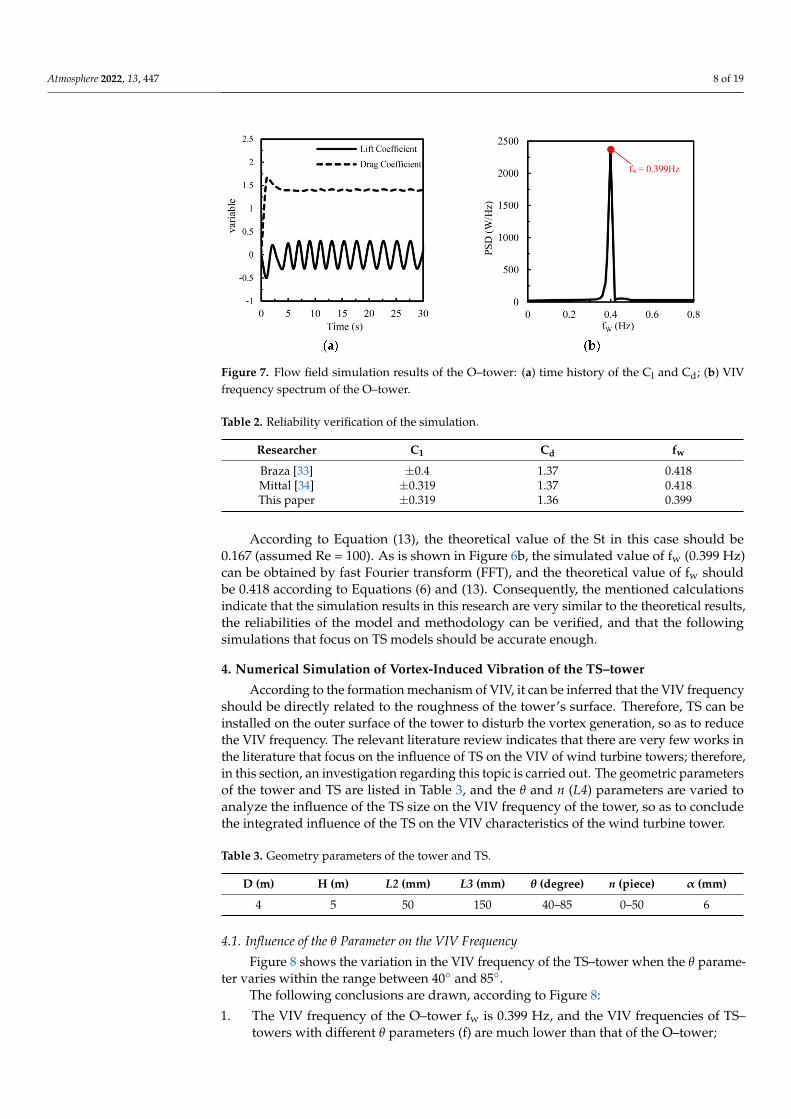
It is necessary to verify the accuracy of the proposed methodology by calculating thetypical flow state parameters of the simulated fluid field on the basis of the O–tower model.Figure 7a illustrates the time–history curves of the Cl and Cd; the results indicate that thevalue of the Cl is within the range of −0.319 to 0.319, the average value of Cd is 1.36, and thatthey become regular and periodic within a period of 2.5 s. The reason for these phenomenashould be the periodicity of vortex generation and shedding. Table 2 lists the simulationresults of the Cl and Cd in this research in addition to theoretical results under completelyconsistent conditions from other examples in the literature. The numerical comparisonsindicate that the obtained simulation results in this paper are basically accordant with thetheoretical research results. Moreover, Professor Roshko [32] has proposed the followingregular equation for determining the St when the Re is within the range of 40 to 150 byusing a data-fitting method:
St = 0.212(1 − 21.2Re
) (13)
Atmosphere 2022, 13, 447 8 of 19
Figure 7. Flow field simulation results of the O–tower: (a) time history of the Cl and Cd; (b) VIVfrequency spectrum of the O–tower.
Table 2. Reliability verification of the simulation.
Researcher C1 Cd fw
Braza [33] ±0.4 1.37 0.418Mittal [34] ±0.319 1.37 0.418This paper ±0.319 1.36 0.399
According to Equation (13), the theoretical value of the St in this case should be0.167 (assumed Re = 100). As is shown in Figure 6b, the simulated value of fw (0.399 Hz)can be obtained by fast Fourier transform (FFT), and the theoretical value of fw shouldbe 0.418 according to Equations (6) and (13). Consequently, the mentioned calculationsindicate that the simulation results in this research are very similar to the theoretical results,the reliabilities of the model and methodology can be verified, and that the followingsimulations that focus on TS models should be accurate enough.
4. Numerical Simulation of Vortex-Induced Vibration of the TS–tower
According to the formation mechanism of VIV, it can be inferred that the VIV frequencyshould be directly related to the roughness of the tower’s surface. Therefore, TS can beinstalled on the outer surface of the tower to disturb the vortex generation, so as to reducethe VIV frequency. The relevant literature review indicates that there are very few works inthe literature that focus on the influence of TS on the VIV of wind turbine towers; therefore,in this section, an investigation regarding this topic is carried out. The geometric parametersof the tower and TS are listed in Table 3, and the θ and n (L4) parameters are varied toanalyze the influence of the TS size on the VIV frequency of the tower, so as to concludethe integrated influence of the TS on the VIV characteristics of the wind turbine tower.
Table 3. Geometry parameters of the tower and TS.
D (m) H (m) L2 (mm) L3 (mm) θ (degree) n (piece) α (mm)
4 5 50 150 40–85 0–50 6
4.1. Influence of the θ Parameter on the VIV Frequency
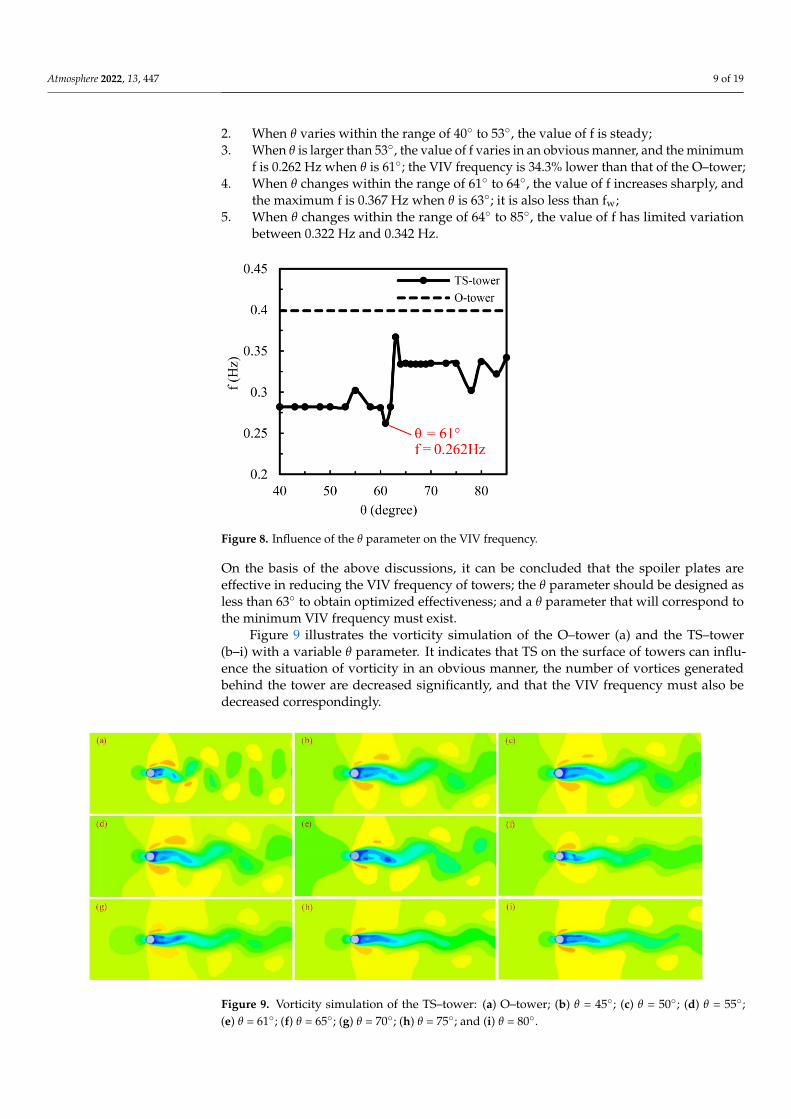
Figure 8 shows the variation in the VIV frequency of the TS–tower when the θ parame-ter varies within the range between 40◦ and 85◦.
The following conclusions are drawn, according to Figure 8:
1. The VIV frequency of the O–tower fw is 0.399 Hz, and the VIV frequencies of TS–towers with different θ parameters (f) are much lower than that of the O–tower;
Atmosphere 2022, 13, 447 9 of 19
2. When θ varies within the range of 40◦ to 53◦, the value of f is steady;3. When θ is larger than 53◦, the value of f varies in an obvious manner, and the minimum
f is 0.262 Hz when θ is 61◦; the VIV frequency is 34.3% lower than that of the O–tower;4. When θ changes within the range of 61◦ to 64◦, the value of f increases sharply, and
the maximum f is 0.367 Hz when θ is 63◦; it is also less than fw;5. When θ changes within the range of 64◦ to 85◦, the value of f has limited variation
between 0.322 Hz and 0.342 Hz.
Figure 8. Influence of the θ parameter on the VIV frequency.
On the basis of the above discussions, it can be concluded that the spoiler plates areeffective in reducing the VIV frequency of towers; the θ parameter should be designed asless than 63◦ to obtain optimized effectiveness; and a θ parameter that will correspond tothe minimum VIV frequency must exist.
Figure 9 illustrates the vorticity simulation of the O–tower (a) and the TS–tower(b–i) with a variable θ parameter. It indicates that TS on the surface of towers can influ-ence the situation of vorticity in an obvious manner, the number of vortices generatedbehind the tower are decreased significantly, and that the VIV frequency must also bedecreased correspondingly.
Figure 9. Vorticity simulation of the TS–tower: (a) O–tower; (b) θ = 45◦; (c) θ = 50◦; (d) θ = 55◦;(e) θ = 61◦; (f) θ = 65◦; (g) θ = 70◦; (h) θ = 75◦; and (i) θ = 80◦.
Atmosphere 2022, 13, 447 10 of 19
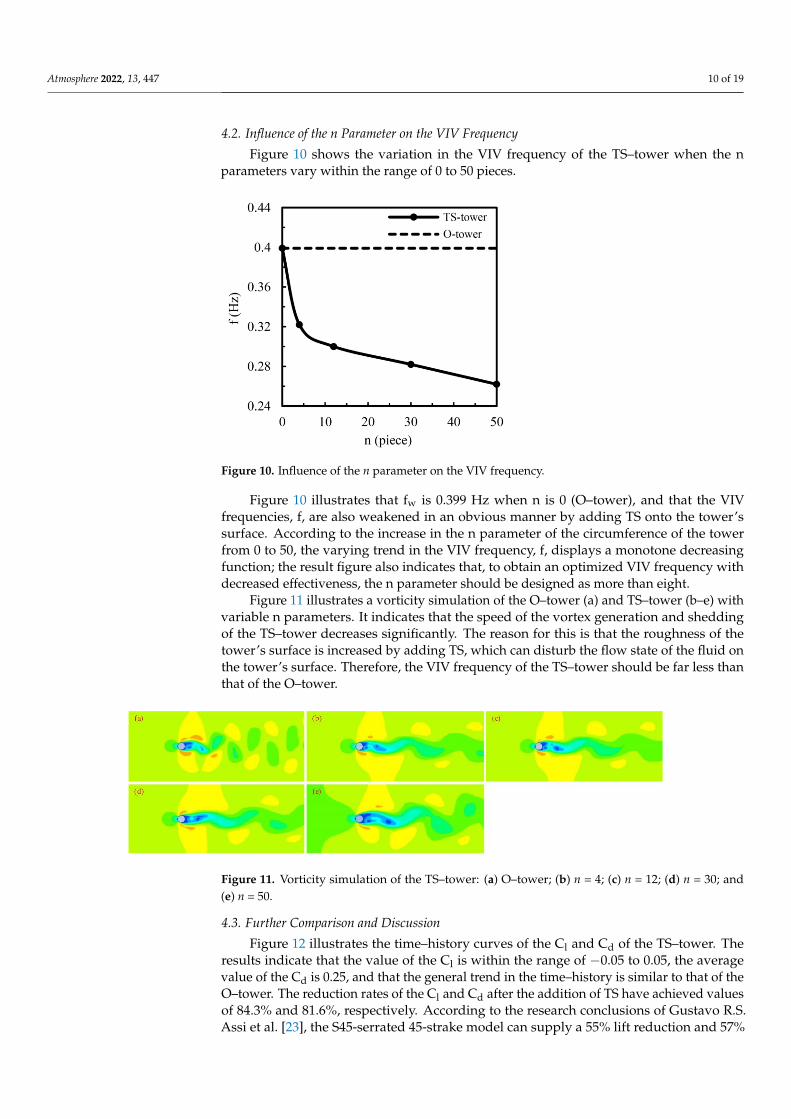
4.2. Influence of the n Parameter on the VIV Frequency
Figure 10 shows the variation in the VIV frequency of the TS–tower when the nparameters vary within the range of 0 to 50 pieces.
Figure 10. Influence of the n parameter on the VIV frequency.
Figure 10 illustrates that fw is 0.399 Hz when n is 0 (O–tower), and that the VIVfrequencies, f, are also weakened in an obvious manner by adding TS onto the tower’ssurface. According to the increase in the n parameter of the circumference of the towerfrom 0 to 50, the varying trend in the VIV frequency, f, displays a monotone decreasingfunction; the result figure also indicates that, to obtain an optimized VIV frequency withdecreased effectiveness, the n parameter should be designed as more than eight.
Figure 11 illustrates a vorticity simulation of the O–tower (a) and TS–tower (b–e) withvariable n parameters. It indicates that the speed of the vortex generation and sheddingof the TS–tower decreases significantly. The reason for this is that the roughness of thetower’s surface is increased by adding TS, which can disturb the flow state of the fluid onthe tower’s surface. Therefore, the VIV frequency of the TS–tower should be far less thanthat of the O–tower.
Figure 11. Vorticity simulation of the TS–tower: (a) O–tower; (b) n = 4; (c) n = 12; (d) n = 30; and(e) n = 50.
4.3. Further Comparison and Discussion
Figure 12 illustrates the time–history curves of the Cl and Cd of the TS–tower. Theresults indicate that the value of the Cl is within the range of −0.05 to 0.05, the averagevalue of the Cd is 0.25, and that the general trend in the time–history is similar to that of theO–tower. The reduction rates of the Cl and Cd after the addition of TS have achieved valuesof 84.3% and 81.6%, respectively. According to the research conclusions of Gustavo R.S.Assi et al. [23], the S45-serrated 45-strake model can supply a 55% lift reduction and 57%

Atmosphere 2022, 13, 447 11 of 19
drag reduction; comparison of the reduction rates validates and evaluates the effectivenessof reducing VIV due to the addition of TS.
Figure 12. The time history of the Cl and Cd of the TS–tower.
The fundamental point of the proposed methodology is to simulate the processesof vortex generation and shedding, so an assumed Re = 100 was defined to clarify thevortex characteristics under laminar flow conditions. It is still essential to carry out asimulation with actual Re to consider real flow state and to analyze the VIV problemunder turbulence flow conditions, and to discuss the relationships between the effect of theaddition of TS on reducing the VIV frequency and Re variation. For further investigation,the algorithm of realizable k-epsilon should be used; the actual Re can be calculatedaccording to Equation (5), and is defined as 360,000 in this case. Figure 13 shows thevariation in the VIV frequencies of the O–tower and TS–tower when the θ parameter varieswithin the range of 45◦ to 80◦:
Figure 13. VIV frequency comparison between the O–tower and TS–tower (actual Re = 360,000).
Figure 13 indicates that the effects of the TS angle on reducing the VIV frequencyis still obvious under turbulence flow conditions, but there are some difference betweenthe result figures: the VIV frequency of the O–tower (0.8 Hz) increases by 100% and themaximum VIV frequency of the TS–tower (0.599 Hz, when θ = 65◦) increases by 60%; thevarying trend in the TS–tower line is obviously different from the one in Figure 8; thecorresponding value of the TS angle of minimum frequency (0.5 Hz) changes to 55◦; andthe frequency value starts to increase in an obvious manner up to the maximum value
Atmosphere 2022, 13, 447 12 of 19
from this angle. The mentioned difference indicates that the VIV frequency of towers isrelative to the Re directly, but the frequency-reduction effect can also be performed by theaddition of TS. To consider the influence of the TS angle on reducing the VIV frequencyunder different fluid state conditions, the recommended TS angle should be less than 60◦;the parameter scheme could ensure that the VIV frequency reduction effect is significantenough for wind turbine towers under practical fluid state conditions.
4.4. Modal Analysis of Wind Turbine Towers
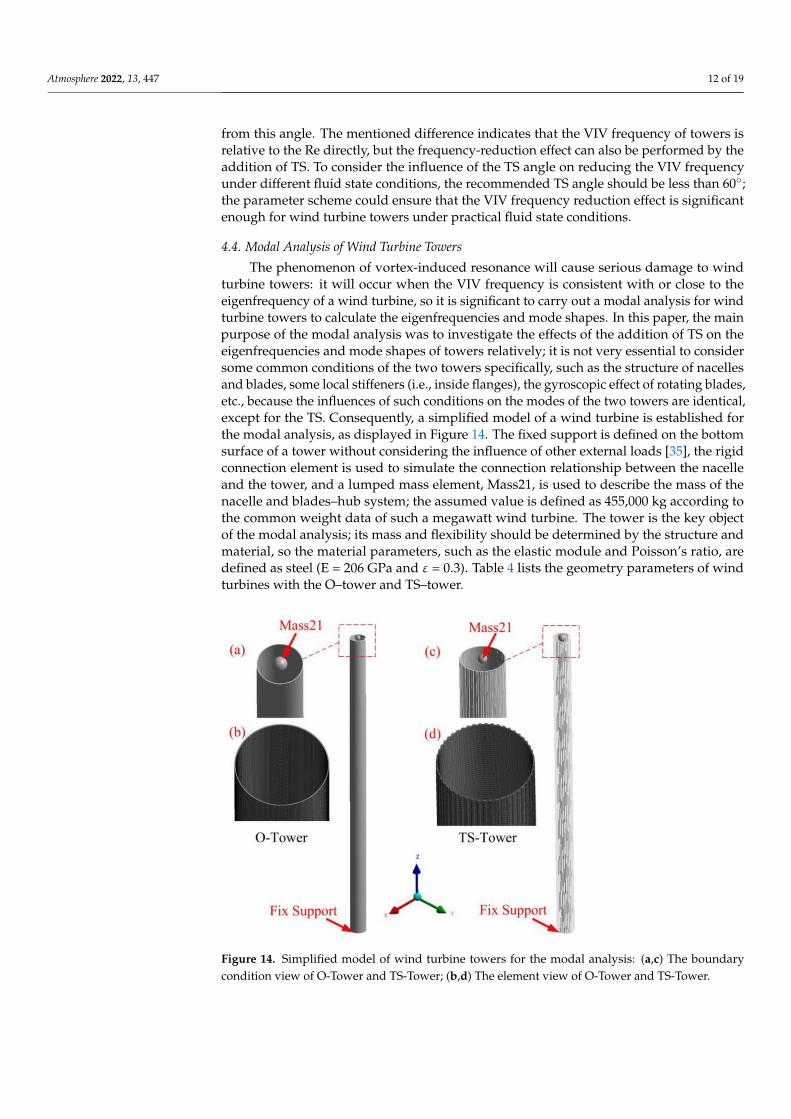
The phenomenon of vortex-induced resonance will cause serious damage to windturbine towers: it will occur when the VIV frequency is consistent with or close to theeigenfrequency of a wind turbine, so it is significant to carry out a modal analysis for windturbine towers to calculate the eigenfrequencies and mode shapes. In this paper, the mainpurpose of the modal analysis was to investigate the effects of the addition of TS on theeigenfrequencies and mode shapes of towers relatively; it is not very essential to considersome common conditions of the two towers specifically, such as the structure of nacellesand blades, some local stiffeners (i.e., inside flanges), the gyroscopic effect of rotating blades,etc., because the influences of such conditions on the modes of the two towers are identical,except for the TS. Consequently, a simplified model of a wind turbine is established forthe modal analysis, as displayed in Figure 14. The fixed support is defined on the bottomsurface of a tower without considering the influence of other external loads [35], the rigidconnection element is used to simulate the connection relationship between the nacelleand the tower, and a lumped mass element, Mass21, is used to describe the mass of thenacelle and blades–hub system; the assumed value is defined as 455,000 kg according tothe common weight data of such a megawatt wind turbine. The tower is the key objectof the modal analysis; its mass and flexibility should be determined by the structure andmaterial, so the material parameters, such as the elastic module and Poisson’s ratio, aredefined as steel (E = 206 GPa and ε = 0.3). Table 4 lists the geometry parameters of windturbines with the O–tower and TS–tower.
Figure 14. Simplified model of wind turbine towers for the modal analysis: (a,c) The boundarycondition view of O-Tower and TS-Tower; (b,d) The element view of O-Tower and TS-Tower.

Atmosphere 2022, 13, 447 13 of 19
Table 4. The geometry parameters of wind turbines with the O–tower and TS–tower.
Height(m)
Diameter(m)
L1(mm)
L2(mm)
L3(mm)
θ(Degree)
n(Piece)
Weight(t)
Mass21(t)
O–tower 80 4 40 — — — — 31.5 455TS–tower 80 4 16.5 50 150 61 50 31.5 455
For the analysis, the modal results of a maximum of 30 modes were calculated, andFigures 15 and 16 illustrate the first five mode shapes of the O–tower and TS–tower.According to the vibration theory of wind turbines, the higher module response attenuatesrapidly due to the effect of structural damping, so the influence of the higher module isnot considered in this paper. Table 5 lists the comparison of the first five eigenfrequenciesand VIV frequencies of the two types of wind turbine towers; the data indicate that theeigenfrequencies are not significantly different. According to the above discussions, the VIVfrequency of the TS–tower should be less than that of the O–tower, meaning that the excitingfrequency of the TS–tower is further away from the eigenfrequency of the wind turbine thanthat of the O–tower, which greatly decreases the possibility of vortex-induced resonance.
Figure 15. Mode shapes of the wind turbine with the O–tower: (a) first mode; (b) second mode;(c) third mode; (d) fourth mode; (e) fifth mode.
Table 5. Comparison of the eigenfrequency and VIV frequency of towers.
Mode O–tower TS–tower
Eigenfrequency(Hz) Mode Shapes Eigenfrequency
(Hz) Mode Shapes
1 0.4462 Radial oscillating 0.4535 Radial oscillating
2 3.9831 Radial bending 2.8794 Harmonic
3 6.7804 Harmonic 3.9641 Radial bending
4 7.4811 Radial oscillating 4.3289 Harmonic
5 9.3686 Harmonic 7.0978 Harmonic
VIV Frequency 0.399 Hz 0.262 Hz

Atmosphere 2022, 13, 447 14 of 19
Figure 16. Mode shapes of the wind turbine with the TS–tower: (a) first mode; (b) second mode;(c) third mode; (d) fourth mode; (e) fifth mode.
4.5. Wind Tunnel Experimental Study
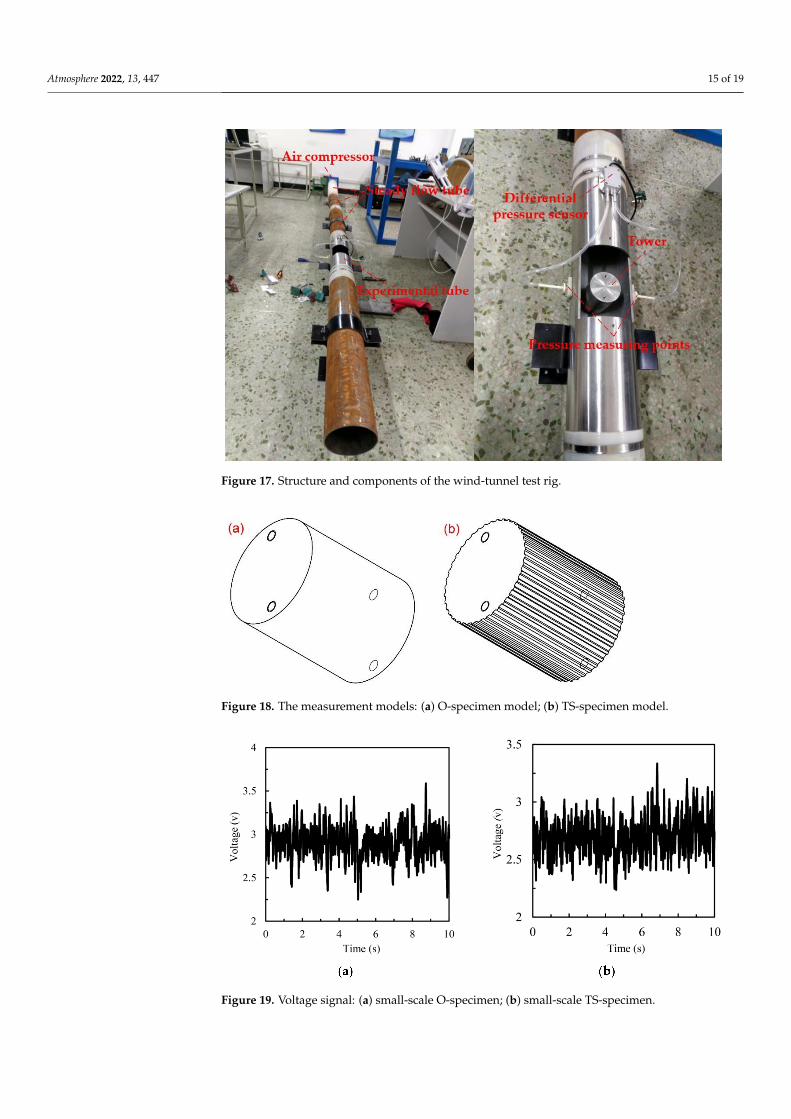
A wind tunnel experimental study was carried out to validate the effectiveness of theTS–tower in reducing the VIV frequency. According to the mechanism of vortex-inducedvibration, the generated vortices will alternately fall off periodically on both sides of thetower when fluid flows through the tower surface; the process causes the fluid pressureon both sides of the tower to vary alternately, with a phase difference of half a cycle.The frequency of the pressure variation is the VIV frequency of the tower, and the datacan be collected by a differential pressure sensor [36]. Figure 17 displays the structureand components of the wind tunnel test rig: the air compressor provides uniform andstable air flow to the steady-flow tube and measurement tube with a velocity of 10 m/s;the measurement model (small-scale O-specimen and TS-specimen models, as shown inFigure 18) and differential pressure sensor are installed in the experimental tube; and thegeometry parameters of the measurement models are listed in Table 6. For comparisonwith the actual sizes of the O–tower and TS–tower in Table 4, the diameter and heightof the test specimens used in the experiment are reduced by 50 times (D = 80 mm andH = 100 mm). On the basis of the model similarity criterion, the TS sizes L2 and L3 arealso reduced by 50 times correspondingly. At the same time, the TS numbers and angleremained as 50 pieces and 61 degrees, respectively, because the two parameters are notrelated to the size difference.
Table 6. Geometry parameters of the measurement models.
Model Height (mm) Diameter (mm) L2 (mm) L3 (mm) n (Piece) θ (Degree)
O-spec. 100 80 — — — —TS-spec. 100 80 1 3 50 61
Figure 19 displays the voltage signals of the differential pressure sensor with a sam-pling time of 10 s, which means that the number of sampling points was 20,480. The voltagesignal variation tendency reflects the variation in the pressure difference on both sides ofthe specimens; the VIV frequency spectrums of the measurement models can be obtainedby FFT, as shown in Figure 20.
Atmosphere 2022, 13, 447 15 of 19
Figure 17. Structure and components of the wind-tunnel test rig.
Figure 18. The measurement models: (a) O-specimen model; (b) TS-specimen model.
Figure 19. Voltage signal: (a) small-scale O-specimen; (b) small-scale TS-specimen.

Atmosphere 2022, 13, 447 16 of 19
Figure 20. VIV frequency spectrum (FFT): (a) small-scale O-specimen; (b) small-scale TS-specimen.
According to the FFT spectrum results, the VIV frequencies of the O-specimen (fsw)and TS-specimen (fs) are 5.562 Hz and 3.345 Hz (the frequencies that correspond to themaximum power spectral density of air pressure signals), respectively, and a reductionrate of 40.53% is reached, similar to the reduction rate obtained by the simulation analysis(34.3%). The experimental results of the wind tunnel testing validate that the TS can reducethe VIV frequency of the tower effectively. In summary, the assumption that the TS structurecould be used to reduce the VIV frequency of the tower has been analyzed from threeavenues: theoretical analysis, numerical simulation analysis, and experimental verification.All of the results indicate that it is reliable to decrease the VIV exciting frequency bymanufacturing TS to disturb the generation and shedding of the vortex, that the VIVfrequency can be determined by a differential pressure sensor, and that the proposedmethodology must be effective to avoid the VIV resonance of wind turbine towers.
5. Conclusions
This paper proposed a method to simulate the vortex-induced vibration (VIV) of windturbine towers according to the theory of cylinder flow, and investigated the suppressiveeffect of TS on the VIV frequency of towers on the basis of a fluid–solid coupling analysis.The research conclusions mainly include the following four points:
1. The proposed model can be used to analyze the vortex-induced vibration (VIV)problems of wind turbine towers. The reliability of the algorithm is validated byconsulting relevant theoretical results and data from the literature (see Table 2).
2. Manufacturing continuous trapezoidal straight spoiler plates (TS) on the outer surfaceof wind turbine towers can decrease the VIV frequency significantly. To obtain themost optimized effectiveness, the recommended geometry parameters of the TS are:an angle, θ, of less than 60◦; a number of TS, n, greater than 8; L3 and L4 being relativeto the tower diameter, D, and n; as well as L1 and L2 being relative to the thickness ofthe base plate (see Figure 2).
3. The TS do not influence the eigenfrequencies of wind turbine structures significantly,but can decrease the exciting frequency (VIV frequency) in an obvious manner. It iseffective for avoiding the vortex-induced resonance risk of wind turbine towers.
4. The function of reducing the VIV frequency of TS is validated by an analogical windtunnel test that uses small-scale specimens (with the consideration of the geometrysimilarity). The results indicate that the experimental VIV frequency deduction ratereached 40.53%, similar to the rate of this simulation (34.3%).
In future work, the methodology of research will be optimized to investigate the VIVsituation in the fluid state with a practical Re, and will try to simulate vortex generation andshedding in turbulence more accurately. The influences of other geometry parameters of
Atmosphere 2022, 13, 447 17 of 19
TS, such as the height, L2; width, L3; and fillet, α, on the VIV frequency will also be studied,and there will be an attempt to establish a database regarding the rule of the influence ofeach TS dimension variable on the VIV frequency of towers, so as to optimize the size ofspoilers and minimize the influence of VIV on towers. The research conclusions obtainedare significant to improve the operation stability and power generation efficiency of windturbines; they also can be used as a reference to solve the VIV problems of other structureswith similar shapes, such as offshore risers, offshore platforms, and bridges.
Author Contributions: Conceptualization, methodology, literature review, discussions and comments,and writing—review and editing, Z.L.; data analysis, development and implementation of the model,and writing—original draft preparation, T.Z.; data collection, literature review, proofreading, and projectadministration, Y.C. and Z.W. All authors have read and agreed to the published version of the manuscript.
Funding: This research was funded by by Dalian Maritime University, Dalian, China, grant number99201600102. This research received no external funding.
Institutional Review Board Statement: Not applicable.
Informed Consent Statement: Not applicable.
Data Availability Statement: Data available on request due to privacy.
Acknowledgments: The research in this article was supported by Dalian Huarui Heavy IndustryGroup Co. Ltd., Dalian, China and funded by Dalian Maritime University, Dalian, China.
Conflicts of Interest: The authors declare no conflict of interest.
Nomenclature
VIV Vortex-induced vibrationCFD Computational fluid mechanicsO–tower Original towerTS–tower Tower with trapezoid straight spoiler platesRe Reynolds numberSt Strouhal numberFFT Fast Fourier transformRe Reynolds numberSt Strouhal numberF Lift forceFd Drag forceCl Lift coefficientCd Drag coefficientD Characteristic diameterH Characteristic heightW The weight of the towerU Flow velocityt Flow timeρ Fluid densityp Fluid pressurev Kinematic viscosity of fluidµ Dynamic viscosity of fluidL1 The thickness of plateL2 The height of TSL3 The width of TSL4 The spacing of TSn The number of TSθ The angle of TSα The fillet of TSfw VIV frequency of the O–towerf VIV frequency of the TS–tower
Atmosphere 2022, 13, 447 18 of 19
fsw VIV frequency of a small-scale O–towerfs VIV frequency of a small-scale TS–tower
References1. Li, Y.; Li, A.; Deng, Y. Performance Investigation of Circular Tld Devices Used in Wind Turbine Generation Tower Via Both
Experiment and Numerical Simulation. J. Vib. Eng. Technol. 2021, 9, 1715–1732. [CrossRef]2. Kang, L.; Ge, F.; Wu, X.; Hong, Y. Experiments and Modeling on the Maximum Displacement of a Long Tensioned Mooring
Tether Subjected to Vortex-induced Vibration. Procedia Eng. 2016, 166, 83–90. [CrossRef]3. Mendis, P.; Ngo, T.; Haritos, N.; Hira, A.; Samali, B.; Cheung, J. Wind Loading on Tall Buildings. Electron. J. Struct. Eng. 2007, 7,
41–54. [CrossRef]4. Christensen, R.M.; Nielsen, M.G.; Ulrik, S.-A. Effective Vibration Dampers: Mast, Towers and Chimneys. In Proceedings of
the EUROSTEEL, Copenhagen, Denmark, 13–15 September 2017; Ernst & Sohn GmbH: Berlin, Germany, 2017; Volume 1, pp.4351–4360. [CrossRef]
5. Chizfahm, A.; Yazdi, E.A.; Eghtesad, M. Dynamic modeling of vortex induced vibration wind turbines. Renew. Energy 2018, 121,632–643. [CrossRef]
6. Khodaie, N. Vibration control of super-tall buildings using combination of tapering method and TMD system. J. Wind Eng. Ind.Aerodyn. 2019, 196, 104031. [CrossRef]
7. Liang, S.; Yang, W.; Song, J.; Wang, L.; Hu, G. Wind-induced responses of a tall chimney by aeroelastic wind tunnel test using acontinuous model. Eng. Struct. 2018, 176, 871–880. [CrossRef]
8. Song, M.T.; Cao, D.Q.; Zhu, W.D. Vortex-Induced Vibration of a Cable-Stayed Bridge. Shock Vib. 2016, 2016, 1928086. [CrossRef]9. Zhang, Y.; Habashi, W.G.; Khurram, R.A. Predicting Wind-Induced Vibrations of High-Rise Buildings Using Unsteady Cfd and
Modal Analysis. J. Wind. Eng. Ind. Aerodyn. 2015, 136, 165–179. [CrossRef]10. Chou, J.-S.; Tu, W.-T. Failure analysis and risk management of a collapsed large wind turbine tower. Eng. Fail. Anal. 2011, 18,
295–313. [CrossRef]11. Sarpkaya, T. A Critical Review of the Intrinsic Nature of Vortex-Induced Vibrations. J. Fluids Struct. 2004, 19, 389–447. [CrossRef]12. Jafari, M.; Alipour, A. Methodologies to Mitigate Wind-Induced Vibration of Tall Buildings: A State-of-the-Art Review. J. Build.
Eng. 2021, 33, 101582. [CrossRef]13. Kareem, A.; Kijewski, T.; Tamura, Y. Mitigation of Motions of Tall Buildings with Specific Examples of Recent Applications. Wind
Struct. 1999, 2, 201–251. [CrossRef]14. Talib, E.; Shin, J.-H.; Kwak, M.K. Designing multi-input multi-output modal-space negative acceleration feedback control for
vibration suppression of structures using active mass dampers. J. Sound Vib. 2018, 439, 77–98. [CrossRef]15. Yang, D.-H.; Shin, J.-H.; Lee, H.; Kim, S.-K.; Kwak, M.K. Active vibration control of structure by Active Mass Damper and
Multi-Modal Negative Acceleration Feedback control algorithm. J. Sound Vib. 2016, 392, 18–30. [CrossRef]16. Momtaz, A.A.; Abdollahian, M.A.; Farshidianfar, A. Study of wind-induced vibrations in tall buildings with tuned mass dampers
taking into account vortices effects. Int. J. Adv. Struct. Eng. 2017, 9, 385–395. [CrossRef]17. Xie, S.; Jin, X.; He, J.; Zhang, C. Structural responses suppression for a barge-type floating wind turbine with a platform-based
TMD. IET Renew. Power Gener. 2019, 13, 2473–2479. [CrossRef]18. Yang, J.; He, E. Coupled modeling and structural vibration control for floating offshore wind turbine. Renew. Energy 2020, 157,
678–694. [CrossRef]19. Gao, Y.; Fu, S.; Ren, T.; Xiong, Y.; Song, L. VIV response of a long flexible riser fitted with strakes in uniform and linearly sheared
currents. Appl. Ocean Res. 2015, 52, 102–114. [CrossRef]20. Hong, K.-S.; Shah, U.H. Vortex-induced vibrations and control of marine risers: A review. Ocean Eng. 2018, 152, 300–315.
[CrossRef]21. Wang, J.-S.; Fan, D.; Lin, K. A review on flow-induced vibration of offshore circular cylinders. J. Hydrodyn. 2020, 32, 415–440.
[CrossRef]22. Holland, V.; Tezdogan, T.; Oguz, E. Full-scale CFD investigations of helical strakes as a means of reducing the vortex induced
forces on a semi-submersible. Ocean Eng. 2017, 137, 338–351. [CrossRef]23. Assi, G.R.; Crespi, T.; Gharib, M. Novel geometries of serrated helical strakes to suppress vortex-induced vibrations and reduce
drag. Appl. Ocean Res. 2022, 120, 103034. [CrossRef]24. Sukarnoor, N.I.M.; Quen, L.K.; Abu, A.; Kuwano, N.; Hooi-Siang, K.; Desa, S.M. The effectiveness of helical strakes in suppressing
vortex-induced vibration of tandem circular cylinders. Ain Shams Eng. J. 2021, 13, 101502. [CrossRef]25. Zhou, B.; Wang, X.; Guo, W.; Gho, W.M.; Tan, S.K. Experimental study on flow past a circular cylinder with rough surface. Ocean
Eng. 2015, 109, 7–13. [CrossRef]26. Bianchi, V.; Silva, L.S.; Cenci, F.; Hirabayashi, S.; Suzuki, H.; Gonçalves, R.T. Spoiler plate effects on the suppression of vortex-
induced motions of a single circular cylinder. Ocean Eng. 2020, 210, 107569. [CrossRef]27. Goncalves, R.T.; Fujarra, A.L.; Rosetti, G.F.; Nishimoto, K. Mitigation of Vortex-Induced Motion, (Vim) on a Monocolumn
Platform: Forces and Movements. J. Offshore Mech. Arct. Eng. 2010, 132, 041102. [CrossRef]
Atmosphere 2022, 13, 447 19 of 19
28. Lubbad, R.K.; Løset, S.; Moe, G. Experimental Investigations of the Efficiency of Round-Sectioned Helical Strakes in SuppressingVortex Induced Vibrations. J. Offshore Mech. Arct. Eng. 2011, 133, 041102. [CrossRef]
29. Quen, L.K.; Abu, A.; Kato, N.; Muhamad, P.; Sahekhaini, A.; Abdullah, H. Investigation on the effectiveness of helical strakes insuppressing VIV of flexible riser. Appl. Ocean Res. 2014, 44, 82–91. [CrossRef]
30. Gao, Y.; Fu, S.-X.; Cao, J.; Chen, Y.-F. Experimental study on response performance of VIV of a flexible riser with helical strakes.China Ocean Eng. 2015, 29, 673–690. [CrossRef]
31. Xu, F.; Chen, W.-L.; Xiao, Y.-Q.; Li, H.; Ou, J.-P. Numerical study on the suppression of the vortex-induced vibration of anelastically mounted cylinder by a traveling wave wall. J. Fluids Struct. 2014, 44, 145–165. [CrossRef]
32. Roshko, A. On the Development of Turbulent Wakes from Vortex Streets; National Advisory Committee for Aeronautics: Washington,DC, USA, 1954.
33. Braza, M.; Chassaing, P.; Minh, H.H. Numerical study and physical analysis of the pressure and velocity fields in the near wakeof a circular cylinder. J. Fluid Mech. 1986, 165, 79–130. [CrossRef]
34. Mittal, S.; Tezduyar, T.E. Computation of Unsteady Incompressible Flows Past Oscillating Cylinders. In Proceedings of theFourth International Conference on Computing in Civil and Building Engineering, Tokyo, Japan, 29–31 July 1991; pp. 95–102.Available online: https://www.researchgate.net/publication/303813048_Computation_of_Unsteady_Incompressible_Flows_Past_Oscillating_Cylinders (accessed on 19 January 2022).
35. Jin, Y.; Gu, J.; Ma, L. Static strength and modal analysis of large wind turbine tower. Mech. Eng. Autom. 2017, 1, 63–65. Availableonline: https://kns.cnki.net/kcms/detail/14.1319.TH.20170112.1349.050.html (accessed on 19 January 2022).
36. Ma, P.; Li, H.; Lin, D.; Zhang, L.; Wang, L. Research on Differential Pressure Vibration Measurement Device for Flow InducedVibration Test. Chin. J. Sci. Instrum. 2020, 41, 170–177. [CrossRef]


![Straight Lines Slides [Compatibility Mode]](https://static.fdokumen.com/doc/165x107/6316ee6071e3f2062906978b/straight-lines-slides-compatibility-mode.jpg)