The eccentricity effect: Target eccentricity affects performance on conjunction searches
21
Perception & Psychophysics 1995,57 (8),1241-1261 The eccentricity effect: Target eccentricity affects performance on conjunction searches MARISA CARRASCO, DENISE L. EVERT, IRENE CHANG, and SVETLANA M. KATZ Wesleyan University, Middletown, Connecticut The serial pattern found for conjunction visual-search tasks has been attributed to covert atten- tional shifts, even though the possible contributions of target location have not been considered. To investigate the effect of target location on orientation X color conjunction searches, the target's du- ration and its position in the display were manipulated. The display was present either until ob- servers responded (Experiment I), for 104msec (Experiment 2), or for 62msec (Experiment 3). Tar- get eccentricity critically affected performance: A pronounced eccentricity effect was very similar for all three experiments; as eccentricity increased, reaction times and errors increased gradually. Furthermore, the set-size effect became more pronounced as target eccentricity increased, and the extent of the eccentricity effect increased for larger set sizes. In addition, according to stepwise re- gressions, target eccentricity as well as its interaction with set size were good predictors of perfor- mance. Wesuggest that these findings could be explained by spatial-resolution and lateral-inhibition factors. The serial self-terminating hypothesis for orientation X color conjunction searches was eval- uated and rejected. We compared the eccentricity effect as well as the extent of the orientation asym- metry in these three conjunction experiments with those found in feature experiments (Carrasco & Katz, 1992).The roles of eye movements, spatial resolution, and covert attention in the eccentricity effect, as well as their implications, are discussed. A good deal of current research assumes that covert shifts of attention play an important role in visual-search tasks. In fact, the absence or presence of these attentional shifts has been said to characterize the nature of the search process: In the preattentive stage, search time is unaffected by the number of items in the display, search is said to be parallel, and no shifts are considered to have occurred; in the attentive stage, search time increases as a function of the number of items in the display, search is said to be serial, and shifts are considered to have taken place (e.g., Treisman, 1982, 1986, 1991; Treisman & Gelade, 1980; Wolfe, 1994). Surprisingly, visual- search theories have not taken into account the effect of target location on search efficiency. Theories of visual search have been based on performance averaged across all locations of the display, without taking into consider- ation the inherent constraints of the retina. Given that spatial resolution is better for the fovea than for the pe- riphery (e.g., DeValois & DeValois, 1988), and that lat- eral interference is more pronounced in the periphery This study was supported by the National Science Foundation (NYl Grant SBR-9357986), by an AAUW American Fellowship to M.e., and by Ford summer grants to I.C. and S.M.K. Parts of this study were presented at the 32nd meeting of the Psychonomic Society, November 1991, and at the 16th European Conference on Visual Perception, Au- gust 1993. We would like to thank reviewers Glyn Humphreys and Je- remy Wolfe for helpful comments on a previous version of this paper, as well as Nicole P. Hubbard, Krista Johansen, Tracy Mcl.ean, and Pepper Williams for their assistance in analyzing data. Correspon- dence regarding this paper should be addressed to M. Carrasco, De- partment of Psychology, New York University, 6 Washington Place, New York, NY 10003-1055 (e-mail: [email protected]). than in the fovea (e.g., Breitmeyer, 1984), processing may be inherently better for conjunction targets located at the fovea than at the periphery. Further, the literature has largely failed to recognize the fact that if detecting the target requires foveal processing, observers would have to shift eye fixation from one stimulus or region of the display to the next, and serial search would necessar- ily take place. The possible interaction between overt shifts of attention (eye movements) and covert shifts of attention (noneye movements) has not been adequately explored (Kinchla, 1992). Investigating the roles of eye movement and target location in the display is critical for the understanding of both feature and conjunction searches. Although some researchers have instructed observers to keep their eyes at the fixation point during display presentation (e.g., Enns & Rensink, 1990a, 1990b), it is very likely that observers make more than one eye fixa- tion during the usual range it takes them to respond (0.5- 1.5 sec), especially with large set sizes (Pashler, 1987a). In fact, eye movements increase for large set sizes for conjunction tasks (Zelinsky, 1994; Zelinsky, Sheinberg, & Bulthoff, 1993). Given that a serial scan could result from successive eye movements and fixations rather than from sequential focusing of covert attention, it is neces- sary to clarify the contribution of eye movements to search performance before theorizing about covert atten- tion. Klein and Farrell (1989) and Treisman and Gormi- can (1988) have concluded that eye movements are not responsible for the normally observed search pattern. However, Zelinsky (1994) has recently conducted a thor- ough investigation of the oculomotor behavior that ac- 1241 Copyright 1995 Psychonomic Society, Inc.
Transcript of The eccentricity effect: Target eccentricity affects performance on conjunction searches

Perception & Psychophysics1995,57 (8),1241-1261
The eccentricity effect: Target eccentricity affectsperformance on conjunction searches
MARISA CARRASCO, DENISE L. EVERT, IRENE CHANG, and SVETLANA M. KATZWesleyan University, Middletown, Connecticut
The serial pattern found for conjunction visual-search tasks has been attributed to covert attentional shifts, even though the possible contributions of target location have not been considered. Toinvestigate the effect of target location on orientation X color conjunction searches, the target's duration and its position in the display were manipulated. The display was present either until observers responded (Experiment I), for 104msec (Experiment 2), or for 62 msec (Experiment 3). Target eccentricity critically affected performance: A pronounced eccentricity effect was very similarfor all three experiments; as eccentricity increased, reaction times and errors increased gradually.Furthermore, the set-size effect became more pronounced as target eccentricity increased, and theextent of the eccentricity effect increased for larger set sizes. In addition, according to stepwise regressions, target eccentricity as well as its interaction with set size were good predictors of performance. Wesuggest that these findings could be explained by spatial-resolution and lateral-inhibitionfactors. The serial self-terminating hypothesis for orientation X color conjunction searches was evaluated and rejected. We compared the eccentricity effect as well as the extent of the orientation asymmetry in these three conjunction experiments with those found in feature experiments (Carrasco &Katz, 1992).The roles of eye movements, spatial resolution, and covert attention in the eccentricityeffect, as well as their implications, are discussed.
A good deal of current research assumes that covertshifts ofattention play an important role in visual-searchtasks. In fact, the absence or presence of these attentionalshifts has been said to characterize the nature of thesearch process: In the preattentive stage, search time isunaffected by the number of items in the display, searchis said to be parallel, and no shifts are considered to haveoccurred; in the attentive stage, search time increases asa function of the number of items in the display, searchis said to be serial, and shifts are considered to havetaken place (e.g., Treisman, 1982, 1986, 1991; Treisman& Gelade, 1980; Wolfe, 1994). Surprisingly, visualsearch theories have not taken into account the effect oftarget location on search efficiency. Theories of visualsearch have been based on performance averaged acrossall locations of the display, without taking into consideration the inherent constraints of the retina. Given thatspatial resolution is better for the fovea than for the periphery (e.g., DeValois & DeValois, 1988), and that lateral interference is more pronounced in the periphery
This study was supported by the National Science Foundation (NYlGrant SBR-9357986), by an AAUW American Fellowship to M.e.,and by Ford summer grants to I.C. and S.M.K. Parts of this study werepresented at the 32nd meeting of the Psychonomic Society, November1991, and at the 16th European Conference on Visual Perception, August 1993. We would like to thank reviewers Glyn Humphreys and Jeremy Wolfe for helpful comments on a previous version of this paper,as well as Nicole P. Hubbard, Krista Johansen, Tracy Mcl.ean, andPepper Williams for their assistance in analyzing data. Correspondence regarding this paper should be addressed to M. Carrasco, Department of Psychology, New York University, 6 Washington Place,New York, NY 10003-1055 (e-mail: [email protected]).
than in the fovea (e.g., Breitmeyer, 1984), processingmay be inherently better for conjunction targets locatedat the fovea than at the periphery. Further, the literaturehas largely failed to recognize the fact that if detectingthe target requires foveal processing, observers wouldhave to shift eye fixation from one stimulus or region ofthe display to the next, and serial search would necessarily take place. The possible interaction between overtshifts of attention (eye movements) and covert shifts ofattention (noneye movements) has not been adequatelyexplored (Kinchla, 1992). Investigating the roles of eyemovement and target location in the display is critical forthe understanding of both feature and conjunctionsearches.
Although some researchers have instructed observersto keep their eyes at the fixation point during displaypresentation (e.g., Enns & Rensink, 1990a, 1990b), it isvery likely that observers make more than one eye fixation during the usual range it takes them to respond (0.51.5 sec), especially with large set sizes (Pashler, 1987a).In fact, eye movements increase for large set sizes forconjunction tasks (Zelinsky, 1994; Zelinsky, Sheinberg,& Bulthoff, 1993). Given that a serial scan could resultfrom successive eye movements and fixations rather thanfrom sequential focusing of covert attention, it is necessary to clarify the contribution of eye movements tosearch performance before theorizing about covert attention. Klein and Farrell (1989) and Treisman and Gormican (1988) have concluded that eye movements are notresponsible for the normally observed search pattern.However, Zelinsky (1994) has recently conducted a thorough investigation of the oculomotor behavior that ac-
1241 Copyright 1995 Psychonomic Society, Inc.
1242 CARRASCO, EVERT, CHANG, AND KATZ
companies some parallel/serial visual-search tasks, andconcluded that a detailed study ofeye movements is necessary to illuminate underlying processes ofvisual searchthat are not easily addressed using the conventional reaction time (RT) methodology.
Target LocationEven in the absence of eye movements, there remain
retinal differences between the fovea and the peripheryin the processing of visual stimuli, as have been documented in various physiological and psychophysicalstudies of spatial resolution and visual acuity. The central 1.5°-2° of visual angle is the locus of the fovea.There are several interrelated differences between thefovea and the periphery that result in decreased spatialresolution with increasing retinal eccentricity (e.g., DeValois & DeValois, 1988): There are more receptor cellsin the fovea than in the periphery; the size of the receptive fields increases toward the periphery of the eye;fewer photoreceptors converge onto a single ganglioncell at the fovea than at the periphery; and the representation of the fovea is magnified at the lateral geniculatenuclei and the visual cortex. Moreover, according to psychophysical evidence, there is a decrease in contrast sensitivity with increasing retinal eccentricity (Cannon, 1985;Rijsdijk, Kroon, & van der Wilt, 1980), and whereas lowspatial frequency channels are located throughout theretina, high spatial frequency channels congregate in thefovea and decrease toward the periphery (Graham, 1981).
On the basis of this evidence that spatial resolution isbetter at the center of the retina than at peripheral eccentricities, we believe that target processing should beinherently better at the fovea. Thus, we would expect RTand errors to increase as the target is presented in themore peripheral positions of the display. Moreover, because the size of the receptive fields becomes larger asretinal eccentricity increases, we would also expect lateralmasking to affect target detection in a more pronouncedway as the target's eccentricity increases (Breitmeyer,1984). As a stimulus is displaced from fovea to periphery, accuracy decreases and latency increases; this retinal gradient is steeper if the stimulus is surrounded byother items than if it appears alone, and lateral interference is more pronounced in the periphery than in thefovea (e.g., Estes & Wolford, 1971; Wolford, 1975; Wolford & Shum, 1980).
Indeed, target location may confound the set-size effect; the extent of the set-size effect may be a function ofthe target eccentricity in the display. On the one hand, ifthe items in the display have a constant density, then withgreater set sizes, the display would necessarily subtend alarger visual angle. On the other hand, if there is a constant display size, then greater set sizes would necessarily increase display density. As a result, the probabilityof having neighboring distractors processed by the sameor neighboring receptive fields, and consequently thepossibility of lateral inhibition and lateral masking,would increase, especially at greater eccentricities. Therefore, the more stimuli that appear at peripheral regions of
the display, the more pronounced the set-size effect wouldbe. Indeed, if we were to find that the set-size effect became more pronounced as target eccentricity increases,we would question the sufficiency of covert attentionalshifts as the explanation ofthe serial self-terminating hypothesis for conjunction searches (e.g., Treisman & Sato,1990; Wolfe, 1994; see General Discussion).
In the experiments we report in this article, we systematically explored the effects of target location on observers' performance on an orientation X color conjunction search. We manipulated target location in the displayand display duration. In the first experiment, eye movements could take place while observers were searchingfor the conjunction because the display was present untilthey responded; as a result, target location did not necessarily correspond to a particular retinal eccentricity.Brief display durations used in Experiments 2 and 3 allowed us to equate field and retinal eccentricities, andthus to address both the effect of preventing eye movements and the role of spatial resolution on search performance. In addition, further shortening display durationin Experiment 3 enabled us to study the effect of reducing the number ofcovert attentional shifts that could takeplace while the display was present. Moreover, given thatcovert attention (e.g., Treisman, 1991; Treisman, Cavanagh, Fischer, Ramachandran, & von der Heydt, 1990;Treisman & Sato, 1990) and eye movements (Zelinsky,1994; Zelinsky et aI., 1993) are considered to be moreprominent in conjunction searches than in feature searches,comparing the conjunction results ofthis study with thoseoffeatures (Carrasco & Katz, 1992) will allow us to examine whether target location and display duration hada similar effect on searches that are presumably carriedout by different underlying processes (parallel vs. serial).
Carrasco and Katz (1992) investigated the role of target location in an orientation feature search when thedisplay was present either until the observer responded(free-viewing condition), for 104 msec (fixed-viewingcondition), or for 62 msec (fast-fixed-viewing condition);the first display duration allowed for eye movements,whereas the second and third did not. They found a persistent and pronounced eccentricity effect: Targets located at peripheral locations from the fixation point weremore difficult to detect than those located closer to thefixation point, as assessed by both speed and accuracy.As their detailed position analyses illustrate how the hidden variable of target location influences search performance, they show that theories of visual search should"not be based on performance averaged across all locations in the display.
On the basis of the premise that observers may movetheir eyes while serially scanning the display of conjunction searches, one could expect a gradient of detectability characterized by increasing RTs for the targetpositions that are scanned later. For instance, if observersmoved their eyes as in reading text, from left to right andfrom top to bottom, shorter RTs would be found for thetop left portion ofthe matrix, and longer RTs for the bottom right portion of the matrix. In fact, some studies
have found that the visual detectability gradient is influenced by the direction in which observers normally read(Efron, Yund, & Nichols, 1987; Heron, 1957; Mishkin &Forgays, 1952; Ostrovsky-Solis, Efron, & Yund, 1991).The fact that the eccentricity effect could not be explainedby a conventional eye-movement pattern, and that it washighly similar for the fixed- and free-viewing conditions,indicated that eye movements were not responsible forthis effect: Had this been the case, the effect would havebeen more pronounced for the free- than for the fixedviewing conditions; moreover, since performance shouldbe accurate once the eyes have moved to the target location, we would expect this difference to be more apparent in terms of latency than in terms of accuracy.
Because, in general, performance did not differ significantly for the three viewing conditions, Carrasco andKatz (1992) concluded that briefdisplay duration may bean effective way to study the effects of precluding eyemovements on search performance. Although RTs weresimilar, the error rates increased for both fixed-viewingconditions, indicating that performance was somewhathampered when the display duration was shortened (theerror rates, however, were comparable to many othervisual-search studies in which eye movements were notprevented; e.g., Enns & Rensink, 1990a; Klein & Farrell,1989; Treisman & Gelade, 1980).
Conjunction AsymmetryA central finding for the exploration of the role of at
tention in the feature integration theory (FIT) model hasbeen that of feature asymmetries (Cavanagh, Arguin, &Treisman, 1990; Treisman, 1985, 1986, 1991, 1993;Treisman et al., 1990; Treisman & Gormican, 1988). Forinstance, according to FIT, the existence of an orientation asymmetry--the fact that a tilted target among vertical distractors is detected more efficiently (in a parallel fashion) than a vertical target among tilted distractors(in a serial fashion)-indicates that tilt is encoded byearly vision, because it is a deviating value from verticality, the standard feature for the system.
Carrasco and Katz (1992) found an orientation asymmetry in the sense that tilted targets were detected amongvertical distractors faster and more accurately than vertical targets were detected among tilted distractors; however, the results did not support the parallel/serial dichotomy that ostensibly underlies the detection of thetilted and vertical targets. The finding that the eccentricity effect was more pronounced for the vertical thanfor the tilted feature targets could possibly be attributedto covert attentional shifts (Carrasco & Katz, 1992) thatare presumably involved when searching for the verticalbut not for the tilted target (Cavanagh et aI., 1990; Treisman, 1985, 1986; Treisman et aI., 1990; Treisman & Gormican, 1988). However, the existence of the eccentricityeffect for the preattentive tilted target makes it clear thatcovert attention is not necessary for the eccentricity effect to emerge, and suggests spatial resolution as the underlying factor for the tilted-target eccentricity effect,and a likely explanation for the vertical-target eccentric-
THE ECCENTRICITY EFFECT 1243
ity effect. In an attempt to disentangle the role that covertattention and spatial resolution play in the eccentricityeffect, we examined whether there would be a differencein the eccentricity effect found for a conjunction task thatis traditionally considered to be performed as a serialprocess and with covert shifts ofattention (e.g., Kinchla,1992; Treisman, 1993; Treisman & Sato, 1990; Wolfe,1992, 1994; Wolfe, Cave, & Franzel, 1989), in comparison with the eccentricity effect that has already beenfound for a simple feature task (Carrasco & Katz, 1992).
Additionally, by utilizing a conjunction task, we wereable to determine not only whether the differences between the eccentricity effect for the tilted versus the vertical target found with a feature task would be enhancedwith a conjunction task, but also whether a conjunctionasymmetry would emerge with a more serial or steeperslope for the vertical versus the tilted target. I On thebasis of Treisman 's hypothesis and the idea that searchrate trends for known conjunctions can be predicted byassuming additive contributions from each componentfeature (Treisman & Sato, 1990), we expected that anasymmetry found at the feature level would also emergefor conjunctions of those features (i.e., that the tiltedconjunction target would be detected more efficientlythan the vertical conjunction target). Alternatively, wecan base our prediction of a conjunction asymmetry onWolfe's guided search (GS) theory, which proposes thatthe parallel process guides attention toward likely targetsby exciting in the parallel feature maps all of the spatiallocations in which the feature components of the knownconjunction target are present (Wolfe, 1992, 1994; Wolfe& Cave, 1990; Wolfe et aI., 1989). In this way, there is,at the location containing the target, a double excitationthat directs attention to that location in order to accomplish the synthesis of the features. Specifically in thecase of the tilted versus the vertical target, Wolfe assertsthat the tilted target's high level of salience and left-rightactivation may more effectively guide the serial search incomparison with the less salient vertical target that contributes no activation.
EXPERIMENTS
Two issues were explored in the present study: Thefirst concerned the question of whether target positionaffects search performance. Target position was either0.7°, 1.6°,2.1°,2.6°,2.9°, or 3.5° ofvisual angle away fromthe fixation point. Because observers had time to movetheir eyes during the display's duration in the free-viewingcondition (Experiment I), retinal eccentricity and fieldeccentricity did not necessarily correspond in this condition. In contrast, because observers did not have time tomove their eyes during the display's duration in both ofthe fixed-viewing conditions (Experiments 2 and 3),retinal eccentricity and field eccentricity did correspondin these conditions. Thus for the former, any eccentricity effect found would be a function of spatial resolutionand/or covert attentional shifts and/or eye movements;for the latter, any eccentricity effect found could only have
1244 CARRASCO, EYERT, CHANG, AND KATZ
been a function of spatial resolution and/or covert attentional shifts. Further, Experiment 3 (fast-fixed-viewingcondition) did not only prevent eye movements, it alsolimited the number ofcovert attentional shifts that couldtake place while the display was present. Any similarities/differences in the eccentricity effect that we might findamong the different viewing conditions would help uselucidate the mechanisms underlying visual-search performance.
The second issue explored in this study concerned thequestion of whether the orientation asymmetry that hasbeen found in feature searches (e.g., Carrasco & Katz,1992; Treisman et aI., 1990; Treisman & Gormican,1988) is also present for any or all viewing conditions ofa conjunction search. Knowledge of the extent to whichconjunction-orientation asymmetries may differ underdifferent viewing conditions will contribute to the understanding of the role of primitive features. We expected shortened display durations to impair detection ofthe vertical targets more than detection of the tilted targets. Although some researchers (Cohen, 1993; Treisman & Gormican, 1988) have found that orientationasymmetries are more likely to occur with relativelyminimal orientation differences between items (i.e.,when the tilted items differed from the vertical items byabout 15°-18°), we decided to employ in the present conjunction experiments the 45° difference between tiltedand vertical elements that we have previously found toproduce a feature asymmetry (Carrasco & Katz, 1992).In the present study, color was chosen as the other dimension for the conjunction target, not only because ithas been proposed in Treisman's FIT and Wolfe's GS asbeing one of the hypothetical feature modules encodedin early vision, but also because it is, like orientation, adimension that is coded by specific pathways in the visual system (e.g., Livingstone & Hubel, 1988). The blueand red we used are prototype colors (Treisman &Gormican, 1988; Wolfe, 1994); thus, they were not expected to be processed in an asymmetrical fashion.
Experiment 1
In this experiment, the display was present until observers responded. We will refer to this manipulation asthe free-viewing condition. Observers searched for acolor X orientation conjunction target, which appearedin all possible positions of the display among distractors.Three factors were independently manipulated betweentrials: target orientation, target presence, and the numberof items in the display (set size).
MethodObservers. Twenty-six students at Wesleyan University partic
ipated in an hour-long session, in partial fulfillment of an introductory psychology course requirement. All had normal or correctedto-normal vision and were naive as to the purposes and method ofthe experiment.
Apparatus and Stimuli. The stimuli were presented on a Macintosh IIx microcomputer with a high-resolution RGB color monitor. Each display consisted of2, 4, 6, 8,12,18,24,30, or 36 tilted(-45° from vertical, \) and vertical (I) red or blue lines presented
against a black background (ClE, International Commission onColor, x,y coordinates: red, .625, .340; blue•. 155, .07). The itemswere scattered among 36 positions on a square grid composed ofsix rows and six columns. Based on a viewing distance of 57 em.fixed by a chinrest. the display subtended a 6° (height) x 6° (width)visual angle. The vertical stimuli in the display subtended about0.5" height X 0.03° width of visual angle, and the tilted stimuliabout 0.45° height X 0.45° width. The target and distractor colorswere both set at 92% ofmaximum luminance. When the target waspresent, it appeared at 0.7°. 1.6°.2.1°.2.6°.2.9°, or 3.5° of eccentricity from fixation point.
Procedure. Each observer was told that half of the displayswould contain a target (either a red tilted line or a red verticalline), and that his or her task was to press the yes key of the computer keyboard when the target was present and the no key whenthe target was absent, with the index or middle finger of their dominant hand; half of the observers used their index finger and halfused their middle finger for a yes response. The display was present until a response was made. The observers were instructed torespond as rapidly and as accurately as possible, since both speedand accuracy were to be recorded. A tone indicated that the response was incorrect. Each trial began with the presentation of afixation point (+), which appeared at the center of the display for1,200 msec. There were six experimental blocks, each of whichconsisted of72 randomized trials (9 set sizes X 8 times). for a totalof 432 experimental trials per observer. In half of the blocks, theobservers searched for a red tilted target among blue tilted and redvertical distractors; in the other half of the blocks, they searchedfor a red vertical target among blue vertical and red tilted distractors. The order of the blocks alternated between searching for thevertical target and searching for the tilted target. The positions occupied by any given display were chosen randomly. Each observerhad a practice block of 72 trials for each target type.
Results and DiscussionGeneral analysis. Owing to the large number ofanal
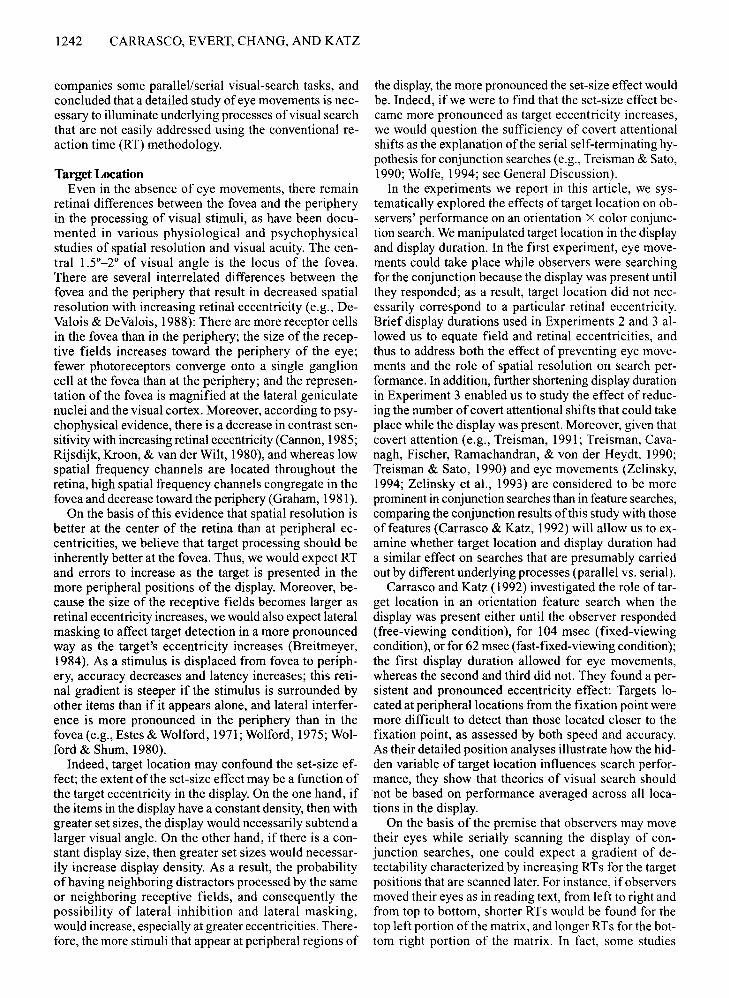
yses, only the significant main effects and interactionsare reported; all pairwise comparisons are NewmanKeuls. Figure 1 presents the observers' mean correct RTand error rates for absent and present trials as a functionof set size for the tilted and vertical targets. The linearfit's intercepts of these functions show that for both targets, the minimum RT was faster for present than for absent trials (tilted: 613 and 709 msec; vertical: 634 and722 msec, respectively). A within-subjects three-wayanalysis of variance (ANaYA; orientation X set size Xtarget) was performed on the correct RT and error data.All three main effects were significant: RTs were fasterfor tilted than for vertical targets [F(l,25) = 62.58, p <.001], for smaller than for larger set sizes [F(8,200) =72.71, p < .001], and for present than for absent trials[F(l,25) = 55.74, p < .001]. The three-way interaction
.for RT [F(8,200) = 2.02, P < .05] indicated that latencyincreased as a function ofset size more rapidly for absentthan for present trials, especially so for the vertical targets.
For errors, main effects were also found for the threefactors: There were more errors for vertical than fortilted targets [F(l,25) = 6.22, p < .05], for larger than forsmaller set sizes [F(8,200) = 7.07, P < .001], and forpresent than for absent trials [F(l,25) = 72.32, p <.001]. The three-way interaction [F(8,200) = 3.25, p <.01] indicated that errors increased more for present thanfor absent trials, especially so for the vertical targets.

THE ECCENTRICITY EFFECT 1245
emerge at the level of conjunctions by assuming additivecontributions from each component feature (Treisman &Sato, 1990), and that the more salient tilted target wouldhave guided the search more efficiently than the verticaltarget (Wolfe, 1992; Wolfe & Cave, 1990; Wolfe et a!.,1989).
Slope analysis. This experiment shows the importance of testing several set sizes that span a large range,of fitting different functions to the data, and of analyzing individual data. Search rates ofless than 10 msec/itemare taken to be indicative of parallel processing (e.g.,Enns & Rensink, 1990a, 1990b; Treisman & Gormican,1988). According to this criterion, observers searchedfor the tilted target in a parallel way, and for the verticaltarget in a serial way. More detailed analyses of the data,however, revealed that this conclusion could not be consistently supported. Table I shows the percentage of variance (R2) accounted for by the linear, logarithmic, andquadratic functions for the tilted and vertical targets. Theadjusted R 2, which takes into consideration the numberof predictors and the number of cases, reduces this proportion to a level expected when using this model in anew sample from the same population. For both presentand absent targets, the quadratic function had the best fit,followed by the logarithmic function for the presenttrials, and the linear function for the absent trials.
Further, several regression models were tested. Thedependent variable was RT and the main independentvariable was set size. Target (absent = 0, present = I) andorientation (tilted = 0, vertical = I) were assigned asdummy variables. Forward stepwise regression was usedto include only variables and interactions that had a significant degree (p < .05) of explanatory value for themodel. The quadratic function fit the data best (Table 2).The logarithmic and the quadratic fits indicate that the estimate of the msec/item would vary for different rangesof set sizes (i.e., that they were not constant). This arguesagainst the serial self-terminating account of conjunction searches (e.g., Treisman, 1982, 1985, 1986; Treisman & Gelade, 1980).
The serial self-terminating search is usually assessedby the 2: I absent/present slope ratio: Whereas the searchfor the present target is terminated once it is found (onaverage, after half the items in the display have been examined), the determination of the target's absence requires first that all items be examined. In contrast, forthe parallel search, target detection is independent of thenumber of items in the display, reflected in a I: I absent/present slope ratio (e.g., Quinlan & Humphreys,1987; Treisman, 1991; Treisman & Gelade, 1980; Treisman & Gormican, 1988; Treisman & Sato, 1990; Wolfeet a!., 1989; for an argument against the use of 2: 1absent/present slope ratio as indicating serial search processes, see Humphreys & Muller, 1993). On the basis ofeach observer's mean RT for each set size, least-squareslope estimates for absent and for present trials were obtained (Table 3). Only a few conjunction studies haveconsidered individual slope data (pashler, 1987a; Treisman, 1991; Wolfe et a!., 1989). Two separate analyses
20
b16
a:::120a:::a:::
w 8~
4
1350a
1250
1150.........u 1050Q)IIIE 950'-"
~850
750
650
5500 4 8 12 16 20 24 28 32 36
SET SIZE
-a- \ofRTrAL-ABS:NT
--II- \ofRTrAL -FremT
---&- lLTID-ABS:NT
----.- lLlID-R£SNT
Figure I. Observers' mean correct reaction times (RTs) and errorrates for target-absent and target-present trials as a function of setsize for the tilted and vertical targets, under free-viewing conditions(Experiment 1).
4 8 12 16 20 24 28 32 36
SET SIZE
RTs and errors increased as set size increased for bothabsent and present trials. These findings are consistentwith findings from other studies (e.g., Duncan & Humphreys, 1989; Egeth, Virzi, & Garbart, 1984; Enns &Rensink, 1990a, 1990b; Pashler, 1987a; Treisman, 1991;Treisman & Gormican, 1988; Ward & McClelland, 1989;Wolfe, 1994; Wolfe et aI., 1989). A speed-accuracy tradeoff was found for target presence: Observers were fasteron present than on absent trials, but they made more errorsin the former; this tradeoff, however, was not evident forthe lower set-size range. These patterns of results, whichhave often been found for both feature and conjunctionsearches, will be addressed in the General Discussion.
We found a conjunction-orientation asymmetry insearch performance: The tilted conjunction target wasdetected significantly faster and more accurately thanthe vertical conjunction target. We had predicted that anasymmetry existing at the feature level would also

1246 CARRASCO, EVERT, CHANG, AND KATZ
Table 1Percentage of Variance (R2) Accounted for by Linear (Lin), Logarithmic
(Log), and Quadratic (Quad) Functions for Target-Absent andTarget-Present Trials of Tilted and Vertical Targets for Experiment 1
Target Orientation
Trial Lin
Tilted
Log Quad Lin
Vertical
Log Quad
Target absentR2 .938 .859 .959 .971 .926 .994Adjusted R2 .929 .839 .935 .967 .915 .990
Target presentR2898 .986 .994 .921 .965 .996Adjusted R2 .884 .984 .990 .910 .960 .993
Note-Adjusted R2 = R2 - (l-R2)(p-1)/(n-p), where p is the number of predietors and n is the number of cases. All fits were significant at p < .0 I.
were performed to evaluate whether the data rejected either the 1:1 parallel hypothesis or the 2:1 serial hypothesis for the conjunction search.I First, by using pairedtwo-tailed t tests (Pashler, 1987a), both the 1:1 and the2:1 hypotheses were rejected [tilted: t(25) = 2.48, p <.05 and t(25) = -2.18,p < .05; vertical: t(25) = 3.65,p < .001 and t(25) = -3.22,p < .01]. Second, the absent/present ratio was computed for each observer (Table 3),and a binomial test was used to test the null hypothesisthat the proportion of the ratios falling below and abovea cutoff point of 1.5 did not significantly differ. If thenull hypothesis were rejected, the 1:1 or the 2:1 hypothesis would be supported when the majority of the ratiosfell below or above 1.5, respectively. However, the binomial tests indicated that the proportion of ratios belowand above 1.5 did not significantly differ for either target.
Hence, for this orientation X color conjunctionsearch, although RTs increased as set size increased, andthe slopes were steeper for the absent trials than theywere for the present trials, the statistical tests performedon the tilted and vertical targets failed to support eitherthe 2:1hypothesis for conjunction searches (Treisman &Gelade, 1980; Treisman & Sato, 1990) or the alternative1:1 hypothesis that is proposed to be indicative of a parallel process. Although some of the ratios were about2:1, the range of ratios indicates that there was morevariability than would be predicted by FIT. Thus, detailed analysis of the search task did not consistentlysupport the serial self-terminating interpretation of theconjunction search in the way that Treisman's coarse examination of slopes and linearity appeared to do (e.g.,Treisman, 1982, 1985, 1986, 1988; Treisman & Gelade,1980; Treisman & Sato, 1990). Nonetheless, the fact that
the search function was consistently steeper for the vertical than for the tilted target supports the asymmetry results of the General Analysis.
Target-position analysis. To address the effect oftarget location on search performance in terms of fieldeccentricity, we obtained the mean correct RTs and errors per target position and eccentricity for each observer, and performed a within-subjects three-wayANOVA (eccentricity from fixation point X orientationX set size) on the RT and error data. Only the effects notreported previously will be discussed (i.e., the effect ofeccentricity and its interaction with other variables).
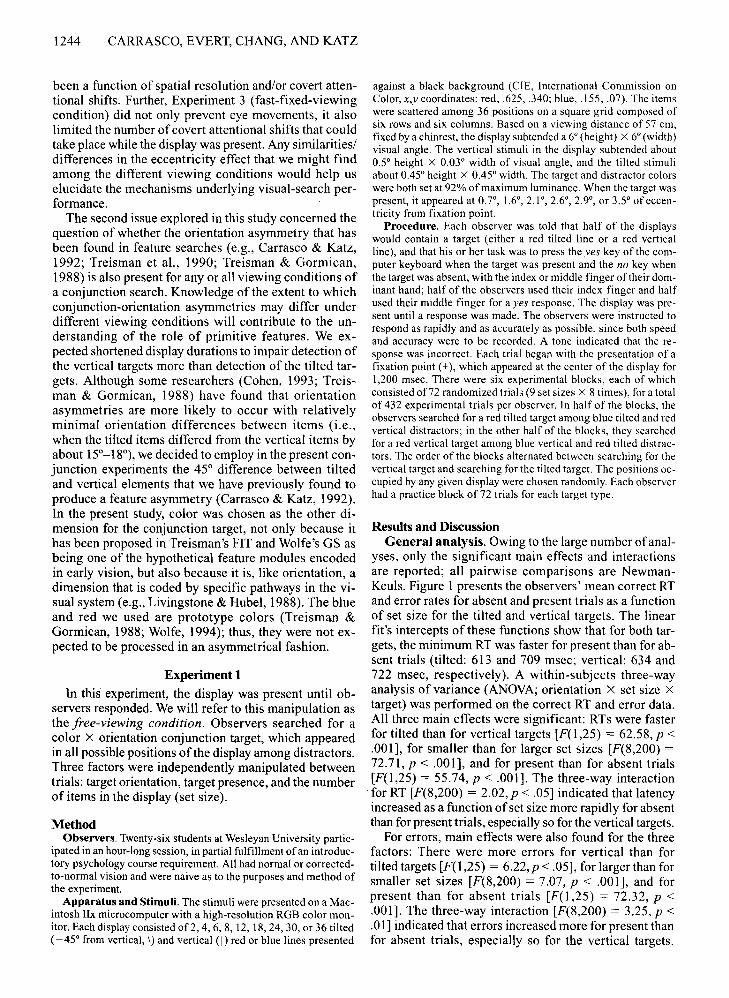
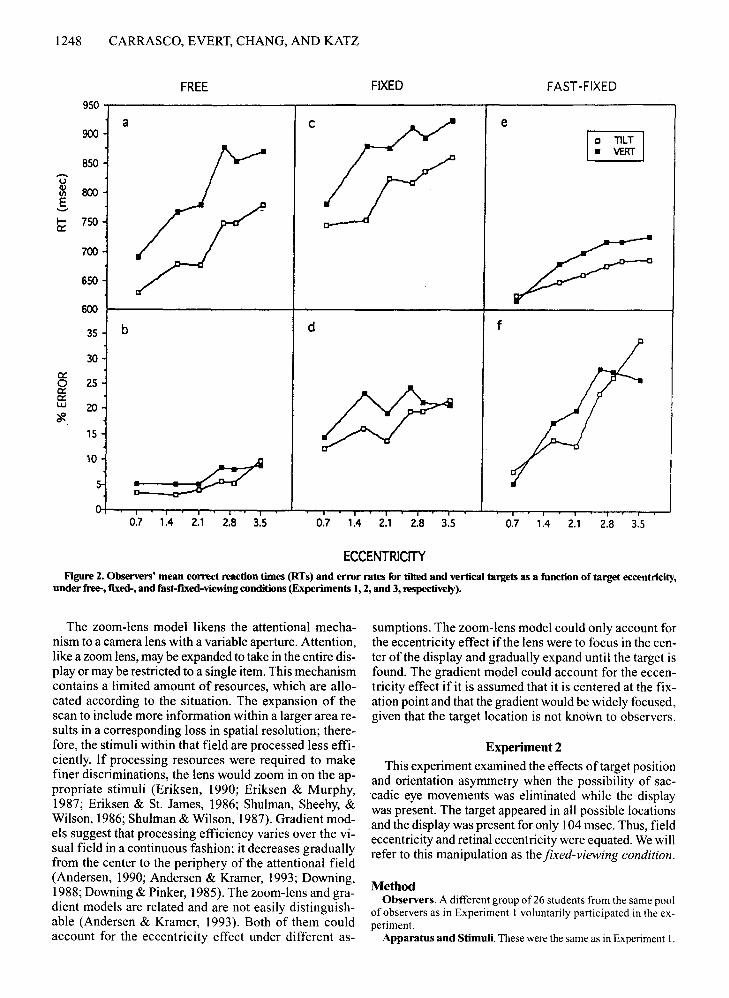
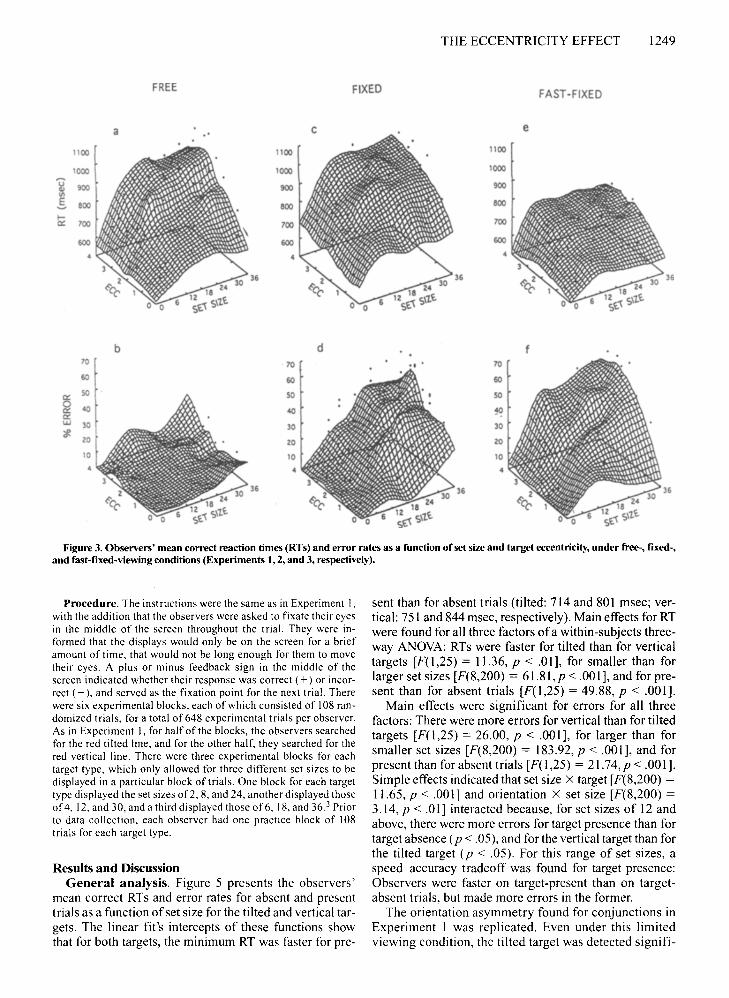
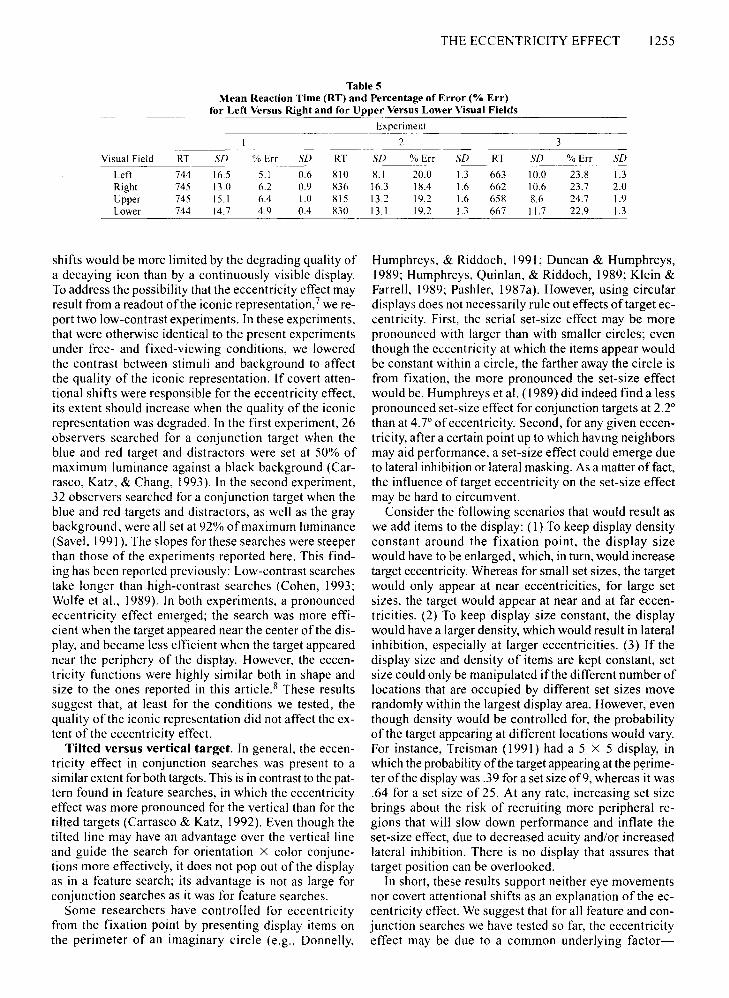
Figure 2a shows that RT increased as a function ofeccentricity [F(5,125) = 29.69, p < .001]; pairwise comparisons indicated that RTs of targets appearing at 0.7°were detected faster than those at 1.6°~2.1 0, which, inturn, were detected faster than those at 2.6°-3.5° (p <.0 I). Errors also increased as a function of eccentricity[F(5,125) = 5.13,p < .001; see Figure 2b]; targets appearing at O.7°~2.1° induced fewer errors than those at3.so (p < .01). Figures 3a and 3b depict RT and errors foreach set size as a function of target eccentricity. The interaction of eccentricity X set size [RT: F(40,1000) =
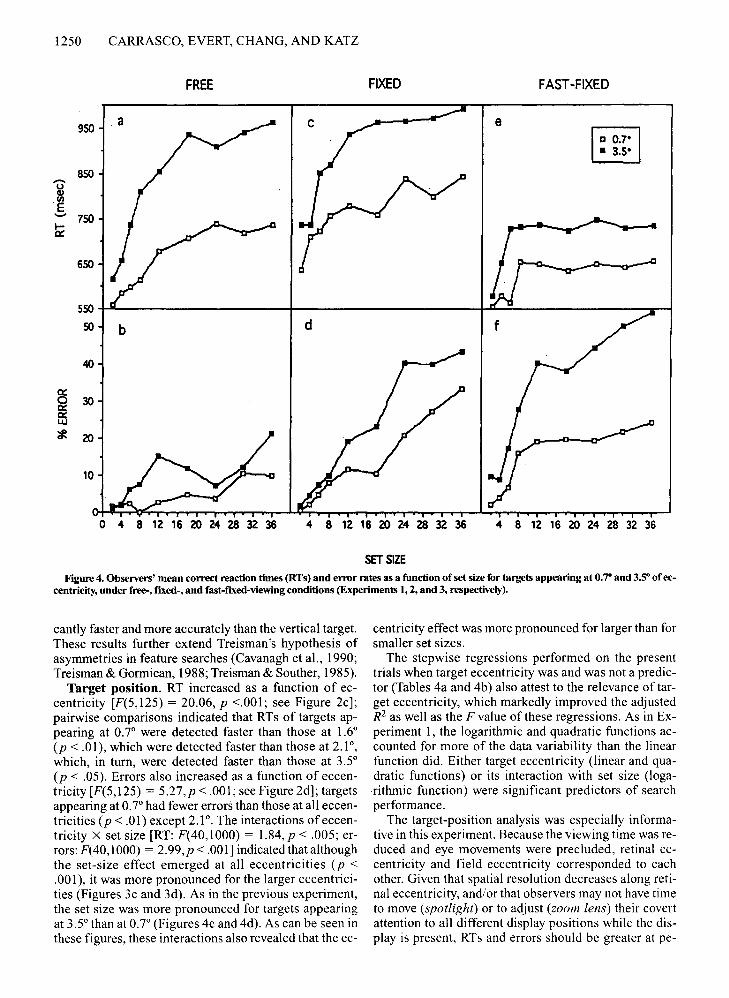
2.01, p < .001; errors: F(40,1000) = 1.56, P < .05] indicated that although the set-size effect emerged at all eccentricities (p < .001), it was more pronounced for thelarger eccentricities. This is further illustrated in Figures4a and 4b; the set-size effect obtained when the target appeared at 3.5° was steeper than that for 0.7° of eccentricity. These figures also show that the eccentricity effectwas more pronounced for larger than for smaller set sizes.
Tables 4A and 4B show the results of stepwise regres.sions performed on the present trials when eccentricity
Linear RT = 715.1 - 92.0(TAR) + 10.4(S) - 4.9(S*TAR) + 7.I(S*OR) .961 .956Logarithmic RT = 508.6 + 150.1(LS) - 68.3(LS*TAR) + 52.9(LS*OR) .940 .935Quadratic RT = 663.3 - 92.0(TAR) + 20.0(S) - 0.3(S*S) - 4.9(S*TAR) + 7.1(S*OR) .983 .980
Table 2Stepwise Regressions for Experiment 1
Formula: RT = Intercept + Lslope(predictors) R2 Adjusted R2 F P SE
190.11 .000 37.8168.37 .000 45.9341.92 .000 25.5
Note-Variables: TAR = target; S = set size; OR = orientation; LS = log of set size.Formulas: Linear, RT = intercept + constant(TAR) + constant(OR) + constant(S) + Lconstant(interaction);Logarithmic, RT = intercept + constant(TAR) + constant( OR) + constant(LS) + Lconstant(interaction);Quadratic, RT = intercept + constant(TAR) + constant(OR) + constant(S) + constantt.S<S') + Lconstant(interaction).
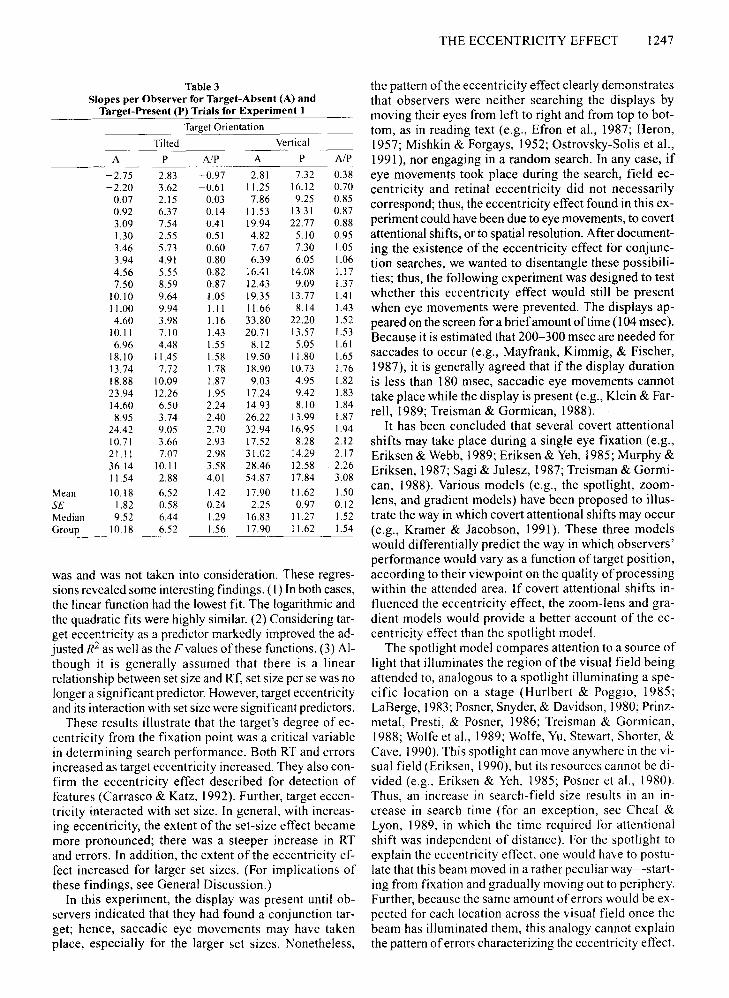
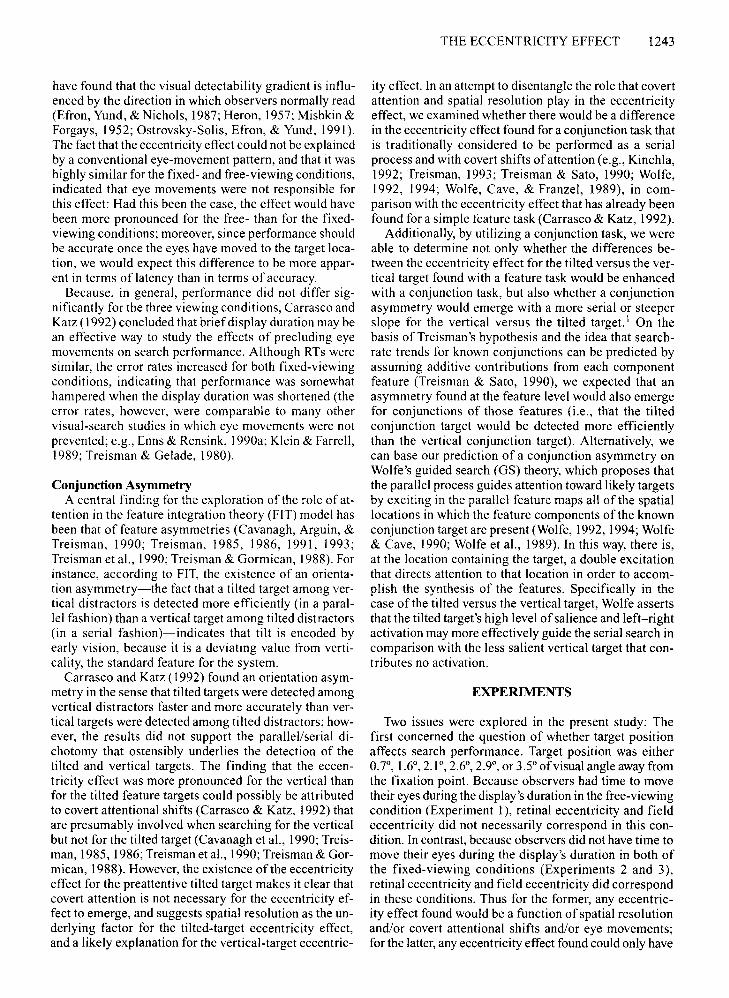
Table 3Slopes per Observer for Target-Absent (A) and
Target-Present (P) Trials for Experiment t
Target Orientation
Tilted Vertical
A P AlP A P AlP
-2.75 2.83 -0.97 2.81 7.32 0.38-2.20 3.62 -0.61 11.25 16.12 0.70
0.07 2.15 0.03 7.86 9.25 0.850.92 6.37 0.14 11.53 13.31 0.873.09 7.54 0.41 19.94 22.77 0.881.30 2.55 0.51 4.82 5.10 0.953.46 5.73 0.60 7.67 7.30 1.053.94 4.91 0.80 6.39 6.05 1.064.56 5.55 0.82 16.41 14.08 1.177.50 8.59 0.87 12.43 9.09 1.37
10.10 9.64 1.05 19.35 13.77 1.4111.00 9.94 1.1I 11.66 8.14 1.434.60 3.98 1.16 33.80 22.20 1.52
10.11 7.10 1.43 20.71 13.57 1.536.96 4.48 1.55 8.12 5.05 1.61
18.10 11.45 1.58 19.50 11.80 1.6513.74 7.72 1.78 18.90 10.73 1.7618.88 10.09 1.87 9.03 4.95 1.8223.94 12.26 1.95 17.24 9.42 1.8314.60 6.50 2.24 14.93 8.10 1.848.95 3.74 2.40 26.22 13.99 1.87
24.42 9.05 2.70 32.94 16.95 1.9410.71 3.66 2.93 17.52 828 2.1221.11 7.07 2.98 31.02 14.29 2.1736.14 10.11 3.58 28.46 12.58 2.2611.54 2.88 4.01 54.87 17.84 3.08
Mean 10.18 6.52 1.42 17.90 11.62 1.50SE 1.82 0.58 0.24 2.25 0.97 0.12Median 9.52 6.44 1.29 16.83 11.27 1.52Group 10.18 6.52 1.56 17.90 11.62 1.54
was and was not taken into consideration. These regressions revealed some interesting findings. ( I) In both cases,the linear function had the lowest fit. The logarithmic andthe quadratic fits were highly similar. (2) Considering target eccentricity as a predictor markedly improved the adjusted R2 as well as the Fvalues of these functions. (3) Although it is generally assumed that there is a linearrelationship between set size and RT, set size per se was nolonger a significant predictor. However, target eccentricityand its interaction with set size were significant predictors.
These results illustrate that the target's degree of eccentricity from the fixation point was a critical variablein determining search performance. Both RT and errorsincreased as target eccentricity increased. They also confirm the eccentricity effect described for detection offeatures (Carrasco & Katz, 1992). Further, target eccentricity interacted with set size. In general, with increasing eccentricity, the extent of the set-size effect becamemore pronounced; there was a steeper increase in RTand errors. In addition, the extent of the eccentricity effect increased for larger set sizes. (For implications ofthese findings, see General Discussion.)
In this experiment, the display was present until observers indicated that they had found a conjunction target; hence, saccadic eye movements may have takenplace, especially for the larger set sizes. Nonetheless,
THE ECCENTRICITY EFFECT 1247
the pattern of the eccentricity effect clearly demonstratesthat observers were neither searching the displays bymoving their eyes from left to right and from top to bottom, as in reading text (e.g., Efron et al., 1987; Heron,1957; Mishkin & Forgays, 1952; Ostrovsky-Solis et al.,1991), nor engaging in a random search. In any case, ifeye movements took place during the search, field eccentricity and retinal eccentricity did not necessarilycorrespond; thus, the eccentricity effect found in this experiment could have been due to eye movements, to covertattentional shifts, or to spatial resolution. After documenting the existence of the eccentricity effect for conjunction searches, we wanted to disentangle these possibilities; thus, the following experiment was designed to testwhether this eccentricity effect would still be presentwhen eye movements were prevented. The displays appeared on the screen for a briefamount oftime (104 msec).Because it is estimated that 200-300 msec are needed forsaccades to occur (e.g., Mayfrank, Kimmig, & Fischer,1987), it is generally agreed that if the display durationis less than 180 msec, saccadic eye movements cannottake place while the display is present (e.g., Klein & Farrell, 1989; Treisman & Gormican, 1988).
It has been concluded that several covert attentionalshifts may take place during a single eye fixation (e.g.,Eriksen & Webb, 1989; Eriksen & Yeh, 1985; Murphy &Eriksen, 1987; Sagi & Julesz, 1987; Treisman & Gorrnican, 1988). Various models (e.g., the spotlight, zoomlens, and gradient models) have been proposed to illustrate the way in which covert attentional shifts may occur(e.g., Kramer & Jacobson, 1991). These three modelswould differentially predict the way in which observers'performance would vary as a function of target position,according to their viewpoint on the quality ofprocessingwithin the attended area. If covert attentional shifts influenced the eccentricity effect, the zoom-lens and gradient models would provide a better account of the eccentricity effect than the spotlight model.
The spotlight model compares attention to a source oflight that illuminates the region of the visual field beingattended to, analogous to a spotlight illuminating a specific location on a stage (Hurlbert & Poggio, 1985;LaBerge, 1983; Posner, Snyder, & Davidson, 1980; Prinzmetal, Presti, & Posner, 1986; Treisman & Gormican,1988; Wolfe et al., 1989; Wolfe, Yu, Stewart, Shorter, &Cave, 1990). This spotlight can move anywhere in the visual field (Eriksen, 1990), but its resources cannot be divided (e.g., Eriksen & Yeh, 1985; Posner et aI., 1980).Thus, an increase in search-field size results in an increase in search time (for an exception, see Cheal &Lyon, 1989, in which the time required for attentionalshift was independent of distance). For the spotlight toexplain the eccentricity effect, one would have to postulate that this beam moved in a rather peculiar way-starting from fixation and gradually moving out to periphery.Further, because the same amount oferrors would be expected for each location across the visual field once thebeam has illuminated them, this analogy cannot explainthe pattern oferrors characterizing the eccentricity effect.
1248 CARRASCO, EVERT, CHANG, AND KATZ
FREE FIXED FAST-FIXED
950
a c e900
~• VERT850....
u(I)
800VIg6: 750
700
650
600
b d f35
30():
0 25():():L.U 20
* 15
10
~::0.7 1.4 2.1 2.8 3.5 0.7 1.4 2.1 2.8 3.5 0.7 1.4 2.1 2.8 3.5
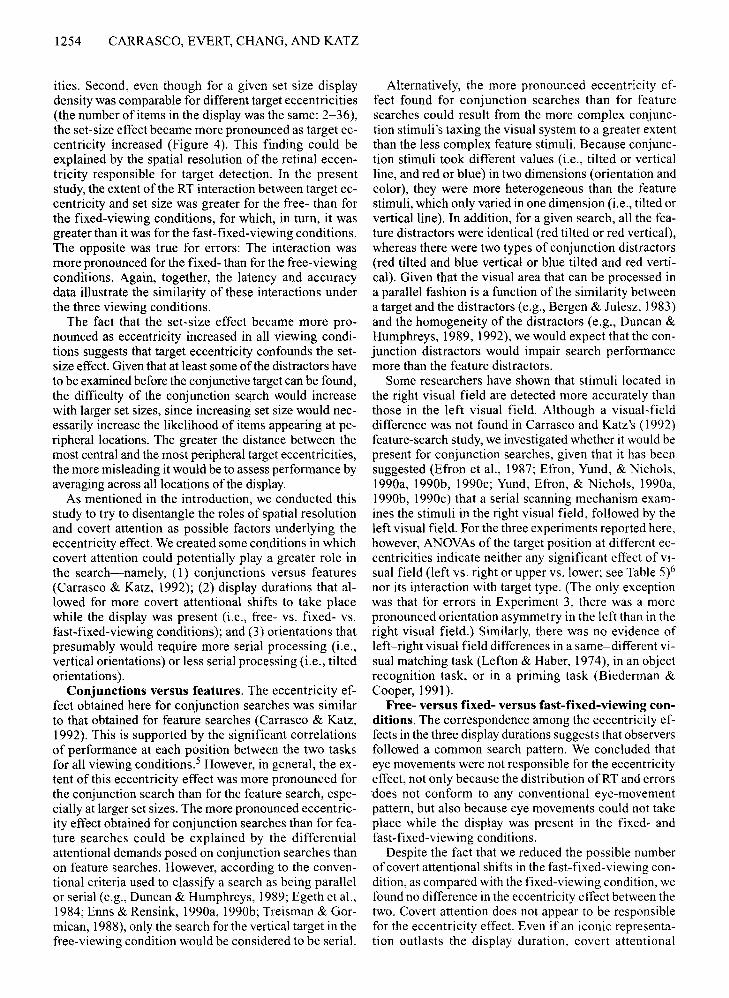
ECCENTRICITYFigure 2. Observers' mean correct reaction times (RTs) and error rates for tilted and vertical targets as a function of target eccentricity,
under free-, fixed-, and fast-nxed-viewing conditions (Experiments 1,2, and 3, respectively).
The zoom-lens model likens the attentional mechanism to a camera lens with a variable aperture. Attention,like a zoom lens, may be expanded to take in the entire display or may be restricted to a single item. This mechanismcontains a limited amount of resources, which are allocated according to the situation. The expansion of thescan to include more information within a larger area results in a corresponding loss in spatial resolution; therefore, the stimuli within that field are processed less efficiently. If processing resources were required to makefiner discriminations, the lens would zoom in on the appropriate stimuli (Eriksen, 1990; Eriksen & Murphy,1987; Eriksen & St. James, 1986; Shulman, Sheehy, &Wilson, 1986; Shulman & Wilson, 1987). Gradient models suggest that processing efficiency varies over the visual field in a continuous fashion; it decreases graduallyfrom the center to the periphery of the attentional field(Andersen, 1990; Andersen & Kramer, 1993; Downing,1988; Downing & Pinker, 1985). The zoom-lens and gradient models are related and are not easily distinguishable (Andersen & Kramer, 1993). Both of them couldaccount for the eccentricity effect under different as-
sumptions. The zoom-lens model could only account forthe eccentricity effect ifthe lens were to focus in the center of the display and gradually expand until the target isfound. The gradient model could account for the eccentricity effect ifit is assumed that it is centered at the fixation point and that the gradient would be widely focused,given that the target location is not known to observers.
Experiment 2
This experiment examined the effects of target positionand orientation asymmetry when the possibility of sac'cadic eye movements was eliminated while the displaywas present. The target appeared in all possible locationsand the display was present for only 104 msec. Thus, fieldeccentricity and retinal eccentricity were equated. Wewillrefer to this manipulation as the fixed-viewing condition.
MethodObservers. A different group of26 students from the same pool
of observers as in Experiment I voluntarily participated in the experiment.
Apparatus and Stimuli. These were the same as in Experiment 1.
THE ECCENTRICITY EFFECT 1249
FAST-FIXED
e
700
600
1100
1000
900
eoo
36
FREE FIXED
a .'
1:[ 1100
1000
~ 900 900III
S seo eoe...cz: 700 700
600 600
b d10 70 ., . 70
60 60 60
cz: so so so0 '0 ~cz: '0cz:UJ 30 30 30#.
10 lO zo10 10 10
36
Figure 3. Observers' mean correct reaction times (RTs) and error rates as a function of set size and target eccentricity, under free-, fixed-,and fast-fixed-viewing conditions (Experiments 1,2, and 3, respectively).
Procedure. The instructions were the same as in Experiment I,with the addition that the observers were asked to fixate their eyesin the middle of the screen throughout the trial. They were informed that the displays would only be on the screen for a briefamount of time, that would not be long enough for them to movetheir eyes. A plus or minus feedback sign in the middle of thescreen indicated whether their response was correct (+) or incorrect ( -), and served as the fixation point for the next trial. Therewere six experimental blocks, each of which consisted of 108 randomized trials, for a total of 648 experimental trials per observer.As in Experiment I, for half of the blocks, the observers searchedfor the red tilted line, and for the other half, they searched for thered vertical line. There were three experimental blocks for eachtarget type, which only allowed for three different set sizes to bedisplayed in a particular block of trials. One block for each targettype displayed the set sizes of2, 8, and 24, another displayed thoseof 4, 12, and 30, and a third displayed those of 6, 18, and 36. 3 Priorto data collection, each observer had one practice block of 108trials for each target type.
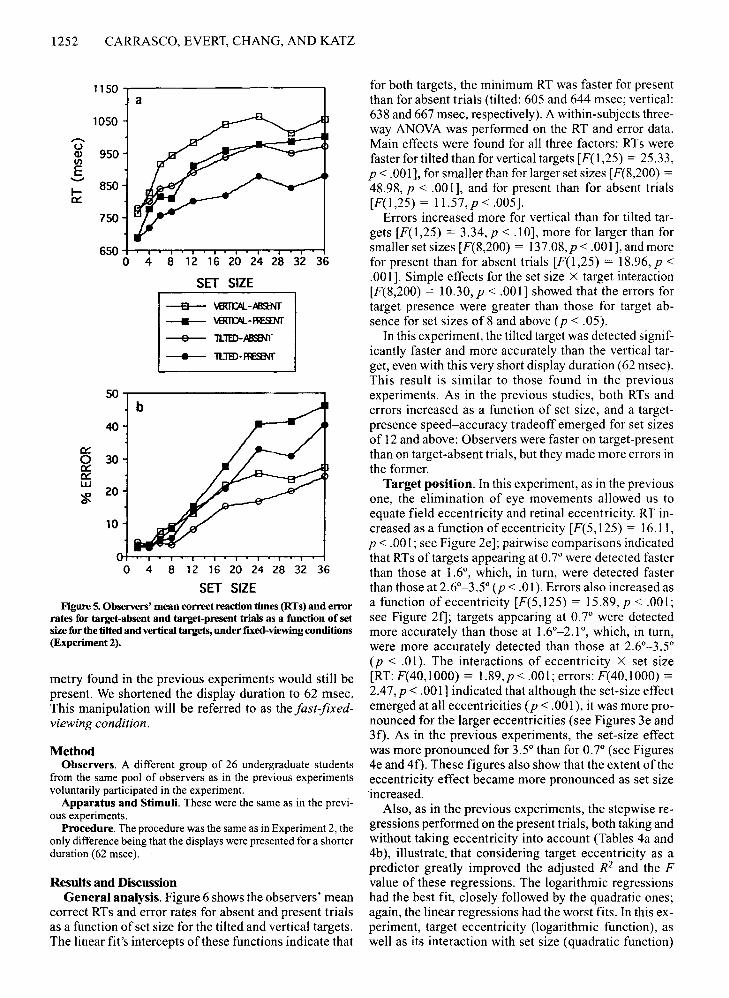
Results and DiscussionGeneral analysis. Figure 5 presents the observers'
mean correct RTs and error rates for absent and presenttrials as a function ofset size for the tilted and vertical targets. The linear fit's intercepts of these functions showthat for both targets, the minimum RT was faster for pre-
sent than for absent trials (tilted: 714 and 801 msec; vertical: 751 and 844 msec, respectively). Main effects for RTwere found for all three factors ofa within-subjects threeway ANOVA: RTs were faster for tilted than for verticaltargets [F(I,25) = 11.36, P < .01], for smaller than forlarger set sizes [F(8,200) = 61.81, P < .001], and for present than for absent trials [F(l,25) = 49.88, P < .001].
Main effects were significant for errors for all threefactors: There were more errors for vertical than for tiltedtargets [F(I,25) = 26.00, P < .001], for larger than forsmaller set sizes [F(8,200) = 183.92, P < .001], and forpresent than for absent trials [F(l,25) = 21.74, p < .001].Simple effects indicated that set size X target [F(8,200) =
11.65, P < .001] and orientation X set size [F(8,200) =3.14, P < .0I] interacted because, for set sizes of 12 andabove, there were more errors for target presence than fortarget absence (p < .05), and for the vertical target than forthe tilted target (p < .05). For this range of set sizes, aspeed-accuracy tradeoff was found for target presence:Observers were faster on target-present than on targetabsent trials, but made more errors in the former.
The orientation asymmetry found for conjunctions inExperiment 1 was replicated. Even under this limitedviewing condition, the tilted target was detected signifi-
1250 CARRASCO, EVERT, CHANG, AND KATZ
FREE FIXED FAST-FIXED
e950
[UTI• 3.5"
850..--uCIlIIIE- 750Ii:
650
55050 d
40
~ 300::
ffi~ ZO
10
0 4 8 12 16 20 24 28 32 36 4 8 12 16 20 24 283236 4 8 12 16 20 24 28 32 36
SET SIZEFigure 4. Observers' mean correct reaction times (RTs) and error rates as a function of set size for targets appearing at 0.70 and 3.5" of ec
centricity, under free-, fixed-, and fast-f"Ixed-viewingconditions (Experiments 1, 2, and 3, respectively).
cantly faster and more accurately than the vertical target.These results further extend Treisman's hypothesis ofasymmetries in feature searches (Cavanagh et aI., 1990;Treisman & Gorrnican, 1988; Treisman & Souther, 1985).
Target position. RT increased as a function of eccentricity [F(5,125) = 20.06, p <.001; see Figure 2c];pairwise comparisons indicated that RTs of targets appearing at 0.7° were detected faster than those at 1.6°(p < .01), which were detected faster than those at 2.1°,which, in turn, were detected faster than those at 3.5°(p < .05). Errors also increased as a function of eccentricity [F(5, 125) = 5.27 ,p < .001; see Figure 2d]; targetsappearing at 0.7° had fewer errors than those at all eccentricities (p < .01) except 2.1°. The interactions ofeccentricity X set size [RT: F(40, 1000) = 1.84,p < .005; errors: F(40,1000) = 2.99,p < .001] indicated that althoughthe set-size effect emerged at all eccentricities (p <.001), it was more pronounced for the larger eccentricities (Figures 3c and 3d). As in the previous experiment,the set size was more pronounced for targets appearingat 3.5° than at 0.7° (Figures 4c and 4d). As can be seen inthese figures, these interactions also revealed that the ec-
centricity effect was more pronounced for larger than forsmaller set sizes.
The stepwise regressions performed on the presenttrials when target eccentricity was and was not a predictor (Tables 4a and 4b) also attest to the relevance of target eccentricity, which markedly improved the adjustedR2 as well as the F value of these regressions. As in Experiment 1, the logarithmic and quadratic functions accounted for more of the data variability than the linearfunction did. Either target eccentricity (linear and quadratic functions) or its interaction with set size (loga-rithmic function) were significant predictors of searchperformance.
The target-position analysis was especially informative in this experiment. Because the viewing time was reduced and eye movements were precluded, retinal eccentricity and field eccentricity corresponded to eachother. Given that spatial resolution decreases along retinal eccentricity, and/or that observers may not have timeto move (spotlight) or to adjust (zoom lens) their covertattention to all different display positions while the display is present, RTs and errors should be greater at pe-
THE ECCENTRICITY EFFECT 1251
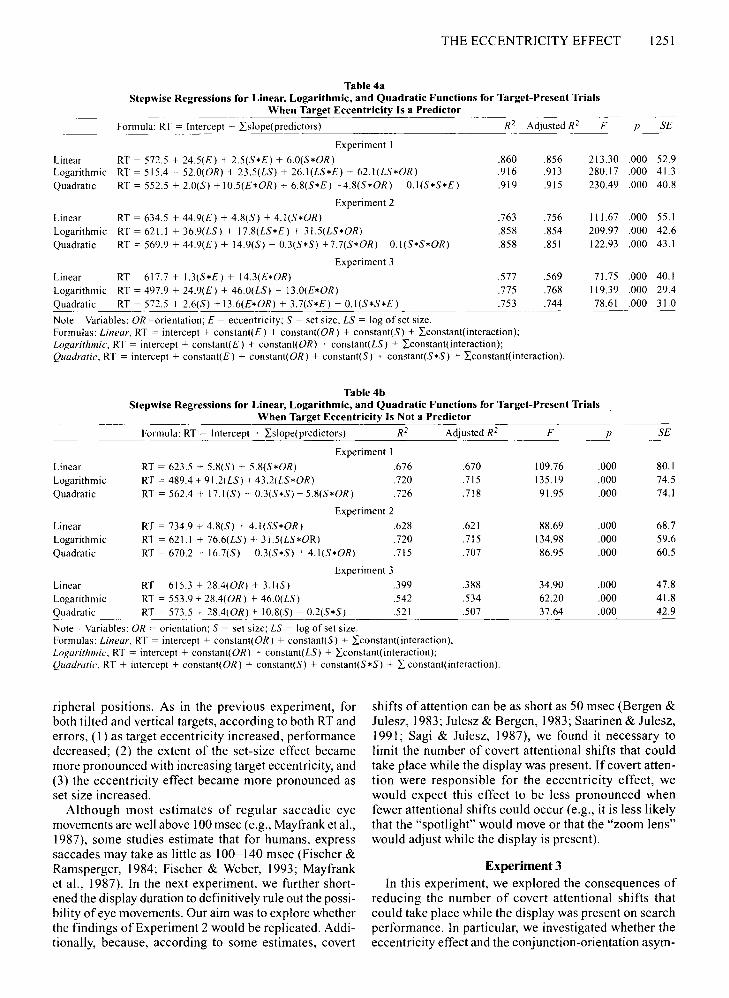
Table 4aStepwise Regressions for Linear, Logarithmic, and Quadratic Functions for Target-Present Trials
When Target Eccentricity Is a Predictor
5£p
213.30 .000 52.9280.17 .000 41.3230.49 .000 40.8
111.67 .000 55.1209.97 .000 42.6122.93 .000 43.1
71.75 .000 40.1119.39 .000 29.478.61 .000 31.0
.756
.854
.851
.856
.913
.915
.763
.858
.858
.860
.916
.919
Experiment 2
Formula: RT = Intercept + Lslope(predictors) R2 Adjusted R2 F
Experiment I
RT = 572.5 + 24.5(£) + 2.5(5*£) + 6.0(5*OR)RT = 515.4 ~ 52.0(OR) + 23.5(L5) + 26.I(L5*£) + 62.1(L5*OR)
RT = 552.5 + 2.0(5) +10.5(£*OR) + 6.8(5*£) +4.8(5*OR) ~ 0.1(5*5*£)
Linear RT = 634.5 + 44.9(£) + 4.8(5) + 4.1(5*OR)
Logarithmic RT = 621.1 + 36.9(L5) + 17.8(L5*£) + 31.5(L5*OR)
Quadratic RT = 569.9 + 44.9(£) + 14.9(5) - 0.3(5*5) +7.7(5*OR) ~0.1(5*5*OR)
Experiment 3
Linear RT = 617.7 + 1.3(5*£) + 14.3(£*OR) .577 .569Logarithmic RT = 497.9 + 24.9(£) + 46.0(L5) + 13.0(£*OR) .775 .768Quadratic RT = 572.5 + 2.6(5) + 13.6(£*OR) + 3.7(5*£) - 0.1(5*5*£) .753 .744
LinearLogarithmicQuadratic
Note-Variables: OR=orientation; E = eccentricity; 5 = set size; L5 = log of set size.Formulas: Linear, RT = intercept + constant(£) + constant( OR) + constant(5) + Lconstant(interaction);Logarithmic, RT = intercept + constant(£) + constant(OR) + constant(L5) + Lconstant(interaction);Quadratic, RT = intercept + constant(£) + constant( OR) + constant(5) + constantt.S'<S') + Lconstant(interaction).
Table 4bStepwise Regressions for Linear, Logarithmic, and Quadratic Functions for Target-Present Trials
When Target Eccentricity Is Not a Predictor
Formula: RT = Intercept + Lslope(predictors) R2 Adjusted R2 F P 5£
80.174.574.1
68.759.660.5
47.841.842.9
109.76 .000135.19 .00091.95 .000
88.69 .000134.98 .00086.95 .000
34.90 .00062.20 .00037.64 .000
.670
.715
.718
.388
.534
.507
.621
.715
.707
Experiment I
.676
.720
.726
Experiment 2
.628
.720
.715
Experiment 3
.399
.542
.521
RT = 623.5 + 5.8(5) + 5.8(5*OR)
RT = 489.4 + 91.2(L5) + 43.2(L5*OR)
RT = 562.4 + 17.1(5) - 0.3(5*5) + 5.8(5*OR)
RT = 734.9 + 4.8(5) + 4.1(55*OR)
RT = 621.1 + 76.6(L5) + 31.5(L5*OR)
RT = 670.2 + 16.7(5) - 0.3(5*5) + 4.1(5*OR)
LinearLogarithmicQuadratic
LinearLogarithmicQuadratic
Linear RT = 615.3 + 28.4(OR) + 3.1(5)Logarithmic RT = 553.9 + 28.4(OR) + 46.0(L5)
Quadratic RT = 573.5 + 28.4(OR) + 10.8(5) - 0.2(5*5)
Note-Variables: OR = orientation; 5 = set size; L5 = log of set size.Formulas: Linear, RT = intercept + constant(OR) + constant(5) + Lconstant(interaction);Logarithmic, RT = intercept + constant(OR) + constant(L5) + Lconstant(interaction);Quadratic, RT + intercept + constant( OR) + constant(5) + constann.S'<S) + L constant(interaction).
ripheral positions. As in the previous experiment, forboth tilted and vertical targets, according to both RT anderrors, (I) as target eccentricity increased, performancedecreased; (2) the extent of the set-size effect becamemore pronounced with increasing target eccentricity, and(3) the eccentricity effect became more pronounced asset size increased.
Although most estimates of regular saccadic eyemovements are well above 100msec (e.g., Mayfrank et aI.,1987), some studies estimate that for humans, expresssaccades may take as little as 100-140 msec (Fischer &Ramsperger, 1984; Fischer & Weber, 1993; Mayfranket al., 1987). In the next experiment, we further shortened the display duration to definitively rule out the possibility ofeye movements. Our aim was to explore whetherthe findings of Experiment 2 would be replicated. Additionally, because, according to some estimates, covert
shifts of attention can be as short as 50 msec (Bergen &Julesz, 1983; Julesz & Bergen, 1983; Saarinen & Julesz,1991; Sagi & Julesz, 1987), we found it necessary tolimit the number of covert attentional shifts that couldtake place while the display was present. If covert attention were responsible for the eccentricity effect, wewould expect this effect to be less pronounced whenfewer attentional shifts could occur (e.g., it is less likelythat the "spotlight" would move or that the "zoom lens"would adjust while the display is present).
Experiment 3In this experiment, we explored the consequences of
reducing the number of covert attentional shifts thatcould take place while the display was present on searchperformance. In particular, we investigated whether theeccentricity effect and the conjunction-orientation asym-
1252 CARRASCO, EVERT, CHANG, AND KATZ
o 4 8 12 16 20 24 28 32 36
SET SIZEFigure 5.Observers' mean correct reaction times (RTs) and error
rates for target-absent and target-present trials as a function of setsizefor the tilted and vertical targets, under fIxed-viewing conditions(Experiment 2).
metry found in the previous experiments would still bepresent. We shortened the display duration to 62 msec.This manipulation will be referred to as the fast-fixedviewing condition.
for both targets, the minimum RT was faster for presentthan for absent trials (tilted: 605 and 644 msec; vertical:638 and 667 msec, respectively). A within-subjects threeway ANOVA was performed on the RT and error data.Main effects were found for all three factors: RTs werefaster for tilted than for vertical targets [F(l,25) = 25.33,P < .00 I], for smaller than for larger set sizes [F(8,200) =48.98, P < .00 1], and for present than for absent trials[F(l,25) = 11.57,p < .005].
Errors increased more for vertical than for tilted targets [F(l,25) = 3.34,p < .10], more for larger than forsmaller set sizes [F(8,200) = 137.08,p < .001], and morefor present than for absent trials [F(I,25) = 18.96, p <.001]. Simple effects for the set size X target interaction[F(8,200) = 10.30, p < .001] showed that the errors fortarget presence were greater than those for target absence for set sizes of 8 and above (p < .05).
In this experiment, the tilted target was detected significantly faster and more accurately than the vertical target, even with this very short display duration (62 msec).This result is similar to those found in the previousexperiments. As in the previous studies, both RTs anderrors increased as a function of set size, and a targetpresence speed-accuracy tradeoff emerged for set sizesof 12 and above: Observers were faster on target-presentthan on target-absent trials, but they made more errors inthe former.
Target position. In this experiment, as in the previousone, the elimination of eye movements allowed us toequate field eccentricity and retinal eccentricity. RT increased as a function of eccentricity [F(5,125) = 16.11,P < .001; see Figure 2e]; pairwise comparisons indicatedthat RTs of targets appearing at 0.7° were detected fasterthan those at 1.6°, which, in turn, were detected fasterthan those at 2.6°-3.5° (p < .01). Errors also increased asa function of eccentricity [F(5,125) = 15.89, P < .00 I;see Figure 2f]; targets appearing at 0.7° were detectedmore accurately than those at 1.6°-2.1°, which, in turn,were more accurately detected than those at 2.6°-3.5°(p < .01). The interactions of eccentricity X set size[RT: F(40,1000) = 1.89,p < .001; errors: F(40,1000) =2.47, P < .001] indicated that although the set-size effectemerged at all eccentricities (p < .001), it was more pronounced for the larger eccentricities (see Figures 3e and3f). As in the previous experiments, the set-size effectwas more pronounced for 3.5° than for 0.7° (see Figures4e and 4f). These figures also show that the extent of theeccentricity effect became more pronounced as set size'increased.
Also, as in the previous experiments, the stepwise regressions performed on the present trials, both taking andwithout taking eccentricity into account (Tables 4a and4b), illustrate. that considering target eccentricity as apredictor greatly improved the adjusted R2 and the Fvalue of these regressions. The logarithmic regressionshad the best fit, closely followed by the quadratic ones;again, the linear regressions had the worst fits. In this experiment, target eccentricity (logarithmic function), aswell as its interaction with set size (quadratic function)
1150a
1050,......o
950Q)1Il
E........850
~
750
6500 4 8 12 16 20 24 28 32 36
SET SIZE
--e- \.eUIX.-AB9NT
----- \.eUIX.-~
--&-- 1l.1ID-AB!INT
---+-- 1l.1ID-m:sNr
50
40
a::0 30a::a::UJ
~20
10
MethodObservers. A different group of 26 undergraduate students
from the same pool of observers as in the previous experimentsvoluntarily participated in the experiment.
Apparatus and Stimuli. These were the same as in the previous experiments.
Procedure. The procedure was the same as in Experiment 2, theonly difference being that the displays were presented for a shorterduration (62 msec).
Results and DiscussionGeneral analysis. Figure 6 shows the observers' mean
correct RTs and error rates for absent and present trialsas a function of set size for the tilted and vertical targets.The linear fit's intercepts ofthese functions indicate that

THE ECCENTRICITY EFFECT 1253
GENERAL DISCUSSION
Eccentricity EffectSome studies have pointed out that to study attention
and perceptual organization, it is necessary to perform astructural analysis of the display (e.g., Kramer & Jacobson, 1991). For instance, it has been found that the spatiallayout of target and distractors is an important factorin directing search (Poisson & Wilkinson, 1992). A critical issue of the present study was to systematically explore the effect of target position on conjunction-searchperformance. The findings were clear: The greater thetarget eccentricity, the slower and less accurate the observers' performance. The eccentricity effect found hereis especially noteworthy given that the maximum targeteccentricity was only 3.5 0 away from fixation point. Wewould expect the extent of this effect to become morepronounced with greater eccentricities. Both theANOYA analyses and the stepwise regressions attest tothe fact that even within this limited display size, targeteccentricity, as well as its interaction with set size, turnedout to playa major role in observers' performance. Indeed, when these predictors were taken into consideration, the stepwise regression models were greatly improved (Tables 4a and 4b). The eccentricity effect hassignificant implications for current models of visualsearch, since none of these models takes target positioninto account.
The extent of the eccentricity effect interacted withdisplay duration. In terms of latency, it was more pronounced for the free- than for the fixed-viewing conditions. In terms of accuracy, the opposite was true: Theeccentricity effect was more pronounced for the fast-fixedthan for the fixed-viewing condition, which, in turn,showed a marginally more pronounced eccentricity effect than did the free-viewing condition. These interactions reflect the corresponding ranges that emerged fromthe RT and error data under the three viewing conditions(see Display Duration, below). Together, the latency andaccuracy data indicate that the pattern of the eccentricity effects for the three viewing conditions were highlysimilar. This proposition is also evidenced by the presenceof significant correlations among the three experimentsfor both RTs and errors per position. Further, significantcorrelations between the RTs and errors per position foreach of the three viewing conditions were found."
The eccentricity effect was present for all set sizesunder the three viewing conditions (Figure 2). Note thattwo revealing interactions emerged in each of the viewing conditions. First, the eccentricity effect became morepronounced as set size increased (Figure 3); that is, thetarget location was more critical as the display densityincreased. This finding could be explained by a greaterimpairing effect of lateral inhibition at higher eccentric-
been due to eye movements and was not likely to havebeen a consequence of covert attentional shifts, we suggest that it could be attributed to spatial resolution (seeGeneral Discussion).
5500 4 8 12 16 20 24 28 32 36
SET SIZE
---a-- ~-AIHNT---- ~-ReDIf
--&- lLTED-AINNT
--.- lL1ID-~
SO
40
a::0 30a::a::w
20~
10
850a
,....., 750uQ)l/)
E'-'
I- 650a:::
4 8 12 16 20 24 28 32 36
SET SIZEFigure 6. Observers' mean correct reaction times (RTs) and error
rates for target-absent and target-present trials as a function of setsize for the tilted and vertical targets, under fast-fIxed-viewing conditions (Experiment 3).
and with orientation (all three functions), were significant predictors of search performance.
The very short display duration of this experiment didnot only eliminate the possibility of eye movements, italso limited the amount of covert attentional shifts thatmay have taken place while the display was present. Asin the previous experiments, the target's position fromthe fixation point was a critical variable in determiningsearch performance. For all set sizes of both tilted andvertical targets, RTs and errors increased with increasingeccentricity from the fixation point. Moreover, as in theprevious experiments, the set-size effect became morepronounced as the target appeared at farther eccentricities, and the eccentricity effect was greater for largerthan for smaller set sizes. Because of the short displayduration of this experiment, the effect of eccentricitywas more pronounced for errors than for RTs. Given thatin this experiment, the eccentricity effect could not have
1254 CARRASCO, EVERT, CHANG, AND KATZ
Hies. Second, even though for a given set size displaydensity was comparable for different target eccentricities(the number of items in the display was the same: 2-36),the set-size effect became more pronounced as target eccentricity increased (Figure 4). This finding could beexplained by the spatial resolution of the retinal eccentricity responsible for target detection. In the presentstudy, the extent of the RT interaction between target eccentricity and set size was greater for the free- than forthe fixed-viewing conditions, for which, in turn, it wasgreater than it was for the fast- fixed-viewing conditions.The opposite was true for errors: The interaction wasmore pronounced for the fixed- than for the free-viewingconditions. Again, together, the latency and accuracydata illustrate the similarity of these interactions underthe three viewing conditions.
The fact that the set-size effect became more pronounced as eccentricity increased in all viewing conditions suggests that target eccentricity confounds the setsize effect. Given that at least some of the distractors haveto be examined before the conjunctive target can be found,the difficulty of the conjunction search would increasewith larger set sizes, since increasing set size would necessarily increase the likelihood of items appearing at peripheral locations. The greater the distance between themost central and the most peripheral target eccentricities,the more misleading it would be to assess performance byaveraging across all locations of the display.
As mentioned in the introduction, we conducted thisstudy to try to disentangle the roles of spatial resolutionand covert attention as possible factors underlying theeccentricity effect. We created some conditions in whichcovert attention could potentially playa greater role inthe search-namely, (1) conjunctions versus features(Carrasco & Katz, 1992); (2) display durations that allowed for more covert attentional shifts to take placewhile the display was present (i.e., free- vs. fixed- vs.fast-fixed-viewing conditions); and (3) orientations thatpresumably would require more serial processing (i.e.,vertical orientations) or less serial processing (i.e., tiltedorientations).
Conjunctions versus features. The eccentricity effect obtained here for conjunction searches was similarto that obtained for feature searches (Carrasco & Katz,1992). This is supported by the significant correlationsof performance at each position between the two tasksfor all viewing conditions.P However, in general, the extent of this eccentricity effect was more pronounced forthe conjunction search than for the feature search, especiallyat larger set sizes. The more pronounced eccentricity effect obtained for conjunction searches than for feature searches could be explained by the differentialattentional demands posed on conjunction searches thanon feature searches. However, according to the conventional criteria used to classify a search as being parallelor serial (e.g., Duncan & Humphreys, 1989; Egeth et al.,1984; Enns & Rensink, 1990a, 1990b; Treisman & Gormican, 1988), only the search for the vertical target in thefree-viewing condition would be considered to be serial.
Alternatively, the more pronounced eccentricity effect found for conjunction searches than for featuresearches could result from the more complex conjunction stimuli's taxing the visual system to a greater extentthan the less complex feature stimuli. Because conjunction stimuli took different values (i.e., tilted or verticalline, and red or blue) in two dimensions (orientation andcolor), they were more heterogeneous than the featurestimuli, which only varied in one dimension (i.e., tilted orvertical line). In addition, for a given search, all the feature distractors were identical (red tilted or red vertical),whereas there were two types of conjunction distractors(red tilted and blue vertical or blue tilted and red vertical). Given that the visual area that can be processed ina parallel fashion is a function of the similarity betweena target and the distractors (e.g., Bergen & Julesz, 1983)and the homogeneity of the distractors (e.g., Duncan &Humphreys, 1989, 1992), we would expect that the conjunction distractors would impair search performancemore than the feature distractors.
Some researchers have shown that stimuli located inthe right visual field are detected more accurately thanthose in the left visual field. Although a visual-fielddifference was not found in Carrasco and Katz's (1992)feature-search study, we investigated whether it would bepresent for conjunction searches, given that it has beensuggested (Efron et al., 1987; Efron, Yund, & Nichols,1990a, 1990b, 1990c; Yund, Efron, & Nichols, 1990a,1990b, 1990c) that a serial scanning mechanism examines the stimuli in the right visual field, followed by theleft visual field. For the three experiments reported here,however, ANOVAs of the target position at different eccentricities indicate neither any significant effect of visual field (left vs. right or upper vs. lower; see Table 5)6nor its interaction with target type. (The only exceptionwas that for errors in Experiment 3, there was a morepronounced orientation asymmetry in the left than in theright visual field.) Similarly, there was no evidence ofleft-right visual field differences in a same-different visual matching task (Lefton & Haber, 1974), in an objectrecognition task, or in a priming task (Biederman &Cooper, 1991).
Free- versus fixed- versus fast-fixed-viewing conditions. The correspondence among the eccentricity effects in the three display durations suggests that observersfollowed a common search pattern. We concluded thateye movements were not responsible for the eccentricityeffect, not only because the distribution ofRT and errors'does not conform to any conventional eye-movementpattern, but also because eye movements could not takeplace while the display was present in the fixed- andfast-fixed-viewing conditions.
Despite the fact that we reduced the possible numberofcovert attentional shifts in the fast-fixed-viewing condition, as compared with the fixed-viewing condition, wefound no difference in the eccentricity effect between thetwo. Covert attention does not appear to be responsiblefor the eccentricity effect. Even if an iconic representation outlasts the display duration, covert attentional
THE ECCENTRICITY EFFECT 1255
Table 5Mean Reaction Time (RT) and Percentage of Error (% Err)
for Left Versus Right and for Upper Versus Lower Visual Fields
Experiment--------
2 3
Visual Field RT SD % Err SD RT SD % Err SD RT SD % Err SDLeft 744 16.5 5.1 0.6 810 8.1 20.0 1.3 663 10.0 23.8 1.3Right 745 13.0 6.2 0.9 836 16.3 18.4 1.6 662 10.6 23.7 2.0Upper 745 15.1 6.4 1.0 815 13.2 19.2 1.6 658 8.6 24.7 1.9Lower 744 14.7 4.9 0.4 830 13.1 19.2 1.3 667 11.7 22.9 1.3
shifts would be more limited by the degrading quality ofa decaying icon than by a continuously visible display.To address the possibility that the eccentricity effect mayresult from a readout of the iconic representation," we report two low-contrast experiments. In these experiments,that were otherwise identical to the present experimentsunder free- and fixed-viewing conditions, we loweredthe contrast between stimuli and background to affectthe quality of the iconic representation. If covert attentional shifts were responsible for the eccentricity effect,its extent should increase when the quality of the iconicrepresentation was degraded. In the first experiment, 26observers searched for a conjunction target when theblue and red target and distractors were set at 50% ofmaximum luminance against a black background (Carrasco, Katz, & Chang, 1993). In the second experiment,32 observers searched for a conjunction target when theblue and red targets and distractors, as well as the graybackground, were all set at 92% of maximum luminance(Savel, 1991). The slopes for these searches were steeperthan those of the experiments reported here. This finding has been reported previously: Low-contrast searchestake longer than high-contrast searches (Cohen, 1993;Wolfe et al., 1989). In both experiments, a pronouncedeccentricity effect emerged; the search was more efficient when the target appeared near the center of the display, and became less efficient when the target appearednear the periphery of the display. However, the eccentricity functions were highly similar both in shape andsize to the ones reported in this article.f These resultssuggest that, at least for the conditions we tested, thequality of the iconic representation did not affect the extent of the eccentricity effect.
Tilted versus vertical target. In general, the eccentricity effect in conjunction searches was present to asimilar extent for both targets. This is in contrast to the pattern found in feature searches, in which the eccentricityeffect was more pronounced for the vertical than for thetilted targets (Carrasco & Katz, 1992). Even though thetilted line may have an advantage over the vertical lineand guide the search for orientation X color conjunctions more effectively, it does not pop out of the displayas in a feature search; its advantage is not as large forconjunction searches as it was for feature searches.
Some researchers have controlled for eccentricityfrom the fixation point by presenting display items onthe perimeter of an imaginary circle (e.g., Donnelly,
Humphreys, & Riddoch, 199 I; Duncan & Humphreys,1989; Humphreys, Quinlan, & Riddoch, 1989; Klein &Farrell, 1989; Pashler, I987a). However, using circulardisplays does not necessarily rule out effects oftarget eccentricity. First, the serial set-size effect may be morepronounced with larger than with smaller circles; eventhough the eccentricity at which the items appear wouldbe constant within a circle, the farther away the circle isfrom fixation, the more pronounced the set-size effectwould be. Humphreys et al. (1989) did indeed find a lesspronounced set-size effect for conjunction targets at 2.2 0
than at 4.7 0 of eccentricity. Second, for any given eccentricity, after a certain point up to which having neighborsmay aid performance, a set-size effect could emerge dueto lateral inhibition or lateral masking. As a matter of fact,the influence of target eccentricity on the set-size effectmay be hard to circumvent.
Consider the following scenarios that would result aswe add items to the display: (I) To keep display densityconstant around the fixation point, the display sizewould have to be enlarged, which, in turn, would increasetarget eccentricity. Whereas for small set sizes, the targetwould only appear at near eccentricities, for large setsizes, the target would appear at near and at far eccentricities. (2) To keep display size constant, the displaywould have a larger density, which would result in lateralinhibition, especially at larger eccentricities. (3) If thedisplay size and density of items are kept constant, setsize could only be manipulated ifthe different number oflocations that are occupied by different set sizes moverandomly within the largest display area. However, eventhough density would be controlled for, the probabilityofthe target appearing at different locations would vary.For instance, Treisman (1991) had a 5 X 5 display, inwhich the probability ofthe target appearing at the perimeter ofthe display was .39 for a set size of9, whereas it was.64 for a set size of 25. At any rate, increasing set sizebrings about the risk of recruiting more peripheral regions that will slow down performance and inflate theset-size effect, due to decreased acuity and/or increasedlateral inhibition. There is no display that assures thattarget position can be overlooked.
In short, these results support neither eye movementsnor covert attentional shifts as an explanation of the eccentricity effect. We suggest that for all feature and conjunction searches we have tested so far, the eccentricityeffect may be due to a common underlying factor-
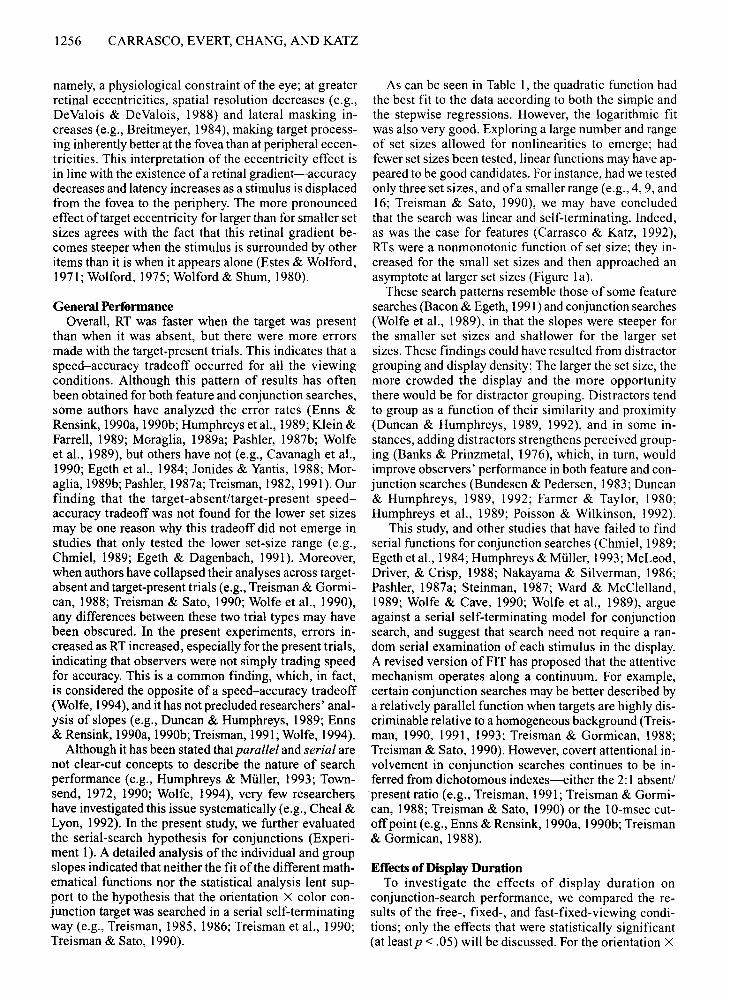
1256 CARRASCO, EVERT, CHANG, AND KATZ
namely, a physiological constraint of the eye; at greaterretinal eccentricities, spatial resolution decreases (e.g.,DeValois & DeValois, 1988) and lateral masking increases (e.g., Breitmeyer, 1984), making target processing inherently better at the fovea than at peripheral eccentricities. This interpretation of the eccentricity effect isin line with the existence ofa retinal gradient-accuracydecreases and latency increases as a stimulus is displacedfrom the fovea to the periphery. The more pronouncedeffect of target eccentricity for larger than for smaller setsizes agrees with the fact that this retinal gradient becomes steeper when the stimulus is surrounded by otheritems than it is when it appears alone (Estes & Wolford,1971; Wolford, 1975; Wolford & Shum, 1980).
General PerformanceOverall, RT was faster when the target was present
than when it was absent, but there were more errorsmade with the target-present trials. This indicates that aspeed-accuracy tradeoff occurred for all the viewingconditions. Although this pattern of results has oftenbeen obtained for both feature and conjunction searches,some authors have analyzed the error rates (Enns &Rensink, 1990a, 1990b; Humphreys et aI., 1989; Klein &Farrell, 1989; Moraglia, 1989a; Pashler, 1987b; Wolfeet aI., 1989), but others have not (e.g., Cavanagh et aI.,1990; Egeth et aI., 1984; Jonides & Yantis, 1988; Moraglia, 1989b; Pashler, 1987a; Treisman, 1982, 1991). Ourfinding that the target-absent/target-present speedaccuracy tradeoff was not found for the lower set sizesmay be one reason why this tradeoff did not emerge instudies that only tested the lower set-size range (e.g.,Chmiel, 1989; Egeth & Dagenbach, 1991). Moreover,when authors have collapsed their analyses across targetabsent and target-present trials (e.g., Treisman & Gormican, 1988; Treisman & Sato, 1990; Wolfe et aI., 1990),any differences between these two trial types may havebeen obscured. In the present experiments, errors increased as RT increased, especially for the present trials,indicating that observers were not simply trading speedfor accuracy. This is a common finding, which, in fact,is considered the opposite of a speed-accuracy tradeoff(Wolfe, 1994), and it has not precluded researchers' analysis of slopes (e.g., Duncan & Humphreys, 1989; Enns& Rensink, 1990a, 1990b; Treisman, 1991; Wolfe, 1994).
Although it has been stated that parallel and serial arenot clear-cut concepts to describe the nature of searchperformance (e.g., Humphreys & Muller, 1993; Townsend, 1972, 1990; Wolfe, 1994), very few researchershave investigated this issue systematically (e.g., Cheal &Lyon, 1992). In the present study, we further evaluatedthe serial-search hypothesis for conjunctions (Experiment 1). A detailed analysis of the individual and groupslopes indicated that neither the fit of the different mathematical functions nor the statistical analysis lent support to the hypothesis that the orientation X color conjunction target was searched in a serial self-terminatingway (e.g., Treisman, 1985, 1986; Treisman et aI., 1990;Treisman & Sato, 1990).
As can be seen in Table 1, the quadratic function hadthe best fit to the data according to both the simple andthe stepwise regressions. However, the logarithmic fitwas also very good. Exploring a large number and rangeof set sizes allowed for nonlinearities to emerge; hadfewer set sizes been tested, linear functions may have appeared to be good candidates. For instance, had we testedonly three set sizes, and ofa smaller range (e.g., 4, 9, and16; Treisman & Sato, 1990), we may have concludedthat the search was linear and self-terminating. Indeed,as was the case for features (Carrasco & Katz, 1992),RTs were a nonmonotonic function of set size; they increased for the small set sizes and then approached anasymptote at larger set sizes (Figure 1a).
These search patterns resemble those of some featuresearches (Bacon & Egeth, 1991) and conjunction searches(Wolfe et aI., 1989), in that the slopes were steeper forthe smaller set sizes and shallower for the larger setsizes. These findings could have resulted from distractorgrouping and display density: The larger the set size, themore crowded the display and the more opportunitythere would be for distractor grouping. Distractors tendto group as a function of their similarity and proximity(Duncan & Humphreys, 1989, 1992), and in some instances, adding distractors strengthens perceived grouping (Banks & Prinzmetal, 1976), which, in turn, wouldimprove observers' performance in both feature and conjunction searches (Bundesen & Pedersen, 1983; Duncan& Humphreys, 1989, 1992; Farmer & Taylor, 1980;Humphreys et aI., 1989; Poisson & Wilkinson, 1992).
This study, and other studies that have failed to findserial functions for conjunction searches (Chmiel, 1989;Egeth et aI., 1984; Humphreys & Muller, 1993; McLeod,Driver, & Crisp, 1988; Nakayama & Silverman, 1986;Pashler, 1987a; Steinman, 1987; Ward & McClelland,1989; Wolfe & Cave, 1990; Wolfe et aI., 1989), argueagainst a serial self-terminating model for conjunctionsearch, and suggest that search need not require a random serial examination of each stimulus in the display.A revised version of FIT has proposed that the attentivemechanism operates along a continuum. For example,certain conjunction searches may be better described bya relatively parallel function when targets are highly discriminable relative to a homogeneous background (Treisman, 1990, 1991, 1993; Treisman & Gormican, 1988;Treisman & Sato, 1990). However, covert attentional involvement in conjunction searches continues to be inferred from dichotomous indexes-either the 2: 1 absent/
'present ratio (e.g., Treisman, 1991; Treisman & Gormican, 1988; Treisman & Sato, 1990) or the l O-msec cutoffpoint (e.g., Enns & Rensink, 1990a, 1990b; Treisman& Gormican, 1988).
Effects of Display DurationTo investigate the effects of display duration on
conjunction-search performance, we compared the results of the free-, fixed-, and fast-fixed-viewing conditions; only the effects that were statistically significant(at least p < .05) will be discussed. For the orientation X
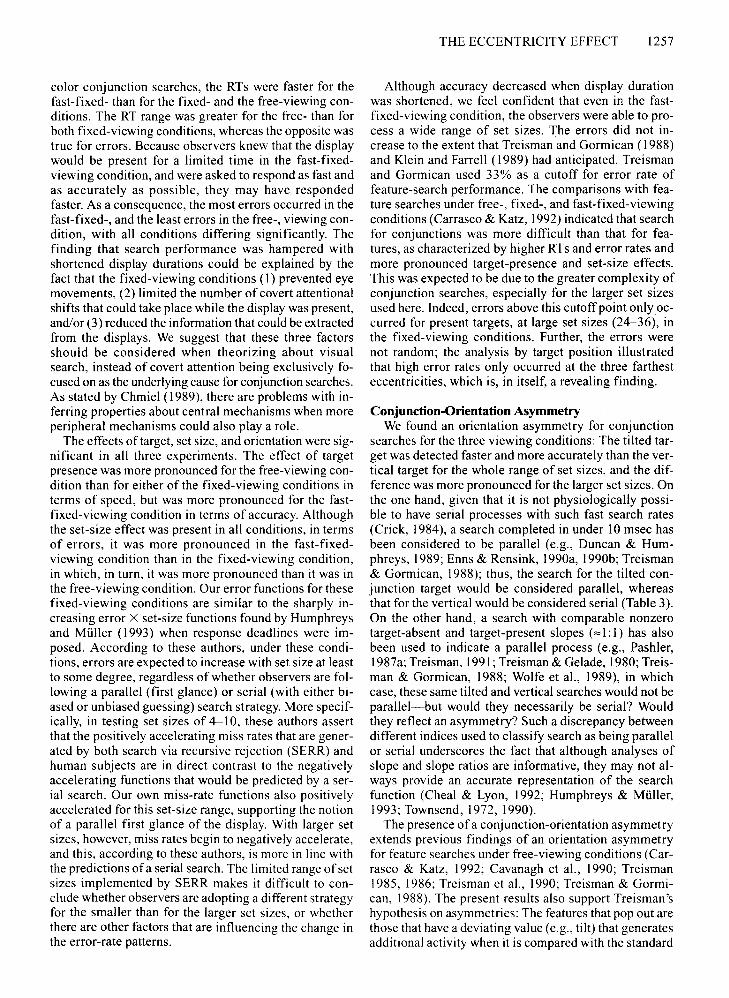
color conjunction searches, the RTs were faster for thefast-fixed- than for the fixed- and the free-viewing conditions. The RT range was greater for the free- than forboth fixed-viewing conditions, whereas the opposite wastrue for errors. Because observers knew that the displaywould be present for a limited time in the fast-fixedviewing condition, and were asked to respond as fast andas accurately as possible, they may have respondedfaster. As a consequence, the most errors occurred in thefast-fixed-, and the least errors in the free-, viewing condition, with all conditions differing significantly. Thefinding that search performance was hampered withshortened display durations could be explained by thefact that the fixed-viewing conditions (I) prevented eyemovements, (2) limited the number of covert attentionalshifts that could take place while the display was present,and/or (3) reduced the information that could be extractedfrom the displays. We suggest that these three factorsshould be considered when theorizing about visualsearch, instead of covert attention being exclusively focused on as the underlying cause for conjunction searches.As stated by Chmiel (1989), there are problems with inferring properties about central mechanisms when moreperipheral mechanisms could also playa role.
The effects of target, set size, and orientation were significant in all three experiments. The effect of targetpresence was more pronounced for the free-viewing condition than for either of the fixed-viewing conditions interms of speed, but was more pronounced for the fastfixed-viewing condition in terms of accuracy. Althoughthe set-size effect was present in all conditions, in termsof errors, it was more pronounced in the fast-fixedviewing condition than in the fixed-viewing condition,in which, in turn, it was more pronounced than it was inthe free-viewing condition. Our error functions for thesefixed-viewing conditions are similar to the sharply increasing error X set-size functions found by Humphreysand Muller (1993) when response deadlines were imposed. According to these authors, under these conditions, errors are expected to increase with set size at leastto some degree, regardless of whether observers are following a parallel (first glance) or serial (with either biased or unbiased guessing) search strategy. More specifically, in testing set sizes of 4-1 0, these authors assertthat the positively accelerating miss rates that are generated by both search via recursive rejection (SERR) andhuman subjects are in direct contrast to the negativelyaccelerating functions that would be predicted by a serial search. Our own miss-rate functions also positivelyaccelerated for this set-size range, supporting the notionof a parallel first glance of the display. With larger setsizes, however, miss rates begin to negatively accelerate,and this, according to these authors, is more in line withthe predictions ofa serial search. The limited range ofsetsizes implemented by SERR makes it difficult to conclude whether observers are adopting a different strategyfor the smaller than for the larger set sizes, or whetherthere are other factors that are influencing the change inthe error-rate patterns.
THE ECCENTRICITY EFFECT 1257
Although accuracy decreased when display durationwas shortened, we feel confident that even in the fastfixed-viewing condition, the observers were able to process a wide range of set sizes. The errors did not increase to the extent that Treisman and Gormican (1988)and Klein and Farrell (1989) had anticipated. Treismanand Gormican used 33% as a cutoff for error rate offeature-search performance. The comparisons with feature searches under free-, fixed-, and fast-fixed-viewingconditions (Carrasco & Katz, 1992) indicated that searchfor conjunctions was more difficult than that for features, as characterized by higher RTs and error rates andmore pronounced target-presence and set-size effects.This was expected to be due to the greater complexity ofconjunction searches, especially for the larger set sizesused here. Indeed, errors above this cutoffpoint onlyoccurred for present targets, at large set sizes (24-36), inthe fixed-viewing conditions. Further, the errors werenot random; the analysis by target position illustratedthat high error rates only occurred at the three farthesteccentricities, which is, in itself, a revealing finding.
Conjunction-Qrientation AsymmetryWe found an orientation asymmetry for conjunction
searches for the three viewing conditions: The tilted target was detected faster and more accurately than the vertical target for the whole range of set sizes, and the difference was more pronounced for the larger set sizes. Onthe one hand, given that it is not physiologically possible to have serial processes with such fast search rates(Crick, 1984), a search completed in under 10 msec hasbeen considered to be parallel (e.g., Duncan & Humphreys, 1989; Enns & Rensink, 1990a, 1990b; Treisman& Gormican, 1988); thus, the search for the tilted conjunction target would be considered parallel, whereasthat for the vertical would be considered serial (Table 3).On the other hand, a search with comparable nonzerotarget-absent and target-present slopes (",J: I) has alsobeen used to indicate a parallel process (e.g., Pashler,1987a; Treisman, 1991; Treisman & Gelade, 1980; Treisman & Gormican, 1988; Wolfe et aI., 1989), in whichcase, these same tilted and vertical searches would not beparallel-but would they necessarily be serial? Wouldthey reflect an asymmetry? Such a discrepancy betweendifferent indices used to classify search as being parallelor serial underscores the fact that although analyses ofslope and slope ratios are informative, they may not always provide an accurate representation of the searchfunction (Cheal & Lyon, 1992; Humphreys & Muller,1993; Townsend, 1972, 1990).
The presence ofa conjunction-orientation asymmetryextends previous findings of an orientation asymmetryfor feature searches under free-viewing conditions (Carrasco & Katz, 1992; Cavanagh et aI., 1990; Treisman1985, 1986; Treisman et al., 1990; Treisman & Gorrnican, 1988). The present results also support Treisman'shypothesis on asymmetries: The features that pop out arethose that have a deviating value (e.g., tilt) that generatesadditional activity when it is compared with the standard
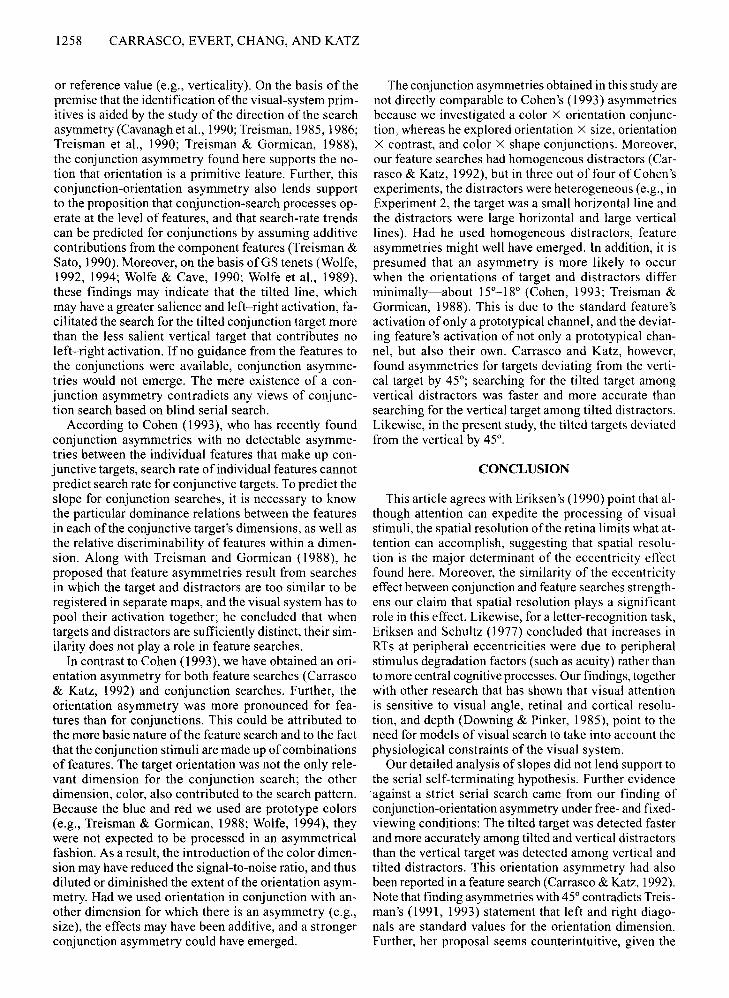
1258 CARRASCO, EVERT, CHANG, AND KATZ
or reference value (e.g., verticality). On the basis of thepremise that the identification ofthe visual-system primitives is aided by the study of the direction of the searchasymmetry (Cavanagh et aI., 1990; Treisman, 1985, 1986;Treisman et aI., 1990; Treisman & Gormican, 1988),the conjunction asymmetry found here supports the notion that orientation is a primitive feature. Further, thisconjunction-orientation asymmetry also lends supportto the proposition that conjunction-search processes operate at the level of features, and that search-rate trendscan be predicted for conjunctions by assuming additivecontributions from the component features (Treisman &Sato, 1990). Moreover, on the basis ofGS tenets (Wolfe,1992, 1994; Wolfe & Cave, 1990; Wolfe et aI., 1989),these findings may indicate that the tilted line, whichmay have a greater salience and left-right activation, facilitated the search for the tilted conjunction target morethan the less salient vertical target that contributes noleft-right activation. Ifno guidance from the features tothe conjunctions were available, conjunction asymmetries would not emerge. The mere existence of a conjunction asymmetry contradicts any views of conjunction search based on blind serial search.
According to Cohen (1993), who has recently foundconjunction asymmetries with no detectable asymmetries between the individual features that make up conjunctive targets, search rate of individual features cannotpredict search rate for conjunctive targets. To predict theslope for conjunction searches, it is necessary to knowthe particular dominance relations between the featuresin each of the conjunctive target's dimensions, as well asthe relative discriminability of features within a dimension. Along with Treisman and Gormican (1988), heproposed that feature asymmetries result from searchesin which the target and distractors are too similar to beregistered in separate maps, and the visual system has topool their activation together; he concluded that whentargets and distractors are sufficiently distinct, their similarity does not playa role in feature searches.
In contrast to Cohen (1993), we have obtained an orientation asymmetry for both feature searches (Carrasco& Katz, 1992) and conjunction searches. Further, theorientation asymmetry was more pronounced for features than for conjunctions. This could be attributed tothe more basic nature of the feature search and to the factthat the conjunction stimuli are made up ofcombinationsof features. The target orientation was not the only relevant dimension for the conjunction search; the otherdimension, color, also contributed to the search pattern.Because the blue and red we used are prototype colors(e.g., Treisman & Gormican, 1988; Wolfe, 1994), theywere not expected to be processed in an asymmetricalfashion. As a result, the introduction of the color dimension may have reduced the signal-to-noise ratio, and thusdiluted or diminished the extent of the orientation asymmetry. Had we used orientation in conjunction with another dimension for which there is an asymmetry (e.g.,size), the effects may have been additive, and a strongerconjunction asymmetry could have emerged.
The conjunction asymmetries obtained in this study arenot directly comparable to Cohen's (1993) asymmetriesbecause we investigated a color X orientation conjunction, whereas he explored orientation X size, orientationX contrast, and color X shape conjunctions. Moreover,our feature searches had homogeneous distractors (Carrasco & Katz, 1992), but in three out of four of Cohen'sexperiments, the distractors were heterogeneous (e.g., inExperiment 2, the target was a small horizontal line andthe distractors were large horizontal and large verticallines). Had he used homogeneous distractors, featureasymmetries might well have emerged. In addition, it ispresumed that an asymmetry is more likely to occurwhen the orientations of target and distractors differminimally-about 15°-18° (Cohen, 1993; Treisman &Gormican, 1988). This is due to the standard feature'sactivation ofonly a prototypical channel, and the deviating feature's activation of not only a prototypical channel, but also their own. Carrasco and Katz, however,found asymmetries for targets deviating from the vertical target by 45°; searching for the tilted target amongvertical distractors was faster and more accurate thansearching for the vertical target among tilted distractors.Likewise, in the present study, the tilted targets deviatedfrom the vertical by 45°.
CONCLUSION
This article agrees with Eriksen's (1990) point that although attention can expedite the processing of visualstimuli, the spatial resolution of the retina limits what attention can accomplish, suggesting that spatial resolution is the major determinant of the eccentricity effectfound here. Moreover, the similarity of the eccentricityeffect between conjunction and feature searches strengthens our claim that spatial resolution plays a significantrole in this effect. Likewise, for a letter-recognition task,Eriksen and Schultz (1977) concluded that increases inRTs at peripheral eccentricities were due to peripheralstimulus degradation factors (such as acuity) rather thanto more central cognitive processes. Our findings, togetherwith other research that has shown that visual attentionis sensitive to visual angle, retinal and cortical resolution, and depth (Downing & Pinker, 1985), point to theneed for models of visual search to take into account thephysiological constraints of the visual system.
Our detailed analysis of slopes did not lend support tothe serial self-terminating hypothesis. Further evidence'against a strict serial search came from our finding ofconjunction-orientation asymmetry under free- and fixedviewing conditions: The tilted target was detected fasterand more accurately among tilted and vertical distractorsthan the vertical target was detected among vertical andtilted distractors. This orientation asymmetry had alsobeen reported in a feature search (Carrasco & Katz, 1992).Note that finding asymmetries with 45° contradicts Treisman's (1991,1993) statement that left and right diagonals are standard values for the orientation dimension.Further, her proposal seems counterintuitive, given the

THE ECCENTRICITY EFFECT 1259
oblique effect-that is, the general superiority in the visibility of horizontal and vertical lines (Appelle, 1972),which seems to be related to the fact that more neuronsare tuned to detect vertical or horizontal lines than to detect oblique lines (Mansfield, 1974), and that thresholdsfor vertical gratings are lower than those for diagonal gratings (Campbell, Kulikowski, & Levinson, 1966).
More important, we have also shown that target location critically affects conjunction-search performance.The eccentricity effect shows that search efficiency, asassessed by both latency and accuracy, gradually decreases as the target is located farther away from the fixation point. Indeed, when performance is assessed by collapsing across different eccentricities, conclusions drawnfrom the data may be confounded; rather than reflectingthe nature of the search (i.e., parallel vs. serial), the datamay reflect peripheral versus central target locations.Further, given the higher probability of the target's appearing at periphery as set size increases, and also giventhe interaction of the eccentricity effect with set size, wesuggest that the set-size effect, commonly relied upon toindicate covert attentional shifts, is confounded by eccentricity.
On the basis of the prevalent and consistent eccentricity effect found under the three viewing conditions, andthe fact that the eccentricity effect was not more pronounced when more covert attentional shifts may havebeen involved, we suggest that spatial resolution and lateral inhibition may account for the eccentricity effect.Moreover. we propose that these, as well as other factors,such as range of set sizes used, display size, and displaydensity, have to be taken into consideration before meaningful comparisons among different search studies canbe made.
REFERENCES
ANI)ERSEN. G. J. ( 1(90). Focused attention in three-dimensional space.Perception & Psvchophvsics, 47. I 12- I20.
ANDERSEN. G. J.. & KRAMFR. A. F.(1993). Limits offocused attentionin three-dimensional space. Perception & Psvchophvsics. 53. 658667.
ApPELLI', S. (1972). Perception and discrimination as a function ofstimulus orientation: The oblique effect in man and animals. PSl'
chological Bulletin, 78, 266-278.BACON, W., & EGETH, H. (1991). Local processes in preattentive fea
ture detection. Journal ofExperimental Psvrhologv: HUI/Il/ll Perception & Performance, 17,77-90.
BANKS, W. P, & PRINZMETAL, W. (1976). Configurational effects in visual information processing. Perception & Psvchophvsics, 19, 361367.
BERGEN. J. R., & JULESZ, B. ( 1983, June 23). Parallel versus serial processing in rapid pattern discrimination. Nature, 303, 696-698.
BIEDERMAN, l., & COOPER, E. E. (1991). Object recognition and laterality null effects. Neuropsvchologia. 29, 685-694.
BREITMEYER, B. G. (1984). Visual masking. All integrative approach.New York: Oxford University Press.
BUNDESEN, c., & PEDERSEN, L. F.( 1983). Color segregation and visualsearch. Perception & Psvchophvsics, 33, 487-493.
CAMPBELL, E W.• KULIKOWSKI, J. J., & LEVINSON, J. (1966). The effectof orientation on the visual resolution of gratings. Journal ofPhvsiologv, 187,427-436.
CANNON, M. W., JR. (1985). Perceived contrast in the fovea and periphery. Journal of the Optical Societv ofAmerica, 2, 1760-1768.
CARRASCO. M., & KATZ, S. M. (1992). Exploring feature asymmetriesin visual search: Effects of target position and presentation time.Proceedings & Abstracts ofthe Annual Meeting ofthe Eastern Psychological Association, 63, 25.
CARRASCO, M., KATZ, S, M., & CHANG, I. (1993). Spatial resolutionversus covert attention: Position effects on visual search tasks [Abstract). Perception, 22 (Suppl.), 69.
CAVANAGH, P, AR0UIN, M., & TREISMAN, A. (1990). Effect of surfacemedium on visual search for orientation and size features. JournalofExperimental Psychology: Human Perception & Performance, 16,479-491.
CHEAL, M. L., & LYON, D. R. ( 1989). Attention effects on form discrimination at different eccentricities. Quarterly Journal ofExperimental Psychologv, 41A. 719-746.
CHEAL, M., & LYON, D. R. ( 1992). Attention in visual search: Multiplesearch classes. Perception & Psychophysics, 52, 113-138.
CHMIEL, N. ( 191\9). Response effects in the perception of conjunctionsof colour and form Psvchological Research, 51, I 17- I 22.
COHEN. A. (1993). Asymmetries in visual search for conjunctive target». Journal 0/ Experimental Psychology: Human Perception &i'crtormancc, 19. 775-797.
CRllf'. F. (1984). Function of the thalamic reticular complex: Thesearchlight hypothesis. Proceedings ofthe National Academy ofSciences, 81, 4586-4590.
DEVALlllS, R. L.. & DEVALOIS, K. K. (1988). Spatial vision. New York:Oxford University Press.
DONNELLY, N., HUMPHREYS, G. W., & RIDDOCH, M. J. (1991). Parallelcomputation of primitive shape descriptions. Journal ofExperimental Psychology: Human Perception & Performance. 17, 561-570.
DOWNING, C. J. (1988). Expectancy and visual-spatial attention: Effects on perceptual quality. Journal 0/ Experimental Psychology:Human Perception & Performance, 14, 188-202.
DOWNING, C. J., & PINKER, S. (1985). The spatial structure of visualattention. In M. I. Posner & O. S. M. Martin (Eds.). Attention andperjormance Xl iotv. 171-187). Hillsdale, NJ: Erlbaum.
DUNCAN, J., & HUMPHREYS, G. W. (1989). Visual search and stimulussimilarity. Psychological Review, 96, 433-458.
DUNCAN, J., & HUMPHREYS, G. W. (1992). Beyond the search surface:Visual search and attentional engagement. Journal ofExperimentalPsvchologv: Human Perception & Performance, 18,578-588.
EFRON, R.•YUND, E. w., & NICHOLS, D. R. ( 1987). Scanning the visualfield without eye movements-a sex difference. Neuropsychologia,25,637-644.
EFRON, R., YUNO, E. w., & NICHOLS, D. R. (1990a). Detectability as afunction of target location: Effects of spatial configuration. Brain &Cognition, 12. I 02-l 16.
EFRON, R., YUNO, E. w., & NICHOLS, D. R. (1990b). Serial processingof visual spatial patterns in a search paradigm. Brain & Cognition,12. 17-41.
EFRON, R., YUND, E. w., & NICHOLS, D. R. (1990c). Visual detectability gradients: The effect of distractors in contralateral field. Brain &Cognition, 12,128-143.
EGETH, H.. & DAGENBACH, D. (1991 ). Parallel vs. serial processing invisual search: Further evidence from subadditive effects of visualquality. Journal ofExperimental Psychology: Human Perception &Performance, 17. 55 I-560.
EGETH, H. J., FOLK, C. L., & MULLEN, P.A. (1989). Spatial parallelismin the processing of lines, letters, and lexicality. In B. E. Shepp &S. Ballesteros (Eds.), Object perception: Structure and process(pp. 19-52). Hillsdale, NJ: Erlbaum.
EGETH, H. J., VIRZI, R. A., & GARBART, H. (1984). Searching for conjunctively defined targets. Journal 0/ Experimental Psvchologv:Human Perception & Performance, 10,32-39.
ENNS, J. T., & RENSINK, R. A. (I 990a, February 9). Influence of scenebased properties on visual search. Science, 247, 72 I-723.
ENNS, J. T.. & RENSINK, R. A. (1990b). Sensitivity to three-dimensionalorientation in visual search. Psychological Science, 1, 323-326.
ERIKSEN, C. W.(1990). Attentional search of the visual field. In D. Brogan (Ed.), Visual search (pp. 3-19). London: Taylor & Francis.
ERIKSEN, C. w., & MURPHY, T. D. (1987). Movement of attentionalfocus across the visual field: A critical look at the evidence. Perception & Psychophysics, 42, 299-305.
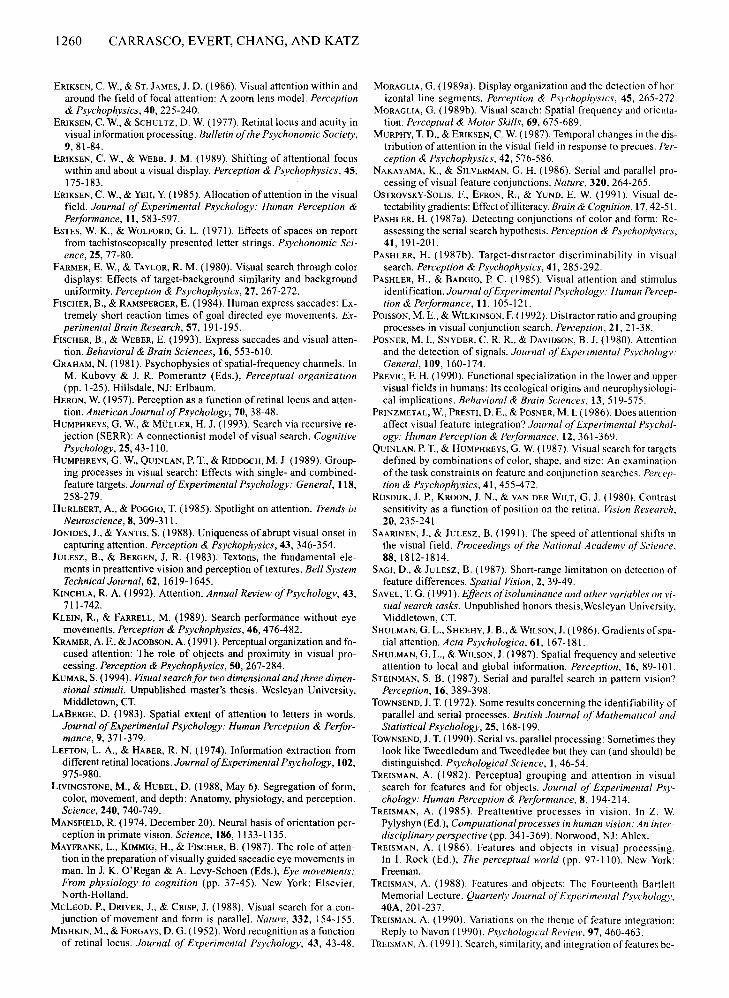
1260 CARRASCO, EVERT, CHANG, AND KATZ
ERIKSEN, C. w., & ST. JAMES, J. D. (1986). Visual attention within andaround the field of focal attention: A zoom lens model. Perception& Psychophysics, 40, 225-240.
ERIKSEN, C. W., & SCHULTZ, D. W. (1977). Retinal locus and acuity invisual information processing. Bulletin ofthe Psychonomic Society,9,81-84.
ERIKSEN, C. w., & WEBB, J. M. (J 989). Shifting of attentional focuswithin and about a visual display. Perception & Psychophysics, 45,175-183.
ERIKSEN, C. w., & YEH,Y.(1985). Allocation of attention in the visualfield. Journal of Experimental Psychology: Human Perception &Performance, 11, 583-597.
ESTES, W. K., & WOLFORD, G. L. (J 971). Effects of spaces on reportfrom tachistoscopically presented letter strings. Psychonomic Science, 25, 77-80.
FARMER, E. w., & TAYLOR, R M. (1980). Visual search through colordisplays: Effects of target-background similarity and backgrounduniformity. Perception & Psychophysics, 27, 267-272.
FiSCHER, B., & RAMSPERGER, E. (1984). Human express saccades: Extremely short reaction times of goal directed eye movements. Experimental Brain Research, 57, 191-195.
FISCHER, B., & WEBER, E. (1993). Express saccades and visual attention. Behavioral & Brain Sciences, 16,553-610.
GRAHAM, N. (1981). Psychophysics of spatial-frequency channels. InM. Kubovy & 1. R. Pomerantz (Eds.), Perceptual organization(pp. 1-25). Hillsdale, NJ: Erlbaum.
HERON, W. (1957). Perception as a function of retinal locus and attention. American Journal ofPsychology, 70, 38-48.
HUMPHREYS, G. W., & MULLER, H. J. (1993). Search via recursive rejection (SERR): A connectionist model of visual search. CognitivePsychology,25,43-110.
HUMPHREYS, G. w., QUINLAN, P. T., & RIDDOCH, M. J. (1989). Grouping processes in visual search: Effects with single- and combinedfeature targets. Journal ofExperimental Psychology: General, 118,258-279.
HURLBERT, A., & POGGIO, T. (1985). Spotlight on attention. Trends inNeuroscience, 8, 309-311.
JONIDES, J., & YANTIS, S. (1988). Uniqueness of abrupt visual onset incapturing attention. Perception & Psychophysics, 43, 346-354.
JULESZ, B., & BERGEN, J. R. (1983). Textons, the fundamental elements in pre attentive vision and perception of textures. Bell SystemTechnicalJournal, 62,1619-1645.
KINCHLA, R. A. (1992). Attention. Annual Review ofPsychology, 43,711-742.
KLEIN, R, & FARRELL, M. (1989). Search performance without eyemovements. Perception & Psychophysics, 46, 476-482.
KRAMER, A. E, & JACOBSON, A. (1991). Perceptual organization and focused attention: The role of objects and proximity in visual processing. Perception & Psychophysics, 50, 267-284.
KUMAR, S. (1994). Visual search for two dimensional and three dimensional stimuli. Unpublished master's thesis. Wesleyan University,Middletown, CT.
LABERGE, D. (1983). Spatial extent of attention to letters in words.Journal ofExperimental Psychology: Human Perception & Performance, 9, 371-379.
LEFTON, L. A., & HABER, R. N. (1974). Information extraction fromdifferent retinal locations. Journal ofExperimental Psychology, 102,975-980.
LIVINGSTONE, M., & HUBEL, D. (1988, May 6). Segregation of form,color, movement, and depth: Anatomy, physiology, and perception.Science, 240, 740-749.
MANSFIELD, R (1974, December 20). Neural basis of orientation perception in primate vision. Science, 186, 1133-1135.
MAYFRANK, L., KIMMIG, H., & FISCHER, B. (1987). The role of attention in the preparation ofvisually guided saccadic eye movements inman. In 1. K. O'Regan & A. Levy-Schoen (Eds.), Eye movements:From physiology to cognition (pp. 37-45). New York: Elsevier,North-Holland.
McLEOD, P., DRIVER, J., & CRISP, J. (1988). Visual search for a conjunction of movement and form is parallel. Nature, 332, 154-155.
MISHKIN, M., & FORGAYS, D. G. (1952). Word recognition as a functionof retinal locus. Journal of Experimental Psychology, 43, 43-48.
MORAGLIA, G. (I989a). Display organization and the detection of horizontal line segments. Perception & Psychophysics, 45, 265-272.
MORAGLIA, G. (I989b). Visual search: Spatial frequency and orientation. Perceptual & Motor Skills, 69, 675-689.
MURPHY, T. D., & ERIKSEN, C. W. (J 987). Temporal changes in the distribution of attention in the visual field in response to precues. Perception & Psychophysics, 42, 576-586.
NAKAYAMA, K., & SILVERMAN, G. H. (1986). Serial and parallel processing ofvisual feature conjunctions. Nature, 320, 264-265.
OSTROVSKY-SOLIS, E, EFRON, R., & YUND, E. W. (1991). Visual detectability gradients: Effect of illiteracy. Brain & Cognition, 17,42-51.
PASHLER, H. (1987a). Detecting conjunctions of color and form: Reassessing the serial search hypothesis. Perception & Psychophysics,41,191-201.
PASHLER, H. (I987b). Target-distractor discriminability in visualsearch. Perception & Psychophysics, 41, 285-292.
PASHLER, H., & BADGIO, P. C. (1985). Visual attention and stimulusidentification. Journal ofExperimental Psychology: Human Perception & Performance, 11,105-121.
POISSON, M. E., & WILKINSON, E (1992). Distractor ratio and groupingprocesses in visual conjunction search. Perception, 21, 21-38.
POSNER, M. I., SNYDER, C. R. R., & DAVIDSON, B. J. (1980). Attentionand the detection of signals. Journal of Experimental Psychology:General, 109, 160-174.
PREVIC, E H. (1990). Functional specialization in the lower and uppervisual fields in humans: Its ecological origins and neurophysiological implications. Behavioral & Brain Sciences, 13, 519-575.
PRINZMETAL, W., PRESTI, D. E., & POSNER, M.1. (1986). Does attentionaffect visual feature integration? Journal ofExperimental Psychology: Human Perception & Performance, 12,361-369.
QUINLAN, P. T., & HUMPHREYS, G. W. (1987). Visual search for targetsdefined by combinations of color, shape, and size: An examinationof the task constraints on feature and conjunction searches. Perception & Psychophysics, 41, 455-472.
RUSDIJK, J. P., KROON, J. N., & VAN DER WILT, G. J. (1980). Contrastsensitivity as a function of position on the retina. Vision Research,20, 235-241.
SAARINEN, J., & JULESZ, B. (1991). The speed of attentional shifts inthe visual field. Proceedings of the National Academy ofScience,88,1812-1814.
SAGI, D., & JULESZ,B. (1987). Short-range limitation on detection offeature differences. Spatial Vision, 2, 39-49.
SAVEL, T. G. (1991). Effects ofisoluminance and other variahles on visual search tasks. Unpublished honors thesis,Wesleyan University,Middletown, CT.
SHULMAN, G. L., SHEEHY, J. B., & WILSON, J. (1986). Gradients of spatial attention. Acta Psychologica, 61,167-181.
SHULMAN, G. L., & WILSON, J. (1987). Spatial frequency and selectiveattention to local and global information. Perception, 16, 89-101.
STEINMAN, S. B. (1987). Serial and parallel search in pattern vision?Perception, 16, 389-398.
TOWNSEND, J. T. (1972). Some results concerning the identifiability ofparallel and serial processes. British Journal of Mathematical andStatistical Psychology, 25, 168-199.
TOWNSEND, J. T. (1990). Serial vs. parallel processing: Sometimes theylook like Tweedledum and Tweedledee but they can (and should) bedistinguished. Psychological Science, 1,46-54.
TREISMAN, A. (1982). Perceptual grouping and attention in visualsearch for features and for objects. Journal of Experimental Psychology: Human Perception & Performance, 8,194-214.
TREISMAN, A. (1985). Preattentive processes in vision. In Z. W.Pylyshyn (Ed.), Computational processes in human vision: An interdisciplinary perspective (pp. 341-369). Norwood, NJ: Ablex.
TREISMAN, A. (1986). Features and objects in visual processing.In I. Rock (Ed.), The perceptual world (pp. 97-110). New York:Freeman.
TREISMAN, A. (1988). Features and objects: The Fourteenth BartlettMemorial Lecture. Quarterly Journal ofExperimental Psychology,40A,201-237.
TREISMAN, A. (1990). Variations on the theme of feature integration:Reply to Navon (1990). Psychological Review, 97, 460-463.
TREISMAN, A. (1991). Search, similarity, and integration of features be-
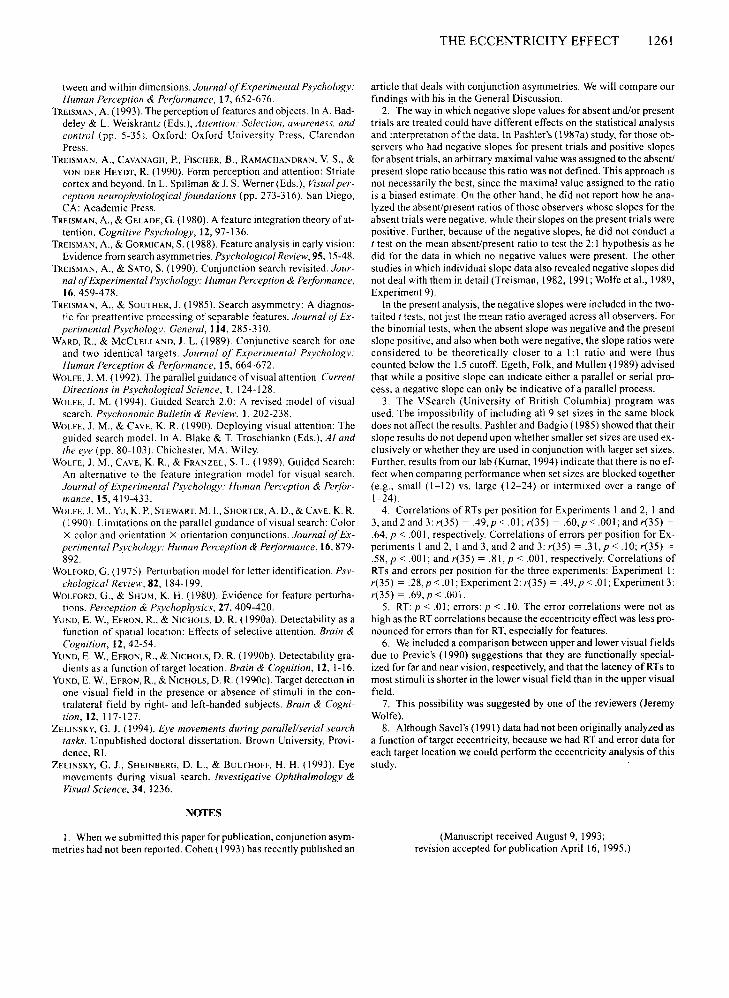
THE ECCENTRICITY EFFECT 1261
tween and within dimensions. Journal ofExperimental Psychology:Human Perception & Performance, 17, 652-676.
1'REISMAN, A. (1993). The perception offeatures and objects. In A. Baddeley & L. Weiskrantz (Eds.), Attention: Selection, awareness, andcontrol (pp. 5-35). Oxford: Oxford University Press, ClarendonPress.
TREISMAN, A., CAVANAGH, P, FISCHER, B., RAMACHANDRAN, V. S., &VON DER HEYDT, R. (1990). Form perception and attention: Striatecortex and beyond. In L. Spillman & 1. S. Werner (Eds.), Visualperception neurophysiological foundations (pp. 273-3 I6). San Diego,CA: Academic Press.
1'REISMAN, A., & GELADE, G. (1980). A feature integration theory ofattention. Cognitive Psychology, 12,97-136.
TREISMAN, A., & GORMICAN, S. (1988). Feature analysis in early vision:Evidence from search asymmetries. Psychological Review, 95, 15-48.
1'REISMAN, A., & SATO, S. (1990). Conjunction search revisited. Journal ofExperimental Psychology: Human Perception & Performance,16, 459-478.
1'REISMAN, A., & SOUTHER, J. (1985). Search asymmetry: A diagnostic for preattentive processing of separable features. Journal ofExperimental Psychology: General, 114,285-310.
WARD, R., & MCCLELLAND, J. L. (1989). Conjunctive search for oneand two identical targets. Journal of Experimental Psychology.Human Perception & Performance, 15, 664-672.
WOLFE, J. M. (1992). The parallel guidance ofvisual attention. CurrentDirections in Psychological Science, I, 124-128.
WOLFE, J. M. (1994). Guided Search 2.0: A revised model of visualsearch. Psychonomic Bulletin & Review, 1,202-238.
WOLFE, J. M., & CAVE, K. R. (1990). Deploying visual attention: Theguided search model. In A. Blake & T. Troschianko (Eds.), Al andthe eye (pp. 80-103). Chichester, MA: Wiley.
WOLFE, J. M., CAVE, K. R., & FRANZEL, S. L. (1989). Guided Search:An alternative to the feature integration model for visual search.Journal ofExperimental Psychology: Human Perception & Performance, 15,419-433.
WOLFE, J. M., Yu, K. P, STEWART, M. I., SHORTER, A. D., & CAVE, K. R.(1990). Limitations on the parallel guidance of visual search: ColorX color and orientation X orientation conjunctions. Journal ofExperimental Psychology: Human Perception & Performance, 16,879892.
WOLFORD, G. (1975). Perturbation model for letter identification. Psychological Review, .82, 184-199.
WOLFORD, G., & SHUM, K. H. (1980). Evidence for feature perturbations. Perception & Psychophysics, 27, 409-420.
YUND, E. w., EFRON, R., & NICHOLS, D. R. (1990a). Detcctability as afunction of spatial location: Effects of selective attention. Brain &Cognition, 12,42-54.
YUND, E. w., EFRON, R., & NICHOLS, D. R. (1990b). Detectability gradients as a function of target location. Brain & Cognition, 12, 1-16.
YUND, E. W., EFRON, R., & NICHOLS, D. R. (1990c). Target detection inone visual field in the presence or absence of stimuli in the contralateral field by right- and left-handed subjects. Brain & Cognition, 12, 117-127.
ZELINSKY, G. J. (1994). Eye movements during parallel/serial searchtasks. Unpublished doctoral dissertation, Brown University, Providence, RI.
ZELINSKY, G. J., SHEINBERG, D. L., & BULTHOFF, H. H. (1993). Eyemovements during visual search. Investigative Ophthalmology &Visual Science, 34, 1236.
NOTES
1. When we submitted this paper for publication, conjunction asymmetries had not been reported. Cohen (1993) has recently published an
article that deals with conjunction asymmetries. We will compare ourfindings with his in the General Discussion.
2. The way in which negative slope values for absent and/or presenttrials are treated could have different effects on the statistical analysisand interpretation of the data. In Pashler's (I 987a) study, for those observers who had negative slopes for present trials and positive slopesfor absent trials, an arbitrary maximal value was assigned to the absent!present slope ratio because this ratio was not defined. This approach isnot necessarily the best, since the maximal value assigned to the ratiois a biased estimate. On the other hand, he did not report how he analyzed the absent/present ratios of those observers whose slopes for theabsent trials were negative, while their slopes on the present trials werepositive. Further, because of the negative slopes, he did not conduct at test on the mean absent/present ratio to test the 2: 1 hypothesis as hedid for the data in which no negative values were present. The otherstudies in which individual slope data also revealed negative slopes didnot deal with them in detail (Treisman, 1982, 1991; Wolfe et aI., 1989,Experiment 9).
In the present analysis, the negative slopes were included in the twotailed t tests, not just the mean ratio averaged across all observers. Forthe binomial tests, when the absent slope was negative and the presentslope positive, and also when both were negative, the slope ratios wereconsidered to be theoretically closer to a I: I ratio and were thuscounted below the 1.5 cutoff. Egeth, Folk, and Mullen (1989) advisedthat while a positive slope can indicate either a parallel or serial process, a negative slope can only be indicative of a parallel process.
3. The VSearch (University of British Columbia) program wasused. The impossibility of including all 9 set sizes in the same blockdoes not affect the results. Pashler and Badgio (1985) showed that theirslope results do not depend upon whether smaller set sizes are used exclusively or whether they are used in conjunction with larger set sizes.Further, results from our lab (Kumar, 1994) indicate that there is no effect when comparing performance when set sizes are blocked together(e.g., small (1-12) vs. large (12-24) or intermixed over a range of1-24).
4. Correlations of RTs per position for Experiments I and 2, I and3,and2and3:r(35) = .49,p<.01;r(35) = .60,p<.001;andr(35) =
.64, p < .001, respectively. Correlations of errors per position for Experiments I and 2, I and 3, and 2 and 3: r(35) = .31, p < .10; r(35) =
.58, p < .00 I; and r(35) = .81, P < .001, respectively. Correlations ofRTs and errors per position for the three experiments: Experiment I:r(35) = .28,p < .01; Experiment 2: r(35) = .49,p < .01; Experiment 3:r(35) = .69, p < .001.
5. RT: p < .01; errors: p < .10. The error correlations were not ashigh as the RT correlations because the eccentricity effect was less pronounced for errors than for RT, especially for features.
6. We included a comparison between upper and lower visual fieldsdue to Previc's (1990) suggestions that they are functionally specialized for far and near vision, respectively, and that the latency ofRTs tomost stimuli is shorter in the lower visual field than in the upper visualfield.
7. This possibility was suggested by one of the reviewers (JeremyWolfe).
8. Although Savel's (1991) data had not been originally analyzed asa function of target eccentricity, because we had RT and error data foreach target location we could perform the eccentricity analysis of thisstudy.
(Manuscript received August 9, 1993;revision accepted for publication April 16, 1995.)