The Early Time Course of Compensatory Face Processing in Congenital Prosopagnosia
14
The Early Time Course of Compensatory Face Processing in Congenital Prosopagnosia Rainer Stollhoff 1 *, Ju ¨ rgen Jost 1,2 , Tobias Elze 1 , Ingo Kennerknecht 3 1 Max Planck Institute for Mathematics in the Sciences, Leipzig, Germany, 2 Santa Fe Institute, Santa Fe, New Mexico, United States of America, 3 Institute of Human Genetics, Westfa ¨lische Wilhelms-Universita ¨t, Mu ¨ nster, Germany Abstract Background: Prosopagnosia is a selective deficit in facial identification which can be either acquired, (e.g., after brain damage), or present from birth (congenital). The face recognition deficit in prosopagnosia is characterized by worse accuracy, longer reaction times, more dispersed gaze behavior and a strong reliance on featural processing. Methods/Principal Findings: We introduce a conceptual model of an apperceptive/associative type of congenital prosopagnosia where a deficit in holistic processing is compensated by a serial inspection of isolated, informative features. Based on the model proposed we investigated performance differences in different face and shoe identification tasks between a group of 16 participants with congenital prosopagnosia and a group of 36 age-matched controls. Given enough training and unlimited stimulus presentation prosopagnosics achieved normal face identification accuracy evincing longer reaction times. The latter increase was paralleled by an equally-sized increase in stimulus presentation times needed achieve an accuracy of 80%. When the inspection time of stimuli was limited (50ms to 750ms), prosopagnosics only showed worse accuracy but no difference in reaction time. Tested for the ability to generalize from frontal to rotated views, prosopagnosics performed worse than controls across all rotation angles but the magnitude of the deficit didn’t change with increasing rotation. All group differences in accuracy, reaction or presentation times were selective to face stimuli and didn’t extend to shoes. Conclusions/Significance: Our study provides a characterization of congenital prosopagnosia in terms of early processing differences. More specifically, compensatory processing in congenital prosopagnosia requires an inspection of faces that is sufficiently long to allow for sequential focusing on informative features. This characterization of dysfunctional processing in prosopagnosia further emphasizes fast and holistic information encoding as two defining characteristics of normal face processing. Citation: Stollhoff R, Jost J, Elze T, Kennerknecht I (2010) The Early Time Course of Compensatory Face Processing in Congenital Prosopagnosia. PLoS ONE 5(7): e11482. doi:10.1371/journal.pone.0011482 Editor: Chris I. Baker, National Institute of Mental Health, United States of America Received January 21, 2010; Accepted June 10, 2010; Published July 21, 2010 Copyright: ß 2010 Stollhoff et al. This is an open-access article distributed under the terms of the Creative Commons Attribution License, which permits unrestricted use, distribution, and reproduction in any medium, provided the original author and source are credited. Funding: These authors have no support or funding to report. Competing Interests: The authors have declared that no competing interests exist. * E-mail: [email protected] Introduction Prosopagnosia, colloquially also referred to as ‘‘face-blindness’’, was first defined by Bodamer as a selective deficit in the specific task of face identification [1], although the deficit has been reported previously in conjunction with more general object recognition deficits [2–4]. Since then, prosopagnosia has mostly been observed in cases of acquired prosopagnosia, where the deficit was caused by neurological damage following e.g. intoxication, head injury or encephalopathy [1,5–9]. Recently, more and more cases of prosopagnosia have been reported where the deficit was not acquired due to an accident, but presumably present from birth, i.e. congenital [9–17]. In contrast to the rare acquired form, the congenital form is among the most common anomalies in humans with a prevalence of 2.5% and is almost always hereditary [16–20]. Notwithstanding ongoing discussions on the nature of this congenital form, here we will continue to refer to all cases of prosopagnosia without any exogenous cause as cases of congenital prosopagnosia (CP), without explicitly addressing the question of heritability or developmental influences. The face recognition deficit in CP can be as profound as in the acquired form [9] and equally selective such that only facial identification is impaired while all other aspects of face and object recognition remain intact [21]. However, the selectivity of the deficit is questioned by recent reports on deficits in the processing of biological motion [22] and decreases in the subjective vividness of visual mental imagery [23]. Overall, cases of CP often display heterogeneous symptoms [24] which has so far prevented a stringent categorization of congenital prosopagnosia according to phenotypical symptoms. In this study, we investigate the face recognition deficit in CP in relation to the following qualitative model of facial information processing. We propose that normally for identification faces are encoded incrementally by holistic processing [25] of informative snapshots of faces. The model is similar to existing models of face perception [26] but focuses on a more detailed description of the process of structural encoding. However, our understanding of PLoS ONE | www.plosone.org 1 July 2010 | Volume 5 | Issue 7 | e11482
-
Upload
uni-muenster -
Category
Documents
-
view
2 -
download
0
Transcript of The Early Time Course of Compensatory Face Processing in Congenital Prosopagnosia
The Early Time Course of Compensatory Face Processingin Congenital ProsopagnosiaRainer Stollhoff1*, Jurgen Jost1,2, Tobias Elze1, Ingo Kennerknecht3
1 Max Planck Institute for Mathematics in the Sciences, Leipzig, Germany, 2 Santa Fe Institute, Santa Fe, New Mexico, United States of America, 3 Institute of Human
Genetics, Westfalische Wilhelms-Universitat, Munster, Germany
Abstract
Background: Prosopagnosia is a selective deficit in facial identification which can be either acquired, (e.g., after braindamage), or present from birth (congenital). The face recognition deficit in prosopagnosia is characterized by worseaccuracy, longer reaction times, more dispersed gaze behavior and a strong reliance on featural processing.
Methods/Principal Findings: We introduce a conceptual model of an apperceptive/associative type of congenitalprosopagnosia where a deficit in holistic processing is compensated by a serial inspection of isolated, informative features.Based on the model proposed we investigated performance differences in different face and shoe identification tasksbetween a group of 16 participants with congenital prosopagnosia and a group of 36 age-matched controls. Given enoughtraining and unlimited stimulus presentation prosopagnosics achieved normal face identification accuracy evincing longerreaction times. The latter increase was paralleled by an equally-sized increase in stimulus presentation times needed achievean accuracy of 80%. When the inspection time of stimuli was limited (50ms to 750ms), prosopagnosics only showed worseaccuracy but no difference in reaction time. Tested for the ability to generalize from frontal to rotated views,prosopagnosics performed worse than controls across all rotation angles but the magnitude of the deficit didn’t changewith increasing rotation. All group differences in accuracy, reaction or presentation times were selective to face stimuli anddidn’t extend to shoes.
Conclusions/Significance: Our study provides a characterization of congenital prosopagnosia in terms of early processingdifferences. More specifically, compensatory processing in congenital prosopagnosia requires an inspection of faces that issufficiently long to allow for sequential focusing on informative features. This characterization of dysfunctional processing inprosopagnosia further emphasizes fast and holistic information encoding as two defining characteristics of normal faceprocessing.
Citation: Stollhoff R, Jost J, Elze T, Kennerknecht I (2010) The Early Time Course of Compensatory Face Processing in Congenital Prosopagnosia. PLoS ONE 5(7):e11482. doi:10.1371/journal.pone.0011482
Editor: Chris I. Baker, National Institute of Mental Health, United States of America
Received January 21, 2010; Accepted June 10, 2010; Published July 21, 2010
Copyright: � 2010 Stollhoff et al. This is an open-access article distributed under the terms of the Creative Commons Attribution License, which permitsunrestricted use, distribution, and reproduction in any medium, provided the original author and source are credited.
Funding: These authors have no support or funding to report.
Competing Interests: The authors have declared that no competing interests exist.
* E-mail: [email protected]
Introduction
Prosopagnosia, colloquially also referred to as ‘‘face-blindness’’,
was first defined by Bodamer as a selective deficit in the specific
task of face identification [1], although the deficit has been
reported previously in conjunction with more general object
recognition deficits [2–4]. Since then, prosopagnosia has mostly
been observed in cases of acquired prosopagnosia, where the
deficit was caused by neurological damage following e.g.
intoxication, head injury or encephalopathy [1,5–9].
Recently, more and more cases of prosopagnosia have been
reported where the deficit was not acquired due to an accident,
but presumably present from birth, i.e. congenital [9–17]. In
contrast to the rare acquired form, the congenital form is among
the most common anomalies in humans with a prevalence of 2.5%
and is almost always hereditary [16–20]. Notwithstanding ongoing
discussions on the nature of this congenital form, here we will
continue to refer to all cases of prosopagnosia without any
exogenous cause as cases of congenital prosopagnosia (CP),
without explicitly addressing the question of heritability or
developmental influences.
The face recognition deficit in CP can be as profound as in the
acquired form [9] and equally selective such that only facial
identification is impaired while all other aspects of face and object
recognition remain intact [21]. However, the selectivity of the
deficit is questioned by recent reports on deficits in the processing
of biological motion [22] and decreases in the subjective vividness
of visual mental imagery [23]. Overall, cases of CP often display
heterogeneous symptoms [24] which has so far prevented a
stringent categorization of congenital prosopagnosia according to
phenotypical symptoms.
In this study, we investigate the face recognition deficit in CP in
relation to the following qualitative model of facial information
processing. We propose that normally for identification faces are
encoded incrementally by holistic processing [25] of informative
snapshots of faces. The model is similar to existing models of face
perception [26] but focuses on a more detailed description of the
process of structural encoding. However, our understanding of
PLoS ONE | www.plosone.org 1 July 2010 | Volume 5 | Issue 7 | e11482

structural encoding is based mostly on methods of machine
learning or computational vision. For example, we assume that
any given snapshot always encodes a holistic representation of the
information contained in all face parts. Changes of fixations
between snapshots only restrict the resolution with which
individual face parts can be processed but don’t imply an exclusive
processing of the face part fixated on, as would be the case in
featural processing. Only in this sense, is the difference between
featural and holistic processing a qualitative one. More generally,
the difference is rather quantitative in the amount of information
which is extracted and integrated for any given snapshot.
We propose that the informativeness of individual snapshots
depends mainly on two factors: feature variability across members
of a population and limitations in the retinal and cortical
resolution of image parts. Optimally, informative regions are
processed earlier on and are fixated on more often, i.e. encoded
with a higher precision, than non-informative ones. The informa-
tiveness of regions is learned over repeated exposures to faces and
depends more on the population exposed to and only to a lesser
degree on the actual face stimulus encoded. Our assumptions are
compatible with psychological studies showing the recruitment of
holistic processing strategies in face recognition [25], stereotypical
fixation patterns that depend neither on the fixation sequences
actually employed during encoding [27], nor on the individual
face perceived [28]. Although initially violating optimal informa-
tion processing of individual faces, stereotypical fixation patterns
can minimize difficulties in comparing translated snapshots (cf.
decreases in the performance of appearance based methods for
automated face recognition [29]). Fixation patterns depend on the
cultural background of the observer but are independent of that of
the stimulus [30]. Whether this is due to social norms, as suggested
by the authors, or due to different patterns of variability across
populations (cf. ‘‘other-race-effect’’ [31]) is still an open question.
During recognition a perceived face image is matched in parallel
against stored representations, and the identity is determined
according to a best match. The accuracy of the matching process is
limited not only by the quality of the stimulus presented but
moreover by the quality of the previously stored representation.
This quality increases with the number of snapshots taken during
initial encoding (i.e. increased encoding time) and the informa-
tiveness of the snapshots (e.g. fixation on informative regions,
retinal and cortical resolution). The recognition of individual faces
is based on informative snapshots, i.e. representations that
integrate information from the full face, and thus allows a faster
processing than serial matching of (local) informative features used
for classification [32,33].
In contrast to normal processing, we hypothesize that in
apperceptive/associative [6] types of CP facial encoding is a
mostly deliberate process of extracting (local) informative features
in a series of fixations or attentional shifts. As the uniqueness of
isolated features, and therefore their informational content, differs
between individual faces, so does the series of fixations employed
to extract the information. Indeed, face processing in CP has been
characterized by a reliance on featural processing [15,34] and
more dispersed fixation patterns [35,36]. More specifically, while
controls fixate almost exclusively on the eye, nose, and mouth
region, participants with CP direct a small but significant amount
of fixations on external features. Furthermore, the proposed
compensatory featural processing is contingent on cognitive
strategies of problem solving, which is in agreement with a face-
specific increase in the BOLD response in frontal areas in
congenital prosopagnosia [37]. In an ideal CP observer model,
during the initial encoding of the stimulus a face image is scanned
for informative regions and if given sufficient time a unique,
optimally informative series of fixations is developed. This doesn’t
necessarily imply that CPs will always be able to extract the same
total amount of information, only that the fixation sequence is
optimal given the restriction on featural processing. Thus,
depending on the task difficulty (number of target and distractor
stimuli, availability of informative features,…) CPs might perform
with a normal accuracy. This is in line with studies showing that
participants with CP can achieve close to normal face recognition
performance in standardized tests [38], however they often show
longer reaction times [15].
Underlying the distinction between the proposed models for CP
and normal face processing is the difference between featural and
holistic encoding. Although, as argued above, we regard this as a
quantitative difference in encoding, the implications on the overall
process of face recognition are of a more qualitative nature: On
the one hand, the incremental refinement of a universally holistic
representation capturing how an individual differs from its
population. On the other hand, the iterative expansion of
personalized ‘‘mental lists’’ by adding isolated features that are
unique to this specific individual. The proposed models align with
explanations of the dissociation between facial identification and
intact object classification as a difference in the level of visual
expertise needed [39,40]. While successful identification of
individual exemplars depends on holistic image-based representa-
tions, classification of objects can be accomplished by a com-
parison of image parts or features (see [41] for a review of
computational approaches).
The experimental assessment of the models carried out in this
study focuses on the implications of the models on temporal
dynamics of face recognition and the influence of stimulus
transformations. More specifically, we test the following predic-
tions: First, if given sufficient training and inspection times, CP
participants might be able to achieve the same performance as
controls presumably by a serial matching of isolated features.
Second, for any given fixed inspection time, on average CP
participants will extract less information and thereby perform
worse. Third, for controls, limiting inspection time during initial
encoding has a stronger influence than limiting inspection time
during recognition. An interruption of the incremental refinement
of a holistic representation is more detrimental than a shortened
period available for holistic matching. Fourth, we hypothesized
that in both cases processing relies mostly on appearance-based
(i.e. pictorial) information that doesn’t generalize well across
rotation in depth [42]. Thus, the deficit in CP is not related to a
dysfunctional generalization and on average the influence of
stimulus transformation shouldn’t differ between control and CP
participants. In addition to testing these predictions on differences
in facial identification, we investigated differences in the ability to
identify novel stimuli (NikeTM sneakers resp.) in which neither
group had any prior expertise and thus couldn’t engage in holistic
processing. This served to ascertain that possible differences in face
recognition between controls and CPs can not be explained by a
general decrease in visual proficiency among the CP participants.
In order to test the predictions of the proposed models and
better characterize the behavioral symptoms in congenital
prosopagnosia, we conducted a series of experiments, each testing
different aspects of face and object recognition, with a total of 16
CP and 32 control participants. The setup of the experiments
closely parallels those of other tests (e.g. Cambridge Face
Recognition Test [43]), and was restricted to setups which have
a direct analogue in real-life situations avoiding unrealistic
conditions, e.g. scrambling or inverting a face.
In the first two experiments, a standard setting was used to test
recognition of frontal images of faces (experiment 1) and shoes
Face Processing in CP
PLoS ONE | www.plosone.org 2 July 2010 | Volume 5 | Issue 7 | e11482

(experiment 2). Participants were familiarized with four individual
target stimuli and later on had to identify the targets amongst a
group of distractor stimuli in a two-alternative forced choice
paradigm (target vs. non-target). We specifically investigated
whether longer reaction times can be attributed to longer
inspection of the images or a longer decisional component. First,
we measured participants’ reaction times under the condition of
unlimited presentation. Second, we used an adaptive sampling
strategy to estimate the presentation time at which a participant
performs with an accuracy of 80%. Third, we contrasted
individuals’ reaction times with their 80%-correct presentation
times. Previous studies of CP-control differences in reaction times
in facial identification tasks have provided mixed results: An
increase in CPs reaction times in a matching task with unlimited
exposure duration [15], but no difference in reaction times in a
delayed recognition task with a limited presentation time (200ms)
during learning [44]. Here, participants had unlimited presenta-
tion time during learning of the stimuli. Reaction times were
measured under unlimited presentation and compared to
presentation times needed for equal performance. The latter
hasn’t been studied so far, and in itself as by comparison with
reaction times provides a direct measure of possible speed-
accuracy trade-offs in CP which have been proposed previously
[15]. Moreover, using the same experimental design with both
face and shoe stimuli allows to clarify whether possible speed-
accuracy trade-offs are restricted to the processing of faces.
In experiment 3 (faces) and experiment 4 (shoes) we investigated
each participants’ ability to generalize stimulus recognition across
rotation in depth. While recognition of stimuli taken under
identical viewing conditions can be solved by image matching,
rotation in depth which occurs frequently under natural view-
ing conditions at least diminishes the applicability of similar
compensatory strategies. Previously, it was shown that normally
for faces learned in a frontal view, recognition performance
decreases monotonically when tested with images rotated around
the vertical axis [42]. Here, we assessed whether participants with
CP show a similar or more pronounced decrease in their
performance to discriminate between the previously learned
targets and distractors. Thus we directly investigate participants
ability to generalize from a learned view (front) to a novel view of
the that was never experienced before in a delayed recognition
tasks.This differs from previous studies employing rotated images
in a matching task where target and samples where always shown
in the same view [15], differing in illumination [45], or studies with
a delayed recognition tasks where stimuli were learned in every
viewing condition prior to being tested. In order to isolate the
influence of rotation and avoid statistical ceiling (or bottom) effects
in the performance, images were displayed for different durations
estimated according to individual performance in experiments 1
and 2 respectively.
The setup of experiments 1 and 2 entailed the presentation of
stimuli for different durations that were individually determined
for each CP participant and their respective matched controls. In
experiments 5 and 6, four fixed presentation times were used,
identical for all participants and chosen to separate between the
times needed for preparation and execution of one or multiple
saccades. In addition, we investigated whether there are
differences in the effect of tachystocopic presentation depending
on whether they are applied during the encoding, i.e. learning, of a
novel face (experiment 5) or during the decoding, i.e. recognition,
of a previously learned face (experiment 6). Previous studies of
patients with acquired prosopagnosia have shown a more
pronounced deficit after limiting exposure to ‘‘tachystocopic’’
presentation [46] - anecdotal evidence only, or to presentations of
1500 or 5000ms [40]. In a study of CP face recognition employing
a delayed recognition task [44], presentation time was limited
during learning (200ms) but unlimited during recognition, similar
to our experiment 5 but without any variation of the limited
presentation duration.
Differences in the age of participants as well as observations of
cognitive heterogeneity in CP participants [24] prompted us to
resort to a threefold statistical analysis: First we tested for group
differences in location using a robust, non-parametric Wilcoxon
rank-sum test on the raw data (average values - mean - for each
participant). Second, in order to account for inter-individual
differences in age and to test for group differences in the influence
of experimental parameters on participants’ performance, we used
generalised linear mixed models (GLMMs, see [47] for a review).
Third, based on fitted GLMMs, for each participant we calculated
individual residuals as the difference between actual outcomes and
the outcome that would be expected based on average control
performance. In this sense, residuals capture individual deviations
from a hypothetical, average control, thereby providing a
straightforward abnormality score to measure the size of individual
CP participants’ deficit.
Results
Experiments 1 and 2For the face stimuli used in experiment 1, CP participants made
more mistakes than controls during the initial feedback training.
Also, reaction times - measured during subsequent feedback
trainings - as well as the presentation times individual participants
needed to achieve 80% correct recognition rates were larger
among CP participants. Difference in reaction times are of the
same magnitude as difference in presentation times, which suggest
that increased reaction times for CP participants are due to a
longer inspection of the stimulus as opposed to a longer time to
reach a decision. For the shoe stimuli used in experiment 2,
control and CP participants’ performance, reaction and presen-
tation times didn’t differ significantly.
Performance during feedback learning. On average
participants with congenital prosopagnosia needed more training
than controls. During the initial training prior to the first testing
they made more mistakes than controls in the face recognition test
(means mcontrols~0:72, and mCP~4:13; Wilcoxon rank sum test,
W~87, n0~32, nCP~16, pv0:001 two-sided), but not in the
shoe recognition test (means mcontrols~0:5, mCP~1:25; W~226,
n0~32, nCP~16, p~0:47 two-sided). For controls, both tasks
were of comparable difficulty (Wilcoxon signed rank test,
V~77:5, n~32, p~0:31 two-sided)
Reaction times during feedback training. Analysis of raw
data, after outlier removal, revealed that on average CP
participants had longer mean reaction times than controls for
faces (means mcontrols~832 ms, mCP~980 ms; Wilcoxon rank sum,
W~125, n0~32, nCP~16, p~0:004 two-sided), but not for
shoes (means mcontrols~900ms, mCP~930ms; W~240, n0~32,
nCP~16, p~0:74 two-sided). For controls, mean reaction times
were faster for face than for shoe recognition (Wilcoxon signed
rank test, V~43, n~32, p~v0:001 two-sided). In both tasks
reaction times increased with age (see Figure 1 C for faces).
After accounting for age related changes in reaction time,
differences between the groups are still significant for faces (LR-
test of main effect, d(?)~13:00, df ~1, p~0:001, bb~{1:7:10{4,
HPDI95%~½{2:6,{0:7�:10{4), but not for shoes (D~0:00,
df ~1, p~0:95). In contrast to group differences in the mean,
in both cases the influence of training block number on reaction
time didn’t differ between groups (LR-test of first-order against
Face Processing in CP
PLoS ONE | www.plosone.org 3 July 2010 | Volume 5 | Issue 7 | e11482

main effect model, D~0:04, df ~1, p~0:85 for faces, and
D~0:20, df ~1, p~0:66 for shoes). Thus, in both groups training
led to a comparable decrease in the reaction times.
A comparison of residuals revealed that participants with CP
had longer reaction times than expected (larger residuals of 21/
(reaction time)) for faces ((Wilcoxon rank sum, W~100, n0~32,
nCP~16, pv0:001 one-sided) but not for shoes (W~244, n0~32,
nCP~16, p~0:40 one-sided). The increase in reaction time was
selective for faces for most CP participants: 13 out of 16 CP
participants had higher residuals in the face task compared to the
shoe task (see Figure 1 D).
Presentation times. All control participants only needed
very short presentation times to perform at an 80% correct level in
both the face (individual PT80%s range between 6 ms and 47 ms)
and shoe recognition task (between 9 ms and 102 ms) which is well
below the time needed for controlled eye movements (i.e. less than
Figure 1. Contrasting face and shoe recognition for frontal images. (A) In experiments 1–4 participants were first presented with 4 targetstimuli, and were trained during at least 16 feedback trials prior to the test. During feedback training, participants with congenital prosopagnosia (CP)on average made more mistakes during initial learning than controls only for faces but not for shoes (B, solid line for equality). Reaction times duringlater training trials with unlimited viewing were strongly influenced by participants’ age (C, shown for faces only, solid lines represent linear modelfits). Comparison of residuals, which account for age related differences, revealed longer reaction times for CPs compared to controls for face stimulibut not for shoe stimuli (D, RTres, inverse transformation i.e. {1/RT see Methods). In face and shoe recognition, the presentation time needed toachieve 80% correct recognition (PT80%) increases with age (E shown for faces only, solid lines represent linear model fits). CP participants neededlonger presentation times than controls in tests for face recognition (Exp. 1) but not for shoe recognition (Exp. 2). (F comparing residuals PT80%,res).Group differences in mean reaction time for faces stimuli (G left boxplots, RTs centered around control mean) vanished after subtracting PT80%
presentation time ((G right boxplots, values centered around control mean): CP participants needed to inspect face stimuli longer than controls.Boxplot shows group distributions (whiskers: 90% CI); significance values according to a Wilcoxon rank sum test.doi:10.1371/journal.pone.0011482.g001
Face Processing in CP
PLoS ONE | www.plosone.org 4 July 2010 | Volume 5 | Issue 7 | e11482
200 ms). In contrast, several participants with congenital
prosopagnosia required far longer presentation times to
accurately recognize faces (21 ms to 766 ms) and/or shoes (7 ms
to 462 ms). In both groups age had a strong confounding influence
on the presentation time needed (shown for faces in Figure 1 E)
Comparing both groups, PT80%s were larger for CP than
control participants for faces (medians of 34.2 ms and 20.9 ms
respectively; Wilcoxon rank sum test, W~94:5, n0~30, nCP~15,
pv0:001 one-sided) but not for shoes (medians of 20 ms and
17.3 ms respectively; W~235, n0~32, nCP~16, p~0:33 one-
sided). Analogously, using model based comparisons revealed a
significant group difference in the log-transformed PT80% for faces
(LR-test, D~24:02, df ~1, pv0:001) but not for shoes (D~2:52,
df ~1, p~0:11).
Compared to the control group CP participants had larger
residuals in the log-transformed PT80% - needed longer presenta-
tion times than expected - for the face task (W~67, n0~30,
nCP~12, pv0:001 one-sided) but not for the shoe task (W~233,
n0~32, nCP~16, p~0:31 one-sided).
Comparison of reaction times and presentation
times. While CP participants had significantly longer mean
reaction times recognizing faces in experiment 2 (see above), there
is no significant group difference left after we subtracted the time
participants’ needed to perform at an 80% correct level (W~226,
n0~30, nCP~15, p~0:51) and thereby accounted for differences
in the time participants need to inspect a stimulus (see Figure 1 G).
Thus, while CP participants needed to inspect face images longer
than controls, the time taken to make a decision didn’t seem to
differ.
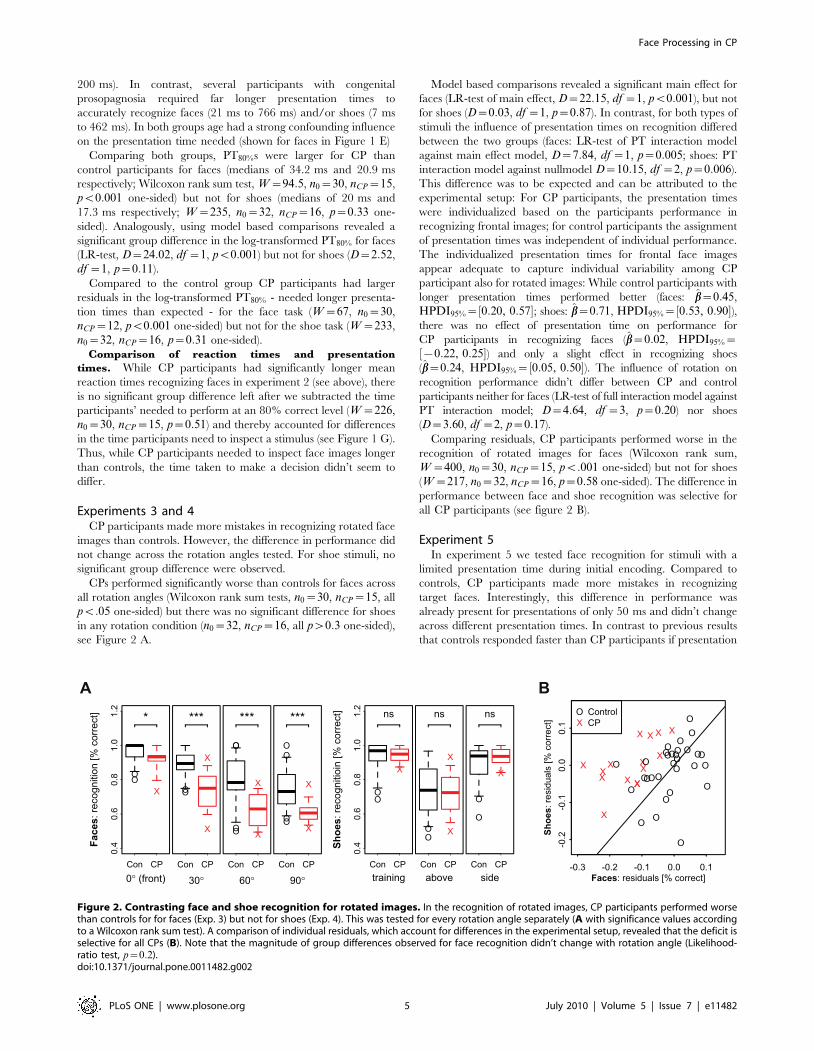
Experiments 3 and 4CP participants made more mistakes in recognizing rotated face
images than controls. However, the difference in performance did
not change across the rotation angles tested. For shoe stimuli, no
significant group difference were observed.
CPs performed significantly worse than controls for faces across
all rotation angles (Wilcoxon rank sum tests, n0~30, nCP~15, all
pv:05 one-sided) but there was no significant difference for shoes
in any rotation condition (n0~32, nCP~16, all pw0:3 one-sided),
see Figure 2 A.
Model based comparisons revealed a significant main effect for
faces (LR-test of main effect, D~22:15, df ~1, pv0:001), but not
for shoes (D~0:03, df ~1, p~0:87). In contrast, for both types of
stimuli the influence of presentation times on recognition differed
between the two groups (faces: LR-test of PT interaction model
against main effect model, D~7:84, df ~1, p~0:005; shoes: PT
interaction model against nullmodel D~10:15, df ~2, p~0:006).
This difference was to be expected and can be attributed to the
experimental setup: For CP participants, the presentation times
were individualized based on the participants performance in
recognizing frontal images; for control participants the assignment
of presentation times was independent of individual performance.
The individualized presentation times for frontal face images
appear adequate to capture individual variability among CP
participant also for rotated images: While control participants with
longer presentation times performed better (faces: bb~0:45,
HPDI95%~½0:20, 0:57�; shoes: bb~0:71, HPDI95%~½0:53, 0:90�),there was no effect of presentation time on performance for
CP participants in recognizing faces (bb~0:02, HPDI95%~
½{0:22, 0:25�) and only a slight effect in recognizing shoes
(bb~0:24, HPDI95%~½0:05, 0:50�). The influence of rotation on
recognition performance didn’t differ between CP and control
participants neither for faces (LR-test of full interaction model against
PT interaction model; D~4:64, df ~3, p~0:20) nor shoes
(D~3:60, df ~2, p~0:17).
Comparing residuals, CP participants performed worse in the
recognition of rotated images for faces (Wilcoxon rank sum,
W~400, n0~30, nCP~15, pv:001 one-sided) but not for shoes
(W~217, n0~32, nCP~16, p~0:58 one-sided). The difference in
performance between face and shoe recognition was selective for
all CP participants (see figure 2 B).
Experiment 5In experiment 5 we tested face recognition for stimuli with a
limited presentation time during initial encoding. Compared to
controls, CP participants made more mistakes in recognizing
target faces. Interestingly, this difference in performance was
already present for presentations of only 50 ms and didn’t change
across different presentation times. In contrast to previous results
that controls responded faster than CP participants if presentation
Figure 2. Contrasting face and shoe recognition for rotated images. In the recognition of rotated images, CP participants performed worsethan controls for for faces (Exp. 3) but not for shoes (Exp. 4). This was tested for every rotation angle separately (A with significance values accordingto a Wilcoxon rank sum test). A comparison of individual residuals, which account for differences in the experimental setup, revealed that the deficit isselective for all CPs (B). Note that the magnitude of group differences observed for face recognition didn’t change with rotation angle (Likelihood-ratio test, p~0:2).doi:10.1371/journal.pone.0011482.g002
Face Processing in CP
PLoS ONE | www.plosone.org 5 July 2010 | Volume 5 | Issue 7 | e11482

time is unlimited, under limited presentation there was no
difference in reaction times. However, while controls responded
faster if the target has been previously presented longer, no such
relation could be observed among CP participants.
On average control participants performed better than CP
participants for all of the presentation times tested (Wilcoxon rank
sum test, all pv0:05, see Figure 3 B). Model based comparisons
revealed a significant main effect of group (LR test of of main
effect: D~13:3, df ~1, pv:001). Although both groups improved
in performance with increasing presentation time during the
learning of the stimuli, the performance of control participants
increased slightly stronger than the performance of CP partici-
pants (LR-test of full model against main effect model, D~4:06,
df ~1, p~0:044). The increase in performance was lower in
CP participants compared to controls (difference bb~{0:13,
HPDI95%~½{0:23,0:01�). Thus, control participants profited
more from increased presentation times during learning than CP
participants.
There was no difference in average reaction time between
control and CP participants for any of the presentation times
Figure 3. Face recognition under the constraint of limited presentation time. (A) In experiment 5, participants were shortly presented witha target stimulus for 50ms, 150ms, 450ms or 750ms, and after a short blank had to recognize the target in a display of four face images. For allpresentation times used in experiment 5, performance of CP participants differed from controls (B), while there was no significant difference inreaction times (C). However, while controls responded faster with increasing presentation time, there was no significant influence of presentationtime on CP reaction times (Likelihood-ratio test, p~0:006). (D) In experiment 6, participants were repeatedly presented target faces, which - after atotal of 24 feedback trials - had to be recognized in a 2-alternative forced choice paradigm. During the test, faces were presented for variabledurations (50ms, 150ms, 450ms or 750ms). Independent of the duration, CP participants performed worse than controls (E), without significantdifferences in reaction times (F).doi:10.1371/journal.pone.0011482.g003
Face Processing in CP
PLoS ONE | www.plosone.org 6 July 2010 | Volume 5 | Issue 7 | e11482

(Wilcoxon rank sum test, all pw0:1 two-sided, see Figure 3 C).
This was confirmed by a model comparison (LR-test of main
effect: D~0:32, df ~1, p~0:57). However, a significant differ-
ence in the influence of presentation time during learning on
reaction time during recognition was found (LR-test of full model
against null model: D~9:94, df ~2, p~0:006): While controls
participants’ reaction times decreased with increasing learning
time (bb~3:6:10{5, HPDI95%~½2:5, 4:7�:10{5, note that coeffi-
cients are with respect to an inverse scale), there was no signifi-
cant influence for CP participants (bb~1:13:10{5, HPDI95%~½{0:8, 2:2�:10{5, inverse scale).
Residuals with respect to the nullmodel are greater for CP
participants compared to control participants in recognition
performance (Wilcoxon rank sum test, W~261, n0~24,
nCP~13, pv0:001 one-sided) but there’s no difference in
residuals of reaction times (W~161, n0~24, nCP~13, p~0:89two-sided).
Experiment 6Experiment 6 assessed participants performance in recognizing
faces that were presented for a limited duration during the
recognition phase. Similar to experiment 5, CP participants made
more mistakes in recognizing target faces than controls. Again, this
difference in performance was already present for presentations of
only 50 ms but compared to experiment 5 the difference didn’t
increase with increasing different presentation time. There were
no differences between CP participants’ and controls’ reaction
times.
On average control participants performed better than CP
participants already after a presentation of only 50 ms (Wilcoxon
rank sum test, all pv0:05, see Figure 3 E). Model based
comparisons revealed a significant main effect of group (LR test
of of main effect: D~10:03, df ~1, p~:002). Both groups
improved in performance with increasing presentation time
(bb~0:17, HPDI95%~½0:14, 0:21�), without a significant differ-
ence (LR-test of full model against main effect model, D~0:48,
df ~1, p~0:49).
There was no difference in average reaction time between
control and CP participants for any of the presentation times
(Wilcoxon rank sum test, all pw0:3 two-sided, see Figure 3 F).
This was confirmed by a model comparison (LR-test of main
effect: D~0:03, df ~1, p~0:87). There was no significant
difference in the influence of presentation time on reaction time
between the groups (LR-test of full model against null model:
D~0:87, df ~2, p~0:65).
Residuals with respect to the nullmodel are greater for CP
participants compared to control participants in recognition
performance (Wilcoxon rank sum test, W~255, n0~24,
nCP~13, pv0:001 one-sided) but there’s no difference in
residuals of reaction times (W~174, n0~24, nCP~13, p~0:58two-sided).
Discussion
SummaryIn all of the face recognition tests there was a significant
difference in performance between the group of CP participants
and the control group: CP participants needed more initial
training, had longer reaction times and needed longer presentation
times of stimuli to achieve the same level of accuracy as compared
to controls. The face recognition deficit in CP participants was
present for both: frontal views of the faces, which were extensively
trained, and rotated views of the faces, which were only presented
as test stimuli. In contrast to the recognition of faces, there was no
performance difference between the two groups in discriminating
individual shoes. However, for four CP participants (HE,-
SE,HB,RK) the deficits seemed to extent to object identification.
Regarding our hypothesis, we first replicated findings that CP
participants can achieve a face recognition accuracy comparable
to controls, albeit requiring more initial training and longer
reaction times. This increase in reaction time was paralleled by an
equal-sized increase in the presentation time CP participants
needed in order to perform at the same level as controls.
Furthermore, if stimulus presentation is limited during recogni-
tion (experiment 6), these differences in reaction time during
recognition vanish. Thus, CP participants can achieve normal
recognition accuracy but they need to inspect the stimulus longer.
Second, CP participants showed worse recognition accuracy
than controls if presentation time - and therefore the process of
information extraction - was limited (experiments 5 and 6). The
difference was already present for presentation times of 50ms.
Thus, performance differences are not merely a function of slower
processing but of differences in the processing that are present
from the very beginning.
Third, for both groups limits on presentation time had a
detrimental influence on recognition accuracy both if the
limitation took place only during the initial encoding, learning
(experiment 5), or only during matching of faces, recognition
(experiment 6). It seems that the positive influence of increasing
presentation times (e.g. from 50ms to 750) was more pronounced
in the former case of restricted initial encoding and unlimited
recognition time (see Figure 2), but a direct comparison is difficult
due to the differences in experimental design. Only in experiment
5 did we observe group differences in the positive influence of
prolonged presentation times on accuracy. Furthermore, this
positive influence on accuracy was paralleled by a decrease in
reaction times, but only among controls and not among CP
participants. Thus for controls restricting inspection time during
the initial encoding influences recognition accuracy and reaction
time to a larger degree than for CP participants. In contrast, the
difference in accuracy between CPs and controls doesn’t change
after increasing limited presentation times during recognition
(experiment 6), where reaction times don’t differ at all between
both groups. Moreover, while control reaction times during
recognition decreased with longer presentation times in experi-
ment 5 they increased in experiment 6. In both experiments the
stimuli were presented without masks, and it is possible that
processing of the stimuli continued after their physical disappear-
ance. But, as the results from experiment 1 indicate, the duration
of post-presentation processing doesn’t seem to differ between
controls and CPs, at least during the recognition process.
Fourth, performance in face recognition decreased with
increasing rotation angle between learned view and testing view
for both CPs and controls similarly. Although this finding supports
the original model put forward, the absence of group differences in
the influence of rotation might have been due to different reasons.
Firstly, in the experiments participants were trained only on
frontal images. However, it is questionable whether frontal images
are suited to the construction of 3D models [42] and whether the
construction can be based on the observation of a single image at
all. Secondly, isolated features might posses a certain inherent
degree of transformation invariance against experimental stimulus
manipulations. For example, one CP participant used cues with a
high degree of rotation invariance as part of their compensatory
processing or feature selection strategies. In recognizing one of the
target faces, FP attended a small mole placed on the left side of the
neck which was visible in frontal view and for rotations to the left
but hidden for rotations to the right. Accordingly FP recognized
Face Processing in CP
PLoS ONE | www.plosone.org 7 July 2010 | Volume 5 | Issue 7 | e11482

this target face whenever it was rotated to the left and failed to
recognize the target whenever it was rotated to the right,
irrespective of the rotation angle.
Models of Congenital ProsopagnosiaIn this study we proposed a model for an apperceptive or
associative type of CP, where the deficit is due to a failure of
holistic encoding. The fallback on encoding isolated features leads
to a compensatory processing that relies on actively scanning a
face for informative features and leads to longer inspection times.
Depending on the task difficulty, this compensatory processing
might give rise to a normal accuracy in facial identification tasks.
Equality of performance might be achievable especially in
experimental investigations which draw on a limited number of
faces each presented only in a small number of images.
Central to the proposed model of CP is a shift from holistic
encoding, with face regions ‘‘weighted’’ according to their
informativeness, to a serial scanning of isolated features, which
are constructed and optimized for each face individually based on
the informativeness of each feature in isolation. However, it is
important to note that optimality and informativeness always
depend on the processing capabilities available. With regard to
fixation behaviour in controls and CP this raises the question
whether the locations providing optimal information for holistic
encoding actually should be the same for compensatory featural
encoding in CPs. It might even be possible that for holistic
processing there is no ‘‘right’’ location: It is important to choose
and maintain a fixation spot, but the exact location is based on
social norms [30].
In a recent study on training face recognition in a girl with
CP [36], the authors explicitly instructed the child to focus on
individual, informative features to recognize a set of familiar
faces. After training, they observed an increased performance
in recognizing the familiar faces as well as a change in scan
paths. Prior to training the child showed a dispersed gaze
behaviour, but afterwards it spent more time fixating internal
features for familiar as well as novel faces. However, based on
the evidence provided it can not be ruled out that the change in
fixation patterns is solely due to a serial checking of all learned
feature lists, e.g. recapitulating taught fixation sequences in
order to be able to identify a familiar face, instead of the
generalization of a fixation strategy to novel faces as proposed
by the authors.
The model of an apperceptive/associative congenital prosop-
agnosia proposed advances on previously proposed models of
prosopagnosia in several aspects:
N Qualitative vs. quantitative shift: Acquired prosopagnosia has
been simulated in artificial neural networks by a decreased
connectivity which lead to a quantitative decrease of
performance [65,66]. However, in the case of CP several
qualitative shifts have been documented (e.g. gaze behavior
[35,36], no inversion effect [15]). Our model proposes that a
qualitative shift to serial, featural processing in CP can emerge
as the result of quantitative differences in the extent to which
distributed information can be encoded holistically.
N Spatial and temporal integration: The model proposed directly
relates a deficit in spatial integration of information extraction
(holistic processing) to increases in the time spent inspecting a
stimulus, i.e. compensatory temporal integration.
N Gaze behavior: Observations that CPs show different fixation
patterns [35,36], have previously been interpreted as the
source of the deficit [36]. However, this raises the question why
CPs would learn such a defunct gaze behavior in the first
place. Our model provides an alternative explanation of
dispersed gaze as the result of compensatory processing due to
an inability of holistic encoding.
Diagnosis of Congenital ProsopagnosiaIn this study, diagnosis of CP was based on a semi-structured
interview including diagnostic criteria such as a reported
uncertainty in face recognition, prolonged recognition times
surpassing socially accepted time spans, the development of
compensatory strategies, anecdotal stories, and familial recur-
rence. Relying on a structured but subjective assessment of real life
difficulties instead of a more controlled assessment of face
recognition abilities under experimental settings, has benefits as
well as caveats. Roughly speaking, our method of diagnosis
increases the validity with respect to actual clinical symptoms but
suffers from a decrease in objectivity due to the impossibility of a
perfect standardization of diagnostic interviews. To further explain
our view, let us consider two possible constellations: A person
shows all symptoms of prosopagnosia as described in this paper,
but has a normal test score (within 1 SD). Then we would still
consider him prosopagnosic because the test does not prove that in
real life situations the person will recognize faces correctly and
within the socially accepted time. With respect to the results
presented here, the inclusion of such clinically positive cases could
potentially lead to a decrease in observed differences in face
recognition performance between CP and control group. Thus,
our estimate of CP deficits has to be considered a conservative
estimate of CP deficits possibly underestimating the true
magnitude. Any a posteriori exclusion of clinically positive CPs
with normal face recognition skills in formal tests would only lead
to an increase in the significance of the reported group differences
in face recognition tests.
Cognitive HeterogeneityThe cognitive heterogeneity in congenital prosopagnosia (cf.
[24]) raises the question whether there are identifiable subgroups
of CP, comparable to those found in acquired prosopagnosia
[6]. In acquired prosopagnosia (AP) a mature, fully functional
face recognition system is disturbed by an external event,
unrelated to the system’s past performance. Irrespective of the
exact processes underlying functional specialization of cortical
regions in the neural system of face recognition, this speciali-
zation presumably leads to an alignment between cortical
location and functional process [67–70]. Damage inflicted to a
specific region can therefore lead to restricted deficits, con-
ditional on the interconnectedness and interdependence of the
distributed processing [71]. However, in contrast to the acquired
form, individuals with congenital prosopagnosia never evolve a
functional face recognition system in the first place and their
deficit has to be interpreted as an endpoint of a developmental
trajectory [72], a mature but dysfunctional system. Thus, even if
there is a single initial cause to CP, it would not be surprising to
see a stronger heterogeneity in CP compared to a homogeneous
group of AP participants, i.e. with the same lesions, based
solely on differences in development, e.g. learning of different
evasive and compensatory strategies. Since the strategies
adopted vary greatly between individual CPs [16,20], this
complicates a categorization of the intrinsic heterogeneity in CP
based on a small number of behavioral tests. Thus, in future
studies it seems essential to integrate behavioural as well as
neurophysiological/-anatomical variability with computational
models of CP based on a general theory of visual information
processing.
Face Processing in CP
PLoS ONE | www.plosone.org 8 July 2010 | Volume 5 | Issue 7 | e11482

Materials and Methods
The experiments were conducted at different times and
locations. Experiments with CP participants took place at the
Institut fur Humangenetik, Westfalische-Wilhelms-Universitat,
Munster, experiments with control participants took place at the
Max Planck Institute for Mathematics in the Sciences, Leipzig.
Experiments 1–4 were conducted at the end of 2006, experiments
5 and 6 a year later at the end of 2007.
ParticipantsIn total we tested 16 CP participants and 36 age matched
controls. In each experiment for each CP participant we included
up to two age and mostly gender matched control participants.
Participation of controls varied across experiments (see below)
leading to a total number of control participants in excess of 32.
Participants age (at first testing, i.e. end of 2006) varied between
20 and 68 years for the CPs (mean: 37:9, sd: 17:5) and for the
controls (mean: 36:6, sd: 15:8). All participants were of caucasian
origin.
Except for one CP participant (MB) all CP and control
participants reported normal or corrected to normal vision. MB
has a strabismus convergens, on which she was operated on three
times during childhood. However, she still reported on perceiving
diplopic images and difficulties with stereopsy.
Ethics Statement. All CP and control participants provided
written informed consent before participation. The study was
approved by the ethical committee of the University of Muenster,
Germany, protocol No 3XKenn2.
Participants with Congenital Prosopagnosia. All of the
16 CP participants were diagnosed using a semi-structured
interview (see below), which includes questions on everyday-
problems with face and object recognition, mental imagery and
avoidance strategies.
CP participants - and accordingly control participants - fall into
two different age groups: one consisting of 8 younger CP
participants, most of them students, aged between 21 and 26
years, the other consisting of 8 older CP participants, aged
between 41 and 68.
N The younger group (born after 1980) consisted of five students
of medicine, which were detected by a screening study which
was conducted by means of a questionnaire (see [19] for a
detailed description). Students who reported suspicious
behavioral deficits were then invited for the semi-structured
interview. In addition, three of the younger participants
established contact after having been informed about prosop-
agnosia via public media or personal contact.
N The older group (age 40 or older) is composed only of people
who initiated contact themselves.
See Table 1 for a short overview of CP participants.
Three CP participants (JM, HW, LL) only participated in
experiments 1–4. For one CP participant (MB) online estimation
of the 80%-correct presentation time in experiment 1 failed due to
technical problems. We therefore excluded MB and both matched
controls from all analysis of experiments 1 and 3 which involved
limited presentation times.
Most CP participants had intact basic-level object recognition
abilities as assessed by a total of seven subtests chosen from the
Birmingham Object Recognition Battery [48] - Tests 6,7,10 easy
and hard, and 13 - and the Visual Object and Space Perception
Battery [49] - Tests 2,4, and 6. Ten CP participants scored in the
normal range in all tests. Only one (HW) had difficulties across
several object recognition tests (BORB 10A hard, score of 20compared to 27½mean� and 2:2½sd�, with n0~13; VOSP 2, score
of 16 compared to 23:1½mean� and 4:1½sd�; VOSP 4, score of 16compared to 9:8½mean� and 2:4½sd�; both VOSP with n0~150).
Three older participants (HE, SE, HB) had difficulties in
recognizing object silhouettes in VOSP 2 (scores of 16, 16, and
17 compared to 22:2½mean� and 4:0½sd�). One older participant
(HG) had difficulties with VOSP 4 (score of 16 compared to
10:8½mean� and 2:5½sd�). Two (EB, HB) had difficulties with the
easy but not the hard condition of BORB subtest 10 (BORB 10B
easy, scores of 28 and 27 compared to 30:5½mean� and 1:4½sd�,with n0~13). Thus, in all cases including performance was always
very close to or at the cutoff level. Furthermore the number of
positive findings only deviates slightly from expected values based
on percentile cutoff values.
Control Participants. In experiments 1–4 a total of 32
control participants (two per CP participant) were selected to
match the age of CP participants and also gender in most cases. In
experiments 5 and 6 a total of 24 age and mostly gender matched
controls participated. Younger control participants were mostly
students, similar to CP participants, while the older control
participants showed a similar variety in profession as the older CP
participants. In total we tested and analyzed the data of 36
controls. 20 controls are included in all experiments, 12 only in
experiments 1–4, four only in experiments 5 and 6.
Diagnostic Interview. Diagnosis of prosopagnosia was made
by a semi- structured interview of about 90 minutes [16–20,50]. In
order to be diagnosed as having CP participants had to meet the
following criteria:
N Uncertainty in face recognition: Not recognizing familiar
people unexpectedly or in crowed places, confusing unknown
persons with familiar persons. Only anecdotal mentioning of
not recognizing people is not taken as a positive criterion.
N Prolonged recognition time for faces (in terms of a socially
accepted span of time).
Table 1. Description of CP participants.
Initials Contact Age Gender
HE Self-reported 68 F
SE Self-reported 64 F
EB Self-reported 57 F
HG Self-reported 53 M
HB Self-reported 50 M
MB Self-reported 48 F
MR Self-reported 48 F
RK Self-reported 41 M
JM Self-reported 26 M
JF Screening 23 M
HS Screening 22 M
VK Screening 21 M
FP Self-reported 21 F
MG Screening 21 F
HW Self-reported 21 F
LL Screening 21 F
Age is with respect to November 2006 (first series of experiments).doi:10.1371/journal.pone.0011482.t001
Face Processing in CP
PLoS ONE | www.plosone.org 9 July 2010 | Volume 5 | Issue 7 | e11482

N Development of compensatory strategies as sign of a long-
standing frequent problem. Strategies can include either
adaptive behaviour (identification by voice, gait, clothing …)
or avoidance behaviour (cancel meetings, looking absent-
minded,…).
N Surprising anecdotal stories (problems in following actors in a
movie)
In addition, a family history of at least one affected first degree
relative renders an hereditary origin of the difficulties more likely,
thereby increasing the probability of congenital prosopagnosia -
including hereditary prosopagnosia.
Experiments 1 to 4Stimuli. The face stimuli were obtained from the publicly
available Face Database of the MPI for Biological Cybernetics (see
[42] for details on the database creation) containing snapshots and
3D-head models obtained by 3D-scans of caucasian people, living
in Tubingen, Germany. The database contains snapshots of 3D-
scans of 200 heads (without hair), taken at seven rotations (frontal
view and 3 rotations in each direction of 30u, 60u and 90u).Snapshots were used as distractor stimuli. Target face stimuli were
generated using the four individual full head models in the Face
Database (two male and two female heads). Snapshots of the full
head models under the same rotations (30u, 60u and 90u) were
generated using Blender free open source 3D content creation
suite (http://www.blender.org, open-source). All snapshots are 8-
bit color images of 2566256 pixels and were presented as colored
images in the experiments.
The shoe stimuli were obtained as snapshots (2566177 pixels, 8-
bit color) of different sneakers obtained from http://nikeid.nike.
com. A total of 53 distractor shoes and 4 target shoes were used, all
under the available three different rotation conditions (oblique,
side and top view) and presented in color.
A randomly chosen subset of 16 distractor objects was used
during the learning blocks, and the remaining distractor items
were used in the testing blocks. Each distractor stimulus was
exclusively used either during learning or testing but could appear
multiple times throughout the experiments. This split ensured that
participants learned to recognize targets and not distractors. All
matched controls had exactly the same experimental setup (choice
of distractors objects during learning and testing as well as
presentation order) as their respective CP participants.
Design. Experiments 1 to 4 all started with a simultaneous
presentation of the same 4 target images in frontal view (faces) or
oblique view (shoes) for unlimited duration, which was then
followed by a feedback training round. Each training round
consisted of 16 trials with frontal/oblique view presentation of
images, 8 of which showed the targets (2 times each) and 8 showed
a distractor (1 time each). The participant had to respond by
clicking the left mouse button for a target and the right mouse
button for a distractor (two alternative forced choice - 2-AFC). In
the training feedback (correct/false) was given after the response.
Presentation and feedback training were repeated until
participants made at most a single error during the 16 training
trials. Selection of distractor stimuli (8 out of the preselected 16)
and the presentation order of target and distractor images was
randomized prior to each training block, but exactly the same for a
CP participant and his/her two matched controls.
After successful completion of the training the test started (see
Figure 1 A for a schematic depiction of the experimental design).
In the midst of each test another round of presentation and
feedback training was administered. As during training, partici-
pants were asked whether the stimulus presented was a target (left
mouse button) or a distractor (right mouse button).
The first experiments (1 and 2) for each stimulus class (faces or
shoes) tested recognition of the frontal view of target images under
varying presentation times (PT) in a two alternative forced choice
task. The presentation times were chosen according to the
accelerated stochastic approximation method [51,52] with a
threshold at 80% correct, see below. The algorithm increased
presentation times, whenever a mistake was made and decreased
presentation time after a correct answer. Trials were grouped into
blocks of 8 such that in each block every target appeared exactly
once. Presentation order of target and distractor image was
randomized, but equal for a CP participant and his/her two
matched controls.
In experiments 3 and 4 for each stimulus class, we tested
recognition of targets in the frontal view and under rotations in a
two alternative forced choice task (for faces: 3 in-depth rotations of
30u, 60u and 90uin each direction; for shoes:side view and top
view). For faces the test contained two testing blocks of 56 images
each (7 rotation conditions with 4 targets and 4 distractors each);
for shoes it contained four testing blocks of 24 images each (3
rotation conditions with 4 targets and 4 distractors each).
Presentation order of target and distractor stimuli, and rotation
angles was randomized in each block, but equal for a CP
participant and his/her two matched controls. The presentation
time was set to a fixed value chosen for each CP participant
individually as an estimate of the time that he/she would need to
give correct answers 90% of the time if tested with frontal face
images (see below for details of the estimation process). This
presentation time was also used for both matched controls of the
CP participant.
Experiments 5 and 6Stimuli. All stimuli were generated with the assistance of the
Recognition and Categorization Group in the Department
Bulthoff at the Max-Planck-Institute for Biological Cybernetics,
Tubingen, Germany. Face images were obtained by rendering
from a total of 96 full 3D head models obtained by 3D-scans of
caucasian people, living in Tubingen, Germany. The acquisition
of 3D-scans and the generation of the head models is described in
[42].
For each test we selected 48 individuals, 24 male and 24 female
faces. For each individual face we rendered 5 face images, differing
in rotation and illumination. One reference image (target stimulus)
was taken in frontal view with ambient illumination (rgb = 0.5 0.5
0.5) and an additional white illumination (rgb = 0.7, 0.7, 0.7) from
a direction in front, above and to the right of the face (horizontal
rotation = 50u, vertical rotation = 50u). Four test images were taken
under slight horizontal and vertical rotations of (+5,+5) degrees.
In all test images the position of the white illumination source was
changed to come from in front, below and to the left of the face
(horizontal rotation = {50u, vertical rotation = {20u).All reference images were standardized to the same rectangular
area (i.e. width6height) of the facial image at roughly 25000
square pixels. Resulting images had widths between 122 and 138,
and heights between 181 and 204 pixels. Size variations (standard
deviation divided by mean) in width and height were slightly
smaller compared to human anthropometric measurements [53].
Resulting images were placed upon a black background such that
each face was in the center of a 1406210 pixels image.
Test images were not standardized as the standardization in
reference images already discounted all size differences with
respect to a scaling of the whole image.
Face Processing in CP
PLoS ONE | www.plosone.org 10 July 2010 | Volume 5 | Issue 7 | e11482

Experimental Design. In experiment 5, a target stimulus
was first presented for a short duration of 50, 150, 450 or 750 ms,
and after a blank of 500 ms, the target stimulus had to be
recognized among a total of four face stimuli (see Figure 3 A). The
response was indicated by pressing one of the four arrow keys
corresponding to the position of the stimuli (left, right, up or
down). During the recognition the four face stimuli were presented
until a response was made. The position of the target stimulus in
the test display was randomized. All combinations of 48 target
stimuli and four presentation times were tested exactly once per
participant, yielding a total of 192 trials. As each stimulus was used
both as target in four trials and as distractor in 12 trials, the order
of the trials in which each stimulus was presented as target or as
distractor was counterbalanced across presentation times to
exclude influences of familiarity on the estimation of presen-
tation time effects.
In experiment 6, four target stimuli were initially learned over
three rounds of unlimited presentation and subsequent feedback
training, and afterwards the influence of variable presentation time
on recognition performance was tested (see Figure 3 D).
In each training trial either one of the four target stimuli or one
of four different distractors was shown and participants had to
indicate, whether the presented stimulus was one of the four target
stimuli. Each training round included 8 training trials, where each
target and each distractor were presented exactly once in a
randomized order.
In each test trial participants had to indicate whether the
presented stimulus was one of the four target stimuli learned in the
previous training. Each test round consisted of 32 test trials: 16
target presentations and 16 distractor presentations. In every
round, each target was presented once for each duration of either
50, 150, 450, or 750 ms. The four distractor stimuli used in the
training and an additional four new distractor stimuli were
displayed two times each. In these 16 distractor presentations,
each of the four presentation durations was chosen four times, but
no distractor stimulus was shown at the same duration twice.
The full cycle of presentation, feedback training and test was
repeated 12 times such that each of the 48 face stimuli was exactly
once among the target stimuli, once among the distractors already
present during the training and once among the additional
distractors introduced in the test round. Presentation order was
counterbalanced across stimuli, groups and presentation time.
In both tests - but not in the feedback training in experiment 6 -
test and reference images differed in size, rotation and illumination
(see above).
The presentation times of 50, 150, 450 or 750 ms were chosen
to separate between different types and numbers of saccadic eye-
movements (express-saccades, saccades). As the experiment should
be applicable to participants of different age, we relied on studies
explicitly addressing age differences in the times needed to
perform saccadic eye-movements [54]. However, it is possible
that true saccade times found in face processing deviate [28].
PresentationIn experiments 1–4 images were displayed on either an
IIYAMA Vision Master Pro514 monitor (229, at 200 Hz) or an
IIYAMA Vision Master 506 (219 at 170 Hz) (random assignment,
identical for each CP and his/her matched controls) both running
at a 8006600 resolution with a screen area of approximately
400 mm6300 mm. Participants were initially seated at a distance
of 1m and stimuli covered on average 140 pixels6210 pixels, i.e.
70 mm6110 mm, equal to a visual angle of 4.0uhorizontally and
6.3uvertically at a distance of 1 m.
In experiments 5 and 6 presentation was always on the IIYAMA
Vision Master Pro514 monitor (229, at 200 Hz) used previously
with a resolution of 8006600 and images subtended 130
pixels6190 pixels, i.e. 65 mm685 mm or 3.5u64.3uat the initial
seating distance of 1 m.
All experiments were run using the open-source flashdot
experimental psychophysics presentation software ([55], available
at http://www.flashdot.info), which allows a high temporal
precision of the presentation. Presentation duration was actually
measured in frames, durations are reported in ms for convenience
and to enable comparisons between results obtained at difference
monitors with different frame rates. To convert between frames
and ms, we simply multiplied the number of frames by the inverse
frame rate, which can deviate from the actual presentation times
for very small durations [56].
Statistical AnalysisIf not noted otherwise, all data analysis and statistical testing was
done in the statistical programming language R [57].Estimation of Presentation Times. In experiments 1 and
2, accelerated stochastic approximation [51] was used as an online
estimation method to obtain a presentation time at which
participants would make correct responses in 80% of the trials
(PT80%). A fraction of 80% correct answers was chosen to avoid
ceiling and/or bottom effects and achieve efficient sampling
[58,59]. Given a sequence of at least two answers (Y1, . . . ,Yn),where Yk is 1 for a correct answer and 0 for an incorrect answer
and an initial presentation time (PT0), presentation times in the
n{th trial (PTn) were adjusted according to
PTnz1~PTn{500 ms
2z# Yk=Yk{1f gkvn
(Yn{:8), ð1Þ
where the denominator contains a counter of the number of shifts
in the answer from correct to incorrect or vice-versa.
As the participants completed the tasks on two different
monitors with frame rates of 170 Hz and 200 Hz respectively
(see below) the actual presentation time sequences had step sizes of
5 ms and 1=170&6 ms. The mean of the presentation times of the
last 16 trials was taken as an estimate of PT80%.
The data obtained in experiments 1 (or 2 resp.), i.e. all pairs
(Yk,PTk)Nk~1, was used to estimate a presentation time for each
participant at which he/she would achieve 90% correct answers
(PT90%). In a pilot study using an 80% correct time we observed
bottom effects in performance on rotated images, and thus
increased the threshold to 90%.
The software package psignifit (http://www.bootstrap-software.
org/psignifit/) was used to fit a modified logistic regression model
as an estimate of participants psychometric function relating the
response to the presentation time [58]:
Pr(Y~1DPT ; a,b,l,c)~cz(1{c{l)1
1zexp {(PT{a)
b
� � : ð2Þ
Here, we used as guess rate c~0:5, an upper bound on the lapse
rate l [ ½0,0:05� and restricted the shape of the logistic regression
function by requiring a positive intercept a [ ½0,500� and slope
b [ ½0,500�. The PT90% obtained by inverting the fitted logistic
regression model in equation (2) to the data gathered in
experiment 1 (or 2 resp.) was then used as a presentation time
in experiment 3 (or 4 resp.). Each CP participant as well as the two
matched controls were shown images at the PT90% estimated for
the CP participant.
Face Processing in CP
PLoS ONE | www.plosone.org 11 July 2010 | Volume 5 | Issue 7 | e11482
In an a-posteriori check, the estimates obtained for the 90%-
correct presentation time appeared appropriate, as for presenta-
tions of frontal images using these PT90% estimates the median CP
recognition of frontal views (93% for faces, 95% for shoes) was
only slightly above the target rate (see Figure 1 E).
Generalized Linear Mixed ModelsTo assess differences in the influence of experimental variables
between the control and the CP group, generalized linear mixed
models (GLMMs) were used (see e.g. [47] for an introduction to
GLMMs). In this section, we only provide a short outline of the
statistical methods used. A more detailed explanation is given in
Appendix S1.
First, a nullmodel was fitted that always included fixed effects to
incorporate influences of age and all experimental variables (e.g.
presentation time) as well as random effects allowing for individual
variation in the mean and also in the influence of experimental
variables. Based on this nullmodel, alternative, nested models were
constructed by subsequently adding group differences in the
influence of fixed effects, i.e. firstly a mean difference between the
groups (main effect), secondly an interaction of group and
experimental variables (first-order effects), (see below for details).
Comparison of nested models was based on differences in the log-
likelihood of the models, i.e. a likelihood ratio test (LR-test).
In addition to model based comparisons, we calculated residuals
for each participant using a modified cross-validation approach.
The obtained residuals measure the deviation of CP participants
performance from the expected performance of a hypothetical
control participant with identical individual characteristics (e.g.
age). First, parameters of the nullmodel were estimated using only
control participants’ observations, and the resulting parameter
estimates were used to calculate residuals for the observations of
CP participants. Second, for control participants, an approach
similar to a leave-one out cross-validation was applied: For each
control participant, parameters of the nullmodel were estimated
using the observations of all control participants except the latter
one, and the estimates were then used to calculate residuals for this
control participant. Residuals were averaged across observations
into a single number for each individual participant. For group
comparisons of these average residuals the non-parametric
Wilcoxon rank sum test, also referred to as Mann-Whitney test,
was used since CP participants’ residuals were in most cases not
Gaussian-distributed.
Fitting of generalized linear mixed models (GLMMs) was done
using the R packages lme4 [60] and MCMCglmm [61]. The
algorithms used in lme4 as well as the model based comparisons
conducted here, are described by the main contributor to the lme4
package in more detail in [62]. To test for significant differences
likelihood ratio tests were performed where we assumed a x2
distribution of the test statistics with degrees of freedom equal to
the difference in the number of parameters. In testing significance
of fixed effects in mixed models, the x2 approximation tends to
produce to p-values that are too small [62]. Hence, if the selected
model included interaction effects, the model was again fit with
MCMCglmm to obtain Bayesian maximum posterior estimates
(bb) )and highest posterior density intervals with 95% support
(HPDI95%) for parameter estimates of interaction effects [63]. As
prior distributions for the Bayesian model fitting we used a
multivariate normal distribution with zero mean and a diagonal
covariance matrix with large variances (s~1010) for fixed effects
and an inverse Wishart distribution with degrees of freedom equal
to one and the inverse scale equal to the unconditional variance of
the response variable.
To analyze group differences in reaction times in experiments
1 and 2, a nullmodel including age and training block number as
fixed effects was fitted with individual random effects on mean
reaction time as well as on the influence of block number. The
inverse of the reaction time was taken as the dependent varia-
ble to improve model fit (see below). Comparison of group
differences in the presentation time needed for 80% correct
recognition (PT80%) was based on a linear model. The nullmodel
only included age as a fixed effect and PT80% was log-trans-
formed. To assess, whether for faces the group differences found
in reaction times can be explained by group differences in
presentation times, again nullmodels were constructed for both
dependent variables but this time without a prior transformation,
and the respective residuals, as well as the difference in residuals
was calculated.
Differences in the influence of rotation and presentation time on
control and CP participants’ performance in experiments 3 and 4
were tested based on binomial GLMM nullmodels with logit-link
including with age, rotation angle (nominal scale according to the
absolute values, i.e. 0, 30u, 60u, and 90u) and presentation time
(log-transformed and mean-centered) as fixed effects and partic-
ipant identity as random effect. Interactions were tested both for
rotation and presentation time combined (full interaction model),
as well as specifically for group differences in the influence of
presentation time (PT interaction model) to account for a priori
known differences in the experimental setup (see above).
Analysis of recognition rates in experiments 5 and 6 was based
on a binomial GLMM nullmodel with logit-link including age and
the logarithm of presentation time (during training or during
recognition resp.) as fixed effects and participants identity as
random effect. Reaction times were transformed by taking the
inverse (see below) and then analysed using a LMM nullmodel
with the same fixed and random effects.
Analysis of Reaction TimesFeedback training was the same in experiments 1 and 3 (faces)
as well as in experiments 2 and 4 (shoes). To increase the sample
size, observations were thus pooled across experiments into two
data sets (faces and shoes) and the analysis of reaction times during
feedback training was then performed conjointly. The results of
this conjoint analysis are reported below as results for experiment
1 (faces) and 2 (shoes). As some participants had initial difficulties
in understanding the task, we excluded reaction times measured
during the very first feedback training from the analysis in order to
preclude an influence of individual difficulties in getting accus-
tomed to the experimental setup. In addition, we restricted
analysis to trials where a correct answer was given (5349 out of
5424 observations). A fixed cutpoint for observations of reaction
time was used dismissing observations with reaction times above
2000 ms and below 500 ms to reduce the number of outliers [64].
A total of 5080 observations of reaction time was analyzed, 2908
observations for face stimuli and 2172 observations for shoe
stimuli.
In experiment 5, only reaction times between 500 ms and
8000 ms (corresponding to the 0.01% and 95% quantiles) were
included in the analysis.
In experiment 6, only reaction times between 500 ms and
4000 ms (corresponding to the 0.05% and 96% quantiles) were
included in the analysis. Note that participants could respond only
after the end of the stimulus presentation.
Prior to any analysis using model based comparisons, reaction
times were transformed by taking the inverse to improve
applicability of linear models [64].
Face Processing in CP
PLoS ONE | www.plosone.org 12 July 2010 | Volume 5 | Issue 7 | e11482
Supporting Information
Appendix S1 Detailed description of the statistical methods
used: Generalized Linear Mixed Models and model based
normalization of test scores.
Found at: doi:10.1371/journal.pone.0011482.s001 (0.14 MB
PDF)
Acknowledgments
The authors thank all control and PA subjects for their participation,
Isabelle Bulthoff (MPI Biol. Cyb.), Tobias Wolf (MPI Biol. Cyb.), Brigitte
Welling (Universitat Munster), Bernhard Englitz (MPI MiS) for interesting
discussions and technical support.
Author Contributions
Conceived and designed the experiments: RS. Performed the experiments:
RS JJ TE IK. Analyzed the data: RS. Contributed reagents/materials/
analysis tools: RS TE IK. Wrote the paper: RS JJ TE IK.
References
1. Bodamer J (1947) Die prosop-agnosie. Arch Psychiatr Nervenkr 179: 6–53.
2. Quaglino A, Borelli GB, Sala SD, Young AW (2003) Quaglino’s 1867 case of
prosopagnosia. Cortex 39: 533–40.
3. Lissauer H (1890) Ein fall von seelenblindheit nebst einem beitrag zur theorie
derselben. Arch Psychiatr Nervenkr 21: 22–70.
4. Wilbrand H (1892) Ein fall von seelenblindheit und hemianopsie mitsectionsbefund. Dtsch Z Nervenheilk 2: 361–387.
5. Hecaen H, Angelergues R (1962) Agnosia for faces (prosopagnosia). Arch Neurol7: 92–100.
6. Damasio A, Tranel D, Damasio H (1990) Face agnosia and the neural substrates
of memory. Annu Rev Neurosci 13: 89–109.
7. Renzi ED, Faglioni P, Grossi D, Nichelli P (1991) Apperceptive and associative
forms of prosopagnosia. Cortex 27: 213–21.
8. Renzi ED, Perani D, Carlesimo G, Silveri M, Fazio F (1994) Prosopagnosia can
be associated with damage confined to the right-hemisphere - an mri and pet
study and a review of the literature. Neuropsychologia 32: 893–902.
9. Barton JJS, Cherkasova M, O’Connor M (2001) Covert recognition in acquired
and developmental prosopagnosia. Neurology 57: 1161–1168.
10. McConachie HR (1976) Developmental prosopagnosia. a single case report.
Cortex 12: 76–82.
11. Ariel R, Sadeh M (1996) Congenital visual agnosia and prosopagnosia in a child:a case report. Cortex 32: 221–40.
12. Kress T, Daum I (2003) Developmental prosopagnosia: a review. Behaviouralneurology 14: 109–21.
13. Hasson U, Avidan G, Deouell LY, Bentin S, Malach R (2003) Face-selective
activation in a congenital prosopagnosic subject. J Cognitive Neurosci 15:419–31.
14. Behrmann M, Avidan G (2005) Congenital prosopagnosia: face-blind frombirth. Trends in Cognitive Sciences 9: 180–7.
15. Behrmann M, Avidan G, Marotta J, Kimchi R (2005) Detailed exploration of
face-related processing in congenital prosopagnosia: 1. behavioral findings.J Cognitive Neurosci 17: 1130–1149.
16. Kennerknecht I, Gruter T, Welling B, Wentzek S, Horst J, et al. (2006) Firstreport of prevalence of non-syndromic hereditary prosopagnosia (hpa). Am J Med
Genet 140A: 1617–1622.
17. Gruter M, Gruter T, Bell V, Horst J, Laskowski W, et al. (2007) Hereditaryprosopagnosia: the first case series. Cortex 43: 734–749.
18. Kennerknecht I, Plumpe N, Edwards S, Raman R (2007) Hereditaryprosopagnosia (hpa): the first report outside the caucasian population. J Hum
Genet 52: 230–6.
19. Kennerknecht I, Ho NY, Wong VCN (2008) Prevalence of hereditaryprosopagnosia (hpa) in hong kong chinese population. Am J Med Genet
146A: 2863–70.
20. Kennerknecht I, Pluempe N, Welling B (2008) Congenital prosopagnosia - a
common hereditary cognitive dysfunction in humans. Front Biosci 13:
3150–3158.
21. Duchaine BC (2006) Prosopagnosia as an impairment to face-specific
mechanisms: Elimination of the alternative hypotheses in a developmental case.Cognitive Neuropsychology 23: 714–747.
22. Lange J, Lussanet MD, Kuhlmann S, Zimmermann A, Lappe M, et al. (2009)
Impairments of biological motion perception in congenital prosopagnosia. PLoSONE 4: e7414.
23. Grueter T, Grueter M, Bell V, Carbon CC (2009) Visual mental imagery incongenital prosopagnosia. Neurosci Lett 453: 135–140.
24. Schmalzl L, Palermo R, Coltheart M (2008) Cognitive heterogeneity in
genetically based prosopagnosia: A family study. J Neuropsychol 2: 99–117.
25. Farah MJ, Wilson KD, Drain M, Tanaka JN (1998) What is ‘‘special’’ about face
perception? Psychol Rev 105: 482–98.
26. Bruce V, Young AW (1986) Understanding face recognition. Brit J Psychol 77(Pt
3): 305–27.
27. Henderson JM, Williams CC, Falk RJ (2005) Eye movements are functionalduring face learning. Memory & cognition 33: 98–106.
28. Bindemann M, Burton AM, Scheepers C (2008) How are frontal, mid-profile,and profile faces processed? evidence from eye movements. Perception 37: 33.
29. Ullman S (1997) High-level vision: Object recognition and visual cognitionaJZ.
MIT: 432.
30. Blais C, Jack RE, Scheepers C, Fiset D, Caldara R (2008) Culture shapes howwe look at faces. PLoS ONE 3: e3022.
31. Shepherd J, Deregowski J, Ellis H (1974) A cross-cultural study of recognitionmemory for faces. International Journal of Psychology 9: 205–212.
32. Tanaka JW (2001) The entry point of face recognition: evidence for face
expertise. Journal of experimental psychology General 130: 534–43.
33. Curby KM, Gauthier I (2009) The temporal advantage for individuating objects
of expertise: Perceptual expertise is an early riser. JOV 9: 1–13.
34. Barton JJS, Zhao J, Keenan JP (2003) Perception of global facial geometry in the
inversion effect and prosopagnosia. Neuropsychologia 41: 1703–11.
35. Schwarzer G, Huber S, Gruter M, Gruter T, Gross C, et al. (2007) Gazebehaviour in hereditary prosopagnosia. Psychological Research 71: 583–90.
36. Schmalzl L, Palermo R, Green M, Brunsdon R, Coltheart M (2008) Training offamiliar face recognition and visual scan paths for faces in a child with congenital
prosopagnosia. Cognitive Neuropsychology 25: 704–729.
37. Avidan G, Hasson U, Malach R, Behrmann M (2005) Detailed exploration offace-related processing in congenital prosopagnosia: 2. functional neuroimaging
findings. J Cognitive Neurosci 17: 1150–1167.
38. Duchaine BC, Nakayama K (2004) Developmental prosopagnosia and the
benton facial recognition test. Neurology 62: 1219–20.
39. Diamond R, Carey S (1986) Why faces are and are not special: an effect ofexpertise. Journal of experimental psychology General 115: 107–17.
40. Gauthier I, Behrmann M, Tarr MJ (1999) Can face recognition really bedissociated from object recognition? J Cognitive Neurosci 11: 349–370.
41. Palmeri T, Wong A, Gauthier I (2004) Computational approaches to the
development of perceptual expertise. Trends in Cognitive Sciences 8: 378–386.
42. Troje NF, Bulthoff HH (1996) Face recognition under varying poses: the role of
texture and shape. Vision Res 36: 1761–71.
43. Duchaine BC, Nakayama K (2006) The cambridge face memory test: results for
neurologically intact individuals and an investigation of its validity using inverted
face stimuli and prosopagnosic participants. Neuropsychologia 44: 576–85.
44. Grand RL, Cooper PA, Mondloch CJ, Lewis TL, Sagiv N, et al. (2006) What
aspects of face processing are impaired in developmental prosopagnosia? Brainand Cognition 61: 139–58.
45. Duchaine B (2000) Developmental prosopagnosia with normal configural
processing. Neuroreport 11: 79–83.
46. Faust C (1947) Partielle seelenblindheit nach occipitalhirnverletzung mit
besonderer beeintrachtigung des physiognomieerkennens. Der Nervenarzt. pp294–297.
47. Tuerlinckx F, Rijmen F, Verbeke G, Boeck PD (2006) Statistical inference in
generalized linear mixed models: a review. The British journal of mathematicaland statistical psychology 59: 225–55.
48. Riddoch JM, Humphreys GW (1993) Borb: Birmingham object recognitionbattery. NY: Psychology Press.
49. Warrington EK, James M (1991) The visual object and space perception battery.
London: Harcourt Assessment.
50. Gruter M (2004) Genetik der kongenitalen prosopagnosie [genetics of congenital
prosopagnosia]. Thesis (MD), Munster University.
51. Kesten H (1958) Accelerated stochastic-approximation. Ann Math Stat 29:
41–59.
52. Treutwein B (1995) Adaptive psychophysical procedures. Vision Res 35:2503–2522.
53. Farkas LG (1981) Anthropometry of the head and face in medicine. New York:Elsevier. 293 p.
54. Munoz D, Broughton J, Goldring J, Armstrong I (1998) Age-related
performance of human subjects on saccadic eye movement tasks. ExperimentalBrain Research 121: 391–400.
55. Elze T (2009) Flashdot - a platform independent experiment generator for visualpsychophysics. JOV 9: 58–58.
56. Elze T (2006) Shorter than you think? temporal precision of visual stimuli on
computer monitors: Pitfalls and systematic errors. Perception 35: 52–52.
57. R Development Core Team (2009) R: A Language and Environment for
Statistical Computing. R Foundation for Statistical Computing, Vienna, Austria.Available: http://www.R-project.org. ISBN 3-900051-07-0.
58. Wichmann FA, Hill N (2001) The psychometric function: I. fitting, sampling,
and goodness of fit. Percept Psychophys 63: 1293–1313.
Face Processing in CP
PLoS ONE | www.plosone.org 13 July 2010 | Volume 5 | Issue 7 | e11482

59. Wichmann FA, Hill N (2001) The psychometric function: Ii. bootstrap-based
confidence intervals and sampling. Percept Psychophys 63: 1314–1329.60. Bates D, Maechler M (2009) lme4: Linear mixed-effects models using S4 classes.
Available: http://CRAN.R-project.org/package = lme4. R package version
0.999375-31.61. Hadfield J (2009) MCMC methods for Multi-response Generalised Linear
Mixed Models: The MCMCglmm R Package. R package version 1.13.62. Faraway JJ (2006) Extending the linear model with r: generalized linear, mixed
effects and nonparametric regression models. FL: Chapman & Hall. 301 p.
63. Baayen R, Davidson D, Bates D (2008) Mixed-effects modeling with crossedrandom effects for subjects and items. Journal of Memory and Language.
64. Ratcliff R (1993) Methods for dealing with reaction time outliers. PsychologicalBulletin 114: 510–32.
65. Burton AM, Young AW, Bruce V, Johnston RA, Ellis AW (1991) Understandingcovert recognition. Cognition 39: 129–66.
66. Farah MJ, O’Reilly RC, Vecera SP (1993) Dissociated overt and covert
recognition as an emergent property of a lesioned neural network. Psychol Rev100: 571–88.
67. Kanwisher N, McDermott J, Chun MM (1997) The fusiform face area: a
module in human extrastriate cortex specialized for face perception. J Neurosci
17: 4302–11.
68. Gauthier I, Tarr MJ, Moylan J, Skudlarski P, Gore JC, et al. (2000) The fusiform
‘‘face area’’ is part of a network that processes faces at the individual level.
J Cognitive Neurosci 12: 495–504.
69. Hoffman E, Haxby JV (2000) Distinct representations of eye gaze and identity in
the distributed human neural system for face perception. Nat Neurosci 3: 80–84.
70. Haxby JV, Hoffman E, Gobbini M (2000) The distributed human neural system
for face perception. Trends in Cognitive Sciences 4: 223–233.
71. Fox CJ, Iaria G, Barton JJS (2008) Disconnection in prosopagnosia and face
processing. Cortex 44: 996–1009.
72. Thomas M, Karmiloff-Smith A (2003) Are developmental disorders like cases of
adult brain damage? implications from connectionist modelling. Behavioral and
Brain Sciences 25: 727–750.
Face Processing in CP
PLoS ONE | www.plosone.org 14 July 2010 | Volume 5 | Issue 7 | e11482