The Diversity Dividends of a Need‐blind and Color‐blind Affirmative Action Policy
35
Alon, Sigal. 2011. “The Diversity Dividends of a Need-blind and Color-blind Affirmative Action Policy” Social Science Research, 40(6):1494-1505. The Diversity Dividends of a Need ‐blind and Color‐blind Affirmative Action Policy Sigal Alon Tel-Aviv University Abstract In the early to mid-2000s, four flagship Israeli selective universities incorporated a need- blind and color-blind affirmative action policy into their admissions practices. The program, which gives an edge in admission to academically borderline applicants from disadvantaged backgrounds, emphasizes structural disadvantages, such as neighborhood socioeconomic status and high school rigor. The current investigation assesses whether this policy design increases geographic, economic and demographic diversity within the student population, and whether the diversification effects are uniform across departments of different levels of selectivity. The results, based on administrative data from the four universities, show that the policy infuses the entire student body, including the departments regarded as bastions of privilege, with under-represented and disadvantaged populations. The paper discusses the universal relevance of the findings to the ongoing discussion of admission regimes, diversity and equality of opportunity. May 2010 This research was supported by grants #200800120 and #200900169 from the Spencer Foundation. I thank Erez Garnai for research assistance. Please direct all correspondence to: Sigal Alon, Department of Sociology and Anthropology, Tel Aviv University, Ramat Aviv, Tel Aviv 69978, Israel. [[email protected]]
Transcript of The Diversity Dividends of a Need‐blind and Color‐blind Affirmative Action Policy
Alon, Sigal. 2011. “The Diversity Dividends of a Need-blind and Color-blind Affirmative Action Policy” Social Science Research, 40(6):1494-1505.
TheDiversityDividendsofaNeed‐blindandColor‐blindAffirmativeActionPolicy
Sigal Alon
Tel-Aviv University
Abstract
In the early to mid-2000s, four flagship Israeli selective universities incorporated a need-blind and color-blind affirmative action policy into their admissions practices. The program, which gives an edge in admission to academically borderline applicants from disadvantaged backgrounds, emphasizes structural disadvantages, such as neighborhood socioeconomic status and high school rigor. The current investigation assesses whether this policy design increases geographic, economic and demographic diversity within the student population, and whether the diversification effects are uniform across departments of different levels of selectivity. The results, based on administrative data from the four universities, show that the policy infuses the entire student body, including the departments regarded as bastions of privilege, with under-represented and disadvantaged populations. The paper discusses the universal relevance of the findings to the ongoing discussion of admission regimes, diversity and equality of opportunity.
May 2010
This research was supported by grants #200800120 and #200900169 from the Spencer Foundation. I thank Erez Garnai for research assistance. Please direct all correspondence to: Sigal Alon, Department of Sociology and Anthropology, Tel Aviv University, Ramat Aviv, Tel Aviv 69978, Israel. [[email protected]]

1
The continuing public discontent with race-conscious admissions in the U.S.--echoing
similar claims in India, South Africa and other countries--and the ban on such preferences
in several states have motivated the search for race-neutral admission alternatives. The
past decade brought the implementation of percent plans in Texas, California and Florida,
alongside growing interest in propositions based on class preference. However, the
shortcomings of these propounded alternatives (Bowen et al. 2005; Espenshade and
Radford 2009; Kane 1998; Kurlaender and Grodsky 2010; Tienda 2010; The U.S.
Commission on Civil Rights 2002), together with the rising class inequality in higher
education in recent decades (Alon 2009), suggest that the quest for innovative race-
neutral ways to increase demographic, socioeconomic and geographical diversity at
selective postsecondary institutions is not over.
The current study contributes to the rich scholarship on admission regimes and
preferences by evaluating a unique policy of class-based affirmative action used at four
flagship Israeli universities since the early to mid-2000s. The program promotes
preferential treatment of academically borderline applicants from disadvantaged
backgrounds. The most theoretically attractive aspect of this policy, however, is its
distinctive design: neither the students' financial constraints nor their national or ethnic
origins are considered. The emphasis, rather, is on students‘ structural disadvantages,
such as neighborhood socioeconomic status and high school rigor.
In Israel, like in other countries, socioeconomic and national/ethnic origin
inequalities are intertwined with spatial inequality. Consequently, this program serves as
a natural experiment that tests the extent of this entanglement. Specifically, it
demonstrates whether and how much a need-blind and color-blind affirmative action

2
policy can increase geographic, economic and demographic diversity within a student
population, and whether the diversification effects are uniform across different levels of
selectivity. The conclusions reached here about the effectiveness of an existing program
of class-based affirmative action, and the scope of its dividends in terms of diversity,
have far-reaching significance for the design of preferential treatment policies, especially
in light of the controversy concerning admission practices in the U.S. The universal
relevance of these findings is considered, while taking into account the differences
between the U.S. and Israeli postsecondary systems, as well as in the judicial standing of
preferential treatment policies.
DIVERSITY AND ALTERNATIVE ADMISSION MODELS Diversification of selective colleges and universities is necessary because they are
bastions of privilege (Alon 2009; Alon and Tienda 2007; Bowen and Bok 1998; Bowen
et al. 2005; Karabel 2005; The National Association for College Admission Counseling
(NACAC) 2006). U.S. Justice Powell, the pivotal opinion in the Bakke case, outlined the
educational foundation for the "diversity rationale." He argued that a diverse student body
broadens the range of viewpoints collectively held by those students and subsequently,
allows a university to provide an atmosphere that is "conducive to speculation,
experiment and creation--so essential to the quality of higher education." Since then,
ample research has demonstrated the educational benefits of campus diversity (see
Milem, Chang, and Antonio 2005). A rise in student body diversity is associated with
better learning experiences for all students and more opportunities for interaction with
students from different backgrounds. This increases students‘ tolerance to a wide range of

3
viewpoints and enhances their cognitive and identity development, preparing them for
better participation in a democratic society.
Justice Powell concluded that race-conscious admissions practices, when
narrowly tailored, serve a compelling educational interest. The U.S. Supreme Court
ruling in 2003, in the two cases regarding the University of Michigan, enacted this
rationale but made it clear that affirmative action should be a temporary remedy. The
practice of affirmative action in higher education admissions was thus deemed
permissible because it is believed to yield educational benefits by assembling a student
body with diverse talents and perspectives (Gurin et al. 2002). Yet, despite evidence of
the demographic diversification effects of race-conscious admissions on elite campuses
(Alon and Tienda 2005; 2007; Bowen and Bok 1998), there is growing opposition to
these practices. One of the main criticisms of the preferential treatment of racial and
ethnic minorities in admissions is that they promote applicants who are ―not deserving‖
because they take into account group identity rather than individual circumstances
(Clayton and Tangri 1989). The rising discontent has led to public referenda against the
use of race-sensitive admissions, such as Proposition 209 in California, Initiative I-200 in
Washington State, and, most recently, Proposal 2 in Michigan and Arizona Proposal 107.
It has also resulted in judicial bans on racial preferences in higher education admissions
in Texas and Florida, as well as numerous lawsuits against affirmative action practices in
higher education (Gratz v. Bollinger [2003] and Grutter v. Bollinger [2003] are the most
notable).
States that have banned race-conscious admission practices have since undertaken
alternative approaches. Texas, Florida and California, for example, have adopted various
4
forms of percent plans, programs that admit a fixed percentage of each school‘s class
rank distribution. The percent plans were designed to broaden college access across
economic, demographic, geographic and social groups in the absence of race-based
preferences. The cumulative evidence from Texas, California, and Florida indicates that a
uniform admission regime cannot increase ethno-racial diversity, even in predominantly
minority and residentially segregated states, without race-sensitive outreach to students at
high schools with low college-going rates and without generous financial support
(Grodsky and Kurlaender 2010; Tienda 2010; The U.S. Commission on Civil right,
2002).
Under the Texas H.B. 588 law, for example, applicants who graduate in the top
decile of their senior class are guaranteed admission to the public postsecondary school
of their choice regardless of their standardized test scores. Although the enactment of this
Plan in Texas was followed by an increase in racial and ethnic diversity in the state‘s
flagship institutions, Harris and Tienda (2010) show that the effect was the result of
changes in the size and composition of high school graduation cohorts rather than the
policy. Moreover, while the plan was successful in broadening geographic diversity
(Long Saenz and Tienda 2010), it failed to augment socioeconomic diversity (Koffman
and Tienda 2008; Tienda, Alon, and Niu 2010).1 Another problem with the uniform
admission regime that Texas put in place is that the University of Texas at Austin (UT-
Austin) became saturated with applicants eligible for automatic admission, thus limiting
1 Likewise, the ban on the consideration of race in admissions in California resulted in a decline in minority
enrollment at the most selective University of California campuses and at some of the more selective
California State University schools (Grodsky and Kurlaender 2010). The Talented 20 plan in Florida did
not produce racial and ethnic diversity at the two most selective campuses in the state‘s university system,
the University of Florida (UF) and Florida State University (FSU), since it benefitted white and Asian
students more than blacks and Hispanics (The U.S. Commission on Civil Rights 2002).
5
the university‘s ability to craft a class and achieve its institutional goals (Tienda 2010).2
Moreover, critics of the law, mostly suburban whites, continue to argue that the plan
gives unjust advantage to ―undeserving‖ applicants, claiming that low-ranked students
from academically rigorous high schools are often more qualified than those from low
performing high schools who are guaranteed college admission. Thus, despite the initial
appeal of a uniform admission regime, the Texas Top Ten Percent policy has become just
as controversial as the race-conscious system it replaced (Tienda 2010).
As the voices objecting to racial preferences became louder in recent years,
another race-neutral alternative to diversifying the collective college student body has
been proposed: preference plans based on socioeconomic class, either in addition to or as
an alternative to race-conscious admissions (Bowen et al. 2005; Kahlenberg 1996). Since
the poor of all races are seen as more deserving than blacks (Skrentny 1996) the concept
of class-based preference is compelling and enjoy strong public support (Carnevale and
Rose 2004). Moreover, giving an edge in admission to applicants from modest
backgrounds to the most selective institutions is expected to advance socioeconomic
diversity and social mobility. Nonetheless, class-based preferential policies remain
theoretical in the U.S. Since they have never been implemented (except for sporadic
experiments), the evidence on their consequences is based on statistical simulations rather
than real initiatives (Bowen et al. 2005; Espenshade and Radford 2009; Kane 1998). The
statistical simulations suggest that class-based preferences cannot replace race-sensitive
admissions because income and parental educational attainment are not good substitutes
for race (Bowen et al. 2005; Espenshade and Radford 2009; Kane 1998). In addition,
2 After the Top Ten Percent bill was revised by the Texas legislature in 2009, UT-Austin was required to
fill only 75 percent of its freshman slots with eligible seniors.
6
whereas policies based on racial preferences include the pool of socioeconomically
strong minorities, class-based policies are limited, it is argued, by the small pool of
qualified applicants from socioeconomically disadvantaged backgrounds.
Noteworthy is the fact that these simulations use a narrow definition of ―class,‖
based solely on parental education and income. Kahlenberg (1996), however, in his
thorough conceptualization of class preferences, maintains that the fairest and most apt
method for implementing class-based affirmative action should take into account
household net worth, the quality of secondary education, neighborhood influences, and
family structure; it is also the most reliable option because the abundance of information
required lowers the chances of abusing the system.3 Yet it seems that this
multidimensionality, however justified, complicates the implementation of class
preferences tremendously. Administering such a comprehensive plan demands the taxing
tasks of determining the relevant indicators, and then collecting, verifying and weighting
a wide array of sensitive information.4 Consequently, such a design for class-based
preferential policy may not prove practical.
The Israeli affirmative action plan at elite institutions, however, takes a different
route for determining class: it targets individuals from disadvantaged neighborhoods and
high schools. The theoretical foundation of this design is rooted in the long sociological
tradition that highlights the effects of social structures, such as neighborhoods and
schools, on youth achievements and educational outcomes (Ainsworth 2002; Brooks-
3 Kahlenberg (1996) suggests three methods for implementing class-based affirmative action. The simplest
is based on family income alone, while the second includes the three factors at the basis of the common
definition of socioeconomic status: parental income, education, and occupation. The third, and most
sophisticated, alternative takes into account individual as well as structural determinants of inequality. 4 This was demonstrated by the year-long experience of UCLA‘s School of Law with class-based
admission preferences in 1996 (Sander 1997).
7
Gunn et al. 1997; Massey and Denton 1993; McLeod and Edwards 1995; Pebley and
Sastry 2004; Sampson et al. 1997; Sampson et al. 1999; South and Crowder 1999; Wilson
1987, 1996). This neighborhood/school-based need-blind and color-blind affirmative
action policy capitalizes on the overlap between spatial boundaries and categorical
inequality. That is, bad neighborhoods and failing schools are populated with
categorically disadvantaged groups, such as racial and ethnic minorities, recent
immigrants, and the poor (Blau 1977; Massey 2007). Thus, to the extent that there is
sufficient overlap between systems of inequality, this scheme has the potential to yield
wide-ranging diversity dividends. The next section provides a description of the
guidelines and operation of the plan.
A NEED- AND COLOR-BLIND AFFIRMATIVE ACTION POLICY AT
SELECTIVE ISRAELI UNIVERSITIES
The higher education system in Israel is mostly public. As of 2007/08, there were 75
institutions in two tiers. In the first tier, there are six research universities. These
universities generally rely on a formulaic selection process for bachelor‘s admissions
based entirely on an academic index, calculated by taking a weighted mean of an
individual‘s matriculation diploma grades and psychometric test score (similar to an SAT
score). 5
The admission cutoff points are not institution-wide but rather major-specific;
the annual number of applicants to each program within each university; thus, within
each institution there are departments that vary in their selectivity level.
5 The second tier consists of degree-granting non-research academic colleges, and specialized institutions or
branches of foreign universities. At the academic colleges, admission is based solely on the matriculation
diploma, and is therefore substantially less selective than admission to the universities.
8
Even after the spectacular expansion of the Israeli higher education system in 1995,6
underprivileged populations remained under-represented in most of the first-tier
universities. In order to address the issues of diversity and access, the four most selective
and internationally recognized universities--Tel-Aviv University, The Hebrew
University, Ben-Gurion University and The Technion--incorporated a comprehensive and
standardized program of class-based affirmative action into their admission practices in
the early to mid-2000s.7
The implementation of the policy involves three stages. First, socioeconomic
eligibility is established outside of the universities. Applicants to all four universities are
given the option to complete and submit a standard application for preferential treatment
(substantiated with documents). The form is examined by a centralized nonprofit
organization that weights the information and creates an index of socioeconomic
disadvantage, and in turn, reports each applicant‘s score to the universities. The score
ranges from 0 to 85 and the threshold for socioeconomic eligibility used by the
universities is 30 points. Eligibility is determined according to three parameters, all of
which are based on an applicant‘s high school years: the structure of opportunity
(neighborhood and high school attended); family socioeconomic status (parental
education and family size); and individual and/or family adverse circumstances.8 The
weighting algorithm, not known to the applicants, makes it almost impossible to pass the
30-point threshold without a structural disadvantage since the two structural factors
6 The total number of undergraduate students tripled from 58,000 in 1990/91 to 168,000 in 2007/08, mostly
due to the addition of 2nd
tier instiutions. The number of undergraduate students attending the six
universities also rose (from 49,000 to 67,000, respectively). 7 The other two institutions, Bar-Ilan University and Haifa University, did not adopt such a program. Both
schools are less selective than the other four universities. 8 ‗Adverse circumstances‘ applies if the applicant is an orphan, an immigrant, divorced, a single parent,
suffers from a health disability, experienced the death of a sibling, or has divorced parents. The definition
also includes any applicant that has a parent with a disability or chronic illness.

9
account for about 50 percent of the eligibility score. Thus, applicants from a poor
community who attended the only high school in the vicinity automatically pass the
threshold for socioeconomic eligibility. Notably, information about an applicant‘s
national or ethnic origin and financial situation is neither requested nor considered.
In the second stage, academic eligibility is determined for those who passed the
threshold for socioeconomic eligibility. The eligible pool consists of applicants with
borderline achievements, those whose academic index score is around 0.5-1.0 standard
deviations below the major-specific cutoff point of admissibility. The third, and final,
stage is the admission decision. It is important to note here that the admission process is
non-mechanistic: that is, admission is not guaranteed to applicants that pass the first two
stages of eligibility and, as such, the departments have the discretion to pick and choose
their students.9 To prevent the saturation of certain majors with AA-eligible admits, the
cap on the share of affirmative action admits in each department is 5 percent of each
department‘s entering class.
The focus on structural inequality facilitates the administration and
implementation of the program because an applicant's place of residence and high school
are easily available on public record. It also expands the pool of qualified applicants,
which is one of the key problems cited in the literature of class-based affirmative action.
Moreover, by eliminating the need to verify an applicant‘s financial standing, the
program is less invasive of privacy, more reliable, and reduces the likelihood of
manipulation. Yet, feasibility is not a goal in itself; the main issue is whether targeting
9 All the applicants are grouped into one pool; the only difference is that eligible students may have a small
edge over non-eligible applicants who are similarly academically situated. Moreover, the exact
socioeconomic eligibility score of applicants above the 30-point threshold has no bearing on the admission
decision.

10
structural determinants of disadvantage yields geographic, demographic and economic
diversity dividends. The answer to this question will depend on the level of overlap
between spatial boundaries and categorical inequality in Israel.
THE OVERLAP BETWEEN SYSTEMS OF INEQUALITY IN ISRAEL
Due to the ethnic and socioeconomic diversity of its population, Israel provides the
perfect setting for studying categorical inequality. There are two main demographic
cleavages in Israel. The first is along national lines, between Israeli Jews and Arabs.
Seventy-six percent of Israel's population is comprised of Jews whereas 20 percent
consists of Arabs, the majority of which are Muslims. The second cleavage exists along
ethnic lines within the Jewish population, between Jews of European and American
origin and Jews of Asian and African origin. Immediately after the establishment of the
State of Israel in 1948, the Jewish population of the state grew several folds from
numerous and massive waves of immigration from both America and Europe (mostly
Holocaust survivors), and Asia and Africa. In recent years, the most significant
immigration wave totaled one million Jews, most of whom arrived from the Former
Soviet Union between 1989 and 1995.10
Yet as time lapses from the major immigration
waves of the 1940s and the 1950s, the share of first- and second-generation immigrants in
the population is declining, especially among the college age population.
Differences in national and ethnic origin shape Israel‘s stratification system.
There is a clear hierarchy, which has persisted over the past fifty years, in the levels of
educational attainment, occupational status, and earnings: Jews of European and
American descent are at the top of the socioeconomic ladder followed by Jews of Asian
10
This wave represents 15 percent of the population. There were also two small waves of immigrants from
Ethiopia during this period.

11
and African origin, while the Arab citizens of Israel occupy the bottom echelons of the
socioeconomic hierarchy (Cohen and Haberfeld 1998; Haberfeld and Cohen 1998, 2007;
Lewin-Epstein and Semyonov 1986, 1992; Semyonov and Tyree 1981; Yaish 2001). In
Israel, like in other countries, this categorical inequality is coupled with spatial
inequality, creating an important contour of stratification.
Israel‘s development towns are the paragon of the overlap of systems of
segregation (Alon 2004a; Spilerman and Habib 1976; Yiftachel 2000). The Israeli
government established these geographically peripheral towns in order to absorb, in
particular, the massive influx of Jews from Asia and Africa during the 1950s (Khazzoom
2005). In 2006, more than 90 percent of these localities ranked in the bottom half of the
localities' socioeconomic index (ICBS 2006), a clear indication that the disadvantaged
status of these towns has not changed much over the decades.11
Their unbalanced
demography has also persisted: more than half of the residents in these towns in 1995
were of Asian/African origin (first and second generation) as opposed to about a third in
the general population (ICBS 1995). Such coupling also occurs in the Arab localities,
deprived areas with high shares of poor, unskilled residents. In 2006, eighty percent of
the independent Arab villages and towns ranked in the bottom third of the socioeconomic
index (ICBS 2006). Moreover, most of the Arab population lives in the geographical
periphery (about half resides in the northern part of Israel), far from the main
metropolitan areas of core economic activity. The spatial segregation of recent
immigrants, who are mostly from the Former Soviet Union, is less pronounced because
11
The index ranges from 1 to 10. Localities are classified according to the socioeconomic level of the
population, which is determined by the financial resources of the residents, housing, standard of living,
schooling and education, employment profile, various types of socio-economic distress, and demographic
characteristics.
12
they, unlike the immigrants before them, were free to choose where to live. In fact, as of
1995, there is an overrepresentation of recent immigrants in strong localities (ICBS
1995). Nevertheless, these new immigrants may still benefit from the affirmative action
plan since it is likely that most do not reside in the affluent parts of these localities, and
because recent immigration status is also considered an indicator of socioeconomic
eligibility.
The implications of the spatial stratification of Israel for its postsecondary
education system are blatant: in 2006, the share of university students from affluent
localities (ranked in the top third of the socioeconomic index) was about 28 percent, but
only 6 percent of students were from localities in the bottom third (ICBS 2006).
Consequently, a policy that spotlights spatial and school inequality should, theoretically,
stretch the diversity dividends to economic status and national and ethnic origin. Thus,
Arabs, Jews of Asian or African origin, and the poor are likely overrepresented in the
affirmative action-eligible pool of students compared to the regular pool. Recent
immigrants may also be overrepresented due to their incomplete economic and social
assimilation in Israel. This hypothesis, however, demands empirical testing because even
in the development towns and Arab localities where segregation is uttermost, not all
residents are underprivileged or belong to an ethnic or national minority.
This investigation sheds light on the effect of the Israeli affirmative action
initiative on the contours of diversification in selective university campuses. Given that
applications and admissions to the universities are major-specific, it is critical to not only
examine the magnitude of the plan‘s diversity dividends, but also their distribution across
selectivity levels. Hence, the study asks: Where does the plan have its greatest
13
diversifying influence? Is it on the more selective programs, where demand and academic
requirements are high and, consequently, where disadvantaged groups are most under-
represented? Or, alternatively, is the plan most effective among the least selective majors,
where the under-representation of groups is smallest?
DATA AND METHODS
Database and sample
I obtained institutional administrative data from four chief Israeli universities—Tel-Aviv
University (TAU), The Hebrew University (HUJI), The Technion (TEC), and Ben-
Gurion University (BGU)—for periods ranging from ten to twelve consecutive years
(circa 1997 to 2008).12
During this period, the fields of study at the four universities
received 1,135,286 applications from 348,869 applicants (each applicant can apply to
multiple majors or apply in different years). Of the applicants, 60 percent were admitted
to at least one of the fields they applied to. Ultimately, 163,610 students enrolled at the
four institutions during this period.
The preferential policy began in 2001 at HUJI; 2003 at TAU;13
2004 at TEC; and
2006 at BGU. Consequently, the data yields eight years of admission observations under
the AA regime at HUJI, six at TAU, five at TEC, and three at BGU.14
The analytical
sample contains around 180,000 observations of applicants and 72,000 of students who
12
The total tally is: 12 years for Tel Aviv University (1997-2008), 11 years for the Technion and Hebrew
University (1998-2008) each, and 10 years for Ben-Gurion University (1999-2008). 13
TAU‘s faculties of law and social sciences have experimented with the affirmative action program since
1997. However, due to the small scale of this local initiative (168 students), I deleted these observations
and do not consider these years under the AA regime. 14
The analyses are limited to students under age 28 due to the different admissions criteria for older
students and the fact that the affirmative action plan has the same age cap. Also excluded are 230 students
who benefited from a relatively new program at TAU, which does not require the submission of test scores
for applicants from disadvantaged schools who ranked at the top of their class. In addition, 290 students of
Ethiopian origin who benefit from other types of preferential treatment are omitted from the analyses.
International students and students enrolled in various programs that combine military service and
academic studies are also not included in the sample.
14
enrolled in the above four universities after the affirmative action plan (AA regime) went
into effect. For the sake of parsimony, I report aggregated results and do not dwell on
between-institution variations.
Selectivity
To understand the choices and destinations of the AA applicants and admits, it is critical
to consider between-major and between-institution differences in the selectivity of
admissions. Since Israeli applicants apply to specific majors within each institution and,
thus, the admission decisions are major-institution-specific, the basic unit for the measure
of selectivity is the department. Altogether, the four institutions contained about 170
departments, representing, approximately, 50 different general fields of study. For each
department I calculated two selectivity indicators: first, competitiveness, defined as the
department admission rate (44 percent on average for the period between 1997 and
2008); and, second, academic rigor, determined by the mean test score of admits (the
overall 1997-2008 average is 636; to put this in perspective, the national average of all
test-takers in 2009 was 564).15
Next, I created an index of selectivity by calculating the
sum of the standardized scores of the admission rate and mean test score of each
department (ranges from -4.26 to 3. 44). The departments were then classified into
selectivity quintiles. Table 1 presents general statistics regarding this classification.
The results underscore the selective and competitive nature of most departments
at the four flagship Israeli universities. Classified as most selective are departments that,
on average, admitted 23 percent of applicants and whose mean test score was 698. The
15
These two measures do not completely overlap (correlation of -0.56). For instance, there are departments
with very low admission rates but that draw from an applicant pool with relatively low academic
credentials (e.g., nursing) and vice versa (e.g., physics).

15
results in the bottom panel of Table 1 indicate that 43 percent of first-time applicants in
1997-2008 sent an application to these majors.16
Among the most selective departments
are the vocational/professional fields, many of which are in the medical sciences17
or in
the engineering/computer sciences (but also architecture and psychology). It is important
to note that these most selective professional programs are longer (between 4-6 years)
than the typical three-year bachelor‘s programs. The bottom quintile has an admission
rate of 72 percent, on average, and mean test score of 573 (similar to the national average
test score); only four percent of applicants in 1997-2008 sought admission to these
departments. All departments classified as least selective are the humanities.
Variables
Appendix A provides definitions for all variables.
AA eligibility. This is a dichotomous outcome that indicates whether a student
applied for preferential treatment and passed the 30-point threshold.
Locality. I identified several theoretically relevant indicators based on student
locality of residence. They are: whether the locality is classified as a development town;
its ranking on the localities socioeconomic index; and its geographic region.18
Origin. I created five mutually exclusive indicators for student origin: (a) second
generation Asia-Africa: native-born Israeli Jews with at least one parent from Asia or
Africa, making up 12 percent of the students in the AA regime; (b) second generation
Europe-America: native-born Israeli Jews with both parents from Europe or America, or
only one parent from Europe or America if the other parent is a native-born Israeli (15
16
Since applicants can apply to multiple majors and students can have dual majors, each individual is
classified according to the most selective major she applied to, was admitted to, and enrolled in. 17
Included are medicine, dentistry, pharmacology, occupational therapy, communication disabilities, and
physiotherapy. 18
The database does not contain neighborhood- and school-level information.
16
percent); (c) Israel: third-generation immigrants, that is, native-born Israeli Jews with
two native-born parents (36 percent); (d) first-generation Jewish immigrants from Asia-
Africa or Europe-America (17 percent); and (e) Arab (8 percent). Twelve percent of the
sample lacked information about their origin, mainly because applicants in one of the
institutions were not asked about their parents‘ place of birth. Yet, since I was able to
identify Arabs and the origin of first-generation immigrants in this institution, I decided
to include its observations in the analytical sample, but report the share of missing data in
the origin variable. Consequently, the results may underestimate the share of second-
generation students.
Economic need. This indicator is based on students‘ receipt of institutional need-
based grants during their first year of university studies (there are no direct aid provisions
by the state). This is a relative measure of pecuniary constraints: within each institution in
a given year, the allocation of grants is solely need-based, and, as a result, distinguishes
between the more and less needy students. About 18 percent of the students in the AA
regime received need-based financial aid. Because this information comes from
administrative records and is not self-reported, it is an attractive measure of student‘s
financial constraints. It is worth emphasizing that in Israel, unlike in the U.S., decisions
regarding eligibility for affirmative action and financial aid are orthogonal: the former is
strictly need-blind and made by an external non-profit organization, while the latter is
made by universities only after a student has been admitted.19
Also noteworthy is the low
and uniform tuition at all Israeli public institutions,20
which renders a unique opportunity
19
Racial preference policies in the U.S. expand educational opportunities for under-represented minorities
not only because of the edge that they provide in admissions, but also because they imply better financial
aid packages for minorities (Alon 2001; Alon 2004b). 20
The tuition in 2009, for example, was 9,351 NIS, which is approximately $2,500.
17
to measure the non-pecuniary effect of affirmative action initiatives on economic
diversity.
Analytical Strategy
In order to estimate the program‘s diversification effect on the overall composition of the
student body, and the distribution of this effect across levels of selectivity, I compare the
diversity of the AA-eligible and the regular student pools during the AA regime. 21
The
diversity in the regular pool captures the counterfactual diversity level, that is, the level of
diversity that would exist if the affirmative action plan were not in place. The analyses
take into account the two factors that determine the magnitude of the overall
diversification effect on student body composition: first, the prevalence of AA-eligible
students in the relevant student body; and second, the dissimilarity between the AA-
eligible and regular pools in terms of key characteristics.
RESULTS
The Prevalence of AA-eligible Students in the Student Body
The results in Table 2 show that since the affirmative action plan began, there were
179,000 applicants to the four universities. Six percent of applicants sought preferential
treatment (10,928 applicants had a score on the socioeconomic index), but only half of
them met the 30-point threshold for eligibility (three percent of applicants). About 55
percent of AA-eligible applicants were admitted compared to 57 percent of the regular
21
Since longitudinal data is available, a before and after comparison seems theoretically attractive for
assessing the plan‘s diversity dividends. However, the temporal trends in group representation during the
period of investigation undermine the feasibility of such a strategy. Most notable is the sharp decline in the
share of first- and second-generation immigrants within the student body (either from Asia-Africa or
Europe-America) and the increase in the share of students with native-born parents. This reflects a natural
demographic trend, resulting from the lapsed time from the major immigration waves to Israel.
18
applicants. Eventually, in the relevant years, 3.7 percent of the student body was AA-
eligible (N=2,651).
[Table 2 about here]
Yet the interesting question is: how do the two groups compare in their field of
study preferences as applicants (in terms of department selectivity), and their ultimate
destinations as students? An examination of the distribution of the two pools (AA-eligible
and regular) across quintiles of departmental selectivity (Table 3) shows that the major
choice sets of AA-eligible and regular applicants are quite similar. One in two of the AA-
eligible applicants included a most selective department in their application (comprising
3.4 percent of the applicant pool in this tier), while less than 2 percent chose a least
selective major (comprising 1.6 percent of the applicant pool in this tier). The widespread
attempts of this group to access the more selective fields of study indicate its high
ambition. However, more AA-eligible applicants are turned down from these departments
than are regular ones. Eventually, the share of AA-eligible admits at the most (and least)
selective departments is the smallest (only 2.4 percent) while their share is largest among
admits to the second, third and fourth quintiles of selectivity (3.3-3.5 percent). Given a
higher yield rate among the AA admits at the most selective departments compared to
regular admits (plausibly another sign of their ambition), their final share at this tier rises
to 3.2 percent. There share is the highest at the forth quintile (4.4 percent). In sum, the
preferential policy has the potential to enhance diversity in all selectivity echelons,
depending, of course, on the dissimilarities in key attributes between students admitted
without preferential treatment and those who received an edge. The following analysis
assesses these dissimilarities.
19
[Table 3 about here]
Dissimilarity Between Pools in Key Characteristics and the Plan’s Diversity Dividends
Table 4 provides evidence regarding differences in spatial location, ethnic origin and
economic status between the groups. The results capture a remarkable effect of spatial
diversity, yet it should be noted that the real spatial diversity is probably larger since the
data do not have neighborhood-level information, which is the level targeted by the plan.
Nine percent of the AA-eligible students came from development towns, compared to
only 2 percent in the regular pool. Overall, this represents an increase of 9 percentage
points in the share of students from development towns in the student body.22
Similarly,
the share of students from localities ranked in the bottom third of the localities SES index
among the AA-eligible pool is more than double that in the regular pool (12 vs. 5 percent,
respectively), indicating an increase of 4 percentage points. The comparisons of the other
localities are less straightforward because not all the neighborhoods and schools in those
localities are classified as disadvantaged. Even so, AA-eligible students were more likely
to hail from localities in the middle third of the localities SES index, and less likely to be
residents of strong localities (in the top third), than students admitted without preferences.
I also calculated the index of dissimilarity, which measures the evenness of the
distributions of the AA and regular students. The index of dissimilarity for the locality‘s
SES cluster is 0.28, implying that about a third of one of the two groups would have to
move to different localities in order to produce a distribution that matches that of the
other group. The index of dissimilarity for geographic areas is 0.23; most of the
difference in geographic diversity stems from the high share of AA students from remote
22
The growth rate of under-represented groups is calculated as follows: ((group share in the student body –
group share without AA students) / group share without AA students) * 100.
20
areas (most gains due to students from the northern part of Israel with some gains from
the south).
[Table 4 about here]
Table 4 also juxtaposes the ethnic composition of the two groups. The index of
dissimilarity in origin is 0.27, most of which stems from the higher share of students
classified as first- or second-generation Asia-Africa or Arabs in the AA-eligible pool.
About 21 percent of the AA-eligible students are Israeli-born of Asian or African origin,
while only 11 percent of the regular students are (growth rate of 4 percentage points).
Conversely, the share of regular admission students of European or American descent is
more than double the share among the AA-eligible students (15 vs. 7 percent). The
program also infuses the student body with Arab students: 25 percent of the students who
receive preferential treatment are Arabs, despite comprising only 8 percent of the general
student body. Furthermore, the AA-eligible pool contains a higher share of new
immigrants than the regular pool; most of this gain is due to immigrants of Asian or
African origin. Given the color-blind nature of the preferential policy this diversification
effect is quite remarkable. Finally, the strictly need-blind plan also taps into students with
economic constraints: fifty percent of the AA-eligible students received need-based
grants in their freshman year compared to just 18 percent of the regular students (growth
rate of 7 percentage points).
One of the most challenging aspects of any preferential policy is its ability to
diversify bastions of privilege. To examine whether the diversification effect reaches the
most selective departments, I replicated the analyses presented in Table 4 for different
selectivity tiers. For the sake of parsimony, Table 5 only reports the two indices of
21
diversification (the growth rate and the index of dissimilarity) for three tiers of
selectivity: the top tier (top quintile), the second tier (second and third quintiles), and the
bottom tier (fourth and bottom quintiles).23
The results demonstrate that the plan‘s
diversity dividends are the largest in the most selective departments because the baseline
share of disadvantaged groups in the top tier is very low. For example, in the top tier, the
share of students from development towns in the regular pool is lowest (1.3 percent,
result not shown), as expected, but the growth rate of such students is the largest (15
percentage points compared to 11 and 9 in the middle and bottom tiers). Likewise, the
indices of dissimilarity for the distributions of localities and origin are the largest in the
top tier. The growth rate of students receiving financial aid is also higher in the top tier (9
percentage points compare to 6 points in the other selectivity tier). In sum, the Israeli
color- and need-blind preferential policy infuses the student body of the four flagship
universities, including the bastions of privilege within them, with under-represented and
disadvantaged populations.
[Table 5 about here]
CONCLUSIONS
The Israeli policy for preferential treatment is a fascinating hybrid of race-conscious
admissions, class-based preferences, and percent plans. It is class-based, but, like race-
conscious admissions and percent plans, stresses group affiliation rather than individual
traits. The Israeli design shares its focus on spatial segregation and school inequality with
percent plans but targets these aspects more directly. Moreover, as in other forms of
affirmative action, admission is not guaranteed; thus, institutions enjoy discretion in
23
The detailed results are available from the author upon request.

22
crafting a class and the issue of institutional saturation, a major weakness of some forms
of percent plans, is circumvented.
The results of this study demonstrate that a need- and color-blind affirmative
action policy can increase the geographic, economic and demographic diversity of a
student population. Having such a policy in place at four selective Israeli universities
made the entire student body, even the echelons at the most selective departments, more
diverse than they otherwise would have been. All in all, the plan‘s focus on structural
determinants of disadvantage, such as geographic and school segregation, yields broad
diversity dividends.
These insights can enrich the ongoing discussion of admission regimes and
equality of opportunity in other countries. Obviously, between-country differences in
postsecondary systems preclude a straightforward duplication of this plan to other
nations. Nonetheless, the concept of basing preferences on school/neighborhood
affiliation is worth serious consideration, especially by elite postsecondary institutions in
the U.S., which are struggling to find race-neutral ways to increase diversity. Class-based
preferential treatment at these institutions is imperative in order to offset the widening
class gaps (Alon 2009; see also Bowen et al. 2005; Carnevale and Rose 2004;
Espenshade and Radford 2009; Kahlenberg 1996), and neighborhood/school-based
preference plans seem the most practical and feasible alternative. Wide-ranging diversity
dividends from such policies are likely not only because spatial segregation has a central
role in the formation of life chances in the U.S., but also because it overlaps with other
systems of inequality (Massey 2007). Such a policy can replace the banned racial
preference programs or supplement them in states where they are still permissible. (In the
23
former case it should be noted that, by default, any race-neutral policy cannot produce the
same level of racial diversity as racial preferences, as the data from simulations and the
implementation of percent plans can attest.24
)
Another issue to consider is the likely public reaction to such a policy in the U.S.
Despite greatly facilitating the administration of such a plan, the focus on group
indicators subjects it to the same criticisms often directed at race-conscious policies:
reverse discrimination and creaming. Nonetheless, class-based preferences may stir less
antagonism than plans that emphasize race because, similar to percent plans, they do not
rely on ascribed traits. To illustrate, Skrentny (1996) contends that there is no opposition
to group preferences per se, but rather to race-conscious admissions in particular because
blacks, unlike, say, veterans, are perceived as undeserving of the preferences.
Furthermore, since they apply to people of all races, such programs are probably
in legally safe waters in states that have banned racial preferences. Bleich and Conrad
(2010) reviewed several legal cases in these states and suggest that while quotas and
mechanistic racial affirmative action methods are prohibited, more limited consideration
of race that does not focus on individual characteristics is usually allowed. They argue (p.
32) that ―Potentially permissible programs in these untested waters would
include…admissions programs that promote diversity using other criteria, such as native
language or neighborhood demographics, that ultimately will have an effect on the racial
composition of the public work force or student body.‖ They conclude that significant
24
The U.S. Court of Appeals for the Fifth Circuit recently reinforced this point when they ruled to allow
the University of Texas (UT) to consider race in admissions in addition to the Top Ten Percent plan in
order to boost the level of diversity in its student body. The majority opinion supported UT‘s contention
that the percent plan is not a substitute for race-conscious university admission policies.

24
opportunities exist for creative minds to promote under-represented groups while still
respecting constitutional regimes that ban racial preferences.
Implementing such plans in elite institutions in the U.S. will require additional
tailoring to ensure their feasibility and success. For example, the non-mechanistic nature
of the admission process and the legality of such programs will be jeopardized if schools
do not erect a wall between the stages of determining SES eligibility and the admission
decisions, as is the case in the Israeli design. A possible solution would be to incorporate
structural preferences into a comprehensive full-file review of applicants; that is,
applicants‘ academic achievements should be interpreted together with their background
information, particularly place of residence and school quality. Furthermore, since class-
based preferences will expand the share of low-income admits, financial aid budgets will
have to be augmented in order to facilitate enrollment at elite and expensive institutions,
and ensure persistence and attainment of a bachelor‘s degree. Consequently, the actual
diversity dividends of such programs will also depend on the magnitude of the financial
resources dedicated to them. Nonetheless, given the appeal of a color-blind and need-
blind affirmative action program, and its potential to diversify bastions of privilege, this
is likely a worthwhile investment.

25
References Ainsworth, James W. 2002. "Why Does It Take a Village? The Mediation of Neighborhood Effects on
Educational Achievement." Social Forces. 81(1): -
Alon, Sigal. 2001. "Racial, Ethnic and Socioeconomic Disparities in College Destinations, 1982 and 1992."
Office of Population Research Working Paper No. 2001-02.
Alon, Sigal. 2004a. ―The Gender Stratification of Employment Hardship: Queuing, Opportunity Structure
and Economic Cycles.‖ Research in Social Stratification and Mobility. 20:115-143.
Alon, Sigal. 2004b. ―Affirmative Action, Financial Aid and Access to Postsecondary Education in the
U.S.‖ In Maor Anat (Ed.) Affirmative Action in Israel. Tel Aviv: Ramot. (in Hebrew).
Alon, Sigal. 2009. ―The Evolution of Class Inequality in Higher Education: Competition, Exclusion and
Adaptation.‖ American Sociological Review. 74:731–755
Alon, Sigal and Marta Tienda. 2005. ―Assessing the Mismatch Hypothesis: Differences in College
Graduation Rates by Institutional Selectivity.‖ Sociology of Education 78:294–315.
Alon, Sigal and Marta Tienda. 2007. ―Diversity, Opportunity and the Shifting Meritocracy in Higher
Education.‖ American Sociological Review, 72(4):487-511.
Blau, Peter M. 1977. Inequality and Heterogeneity: A primitive theory of social structure. New York: Free
Press.
Bleich, J. & Conrad, M. (2010). Interpreting Proposition 209 and California's Developing Case Law on
Affirmative Action. In E. Grodsky & M. Kurlaender (Eds.), Equal Opportunity in Higher Education: The
Past and Future of California's Proposition 209 (pp. 11-32). Cambridge: Harvard Education Press.
Bowen, William G. and Derek Bok. 1998. The Shape of the River: Long-Term Consequences of
Considering Race in College and University Admission. Princeton, NJ: Princeton University Press.
Bowen, William G., Martin A. Kurzweil and Eugene M. Tobin. 2005. Equity and Excellence in American
Higher Education. Charlottesville, VA: University of Virginia Press.
Brooks-Gunn Jeanne, Greg J. Duncan, Tama Leventhal, and J. Lawrence Aber. 1997. “Lessons Learned
and Future Directions for Research on the Neighborhoods in Which Children Live.‖ In Brooks-Gunn
Jeanne, Duncan Greg, & Aber J. Lawrence (Eds.) Neighborhood Poverty: Context and consequences for
children (Volume 1). New York, NY: Russell Sage. Pp. 279-298.
Carnevale, Anthony P. and Stephen J. Rose. 2004. ―Socioeconomic Status, Race/Ethnicity, and Selective
College Admissions.‖ Pp. 101–56 in America Untapped Resources, edited by R. D. Kahlenberg. New
York: The Century Foundation Press.
Clayton, Susan D. and Sandra S Tangri. 1989. The justice of affirmative action. In F. Blanchard & F.
Crosby (Eds.). Affirmative action in perspective. New York : Springer-Verlag. pp. 177-192.
Cohen, Yinon and Haberfeld, Yitchak. 1998. "Second generation Jewish immigrants in
Israel: Have the ethnic gaps in schooling and earnings declined?‖ Ethnic and Racial Studies. 21: 507-528.
Espenshade, J. Thomas and Alexandria Walton Radford. 2009. No Longer Separate, Not Yet Equal: Race
and Class in Elite College Admission and Campus Life. Princeton, NJ: Princeton University Press.
Gratz v. Bollinger, 539 U.S. 244 (2003)

26
Grodsky, Eric, and Kurlaender, Michal. 2010. The Demography of Higher Education in the Wake of
Affirmative Action. In E. Grodsky & M. Kurlaender (Eds.), Equal Opportunity in Higher Education: The
Past and Future of California's Proposition 209 (pp. 33-58). Cambridge: Harvard Education Press.
Grutter v. Bollinger, 539 U.S. 306 (2003)
Gurin, Patricia, Eric .L. Dey, Sylvia Hurtado and Gerald Gurin. 2002 ―Diversity and Higher Education:
Theory and Impact on Educational Outcomes.‖ Harvard Educational Review. 72(3):330-366.
Haberfeld, Yitchak and Cohen, Yinon. 1998. ―Earnings of native-born Jewish and Arab men in Israel,
1987-1993‖ Research in Social Stratification and Mobility, 16: 69-88.
Haberfeld, Yitchak, and Yinon Cohen. 2007. Gender, Ethnic, and National Earnings Gaps in Israel: the
Role of Rising Inequality. Social Science Research 36: 654-672.
Harris Angel and Marta Tienda. 2010. ―Minority Higher Education Pipeline: Consequences of Changes in
College Admissions Policy in Texas." Annals of the American Academy of Political and Social Science.
627(1): 60-81.
Israel Central Bureau of Statistics (ICBS). 1995. "Table C1: Population in Jewish Localities, Mixed
Localities and Statistical Areas, by Continent of origin, period of immigration and sex." In Demographic
characteristics of the population in localities and statistical areas. Census of Population and Housing
publications.
Israel Central Bureau of Statistics (ICBS). 2006. "Table 1: Local Councils and Municipalities - Rank,
Cluster Membership, Population, Variable Values, Standardized Values and Ranking for the Variables used
in the Computation of the index" In Characterization and Classification of Local Authorities By the Socio-
Economic Level of the Population . Census of Population and Housing publications.
Kahlenberg, Richard D. 1996. The Remedy: Class, Race, and Affirmative Action. New York: BasicBooks.
Kane Thomas J. 1998. "Misconceptions in the Debate Over Affirmative Action in College Admissions". In
Chilling Admissions: the Affirmative Action Crisis and the Search for Alternatives. (Edited by: Orefield G
and Miller E). Boston, MA, Harvard Education Press. pp 17-31.
Karabel, Jerome .2005. The Chosen: The Hidden History of Admission and Exclusion at Harvard, Yale,
and Princeton. Boston: Houghton Mifflin.
Khazzoom, Aziza, 2005 "Did the Israeli State Engineer Segregation? On the Placement of Jewish
Immigrants in Development Towns in the 1950s," Social Forces 84(1):115-134.
Koffman Dawn and Marta Tienda. 2008. "Missing in Application: Admission Guarantees and
Socioeconomic Diversity." THEOP Working Paper. Retrieved 12/22/2010
http://theop.princeton.edu/reports/wp/ApplicantSocialClass.pdf
Kurlaender, Michal and Eric Grodsky. 2010. Toward Equal Opportunity in Higher Education. In E.
Grodsky & M. Kurlaender (Eds.), Equal Opportunity in Higher Education: The Past and Future of
California's Proposition 209 (pp. 217-226). Cambridge: Harvard Education Press.
Lewin-Epstein Noah and Moshe Semyonov. 1986. "Ethnic Group Mobility in the Israeli Labor Market".
American Sociological Association. 51(3):342-352.
Lewin-Epstein Noah and Moshe Semyonov. 1992. "Local Labor Markets, Ethnic Segregation, and Income
Inequality". Social Forces. 70(4) 1101-1119.

27
Long Mark C, Victor Saenz, and Marta Tienda. 2010. ―Policy Transparency and College Enrollment: Did
the Texas Top 10% Law Broaden Access to the Public Flagships?" Annals of the American Academy of
Political and Social Science. 627(1): 82-105.
Massey, Douglas S. 2007. Categorically Unequal: The American Stratification System. New York: Russell
Sage Foundation.
Massey, Douglas S. and Denton, Nancy 1993. American Apartheid: Segregation and the Making of the
Underclass. Cambridge: Harvard University Press
McLeod, Jane D. and Kevan Edwards. 1995. "Contextual determinants of children's responses to poverty".
Social Forces. 73:1487–1516.
Milem, Jeffrey F, Mitchel J. Chang and Anthony Lising Antonio. 2005. ―Making Diversity Work on
Campus: A Research-Based Perspective.‖ The Association of American colleges and Universities.
Retrieved 5/17/11 http://siher.stanford.edu/AntonioMilemChang_makingdiversitywork.pdf
Pebley, Anne R. and Sastry Narayan. 2004. "Neighborhoods, Poverty and Children‘s Well-Being: A
Review," in Kathryn Neckerman (ed.), Social Inequality. New York, NY: Russell Sage Foundation, pp.
119–145.
Sampson, Robert J, Stephen W. Raudenbush, and Felton Earls. 1997. "Neighborhoods and violent crime: a
multilevel study of collective efficacy". Science. 277(5328):918 - 924.
Sampson, Robert J., Jeffrey D. Morenoff. and Felton Earls. 1999. Beyond social capital: spatial dynamics
of collective efficacy for children. American Sociological Review. 64: 633–660.
Sander Richard H. 1997. "Experimenting With Class-Based Affirmative Action," 47 Journal of Legal
Education. 472-503.
Semyonov Moshe and Andrea Tyree. 1981. "Community Segregation and the Costs of Ethnic
Subordination", Social Forces. 59(3): 649-666.
South, Scott J., and Kyle D. Crowder. 1999. "Neighborhood effects on family formation: concentrated
poverty and beyond". American Sociological Review. 64:113–132.
Skrentny John David. 1996. The Ironies of Affirmative Action: Politics Culture and Justice in America.
University of Chicago Press.
Spilerman, Seymour and Jack Habib. 1976. ―Development Towns in Israel, The Role of Community in
Creating Ethnic. Disparities in Labor Force Characteristics‖ American Journal of Sociology. 81:781-812
The National Association for College Admission Counseling (NACAC). State of College Admission. David
A. Hawkins and Melissa Clinedinst, NACAC. Retrieved June 2009
http://www.nacacnet.org/PublicationsResources/Research/Documents/06StateofAdmission.pdf
Tienda, M. 2010. Lessons about College Admissions from the Texas Top 10 Percent Law. In E. Grodsky &
M. Kurlaender (Eds.), Equal Opportunity in Higher Education: The Past and Future of California's
Proposition 209 (pp. 195-210). Cambridge: Harvard Education Press.
Marta Tienda, Sigal Alon, and Sunny X. Niu. 2010. "Affirmative Action and the Texas Top 10% Percent
Admission Law: Balancing Equity and Access to Higher Education" Sociétés Contemporaines. 79:19-39
U.S. Commission on Civil Rights (2002). (USCCR). Beyond percentage plans: the challenge of equal
opportunity in higher education. Draft staff report. Retrieved 21/3/2011
http://www.vpcomm.umich.edu/admissions/research/beyondpercentplns.pdf
28
Wilson J. William. 1987. The truly disadvantaged: The Inner City, the Underclass, and Public Policy.
University Of Chicago Press.
Wilson J. William.1996. When Work Disappears: The World of the New Urban Poor. New York: Knopf.
Yaish Meir. 2001. "Class Structure in A Deeply Divided Society: Class and Ethnic Inequality in Israel,
1974-1991," British Journal of Sociology, 52 (3): 409-39
Yiftachel, Oren. 2000. "Social Control, Urban Planning and Ethno-Class Relations: Mizrahi Jews in Israel's
'Development towns'." International Journal of Urban and Regional Research. 24(2): 418-438
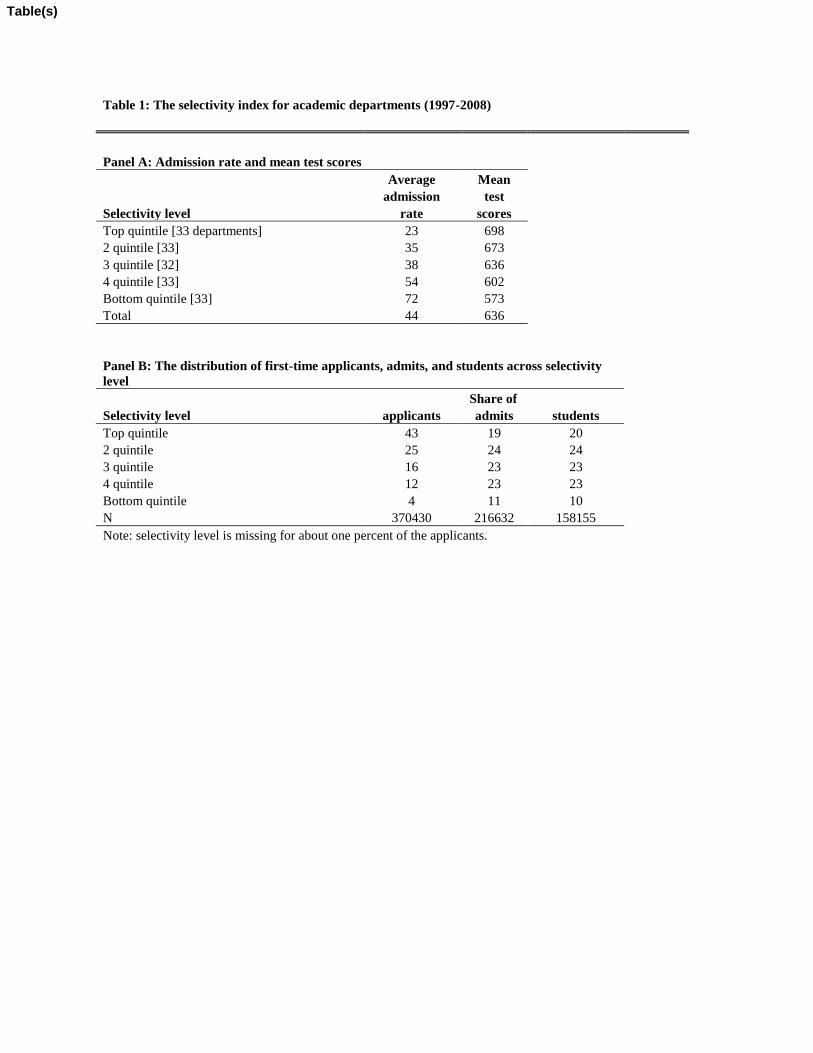
Table 1: The selectivity index for academic departments (1997-2008)
Panel A: Admission rate and mean test scores
Average Mean
admission test
Selectivity level rate scores
Top quintile [33 departments] 23 698
2 quintile [33] 35 673
3 quintile [32] 38 636
4 quintile [33] 54 602
Bottom quintile [33] 72 573
Total 44 636
Panel B: The distribution of first-time applicants, admits, and students across selectivity
level
Share of
Selectivity level applicants admits students
Top quintile 43 19 20
2 quintile 25 24 24
3 quintile 16 23 23
4 quintile 12 23 23
Bottom quintile 4 11 10
N 370430 216632 158155
Note: selectivity level is missing for about one percent of the applicants.
Table(s)
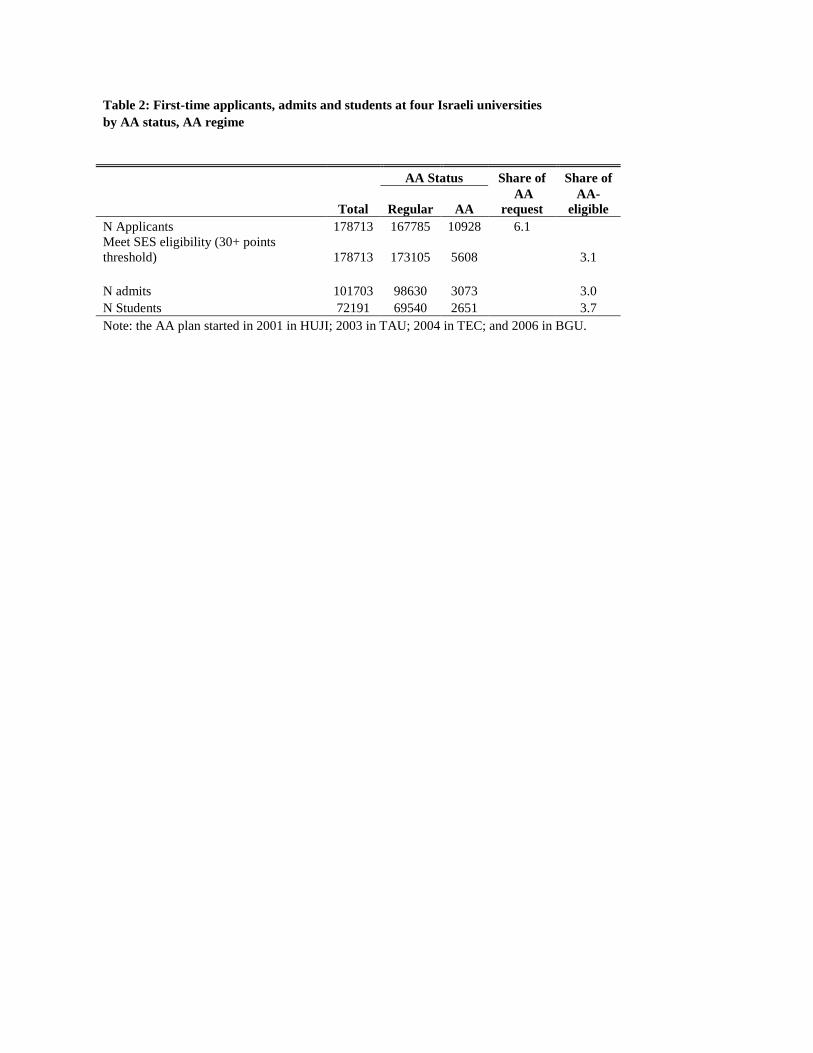
Table 2: First-time applicants, admits and students at four Israeli universities
by AA status, AA regime
AA Status Share of Share of
Total Regular AA
AA
request
AA-
eligible
N Applicants 178713 167785 10928 6.1
Meet SES eligibility (30+ points
threshold) 178713 173105 5608
3.1
N admits 101703 98630 3073
3.0
N Students 72191 69540 2651 3.7
Note: the AA plan started in 2001 in HUJI; 2003 in TAU; 2004 in TEC; and 2006 in BGU.
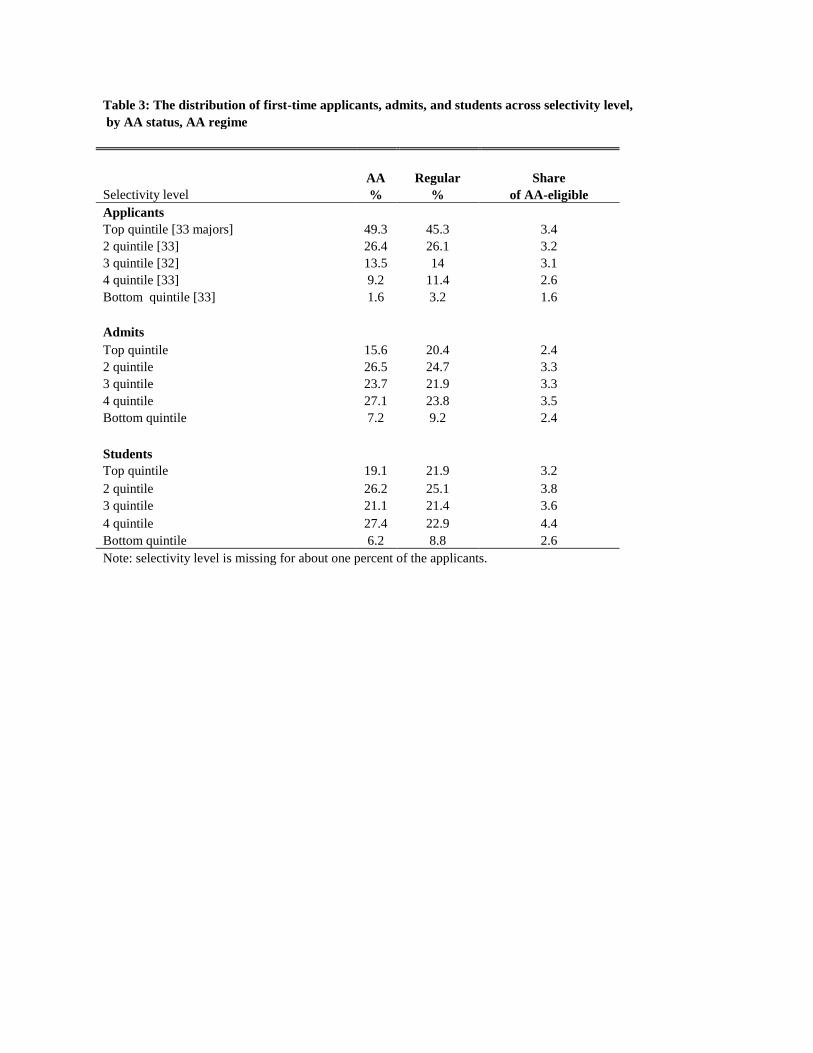
Table 3: The distribution of first-time applicants, admits, and students across selectivity level,
by AA status, AA regime
AA Regular Share
Selectivity level % % of AA-eligible
Applicants
Top quintile [33 majors] 49.3 45.3 3.4
2 quintile [33] 26.4 26.1 3.2
3 quintile [32] 13.5 14 3.1
4 quintile [33] 9.2 11.4 2.6
Bottom quintile [33] 1.6 3.2 1.6
Admits
Top quintile 15.6 20.4 2.4
2 quintile 26.5 24.7 3.3
3 quintile 23.7 21.9 3.3
4 quintile 27.1 23.8 3.5
Bottom quintile 7.2 9.2 2.4
Students
Top quintile 19.1 21.9 3.2
2 quintile 26.2 25.1 3.8
3 quintile 21.1 21.4 3.6
4 quintile 27.4 22.9 4.4
Bottom quintile 6.2 8.8 2.6
Note: selectivity level is missing for about one percent of the applicants.

Table 4: Characteristics of students at the four institutions by status of AA-eligibility, AA
regime
Entire student body
Growth rate
3 Index of
AA REG Total Dissimilarity
% %
Locality characteristics1
Development town 9.1 2.3 2.5 9%
Locality SES cluster
0.28
Bottom 12.3 5.4 5.6 4%
Middle 73.8 64.6 64.9 0%
Top 13.9 30 29.5 -2%
100% 100% 100%
Geographic region
0.23
Jerusalem 19 14 14.2 1%
North 22.3 9.5 9.9 4%
Haifa 8.1 12.2 12.1 -1%
Center 17.7 29 28.6 -1%
Tel-Aviv 15 22.8 22.5 -1%
South 18.1 12.5 12.7 2%
100% 100% 100%
Origin
0.27
Asia-Africa 2nd gen2 21.3 11.4 11.8 4%
Europe-America 2nd gen2 6.8 15.1 14.8 -2%
Israel2 23.7 36.2 35.7 -1%
New immigrants - Total 19.7 17 17.1 1%
Asia-Africa 1st gen 4.6 1.4 1.5 7%
Europe-America 1st gen 13.7 12.6 12.6 0%
Missing 1.4 3.1 3
Arab 25.2 7.8 8.4 8%
Missing 3.4 12.5 12.2
100% 100% 100%
Economic need
Need-based financial aid recipient 50.3 18.2 19.4 7%
N 2,651 69,540 72,191
1) Information on locality SES cluster and geographic region is missing for 25 and 17 percent of the students,
respectively, but there are no differences between AA-eligible and regular students.
2) Based on data from three institutions.
3) The growth rate is calculated as [(%group_x TOT - %group_x REG)/%group_x REG]*100

Table 5: The diversity dividends of the preferential policy by selectivity quintiles, AA regime
Departmental selectivity tiers
Top Tier
Second Tier
Bottom Tier
(Top quintile )
(2+3 quintiles)
(4+5 quintiles)
Growth
rate Index of
Growth
rate Index of
Growth
rate Index of
Dissimilarity Dissimilarity Dissimilarity
Locality characteristics
Development town 15%
11%
9%
Locality SES cluster
0.31
0.27
0.25
Bottom 6%
6%
2%
Geographic region
0.27
0.25
0.17
North 5%
5%
4%
South 4%
1%
1%
Origin
0.34
0.25
0.29
Asia-Africa 2nd gen 3%
4%
2%
Asia-Africa 1st gen 11%
0%
10%
Arab 8%
9%
9%
Economic need
Need-based financial aid recipient 9% 6% 6%

Appendix A: Variables'
definitions
Variable Definition
AA-eligible Whether a student applied for preferential treatment and passed the 30-point threshold
Locality: Development town The student’s locality is classified as a Development town. These towns were established
in the 1950s to absorb the massive immigration waves of Jews from Asia and Africa
Locality: SES cluster The classification of local authorities by the socioeconomic level of the population is based on:
financial resources of the residents; housing; standard of living; schooling and education;
employment profile; various types of socio-economic distress; and demographic characteristics.
The index ranges from 1-10.
Low-cluster locality ranked at the bottom third of socioeconomic index (ranks 1-3)
Mid-cluster locality ranked at the middle third of socioeconomic index (ranks 4-7)
Top-cluster locality ranked at the top third of socioeconomic index (ranks 8-10)
Locality: Geographic region The classification of local authorities by their geographic location
Jerusalem
North
Haifa
Center
Tel-Aviv
South
Origin
Asia-Africa 2nd gen Native-born Israeli Jews to at least one parent from Asia-Africa
Europe-America 2nd gen Native-born Israeli Jews to two parents from Europe-America or one parent of
European-American origin the second native-born Israeli
Israel Native-born Jews to both native-born parents
New immigrants - Total First generation immigrants
1st gen - Asia-Africa First generation immigrants from Asia-Africa
1st gen - Europe-
America First generation immigrants from Europe-America
Arab Arab
Need-based financial aid
recipient Student received need-based financial-aid in the first year.
The student's most selective
department The department's index of selectivity is the sum of the standardized scores of admission rate
and admits’ mean test scores. Each applicant/admit/student is classified to the most selective
major she applied to; admitted to; and enrolled in.