The dissociation constants of carbonic acid in seawater at salinities 5 to 45 and temperatures 0 to...
15
Dissociation constants of carbonic acid in seawater as a function of salinity and temperature Frank J. Millero * , Taylor B. Graham, Fen Huang, He ´ctor Bustos-Serrano, Denis Pierrot Rosenstiel School of Marine and Atmospheric Science, University of Miami, Miami, FL 33149, United States Received 17 June 2005; received in revised form 2 December 2005; accepted 2 December 2005 Available online 31 January 2006 Abstract Potentiometric measurements of the stoichiometric constants on the seawater pH scale for the dissociation of carbonic acid in seawater (K 1 * =[H + ][HCO 3 ]/[CO 2 ] and K 2 * =[H + ][CO 3 2 ]/[HCO 3 ]) have been made as a function of salinity (1 to 50) and temperature (0 to 50 8C). The results have been fitted to the equations (T/K) pK i pK 0 i ¼ A i þ B i =T þ C i lnT : The values of pK i 0 in pure water are taken from the early work of Harned and Davis (1943) and Harned and Scholes (1941) pK 0 1 ¼ 126:34048 þ 6320:813=T þ 19:568224lnT pK 0 2 ¼ 90:18333 þ 5143:692=T þ 14:613358lnT : The value of the adjustable parameters A i , B i and C i for pK 1 * are given by (r = 0.0054 and N = 466) A 1 ¼ 13:4191S 0:5 þ 0:0331S 5:33E 05S 2 B 1 ¼ 530:123S 0:5 6:103S C 1 ¼ 2:06950S 0:5 : For pK 2 * the parameters are given by (r = 0.011 and N = 458) A 2 ¼ 21:0894S 0:5 þ 0:1248S 3:687E 04S 2 B 2 ¼ 772:483S 0:5 20:051S C 2 ¼ 3:3336S 0:5 : 0304-4203/$ - see front matter D 2006 Elsevier B.V. All rights reserved. doi:10.1016/j.marchem.2005.12.001 * Corresponding author. E-mail address: [email protected] (F.J. Millero). Marine Chemistry 100 (2006) 80 – 94 www.elsevier.com/locate/marchem
Transcript of The dissociation constants of carbonic acid in seawater at salinities 5 to 45 and temperatures 0 to...

www.elsevier.com/locate/marchem
Marine Chemistry 10
Dissociation constants of carbonic acid in seawater as a function
of salinity and temperature
Frank J. Millero *, Taylor B. Graham, Fen Huang, Hector Bustos-Serrano, Denis Pierrot
Rosenstiel School of Marine and Atmospheric Science, University of Miami, Miami, FL 33149, United States
Received 17 June 2005; received in revised form 2 December 2005; accepted 2 December 2005
Available online 31 January 2006
Abstract
Potentiometric measurements of the stoichiometric constants on the seawater pH scale for the dissociation of carbonic acid in
seawater (K1*=[H+][HCO3
�]/[CO2] and K2*=[H+][CO3
2�]/[HCO3�]) have been made as a function of salinity (1 to 50) and
temperature (0 to 50 8C). The results have been fitted to the equations (T/K)
pKi � pK0i ¼ Ai þ Bi=T þ CilnT :
The values of pKi0 in pure water are taken from the early work of Harned and Davis (1943) and Harned and Scholes (1941)
pK01 ¼ � 126:34048þ 6320:813=T þ 19:568224lnT
pK02 ¼ � 90:18333þ 5143:692=T þ 14:613358lnT :
The value of the adjustable parameters Ai, Bi and Ci for pK1* are given by (r =0.0054 and N =466)
A1 ¼ 13:4191S0:5 þ 0:0331S � 5:33E � 05S2
B1 ¼ � 530:123S0:5 � 6:103S
C1 ¼ � 2:06950S0:5:
For pK2* the parameters are given by (r =0.011 and N =458)
A2 ¼ 21:0894S0:5 þ 0:1248S � 3:687E � 04S2
B2 ¼ � 772:483S0:5 � 20:051S
C2 ¼ � 3:3336S0:5:
0304-4203/$ - s
doi:10.1016/j.ma
* Correspondin
E-mail addre
0 (2006) 80–94
ee front matter D 2006 Elsevier B.V. All rights reserved.
rchem.2005.12.001
g author.
ss: [email protected] (F.J. Millero).

F.J. Millero et al. / Marine Chemistry 100 (2006) 80–94 81
The values of pK1* and pK2* determined in this study are in good agreement with the seawater (SW) measurements of Mehrbach
et al. (1973) and Mojica-Prieto and Millero (2002) from S =15 to 45 and 0 to 40 8C. The values of pK1* near S =35 are also in
reasonable agreement with the measurements in artificial seawater (ASW) of Goyet and Poisson (1989) and Roy et al. (1993) from
0 to 35 8C. The values of pK2* in real seawater, however, do not agree with the measurement made in artificial seawater at
temperatures above 5 8C. Calculations of pK1* and pK2* near 25 8C using an ionic interaction model (Millero and Roy, 1997)
suggest that the pK2* results in SW are more reliable than in ASW.
The equations from this study should be valid from S =0 to 50 and t =0 to 50 8C for most estuarine and marine waters (check
values at S =35 and t =25 8C are pK1*=5.8401 and pK2*=8.9636).
D 2006 Elsevier B.V. All rights reserved.
Keywords: Seawater; Carbonic acid; Dissociation constants; pK1; pK2; Titration; Modeling
1. Introduction
To examine the thermodynamics of the carbonic
acid system in seawater from measurements of pH,
total alkalinity (TA), total carbon dioxide (TCO2) and
the partial pressure of carbon dioxide ( pCO2) one
needs reliable constants for the dissociation of carbonic
acid.
CO2 þ H2O X Hþ þ HCO�3 ð1Þ
HCO�3 X Hþ þ CO2�3 : ð2Þ
The stoichiometric constants are given by
K1* ¼ Hþ½ � HCO�3
� �= CO2½ � ð3Þ
K2* ¼ Hþ½ � CO2�
3
� �= HCO�3� �
: ð4Þ
The concentrations (mol kg SW�1) are the total stoi-
chiometric values, [H+]= [H+]F+[HSO4�]+ [HF] (where
the subscript F is used to designate the free proton
concentration). Theoretically the measured stoichiomet-
Table 1
A summary of the measurement made on the dissociation constants of carbon
Reference Media Salinity range
Hansson ASW 5–40
Mehrbach et al. SW 19–43
Goyet and Poisson ASW 10–50
Roy et al. ASW 5–45
Mojica-Prieto and Millero SW 12–45
This study SW 1–50
a The values in parentheses are the number of measurements made and th
functional form (Eqs. (11)–(14)).
ric constants (K1* and K2*) for carbonic acid in sea-
water are related to the thermodynamic constants (Ki0)
by
K1* ¼ K0
1aH2OcCO2=cHcHCO3
ð5Þ
K2* ¼ K0
2cHCO3=cHcCO3
ð6Þ
where ai is the activity and ci is the activity coeffi-
cient of species i.
A number of workers have made measurements of the
stoichiometric constants for the dissociation of carbonic
acid in real seawater (SW) (Mehrbach et al., 1973;
Mojica-Prieto and Millero, 2002) and artificial seawater
(ASW) (Hansson, 1973; Goyet and Poisson, 1989; Roy
et al., 1993). A summary of these studies is given in
Table 1 along with the standard errors of the individual
measurements being fit to the same equation (Eqs. (11)–
(14)). All of the individual studies have similar standard
deviations, r =0.004 to 0.007 for pK1* and r =0.002 to
0.010 for pK2*. The measurements by Mehrbach et al.
(1973) and Mojica-Prieto and Millero (2002) were
made on real seawater (SW) while the measurements
made by Hansson (1973), Goyet and Poisson (1989)
and Roy et al. (1993) were made on artificial seawater
ic acid in real (SW) and artificial (ASW) seawater by various workers
Temperature range (8C) r(pK1*)a r(pK2*)
a
5–35 0.0070 (62) 0.010 (62)
2–35 0.0043 (30) 0.010 (33)
�1–40 0.0057 (84) 0.010 (90)
0–45 0.0044 (80) 0.002 (80)
5–45 0.0040 (80) 0.008 (80)
0–50 0.0054 (466) 0.011 (458)
e standard errors are based upon fitting the measurements to the same

F.J. Millero et al. / Marine Chemistry 100 (2006) 80–9482
(ASW). The values of pK1* determined by Mehrbach et
al. (1973), Hansson (1973), Goyet and Poisson (1989)
and Mojica-Prieto and Millero (2002) were determined
from potentiometric titrations. The values of pK2* de-
termined by Hansson (1973) and Goyet and Poisson
(1989) were also determined by potentiometric meth-
ods. Roy et al. (1993) determined pK1* and pK2* using
the hydrogen electrode method. The pK2* measurements
by Mehrbach et al. (1973) and Mojica-Prieto and Mill-
ero (2002) determined pK1*+pK2* on seawater that had
been stripped of CO2 with HCl. The values of pH=0.5
(pK1*+pK2*) of these solutions were determined after
the addition of HCO3�. If the pH is determined using a
spectroscopic method (Clayton and Byrne, 1993), then
one should be able to determine the pK2* to F0.005
which is better than the precision from most of the
titration studies.
Comparisons of the measurements made in ASW
and SW by various workers for S =35 seawater as a
function of temperature are shown in Fig. 1. These
comparisons are made relative to the measurements of
Mehrbach et al. (1973) as reformulated by Dickson and
Millero (1987). This was done since laboratory (Lee et
al., 1996, 1997, 2000; Lueker et al., 2000; Mojica-
Prieto and Millero, 2002) and field (Wanninkhof et
al., 1999; Millero et al., 2002) studies on SW indicate
0 10 20 30 40
0 10 20 30 40
-0.03
-0.02
-0.01
0.00
0.01
0.02
0.03
HanssonGoyet & PoissonRoy et al.Mojica & Millero
Δ p
K1
Δ p
K2
Temperature (°C)
-0.06
-0.04
-0.02
0.00
0.02
Fig. 1. A comparison of the values of pK1*and pK2* from 0 to 40 8Cand S =35 determined by various workers with the results of Mehr-
bach et al. (1973) as refit by Dickson and Millero (1987).
that these constants are more reliable than those made
in ASW. The pK1* measurements in SW by Mehrbach
et al. (1973) and in ASW by Goyet and Poisson (1989)
and Roy et al. (1993) are in reasonable agreement
(within 2r =0.014). The pK1* results of Hansson
(1973) from 5 to 25 8C in ASW are slightly higher
than the measurements of Goyet and Poisson (1989)
and Roy et al. (1993). The pK2* results in SW do not
agree with the results in ASW above 5 8C (see Fig. 1).
These results suggest that the values of pK2* in SW and
ASW are different. As discussed above internal consis-
tency studies with field and laboratory measurements of
seawater have shown that the pK2* measurements of
Mehrbach et al. (1973) in SW are more reliable than
the measurements made in ASW. The pK2* SW mea-
surements of Mojica-Prieto and Millero (2002) are in
good agreement with the results of Mehrbach et al.
(1973).
2. Modeling the carbonate system in natural waters
The differences in the values of pKi* near 25 8Cgoing from ASW to SW can be attributed to changes
in the activity of the H2O and CO2 or the activity
coefficients of HCO3� and CO3
2�. For example, the
increase in K1* and decrease in K2* near 25 8C can be
attributed to a decrease in cHCO3and an increase in cCO3
when going from ASW to SW. If these effects are due
to the boric acid in real seawater (Mojica-Prieto and
Millero, 2002), they can be attributed to interactions of
HCO3� with B(OH)3 or B(OH)4
� and interactions of
CO32� with B(OH)3 or B(OH)4
�. It is also possible
that the differences in the pK2* in SW and ASW are
related to an organic acid that is in all seawater (Millero
et al., 2002). Further measurements are needed to de-
termine the cause of these differences.
The measured stoichiometric constants (K1* and
K2*) for carbonic acid in seawater are related to
the thermodynamic constants by Eqs. (5) and (6).
The activity coefficients of H+, HCO3�, CO3
2� and
activities of CO2 and H2O can be determined from
ionic interaction models (Pitzer, 1991). Millero and
Roy (1997) have developed a carbonate model valid
from 0 to 50 8C and I =0 to 6 m. The model considers
the ionic interactions in solutions of the major
components of seawater and other natural waters
(H–Na–K–Mg–Ca–Sr–F–Cl–Br–OH–HCO3–B(OH)4–
HSO4–SO4–CO3–CO2–HF–B(OH)3–H2O). The model
has been used to predict the activity coefficients of major
and minor components of ions required to determine the
dissociation constants of all the acids needed to examine
the carbonate system in natural waters (H2CO3, B(OH)3,

Table 2
The composition of artificial seawater used by various authors
Hansson Roy et al. Goyet and Poisson Seawatera
NaCl 0.422 0.412598 0.409411 0.41040
Na2SO4 0.028 0.02824 0.028217 0.02824
KCl 0.010208 0.00908 0.00937
CaCl2 0.010 0.010372 0.01033 0.01028
MgCl2 0.054 0.052815 0.05327 0.05282
NaF 0.000071 0.00007
KBr 0.000823 0.00084
SrCl2 0.00009 0.00009
Na2CO3 0.001
NaHCO3 0.00205
B(OH)3 0.00042
a In mol (kg soln)�1, Millero (1996).
F.J. Millero et al. / Marine Chemistry 100 (2006) 80–94 83
H2O, HF, HSO4�, H3PO4, H2S, NH4
+). The predicted
dissociation constants for a number of acids in seawater
have been shown to be in good agreement with experi-
mental measurements (Millero and Roy, 1997).
The model can be used to examine the effects of
composition on the carbonate constants in seawater
and to compare the measurements made by various
studies. The compositions of artificial seawater used in
Model Comparisons
0 10 20 30 40 50
Δ p
K1 (M
eas
- Cal
c)Δ
pK
2 (M
eas
- Cal
c)
-0.06
-0.05
-0.04
-0.03
-0.02
-0.01
0.00
0.01
0.02
Mehrbach et al.Goyet & PoissonRoy et al.Mojica and Millero
0 10 20 30 40 50-0.08
-0.06
-0.04
-0.02
0.00
0.02
0.04
Temperature (°C)
Fig. 2. A comparison of the values of pK1* and pK2* from 0 to 40 8Cand S =35 determined by various workers with the model results of
Millero and Roy (1997).
the various studies are given in Table 2. A calculation of
the values of pK1* and pK2* using the compositions
shown in Table 2 indicate that the differences in pK1*
and pK2* are all within F0.002 which is well within the
experimental error of the measurements (see Table 1).
Changes in the values of SO42� and F� show the largest
effects on the values of pKi* (an increase of 0.00001 in F�
increases the pK’s by 0.005 and an increase of 0.0001 in
SO42� increases the pK’s by 0.005). These effects cannot
account for the increase in pK1* and decrease in pK2*
when going from SW to ASW near 25 8C.A comparison of the model calculations of pK1* and
pK2* at S =35 and from 0 to 45 8C with the fitted
measurements of Mehrbach et al. (1973), Goyet and
Poisson (1989), Roy et al. (1993) and Mojica-Prieto
and Millero (2002) are shown in Fig. 2. The model
calculations of pK1* are in reasonable agreement with
all of the measurements from 10 to 45 8C. The model
calculations of pK2* are in agreement with the measure-
ments in seawater by Mehrbach et al. (1973) and
Mojica-Prieto and Millero (2002). Large offsets occur
in the values of pK2* made in ASW by Goyet and
Poisson (1989), and Roy et al. (1993). The model
0 1 2 3 4 5 6 7
0 1 2 3 4 5 6 7
5.7
5.8
5.9
6.0
6.1
6.2
6.3
6.4
ModelMehrbach et al.
Carbonic Acid
S0.5
8.8
9.0
9.2
9.4
9.6
9.8
10.0
10.2
10.4
ModelMehrbach et l.
pK
1 p
K2
Fig. 3. A comparison of the values of pK1* and pK2* at 25 8C as a
function of the square root of salinity (S =0 to 45) of Mehrbach et al
(1973) with the model results from Millero and Roy (1997).
.

F.J. Millero et al. / Marine Chemistry 100 (2006) 80–9484
appears to be in error below 10 8C probably due to the
scarcity of measurements of pK1* and pK2* in NaCl
solutions at low temperatures. In summary, the model
supports the measurements in real seawater by Mehr-
bach et al. (1973) and Mojica-Prieto and Millero (2002).
The measurements made by Mehrbach et al. (1973)
and Mojica-Prieto and Millero (2002) on SW were not
made in dilute solutions so they may not give reliable
constants for estuarine waters. This is shown in Fig. 3
by comparing the measurements of pK1* and pK2* of
Mehrbach et al. (1973) with the model at 25 8C. In this
paper, we present measurements of real seawater over a
wide temperature (1 to 50 8C) and salinity (1 to 50)
range. The seawater results of this study have been
fitted to equations that are valid for all marine waters
over a wide range of salinity and temperature.
3. Methods
The measurements were made on Gulf Stream sea-
water that was diluted or evaporated from a salinity near
36. The seawater was filtered through a 0.45 Am filter
and stored at room temperature in 50 L P.P. Nalgene
Bottles before use. The low salinity samples were made
Table 3
The effects of TA (Amol kg�1) and TCO2 (Amol kg�1) levels and pH
(A) Effect of fixing or floating TA and TCO2 on the calculated pK1* and pK
Fixed values of TA and TCO2
Temperature (8C) Salinity TA TCO2 pK1*
20 33.758 2233.7 2003.8 5.900
25 33.758 2233.7 2003.8 5.845
30 33.076 2202.0 1998.2 5.805
35 33.076 2202.0 1998.2 5.763
40 33.076 2202.0 1998.2 5.726
Floating values of TA and TCO2
20 33.758 2233.9 2004.3 5.900
25 33.758 2233.7 2011.0 5.849
30 33.076 2202.0 2004.4 5.809
35 33.076 2202.3 2001.8 5.766
40 33.076 2202.1 2000.5 5.728
(B) Effect of initial pH on the values of pK1* and pK2*
Temperature Salinity Without NaOH With Na
pK1* pK2* pK1*
20 36.054 5.879 8.989 5.880
25 36.054 5.829 8.929 5.832
25 33.758b 5.849 8.974 5.851
30 35.885 5.794 8.867 5.796
35 35.885 5.752 8.782 5.756
40 35.885 5.715 8.696 5.723
a Certified reference material.b From Mehrbach data.
by diluting SWwith pure Milli-Q water (18 mV) and the
high salinity samples were obtained by slowly evaporat-
ing the SW. All the salinities below 42 were directly
determined on a Guildline 8410 PortaSal Salinometer.
The samples at higher salinities were determined from
density measurements on a DMA 60 Mettler/Paar Den-
sity Meter. The salinities were determined from the
density measurements using the 1 atm equation of state
of Millero and Poisson (1981). For samples of salinity
less than 8, sodium carbonate (0.002 m) was added to aid
in the determination of pK2*. Since the pH of seawater
(~8) is not high enough to determine an accurate value of
pK2*, small amounts of sodium hydroxide were added to
increase the pH to ~9–10. These small additions of
NaOH did not significantly change the salinity of the
samples. The addition of NaOH was not necessary in
dilute solutions when sodium carbonate was added.
All the samples were equilibrated to the desired tem-
perature in a Neslab RTE-221 constant temperature
water bath to F0.05 8C before addition to the titration
vessel. Flowing water at the desired temperature was
circulated through the titration cell and around the piston
delivering the HCl during an experiment. The tempera-
tures in the constant temperature bath and in the cell were
on the determination of the pK1* and pK2* at various temperatures
2*
Floating values of TA and TCO2
pK2* DpK1* DpK2* DTA DTCO2
9.051 0.000 �0.003 �0.2 �0.58.943 �0.004 �0.027 0.0 7.2
8.868 �0.004 �0.029 0.0 �6.28.792 �0.003 �0.016 �0.3 �3.68.702 �0.002 �0.010 �0.1 �2.3
9.054
8.974
8.897
8.808
8.712
OH Without With
pK2* DpK1*a DpK2*
a DpK1*a DpK2*
a
9.023 �0.001 0.036 �0.002 0.002
8.945 0.004 0.015 �0.002 �0.0008.967 0.007 �0.006 0.009 0.001
8.868 0.000 0.002 �0.002 0.001
8.794 0.005 0.013 0.002 0.001
8.725 0.010 0.026 0.002 �0.003

Table 4
Measured values of pK1* and pK2* for carbonic acid in seawater as a
function of salinity and temperature
Temperature S pK1* pK2*
1.1 3.467 6.362 9.945
1.2 3.467 6.349 9.935
1.0 4.353 6.323 9.923
1.2 4.702 6.336 9.879
1.2 4.929 6.332 9.856
1.0 5.561 6.307 9.859
1.0 6.278 6.295 9.827
1.2 8.154 6.283 9.721
1.2 8.154 6.276 9.721
1.2 9.965 6.256 9.679
1.1 10.349 6.247 9.684
1.3 10.349 6.236 9.685
1.0 12.328 6.219 9.624
1.0 12.328 6.218 9.655
1.2 12.698 6.229 9.642
1.2 12.698 6.227 9.636
1.0 14.626 6.200 9.602
1.0 14.626 6.202 9.604
1.2 17.100 6.193 9.539
1.2 17.100 6.193 9.571
1.0 20.463 6.168 9.514
1.1 20.463 6.170 9.486
1.2 26.089 6.140 9.432
1.3 26.089 6.137 9.458
1.0 27.724 6.117 9.425
1.0 27.724 6.118 9.435
1.0 27.724 6.117 9.425
1.1 28.220 6.127 9.433
1.1 28.220 6.125 9.421
1.1 29.792 6.128 9.410
1.2 29.792 6.132 9.409
1.2 31.459 6.113 9.395
1.0 31.707 6.106 9.384
1.0 31.707 6.107 9.386
1.0 31.707 6.101 9.388
1.0 33.227 6.100 9.361
1.0 33.227 6.100 9.382
1.1 33.251 6.110 9.362
1.2 33.251 6.109 9.364
1.0 35.771 6.104 9.340
1.2 35.771 6.105 9.335
1.0 35.775 6.092 9.356
1.0 35.775 6.087 9.361
1.0 35.775 6.090 9.357
1.2 37.180 6.101 9.329
1.2 37.180 6.095 9.340
1.0 37.474 6.078 9.326
1.0 37.474 6.083 9.330
1.0 37.474 6.080 9.331
1.0 39.819 6.079 9.311
1.0 39.819 6.074 9.315
1.0 41.091 6.073 9.299
3.2 8.150 6.244 9.733
3.0 8.509 6.244 9.692
3.0 8.509 6.244 9.690
3.0 8.509 6.244 9.692(continued on next page)
Table 4 (continued)
Temperature S pK1* pK2*
3.3 9.355 6.237 9.659
3.0 13.045 6.201 9.606
3.3 17.088 6.176 9.535
2.9 17.73 6.161 9.531
3.0 17.814 6.164 9.530
3.0 20.48 6.143 9.497
3.0 22.729 6.132 9.466
3.0 22.729 6.135 9.467
3.3 25.230 6.124 9.401
3.3 25.230 6.123 9.406
3.0 26.091 6.106 9.420
3.0 26.091 6.107 9.428
3.0 26.091 6.111 9.427
2.4 29.939 6.085 9.378
2.5 29.939 6.086 9.381
3.1 29.939 6.097 9.376
3.2 29.939 6.102 9.361
3.0 30.41 6.084 9.377
3.0 30.41 6.084 9.376
3.0 30.41 6.084 9.377
3.0 35.775 6.070 9.315
3.0 35.775 6.065 9.310
3.0 35.775 6.065 9.304
3.0 35.775 6.064 9.306
3.0 35.775 6.065 9.320
3.0 35.775 6.062 9.321
3.0 35.775 6.066 9.320
2.2 36.302 6.077 9.312
2.4 36.302 6.079 9.308
2.4 36.302 6.081 9.313
3.0 37.097 6.062 9.306
3.0 37.097 6.061 9.307
3.0 37.097 6.062 9.307
3.0 39.725 6.056 9.283
3.0 39.725 6.052 9.280
3.0 43.789 6.042 a
5.1 2.569 6.318 9.972
5.2 2.569 6.319 9.963
5.1 5.221 6.267 9.784
5.2 9.104 6.212 9.664
5.2 14.849 6.159 9.539
5.2 14.849 6.161 9.510
5.0 19.902 6.115 9.466
5.0 19.902 6.118 9.463
5.1 20.258 6.117 9.449
5.1 20.258 6.118 9.448
5.0 22.17 6.102 9.430
5.0 22.17 6.102 9.433
5.0 22.17 6.103 9.435
5.0 23.465 6.092 9.421
6.0 24.00 6.093 9.391
5.0 25.473 6.086 9.399
5.0 25.473 6.085 9.399
5.0 25.473 6.086 9.399
5.0 26.347 6.089 9.367
5.0 26.347 6.091 9.370
5.0 26.347 6.086 9.363
F.J. Millero et al. / Marine Chemistry 100 (2006) 80–94 85

Table 4 (continued)
Temperature S pK1* pK2*
5.1 26.510 6.082 9.367
5.1 26.510 6.083 9.370
5.0 27.79 6.073 9.368
5.0 27.79 6.073 9.374
5.0 27.79 6.075 9.372
5.0 30 6.074 9.345
5.0 30 6.068 9.342
5.0 31.4 6.056 9.332
5.0 31.4 6.057 9.332
5.0 31.4 6.058 9.330
5.0 32.346 6.072 9.313
5.1 32.376 6.060 9.299
5.1 32.376 6.058 9.315
5.0 35.775 6.043 9.284
5.0 35.775 6.042 9.280
5.0 35.775 6.043 9.284
5.0 35.775 6.041 9.280
5.0 35.775 6.046 9.266
5.0 35.775 6.049 9.268
5.0 36.094 6.056 9.284
5.0 36.324 6.056 9.279
5.1 37.653 6.044 9.261
5.2 37.653 6.041 9.259
5.0 39.69 6.034 9.245
5.0 40.27 6.028 9.245
5.0 40.27 6.027 9.242
5.0 40.27 6.031 9.241
5.0 42.69 6.023 9.223
5.0 42.69 6.024 9.219
5.0 42.69 6.022 9.220
5.0 43.538 6.020 a
5.2 46.850 6.013 9.177
5.0 50.754 5.982 a
10.0 5.493 6.206 9.706
10.1 5.493 6.203 9.713
10.1 10.934 6.129 9.538
10.2 10.934 6.131 9.527
10.1 12.43 6.112 9.497
9.9 16.072 6.081 9.437
10.2 16.072 6.088 9.428
10.2 20.777 6.052 9.358
10.2 20.777 6.053 9.356
10.4 23.702 6.046 9.325
10.2 24.00 6.043 9.320
10.1 26.388 6.024 9.295
10.1 26.388 6.021 9.293
10.0 30 6.013 9.268
10.0 32.093 5.999 9.229
10.2 32.093 6.001 9.230
9.9 35.740 5.986 9.190
10.2 35.740 5.989 9.189
10.0 36.2 5.990 9.188
10.0 36.3 5.990 9.188
10.2 38.113 5.977 9.164
10.3 38.113 5.978 9.171
15.0 1.924 6.236 9.899
14.9 2.772 6.209 9.790
able 4 (continued)
emperature S pK1* pK2*
5.1 4.933 6.158 9.642
5.1 4.933 6.162 9.657
5.0 6.447 6.133 9.586
5.0 6.579 6.136 9.576
5.0 6.579 6.138 9.574
5.0 6.579 6.138 9.572
5.0 9.164 6.089 9.450
5.0 9.164 6.086 9.456
5.0 10.191 6.084 9.442
3.7 12.40 6.085 9.429
5.0 15.274 6.035 9.359
5.1 15.274 6.036 9.362
5.0 17.358 6.032 9.331
5.0 17.358 6.029 9.330
5.1 19.551 6.006 9.300
5.1 19.551 6.005 9.298
5.0 21.631 5.993 9.259
5.1 21.631 5.992 9.262
5.2 25.670 5.972 9.216
5.2 25.670 5.970 9.220
5.0 30 5.956 9.188
5.0 31.15 5.960 9.158
5.0 35.00 5.947 9.117
5.0 36.2 5.932 9.107
5.0 36.3 5.932 9.107
5.0 37.25 5.942 9.096
5.0 40.52 5.932 9.060
5.0 40.74 5.930 9.061
0.0 1.663 6.204 9.858
0.0 1.954 6.199 9.794
0.2 3.342 6.153 9.668
0.0 4.48 6.134 9.586
0.0 4.48 6.134 9.587
0.0 4.48 6.133 9.585
0.0 7.122 6.082 9.457
0.0 9.198 6.040 9.392
0.0 9.198 6.043 9.395
0.0 9.198 6.047 9.393
0.5 10.461 6.039 9.355
0.0 13.748 5.996 9.297
0.0 13.748 5.998 9.302
0.0 13.748 5.999 9.295
0.0 16.354 5.983 9.265
0.0 16.354 5.983 9.265
0.0 18.53 5.965 9.228
0.2 20.326 5.959 9.210
0.2 20.326 5.962 9.217
0.2 20.326 5.957 9.208
0.2 20.326 5.958 9.208
0.0 22.154 5.944 9.181
0.0 22.154 5.944 9.183
0.0 25.89 5.924 9.133
0.0 25.89 5.922 9.137
0.0 25.89 5.923 9.137
0.2 31.444 5.903 9.072
0.2 31.444 5.905 9.072
0.0 40.134 5.880 8.988
(continued on next page)
F.J. Millero et al. / Marine Chemistry 100 (2006) 80–9486
T
T
1
1
1
1
1
1
1
1
1
1
1
1
1
1
1
1
1
1
1
1
1
1
1
1
1
1
1
1
2
2
2
2
2
2
2
2
2
2
2
2
2
2
2
2
2
2
2
2
2
2
2
2
2
2
2
2
2

Table 4 (continued)
Temperature S pK1* pK2*
20.2 43.061 5.856 8.961
20.2 43.061 5.857 8.958
20.0 47.219 5.858 a
25.2 2.217 6.148 9.695
25.3 2.868 6.134 9.671
25.0 4.213 6.086 9.525
25.0 4.213 6.095 9.560
25.0 5.007 6.064 9.493
25.1 5.940 6.050 9.441
25.1 6.217 6.059 9.459
25.1 12.015 5.980 9.250
25.1 12.015 5.980 9.251
25.2 13.847 5.951 9.222
25.2 13.847 5.951 9.215
25.0 14.742 5.950 9.213
25.0 14.742 5.950 9.207
25.1 16.488 5.934 9.184
25.1 16.488 5.934 9.183
25.0 16.996 5.930 9.171
25.0 16.996 5.931 9.175
25.0 16.996 5.939 9.164
25.0 16.996 5.935 9.151
25.0 18.545 5.917 9.154
25.2 18.545 5.918 9.152
25.1 19.079 5.917 9.145
25.1 19.079 5.916 9.146
25.0 21.147 5.905 9.121
25.0 21.147 5.907 9.112
25.0 21.147 5.907 9.118
25.0 21.147 5.906 9.112
25.1 24.097 5.888 9.077
25.2 24.097 5.887 9.080
25.0 27.713 5.869 9.034
25.0 27.713 5.869 9.033
25.0 27.713 5.869 9.034
25.0 27.713 5.869 9.035
25.0 30 5.858 9.007
25.0 30 5.857 9.006
25.0 30 5.858 9.007
25.0 30 5.857 9.006
25.0 30.00 5.857 9.004
25.0 31.847 5.856 8.983
25.0 31.847 5.853 8.988
25.0 31.847 5.852 8.988
25.0 31.847 5.854 8.983
25.0 33.998 5.842 8.965
25.0 33.998 5.842 8.963
25.0 33.998 5.842 8.965
25.0 33.998 5.842 8.963
25.0 36.055 5.840 8.939
25.0 36.055 5.836 8.941
25.0 36.055 5.836 8.944
25.0 36.055 5.837 8.939
25.0 36.055 5.836 8.942
25.0 36.055 5.833 8.943
25.0 36.25 5.843 8.949
25.0 37.51 5.831 8.926
25.0 38.272 5.837 8.936
Table 4 (continued)
Temperature S pK1* pK2*
25.0 38.272 5.831 8.922
25.0 38.272 5.829 8.918
25.0 39.011 5.828 8.912
25.0 39.011 5.823 8.915
25.0 39.011 5.825 8.913
25.0 39.011 5.827 8.919
25.0 40.39 5.820 8.904
25.0 40.39 5.821 8.904
25.0 40.39 5.819 8.901
25.0 40.39 5.820 8.902
25.0 42.67 5.813 8.883
25.0 42.67 5.811 8.884
25.0 42.67 5.811 8.885
25.0 44.008 5.811 8.872
25.0 44.008 5.811 8.869
25.0 44.008 5.811 8.870
25.0 44.236 5.808 8.870
25.0 44.236 5.807 8.872
25.0 44.236 5.807 8.870
25.0 45.002 5.808 8.863
25.0 45.002 5.805 8.866
25.0 45.002 5.799 8.866
25.0 45.985 5.794 8.856
25.0 45.985 5.796 8.857
25.0 45.985 5.796 8.867
30.0 0.953 6.187 9.855
30.0 2.435 6.116 9.624
30.0 2.435 6.120 9.629
30.0 2.435 6.120 9.622
30.0 3.804 6.073 9.519
30.0 3.804 6.073 9.522
30.0 5.815 6.025 9.382
30.0 8.305 5.986 9.269
30.0 8.305 5.985 9.274
30.0 8.305 5.986 9.275
30.0 10.29 5.953 9.219
30.0 10.29 5.959 9.212
30.0 10.29 5.957 9.219
30.0 13.277 5.925 9.154
30.0 13.277 5.925 9.154
30.0 13.277 5.925 9.154
30.0 15.5 5.908 9.121
30.0 15.5 5.905 9.120
30.0 15.5 5.908 9.121
30.1 17.231 5.888 9.092
30.2 17.231 5.890 9.096
30.0 17.676 5.891 9.082
30.0 17.676 5.888 9.085
30.0 17.676 5.894 9.086
30.0 18.330 5.880 9.080
30.0 18.330 5.881 9.080
30.1 19.216 5.877 9.068
30.1 19.216 5.876 9.065
30.0 20.853 5.867 9.040
30.0 20.853 5.866 9.038
30.0 21.429 5.863 9.037
30.0 21.429 5.866 9.037
(continued on next page)
F.J. Millero et al. / Marine Chemistry 100 (2006) 80–94 87

Table 4 (continued)
Temperature S pK1* pK2*
30.0 24.674 5.846 8.996
30.0 24.674 5.844 8.995
30.0 25.236 5.839 8.986
30.0 25.236 5.839 8.988
30.0 27.281 5.826 8.964
30.0 27.281 5.829 8.962
30.0 30.045 5.814 8.930
30.0 30.045 5.817 8.932
30.0 30.919 5.814 8.917
30.1 30.919 5.813 8.915
30.0 33.133 5.803 8.897
30.0 33.133 5.801 8.897
30.0 33.133 5.801 8.897
30.0 38.789 5.793 8.842
30.0 38.789 5.789 8.842
30.0 38.789 5.791 8.843
30.0 45.344 5.765 8.797
30.0 45.344 5.763 8.786
30.0 45.344 5.764 8.796
35.0 0.823 6.162 9.825
35.0 2.905 6.061 9.529
35.0 4.395 6.042 9.423
35.0 5.476 6.005 9.333
35.0 8.413 5.942 9.224
35.0 11.931 5.904 9.100
35.0 14.502 5.875 9.056
35.0 14.502 5.876 9.047
35.0 14.502 5.878 9.051
35.0 17.876 5.850 9.000
35.0 17.876 5.851 9.007
35.0 21.521 5.821 8.941
35.0 21.521 5.822 8.942
35.0 24.579 5.805 8.922
35.0 24.579 5.805 8.925
35.0 28.39 5.785 8.880
35.0 30.116 5.777 8.856
35.0 30.116 5.776 8.856
35.0 33.062 5.762 8.828
35.0 33.062 5.764 8.825
35.0 34.881 5.754 8.808
35.0 34.881 5.754 8.808
34.9 39.562 5.739 8.761
35.0 39.562 5.740 8.763
35.0 42.509 5.733 8.734
35.0 42.509 5.728 8.735
35.0 48.513 5.710 a
35.0 48.513 5.708 a
40.0 0.967 6.140 9.738
40.0 1.761 6.104 9.612
40.0 2.91 6.057 9.488
40.0 3.932 6.030 9.403
40.0 9.584 5.909 9.099
40.0 9.584 5.906 9.103
40.0 12.625 5.870 9.011
40.0 13.779 5.854 8.989
40.0 13.779 5.856 8.999
40.0 16.462 5.831 8.942
able 4 (continued)
emperature S pK1* pK2*
0.0 16.462 5.835 8.946
0.0 17.864 5.818 8.939
0.0 17.864 5.820 8.938
0.0 20.501 5.806 8.902
0.0 20.501 5.800 8.895
0.0 20.501 5.799 8.888
0.0 22.149 5.791 8.883
0.0 22.149 5.787 8.867
0.0 24.818 5.768 8.833
0.0 24.818 5.773 8.847
0.0 24.818 5.772 8.847
0.0 26.997 5.761 8.822
0.0 26.997 5.760 8.823
9.9 29.736 5.749 8.790
0.0 29.736 5.747 8.790
0.0 31.008 5.739 8.781
0.0 31.008 5.741 8.774
0.0 31.008 5.740 8.774
0.0 32.604 5.733 8.757
0.0 32.604 5.732 8.756
0.0 38.480 5.709 8.700
0.0 38.480 5.708 8.699
0.0 44.793 5.687 8.646
0.0 44.793 5.681 8.643
5.0 14.513 5.817 8.902
5.1 14.513 5.817 8.918
5.0 17.814 5.792 8.872
5.0 17.814 5.793 8.870
5.0 19.519 5.778 8.848
5.0 19.519 5.777 8.847
5.0 21.709 5.766 8.817
5.0 21.709 5.763 8.820
4.9 22.935 5.751 8.806
5.1 22.935 5.751 8.807
5.0 25.66 5.736 8.760
5.0 25.66 5.738 8.761
5.0 25.66 5.734 8.761
4.9 27.133 5.727 8.749
5.0 27.133 5.725 8.755
5.1 30.140 5.713 8.716
5.1 30.140 5.711 8.719
5.0 32.957 5.698 8.684
5.1 32.957 5.694 8.685
5.3 35.00 5.697 8.644
5.0 36.200 5.683 8.649
5.0 36.300 5.683 8.649
4.9 37.51 5.684 8.644
5.0 43.289 5.659 8.586
0.0 9.534 5.869 8.998
0.0 9.534 5.866 9.001
0.4 12.40 5.831 8.894
9.7 14.975 5.792 8.830
0.2 14.975 5.802 8.849
0.2 17.73 5.774 8.780
0.2 19.717 5.766 8.777
0.0 21.163 5.740 8.759
(continued on next page)
F.J. Millero et al. / Marine Chemistry 100 (2006) 80–9488
T
T
4
4
4
4
4
4
4
4
4
4
4
4
4
3
4
4
4
4
4
4
4
4
4
4
4
4
4
4
4
4
4
4
4
4
4
4
4
4
4
4
4
4
4
4
4
4
4
4
5
5
5
4
5
5
5
5

Table 4 (continued)
Temperature S pK1* pK2*
50.1 21.163 5.742 8.762
50.0 21.250 5.745 8.755
50.3 24.00 5.724 8.686
49.7 28.024 5.694 8.671
49.8 28.024 5.690 8.674
50.1 32.660 5.675 8.618
50.5 32.660 5.673 8.618
50.0 36.3 5.650 8.561
50.0 36.3 5.652 8.561
50.2 36.34 5.653 8.559
50.0 46.291 5.613 a
a: The missing values of pK2* are not given since they are unreliable
due to the precipitation of MgOH at high pH.
F.J. Millero et al. / Marine Chemistry 100 (2006) 80–94 89
measured with a Guildline 9540 Digital Resistance Ther-
mometer calibrated by the company. The temperature
inside the cell was measured before and after each titra-
tion. The values agreed to F0.1 8C which is equivalent
to an error ofF0.0009 in pK1* andF0.0016 in pK2*. The
recorded temperature of a run is the mean of the initial
and final values.
The titration system (Millero et al., 1993) consists of a
closed water jacketed plexiglass cell with a ROSS 8101
glass pH electrode and an Orion 90-02 double junction
Ag/AgCl reference electrode. Some measurements were
made using an Orion 80-05 ROSS Reference Half-Cell
electrode. The titrant is delivered with a Metrohm 665
Dosimat titrator and the emf is measured with an Orion
720A pH meter. The system is controlled by a personal
computer (Millero et al., 1993) using a National Instru-
ment’s Labwindows/CVI environment. The titration is
made by adding ~0.25 M HCl (in 0.45 M NaCl) to
seawater past the carbonic acid end point. A typical
titration records the emf after the readings become stable
(0.05 mV) and adds enough acid to change the voltage to
a pre-assigned increment (9 mV). This provides more
data points in the range of a rapid increase in the emf near
the endpoints.
The values of pK1* and pK2* [mol (kg soln)�1] were
determined using a non-linear curve-fitting procedure
developed by Johansson and Wedborg (1982) and Dick-
son (1981). This procedure was modified to a more
buser-friendlyQ Excel version by Dr. Pierrot. The pro-
gram determines the E*, pK1*, pK2*, TA and TCO2 of the
sample from the full titration (N50 pts). The electrodes
are calibrated over the entire range of the titration with
the computer code giving a value of E* that is constant at
a given temperature and salinity. The dissociation or
association constants needed in the computer code
were taken from the literature (B(OH)3 from Dickson,
1990a; HF from Dickson and Riley, 1979. HSO4� from
Dickson, 1990b, H2O from Millero, 1995).
The dissociation constants are on the seawater pH
scale (Dickson, 1984)
½Hþ�SWS ¼ ½Hþ� þ ½HSO�4 � þ ½HF� ð7Þ
where the brackets represent concentrations in mol
(kg soln)�1 (Millero, 1995). The total seawater scale
is given by
½Hþ�T ¼ ½Hþ� þ ½HSO�4 �: ð8Þ
The two pH scales are related by (Dickson, 1984)
pHSWS ¼ pHT þ log 1þ bHSO4SO4½ �T
� �
� log 1þ bHSO4SO4½ �T þ bHF F½ �T
� �ð9Þ
where the subscript T represents the total concentration
and the bs are the association constants for the forma-
tion of HSO4� (Dickson, 1990b) and HF (Dickson and
Riley, 1979) at the ionic strength and temperature of the
solution.
The calculations were carried out in a manner similar
to the methods described by Goyet and Poisson (1989).
As pointed out by these authors, care is needed in
fitting titration data with many variables. To test the
reliability of the computer code a number of titrations
as a function of temperature were made on certified
reference material provided by Dickson (2004) with
known values of TA and TCO2. The derived values
of pK1* and pK2* on these samples are given in Table 3.
The values of pK1* determined with and without the
known values of TA and TCO2 (floating) gave similar
results that were in good agreement with the values of
Mehrbach et al. (1973). The floating values of TA and
TCO2 are also in good agreement with the certified
values. In a second series of studies, we examined the
values of pK2* obtained with and without the addition of
NaOH. These results indicate that to obtain reliable
values of pK2* that agreed with the results of Mehrbach
et al. (1973) or Mojica-Prieto and Millero (2002), one
needs to increase the pH and the concentration of the
CO32� ion. In a few of the titrations at high salinity the
precipitation of Mg(OH)2 appeared to occur yielding
unreliable values of pK2*. This was apparently due to
the loss of the MgCO3 complex. Since the interactions
of Mg2+ with HCO3� are small, it did not cause any
significant errors in the determination of pK1* (Millero
and Roy, 1997).
4. Results and calculations
The titrations were made on seawater samples as a
function of temperature (1 to 50) and salinity (1 to 50).
Salinity
0 10 20 30 40 50
0 10 20 30 40 50
-0.020
-0.015
-0.010
-0.005
0.000
0.005
0.010
0.015
0.020
-0.020
-0.015
-0.010
-0.005
0.000
0.005
0.010
0.015
0.020
+2σ
-2σ
+2σ
-2σ
σ = 0.0054
σ = 0.0054
Δ p
K1
Δ p
K1
Temperature (°C)
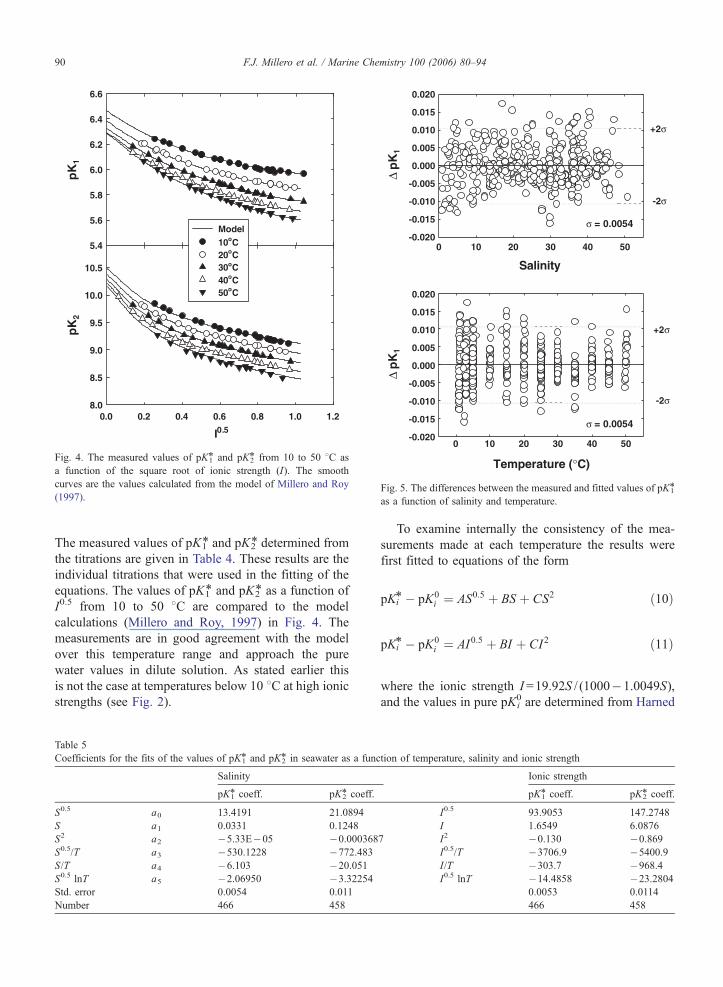
ig. 5. The differences between the measured and fitted values of pK1*
s a function of salinity and temperature.
5.4
5.6
5.8
6.0
6.2
6.4
6.6
I0.5
0.0 0.2 0.4 0.6 0.8 1.0 1.28.0
8.5
9.0
9.5
10.0
10.5
Model10oC20oC30oC40oC50oC
pK
1 p
K2
Fig. 4. The measured values of pK1* and pK2* from 10 to 50 8C as
a function of the square root of ionic strength (I). The smooth
curves are the values calculated from the model of Millero and Roy
(1997).
F.J. Millero et al. / Marine Chemistry 100 (2006) 80–9490
The measured values of pK1* and pK2* determined from
the titrations are given in Table 4. These results are the
individual titrations that were used in the fitting of the
equations. The values of pK1* and pK2* as a function of
I0.5 from 10 to 50 8C are compared to the model
calculations (Millero and Roy, 1997) in Fig. 4. The
measurements are in good agreement with the model
over this temperature range and approach the pure
water values in dilute solution. As stated earlier this
is not the case at temperatures below 10 8C at high ionic
strengths (see Fig. 2).
Table 5
Coefficients for the fits of the values of pK1* and pK2* in seawater as a func
Salinity
pK1* coeff. pK2* coeff.
S0.5 a0 13.4191 21.0894
S a1 0.0331 0.1248
S2 a2 �5.33E�05 �0.000368S0.5/T a3 �530.1228 �772.483S/T a4 �6.103 �20.051S0.5 lnT a5 �2.06950 �3.32254Std. error 0.0054 0.011
Number 466 458
F
a
To examine internally the consistency of the mea-
surements made at each temperature the results were
first fitted to equations of the form
pKi*� pK0
i ¼ AS0:5 þ BS þ CS2 ð10Þ
pKi*� pK0
i ¼ AI0:5 þ BI þ CI2 ð11Þ
where the ionic strength I=19.92S / (1000�1.0049S),
and the values in pure pKi0 are determined from Harned
tion of temperature, salinity and ionic strength
Ionic strength
pK1* coeff. pK2* coeff.
I0.5 93.9053 147.2748
I 1.6549 6.0876
7 I2 �0.130 �0.869I0.5/T �3706.9 �5400.9I/T �303.7 �968.4I0.5 lnT �14.4858 �23.2804
0.0053 0.0114
466 458

-0.03
-0.02
-0.01
0.00
0.01
0.02
0.03
0.04
HanssonMehrbach et al.Goyet & PoissonRoy et al.Mojica & Millero
Δ p
K1 (M
eas
- Cal
c)
-0.03
-0.02
-0.01
0.00
0.01
0.02
0.03
0.04
Δ p
K1 (M
eas
- Cal
c)
0 10 20 30 40 50
Temperature (°C)
Salinity0 10 20 30 40 50
Fig. 7. A comparison of our values of pK1* as a function of temper
ature and salinity with literature values.
Salinity
-0.04
-0.03
-0.02
-0.01
0.00
0.01
0.02
0.03
-0.04
-0.03
-0.02
-0.01
0.00
0.01
0.02
0.03
σ = 0.011
σ = 0.011
+2σ
-2σ
+2σ
-2σ
Δ p
K2
Δ p
K2
0 10 20 30 40 50
Temperature (°C)
0 10 20 30 40 50
Fig. 6. The differences between the measured and fitted values of pK2*
as a function of salinity and temperature.
F.J. Millero et al. / Marine Chemistry 100 (2006) 80–94 91
and Bonner (1945), Harned and Davis (1943), and
Harned and Scholes (1941) as refit by Millero (1979)
pK01 ¼ � 126:34048þ 6320:813=T þ 19:568224lnT
ð12Þ
pK02 ¼ � 90:18333þ 5143:692=T þ 14:613358lnT
ð13ÞThe average standard deviations for the individual tem-
peratures varied from 0.0029 to 0.0078 for pK1*
(weighted average 0.0048, N =466) and 0.0049 to
0.0130 for pK2* (weighted average of 0.010, N =458).
All of the measurements as a function of temper-
ature and salinity have been fitted to equations of the
form
pKi*� pK0
i ¼ Ai þ Bi=T þ CilnT ð14Þ
The adjustable parameters have been fitted to func-
tions of salinity using equations
Ai ¼ a0S0:5 þ a1S þ a2S
2 ð15Þ
Bi ¼ a3S0:5 þ a4S ð16Þ
Ci ¼ a5S0:5 þ a6S: ð17Þ
Similar equations as a function of ionic strength can
be formulated by replacing S with I.
The coefficients used were arrived at by using an F-
test and are shown in Table 5 along with the standard
errors of the fits (r =0.0054 for pK1* and r =0.011 for
pK2*). The differences between the measured and cal-
culated values of pK1* and pK2* are shown in Figs. 5
and 6). Most of the deviations for pK1* and pK2* are
within 2r (0.012 and 0.022, respectively).
5. Discussion
Comparisons of the results of pK1* and pK2* calcu-
lated from Eqs. (14)–(17) with earlier workers shown
in Figs. 7 and 8) are summarized in Table 6. Our
calculated results of pK1* from 0 to 40 8C and S =12
to 45 are in good agreement with the measurements of
Mehrbach et al. (r =F0.0066, N =30) and Mojica-
Prieto and Millero (r =F0.0086, N =59). The pK1*
results of Roy et al. (r =F0.098, N =56) and Goyet
and Poisson (r =F0.0120, N =93) show larger offsets.
It should be pointed out that the Roy et al. results from
-
able 6
omparisons of the standard deviations of the differences between our
easurements and other authors
uthor r(pK1*) No. r(pK2*) No.
ehrbach et al. 0.0066 30 0.013 33
ansson 0.021 70
oyet and Poisson 0.012 93
0.0084a 84
oy et al. 0.0098b 56
ojica and Millero 0.0086c 59 0.014 140
his study 0.0054 466 0.011 458
a Minus the measurements at 10 8C.b Minus the measurements at S =5.c Minus the measurements at S =5.
-0.03
-0.02
-0.01
0.00
0.01
0.02
0.03
-0.03
-0.02
-0.01
0.00
0.01
0.02
0.03
Mehrbach et al.Mojica & Millero
10 20 30 40 50
Δ p
K2 (M
eas
- Cal
c)Δ
pK
2 (M
eas
- Cal
c)
0 10 20 30 40 50
Temperature (°C)
Salinity
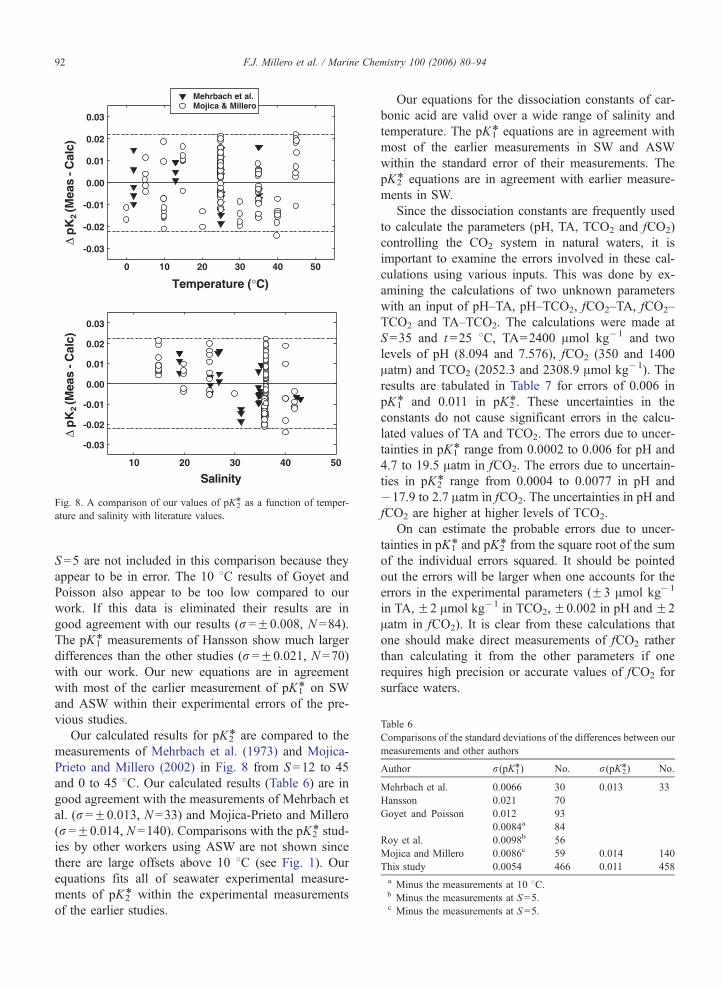
Fig. 8. A comparison of our values of pK2* as a function of temper-
ature and salinity with literature values.
F.J. Millero et al. / Marine Chemistry 100 (2006) 80–9492
S =5 are not included in this comparison because they
appear to be in error. The 10 8C results of Goyet and
Poisson also appear to be too low compared to our
work. If this data is eliminated their results are in
good agreement with our results (r =F0.008, N =84).
The pK1* measurements of Hansson show much larger
differences than the other studies (r =F0.021, N =70)
with our work. Our new equations are in agreement
with most of the earlier measurement of pK1* on SW
and ASW within their experimental errors of the pre-
vious studies.
Our calculated results for pK2* are compared to the
measurements of Mehrbach et al. (1973) and Mojica-
Prieto and Millero (2002) in Fig. 8 from S=12 to 45
and 0 to 45 8C. Our calculated results (Table 6) are in
good agreement with the measurements of Mehrbach et
al. (r =F0.013, N =33) and Mojica-Prieto and Millero
(r =F0.014, N =140). Comparisons with the pK2* stud-
ies by other workers using ASW are not shown since
there are large offsets above 10 8C (see Fig. 1). Our
equations fits all of seawater experimental measure-
ments of pK2* within the experimental measurements
of the earlier studies.
Our equations for the dissociation constants of car-
bonic acid are valid over a wide range of salinity and
temperature. The pK1* equations are in agreement with
most of the earlier measurements in SW and ASW
within the standard error of their measurements. The
pK2* equations are in agreement with earlier measure-
ments in SW.
Since the dissociation constants are frequently used
to calculate the parameters (pH, TA, TCO2 and fCO2)
controlling the CO2 system in natural waters, it is
important to examine the errors involved in these cal-
culations using various inputs. This was done by ex-
amining the calculations of two unknown parameters
with an input of pH–TA, pH–TCO2, fCO2–TA, fCO2–
TCO2 and TA–TCO2. The calculations were made at
S =35 and t =25 8C, TA=2400 Amol kg�1 and two
levels of pH (8.094 and 7.576), fCO2 (350 and 1400
Aatm) and TCO2 (2052.3 and 2308.9 Amol kg�1). The
results are tabulated in Table 7 for errors of 0.006 in
pK1* and 0.011 in pK2*. These uncertainties in the
constants do not cause significant errors in the calcu-
lated values of TA and TCO2. The errors due to uncer-
tainties in pK1* range from 0.0002 to 0.006 for pH and
4.7 to 19.5 Aatm in fCO2. The errors due to uncertain-
ties in pK2* range from 0.0004 to 0.0077 in pH and
�17.9 to 2.7 Aatm in fCO2. The uncertainties in pH and
fCO2 are higher at higher levels of TCO2.
On can estimate the probable errors due to uncer-
tainties in pK1* and pK2* from the square root of the sum
of the individual errors squared. It should be pointed
out the errors will be larger when one accounts for the
errors in the experimental parameters (F3 Amol kg�1
in TA, F2 Amol kg�1 in TCO2, F0.002 in pH and F2
Aatm in fCO2). It is clear from these calculations that
one should make direct measurements of fCO2 rather
than calculating it from the other parameters if one
requires high precision or accurate values of fCO2 for
surface waters.
T
C
m
A
M
H
G
R
M
T

Table 7
Uncertainties in the determination of CO2 parameters at S =35 and t =25 8C due to errors of 0.006 in pK1* and 0.011 in pK2*a,b
Uncertainties due to error in pK1*
Input variables fCO2 (Aatm) DTCO2 (Amol kg�1) TA (Amol kg�1) pH fCO2 (Aatm)
pH–TA 350 0.1 – – 4.9
1400 0.6 – – 19.5
pH–TCO2 350 – �0.2 – 4.8
1400 – �0.6 – 19.1
fCO2–TA 350 �3.0 – 0.005 –
1400 �1.5 – 0.005 –
fCO2–TCO2 350 – 3.7 0.005 –
1400 – 1.6 0.006 –
TA–TCO2 350 – – 0.000 4.7
1400 – – 0.001 14.2
Uncertainties due to errors in pK2*
Input variables fCO2 (Aatm) DTCO2 (Amol kg�1) DTA (Amol kg�1) DpH DfCO2 (Aatm)
pH–TA 350 4.9 – – 1.9
1400 2.2 – – 2.7
pH–TCO2 350 – �5.5 – 1.1
1400 – �2.2 – 1.4
fCO2–TA 350 3.7 – 0.002 –
1400 1.9 – 0.001 –
fCO2–TCO2 350 – �4.6 0.001 –
1400 – �2.1 0.000 –
TA–TCO2 350 – – 0.008 �5.81400 – – 0.006 �17.9
a Initial inputs of TA=2400 Amol kg�1, pH=8.094 and 7.576, TCO2=2052.3 and 2308.9 Amol kg�1, respectively for fCO2=350 and 1400 Aatmat 25 8C. The calculations were made using pK1*=5.8372 and pK2*=8.9553 at 25 8C and S =35 from Mehrbach et al. (1973).b The total probable error (pe) can be estimated from the square root of the sum of the errors due to pK1* and pK2* squared,
pe=[(DpK1*)2 + (DpK2*)
2 ]0.5.
F.J. Millero et al. / Marine Chemistry 100 (2006) 80–94 93
The equations can be used to examine the thermody-
namics of the carbonate system in most estuarine and
marine waters. It should be pointed out that our equa-
tions assume that seawater is diluted with pure water.
This may not be the case for some estuarine systems. If
the composition is known one can use Pitzer models
(Millero and Roy, 1997; Millero and Pierrot, 1998) to
account for the difference in the composition of estua-
rine waters that differ from seawater diluted with pure
water.
Acknowledgements
This work was supported by the Oceanographic
Section of National Science Foundation and the Na-
tional Oceanic and Atmospheric Administration.
References
Clayton, T., Byrne, R.H., 1993. Spectrophotometric seawater pH
measurements: total hydrogen ion concentration scale calibra-
tion of m-cresol purple and at-sea results. Deep-Sea Res. 40,
2115–2129.
Dickson, A.G., 1981. An exact definition of total alkalinity and a
procedure for the estimation of alkalinity and total inorganic
carbon from titration data. Deep-Sea Res. 28A, 609–623.
Dickson, A.G., 1984. pH scales and proton-transfer reactions in
saline media such as seawater. Geochim. Cosmochim. Acta 48,
2299–2308.
Dickson, A.G., 1990a. Thermodynamics of the dissociation of boric
acid in synthetic seawater from 273.15 to 318.15K. Deep-Sea Res.
37, 755–766.
Dickson, A.G., 1990b. Standard potential of the reaction:
AgCl(s)+1.2H2(g)=Ag(s)+HCl (aq), and the standard acidity
constant of the ion HSO4� in synthetic sea water from 273.15 to
318.15. J. Chem. Thermodyn. 22, 113–127.
Dickson, A.G., 2004. Reference material batch information (http://
www-mpl.ucsd.edu/people/adickson/CO2_QC/Level1/Batches.
html).
Dickson, A.G., Millero, F.J., 1987. A comparison of the equilibrium
constants for the dissociation of carbonic acid in seawater media.
Deep-Sea Res. 34, 1733–1743.
Dickson, A.G., Riley, J.P., 1979. The estimation of acid dissociation
constants in seawater from potentiometric titrations with strong
base: I. The ion product of water—Kw. Mar. Chem. 7, 89–99.
Goyet, C., Poisson, A., 1989. New determination of carbonic acid
dissociation constants in seawater as a function of temperature and
salinity. Deep-Sea Res. 36, 1635–1654.
Hansson, I., 1973. A new set of acidity constants for carbonic acid
and boric acid in seawater. Deep-Sea Res. 20, 461–478.

F.J. Millero et al. / Marine Chemistry 100 (2006) 80–9494
Harned, H.S., Bonner, F.T., 1945. The first ionization constant of
carbonic acid in aqueous solutions of sodium chloride. J. Am.
Chem. Soc. 67, 1026–1031.
Harned, H.S., Davis Jr., R.D., 1943. The ionization constant of
carbonic acid in water and the solubility of carbon dioxide in
water and aqueous salt solutions from 0 to 50 8C. J. Am. Chem.
Soc. 65, 2030–2037.
Harned, H.S., Scholes, S.R., 1941. The ionization constant of HCO3�
from 0 to 50 8C. J. Am. Chem. Soc. 63, 1706–1709.
Johansson, O., Wedborg, M., 1982. On the evaluation of potentio-
metric titrations of seawater with hydrochloric acid. Oceanol. Acta
5, 209–218.
Lee, K., Millero, F.J., Campbell, D.M., 1996. The reliability of the
thermodynamic constants for the dissociation of carbonic acid in
seawater. Mar. Chem. 55, 233–245.
Lee, K., Millero, F.J., Wanninkhof, R., 1997. The carbon dioxide
system in the Atlantic Ocean. J. Geophys. Res. 102, 15696–15707.
Lee, K., Millero, F.J., Byrne, R.H., Feely, R.A., Wanninkhof, R.,
2000. The recommended dissociation constants for carbonic
acid in seawater. Geophys. Res. Lett. 27, 229–232.
Lueker, T.J., Dickson, A.G., Keeling, C.D., 2000. Ocean pCO2
calculated from dissolved inorganic carbon, alkalinity and equa-
tions for K1 and K2: validation based on laboratory measure-
ments of CO2 in gas and seawater at equilibrium. Mar. Chem.
70, 105–119.
Mehrbach, C., Culberson, C.H., Hawley, J.E., Pytkowicz, R.M., 1973.
Measurement of the apparent dissociation constants of carbonic
acid in seawater at atmospheric pressure. Limnol. Oceanogr. 18,
897–907.
Millero, F.J., 1979. The thermodynamics of the carbonate system in
seawater. Geochim. Cosmochim. Acta 43, 1651–1661.
Millero, F.J., 1995. Thermodynamics of the carbon dioxide system in
the oceans. Geochim. Cosmochim. Acta 59, 661–667.
Millero, F.J., 1996. Chemical Oceanography. CRC Press, Boca Raton,
FL.
Millero, F.J., Pierrot, D., 1998. A chemical equilibrium model for
natural waters. Aquat. Geochem. 4, 153–199.
Millero, F.J., Poisson, A., 1981. International one-atmosphere equa-
tion of state of seawater. Deep-Sea Res. 28, 625–629.
Millero, F.J., Roy, R.N., 1997. A chemical equilibrium model for the
carbonate system, in natural waters. Croat. Chem. Acta 70, 1–38.
Millero, F.J., Zhang, J.Z., Lee, K., Campbell, D.M., 1993. Titration
alkalinity of seawater. Mar. Chem. 44, 153–165.
Millero, F.J., Pierrot, D., Lee, K., Wanninkhof, R., Feely, R., Sabine,
C.L., Key, R.M., Takahashi, T., 2002. Dissociation constants for
carbonic acid determined from field measurements. Deep-Sea
Res. 49, 1705–1723.
Mojica-Prieto, F.J., Millero, F.J., 2002. The values of pK1+pK2 for
the dissociation of carbonic acid in seawater. Geochim. Cosmo-
chim. Acta 66, 2529–2540.
Pitzer, K.S., 1991. Theory: ion interaction approach: theory and
data collection. In: Pitzer, K.S. (Ed.), Activity Coefficients in
Electrolyte Solutions, vol. I, 2nd ed. CRC Press, Boca Raton,
FL, pp. 75–153.
Roy, R.N., Roy, L.N., Lawson, M., Vogel, K.M., Porter-Moore, C.,
Davis, W., Millero, F.J., Campbell, D.M., 1993. The dissociation
constants of carbonic acid in seawater at salinities 5 to 45 and
temperatures 0 to 45 8C. Mar. Chem. 44, 249–259.
Wanninkhof, R., Lewis, E., Feely, R.A., Millero, F.J., 1999. The
optimal carbonate dissociation constants for determining surface
water pCO2 from alkalinity and total inorganic carbon. Mar.
Chem. 65, 291–301.