Initial Environmental Examination - Ujjayanta Palace Complex

ARTICLE IN PRESS
0967-0645/$ - se
doi:10.1016/j.ds
�CorrespondiE-mail addre
Deep-Sea Research II 51 (2004) 1151–1171
www.elsevier.com/locate/dsr2
The dispersal of the Amazon and Orinoco River water in thetropical Atlantic and Caribbean Sea: Observation from space
and S-PALACE floats
Chuanmin Hua,�, Ellyn T. Montgomeryb, Raymond W. Schmittb,Frank E. Muller-Kargera
aCollege of Marine Science, Institute for Marine Remote Sensing, University of South Florida, 140 Seventh Ave. S.,
St. Petersburg, FL 33701, USAbDepartment of Physical Oceanography, Woods Hole Oceanographic Institution, Woods Hole, MA 02543, USA
Received 28 October 2002; accepted 15 April 2004
Available online 25 September 2004
Abstract
The temporal evolution of spatial patterns of the colored water mass associated with the discharges of the Amazon
and Orinoco Rivers between 1997 and 2002 was examined using concurrent in situ and satellite observations in the
region bounded by 01N–241N and 701W–401W. Patches of low-salinity (�32–34) surface waters were frequently
observed with Salinity Profiling Autonomous LAgrangian Current Explorer (S-PALACE) floats as far as 2000 km away
from the mouths of the Amazon and Orinoco Rivers. Ocean-color data collected with the Sea-viewing Wide Field-of-
view Sensor (SeaWiFS) show that these patches originate with these rivers. Chlorophyll (Chl) and colored dissolved
organic matter (CDOM) distribution estimated with SeaWiFS data are well correlated with low sea-surface salinity
(SSS) throughout the observation period (average correlation coefficients for monthly observations of �0.6 for the
SSS–CDOM relationship and �0.5 for the SSS–Chl relationship). The color of the water in the river plumes is
dominated by CDOM rather than Chl light absorption, in contrast to adjacent open-ocean and equatorial upwelling
regions, where optical properties are primarily controlled by Chl. The mean CDOM absorption coefficient for the area
covered by the Amazon’s plume showed a peak in July for the 1998–2001 period, which lagged the Amazon’s
hydrograph by one month. The timing of the CDOM peak along different sections of the Amazon River plume implies
an estimated advection speed of �35 cm s�1 within the plume. Anti-cyclonic rings (eddies) with diameters of
400–500 km were observed moving along the northeastern coast of South America every year and in all seasons, at a
frequency of about one every 30–60 days. These eddies moved to the northwest at a speed of 8–20 cm s�1, with higher
speeds observed during the first half of each calendar year. The average depth of the Amazon plume for SSS ranging
from 32 to 35 was 20–30m, and the total fresh-water volume contained in the plume was consistent with discharge rates.
Due to uncertainties in the Chl and CDOM absorption coefficient estimates in river plumes, accurate estimation of the
rivers’ impact on regional primary production remains a challenge. The paired SeaWiFS and S-PALACE float
e front matter r 2004 Elsevier Ltd. All rights reserved.
r2.2004.04.001
ng author. Tel.: +1-727-5533987; fax: +1-727-5531103.
ss: [email protected] (C. Hu).

ARTICLE IN PRESS
C. Hu et al. / Deep-Sea Research II 51 (2004) 1151–11711152
observations validate the hypothesis that the coherent surface color patches seen annually far offshore in the tropical
North Atlantic are caused by dispersal of Amazon and Orinoco River water. In contrast, wind-driven upwelling near
the edge of the North Brazil Current retroflection, another mechanism causing color enhancement, is not suggested by
these data sets.
r 2004 Elsevier Ltd. All rights reserved.
1. Introduction
River discharge plays an important role in thehydrological cycle and thermodynamic stability ofthe ocean. Knowledge of the variations in theextent and dispersal patterns of river plumes, andtheir mixing rates with oceanic water is thereforecritical in all aspects of continental shelf andregional oceanography (e.g., Lohrenz et al., 1990).Yet there are few observations to help understandthe fate of water derived from the world’s majorrivers. Of particular interest is the effect of riverslike the Amazon and the Orinoco on the adjacentocean. The combined discharge from these riversrepresents nearly 20% of the total global annualfresh-water discharge via rivers, which is alldelivered into the western tropical North Atlantic.This study uses ocean-color satellite imagery andconcurrent in situ hydrographic observations toexamine the dispersal pattern of the Amazonand the Orinoco River waters over a period offive years.
1.1. The Amazon River plume
The Amazon is the world’s largest river in termsof fresh-water discharge (Milliman and Meade,1983; Perry et al., 1996). The annual meandischarge rate onto the north Brazilian shelfat the equator is (1.9370.13)� 105m3 s�1 (Perryet al., 1996). The Amazon’s plume spreads off-shore and northwestward along the north Brazi-lian coast, covering most of the continental shelffrom 11S to 51N (Muller-Karger et al., 1988, 1995).Beyond this region, the Amazon’s water has beentraced northwestward into the Caribbean Seaand eastward in the North Atlantic (Muller-Karger et al., 1988, 1995; Johns et al., 1990).Hydrographic surveys by Lentz and Limeburner
(1995) revealed that the Amazon Plume over theshelf is typically 3–10m thick and between 80 and
4200 km wide. Both chlorophyll (Chl) concentra-tion and primary productivity on the continentalshelf are greatest in the river–ocean transitionzone, where the bulk of heavy sediments settle outof surface waters (Smith and Demaster, 1996). Thecombination of riverine nutrient input and in-creased irradiance availability creates a highlyproductive transition zone, the location of whichvaries with the discharge from the river. Phyto-plankton biomass and productivity of over 25mgChl-am�3 and 8 g Cm�2 d�1, respectively, arefound in this transition region (Smith and De-master, 1996). Because of this, the North Brazilshelf acts as a significant sink for atmospheric CO2
(Ternon et al., 2000).Muller-Karger et al. (1988, 1995) discovered
what appeared to be regular seasonal changesin the patterns of dispersal of the Amazon water inthe western tropical Atlantic. They proposed thatduring the first half of the year the Amazon watergenerally dispersed to the northwest, toward theCaribbean Sea and over a broad geographicarea. This included a coastal turbid zone, a largeriver plume and offshore lenses of low-salinitywater. However, during the second half of theyear, the Amazon plume flows around the NorthBrazil Current (NBC) retroflection near 5–101N,and is carried eastward in the meandering northequatorial counter current (NECC). Johns et al.(1990) reported that the NBC retroflectionregularly shed large anti-cyclonic eddies. Richard-son et al. (1994) and Fratantoni and Glickson(2002) further attempted to describe the eddies andquantify the frequency at which they are gener-ated. Muller-Karger et al. (1988, 1995) speculatedthat the river-derived water probably containedboth colored dissolved organic matter (CDOM)and phytoplankton growing on river-derivednutrients, and that both contributed to thecolor that traced the river plume in ocean-colorimagery.

ARTICLE IN PRESS
C. Hu et al. / Deep-Sea Research II 51 (2004) 1151–1171 1153
Longhurst (1993) argued that the colored waterseen in the NBC retroflection and NECC was dueto phytoplankton blooming by action of eddyupwelling (e.g., Woods, 1988), and not due to thedispersal of Amazon water. In subsequent compa-nion papers, Longhurst (1995) and Muller-Kargeret al. (1995) further explored the two separatemechanisms proposed to explain the seasonalformation of the plume. However, both concludedthat without extensive in situ data and withoutbetter imagery than that provided by the coastalzone color scanner (CZCS) (the only ocean-colordata available to that date), it would be difficult toconclusively prove which of the mechanismsdominated the surface color signal observed.Remote sensing is the only viable approach to
measure the temporal variability of the dispersal ofwaters from large rivers such as the Amazon oversynoptic scales. As we enter the era of globalobserving systems, we now have superior ocean-color satellite sensors as well as devices deployed insitu. We are now in an excellent position to revisitthe origin of the color observed in the tropicalNorth Atlantic with a multi-year time series ofexcellent remote sensing and concurrent in situobservations.
1.2. The Orinoco River plume
Ranked generally as the 4th of the world’s riversin terms of flow, and the largest river in Venezuela,the Orinoco discharges a mean of (3.1070.38)� 104m3 s�1 fresh water into the southernCaribbean Sea. Discharge ranges from1� 104m3 s�1 in March to 7� 104m3 s�1 inAugust (Perry et al., 1996; Muller-Karger andAparicio Castro, 1994). Previous studies haveshown that the Orinoco River plume covers theeastern and northern Caribbean Sea on a seasonalbasis (Muller-Karger et al., 1989; Bidigare et al.,1993; DelCastillo et al., 1999). Using CZCSimages, Muller-Karger et al. (1989) concludedthat river discharge was one of the major factorscontrolling the pigment distribution in the widerCaribbean Sea and that the Caribbean wasbiologically productive due to an abundance ofnutrients derived from river discharge and upwel-ling. The surface area covered by this plume may
exceed 160,000 km2, and therefore the only way tostudy it synoptically is also through the use ofremote sensing.
1.3. Scope of this study
Despite these pioneering efforts, several keyquestions have remained unanswered, namely:
(1)
What is the nature of the plumes? Are they theresult of colored Amazon water or are they theresult of phytoplankton blooms stimulated byeddy pumping?(2)
How deep are the plumes in the high seas andhow fast do they move?These questions are the focus of this paper. Weprove that the coloration of these waters isprimarily due to the discharge of large rivers andreport on their depth and dynamics.
2. Methods
2.1. Satellite data
The Sea-viewing Wide Field-of-view Sensor(SeaWiFS) satellite sensor, launched in August1997, provides complete and calibrated coverageof the global ocean reflectance every two days(Hooker et al., 1992; McClain et al., 1998; Barneset al., 1999). We obtained the SeaWiFS Level-3products from the Distributed Active ArchiveCenter (DAAC) at the NASA Goddard SpaceFlight Center, USA. The products included theglobal 9-km resolution Chl-a concentration andspectral water-leaving radiance (six channels at412, 443, 490, 510, 555, and 670 nm, respectively).The data were generated using the most recentalgorithms and corrections suggested by NASA(SeaWiFS Version 4 products of summer 2002).Both calibration and algorithm improvementswere included (Gordon and Wang, 1994; Dingand Gordon, 1995; Arnone et al., 1998; O’Reillyet al., 2000; Hu et al., 2001). For the match-up ofconcurrent in situ and satellite observations weused eight-day satellite data composites. To studythe seasonal variability of the plume we used themonthly composite data.

ARTICLE IN PRESS
Fig. 1. Diagram of a typical S-PALACE profile sequence.
C. Hu et al. / Deep-Sea Research II 51 (2004) 1151–11711154
CDOM (also called Gelbstoff or yellow sub-stance) is an important riverine constituent thatoften serves as a conservative tracer (e.g., Hu et al.,2003). Both CDOM and Chl-a absorb lightstrongly in the blue, but a semi-analytical algo-rithm has been developed to estimate both Chlconcentration and CDOM absorption coefficientat 400 nm (a proxy for CDOM abundance) fromhigh-quality remote sensing data (Carder et al.,1997, 1999). The algorithm was designed for themoderate resolution imaging spectroradiometer(MODIS, Salomonson et al., 1989), but it alsocan be applied to the SeaWiFS spectral water-leaving radiance data (Hu et al., 2003). While thisnon-linear algorithm ideally should be applied atthe daily, single image level, we applied thealgorithm to the eight-day average spectralwater-leaving radiance to estimate the meanCDOM absorption coefficient and Chl-a concen-tration. The underlying assumption was that therewas little temporal variation within a 9-km pixel inCDOM and Chl over an eight-day period. Wetested this assumption by comparing the series ofdaily CDOM and Chl products with the eight-daymeans series, and the error was less than 5% formore than 95% of the pixels in the study area. Theeight-day means and particularly the monthlymeans facilitated visual interpretation of thespatial distribution of the CDOM absorptioncoefficient and Chl concentration.Synoptic sea-surface temperature (SST) patterns
were examined using eight-day, 9-km resolutionAVHRR composites. The SST data were exam-ined primarily to help determine whether featuresseen in the ocean-color images were associatedwith apparent upwelling or not, based on theassumption that upwelling waters would be coolerthan adjacent oceanic surface waters (e.g., Muller-Karger et al., 2000). In the tropical waters,however, upwelling may not be well revealed bysatellite SST data due to the small changes in SSTbetween upwelled and surrounding waters.
2.2. Field data
As part of the Atlantic circulation and climateexperiment (ACCE), Salinity Profiling Autono-mous LAgrangian Current Explorer (S-PALACE)
floats were used to examine the physical propertiesof the upper ocean in the tropical Atlantic. Thesefloats are autonomous collectors of temperatureand salinity profiles, which are telemetered to theusers’ laboratories. The floats used in this studywere deployed in two groups: 10 floats weredeployed along 61N in July 1997 and 30 floatswere deployed between 111N and 161N in October1998. The floats were ballasted to drift at 1000mand programmed to ascend to the surface every 10or 14 days (Fig. 1). They stayed at the surfacetransmitting data messages to ARGOS satellitesfor 24 hours and then descended to the ballastdepth. The floats drifted with the currents at theballast depth until ascending to begin the cycleagain (Fig. 1). The 10 floats deployed in 1997profiled and acquired data during descent in the14-day cycle. The other 30 floats profiled andacquired data during ascent in the 10-day cycle.This study was restricted to profiles acquiredbetween January 1998 and December 2001.A quality control process removed spikes and
identified potential sensor problems. For thisstudy, if temperature or salinity data were suspect,the entire profile was discarded. Once a float hadtwo consecutive profiles with suspect data, the restof the profiles collected by that float werediscarded. Following these criteria, 38% of thefloats transmitted valid temperature and conduc-tivity data for at least three years.

ARTICLE IN PRESS
C. Hu et al. / Deep-Sea Research II 51 (2004) 1151–1171 1155
Conductivity data from the S-PALACE floatswas prone to drift as a result of biofouling or othersensor/seawater interactions, as is common withsensors deployed for extended periods. Each profilewas corrected to allow overlay of the deep theta-salinity profile of the CTD acquired when the floatwas deployed. The ability to reference the salinityprofiles to stable deep theta-salinity values gaveconfidence that the very low surface salinitiesobserved were not artifacts. In addition, observedhigher surface salinities in open-ocean waters sub-sequent to profiles in waters with low surface salinityalso validated functioning of a float’s sensors.
2.3. Correlation study of paired SeaWiFS and float
data
The database of 2888 float profiles covering the1998–2001 period was first screened using severalquality control flags. For this study, we restrictedthe profile database to 0–241N and 70–401W and tothose days when sea-surface salinity (SSS) less than35 was detected (all salinity 435 data found onthose days were also used); this left a total of 530data profiles. The shallowest observations were atabout 5m, and those salinities were considered to beSSS. We used only the top 200m of each profile inorder to focus on the vertical structure of the riverplumes. For each of these profiles (location andtime), we searched for the corresponding SeaWiFSfile and pixel location from the time series of eight-day composites. Because of abundant cloud cover inthe study region, there were cases when no SeaWiFSmatches could be obtained. In these cases, we usedthe average value of the surrounding pixels within3� 3 or 5� 5 pixels as surrogates. Even allowingthis substitution, only 470 matching float SSS andSeaWiFS data were found, of which 367 came from1� 1 pixels, 89 came from 3� 3 pixels, and 14 camefrom 5� 5 pixels. Data pairs were binned bycalendar month and the monthly correlationbetween Chl-a or CDOM absorption coefficientand SSS was computed.
2.4. Barrier layer depth and fresh-water volume
Unlike in open waters of a tropical ocean, wherethe ‘‘mixed-layer depth’’ (MLD) typically may be
defined as the depth of a specific thermocline,river-plume waters feature a thin upper layer oflow-salinity water. To characterize the river-plumethickness we used instead the barrier layer depth(BLD), defined as the depth at which the salinitygradient or halocline is maximum (Lukas andLindstrom, 1991). The BLD is an indicator of thedepth at which vertical mixing between the fresh,buoyant river plume and the deep, saline seawateris inhibited. The plume salinity (PS) is defined asthe average salinity above the BLD, weighted bythe depth interval: PS ¼
RS dz=
Rdz; where the
integral is from the surface to the BLD. The areadistribution of plume water was estimated fromsatellite data (as traced by pixels containing highCDOM). The BLD, PS, and plume surface areawere used to estimate the fresh-water volumecontained in the plume extending into the westerntropical Atlantic.
3. Results and discussion
3.1. Spatial and temporal patterns
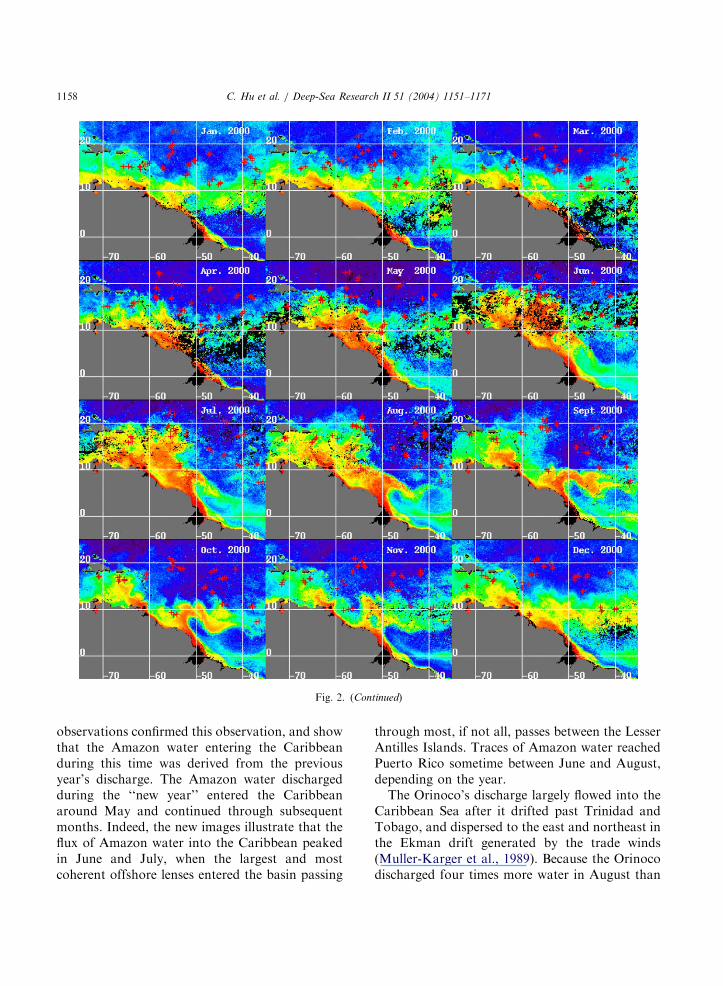
Fig. 2 presents the monthly composite ofCDOM absorption coefficient distribution mapsfor 1997–2002. Float surface locations for eachmonth were overlaid on the images. The colored,continuous water masses that extend from theAmazon and Orinoco River mouths (red–yellow–green colors) are the plumes or fresh-water lensesassociated with the rivers. Arguments and prooffor this assertion are provided below.The CDOM absorption coefficient images (from
here onward referred to as CDOM images)illustrate the marked seasonal cycles in thedispersal patterns of both the Amazon andOrinoco River plumes. The Amazon’s influenceon the North Brazil and French Guiana con-tinental shelf is apparent throughout the year. Asdescribed by Muller-Karger et al. (1988, 1995), theAmazon plume tends to disperse to the northwest,parallel to the continent, starting approximately inMarch–April. The surface area of the plumepeaked in approximately June–July, at which timeit also entered the Caribbean Sea in a wide(�500 km) band through the Lesser Antilles

ARTICLE IN PRESS
Fig. 2. Monthly composites of CDOM distribution maps estimated from SeaWiFS Version 4 data. Overlaid on the images are the
concurrent float locations. Note that the last group of images includes data from two partial years, namely 1997 and 2002.
C. Hu et al. / Deep-Sea Research II 51 (2004) 1151–11711156

ARTICLE IN PRESS
Fig. 2. (Continued)
C. Hu et al. / Deep-Sea Research II 51 (2004) 1151–1171 1157
Islands. The year 1998 was notably different,showing a reduced plume size and apparentlyminimal interactions with the Caribbean. This waslikely related to the 1997–1998 El-Nino.Starting in July–August, the effect of the NBC
retroflection became apparent. This phenomenonforced the plume to turn northeastward at about91N and 52.51W with the crest of the retroflectionextending up to 121N. The plume was entrained inthe NECC and flowed eastward, forming a sinuous
colored band in the tropical Atlantic. The coloredwater reached at least as far as 351W and 71N bylate September, after traveling a distance of43000 km from the river mouth. The dissipationof color in the western tropical Atlantic began inNovember and continued through March–April.A similar pattern was repeated every year.Muller-Karger et al. (1988) observed that during
February–May the Amazon water flowed into theCaribbean in a 150–200 km band. The new
ARTICLE IN PRESS
Fig. 2. (Continued)
C. Hu et al. / Deep-Sea Research II 51 (2004) 1151–11711158
observations confirmed this observation, and showthat the Amazon water entering the Caribbeanduring this time was derived from the previousyear’s discharge. The Amazon water dischargedduring the ‘‘new year’’ entered the Caribbeanaround May and continued through subsequentmonths. Indeed, the new images illustrate that theflux of Amazon water into the Caribbean peakedin June and July, when the largest and mostcoherent offshore lenses entered the basin passing
through most, if not all, passes between the LesserAntilles Islands. Traces of Amazon water reachedPuerto Rico sometime between June and August,depending on the year.The Orinoco’s discharge largely flowed into the
Caribbean Sea after it drifted past Trinidad andTobago, and dispersed to the east and northeast inthe Ekman drift generated by the trade winds(Muller-Karger et al., 1989). Because the Orinocodischarged four times more water in August than

ARTICLE IN PRESS
Fig. 2. (Continued)
C. Hu et al. / Deep-Sea Research II 51 (2004) 1151–1171 1159
in January (Fig. 3), its plume was largest in theSeptember–November time frame. Clearly, duringthis time, the eastern Caribbean was heavilyinfluenced by both rivers. This suggested that thebiogeochemical model of Muller-Karger et al.(1989), which discounted the relevance of theAmazon plume in the Caribbean during latesummer, was truly an oversimplification.The SeaWiFS images clearly show the anti-
cyclonic eddies (rings) shed by the NBC retro-
flection every year (see Johns et al., 1990, for adiscussion on eddy shedding dynamics). The ringswere most clearly seen in the November–Februarytime frame, i.e. prior to the annual destruction ofthe stable surface expression of the NBC retro-flection. But the rings are evident also throughoutthe rest of the year. Sometimes they are detected asonly subtle variations in the pigment gradienttracing eddy contours in the area northwest of theretroflection.

ARTICLE IN PRESS
Fig. 2. (Continued)
C. Hu et al. / Deep-Sea Research II 51 (2004) 1151–11711160
Some of the eddies were visible in the monthlycomposite images (Fig. 2), but the longer aver-aging process smeared the features. Visual exam-ination of the eight-day composites revealed thattypically 6–7 rings formed every year. Some of therings seemed to be shed even prior to completeclosing of the southeastern walls. The sheddingtime varied from year to year, but the period wasgenerally between 30 and 60 days. These observa-tions confirm the findings of Johns et al. (1990),
who speculated based on limited CZCS data thatthe rings had quasi-periods of 50 days. These ob-servations also agree with those from Fratantoniand Glickson (2002).There were no rings observed in October–De-
cember 1997, August–September 1999, August–October 2000, and August–October 2001. Theeddies had external diameters exceeding400–500 km, and they invariably moved north-westward along the outer continental shelf with a

ARTICLE IN PRESS
Jan Feb Mar Apr May Jun Jul Aug Sep Oct Nov Dec
Orinoco
Amazon
Time of the year
0
50
100
150
200
250
Dis
char
ge (
103 m
3 /s)
Jan Feb Mar Apr May Jun Jul Aug Sep Oct Nov Dec
Fig. 3. Mean7a standard deviation of the discharge of the
Amazon (1969–1978) and Orinoco Rivers (1979–1983). Repro-
duced fromMuller-Karger et al. (1989) with permission. Due to
technical difficulties concurrent (1998–2001) river discharge
data were not available for this study.
Jan Feb Mar Apr May Jun Jul Aug Sep Oct Nov Dec
Jan Feb Mar Apr May Jun Jul Aug Sep Oct Nov Dec
199719981999
200020012002
Lat = 15oN to 0oN
Lon = 62oW to 45oW
0.00
0.05
0.10
0.15
0.20
CD
OM
abs
orpt
ion
(400
nm
, m-1
)
Time of the year
(A)
Jan Feb Mar Apr May Jun Jul Aug Sep Oct Nov Dec
Jan Feb Mar Apr May Jun Jul Aug Sep Oct Nov Dec(B)
0.01
0.02
0.03
0.04
0.05
0.06
CD
OM
abs
orpt
ion
(400
nm
, m-1
)
Time of the year
Lat = 10 N to 5 N
Lon = 41 W to 39 W
199719981999
200020012002
Jan Feb Mar Apr May Jun Jul Aug Sep Oct Nov Dec
Jan Feb Mar Apr May Jun Jul Aug Sep Oct Nov Dec
0.02
0.04
0.06
0.08
0.10
0.12
CD
OM
abso
rpti
on (
400 n
m,
m-1
)
Time of the year
Lat = 20°° °
° °°°
N to 10°N
Lon = 72 W to 62 W
1997
1998
1999
2000
2001
2002
(C)
Fig. 4. Time series of mean CDOM absorption for the areas
specified by the latitude and longitude limits: (A) the Amazon
plume; (B) the tip of the Amazon plume; (C) Eastern
Caribbean.
C. Hu et al. / Deep-Sea Research II 51 (2004) 1151–1171 1161
speed of 1–2.51 every 16 days or �8–20 cm s�1,confirming the findings of Fratantoni and Glick-son (2002). The translational velocities agreed wellwith observations from Lagrangian drifters (Lime-burner et al., 1995) and moored current meters(Johns et al., 1990). Some uncertainties may existin these image-based estimates due to smearing inthe eight-day composites.Changes in the color of the western tropical
Atlantic were related to variability in riverdischarge. A time series of the mean monthlyCDOM absorption coefficient for 1997–2002 with-in the box bounded by 0–151N, 45–621W is shownin Fig. 4A. A positive correlation was foundbetween mean CDOM and the mean climatologi-cal Amazon River discharge. At most a one-monthtime lag was measured between climatologicaldischarge and maximum average CDOM absorp-tion (we were unable to find a source for recentAmazon stage height data and therefore weestablished a generalized relationship with meandischarge, estimated from stage height dataobtained at Manaus, Brazil, and compiled fromvarious sources spanning the period 1903–1988).Similar to the correlation study of ocean color
and Mississippi River discharge (Salisbury et al.,2001), we propose that the tight relationshipbetween discharge and regional CDOM concen-tration is additional evidence that the ocean-color
variability in this area is dominated by theAmazon River discharge. The small time lag isthe result of both the long distance between thestage gauge at Manaus and the Amazon River
ARTICLE IN PRESS
Jan Feb Mar Apr May Jun Jul Aug Sep Oct Nov Dec
Jan Feb Mar Apr May Jun Jul Aug Sep Oct Nov Dec
Lat = 15 N to 0 N
Lon = 62 W to 45 W
Time of the year
0.2
0.3
0.4
0.5
0.6
0.7
0.8
Ch
loro
ph
yll
co
nce
ntr
atio
n (
mg
/m3)
1997
1998
1999
2000
2001
2002
° °°°
Fig. 5. Time series of mean Chl concentrations for the same
area as for Fig. 4A.
C. Hu et al. / Deep-Sea Research II 51 (2004) 1151–11711162
delta, and the smeared time-lag effect introducedby the river water dispersing over this largeoceanic region.For a box bounded by 10–51N, 41–391W (this
box was chosen arbitrarily following the riverdispersal), the lag was more pronounced (Fig. 4B).Here, the mean CDOM first peaked in mid-September. We believe this corresponds to thetime at which Amazon River water reached theregion, i.e. about �3 months after the crest atManaus. Assuming that the timing of the stageheight at Manaus is in general representative of thewater level throughout the length of the AmazonRiver, considering that the Amazon water hadtraveled about 2700 km from the river mouth tothis region would imply that the Amazon waterdispersed around the retroflection at an averagespeed of about 35 cm s�1. This is within the rangeof velocities obtained from Lagrangian drifters(Limeburner et al., 1995). A second but smallerpeak in CDOM was seen during December andJanuary (in some years it may be larger, forexample 2000). We speculate that this representedthe trace of Amazon water that moved farther eastin the NECC during previous months and whichhad started to flow westward in the NorthEquatorial Current, as the surface NECC under-went its seasonal obliteration cycle. Anotherpossible reason for the peak in northern wintermay be local upwelling or advection from theAfrican coastal water. However, the salinity andtemperature profiles from the S-PALACE floats(see below) did not provide a definitive explana-tion of coloration in this 41–391W region.Results from a similar exercise for the eastern
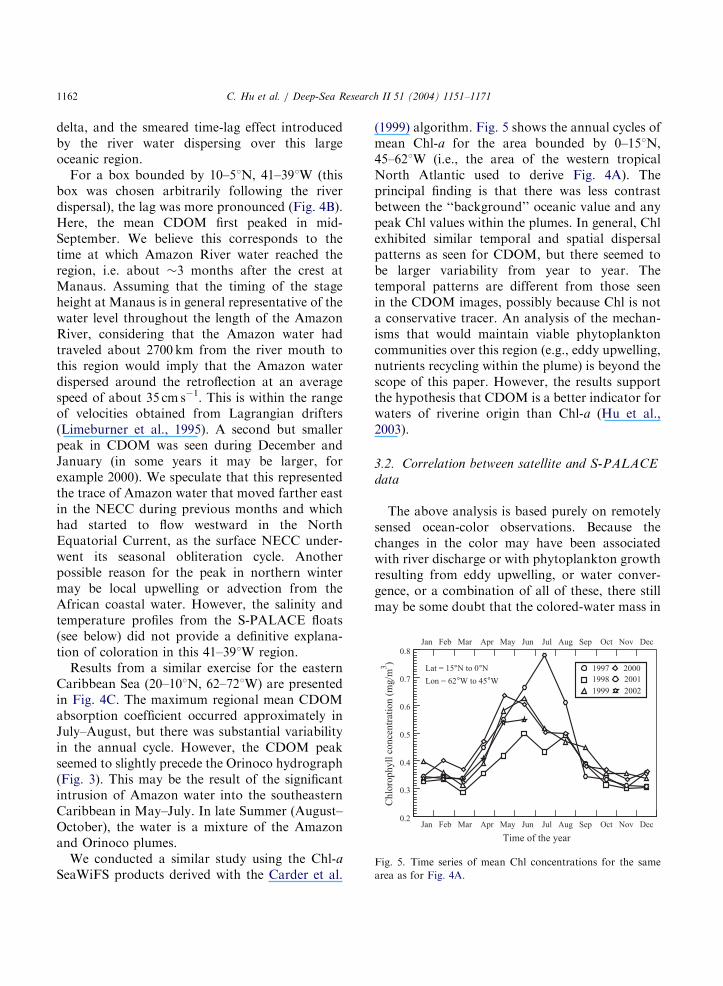
Caribbean Sea (20–101N, 62–721W) are presentedin Fig. 4C. The maximum regional mean CDOMabsorption coefficient occurred approximately inJuly–August, but there was substantial variabilityin the annual cycle. However, the CDOM peakseemed to slightly precede the Orinoco hydrograph(Fig. 3). This may be the result of the significantintrusion of Amazon water into the southeasternCaribbean in May–July. In late Summer (August–October), the water is a mixture of the Amazonand Orinoco plumes.We conducted a similar study using the Chl-a
SeaWiFS products derived with the Carder et al.
(1999) algorithm. Fig. 5 shows the annual cycles ofmean Chl-a for the area bounded by 0–151N,45–621W (i.e., the area of the western tropicalNorth Atlantic used to derive Fig. 4A). Theprincipal finding is that there was less contrastbetween the ‘‘background’’ oceanic value and anypeak Chl values within the plumes. In general, Chlexhibited similar temporal and spatial dispersalpatterns as seen for CDOM, but there seemed tobe larger variability from year to year. Thetemporal patterns are different from those seenin the CDOM images, possibly because Chl is nota conservative tracer. An analysis of the mechan-isms that would maintain viable phytoplanktoncommunities over this region (e.g., eddy upwelling,nutrients recycling within the plume) is beyond thescope of this paper. However, the results supportthe hypothesis that CDOM is a better indicator forwaters of riverine origin than Chl-a (Hu et al.,2003).
3.2. Correlation between satellite and S-PALACE
data
The above analysis is based purely on remotelysensed ocean-color observations. Because thechanges in the color may have been associatedwith river discharge or with phytoplankton growthresulting from eddy upwelling, or water conver-gence, or a combination of all of these, there stillmay be some doubt that the colored-water mass in

ARTICLE IN PRESS
1998
1999
2000
2001
(A)-1.00
-0.80
-0.60
-0.40
-0.20
0.00
r2 (s
urfa
ce s
alin
ity a
nd S
eaW
iFS
data
)
MonthJan Feb Mar Apr May Jun Jul Aug Spt Oct Nov Dec
(B)
0
5
10
15
20
25
30
35
# of
dat
a pa
irs
MonthJan Feb Mar Apr May Jun Jul Aug Spt Oct Nov Dec
Fig. 6. (A) Correlation between SSS and CDOM (open
symbols) and between SSS and Chl (solid symbols) for each
calendar month; (B) number of data pairs used in the
correlation calculation in (A).
C. Hu et al. / Deep-Sea Research II 51 (2004) 1151–1171 1163
the western tropical North Atlantic is derived fromlarge rivers. Indeed, some have argued intenselythat the color observed around the NBC retro-flection is associated with a phytoplankton bloomgrowing in upwelled waters (Longhurst, 1993,1995). In a bloom associated with oceanic upwel-ling, generally the phytoplankton concentration(or strong absorption of blue light) may bepositively correlated with SSS and negatively withSST (e.g., Muller-Karger et al., 2000). In contrast,river-plume waters typically show negative corre-lation between similar ocean-color signals and SSS(Hu et al., 2003). With the availability of the nearlyconcurrent SeaWiFS and hydrographic profiledata derived from the S-PALACE floats, we canaddress this long-standing question.Fig. 6A shows the correlation between SSS and
CDOM and between SSS and Chl for eachcalendar month for the area of 70–401W (Notethat the data pairs were found within eight-daycomposites and then binned by calendar month;those months when less than three matched datapairs were found were not included in thecorrelation study. See Section 2 for data selectioncriteria.) SSS was negatively correlated with bothCDOM and Chl. While there was some timedependence to the strength of these correlations,larger negative correlation coefficients were shownby the SSS–CDOM relationship. The averagecorrelation coefficient for the time series, weightedby the number of paired observations (shown inFig. 6B), is about �0.6 for the SSS–CDOMrelationship and approximately �0.5 for theSSS–Chl relationship. This again would suggest adominance of riverine influence on the major‘‘color’’ patterns seen in the region.To illustrate the relationship in more detail,
Fig. 7 shows CDOM distribution between 1November and 31 December 1999, and SSSand CDOM for all paired points within eight-day windows in this period. This periodwas selected rather arbitrarily for illustrationpurposes, and similar results were obtained forall eight-day SeaWiFS binned periods for whichpaired S-PALACE data were available. Two anti-cyclonic rings with diameters of about 400 km areclearly visible in Fig. 7A. The match-ups includeddata pairs north of Barbados (around 151N,
581W), near the northern extent of the NBCretroflection around 121N, 471W, i.e. at the edge ofthe core of the ‘‘Amazon plume’’, and across alarge area of clear water within the mid-tropicalNorth Atlantic Ocean, i.e. north and east of thecolored plumes. The parameters, plotted sequen-tially from west to east for each float location,show that when salinity decreased, CDOM in-creased, and vice versa, illustrating the strongcoherence between these parameters in offshoreregions. Note that the correlation and regressioncoefficients in Fig. 7B would change slightly ifhigher SSS points, associated with open-oceanwaters, were discarded.We examined the CDOM–salinity relationship
for each of the calendar months during the four-year period over which we had match-ups, to

ARTICLE IN PRESS
33
34
35
36
37
38
(A)
(B)
Surf
ace
salin
ity
0 5 10 15 20 25 30 35 40 45
Data points (west to east)
0.01
0.1
Surf
ace
a CD
OM
(40
0 nm
, m-1
)
SSS
aCDOM
1 November - 31 December 1999SSS = 38.18 -118.24 * aCDOM
r2=-0.74, n=41
Fig. 7. (A) CDOM distribution for November–December 1999
(Color legend is shown in Fig. 2), overlaid with float locations
(symbol ‘‘+’’) for the same period. Color legend is the same as
in Fig. 3. Two anti-cyclonic rings are visible on the image. Three
areas (marked as ‘‘1’’, ‘‘2’’, and ‘‘3’’) are chosen for water-type
classification study: (B) variation in SSS and CDOM at
locations shown on the images. The data pairs were matched
within eight-day windows and plotted from west to east.
C. Hu et al. / Deep-Sea Research II 51 (2004) 1151–11711164
determine whether this relationship was consistent,linear, and whether it changed from month tomonth. The results for the ensemble of all imageswere mixed and inconclusive to prevent a uniform,linear relationship for all seasons even though thedata all showed negative correlations (Fig. 6).Factors that may cause the variability in theregressions are lack of synopticity (eight-daywindow), a much coarser pixel resolution of theSeaWiFS data (9 km) relative to the minusculesurface area measured by the S-PALACE floatswhen at the surface, or even a mismatch betweenthe water observed by the satellite (possibly a thin
surface lens) and the shallowest float observation,which may be as deep as 5m or more. A non-linearrelationship between CDOM and salinity may bedue to either photobleaching or some otherCDOM consumption process. Clearly, there couldbe a tighter quality control process for match-upselection, and most likely also further improve-ments in the SeaWiFS algorithms, but this isbeyond the scope of this paper. It is unclearwhether the peculiar mechanism proposed for theformation of the plume, i.e. entrainment at thesurface into an offshore transport of water andmaterials from the immediate vicinity of thecontinental margin, also would have limited thenumber of S-PALACE drifters that could haveappeared in the core of the plume.We also compared the SSS data with paired
AVHRR SST data, but there was no discerniblerelationship; most of the data showed no correla-tion or only a slightly positive correlation betweenthese parameters. Visual examination of the SSTimagery did not reveal upwelling (cool-waterpatches) in the vicinity of the colored water.However, this image analysis alone cannot ruleout possible upwelling in the tropical Atlantic, asupwelling may not reach the surface and upwel-ling-induced SST changes may be too subtle.
3.3. Plume or bloom?
Our results support the concept that the coloredwater in the deep tropical North Atlantic betweenabout 601W and 401W is river-plume water.However, in an effort to dispel lingering doubtsabout whether the color of the plumes reflectsCDOM in waters of riverine origin or phytoplank-ton blooms associated with eddy-induced upwel-ling, we conducted additional tests using thehydrographic field data and the satellite bio-optical observations.According to the classical definition of Morel
and Prieur (1977), Case I waters are those wherethe optical properties are dominated by phyto-plankton and their associated debris and dissolvedorganic matter. However, river plumes are typi-cally Case II waters, i.e. CDOM and particulateabsorption do not covary. We chose threegeographical subregions (Fig. 7A) within which

ARTICLE IN PRESS
0.1
nm
, m
-1)
Area 1: clear, oligotrophic water
Area2: equatorial upwelling water
Area3: Amazon plume water
C. Hu et al. / Deep-Sea Research II 51 (2004) 1151–1171 1165
to examine the covariation between satellite-derived Chl-a and CDOM in sampling areasdefined by 25 (5� 5) pixels, namely:
n (
44
3
�
abso
rpti
o
Area 1 (around 5.51N, 481W): a clear-waterpatch in the oligotrophic ocean just south of theretroflection.
ll
�0.01
rop
hy
Area 2 (around 11N, 42.51W): a colored tonguelocated within the equatorial upwelling zone.
hlo
�0.01 0.1
CDOM absorption (443 nm, m-1
)
C
Fig. 8. CDOM absorption vs. Chl absorption at 443 nm for the
three areas (25 pixels in each area) shown in Fig. 7A; the solid
line is 1:1 line. These results suggest that satellite ocean data
alone may be used to distinguish various water masses.
Area 3 (around 81N, 47.51W): the ‘‘river-plume’’color in the retroflection.
CDOM absorption at 443 nm was estimatedas ag443 (m
�1)=ag400� exp(�0.014� (443–400))(Bricaud et al., 1981) while Chl absorption at443 nm was estimated as af443 (m
�1)=0.04�Chl0.668 (Bricaud et al., 1995) where Chl isthe Chl concentration in mgm�3. The relationshipbetween these two quantities for the three differentareas is shown in Fig. 8. The data were clearlyseparated into three clusters. Area 1 had the lowestChl and CDOM, with Chl dominating lightabsorption at 443 nm. Area 2 had elevated Chland CDOM, but they seemed well correlated. InArea 3, however, CDOM absorption dominatedand there was no apparent correlation betweenChl and CDOM absorption, supporting thehypothesis that the plume tracing the retroflectioncontained Case II waters.The S-PALACE floats allowed us to examine
the hydrographic profiles within the variousplumes (colored-water masses) and the adjacentclear ocean water. Because of the large number ofprofiles (2888 in total), we focused here on specificcase studies. We used all the profiles, however, inan attempt to estimate the total fresh-watervolume present in the western tropical NorthAtlantic over the period of the study.Fig. 9A shows the CDOM image for 6–13
March 1999 overlaid with the S-PALACE floatpositions for that time interval. Salinity andtemperature profiles for four floats that surfacednear 131N, between 551W and 581W on 13 March1999 are presented in Fig. 9B. The profile at55.461W showed surface salinities of about 36.3and a salinity maximum of about 37.1 around90m. This was close to the ‘‘background’’ proper-ties, obtained as an average of six profiles from 3
to 4 March 1999 (thick solid lines). The MLD forthe 55.461W profile was around 70m. The salinitydifference between the surface (36.24) and thesubsurface maximum (37.08) implied some resi-dual surface freshening, perhaps due to mixing ofplume water in previous seasons. The differencebetween this profile and the ‘‘background’’ profilealso suggests such historical or legacy mixing.Moving to the west at this latitude (58.821W),CDOM increased, and a shallower, secondaryhalocline was apparent. A 25-m lens of water withsalinityo36 was apparent. At locations with moreCDOM (symbols & and D), the salinity profilesshow similar vertical structure but with surfacesalinities further declining to as low as 33,suggesting more riverine influence. The steephalocline was similar to that reported for theAmazon continental shelf within the 100m isobath(Lentz and Limeburner, 1995), except that indeeper waters an intermediate salinity layer isfound below the surface due to mixing in theprevious seasons.The temperature profiles show that the fresh-
water lens was warmer than the more salinesurface water at the same latitude by as much as1.5 1C. While there is a possibility that thetemperature difference is due to water massesoriginating at widely differing latitudes, it is morelikely that this difference was due to increased light

ARTICLE IN PRESS
32 34 36 38 40
Salinity
0
50
100
150
200
Dep
th (
m)
15 20 25 30
Temperature (°C)
58.61°W
55.46°W57.19°W
58.82°W
Empty: SalinityFilled: Temperature
(A)
(B)
Fig. 9. (A) CDOM distribution for 6–13 March 1999, overlaid
with concurrent S-PALACE float locations (color legend is
shown in Fig. 2). An anti-cyclonic ring, centered at 9.51N and
54.51W, is forming; (B) salinity–temperature profiles from the
four S-PALACE floats on 13 March 1999. Solid lines without
symbols are comprised of profiles from early March within a 21
radius of 171N 541W, in areas of minimum CDOM. For the
symbols J, &, n, and B, the SeaWiFS-derived CDOM
absorption coefficient (400 nm) was 0.023, 0.036, 0.104, and
0.014m�1, respectively.
C. Hu et al. / Deep-Sea Research II 51 (2004) 1151–11711166
absorption by the colored, CDOM-rich fresh-water plume (CDOM would selectively absorbmore of the energetic UV and blue light than clearwater). Another possibility is that shallow fresh-water surface layer is isolated from the deepersaltier water and therefore trap heat in the upperlayer.All profiles in colored waters within the retro-
flection and near its edge, and in colored waters
offshore in the Caribbean, showed a noticeablesurface decrease in salinity. The difference betweensurface salinity and the subsurface salinity max-imum may be greater than 3, indicating significantfresh water content over large geographic areas.None of the floats indicated an upwelling process(i.e., salinity maximum at the surface withtemperatures less than 26 1C).As described in Muller-Karger et al. (1988), the
first observations of extensive fresh water at thesurface across the tropical North Atlantic Oceanwere explained by direct accumulation of precipi-tation from the intertropical convergence zone(ITCZ) (e.g., Neumann, 1969). Assuming an upperwater column seawater end-member in the regionof salinity 36.8, in order to obtain a surface layerof 20m with an average salinity of 34.5 it isnecessary to mix 1.25m [i.e., (1–34.5/36.8)� 20mE1.25m] of pure fresh water withthe saline end-member. Even at a high rate ofprecipitation of 8mmday�1 estimated to occurunder the axis of the ITCZ over the tropicalAtlantic, it would take 4150 days of precipitationat one location to deliver this amount of freshwater. Clearly, the salinity patterns re-occur everyyear and they maintain temporal coherence eachseason. Indeed, the net fresh-water accumulation(P-E) under the ITCZ is much more variable forany one location in the tropical North Atlantic(Schmitt, 1995; Dessier and Donguy, 1994) overany reasonable period over which we observe theplumes. Further, we observe such low surface-salinity plumes (sometimes even salinities below32) in the vicinity of Barbados and the LesserAntilles (i.e., upward of 2000 km from theAmazon’s mouth) during January–March periods,i.e. when the ITCZ is at its maximum southernextent (south of the equator and of the Amazon’smouth), and when evaporation is expected to be amaximum in this region.As mentioned previously, very large patches of
colored water are observed flowing toward andinto the Caribbean during approximately the first5–7 months of each year. The SeaWiFS images forJune and July 1999 show this phenomenon even asthe retroflection began to take shape. We exam-ined S-PALACE salinity profiles in the regionbounded by 12–181N, 62–651W, and found a

ARTICLE IN PRESS
C. Hu et al. / Deep-Sea Research II 51 (2004) 1151–1171 1167
surface layer of about 20–30m with salinities aslow as 32 in highly colored waters. This is over2000 km from the Amazon river mouth. Allsalinity profiles examined in the S-PALACEdatabase for this region showed that east of theAntilles the halocline was shallower and surfacesalinities were lower than those in Amazon plumewater west of the northern Lesser Antilles,suggesting that passage through the islandchain led to deeper mixing. In contrast, thoseS-PALACE floats that entered the Orinoco Riverplume in approximately October–November,when this plume reached its maximum spatialextent (Muller-Karger et al., 1989), showed thatthe Orinoco’s plume thickness was 20–30m atsurface salinities of �32.Based on these observations, we concluded that
the low surface-salinity values found in and nearthe NBC retroflection are the result of thedispersal of Amazon River water. Riverine fresh-water input and offshore dispersal is the onlyreasonable explanation of this phenomenon.
3.4. Fresh-water volume
BLD and PS were computed for all float profileswith SSS o35 (a total of 151 profiles) for thewestern tropical Atlantic between 401W and 621W.Note that in other areas of the world SSS of 35may not indicate the presence of a river plume. Wefound that PS=0.881� SSS+4.352 (r ¼ 0:982;n ¼ 151). The salinity profiles exhibited similarvertical structure below the first few meters fromthe surface, regardless of their PS value. Binningthe profiles by BLD, 20 had BLD around 15m, 74were around 25m, 43 showed about 35m, and 14had 45m. There was no significant trend betweenBLD and PS, suggesting that the dispersal, andtherefore the dilution of the plume, occurredpreferentially in the horizontal direction.Using the salinity profile characteristics de-
scribed above and the correlation between SSSand CDOM, we attempted to estimate the totalfresh-water volume in the western tropical Atlanticusing SeaWiFS data. Due to lack of complete datacoverage for the entire plume area, severalassumptions were made:
(1)
PS can be derived empirically from SeaWiFSCDOM absorption coefficient estimates. Weused the relationship found for 7 November–7December 1999 (SSS=36.47–28.1�CDOM,r ¼ �0:74; n ¼ 25) to derive SSS for the wholetime series of satellite data. PS was thenestimated as PS=0.881� SSS+4.352. Salinityfor the marine end-member was assumed to be36.47, and pure fresh-water depth was esti-mated as (1–PS/36.47)�BLD.(2)
We assumed (based on the BLD statistics) thatBLD=30m for PS434, 25m for 32oPSp34,7+(25–7)� (PS–22)/(32–22) for 22oPSp32,7m for PSp22 (based on data from Lentz andLimeburner, 1995).(3)
A threshold of 0.025m�1 for the CDOMabsorption coefficient allows discriminationof river plume from non-plume oceanic waters.Clearly, this crude threshold has limitations,but we excluded pixels associated with equa-torial upwelling or with high CDOM valuesobserved moving westward near the easternedge of the images from our calculations.Fig. 10 shows the total fresh-water volume(in 1012m3), estimated to be derived from theAmazon River, dispersed over the western tropicalNorth Atlantic (0–151N, 45–621W). If we assumethat the mean discharge of the Amazon Riverbetween mid-April and July is about2.2� 104m3 s�1 (Fig. 3), then the total volumedischarged between mid-April and July is about2� 1012m3. This is essentially the same as thedifference in estimated fresh-water volume foundoffshore between July and April in Fig. 10. Thearea of the fresh water in this region peaked in Julyat �1.2� 106 km2. This is seven times larger thanthe conservative estimate for the Orinoco Riverplume (160,000 km2, Muller-Karger et al., 1989).Estimates of the amount and distribution of
surface fresh water in the world’s oceans areessential to aid in circulation and climate modelsand predictions (Schmitt, 1995) and to helpunderstand biogeochemical processes. Histori-cally, however, it has been difficult to obtain theseestimates, and much less definition of the temporaland spatial variability in these patterns. Therefore,the dispersed fresh-water volume estimates based

ARTICLE IN PRESS
Jan Feb Mar Apr May Jun Jul Aug Sep Oct Nov Dec
Jan Feb Mar Apr May Jun Jul Aug Sep Oct Nov Dec
199719981999
200020012002
Month
0
1
2
3
Fres
h w
ater
vol
ume
(1012
m3 )
Fig. 10. Monthly time series of fresh-water volume dispersed in
the western tropical Atlantic, estimated from SeaWiFS and
S-PALACE data.
C. Hu et al. / Deep-Sea Research II 51 (2004) 1151–11711168
on ocean-color imagery, while crude, provide thefirst assessments of the river-derived fresh-waterbudget in the tropical North Atlantic Ocean. Theyshould help clarify the spatial variability in salt,nutrient, and carbon in the region, and theydemonstrate the importance of materials derivedfrom the continental margin in the adjacent openocean, over distances exceeding 2000 km. Oncelarge numbers of float profiles are available foranalysis with satellite images, more reliable esti-mates should emerge. Much work needs to bedone, however, particularly in the development ofmore reliable algorithms to separate CDOM fromother optically important constituents and in theimproved understanding of how CDOM is relatedto SSS.
4. Summary and conclusions
We have studied the spatial and temporalevolution patterns of colored water in the westerntropical North Atlantic Ocean and in the Car-ibbean Sea. Using nearly concurrent (eight-daywindow) S-PALACE floats and SeaWiFS datacollected over four years (1998–2001) we foundthat the colored-water mass was associated withriverine discharge originating primarily from theAmazon and the Orinoco Rivers. Several findings
led to this conclusion: (1) the plumes appeared tobe continuous features, linking the river mouthswith patterns far offshore, and these patterns werestable over time and seasonally recurrent; (2)ocean color (CDOM and Chl) was highly andnegatively correlated with SSS. Waters withsalinities of 32–35 exhibited strong coloration upto thousands of kilometers away from the rivermouths. Further, SSS had better average correla-tion with CDOM (r approximately �0.6) thanwith Chl (r approximately �0.5) for the 470 datapairs found over the four-year period; (3) thecolored-plume water had distinguishable Case IIcharacteristics with CDOM dominating the ab-sorption properties. CDOM was not correlatedwith Chl for these waters. In contrast, in adjacentopen-ocean and equatorial upwelling waters, Chlabsorption was well correlated with CDOM; and(4) salinity–temperature profiles for the coloredwater showed typical riverine characteristics thatare difficult to explain by either precipitation orupwelling.Indeed, the ability of the semi-analytical algo-
rithm (Carder et al., 1999) to separate CDOMfrom Chl in the satellite ocean-color signal made itpossible to differentiate various water types fromocean-color imagery alone. Several water typeswere observed, ranging from oligotrophic ocean,upwelling-induced bloom, to river-plume waters(Fig. 8). While earlier studies with CZCS attrib-uted a much larger role to phytoplankton growingin these river plumes (Muller-Karger et al., 1988,1989, 1995), the higher quality SeaWiFS data andthe more refined algorithms available todaydemonstrate that the coloration of these waters isdominated by CDOM, not by Chl pigmentscontained within living organisms. This findingwill have significant impact in regional estimates ofbiomass and primary productivity derived fromremote sensing data.The BLD, defined as the depth of the maximum
halocline, was typically 20–30m in the AmazonRiver plume where SSS varied between 32 and 35.The BLD did not change much with distance orsalinity, suggesting the plume dispersed horizon-tally as it moved offshore. While the Orinoco’splume had a similar vertical structure, salinityprofiles in the eastern Caribbean were found to

ARTICLE IN PRESS
C. Hu et al. / Deep-Sea Research II 51 (2004) 1151–1171 1169
have a wider range of BLD values. We attributethis to the separate influence of both the Amazonand Orinoco waters. The Amazon’s plume enteredthe Caribbean through the Lesser Antilles Islandsmainly during June–August. Concurrently startingduring this period, Amazon water was alsoobserved to turn eastward at about 91N as itbecame entrained in the retroflection of the NBC.This water was carried east by the NECC, andreached 351W in late September after the waterhad traveled 43000 km from the river mouth.The average CDOM absorption coefficient for
the whole area, including the Amazon’s plume(0–151N and 45–621W), showed a peak in July forthe 1998–2001 period. This corresponded to aslight lag relative to the river discharge peak in lateJune. Farther to the east, the CDOM peaked later,which can be accounted for by the eastwardmovement of the plume. The peak CDOM forwaters near 401W was observed in September,suggesting an average plume speed of �35 cm s�1
from the river mouth.The SeaWiFS time series data clearly showed
the anti-cyclonic rings (eddies) shed by the retro-flection, and their motion along the Brazil–Guianacontinental shelf. The rings, with diameters of400–500 km, moved to the northwest at a speedof 8–20 cm s�1, confirming previous findings. Someof the eddies increased in diameter significantly asthey collided against the Lesser Antilles, spreadingcolored water in an arc with a diameter exceeding750 km with a crest far to the north of Barbados.Indeed, while this phenomenon was observedannually both in CZCS data as well as in SeaWiFSdata, the July 1999 event seemed to be particularlysignificant. This may have been the cause forthe massive fish mortality observed near Trinidadand Tobago that year (Suresh Sookbir, Instituteof Marine Affairs, Trinidad, personal communica-tion).The methodology used seemed to yield a time-
varying relationship between SSS and CDOM.Nevertheless, we used an approximate empiricalrelationship to estimate the fresh-water volumeand distribution in the western tropical Atlanticfrom SeaWiFS data. Results are in gross agree-ment with the water volume discharged by theAmazon River. These estimates are critical to the
regional circulation and fresh-water budget. Theyare also important to help understand the nutrientand carbon cycling and the influence of thecontinental margin on the adjacent open ocean.The regional fresh-water volume estimates are
crude and may be refined with additional floatdata and with improved ocean-color algorithms(atmospheric correction and bio-optical algo-rithms) to obtain more reliable CDOM and Chldata from river-plume Case II waters. Preliminaryresults (Hu et al., 2002) using in situ optical datashow that current existing bio-optical algorithmsstill need refinement to provide highly accurate Chland CDOM data products for the Amazon andOrinoco River plumes. Therefore, accurate esti-mates of the impact of these major rivers onregional primary production remains a challengingtask.
Acknowledgements
This work was supported by NASA grantNAG5-10738 to CH and NAG5-11254 to FMK,and NSF grant OCE-831869 to ETM and RWS.We thank the US SeaWiFS Project (Code 970.2),the Distributed Active Archive Center (Code 902),and OrbImage for the production and distributionof the satellite data. The software codes to estimateGelbstoff and chlorophyll from SeaWiFS wereprovided by Kendall L. Carder (USF). We thankRobert Weisberg (USF) for helpful discussionsabout the oceanography of the tropical NorthAtlantic. Two anonymous reviewers providedextensive comments and helped to clarify thismanuscript. We are indebted to them for theircontribution.
References
Arnone, R.A., Martinolich, P., Gould Jr., R.W, Stumpf, R.,
Ladner, S., 1998. Coastal optical properties using SeaWiFS.
SPIE proceedings, Ocean Optics XIV, Kailua Kona,
Hawaii, USA, November 10–13, 1998.
Barnes, R.A., Eplee Jr, R.E., Patt, F.S., McClain, C.R., 1999.
Changes in the radiometric sensitivity of SeaWiFS deter-
mined from lunar and solar-based measurements. Applied
Optics 38, 4649–4664.

ARTICLE IN PRESS
C. Hu et al. / Deep-Sea Research II 51 (2004) 1151–11711170
Bidigare, R.R., Ondrusek, M.E., Brooks, J.M., 1993. Influence
of the Orinoco River outflow on distributions of algal
pigments in the Caribbean Sea. Journal of Geophysical
Research 98, 2259–2269.
Bricaud, A., Morel., A., Prieur, L., 1981. Absorption by
dissolved organic matter of the sea in the UV and visible
domains. Limnology and Oceanography 26, 43–53.
Bricaud, A., Babin, M., Morel, A., Claustre, H., 1995.
Variability in the chlorophyll-specific absorption coefficients
of natural phytoplankton: analysis and parameterization.
Journal of Geophysical Research 100, 13321–13332.
Carder, K.L., Hawes, S.K., Lee, Z., Chen, F.R., 1997. MODIS:
Case 2 chlorophyll a algorithm. MODIS ATBD-19, URL
http://eospso.gsfc.nasa.gov/atbd/modistables.html.
Carder, K.L., Chen, F.R., Lee, Z.P., Hawes, S.K., Kamy-
Kowski, D., 1999. Semianalytic moderate-resolution ima-
ging spectrometer algorithms for chlorophyll a and
absorption with bio-optical domains based on nitrate
depletion temperatures. Journal of Geophysical Research
104, 5403–5421.
DelCastillo, C.E.D., Coble, P.G., Morell, J.M., Lopez, J.M.,
Corredor, J.E., 1999. Analysis of the optical properties of
the Orinoco River plume by absorption and fluorescence
spectroscopy. Marine Chemistry 66, 35–51.
Dessier, A., Donguy, J.R., 1994. The sea surface salinity in the
tropical Atlantic between 101S and 301N—seasonal and
interannual variations (1977–1989). Deep-Sea Research I
41, 81–100.
Ding, K., Gordon, H.R., 1995. Analysis of the influence of O2
A-band absorption on atmospheric correction of ocean-
color imagery. Applied Optics 34, 2068–2080.
Fratantoni, D.M., Glickson, D.A., 2002. North Brazil
Current ring generation and evolution observed with
SeaWiFS. Journal of Physical Oceanography 32 (3),
1058–1074.
Gordon, H.R., Wang, M., 1994. Retrieval of water-leaving
radiance and aerosol optical thickness over the oceans with
SeaWiFS: a preliminary algorithm. Applied Optics 33,
443–452.
Hooker, S.B., Esaias, W.E., Feldman, G.C., Gregg, W.W.,
McClain, C.R., 1992. In: Hooker, S.B., Firestone, E.R.
(Eds.), An Overview of SeaWiFS and Ocean Color, NASA
Technical Memorandum 104566, Vol. 1. NASA Goddard
Space Flight Center, Greenbelt, MD, 25pp., plus color
plates.
Hu, C., Carder, K.L., Muller-Karger, F.E., 2001. How precise
are SeaWiFS ocean color estimates? Implications of
digitization-noise errors. Remote Sensing of Environment
76, 239–249.
Hu, C., Odriozola, A.L., Akl, J.P., Muller-Karger, F.E.,
Varela, R., Astor, Y., Swarzenski, P., Froidefond, J.-M.,
2002. Remote Sensing Algorithms for River Plumes: a
Comparison. ASLO2002, Victoria, BC, Canada, 10–14 June
2002.
Hu, C., Muller-Karger, F.E., Biggs, D.C., Carder, K.L.,
Nababan, B., Nadeau, D., Vanderbloemen, J., 2003.
Comparison of ship and satellite bio-optical measurements
on the continental margin of the NE Gulf of Mexico.
International Journal of Remote Sensing 24, 2597–2612.
Johns, W.E., Lee, T.N., Schott, F., Zantopp, R.J., Evans, R.H.,
1990. The North Brazil Current retroflection: seasonal
structure and eddy variability. Journal of Geophysical
Research 95, 22103–22120.
Lentz, S.J., Limeburner, R., 1995. The Amazon River plume
during AMASSEDS: spatial characteristics and salinity
variability. Journal of Geophysical Research 100,
2355–2375.
Limeburner, R., Beardsley, R.C., Soares, I.D., Lentz, S.J.,
Candela, J., 1995. Lagrangian flow observations of the
Amazon River discharge into the North Atlantic. Journal of
Geophysical Research 100, 2401–2415.
Longhurst, A., 1993. Seasonal cooling and blooming in tropical
oceans. Deep-Sea Research I 40, 2145–2165.
Longhurst, A., 1995. Interpreting CZCS images of the Amazon
Plume. Deep-Sea Research I 42, 2139–2141.
Lohrenz, S.E., Dagg, M.J., Whiteledge, T.E., 1990. Enhanced
primary production at the plume/oceanic interface of the
Mississippi River. Continental Shelf Research 10, 639–664.
Lukas, R., Lindstrom, E., 1991. The mixed layer of the Western
Equatorial Pacific Ocean. Journal of Geophysical Research
96, 3343–3357.
McClain, C.R., Cleave, M.L., Feldman, G.C., Gregg, W.W.,
Hooker, S.B., Kuring, N., 1998. Science quality SeaWiFS
data for global biosphere research. Sea Technology 39,
10–16.
Milliman, J.D., Meade, R.H., 1983. World-wide delivery of
river sediment to the ocean. Journal of Geology 91, 1–21.
Morel, A., Prieur, L., 1977. Analysis of variations in ocean
color. Limnology and Oceanography 22, 709–722.
Muller-Karger, F.E., McClain, C.R., Richardson, P.L., 1988.
The dispersal of the Amazon’s water. Nature 333, 56–58.
Muller-Karger, F.E., McClain, C.R., Fisher, T.R., Esaias,
W.E., Varela, R., 1989. Pigment distribution in the
Caribbean Sea: observations from space. Progress in
Oceanography 23, 23–64.
Muller-Karger, F.E., Aparicio Castro, R.A., 1994. Mesoscale
processes affecting phytoplankton abundance in the south-
ern Caribbean Sea. Continental Shelf Research 14, 199–221.
Muller-Karger, F.E., Richardson, P.L., McGillicuddy, D.,
1995. On the offshore dispersal of the Amazon’s plume in
the North Atlantic. Deep-Sea Research I 42, 2127–2137.
Muller-Karger, F.E., Varela, R., Thunell, R., Scranton, M.,
Bohrer, R., Taylor, G., Capelo, J., Astor, Y., Tappa, E.,
Ho, T.-Y., Iabichella, M., Walsh, J.J., Diaz, J.R., 2000.
Sediment record linked to surface processes in the Cariaco
Basin. EOS Transactions AGU 81, 529, 534–535
Neumann, G., 1969. Seasonal salinity variations in the upper
strata of the western tropical Atlantic Ocean—I. Sea surface
salinities. Deep-Sea Research 16 (Suppl.), 165–177.
O’Reilly, J.E., Maritorena, S., O’Brien, M.C., Siegel, D.A.,
Toole, D., Mitchell, B.G., Kahru, M., Chavez, F.P.,
Strutton, P., Cota, G.F., Hooker, S.B., McClain, C.R.,
Carder, K.L., Muller-Karger, F.E., Harding, L., Magnuson,
A., Phinney, D., Moore, G.F., Aiken, J., Arrigo, K.R.,

ARTICLE IN PRESS
C. Hu et al. / Deep-Sea Research II 51 (2004) 1151–1171 1171
Letelier, R., Culver, M., 2000. Ocean color chlorophyll a
algorithms for SeaWiFS, OC2, and OC4: version 4. In:
Hooker, S.B., Firestone, E.R. (Eds.), SeaWiFS Postlaunch
Technical Report Series, NASA Technical Memorandum
2000-206892, Vol. 11. NASA Goddard Space Flight Center,
Greenbelt, MD. 51pp.
Perry, G.D., Duffy, P.B., Miller, N.L., 1996. An extended data
set of river discharges for validation of general circulation
models. Journal of Geophysical Research 101, 21339–21349.
Richardson, P.L., Hufford, G.E., Limeburner, R., 1994. North
Brazil Current retroflection eddies. Journal of Geophysical
Research 99, 5081–5093.
Salisbury, J.E., Campbell, J.W., Meeker, L.D., Vorosmarty, C.,
2001. Ocean color and river data reveal fluvial influence in
coastal waters. EOS Transactions AGU 82 (20), 221, 226–227.
Salomonson, V.V., Barnes, W.L., Maymon, P.W., Montgom-
ery, H.E., Ostrow, H., 1989. MODIS: advanced facility
instrument for studies of the Earth as a system. IEEE
Geoscience and Remote Sensing 27, 145–152.
Schmitt, R.W., 1995. The ocean component of the global water
cycle. Reviews of Geophysics 33 (Suppl., Part 2),
1395–1409.
Smith, W.O., Demaster, D.J., 1996. Phytoplankton biomass
and productivity in the Amazon River plume: correlation
with seasonal river discharge. Continental Shelf Research
16, 291–319.
Ternon, J.F., Oudot, C., Dessier, A., Diverres, D., 2000. A
seasonal tropical sink for atmospheric CO2 in the Atlantic
Ocean: the role of the Amazon River discharge. Marine
Chemistry 68, 183–201.
Woods, J.D., 1988. Mesoscale upwelling and primary produc-
tion. In: Rothschild, B.J. (Ed.), Towards a Theory
of Biological–Physical Interactions in the World Ocean.
D. Reidel, Dordrecht, pp. 7–38.
Copyright © 2022 FDOKUMEN