The Disclosure of Non-GAAP Performance Measures and the ...
36
The Disclosure of Non-GAAP Performance Measures and the Adoption of IFRS: Evidence from Japanese Firms’ Experience Yuta Shibasaki and Chikara Toyokura We investigate whether and how Japanese firms’ non-GAAP disclo- sure practices change when they adopt International Financial Re- porting Standards (IFRS). We find that the likelihood that firms dis- close non-GAAP performance measures outside financial statements increases after they have adopted IFRS. This is consistent with the view that the proliferation of non-GAAP performance measures is, in part, attributable to the nature of the current IFRS presentation re- quirements for financial statements. We also show that the exclusion of non-recurring items to arrive at non-GAAP performance mea- sures becomes more common only after firms have adopted IFRS. This finding indicates that many managers regard separating out unusual or infrequently occurring items as important. The practice corresponds to financial statement users’ calls for such separation. We also show how the proposed introduction of several subtotals in statements of financial performance by the International Account- ing Standards Board (IASB) under the Primary Financial Statements project will improve the comparability and usefulness of financial statements of Japanese firms that have adopted IFRS. These results provide important empirical evidence at a time when the IASB is de- veloping new presentation requirements for statements of financial performance. Keywords: Non-GAAP performance measures; IFRS; Primary Fi- nancial Statements project JEL Classification: M41 Yuta Shibasaki: Associate Director, Institute for Monetary and Economic Studies (cur- rently, International Department), Bank of Japan (E-mail: [email protected]) Chikara Toyokura: Director, Head of Accounting Studies Group, Institute for Monetary and Economic Studies (currently, Chief Representative in Hong Kong), Bank of Japan (E-mail: [email protected]) .............................................................................................................. We are grateful to Kenichi Akiba, former Visiting Scholar of the Institute for Monetary and Economic Studies (IMES) of the Bank of Japan, for his valuable guidance and ad- MONETARY AND ECONOMIC STUDIES / NOVEMBER 2020 DO NOT REPRINT OR REPRODUCE WITHOUT PERMISSION 19
-
Upload
khangminh22 -
Category
Documents
-
view
1 -
download
0
Transcript of The Disclosure of Non-GAAP Performance Measures and the ...

The Disclosure of Non-GAAPPerformance Measures and the
Adoption of IFRS: Evidencefrom Japanese Firms’
ExperienceYuta Shibasaki and Chikara Toyokura
We investigate whether and how Japanese firms’ non-GAAP disclo-sure practices change when they adopt International Financial Re-porting Standards (IFRS). We find that the likelihood that firms dis-close non-GAAP performance measures outside financial statementsincreases after they have adopted IFRS. This is consistent with theview that the proliferation of non-GAAP performance measures is, inpart, attributable to the nature of the current IFRS presentation re-quirements for financial statements. We also show that the exclusionof non-recurring items to arrive at non-GAAP performance mea-sures becomes more common only after firms have adopted IFRS.This finding indicates that many managers regard separating outunusual or infrequently occurring items as important. The practicecorresponds to financial statement users’ calls for such separation.We also show how the proposed introduction of several subtotals instatements of financial performance by the International Account-ing Standards Board (IASB) under the Primary Financial Statementsproject will improve the comparability and usefulness of financialstatements of Japanese firms that have adopted IFRS. These resultsprovide important empirical evidence at a time when the IASB is de-veloping new presentation requirements for statements of financialperformance.
Keywords: Non-GAAP performance measures; IFRS; Primary Fi-nancial Statements project
JEL Classification: M41
Yuta Shibasaki: Associate Director, Institute for Monetary and Economic Studies (cur-rently, International Department), Bank of Japan (E-mail: [email protected])
Chikara Toyokura: Director, Head of Accounting Studies Group, Institute for Monetaryand Economic Studies (currently, Chief Representative in Hong Kong), Bank of Japan(E-mail: [email protected])
..............................................................................................................We are grateful to Kenichi Akiba, former Visiting Scholar of the Institute for Monetaryand Economic Studies (IMES) of the Bank of Japan, for his valuable guidance and ad-
MONETARY AND ECONOMIC STUDIES /NOVEMBER 2020DO NOT REPRINT OR REPRODUCE WITHOUT PERMISSION 19

..............................................................................................................vice. The paper is benefitted from the constructive comments of the participants at the2019 IMES Accounting Studies Meeting; Kentaro Inoue, Makoto Kaimasu, YasunobuKawanishi, Masaki Murase, and Masaki Yoneyama. We also thank helpful commentsfrom Keisuke Hane, Mikari Kashima, Shunji Kato, Makoto Nakano, Ralph Paprzycki,and Toshitaka Sekine. We appreciate the research assistance of Sayaka Nogi. The viewsexpressed in this paper are those of the authors and do not necessarily reflect the officialviews of the Bank of Japan. All remaining errors are our own.
20 MONETARY AND ECONOMIC STUDIES /NOVEMBER 2020
The Disclosure of Non-GAAP Performance Measures and the Adoption of IFRS
I. Introduction
The central issue this paper addresses is whether and how the adoption of Interna-tional Financial Reporting Standards (IFRS) by Japanese firms affects their non-GAAPdisclosure practices. In Japan, unlike in most other jurisdictions, listed firms are notobliged to use a particular set of accounting standards under the current system. Rather,they are free to choose among (a) Japanese generally accepted accounting principles(GAAP), (b) U.S. GAAP, (c) IFRS or (d) Japan’s Modified International Standards(JMIS) for their consolidated financial statements.1 The number of Japanese firms thathave chosen to adopt full IFRS has been growing since 2010.2 In this unique setting,Japanese firms will adopt IFRS if they believe they are better off doing so. WhenJapanese firms switch accounting standards, they are required to accept the wholeset of rules. However, for a variety of reasons discussed below, firms may feel thatcertain aspects of the accounting standards they choose do not adequately reflect thefirm’s performance, so that they may start to use alternative financial measures outsideGAAP. Therefore, should we observe changes in firms’ non-GAAP disclosure practicesin the wake of a switch in accounting standards, this may signal possible dissatisfac-tion with the accounting standards they moved to. In this paper, we focus on Japanesefirms’ non-GAAP disclosure practices and investigate whether and how Japanese firmschange their disclosure practices in the wake of having adopted IFRS.
Accounting is an evolved economic institution (Waymire and Basu [2008]). Dichev(2017) highlights the “need to encourage more ‘bottom-up’ rule making,” while thesetting of accounting standard currently remains top-down in essence. In this context,Sunder (2016, p. 100) argues that “[t]he complexity and interactivity of social systemsand markets makes it difficult for a group of experts to devise accounting solutionsto better serve even a simple, much less diverse, economy. Even if it were feasible,solutions could only be developed through bottom-up evolution of accounting and notthrough top-down imposition of a single method selected by a board of ‘experts’ withlimited accountability and without field trials of their new formulation.” While the im-portance of “bottom-up” rule making also applies in the case of IFRS, such bottom-uprule making may be more difficult to achieve than for national GAAP. As highlightedby Saito (2011, p. 108), “the review of proposed rules based on market tests, though rel-atively easy within a single country, is far more difficult once adopted across borders.”While non-GAAP performance measures can be regarded as a challenge to existingstandards, they potentially also allow firms to present their own perspective of howtheir income should be presented.3,4
................................1. JMIS consist of IFRS and modifications by the Accounting Standards Board of Japan (ASBJ). No firms have
adopted JMIS so far.2. In Japan, IFRS firms now represent more than 30 percent of the total market capitalization of the Tokyo Stock
Exchange. As of July 2020, 213 listed firms had adopted IFRS.3. The extent to which firms’ non-GAAP disclosure practices can provide insights for the setting of accounting
standards depends, among other things, on firms’ motivation for using non-GAAP disclosure practices—whether firms disclose non-GAAP performance measures to inform or to mislead—, which in turn dependson the social settings in which firms operate. If firms’ motive for the disclosure of non-GAAP performancemeasures is to inform rather than to mislead, non-GAAP performance measures provide more meaningfulinformation on firms’ perspective on how their income should be presented.
4. In fact, Russell, current chairman of the U.S. Financial Accounting Standards Board (FASB) has stated, in
21
Against this background, the purpose of this study is to examine the relationship be-tween non-GAAP disclosure practices and accounting standards. The aim is to providefinancial statement users, financial statement preparers, and standard setters—the In-ternational Accounting Standards Board (IASB) and national standards setters alike—with insights regarding ways to develop new presentation requirements for statementsof financial performance at a time when the IASB is developing new presentation re-quirements for statements of financial performance.
The remainder of the paper is organized as follows: Section II provides a briefoverview of non-GAAP performance measures and the IASB’s recent Primary Finan-cial Statements project, while Section III develops our research questions. Section IVdescribes our research design, Section V presents our results, and Section VI con-cludes.
II. Non-GAAP Measures and the IASB’s Primary Financial State-ments Project
A. Non-GAAP MeasuresThere is growing evidence that the use of non-GAAP performance measures is an in-creasingly common global phenomenon, especially among large listed companies.5 In2017, 97 percent of S&P 500 firms in the United States used at least one non-GAAPmetric. This share represents an increase of roughly 20 percentage points compared toten years earlier, according to Audit Analytics (2018).6,7 In Europe, around 75 percentof a sample of 170 European issuers make use of APMs as a measure of the financialsituation or performance outside the financial statements (ESMA [2018]). Moreover,these numbers seem to be widely used in practice by investors: in a survey conductedby the CFA Institute (Papa and Peters [2016]), 63 percent of respondents indicated thatthey always or often use non-GAAP financial measures. This figure is not far behind the71 percent of respondents in the survey that said they always or often use GAAP/IFRSmeasures.8
..........................................................................................................................................relation to firms’ use of non-GAAP performance measures, that “I often ask myself: Are these companies—deliberately or otherwise—sending us a signal about ways to improve GAAP?”(Golden [2017]).
5. The terms “non-GAAP (performance) measures,” “non-GAAP financial measures,” “alternative performancemeasures (APMs),” “pro-forma (performance) measures” and “street earnings” are often used synonymously.In this paper, we use the term “non-GAAP (performance) measures” to refer to financial performance mea-sures that firms are not required disclose under GAAP. For further discussion of the definition of “non-GAAP(performance) measures,” see Appendix 1.
6. In addition to the use of non-GAAP metrics among S&P 500 firms in 2017, Audit Analytics (2018) alsoexamined the usage of such metrics in 1996, 2006, and 2016 using data from 8-K Item 2.02 filings, whenavailable, and 10-K filings in other cases, in order to understand long-term trends. The results indicate thatthe use of non-GAAP metrics increased dramatically from 59 percent of S&P 500 firms in 1996 to 76 percentin 2006 and 96 percent in 2016.
7. It should be noted that the share of firms that report non-GAAP measures varies depending, among otherthings, on the definition used. For example, prior research on non-GAAP disclosure practices of S&P 500firms, albeit for different years, shows that the share ranges from around 70 to nearly 100 percent. For in-stance, Gu and Lev (2017) report they collected a sample of 265 S&P 500 firms reporting fourth-quarter 2016earnings and found that 212 of those (i.e., 80 percent) also disclosed non-GAAP earnings. Similarly, Black etal. (2020) found that 71 percent of S&P 500 firms disclosed non-GAAP performance measures in 2014.
8. CFA Institute conducted a global survey on the uses, concerns, and expectations around the reporting of non-GAAP financial measures. On the use of non-GAAP measures (GAAP/IFRS measures), the survey had 558
22 MONETARY AND ECONOMIC STUDIES /NOVEMBER 2020

The Disclosure of Non-GAAP Performance Measures and the Adoption of IFRS
Non-GAAP measures can be informative in the sense that they provide informationthat is helpful for stakeholders in understanding profit numbers that managers deem im-portant. Lev and Gu (2016, p. 205), for example, argue that “an SEC regulation (2003)requiring the reconciliation of non-GAAP with GAAP earnings, and empirical evi-dence documenting that investors respond to non-GAAP earnings more strongly thanto their GAAP brethren, conferred certain respectability on pro forma earnings andother non-GAAP items” (emphasis in the original).9 Supporters of non-GAAP mea-sures argue that firms’ motive for reporting non-GAAP measures is to inform investors:at least under certain circumstances, presenting non-GAAP measures managers deemimportant allows them to better explain the firm’s future earnings prospects. On theother hand, critics argue that non-GAAP measures can be misleading, opportunistic,and reflect management self-interest. Such critics highlight that non-GAAP earningsare often higher than GAAP earnings and meet or beat earnings benchmarks and/or an-alysts’ forecasts. Moreover, it is also argued that the adjustments firms make to arriveat their non-GAAP measures are often arbitrary. A number of studies have investigatedthese issues and have found evidence consistent with both sides of the argument.10,11
This is not surprising, because both sets of motives—to better inform investors aboutthe firm’s future earnings prospects on the one hand and to present earnings in a betterlight—are not mutually exclusive. Firms suffering losses or firms that are at an earlystage of growth and development may be more inclined to report non-GAAP measures.Such measures could reflect managers’ overly optimistic views, but they could also beinformative in showing the underlying profits that firms regard as recurring. In otherwords, the measures can be either informative or misleading, or both at the same time.Even the same firm may act differently depending on the situation it is facing.
In response to concerns over the potential misuse of non-GAAP measures, securi-ties regulators around the world, especially the U.S. Securities and Exchange Com-mission (SEC), have tried to limit the potential for misuse.12 In the United States,the Sarbanes-Oxley Act of 2002 and Regulation G imposed strict requirements fornon-GAAP reporting. While the SEC loosened restrictions on non-GAAP reporting in2010, it again introduced tighter restrictions by updating its interpretive guidance inMay 2016.13 In the European Union, the European Securities and Market Authority
..........................................................................................................................................(557) respondents, of which 376 (375) were portfolio managers and buy-side analysts, and 182 were sell-sideanalysts and others.
9. They refer to Bhattacharya et al. (2003). Of course, Lev and Gu (2016, p. 205) also recognize the problemsassociated with non-GAAP measures, arguing that the problem with these voluntary disclosures includingnon-GAAP measures is “that they are haphazard, inconsistent, and not uniform across the industry, and henceof limited usefulness to investors.”
10. For a review of extant literature on non-GAAP measures, see Coulton et al. (2016) for example.11. For example, Bradshaw and Sloan (2002), Bhattacharya et al. (2003), and Lougee and Marquardt (2004)
provide evidence consistent with both sides of the argument.12. Lynn E. Turner, SEC former Chief Accountant noticed ill-intended non-GAAP disclosure practices, calling
some of non-GAAP measures EBS—“Everything but Bad Stuff” (Turner [2000]). In more recent years, SECformer Chair Mary Jo White called them “a source of confusion” (White [2015]), and SEC former ChiefAccountant James Schnurr states “[t]he SEC staff has observed a significant and, in some respects, troublingincrease over the past few years in the use of, and nature of adjustments within, non-GAAP measures bycompanies as well as prominence that the analysts and media have accorded such measures when reportingon the results of the companies they cover” (Schnurr [2016]).
13. Before the introduction of Regulation G, the SEC issued “cautionary advice” to registrants about including
23
(ESMA) published its final Guidelines on Alternative Performance Measures (non-GAAP measures) for listed issuers in October 2015, which became effective in July2016.14 Moreover, in June 2016, the International Organization of Securities Com-missions (IOSCO) issued the Statement on Non-GAAP Financial Measures to assistissuers not only in providing clear and useful disclosure, but in reducing risk that suchmeasures are presented in a way that could be misleading. Despite these efforts by se-curities regulators, concerns over troubling use of non-GAAP measures persist. Sher-man and Young (2018, pp. 57–58), for instance, argue that they have seen “a troublingtrend” in the use of alternative measures, saying that “[a]lternative measures, once usedfairly sparingly and shared mostly with a small group of professional investors, havebecome more ubiquitous and further and further disconnected from reality.”
In recent years, non-GAAP disclosures have become the subject of increased focusby standard setters as well.15 In fact, the IASB in December 2016 added to its work plana major research project titled “Primary Financial Statements,” which will be brieflyoutlined.16
B. The IASB’s Primary Financial Statements ProjectAcknowledging that firms use different performance measures in their primary finan-cial statements (hereafter financial statements), often without clarifying what informa-tion is included in or excluded from such measures, the IASB is currently developingnew presentation requirements for the statement of profit or loss. The IASB publishedthe Exposure Draft of a new standard General Presentation and Disclosures that is in-tended to replace IAS 1 Presentation of Financial Statements in December 2019 (IASB[2019a]). In the Exposure Draft, the IASB proposes to require companies to:
• present the new defined subtotals comparable across firms, such as operatingprofit in the statement of profit or loss.• disaggregate information in a better way; and• disclose information about some performance measures defined by management
(Management Performance Measures).
Throughout this paper, we will refer to this project as “PFS” and to proposals in thisconnection as “PFS proposals.”
..........................................................................................................................................non-GAAP financial information in their press releases. See Deloitte (2019), for example, for a brief historyof the evolution of the SEC’s guidance on non-GAAP measures.
14. The guidelines are aimed at promoting the usefulness and transparency of alternative performance measuresincluded in prospectuses or regulated information (ESMA [2015]). In October 2005, ESMA’s predecessor, theCommittee of European Securities Regulators (CESR) published a Recommendation on Alternative Perfor-mance Measures (CESR [2005b]). ESMA reviewed this Recommendation with the objective of strengtheningthe principles contained in it and reissued the principles as ESMA guidelines. National securities regulatorsin Europe also have addressed the issue before 2016.
15. As early as 2002, the FASB (2002) acknowledged that key measures including adjusted, “normalized,” or“operating” earnings, which are not necessarily well defined, were commonly used.
16. The IASB started addressing the issue of non-GAAP earnings measures in this research project (Kabureck[2017]).
24 MONETARY AND ECONOMIC STUDIES /NOVEMBER 2020
The Disclosure of Non-GAAP Performance Measures and the Adoption of IFRS
III. Research Questions
Non-GAAP measures are used by firms both in their financial statements and in othercommunications with users of financial statements—such as management commen-tary and analyst briefings. The content and presentation of information in the financialstatements is determined primarily by the accounting standards. However, since theIFRS makes few prescriptions about the format and minimum line items of incomestatements, non-GAAP measures can appear on the face of income statements.17 Thisis essentially what the IASB’s PFS seeks to address. However, more frequent use ofnon-GAAP measures is found outside financial statements, as we discuss below.
Our research questions relate to firms’ use of non-GAAP performance measuresboth in their financial statements and outside of their financial statements.18
A. Use of Non-GAAP Measures in Financial StatementsIn stark contrast with the IFRS, Japanese GAAP prescribe the format and minimumline items of income statements. Specifically, Japanese GAAP require the statementof profit or loss to be presented in a multi-layered format with defined subtotals.19
Japanese firms that switch from Japanese GAAP to IFRS are no longer required topresent subtotals in their statement of profit or loss. Do such firms continue to usesubtotals such as operating profit? This is our first question.
Next, since these subtotals are not defined under the IFRS, firms can self-definethe contents of the subtotals (i.e., the calculation of subtotals may differ across firms).Thus, even though firms may use the same name for a subtotal, the items coveredpotentially differ.20,21 Moreover, the same items may be covered under different namesfor subtotals. This raises the question whether subtotals across firms are more or lesscomparable. Thus, our first two research questions are:
RQ1: Do Japanese firms continue to use subtotals in their statements of financialperformance after they adopted IFRS?
RQ2: Do subtotals in IFRS-based statements of financial performance ofJapanese firms cover (more or less) the same items?
................................17. See Appendix 1 for further explanation.18. We use the expression “outside of financial statements” interchangeably with “outside of income statements
(statements of profit or loss).”19. Japanese GAAP Business Accounting Principles and ASBJ Statement No. 22 Accounting Standard for Con-
solidated Financial Statements requires firms to present Operating Profit and Ordinary Profit among others.Japan’s Ministry of Finance Ordinance on Terminology, Forms and Preparation Methods of Financial State-ments, etc. as well as Ordinance on Terminology, Forms and Presentation Methods of Consolidated FinancialStatements additionally defines terminology, forms, and presentation for listed Japanese firms. In particular,it is noteworthy that the ordinance specifies which items to be included in a subtotal of non-operating income(expenses) or special income (expenses). See Appendix 2.A for the format the ordinance determines.
20. Hoogervorst (2019a) states that “[s]ubtotals like Operating Profit and EBITDA are very commonly used, butin practice companies define these subtotals in very different ways” (emphasis added). IASB staff found that63 in a sample of 100 companies reported operating profit in the financial statements, using at least ninedifferent definitions (IASB [2019b]). They analyzed the 2017–18 annual reports of 100 listed companiesapplying IFRS from 26 jurisdictions and 12 industries.
21. Until 2016, it was possible for subtotals such as “operating profit” in IFRS-based financial statements to benoncomparable even for the same firm from one year to the next. The amendments to IAS 1 Presentation ofFinancial Statements, published in December 2014 and effective since 2016, among other things added therequirement that subtotals presented in financial statements shall be consistent from period to period.
25
B. Use of Non-GAAP Measures in Investor and Shareholder PresentationsNon-GAAP performance measures are more widely used in firms’ communicationsoutside financial statements and are presented alongside, in contrast to, or instead ofthe GAAP measures (Deloitte [2017]). Moreover, this is where firm-tailored formsof performance measures—typically called “adjusted operating profit,” “normalizedearnings,” or “adjusted-EBITDA” and referred to as “adjusted (non-GAAP) measures”below—are commonly presented.22 These measures can appear in analyst reports orarticles in the business press without reference to GAAP measures.
Hoogervorst (2019a), the current IASB chairman, has attributed the proliferationof non-GAAP measures in part to the IFRS, observing:
We define Revenue and Profit or Loss but not all that much in between. Inpractice, both preparers and investors like to use subtotals to better explain andunderstand performance. Our lack of guidance in this respect has had theunintended consequence of stimulating the use of self-defined subtotals,also known as non-GAAP measures. (Emphasis added.)
We do not know whether, by “the use of self-defined subtotals,” Hoogervorst meantinside and/or outside of financial statements. Should we expect, ex ante, increased useof non-GAAP measures in the wake of the adoption of IFRS? Because the IFRS donot require or define the subtotals, an increase in self-defined subtotals on the face ofstatements of profit or loss may be expected, but the potential effect on the use of non-GAAP measures (other than subtotals on the face of profit and loss statements) outsidefinancial statements is not clear.23 We first investigate whether firms’ adoption of IFRScontributes to the proliferation of non-GAAP measures outside financial statements.If that is the case, what might firms’ motives be? That is, we examine not only whyfirms provide non-GAAP measures, but why they began to provide those measureswhen they switched their accounting standards. Differences in presentation require-ments with regard to financial statements across accounting standards may affect thenon-GAAP disclosure practices of Japanese firms.
Our next two research questions are:
RQ3: Does the use of non-GAAP measures (in communications other than finan-cial statements) by Japanese firms increase in the wake of their adoption ofIFRS?
RQ4: If that is the case, what are Japanese firms’ motives for doing so?
Answering the four research questions presented here will provide important evi-dence at a time when the IASB is developing new presentation requirements for state-ments of financial performance. Exploring whether and how Japanese firms change................................22. In other words, in this paper measures such as earnings before interest and taxes (EBIT) and earnings before
interest, taxes, depreciation, and amortization (EBITDA) are treated as unadjusted non-GAAP measures, asthey simply add/subtract defined line items in the income statement.
23. In the context of the adoption of IFRS among European listed firms, it has been argued that the adoption ofIFRS should increase the use of non-GAAP measures. For example, the Committee of European SecuritiesRegulators (2005a) states that “[i]t can be observed that European listed companies widely use divergingfinancial data in press releases and other documents. [. . .] CESR expects that the adoption of IFRS and theelimination of binding formats will increase the use of alternative performance measures.”
26 MONETARY AND ECONOMIC STUDIES /NOVEMBER 2020
The Disclosure of Non-GAAP Performance Measures and the Adoption of IFRS
their non-GAAP disclosure practices in the wake of the adoption of IFRS can poten-tially provide a better understanding of firms’ perspective of how their income shouldbe presented. Answers to the first two questions are also important in helping us to un-derstand the potential impact of the IASB’s PFS proposals on Japanese firms’ financialstatements.
IV. Research Design
A. Use of Non-GAAP Measures in Financial StatementsWe first explore whether and how Japanese firms use subtotals in their financial state-ments after the adoption of IFRS. Since 2010, 199 Japanese firms have switched toIFRS for their consolidated financial statements (as of July 2019).24 Out of these, 158firms actually disclosed IFRS-based annual financial statements for fiscal 2017 (i.e.,mostly for the accounting period ending March 2018). We use the Securities Reportsfor fiscal 2017, which are the Japanese equivalent of Form 10-K/Q in the United States.We downloaded the securities reports from Electronic Disclosure for Investors’ Net-work (EDINET).25
B. Use of Non-GAAP Measures in Investor and Shareholder PresentationsThe next two research questions relate to whether and how Japanese firms change theirnon-GAAP disclosure practices in communication other than financial statements inthe wake of the adoption of IFRS. For communication other than financial statements,we use firms’ actual documents for investor and shareholder presentations (which werefer to as “IR documents” hereafter).26 We first provide an overview of non-GAAPdisclosure practices employed by Japanese firms depending on the accounting stan-dards they use. For this purpose, we examine the IR documents disclosed for the sixsuccessive fiscal year-ends from 2012 to 2017 (corresponding to the calendar yearsfrom 2013 to 2018)27 for the following firms:
(1) all Nikkei 225 firms (excluding firms in the banking and insurance industries;the same applies below)28 that were using the IFRS (referred to as “Nikkei 225
................................24. As of July 2019, there were 198 firms listed on the Tokyo Stock Exchange that use IFRS, according to the
Japan Exchange Group’s website. Moreover, there was one firm listed on the Sapporo Securities Exchangethat uses IFRS.
25. EDINET is an electronic corporate disclosure system under the Japanese Financial Instruments and ExchangeAct. All listed or major fund-raising companies and investment funds in Japans are required to file theirdisclosure system using this system.
26. Our focus here is only on non-GAAP measures other than subtotals on the face of statements of profit orloss. As discussed in Section III. B, an increase in self-defined subtotals on the face of statements of profit orloss—such as “operating profit”—may naturally be expected. See Appendix 1 for further explanation of thecriteria we used to consider non-GAAP measures in this study.
27. The reason for starting from fiscal 2012 is that until March 2012 (fiscal 2011), only five Japanese firms haddisclosed IR documents with IFRS-based financial statements.
28. Nikkei 225 firms in the banking and insurance industry are excluded for two reasons. First, there are addi-tional regulations which define, among other things, the format of financial statements for these industriesspecifically (namely, the Ministry of Finance’s Ordinance for Enforcement of the Banking Act and Ordinancefor Enforcement of Insurance Business Act). Second, related to the first issue, the nature of the businessof firms in these industries differs from that of general corporations, because for firms in the banking and
27

IFRS firms” below);(2) all Nikkei 225 firms that were using either Japanese GAAP or U.S. GAAP
(“Nikkei 225 non-IFRS firms”); and(3) all listed Japanese firms that were using IFRS (“Japanese IFRS firms”).
All IR documents were downloaded from firms’ websites. In total, we collected andanalyzed 1,816 firm-year observations (see Table 1(c)).29 Table 1 describes our sampleframe and final sample for Japanese firms’ IR documents.
Table 1 Sample Selection
(a) Nikkei 225 firms
1. Sample frame
Firm-years Year2013–2018 2013 2014 2015 2016 2017 2018
Nikkei 225 firms(excluding firms in the bankingand insurance industries)
1,248 208 208 208 208 208 208
Nikkei 225 IFRS firms 165 6 12 24 31 39 53Nikkei 225 non-IFRS firms 1,083 202 196 184 177 169 155Of which: Firms that currentlyuse IFRS
153 47 41 29 22 14 0
2. Final sample
Firm-years Year2013–2018 2013 2014 2015 2016 2017 2018
Nikkei 225 firms(excluding firms in the bankingand insurance industries)
1,206 185 195 205 206 207 208
Nikkei 225 IFRS firms 165 6 12 24 31 39 53Nikkei 225 non-IFRS firms 1,041 179 183 181 175 168 155Of which: Firms that currentlyuse IFRS
148 43 40 29 22 14 0
Notes: 1. Because the composition of Nikkei 225 firms varies across times, we select the composition at a given pointof time (March 2019) to define our sample firms. Through the period of 2013 to 2018, the same firms areexamined.
2. As for “Nikkei 225 IFRS firms,” we regard a firm as having switched to IFRS if it discloses IR documents withIFRS-based annual financial statements.
3. Firms which do not disclose IR documents on their websites are excluded from the final sample.
(continued on next page)
..........................................................................................................................................insurance industry, providing loans or underwriting insurance is their main business activity.
29. All firms in category (1), “Nikkei 225 IFRS firms,” are included in category (3), “Japanese IFRS firms,” sinceall Nikkei 225 firms by definition are listed firms. See Figure A-1 for the sample we employed for analyzingJapanese firms’ IR documents.
28 MONETARY AND ECONOMIC STUDIES /NOVEMBER 2020
The Disclosure of Non-GAAP Performance Measures and the Adoption of IFRS
Table 1 (continued)
(b) Japanese IFRS firms
Firm-years Year2013–2018 2013 2014 2015 2016 2017 2018
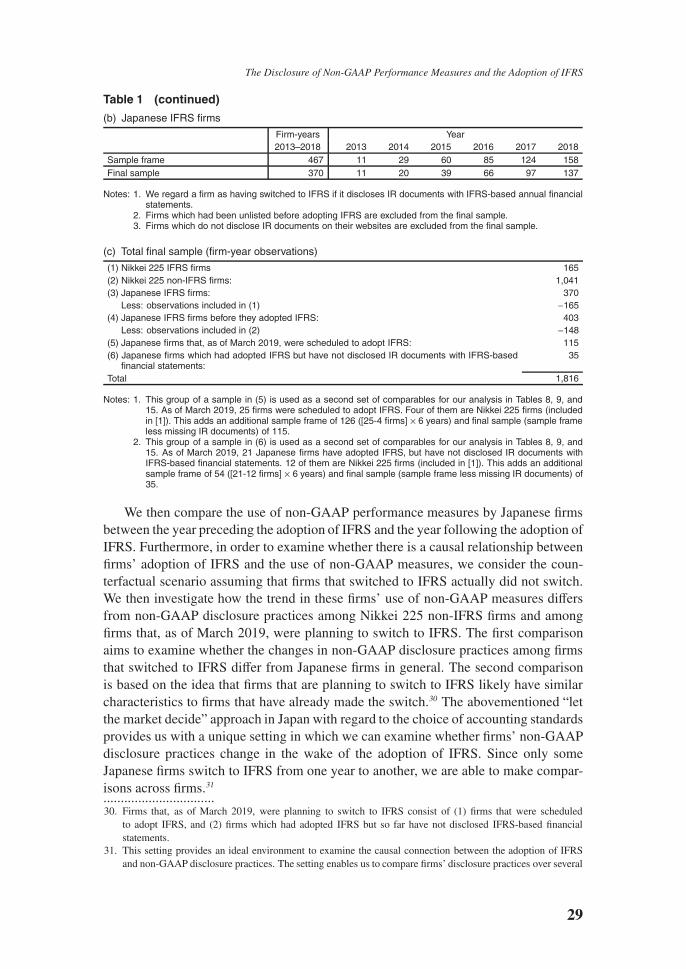
Sample frame 467 11 29 60 85 124 158Final sample 370 11 20 39 66 97 137
Notes: 1. We regard a firm as having switched to IFRS if it discloses IR documents with IFRS-based annual financialstatements.
2. Firms which had been unlisted before adopting IFRS are excluded from the final sample.3. Firms which do not disclose IR documents on their websites are excluded from the final sample.
(c) Total final sample (firm-year observations)
(1) Nikkei 225 IFRS firms 165(2) Nikkei 225 non-IFRS firms: 1,041(3) Japanese IFRS firms: 370
Less: observations included in (1) −165(4) Japanese IFRS firms before they adopted IFRS: 403
Less: observations included in (2) −148(5) Japanese firms that, as of March 2019, were scheduled to adopt IFRS: 115(6) Japanese firms which had adopted IFRS but have not disclosed IR documents with IFRS-based
financial statements:35
Total 1,816
Notes: 1. This group of a sample in (5) is used as a second set of comparables for our analysis in Tables 8, 9, and15. As of March 2019, 25 firms were scheduled to adopt IFRS. Four of them are Nikkei 225 firms (includedin [1]). This adds an additional sample frame of 126 ([25-4 firms] × 6 years) and final sample (sample frameless missing IR documents) of 115.
2. This group of a sample in (6) is used as a second set of comparables for our analysis in Tables 8, 9, and15. As of March 2019, 21 Japanese firms have adopted IFRS, but have not disclosed IR documents withIFRS-based financial statements. 12 of them are Nikkei 225 firms (included in [1]). This adds an additionalsample frame of 54 ([21-12 firms] × 6 years) and final sample (sample frame less missing IR documents) of35.
We then compare the use of non-GAAP performance measures by Japanese firmsbetween the year preceding the adoption of IFRS and the year following the adoption ofIFRS. Furthermore, in order to examine whether there is a causal relationship betweenfirms’ adoption of IFRS and the use of non-GAAP measures, we consider the coun-terfactual scenario assuming that firms that switched to IFRS actually did not switch.We then investigate how the trend in these firms’ use of non-GAAP measures differsfrom non-GAAP disclosure practices among Nikkei 225 non-IFRS firms and amongfirms that, as of March 2019, were planning to switch to IFRS. The first comparisonaims to examine whether the changes in non-GAAP disclosure practices among firmsthat switched to IFRS differ from Japanese firms in general. The second comparisonis based on the idea that firms that are planning to switch to IFRS likely have similarcharacteristics to firms that have already made the switch.30 The abovementioned “letthe market decide” approach in Japan with regard to the choice of accounting standardsprovides us with a unique setting in which we can examine whether firms’ non-GAAPdisclosure practices change in the wake of the adoption of IFRS. Since only someJapanese firms switch to IFRS from one year to another, we are able to make compar-isons across firms.31
................................30. Firms that, as of March 2019, were planning to switch to IFRS consist of (1) firms that were scheduled
to adopt IFRS, and (2) firms which had adopted IFRS but so far have not disclosed IFRS-based financialstatements.
31. This setting provides an ideal environment to examine the causal connection between the adoption of IFRSand non-GAAP disclosure practices. The setting enables us to compare firms’ disclosure practices over several
29
V. Results
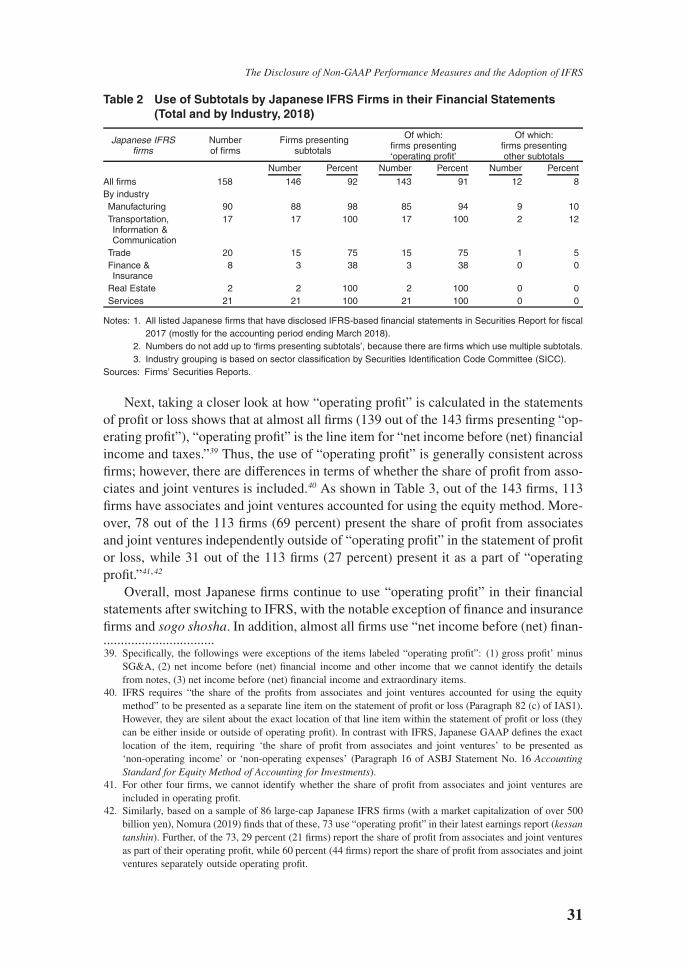
A. Use of Non-GAAP Measures in Financial StatementsTable 2 reports the use of subtotals by Japanese IFRS firms in their statements of profitor loss (mostly those as of March 2018).32 More than 90 percent of firms (146 out of158) use subtotal(s)—in particular “operating profit” (which is used by 143 out of the158 firms)—in their statements of profit or loss.33,34 Nearly 100 percent of firms in allindustries other than “finance and insurance” and “trade” use the subtotal of “operatingprofit.” The five “trade” firms that do not use subtotals are all sogo shosha (general trad-ing firms).35 As will be discussed in more detail below, most Japanese IFRS firms use“operating profit” to represent “net income before (net) financial income and taxes.”36
Excluding (net) financial income and taxes from net income helps general corporationsto show the profits from their main business activities. In contrast, for the five “financeand insurance” firms, excluding (net) financial income and taxes does not help themto show their underlying profits since their main business consists of generating finan-cial income. The same applies to the sogo shosha, which engage in a wide range ofactivities, including finance.
As shown in Table 2, less than a tenth of firms use subtotals other than “operatingprofit” (12 out of the 158 firms).37 Five use the subtotal “gross profit” minus “selling,general and administrative expense (SG&A).” The five firms use different names forthis subtotal, with labels ranging from “business profit” to “core operating profit” and“adjusted operating profit.” Although they use different names, the firms essentiallycover the same items under this subtotal. Next, three of the 12 firms use EBIT, whilefour use firm-tailored forms of operating profit.38 Finally, one of firm labels a line item“business profit” that shows what most other firms call “operating profit.”..........................................................................................................................................
years in the wake of the adoption of IFRS across firms facing a similar economic environment (i.e., doingbusiness primarily in Japan). For a study on the link between the adoption of IFRS and non-GAAP disclosurepractices in the European Union, see PricewaterhouseCoopers (2007). Looking into changes in non-GAAPreporting practices among European listed firms between 2004 and 2005, PricewaterhouseCoopers (2007)reports that “[European listed] companies have aligned their choice and presentation of non-GAAP measuresas much as possible with what was used in the past.”
32. In Japan, the fiscal year begins in April and ends in March. Most Japanese firms use this fiscal year as theiraccounting period.
33. Here, the distinction between “operating profit” and subtotals other than operating profit is made based on thename of the line items firms specify.
34. Similarly, Nomura (2019) collected a sample of large-cap Japanese IFRS firms (with a market capitalizationof over 500 billion yen) and found that 85 percent (73 out of 86 firms) use “operating profit” as a subtotal intheir statements of profit or loss in the latest earnings report (kessan tanshin).
35. Sogo shosha engage in a wide range of activities. For example, Mitsubishi Corporation, one of the largestsogo shosha, introduces itself, on its website, as follows: Mitsubishi Corporation “develops and operatesbusinesses across virtually every industry, including industrial finance, energy, metals, machinery, chemicals,and daily living essentials.”
36. We refer to “‘financial income’ minus ‘financial expenses”’ as “(net) financial income”. The classification offinancial income and financial expenses will depend on a firm’s accounting practices regarding such items. Asdiscussed below, line items labelled “financial income” or “financial expenses” are used, without definition,in the template in the Illustrative IFRS Consolidated Financial Statements prepared by Japan’s FinancialServices Agency.
37. Numbers do not add up to 146, because there are firms which use multiple subtotals.38. Of the four firms using firm-tailored forms, three use “operating profit” adjusted for specific non-recurring
items the firms consider appropriate to exclude. The fourth uses “operating profit” excluding gains fromparticular funds.
30 MONETARY AND ECONOMIC STUDIES /NOVEMBER 2020
The Disclosure of Non-GAAP Performance Measures and the Adoption of IFRS
Table 2 Use of Subtotals by Japanese IFRS Firms in their Financial Statements(Total and by Industry, 2018)
Japanese IFRSfirms
Numberof firms
Firms presentingsubtotals
Of which:firms presenting‘operating profit’
Of which:firms presentingother subtotals
Number Percent Number Percent Number Percent
All firms 158 146 92 143 91 12 8By industryManufacturing 90 88 98 85 94 9 10Transportation,Information &Communication
17 17 100 17 100 2 12
Trade 20 15 75 15 75 1 5Finance &Insurance
8 3 38 3 38 0 0
Real Estate 2 2 100 2 100 0 0Services 21 21 100 21 100 0 0
Notes: 1. All listed Japanese firms that have disclosed IFRS-based financial statements in Securities Report for fiscal2017 (mostly for the accounting period ending March 2018).
2. Numbers do not add up to ‘firms presenting subtotals’, because there are firms which use multiple subtotals.3. Industry grouping is based on sector classification by Securities Identification Code Committee (SICC).
Sources: Firms’ Securities Reports.
Next, taking a closer look at how “operating profit” is calculated in the statementsof profit or loss shows that at almost all firms (139 out of the 143 firms presenting “op-erating profit”), “operating profit” is the line item for “net income before (net) financialincome and taxes.”39 Thus, the use of “operating profit” is generally consistent acrossfirms; however, there are differences in terms of whether the share of profit from asso-ciates and joint ventures is included.40 As shown in Table 3, out of the 143 firms, 113firms have associates and joint ventures accounted for using the equity method. More-over, 78 out of the 113 firms (69 percent) present the share of profit from associatesand joint ventures independently outside of “operating profit” in the statement of profitor loss, while 31 out of the 113 firms (27 percent) present it as a part of “operatingprofit.”41,42
Overall, most Japanese firms continue to use “operating profit” in their financialstatements after switching to IFRS, with the notable exception of finance and insurancefirms and sogo shosha. In addition, almost all firms use “net income before (net) finan-................................39. Specifically, the followings were exceptions of the items labeled “operating profit”: (1) gross profit’ minus
SG&A, (2) net income before (net) financial income and other income that we cannot identify the detailsfrom notes, (3) net income before (net) financial income and extraordinary items.
40. IFRS requires “the share of the profits from associates and joint ventures accounted for using the equitymethod” to be presented as a separate line item on the statement of profit or loss (Paragraph 82 (c) of IAS1).However, they are silent about the exact location of that line item within the statement of profit or loss (theycan be either inside or outside of operating profit). In contrast with IFRS, Japanese GAAP defines the exactlocation of the item, requiring ‘the share of profit from associates and joint ventures’ to be presented as‘non-operating income’ or ‘non-operating expenses’ (Paragraph 16 of ASBJ Statement No. 16 AccountingStandard for Equity Method of Accounting for Investments).
41. For other four firms, we cannot identify whether the share of profit from associates and joint ventures areincluded in operating profit.
42. Similarly, based on a sample of 86 large-cap Japanese IFRS firms (with a market capitalization of over 500billion yen), Nomura (2019) finds that of these, 73 use “operating profit” in their latest earnings report (kessantanshin). Further, of the 73, 29 percent (21 firms) report the share of profit from associates and joint venturesas part of their operating profit, while 60 percent (44 firms) report the share of profit from associates and jointventures separately outside operating profit.
31
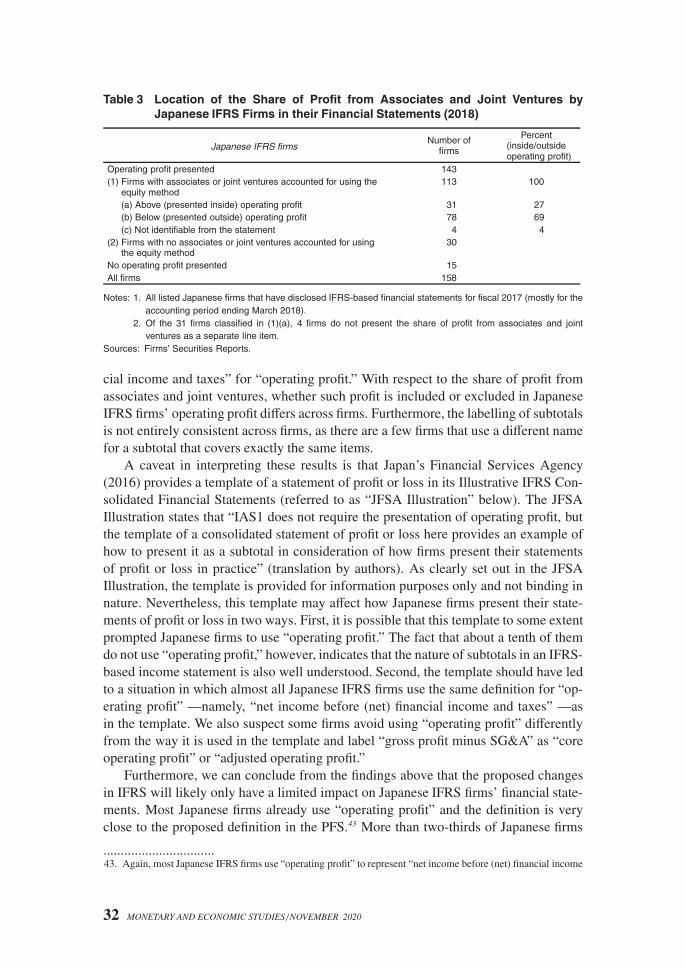
Table 3 Location of the Share of Profit from Associates and Joint Ventures byJapanese IFRS Firms in their Financial Statements (2018)
Japanese IFRS firmsNumber of
firms
Percent(inside/outsideoperating profit)
Operating profit presented 143(1) Firms with associates or joint ventures accounted for using the
equity method113 100
(a) Above (presented inside) operating profit 31 27(b) Below (presented outside) operating profit 78 69(c) Not identifiable from the statement 4 4
(2) Firms with no associates or joint ventures accounted for usingthe equity method
30
No operating profit presented 15All firms 158
Notes: 1. All listed Japanese firms that have disclosed IFRS-based financial statements for fiscal 2017 (mostly for theaccounting period ending March 2018).
2. Of the 31 firms classified in (1)(a), 4 firms do not present the share of profit from associates and jointventures as a separate line item.
Sources: Firms’ Securities Reports.
cial income and taxes” for “operating profit.” With respect to the share of profit fromassociates and joint ventures, whether such profit is included or excluded in JapaneseIFRS firms’ operating profit differs across firms. Furthermore, the labelling of subtotalsis not entirely consistent across firms, as there are a few firms that use a different namefor a subtotal that covers exactly the same items.
A caveat in interpreting these results is that Japan’s Financial Services Agency(2016) provides a template of a statement of profit or loss in its Illustrative IFRS Con-solidated Financial Statements (referred to as “JFSA Illustration” below). The JFSAIllustration states that “IAS1 does not require the presentation of operating profit, butthe template of a consolidated statement of profit or loss here provides an example ofhow to present it as a subtotal in consideration of how firms present their statementsof profit or loss in practice” (translation by authors). As clearly set out in the JFSAIllustration, the template is provided for information purposes only and not binding innature. Nevertheless, this template may affect how Japanese firms present their state-ments of profit or loss in two ways. First, it is possible that this template to some extentprompted Japanese firms to use “operating profit.” The fact that about a tenth of themdo not use “operating profit,” however, indicates that the nature of subtotals in an IFRS-based income statement is also well understood. Second, the template should have ledto a situation in which almost all Japanese IFRS firms use the same definition for “op-erating profit” —namely, “net income before (net) financial income and taxes” —asin the template. We also suspect some firms avoid using “operating profit” differentlyfrom the way it is used in the template and label “gross profit minus SG&A” as “coreoperating profit” or “adjusted operating profit.”
Furthermore, we can conclude from the findings above that the proposed changesin IFRS will likely only have a limited impact on Japanese IFRS firms’ financial state-ments. Most Japanese firms already use “operating profit” and the definition is veryclose to the proposed definition in the PFS.43 More than two-thirds of Japanese firms
................................43. Again, most Japanese IFRS firms use “operating profit” to represent “net income before (net) financial income
32 MONETARY AND ECONOMIC STUDIES /NOVEMBER 2020
The Disclosure of Non-GAAP Performance Measures and the Adoption of IFRS
(about 70 percent) present the “share of profit from associates and joint ventures” out-side operating profit, so that their operating profit is also unaffected by the proposeddefinition of operating profit.44 For the remaining firms (about 30 percent), which cur-rently present the share of profit from associates and joint ventures as part of their op-erating profit, their stated operating profit will be affected to that extent, but the profitnumbers they currently present as “operating profit” will be presented as “operatingprofit and share of profit of integral associates and joint ventures.”45
These findings underscore the importance of the IASB’s PFS project. The currentIFRS make few prescriptions about the format and minimum line items of incomestatements, which has the advantage that firms can present items that they regard asimportant. In fact, some Japanese IFRS firms make effective use of line items and/orsubtotals to take advantage of the flexibility thus provided. Examining the financialstatements of all 158 Japanese IFRS firms shows that firms tailor the format in order tobetter communicate their business situation to stakeholders—for instance by presentingline items such as “research & development expenses” or “gains from remeasurementat fair value after changes in control.” Finding the right balance between flexibilityand comparability in the formatting of statements of profit or loss is important. If theaforementioned template in the JFSA’s Illustration—which is not binding—helped insome way to build a common understanding of “operating profit” among JapaneseIFRS firms, the PFS proposals will certainly improve the comparability and usefulnessof financial statements of IFRS adopters around the world, without impairing flexibil-ity. For Japanese IFRS firms, the change involved will be marginal, but the benefit ofthe project may nevertheless be important. First, Japanese firms will all use “operatingprofit” in the same way, without any exceptions. Second, their “share of profit fromassociates and joint ventures” will be presented clearly, again without exceptions. Theproposed format of IFRS financial statement should help users to more clearly under-stand the content of operating profit.
B. Use of Non-GAAP Measures in Investor and Shareholder PresentationsOur next two research questions relate to the use of non-GAAP measures in com-munication other than financial statements. Before exploring the relationship betweenJapanese firms’ non-GAAP disclosure practices and the accounting standards they use,we first take a look at non-GAAP disclosure practices of a representative group of listedJapanese firms regardless of the accounting standard they use. Table 4 shows that about..........................................................................................................................................
and taxes.” In the Exposure Draft, operating profit or loss is defined as a default or a residual category. TheIASB explains that the operating category comprises all income and expenses included in profit or loss thatare not classified as income or expenses from integral associates and joint ventures, investing or financing,and those that are not classified in income taxes or discontinued operations (Basis for Conclusion 54, IASB[2019a]). “The items in the investing and financing categories in the statement of profit or loss will be verysimilar to the items in “financial income (expenses)” that Japanese IFRS firms use.
44. The fact that Japanese GAAP requires the “share of profit from associates and joint ventures” to be presentedas non-operating income/expenses may be partly responsible for the fact that a majority of firms report suchprofit outside operating profit even after switching to IFRS.
45. The IASB is proposing to introduce the subtotal “Operating profit or loss and income from integral associatesand joint ventures” (Appendix 2. C). Assuming that Japanese IFRS firms that currently include their share ofprofit from associates and joint ventures regard these associates and joint ventures as integral to their business,their current “operating profit” numbers will be shown as “operating profit or loss and income from integralassociates and joint ventures.”
33
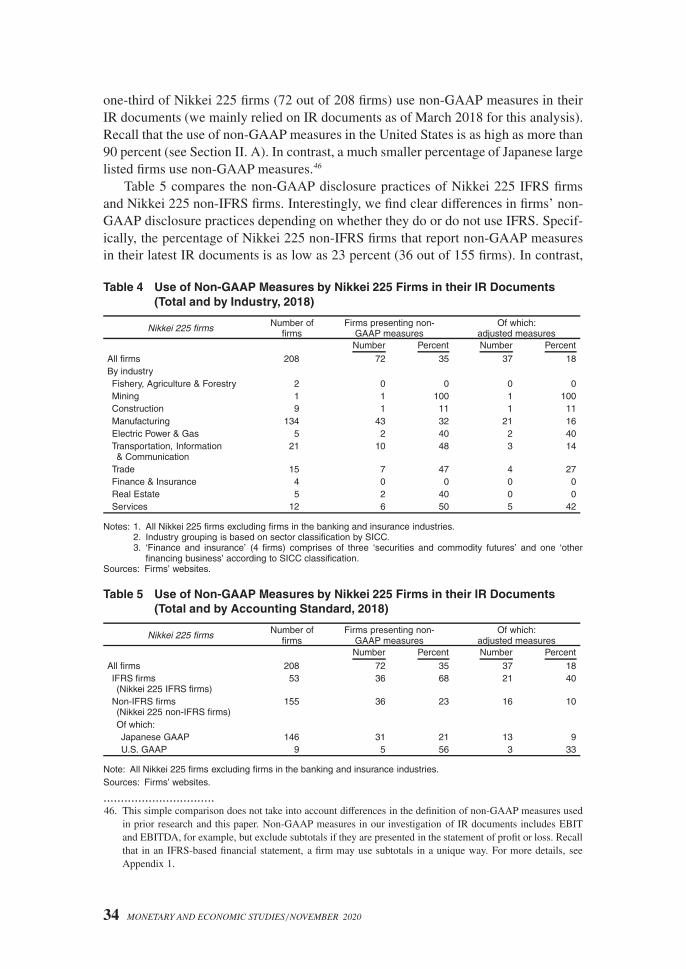
one-third of Nikkei 225 firms (72 out of 208 firms) use non-GAAP measures in theirIR documents (we mainly relied on IR documents as of March 2018 for this analysis).Recall that the use of non-GAAP measures in the United States is as high as more than90 percent (see Section II. A). In contrast, a much smaller percentage of Japanese largelisted firms use non-GAAP measures.46
Table 5 compares the non-GAAP disclosure practices of Nikkei 225 IFRS firmsand Nikkei 225 non-IFRS firms. Interestingly, we find clear differences in firms’ non-GAAP disclosure practices depending on whether they do or do not use IFRS. Specif-ically, the percentage of Nikkei 225 non-IFRS firms that report non-GAAP measuresin their latest IR documents is as low as 23 percent (36 out of 155 firms). In contrast,
Table 4 Use of Non-GAAP Measures by Nikkei 225 Firms in their IR Documents(Total and by Industry, 2018)
Nikkei 225 firms Number offirms
Firms presenting non-GAAP measures
Of which:adjusted measures
Number Percent Number Percent
All firms 208 72 35 37 18By industryFishery, Agriculture & Forestry 2 0 0 0 0Mining 1 1 100 1 100Construction 9 1 11 1 11Manufacturing 134 43 32 21 16Electric Power & Gas 5 2 40 2 40Transportation, Information& Communication
21 10 48 3 14
Trade 15 7 47 4 27Finance & Insurance 4 0 0 0 0Real Estate 5 2 40 0 0Services 12 6 50 5 42
Notes: 1. All Nikkei 225 firms excluding firms in the banking and insurance industries.2. Industry grouping is based on sector classification by SICC.3. ‘Finance and insurance’ (4 firms) comprises of three ‘securities and commodity futures’ and one ‘other
financing business’ according to SICC classification.Sources: Firms’ websites.
Table 5 Use of Non-GAAP Measures by Nikkei 225 Firms in their IR Documents(Total and by Accounting Standard, 2018)
Nikkei 225 firms Number offirms
Firms presenting non-GAAP measures
Of which:adjusted measures
Number Percent Number Percent
All firms 208 72 35 37 18IFRS firms(Nikkei 225 IFRS firms)
53 36 68 21 40
Non-IFRS firms(Nikkei 225 non-IFRS firms)
155 36 23 16 10
Of which:Japanese GAAP 146 31 21 13 9U.S. GAAP 9 5 56 3 33
Note: All Nikkei 225 firms excluding firms in the banking and insurance industries.Sources: Firms’ websites.
................................46. This simple comparison does not take into account differences in the definition of non-GAAP measures used
in prior research and this paper. Non-GAAP measures in our investigation of IR documents includes EBITand EBITDA, for example, but exclude subtotals if they are presented in the statement of profit or loss. Recallthat in an IFRS-based financial statement, a firm may use subtotals in a unique way. For more details, seeAppendix 1.
34 MONETARY AND ECONOMIC STUDIES /NOVEMBER 2020
The Disclosure of Non-GAAP Performance Measures and the Adoption of IFRS
Table 6 Use of Non-GAAP Measures by Japanese IFRS Firms in their IR Documents(Total and by Industry, 2018)
Japanese IFRS firms Number offirms
Firms presenting non-GAAP measures
Of which:adjusted measures
Number Percent Number Percent
All firms 137 73 53 38 28By industryManufacturing 82 44 54 24 29Transportation, Information &
Communication14 8 57 4 29
Trade 17 9 53 4 24Finance & Insurance 6 2 33 0 0Real Estate 2 0 0 0 0Services 16 10 63 6 38
Notes: 1. All listed Japanese firms that have disclosed IR documents with IFRS-based financial statements for fiscal2017 (mostly for the accounting period ending March 2018).
2. Industry grouping is based on sector classification by SICC.3. ‘Finance and insurance’ (6 firms) comprises of three ‘other financing business’, two ‘securities and commodi-
ties futures’ and one ‘insurance’ according to SICC classification. The ‘insurance’ firm does not engage ininsurance underwriting and falls outside insurance industry by the definition of Japan’s Insurance BusinessAct.
Sources: Firms’ websites.
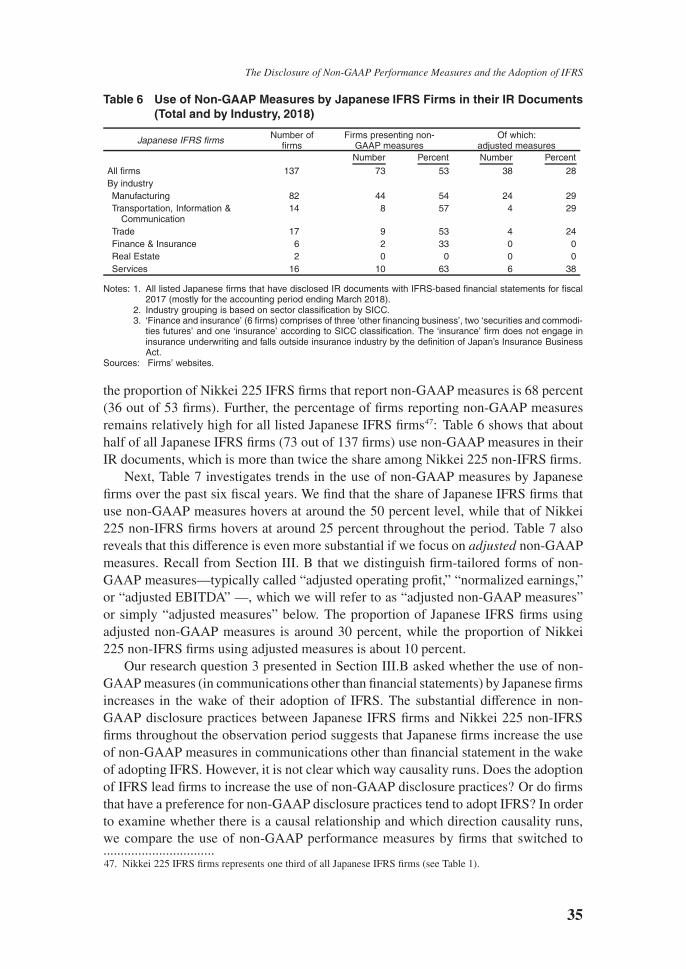
the proportion of Nikkei 225 IFRS firms that report non-GAAP measures is 68 percent(36 out of 53 firms). Further, the percentage of firms reporting non-GAAP measuresremains relatively high for all listed Japanese IFRS firms47: Table 6 shows that abouthalf of all Japanese IFRS firms (73 out of 137 firms) use non-GAAP measures in theirIR documents, which is more than twice the share among Nikkei 225 non-IFRS firms.
Next, Table 7 investigates trends in the use of non-GAAP measures by Japanesefirms over the past six fiscal years. We find that the share of Japanese IFRS firms thatuse non-GAAP measures hovers at around the 50 percent level, while that of Nikkei225 non-IFRS firms hovers at around 25 percent throughout the period. Table 7 alsoreveals that this difference is even more substantial if we focus on adjusted non-GAAPmeasures. Recall from Section III. B that we distinguish firm-tailored forms of non-GAAP measures—typically called “adjusted operating profit,” “normalized earnings,”or “adjusted EBITDA” —, which we will refer to as “adjusted non-GAAP measures”or simply “adjusted measures” below. The proportion of Japanese IFRS firms usingadjusted non-GAAP measures is around 30 percent, while the proportion of Nikkei225 non-IFRS firms using adjusted measures is about 10 percent.
Our research question 3 presented in Section III.B asked whether the use of non-GAAP measures (in communications other than financial statements) by Japanese firmsincreases in the wake of their adoption of IFRS. The substantial difference in non-GAAP disclosure practices between Japanese IFRS firms and Nikkei 225 non-IFRSfirms throughout the observation period suggests that Japanese firms increase the useof non-GAAP measures in communications other than financial statement in the wakeof adopting IFRS. However, it is not clear which way causality runs. Does the adoptionof IFRS lead firms to increase the use of non-GAAP disclosure practices? Or do firmsthat have a preference for non-GAAP disclosure practices tend to adopt IFRS? In orderto examine whether there is a causal relationship and which direction causality runs,we compare the use of non-GAAP performance measures by firms that switched to................................47. Nikkei 225 IFRS firms represents one third of all Japanese IFRS firms (see Table 1).
35
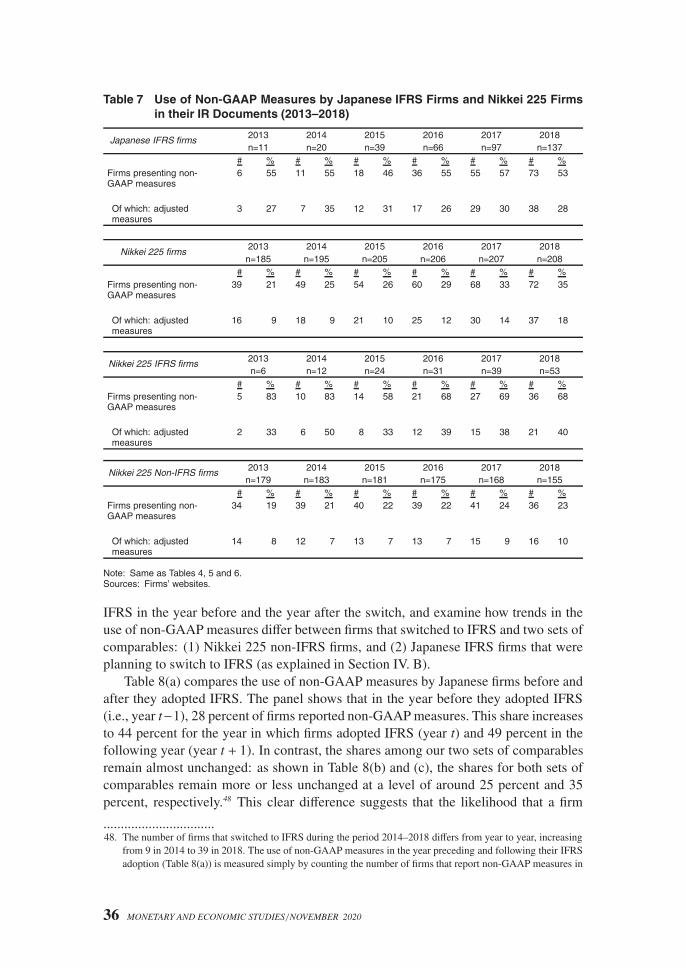
Table 7 Use of Non-GAAP Measures by Japanese IFRS Firms and Nikkei 225 Firmsin their IR Documents (2013–2018)
Japanese IFRS firms 2013 2014 2015 2016 2017 2018n=11 n=20 n=39 n=66 n=97 n=137
# % # % # % # % # % # %Firms presenting non-GAAP measures
6 55 11 55 18 46 36 55 55 57 73 53
Of which: adjustedmeasures
3 27 7 35 12 31 17 26 29 30 38 28
Nikkei 225 firms2013 2014 2015 2016 2017 2018n=185 n=195 n=205 n=206 n=207 n=208
# % # % # % # % # % # %Firms presenting non-GAAP measures
39 21 49 25 54 26 60 29 68 33 72 35
Of which: adjustedmeasures
16 9 18 9 21 10 25 12 30 14 37 18
Nikkei 225 IFRS firms 2013 2014 2015 2016 2017 2018n=6 n=12 n=24 n=31 n=39 n=53
# % # % # % # % # % # %Firms presenting non-GAAP measures
5 83 10 83 14 58 21 68 27 69 36 68
Of which: adjustedmeasures
2 33 6 50 8 33 12 39 15 38 21 40
Nikkei 225 Non-IFRS firms 2013 2014 2015 2016 2017 2018n=179 n=183 n=181 n=175 n=168 n=155
# % # % # % # % # % # %Firms presenting non-GAAP measures
34 19 39 21 40 22 39 22 41 24 36 23
Of which: adjustedmeasures
14 8 12 7 13 7 13 7 15 9 16 10
Note: Same as Tables 4, 5 and 6.Sources: Firms’ websites.
IFRS in the year before and the year after the switch, and examine how trends in theuse of non-GAAP measures differ between firms that switched to IFRS and two sets ofcomparables: (1) Nikkei 225 non-IFRS firms, and (2) Japanese IFRS firms that wereplanning to switch to IFRS (as explained in Section IV. B).
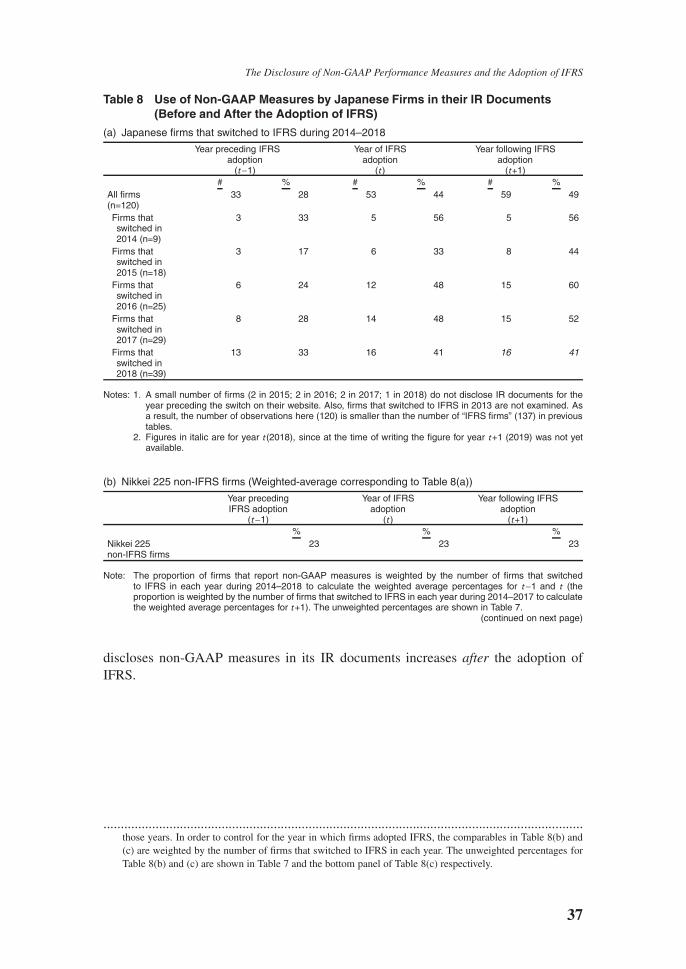
Table 8(a) compares the use of non-GAAP measures by Japanese firms before andafter they adopted IFRS. The panel shows that in the year before they adopted IFRS(i.e., year t−1), 28 percent of firms reported non-GAAP measures. This share increasesto 44 percent for the year in which firms adopted IFRS (year t) and 49 percent in thefollowing year (year t + 1). In contrast, the shares among our two sets of comparablesremain almost unchanged: as shown in Table 8(b) and (c), the shares for both sets ofcomparables remain more or less unchanged at a level of around 25 percent and 35percent, respectively.48 This clear difference suggests that the likelihood that a firm
................................48. The number of firms that switched to IFRS during the period 2014–2018 differs from year to year, increasing
from 9 in 2014 to 39 in 2018. The use of non-GAAP measures in the year preceding and following their IFRSadoption (Table 8(a)) is measured simply by counting the number of firms that report non-GAAP measures in
36 MONETARY AND ECONOMIC STUDIES /NOVEMBER 2020
The Disclosure of Non-GAAP Performance Measures and the Adoption of IFRS
Table 8 Use of Non-GAAP Measures by Japanese Firms in their IR Documents(Before and After the Adoption of IFRS)
(a) Japanese firms that switched to IFRS during 2014–2018
Year preceding IFRSadoption
(t−1)
Year of IFRSadoption
(t )
Year following IFRSadoption
(t+1)# % # % # %
All firms(n=120)
33 28 53 44 59 49
Firms thatswitched in2014 (n=9)
3 33 5 56 5 56
Firms thatswitched in2015 (n=18)
3 17 6 33 8 44
Firms thatswitched in2016 (n=25)
6 24 12 48 15 60
Firms thatswitched in2017 (n=29)
8 28 14 48 15 52
Firms thatswitched in2018 (n=39)
13 33 16 41 16 41
Notes: 1. A small number of firms (2 in 2015; 2 in 2016; 2 in 2017; 1 in 2018) do not disclose IR documents for theyear preceding the switch on their website. Also, firms that switched to IFRS in 2013 are not examined. Asa result, the number of observations here (120) is smaller than the number of “IFRS firms” (137) in previoustables.
2. Figures in italic are for year t (2018), since at the time of writing the figure for year t+1 (2019) was not yetavailable.
(b) Nikkei 225 non-IFRS firms (Weighted-average corresponding to Table 8(a))
Year precedingIFRS adoption
(t−1)
Year of IFRSadoption
(t )
Year following IFRSadoption
(t+1)% % %
Nikkei 225non-IFRS firms
23 23 23
Note: The proportion of firms that report non-GAAP measures is weighted by the number of firms that switchedto IFRS in each year during 2014–2018 to calculate the weighted average percentages for t−1 and t (theproportion is weighted by the number of firms that switched to IFRS in each year during 2014–2017 to calculatethe weighted average percentages for t+1). The unweighted percentages are shown in Table 7.
(continued on next page)
discloses non-GAAP measures in its IR documents increases after the adoption ofIFRS.
..........................................................................................................................................those years. In order to control for the year in which firms adopted IFRS, the comparables in Table 8(b) and(c) are weighted by the number of firms that switched to IFRS in each year. The unweighted percentages forTable 8(b) and (c) are shown in Table 7 and the bottom panel of Table 8(c) respectively.
37
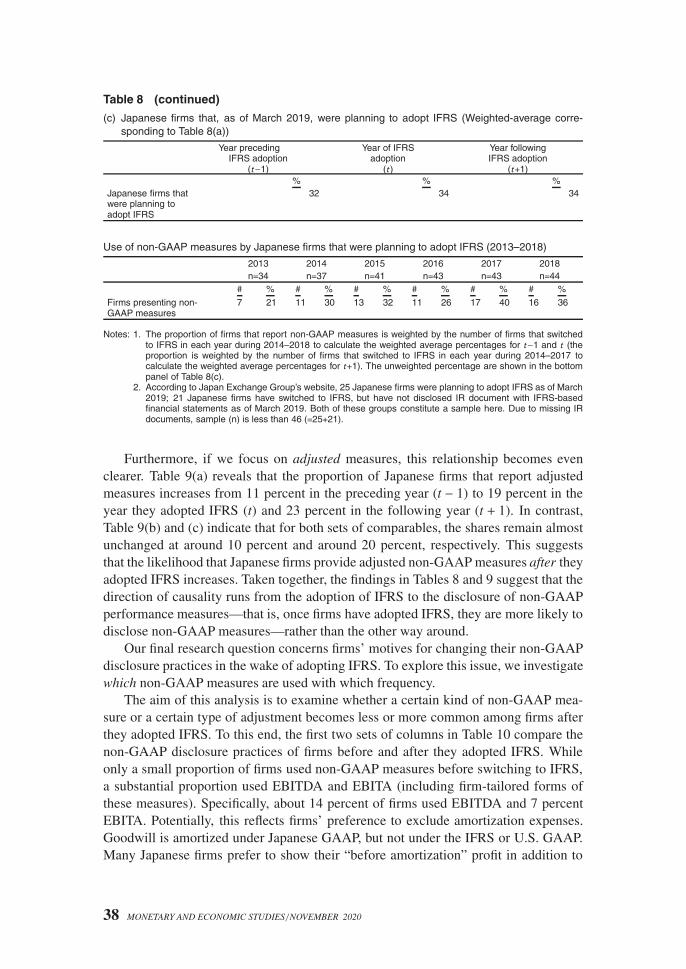
Table 8 (continued)
(c) Japanese firms that, as of March 2019, were planning to adopt IFRS (Weighted-average corre-sponding to Table 8(a))
Year precedingIFRS adoption
(t−1)
Year of IFRSadoption
(t )
Year followingIFRS adoption
(t+1)% % %
Japanese firms thatwere planning toadopt IFRS
32 34 34
Use of non-GAAP measures by Japanese firms that were planning to adopt IFRS (2013–2018)
2013 2014 2015 2016 2017 2018n=34 n=37 n=41 n=43 n=43 n=44
# % # % # % # % # % # %
Firms presenting non-GAAP measures
7 21 11 30 13 32 11 26 17 40 16 36
Notes: 1. The proportion of firms that report non-GAAP measures is weighted by the number of firms that switchedto IFRS in each year during 2014–2018 to calculate the weighted average percentages for t−1 and t (theproportion is weighted by the number of firms that switched to IFRS in each year during 2014–2017 tocalculate the weighted average percentages for t+1). The unweighted percentage are shown in the bottompanel of Table 8(c).
2. According to Japan Exchange Group’s website, 25 Japanese firms were planning to adopt IFRS as of March2019; 21 Japanese firms have switched to IFRS, but have not disclosed IR document with IFRS-basedfinancial statements as of March 2019. Both of these groups constitute a sample here. Due to missing IRdocuments, sample (n) is less than 46 (=25+21).
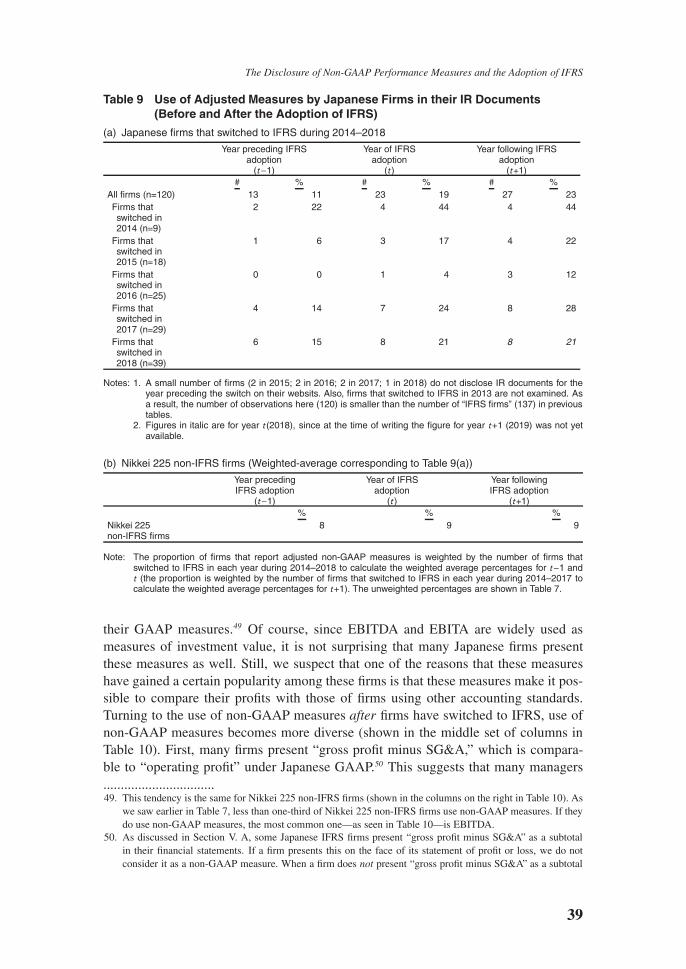
Furthermore, if we focus on adjusted measures, this relationship becomes evenclearer. Table 9(a) reveals that the proportion of Japanese firms that report adjustedmeasures increases from 11 percent in the preceding year (t − 1) to 19 percent in theyear they adopted IFRS (t) and 23 percent in the following year (t + 1). In contrast,Table 9(b) and (c) indicate that for both sets of comparables, the shares remain almostunchanged at around 10 percent and around 20 percent, respectively. This suggeststhat the likelihood that Japanese firms provide adjusted non-GAAP measures after theyadopted IFRS increases. Taken together, the findings in Tables 8 and 9 suggest that thedirection of causality runs from the adoption of IFRS to the disclosure of non-GAAPperformance measures—that is, once firms have adopted IFRS, they are more likely todisclose non-GAAP measures—rather than the other way around.
Our final research question concerns firms’ motives for changing their non-GAAPdisclosure practices in the wake of adopting IFRS. To explore this issue, we investigatewhich non-GAAP measures are used with which frequency.
The aim of this analysis is to examine whether a certain kind of non-GAAP mea-sure or a certain type of adjustment becomes less or more common among firms afterthey adopted IFRS. To this end, the first two sets of columns in Table 10 compare thenon-GAAP disclosure practices of firms before and after they adopted IFRS. Whileonly a small proportion of firms used non-GAAP measures before switching to IFRS,a substantial proportion used EBITDA and EBITA (including firm-tailored forms ofthese measures). Specifically, about 14 percent of firms used EBITDA and 7 percentEBITA. Potentially, this reflects firms’ preference to exclude amortization expenses.Goodwill is amortized under Japanese GAAP, but not under the IFRS or U.S. GAAP.Many Japanese firms prefer to show their “before amortization” profit in addition to
38 MONETARY AND ECONOMIC STUDIES /NOVEMBER 2020
The Disclosure of Non-GAAP Performance Measures and the Adoption of IFRS
Table 9 Use of Adjusted Measures by Japanese Firms in their IR Documents(Before and After the Adoption of IFRS)
(a) Japanese firms that switched to IFRS during 2014–2018
Year preceding IFRSadoption
(t−1)
Year of IFRSadoption
(t )
Year following IFRSadoption
(t+1)# % # % # %
All firms (n=120) 13 11 23 19 27 23Firms thatswitched in2014 (n=9)
2 22 4 44 4 44
Firms thatswitched in2015 (n=18)
1 6 3 17 4 22
Firms thatswitched in2016 (n=25)
0 0 1 4 3 12
Firms thatswitched in2017 (n=29)
4 14 7 24 8 28
Firms thatswitched in2018 (n=39)
6 15 8 21 8 21
Notes: 1. A small number of firms (2 in 2015; 2 in 2016; 2 in 2017; 1 in 2018) do not disclose IR documents for theyear preceding the switch on their websits. Also, firms that switched to IFRS in 2013 are not examined. Asa result, the number of observations here (120) is smaller than the number of “IFRS firms” (137) in previoustables.
2. Figures in italic are for year t (2018), since at the time of writing the figure for year t+1 (2019) was not yetavailable.
(b) Nikkei 225 non-IFRS firms (Weighted-average corresponding to Table 9(a))
Year precedingIFRS adoption
(t−1)
Year of IFRSadoption
(t )
Year followingIFRS adoption
(t+1)% % %
Nikkei 225non-IFRS firms
8 9 9
Note: The proportion of firms that report adjusted non-GAAP measures is weighted by the number of firms thatswitched to IFRS in each year during 2014–2018 to calculate the weighted average percentages for t−1 andt (the proportion is weighted by the number of firms that switched to IFRS in each year during 2014–2017 tocalculate the weighted average percentages for t+1). The unweighted percentages are shown in Table 7.
their GAAP measures.49 Of course, since EBITDA and EBITA are widely used asmeasures of investment value, it is not surprising that many Japanese firms presentthese measures as well. Still, we suspect that one of the reasons that these measureshave gained a certain popularity among these firms is that these measures make it pos-sible to compare their profits with those of firms using other accounting standards.Turning to the use of non-GAAP measures after firms have switched to IFRS, use ofnon-GAAP measures becomes more diverse (shown in the middle set of columns inTable 10). First, many firms present “gross profit minus SG&A,” which is compara-ble to “operating profit” under Japanese GAAP.50 This suggests that many managers................................49. This tendency is the same for Nikkei 225 non-IFRS firms (shown in the columns on the right in Table 10). As
we saw earlier in Table 7, less than one-third of Nikkei 225 non-IFRS firms use non-GAAP measures. If theydo use non-GAAP measures, the most common one—as seen in Table 10—is EBITDA.
50. As discussed in Section V. A, some Japanese IFRS firms present “gross profit minus SG&A” as a subtotalin their financial statements. If a firm presents this on the face of its statement of profit or loss, we do notconsider it as a non-GAAP measure. When a firm does not present “gross profit minus SG&A” as a subtotal
39
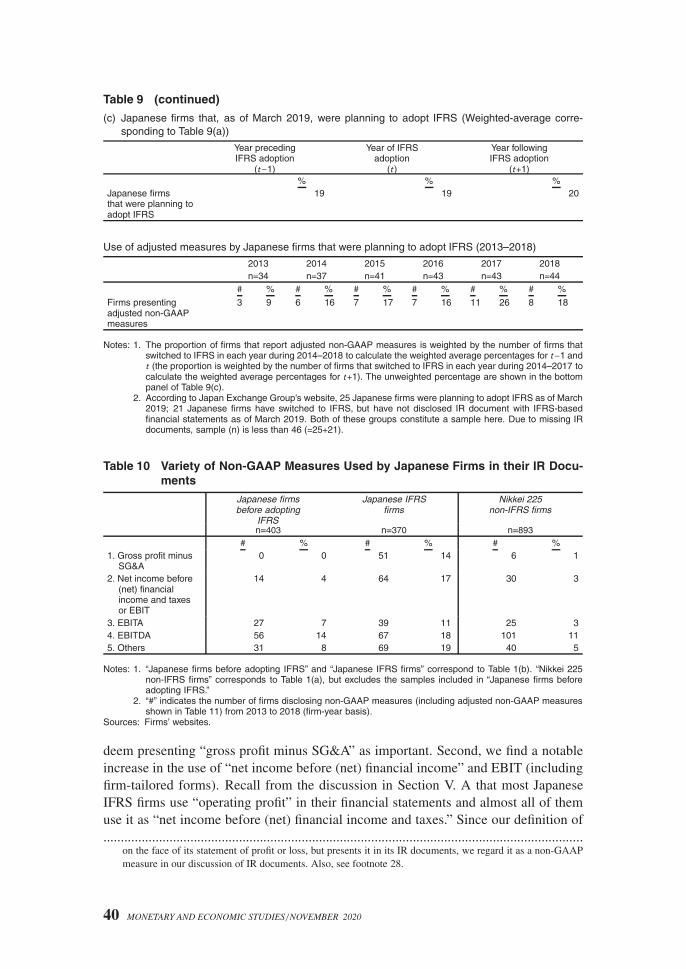
Table 9 (continued)
(c) Japanese firms that, as of March 2019, were planning to adopt IFRS (Weighted-average corre-sponding to Table 9(a))
Year precedingIFRS adoption
(t−1)
Year of IFRSadoption
(t )
Year followingIFRS adoption
(t+1)% % %
Japanese firmsthat were planning toadopt IFRS
19 19 20
Use of adjusted measures by Japanese firms that were planning to adopt IFRS (2013–2018)
2013 2014 2015 2016 2017 2018n=34 n=37 n=41 n=43 n=43 n=44
# % # % # % # % # % # %
Firms presentingadjusted non-GAAPmeasures
3 9 6 16 7 17 7 16 11 26 8 18
Notes: 1. The proportion of firms that report adjusted non-GAAP measures is weighted by the number of firms thatswitched to IFRS in each year during 2014–2018 to calculate the weighted average percentages for t−1 andt (the proportion is weighted by the number of firms that switched to IFRS in each year during 2014–2017 tocalculate the weighted average percentages for t+1). The unweighted percentage are shown in the bottompanel of Table 9(c).
2. According to Japan Exchange Group’s website, 25 Japanese firms were planning to adopt IFRS as of March2019; 21 Japanese firms have switched to IFRS, but have not disclosed IR document with IFRS-basedfinancial statements as of March 2019. Both of these groups constitute a sample here. Due to missing IRdocuments, sample (n) is less than 46 (=25+21).
Table 10 Variety of Non-GAAP Measures Used by Japanese Firms in their IR Docu-ments
Japanese firmsbefore adopting
IFRS
Japanese IFRSfirms
Nikkei 225non-IFRS firms
n=403 n=370 n=893
# % # % # %1. Gross profit minus
SG&A0 0 51 14 6 1
2. Net income before(net) financialincome and taxesor EBIT
14 4 64 17 30 3
3. EBITA 27 7 39 11 25 34. EBITDA 56 14 67 18 101 115. Others 31 8 69 19 40 5
Notes: 1. “Japanese firms before adopting IFRS” and “Japanese IFRS firms” correspond to Table 1(b). “Nikkei 225non-IFRS firms” corresponds to Table 1(a), but excludes the samples included in “Japanese firms beforeadopting IFRS.”
2. “#” indicates the number of firms disclosing non-GAAP measures (including adjusted non-GAAP measuresshown in Table 11) from 2013 to 2018 (firm-year basis).
Sources: Firms’ websites.
deem presenting “gross profit minus SG&A” as important. Second, we find a notableincrease in the use of “net income before (net) financial income” and EBIT (includingfirm-tailored forms). Recall from the discussion in Section V. A that most JapaneseIFRS firms use “operating profit” in their financial statements and almost all of themuse it as “net income before (net) financial income and taxes.” Since our definition of..........................................................................................................................................
on the face of its statement of profit or loss, but presents it in its IR documents, we regard it as a non-GAAPmeasure in our discussion of IR documents. Also, see footnote 28.
40 MONETARY AND ECONOMIC STUDIES /NOVEMBER 2020

The Disclosure of Non-GAAP Performance Measures and the Adoption of IFRS
Table 11 Variety of Adjusted Non-GAAP Measures Used by Japanese Firms in theirIR Documents
Japanese firmsbefore adopting
IFRS
Japanese IFRSfirms
Nikkei 225non-IFRS firms
n=403 n=370 n=893
# % # % # %1. Adjusted net income
before (net) financialincome and taxes (i.e.adjusted operatingprofit) or Adjusted-EBIT
12 3 50 14 26 3
2. Adjusted-EBITA 6 2 39 11 6 13. Adjusted-EBITDA 4 1 20 5 6 14. Other forms of
modified measures30 7 46 12 39 4
Notes: 1. “Japanese firms before adopting IFRS” and “Japanese IFRS firms” correspond to Table 1(b). “Nikkei 225non-IFRS firms” corresponds to Table 1(a), but excludes the samples included in “Japanese firms beforeadopting IFRS.”
2. “#” indicates the number of firms disclosing adjusted non-GAAP measures from 2013 to 2018 (firm-yearbasis).
Sources: Firms’ websites.
Table 12 List of Adjustment Items Used by Japanese IFRS Firms in their IR Docu-ments (2013–2018)
Japanese IFRS firms(n=370)
Frequency
Adjustments 1Acquisition related gains or charge/merger related gains or charge/restructuring gains or charges 88Non-recurring gains or losses 69Impairment losses/casualty losses 68Impairment of goodwill and other intangibles 39Gains or losses on disposal of non-current assets 37Gains or losses from settlement of lawsuit and other compensation 29
Adjustments 2Foreign currency translation gains/losses 27Gains/losses on sales of securities 24Retirement compensation/stock compensation expense/incentive compensation 17Inventory revaluation 11Retirement benefits related charges 5
Notes: 1. Items used more than ten in total in our firm-year samples of Japanese firms are shown.2. Adjustments 1 comprises adjustments of items in “other income (expenses)” in a typical IFRS-based state-
ment of profit or loss. Adjustments 2 comprises adjustments of line items other than “other income (ex-penses)” in the statement, that is, adjustments of line items in “revenue,” “cost of goods sold,” “SG&A,” or“financial income (expenses).”
Sources: Firms’ websites.
non-GAAP measures, as explained in Appendix 1, excludes subtotals presented on theface of income statements, the increase should be mostly due to the widespread use offirm-tailored forms of non-GAAP measures. Table 11 sheds light on this aspect by dis-tinguishing firm-tailored forms (adjusted measures) from other non-GAAP measures.The table shows that there is a considerable increase in Japanese firms’ use of firm-tailored forms of non-GAAP measures, in particular adjusted forms of operating profit,once they have adopted IFRS.
Turning to the nature of adjustments Japanese IFRS firms make to arrive at theiradjusted non-GAAP measures, we find that most of Japanese IFRS firms excludewhat managers deem non-recurring items, such as acquisition- or merger-relatedgains/charges, restructuring gains/charges, impairment losses, casualty losses, and
41
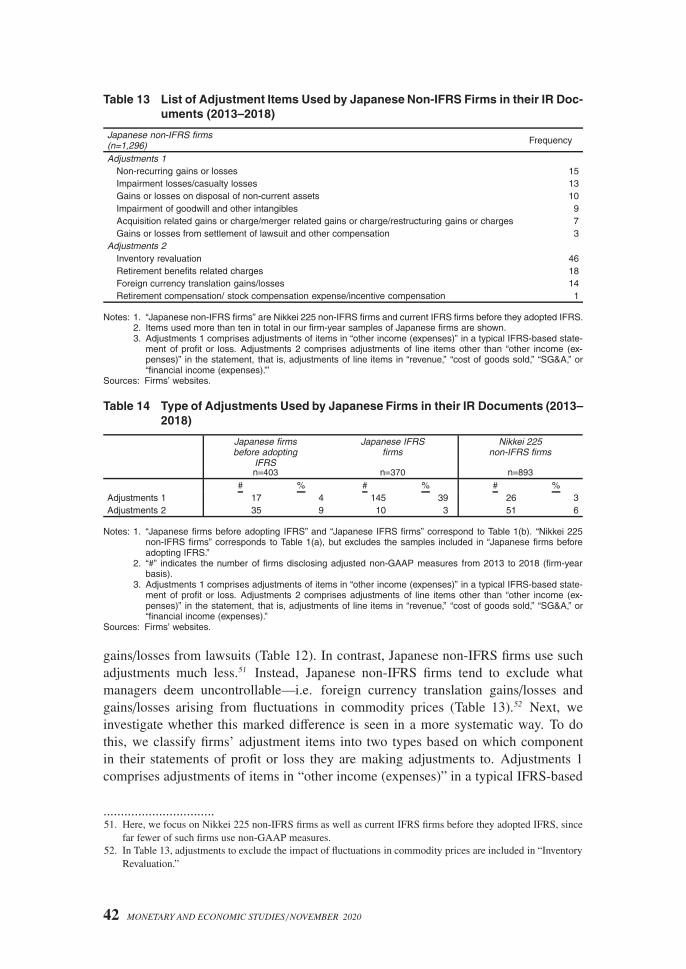
Table 13 List of Adjustment Items Used by Japanese Non-IFRS Firms in their IR Doc-uments (2013–2018)
Japanese non-IFRS firms(n=1,296) Frequency
Adjustments 1Non-recurring gains or losses 15Impairment losses/casualty losses 13Gains or losses on disposal of non-current assets 10Impairment of goodwill and other intangibles 9Acquisition related gains or charge/merger related gains or charge/restructuring gains or charges 7Gains or losses from settlement of lawsuit and other compensation 3
Adjustments 2Inventory revaluation 46Retirement benefits related charges 18Foreign currency translation gains/losses 14Retirement compensation/ stock compensation expense/incentive compensation 1
Notes: 1. “Japanese non-IFRS firms” are Nikkei 225 non-IFRS firms and current IFRS firms before they adopted IFRS.2. Items used more than ten in total in our firm-year samples of Japanese firms are shown.3. Adjustments 1 comprises adjustments of items in “other income (expenses)” in a typical IFRS-based state-
ment of profit or loss. Adjustments 2 comprises adjustments of line items other than “other income (ex-penses)” in the statement, that is, adjustments of line items in “revenue,” “cost of goods sold,” “SG&A,” or“financial income (expenses).”’
Sources: Firms’ websites.
Table 14 Type of Adjustments Used by Japanese Firms in their IR Documents (2013–2018)
Japanese firmsbefore adopting
IFRS
Japanese IFRSfirms
Nikkei 225non-IFRS firms
n=403 n=370 n=893
# % # % # %Adjustments 1 17 4 145 39 26 3Adjustments 2 35 9 10 3 51 6
Notes: 1. “Japanese firms before adopting IFRS” and “Japanese IFRS firms” correspond to Table 1(b). “Nikkei 225non-IFRS firms” corresponds to Table 1(a), but excludes the samples included in “Japanese firms beforeadopting IFRS.”
2. “#” indicates the number of firms disclosing adjusted non-GAAP measures from 2013 to 2018 (firm-yearbasis).
3. Adjustments 1 comprises adjustments of items in “other income (expenses)” in a typical IFRS-based state-ment of profit or loss. Adjustments 2 comprises adjustments of line items other than “other income (ex-penses)” in the statement, that is, adjustments of line items in “revenue,” “cost of goods sold,” “SG&A,” or“financial income (expenses).”
Sources: Firms’ websites.
gains/losses from lawsuits (Table 12). In contrast, Japanese non-IFRS firms use suchadjustments much less.51 Instead, Japanese non-IFRS firms tend to exclude whatmanagers deem uncontrollable—i.e. foreign currency translation gains/losses andgains/losses arising from fluctuations in commodity prices (Table 13).52 Next, weinvestigate whether this marked difference is seen in a more systematic way. To dothis, we classify firms’ adjustment items into two types based on which componentin their statements of profit or loss they are making adjustments to. Adjustments 1comprises adjustments of items in “other income (expenses)” in a typical IFRS-based
................................51. Here, we focus on Nikkei 225 non-IFRS firms as well as current IFRS firms before they adopted IFRS, since
far fewer of such firms use non-GAAP measures.52. In Table 13, adjustments to exclude the impact of fluctuations in commodity prices are included in “Inventory
Revaluation.”
42 MONETARY AND ECONOMIC STUDIES /NOVEMBER 2020
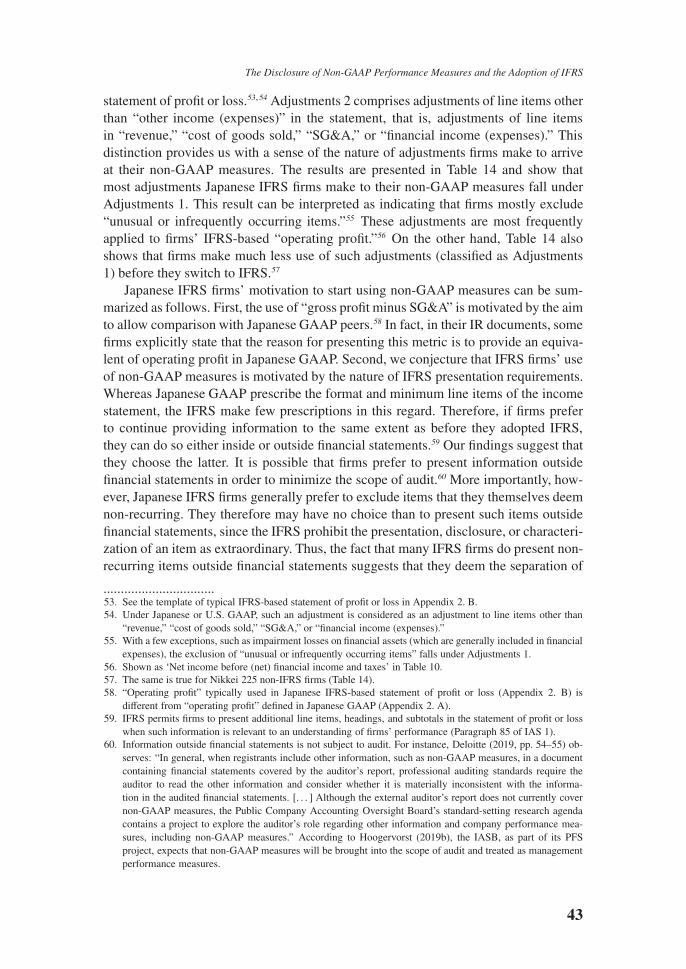
The Disclosure of Non-GAAP Performance Measures and the Adoption of IFRS
statement of profit or loss.53,54 Adjustments 2 comprises adjustments of line items otherthan “other income (expenses)” in the statement, that is, adjustments of line itemsin “revenue,” “cost of goods sold,” “SG&A,” or “financial income (expenses).” Thisdistinction provides us with a sense of the nature of adjustments firms make to arriveat their non-GAAP measures. The results are presented in Table 14 and show thatmost adjustments Japanese IFRS firms make to their non-GAAP measures fall underAdjustments 1. This result can be interpreted as indicating that firms mostly exclude“unusual or infrequently occurring items.”55 These adjustments are most frequentlyapplied to firms’ IFRS-based “operating profit.”56 On the other hand, Table 14 alsoshows that firms make much less use of such adjustments (classified as Adjustments1) before they switch to IFRS.57
Japanese IFRS firms’ motivation to start using non-GAAP measures can be sum-marized as follows. First, the use of “gross profit minus SG&A” is motivated by the aimto allow comparison with Japanese GAAP peers.58 In fact, in their IR documents, somefirms explicitly state that the reason for presenting this metric is to provide an equiva-lent of operating profit in Japanese GAAP. Second, we conjecture that IFRS firms’ useof non-GAAP measures is motivated by the nature of IFRS presentation requirements.Whereas Japanese GAAP prescribe the format and minimum line items of the incomestatement, the IFRS make few prescriptions in this regard. Therefore, if firms preferto continue providing information to the same extent as before they adopted IFRS,they can do so either inside or outside financial statements.59 Our findings suggest thatthey choose the latter. It is possible that firms prefer to present information outsidefinancial statements in order to minimize the scope of audit.60 More importantly, how-ever, Japanese IFRS firms generally prefer to exclude items that they themselves deemnon-recurring. They therefore may have no choice than to present such items outsidefinancial statements, since the IFRS prohibit the presentation, disclosure, or characteri-zation of an item as extraordinary. Thus, the fact that many IFRS firms do present non-recurring items outside financial statements suggests that they deem the separation of
................................53. See the template of typical IFRS-based statement of profit or loss in Appendix 2. B.54. Under Japanese or U.S. GAAP, such an adjustment is considered as an adjustment to line items other than
“revenue,” “cost of goods sold,” “SG&A,” or “financial income (expenses).”55. With a few exceptions, such as impairment losses on financial assets (which are generally included in financial
expenses), the exclusion of “unusual or infrequently occurring items” falls under Adjustments 1.56. Shown as ‘Net income before (net) financial income and taxes’ in Table 10.57. The same is true for Nikkei 225 non-IFRS firms (Table 14).58. “Operating profit” typically used in Japanese IFRS-based statement of profit or loss (Appendix 2. B) is
different from “operating profit” defined in Japanese GAAP (Appendix 2. A).59. IFRS permits firms to present additional line items, headings, and subtotals in the statement of profit or loss
when such information is relevant to an understanding of firms’ performance (Paragraph 85 of IAS 1).60. Information outside financial statements is not subject to audit. For instance, Deloitte (2019, pp. 54–55) ob-
serves: “In general, when registrants include other information, such as non-GAAP measures, in a documentcontaining financial statements covered by the auditor’s report, professional auditing standards require theauditor to read the other information and consider whether it is materially inconsistent with the informa-tion in the audited financial statements. [. . . ] Although the external auditor’s report does not currently covernon-GAAP measures, the Public Company Accounting Oversight Board’s standard-setting research agendacontains a project to explore the auditor’s role regarding other information and company performance mea-sures, including non-GAAP measures.” According to Hoogervorst (2019b), the IASB, as part of its PFSproject, expects that non-GAAP measures will be brought into the scope of audit and treated as managementperformance measures.
43

non-recurring items important. Some IFRS firms, in fact, explicitly state that the reasonfor presenting non-GAAP measures is to report their underlying performance. Anotherpossible motive for the use of non-GAAP measures is to allow comparison with globalpeers. For firms that compete globally, switching to IFRS can be a good opportunityfor them to start presenting non-GAAP measures, which many of their competitorsoverseas already use.61
It is notable that virtually no Japanese IFRS firms use a measure that is equivalentto “ordinary profit” in the Japanese GAAP (i.e., “net income before special items andtaxes”).62 When firms use Japanese GAAP, they generally do not report adjusted mea-sures and seem to be fairly satisfied with their use of “special items” and “ordinaryprofit.” Once they depart from Japanese GAAP, however, Japanese firms no longer use“ordinary profit,” not even as a non-GAAP measure. This suggests that firm managersprefer to present separately what they regard as recurring and non-recurring items.This corresponds to financial statement users’ call for disclosure of such items.63,64 Ourfindings here also underscore the importance of the PFS project, in which the IASBdiscusses the introduction of management performance measures as well as ways toimprove disaggregation in statements of financial performance.65
................................61. In interviews conducted by the Japanese accounting magazine Kigyo Kaikei with seven Japanese IFRS firms,
several interviewees explained that their motivation for starting to use non-GAAP measures, in addition to themotives we discussed here, was to follow global competitors’ presentation practices (Kigyo Kaikei Henshubu[2019]).
62. Japanese GAAP requires firms to disclose extraordinary profit or losses and retrospective restatements as“special items.”
63. IASB (2017) provides as follows (underline by authors):5.25 Users of the financial statements have told the Board that separate presentation or disclosure of unusual
or infrequently occurring items is helpful in making forecasts about future cash flows. Consequently,the Board’s preliminary view is that it should allow entities to present such item separately. However, torespond to concerns that entities are presenting unusual or infrequently occurring items inappropriatelyand/or inconsistently, the Board is also of preliminary view that a general disclosure standard shouldexplain when and how items can be presented in the statement(s) of financial performance as unusualand/or infrequently occurring.
64. Prior studies indicate that special items have been used for the purpose of earnings management by firmmanagers but also show that such special items are relevant to investors.
An example of earnings management using special items is a “big bath.” Empirical evidence suggests thatfirm managers use special items for earnings management by overstating current-period expenses to improvethe firm’s future income (Burgstahler, Jiambalvo, and Shevlin [2002]). Extending the analysis by Burgstahler,Jiambalvo, and Shevlin (2002), Cready, Lopez, and Sisneros (2012) find that negative special items serve notonly as a transfer of expenses but also signal real future performance improvements made within the firm.
A different use of special items to manage earnings is “classification shifting” (McVay[2006]). The studyidentifies managers’ deliberate misclassification of items within the income statement. However, these priorstudies do not necessarily assert that the use of special items or the separation of recurring and non-recurringitems are used only for earnings management and hence of little value for investors.
65. The IASB proposes to require companies to disclose, in a single note, for each unusual items: (1) the amountrecognized in the period; (2) a narrative description of how it arose and why it meets the definition of anunusual item; (3) in which line item(s) in the statement of profit or loss it is included; and (4) an analysisby nature, if the company presents operating expenses by function in the statement of profit or loss. Theproposed definition of “unusual income and expenses” in the Exposure Draft is “income and expenses withlimited predictive value. Income and expenses have limited predictive value when it is reasonable to expectthat income or expenses that are similar in type and amount will not arise for several future annual reportingperiods.” See IASB (2019b) .
44 MONETARY AND ECONOMIC STUDIES /NOVEMBER 2020
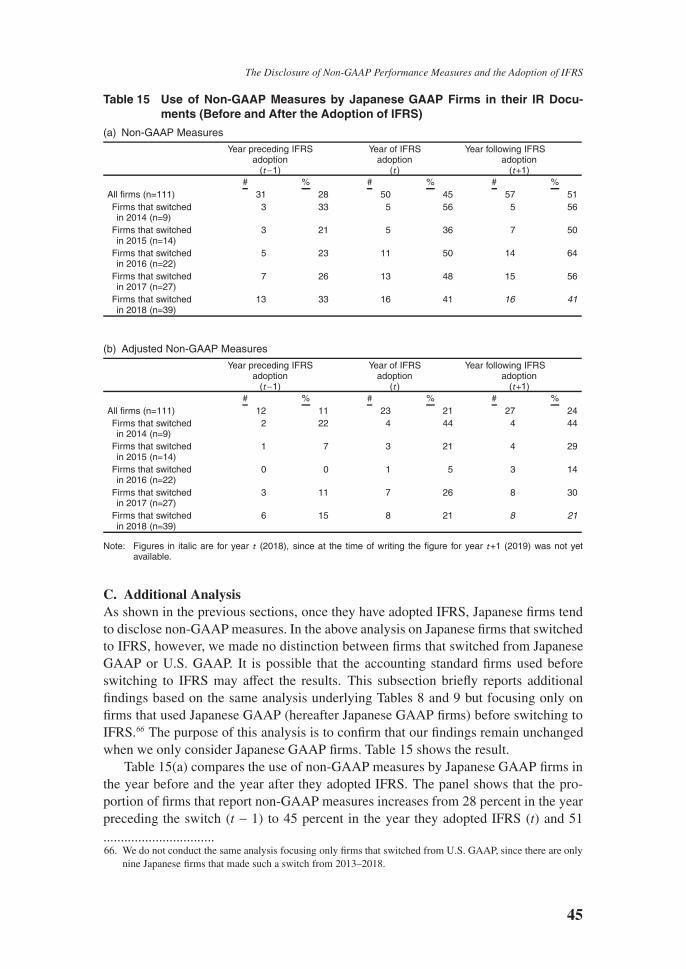
The Disclosure of Non-GAAP Performance Measures and the Adoption of IFRS
Table 15 Use of Non-GAAP Measures by Japanese GAAP Firms in their IR Docu-ments (Before and After the Adoption of IFRS)
(a) Non-GAAP Measures
Year preceding IFRSadoption
(t−1)
Year of IFRSadoption
(t )
Year following IFRSadoption
(t+1)# % # % # %
All firms (n=111) 31 28 50 45 57 51Firms that switchedin 2014 (n=9)
3 33 5 56 5 56
Firms that switchedin 2015 (n=14)
3 21 5 36 7 50
Firms that switchedin 2016 (n=22)
5 23 11 50 14 64
Firms that switchedin 2017 (n=27)
7 26 13 48 15 56
Firms that switchedin 2018 (n=39)
13 33 16 41 16 41
(b) Adjusted Non-GAAP Measures
Year preceding IFRSadoption
(t−1)
Year of IFRSadoption
(t )
Year following IFRSadoption
(t+1)# % # % # %
All firms (n=111) 12 11 23 21 27 24Firms that switchedin 2014 (n=9)
2 22 4 44 4 44
Firms that switchedin 2015 (n=14)
1 7 3 21 4 29
Firms that switchedin 2016 (n=22)
0 0 1 5 3 14
Firms that switchedin 2017 (n=27)
3 11 7 26 8 30
Firms that switchedin 2018 (n=39)
6 15 8 21 8 21
Note: Figures in italic are for year t (2018), since at the time of writing the figure for year t+1 (2019) was not yetavailable.
C. Additional AnalysisAs shown in the previous sections, once they have adopted IFRS, Japanese firms tendto disclose non-GAAP measures. In the above analysis on Japanese firms that switchedto IFRS, however, we made no distinction between firms that switched from JapaneseGAAP or U.S. GAAP. It is possible that the accounting standard firms used beforeswitching to IFRS may affect the results. This subsection briefly reports additionalfindings based on the same analysis underlying Tables 8 and 9 but focusing only onfirms that used Japanese GAAP (hereafter Japanese GAAP firms) before switching toIFRS.66 The purpose of this analysis is to confirm that our findings remain unchangedwhen we only consider Japanese GAAP firms. Table 15 shows the result.
Table 15(a) compares the use of non-GAAP measures by Japanese GAAP firms inthe year before and the year after they adopted IFRS. The panel shows that the pro-portion of firms that report non-GAAP measures increases from 28 percent in the yearpreceding the switch (t − 1) to 45 percent in the year they adopted IFRS (t) and 51................................66. We do not conduct the same analysis focusing only firms that switched from U.S. GAAP, since there are only
nine Japanese firms that made such a switch from 2013–2018.
45
percent in the following year (t + 1). We use the same two sets of comparables asabove. Recall that for the two sets of comparables, the proportions remain almost un-changed (Table 8(b) and (c)). This difference suggests that the likelihood that firms thatpreviously used Japanese GAAP disclose non-GAAP measures in their IR documentsincreases following the adoption of IFRS. The same pattern is observed for adjustedmeasures. Table 15(b) compares the use of adjusted measures by Japanese GAAP firmsin the year before and the year after the adoption of IFRS. The panel shows that theproportion of Japanese firms that report adjusted non-GAAP measures increased from11 percent in the year preceding the switch (t−1) to 21 percent in the year of the switch(t) and 24 percent in the following year (t + 1). Again, a clear difference is observedfrom the two sets of comparables in Table 9(b) and (c). Taken together, our findingson the relationship between Japanese firms’ IFRS adoption and changes in non-GAAPdisclosure practices remain unchanged when we focus on Japanese GAAP firms only.
VI. Conclusion
This study provides evidence on whether and how Japanese firms change their non-GAAP disclosure practices both inside and outside financial statements in the wake ofadopting IFRS.
Investigating the financial statements of all listed firms in Japan that have switchedto IFRS, we find that most of these firms continue to use “operating profit” in theirstatements of financial performance after they have adopted IFRS. Moreover, with onlya very few exceptions, such firms use the same definition of operating profit, althoughthere are differences in terms of whether firms include or exclude the share of profitfrom associates and joint ventures. We also discussed the role of the Illustrative IFRSConsolidated Financial Statements prepared by Japan’s Financial Services Agency. Wesuspect that although they are not binding, the illustrative statements likely have helpedto build a widely shared understanding of “operating profit” among firms that haveadopted IFRS. Further, the introduction of several subtotals proposed in the PFS projectwould improve the comparability and usefulness of financial statements.
For our investigation of Japanese firms’ non-GAAP disclosure practices outsidefinancial statements, we used IR documents for the past six fiscal years available fromfirms’ websites, focusing on all Nikkei 225 firms as well as all listed firms in Japan thathave adopted IFRS. We find, firstly, that only one third of Nikkei 225 firms report non-GAAP measures. Secondly, we find evidence suggesting that, in the wake of adoptingIFRS, Japanese firms change their non-GAAP disclosure practices in the followingways:
• Japanese firms increase their use of non-GAAP measures after they haveadopted IFRS.• Many Japanese firms start providing adjusted non-GAAP measures only after
they have adopted IFRS.• The exclusion of non-recurring items to arrive at non-GAAP measures becomes
more common only after the adoption of IFRS.
Our findings are important in two respects. First, the evidence we obtain is consis-
46 MONETARY AND ECONOMIC STUDIES /NOVEMBER 2020

The Disclosure of Non-GAAP Performance Measures and the Adoption of IFRS
tent with the view that the proliferation of non-GAAP measures is, in part, attributableto the nature of the current IFRS presentation requirements for financial statements.Second, our findings indicate that many managers deem the separation of non-recurringitems important. Together with our findings on whether and how Japanese firms usesubtotals in their statements of financial performance, these results underscore the im-portance of the IASB’s PFS project. Overall, our findings provide important empiricalevidence at a time when the IASB is developing new presentation requirements forstatements of financial performance.
APPENDIX 1: WHAT IS A NON-GAAP MEASURE?
Firms’ financial performance measures that are not required to be disclosed by GAAP(either national GAAP or IFRS) are commonly referred to as “non-GAAP (perfor-mance) measures.”67 There is, however, no universal definition of ‘non-GAAP mea-sures’. In this Appendix, we review definitions by major securities regulators and showhow those measures may or may not appear inside or outside financial statements whenfirms use different accounting standards. Next, we explain the criteria we used to con-sider “non-GAAP (performance) measures” in this study.
Definitions by Major Securities RegulatorsThe Table below shows the definition of non-GAAP measures by the U.S. SEC, theESMA and the IOSCO. Japanese securities regulators currently do not directly regulatenon-GAAP measures.
Definition of “Non-GAAP measures” by Major Securities Regulators
U.S. SEC (2002) For purposes of Regulation G, a non-GAAP financial measure is a numerical measure of aregistrant’s historical or future performance, financial position, or cash flows that:
• exclude amounts, or is subject to adjustments that have the effect of excluding amounts,that are included in the most directly comparable measure calculated and presented inaccordance with GAAP in the statement of income, balance sheet or statement of cashflows (or equivalent statements) of the issuer; or
• includes amounts, or is subject to adjustments that have the effect of including amounts,that are excluded from the most directly comparable measure so calculated and pre-sented.
ESMA (2015) What is an alternative performance measure (APM)?For the purpose of these guidelines an APM is understood as a financial measure of historicalor future financial performance, financial position, or cash flows, other than a financial measuredefined or specified in the applicable financial reporting framework.
IOSCO (2016) For the purpose of this Statement, a non-GAAP financial measure is a numerical measure ofan issuer’s current, historical or future financial performance, financial position or cash flow thatis not a GAAP measure.
................................67. The terms “non-GAAP (performance) measures,” “non-GAAP financial measures,” “alternative performance
measures (APMs),” “pro forma (performance) measures,” and “street earnings” are often used synonymously.U.S. and Canadian securities regulators call them “non-GAAP (financial) measures,” while E.U. securitiesregulators call them “alternative performance measures (APMs).”
47
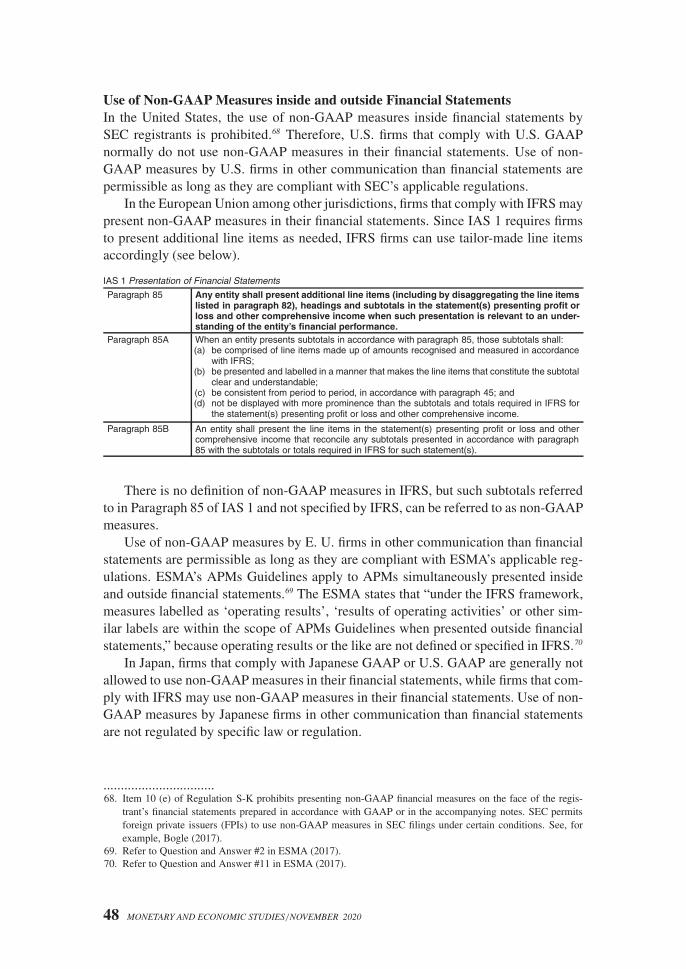
Use of Non-GAAP Measures inside and outside Financial StatementsIn the United States, the use of non-GAAP measures inside financial statements bySEC registrants is prohibited.68 Therefore, U.S. firms that comply with U.S. GAAPnormally do not use non-GAAP measures in their financial statements. Use of non-GAAP measures by U.S. firms in other communication than financial statements arepermissible as long as they are compliant with SEC’s applicable regulations.
In the European Union among other jurisdictions, firms that comply with IFRS maypresent non-GAAP measures in their financial statements. Since IAS 1 requires firmsto present additional line items as needed, IFRS firms can use tailor-made line itemsaccordingly (see below).
IAS 1 Presentation of Financial Statements
Paragraph 85 Any entity shall present additional line items (including by disaggregating the line itemslisted in paragraph 82), headings and subtotals in the statement(s) presenting profit orloss and other comprehensive income when such presentation is relevant to an under-standing of the entity’s financial performance.
Paragraph 85A When an entity presents subtotals in accordance with paragraph 85, those subtotals shall:(a) be comprised of line items made up of amounts recognised and measured in accordance
with IFRS;(b) be presented and labelled in a manner that makes the line items that constitute the subtotal
clear and understandable;(c) be consistent from period to period, in accordance with paragraph 45; and(d) not be displayed with more prominence than the subtotals and totals required in IFRS for
the statement(s) presenting profit or loss and other comprehensive income.
Paragraph 85B An entity shall present the line items in the statement(s) presenting profit or loss and othercomprehensive income that reconcile any subtotals presented in accordance with paragraph85 with the subtotals or totals required in IFRS for such statement(s).
There is no definition of non-GAAP measures in IFRS, but such subtotals referredto in Paragraph 85 of IAS 1 and not specified by IFRS, can be referred to as non-GAAPmeasures.
Use of non-GAAP measures by E. U. firms in other communication than financialstatements are permissible as long as they are compliant with ESMA’s applicable reg-ulations. ESMA’s APMs Guidelines apply to APMs simultaneously presented insideand outside financial statements.69 The ESMA states that “under the IFRS framework,measures labelled as ‘operating results’, ‘results of operating activities’ or other sim-ilar labels are within the scope of APMs Guidelines when presented outside financialstatements,” because operating results or the like are not defined or specified in IFRS.70
In Japan, firms that comply with Japanese GAAP or U.S. GAAP are generally notallowed to use non-GAAP measures in their financial statements, while firms that com-ply with IFRS may use non-GAAP measures in their financial statements. Use of non-GAAP measures by Japanese firms in other communication than financial statementsare not regulated by specific law or regulation.
................................68. Item 10 (e) of Regulation S-K prohibits presenting non-GAAP financial measures on the face of the regis-
trant’s financial statements prepared in accordance with GAAP or in the accompanying notes. SEC permitsforeign private issuers (FPIs) to use non-GAAP measures in SEC filings under certain conditions. See, forexample, Bogle (2017).
69. Refer to Question and Answer #2 in ESMA (2017).70. Refer to Question and Answer #11 in ESMA (2017).
48 MONETARY AND ECONOMIC STUDIES /NOVEMBER 2020

The Disclosure of Non-GAAP Performance Measures and the Adoption of IFRS
Criteria Used to Consider Non-GAAP Measures in this StudyFor the purpose of this study, a non-GAAP measure is a numerical measure of a firm’shistorical performance. A numerical measure of a firm’s financial position, or cashflows is outside the scope of the study. A numerical measure of firm’s future perfor-mance alone is also outside the scope of the study.
Consistent with the definition by U.S. SEC (2012), the amounts in the table to showthe impact that certain significant income and expense items have on GAAP measuresare not considered non-GAAP measures unless they were subtotaled to a non-GAAPamount or used to derive an adjusted measure. Further, the presentation of year-over-year percentage change of non-GAAP measures alone, without mentioning the amountof it, is not considered non-GAAP measure either.
For our investigation of IFRS-based financial statements (the first part of our anal-ysis), subtotals not specified or defined by IFRS are considered non-GAAP measures.‘Operating profit’, for example, is regarded as non-GAAP measures. On the other hand,for our investigation for IR documents (the second part of our analysis), measures pre-sented outside financial statements that are exactly the same as shown in its IFRS-basedfinancial statements—are not considered non-GAAP measures. A measure simultane-ously presented inside and outside financial statements, for example ‘operating profit’shown in both of their IFRS-based financial statements and IR document is not consid-ered non-GAAP measure.
APPENDIX 2: JAPANESE GAAP AND IFRS COMPARISON FORINCOME STATEMENT PRESENTATION
In this Appendix, illustrations of the following consolidated income statements areshown:
(a) Japanese GAAP-based income statement;(b) the statement of profit or loss in Illustrative IFRS Consolidated Financial State-
ments by Japan’s Financial Services Agency (JFSA Illustration); and(c) the statement of profit or loss with subtotals tentatively defined in the IASB’s
Primary Financial Statements project.71
A. Illustration of Japanese GAAP-based Income StatementBelow is an excerpt from Form 5 in Japan’s Ministry of Finance Ordinance on Termi-nology, Forms and Preparation Methods of Consolidated Financial Statements.
Consolidated Income Statement(amount unit: Japanese yen)
Consolidatedprevious accountingyear for the fiscalyear ended **, 20**
Consolidatedcurrent accountingyear for the fiscalyear ended **, 20**
Revenue *** ***Cost of goods sold *** ***Gross profit (or gross loss) *** ***Selling, general and administrative expense (SG&A)
...........................................71. For (a) and (b), translations are provided by authors.
49

**** *** ******* *** ******* *** ***Total selling, general and administrative expense (SG&A) *** ***Operating profit (or operating loss) *** ***Non-operating income
Interest income *** ***Dividends income *** ***Gain from sale of investment securities *** ***Share of profit of joint ventures and associates *** ******* *** ******* *** ***Total non-operating income *** ***
Non-operating expensesInterest expenses *** ***Loss from sale of investment securities *** ***Share of losses of joint ventures and associates *** ******* *** ***Total non-operating expenses *** ***
Ordinary profit (or ordinary losses) *** ***Special income
Gain on sale of fixed assets *** ***Gain on acquisition of business *** ******* *** ******* *** ***Total special income *** ***
Special expensesLoss from sale of fixed assets *** ***Impairment loss *** ***Loss on disaster *** ******* *** ******* *** ***Total special expenses *** ***
Net income before taxes and minority interests *** ***The corporation tax, inhabitants tax, and enterprise taxes *** ***Tax adjustment *** ***Total taxes *** ***Net income (or net loss) *** ***Net income attributable to non-controlling interests (or net lossattributable to non-controlling interests)
*** ***
Net income attributable to owners of parent (or net loss at-tributable to owners of parent)
*** ***
B. JFSA Illustration of an IFRS-based Statement of Profit or Loss
Consolidated Income Statement(amount unit: Japanese million yen)
Notes From April 1, 2014 toMarch 31, 2015
From April 1, 2015 toMarch 31, 2016
Revenue 6, 25Cost of goods soldGross profit
Selling, general and administrative expense (SG&A) 26Other income 27Other expenses 27Operating profit
Financial income 28Financial expenses 28
50 MONETARY AND ECONOMIC STUDIES /NOVEMBER 2020
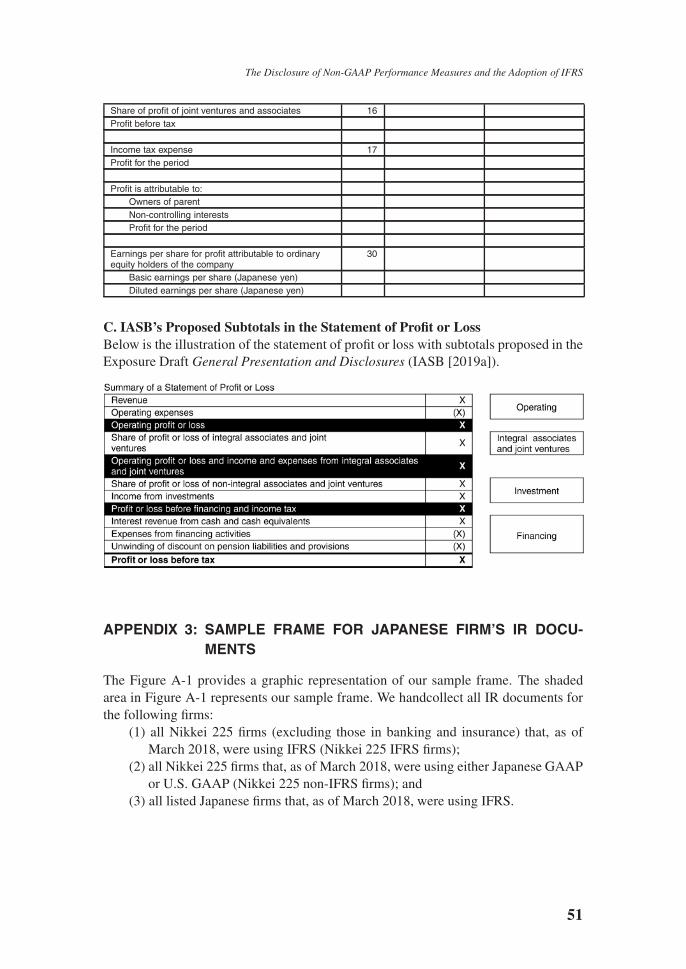
The Disclosure of Non-GAAP Performance Measures and the Adoption of IFRS
Share of profit of joint ventures and associates 16Profit before tax
Income tax expense 17Profit for the period
Profit is attributable to:Owners of parentNon-controlling interestsProfit for the period
Earnings per share for profit attributable to ordinaryequity holders of the company
30
Basic earnings per share (Japanese yen)Diluted earnings per share (Japanese yen)
C. IASB’s Proposed Subtotals in the Statement of Profit or LossBelow is the illustration of the statement of profit or loss with subtotals proposed in theExposure Draft General Presentation and Disclosures (IASB [2019a]).
APPENDIX 3: SAMPLE FRAME FOR JAPANESE FIRM’S IR DOCU-MENTS
The Figure A-1 provides a graphic representation of our sample frame. The shadedarea in Figure A-1 represents our sample frame. We handcollect all IR documents forthe following firms:
(1) all Nikkei 225 firms (excluding those in banking and insurance) that, as ofMarch 2018, were using IFRS (Nikkei 225 IFRS firms);
(2) all Nikkei 225 firms that, as of March 2018, were using either Japanese GAAPor U.S. GAAP (Nikkei 225 non-IFRS firms); and
(3) all listed Japanese firms that, as of March 2018, were using IFRS.
51

Figure A-1 Sample Frame for Japanese Firms’ IR Documents
Note: “Banking and insurance” in this figure is as defined in Japan’s Banking Act and Insurance Business Act. NoJapanese firms in banking and insurance have so far adopted IFRS.
Since we analyze how firms change their disclosure practices, we track the abovementioned firms over six successive fiscal year-ends. When we investigate trends in theuse of non-GAAP performance measures by type of firm (i.e., Japanese IFRS firms,Japanese non-IFRS firms, Nikkei 225 IFRS firms, or Nikkei 225 non-IFRS firms), ourclassification is based on the accounting standard that firms used during the year weanalyze. To provide an example, the figure below depicts how we classify firms intonon-IFRS firms and IFRS firms. In the figure, the firm switched to IFRS in 2016.
2013 2014 2015 2016 2017 2018Accountingstandard
JapaneseGAAP
JapaneseGAAP
JapaneseGAAP
Firm switchesto IFRS
IFRS IFRS
Ourclassification
Non-IFRSfirm
Non-IFRSfirm
Non-IFRSfirm
IFRS firm IFRS firm IFRS firm
Note: As for “firm switches to IFRS,” we regard a firm as having switched to IFRS if it discloses IR documents withIFRS-based annual financial statements.
52 MONETARY AND ECONOMIC STUDIES /NOVEMBER 2020
The Disclosure of Non-GAAP Performance Measures and the Adoption of IFRS
References
Audit Analytics, “Long-Term Trends in Non-GAAP Disclosures: A Three-Year Overview,” 2018(available at https://blog.auditanalytics.com/long-term-trends-in-non-gaap-disclosures-a-three-year-overview/).
Bhattacharya, Nilabhra, Ervin L. Black, Theodore E. Christensen, and Chad R. Larson, “Assessingthe Relative Informativeness and Performance of Pro Forma Earnings and GAAP OperatingEarnings,” Journal of Accounting and Economics, 36, 2003, pp. 285–319.
Black, Dirk E., Theodore E. Christensen, Jack T. Ciesielski, and Benjamin C. Whipple, “Non-GAAPEarnings: A Consistency and Comparability Crisis?,” Tuck School of Business Working PaperNo. 2759312, 2020.
Bogle, Kevin, “Non-GAAP Financial Measures are Thriving”, KPMG Advisory, 2017 (available athttps://advisory.kpmg.us/articles/2017/non-gaap-financial-measures-are-thriving.html).
Bradshaw, Mark T. and Richard G. Sloan, “GAAP versus The Street: An Empirical Assessmentof Two Alternative Definitions of Earnings,” Journal of Accounting Research, 40(1), 2002,pp. 41–66.
Burgstahler, David, James Jiambalvo, and Terry Shevlin, “Do Stock Prices Fully Reflect the Impli-cations of Special Items for Future Earnings?,” Journal of Accounting Research, 40(3), 2002,pp. 585–612.
CESR (Committee of European Securities Regulators), “CESR Recommendation on AlternativePerformance Measures,” Consultation Paper, Ref: CESR/05-178, 2005a (available at https://wwww.esma.europa.eu/sites/default/files/library/2015/11/05_178.pdf)., “CESR Recommendation on Alternative Performance Measures,” Ref: CESR/05-178b,2005b (available at https://www.esma.europa.eu/sites/default/files/library/2015/11/05_178b.pdf).
Coulton, Jeff, Andrea Ribeiro, Yaowen Shan, and Stephen Taylor, “The Rise and Rise of Non-GAAPDisclosure—A Survey of Australian Practice and Its Implications,” Chartered AccountantsAustralia and New Zealand, 2016.
Cready, William M., Thomas J. Lopez, and Craig A. Sisneros, “Negative Special Items and FutureEarnings: Expense Transfer or Real Improvements?,” The Accounting Review, 87(4), 2012,pp. 1165–1195.
Deloitte, “Thinking Allowed: Non-GAAP and Alternative Performance Measures,” 2017., “A Roadmap to Non-GAAP Financial Measures,” 2019.
Dichev, Ilia D, “On the Conceptual Foundations of Financial Reporting,” Accounting and BusinessResearch, 47(6), 2017, pp. 617–632.
ESMA (European Securities and Markets Authority), “Guidelines: ESMA Guidelines on AlternativePerformance Measures,” October, 2015., “Questions and Answers: ESMA Guidelines on Alternative Performance Measures(APMs),” October, 2017., “Report: Enforcement and Regulatory Activities of Accounting Enforcers in 2017,” April,2018.
FASB (Financial Accounting Standards Board), “Summary of User Interviews: Reporting FinancialPerformance by Business Enterprises,” 2002.
Golden, Russell G., “Why the FASB Cares about Non-GAAP Performance Measures—From theChairman’s Desk,” 2017 (available at https://www.fasb.org/jsp/FASB/Page/SectionPage&cid=1176168752402).
Gu, Feng and Baruch Lev, “Surprise: Investors Like Non-GAAP Earnings,” Seeking Alpha, April 6,2017 (available at https://seekingalpha.com/article/4060911-surprise-investors-like-non-gaap-earnings).
Hoogervorst, Hans, “The Primary Financial Statements Project—A Game Changer in Financial Re-porting?,” speech at Mexico City, Mexico on 6 March, 2019a., “Strengthening the Relevance of Financial Reporting,” speech at IFRS Foundation confer-ence, Leonardo Royal Hotel, London on 20 June, 2019b.
53
IASB (International Accounting Standards Board), “Discussion Paper: Disclosure Initiative—Principles of Disclosure,” DP/2017/1, March, 2017., “Exposure Draft: General Presentation and Disclosures,” ED/2019/7, December, 2019a., “Snapshot: General Presentation and Disclosures,” December, 2019b (availableat https://cdn.ifrs.org/-/media/project/primary-financial-statements/exposure-draft/snapshot-ed-general-presentation-disclosures.pdf).
IOSCO (International Organization of Securities Commissions), “Statement on Non-GAAP Fi-nancial Measures,” June, 2016 (available at https://www.iosco.org/library/pubdocs/pdf/IOSCOPD532.pdf).
Japan’s Financial Services Agency, “IFRS ni motozuku Renketsu Zaimusyohyo no Kaijirei (Illustra-tive IFRS Consolidated Financial Statements),” 2016 (in Japanese).
Kabureck, Gary R., “Accounting for Non-GAAP Earnings Measures,” Compliance Week,February, 2017 (available at https://www.complianceweek.com/accounting-for-non-gaap-earnings-measures/2764.article).
Kigyo Kaikei Henshubu, “Interviews: Kigyo ga Non-GAAP Shihyo wo kaijisuru Riyu (Interviews:Reasons of Firms’ Disclosing Non-GAAP measures),” Kigyo Kaikei, 71(9), 2019, pp. 22–50(in Japanese).
Lev, Baruch and Feng Gu, The End of Accounting and The Path Forward for Investors and Managers,New Jersey: John Wiley & Sons Inc., 2016.
Lougee, Barbara A., and Carol A. Marquardt, “Earnings Informativeness and Strategic Disclosure:An Empirical Examination of ‘Pro Forma’ Earnings,” The Accounting Review, 79(3), 2004,pp. 769–795.
McVay, Sarah Elizabeth, “Earnings Management Using Classification Shifting: An Examination ofCore Earnings and Special Items,” The Accounting Review, 81(3), 2006, pp. 501–531.
Nomura, Yoshihiro, “Zaimu Riyosha ga Motomeru Gyoseki Shihyo (Performance Measures that Fi-nancial Statement Users Demand),” Kigyo Kaikei, 71(9), 2019, pp. 58–63 (in Japanese).
Papa, Vincent, and Sandra J. Peters, “Investor Uses, Expectations, and Concerns on Non-GAAPFinancial Measures,” CFA Institute, 2016 (available at https://www.cfainstitute.org/-/media/documents/support/advocacy/investor-uses-expectations-concerns-on-non-gaap.ashx).
PricewaterhouseCoopers, “Presentation of Income under IFRS: Flexibility and Consis-tency Explored,” 2007 (available at https://www.pwc.com/gx/en/ifrs-reporting/pdf/europesurveynongaapmeasures.pdf).
Saito, Shizuki, “Accounting Standards and Global Convergence Revisited: Social Norms and Eco-nomic Concepts,” The Japanese Accounting Review, 1, Research Institute for Economics &Business Administration, Kobe University, 2011, pp. 106–117.
Schnurr, James V., “Remarks before the 12th Annual Life Sciences Accounting and ReportingCongress,” U.S. Securities and Exchange Commission, March 22, 2016.
SEC (U.S. Securities and Exchange Commission), “Final Rule: Conditions for Use of Non-GAAPFinancial Measures,” 2002 (available at https://www.sec.gov/rules/final/33-8176.htm).
Sherman, H. David, and S. David Young, “The Pitfalls of Non-GAAP Metrics,” MIT Sloan Manage-ment Review, 59(2), 2018, pp. 57–63.
Sunder, Shyam, “Rethinking Financial Reporting: Standards, Norms and Institutions,” Foundationsand Trends in Accounting, 11(1–2), 2016, pp. 1–118.
Turner, Lynn E., “Speech by SEC Staff: Remarks to the 39th Annual Corporate Counsel Institute,”speech at Northwestern University School of Law, Evanston, Ill. on October 12, 2000.
Waymire, Gregory B., and Sudipta Basu, “Accounting is an Evolved Economic Institution,” Founda-tions and Trends in Accounting, 2(1–2), 2008, pp. 1–173.
White, Mary Jo, “Keynote Address at the 2015 AICPA National Conference: ‘Maintaining High-Quality, Reliable Financial Reporting: A Shared and Weighty Responsibility’,” speech atWashington DC on December 9, 2015.
54 MONETARY AND ECONOMIC STUDIES /NOVEMBER 2020