Energy Charter Disclosure Report
13
2020-21 Energy Charter Disclosure Report
-
Upload
khangminh22 -
Category
Documents
-
view
6 -
download
0
Transcript of Energy Charter Disclosure Report

2020-21
Energy Charter Disclosure Report
Energy Queensland's Energy Charter Disclosure Report 2020-212
Chairman, CEO and Customer Council message 2
Our customers and our communities 3
Our scorecard 4
Principle 1 – We will put customers at the centre of our business and the energy system 5
Principle 2 – We will improve energy affordability for customers 5
Principle 3 – We will provide energy safely, sustainably and reliably 7
Principle 4 – We will improve the customer experience 8
Principle 5 – We will support customers facing vulnerable circumstances 9
ContentsEnergy Queensland is committed to connecting respectfully with Queensland’s Aboriginal and Torres Strait Islander peoples and communities. We acknowledge Aboriginal and Torres Strait Islander people as the First Nations people of Australia and the Traditional Custodians of this land and its waters. We pay our respects to Elders past, present and future for they hold the memories, the traditions, the culture and knowledge of Aboriginal Australia.
Referencing guideEQL Energy Queensland Limited. The term Energy Queensland is
used throughout the report and acronym EQL is used to refer to work across the Group
EEN-EX Ergon Energy Network and Energex
EER Ergon Energy Retail
YKA Yurika
The points relevant to the Independent Accountability Panel Recommendations 2020 are referenced with a R#. A copy of those recommendations is available on the Energy Charter website. Reports on 2019-20 Focus Areas are referenced with a F# and explained in Appendix 2.
Message from the Chairman and CEO The empowered energy consumer is on the rise in Queensland. We now have one of the highest penetrations of residential rooftop solar of any State in Australia, and businesses are increasingly seeking new, more sustainable energy solutions. But while the energy transition brings opportunities for some, we are mindful these are not easily accessible to all.
The diversity of our customers’ needs has never been more apparent. To that end, we are increasingly at the fore, learning through investigation and partnering with leading industry organisations to design and implement solutions enabling better, balanced customer outcomes. We continue to improve the way we collaborate with our customer advocates, stakeholders and fellow Energy Charter signatories to better understand our customers and incorporate their feedback into our business decisions and to influence energy policy.
In this complex environment, it is not a one-size-fits-all solution. Rather, our holistic approach comprises diverse strategies and initiatives, many of which are outlined in this report. This year, we have made necessary investments in technology and analytics innovations to better manage the energy transition. We strengthened the ways in which we support our vulnerable customers and those facing hardship, in recognition that we provide an essential service to Queenslanders.
In this way, we continue to strive to deliver safe, affordable, sustainable power and build an electric future for our customers and communities.
Message from our Customer Council As the Customer Council for Energy Queensland, we appreciate the effort to engage with Council members in developing this disclosure statement, and for incorporating our views on both the progress made against the principles of the Energy Charter over the past year, and Energy Queensland’s maturity assessment. We believe that each of these interactions is an opportunity for Energy Queensland to better understand their customers’ diverse expectations.
While important progress has been made during the year, much remains to be done to elevate Energy Queensland beyond the ‘evolved’ level of the maturity framework. We see the Customer Council’s role as holding Energy Queensland to account on the commitments they’ve made and identifying new ways to improve their service to customers.
Customer Council Members Dale Holliss Bundaberg Regional Irrigators Group
Wendy Miller Queensland Council of Social Service
Gus Mandigora Chamber of Commerce and Industry Queensland
Luke Reade Energetic Communities
Jon Braund City of Gold Coast Council
Georgina Davis Queensland Farmers Federation
Robyn Robinson Council on the Ageing Queensland
Michael Fullelove Local Government Association Queensland
Colin Coverdale Small Business Association of Australia
Anthony King Master Electricians Australia
Judene Andrews UnitingCare Queensland
Andrew Barger Queensland Resources Council
Martin Zaltron Urban Development Institute of AustraliaPhil GarlingChairman
Rod DukeChief Executive Officer

CommunityStakeholders
IndustryPartners
Our People
Government IndustryRegulators
End-user Customers
INDUSTRIAL CUSTOMERS
Some industrial sites are supplied directly from the
transmission lines.
SERVICE PROVIDERS Infrastructure and alternative or
distributed energy providers, metering services, electrical
contractors, energy on-sellers and others in the energy ecosystem.
DISTRIBUTION The distribution networks then supply the electricity
at a lower voltage to Queensland’s homes and
businesses.
GENERATION A range of energy
resources – coal, gas, hydro, solar, wind and biomass – is used to generate the state’s
electricity. Queensland is also connected to interstate supplies.
TRANSMISSION The transmission
network transports high voltage electricity from the major generators over long distances to
the distribution network and large industrial
customers.
RETAILERS The electricity is sold by
the retailers, who provide a range of other services. They buy the electricity from the generators.
END USE CUSTOMERS Queensland has
2.3 million homes and businesses state-wide.30% of houses now
have rooftop solar – that is now being exported across the distribution
network. Business solar and utility
scale renewables are also distributed across the state, and growing
rapidly.
3Energy Queensland's Energy Charter Disclosure Report 2020-21
About this reportThis report covers the Energy Queensland Group’s (the Group’s) Energy Charter disclosures for July 2020 to June 2021. It reports the contribution of Ergon Energy Network, Energex, Ergon Energy Retail and Yurika.
This Energy Charter Disclosure Report is on our website at www.energyq.com.au/publications. We welcome feedback to help us improve our reporting. Comments can be directed to [email protected]
Our customers and our communitiesEnergy Queensland is a 100% Queensland-owned group of electricity distribution, retail and energy services businesses. This report focuses on our end-user customers and the communities we serve from the Tweed River to Torres Strait and from Brisbane across to Birdsville. This includes 2.3 million connected customers, 738,000 regional retail customers, 37 large-scale renewable energy systems and 690,000 small-scale solar energy systems.
We deliver electricity across Queensland through our ‘poles and wires’ businesses Energex and Ergon Energy Network, with 33 stand-alone power stations for our isolated communities. Our retailer, Ergon Energy Retail, sells electricity to customers throughout regional Queensland. These essential service activities are also supported by a range of products and services delivered by Yurika both in Queensland and nationally.
To help us understand our end-user customers, we have a needs-based segmentation framework that maps our residential and business customers to three macro-needs – connection, control and progression. To meet the needs of our end-user customers (the focus of this report), we work closely with the Queensland Government and industry regulators and invest in building positive relationships with community stakeholders, industry partners and our people (employees).
Our stakeholders
The Electricity Supply Chain

Energy Queensland's Energy Charter Disclosure Report 2020-214
Our scorecardOur scorecard links our high-level customer and community metrics to the Energy Charter Maturity Assessment Framework against our business targets. Our maturity assessment remains unchanged from last year.
1 Energy Queensland’s Voice of the Customer program. Number based on responses to four questions about enabling customer outcomes. While we exceeded target, this was a small decline from last year’s result of 6.9.
2 2020 Queensland Household Energy Survey, p.24. Question: Indicate on the scale (0-10), how concerned are you about your ability to pay your electricity bill? 3 Final figure from 2019-20 was revised to 358 due to improvement and revision in data calculation. This year’s result is a 5% decrease from last year’s result.4 This metric has changed from last year, which reported on direct emissions only. The figure is largely due to the indirect emissions of energy lost while distributing electricity across the network.5 This metric has changed from last year due to a change in the Energy Consumers Australia Sentiment Survey. The response reported relates to the 2020 Queensland Household Energy Survey. Question:
These energy suppliers provide my household with a reliable energy supply. Scale 0-10. Results based on those who agreed (8-10). Result up from 58% in 2019 and 55% in 2018.6 Results reflect vital planned outages linked to safety-driven works (see Principle 3, Reliability).7 This figure has increased by 9.4% for Energex and 18.6% for Ergon Energy Network compared to 2019-20.8 This figure has reduced by 45% compared to 2019-20 due mainly to COVID-19 supports to customers in hardship, in addition to continued improvements (see Principle 5).9 This metric replaces the previously used number of disconnections for debt in line with advice from our customer advocates to better reflect our support of the vulnerable in a positive measure. Number
of customers accessing rebates increased from 217,931 in 2019/20. Number of customers on our hardship program reduced from 6886 in 2019/20, due to COVID-19 support measures. Customers successfully transitioned from our hardship program increased from 4760 in 2019/20.
Key Performance Measures Energy Charter Maturity Assessment
Met
ric
and
Targ
et
Resu
lt
Elem
enta
ry
Emer
ging
Evol
ved
Empo
wer
ed
Exem
plar
y
We will put customers at the centre of our business and the energy system
We measure the mindset in our organisational culture, by how enabled employees feel to deliver for our customers.
Energy Queensland Customer Enablement Index1: Target ≥5.9
6.6
We will improve energy affordability for customers
We track price and affordability perceptions.
We outline tariff trends in our Annual Report.
Household concern about ability to pay the bill2 –
% moderate-high concern
% low bill concern
Retail price changes July 2020:
Residential
Small Business
47%
51%
5.3%
5.0%
We will provide energy safely, sustainably and reliably
Safety: We have a suite of community and workplace safety measures detailed in our Annual Report.
Community safety incidents involving contact with our networks3
340 N/A N/A
Sustainability: We’re playing an important role in Queensland’s transition to a low-carbon energy future. For more see our Annual Report.
New solar connections to our networks
Energy Queensland’s combined direct and indirect emissions (2019-20)4
70,668
1,725,282 tCO2-e
Reliability: Our network’s performance across the state for our outage frequency and duration standards are detailed in our Annual Report.
Household satisfaction with network reliability5
59%
12 power outage standards:Target 100%6
75%
We will improve the customer experience
Customer outcomes and communication: We measure service satisfaction through our Voice of the Customer program.
Energy Queensland Customer Index: Target ≥6.7
7.2
We aim to resolve customer issues and track the number of complaints escalated to the Energy and Water Ombudsman
Energex and Ergon Energy Network7
Ergon Energy Retail8
453
372
We will support customers facing vulnerable circumstances
Through Ergon Energy Retail, we raise awareness of rebates to eligible customers and support our customers through our hardship program.9
Customers accessing rebates
Customers on hardship program
Customers successfully transitioned from hardship
225,596
6,657
5,836
5Energy Queensland's Energy Charter Disclosure Report 2020-21
Principle 1
Principle 2
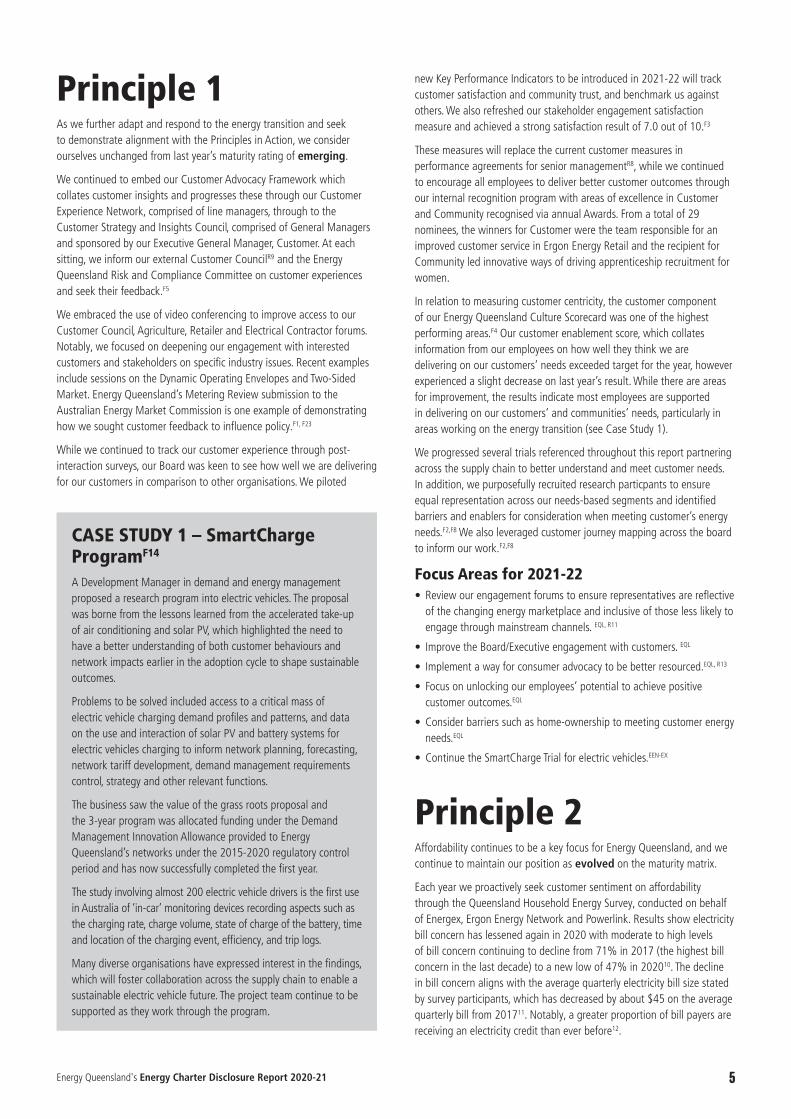
As we further adapt and respond to the energy transition and seek to demonstrate alignment with the Principles in Action, we consider ourselves unchanged from last year’s maturity rating of emerging.
We continued to embed our Customer Advocacy Framework which collates customer insights and progresses these through our Customer Experience Network, comprised of line managers, through to the Customer Strategy and Insights Council, comprised of General Managers and sponsored by our Executive General Manager, Customer. At each sitting, we inform our external Customer CouncilR9 and the Energy Queensland Risk and Compliance Committee on customer experiences and seek their feedback.F5
We embraced the use of video conferencing to improve access to our Customer Council, Agriculture, Retailer and Electrical Contractor forums. Notably, we focused on deepening our engagement with interested customers and stakeholders on specific industry issues. Recent examples include sessions on the Dynamic Operating Envelopes and Two-Sided Market. Energy Queensland’s Metering Review submission to the Australian Energy Market Commission is one example of demonstrating how we sought customer feedback to influence policy.F1, F23
While we continued to track our customer experience through post-interaction surveys, our Board was keen to see how well we are delivering for our customers in comparison to other organisations. We piloted
Affordability continues to be a key focus for Energy Queensland, and we continue to maintain our position as evolved on the maturity matrix.
Each year we proactively seek customer sentiment on affordability through the Queensland Household Energy Survey, conducted on behalf of Energex, Ergon Energy Network and Powerlink. Results show electricity bill concern has lessened again in 2020 with moderate to high levels of bill concern continuing to decline from 71% in 2017 (the highest bill concern in the last decade) to a new low of 47% in 202010. The decline in bill concern aligns with the average quarterly electricity bill size stated by survey participants, which has decreased by about $45 on the average quarterly bill from 201711. Notably, a greater proportion of bill payers are receiving an electricity credit than ever before12.
CASE STUDY 1 – SmartCharge ProgramF14
A Development Manager in demand and energy management proposed a research program into electric vehicles. The proposal was borne from the lessons learned from the accelerated take-up of air conditioning and solar PV, which highlighted the need to have a better understanding of both customer behaviours and network impacts earlier in the adoption cycle to shape sustainable outcomes.
Problems to be solved included access to a critical mass of electric vehicle charging demand profiles and patterns, and data on the use and interaction of solar PV and battery systems for electric vehicles charging to inform network planning, forecasting, network tariff development, demand management requirements control, strategy and other relevant functions.
The business saw the value of the grass roots proposal and the 3-year program was allocated funding under the Demand Management Innovation Allowance provided to Energy Queensland’s networks under the 2015-2020 regulatory control period and has now successfully completed the first year.
The study involving almost 200 electric vehicle drivers is the first use in Australia of ‘in-car’ monitoring devices recording aspects such as the charging rate, charge volume, state of charge of the battery, time and location of the charging event, efficiency, and trip logs.
Many diverse organisations have expressed interest in the findings, which will foster collaboration across the supply chain to enable a sustainable electric vehicle future. The project team continue to be supported as they work through the program.
new Key Performance Indicators to be introduced in 2021-22 will track customer satisfaction and community trust, and benchmark us against others. We also refreshed our stakeholder engagement satisfaction measure and achieved a strong satisfaction result of 7.0 out of 10.F3
These measures will replace the current customer measures in performance agreements for senior managementR8, while we continued to encourage all employees to deliver better customer outcomes through our internal recognition program with areas of excellence in Customer and Community recognised via annual Awards. From a total of 29 nominees, the winners for Customer were the team responsible for an improved customer service in Ergon Energy Retail and the recipient for Community led innovative ways of driving apprenticeship recruitment for women.
In relation to measuring customer centricity, the customer component of our Energy Queensland Culture Scorecard was one of the highest performing areas.F4 Our customer enablement score, which collates information from our employees on how well they think we are delivering on our customers’ needs exceeded target for the year, however experienced a slight decrease on last year’s result. While there are areas for improvement, the results indicate most employees are supported in delivering on our customers’ and communities’ needs, particularly in areas working on the energy transition (see Case Study 1).
We progressed several trials referenced throughout this report partnering across the supply chain to better understand and meet customer needs. In addition, we purposefully recruited research particpants to ensure equal representation across our needs-based segments and identified barriers and enablers for consideration when meeting customer’s energy needs.F2,F8 We also leveraged customer journey mapping across the board to inform our work.F2,F8
Focus Areas for 2021-22• Review our engagement forums to ensure representatives are reflective
of the changing energy marketplace and inclusive of those less likely to engage through mainstream channels. EQL, R11
• Improve the Board/Executive engagement with customers. EQL
• Implement a way for consumer advocacy to be better resourced.EQL, R13
• Focus on unlocking our employees’ potential to achieve positive customer outcomes.EQL
• Consider barriers such as home-ownership to meeting customer energy needs.EQL
• Continue the SmartCharge Trial for electric vehicles.EEN-EX

Energy Queensland's Energy Charter Disclosure Report 2020-216
10 2020 Queensland Household Energy Survey, p.24. Question: How concerned are you about your ongoing ability to pay your electricity bill? Scale 0-10. Result includes those indicating moderate concern (6-7) and high concern 8-10.
11 2020 Queensland Household Energy Survey, p.27. Question: On average, how much is your electricity bill per fortnight/month/quarter?
12 2020 Queensland Household Energy Survey, p.25. Question: Which of the following electricity rebates do you currently receive?
13 2020 Queensland Household Energy Survey, p.13. Question: Have you consciously tried to reduce your electricity consumption (from the electricity grid) in the past 12 months?
CASE STUDY 2 – Outcomes from implementation of Regulatory DeterminationF9
Our networks’ 2020-21 Pricing Proposals focussed on outworking the commitment to apply downward pressure on the cost of electricity and shows the benefits of transitioning to the new Time of Use and Demand Tariffs for customers.
The total network charges customers pay for their use of the distribution network are known as Network Use of System charges and are comprised of the following three components:
• Distribution Use of System charge – this charge refers to the network charge attributable to the use of distribution network.
• Designated Pricing Proposal Charge – this charge mainly refers to the charges incurred for the use of Powerlink’s transmission network. It was previously referred to as Transmission Use of System charge.
• Jurisdictional scheme charges – this charge refers to the amounts incurred through legislative obligations by the Queensland Government.
In this first year of our new five-year regulatory period, Distribution Use of System charges for an average residential customer were as follows:
• For Energex, a decrease by about 9% ($43) compared to 2019-20 for those on the Flat Tariff, with those who chose transitioned to the new tariffs receiving greater savings of up to 13%.
• For Ergon Energy Network, a decrease by about 13% ($88) compared to 2019-20 for those on the Flat Tariff, with those transitioned to the new tariffs receiving greater savings of up to 14%.
Distribution Use of System charges for an average small business customer were as follows:
• For Energex, a decrease by about 8% ($60) compared to 2019-20 for those on the Flat Tariff, with those who transitioned to the new tariffs receiving greater savings of up to 10%.
• For Ergon Energy Network, a decrease by about 14% ($142) compared to 2019-20 for those on the Flat Tariff. Small business customers that transitioned to the new tariffs receiving greater savings of up to 12%.
Research also showed a significant increase in interest in cost saving services facilitated by home energy management systems. This is coupled with a decline in energy reducing behaviours which suggests Queenslanders believe they have taken the necessary steps they can or willing to do, to reduce their consumption13.
We continued to support the development of home energy management systems through a second year of testing of appliance response to network signals. The potential benefit of increased penetration of home energy management systems should allow for daily savings on energy bills through optimal use of energy in homes when combined with suitable retail pricing plans. In addition, customers could further benefit by participating in energy response programs using home energy management systems potentially managed by third parties. Findings of these trials are currently being assessed in the context of policy development for the benefit of both customers and improved network management.F11
The most significant operational focus of our network businesses has been to outwork the Australian Energy Regulator Final Decision and drive cost efficiencies to pass through to our customers. Under the 2020-21 Pricing Proposal, we estimate that in the first year of the 2020-25 regulatory control period almost all or our Energex and Ergon Energy Network customers experienced a decrease in network distribution charges in 2020-21 compared with their 2019-20 charges (see Case Study 2). To support further customer savings, we developed an online calculator for customers to assess the benefits of transitioning to one of our new Time of Use or Demand network tariffs.F12
For the fourth year in a row the Queensland Competition Authority has set lower retail electricity prices for regional Queensland in 2021-22. These reductions are mainly from projected decreases in wholesale energy cost components of the price stack. These rates are also supported by this year’s reduction in the cost of electricity distribution. Overall, the retail prices result in a 7.3% decrease in the annual bill for a typical residential customer on Tariff 11 and a 3.7% decrease for the typical small business customer on Tariff 20.
Through Ergon Energy Retail, we continued to make it easier for customers to understand their energy consumption by developing a new bill design taking account of customer feedbackR10, which is now standing by to include the Australian Energy Market Commission’s billing guideline to be published by 1 April 2022. We also continue to work with our regional retail business customers to assess the most suitable tariffs for their needs as a range of legacy tariffs comes to an end.R2, F10
Focus areas for 2021-22• A second home energy management program for customers in
Carseldine, north Brisbane, to determine daily financial benefits.EEN-EX
• Continue to drive efficiencies in accordance with our revenue allowance.EEN-EX
• Test and roll out subsidised solar irrigation pumps to replace expensive network connections to interested customers.EEN-EX
• Engage and communicate with customers on managing their energy demand.EEN-EX
• Align new bill redesign with regulatory guidelines.EER
• Develop feasible microgrid models for regional commercial and industrial businesses.YKA

7Energy Queensland's Energy Charter Disclosure Report 2020-21
Principle 3 Safety, sustainability and reliability continued to be at the centre of our business, and we continue to assess ourselves as evolved against Principle 3.
SafetySafety continued to be a priority. In line with community expectations, we have made steady and sustained enhancements in the way we manage safety across all aspects of our business.
Our networks installed 20,000 monitoring devices into customers’ meter boxes in a pilot program to improve detection of potential issues which can result in shocks and tingles to customers. To date, monitoring has proactively detected numerous individual safety issues at customer premises, enabling these issues to be immediately rectified without incident. Customer feedback from a post-trial survey found most customers experienced a simple and convenient installation process. The trial has positioned us to proactively maintain a safe and reliable electricity network.
Our networks launched a campaign to encourage business owners, machinery operators, tradespeople and other workers to download the Look up and Live app to help plan and work safely around the electricity network. The app was accessed over 80,000 times in the last year. In addition, Energex and Ergon Energy Network’s Safety Heroes program received registrations from a record 97% of schools across Queensland, with 100% of respondents considering participation again in 2021. Research on our Take Care Stay Line Aware public safety campaign reported 80% of customers surveyed indicating that it positively influenced their behaviour around powerlines.
SustainabilityF13
Last year, we updated our Energy Queensland Low Carbon Future Statement Policy and continued to deliver on our commitments in support of the Queensland Government’s renewable target of 50% by 2030, starting with ourselves as a large purchaser of renewable energy.R4
Our networks achieved a major milestone in the journey to move remote customers to renewable energy and contribute to an affordable electricity supply with the commissioning of our first two Stand Alone Power Systems at Bustard Head and West Leichhardt.F6
Queensland’s distribution networks now have more connected solar capacity than the combined capacity of the Stanwell, Millmerran, Tarong and Tarong North power stations. Much of this is provided for by connecting our customers’ rooftop solar to the grid. Almost 40% of detached houses and over 10% of businesses across Queensland have rooftop solar, with some areas well above these averages. In addition, the size of rooftop solar continues to increase, up from 4.2kVA in 2015-16 to an average of 6.7kVA at the end of 2020-21. To accommodate this, we updated our new Connection Policy to allow increased system capacities on our networks.
Connecting solar was key to decarbonising our remote communities. In the last year, Ergon Energy Network approved more than 130 solar PV connections totalling over 1,300kVA in solar PV capacity in its isolated networks. This is a significant increase on the previous financial year where approximately 280kVA of solar PV capacity was approved. A significant portion of this capacity was related to the Diamantina Shire Council Project, a partnership between the Department of Energy and Public Works and Ergon Energy Network, to reduce reliance on diesel in remote communities.
The majority of approved solar PV capacity in our isolated networks was made possible through dynamic distributed energy resource monitoring and control. Our networks are exploring further enablement of distributed energy resources through Dynamic Operating Envelopes for residential and commercial customers. Dynamic Operating Envelopes are where import and export limits can vary over time and location, rather than customers adhering to fixed export limits due to the network’s finite capacity to cater for exports (see Case Study 3).F7
At Energy Queensland, we commenced building 40MWh of battery storage to be installed across five trial locations where rooftop solar penetration is high, and at our substations in Townsville, Yeppoon, Bundaberg, Hervey Bay and Toowoomba.
As the transition to clean energy continues around the world, we grew the Queensland Electric Vehicle Super Highway with Yurika now operating 31 fast charging stations between the NSW border and Port Douglas. Yurika partnered with a global business to establish a sponsorship agreement to keep user costs to a minimum. We also continued to meet the changing needs of the energy market with Yurika completing the first of five of the largest shopping centre solar PV systems in the country (see Case Study 4).
Reliability While we reached most of our networks’ minimum service standard levels for reliability, we continued our focus on improving supply to regional areas. The need to replace parts of our ageing network resulted in an increase in planned power outages for our regional customers over the past year, however, this has been necessary to improve the safety and reliability of the network. We also worked to better manage our customers’ experience through strategies to reduce the duration of power outages, including targeted use of live linesperson resources, line patrols and the deployment of mobile generators. While research shows customer satisfaction with reliability continuing to improve (see Our Scorecard, p.3) we have committed to a deeper exploration in targeted areas to reduce, as reasonable as practical, the impact of power outages on our customers.
For five of our isolated systems communities, we delivered enhancements to improve reliability and our response to outages. As a result, there has been a nearly 90% decrease in Guaranteed Service Level payments to customers in these communities compared to the previous year. Customers, Councils, and Local Disaster Management Groups of isolated systems are consistent in their feedback that reliability is not a major concern, and there is strong appreciation of the response to outages and disasters.
Focus areas for 2021-22• Monitor the Stand-Alone Power Systems for performance.EEN-EX
• Broaden engagement and continue to trial Dynamic Operating Envelopes to include chargeable loads e.g., batteries and electric vehicles.EEN-EX
• Install 40MWh of battery storage across Queensland.EQL
• Commence transition to an electric vehicle fleet and continue the installation of 18 new charges in western Queensland under Stage Three of the Queensland Electric Vehicle Superhighway.EQL/YKA
• Conduct feasibility studies into decarbonisation of isolated systems, with the goal of supplying 100% of community power from renewable energy resources during periods of high solar PV generation.EEN
• Further research into the customer reliability experience for regional locations to inform network investment.EEN
Energy Queensland's Energy Charter Disclosure Report 2020-218
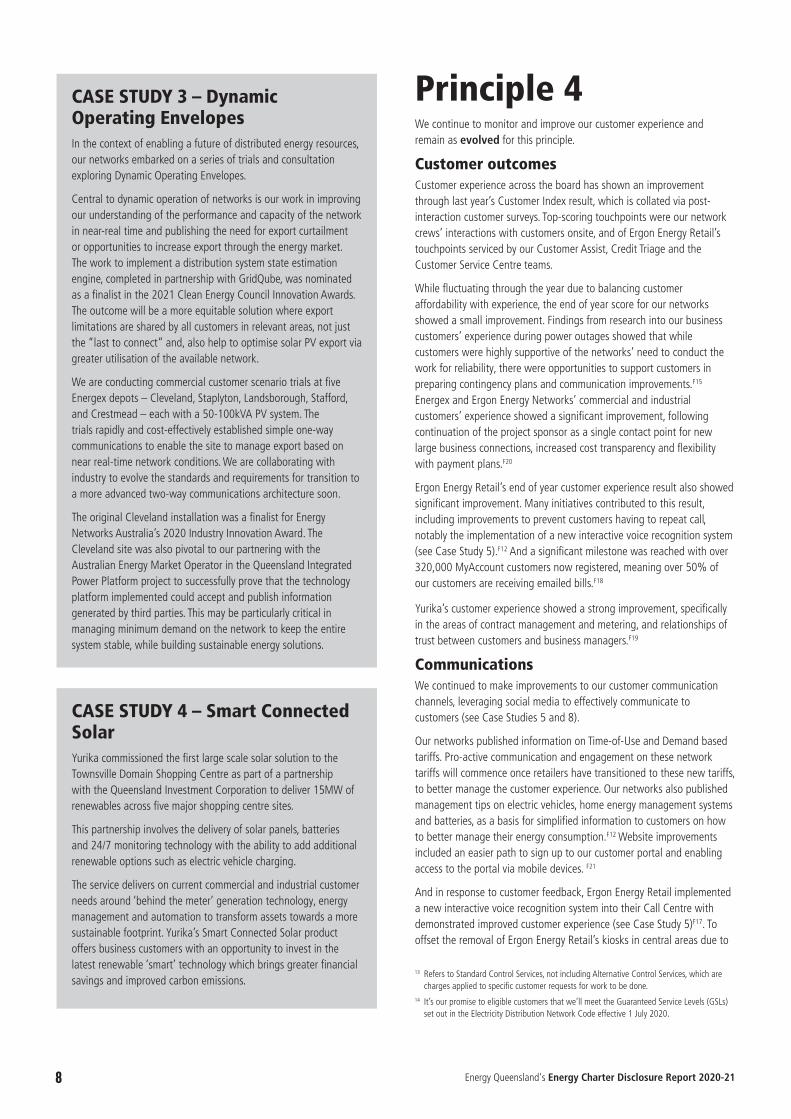
CASE STUDY 3 – Dynamic Operating EnvelopesIn the context of enabling a future of distributed energy resources, our networks embarked on a series of trials and consultation exploring Dynamic Operating Envelopes.
Central to dynamic operation of networks is our work in improving our understanding of the performance and capacity of the network in near-real time and publishing the need for export curtailment or opportunities to increase export through the energy market. The work to implement a distribution system state estimation engine, completed in partnership with GridQube, was nominated as a finalist in the 2021 Clean Energy Council Innovation Awards. The outcome will be a more equitable solution where export limitations are shared by all customers in relevant areas, not just the “last to connect” and, also help to optimise solar PV export via greater utilisation of the available network.
We are conducting commercial customer scenario trials at five Energex depots – Cleveland, Staplyton, Landsborough, Stafford, and Crestmead – each with a 50-100kVA PV system. The trials rapidly and cost-effectively established simple one-way communications to enable the site to manage export based on near real-time network conditions. We are collaborating with industry to evolve the standards and requirements for transition to a more advanced two-way communications architecture soon.
The original Cleveland installation was a finalist for Energy Networks Australia’s 2020 Industry Innovation Award. The Cleveland site was also pivotal to our partnering with the Australian Energy Market Operator in the Queensland Integrated Power Platform project to successfully prove that the technology platform implemented could accept and publish information generated by third parties. This may be particularly critical in managing minimum demand on the network to keep the entire system stable, while building sustainable energy solutions.
13 Refers to Standard Control Services, not including Alternative Control Services, which are charges applied to specific customer requests for work to be done.
14 It’s our promise to eligible customers that we’ll meet the Guaranteed Service Levels (GSLs) set out in the Electricity Distribution Network Code effective 1 July 2020.
CASE STUDY 4 – Smart Connected SolarYurika commissioned the first large scale solar solution to the Townsville Domain Shopping Centre as part of a partnership with the Queensland Investment Corporation to deliver 15MW of renewables across five major shopping centre sites.
This partnership involves the delivery of solar panels, batteries and 24/7 monitoring technology with the ability to add additional renewable options such as electric vehicle charging.
The service delivers on current commercial and industrial customer needs around ‘behind the meter’ generation technology, energy management and automation to transform assets towards a more sustainable footprint. Yurika’s Smart Connected Solar product offers business customers with an opportunity to invest in the latest renewable ‘smart’ technology which brings greater financial savings and improved carbon emissions.
Principle 4We continue to monitor and improve our customer experience and remain as evolved for this principle.
Customer outcomesCustomer experience across the board has shown an improvement through last year’s Customer Index result, which is collated via post-interaction customer surveys. Top-scoring touchpoints were our network crews’ interactions with customers onsite, and of Ergon Energy Retail’s touchpoints serviced by our Customer Assist, Credit Triage and the Customer Service Centre teams.
While fluctuating through the year due to balancing customer affordability with experience, the end of year score for our networks showed a small improvement. Findings from research into our business customers’ experience during power outages showed that while customers were highly supportive of the networks’ need to conduct the work for reliability, there were opportunities to support customers in preparing contingency plans and communication improvements.F15
Energex and Ergon Energy Networks’ commercial and industrial customers’ experience showed a significant improvement, following continuation of the project sponsor as a single contact point for new large business connections, increased cost transparency and flexibility with payment plans.F20
Ergon Energy Retail’s end of year customer experience result also showed significant improvement. Many initiatives contributed to this result, including improvements to prevent customers having to repeat call, notably the implementation of a new interactive voice recognition system (see Case Study 5).F12 And a significant milestone was reached with over 320,000 MyAccount customers now registered, meaning over 50% of our customers are receiving emailed bills.F18
Yurika’s customer experience showed a strong improvement, specifically in the areas of contract management and metering, and relationships of trust between customers and business managers.F19
CommunicationsWe continued to make improvements to our customer communication channels, leveraging social media to effectively communicate to customers (see Case Studies 5 and 8).
Our networks published information on Time-of-Use and Demand based tariffs. Pro-active communication and engagement on these network tariffs will commence once retailers have transitioned to these new tariffs, to better manage the customer experience. Our networks also published management tips on electric vehicles, home energy management systems and batteries, as a basis for simplified information to customers on how to better manage their energy consumption.F12 Website improvements included an easier path to sign up to our customer portal and enabling access to the portal via mobile devices. F21
And in response to customer feedback, Ergon Energy Retail implemented a new interactive voice recognition system into their Call Centre with demonstrated improved customer experience (see Case Study 5)F17. To offset the removal of Ergon Energy Retail’s kiosks in central areas due to

9Energy Queensland's Energy Charter Disclosure Report 2020-21
COVID-19 impacts and roll out of emailed bills, emphasis was placed on maintaining traditional channels as essential services to some customers.R11 Specifically, Ergon Energy Retail worked to support 20,000 customers to transition from obsolete tariffs. About 10,000 of impacted customers are from the agriculture sector, and Ergon Energy Retail continue to consult peak bodies to ensure communications are easy to understand and provide adequate advice on the options and support available to customers.F18
Yurika supported their strong relationship management with the commencement of a system roll-out to enable easy access for customers to their account information.
ComplaintsWe continue to report customer complaints to our Risk and Compliance Committee and Board, who provided feedback to improve the depth of information they receive.
Our networks resolved 5,690 complaints at first point of contact and made changes to their process to better address customer complaints traditionally escalated to the Energy and Water Ombudsman. Metering continues to be an area for improved customer experienceF16 (see Case Study 7).
Ergon Energy Retail’s Complaints Team achieved the most improved service interaction across all of Energy Queensland’s post interaction surveys, thanks to the roll out of a quality management framework supporting employees and a focus on adhering to response timeframes to customer queries. Ergon Energy Retail’s strong performance against other retailers is evident in the Australian Energy Regulator’s performance monitoring of retailers15. Specifically, we examined customer complaints on estimated bills, to identify opportunities for prevention.
Yurika continued to implement improvements in response to complaints. It commenced implementing improved internal processes to make it easier to capture all customer feedback. This will expand on our customer complaints management process to better identify systemic issues.
CASE STUDY 5 – Managing large-scale power outageOn 25 May, the Callide Power Station event led to the loss of approximately 1GW of generation from the network causing around 470,000 customers to lose power. This was reduced to less than 20,000 customers within 90 minutes, with all customers back on supply within three hours.
As the outage involved a major generator, Queensland’s power supply was at risk, requiring Australian Energy Market Operator direction to generators and distributors to manage load. We worked in partnership with the Australian Energy Market Operator, Powerlink and CS Energy in the restoration of supply, sharing information and communication to customers.
The volume of customers seeking information through traditional communication channels was unprecedented. Our network websites were under extreme demand with the number of visitors to these sites and the contact centre recorded 153,457 calls in one hour.
In accordance with emergency curtailment agreements, major customers were contacted to reduce load under connection agreements. The 35MW gas-fired power station in Barcaldine operated by Ergon Energy Retail was used to assist in the restoration of supply.
Social media engagement increased, leveraging the more than 150,000 followers, to alleviate website and contact centre demand. In addition to providing information in relation to the outage, there was direct engagement with customers indicating vulnerability and also with those commenting on difficulties in reaching contact centre operators.
Over the course of the outage, Ergon Energy Network and Energex reached an audience of 887,000 customers with 158,000 engagements. Social media sentiment among customers was positive, peaking at 75% positive on Energex’s Facebook.Enquiries Network Retail
Refer Back 0.97 2.33
Refer Higher Level 0.64 1.37
Complaints Network Retail
Level 1 0.18 0.80
Level 2 0.10 0.45
Level 3 0.02 0.08
Focus areas for 2021-22• Continue to meet commercial customer needs through access to
account information online.YKA
• Support customers on obsolete tariffs to transition to best tariff option.EER
• Deliver communications to encourage business customers on how to prepare for power outages.EEN-EX
• Improve the depth of reporting on complaints to the Risk and Compliance Committee.EQL
• Educate customers on how to avoid estimated bills.EER
• Focus on improving customer issues at the first point of contact.EER
All figures in table are per 10,000 customers and figures are rounded up to the nearest one hundredth. The total customer figure used for Ergon Energy Retail was 746,000 and for Network, 2.3 million customers.
15 Australian Energy Regulator Schedule 3 – Q4 – 2020-21 Retail Performance Data (Not yet released)
Principle 5We continue to refine our strategies and invest in systems to support our vulnerable customers and therefore remain as empowered on the maturity scale for Principle 5.
The COVID-19 pandemic has created an environment of high uncertainty and to better understand and support our customers’ experience, Energy Queensland partnered with other Energy Charter signatories to co-fund the COVID-19 Customer Vulnerability Research.R1, F8
Through the Queensland Chapter of the Thriving Communities Partnership, we continued to work on the Disaster Planning and Recovery Project. Through the second phase of the project, which has built on the national virtual roundtable in late 2020, we gained a greater understanding of the relationship between the experiences of individuals, first responders and front-line service providers, with opportunities to further improve customer experiences being developed.
We continue to lead in managing hardship with Ergon Energy Retail proactively engaging customers to make them aware of available support (see Case Study 8). We track how well we support vulnerable customers through a series of measures (see Scorecard).

Energy Queensland's Energy Charter Disclosure Report 2020-2110
CASE STUDY 6 – Customer led design improves service experienceF17
Ergon Energy Retail’s Interactive Voice Response system which handles one million calls per year, was redesigned incorporating both customer and employee feedback with the aim of improving the customer experience.
Customer calls were analysed against the actual reason for call and identified the three key reasons customers contact Ergon Energy Retail, as well as customer sentiment and intention during the interaction. Frontline employees and customers across specific segments were recruited for research, including those who had previously complained about the IVR, business owners and electrical contractors.
Insights informed the design of the new system. Menu structure and smart routing increased the rate of call landing with the correct agent first, removing the need for manual transfers. Further benefits include reducing the cost to serve through better resource allocation and the introduction of a business owned and secure online credit payment system. The smoother internal process translates to a better customer experience and is supported by tailored messages played to customers whilst they are waiting, a simpler menu structure and a call back option. Customer satisfaction is trending up as these changes are implemented.
CASE STUDY 7 – Tariff changes for business customers F16
Over the last year, improvements to processes involving meter reading and meter upgrades to support tariff changes have been a focus to reduce the number of estimated bills received by customers.
While we regularly receive requests to change tariffs for our business customers, this has significantly increased with the ending of legacy tariffs impacting about 20,000 customers and the implementation of new network tariffs. While most occur seamlessly, there has been on a small number of occasions data entry error resulting in components being billed incorrectly. As soon as teams are alerted, the change is backdated to prevent any adverse customer impact.
On one occasion, a customer experienced a three-month timeframe for a meter upgrade to support the transition to a tariff based on monthly demand. Meter installations generally occur within four weeks, however, where meter installations do not occur within this timeframe, Ergon Energy Retail now requests monthly meter reads (until meter installation) to collect customer energy demand data for billing.
CASE STUDY 8 – Improving access to supportR7, R12
We continued to focus on ensuring that our Ergon Energy Retail customers who were experiencing financial impacts from COVID-19 lock downs and business closures, were individually managed with tailored support options.
Through the ‘Help Made for You’ targeted SMS, email and social media campaign, customers were encouraged to check their eligibility for rebates through MyAccount.
Payment plans were extended, payments of amounts less than current usage as well as an increased number of grace periods were made available. Improved communication options, including implementing two-way SMSs service, helped alleviate stress created by time spent on calls.
Through Ergon Energy Retail, we also participated in a trial with the Queensland Government to digitise concession services to enable applications for the Home Energy Emergency Assistance Scheme.Customers can now apply for a one-off emergency assistance payment of $720, available once every two-years, through an email or SMS link rather than a paper form via the post office.R3
Stronger relationships were built with business customers whose trading had been disrupted, most of whom had never been in that situation previously. Most impacted customers have been able to return to near-normal trading conditions, with many expressing gratitude that Ergon Energy Retail had been so supportive of their situation.
While the Statement of Expectations is due to end on 30 June 2021, our payment extension arrangements and financial support programs including Customer Assist, Life Support, Concessional Rebate administration, Drought Relief from Electricity Charges Program will continue to support our customers to manage their bills.
we anticipate an increase in the number of customers referred to the Hardship Program in the coming year.
In line with our Financial Inclusion Action PlanR11,F24, we partnered with the Indigenous Consumer Assistance Network to provide scholarships for seven regional Queenslanders to complete their Diploma in Financial Counselling to provide further support to our customers. Energy literacy was improved through monthly engagement activities in Woorabinda and across eight Card Operated communities from Gununa (Mornington Island) to Bamaga. Across regional Queensland, Bring Your Bill days were held in Rockhampton, Yeppoon, and Townsville.R11, F25
At Ergon Energy Retail, we continued to develop our own policy protections for customers experiencing family violence.F26 These include improving system capability to instigate security and privacy safeguards, training specialist staff to support customers, defining debt management procedures including waivers, and ensuring the process is consistent and equitable.
Focus areas for 2021-22• Action research to better understand the lag effects of COVID-19 and
strategies to address these.EQL
• Progress the Financial Inclusion Action Plan Build Phase.EER
• Implement policies supporting domestic violence prevention.EER
• Partner with local councils to improve energy management in First Nation communities.EER
The AER Statement of Expectations halting disconnections for debt and the Queensland Government’s household utility relief contributed to a reduction in customers being referred to the Hardship Program. Last year, we referred 55 customers on average per day to our hardship program, a decrease from an average of 60 per day in 2019/20. With the lifting of these restrictions,

11Energy Queensland's Energy Charter Disclosure Report 2020-21
Appendix 1 - Independent Accountability Panel Recommendations:
R1. Immediately and collectively, find ways to utilise payment and usage data to proactively identify and assist customers in vulnerable circumstances, so that the industry and policy makers are taking all steps within their power to support customers in financial difficulty and to reduce payment difficulties in 2021. The process should include engagement with experts and consumer groups.
R2. Audit all customers on payment or hardship plans, and immediately and retrospectively switch them to the cheapest plan available and adjust the debt accordingly. We strongly recommend this becomes BAU for all energy retailers.
R3. Work with governments to establish a practically failsafe system to ensure each and every customer who is entitled to a concession receives it.
R4. Adopt and each publicly articulate a clear, collective approach that builds on recent energy industry acknowledgements of the inevitability of change, effectively communicates how the “north star” of net zero emissions feeds into better consumer outcomes, and drives a whole of sector focus on making energy transition work for consumers.
R5. Under the #BetterTogether initiative, consider establishing a ‘Whole of Industry Energy Transition Working Group’ to coordinate a long-term response for the industry and a ‘just transition’ for customers. This working group should include customer representatives and be approached as something of a ‘blank canvas’. This has the potential to elevate the industry above the politics of the day and provide a more stable platform for future investments and joint industry-customer advocacy.
R6. Expand their management of the growing risk that more customers cannot pay their energy bills to include becoming more active on policy questions that feed into energy affordability (e.g., low-income households’ access to energy efficiency and income adequacy).
R7. Ensure the highest standards of customer care are implemented in responding to the growing debt tsunami, using the Victorian Payment Difficulty Framework as the benchmark.
R8. Elevate the Energy Charter to the highest possible extent within the organisation, including involving their Board in development of Energy Charter Disclosures and linking performance review standards and leadership remuneration to customer outcomes.
R9. If not already in place, Signatories should establish a customer reference group or customer/community council. Signatories should then commit to go beyond simply informing this group of what they are doing, but seek to involve them in key decisions and empower them to play an active role in shaping key aspects of business practices and investment decisions where appropriate.
R10. Continue to simplify energy bills so that energy usage and costs are easy to comprehend and provide specially trained customer contact staff who can help customers to understand energy usage in the home or small business. This could extend to developing a specialist energy advisor role within the customer service centre.
R11. Work more closely with consumer groups to expand and develop community collaborations with customer groups that are less likely to actively engage through mainstream channels.
R12. Pursue active personal engagement with all customers faced with potential disconnections and aspire to no disconnections, working with consumer groups to deliver on that outcome.
R13. Work with policy makers and market bodies to implement a way for consumer advocacy to be better resourced.
R14. Ensure their self-assessments under the Maturity Model incorporate opportunities to back up the ratings with data and stakeholder input, including by involving their Customer/Community Council in development of Energy Charter Disclosures.
R15. Focus on outcomes not activity, ensure that Disclosures make clear whether previous year commitments have been delivered, and continue to increase the consistency of presentation of their Disclosures, including via implementation of the recommendations in this Report.

Energy Queensland's Energy Charter Disclosure Report 2020-2112
Appendix 2 - 2019/20 Key Focus Areas
The following items were reported in the 2019/20 Energy Queensland Energy Charter Report
F1. Improve customer and stakeholder engagement to inform customer focused decision making through revisiting our engagement structure and activities and incorporating a new engagement satisfaction measure into performance agreements. EQL
F2. Integrate customer needs-based segmentation into strategic decision-making to meet our customers’ needs and expectations and deliver value. EQL
F3. Aim to increase customer satisfaction and community trust through trialling new customer corporate key performance indicators measures and acting on insights obtained. EQL
F4. Embed our Culture Model, which recognises employee experience equals customer experience, into the business to drive improved customer service delivery and interactions. EQL
F5. Embed our Customer Advocacy Framework with a focus on quantifying customer issues and processes for quality assurance and further integrate our Customer Council and specific interest groups into our decision-making processes to ensure we are focused on what matters most to our customers and communities. EQL
F6. Continue Stand-Alone Power System trials in partnership with customers to inform the next phase of our plan to transform Fringe of Grid Supply and provide more cost-effective options for our customers and communities into the future. EQL
F7. Continue trials to build new capabilities to support customers’ investment in more distributed energy resources, through enabling the dynamic export of energy. EEN-EX
F8. Consider our understanding of and advocacy for customers who are least likely to provide feedback and/or complain. EQL
F9. Drive cost efficiencies in line with the AER’s revenue determinations. EEN-EX
F10. Improve customer access and understanding of energy data by implementing the new retail bill design and broadening the customer base for Energy Analysis so customers can more easily engage and be empowered in making decisions around their energy use. EER
F11. Continue to test the acceptance and efficacy of Home Energy Management Systems for demand response with customers so that their experience and needs form policy development and activity in this area. EEN-EX
F12. Work in partnership with customers to help understand their information and communication needs and identify supportive information tools to maximise the impact of messaging and uptake of initiatives that can help address energy affordability. EEN-EX
F13. Advance our planned approach to a low-carbon energy future, continue to decarbonise remote communities and enable distributed energy resources and further consider impacts of energy transition on communities. EQL
F14. Progress work to support an increasing take-up of electric vehicles and continue to develop electric vehicle network and retail tariffs for residential and business customers. EQL
F15. Investigate the customer experience during power outages, through utilising customer journey mapping and other customer research, to identify and action improvement opportunities. EEN-EX
F16. Understand customer pain points in relation to metering and implement improvements. EQL
F17. Use a customer-centred design process to develop and implement a new Interactive Voice Recognition system to manage the one million customer calls handled each year, enabling faster and more accurate call management for customers. EER
F18. Continue to look at technology investment to help our customers engage with us, especially in regional/remote areas. EER
F19. Improve management of the customer experience for Yurika customers. YKA
F20. Deliver further improvements for the large business customer experience. EEN-EX
F21. Ongoing website improvements, including enabling our customer portal to be accessed via mobile devices and therefore delivering new channel choices to customers. EEN-EX
F22. Develop information and support tools to assist customers in better understanding their tariff options and adoption of tariffs that best suit their circumstances and address their affordability concerns. EQL
F23. Develop and implement further mechanisms to close the loop on customer feedback and action improvements so that customers know their feedback has been considered in decision making. EQL
F24. Commence the next phase of the Financial Inclusion Action Plan, which includes delivery of energy literacy programs that will assist customers in better understanding energy matters. EER
F25. Continue to work with Queensland’s First Nations community leaders to design location-based initiatives to improve customer outcomes in indigenous communities. EQL
F26. Continue to invest in an internal Domestic and Family Violence Working Party, seeking to learn from similar practices in Victoria and go beyond legislative requirements in delivering improved services for customers who are victims of domestic and family violence. EER

1-21
-020
0
energyq.com.auEnergy Queensland Limited
ABN 96 612 535 583
Head Office Level 6 420 Flinders Street
Townsville QLD 4810
PO Box 1090 Townsville QLD 4810