An Extended Framework Structure in MUVIS for Content-based Multimedia Indexing and Retrieval
Upload
khangminh22Category
view
3download
0
THE DEVELOPMENT OF INTERACTIVE MULTIMEDIA CONTENT
BY USING COURSE LAB FOR STATISTICS AND PROBABILITY
Pebrianto
SMU 15 Mukomuko
ABSTRACT
Statistic and probability material have an important role on math
for students in senior high school. Therefore, to increase
students’ interest and comprehension in statistic and probability
we need a tools or media that is able to boost student’s
motivation to study statistic and probability. As the development
of technology increases rapidly, it provides an opportunity for
educators to develop Media Interactive Learning (MPI). One of
the MPI is the Course Lab MPI 2.4 application. This study aimed
to produce a valid, practical and effective interactive multimedia
teaching materials. Researcher use Plomp development method
which consists of three phases there were preliminary research
phase, prototyping phase, and assessment phase. Based on the
result of the hypothesis testing, it was found that; Course Lab
interactive multimedia were valid, practical, and effective.
Students’ test scores average changed at 25 with a standard
deviation of 7.07. The test results were statistically
demonstrating the value which means there were some
differences in the average score of the initial test and final test.

It can be concluded that the multimedia modules developed was
effective in improving student learning achievements.
Keywords: Course Lab, Statistic and Probability, Interactive
Multimedia
INTRODUCTION
The quality of education can be improve by the effective learning
process, it means that the learning process can run smoothly,
directed and in accordance with the purpose of learning. There
are some factors that influence the learning process, from the
learners themselves or from other factors such as educators,
teachers, facilities, environmental, and instructional media used.
Student should be active, creative and empowered themselves
with technology as well as the teacher whom master the learning
material and have a good strategy in delivering the learning
materials will raise the quality of learning. However, there were
still many constraints in teaching and learning.
Statistic and probability material have an important role in
mathematics, especially for senior high school students. The fact
is that these material are conceptually difficult to understand by
the students due to these materials require high reasoning
power. Therefore, we need a media which is able to increase
students’ interest so that they can increase their motivation and
comprehension of statistic and probability.

Learning media is something that can be used to deliver the
message (learning materials), so it can stimulate students’
attention, interests, thoughts, and feelings in learning activities
to achieve the goal of learning (Santyasa, 2007: 3). As the
development of technology that increases very rapidly, it
provides an opportunity for educators to develop Media
Interactive Learning (MPI). One of the learning media is
multimedia modules. Learning by using multimedia modules is
expected to motivate students to learn independently,
creatively, effectively and efficiently. With multimedia modules,
it is expected to reduce the saturation of the students due to the
learning process done by most teachers (had been face to face
methods (lectures)) that caused students became bored and
tired, thus the students' motivation decreased. One of the MPI
software are Web Blog, Macromedia Flash, Course Lab, and so
forth that belong to edutainment, a mix between education and
entertainment. One of the software that is used the most on
education is Course Lab 2.4. It is a software to arrange
multimedia teaching materials for e-learning which is powerful
and easy to use. Course Lab 2.4 offers an environment WYSIWYG
(What You See Is What You Get) that is free from programming
to produce interactive teaching materials that can be published
on the internet, Learning Management System (LMS), and CD-
ROM.
Course Lab 2.4 application is a free base application that can be
used to create teaching materials. By using this application we
can create a teaching material that can later be integrated with
web-based Learning Management System. Course Lab 2.4 is a
solution to overcome the various problems faced by teachers in
the use of teaching materials or modules that still refer to a very
broad subject where the students are difficult to understand the
material provided by the teacher. Course Lab 2.4 application
usage is almost similar to Microsoft Power Point application
usage, so teachers will not find any difficulties in making the
teaching material by using this application.
This research aimed to seek more about the advantages of
Course Lab 2.4, when used by students in independent learning.
So, the writer considers it is important to do this research called
"The Development of Interactive Multimedia Teaching Materials
by Using Course Lab on Statistic and Probability". The purpose of
this study is to create a valid, practical, and effective interactive
multimedia learning material by using Course Lab on statistic and
probability for senior high school students. Ahmad Novandi
(2016) conducted research on "Development of Learning Media
Presentation by Using Course Lab 2.4 on Fundamental of Digital
Electronics at SMK Negeri 3 (Vocational High School) Surabaya ".
The study is equally the form of research and development by
using Course Lab 2.4. The difference is in the subject matter
being used. The findings of this study show that learning material
using Course Lab 2.4 ineligible to use by the teachers and easy
and increases students’ interest to understand the learning
material.

METHODOLOGY
The methodology used in this was research design Plomp (2013:
19) which consists of three phases: preliminary research,
prototyping phase, and assessment phase. At the first phase
“Preliminary research” it is used an analysis of the problem and
the study of literature. Prototyping phase is the stage of
prototyping. Assessment phase is the phase of assessing
whether the user can use the media and would like to apply, as
well as to assess the effectiveness of the media developed.
Evaluation methods used in this study is a formative evaluation
that took place in all the phases and the development cycle.
According to Tessmer (1993) formative evaluation has several
layers, as illustrated in Figure 1.
Figure 1, Layer Formative Evaluation
Self Evaluation
Expert Review
Content, design,
One-to-One
Clarity, Appeal
Small Group
Effectiveness, Appeal
Field Test
User Acceptance, Implementability
revise
revise
revise
Low Resistance to Revision
High Resistance to Revision
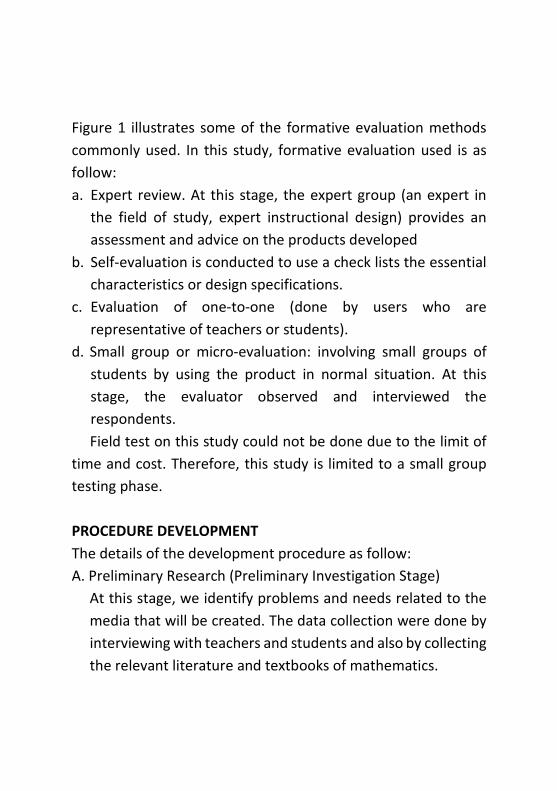
Figure 1 illustrates some of the formative evaluation methods
commonly used. In this study, formative evaluation used is as
follow:
a. Expert review. At this stage, the expert group (an expert in
the field of study, expert instructional design) provides an
assessment and advice on the products developed
b. Self-evaluation is conducted to use a check lists the essential
characteristics or design specifications.
c. Evaluation of one-to-one (done by users who are
representative of teachers or students).
d. Small group or micro-evaluation: involving small groups of
students by using the product in normal situation. At this
stage, the evaluator observed and interviewed the
respondents.
Field test on this study could not be done due to the limit of
time and cost. Therefore, this study is limited to a small group
testing phase.
PROCEDURE DEVELOPMENT
The details of the development procedure as follow:
A. Preliminary Research (Preliminary Investigation Stage)
At this stage, we identify problems and needs related to the
media that will be created. The data collection were done by
interviewing with teachers and students and also by collecting
the relevant literature and textbooks of mathematics.

B. Prototyping Phase (Phase Prototyping)
Prototype activities are carried out as follow:
1. Designing systematic and structure media, conduct self-
evaluation, analysis, and systematic revision of the
design and structure of the media,
2. Arranging a prototype based on the design of systematic
and structural media, perform a self-evaluation, analyze
and revise prototypes based on the results of self-
evaluation,
3. Validating the contents and constructs (expert review) of
the prototype media, analyze, and revise prototypes
based on the results of the expert review.
4. Evaluate one-on-one with two teachers and three senior
high school students, analyze, and revise prototypes.
5. Evaluate a small group of students from one of senior
high school in Muko-muko. Trials activities will be
conducted in the computer laboratory for four meetings.
In summary the research procedure can be seen in Figure 2.

Figure 2, Flowchart Development
Identification of the problem and needs in preparing to face
senior high school on math
Self Evaluation Revis
Systematic Design and Media structure
Step I.
Preliminary
Research
Step II.
Prototyping
phase
Arranging the Media Prototype
Self Evaluation Revise
Validasion (expert
Vali
Yes
No Revise
Evaluasion one-to-
Analysis Revise
A valid and Practical Media
Small Group Practicalities Test
Yes
Pract Revise No
Try out were conducted in the third week of September so
the test would be chosen from some of the students who
received monthly test of mathematics, each represented a high,
medium and low group. Try out on small group would be
conducted for third grade students (6 students) who were
selected from senior high school in Mukomuko. Subjects were
chosen representatively for each academic ability of high,
medium and low.
The instrument used in the development was the media
sheets validation, guidelines for self evaluation (Self Evaluation),
questionnaires, interview guidelines, achievement test.
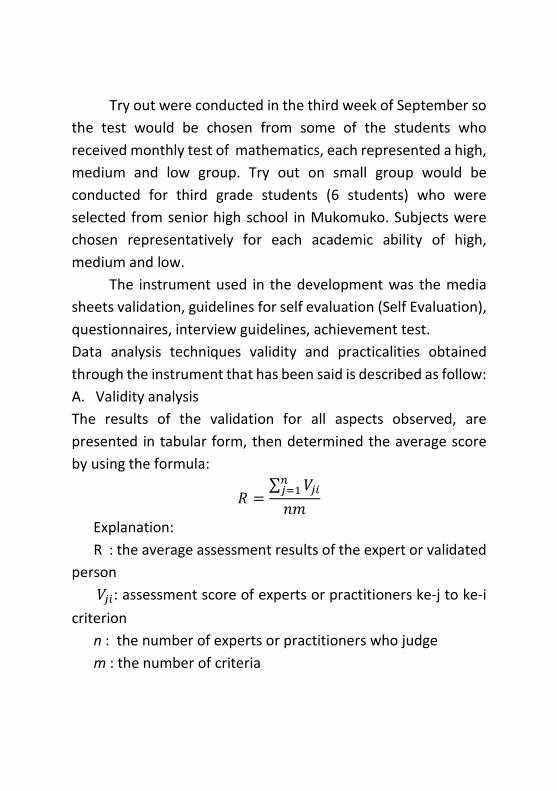
Data analysis techniques validity and practicalities obtained
through the instrument that has been said is described as follow:
A. Validity analysis
The results of the validation for all aspects observed, are
presented in tabular form, then determined the average score
by using the formula:
� =∑ ���
����
��
Explanation:
R : the average assessment results of the expert or validated
person
���: assessment score of experts or practitioners ke-j to ke-i
criterion
n : the number of experts or practitioners who judge
m : the number of criteria

Average obtained is confirmed with the specified criteria. How
to get these criteria is by assigning a score range starts from 1 (sr
= low score) to 4 (st = high score). The score range is divided into
four class intervals. Criteria for each interval are classified into
five levels as shown in Table 1.
Table 1. Criteria Validity Instruments and Media Inspiration
Average Range Criteria
3,00 < R ≤ 4,00
2,00 < R ≤ 3,00
1,00 < R ≤ 2,00
0,00 < R ≤ 1,00
Very Valid
Valid
Valid Enough
Less valid
(Modification of Arikunto, 2010: 270-272)
B. Practicalities Analysis
Questionnaire
Students’ questionnaire responses were arranged in the form of
Likert scale with positive statements. The data from students’
response were analyzed with the following steps.
a. Score for each item answer, Strongly Agree (4), Agree (3)
Disagree (2), and Strongly Disagree (1).
b. Calculate the total score for each validated person for all
indicators.
c. Scoring the practicalities by using the formula:
� =∑ �
�� 100%

With P = the final score
F = acquisition score
N = maximum score
The results were interpreted by the following criteria.
Table 2. Criteria practicalities Questionnaire Results Based
Average Range Criteria
3,00 < R ≤ 4,00
2,00 < R ≤ 3,00
1,00 < R ≤ 2,00
0,00 < R ≤ 1,00
Very Practice
Practice
Practice Enough
Less Practice
(Modification of Arikunto, 2010: 270-272)
The data from the interview were qualitative data which were
analyzed qualitatively. There were three stages to analyze
qualitative data consists of; the data reduction, data
presentation and data conclusion (Miles and Huberman, 1992:
16). The data reduction is a selecting activity, focusing,
abstracting and transforming raw data collected.
Learning Achievement
Learning achievement data were analyzed by comparing the
results of pre-test and post-test by using t test. This was done to
identify the differences between these two values significantly.
Research hypothesis is:
��: �� = ��
��: �� > ��

Explanation:
��: average students’ learning achievement before using
interactive modules course lab based
��: average students’ learning achievement after using
interactive modules course lab based
RESULT
At this session data were collected along the development of
interactive module based on course lab. The data includes an
interview with teachers and students, collected documents
syllabus, and text books of statistic and probability.
Result from interview with teachers and students. According to
the interviews on August the 8th, 2016, it was obtained
information about spatial students ability to learn statistic and
probability. The use of teaching book or textbook by students are
still lacking. The students receive information from the teacher
with face to face Methods with a way of explaining matter, giving
examples, and exercise so students less motivated and untrained
imagination in space. Teachers also have never been writing
material that can help students in learning statistic and
probability. Development of interactive module based course
lab designed to facilitate limitations in learning. The use of
lectora as the media in the presentation of material can provide
view and animation into the room interesting and able to
motivate students in learning so spatial ability students also
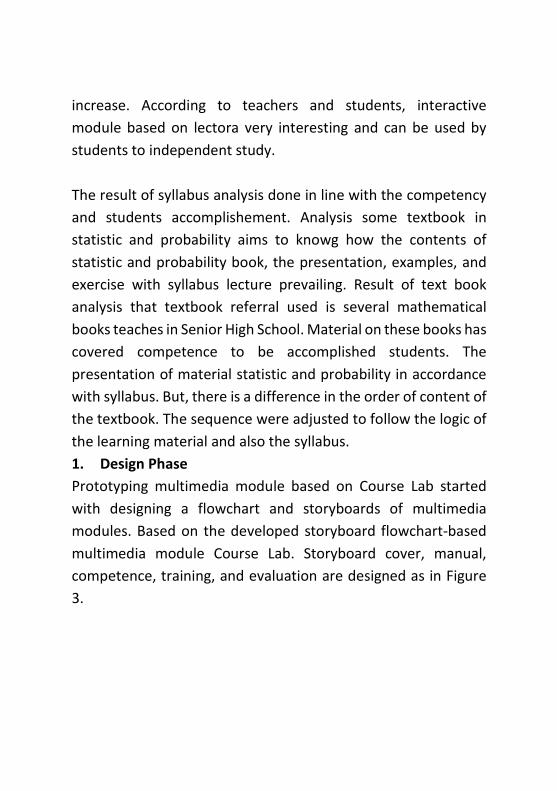
increase. According to teachers and students, interactive
module based on lectora very interesting and can be used by
students to independent study.
The result of syllabus analysis done in line with the competency
and students accomplishement. Analysis some textbook in
statistic and probability aims to knowg how the contents of
statistic and probability book, the presentation, examples, and
exercise with syllabus lecture prevailing. Result of text book
analysis that textbook referral used is several mathematical
books teaches in Senior High School. Material on these books has
covered competence to be accomplished students. The
presentation of material statistic and probability in accordance
with syllabus. But, there is a difference in the order of content of
the textbook. The sequence were adjusted to follow the logic of
the learning material and also the syllabus.
1. Design Phase
Prototyping multimedia module based on Course Lab started
with designing a flowchart and storyboards of multimedia
modules. Based on the developed storyboard flowchart-based
multimedia module Course Lab. Storyboard cover, manual,
competence, training, and evaluation are designed as in Figure
3.
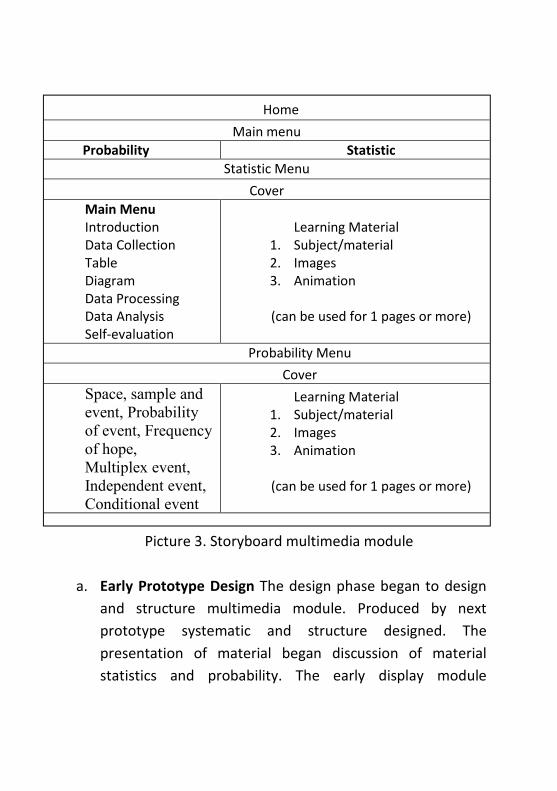
Picture 3. Storyboard multimedia module
a. Early Prototype Design The design phase began to design
and structure multimedia module. Produced by next
prototype systematic and structure designed. The
presentation of material began discussion of material
statistics and probability. The early display module
Home
Main menu
Probability Statistic
Statistic Menu
Cover
Main Menu Introduction Data Collection Table Diagram Data Processing Data Analysis Self-evaluation
Learning Material 1. Subject/material 2. Images 3. Animation
(can be used for 1 pages or more)
Probability Menu
Cover
Space, sample and event, Probability of event, Frequency of hope, Multiplex event, Independent event, Conditional event
Learning Material 1. Subject/material 2. Images 3. Animation
(can be used for 1 pages or more)

presenting home, the authors, and menu containing a list of
choice matter who want to be studied by students. At the
beginning of subjects sub basic begins with the presentation
of competence base and learning experience. Followed by
presentation of matter and exercise. At the end an
interactive module evaluation for students who has been
completed all sub subjects. Based on systematic and
structure interactive module designed produced a
prototype. The first prototype is the title of interactive
module a button navigator menu “start” and menus the
authors is presented in figure 4.
Figure 4. Opening Slide Multimedia Module

The navigator menu “star” useful to lead students to open the
next interactive module show on figure 5.
Figure 5. Main Menu
The main menu button was made independent so student can
freely choose which topic they want to learn. And the student
where been given exercise for all subject. The initial design of
interactive modules can be seen in Figure 6.

Figure 6. Module Interactive

Figure 6. Module Interactive

Figure 6. Module Interactive
The prototype module has been revised based on the
recommendation from the research team and by the reviewer.
After self-evaluation phase the module was reviewed by the
expert. The expert came from ICT expert from STIKIP PGRI west
Sumatera and Senior Highschool 15 Mokumoku. The expert

reviewed orally and writing. There are two types of data on this
expert review stage, the data is advice from experts for the
improvement of the validity of the data modules and modules
based on expert judgments. Analysis and revision of the
prototype are done to obtain valid module according to experts.
Some suggestions and revisions made are as follows.
Figure 7. Display Main Menu Before and After Revisions

Figure 8. Display Main Menu Before and After Revisions
The review aimed to see the module validity to achieve
interactive lectora module was valid. The data collected through
validation sheets and advice delivered directly and writing. The
evaluation rendered includes four aspects presentation of
material, the feasibility, languages, and graphic. The assessment
on the presentation of materials with average 3,73, the
feasibility with average 3,76 , language with average 3,9, and
graph with average 3,89 . The evaluation of small group involving
ten senior high school students representing the population
target. All students involved were from SMA 15 Mukomuku. The
research conducted in four meetings on May 2, 3, 9, and 10
september 2016 to spending time 3 until 45 minutes per
meeting. A pretest conducted on 2 september 2016 and posttest
done on September 10 2016. Evaluation for small group
conducted to see interactive module efectiveness. The data
collected through the survey. The score 1 provided if strongly
disagree with statement at the survey, the score 2 to disagree,
the score 3 to considerable agree, 4 to agree, and 5 to could not
agree. The survey compiled consists of three indicators that 1
statement. The first one is the time it takes in using module
consists of a statement. Indicators both the ease of use module
consists of six statement. A third indicators benefit gained in
using module consists of three statement. The charging survey
by students shows that the majority of students said the time to
look matter is in accordance with the time available. It also
applies to ease the use of modules and benefit gained in using
the module, the majority of students said they agreed. The
analysis score for the survey shows that interactive module
based on lectora have practical used by students.
Testing were also carried out to see the effectiveness interactive
module developed and to get information to further
improvements to module developed. The effectiveness of data

collected in pretest scores and postest of students joining testing
small group. The use of module by students at each meeting
satisfying enough. The first meeting of cube material can well
understood by students. The second matter beams learned,
prism on third meeting, and limas in the fourth. Pretest
conducted in the first meeting before the learning that starts.
Question have been tested is the question evaluation is
contained in interactive module. About the same tested back on
the tests conducted after the research phase. Tests late aims to
obtain data to study for students after implementation of
learning using module developed. That test scores students rata-
rata changed as much as 25 with byway 7,07 raw. This data
showing how a change in value ranges from 17,93 until 32,07.
Seen from rata-rata test scores the beginning and final test,
there has been increasing scores of the students 17,93 until
32,07. The results of testing statistically showing that
the������ > ������ which means that there are differences the
average score a pretest and postest. Seen from the average test
scores, been an increase in a value sufficiently significant. Thus,
can be concluded that module interactive developed effective in
improve learning outcomes students. In other words, the spatial
ability of students increased after using module interactive
based on lectora. Test results of pretest has increased enough
significant impact on a pretest. The comprehensive learning
strategy to a learning material gives good impact for student it
can be showed in their exercise score or achievement. As

expressed by suparno (1997: 61) that student with prepared
knowledge, goals and motivation gives impact to interact with
the learning materials. Understanding and the application of
knowledge and experience gained through examples and
exercise contained in module expand and refine knowledge and
students increase of understanding of material learned .In
accordance with statements from Hamalik (2012: 95) stated that
the exercise give learning experience that can help mastery
behavior changes aspect, develop the capacity to solve
problems, and helping the learning process effective.
According to the data analysis and discussion has obtained
conclusions as follows reviews of the module based interactive
lectora has the validity of the (relevance) and constructs
(consistency). The feasibility of includes the contents, the
presentation of material, language, and graph. Every aspect is
valid. The evaluation of small group involving ten students shows
that prototype interactive module developed already practical.
Material on the presentation of this module easily understood,
the language used is clear and easy to understandThe module
observed through learning outcomes of students after using
interactive module showed that the module is already effective.
This conclusion based on the results obtained evaluation trial of
small group involving ten junior high school students in the city
of padang. The results of the trial showed that learning
outcomes students experienced a significant difference between
the value of test tests the beginning and the end of which is

obtained. Data analysis showed that been an increase in the
average value of students from the pre test to posttest.
The module is different from the teaching sources in use of
media and presentation of material more interesting.
This module can be used as a source of independent study and
help students in visualizing up room so that the ability into
spatial students increased. Module based interactive lectora was
able to improve learning outcomes. This research can provide an
illustration and providing comments to the teacher in
implementing learning activities. This module demanding
students to run some activities such as reading, writinging, and
answering a question. In the use of this module, teachers can
facilitate learning activities use the model blended learning.
CONCLUSION
Course lab based interactive multimedia application is an
alternative solution as a learning resources for teacher, students
and learner especially in statistic and probability. Based on the
analysis of data and discussion, the conclusion can be seen as
follow:
1. The data showed that multimedia module Course Lab
based already has content validity (relevancy) and
construct (consistency). Validity assessment includes
aspects of the feasibility of the content, presentation
material, language, and graphic. Every aspect validated

has been considered valid in terms of content and
construct.
2. The evaluation results involving a small group of ten
students showed that the prototype multimedia module
had been practically developed. Presentation of the
material in this module is easy to understand, the
language used is clear and easy to understand.
3. The effectiveness module was observed through
students’ learning achievements after using multimedia
module indicated that the module was effective. This
conclusion is obtained based on the evaluation of small
group trial involving ten senior high school students in
the Bengkulu city. The trial results showed that students’
learning achievements have significant differences
between the score of the obtained initial test and final
test. Analysis of the data showed that an increasing in the
average score of students from initial tests to the final
test.
SUGGESTION
Based on what have done in this study, there were some
suggestions which can be forwarded to the teacher, students
and other researchers:
1. Course Lab-based multimedia module can be used as an
alternative source in learning activity.

2. This module was developed only on the probability and
statistic material, teachers or further researchers can use
course lab as a media in developing learning materials with a
wider range of materials or for different disciplines.
3. This module can be used by teachers as a teaching material in
the learning process by using blended model learning.

REFERENCES Alwi, Hasan, dkk. 2007. Tata Bahasa Baku Bahasa Indonesia.
Jakarta: Balai Pustaka. Arikunto, Suharsimi. 2010. Manajemen Penelitian. Jakarta:
Rineka Cipta. Asyhar, Rayandra. (2011). Kreatif Mengembangkan Media
Pembelajaran. Jakarta: GP Press. Binanto, Iwan, (2010). Multimedia Digital Interaktif, Teori dan
Pengembangannya. Andi: Yogyakarta. Daryanto. 2010. Media Pembelajaran. Yogyakarta: Gava Media. Hake, Richard. 1999. Analyzing Change/Gain Scores. (On-Line).
Tersedia: www.physics.indiana.edu/~sdi/AnalyzingChange-Gain.pdf. Diunduh 20 Oktober 2016
Hamalik, Oemar. 2012. Kurikulum dan Pembelajaran. Jakarta: Bumi Aksara
Kurniawan, Khaerudin. 2014. Handout Mata Kuliah Menulis Buku Ajar Ilmiah. file.upi.edu/Direktori/FPBS/JUR.../Handout_Buku_Ajar.pdf
Miles,Matthew B &Huberman, A Michael. (1992). Analisis Data Kualitatif (TjetjepRohendiRohidi.Terjemahan). Jakarta: Universitas Indonesia
Muljono, Pudji. 2007. “Kegiatan Penilaian Buku Teks Pelajaran Pendidikan Dasar dan Menengah”. Buletin BSNP, II (1): 21.
Muslich, Masnur. 2010. Text Book Writing. Jogjakarta: Ar-ruz Media
Novandi, Ahmad. (2016). Pengembangan Media Pembelajaran Presentasi Menggunakan Courselab 2.4 pada Kompetensi Dasar-Dasar Elektronika Digital di SMK 3 Negeri Surabaya. Jurnal Pendidikan Teknik Elektro,Vol 5, No 1.

Plomp, T & Nienke Nieveen. 2013. Educational Design Research Part A: An Introduction. Enschede: slo
Prastowo, Andi. 2011. Panduan Kreatif Membuat Bahan Ajar Inovatif. Jogjakarta: Diva Press.
Riduwan, M.B.A. 2010. Belajar Mudah Penelitian Untuk Guru, Karyawan Dan Peneliti Pemula. Bandung: Alfabeta.
Ridwansyah dkk. (2009). Manual CourseLab. ICT center universitas Negeri makasar.
............... (2008). Courselab 2.4 User Manual, Free Tools For Free People. Web Soft Ltd: Russia
.............,http://www.courselab.com
Sri Rahayu, Nanik, (2013). Pengenalan CourseLab, Modul Diklat ITC 2013, PPPPTK BOE / VEDC: Malang.
Sudaryono. 2013. Pengembangan Instrumen Penelitian Pendidikan.Yogyakarta: Graha Ilmu.
Sugiyono, 2008. Metode Penelitian Pendidikan. Bandung: CV. Alfabeta.
Suparno, Paul. 1997. Filsafat Konstruktivisme dalam Pendidikan. Yogyakarta: Kanisius.
Copyright © 2022 FDOKUMEN